UNITED STATES
SECURITIES AND EXCHANGE COMMISSION
Washington, D.C. 20549
________
FORM N-CSR/A
________
CERTIFIED SHAREHOLDER REPORT OF REGISTERED MANAGEMENT
INVESTMENT COMPANIES
Investment Company Act File Number 811-04878
SEI Institutional Managed Trust
(Exact name of registrant as specified in charter)
________
SEI Investments
One Freedom Valley Drive
Oaks, PA 19456
(Address of principal executive offices) (Zip code)
Timothy D. Barto, Esq.
SEI Investments
One Freedom Valley Drive
Oaks, PA 19456
(Name and address of agent for service)
Registrant’s telephone number, including area code: 1-610-676-1000
Date of fiscal year end: September 30, 2023
Date of reporting period: September 30, 2023
Explanatory Note: This Form N-CSR/A (the “Form”) is filed to remove “unaudited” from the Statement of Operations in Item 1 of the Form. Other than the removal of unaudited, no other information or disclosures contained in the Form are amended by this Form N-CSR/A.
| Item 1. | Reports to Stockholders. |

September 30, 2023
ANNUAL REPORT
SEI Institutional Managed Trust
❯ | Large Cap Fund |
❯ | Large Cap Value Fund |
❯ | Large Cap Growth Fund |
❯ | Large Cap Index Fund |
❯ | Tax-Managed Large Cap Fund |
❯ | S&P 500 Index Fund |
❯ | Small Cap Fund |
❯ | Small Cap Value Fund |
❯ | Small Cap Growth Fund |
❯ | Tax-Managed Small/Mid Cap Fund |
❯ | Mid-Cap Fund |
❯ | U.S. Managed Volatility Fund |
❯ | Global Managed Volatility Fund |
❯ | Tax-Managed Managed Volatility Fund |
❯ | Tax-Managed International Managed |
❯ | Real Estate Fund |
❯ | Core Fixed Income Fund |
❯ | High Yield Bond Fund |
❯ | Conservative Income Fund |
❯ | Tax-Free Conservative Income Fund |
❯ | Real Return Fund |
❯ | Dynamic Asset Allocation Fund |
❯ | Multi-Strategy Alternative Fund |
❯ | Liquid Alternative Fund |
❯ | Multi-Asset Accumulation Fund |
❯ | Multi-Asset Income Fund |
❯ | Multi-Asset Inflation Managed Fund |
❯ | Multi-Asset Capital Stability Fund |
Paper copies of the Funds’ shareholder reports are no longer sent by mail, unless you specifically request them from the Funds or from your financial intermediary, such as a broker-dealer or bank. Shareholder reports are available online and you will be notified by mail each time a report is posted on the Funds’ website and provided with a link to access the report online.
You may elect to receive all future reports in paper free of charge. If you invest through a financial intermediary, you can contact your financial intermediary to inform it that you wish to continue receiving paper copies of your shareholder reports. If you invest directly with the Funds, you can inform the Funds that you wish to continue receiving paper copies of your shareholder reports by calling 1-800-DIAL-SEI. Your election to receive reports in paper will apply to all funds held with the SEI Funds or your financial intermediary.
seic.com
TABLE OF CONTENTS
| Letter to Shareholders | 1 |
| Management’s Discussion and Analysis of Fund Performance | 8 |
| Schedules of Investments | 66 |
| Glossary | 357 |
| Statements of Assets and Liabilities/Consolidated Statements of Assets and Liabilities | 358 |
| Statements of Operations/Consolidated Statements of Operations | 370 |
| Statements of Changes in Net Assets/Consolidated Statements of Changes in Net Assets | 376 |
| Consolidated Statement of Cash Flows | 384 |
| Financial Highlights/Consolidated Financial Highlights | 385 |
| Notes to Financial Statements/ Notes to Consolidated Financial Statements | 398 |
| Report of Independent Registered Public Accounting Firm | 444 |
| Trustees and Officers of the Trust | 446 |
| Disclosure of Fund Expenses | 450 |
| Review of the Liquidity Risk Management Program | 453 |
| Board of Trustees Considerations in Approving the Advisory and Sub-Advisory Agreement | 454 |
| Notice to Shareholders | 457 |
The Trust files its complete schedule of portfolio holdings with the Securities and Exchange Commission for the first and third quarters of each fiscal year as an exhibit to its reports on Form N-PORT. The Trust’s Form N-PORT reports are available on the Commission’s website at http://www.sec.gov.
A description of the policies and procedures that the Trust uses to determine how to vote proxies relating to portfolio securities, as well as information relating to how a Fund voted proxies relating to portfolio securities during the most recent 12-month period ended June 30, is available (i) without charge, upon request, by calling 1-800-DIAL-SEI; and (ii) on the Commission’s website at http://www.sec.gov.
LETTER TO SHAREHOLDERS
September 30, 2023 (Unaudited)
To Our Shareholders
During the one-year reporting period ending September 30, 2023, global financial markets gyrated in response to concerns about central bank monetary policy, the strength of the global economy, a crisis in the U.S. regional banking sector, the politically charged U.S. debt-ceiling standoff, and the implications of a higher-for-longer interest-rate environment.
The U.S. equity market experienced numerous periods of volatility as the Federal Reserve (Fed) maintained its interest rate-hiking cycle for much of the reporting period in an effort to tame rising inflation. Headline inflation, as measured by the U.S. consumer-price index (CPI), decelerated during the reporting period. The Fed raised the federal-funds rate in six increments totaling 225 basis points (2.25%) to a range of 5.25% to 5.50% during the reporting period. These included a 25-basis point increase following the central bank meeting in July 2023, which was sandwiched between pauses in its rate-hiking cycle in June and September.
In a statement announcing the pause in September, the Federal Open Market Committee (FOMC) reiterated its commitment to bringing inflation down to its 2% target rate and cautioned that “tighter credit conditions for households and businesses are likely to weigh on economic activity, hiring, and inflation. The extent of these effects remains uncertain.” The Fed members also commented that it “would be prepared to adjust the stance of monetary policy as appropriate if risks emerge that could impede the attainment of the Committee’s goals.” The Fed’s so-called dot plot of economic projections indicated a median federal-funds rate of 5.6% at the end of 2023, unchanged from its previous estimate issued in June, implying that the central bank could opt for an additional 25-basis point increase at one of its two remaining policy meetings in 2023.
In early March 2023, the financial markets’ focus turned to the banking sector as two U.S.-based regional banks–Silicon Valley Bank (SVB) and Signature Bank–failed after depositors withdrew funds on fears regarding the valuation of the institutions’ bond portfolios. The Federal Deposit Insurance Corporation (FDIC) was appointed as receiver to SVB after the California Department of Financial Protection and Innovation– which oversees the operations of state-licensed financial institutions, including banks and credit unions–closed the bank. Occurring on the heels of the collapse of Silvergate Capital a few days earlier, SVB’s failure prompted investors to reconsider the safety of their positions across the banking industry. SVB is a unique entity, with a client base highly concentrated among startup, venture capital-backed companies. The deposits of the bank increased tremendously over the past few years and poor liquidity management of these assets appears to have been a significant contributor to the collapse. Both Silvergate Capital and Signature Bank, which was shut down by New York state regulators in mid-March, were closely aligned with the highly speculative cryptocurrency industry. In early May, U.S. regulators took control of California-based First Republic Bank. The California Department of Financial Protection and Innovation issued a statement announcing that it had taken over the bank and appointed the FDIC as receiver. The FDIC subsequently announced that it had accepted J.P. Morgan Chase Bank’s bid to “assume all deposits, including all uninsured deposits, and substantially all assets of First Republic Bank."
The administration of President Joe Biden and the Republican Party majority in the U.S. House of Representatives engaged in a heated debate about raising the U.S. government’s $31.4 trillion debt ceiling for much of the first half of 2023. The debt ceiling comprises the total amount of money that the U.S. government is authorized to borrow to meet its existing legal obligations, including Social Security and Medicare benefits, military salaries, interest on the national debt, tax refunds, and other payments. U.S. Treasury Secretary Janet Yellen had warned that the U.S. would no longer be able to meet its financial obligations as of early June. After numerous one-on-one discussions, Biden and Kevin McCarthy, who had been elected Speaker of the House of Representatives after the Republicans secured a majority in the lower house of Congress following the national election in November 2022, reached an agreement on the debt ceiling during the last week of May. Both the U.S. House of Representatives and the Senate passed the legislation–the Fiscal Responsibility Act–by wide margins, with strong support from Republicans and Democrats. The bill suspended the debt ceiling through January 1, 2025; maintains non-military spending close to current levels for the 2024 fiscal year, which was to begin in October; and implements a 1% cap on increases in non-military spending for the 2025 fiscal year. The fast-track approval of the legislation enabled the government to avoid a potential default on its debt.
Despite the budget agreement, credit-rating agency Fitch Ratings downgraded U.S. debt one notch from AAA—the agency’s highest credit rating—to AA+ with a stable outlook. In a news release announcing the downgrade, Fitch cited “expected fiscal deterioration over the next three years, a high and growing general government debt burden, and the erosion of governance relative to 'AA' and 'AAA' rated peers over the last two decades that has manifested in repeated debt limit standoffs and last-minute resolutions.” The agency also expressed its view that, despite June’s bipartisan agreement
SEI Institutional Managed Trust
1
LETTER TO SHAREHOLDERS (Continued)
September 30, 2023 (Unaudited)
on the government’s debt ceiling, there has been “a steady deterioration in standards of governance over the last 20 years, including on fiscal and debt matters.”
At the end of the reporting period on September 30, Congress again avoided a shutdown of the federal government, agreeing on a bipartisan stopgap bill to fund the government through mid-November. The House of Representatives voted 335-91 in support of the agreement, while the Senate, where the Democratic Party holds a slim majority, approved the measure by a vote of 88-9. The bill included, among other appropriations, $16 billion for disaster relief, but provided no additional financial aid for Ukraine for its ongoing conflict with Russia. Leaders of both political parties indicated that they would propose separate legislation authorizing more assistance to Ukraine.
Geopolitical events
The ongoing Russia-Ukraine war dominated the geopolitical news during the reporting period. Ukraine’s president, Volodymyr Zelenskyy, traveled to Washington, D.C., to address a joint session of the U.S. Congress in late December 2022, in an effort to secure additional financial aid from the U.S. and its allies. President Biden reiterated the U.S. government’s support for Ukraine in its conflict with Russia. In late December, the U.S. Congress approved $45 billion in additional financial assistance to Ukraine. In February 2023, nearly a year after the conflict began, President Biden made an unannounced trip to Ukraine to meet with President Volodymyr Zelenskyy and to encourage ongoing support from U.S. allies. The visit occurred as Russian President Vladimir Putin increased military activity in eastern Ukraine. President Biden’s trip was particularly risky as there was no protection from U.S. military personnel on the ground in Ukraine. In March, President Xi Jinping of China met with Russian President Vladimir Putin in Moscow to discuss China’s proposal to end the conflict with Ukraine. The Biden administration criticised the plan as “the ratification of Russian conquest” as it proposed a ceasefire that would recognize Russia’s right to occupy territory in Ukraine and provide Putin with time to bolster the nation’s military forces.
The Wagner Group, a Russian paramilitary organization, began to retreat from the city of Bakhmut, Ukraine, in late May. The mercenaries were scheduled to complete their retreat by the beginning of June, and would be replaced by regular Russian troops. The Wagner Group had been fighting in Bakhmut since the summer of 2022. The withdrawal from the city occurred after the group’s leader, Yevgeny Prigozhin, claimed that Russian Defense Minister Sergei Shoigu and Valery Gerasimov, Chief of the General Staff, had intentionally withheld ammunition from Wagner Group fighters. In late June, the Wagner Group organized a short-lived mutiny against Russian President Vladimir Putin’s regime. The group occupied Rostov-On-Don in southern Russia, a significant command center for the Russian government’s invasion of Ukraine. Prigozhin, agreed to be exiled to Belarus, and the mercenaries retreated from Rostov-On-Don. Prigozhin and nine other passengers later died in an airplane crash near Moscow on August 24, raising questions about the circumstances surrounding his death.
Late in the reporting period, China, the world’s second-largest economy, experienced relatively weak credit growth, a downturn in exports, and a year-over-year decline in consumer prices. Lower demand for goods and services from Chinese consumers could have a negative impact on other countries’ exports of iron ore, crude oil, factory equipment, and luxury goods into the country. A large property developer filed for protection under Chapter 15 of the U.S. bankruptcy code, which safeguards non-U.S. companies that are undergoing debt restructurings from creditors seeking to sue the firms or to freeze their assets in the U.S. Additionally, in contrast to inflationary worries in most global economies, there were concerns regarding a bout of deflation in China. According to the National Bureau of Statistics of China, the country’s producer-price index (PPI), which tracks the average change over time in selling prices received by domestic producers of manufactured goods, was down 3.0% year-over-year in August— the eleventh consecutive month-over-month decline. Prices for the mining, raw materials, and processing industries fell by 9.0%, 4.0%, and 3.1%, respectively, during the previous 12-month period.
Economic performance
U.S. inflation cooled during the reporting period. According to the Department of Labor, the U.S. consumer-price index (CPI) fell from an annual rate of 7.7% in September 2022, to 3.7% in August 2023. The most recent inflation data indicated that the CPI increased 0.6% month-over-month in August. However, the 4.3% annual increase in core inflation, as measured by the CPI for all items less food and energy, represented a 0.4- percentage point decline from the 4.7% year-over-year upturn in July. Core inflation rose 0.3% month-over-month in August, following a 0.2-percentage point uptick in July. The government noted that more than half of the month-over-month increase in the overall CPI was attributable to higher
2
SEI Institutional Managed Trust
gasoline prices, which climbed 10.6% in August. Housing costs also contributed to the upturn in inflation for the month. Food prices rose 0.2% in August, matching the previous month’s increase.
According to the third estimate from the Department of Commerce, U.S. gross domestic product (GDP) grew at an annualized rate of 2.1% in the second quarter of 2023, unchanged from the government’s second estimate released in August, and down 0.1 percentage point from the 2.2% rise in the first three months of the year. The largest increases for the second quarter were in nonresidential fixed investment (purchases of both nonresidential structures and equipment and software), consumer spending, and state and local government spending. These gains offset reductions in exports and residential fixed investment (purchases of private residential structures and residential equipment that property owners use for rentals). The marginal decline in the GDP growth rate for the second quarter compared to the first three months of the year was due to slowdowns in consumer and federal government spending, as well as a decrease in exports.
The Office for National Statistics reported that consumer prices in the U.K. rose 0.4% month-over-month in August (the most recent reporting period)—up sharply from the 0.3% decrease in July. Inflation advanced 6.3% over the previous 12-month period, down marginally from the 6.4% annual upturn in July. Prices for alcohol and tobacco, along with clothing and footwear, were the largest contributors to the rise in inflation in August, while food and alcoholic beverages, and alcohol and tobacco posted the most notable price increases over the previous 12-month period. Core inflation, which excludes volatile food prices, rose at an annual rate of 5.9% in August, down from the 6.4% rise in July.
Eurostat pegged the inflation rate for the eurozone at 4.3% for the 12-month period ending in September 2023, down 0.9 percentage point from the 5.2% annual increase in August. Prices for food, alcohol and tobacco rose 8.8% in September, but the pace of acceleration slowed from the 9.7% annual rate for the previous month. Energy prices fell 4.7% year-over-year, following a 3.3% decline in August. Core inflation, which excludes volatile energy and food prices, rose at an annual rate of 4.5% in September, down 0.8 percentage point from August.
Market developments
Global equity markets garnered positive returns despite periods of volatility over the reporting period. Developed markets significantly outperformed their emerging-market counterparts, though both asset classes posted double-digit gains. The Nordic countries garnered the highest returns among developed markets for the reporting period, attributable mainly to robust performance in Denmark. Despite posting a double-digit gain during the period, the Pacific ex Japan region was the primary underperformer due to weakness in Hong Kong. Eastern Europe was the top-performing region within the emerging markets for the reporting period due to notable strength in Hungary, Greece, and Poland. Conversely, the Gulf Cooperating Council (GCC) countries (Saudi Arabia, United Arab Emirates, Qatar, Kuwait, and Oman) were the most notable laggards among the emerging markets for the period.
Global fixed-income assets ended the reporting period in positive territory, with the Bloomberg Global Aggregate Bond Index returning 2.24% in U.S. dollar terms. High-yield bonds, which posted double-digit returns, and emerging-market debt were the strongest performers. Both asset classes outperformed global corporate and government bonds. Over the reporting period, rates rose significantly across all maturities of the U.S. Treasury yield curve. The yield on the 10-year U.S. Treasury note ended the one-year reporting period up 76 basis points (0.76%) to 4.59%, while the 2-year yield rose 81 basis points to 5.03%. Bond prices fall as interest rates rise. The spread between 10- and 2-year notes widened from -0.39 to -0.44 basis points over the reporting period. The yield curve remained inverted, with yields on shorter-term bonds exceeding those on longer-dated securities. In an unusual move, yields on the 1-, 2- and 3-month Treasury bills climbed by corresponding margins of 276, 240 and 222 basis points to 5.55%, 5.60%, and 5.55% during the period. The significant upturn in ultra-short-term bond yields reflected expectations for rates to remain higher for longer; longer-term bond yields showed signs of concerns regarding how monetary tightening might have a negative impact on economic growth.
Global commodity prices, as measured by the Bloomberg Commodity Total Return Index, dipped 1.30% in U.S. dollar terms during the reporting period. However, gold prices rallied and ended the period in positive territory as the U.S. dollar weakened (gold prices move inversely to the U.S. dollar) and the Fed began to slow the pace of its interest-rate hikes. Prices for West Texas Intermediate crude oil and Brent crude oil declined during much of first nine months of the reporting period before rallying sharply in the summer of 2023 on expectations that production output cuts from the Organization of the Petroleum Exporting Countries (OPEC) and Russia would continue through the end of the year. Wheat prices moved lower over the period, hampered by Russia’s shipments of large quantities of cheaply priced grain. The New York Mercantile Exchange (NYMEX) natural gas price tumbled more than 50% over the reporting period. The downturn was attributable
SEI Institutional Managed Trust
3
LETTER TO SHAREHOLDERS (Continued)
September 30, 2023 (Unaudited)
mainly to a steep decline in late 2022 and early 2023, as an unusually mild winter in the U.S. continued to weigh on demand during the home-heating season.
Our view
While predictions of a downturn in business activity during 2023 have been widely held since the end of last year, the U.S. economy has mostly surprised to the upside. Recession calls are now in the minority, with the latest plane analogy going from “hard landing” to “soft landing,” and even to “no landing.” Strong July results for retail sales, services consumption, industrial production, and housing starts resulted in the inflation-adjusted gross domestic product reaching an annualized 5.9% rate of gain in August. We do not believe this trend is sustainable. Although the consensus has swung away from this view, there is a reasonable probability of a recession in 2024.
Other major economies outside the U.S. are showing signs of weakness, despite advances during the first half of this year. Germany is already in recession and the U.K. may not be far behind. In these developed economies, businesses and consumers alike are feeling pressure from rising interest rates and persistent core inflation.
Hopes that China’s economy would offset slowing growth elsewhere have proven to be elusive. Although Chinese domestic travel and services consumption experienced a post-COVID-19 bounce, the economic data have been mostly disappointing. Consumer sentiment remains extremely depressed, with the latest quarterly reading showing a partial reversal of the early 2023 post-lockdown bounce. Chinese consumers and financial market participants appear largely unimpressed with the government’s efforts, both fiscal and monetary, to turn the economy around.
Inflation continues to fall as COVID-19-era supply-chain disruptions abate. However, it is SEI’s strong conviction that there has been a regime change when it comes to long-run inflation, and that it will run sustainably higher in the U.S. than the Federal Reserve’s (Fed) 2% target. Structurally tight labor markets, the shifting of global supply chains away from China, higher financing costs, the disruptions caused by the transition to a carbon-neutral regime, and a likely boost in corporate tax rates in the years ahead suggest to us that an inflation rate over 3% is more likely than one under 2%.
The Fed’s rate-hiking cycle is nearing an end, but this does not mean that the federal-funds rate will be moving lower anytime soon. We believe there could be one more interest-rate increase from the Fed, but as labor-market pressures ease, even this appears increasingly unlikely. The latest Federal Open Market Committee projections indicate an intention to keep the federal-funds rate higher for longer. In our view, it is unlikely the central bank will begin cutting rates before the second half of 2024.
Other major central banks are in similar positions. Given Europe’s stubborn inflation and lower policy-rate stance, the European Central Bank may raise its key interest rate once or twice more this cycle. The U.K. is closest to a wage-price spiral, which may force the Bank of England to implement a monetary policy that is tighter than it would prefer. Meanwhile, the Bank of Japan is under increasing pressure to start raising its policy interest rate in order to firm up the yen.
Bond yields have risen despite lower inflation rates. We believe markets are responding to the increase in government debt issuance at a time when central banks are adding to supply pressures via quantitative tightening (i.e., selling bonds out of their portfolios).
SEI expects bond yields to remain elevated as investors adjust their expectations regarding the probability of higher-for-longer central bank interest-rate policy. We also believe that the term premium (the excess yield required to offset the additional risk in longer-dated bonds) will turn positive as investors demand compensation for taking on a greater level of uncertainty around future interest-rate risk.
4
SEI Institutional Managed Trust
Equity markets have entered a corrective phase. U.S. large-capitalization stocks are expected to trade in a broad range, with the S&P 500 Index currently closer to the upper end of this range. Growth companies with high price-to-earnings ratios are vulnerable to rising bond yields, and more cyclical and economically sensitive names within this cohort could face pressure from declining profit margins.
Sincerely,

James Smigiel
Chief Investment Officer
SEI Institutional Managed Trust
5
LETTER TO SHAREHOLDERS (Concluded)
September 30, 2023 (Unaudited)
Index Definitions
Bloomberg 1-3 Year U.S. Government/Credit Index: includes all medium and larger issues of U.S. government, investment-grade corporate, and investment-grade international dollar-denominated bonds that have maturities of between 1 and 3 years and are publicly issued.
Bloomberg 1-5 Year U.S. TIPS Index: represents an unmanaged market index composed of all U.S. Treasury inflation-linked indexed securities with maturities of 1 to 5 years.
Bloomberg Commodity Index: is a broadly diversified index that allows investors to track commodity futures through a single, simple measure.
Bloomberg Global Aggregate Index: is a broad-based benchmark that is considered representative of global investment-grade, fixed-income markets.
Bloomberg Long A+ US Credit Index: measures the performance of the U.S. corporate and a non-corporate component with maturities of 10 years and greater that includes foreign agencies, sovereigns, supranationals, and local authorities.
Bloomberg U.S. Aggregate Bond Index: The Bloomberg U.S. Aggregate Bond Index is a benchmark index composed of U.S. securities in Treasury, government-related, corporate and securitized sectors. It includes securities that are of investment-grade quality or better, have at least one year to maturity and have an outstanding par value of at least $250 million.
Bloomberg US Corporate Investment Grade Index: is a broad-based benchmark that measures the investment-grade, fixed-rate, taxable corporate bond market.
Dow Jones Industrial Average: The Index measures the stock performance of 30 large companies listed on stock exchanges in the United States.
FTSE UK Series All-Share Index: is a capitalization-weighted index, comprising around 600 of more than 2,000 companies traded on the London Stock Exchange.
ICE BofA U.S. 3-Month Treasury Bill Index: measures total return on cash, including price and interest income, based on short-term government Treasury Bills of about 90-day maturity.
ICE BofA U.S. High Yield Constrained Index: tracks the performance of below-investment-grade, U.S. dollar-denominated corporate bonds publicly issued in the U.S. domestic market; exposure to individual issuers is capped at 2%.
ICE BofA USD 3-Month Deposit Offered Rate Constant Maturity Index: is based on the assumed purchase of a synthetic instrument having 3 months to maturity and with a coupon equal to the closing quote for 3-Month LIBOR. That issue is sold the following day (priced at a yield equal to the current day closing 3-Month LIBOR rate) and is rolled into a new 3-Month instrument. The index, therefore, will always have a constant maturity equal to exactly 3 months.
JP Morgan EMBI Global Diversified Index: tracks the performance of external debt instruments (including U.S.-dollar-denominated and other external-currency-denominated Brady bonds, loans, eurobonds and local-market instruments) in emerging markets.
JP Morgan GBI-EM Global Diversified Composite Index: tracks the performance of debt instruments issued in local currencies by emerging-market governments.
MSCI EAFE Index: is an equity index which captures large and mid-cap representation across 21 Developed Markets countries around the world, excluding the US and Canada.
MSCI Emerging Markets Index: is a free float-adjusted market-capitalization-weighted index designed to measure the performance of global emerging-market equities.
MSCI Europe Index: is a free float-adjusted market-capitalization-weighted index designed to measure the performance of large- and mid-capitalization stocks across developed-market countries in Europe.
MSCI World Index: is a free float-adjusted market-capitalization-weighted index that is designed to measure the equity-market performance of developed markets.
Russell 1000® Growth Index: measures the performance of the large cap growth segment of the U.S. equity universe. It includes those Russell 1000® Index companies with higher price-to-book ratios and higher forecasted growth values.
Russell 1000® Index: includes 1,000 of the largest U.S. stocks based on market cap and current index membership; it is used to measure the activity of the U.S. large-cap equity market.
Russell 1000® Value Index: measures the performance of the large cap value segment of the U.S. equity universe. It includes those Russell 1000® Index companies with lower price-to-book ratios and lower expected growth values.
6
SEI Institutional Managed Trust
Russell 2000® Growth Index: measures the performance of the small cap growth segment of the U.S. equity universe. It includes those Russell 2000® Index companies with higher price-to-value ratios and higher forecasted growth values.
Russell 2000® Index: The Russell 2000® Index measures the performance of the 2,000 smallest companies in the Russell 3000® Index, which represents approximately 8% of the total market capitalization of the Russell 3000® Index.
Russell 2000® Value Index: measures the performance of the small cap value segment of the U.S. equity universe. It includes those Russell 2000® Index companies with lower price-to-book ratios and lower forecasted growth values.
Russell 2500® Index: measures the performance of the 2,500 smallest companies in the Russell 3000® Index. This index is market cap-weighted and includes only common stocks incorporated in the U.S. and its territories.
Russell 3000® Index: measures the performance of the largest 3000 U.S. companies representing approximately 98% of the investable U.S. equity market.
Russell Midcap® Index: measures the performance of the mid-cap segment of the U.S. equity universe. The Russell Midcap® Index is a subset of the Russell 1000® Index. It includes approximately 800 of the smallest securities based on a combination of their market cap and current index membership. The Russell Midcap® Index represents approximately 31% of the total market capitalization of the Russell 1000® companies.
S&P 500 Index: is an unmanaged, market-weighted index that consists of approximately 500 of the largest publicly-traded U.S. companies and is considered representative of the broad U.S. stock market.
Wilshire U.S. Real Estate Securities Index: is a broad measure of the performance of publicly traded U.S. real estate securities, such as REITs and REOCs. The index is capitalization-weighted. The beginning date, January 1, 1978, was selected because it coincides with the Russell/NCREIF Property Index start date. The Wilshire U.S. Real Estate Securities Index is rebalanced monthly, and returns are calculated on a buy and hold basis.
SEI Institutional Managed Trust
7
MANAGEMENT’S DISCUSSION AND ANALYSIS OF FUND PERFORMANCE
September 30, 2023 (Unaudited)
Large Cap Fund
I. Objective
The Large Cap Fund (the “Fund”) seeks to provide long-term growth of capital and income.
II. Investment Approach
The Fund uses a multi-manager approach, relying on a number of sub-advisors with differing investment philosophies and strategies to manage portions of the Fund’s portfolio, under the general supervision of SEI Investments Management Corporation (SIMC). Assets of the Fund not allocated to sub-advisors are managed directly by SIMC. The Fund utilized the following sub-advisors as of September 30, 2023: Brandywine Global Investment Management, LLC (Brandywine), Ceredex Value Advisors LLC (Ceredex), Coho Partners, Ltd. (Coho), Fred Alger Management, LLC (Alger), LSV Asset Management (LSV), Mar Vista Investment Partners, LLC (Mar Vista), and Parametric Portfolio Associates LLC (Parametric).
No manager changes were made during the Fund’s fiscal year.
III. Returns
For the one-year period ending September 30, 2023, the Fund’s Class F shares returned 18.19%. The Fund’s benchmark—the Russell 1000® Index, which tracks the performance of the U.S. large-cap equity market—returned 21.19%.
IV. Performance Discussion
The ongoing war in Ukraine, inflation, and rising interest rates were ever present during the 12-month reporting period, but the U.S. equity market rebounded, as noted in the shareholder letter. The gains were led by mega-cap growth stocks spurred by optimism about artificial intelligence (AI). In the middle of the reporting period, significant concerns arose about the stability of the U.S. banking system as the market was shaken by the failures of Silicon Valley Bank and Signature Bank. Large-cap value and mid-cap stocks lagged relative to their large-cap growth counterparts.
Within the U.S. large-cap segment of the market, information technology, communication services, and energy were the strongest-performing sectors for the period. The poor performance of bank stocks caused the financials sector to lag the overall market. The weakest performers were traditional low-beta sectors such as utilities, real estate, and consumer staples. In some cases, investors had owned low-beta stocks for income from dividends, but rising interest rates made other sources of income available to them. Overall, leadership emanated
from more cyclical segments of the market despite the concerns that a U.S. economic recession could be on the horizon.
The Fund’s overweight allocation to the energy sector and underweights to the utilities and real estate sectors benefited performance during the reporting period. However, underweights to the information technology and communication services sectors weighed on the Fund’s performance relative to the benchmark Russell 1000® Index. Overweight allocations to the consumer staples, health care, and financials sectors also detracted from Fund performance. Security selection within the industrials sector bolstered Fund performance for the reporting period, but was a detractor within the financials sector. Overall, the Fund’s value tilt and lower-beta positions had a negative impact on the relative performance. The Fund’s greater emphasis on medium-capitalization stocks relative to the benchmark also detracted from performance during the reporting period.
Among the Fund’s managers, Brandywine’s value orientation caused its performance to lag relative to the broad market over the reporting period, with an underweight to the information technology sector. However, favorable security selection within the industrials and consumer discretionary sectors contributed positively to Fund performance. LSV underperformed the overall market due to its value orientation and associated underweight allocation to the information technology sector, while an overweight to the energy sector had a positive impact. Ceredex’s value orientation and underweight to the information technology sector weighed on relative performance, but its underweights to the health care and consumer staples sectors enhanced performance. Coho’s overweights to the low-beta consumer staples and health care sectors, along with underweights to the communication services and information technology sectors, detracted from Fund performance.
Alger outperformed during the reporting period as a result of its growth orientation, large allocation to the information technology sector, and favorable security selection within the information technology and industrials sectors. Mar Vista’s performance benefited from an overweight to the information technology sector and underweight to health care. The benefit of these sector allocations was partially offset by negative stock selection effects within the financial sector. The SEI Momentum Factor Portfolio underperformed due to security selection within the consumer discretionary, health care, and financials sectors. The SEI Quality Factor Portfolio’s outperformance for the reporting period was attributable to its overweight allocation to the information
8
SEI Institutional Managed Trust
technology sector, as well as underweights to the utilities and real estate sectors.
Investing is subject to risk, including the possible loss of principal. Past performance is no indication of future results.
AVERAGE ANNUAL TOTAL RETURN1 | |||||
1 Year | Annualized | Annualized | Annualized | Annualized | |
Large Cap Fund, Class F | 18.19% | 8.32% | 6.72% | 9.21% | 10.55% |
Large Cap Fund, Class Y | 18.59% | 8.62% | 6.99% | 9.45% | 10.73% |
Russell 1000® Index | 21.19% | 9.53% | 9.63% | 11.63% | 12.61% |
Comparison of Change in the Value of a $100,000 Investment in the Large Cap Fund, Class F and Class Y, versus the Russell 1000® Index
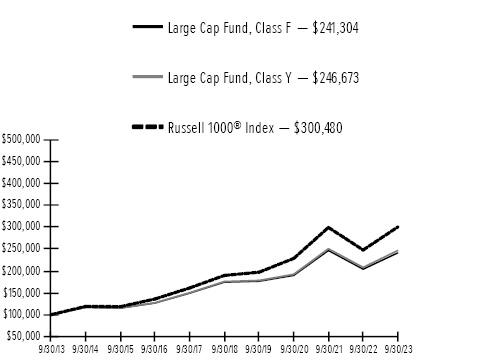
1 | For the year ended 9/30/23. Past performance is no indication of future performance. Class F shares were offered beginning 9/30/09. Class Y shares were offered beginning 12/31/14. For periods prior to 12/31/14, the performance of the Fund’s Class F Shares has been used. Returns for Class Y Shares would have been substantially similar to those of Class F Shares and would have differed only to the extent that Class Y Shares have lower total annual fund operating expenses than Class F Shares. Returns shown do not reflect the deduction of taxes that a shareholder would pay on fund distributions or the redemption of fund shares. The returns for the period reflect fee waivers and/or reimbursements in effect for the period; absent fee waivers and reimbursements, performance would have been lower. |
SEI Institutional Managed Trust
9
MANAGEMENT’S DISCUSSION AND ANALYSIS OF FUND PERFORMANCE
September 30, 2023 (Unaudited)
Large Cap Value Fund
I. Objective
The Large Cap Value Fund (the “Fund”) seeks to provide long-term growth of capital and income.
II. Investment Approach
The Fund uses a multi-manager approach, relying on a number of sub-advisors with differing investment philosophies and strategies to manage portions of the Fund’s portfolio, under the general supervision of SEI Investments Management Corporation (SIMC). Assets of the Fund not allocated to sub-advisors are managed directly by SIMC. The Fund utilized the following sub-advisors as of September 30, 2023: Brandywine Global Investment Management, LLC (Brandywine), Cullen Capital Management, LLC (Cullen) (fka Schafer Cullen Capital Management, Inc.), LSV Asset Management (LSV) and Parametric Portfolio Associates LLC (Parametric).
No manager changes were made during the Fund’s fiscal year.
III. Returns
For the one-year period ending September 30, 2023, the Fund’s Class F shares returned 14.03%. The Fund’s benchmark—the Russell 1000® Value Index, which tracks the performance of the large-cap value segment of the U.S. equity universe—returned 14.44%.
IV. Performance Discussion
The ongoing war in Ukraine, inflation, and rising interest rates were ever present during the 12-month reporting period, but the U.S. equity market rebounded, as discussed in the shareholder letter. The gains were led by mega-cap growth stocks spurred by optimism about artificial intelligence (AI). In the middle of the reporting period, significant concerns arose about the stability of the U.S. banking system as the market was shaken by the failures of Silicon Valley Bank and Signature Bank. Large-cap value and mid-cap stocks lagged relative to their large-cap growth counterparts.
Within the U.S. large-cap segment of the market, information technology, communication services, and energy were the strongest-performing sectors for the period. The poor performance of bank stocks caused the financials sector to lag the overall market. The weakest performers were traditional low-beta sectors such as utilities, real estate, and consumer staples. In some cases, investors had owned low-beta stocks for income from dividends, but rising interest rates made other sources of income available to them. Overall, leadership emanated from more cyclical segments of the market despite the
concerns that a U.S. economic recession could be on the horizon.
Security selection within the information technology sector contributed positively to the Fund’s performance relative to the benchmark Russell 1000® Value Index over the reporting period. This was partially offset by negative security selection within the consumer staples and industrials sectors. An overweight allocation to the banking industry detracted from Fund performance, while an underweight to the real estate sector had a positive impact.
Among the Fund’s managers, LSV’s outperformance relative to the benchmark index was attributable to favorable security selection within the consumer discretionary, health care, and information technology sectors. LSV’s underweight allocations to the utilities and real estate sectors benefited Fund performance.
Cullen underperformed due to its overweight allocations to the consumer staples sector, underweight to the materials sector, and security selection within the industrials sector.
Brandywine outperformed the benchmark as a result of an overweight allocation to the communication services sector and favorable security selection within the industrials sector. However, security selection within the consumer staples sector detracted from Fund performance for the reporting period.
The SEI Factor Based Value Portfolio’s performance for the period benefited from its holdings within the energy sector and underweights to the real estate and utilities sectors.
Investing is subject to risk, including the possible loss of principal. Past performance is no indication of future results.
10
SEI Institutional Managed Trust
AVERAGE ANNUAL TOTAL RETURN1 | |||||
1 Year | Annualized | Annualized | Annualized | Annualized | |
Large Cap Value Fund, Class F | 14.03% | 12.23% | 4.75% | 7.37% | 7.97% |
Large Cap Value Fund, Class I | 13.79% | 11.98% | 4.52% | 7.13% | 8.06% |
Large Cap Value Fund, Class Y | 14.32% | 12.52% | 5.02% | 7.58% | 8.03% |
Russell 1000® Value Index | 14.44% | 11.05% | 6.23% | 8.45% | 9.47% |
Comparison of Change in the Value of a $100,000 Investment in the Large Cap Value Fund, Class F, Class I and Class Y, versus the Russell 1000® Value Index
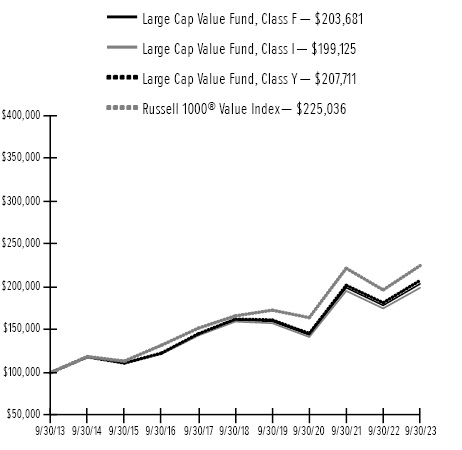
1 | For the year ended 9/30/23. Past performance is no indication of future performance. Class F shares were offered beginning 10/3/94 and Class I shares were offered beginning 8/6/01. The performance of Class I shares prior to 8/6/01 is calculated using the performance of the fund’s Class F shares adjusted for the higher expenses of the Class I shares. Class Y shares were offered beginning 10/30/15. For periods prior to 10/30/15, the performance of the Fund’s Class F Shares has been used. Returns for Class Y Shares would have been substantially similar to those of Class F Shares and would have differed only to the extent that Class Y Shares have lower total annual fund operating expenses than Class F Shares. Returns shown do not reflect the deduction of taxes that a shareholder would pay on fund distributions or the redemption of fund shares. The returns for certain periods reflect fee waivers and/or reimbursements in effect for that period; absent fee waivers and reimbursements, performance would have been lower. |
SEI Institutional Managed Trust
11
MANAGEMENT’S DISCUSSION AND ANALYSIS OF FUND PERFORMANCE
September 30, 2023 (Unaudited)
Large Cap Growth Fund
I. Objective
The Large Cap Growth Fund (the “Fund”) seeks to provide capital appreciation.
II. Investment Approach
The Fund uses a multi-manager approach, relying on a number of sub-advisors with differing investment philosophies and strategies to manage portions of the Fund’s portfolio, under the general supervision of SEI Investments Management Corporation (SIMC). Assets of the Fund not allocated to sub-advisors are managed directly by SIMC. The Fund utilized the following sub-advisors as of September 30, 2023: Fred Alger Management, LLC (Alger), Mackenzie Investment Corporation (Mackenzie), Parametric Portfolio Associates LLC (Parametric), and PineStone Asset Management Inc. (PineStone).
Fiera Capital Inc. (Fiera) and McKinley Capital Management, LLC (McKinley) were terminated and Mackenzie and PineStone were added during the Fund’s fiscal year.
III. Returns
For the one-year period ending September 30, 2023, the Fund’s Class F shares returned 25.88%. The Fund’s benchmark—the Russell 1000® Growth Index, which tracks the performance of the large-cap growth segment of the U.S. equity universe—returned 27.72%.
IV. Performance Discussion
Supply-chain disruptions, the end of pandemic-induced lockdowns, Russia’s invasion of Ukraine, and fiscal stimulus contributed to increased global inflation during the fiscal year. As noted in the shareholder letter, central banks globally reacted by raising interest rates at a record pace. This led to a selloff in most asset markets, including the U.S. stock market. Value stocks generally held up better than their growth counterparts in this environment. Small- and medium-capitalization stocks generally fell further than larger-capitalization stocks during the market decline.
Within the U.S. large-cap universe, as represented by the Russell 1000® Index, the only GICS sectors to produce positive returns were energy and utilities as rising commodity prices benefited oil and gas companies and investors also gravitated toward the less economically sensitive industries such as electric utilities. The consumer staples and health care sectors saw smaller losses than the overall market and helped cushion the decline in portfolios. The communication services sector was the worst performer for the reporting period as shares of both traditional media companies and social media companies fell out of favor.
The Fund’s growth orientation hurt performance during the year. An underweight of the largest capitalization stocks detracted from security selection within the information technology sector. An overweight to the health care and materials sectors, along with favorable security selection within them, was beneficial. Security selection within the financials sector detracted. An underweight to the communication services sector helped benchmark-relative performance.
Alger’s performance was hurt by an underweight to the consumer staples sector and by security selection within the information technology sector. McKinley’s performance benefited from an overweight to the energy sector and favorable security selection within the materials sector, but security selection within the health care and communication services sectors detracted.
The SEI Momentum Factor Portfolio managed by SIMC outperformed due to an underweight of the communication services sector and favorable security selection within the information technology and health care sectors. Fiera’s overweight to the consumer staples sector was beneficial and Fiera provided favorable security selection results within the health care and consumer discretionary sectors.
Investing is subject to risk, including the possible loss of principal. Past performance is no indication of future results.
12
SEI Institutional Managed Trust
AVERAGE ANNUAL TOTAL RETURN1 | |||||
1 Year |
|
|
| Annualized | |
Large Cap Growth Fund, Class F | 25.88% | 6.41% | 10.60% | 12.05% | 9.16% |
Large Cap Growth Fund, Class I | 25.61% | 6.18% | 10.36% | 11.80% | 8.86% |
Large Cap Growth Fund, Class Y | 26.22% | 6.68% | 10.87% | 12.27% | 9.23% |
Russell 1000® Growth Index | 27.72% | 7.97% | 11.42% | 14.48% | 10.49% |
Comparison of Change in the Value of a $100,000 Investment in the Large Cap Growth Fund, Class F, Class I and Class Y, versus the Russell 1000® Growth Index

1 | For the year ended 9/30/23. Past performance is no indication of future performance. Class F shares were offered beginning 12/20/94 and Class I shares were offered beginning 8/6/01. The performance of Class I shares prior to 8/6/01 is calculated using the performance of the fund’s Class F shares adjusted for the higher expenses of the Class I shares. Class Y shares were offered beginning 10/30/15. For periods prior to 10/30/15, the performance of the Fund’s Class F Shares has been used. Returns for Class Y Shares would have been substantially similar to those of Class F Shares and would have differed only to the extent that Class Y Shares have lower total annual fund operating expenses than Class F Shares. Returns shown do not reflect the deduction of taxes that a shareholder would pay on fund distributions or the redemption of fund shares. The returns for certain periods reflect fee waivers and/or reimbursements in effect for that period; absent fee waivers and reimbursements, performance would have been lower. |
SEI Institutional Managed Trust
13
MANAGEMENT’S DISCUSSION AND ANALYSIS OF FUND PERFORMANCE
September 30, 2023 (Unaudited)
Large Cap Index Fund
I. Objective
The Large Cap Index Fund (the “Fund”) seeks to track the performance of a benchmark index that measures the investment return of large-capitalization stocks.
II. Investment Approach
The Fund uses a sub-advisor to manage the Fund’s portfolio under the general supervision of SEI Investments Management Corporation (SIMC). The sole sub-advisor as of September 30, 2023, was SSGA Funds Management, Inc. (SSGA).
No manager changes were made during the Fund’s fiscal year.
III. Returns
For the one-year period ending September 30, 2023, the Fund’s Class F shares returned 20.90%. The Fund’s benchmark—the Russell 1000® Index, which tracks the performance of approximately 1,000 large- and mid-cap U.S. companies that are considered representative of the broad U.S. stock market —returned 21.19%.
IV. Performance Discussion
As discussed in the shareholder letter, the ongoing war in Ukraine, inflation, and rising interest rates were ever present during the 12-month reporting period, but the U.S. equity market rebounded. The gains were led by mega-cap growth stocks spurred by optimism about artificial intelligence (AI). In the middle of the reporting period, significant concerns arose about the stability of the U.S. banking system as the market was shaken by the failures of Silicon Valley Bank and Signature Bank. Large-cap value and mid-cap stocks lagged relative to their large-cap growth counterparts.
Within the U.S. large-cap segment of the market, information technology, communication services, and energy were the strongest-performing sectors for the period. The poor performance of bank stocks caused the financial sector to lag the overall market. The weakest performers were traditional low-beta sectors such as utilities, real estate, and consumer staples. In some cases, investors had owned low-beta stocks for income from dividends, but rising interest rates made other sources of income available to them. Overall, leadership emanated from more cyclical segments of the market despite the concerns that a U.S. economic recession could be on the horizon.
During the reporting period, the Fund achieved its objective of tracking, before fees and expenses, the performance of the Russell 1000® Index.
AVERAGE ANNUAL TOTAL RETURN1 | ||||
1 Year | Annualized | Annualized | Annualized | |
Large Cap Index Fund, Class F | 20.90% | 9.28% | 9.36% | 9.05% |
Russell 1000® Index | 21.19% | 9.53% | 9.63% | 9.34% |
Comparison of Change in the Value of a $100,000 Investment in the Large Index Cap Fund, Class F versus the Russell 1000® Index
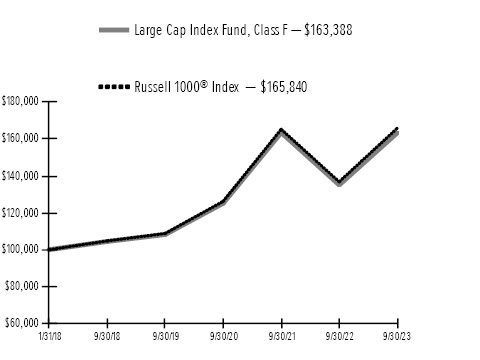
1 | For the year ended 9/30/23. Past performance is no indication of future performance. Class F shares were offered beginning 1/31/18. Returns shown do not reflect the deduction of taxes that a shareholder would pay on fund distributions or the redemption of fund shares. The returns for the period reflect fee waivers and/or reimbursements in effect for the period; absent fee waivers and reimbursements, performance would have been lower. |
14
SEI Institutional Managed Trust
MANAGEMENT’S DISCUSSION AND ANALYSIS OF FUND PERFORMANCE
September 30, 2023 (Unaudited)
Tax-Managed Large Cap Fund
I. Objective
The Tax-Managed Large Cap Fund (the “Fund”) seeks to provide high, long-term after-tax returns.
II. Investment Approach
The Fund uses a multi-manager approach, relying on a number of sub-advisors with differing investment approaches to manage portions of the Fund’s portfolio, under the general supervision of SEI Investments Management Corporation (SIMC). Assets of the Fund not allocated to sub-advisors are managed directly by SIMC. The Fund utilized the following sub-advisors as of September 30, 2023: Brandywine Global Investment Management, LLC (Brandywine), Coho Partners, Ltd. (Coho), Cullen Capital Management, LLC (Cullen) (fka Schafer Cullen Capital Management), LSV Asset Management (LSV), Mar Vista Investment Partners, LLC (Mar Vista), Parametric Portfolio Associates LLC (Parametric), and PineStone Asset Management Inc. (PineStone).
Fiera Capital Inc. (Fiera) was terminated and PineStone was added during the Fund’s fiscal year.
III. Returns
For the one-year period ending September 30, 2023, the Fund’s Class F shares returned 18.44%. The Fund’s benchmark—the Russell 1000® Index, which tracks the performance of the U.S. large-cap equity market—returned 21.19%.
IV. Performance Discussion
The ongoing war in Ukraine, inflation, and rising interest rates were ever present during the 12-month reporting period, but the U.S. equity market rebounded, as noted in the shareholder letter. The gains were led by mega-cap growth stocks spurred by optimism about artificial intelligence (AI). In the middle of the reporting period, significant concerns arose about the stability of the U.S. banking system as the market was shaken by the failures of Silicon Valley Bank and Signature Bank. Large-cap value and mid-cap stocks lagged relative to their large-cap growth counterparts.
Within the U.S. large-cap segment of the market, information technology, communication services, and energy were the strongest-performing sectors for the period. The poor performance of bank stocks caused the financial sector to lag the overall market. The weakest performers were traditional low-beta sectors such as utilities, real estate, and consumer staples. In some cases, investors had owned low-beta stocks for income from dividends, but rising interest rates made other sources of
income available to them. Overall, leadership emanated from more cyclical segments of the market despite the concerns that a U.S. economic recession could be on the horizon.
The Fund’s underweights to the utilities and real estate sectors enhanced performance relative to the benchmark Russell 1000® Index over the reporting period. Underweights to the information technology and communication services sectors weighed on Fund performance. Both an overweight position and stock selection within the consumer staples sector detracted from Fund performance. Overall, the Fund’s value tilt and lower-beta positions hampered relative performance. The Fund’s greater emphasis on medium-capitalization stocks relative to the benchmark also detracted from performance during the reporting period.
Among the Fund’s managers, Brandywine’s value orientation caused its performance to lag relative to the broad market during the reporting period, with an underweight to the information technology sector. Favorable security selection within the industrials and consumer discretionary sectors contributed positively to performance. LSV underperformed due to its value orientation and associated underweight allocation to the information technology sector. Conversely, an overweight to the energy sector benefited performance. Cullen underperformed due to its overweights to the consumer staples, utilities, and real estate sectors and underweight to the information technology sector. Cullen’s security selection within the industrials and communication services sectors detracted from performance. Coho’s overweight allocations to the low-beta consumer staples and health care sectors, along with underweights to the communication services and information technology sectors detracted from performance for the period.
PineStone outperformed the overall market as a result of favorable security selection within the financials, information technology, materials, and consumer discretionary sectors. Mar Vista outperformed due to an overweight allocation to the information technology sector and underweight to the health care sector. The benefit of these sector allocations was partially offset by negative stock selection effects within the financial sector. The SEI Momentum Factor Portfolio underperformed due to security selection within the consumer discretionary, health care, and financials sectors. The SEI Quality Factor Portfolio’s outperformance was attributable to its overweight allocation to the information technology sector and underweights to the utilities and real estate sectors.
SEI Institutional Managed Trust
15
MANAGEMENT’S DISCUSSION AND ANALYSIS OF FUND PERFORMANCE
September 30, 2023 (Unaudited)
Tax-Managed Large Cap Fund (Concluded)
Investing is subject to risk, including the possible loss of principal. Past performance is no indication of future results.
AVERAGE ANNUAL TOTAL RETURN1 | |||||
1 Year |
|
|
| Annualized | |
Tax-Managed Large Cap Fund, Class F | 18.44% | 10.02% | 7.81% | 9.68% | 6.40% |
Tax-Managed Large Cap Fund, Class Y | 18.69% | 10.29% | 8.08% | 9.91% | 6.49% |
Russell 1000® Index | 21.19% | 9.53% | 9.63% | 11.63% | 7.80% |
Comparison of Change in the Value of a $100,000 Investment in the Tax-Managed Large Cap Fund, Class F and Class Y, versus the Russell 1000® Index
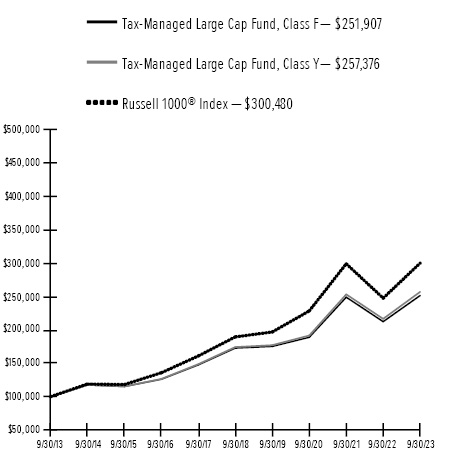
1 | For the year ended 9/30/23. Past performance is no indication of future performance. Class F shares were offered beginning 3/5/98. Class Y shares were offered beginning 12/31/14. For periods prior to 12/31/14, the performance of the Fund’s Class F Shares has been used. Returns for Class Y Shares would have been substantially similar to those of Class F Shares and would have differed only to the extent that Class Y Shares have lower total annual fund operating expenses than Class F Shares. Returns shown do not reflect the deduction of taxes that a shareholder would pay on fund distributions or the redemption of fund shares. The returns for certain periods reflect fee waivers and/or reimbursements in effect for that period; absent fee waivers and reimbursements, performance would have been lower. |
16
SEI Institutional Managed Trust
MANAGEMENT’S DISCUSSION AND ANALYSIS OF FUND PERFORMANCE
September 30, 2023 (Unaudited)
S&P 500 Index Fund
I. Objective
The S&P 500 Index Fund (“the Fund”) seeks to provide investment results that correspond to the aggregate price and dividend performance of the securities in the S&P 500 Index.
Investment Approach
The Fund uses a sub-advisor to manage the Fund’s portfolio under the general supervision of SEI Investments Management Corporation (SIMC). The sole sub-advisor as of September 30, 2023, was SSGA Funds Management, Inc. (SSGA).
No manager changes were made during the Fund’s fiscal year.
II. Returns
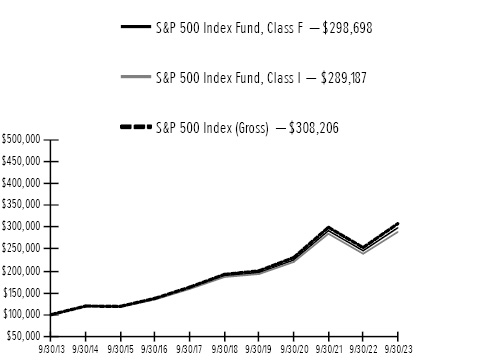
For the one-year period ending September 30, 2023, the Fund’s Class F shares returned 21.31%. The Fund’s benchmark—the S&P 500 Index (gross), which tracks the performance of approximately 500 large U.S. companies that are considered representative of the broad U.S. stock market—returned 21.62%.
III. Performance Discussion
The ongoing war in Ukraine, inflation, and rising interest rates were ever present during the 12-month reporting period, but the U.S. equity market rebounded, as noted in the shareholder letter. The gains were led by mega-cap growth stocks spurred by optimism about artificial intelligence (AI). In the middle of the reporting period, significant concerns arose about the stability of the U.S. banking system as the market was shaken by the failures of Silicon Valley Bank and Signature Bank. Large-cap value and mid-cap stocks lagged relative to their large-cap growth counterparts.
Within the U.S. large-cap segment of the market, information technology, communication services, and energy were the strongest-performing sectors for the period. The poor performance of bank stocks caused the financials sector to lag the overall market. The weakest performers were traditional low-beta sectors such as utilities, real estate, and consumer staples. In some cases, investors had owned low-beta stocks for income from dividends, but rising interest rates made other sources of income available to them. Overall, leadership emanated from more cyclical segments of the market despite the concerns that a U.S. economic recession could be on the horizon.
During the reporting period, the Fund achieved its objective of tracking, before fees and expenses, the performance of the S&P 500 Index.
Investing is subject to risk, including the possible loss of principal. Past performance is no indication of future results.
AVERAGE ANNUAL TOTAL RETURN1 | |||||
1 Year |
|
|
| Annualized | |
S&P 500 Index Fund, Class F | 21.31% | 9.89% | 9.66% | 11.56% | 8.72% |
S&P 500 Index Fund, Class I | 20.83% | 9.45% | 9.22% | 11.20% | 8.58% |
S&P 500 Index (Gross) | 21.62% | 10.15% | 9.92% | 11.91% | 9.11% |
Comparison of Change in the Value of a $100,000 Investment in the S&P 500 Index Fund, Class F and Class I, versus the S&P 500 Index (Gross)
1 | For the year ended 9/30/23. Past performance is not an indication of future performance. Class F shares were offered beginning 2/28/96. Class I shares were offered beginning 6/28/02. The performance of Class I shares prior to 6/28/02 is calculated using the performance of the fund’s Class F shares adjusted for the higher expenses of the Class I shares. Returns shown do not reflect the deduction of taxes that a shareholder would pay on fund distributions or the redemption of fund shares. The returns for certain periods reflect fee waivers and reimbursements, performance would have been lower. |
SEI Institutional Managed Trust
17
MANAGEMENT’S DISCUSSION AND ANALYSIS OF FUND PERFORMANCE
September 30, 2023 (Unaudited)
Small Cap Fund
I. Objective
The Small Cap Fund (the “Fund”) seeks to provide capital appreciation.
II. Investment Approach
The Fund uses a multi-manager approach, relying on a number of sub-advisors with differing investment approaches to manage portions of the Fund’s portfolio, under the general supervision of SEI Investments Management Corporation (SIMC). The Fund utilized the following sub-advisors as of September 30, 2023: Copeland Capital Management, LLC (Copeland), EAM Investors, LLC (EAM), Easterly Investment Partners LLC (Easterly), Hillsdale Investment Management Inc. (Hillsdale), Leeward Investments, LLC (Leeward), Los Angeles Capital Management, LLC (LA Capital) and Parametric Portfolio Associates LLC (Parametric).
No manager changes were made during the Fund’s fiscal year.
III. Returns
For the one-year period ending September 30, 2023, the Fund’s Class F shares returned 10.86%. The Fund’s benchmark—the Russell 2000® Index, which tracks the performance of the U.S. small-cap equity market—returned 8.93%.
IV. Performance Discussion
As noted in the shareholder letter, the reporting period was largely defined by the continuing monetary policy tightening of the U.S. Federal Reserve (Fed), which remained stalwart in its mission to curb inflation without tipping the U.S. economy into a full-blown recession.
In the fourth quarter of 2022, U.S. financial markets rallied on investors’ hopes that the inflation had peaked. This upturn stemmed further losses in what ultimately proved to be the worst calendar year for Wall Street since 2008. The Fed raised the federal-funds rate by 50 basis points (0.50%) after a series of 75-basis point increases to a target range of 4.25%-4.50%, while also indicating its terminal rate (the final interest rate that the Fed seeks to achieve at the end of its monetary policy tightening cycle) might be higher than initially expected (landing just above 5%). The central bank also signaled that interest rates might remain higher for a longer period while the results of its policy tightening cycle take effect. Markets reacted negatively to the higher terminal rate before stabilizing, and still seemed to be pricing in a rate-cut in late 2023. Economically sensitive sectors such as energy, materials, and industrials were the strongest performers during the fourth quarter of 2022,
while health care, communication services and information technology lagged. Small-cap value stocks significantly outperformed their growth counterparts, widening their trailing 12-month lead. The trend was even more pronounced in the large-cap universe, where shares of mega-cap tech companies continued to take a beating.
Early in the first quarter of 2023, many stocks that had been underperforming rallied, as higher-risk assets rebounded. The market was retesting short-term highs previously achieved in August 2022, when Silicon Valley Bank (SVB), a California-based regional bank with a large venture capital depositor base, collapsed. The bank had underestimated the number of withdrawals that it would face amid a rising-rate environment, and its investments in long-term bonds further strained its capital structure. When SVB announced an equity raise to address this shortfall, a bank run began that forced the institution into insolvency. First Republic and Signature Bank also shut down, and for a time it appeared that the entire financial system was in danger. The Federal Deposit Insurance Corporation (FDIC) stepped in to make uninsured depositors whole, while larger banks made strategic deposits in an attempt to maintain liquidity at other regional institutions. The ripples were felt globally as Switzerland-based financial services provider UBS agreed to purchase Swiss financial services company Credit Suisse. This stemmed the tide of failures, but it also forced investors to realign expectations for both credit and economic conditions for the remainder of the year. During this period, investors flocked to the perceived safety of mega-cap tech names at the expense of smaller-cap stocks and financial companies. This created a meaningful headwind for the value factor, which has significant representation in the financials sector. For the next two months, the U.S. market moved sideways as recessionary expectations persisted in the wake of the crisis.
Financial stocks rebounded in April, and in May, the Fed raised its benchmark interest rate again, but only by 25 basis points, with the caveat that it was prepared to halt further rate hikes depending on the response to higher borrowing costs. At its June meeting, the central bank opted to hold the federal-funds rate at a range of 5.00% to 5.25%. This led to a "risk on" equity market environment. Lower-quality, higher-beta companies with no earnings and sales led the way in this rally. Higher-quality and defensive names lagged the market. Higher-beta and economically sensitive sectors performed well, including industrials (especially airlines and homebuilding), technology, and health care, which was driven by the biotech subsector's massive rally in the second quarter of 2023. Defensive sectors such as utilities underperformed; financials also lagged the market as the banking crisis in March still faced
18
SEI Institutional Managed Trust
some pressure during the second quarter. In terms of factors, growth outperformed value and momentum.
During the third quarter of 2023, markets rallied in July on optimism that the Fed could successfully navigate a soft landing for the economy while still curbing inflation. This rally was ultimately offset over the remainder of the quarter as the Fed raised its benchmark interest rate another 25 basis points in late July, and investors began to grapple with the possibility of a ”higher for longer” interest -rate cycle. In September, the Fed opted to maintain the federal-funds target rate at a range of 5.25% to 5.50%, and indicated that interest-rate cuts would not be considered until late 2024, due to its concerns that inflation could be resurgent otherwise. A weakening Chinese economy also weighed on investors’ outlook, and ultimately major equity market indexes slid by mid-to-low single digits. Large-cap stocks held up better than small caps, and energy stocks soared on rising oil prices—one of the only sectors to post a gain over the third quarter of 2023. The value factor outperformed within the small-cap universe, but was essentially flat relative to large-cap growth stocks, where the “Magnificent Seven" (Amazon, Apple, Alphabet (parent of Google), Meta, Microsoft, Nvidia and Tesla) generally continued to drive index level performance, with concentration in just these few names at near-record levels.
For the 12-month reporting period, from a factor perspective, value outperformed growth—though it lost ground relative to growth during both the “risk-on” rally in early 2023, and throughout the regional banking crisis. This is reflected in the Russell style indexes, where financials detracted from the return of the Russell 2000® Value Index (which tracks the performance of the small-cap value segment of the U.S. equity market), and the inclusion of more speculative tech stocks bolstered the performance of the Russell 2000® Growth Index (which tracks the performance of the small- to mid-cap growth segment of the U.S. equity market. Quality outperformed as well, though the low volatility factor trailed in the face of multiple risk-on moves over the reporting period. Momentum saw modest outperformance in the face of shifting market leadership. The top-performing sectors within the Russell 2000® Index for the reporting period were energy, industrials, and consumer discretionary, while the weakest performers included health care, utilities, and communication services.
The Fund outperformed its benchmark, the Russell 2000® Index, for the reporting period, attributable mainly to stock selection in the information technology and consumer discretionary sectors. There generally was a positive environment for the Fund over the period, with value, quality, and momentum factors outperforming. Value was
the largest tailwind to Fund performance, closely followed by quality, while momentum was a marginal contributor to performance. Nonetheless, the first and second quarters of 2023 were challenging for our alpha sources, as both big-tech growth stocks rallied and fundamental factors such as value and momentum underperformed.
Five of the Fund’s seven sub-advisors outperformed the benchmark Russell 2000® Index for the reporting period. Easterly’s performance benefited from strong stock selection in information technology, specifically hardware and equipment, and financials. Value tailwinds also bolstered the strategy’s performance. Copeland also benefited from factor tailwinds, with quality outperforming; however, low volatility headwinds detracted from performance. Hillsdale and Leeward contributed positively to Fund performance to a slightly lesser degree. Hillsdale benefited from stock selection in the information technology sector and Leeward’s performance was bolstered by value tailwinds. LA Capital performed in line with the benchmark. EAM was the lone manager to detract from Fund performance, despite slight momentum tailwinds. Poor stock selection in the industrials sector, specifically capital goods, and consumer discretionary stocks drove EAM’s underperformance for the reporting period.
No manager changes occurred during the reporting period. Some capital was reallocated from EAM to Easterly to increase the Fund’s value exposure.
Investing is subject to risk, including the possible loss of principal. Past performance is no indication of future results.
AVERAGE ANNUAL TOTAL RETURN1 | ||||||
1 Year | Annualized | Annualized | Annualized | Annualized | ||
Small Cap Fund, Class F | 10.86% | 11.36% | 3.70% | 5.92% | 8.63% | |
Small Cap Fund, Class Y | 11.18% | 11.62% | 3.97% | 6.15% | 8.80% | |
Russell 2000® Index | 8.93% | 7.16% | 2.40% | 6.65% | 9.51% | |
SEI Institutional Managed Trust
19
MANAGEMENT’S DISCUSSION AND ANALYSIS OF FUND PERFORMANCE
September 30, 2023 (Unaudited)
Small Cap Fund (Concluded)
Comparison of Change in the Value of a $100,000
Investment in the Small Cap Fund, Class F and Class Y,
versus the Russell 2000® Index

1 | For the year ended 9/30/23. Past performance is not an indication of future performance. Class F shares were offered beginning 9/30/09. Class Y shares were offered beginning 12/31/14. For periods prior to 12/31/14, the performance of the Fund’s Class F Shares has been used. Returns for Class Y Shares would have been substantially similar to those of Class F Shares and would have differed only to the extent that Class Y Shares have lower total annual fund operating expenses than Class F Shares. Returns shown do not reflect the deduction of taxes that a shareholder would pay on fund distributions or the redemption of fund shares. The returns for certain periods reflect fee waivers and reimbursements, performance would have been lower. |
20
SEI Institutional Managed Trust
MANAGEMENT’S DISCUSSION AND ANALYSIS OF FUND PERFORMANCE
September 30, 2023 (Unaudited)
Small Cap Value Fund
I. Objective
The Small Cap Value Fund (the “Fund”) seeks to provide capital appreciation.
II. Investment Approach
The Fund uses a multi-manager approach, relying on a number of sub-advisors with differing investment approaches to manage portions of the Fund’s portfolio, under the general supervision of SEI Investments Management Corporation (SIMC). Assets of the Fund not allocated to sub-advisors are managed directly by SIMC. The Fund utilized the following sub-advisors as of September 30, 2023: Cardinal Capital Management, LLC (Cardinal), Easterly Investment Partners LLC (Easterly), LSV Asset Management (LSV) and Parametric Portfolio Associates LLC (Parametric).
No manager changes were made during the Fund’s fiscal year.
III. Returns
For the one-year period ending September 30, 2023, the Fund’s Class F shares returned 13.98%. The Fund’s benchmark—the Russell 2000® Value Index, which tracks the performance of the small-cap value segment of the U.S. equity universe—returned 7.84%.
IV. Performance Discussion
As addressed in the shareholder letter, the reporting period was largely defined by continuing monetary policy tightening by the U.S. Federal Reserve (Fed), which remained stalwart in its mission to curb inflation without tipping the U.S. economy into a full-blown recession.
In the fourth quarter of 2022, U.S. financial markets rallied on investors’ hopes that the inflation had peaked. This upturn stemmed further losses in what ultimately proved to be the worst calendar year for Wall Street since 2008. The Fed raised the federal-funds rate by 50 basis points (0.50%) after a series of 75-basis point increases to a target range of 4.25%-4.50%, while also indicating its terminal rate (the final interest rate that the Fed seeks to achieve at the end of its monetary policy tightening cycle) might be higher than initially expected (landing just above 5%). The central bank also signaled that interest rates might remain higher for a longer period while the results of its policy tightening cycle take effect. Markets reacted negatively to the higher terminal rate before stabilizing, and still seemed to be pricing in a rate-cut in late 2023. Economically sensitive sectors such as energy, materials, and industrials were the strongest performers during the fourth quarter of 2022, while health care, communication services and information
technology lagged. Small-cap value stocks significantly outperformed their growth counterparts, widening their trailing 12-month lead. The trend was even more pronounced in the large-cap universe, where shares of mega-cap tech companies continued to take a beating.
Early in the first quarter of 2023, many stocks that had been underperforming rallied, as higher-risk assets rebounded. The market was retesting short-term highs previously achieved in August 2022, when Silicon Valley Bank (SVB), a California-based regional bank with a large venture capital depositor base, collapsed. The bank had underestimated the number of withdrawals that it would face amid a rising-rate environment, and its investments in long-term bonds further strained its capital structure. When SVB announced an equity raise to address this shortfall, a bank run began that forced the institution into insolvency. First Republic and Signature Bank also shut down, and for a time it appeared that the entire financial system was in danger. The Federal Deposit Insurance Corporation (FDIC) stepped in to make uninsured depositors whole, while larger banks made strategic deposits in an attempt to maintain liquidity at other regional institutions. The ripples were felt globally as Switzerland-based financial services provider UBS agreed to purchase Swiss financial services company Credit Suisse. This stemmed the tide of failures, but it also forced investors to realign expectations for both credit and economic conditions for the remainder of the year. During this period, investors flocked to the perceived safety of mega-cap tech names at the expense of smaller-cap stocks and financial companies. This created a meaningful headwind for the value factor, which has significant representation in the financial sector. For the next two months, the U.S. market moved sideways as recessionary expectations persisted in the wake of the crisis.
Financial stocks rebounded in April, and in May, the Fed raised its benchmark interest rate again, but only by 25 basis points, with the caveat that it was prepared to halt further rate hikes depending on the response to higher borrowing costs. At its June meeting, the central bank opted to hold the federal-funds rate at a range of 5.00% to 5.25%. This led to a "risk on" equity market environment. Lower-quality, higher-beta companies with no earnings and sales led the way in this rally. Higher-quality and defensive names lagged the market. Higher-beta and economically sensitive sectors performed well, including industrials (especially airlines and homebuilding), technology, and health care, which was driven by the biotech subsector's massive rally in the second quarter of 2023. Defensive sectors such as utilities underperformed; financials also lagged the market as the banking crisis in March still faced
SEI Institutional Managed Trust
21
MANAGEMENT’S DISCUSSION AND ANALYSIS OF FUND PERFORMANCE
September 30, 2023 (Unaudited)
Small Cap Value Fund (Concluded)
some pressure during the second quarter. In terms of factors, growth outperformed value and momentum.
During the third quarter of 2023, markets rallied in July on optimism that the Fed could successfully navigate a soft landing for the economy while still curbing inflation. This rally was ultimately offset over the remainder of the quarter as the Fed raised its benchmark interest rate another 25 basis points in late July, and investors began to grapple with the possibility of a ”higher for longer” interest -rate cycle. In September, the Fed opted to maintain the federal-funds target rate at a range of 5.25% to 5.50%, and indicated that interest-rate cuts would not be considered until late 2024, due to its concerns that inflation could be resurgent otherwise. A weakening Chinese economy also weighed on investors’ outlook, and ultimately major equity market indexes slid by mid-to-low single digits. Large-cap stocks held up better than small caps, and energy stocks soared on rising oil prices—one of the only sectors to post a gain over the third quarter of 2023. The value factor outperformed within the small-cap universe, but was essentially flat relative to large-cap growth stocks, where the “Magnificent Seven" (Amazon, Apple, Alphabet (parent of Google), Meta, Microsoft, Nvidia and Tesla) generally continued to drive index level performance, with concentration in just these few names at near-record levels.
From a factor perspective, value outperformed during the reporting period—though it lost ground relative to growth during both the early 2023 risk-on rally and throughout the regional banking crisis. This was reflected in the Russell style indexes, where financial stocks detracted from the Russell 2000® Value Index’s return, and the inclusion of more speculative tech stocks bolstered the Russell 2000® Growth Index’s return. Quality outperformed as well, though low volatility trailed in the face of multiple risk-on market moves over the reporting period. Momentum saw modest outperformance in the face of shifting market leadership. The top-performing sectors within the Russell 2000® Value Index during the period were energy, industrials, and consumer discretionary, while health care, utilities and communication services were the weakest performers.
The Fund outperformed its benchmark, the Russell 2000® Value Index, over the reporting period due largely to positive stock selection within the information technology, financials, and industrials sectors. Sector positioning also benefited Fund performance, particularly underweight allocations to health care and financials. The Fund’s positive active value and quality exposure relative to the benchmark index were the largest factor tailwinds, benefiting from both overweight allocations to the cheapest higher-quality stocks and underweights to the most expensive lower-quality stocks.
Among the Fund’s subadvisors, LSV was the largest positive contributor to performance for the reporting period. LSV’s systematic exposure to the value factor was a tailwind for performance, as was stock selection in several sectors, specifically information technology and financials.
Easterly also contributed positively to Fund performance for the reporting period due to strong stock selection in the information technology sector, particularly in hardware and equipment, and financials. Value tailwinds also enhanced the strategy’s performance. The SEI value strategy was a positive contributor to Fund performance for similar reasons, though lagging LSV and Easterly.
Cardinal was the sole detractor from Fund performance during the reporting period due to poor selection in the materials, industrials, and consumer discretionary sectors. Underweight allocations to utilities and health care weighed on Fund performance.
There were no manager changes over the period, though roughly 6% of the Fund’s assets were reallocated from Cardinal to LSV and Easterly.
Investing is subject to risk, including the possible loss of principal. Past performance is no indication of future results.
AVERAGE ANNUAL TOTAL RETURN1 | |||||
1 Year | Annualized | Annualized | Annualized | Annualized | |
Small Cap Value Fund, Class F | 13.98% | 14.87% | 2.84% | 5.10% | 8.72% |
Small Cap Value Fund, Class I | 13.70% | 14.60% | 2.61% | 4.86% | 8.42% |
Small Cap Value Fund, Class Y | 14.32% | 15.17% | 3.11% | 5.32% | 8.80% |
Russell 2000® Value Index | 7.84% | 13.32% | 2.59% | 6.19% | 9.38% |
22
SEI Institutional Managed Trust
Comparison of Change in the Value of a $100,000 Investment in the Small Cap Value Fund, Class F, Class I and Class Y, versus the Russell 2000® Value Index
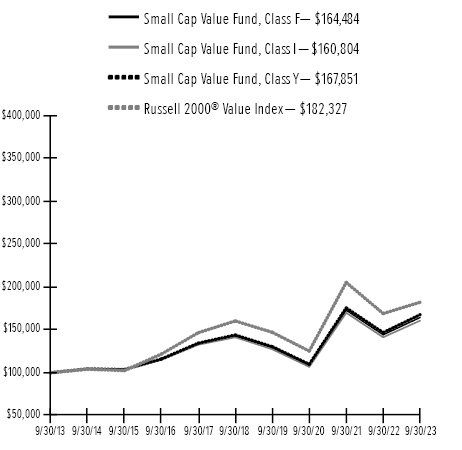
1 | For the year ended 9/30/23. Past performance is no indication of future performance. Class F shares were offered beginning 12/20/94 and Class I shares were offered beginning 2/11/02. Class I shares performance for the period prior to 2/11/02 is derived from the performance of Class F shares adjusted for the higher expenses of the Class I shares. Class Y shares were offered beginning 10/30/15. For periods prior to 10/30/15, the performance of the Fund’s Class F Shares has been used. Returns for Class Y Shares would have been substantially similar to those of Class F Shares and would have differed only to the extent that Class Y Shares have lower total annual fund operating expenses than Class F Shares. Returns shown do not reflect the deduction of taxes that a shareholder would pay on fund distributions or the redemption of fund shares. The returns for certain periods reflect fee waivers and/or reimbursements in effect for that period; absent fee waivers and reimbursements, performance would have been lower. |
SEI Institutional Managed Trust
23
MANAGEMENT’S DISCUSSION AND ANALYSIS OF FUND PERFORMANCE
September 30, 2023 (Unaudited)
Small Cap Growth Fund
I. Objective
The Small Cap Growth Fund (the “Fund”) seeks to provide long-term capital appreciation.
II. Investment Approach
The Fund uses a multi-manager approach, relying on a number of sub-advisors with differing investment approaches to manage portions of the Fund’s portfolio, under the general supervision of SEI Investments Management Corporation (SIMC). Assets of the Fund not allocated to sub-advisors are managed directly by SIMC. The Fund utilized the following sub-advisors as of September 30, 2023: ArrowMark Colorado Holdings LLC (ArrowMark), EAM Investors LLC (EAM), Jackson Creek Investment Advisors, LLC (Jackson Creek) and Parametric Portfolio Associates LLC (Parametric).
No manager changes were made during the Fund’s fiscal year.
III. Returns
For the full year ended September 30, 2023, the Fund’s Class F shares returned 7.31%. The Fund’s benchmark—the Russell 2000® Growth Index, which tracks the performance of the small-cap growth segment of the U.S. equity universe—returned 9.59%.
IV. Performance Discussion
As discussed in the shareholder letter, the reporting period was largely defined by continuing monetary policy tightening by the U.S. Federal Reserve (Fed), which remained stalwart in its mission to curb inflation without tipping the U.S. economy into a full-blown recession.
In the fourth quarter of 2022, U.S. financial markets rallied on investors’ hopes that inflation had peaked. This upturn stemmed further losses in what ultimately proved to be the worst calendar year for Wall Street since 2008. The Fed raised the federal-funds rate by 50 basis points (0.50%) after a series of 75-basis point increases to a target range of 4.25%-4.50%, while also indicating its terminal rate (the final interest rate that the Fed seeks to achieve at the end of its monetary policy tightening cycle) might be higher than initially expected (landing just above 5%). The central bank also signaled that interest rates might remain higher for a longer period while the results of its policy tightening cycle take effect. Markets reacted negatively to the higher terminal rate before stabilizing, and still seemed to be pricing in a rate-cut in late 2023. Economically sensitive sectors such as energy, materials, and industrials were the strongest performers during the fourth quarter of 2022, while health care, communication services and information
technology lagged. Small-cap value stocks significantly outperformed their growth counterparts, widening their trailing 12-month lead. The trend was even more pronounced in the large-cap universe, where shares of mega-cap tech companies continued to take a beating.
Early in the first quarter of 2023, many stocks that had been underperforming rallied, as higher-risk assets rebounded. The market was retesting short-term highs previously achieved in August 2022, when Silicon Valley Bank (SVB), a California-based regional bank with a large venture capital depositor base, collapsed. The bank had underestimated the number of withdrawals that it would face amid a rising-rate environment, and its investments in long-term bonds further strained its capital structure. When SVB announced an equity raise to address this shortfall, a bank run began that forced the institution into insolvency. First Republic and Signature Bank also shut down, and for a time it appeared that the entire financial system was in danger. The Federal Deposit Insurance Corporation (FDIC) stepped in to make uninsured depositors whole, while larger banks made strategic deposits in an attempt to maintain liquidity at other regional institutions. The ripples were felt globally as Switzerland-based financial services provider UBS agreed to purchase Swiss financial services company Credit Suisse. This stemmed the tide of failures, but it also forced investors to realign expectations for both credit and economic conditions for the remainder of the year. During this period, investors flocked to the perceived safety of mega-cap tech names at the expense of smaller-cap stocks and financial companies. This created a meaningful headwind for the value factor, which has significant representation in the financials sector. For the next two months, the U.S. market moved sideways as recessionary expectations persisted in the wake of the crisis.
Financial stocks rebounded in April, and in May, the Fed raised its benchmark interest rate again, but only by 25 basis points, with the caveat that it was prepared to halt further rate hikes depending on the response to higher borrowing costs. At its June meeting, the central bank opted to hold the federal-funds rate at a range of 5.00% to 5.25%. This led to a "risk on" equity market environment. Lower-quality, higher-beta companies with no earnings and sales led the way in this rally. Higher-quality and defensive names lagged the market. Higher-beta and economically sensitive sectors performed well, including industrials (especially airlines and homebuilding), technology, and health care, which was driven by the biotech subsector's massive rally in the second quarter of 2023. Defensive sectors such as utilities underperformed; financials also lagged the market as the banking crisis in March still faced
24
SEI Institutional Managed Trust
some pressure during the second quarter. In terms of factors, growth outperformed value and momentum.
During the third quarter of 2023, markets rallied on optimism that the Fed could successfully navigate a soft landing for the economy while still curbing inflation. This rally was ultimately offset over the remainder of the quarter as the Fed raised its benchmark interest rate another 25 basis points in late July, and investors began to grapple with the possibility of a ”higher for longer” interest -rate cycle. In September, the Fed opted to maintain the federal-funds target rate at a range of 5.25% to 5.50%, and indicated that interest-rate cuts would not be considered until late 2024, due to its concerns that inflation could be resurgent otherwise. A weakening Chinese economy also weighed on investors’ outlook, and ultimately major equity market indexes slid by mid-to-low single digits. Large-cap stocks held up better than small caps, and energy stocks soared on rising oil prices—one of the only sectors to post a gain over the third quarter of 2023. The value factor outperformed within the small-cap universe, but was essentially flat relative to large-cap growth stocks, where the “Magnificent Seven" (Amazon, Apple, Alphabet (parent of Google), Meta, Microsoft, Nvidia and Tesla) generally continued to drive index level performance, with concentration in just these few names at near-record levels.
From a factor perspective, value outperformed during the reporting period–though it lost ground relative to growth during both the early 2023 risk-on rally and throughout the regional banking crisis. This was reflected in the Russell style indexes, where financial stocks detracted from the Russell 2000® Value Index’s return, and the inclusion of more speculative tech stocks bolstered the Russell 2000® Growth Index’s return. Quality outperformed as well, though low volatility trailed in the face of multiple risk-on market moves over the reporting period. Momentum saw modest outperformance in the face of shifting market leadership. The top-performing sectors within the Russell 2000® Growth Index for the period were energy, consumer staples, and industrials, while the utilities, health care and communication services were the primary market laggards.
The Fund underperformed its benchmark for the reporting period due predominantly to negative stock selection within the financials sector. Overall sector positioning slightly hampered Fund performance, particularly an overweight allocation to energy and an underweight to information technology. The Fund’s overweights to value and quality relative to the broader Russell 2000® Growth Index–particularly an underweight to the most expensive and lowest-quality stocks—offset some of the negative stock selection. Momentum positioning was slightly additive as well.
Among the Fund’s sub-advisors, Arrowmark was the top contributor to performance for the reporting period. The strategy benefited from growth tailwinds, as well as positive stock selection effects in the industrials sectors, specifically commercial and professional services. The SEI momentum strategy also contributed positively to Fund performance on momentum tailwinds, though to a lesser degree. Jackson Creek detracted from performance for the period due to poor allocation and stock selection in industrials, particularly capital goods.
EAM was, by far, the largest detractor from Fund performance for the reporting period, attributable mainly to poor stock selection in the industrials sector, specifically capital goods, and in the consumer discretionary sector.
There were no manager changes over the reporting period, though capital was reallocated from EAM into Jackson Creek.
Investing is subject to risk, including the possible loss of principal. Past performance is no indication of future results.
AVERAGE ANNUAL TOTAL RETURN1 | |||||
1 Year | Annualized | Annualized | Annualized | Annualized | |
Small Cap Growth Fund, Class F | 7.31% | 4.15% | 0.55% | 6.05% | 8.31% |
Small Cap Growth Fund, Class I | 7.03% | 3.88% | 0.30% | 5.78% | 5.00% |
Small Cap Growth Fund, Class Y | 7.58% | 4.41% | 0.81% | 6.26% | 8.38% |
Russell 2000® Growth Index | 9.59% | 1.09% | 1.55% | 6.72% | 7.36% |
SEI Institutional Managed Trust
25
MANAGEMENT’S DISCUSSION AND ANALYSIS OF FUND PERFORMANCE
September 30, 2023 (Unaudited)
Small Cap Growth Fund (Concluded)
Comparison of Change in the Value of a $100,000 Investment in the Small Cap Growth Fund, Class F, Class I and Class Y, versus the Russell 2000® Growth Index
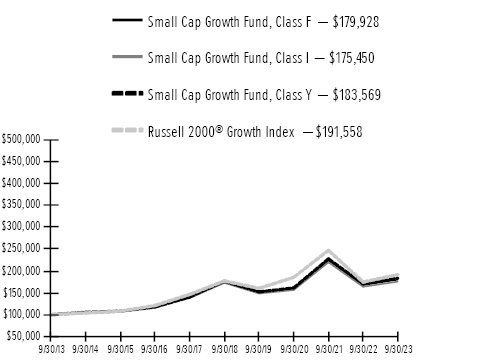
1 | For the year ended 9/30/23. Past performance is not an indication of future performance. Class F shares were offered beginning 4/20/92 and Class I shares were offered beginning 8/6/01. Class I shares performance for the period prior to 8/6/01 is derived from the performance of Class F shares adjusted for the higher expenses of Class I shares. Class Y shares were offered beginning 10/30/15. For periods prior to 10/30/15, the performance of the Fund’s Class F Shares has been used. Returns for Class Y Shares would have been substantially similar to those of Class F Shares and would have differed only to the extent that Class Y Shares have lower total annual fund operating expenses than Class F Shares. Returns shown do not reflect the deduction of taxes that a shareholder would pay on fund distributions or the redemption of fund shares. The returns for certain periods reflect fee waivers and/or reimbursements in effect for that period; absent fee waivers and/or reimbursements, performance would have been lower. |
26
SEI Institutional Managed Trust
MANAGEMENT’S DISCUSSION AND ANALYSIS OF FUND PERFORMANCE
September 30, 2023 (Unaudited)
Tax-Managed Small/Mid Cap Fund
I. Objective
The Tax-Managed Small/Mid Cap Fund (the “Fund”) seeks to provide high, long-term after-tax returns.
II. Investment Approach
The Fund uses a multi-manager approach, relying on a number of sub-advisers with differing investment approaches to manage portions of the Fund’s portfolio, under the general supervision of SEI Investments Management Corporation (“SIMC”). The Fund utilized the following sub-advisers during the fiscal year ending September 30, 2023: Cardinal Capital Management, LLC (“Cardinal”), Easterly Investment Partners LLC (“Easterly”), Hillsdale Investment Management Inc. (“Hillsdale”), Martingale Asset Management, LP (“Martingale”), Parametric Portfolio Associates LLC (“Parametric”) and Rice Hall James & Associates LLC (“Rice Hall”).
No manager changes were made during the Fund’s fiscal year.
III. Returns
For the one-year period ending September 30, 2023, the Fund’s Class F shares returned 10.21%. The Fund’s benchmark—the Russell 2500® Index, which tracks the performance of the small- to mid-cap segment of the U.S. equity universe—returned 11.28%.
IV. Performance Discussion
As detailed in the shareholder letter, the reporting period was largely defined by continuing monetary policy tightening by the U.S. Federal Reserve (“Fed”), which remained stalwart in its mission to curb inflation without tipping the U.S. economy into a full-blown recession.
In the fourth quarter of 2022, U.S. financial markets rallied on investors’ hopes that inflation had peaked. This upturn stemmed further losses in what ultimately proved to be the worst calendar year for Wall Street since 2008. The Fed raised the federal-funds rate by 50 basis points (0.50%) after a series of 75-basis point increases to a target range of 4.25%-4.50%, while also indicating its terminal rate (the final interest rate that the Fed seeks to achieve at the end of its monetary policy tightening cycle) might be higher than initially expected (landing just above 5%). The central bank also signaled that interest rates might remain higher for a longer period while the results of its policy tightening cycle take effect. Markets reacted negatively to the higher terminal rate before stabilizing, and still seemed to be pricing in a rate-cut in late 2023. Economically sensitive sectors such as energy, materials, and industrials were the strongest performers during the fourth quarter of 2022,
while health care, communication services and information technology lagged. Small-cap value stocks significantly outperformed their growth counterparts, widening their trailing 12-month lead. The trend was even more pronounced in the large-cap universe, where shares of mega-cap tech companies continued to take a beating.
Early in the first quarter of 2023, many stocks that had been underperforming rallied, as higher-risk assets rebounded. The market was retesting short-term highs previously achieved in August 2022, when Silicon Valley Bank (“SVB”), a California-based regional bank with a large venture capital depositor base, collapsed. The bank had underestimated the number of withdrawals that it would face amid a rising-rate environment, and its investments in long-term bonds further strained its capital structure. When SVB announced an equity raise to address this shortfall, a bank run began that forced the institution into insolvency. First Republic and Signature Bank also shut down, and for a time it appeared that the entire financial system was in danger. The Federal Deposit Insurance Corporation (“FDIC”) stepped in to make uninsured depositors whole, while larger banks made strategic deposits in an attempt to maintain liquidity at other regional institutions. The ripples were felt globally as Switzerland-based financial services provider UBS agreed to purchase Swiss financial services company Credit Suisse. This stemmed the tide of failures, but it also forced investors to realign expectations for both credit and economic conditions for the remainder of the year. During this period, investors flocked to the perceived safety of mega-cap tech names at the expense of smaller-cap stocks and financial companies. This created a meaningful headwind for the value factor, which has significant representation in the financials sector. For the next two months, the U.S. market moved sideways as recessionary expectations persisted in the wake of the crisis.
Financial stocks rebounded in April, and in May, the Fed raised its benchmark interest rate again, but only by 25 basis points, with the caveat that it was prepared to halt further rate hikes depending on the response to higher borrowing costs. At its June meeting, the central bank opted to hold the federal-funds rate at a range of 5.00% to 5.25%. This led to a "risk on" equity market environment. Lower-quality, higher-beta companies with no earnings and sales led the way in this rally. Higher-quality and defensive names lagged the market. Higher-beta and economically sensitive sectors performed well, including industrials (especially airlines and homebuilding), technology, and health care, which was driven by the biotech subsector's massive rally in the second quarter of 2023. Defensive sectors such as utilities underperformed; financials also lagged the market as the banking crisis in March still faced
SEI Institutional Managed Trust
27
MANAGEMENT’S DISCUSSION AND ANALYSIS OF FUND PERFORMANCE
September 30, 2023 (Unaudited)
Tax-Managed Small/Mid Cap Fund (Continued)
some pressure during the second quarter. In terms of factors, growth outperformed value and momentum.
During the third quarter of 2023, markets rallied on optimism that the Fed could successfully navigate a soft landing for the economy while still curbing inflation. This rally was ultimately offset over the remainder of the quarter as the Fed raised its benchmark interest rate another 25 basis points in late July, and investors began to grapple with the possibility of a ”higher for longer” interest -rate cycle. In September, the Fed opted to maintain the federal-funds target rate at a range of 5.25% to 5.50%, and indicated that interest-rate cuts would not be considered until late 2024, due to its concerns that inflation could be resurgent otherwise. A weakening Chinese economy also weighed on investors’ outlook, and ultimately major equity market indexes slid by mid-to-low single digits. Large-cap stocks held up better than small caps, and energy stocks soared on rising oil prices—one of the only sectors to post a gain over the third quarter of 2023. The value factor outperformed within the small-cap universe, but was essentially flat relative to large-cap growth stocks, where the “Magnificent Seven" (Amazon, Apple, Alphabet (parent of Google), Meta, Microsoft, Nvidia and Tesla) generally continued to drive index level performance, with concentration in just these few names at near-record levels.
From a factor perspective, value outperformed during the reporting period–though it lost ground relative to growth during both the early 2023 risk-on rally and throughout the regional banking crisis. This is reflected in the Russell style indexes, where the financials sector detracted from the Russell 2500® Value Index’s return, and the inclusion of more speculative technology stocks bolstered the Russell 2500® Growth Index’s return. Quality outperformed as well, though low volatility trailed in the face of multiple risk-on moves over the period. Momentum saw modest outperformance in the face of shifting market leadership.
Energy was the strongest performing sector within the benchmark Russell 2500® Index for the period, returning over 24%, benefiting from resurgent oil prices late in the period—more than doubling the return of the index. The industrials and information technology sectors followed close behind, though the latter sector’s returns were boosted by the significant outperformance of IT services provider Super Micro Computer on AI frenzy tailwinds. Health care was the weakest-performing sector, hampered by health are technology and Biotechnology stocks, as higher-quality companies outperformed over the period.
The Fund underperformed the benchmark Russell 2500® Index for the reporting period. Easterly was the only manager to contribute positively to the Fund’s relative
performance. Easterly garnered strong returns, also due largely to the notable outperformance of Super Micro Computer. The strategy more generally benefited from value style tailwinds, as well as positive stock selection in the consumer discretionary and communication services sectors. Hillsdale marginally detracted from Fund performance over the reporting period, as meaningful momentum tailwinds failed to materialize with the rapid shifts in market leadership throughout the period. Hillsdale benefited from positive stock selection in the information technology and consumer discretionary sectors. However, this was offset by negative stock selection in the financials sector, as well as both selection and an overweight allocation to health care.
Martingale also moderately detracted from Fund performance for the period, outperforming in both the fourth quarter of 2022 and the third quarter of 2023, but lagging in the risk-on, high-beta rallies in the first two quarters of 2023. Ultimately, low volatility as a factor underperformed over the period because of these junk rallies; this presented a style headwind for the strategy. Martingale benefited from positive stock selection in the health care sector, while an overweight position in utilities and an underweight in consumer discretionary weighed on Fund performance.
Rice Hall detracted from Fund performance significantly largely due to growth style headwinds and weak stock selection. As a quality growth manager, Rice Hall did not participate in the junk rallies during the period, nor did the manager fully participate in value’s outperformance. This is within our expectations for the strategy. Stock selection within the consumer discretionary sector was the largest source of underperformance, specifically auto parts retailer Advanced Auto Parts, and online retailer Etsy.
Cardinal was the leading detractor from Fund performance, which in our view was a slightly disappointing outcome given the value and quality style tailwinds during the period. This outcome resulted largely from negative stock selection within Cardinal’s concentrated portfolio of roughly 45 stocks. Stock selection within the materials, information technology, consumer discretionary, and financials sector detracted from Fund performance. At the security level, the biggest detractors were PacWest (which suffered collateral damage during the regional banking crisis), health care real estate investment trust (“REIT”) Medical Properties Trust, and agricultural sciences company FMC Corp.
At the Fund level, positive selection within the information technology sector was the largest contributor to performance for the reporting period, while stock selection
28
SEI Institutional Managed Trust
within materials, financials, and real estate were the largest detractors.
There were no manager changes over the period; however, Easterly’s weight was increased by more than 8%, while the weights for Martingale and Cardinal were decreased by roughly 6% and 3%, respectively.
Investing is subject to risk, including the possible loss of principal. Past performance is no indication of future results.
AVERAGE ANNUAL TOTAL RETURN1 | |||||
1 Year |
|
|
| Annualized | |
Tax-Managed Small/Mid Cap Fund, Class F | 10.21% | 8.88% | 2.28% | 5.98% | 6.29% |
Tax-Managed Small/Mid Cap Fund, Class Y | 10.49% | 9.11% | 2.50% | 6.19% | 6.38% |
Russell 2500® Index | 11.28% | 8.39% | 4.55% | 7.90% | 8.14% |
Comparison of Change in the Value of a $100,000 Investment in the Tax-Managed Small/Mid Cap Fund, Class F and Class Y, versus the Russell 2500® Index
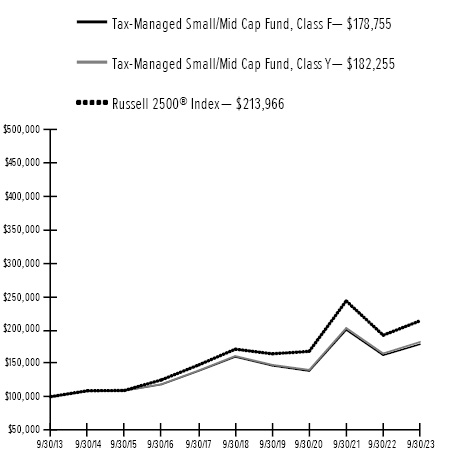
SEI Institutional Managed Trust
29
MANAGEMENT’S DISCUSSION AND ANALYSIS OF FUND PERFORMANCE
September 30, 2023 (Unaudited)
Tax-Managed Small/Mid Cap Fund (Concluded)
1 | For the year ended 9/30/23. Past performance is no indication of future performance. Class F shares were offered beginning 10/31/00. Class Y shares were offered beginning 12/31/14. For periods prior to 12/31/14, the performance of the Fund’s Class F Shares has been used. Returns for Class Y Shares would have been substantially similar to those of Class F Shares and would have differed only to the extent that Class Y Shares have lower total annual fund operating expenses than Class F Shares. Returns shown do not reflect the deduction of taxes that a shareholder would pay on fund distributions or the redemption of fund shares. The returns for the period reflect fee waivers and/or reimbursements in effect for the period; absent fee waivers and reimbursements, performance would have been lower. |
30
SEI Institutional Managed Trust
MANAGEMENT’S DISCUSSION AND ANALYSIS OF FUND PERFORMANCE
September 30, 2023 (Unaudited)
Mid-Cap Fund
I. Objective
The Mid-Cap Fund (the “Fund”) seeks to provide long-term capital appreciation.
II. Investment Approach
The Fund uses a multi-manager approach, relying on a number sub-advisors to manage the Fund’s portfolio under the general supervision of SEI Investments Management Corporation (SIMC). The Fund utilized the following sub-advisors as of September 30, 2023: Leeward Investments, LLC (Leeward) and Los Angeles Capital Management LLC (LA Capital).
No manager changes were made during the Fund’s fiscal year.
III. Returns
For the one-year period ending September 30, 2023, the Mid-Cap Fund, Class F shares, returned 11.77%. The Fund’s benchmark—the Russell Midcap® Index, which tracks the performance of the mid-cap segment of the U.S. equity universe—returned 13.45%.
IV. Performance Discussion
As discussed in the shareholder letter, the reporting period was largely defined by continuing monetary policy tightening by the U.S. Federal Reserve (Fed), which remained stalwart in its mission to curb inflation without tipping the U.S. economy into a full-blown recession.
In the fourth quarter of 2022, U.S. financial markets rallied on investors’ hopes that inflation had peaked. This upturn stemmed further losses in what ultimately proved to be the worst calendar year for Wall Street since 2008. The Fed raised the federal-funds rate by 50 basis points (0.50%) after a series of 75-basis point increases to a target range of 4.25%-4.50%, while also indicating its terminal rate (the final interest rate that the Fed seeks to achieve at the end of its monetary policy tightening cycle) might be higher than initially expected (landing just above 5%). The central bank also signaled that interest rates might remain higher for a longer period while the results of its policy tightening cycle take effect. Markets reacted negatively to the higher terminal rate before stabilizing, and still seemed to be pricing in a rate-cut in late 2023. Economically sensitive sectors such as energy, materials, and industrials were the strongest performers during the fourth quarter of 2022, while health care, communication services and information technology lagged. Small-cap value stocks significantly outperformed their growth counterparts, widening their trailing 12-month lead. The trend was even more
pronounced in the large-cap universe, where shares of mega-cap tech companies continued to take a beating.
Early in the first quarter of 2023, many stocks that had been underperforming rallied, as higher-risk assets rebounded. The market was retesting short-term highs previously achieved in August 2022, when Silicon Valley Bank (SVB), a California-based regional bank with a large venture capital depositor base, collapsed. The bank had underestimated the number of withdrawals that it would face amid a rising-rate environment, and its investments in long-term bonds further strained its capital structure. When SVB announced an equity raise to address this shortfall, a bank run began that forced the institution into insolvency. First Republic and Signature Bank also shut down, and for a time it appeared that the entire financial system was in danger. The Federal Deposit Insurance Corporation (FDIC) stepped in to make uninsured depositors whole, while larger banks made strategic deposits in an attempt to maintain liquidity at other regional institutions. The ripples were felt globally as Switzerland-based financial services provider UBS agreed to purchase Swiss financial services company Credit Suisse. This stemmed the tide of failures, but it also forced investors to realign expectations for both credit and economic conditions for the remainder of the year. During this period, investors flocked to the perceived safety of mega-cap tech names at the expense of smaller-cap stocks and financial companies. This created a meaningful headwind for the value factor, which has significant representation in the financials sector. For the next two months, the U.S. market moved sideways as recessionary expectations persisted in the wake of the crisis.
Financial stocks rebounded in April, and in May, the Fed raised its benchmark interest rate again, but only by 25 basis points, with the caveat that it was prepared to halt further rate hikes depending on the response to higher borrowing costs. At its June meeting, the central bank opted to hold the federal-funds rate at a range of 5.00% to 5.25%. This led to a "risk on" equity market environment. Lower-quality, higher-beta companies with no earnings and sales led the way in this rally. Higher-quality and defensive names lagged the market. Higher-beta and economically sensitive sectors performed well, including industrials (especially airlines and homebuilding), technology, and health care, which was driven by the biotech subsector's massive rally in the second quarter of 2023. Defensive sectors such as utilities underperformed; financials also lagged the market as the banking crisis in March still faced some pressure during the second quarter. In terms of factors, growth outperformed value and momentum.
During the third quarter of 2023, markets rallied on optimism that the Fed could successfully navigate a soft
SEI Institutional Managed Trust
31
MANAGEMENT’S DISCUSSION AND ANALYSIS OF FUND PERFORMANCE
September 30, 2023 (Unaudited)
Mid-Cap Fund (Concluded)
landing for the economy while still curbing inflation. This rally was ultimately offset over the remainder of the quarter as the Fed raised its benchmark interest rate another 25 basis points in late July, and investors began to grapple with the possibility of a ”higher for longer” interest -rate cycle. In September, the Fed opted to maintain the federal-funds target rate at a range of 5.25% to 5.50%, and indicated that interest-rate cuts would not be considered until late 2024, due to its concerns that inflation could be resurgent otherwise. A weakening Chinese economy also weighed on investors’ outlook, and ultimately major equity market indexes slid by mid-to-low single digits. Large-cap stocks held up better than small caps, and energy stocks soared on rising oil prices—one of the only sectors to post a gain over the third quarter of 2023. The value factor outperformed within the small-cap universe, but was essentially flat relative to large-cap growth stocks, where the “Magnificent Seven" (Amazon, Apple, Alphabet (parent of Google), Meta, Microsoft, Nvidia and Tesla) generally continued to drive index level performance, with concentration in just these few names at near-record levels.
From a factor perspective, value’s performance was mixed during the reporting period, depending on the asset class. There was mild outperformance among U.S. small-cap stocks, but to a lesser degree in the large-cap space, where shares of mega-cap tech companies remained dominant. Value lost ground relative to growth during both the early 2023 risk-on rally and throughout the regional banking crisis. Quality saw moderate tailwinds, though momentum and low volatility trailed in the face of multiple shifts in market leadership and risk-on moves over the period.
The industrial sector was the strongest-performing sector for the reporting period, returning over 27%, more than doubling the return of the Russell Midcap® Index. The energy sector also outperformed on surging oil prices late in the period. Real estate and utilities lagged as bond proxies lost relative attractiveness to actual risk-free assets amid the Fed’s monetary policy tightening regime.
The Fund underperformed its benchmark, the Russell Midcap® Index, during the reporting period as a result of stock selection within the industrials, utilities, and consumer discretionary sectors. An overweight allocation to the fnancials and consumer staples sectors also detracted from Fund performance. Stock selection within the information technology bolstered Fund performance. Among the Fund’s managers, LA Capital contributed positively to Fund performance over the reporting period, benefiting from positive stock selection in information technology and financials. This outperformance occurred in the face of mild headwinds, with momentum underperforming among larger caps relative to smaller caps.
Leeward detracted from Fund performance to a larger degree, with no material value tailwinds and volatility headwinds. The strategy underperformed mainly during the risk-on rally in early 2023, and failed to make up the lost ground over the next two quarters. Stock selection within the financials and materials sectors was the largest detractor from Fund performance for the period.
Investing is subject to risk, including the possible loss of principal. Past performance is no indication of future results.
AVERAGE ANNUAL TOTAL RETURN1 | |||||
1 Year |
|
|
| Annualized | |
Mid-Cap Fund, Class F | 11.77% | 9.55% | 4.35% | 8.12% | 9.36% |
Mid-Cap Fund, Class I | 11.50% | 9.29% | 4.11% | 7.88% | 6.27% |
Mid-Cap Fund, Class Y | 12.04% | 9.80% | 4.61% | 8.34% | 9.43% |
Russell Midcap® Index | 13.45% | 8.09% | 6.38% | 8.98% | 10.44% |
32
SEI Institutional Managed Trust
Comparison of Change in the Value of a $100,000 Investment in the Mid-Cap Fund, Class F, Class I and Class Y, versus the Russell Midcap® Index
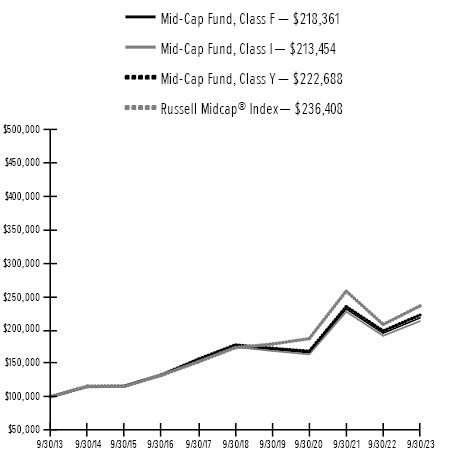
1 | For the year ended 9/30/23. Past performance is not indication of future performance. Class F shares were offered beginning 2/16/93 and Class I shares were offered beginning 10/01/07. Class I shares performance for the period prior to 10/01/07 is derived from the performance of Class F shares adjusted for the higher expenses of the Class I Shares. Class Y shares were offered beginning 10/30/15. For periods prior to 10/30/15, the performance of the Fund’s Class F Shares has been used. Returns for Class Y Shares would have been substantially similar to those of Class F Shares and would have differed only to the extent that Class Y Shares have lower total annual fund operating expenses than Class F Shares. Returns shown do not reflect the deduction of taxes that a shareholder would pay on fund distributions or the redemption of fund shares. The returns for the period reflect fee waivers and/or reimbursements in effect for the period; absent fee waivers and reimbursements, performance would have been lower. |
SEI Institutional Managed Trust
33
MANAGEMENT’S DISCUSSION AND ANALYSIS OF FUND PERFORMANCE
September 30, 2023 (Unaudited)
U.S. Managed Volatility Fund
I. Objective
The U.S. Managed Volatility Fund (the “Fund”) seeks to provide capital appreciation with less volatility than the broad U.S. equity markets.
II. Investment Approach
The Fund uses a multi-manager approach, relying on a number of sub-advisors with differing investment approaches to manage portions of the Fund’s portfolio, under the general supervision of SEI Investments Management Corporation (SIMC). The Fund utilized the following sub-advisors as of September 30, 2023: LSV Asset Management (LSV) and Allspring Global Investments, LLC (Allspring).
No manager changes were made during the Fund’s fiscal period.
III. Returns
For the one-year period ended September 30, 2023, the Fund’s Class F shares returned 10.23%. The Fund’s benchmark–the Russell 3000® Index, which tracks the performance of 3,000 of the largest U.S.-traded stocks–returned 20.46%.
IV. Performance Discussion
U.S. equities climbed higher during the 12-month reporting period ending September 30, 2023, as noted in the shareholder letter, in a resilient environment for equity markets after bottoming early in the fourth quarter of 2022. From that time until the end of the reporting period, equities staged a strong rally, with investors reflecting confidence that interest-rate increases would soon be levelling off, and inflationary risks appeared to moderate as consumer-price index (CPI) data fell from much higher levels. The U.S. Federal Reserve (Fed) raised the federal-funds rate by an aggregate of 225 basis points (2.25%) over the period, though this monetary policy tightening subsequently tapered off as the Fed paused its rate-hiking cycle late in the reporting period. Equity investors mostly shrugged off the risk of an economic recession as well as geopolitical risks from the ongoing Russia-Ukraine conflict. In mid-September 2023, implied market volatility, as measured by the CBOE Volatility Index, dipped below 15% for the first time since the beginning of the COVID-19 pandemic in early 2020.
Over the reporting period, the Fund achieved meaningful risk reduction of about 27% relative to the benchmark, and posted a net positive total return, but lagged the broader market given the strategy’s defensive objective. Low-volatility strategies run a below-market beta of
approximately .070 (a beta above 1 indicates volatility greater than the benchmark, while a beta below 1 indicates lower volatility than the benchmark), and by design will typically lag capitalization-weighted benchmarks during market rallies. Major equity market indexes moved higher over the reporting, bolstered by speculative buying of higher-beta growth stocks, particularly in technology around new artificial intelligence (AI) themes, as well as consumer discretionary stocks. The Fund’s emphasis on low-volatility securities and additional diversification objectives resulted in underweight allocations to those market-leading sectors. Overall performance was further limited by the Fund’s additional focus on attractively valued securities, which lagged those with high valuation and growth characteristics. While energy was a standout sector, posting a strong positive return, Fund participation was limited as it is a typically volatile sector which the Fund underweights.
Both of the Fund’s sub–advisors–LSV and Allspring–achieved substantial risk reduction over the 12-month period relative to the Fund’s benchmark. However, Allspring placed more emphasis on defensive sector positioning, by holding a relatively larger overweight to consumer staples and an underweight to technology. Consequently, the strategy lagged to a greater degree in the market rally. LSV has the better performance of the two, the strategy takes only modest active sector weights while focusing on stocks meeting both low-volatility and value characteristics. Neither sub-advisor held meaningful exposure to the riskier mega-cap tech stocks that led the markets higher over the period.
Investing is subject to risk, including the possible loss of principal. Past performance is no indication of future results. Diversification may not protect against market risk.
AVERAGE ANNUAL TOTAL RETURN1 | |||||
1 Year | Annualized | Annualized | Annualized | Annualized | |
U.S. Managed Volatility Fund, Class F | 10.23% | 7.66% | 5.07% | 8.34% | 8.09% |
U.S. Managed Volatility Fund, Class I | 9.89% | 7.37% | 4.79% | 8.06% | 7.79% |
U.S. Managed Volatility Fund, Class Y | 10.44% | 7.91% | 5.33% | 8.57% | 8.21% |
Russell 3000® Index | 20.46% | 9.38% | 9.14% | 11.28% | 9.40% |
34
SEI Institutional Managed Trust
Comparison of Change in the Value of a $100,000 Investment in the U.S. Managed Volatility Fund, Class F, Class I and Class Y, versus the Russell 3000® Index
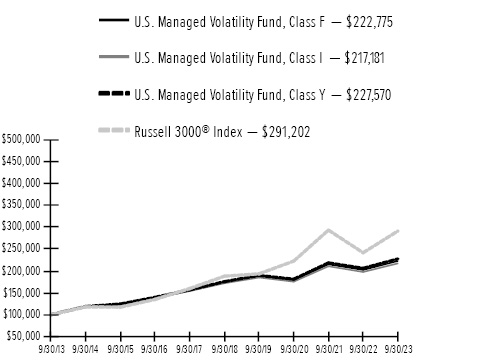
1 | For the year ended 9/30/23. Past performance is no indication of future performance. Class F shares were offered beginning 10/28/04 and Class I shares were offered beginning 6/29/07. Class I shares performance for the period prior to 06/29/07 is derived from the performance of Class F shares adjusted for the higher expenses of the Class I shares. Class Y shares were offered beginning 12/31/14. For periods prior to 12/31/14, the performance of the Fund’s Class F Shares has been used. Returns for Class Y Shares would have been substantially similar to those of Class F Shares and would have differed only to the extent that Class Y Shares have lower total annual fund operating expenses than Class F Shares. Returns shown do not reflect the deduction of taxes that a shareholder would pay on fund distributions or the redemption of fund shares. The returns for the period reflect fee waivers and/or reimbursements in effect for the period; absent fee waivers and reimbursements, performance would have been lower. |
SEI Institutional Managed Trust
35
MANAGEMENT’S DISCUSSION AND ANALYSIS OF FUND PERFORMANCE
September 30, 2023 (Unaudited)
Global Managed Volatility Fund
I. Objective
The Global Managed Volatility Fund (the “Fund”) seeks to provide capital appreciation with less volatility than the broad global equity markets.
II. Investment Approach
The Fund uses a multi-manager approach, relying on a number of sub-advisors with differing investment philosophies to manage portions of the Fund’s portfolio under the general supervision of SEI Investments Management Corporation (SIMC). The Fund utilized the following sub-advisors as of September 30, 2023: Acadian Asset Management LLC (Acadian) and Allspring Global Investments, LLC (Allspring).
No manager changes were made during the Fund’s fiscal year.
III. Returns
For the one-year period ending September 30, 2023, the Fund’s Class F shares returned 12.23%. The Fund’s benchmark–the MSCI World Index (Net), which tracks large- and mid-cap equity performance across all 23 developed-market countries–returned 21.95%.
IV. Performance Discussion
As discussed in the shareholder letter, global equities climbed higher during the 12-month reporting period ending September 30, 2023, in a resilient environment for equity markets after bottoming early in the fourth quarter of 2022. From that time until the end of the reporting period, equities staged a strong rally, with investors reflecting confidence that interest-rate increases would soon be levelling off, and inflationary risks appeared to moderate as consumer-price index (CPI) data fell from much higher levels. The U.S. Federal Reserve (Fed) raised the federal-funds rate by an aggregate of 225 basis points (2.25%) over the period, though this monetary policy tightening subsequently tapered off as the Fed paused its rate-hiking cycle late in the reporting period. Equity investors mostly shrugged off the risk of an economic recession as well as geopolitical risks from the ongoing Russia-Ukraine conflict. In mid-September 2023, implied market volatility, as measured by the CBOE Volatility Index, dipped below 15% for the first time in since the beginning of the COVID-19 pandemic in early 2020.
Over the 12-month reporting period, the Fund achieved meaningful risk reduction of about 35% relative to the benchmark, and posted a net positive total return, but lagged the broader market given the strategy’s defensive objective. Low-volatility strategies run a below-market beta
of approximately 0.70, and by design will typically lag the performance of capitalization-weighted benchmarks during market rallies. Major equity market indexes moved higher over the reporting period, bolstered by speculative buying of higher-beta growth stocks, particularly in technology around new artificial intelligence (AI) themes, as well as consumer discretionary stocks. The Fund’s emphasis on low-volatility securities and additional diversification objectives resulted in underweight allocations to those market-leading sectors. Overall performance was further limited by the Fund’s additional focus on attractively valued securities, which lagged those with high valuation and growth characteristics. While energy was a standout sector, posting strong positive returns, Fund participation was limited as it is a typically volatile sector which the Fund underweights.
Both of the Fund’s sub-advisors– Acadian and Allspring–achieved substantial risk reduction over the 12-month period relative to the Fund’s benchmark, and generated positive total returns. Acadian’s performance was modestly stronger than that of Allspring. Acadian benefited as its holdings tended to be more broadly diversified across sectors in line with its multifactor blend model. Allspring placed more emphasis on defensive positioning and held a greater overweight position in the consumer staples sector and an underweight allocation to technology. Neither manager held meaningful exposure to the riskier mega-cap tech stocks that led markets higher over the period.
The Fund used derivatives to hedge currency risk. Over the reporting period, hedging currency risk modestly detracted from Fund performance in the environment of a weakening U.S. dollar against a basket of major global currencies.
Investing is subject to risk, including the possible loss of principal. Past performance is no indication of future results. Diversification may not protect against market risk.
AVERAGE ANNUAL TOTAL RETURN1 | |||||
1 Year | Annualized | Annualized | Annualized | Annualized | |
Global Managed Volatility Fund, Class F | 12.23% | 5.25% | 3.17% | 6.72% | 4.90% |
Global Managed Volatility Fund, Class I | 12.07% | 5.01% | 2.92% | 6.46% | 4.62% |
Global Managed Volatility Fund, Class Y | 12.62% | 5.54% | 3.43% | 6.96% | 5.04% |
MSCI World Index (Net) | 21.95% | 8.08% | 7.26% | 8.26% | 6.66% |
36
SEI Institutional Managed Trust
Comparison of Change in the Value of a $100,000 Investment in the Global Managed Volatility Fund, Class F, Class I and Class Y, versus the MSCI World Index (Net)
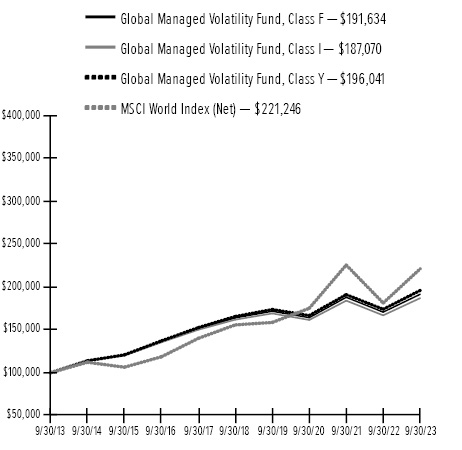
1 | For the year ended 9/30/23. Past performance is no indication of future performance. Class F shares were offered beginning 7/27/06 and Class I shares were offered beginning 6/29/07. Class I shares performance for the period prior to 06/29/07 is derived from the performance of Class F shares adjusted for the higher expenses of the Class I shares. Class Y shares were offered beginning 12/31/14. For periods prior to 12/31/14, the performance of the Fund’s Class F Shares has been used. Returns for Class Y Shares would have been substantially similar to those of Class F Shares and would have differed only to the extent that Class Y Shares have lower total annual fund operating expenses than Class F Shares. Returns shown do not reflect the deduction of taxes that a shareholder would pay on fund distributions or the redemption of fund shares. The returns for the period reflect fee waivers and/or reimbursements in effect for the period; absent fee waivers and reimbursements, performance would have been lower. |
SEI Institutional Managed Trust
37
MANAGEMENT’S DISCUSSION AND ANALYSIS OF FUND PERFORMANCE
September 30, 2023 (Unaudited)
Tax-Managed Managed Volatility Fund
I. Objective
The Tax-Managed Managed Volatility Fund (the “Fund”) seeks to maximize after-tax returns, but with a lower level of volatility than the broad U.S. equity markets.
II. Investment Approach
The Fund uses a multi-manager approach, relying on a number of sub-advisors with differing investment approaches, to manage portions of the Fund’s portfolio under the general supervision of SEI Investments Management Corporation (SIMC). The Fund utilized the following sub-advisors as of September 30, 2023: LSV Asset Management (LSV), Parametric Portfolio Associates LLC (Parametric) and Allspring Global Investments, LLC (Allspring).
No manager changes were made during the Fund’s fiscal year.
III. Returns
For the one-year reporting period ending September 30, 2023, the Fund’s Class F shares returned 10.98%. The Fund’s benchmark—the Russell 3000® Index, which tracks the performance of 3,000 of the largest U.S.-traded stocks—returned 20.46%.
IV. Performance Discussion
As discussed in the shareholder letter, global equities climbed higher during the 12-month reporting period ending September 30, 2023, in a resilient environment for equity markets after bottoming early in the fourth quarter of 2022. From that time until the end of the reporting period, equities staged a strong rally, with investors reflecting confidence that interest-rate increases would soon be levelling off, and inflationary risks appeared to moderate as consumer-price index (CPI) data fell from much higher levels. The U.S. Federal Reserve (Fed) raised the federal-funds rate by an aggregate of 225 basis points (2.25%) over the period, though this monetary policy tightening subsequently tapered off as the Fed paused its rate-hiking cycle late in the reporting period. Equity investors mostly shrugged off the risk of an economic recession as well as geopolitical risks from the ongoing Russia-Ukraine conflict. In mid-September 2023, implied market volatility, as measured by the CBOE Volatility Index, dipped below 15% for the first time since the beginning of the COVID-19 pandemic in early 2020.
Over the reporting period, the Fund achieved meaningful risk reduction of about 28% relative to the benchmark, and posted a net positive total return, but lagged the broader market given the strategy’s defensive objective.
Low-volatility strategies run a below-market beta of approximately 0.70 (a beta above 1 indicates volatility greater than the benchmark, while a beta below 1 indicates lower volatility than the benchmark), and by design will typically lag capitalization-weighted benchmarks during market rallies. Major equity market indexes moved higher over the reporting, bolstered by speculative buying of higher-beta growth stocks, particularly in technology around new artificial intelligence (AI) themes, as well as consumer discretionary stocks. The Fund’s emphasis on low-volatility securities and additional diversification objectives translated into an underweight of those market leading sectors. Overall performance was further limited by the Fund’s additional focus on attractively valued securities, which lagged those with high valuation and growth characteristics. While energy was a standout sector, posting strong positive returns, Fund participation was limited as it is a typically volatile sector which the Fund underweights.
The Fund’s sub-advisors achieved substantial risk reduction over the 12-month reporting period relative to the Fund’s benchmark. However, Allspring placed more emphasis on defensive sector positioning by holding a greater overweight allocation to consumer staples and an underweight to technology. Consequently, the strategy lagged to a greater degree amid the market rally. LSV garnered the strongest performance among the sub-advisors. The strategy takes only modest active sector weights, while focusing on stocks meeting both low-volatility and value characteristics. Tax management considerations also allowed LSV to continue to hold positions in select mega-cap tech stocks such as Apple and Microsoft, which boosted its performance. Parametric’s responsibility is limited to implementation–i.e., tax management–of Allspring’s model portfolio.
Investing is subject to risk, including the possible loss of principal. Past performance is no indication of future results.
AVERAGE ANNUAL TOTAL RETURN1 | |||||
1 Year | Annualized | Annualized | Annualized | Annualized | |
Tax-Managed Managed Volatility Fund, Class F | 10.98% | 9.34% | 6.64% | 9.31% | 8.45% |
Tax-Managed Managed Volatility Fund, Class Y | 11.26% | 9.61% | 6.90% | 9.54% | 8.59% |
Russell 3000® Index | 20.46% | 9.38% | 9.14% | 11.28% | 9.05% |
38
SEI Institutional Managed Trust
Comparison of Change in the Value of a $100,000 Investment in the Tax-Managed Managed Volatility Fund, Class F and Class Y, versus the Russell 3000® Index
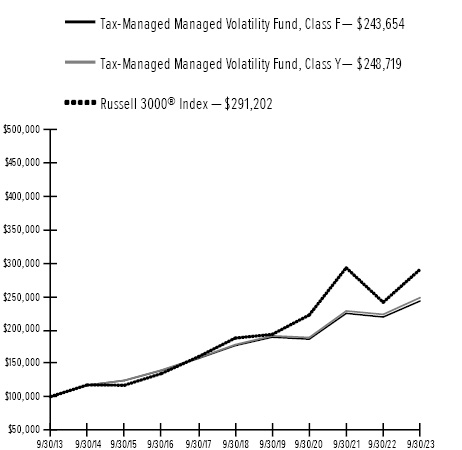
1 | For the year ended 9/30/23. Past performance is not an indication of future performance. Class F shares were offered beginning 12/20/07 and Class Y shares were offered beginning 4/30/15. For periods prior to 4/30/15, the performance of the Fund’s Class F Shares has been used. Returns for Class Y Shares would have been substantially similar to those of Class F Shares and would have differed only to the extent that Class Y Shares have lower total annual fund operating expenses than Class F Shares. Returns shown do not reflect the deduction of taxes that a shareholder would pay on fund distributions or the redemption of fund shares. The returns for certain periods reflect fee waivers and/or reimbursements in effect for that period; absent fee waivers and/or reimbursements, performance would have been lower. |
SEI Institutional Managed Trust
39
MANAGEMENT’S DISCUSSION AND ANALYSIS OF FUND PERFORMANCE
September 30, 2023 (Unaudited)
Tax-Managed International Managed Volatility Fund
I. Objective
The Tax-Managed International Managed Volatility Fund (the “Fund”) seeks tax-sensitive long-term capital appreciation with less volatility than the broad international equity markets.
II. Investment Approach
The Fund uses a multi-manager approach, relying on a number of sub-advisors with differing investment approaches to manage portions of the Fund’s portfolio, under the general supervision of SEI Investments Management Corporation (SIMC). The Fund utilized the following sub-advisors as of September 30, 2023: Acadian Asset Management LLC (Acadian), Allspring Global Investments, LLC (Allspring), LSV Asset Management (LSV) and Parametric Portfolio Associates LLC (Parametric).
No manager changes were made during the Fund’s fiscal period.
III. Returns
For the one-year period ending September 30, 2023, the Fund’s Class F shares returned 20.84%. The Fund’s benchmark—the MSCI EAFE Index (Net), which tracks equity performance of developed markets outside the U.S. and Canada—returned 25.65%.
IV. Performance Discussion
Global equities climbed higher during the 12-month reporting period ending September 30, 2023, in a resilient environment for equity markets after bottoming early in the fourth quarter of 2022. From that time until the end of the reporting period, equities staged a strong rally, with investors reflecting confidence that interest-rate increases would soon be levelling off, and inflationary risks appeared to moderate as consumer-price index (CPI) data fell from much higher levels. As discussed in the shareholder letter, both the U.S. Federal Reserve (Fed) and the European Central Bank continued to increase interest rates over the period, though this monetary policy tightening subsequently tapered off, with the Fed pausing late in the reporting period. Equity investors mostly shrugged off the risk of an economic recession as well as geopolitical risks from the ongoing Russia-Ukraine conflict. In mid-September 2023, implied market volatility, as measured by the CBOE Volatility Index, dipped below 15% for the first time in since the beginning of the COVID-19 pandemic in early 2020.
Over the 12-month reporting period, the Fund achieved meaningful risk reduction of approximately 26% relative to the benchmark, and posted a net positive total return, but
modestly lagged the broader market given the strategy’s defensive objective. Low-volatility strategies run a below-market beta of approximately 0.75, and by design will typically lag capitalization-weighted benchmarks during market rallies. The Fund’s emphasis on low-volatility securities and additional diversification objectives resulted in underweight allocations to those market-leading sectors. Headwinds to defensive positioning were partly offset by the Fund’s additional focus on attractively priced securities, as valuation themes were rewarded in international markets over the period.
The Fund’s managers performed in line with our expectations during the reporting period. Each manager achieved substantial risk reduction over the 12-month period relative to the Fund’s benchmark, and generated positive total returns. LSV was the strongest performer as the strategy takes only modest active sector weights while focusing on stocks meeting both low-volatility and value characteristics. Despite nuanced approaches, results for Allspring and Acadian were in line with each other. Both strategies held greater defensive sector weights to consumer staples, causing their performance to lag the overall market. As of the end of the reporting period, all three managers remained conservatively positioned, with minimal exposure to higher-beta growth stocks. Parametric’s responsibility is limited to implementation–i.e., tax management–of the three other managers’ model portfolios.
Investing is subject to risk, including the possible loss of principal. Past performance is no indication of future results.
40
SEI Institutional Managed Trust
AVERAGE ANNUAL TOTAL RETURN1 | |||||||||
1 Year Return | 3 Year Return | 5 Year Return | Annualized | ||||||
Tax-Managed International Managed Volatility Fund, Class F | 20.84% | 2.77% | 0.46% | 2.58% | |||||
Tax-Managed International Managed Volatility Fund, Class Y | 21.02% | 3.00% | 0.70% | 2.83% | |||||
MSCI EAFE Index (Net) | 25.65% | 5.75% | 3.24% | 5.73% | |||||
Comparison of Change in the Value of a $100,000 Investment in the Tax-Managed International Managed Volatility Fund, Class F and Class Y, versus the MSCI EAFE Index (Net).
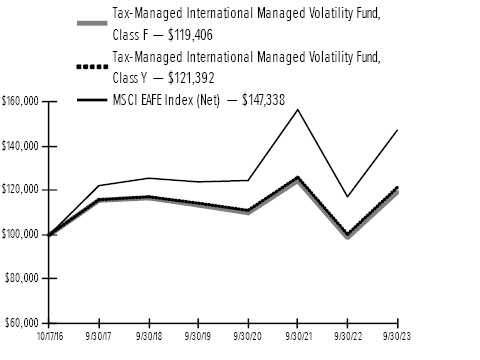
1 | For the year ended 9/30/23. Past performance is no indication of future performance. Class F shares and Class Y shares were offered beginning 10/17/16. Returns shown do not reflect the deduction of taxes that a shareholder would pay on fund distributions or the redemption of fund shares. The returns for certain periods reflect fee waivers and/or reimbursements in effect for that period; absent fee waivers and/or reimbursements, performance would have been lower. |
SEI Institutional Managed Trust
41
MANAGEMENT’S DISCUSSION AND ANALYSIS OF FUND PERFORMANCE
September 30, 2023 (Unaudited)
Real Estate Fund
I. Objective
The Real Estate Fund (the “Fund”) seeks to provide total return including current income and capital appreciation.
II. Investment Approach
The Fund uses a sub-advisor to manage the Fund’s portfolio under the general supervision of SEI Investments Management Corporation (“SIMC”). The sole sub-advisor as of September 30, 2023, was CenterSquare Investment Management LLC (“CenterSquare”).
No manager changes were made during the Fund’s fiscal year.
III. Returns
For the one-year period ending September 30, 2023, the Fund’s Class F shares returned 2.69%. The Fund’s benchmark—the Wilshire U.S. Real Estate Securities Index, which tracks the performance of the U.S. real-estate market and includes both real-estate investment trusts and real-estate operating companies—returned 4.08%.
IV. Performance Discussion
The reporting period was largely defined by the continuing monetary policy tightening of the U.S. Federal Reserve (“Fed”), as discussed in the shareholder letter, which remained stalwart in its mission to curb inflation without tipping the U.S. economy into a full-blown recession.
In the fourth quarter of 2022, U.S. financial markets rallied on investors’ hopes that the inflation had peaked. This upturn stemmed further losses in what ultimately proved to be the worst calendar year for Wall Street since 2008. The Fed raised the federal-funds rate by 50 basis points (0.50%) after a series of 75-basis point increases to a target range of 4.25%-4.50%, while also indicating its terminal rate (the final interest rate that the Fed seeks to achieve at the end of its monetary policy tightening cycle) might be higher than initially expected (landing just above 5%). The central bank also signaled that interest rates might remain higher for a longer period while the results of its policy tightening cycle take effect. Markets reacted negatively to the higher terminal rate before stabilizing, and still seemed to be pricing in a rate-cut in late 2023. Economically sensitive sectors such as energy, materials, and industrials were the strongest performers during the fourth quarter of 2022, while health care, communication services and information technology lagged. Small-cap value stocks significantly outperformed their growth counterparts, widening their trailing 12-month lead. The trend was even more pronounced in the large-cap universe, where shares of mega-cap tech companies continued to take a beating.
Early in the first quarter of 2023, many stocks that had been underperforming rallied, as higher-risk assets rebounded. The market was retesting short-term highs previously achieved in August 2022, when Silicon Valley Bank (“SVB”), a California-based regional bank with a large venture capital depositor base, collapsed. The bank had underestimated the number of withdrawals that it would face amid a rising-rate environment, and its investments in long-term bonds further strained its capital structure. When SVB announced an equity raise to address this shortfall, a bank run began that forced the institution into insolvency. First Republic and Signature Bank also shut down, and for a time it appeared that the entire financial system was in danger. The Federal Deposit Insurance Corporation (“FDIC”) stepped in to make uninsured depositors whole, while larger banks made strategic deposits in an attempt to maintain liquidity at other regional institutions. The ripples were felt globally as Switzerland-based financial services provider UBS agreed to purchase Swiss financial services company Credit Suisse. This stemmed the tide of failures, but it also forced investors to realign expectations for both credit and economic conditions for the remainder of the year. During this period, investors flocked to the perceived safety of mega-cap tech names at the expense of smaller-cap stocks and financial companies. This created a meaningful headwind for the value factor, which has significant representation in the financials sector. For the next two months, the U.S. market moved sideways as recessionary expectations persisted in the wake of the crisis.
Financial stocks rebounded in April, and in May, the Fed raised its benchmark interest rate again, but only by 25 basis points, with the caveat that it was prepared to halt further rate hikes depending on the response to higher borrowing costs. At its June meeting, the central bank opted to hold the federal-funds rate at a range of 5.00% to 5.25%. This led to a "risk on" equity market environment. Lower-quality, higher-beta companies with no earnings and sales led the way in this rally. Higher-quality and defensive names lagged the market. Higher-beta and economically sensitive sectors performed well, including industrials (especially airlines and homebuilding), technology, and health care, which was driven by the biotech subsector's massive rally in the second quarter of 2023. Defensive sectors such as utilities underperformed; financials also lagged the market as the banking crisis in March still faced some pressure during the second quarter. In terms of factors, growth outperformed value and momentum.
During the third quarter of 2023, markets rallied on optimism that the Fed could successfully navigate a soft landing for the economy while still curbing inflation. This rally was ultimately offset over the remainder of the quarter
42
SEI Institutional Managed Trust
as the Fed raised its benchmark interest rate another 25 basis points in late July, and investors began to grapple with the possibility of a ”higher for longer” interest -rate cycle. In September, the Fed opted to maintain the federal-funds target rate at a range of 5.25% to 5.50%, and indicated that interest-rate cuts would not be considered until late 2024, due to its concerns that inflation could be resurgent otherwise. A weakening Chinese economy also weighed on investors’ outlook, and ultimately major equity market indexes slid by mid-to-low single digits. Large-cap stocks held up better than small caps, and energy stocks soared on rising oil prices—one of the only sectors to post a gain over the third quarter of 2023. The value factor outperformed within the small-cap universe, but was essentially flat relative to large-cap growth stocks, where the “Magnificent Seven" (Amazon, Apple, Alphabet (parent of Google), Meta, Microsoft, Nvidia and Tesla) generally continued to drive index level performance, with concentration in just these few names at near-record levels.
For the 12-month reporting period, from a factor perspective, value outperformed growth—though it lost ground relative to growth during both the “risk-on” rally in early 2023, and throughout the regional banking crisis. This is reflected in the Russell style indexes, where financials detracted from the return of the Russell 2000® Value Index (which tracks the performance of the small-cap value segment of the U.S. equity market), and the inclusion of more speculative tech stocks bolstered the performance of the Russell 2000® Growth Index (which tracks the performance of the small- to mid-cap growth segment of the U.S. equity market. Quality outperformed as well, though the low volatility factor trailed in the face of multiple risk-on moves over the reporting period. Momentum saw modest outperformance in the face of shifting market leadership. The top-performing sectors within the Wilshire US Real Estate Securities Index over the reporting period included data centers, real estate management and services, and retail, while office REITs, diversified REITs, and self-storage REITs were the primary market laggards.
The Wilshire US Real Estate Securities Index significantly underperformed the U.S. small-cap equity indexes and the Russell 1000® index (which tracks the performance of 1000 of the largest U.S. equity securities based on market capitalization) for the reporting period. Within equity markets, higher-quality and value outperformed over the period, but real estate lagged the broader market. During the first half of the reporting period, a speculative rally left defensive sectors out of favor.
The Fund underperformed its benchmark, the Wilshire US Real Estate Securities Index, for the reporting period due to the allocation decisions of the sole manager, CenterSquare. This was driven by CenterSquare’s overweight to shares of telecommunications towers operators. This was partially offset by positive stock selection, particularly in multi-family residential REITs and data center REITs.
Investing is subject to risk, including the possible loss of principal. Past performance is no indication of future results.
AVERAGE ANNUAL TOTAL RETURN1 | |||||
1 Year | Annualized | Annualized | Annualized | Annualized | |
Real Estate Fund, Class F | 2.69% | 5.49% | 3.40% | 6.14% | 7.32% |
Real Estate Fund, Class I | 2.44% | 5.28% | 3.18% | 5.90% | 7.08% |
Real Estate Fund, Class Y | 2.94% | 5.78% | 3.66% | 6.37% | 7.44% |
Wilshire U.S. Real Estate Securities Index | 4.08% | 5.82% | 2.88% | 6.18% | 7.58% |
SEI Institutional Managed Trust
43
MANAGEMENT’S DISCUSSION AND ANALYSIS OF FUND PERFORMANCE
September 30, 2023 (Unaudited)
Real Estate Fund (Concluded)
Comparison of Change in the Value of a $100,000 Investment in the Real Estate Fund, Class F, Class I and Class Y, versus the Wilshire U.S. Real Estate Securities Index
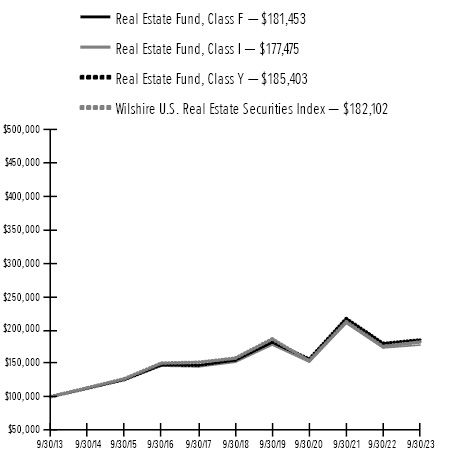
1 | For the year ended 9/30/23. Past performance is not an indication of future performance. Class F shares were offered beginning 11/13/03 and Class I shares were offered beginning 10/01/07. Class I shares performance for the period prior to 10/01/07 is derived from the performance of Class F shares adjusted for the higher expenses of Class I shares. Class Y shares were offered beginning 12/31/14. For periods prior to 12/31/14, the performance of the Fund’s Class F Shares has been used. Returns for Class Y Shares would have been substantially similar to those of Class F Shares and would have differed only to the extent that Class Y Shares have lower total annual fund operating expenses than Class F Shares. Returns shown do not reflect the deduction of taxes that a shareholder would pay on fund distributions or the redemption of fund shares. The returns for certain periods reflect fee waivers and/or reimbursements in effect for that period; absent fee waivers and/or reimbursements, performance would have been lower. |
44
SEI Institutional Managed Trust
MANAGEMENT’S DISCUSSION AND ANALYSIS OF FUND PERFORMANCE
September 30, 2023 (Unaudited)
Core Fixed Income Fund
I. Objective
The Core Fixed Income Fund (the “Fund”) seeks to provide current income consistent with the preservation of capital.
II. Investment Approach
The Fund uses a multi-manager approach, relying on a number of sub-advisors with differing investment approaches to manage portions of the Fund’s portfolio, under the general supervision of SEI Investments Management Corporation (SIMC). The Fund utilized the following sub-advisors as of September 30, 2023: Jennison Associates LLC (Jennison), MetLife Investment Management, LLC (MetLife), Metropolitan West Asset Management, LLC (MetWest), Allspring Global Investments, LLC (Allspring), Western Asset Management Company, LLC and Western Asset Management Company Limited (Western).
No manager changes were made during the Fund’s fiscal year.
III. Returns
For the one-year period ending September 30, 2023, the Fund’ s Class F shares returned 0.44%, while the Fund’s benchmark–the Bloomberg U.S. Aggregate Bond Index, which tracks the performance of the investment-grade, U.S. dollar-denominated, fixed-rate taxable bond market–returned 0.64%.
IV. Performance Discussion
U.S. Treasury yields rose over the 12-month reporting period as the U.S. Federal Reserve (Fed) increased the target range on the federal-funds rate to a range of 5.25% to 5.50%—a 225-basis point (2.25%) increase. As noted in the shareholder letter, the magnitude of the rate hikes slowed during 2023, as inflation moderated and the lagged effects of tighter monetary policy began working its way through the economy. While the rate-hiking cycle may be close to its peak, U.S. economic growth continued to exceed market expectations due to strong consumer spending and a robust labor market. Consequently, the Fed’s most recent “dot plot” of economic projections, which was issued in September, projected interest-rate reductions totaling 50 basis points in 2024—indicating fewer rate cuts than the central bank had anticipated just three months earlier. Longer-term yields moved higher later in the reporting period as the U.S. financial markets continued to grapple with “higher for longer” interest rates, and the 10- year Treasury yield rose more than 70 basis points during the third quarter of 2023, as Treasury supply increased and credit-rating agency Fitch downgraded U.S. Treasury debt from AAA (its highest rating) one notch to AA+. Spread
sectors generated positive excess returns over the period as corporate bonds benefited from a strong technical environment. Consumer-based asset-backed securities (ABS) continued to be supported by healthy consumer spending as the labor market remained strong and the unemployment rate hovered near all-time lows. Despite concerns over the office subsector, commercial mortgage-backed securities (CMBS) outperformed the overall market as types of property such as multi-family and warehouse remained on solid footing. While agency mortgage-backed securities (MBS) lagged in the third quarter of 2023, given the interest-rate volatility, the sector outperformed the overall market for the 12-month reporting period as valuations were attractive and the convexity (which measures the sensitivity of a bond’s price to a change in interest rates more precisely than duration alone) profile of the Bloomberg U.S. Aggregate Bond Index improved year-over-year.
The Fund’s overweight allocation to the corporate sector enhanced performance during the reporting period as credit spreads tightened due to higher yields and solid demand. Within the corporate sector, the Fund’s managers generally moved to higher- conviction names with healthier balance sheets as recessionary risks continued to rise with leverage increasing and interest coverage (the ratio of a company's earnings before interest and taxes (EBIT) to its interest expense during a given period) decreasing. Security selection within the ABS sector bolstered Fund performance as the managers generally preferred high-quality tranches. An allocation to AAA rated collateralized loan obligations (CLOs) also benefited Fund performance. Security selection in MBS had a positive impact on Fund performance for the reporting period as the managers preferred specified pools to “too-be-announced” (TBA) issues (which comprise contracts to buy or sell mortgage-backed securities on a specific date). The Fund’s duration posture remained long during the period and detracted from performance as the Fed raised interest rates and the 10-year Treasury yield climbed 76 basis points and closed the reporting period at 4.59%. Yield-curve positioning generally benefited Fund performance over the period as the yield curve flattened, but remained inverted (short-term yields exceeded long-term yields).
Four of the Fund’s five managers outperformed the benchmark Bloomberg U.S. Aggregate Bond Index for the reporting period, with MetWest the lone manager to underperform. Allspring benefited from positive security selection in MBS and corporate bonds; this was partially offset by an underweight allocation to the industrials sector. Western benefited from both spread-tightening and an overweight position in the corporate sector. A long duration
SEI Institutional Managed Trust
45
MANAGEMENT’S DISCUSSION AND ANALYSIS OF FUND PERFORMANCE
September 30, 2023 (Unaudited)
Core Fixed Income Fund (Concluded)
posture detracted from Western’s performance as yields moved higher. This was partially offset by the positive impact of yield-curve positioning. Metlife contributed positively to Fund performance due to security selection and an overweight position in the corporate sector. Security selection within the CMBS sector detracted from Fund performance. Jennison’s security selection in MBS contributed to Fund performance, while security selection in corporate bonds generally was a detractor. MetWest underperformed over the reporting period, attributable to a long duration posture, though its security selection within banks and MBS had a positive impact.
Regarding derivatives, the Fund employed futures, swaps and options over the reporting period to help manage the duration, yield curve, and credit exposure. These positions detracted slightly from Fund performance during the reporting period. To a limited extent, the Fund used currency-forward contracts to manage currency exposure, which subtracted from performance for the period.
Investing is subject to risk, including the possible loss of principal. Past performance is no indication of future results.
AVERAGE ANNUAL TOTAL RETURN1 | |||||
1 Year |
|
|
| Annualized | |
Core Fixed Income Fund, Class F | 0.44% | -5.80% | -0.10% | 1.19% | 5.12% |
Core Fixed Income Fund, Class I | 0.32% | -6.01% | -0.33% | 0.97% | 4.76% |
Core Fixed Income Fund, Class Y | 0.80% | -5.55% | 0.14% | 1.40% | 5.18% |
Bloomberg U.S. Aggregate Bond Index | 0.64% | -5.21% | 0.10% | 1.13% | 5.29% |
Comparison of Change in the Value of a $100,000 Investment in the Core Fixed Income Fund, Class F, Class I and Class Y, versus the Bloomberg US Aggregate Bond Index
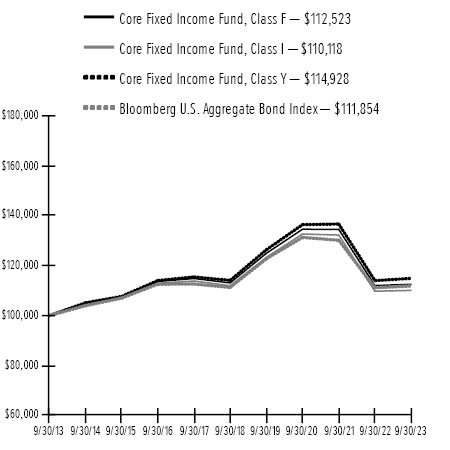
1 | For the year ended 9/30/23. Past performance is no indication of future performance. Class F shares were offered beginning 5/1/87 and Class I shares were offered beginning 8/06/01. Class I shares performance for the period prior to 6/29/07 is derived from the performance of Class F shares adjusted for the higher expenses of the Class I shares. Class Y shares were offered beginning 6/30/15. For periods prior to 6/30/15, the performance of the Fund’s Class F Shares has been used. Returns for Class Y Shares would have been substantially similar to those of Class F Shares and would have differed only to the extent that Class Y Shares have lower total annual fund operating expenses than Class F Shares. Returns shown do not reflect the deduction of taxes that a shareholder would pay on fund distributions or the redemption of fund shares. The returns for the period reflect fee waivers and/or reimbursements in effect for the period; absent fee waivers and reimbursements, performance would have been lower. |
46
SEI Institutional Managed Trust
MANAGEMENT’S DISCUSSION AND ANALYSIS OF FUND PERFORMANCE
September 30, 2023 (Unaudited)
High Yield Bond Fund
I. Objective
The High Yield Bond Fund (the "Fund") seeks total return.
II. Investment Approach
The Fund uses a multi-manager approach, relying on a number of sub-advisors with differing investment approaches to manage portions of the Fund’s portfolio, under the general supervision of SEI Investments Management Corporation (“SIMC”). Assets of the Fund not allocated to sub-advisors are managed directly by SIMC. The Fund utilized the following sub-advisors as of September 30, 2023: Ares Capital Management II LLC (“Ares”), Benefit Street Partners, LLC (“Benefit Street”), Brigade Capital Management, LP (“Brigade”), J.P. Morgan Investment Management, Inc. (“JP Morgan”), and T. Rowe Price Associates, Inc. (“T. Rowe Price”).
III. Returns
For the full-year ended September 30, 2023, the Fund’s Class F shares returned 9.27%. The Fund’s benchmark–the ICE BofA U.S. High Yield Constrained Index, which tracks the performance of below-investment-grade, U.S. dollar-denominated corporate bonds publicly issued in the U.S. domestic market–returned 10.19%.
IV. Performance Discussion
As noted in the shareholder letter, above-historical average inflation, rising interest rates, and ongoing concerns about a possible recession weren’t enough to derail the high-yield bond market as the ICE BofA US High Yield Constrained Index returned more than 10% during the 12-month reporting period. The index yield began the period at 9.59%, reached a period high of 9.62% on October 13, 2022, and low of 7.78% on February 2, 2023 ending the period at 8.96%. The high-yield market spread began the period at 545 basis points (a basis point equals .01%), which was also the high for the period, while reaching a low of 379 basis points on September 20, and finishing the reporting period at 406 basis points. CCC-rated bonds were the top performers, returning 14.16%, followed by B-rated bonds at 11.39%, and BB-rated bonds at 8.24%. Energy remained the largest sector within the ICE BofA U.S. High Yield Constrained Index, and outperformed the broader market, returning 11.9% over the reporting period. The bank loan market (floating-rate assets), as measured by the Credit Suisse Leveraged Loan Index, was up 12.5% for the period.
The Fund’s allocation to structured credit–collateralized loan obligations (“CLOs”)–was the top contributor to performance for the reporting period. CLOs and bank loans (floating-rate assets) saw strong returns as a result of still-healthy fundamentals and favorable technicals.
Fundamentally, the pace of credit quality deterioration that began in 2022 eased a bit in the third quarter of 2023. Earnings and other measures of credit health (debt and interest coverage ratios) held up well for the first nine months of 2023, particularly when compared to the expectations coming into the year. Technically, investors now maintain the view that interest rates will be higher for a longer period of time. Therefore, demand for floating-rate assets, which have benefitted the most from the U.S. Federal Reserve’s (“Fed”) aggressive interest-rate hikes, has been strong. Security selection within the energy sector and both an overweight position and selection within financial services also contributed to Fund performance. In contrast, an overweight position and selection within the technology and electronics sector (primarily software and services), as well as selections within basic industry (primarily chemicals) and healthcare, detracted from Fund performance for the reporting period.
SIMC was the Fund’s strongest-performing manager over the reporting period, as its off-benchmark allocation to CLOs outperformed the overall high-yield bond market over the period. Ares underperformed due to selection within the healthcare sector, an overweight position and selection within technology and electronics, and an underweight position and selection within leisure. Positive contributors to Fund performance included an overweight position and selection within the energy sector, an underweight position and selection within telecommunications, and selection within the services sector. Benefit Street underperformed due to an underweight allocation to and selection within services, along with selection within the energy and basic industry sectors. Though it overall underperformed, Benefit Street’s performance benefited from selection within real estate, telecommunications, and transportation. Brigade underperformed due to selection within the real estate sector, an overweight allocation to and selection within technology & electronics and media. Positive contributors were an overweight to and selection within financial services, selection within energy, and an overweight allocation to and selection within retail. JP Morgan underperformed the overall market due to selection within the retail sector, an overweight allocation to and selection within telecommunications, and an underweight position and selection within leisure. JP Morgan’s performance benefited from selection within consumer goods, an overweight allocation to and selection within the automotive sector, and selection within capital goods. T. Rowe Price outperformed due to an overweight position and selection within consumer goods, selection within leisure, and an overweight allocation to and selection within capital goods. Detractors from performance included
SEI Institutional Managed Trust
47
MANAGEMENT’S DISCUSSION AND ANALYSIS OF FUND PERFORMANCE
September 30, 2023 (Unaudited)
High Yield Bond Fund (Concluded)
an underweight position and selection within the basic industry and services sectors, and selection within retail.
The Fund used derivatives throughout the 12-month reporting period ending September 30, 2023, to help manage duration, yield-curve positioning, and spread duration more efficiently. The Fund used the iBoxx USD Liquid High Yield Index for this purpose, and it had a negligible impact on overall Fund performance for the period.
Investing is subject to risk, including the possible loss of principal. Past performance is no indication of future results. Diversification may not protect against market risk.
AVERAGE ANNUAL TOTAL RETURN1 | |||||
1 Year | Annualized | Annualized | Annualized | Annualized | |
High Yield Bond Fund, Class F | 9.27% | 3.87% | 3.09% | 4.22% | 6.47% |
High Yield Bond Fund, Class I | 9.10% | 3.71% | 2.88% | 3.88% | 6.17% |
High Yield Bond Fund, Class Y | 9.54% | 4.12% | 3.34% | 4.43% | 6.55% |
ICE BofA US High Yield Constrained Index | 10.19% | 1.82% | 2.78% | 4.16% | 6.77% |
Comparison of Change in the Value of a $100,000 Investment in the High Yield Bond Fund, Class F, Class I and Class Y, versus the ICE BofA US High Yield Constrained Index

1 | For the year ended 9/30/23. Past performance is not an indication of future performance. Class F shares were offered beginning 1/11/95 and Class I shares were offered beginning 10/1/07. Class I shares performance for the period prior to 10/1/07 is derived from the performance of Class F shares adjusted for the higher expenses of the Class I shares. Class Y shares were offered beginning 12/31/14. For periods prior to 12/31/14, the performance of the Fund’s Class F Shares has been used. Returns for Class Y Shares would have been substantially similar to those of Class F Shares and would have differed only to the extent that Class Y Shares have lower total annual fund operating expenses than Class F Shares. Returns shown do not reflect the deduction of taxes that a shareholder would pay on fund distributions or the redemption of fund shares. The returns for certain periods reflect fee waivers and/or reimbursements in effect for that period; absent fee waivers and/or reimbursements, performance would have been lower. |
48
SEI Institutional Managed Trust
MANAGEMENT’S DISCUSSION AND ANALYSIS OF FUND PERFORMANCE
September 30, 2023 (Unaudited)
Conservative Income Fund
I. Objective
The Conservative Income Fund (the “Fund”) seeks principal preservation and a high degree of liquidity while providing current income.
II. Investment Approach
The Fund uses a sub-advisor to manage the Fund’s portfolio under the general supervision of SEI Investments Management Corporation (SIMC). The sole sub-advisor as of September 30, 2023, was BlackRock Advisors, LLC (BlackRock).
No manager changes were made during the Fund’s fiscal year.
III. Returns
For the one-year period ending September 30, 2023, the Fund Class F shares returned 4.61%. The Fund’s benchmark–the ICE BofA U.S. 3-Month Treasury Bill Index, which tracks the performance of three-month Treasury bills–returned 4.47%.
Although the Fund’s performance is benchmarked against the return of the ICE BofA U.S. 3-Month Treasury Bill Index, an investment in the Fund differs from an investment in U.S. Treasury bills. Among other things, Treasury bills are backed by the full faith and credit of the U.S. government and have a fixed rate of return. Investors in Treasury bills do not risk losing their investment, whereas loss of principal is a risk of investing in the Fund. Furthermore, an investment in the Fund is expected to be more volatile than an investment in Treasury bills because of the breadth and types of securities and other instruments in which the Fund may invest.
IV. Performance Discussion
U.S. Treasury yields in the front end of the curve rose during reporting period as the Federal Reserve (Fed) continued to tighten monetary policy. As noted in the shareholder letter, since the start of this rate-hiking cycle in March 2022 through the end of the reporting period on September 30, 2023, the Fed raised the federal-funds rate by a cumulative total 525 basis points (5.25%) during 11 of its last 13 meetings. Inflation has moderated; the most recent consumer-price index (CPI) reading (as of August 31, 2023) coming in at 3.7% year-over-year. However, the rate was still above the Fed’s 2% target as the lagged effects of monetary policy continued to work its way through the economy. U.S. Treasury bill supply was higher during the second half of the reporting period following a bipartisan resolution on the debt ceiling in the U.S. Congress in June 2023, and the U.S. Treasury began to restock its depleted cash levels. Given attractive short-term yields, demand at the front end
of the U.S. Treasury curve remained strong as yields on U.S. government money market funds across the industry rose to multi-year highs.
The performance of BlackRock, the Fund’s sole manager, benefited during the reporting period from positions in commercial paper and certificates of deposit (which have a yield pick-up relative to comparable-duration Treasurys). The Fund’s performance reflected the rising-yield environment as the three-month Treasury bill yield increased by 220 basis points over the period.
AVERAGE ANNUAL TOTAL RETURN1 | ||||
1 Year | Annualized | Annualized | Annualized | |
Conservative Income Fund, Class F | 4.61% | 1.74% | 1.70% | 1.49% |
Conservative Income Fund, Class Y | 4.78% | 1.84% | 1.80% | 1.59% |
ICE BofA U.S. 3-Month Treasury Bill Index | 4.47% | 1.70% | 1.72% | 1.47% |
Comparison of Change in the Value of a $100,000 Investment in the Conservative Income Fund, Class F and Class Y, versus the ICE BofA U.S. 3-Month Treasury Bill Index
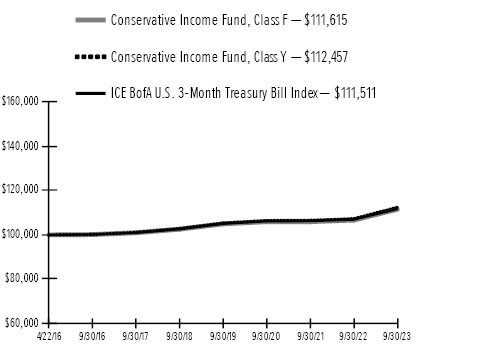
1 | For the year ended 9/30/23. Past performance is no indication of future performance. Class F shares and Class Y shares were offered beginning 4/22/16. Returns shown do not reflect the deduction of taxes that a shareholder would pay on fund distributions or the redemption of fund shares. The returns for the period reflect fee waivers and/or reimbursements in effect for the period; absent fee waivers and reimbursements, performance would have been lower. |
SEI Institutional Managed Trust
49
MANAGEMENT’S DISCUSSION AND ANALYSIS OF FUND PERFORMANCE
September 30, 2023 (Unaudited)
Tax-Free Conservative Income Fund
I. Objective
The Tax-Free Conservative Income Fund (the “Fund”) seeks to preserve principal value and maintain a high degree of liquidity while providing current income exempt from federal income taxes.
II. Investment Approach
The Fund uses a sub-advisor to manage the Fund’s portfolio under the general supervision of SEI Investments Management Corporation (SIMC). The sole sub-advisor as of September 30, 2023, was BlackRock Advisors, LLC (BlackRock).
No manager changes were made during the Fund’s fiscal year.
III. Returns
For the one-year period ending September 30, 2023, the Fund’s Class F shares returned 2.92%. The Fund’s benchmark–the ICE BofA U.S. 3-Month Treasury Bill Index, which tracks the performance of three-month Treasury bills–returned 4.47%.
Although the Fund’s performance is benchmarked against the return of the ICE BofA U.S. 3-Month Treasury Bill Index, an investment in the Fund differs from an investment in U.S. Treasury bills as the fund invests in tax-exempt securities issued by the state and local municipalities. Among other things, Treasury bills are backed by the full faith and credit of the U.S. government and have a fixed rate of return. Investors in Treasury bills do not risk losing their investment, whereas loss of money is a risk of investing in the Fund. Furthermore, an investment in the Fund is expected to be more volatile than an investment in Treasury bills because of the breadth and types of securities and other instruments in which the Fund may invest.
IV. Performance Discussion
U.S. Treasury yields in the front end of the curve rose during the reporting period as the Federal Reserve (Fed) continued to tighten monetary policy, as discussed in the shareholder letter. Since the start of this rate-hiking cycle in March 2022 through the end of the reporting period on September 30, 2023, the Fed raised the federal-funds rate by a cumulative total 525 basis points (5.25%) and at 11 of its last 13 meetings. Inflation has moderated; the most recent consumer-price index (CPI) reading (as of August 31, 2023) coming in at 3.7% year-over-year. However, the rate was still above the Fed’s 2% target as the lagged effects of monetary policy continued to work its way through the economy. U.S. Treasury bill supply was higher during the second half of the reporting period following a bipartisan
resolution on the debt ceiling in the U.S. Congress in June 2023, and the U.S. Treasury began to restock its depleted cash levels. Given attractive short-term yields, demand at the front end of the U.S. Treasury curve remained strong as yields on U.S, government money market funds across the industry rose to multi-year highs. Municipal issuance remained light over the reporting period and fundamentals were solid as the sector benefited from the continuation of strong tax receipts, as well as state surpluses built up during the pandemic.
The performance of BlackRock, the Fund’s sole manager, benefited during the reporting period from its position in municipal commercial paper. Positions in variable-rate demand notes linked to 7-day Securities Industry and Financial Markets Association Municipal (SIFMA) Swap Index (which comprises 7-day tax exempt variable rate demand notes, debt instruments that represent borrowed funds that are payable on demand and accrue interest based on a prevailing money market rate) contributed positively to Fund performance as 7-day SIFMA swaps had no duration, thereby benefiting Fund performance as yields moved higher. The SIFMA Swap Index ended the period with a yield of 3.98%, but fluctuated between 1.66% and 4.47% during the reporting period.
The Fund seeks tax-free income, and its benchmark is the ICE BofA U.S. 3-Month Treasury Bill Index, which tracks the performance of three-month Treasury bills. The index is used as the benchmark as there is no published tax-exempt benchmark that mirrors the Fund’s objective. The Fund’s underperformance versus the benchmark was attributable to the yield differential between taxable and tax-exempt securities. At the end of the reporting period, the yield on the ICE BofA U.S. 3-Month Treasury Bill Index was substantially higher than that of the Fund after rising sharply during the period as the Fed aggressively raised interest rates.
Investing is subject to risk, including the possible loss of principal. Past performance is no indication of future results.
50
SEI Institutional Managed Trust
AVERAGE ANNUAL TOTAL RETURN1 | ||||
1 Year | Annualized | Annualized | Annualized | |
Tax-Free Conservative Income Fund, Class F | 2.92% | 1.06% | 1.04% | 0.92% |
Tax-Free Conservative Income Fund, Class Y | 2.92% | 1.15% | 1.13% | 1.01% |
ICE BofA U.S. 3-Month Treasury Bill Index | 4.47% | 1.70% | 1.72% | 1.47% |
Comparison of Change in the Value of a $100,000 Investment in the Tax-Free Conservative Income Fund, Class F and Class Y, versus the ICE BofA U.S. 3-Month Treasury Bill Index
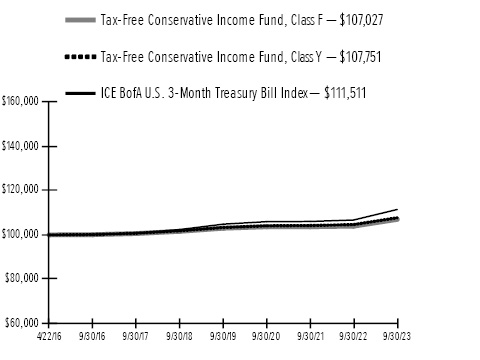
1 | For the year ended 9/30/23. Past performance is no indication of future performance. Class F shares and Class Y shares were offered beginning 4/22/16. Returns shown do not reflect the deduction of taxes that a shareholder would pay on fund distributions or the redemption of fund shares. The returns for the period reflect fee waivers and/or reimbursements in effect for the period; absent fee waivers and reimbursements, performance would have been lower. |
SEI Institutional Managed Trust
51
MANAGEMENT’S DISCUSSION AND ANALYSIS OF FUND PERFORMANCE
September 30, 2023 (Unaudited)
Real Return Fund
I. Objective
The Real Return Fund (the “Fund”) seeks to provide total return exceeding the rate of inflation.
II. Investment Approach
During the one-year period ending September 30, 2023, the Fund was internally managed by SEI Investments Management Corporation (SIMC).
III. Returns
For the one-year period ending September 30, 2023, the Fund’s Class F shares returned 2.44%. The Fund’s benchmark—the Bloomberg 1-5 Year U.S. TIPS Index, which tracks the performance of inflation-protected public obligations of the U.S. Treasury that have a remaining maturity of one to five years—returned 2.84%.
IV. Performance Discussion
With inflation proving stickier than anticipated and economic growth showing an unexpected degree of resiliency, the U.S. Federal Reserve (Fed) further tightened monetary policy over the reporting period, as discussed in the shareholder letter. In what may prove to be the last leg of the most aggressive policy tightening cycle in many years, the Fed increased the federal-funds rate by an aggregate of 175 basis points (1.75%) during the period to a range of 5.25% to 5.50%—a level that was unthinkable just a few years ago. Despite failing to deliver a significant tightening of financial conditions, the ongoing monetary policy tightening drove yields higher. For fixed-income investors, the pain of higher interest rates was partially alleviated by more favorable starting conditions in the form of higher yields. These higher yields provided a degree of insulation from the price depreciation caused by rising rates.
As the market embraced a “stronger-for-longer” economic outlook and a “tighter-for-longer” monetary policy outlook, real interest rates were particularly affected. Real rates across the yield curve sold off and, at the end of the reporting period, were firmly in positive yield territory for the first time in over a decade. In a sign of insufficiently tight financial conditions, inflation breakevens (the difference between the nominal yield on a fixed-rate bond and the real yield (an adjusted yield that takes into account the impact of inflation) on an inflation-linked bond of similar maturity and credit quality) performed well over the reporting period and widened by an average of 20 basis points across the yield curve as recession risk faded and forward-looking inflation expectations rose. U.S. Treasury Inflation-Protected Securities (TIPS) outperformed conventional bonds as high
inflation delivered impressive inflation-accretion returns and breakeven inflation expectations widened.
Through the exposure to TIPS, Fund performance was within expectations over the reporting period as the Fund manager sought to replicate the performance of the Bloomberg 1-5 Year U.S. TIPS Index.
Investing is subject to risk, including the possible loss of principal. Past performance is no indication of future results.
AVERAGE ANNUAL TOTAL RETURN1 | |||||
1 Year | Annualized | Annualized | Annualized | Annualized | |
Real Return Fund, Class F | 2.44% | 0.98% | 2.20% | 1.16% | 1.68% |
Real Return Fund, Class Y | 2.44% | 1.08% | 2.30% | 1.26% | 1.75% |
Bloomberg 1-5 Year U.S. TIPS Index | 2.84% | 1.45% | 2.67% | 1.63% | 2.13% |
Comparison of Change in the Value of a $100,000 Investment in the Real Return Fund, Class F and Class Y, versus the Bloomberg 1-5 Year U.S. TIPS Index
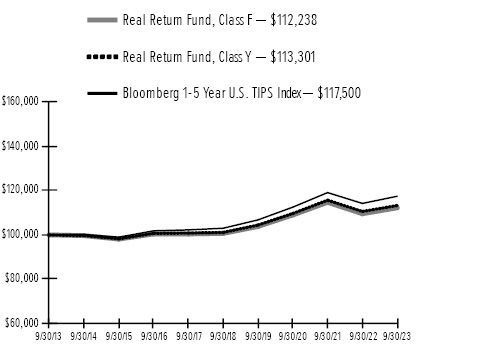
1 | For the year ended 9/30/23. Past performance is no indication of future performance. Class F shares were offered beginning 7/2/09 and Class Y shares were offered beginning 12/31/14. For periods prior to 12/31/14, the performance of the Fund’s Class F Shares has been used. Returns for Class Y Shares would have been substantially similar to those of Class F Shares and would have differed only to the extent that Class Y Shares have lower total annual fund operating expenses than Class F Shares. Returns shown do not reflect the deduction of taxes that a shareholder would pay on fund distributions or the redemption of fund shares. The returns for the period reflect fee waivers and/or reimbursements in effect for the period; absent fee waivers and reimbursements, performance would have been lower. |
52
SEI Institutional Managed Trust
MANAGEMENT’S DISCUSSION AND ANALYSIS OF FUND PERFORMANCE
September 30, 2023 (Unaudited)
Dynamic Asset Allocation Fund
I. Objective
The Dynamic Asset Allocation Fund (the “Fund”) seeks long-term total return.
II. Investment Approach
The Fund uses a sub-advisor to manage the Fund’s portfolio under the general supervision of SEI Investments Management Corporation (SIMC). The sole sub-advisor as of September 30, 2023, was SSGA Funds Management, Inc. (SSGA).
No manager changes were made during the Fund’s fiscal year.
III. Returns
For the full year ended September 30, 2023, the Fund’s Class F shares returned 17.64%. The Fund’s benchmark–the S&P 500 Index (Gross), which tracks the performance of approximately 500 large-cap U.S. companies–returned 21.62%.
IV. Performance Discussion
A majority of the Fund’s volatility is typically driven by strategic exposure to the S&P 500 Index, which served as the most significant driver of the Fund’s return during the period. The Fund’s tactical trades detracted from both the absolute and relative returns for the reporting period.
As noted in the shareholder letter, the U.S. equity market performed well in the first three quarters of the reporting period as inflation moderated, while the U.S. economy continued to benefit from a strong labor market and corporate profitability. However, the U.S. equities market experienced some weakness in the fourth quarter of the reporting period as investors’ expectations adjusted to a potentially longer period of monetary policy tightening by the U.S. Federal Reserve (Fed). Information technology was the strongest-performing sector within the S&P 500 Index during the period, followed by communication services and energy. Utilities was the weakest-performing sector, followed by real estate and consumer staples. As the market favored more growth-oriented stocks, the typically more defensive sectors experienced unfavorable relative performance.
The largest detractor from the Fund’s relative performance over the reporting period was a short position on the S&P 500 Index, which had a negative impact as the U.S. equity market experienced positive performance over the period. A position in a Goldman Sachs Financial Conditions Index total return swap also detracted from performance as financial conditions proved resilient during the period in which the Fund held the position. A position in a
Bloomberg Commodity Index total return swap detracted from relative performance as commodities faced headwinds over concerns of weakening global demand. A position in gold total return swaps weighed on Fund performance as the gold price was challenged by a strong U.S. dollar and higher interest rates. A relative value position that was long the S&P 500 Equal Weight Index/short the S&P 500 Index detracted from performance as the broad S&P 500 index exhibited relative strength versus the less concentrated equal weight index.
The largest contributor to Fund performance for the reporting period was a short position in Japanese interest rates, which benefited from improving market sentiment regarding Bank of Japan monetary policy. Two S&P 500 Index put option spread positions enhanced the Fund’s relative performance. A relative value position, which benefited from a divergence in monetary policy between the U.S. and Europe, also contributed positively to Fund performance.
Regarding derivatives, the Fund used equity index futures, interest-rate swaps, total return swaps, options on equity indices, options on currency forwards and currency forwards over the reporting period. Derivatives had a meaningful impact on the Fund’s relative performance during the period. Interest rate swaps provided positive performance during the period, benefiting from higher interest rates in Japan and the U.S. Equity index futures hampered Fund performance as equities garnered positive returns during the period, which detracted from short positions in the index. The Fund has a controlled foreign corporation designed to provide commodity exposure, primarily through commodity total return swaps. This exposure detracted from Fund performance over the reporting period. Options on equity indexes experienced positive performance during the period. Options on currency forwards posted negative returns over the period. Total return swaps on the Goldman Sachs U.S. Financial Conditions Index weighed on Fund performance for the period. Forward-currency contracts did not have a meaningful impact on performance over the period.
Investing is subject to risk, including the possible loss of principal. Past performance is no indication of future results.
SEI Institutional Managed Trust
53
MANAGEMENT’S DISCUSSION AND ANALYSIS OF FUND PERFORMANCE
September 30, 2023 (Unaudited)
Dynamic Asset Allocation Fund (Concluded)
AVERAGE ANNUAL TOTAL RETURN1 | ||||
1 Year | Annualized 3 Year |
5 Year | Annualized | |
Dynamic Asset Allocation Fund, Class F | 17.64% | 10.51% | 9.67% | 9.86% |
Dynamic Asset Allocation Fund, Class Y | 17.95% | 10.75% | 9.92% | 10.11% |
S&P 500 Index (Gross) | 21.62% | 10.15% | 9.92% | 11.12% |
Comparison of Change in the Value of a $100,000 Investment in the Dynamic Asset Allocation Fund, Class F and Class Y, versus the S&P 500 Index (Gross)
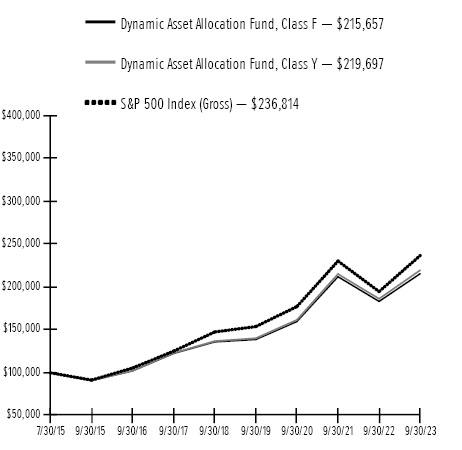
1 | For the year ended 9/30/23. Past performance is no indication of future performance. Class F shares and Class Y shares were offered beginning 7/30/15. Returns shown do not reflect the deduction of taxes that a shareholder would pay on fund distributions or the redemption of fund shares. The returns for the period reflect fee waivers and/or reimbursements in effect for the period; absent fee waivers and reimbursements, performance would have been lower. |
54
SEI Institutional Managed Trust
MANAGEMENT’S DISCUSSION AND ANALYSIS OF FUND PERFORMANCE
September 30, 2023 (Unaudited)
Multi-Strategy Alternative Fund
I. Objective
The Multi-Strategy Alternative Fund (the “Fund”) allocates its assets among a variety of investment strategies to seek to generate an absolute return with reduced correlation to the stock and bond markets.
II. Investment Approach
The Fund’s assets are managed under the direction of SEI Investments Management Corporation (“SIMC”), which manages the Fund’s assets in a way that it believes will achieve the Fund’s investment objective. In order to achieve its investment objective, the Fund may allocate its assets among a variety of investment strategies through the use of: (i) affiliated and unaffiliated funds, including open-end funds, closed-end funds and exchange traded funds (underlying funds); and (ii) one or more investment sub-advisors. During the fiscal year ending September 30, 2023, the Fund allocated its assets among unaffiliated funds and one affiliated fund.
The Fund utilized the following sub-advisors as of September 30, 2023: Brigade Capital Management, LP (Brigade), Global Credit Advisers, LLC (Global Credit), Kettle Hill Capital Management, LLC (Kettle Hill), and Mountaineer Partners Management, LLC (Mountaineer).
Emso Asset Management Limited (EMSO), Putnam Investment Management, LLC (Putnam) and Ramius Advisors, LLC (Ramius) were terminated during the Fund’s fiscal year.
III. Returns
For the one-year period ending September 30, 2023, the Multi-Strategy Alternative Fund, Class F shares, returned 5.40%. The Fund’s benchmark—the ICE BofA U.S. 3-Month Treasury Bill Index, which tracks the performance of three-month Treasury bills—returned 4.47%.
Although the Fund’s performance is benchmarked against the return of the ICE BofA U.S. 3-Month Treasury Bill Index, an investment in the Fund is substantially different from an investment in U.S. Treasury bills. Among other things, Treasury bills are backed by the full faith and credit of the U.S. government and have a fixed rate of return. Treasury bill investors do not risk losing their investment, whereas loss of money is a risk of investing in the Fund. Further, an investment in the Fund is expected to be substantially more volatile than an investment in Treasury bills because of the breadth and types of securities and other instruments in which the Fund may invest.
IV. Performance Discussion
The reporting period was characterized by a notable recovery in global equity markets, which managed to claw back most of their losses from 2022. While there were a number of scares, most notably several regional bank failures in the spring of 2023, as detailed in the shareholder letter, investors grew increasingly confident that the U.S. Federal Reserve (Fed) would be able to engineer a “soft landing”; i.e., tame inflation while inflicting minimal damage on the economy and labor markets. Underneath the headline numbers, however, the market rally was very uneven, driven by a handful of mega-cap technology companies riding the wave of investor excitement about artificial intelligence (AI). Most other stocks posted much more modest gains.
Other risk asset classes such as credit markets generally gained ground along with equities during the reporting period. Interest rate-sensitive assets, notably government bonds, stabilized and even staged a modest rally in the first half of the period, as long-term interest rates fell from recent peaks. However, by the end of the third quarter of 2023, investors had concluded that interest rates most likely will need to stay higher for longer, pushing up long-term rates to new highs, and causing losses in government bond indexes.
The Fund’s participation in the market rally was relatively muted over the reporting period. The Fund’s Equity Long/Short strategy sub-advisors entered the period in a defensive posture and missed some of the early markets gains. Mountaineer, in particular, underperformed during the period due to its defensive posture and emphasis on the industrials and cyclical sectors, which barely participated in the rally. Kettle Hill performed better, but the sub-advisor also had relatively low market exposure.
The Fund’s Relative Value strategy performed well during the period, led by Brigade, which outperformed its benchmark, the Bloomberg Global High Yield Index. EMSO which was focused on emerging-market debt and U.S. corporate credit also contributed to Fund performance.
The period was challenging for some Event-Driven strategies over the reporting period due to the hostile stance of the U.S. Federal Trade Commission (FTC) towards large corporate mergers. The FTC sued to block several transactions. Nevertheless, the Fund’s Even-Driven allocations, Ramius and the Merger Fund, navigated the environment well and posted positive returns over the
SEI Institutional Managed Trust
55
MANAGEMENT’S DISCUSSION AND ANALYSIS OF FUND PERFORMANCE
September 30, 2023 (Unaudited)
Multi-Strategy Alternative Fund (Concluded)
period. Ultimately, the FTC was largely unsuccessful in blocking the deals and most related losses were recovered.
There were numerous significant changes to the Fund’s sub-advisors over the reporting period Putnam (Equity Long/Short) and Ramius (Event-Driven) announced that they wished to terminate the sub-advisory relationships for unrelated reasons. The capital was reallocated to existing sub-advisors within those strategies. In September, SEI decided to terminate the EMSO account for several reasons. This capital also was reallocated to existing sub-advisors.
Derivatives used in the Fund during the reporting period consisted primarily of currency futures and forwards, interest-rate swaps, credit default swaps, and equity and equity-index options. The Fund’s sub-advisors employed derivatives in the Fund primarily for hedging and risk management. The sub-advisors, particularly EMSO, used derivatives mainly to hedge currency and interest-rate risk when they held bonds issued by non-U.S. governments or corporations which may have been denominated in local currency. The sub-advisors, most notably Ramius and Putnam, used equity puts and calls, in an effort to enhance returns or limit losses in common stock positions. On balance, derivatives detracted modestly from Fund performance during the period. As each of EMSO, Ramius, and Putnam are no longer Fund sub-advisors, there most likely will be a reduction in the use of derivative in the Fund going forward.
Investing is subject to risk, including the possible loss of principal. Past performance is no indication of future results.
AVERAGE ANNUAL TOTAL RETURN1 | |||||
1 Year | Annualized | Annualized | Annualized | Annualized | |
Multi-Strategy Alternative Fund, Class F | 5.40% | 2.01% | 2.14% | 2.11% | 1.70% |
Multi-Strategy Alternative Fund, Class Y | 5.68% | 2.27% | 2.38% | 2.32% | 1.85% |
ICE BofA U.S. 3-Month Treasury Bill Index | 4.47% | 1.70% | 1.72% | 1.11% | 0.85% |
Comparison of Change in the Value of a $100,000 Investment in the Multi-Strategy Alternative Fund, Class F and Class Y, versus the ICE BofA U.S. 3-Month Treasury Bill Index

1 | For the year ended 9/30/23. Past performance is no indication of future performance. Class F shares were offered beginning 3/31/10 and Class Y shares were offered beginning 4/30/15. For periods prior to 4/30/15, the performance of the Fund’s Class F Shares has been used. Returns for Class Y Shares would have been substantially similar to those of Class F Shares and would have differed only to the extent that Class Y Shares have lower total annual fund operating expenses than Class F Shares. Returns shown do not reflect the deduction of taxes that a shareholder would pay on fund distributions or the redemption of fund shares. The returns for the period reflect fee waivers and/or reimbursements in effect for the period; absent fee waivers and reimbursements, performance would have been lower. Although the Fund’s performance is benchmarked against the return of the ICE BofA U.S. 3-Month Treasury Bill Index, an investment in the Fund is substantially different from an investment in U.S. Treasury bill. Among other things, Treasury bills are backed by the full faith and credit of the U.S. Government and have a fixed rate of return. Investors in Treasury bills do not risk losing their investment, whereas loss of money is a risk of investing in the Fund. Further, an investment in the Fund is expected to be substantially more volatile than an investment in Treasury bills because of the breadth and types of securities and other instruments in which the Fund may invest. |
56
SEI Institutional Managed Trust
MANAGEMENT’S DISCUSSION AND ANALYSIS OF FUND PERFORMANCE
September 30, 2023 (Unaudited)
Multi-Asset Accumulation Fund
I. Objective
The Multi-Asset Accumulation Fund (the “Fund”) seeks to provide total return, including capital appreciation and income.
II. Investment Approach
The Fund uses a multi-manager approach, relying on a number of sub-advisors with differing investment strategies to manage portions of the Fund’s portfolio, under the general supervision of SEI Investments Management Corporation (SIMC). The Fund utilized the following sub-advisors as of September 30, 2023: AQR Capital Management, LLC (AQR) and PanAgora Asset Management Inc. (PanAgora).
No manager changes were made during the Fund’s fiscal year.
III. Returns
For the one-year period ending September 30, 2023, the Fund’s Class F shares returned 2.59%. The Fund’s blended benchmark—the MSCI World Index (Net) Hedged (USD) Index (which tracks the equity-market performance of developed markets) (60%) and the Bloomberg Global Aggregate Index, Hedged (USD) (which tracks the performance of investment-grade fixed-income securities denominated in 13 currencies) (40%)—returned 13.55%.
IV. Performance Discussion
Major asset-class performance globally was mixed during the reporting period. As discussed in the shareholder letter, global equities and global credit performed well as the markets pushed out the timing of a potential economic recession. Additionally, markets have largely priced in a mild recession at worst if and when it occurs. Global nominal bond markets, however, were challenged by higher interest rates as central banks remained steadfast in dealing with inflation through tight monetary policy. Commodities (as measured by the Bloomberg Commodity Index) declined modestly as weakness in natural gas prices weighed on the overall market. Despite the poor performance of natural gas, there were pockets of strength in the energy sector, with double-digit returns for both Brent crude oil and West Texas Intermediate (WTI) crude oil.
Risk assets performed well during the reporting period as central banks were able to bring inflation under control through tight monetary policy, potentially avoiding a “hard landing” (which occurs when a country's economy rapidly shifts from growth to slow growth to flat as it approaches a recession) across major economies. Despite the strength in risk assets, nominal sovereign bonds were challenged in
this rising interest-rate environment, especially in the U.S., U.K. and Germany. Japanese government bonds recorded slightly positive returns as the Bank of Japan did not embark on a monetary policy tightening campaign during the reporting period. Industrial metals faced headwinds with concerns over demand as China’s recovery from its zero-COVID policy was underwhelming. The agriculture sector recorded modestly negative returns, while precious metals saw virtually flat performance for the period.
The Fund’s overweight allocation to sovereign bonds relative to the Bloomberg Global Aggregate Index was the greatest detractor from relative performance for the reporting period; developed bond markets posted negative returns as global central banks maintained tight monetary policy. Within the asset class, U.S. Treasurys, U.K. gilts and German Bunds were among the weakest-performing markets over the reporting period. The Fund’s exposure to global inflation-linked bonds had a negligible impact on performance as most of the declines in this sector occurred in 2022. The Fund’s lower average concentration in global equities relative to its blended benchmark detracted from performance during the period as most global equity markets rallied. The Fund’s exposure to commodities was a modest detractor from performance as commodities underperformed global stocks over the reporting period.
Among the Fund’s managers, both AQR and PanAgora recorded negative returns during the reporting period, and underperformed the Fund’s blended benchmark. The exposure to global sovereign bonds and an underweight versus the benchmark to global equities provided headwinds for both managers. Exposure to commodities also detracted from Fund performance for both managers.
Regarding derivatives, the Fund used equity index futures, bond index futures, interest-rate swaps, commodity futures, total-return swaps, and currency forwards over the period in an effort to provide cost-effective exposures to desired asset classes. Derivatives had a meaningful impact on Fund performance during the period. Sovereign bond index futures, interest-rate swaps and, to a lesser extent, sovereign bond total-return swaps (used for market exposure) produced negative returns, as interest rates rose globally (on average) over the period. Both developed-market and emerging-market equity futures (used for market exposure) contributed positively to Fund performance. The Fund has a controlled foreign corporation designed to provide commodity exposure, primarily through commodity futures and, to a lesser extent, commodity total-return swaps, as commodities are a key part of the Fund’s strategy. The commodity futures provide strategic exposure to a diversified mix of underlying commodities. This exposure detracted from Fund performance over the period.
SEI Institutional Managed Trust
57
MANAGEMENT’S DISCUSSION AND ANALYSIS OF FUND PERFORMANCE
September 30, 2023 (Unaudited)
Multi-Asset Accumulation Fund (Concluded)
Forward-currency contracts on emerging-market currencies (used for market exposure) contributed to both the Fund’s absolute and benchmark-relative returns. The Fund employed forward currency contracts on developed-market currencies principally to hedge foreign-currency risk relative to the U.S. dollar. These exposures contributed positively to Fund performance over the reporting period.
Investing is subject to risk, including the possible loss of principal. Past performance is no indication of future results.
AVERAGE ANNUAL TOTAL RETURN1 | |||||
1 Year | Annualized | Annualized | Annualized | Annualized | |
Multi-Asset Accumulation Fund, Class F | 2.59% | -2.59% | 0.99% | 2.78% | 3.00% |
Multi-Asset Accumulation Fund, Class Y | 2.73% | -2.40% | 1.19% | 2.98% | 3.17% |
MSCI World Index (Net) (Hedged) (USD) | 21.54% | 10.16% | 8.71% | 9.91% | 10.81% |
Bloomberg Global Aggregate Index, (Hedged) (USD) | 2.10% | -3.71% | 0.57% | 1.84% | 1.94% |
60/40 Hybrid consisting of the MSCI World Index (Net) (Hedged) (USD), and Bloomberg Global Aggregate Index | 13.55% | 4.62% | 5.70% | 6.83% | 7.39% |
Comparison of Change in the Value of a $100,000 Investment in the Multi-Asset Accumulation Fund, Class F and Class Y, versus the 60/40 Hybrid consisting of the MSCI World Index (Net) (Hedged) (USD) and Bloomberg Global Aggregate Index.
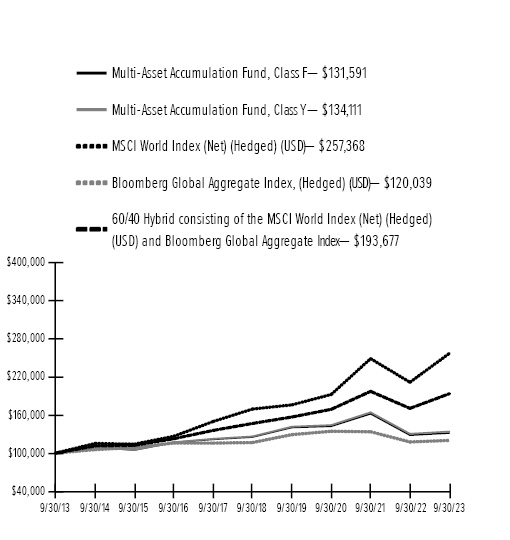
1 | For the year ended 9/30/23. Past performance is no indication of future performance. Class F shares were offered beginning 4/09/12 and Class Y shares were offered beginning 12/31/14. For periods prior to 12/31/14, the performance of the Fund’s Class F Shares has been used. Returns for Class Y Shares would have been substantially similar to those of Class F Shares and would have differed only to the extent that Class Y Shares have lower total annual fund operating expenses than Class F Shares. Returns shown do not reflect the deduction of taxes that a shareholder would pay on fund distributions or the redemption of fund shares. The returns for the period reflect fee waivers and/or reimbursements in effect for the period; absent fee waivers and reimbursements, performance would have been lower. |
N/A — Not available.
58
SEI Institutional Managed Trust
MANAGEMENT’S DISCUSSION AND ANALYSIS OF FUND PERFORMANCE
September 30, 2023 (Unaudited)
Multi-Asset Income Fund
I. Objective
The Multi-Asset Income Fund (the “Fund”) seeks to provide total return with an emphasis on current income.
II. Investment Approach
The Fund uses a multi-manager approach, relying on a number of sub-advisors with differing investment strategies to manage portions of the Fund’s portfolio, under the general supervision of SEI Investments Management Corporation (SIMC). The Fund used the following sub-advisors as of September 30, 2023: Goldman Sachs Asset Management, LP (Goldman Sachs), Western Asset Management Company, LLC, Western Asset Management Company Limited and Western Asset Management Company PTE Ltd. (Western).
SSGA Funds Management, Inc. (SSGA) was terminated and SIMC was added during the Fund’s fiscal year.
III. Returns
For the one-year reporting period ending September 30, 2023, the Fund’s Class F shares returned 8.02%. The Fund’s blended benchmark–the Bloomberg U.S. Aggregate Bond Index, which tracks the performance of the investment-grade, U.S. dollar-denominated, fixed-rate taxable bond market (45%), the ICE BofA U.S. High Yield Constrained Index, which tracks the performance of below-investment-grade, U.S. dollar-denominated corporate bonds publicly issued in the U.S. (40%), and the MSCI All-Country World Index (ACWI) (Net) (USD), a market capitalization-weighted index that tracks the performance of over 2,000 companies, and is representative of the market structure of 48 developed and emerging-market countries in North and South America, Europe, Africa, and the Pacific Rim and is calculated with net dividends reinvested in U.S. dollars. (15%)–returned 7.10%.
IV. Performance Discussion
U.S. Treasury yields rose significantly over the 12-month reporting period, as noted in the shareholder letter, with most of the increase coming over the second half of the period. Yields across the curve reached their highest levels since the global financial crisis of 2007-2008 as the Federal Reserve (Fed) raised the federal-funds rate by a total of 225 basis points (2.25%) over six meetings to a 22-year high. After the Fed’s meeting in September 2023, projections from the central bank indicated the likelihood of one more increase before the end of the year. Fed Chair Jerome Powell reiterated the Fed’s commitment to a 2% inflation target during his September post-policy meeting news conference, and noted that, while the inflation rate has
declined dramatically over the reporting period, it remains stubbornly higher than the 2% target.
Despite the increase in nominal rates, credit market spreads contracted during the reporting period, reflecting both low default rates and attractive corporate balance sheets, and also the attractiveness of riskier bonds in an inflationary environment. Lower-quality segments of the corporate credit market, such as high-yield bonds and bank loans, were the strongest performers over the period, as investors deemed that a deterioration in credit quality or a sharp rise in defaults for high-yield bond issuers was unlikely. Securitized credit also garnered positive returns as the generally lower duration of the asset class provided some relief in a rising-yield environment. Emerging-market debt outperformed developed-market bonds during the period. China’s reopening drove economic activity in the region and expectations of the Fed nearing the end of its monetary policy tightening cycle created a favorable environment for the asset class.
The largest contributor to Fund performance during the reporting period was an overweight allocation to emerging-market debt as China's economic reopening late in 2022 bolstered trade and growth in the region. The Fund’s exposure to bank loans and collateralized loan obligations (CLOs) also contributed to performance; bank loans benefited from broad-based spread compression across risk assets, while demand for floating-rate loans in a rising-rate environment helped drive CLO performance. The greatest challenge to Fund performance over the period was an underweight to equities as stocks were the strongest-performing asset class over the reporting period. The Fund’s dividend-oriented mandate also struggled in a growth-oriented market environment.
Among the Fund’s managers, Goldman Sachs contributed to the Fund’s relative performance during the reporting period due to its overweight allocation to emerging-market debt, as well as strong security selection within high-yield debt. Given the rise in Treasury yields during the period, the manager’s long duration positioning detracted from Fund performance. Western detracted from Fund performance due to the negative impact of its overall long duration positioning. Further, Western’s exposure to high-yield bonds bolstered Fund performance given broad-based spread compression across risk assets during the period, while its bank loan exposure benefited from the segment’s lack of duration in a rising-rate climate. Prior to its termination from the Fund in February, SSGA’s covered-call strategy produced performance within our expectations. Following its inclusion into the Fund, the performance of SIMC’s dividend equity strategy also met expectations; however,
SEI Institutional Managed Trust
59
MANAGEMENT’S DISCUSSION AND ANALYSIS OF FUND PERFORMANCE
September 30, 2023 (Unaudited)
Multi-Asset Income Fund (Concluded)
the manager’s mandate significantly lagged its broad-market equity benchmark in a growth-led rally.
Regarding the use of derivatives, the Fund employed total-return swaps on bond futures, interest-rate swaps, and futures and options on exchange-traded funds, equity indexes, credit default swaps, and currency forwards. The Fund employed derivatives for various reasons, including fixed-income relative value, to generate option income, and hedge interest-rate risk. Derivatives had a meaningful impact on Fund performance. Interest-rate futures were used to manage duration, and detracted from Fund performance as yields increased during the period. Short exposure to interest-rate swaps had a modestly positive impact on performance for the reporting period. Options used as part of the covered-call strategy contributed to Fund performance. Currency forwards had a slightly negative impact on performance. The Fund’s exposure to investment-grade credit and high-yield bonds through credit default swaps did not contribute meaningfully to Fund performance over the period.
Investing is subject to risk, including the possible loss of principal. Past performance is no indication of future results.
AVERAGE ANNUAL TOTAL RETURN1 | |||||
1 Year | Annualized | Annualized | Annualized | Annualized | |
Multi-Asset Income Fund, Class F | 8.02% | -0.25% | 1.83% | 3.43% | 4.16% |
Multi-Asset Income Fund, Class Y | 8.12% | -0.14% | 1.93% | 3.52% | 4.24% |
Bloomberg U.S. Aggregate Bond Index | 0.64% | -5.21% | 0.10% | 1.13% | 1.09% |
ICE BofA U.S. High Yield Constrained Index | 10.19% | 1.82% | 2.78% | 4.16% | 4.82% |
MSCI All Country World Index (Net) | 20.80% | 6.89% | 6.46% | 7.56% | 8.37% |
45/40/15 Hybrid consisting of the Bloomberg U.S. Aggregate Bond Index, ICE BofA U.S. High Yield Constrained Index and MSCI All Country World Index (Net) | 7.10% | -0.21% | 2.74% | 4.01% | 4.34% |
Comparison of Change in the Value of a $100,000 Investment in the Multi-Asset Income Fund, Class F and Class Y, versus the 45/40/15 Hybrid consisting of the Bloomberg U.S. Aggregate Bond Index, ICE BofA U.S. High Yield Constrained Index, and MSCI All Country World Index (Net)
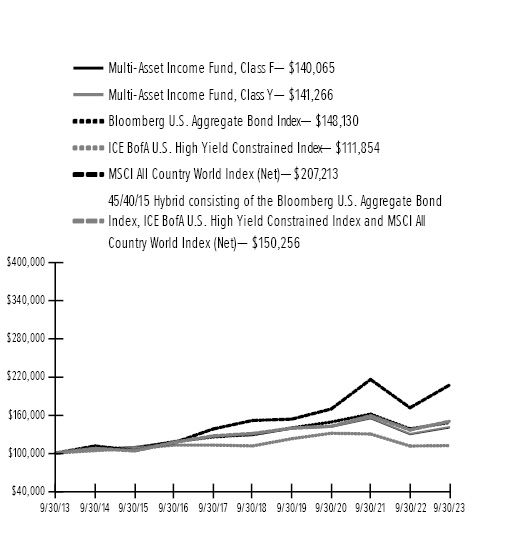
1 | For the year ended 9/30/23. Past performance is not an indication of future performance. Class F shares were offered beginning 4/9/12. Class Y shares were offered beginning 12/31/14. For periods prior to 12/31/14, the performance of the Fund’s Class F Shares has been used. Returns for Class Y Shares would have been substantially similar to those of Class F Shares and would have differed only to the extent that Class Y Shares have lower total annual fund operating expenses than Class F Shares. Returns shown do not reflect the deduction of taxes that a shareholder would pay on fund distributions or the redemption of fund shares. The returns for certain periods reflect fee waivers and reimbursements, performance would have been lower. |
60
SEI Institutional Managed Trust
MANAGEMENT’S DISCUSSION AND ANALYSIS OF FUND PERFORMANCE
September 30, 2023 (Unaudited)
Multi-Asset Inflation Managed Fund
I. Objective
The Multi-Asset Inflation Managed Fund (the “Fund”) seeks to provide total return exceeding the rate of inflation.
II. Investment Approach
The Fund uses a multi-manager approach, relying on a number of sub-advisors with differing investment strategies to manage portions of the Fund’s portfolio, under the general supervision of SEI Investments Management Corporation (SIMC). The Fund utilized the following sub-advisors as of September 30, 2023: AllianceBernstein L.P. (AllianceBernstein), Columbia Management Investment Advisers, LLC (Columbia), Credit Suisse Asset Management, LLC (Credit Suisse), and Franklin Advisers, Inc. (Franklin).
Columbia manages a wholly-owned subsidiary of the Fund. Columbia has delegated certain of its duties to Threadneedle International Ltd. as a sub-advisor. Credit Suisse also manages the wholly-owned subsidiary of the Fund.
No manager changes were made during the Fund’s fiscal year.
III. Returns
For the full year ended September 30, 2023, the Fund’s Class F shares returned 1.46%. The Fund’s blended benchmark–—the Bloomberg 1-5 Year U.S. TIPS Index (which tracks the performance of U.S. Treasury Inflation-Protected Securities (TIPS) with maturities between one and five years) (70%), the Bloomberg Commodity Index (which tracks the performance of a basket of commodities) (20%), and the S&P 500 Index (gross) (which tracks the performance of approximately 500 large U.S. companies that are considered representative of the broad U.S. stock market) (10%)–returned 3.90%.
IV. Performance Discussion
Real assets experienced mixed performance over the reporting period. Commodities moved lower over the period, while Treasury Inflation-Protected Securities (TIPS) and U.S. equities garnered positive returns. Within the commodities market, declines in energy and grain prices followed outsized gains in 2022 after the Russian invasion in Ukraine had disrupted trade and supply of energy and food, as further discussed in the shareholder letter. Soft commodities (such as agricultural products and livestock) outperformed, while precious metals also experienced strong performance, as investors looked to the asset class for its potential ability to hedge risk in an inflationary economy. Despite the rise in interest rates, short-dated TIPS (as measured by the Bloomberg 1-5 Year U.S. TIPS Index) still
posted gains for the reporting period; however, the overall TIPS market saw mixed performance as longer-dated TIPS recorded negative returns during the period.
The Fund managers’ performance was mixed during the reporting period. Franklin’s inflation-sensitive equity long/short strategy was challenged; the strategy’s short position in consumer discretionary was the largest detractor from performance, while the long exposure to the energy sector (which diverged from negative commodity performance) was the most notable positive contributor. Security selection within the commodities sector bolstered the performance of the Fund’s commodities managers, Columbia and Credit Suisse, in aggregate. AllianceBernstein outperformed, benefiting from an overweight allocation to credit-spread sectors as credit spreads tightened. The TIPS market experienced mixed performance during the reporting period; short-dated TIPS ended with modestly positive returns, while longer-dated TIPS lost ground. AllianceBernstein’s focus on the short end of the TIPS yield curve was within its mandate’s expectations.
Regarding derivatives, the Fund used commodity futures, commodity total-return swaps, bond-index futures, equity-index futures, options on futures, and interest-rate swaps during the reporting period. The use of derivatives had a meaningful impact on Fund performance. The Fund employed short positions in U.S. Treasury futures and interest-rate swaps to hedge duration risk for a portion of the Fund’s corporate-bond exposure. The hedge contributed positively to Fund performance as interest rates rose. A short position in global equity total-return swaps was implemented to hedge risk for a portion of the Fund’s long equity positions. This hedge detracted from Fund performance as global equities recorded positive returns for the reporting period. Within the Fund, a controlled foreign corporation was established to provide additional exposure to commodities, including commodity futures and commodity total-return swaps. The commodity futures, commodity total-return swaps, and options on futures exposure, used to provide strategic exposure to a diversified mix of underlying commodities, saw negative performance over the period. Forward-currency contracts on developed-market currencies, which were used principally to hedge foreign-currency risk relative to the U.S. dollar, detracted from Fund performance over the reporting period.
Investing is subject to risk, including the possible loss of principal. Past performance is no indication of future results.
SEI Institutional Managed Trust
61
MANAGEMENT’S DISCUSSION AND ANALYSIS OF FUND PERFORMANCE
September 30, 2023 (Unaudited)
Multi-Asset Inflation Managed Fund (Concluded)
AVERAGE ANNUAL TOTAL RETURN1 | ||||||
1 Year |
|
|
| Annualized | ||
Multi-Asset Inflation Managed Fund, Class F | 1.46% | 6.95% | 3.26% | 0.87% | 0.33% | |
Multi-Asset Inflation Managed Fund, Class Y | 1.75% | 7.22% | 3.53% | 1.09% | 0.51% | |
Bloomberg 1-5 Year U.S. TIPS Index | 2.84% | 1.45% | 2.67% | 1.63% | 1.37% | |
Bloomberg Commodity Index | -1.30% | 16.23% | 6.13% | -0.75% | -1.54% | |
S&P 500 Index (Gross) | 21.62% | 10.15% | 9.92% | 11.91% | 12.52% | |
70/20/10 Hybrid consisting of the Bloomberg 1-5 Year U.S. TIPS Index, Bloomberg Commodity Index and S&P 500 Index (Gross) | 3.90% | 5.40% | 4.36% | 2.27% | 1.93% | |
Comparison of Change in the Value of a $100,000 Investment in the Multi-Asset Inflation Managed Fund, Class F and Class Y, versus a 70/20/10 Hybrid consisting of the Bloomberg 1-5 Year U.S. TIPS Index, Bloomberg Commodity Index and the S&P 500 Index (Gross).

62
SEI Institutional Managed Trust
1 | For the year ended 9/30/23. Past performance is no indication of future performance. Class F shares were offered beginning 4/09/12 and Class Y shares were offered beginning 12/31/14. For periods prior to 12/31/14, the performance of the Fund’s Class F Shares has been used. Returns for Class Y Shares would have been substantially similar to those of Class F Shares and would have differed only to the extent that Class Y Shares have lower total annual fund operating expenses than Class F Shares. Returns shown do not reflect the deduction of taxes that a shareholder would pay on fund distributions or the redemption of fund shares. The returns for the period reflect fee waivers and/or reimbursements in effect for the period; absent fee waivers and reimbursements, performance would have been lower.
|
SEI Institutional Managed Trust
63
MANAGEMENT’S DISCUSSION AND ANALYSIS OF FUND PERFORMANCE
September 30, 2023 (Unaudited)
Multi-Asset Capital Stability Fund
I. Objective
The Multi-Asset Capital Stability Fund (the “Fund”) seeks to manage the risk of a loss while providing current income and an opportunity for capital appreciation.
II. Investment Approach
The Fund uses a multi-manager approach, relying on a number of sub-advisors with differing investment strategies to manage portions of the Fund’s portfolio, under the general supervision of SEI Investments Management Corporation (SIMC). The Fund utilized the following sub-advisors as of September 30, 2023: AllianceBernstein, L.P. (AllianceBernstein) and Janus Henderson Investors US LLC (Janus).
No manager changes were made during the Fund’s fiscal year.
III. Returns
For the one-year ending September 30, 2023, the Fund’s Class F shares returned 4.19%. The Fund’s blended benchmark—the Bloomberg 1-3 Year U.S. Government/Credit Index (which measures the performance of investment-grade, U.S. dollar-denominated, fixed-rate U.S. Treasurys, government-related and corporate securities with maturities of 1 to 3 years) (95%) and S&P 500 Index (gross) (which tracks the performance of approximately 500 large U.S. companies that are considered representative of the broad U.S. stock market) (5%)—returned 3.70%.
IV. Performance Discussion
Major asset-class performance globally was mixed during the reporting period. As discussed in the shareholder letter, global equities and global credit performed well as the markets pushed out the timing of a potential economic recession. Additionally, markets have largely priced in a mild recession at worst if and when it occurs. Global nominal bond markets, however, were challenged by higher interest rates as central banks remained steadfast in dealing with inflation through tight monetary policy. Commodities (as measured by the Bloomberg Commodity Index) declined modestly as weakness in natural gas prices weighed on the overall market. Despite the poor performance of natural gas, there were pockets of strength in the energy sector, with double-digit returns for both Brent crude oil and West Texas Intermediate crude oil.
During the reporting period, the Fund’s positive absolute performance was within expectations for its mandate, and it outperformed its blended benchmark. Throughout most of the period, the Fund maintained exposure to equities that was in line with its historical average, while
maintaining below-historical average exposure to fixed income. The primary contributor to relative performance was the Fund’s overweight allocation to global equities versus its blended benchmark. Additionally, the Fund’s use of cash as the primary risk-mitigation asset (rather than nominal bonds) benefited performance as most major developed bond markets recorded negative returns over the reporting period. The Fund’s exposure to credit (both investment-grade and high yield) contributed modestly to performance. A tactical position in U.S. Treasury Inflation-Protected Securities (TIPS) slightly detracted from both the Fund’s absolute and relative performance for the period.
Regarding derivatives, the Fund used credit-default swaps, equity-index futures, bond-index futures, interest-rate swaps, equity options, interest-rate swaptions, and currency forwards over the reporting period. Derivatives are primarily used to provide cost-effective exposures to the desired asset classes and had a meaningful impact on Fund performance during the period. The use of stock index futures, primarily developed-market equities used for market exposure, resulted in positive performance during the period. Interest-rate futures and swaps detracted from Fund performance over the period as interest rates generally moved higher globally. Small positions in credit-default swaps, used to gain exposure to high-yield and investment-grade credit, contributed positively to Fund performance. The Fund employed forward-currency contracts on developed-market currencies principally to hedge foreign-currency risk relative to the U.S. dollar. These hedges had a positive effect on Fund performance for the reporting period.
Investing is subject to risk, including the possible loss of principal. Past performance is no indication of future results.
64
SEI Institutional Managed Trust
AVERAGE ANNUAL TOTAL RETURN1 | |||||
1 Year | Annualized | Annualized | Annualized | Annualized | |
Multi-Asset Capital Stability Fund, Class F | 4.19% | 1.00% | 1.89% | 1.84% | 1.61% |
Multi-Asset Capital Stability Fund, Class Y | 4.30% | 1.10% | 1.99% | 1.93% | 1.69% |
Bloomberg 1-3 year U.S. Government/Credit Index | 2.77% | (0.72)% | 1.21% | 1.02% | 1.00% |
S&P 500 Index (Gross) | 21.62% | 10.15% | 9.92% | 11.91% | 12.52% |
95/5 Hybrid consisting of Bloomberg 1-3 Year U.S. Government/Credit Index and S&P 500 Index (Gross) | 3.70% | (0.13)% | 1.71% | 1.59% | 1.60% |
Comparison of Change in the Value of a $100,000 Investment in the Multi-Asset Capital Stability Fund, Class F and Class Y, versus a 95/5 Hybrid of the following indexes: the Bloomberg 1-3 Year U.S. Government/Credit Index, and the S&P 500 Index (Gross).
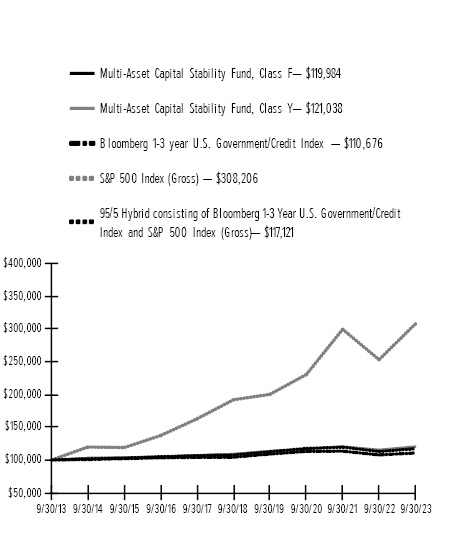
1 | For the year ended 9/30/23. Past performance is not an indication of future performance. Class F shares were offered beginning 4/9/12 and Class Y shares were offered beginning 12/31/14. For periods prior to 12/31/14, the performance of the Fund’s Class F Shares has been used. Returns for Class Y Shares would have been substantially similar to those of Class F Shares and would have differed only to the extent that Class Y Shares have lower total annual fund operating expenses than Class F Shares. Returns shown do not reflect the deduction of taxes that a shareholder would pay on fund distributions or the redemption of fund shares. The returns for certain periods reflect fee waivers and/or reimbursements in effect for that period; absent fee waivers and/or reimbursements, performance would have been lower. |
SEI Institutional Managed Trust
65
SCHEDULE OF INVESTMENTS
September 30, 2023
Large Cap Fund
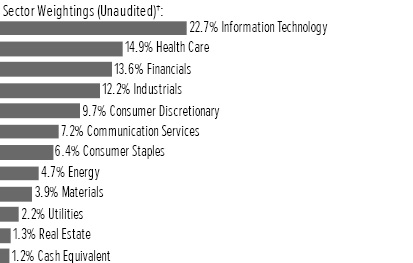
† | Percentages are based on total investments. Total investments do not include derivatives such as options, futures contracts, forward contracts, and swap contracts, if applicable. |
Description | Shares | Market Value | ||||||
COMMON STOCK — 98.7% | ||||||||
Communication Services — 7.2% | ||||||||
Alphabet Inc, Cl A * | 88,197 | $ | 11,542 | |||||
Alphabet Inc, Cl C * | 188,524 | 24,857 | ||||||
AT&T Inc | 239,840 | 3,602 | ||||||
Comcast Corp, Cl A | 142,077 | 6,300 | ||||||
Fox Corp, Cl A | 57,265 | 1,787 | ||||||
Liberty Media -Liberty Formula One, Cl C * | 54,837 | 3,416 | ||||||
Meta Platforms Inc, Cl A * | 83,824 | 25,165 | ||||||
Netflix Inc * | 8,096 | 3,057 | ||||||
Nexstar Media Group Inc, Cl A | 7,733 | 1,109 | ||||||
Paramount Global, Cl B | 22,664 | 292 | ||||||
Pinterest Inc, Cl A * | 39,150 | 1,058 | ||||||
TEGNA Inc | 150,197 | 2,188 | ||||||
T-Mobile US Inc | 67,629 | 9,472 | ||||||
Trade Desk Inc/The, Cl A * | 47,680 | 3,726 | ||||||
Verizon Communications Inc | 193,284 | 6,264 | ||||||
Walt Disney Co/The * | 160,172 | 12,982 | ||||||
| 116,817 | ||||||||
Consumer Discretionary — 9.8% | ||||||||
Amazon.com Inc, Cl A * | 266,546 | 33,883 | ||||||
Autoliv Inc | 14,037 | 1,354 | ||||||
AutoNation Inc * | 7,577 | 1,147 | ||||||
AutoZone Inc * | 726 | 1,844 | ||||||
Best Buy Co Inc | 70,574 | 4,903 | ||||||
Bloomin' Brands Inc | 60,688 | 1,492 | ||||||
BorgWarner Inc | 51,591 | 2,083 | ||||||
Dick's Sporting Goods Inc | 36,476 | 3,961 | ||||||
Dillard's Inc, Cl A | 6,450 | 2,134 | ||||||
DraftKings Inc, Cl A * | 81,183 | 2,390 | ||||||
eBay Inc | 56,727 | 2,501 | ||||||
Foot Locker Inc, Cl A * | 23,394 | 406 | ||||||
Ford Motor Co | 65,375 | 812 | ||||||
General Motors Co | 161,784 | 5,334 | ||||||
Harley-Davidson Inc, Cl A | 49,267 | 1,629 | ||||||
Description | Shares | Market Value | ||||||
COMMON STOCK (continued) | ||||||||
Home Depot Inc/The | 13,650 | $ | 4,125 | |||||
Kohl's Corp | 24,781 | 519 | ||||||
Lennar Corp, Cl A | 12,211 | 1,370 | ||||||
Lithia Motors Inc, Cl A | 10,129 | 2,991 | ||||||
Lowe's Cos Inc | 55,559 | 11,547 | ||||||
Magna International Inc, Cl A | 39,591 | 2,122 | ||||||
MercadoLibre Inc * | 4,032 | 5,112 | ||||||
MGM Resorts International * | 117,451 | 4,318 | ||||||
Mobileye Global Inc, Cl A * | 30,063 | 1,249 | ||||||
NIKE Inc, Cl B | 108,684 | 10,392 | ||||||
O'Reilly Automotive Inc * | 1,659 | 1,508 | ||||||
Penske Automotive Group Inc, Cl A | 5,456 | 911 | ||||||
Phinia Inc | 12,286 | 329 | ||||||
PulteGroup Inc | 93,106 | 6,895 | ||||||
PVH Corp | 11,442 | 875 | ||||||
Ross Stores Inc | 101,920 | 11,512 | ||||||
Service Corp International/US | 51,314 | 2,932 | ||||||
Starbucks Corp | 72,980 | 6,661 | ||||||
Tesla Inc * | 23,718 | 5,935 | ||||||
Trip.com Group Ltd ADR * | 65,851 | 2,303 | ||||||
Whirlpool Corp | 27,260 | 3,645 | ||||||
Williams-Sonoma Inc | 30,798 | 4,786 | ||||||
| 157,910 | ||||||||
Consumer Staples — 6.4% | ||||||||
Altria Group Inc | 46,068 | 1,937 | ||||||
Archer-Daniels-Midland Co | 20,067 | 1,513 | ||||||
Coca-Cola Co/The | 146,094 | 8,178 | ||||||
Colgate-Palmolive Co | 34,871 | 2,480 | ||||||
Conagra Brands Inc | 263,174 | 7,216 | ||||||
Dollar General Corp | 41,094 | 4,348 | ||||||
Ingredion Inc | 72,988 | 7,182 | ||||||
J M Smucker Co/The | 53,849 | 6,619 | ||||||
Kenvue Inc | 169,037 | 3,394 | ||||||
Kraft Heinz Co/The | 9,187 | 309 | ||||||
Kroger Co/The | 268,628 | 12,021 | ||||||
Molson Coors Beverage Co, Cl B | 30,456 | 1,937 | ||||||
Mondelez International Inc, Cl A | 85,885 | 5,960 | ||||||
PepsiCo Inc | 62,828 | 10,646 | ||||||
Philip Morris International Inc | 106,185 | 9,831 | ||||||
Sysco Corp, Cl A | 145,077 | 9,582 | ||||||
Target Corp, Cl A | 33,894 | 3,748 | ||||||
Tyson Foods Inc, Cl A | 105,363 | 5,320 | ||||||
Walgreens Boots Alliance Inc | 38,987 | 867 | ||||||
| 103,088 | ||||||||
Energy — 4.7% | ||||||||
Baker Hughes Co, Cl A | 173,425 | 6,125 | ||||||
BP PLC ADR | 131,377 | 5,087 | ||||||
Canadian Natural Resources Ltd | 89,208 | 5,769 | ||||||
Chesapeake Energy Corp | 31,422 | 2,710 | ||||||
Chevron Corp | 75,839 | 12,788 | ||||||
ConocoPhillips | 81,177 | 9,725 | ||||||
66
SEI Institutional Managed Trust
Description | Shares | Market Value | ||||||
COMMON STOCK (continued) | ||||||||
Devon Energy Corp | 66,117 | $ | 3,154 | |||||
EOG Resources Inc | 75,896 | 9,621 | ||||||
Exxon Mobil Corp | 16,215 | 1,907 | ||||||
Hess Corp | 3,244 | 496 | ||||||
HF Sinclair Corp | 35,358 | 2,013 | ||||||
Marathon Oil Corp | 12,387 | 331 | ||||||
Marathon Petroleum Corp | 29,810 | 4,511 | ||||||
Phillips 66 | 23,171 | 2,784 | ||||||
Schlumberger NV, Cl A | 64,571 | 3,765 | ||||||
Shell PLC ADR | 30,942 | 1,992 | ||||||
Valero Energy Corp | 27,947 | 3,960 | ||||||
| 76,738 | ||||||||
Financials — 13.5% | ||||||||
Aflac Inc | 81,002 | 6,217 | ||||||
Allstate Corp/The | 55,820 | 6,219 | ||||||
American Financial Group Inc/OH | 10,346 | 1,155 | ||||||
Ameriprise Financial Inc | 16,732 | 5,516 | ||||||
Apollo Global Management Inc | 3,670 | 329 | ||||||
Ares Management Corp, Cl A | 3,156 | 325 | ||||||
Bank of America Corp | 321,127 | 8,792 | ||||||
Bank of New York Mellon Corp/The | 19,244 | 821 | ||||||
Berkshire Hathaway Inc, Cl B * | 48,951 | 17,147 | ||||||
Capital One Financial Corp | 33,366 | 3,238 | ||||||
Charles Schwab Corp/The | 60,560 | 3,325 | ||||||
Citigroup Inc | 178,158 | 7,328 | ||||||
Citizens Financial Group Inc | 9,142 | 245 | ||||||
CME Group Inc, Cl A | 7,554 | 1,512 | ||||||
Discover Financial Services | 33,010 | 2,860 | ||||||
Everest Group Ltd | 1,843 | 685 | ||||||
Fifth Third Bancorp | 115,704 | 2,931 | ||||||
First American Financial Corp | 14,531 | 821 | ||||||
Global Payments Inc | 120,935 | 13,955 | ||||||
Goldman Sachs Group Inc/The | 996 | 322 | ||||||
Hartford Financial Services Group Inc/The | 69,124 | 4,902 | ||||||
JPMorgan Chase & Co | 79,023 | 11,460 | ||||||
KeyCorp | 97,020 | 1,044 | ||||||
Markel Group Inc * | 8,135 | 11,979 | ||||||
Marsh & McLennan Cos Inc | 55,548 | 10,571 | ||||||
Mastercard Inc, Cl A | 798 | 316 | ||||||
Moody's Corp | 29,213 | 9,236 | ||||||
Morgan Stanley | 11,750 | 960 | ||||||
New York Community Bancorp Inc | 259,581 | 2,944 | ||||||
Progressive Corp/The | 57,358 | 7,990 | ||||||
Radian Group Inc | 16,498 | 414 | ||||||
Raymond James Financial Inc | 11,898 | 1,195 | ||||||
Regions Financial Corp | 212,723 | 3,659 | ||||||
Reinsurance Group of America Inc, Cl A | 17,568 | 2,551 | ||||||
S&P Global Inc | 20,010 | 7,312 | ||||||
Starwood Property Trust Inc ‡ | 32,387 | 627 | ||||||
State Street Corp | 122,316 | 8,190 | ||||||
Synchrony Financial | 77,838 | 2,379 | ||||||
Unum Group | 6,781 | 333 | ||||||
Description | Shares | Market Value | ||||||
COMMON STOCK (continued) | ||||||||
US Bancorp | 241,322 | $ | 7,978 | |||||
Visa Inc, Cl A | 104,955 | 24,141 | ||||||
Voya Financial Inc | 4,791 | 318 | ||||||
Wells Fargo & Co | 115,137 | 4,704 | ||||||
Willis Towers Watson PLC | 48,312 | 10,095 | ||||||
| 219,041 | ||||||||
Health Care — 14.8% | ||||||||
AbbVie Inc | 34,264 | 5,107 | ||||||
Acadia Healthcare Co Inc, Cl A * | 46,772 | 3,289 | ||||||
Amgen Inc, Cl A | 38,169 | 10,258 | ||||||
AstraZeneca PLC ADR | 76,964 | 5,212 | ||||||
Baxter International Inc | 136,426 | 5,149 | ||||||
Biogen Inc * | 8,964 | 2,304 | ||||||
Boston Scientific Corp * | 59,857 | 3,160 | ||||||
Bristol-Myers Squibb Co | 155,447 | 9,022 | ||||||
Cardinal Health Inc | 34,293 | 2,977 | ||||||
Cencora Inc, Cl A | 66,235 | 11,920 | ||||||
Centene Corp * | 5,276 | 363 | ||||||
Cigna Group/The | 3,135 | 897 | ||||||
CVS Health Corp | 187,434 | 13,087 | ||||||
Danaher Corp, Cl A | 42,146 | 10,456 | ||||||
DaVita Inc * | 4,103 | 388 | ||||||
DENTSPLY SIRONA Inc | 83,788 | 2,862 | ||||||
Eli Lilly & Co | 7,084 | 3,805 | ||||||
Exelixis Inc * | 70,404 | 1,538 | ||||||
Gilead Sciences Inc | 63,484 | 4,757 | ||||||
GSK PLC ADR | 83,573 | 3,030 | ||||||
HCA Healthcare Inc | 13,474 | 3,314 | ||||||
Humana Inc | 18,782 | 9,138 | ||||||
Jazz Pharmaceuticals PLC * | 31,805 | 4,117 | ||||||
Johnson & Johnson | 191,313 | 29,797 | ||||||
Koninklijke Philips * | 16,231 | 324 | ||||||
Lantheus Holdings Inc * | 16,726 | 1,162 | ||||||
McKesson Corp | 29,577 | 12,862 | ||||||
Medtronic PLC | 79,267 | 6,211 | ||||||
Merck & Co Inc | 94,491 | 9,728 | ||||||
Mettler-Toledo International Inc * | 10,186 | 11,287 | ||||||
Natera Inc * | 87,218 | 3,859 | ||||||
Organon & Co | 15,833 | 275 | ||||||
Perrigo Co PLC | 92,473 | 2,955 | ||||||
Pfizer Inc | 237,127 | 7,866 | ||||||
QuidelOrtho Corp * | 10,714 | 783 | ||||||
Revvity Inc | 20,840 | 2,307 | ||||||
Thermo Fisher Scientific Inc | 13,628 | 6,898 | ||||||
TransMedics Group Inc * | 57,698 | 3,159 | ||||||
UnitedHealth Group Inc | 32,254 | 16,262 | ||||||
Vaxcyte Inc * | 26,085 | 1,330 | ||||||
Vertex Pharmaceuticals Inc * | 19,131 | 6,653 | ||||||
Viatris Inc, Cl W | 49,717 | 490 | ||||||
| 240,358 | ||||||||
SEI Institutional Managed Trust
67
SCHEDULE OF INVESTMENTS
September 30, 2023
Large Cap Fund (Continued)
Description | Shares | Market Value | ||||||
COMMON STOCK (continued) | ||||||||
Industrials — 12.2% | ||||||||
AerCap Holdings NV * | 62,810 | $ | 3,936 | |||||
AGCO Corp | 28,514 | 3,373 | ||||||
Alaska Air Group Inc * | 80,294 | 2,977 | ||||||
Allison Transmission Holdings Inc | 37,699 | 2,227 | ||||||
American Airlines Group Inc * | 127,347 | 1,631 | ||||||
Caterpillar Inc, Cl A | 1,327 | 362 | ||||||
Chart Industries Inc * | 13,230 | 2,238 | ||||||
CNH Industrial NV | 22,669 | 274 | ||||||
Cummins Inc | 24,677 | 5,638 | ||||||
Delta Air Lines Inc, Cl A | 89,962 | 3,329 | ||||||
Eaton Corp PLC | 21,926 | 4,676 | ||||||
Emerson Electric Co | 24,649 | 2,380 | ||||||
Equifax Inc | 26,848 | 4,918 | ||||||
FedEx Corp | 54,639 | 14,475 | ||||||
Fortive Corp | 174,964 | 12,975 | ||||||
GFL Environmental Inc | 212,703 | 6,755 | ||||||
GXO Logistics Inc * | 198,654 | 11,651 | ||||||
HEICO Corp | 7,622 | 1,234 | ||||||
Honeywell International Inc | 75,534 | 13,954 | ||||||
Huntington Ingalls Industries Inc, Cl A | 10,975 | 2,245 | ||||||
IDEX Corp | 17,250 | 3,588 | ||||||
Jacobs Solutions Inc | 29,315 | 4,002 | ||||||
Knight-Swift Transportation Holdings Inc, Cl A | 101,784 | 5,105 | ||||||
L3Harris Technologies Inc | 20,797 | 3,621 | ||||||
Lockheed Martin Corp | 8,565 | 3,503 | ||||||
ManpowerGroup Inc | 43,604 | 3,197 | ||||||
Owens Corning | 34,317 | 4,681 | ||||||
Parker-Hannifin Corp, Cl A | 23,421 | 9,123 | ||||||
Paychex Inc | 5,604 | 646 | ||||||
Ryder System Inc | 14,973 | 1,601 | ||||||
Snap-on Inc | 9,818 | 2,504 | ||||||
Textron Inc | 56,360 | 4,404 | ||||||
Timken Co/The | 61,063 | 4,488 | ||||||
TransDigm Group Inc * | 21,482 | 18,112 | ||||||
United Airlines Holdings Inc * | 19,870 | 841 | ||||||
United Parcel Service Inc, Cl B | 58,899 | 9,181 | ||||||
Vertiv Holdings Co, Cl A | 75,867 | 2,822 | ||||||
Westinghouse Air Brake Technologies Corp | 14,105 | 1,499 | ||||||
WW Grainger Inc | 18,547 | 12,832 | ||||||
| 196,998 | ||||||||
Information Technology — 22.7% | ||||||||
Adobe Inc * | 42,607 | 21,725 | ||||||
Advanced Micro Devices Inc * | 48,233 | 4,959 | ||||||
Amdocs Ltd | 51,821 | 4,378 | ||||||
Amkor Technology Inc | 51,908 | 1,173 | ||||||
Amphenol Corp, Cl A | 108,662 | 9,127 | ||||||
Apple Inc | 309,126 | 52,925 | ||||||
Applied Materials Inc | 42,015 | 5,817 | ||||||
Arista Networks Inc * | 9,068 | 1,668 | ||||||
Arrow Electronics Inc, Cl A * | 20,514 | 2,569 | ||||||
Description | Shares | Market Value | ||||||
COMMON STOCK (continued) | ||||||||
Broadcom Inc | 2,831 | $ | 2,351 | |||||
Cadence Design Systems Inc * | 18,825 | 4,411 | ||||||
Cirrus Logic Inc * | 12,623 | 934 | ||||||
Cisco Systems Inc | 151,519 | 8,146 | ||||||
Datadog Inc, Cl A * | 51,842 | 4,722 | ||||||
Dell Technologies Inc, Cl C | 36,916 | 2,544 | ||||||
DXC Technology Co * | 63,528 | 1,323 | ||||||
Flex Ltd * | 20,930 | 565 | ||||||
Fortinet Inc * | 23,850 | 1,400 | ||||||
Hewlett Packard Enterprise Co | 249,894 | 4,341 | ||||||
HP Inc | 124,604 | 3,202 | ||||||
Intel Corp | 118,591 | 4,216 | ||||||
International Business Machines Corp | 24,273 | 3,406 | ||||||
Intuit Inc | 23,887 | 12,205 | ||||||
Jabil Inc | 68,671 | 8,714 | ||||||
Manhattan Associates Inc * | 2,962 | 585 | ||||||
Marvell Technology Inc | 183,135 | 9,913 | ||||||
Microchip Technology Inc | 227,091 | 17,724 | ||||||
Micron Technology Inc | 54,334 | 3,696 | ||||||
Microsoft Corp | 201,808 | 63,721 | ||||||
NVIDIA Corp | 51,921 | 22,585 | ||||||
ON Semiconductor Corp * | 50,746 | 4,717 | ||||||
Oracle Corp, Cl B | 73,084 | 7,741 | ||||||
QUALCOMM Inc | 90,748 | 10,079 | ||||||
Roper Technologies Inc | 21,630 | 10,475 | ||||||
Salesforce Inc * | 50,377 | 10,215 | ||||||
SAP SE ADR | 85,766 | 11,091 | ||||||
ServiceNow Inc * | 4,229 | 2,364 | ||||||
Skyworks Solutions Inc | 3,042 | 300 | ||||||
Taiwan Semiconductor Manufacturing Co Ltd ADR | 10,858 | 944 | ||||||
Teradyne Inc | 71,961 | 7,229 | ||||||
Vishay Intertechnology Inc | 115,899 | 2,865 | ||||||
VMware Inc, Cl A * | 31,155 | 5,187 | ||||||
Vontier Corp | 227,465 | 7,033 | ||||||
Xerox Holdings Corp | 83,008 | 1,302 | ||||||
| 366,587 | ||||||||
Materials — 3.9% | ||||||||
Air Products and Chemicals Inc | 46,345 | 13,134 | ||||||
Avery Dennison Corp | 14,381 | 2,627 | ||||||
Berry Global Group Inc | 31,426 | 1,946 | ||||||
Crown Holdings Inc | 71,500 | 6,326 | ||||||
Eastman Chemical Co | 73,135 | 5,611 | ||||||
Freeport-McMoRan Inc, Cl B | 71,931 | 2,682 | ||||||
Graphic Packaging Holding Co | 13,677 | 305 | ||||||
Huntsman Corp | 158,009 | 3,855 | ||||||
Linde PLC | 27,030 | 10,065 | ||||||
LyondellBasell Industries NV, Cl A | 3,410 | 323 | ||||||
Martin Marietta Materials Inc, Cl A | 4,861 | 1,995 | ||||||
Mosaic Co/The | 15,728 | 560 | ||||||
Newmont Corp | 67,378 | 2,490 | ||||||
O-I Glass Inc, Cl I * | 44,115 | 738 | ||||||
68
SEI Institutional Managed Trust
Description | Shares | Market Value | ||||||
COMMON STOCK (continued) | ||||||||
Reliance Steel & Aluminum Co | 8,194 | $ | 2,149 | |||||
Sherwin-Williams Co/The, Cl A | 9,816 | 2,504 | ||||||
Steel Dynamics Inc | 9,490 | 1,017 | ||||||
Sylvamo Corp | 40,871 | 1,796 | ||||||
Vulcan Materials Co | 10,672 | 2,156 | ||||||
Westrock Co | 8,670 | 310 | ||||||
| 62,589 | ||||||||
Real Estate — 1.3% | ||||||||
American Tower Corp, Cl A ‡ | 55,725 | 9,164 | ||||||
Crown Castle Inc ‡ | 67,313 | 6,195 | ||||||
Howard Hughes Holdings Inc * | 35,813 | 2,655 | ||||||
Omega Healthcare Investors Inc ‡ | 57,992 | 1,923 | ||||||
Sabra Health Care REIT Inc ‡ | 73,150 | 1,020 | ||||||
Service Properties Trust ‡ | 89,393 | 687 | ||||||
| 21,644 | ||||||||
Utilities — 2.2% | ||||||||
Ameren Corp | 14,513 | 1,086 | ||||||
CMS Energy Corp | 51,784 | 2,750 | ||||||
Edison International | 104,559 | 6,617 | ||||||
Description | Shares | Market Value | ||||||
COMMON STOCK (continued) | ||||||||
FirstEnergy Corp | 180,214 | $ | 6,160 | |||||
NRG Energy Inc | 144,416 | 5,563 | ||||||
PPL Corp | 319,532 | 7,528 | ||||||
UGI Corp | 103,502 | 2,381 | ||||||
Vistra Corp | 94,721 | 3,143 | ||||||
| 35,228 | ||||||||
Total Common Stock | ||||||||
(Cost $1,071,099) ($ Thousands) | 1,596,998 | |||||||
CASH EQUIVALENT — 1.2% | ||||||||
SEI Daily Income Trust, Government Fund, Institutional Class | ||||||||
5.210%**† | 19,609,846 | 19,610 | ||||||
Total Cash Equivalent | ||||||||
(Cost $19,610) ($ Thousands) | 19,610 | |||||||
Total Investments in Securities — 99.9% | ||||||||
(Cost $1,090,709) ($ Thousands) | $ | 1,616,608 | ||||||
A list of the open futures contracts held by the Fund at September 30, 2023 is as follows:
Type of Contract | Number of | Expiration Date | Notional Amount (Thousands) | Value | Unrealized Depreciation(Thousands) | |||||||||||||||
Long Contracts | ||||||||||||||||||||
S&P 500 Index E-MINI | 49 | Dec-2023 | $ | 10,811 | $ | 10,598 | $ | (213 | ) | |||||||||||
S&P Mid Cap 400 Index E-MINI | 18 | Dec-2023 | 4,564 | 4,537 | (27 | ) | ||||||||||||||
| $ | 15,375 | $ | 15,135 | $ | (240 | ) | ||||||||||||||
| Percentages are based on Net Assets of $1,617,891 ($ Thousands). |
* | Non-income producing security. |
** | The rate reported is the 7-day effective yield as of September 30, 2023. |
‡ | Real Estate Investment Trust. |
† | Investment in Affiliated Security (see Note 6). |
The following is a summary of the level of inputs used as of September 30, 2023, in valuing the Fund's investments and other financial instruments carried at value ($ Thousands): | ||||||||||||||||
Investments in Securities | Level 1 | Level 2 | Level 3 | Total | ||||||||||||
Common Stock | 1,596,998 | – | – | 1,596,998 | ||||||||||||
Cash Equivalent | 19,610 | – | – | 19,610 | ||||||||||||
Total Investments in Securities | 1,616,608 | – | – | 1,616,608 | ||||||||||||
Other Financial Instruments | Level 1 | Level 2 | Level 3 | Total | ||||||||||||
Futures Contracts* | ||||||||||||||||
Unrealized Depreciation | (240 | ) | – | – | (240 | ) | ||||||||||
Total Other Financial Instruments | (240 | ) | – | – | (240 | ) | ||||||||||
* | Futures contracts are valued at the unrealized depreciation on the instrument. |
For more information on valuation inputs, see Note 2 — Significant Accounting Policies in Notes to Financial Statements.
SEI Institutional Managed Trust
69
SCHEDULE OF INVESTMENTS
September 30, 2023
Large Cap Fund (Concluded)
The following is a summary of the Fund’s transactions with affiliates for the year ended September 30, 2023 ($ Thousands):
Security Description | Value | Purchases | Proceeds | Realized Gain/(Loss) | Change in Unrealized Appreciation/(Depreciation) | Value | Income | Capital Gains | ||||||||||||||||||||||||
SEI Liquidity Fund, LP | $ | 1,266 | $ | 67,382 | $ | (68,622 | ) | $ | (20 | ) | $ | (6 | ) | $ | — | $ | 67 | $ | — | |||||||||||||
SEI Daily Income Trust, Government Fund, | 15,252 | 355,481 | (351,123 | ) | — | — | 19,610 | 653 | — | |||||||||||||||||||||||
Totals | $ | 16,518 | $ | 422,863 | $ | (419,745 | ) | $ | (20 | ) | $ | (6 | ) | $ | 19,610 | $ | 720 | $ | — | |||||||||||||
Amounts designated as “—” are either $0 or have been rounded to $0.
See “Glossary” for abbreviations.
The accompanying notes are an integral part of the financial statements.
70
SEI Institutional Managed Trust
SCHEDULE OF INVESTMENTS
September 30, 2023
Large Cap Value Fund
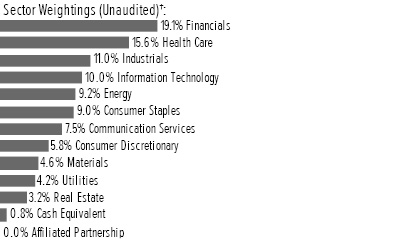
† | Percentages are based on total investments. Total investments do not include derivatives such as |
options, futures contracts, forward contracts, and swap contracts, if applicable.
Description | Shares | Market Value | ||||||
COMMON STOCK — 99.0% | ||||||||
Communication Services — 7.5% | ||||||||
Alphabet Inc, Cl A * | 48,296 | $ | 6,320 | |||||
Alphabet Inc, Cl C * | 2,041 | 269 | ||||||
AT&T Inc | 1,320,970 | 19,841 | ||||||
BCE Inc | 272,263 | 10,392 | ||||||
Comcast Corp, Cl A | 507,972 | 22,524 | ||||||
Fox Corp, Cl A | 117,686 | 3,672 | ||||||
Meta Platforms Inc, Cl A * | 26,627 | 7,994 | ||||||
Nexstar Media Group Inc, Cl A | 9,818 | 1,408 | ||||||
Paramount Global, Cl B | 56,061 | 723 | ||||||
TEGNA Inc | 94,393 | 1,375 | ||||||
T-Mobile US Inc | 59,317 | 8,307 | ||||||
Verizon Communications Inc | 167,004 | 5,413 | ||||||
Walt Disney Co/The * | 52,590 | 4,262 | ||||||
| 92,500 | ||||||||
Consumer Discretionary — 5.8% | ||||||||
Autoliv Inc | 18,618 | 1,796 | ||||||
AutoNation Inc * | 12,701 | 1,923 | ||||||
Bloomin' Brands Inc | 59,825 | 1,471 | ||||||
BorgWarner Inc | 26,812 | 1,082 | ||||||
Dick's Sporting Goods Inc | 14,390 | 1,562 | ||||||
Dillard's Inc, Cl A | 7,538 | 2,494 | ||||||
eBay Inc | 38,550 | 1,700 | ||||||
Foot Locker Inc, Cl A * | 31,098 | 540 | ||||||
Ford Motor Co | 185,547 | 2,305 | ||||||
General Motors Co | 279,508 | 9,215 | ||||||
Genuine Parts Co | 102,865 | 14,852 | ||||||
Goodyear Tire & Rubber Co/The * | 141,512 | 1,759 | ||||||
Harley-Davidson Inc, Cl A | 31,143 | 1,030 | ||||||
Kohl's Corp | 23,092 | 484 | ||||||
Lennar Corp, Cl A | 30,058 | 3,373 | ||||||
Lithia Motors Inc, Cl A | 8,992 | 2,656 | ||||||
Lowe's Cos Inc | 49,572 | 10,303 | ||||||
Magna International Inc, Cl A | 18,453 | 989 | ||||||
NVR Inc * | 78 | 465 | ||||||
Description | Shares | Market Value | ||||||
COMMON STOCK (continued) | ||||||||
Penske Automotive Group Inc, Cl A | 13,566 | $ | 2,266 | |||||
PulteGroup Inc | 70,857 | 5,247 | ||||||
PVH Corp | 13,197 | 1,010 | ||||||
Williams-Sonoma Inc | 20,334 | 3,160 | ||||||
| 71,682 | ||||||||
Consumer Staples — 9.0% | ||||||||
Altria Group Inc | 213,204 | 8,965 | ||||||
Archer-Daniels-Midland Co | 82,751 | 6,241 | ||||||
Conagra Brands Inc | 168,205 | 4,612 | ||||||
Diageo PLC ADR | 40,805 | 6,087 | ||||||
Ingredion Inc | 72,344 | 7,119 | ||||||
Kenvue Inc | 495,721 | 9,954 | ||||||
Kraft Heinz Co/The | 56,221 | 1,891 | ||||||
Kroger Co/The | 371,657 | 16,632 | ||||||
Molson Coors Beverage Co, Cl B | 104,071 | 6,618 | ||||||
Philip Morris International Inc | 156,341 | 14,474 | ||||||
Target Corp, Cl A | 94,360 | 10,433 | ||||||
Tyson Foods Inc, Cl A | 136,847 | 6,910 | ||||||
Unilever PLC ADR | 172,210 | 8,507 | ||||||
Walgreens Boots Alliance Inc | 134,840 | 2,999 | ||||||
| 111,442 | ||||||||
Energy — 9.2% | ||||||||
APA Corp | 43,909 | 1,804 | ||||||
BP PLC ADR | 136,639 | 5,291 | ||||||
Canadian Natural Resources Ltd | 37,000 | 2,393 | ||||||
Chevron Corp | 141,628 | 23,881 | ||||||
ConocoPhillips | 180,628 | 21,639 | ||||||
Devon Energy Corp | 34,255 | 1,634 | ||||||
Exxon Mobil Corp | 273,934 | 32,209 | ||||||
HF Sinclair Corp | 28,302 | 1,611 | ||||||
Marathon Oil Corp | 94,717 | 2,534 | ||||||
Marathon Petroleum Corp | 50,944 | 7,710 | ||||||
Phillips 66 | 36,211 | 4,351 | ||||||
Shell PLC ADR | 61,589 | 3,965 | ||||||
Valero Energy Corp | 36,531 | 5,177 | ||||||
| 114,199 | ||||||||
Financials — 19.1% | ||||||||
Aflac Inc | 78,802 | 6,048 | ||||||
Allstate Corp/The | 17,830 | 1,986 | ||||||
Ally Financial Inc | 31,400 | 838 | ||||||
American Financial Group Inc/OH | 20,349 | 2,272 | ||||||
American International Group Inc | 29,934 | 1,814 | ||||||
Ameriprise Financial Inc | 15,721 | 5,183 | ||||||
Annaly Capital Management Inc ‡ | 13,851 | 261 | ||||||
Bank of America Corp | 566,703 | 15,516 | ||||||
Bank of New York Mellon Corp/The | 191,211 | 8,155 | ||||||
Berkshire Hathaway Inc, Cl B * | 36,393 | 12,748 | ||||||
Capital One Financial Corp | 28,002 | 2,718 | ||||||
Charles Schwab Corp/The | 43,038 | 2,363 | ||||||
Chubb Ltd | 85,357 | 17,770 | ||||||
Citigroup Inc | 544,061 | 22,377 | ||||||
SEI Institutional Managed Trust
71
��
SCHEDULE OF INVESTMENTS
September 30, 2023
Large Cap Value Fund (Continued)
Description | Shares | Market Value | ||||||
COMMON STOCK (continued) | ||||||||
Citizens Financial Group Inc | 94,679 | $ | 2,537 | |||||
Discover Financial Services | 34,891 | 3,023 | ||||||
Everest Group Ltd | 2,694 | 1,001 | ||||||
Fifth Third Bancorp | 113,014 | 2,863 | ||||||
First American Financial Corp | 19,225 | 1,086 | ||||||
Global Payments Inc | 46,481 | 5,363 | ||||||
Goldman Sachs Group Inc/The | 6,045 | 1,956 | ||||||
Hartford Financial Services Group Inc/The | 40,505 | 2,872 | ||||||
JPMorgan Chase & Co | 161,900 | 23,479 | ||||||
KeyCorp | 115,208 | 1,240 | ||||||
Lincoln National Corp | 31,513 | 778 | ||||||
MetLife Inc | 85,353 | 5,370 | ||||||
MGIC Investment Corp | 55,201 | 921 | ||||||
Morgan Stanley | 170,065 | 13,889 | ||||||
New York Community Bancorp Inc | 432,286 | 4,902 | ||||||
Principal Financial Group Inc, Cl A | 5,795 | 418 | ||||||
Prudential Financial Inc | 28,531 | 2,707 | ||||||
Radian Group Inc | 78,204 | 1,964 | ||||||
Regions Financial Corp | 201,984 | 3,474 | ||||||
Reinsurance Group of America Inc, Cl A | 21,858 | 3,174 | ||||||
State Street Corp | 47,517 | 3,182 | ||||||
Stifel Financial Corp | 3,867 | 238 | ||||||
Synchrony Financial | 153,808 | 4,702 | ||||||
T Rowe Price Group Inc | 14,890 | 1,561 | ||||||
Travelers Cos Inc/The | 48,773 | 7,965 | ||||||
Truist Financial Corp | 211,571 | 6,053 | ||||||
Unum Group | 62,598 | 3,079 | ||||||
Voya Financial Inc | 82,173 | 5,460 | ||||||
Wells Fargo & Co | 362,724 | 14,821 | ||||||
Willis Towers Watson PLC | 16,379 | 3,423 | ||||||
Zions Bancorp NA | 61,404 | 2,142 | ||||||
| 235,692 | ||||||||
Health Care — 15.6% | ||||||||
AbbVie Inc | 11,458 | 1,708 | ||||||
Amgen Inc, Cl A | 16,965 | 4,559 | ||||||
AstraZeneca PLC ADR | 37,794 | 2,559 | ||||||
Baxter International Inc | 50,853 | 1,919 | ||||||
Biogen Inc * | 6,434 | 1,654 | ||||||
Bristol-Myers Squibb Co | 190,557 | 11,060 | ||||||
Cardinal Health Inc | 73,301 | 6,364 | ||||||
Centene Corp * | 71,998 | 4,959 | ||||||
Cigna Group/The | 18,672 | 5,341 | ||||||
CVS Health Corp | 192,393 | 13,433 | ||||||
DaVita Inc * | 9,941 | 940 | ||||||
DENTSPLY SIRONA Inc | 110,087 | 3,760 | ||||||
Exelixis Inc * | 74,033 | 1,618 | ||||||
Gilead Sciences Inc | 123,820 | 9,279 | ||||||
GSK PLC ADR | 101,133 | 3,666 | ||||||
HCA Healthcare Inc | 12,270 | 3,018 | ||||||
Hologic Inc * | 6,340 | 440 | ||||||
Jazz Pharmaceuticals PLC * | 44,651 | 5,780 | ||||||
Johnson & Johnson | 144,849 | 22,560 | ||||||
Description | Shares | Market Value | ||||||
COMMON STOCK (continued) | ||||||||
Koninklijke Philips * | 24,715 | $ | 493 | |||||
Lantheus Holdings Inc * | 11,065 | 769 | ||||||
McKesson Corp | 21,918 | 9,531 | ||||||
Medtronic PLC | 182,215 | 14,278 | ||||||
Merck & Co Inc | 235,258 | 24,220 | ||||||
Novartis AG ADR | 103,008 | 10,492 | ||||||
Organon & Co | 76,027 | 1,320 | ||||||
Pfizer Inc | 644,980 | 21,394 | ||||||
QuidelOrtho Corp * | 11,618 | 849 | ||||||
Viatris Inc, Cl W | 487,079 | 4,803 | ||||||
| 192,766 | ||||||||
Industrials — 11.0% | ||||||||
AerCap Holdings NV * | 77,499 | 4,857 | ||||||
AGCO Corp | 31,476 | 3,723 | ||||||
Alaska Air Group Inc * | 72,619 | 2,693 | ||||||
Allison Transmission Holdings Inc | 68,559 | 4,049 | ||||||
Caterpillar Inc, Cl A | 7,394 | 2,019 | ||||||
Chart Industries Inc * | 12,449 | 2,105 | ||||||
CNH Industrial NV | 102,959 | 1,246 | ||||||
Cummins Inc | 24,975 | 5,706 | ||||||
Delta Air Lines Inc, Cl A | 161,817 | 5,987 | ||||||
Expeditors International of Washington Inc | 4,284 | 491 | ||||||
FedEx Corp | 39,365 | 10,429 | ||||||
General Dynamics Corp | 60,416 | 13,350 | ||||||
Huntington Ingalls Industries Inc, Cl A | 15,488 | 3,168 | ||||||
Johnson Controls International PLC | 234,738 | 12,490 | ||||||
Lockheed Martin Corp | 5,611 | 2,295 | ||||||
ManpowerGroup Inc | 42,383 | 3,107 | ||||||
Owens Corning | 35,493 | 4,842 | ||||||
PACCAR Inc | 32,837 | 2,792 | ||||||
RTX Corp | 194,355 | 13,988 | ||||||
Ryder System Inc | 31,013 | 3,317 | ||||||
Siemens AG ADR | 107,812 | 7,703 | ||||||
Snap-on Inc | 18,096 | 4,616 | ||||||
Textron Inc | 58,357 | 4,560 | ||||||
Timken Co/The | 50,058 | 3,679 | ||||||
United Airlines Holdings Inc * | 38,423 | 1,625 | ||||||
United Parcel Service Inc, Cl B | 69,337 | 10,807 | ||||||
| 135,644 | ||||||||
Information Technology — 9.9% | ||||||||
Amdocs Ltd | 66,501 | 5,619 | ||||||
Amkor Technology Inc | 102,883 | 2,325 | ||||||
Applied Materials Inc | 26,846 | 3,717 | ||||||
Arrow Electronics Inc, Cl A * | 28,506 | 3,570 | ||||||
Broadcom Inc | 17,290 | 14,361 | ||||||
Cirrus Logic Inc * | 18,558 | 1,373 | ||||||
Cisco Systems Inc | 341,952 | 18,383 | ||||||
Cognizant Technology Solutions Corp, Cl A | 23,945 | 1,622 | ||||||
Dell Technologies Inc, Cl C | 50,452 | 3,476 | ||||||
DXC Technology Co * | 112,302 | 2,339 | ||||||
Flex Ltd * | 72,201 | 1,948 | ||||||
72
SEI Institutional Managed Trust
Description | Shares | Market Value | ||||||
COMMON STOCK (continued) | ||||||||
Hewlett Packard Enterprise Co | 337,327 | $ | 5,859 | |||||
HP Inc | 257,060 | 6,606 | ||||||
Intel Corp | 326,557 | 11,609 | ||||||
International Business Machines Corp | 26,606 | 3,733 | ||||||
Jabil Inc | 55,524 | 7,045 | ||||||
Micron Technology Inc | 60,319 | 4,104 | ||||||
Microsoft Corp | 28,296 | 8,935 | ||||||
Oracle Corp, Cl B | 33,496 | 3,548 | ||||||
QUALCOMM Inc | 19,370 | 2,151 | ||||||
Skyworks Solutions Inc | 17,969 | 1,772 | ||||||
Teradyne Inc | 50,479 | 5,071 | ||||||
Vontier Corp | 122,930 | 3,801 | ||||||
| �� | ||||||||
| 122,967 | ||||||||
Materials — 4.5% | ||||||||
Berry Global Group Inc | 26,280 | 1,627 | ||||||
Crown Holdings Inc | 45,761 | 4,049 | ||||||
Dow Inc | 320,918 | 16,547 | ||||||
Eastman Chemical Co | 47,072 | 3,611 | ||||||
Graphic Packaging Holding Co | 25,779 | 574 | ||||||
Huntsman Corp | 146,520 | 3,575 | ||||||
LyondellBasell Industries NV, Cl A | 46,631 | 4,416 | ||||||
Mosaic Co/The | 52,568 | 1,871 | ||||||
Newmont Corp | 65,956 | 2,437 | ||||||
O-I Glass Inc, Cl I * | 56,355 | 943 | ||||||
Reliance Steel & Aluminum Co | 30,848 | 8,089 | ||||||
Steel Dynamics Inc | 47,842 | 5,130 | ||||||
Sylvamo Corp | 31,045 | 1,364 | ||||||
Westrock Co | 57,168 | 2,047 | ||||||
| 56,280 | ||||||||
Real Estate — 3.2% | ||||||||
Boston Properties Inc ‡ | 88,791 | 5,281 | ||||||
Healthpeak Properties Inc ‡ | 552,456 | 10,143 | ||||||
Host Hotels & Resorts Inc ‡ | 157,386 | 2,529 | ||||||
Howard Hughes Holdings Inc * | 44,213 | 3,278 | ||||||
Omega Healthcare Investors Inc ‡ | 93,655 | 3,106 | ||||||
Sabra Health Care REIT Inc ‡ | 143,789 | 2,005 | ||||||
Description | Shares | Market Value | ||||||
COMMON STOCK (continued) | ||||||||
Service Properties Trust ‡ | 92,900 | $ | 714 | |||||
Simon Property Group Inc ‡ | 21,266 | 2,297 | ||||||
VICI Properties Inc, Cl A ‡ | 340,826 | 9,918 | ||||||
| 39,271 | ||||||||
Utilities — 4.2% | ||||||||
Duke Energy Corp | 144,122 | 12,720 | ||||||
Edison International | 99,315 | 6,286 | ||||||
FirstEnergy Corp | 168,244 | 5,751 | ||||||
NextEra Energy Inc | 209,704 | 12,014 | ||||||
NRG Energy Inc | 166,631 | 6,419 | ||||||
UGI Corp | 223,368 | 5,137 | ||||||
Vistra Corp | 122,949 | 4,079 | ||||||
| 52,406 | ||||||||
Total Common Stock | ||||||||
(Cost $933,405) ($ Thousands) | 1,224,849 | |||||||
AFFILIATED PARTNERSHIP — 0.0% | ||||||||
SEI Liquidity Fund, LP | ||||||||
5.410% **†(A) | 43,030 | 38 | ||||||
Total Affiliated Partnership | ||||||||
(Cost $43) ($ Thousands) | 38 | |||||||
CASH EQUIVALENT — 0.8% | ||||||||
SEI Daily Income Trust, Government Fund, Institutional Class | ||||||||
5.210%**† | 9,540,728 | 9,541 | ||||||
Total Cash Equivalent | ||||||||
(Cost $9,541) ($ Thousands) | 9,541 | |||||||
Total Investments in Securities — 99.8% | ||||||||
(Cost $942,989) ($ Thousands) | $ | 1,234,428 | ||||||
A list of the open futures contracts held at September 30, 2023 is as follows:
Type of Contract | Number of | Expiration Date | Notional Amount (Thousands) | Value | Unrealized Depreciation(Thousands) | |||||||||||||||
Long Contracts | ||||||||||||||||||||
S&P 500 Index E-MINI | 12 | Dec-2023 | $ | 2,645 | $ | 2,595 | $ | (50 | ) | |||||||||||
S&P Mid Cap 400 Index E-MINI | 14 | Dec-2023 | 3,550 | 3,529 | (21 | ) | ||||||||||||||
| $ | 6,195 | $ | 6,124 | $ | (71 | ) | ||||||||||||||
SEI Institutional Managed Trust
73
SCHEDULE OF INVESTMENTS
September 30, 2023
Large Cap Value Fund (Concluded)
| Percentages are based on Net Assets of $1,236,527 ($ Thousands). |
* | Non-income producing security. |
** | The rate reported is the 7-day effective yield as of September 30, 2023. |
‡ | Real Estate Investment Trust. |
† | Investment in Affiliated Security (see Note 6). |
(A) | This security was purchased with cash collateral held from securities on loan (see Note 12). The total market value of such securities as of September 30, 2023 was $38 ($ Thousands). |
The following is a summary of the level of inputs used as of September 30, 2023, in valuing the Fund's investments and other financial instruments carried at value ($ Thousands): | ||||||||||||||||
Investments in Securities | Level 1 | Level 2 | Level 3 | Total | ||||||||||||
Common Stock | 1,224,849 | – | – | 1,224,849 | ||||||||||||
Affiliated Partnership | – | 38 | – | 38 | ||||||||||||
Cash Equivalent | 9,541 | – | – | 9,541 | ||||||||||||
Total Investments in Securities | 1,234,390 | 38 | – | 1,234,428 | ||||||||||||
Other Financial Instruments | Level 1 | Level 2 | Level 3 | Total | ||||||||||||
Futures Contracts* | ||||||||||||||||
Unrealized Depreciation | (71 | ) | – | – | (71 | ) | ||||||||||
Total Other Financial Instruments | (71 | ) | – | – | (71 | ) | ||||||||||
* | Futures contracts are valued at the unrealized depreciation on the instrument. |
For more information on valuation inputs, see Note 2 — Significant Accounting Policies in Notes to Financial Statements.
The following is a summary of the Fund’s transactions with affiliates for the year ended September 30, 2023 ($ Thousands):
Security Description | Value | Purchases | Proceeds | Realized Gain/(Loss) | Change in Unrealized Appreciation/(Depreciation) | Value | Income | Capital Gains | ||||||||||||||||||||||||
SEI Liquidity Fund, LP | $ | 15,770 | $ | 88,017 | $ | (103,748 | ) | $ | 2 | $ | (3 | ) | $ | 38 | $ | 89 | $ | 2 | ||||||||||||||
SEI Daily Income Trust, Government Fund, | 16,000 | 258,176 | (264,635 | ) | — | — | 9,541 | 543 | — | |||||||||||||||||||||||
Totals | $ | 31,770 | $ | 346,193 | $ | (368,383 | ) | $ | 2 | $ | (3 | ) | $ | 9,579 | $ | 632 | $ | 2 | ||||||||||||||
Amounts designated as “—” are either $0 or have been rounded to $0.
See “Glossary” for abbreviations.
The accompanying notes are an integral part of the financial statements.
74
SEI Institutional Managed Trust
SCHEDULE OF INVESTMENTS
September 30, 2023
Large Cap Growth Fund
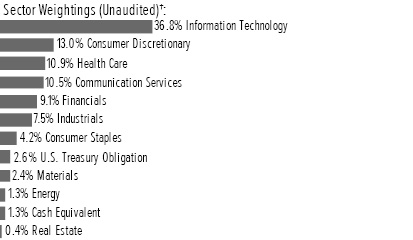
† | Percentages are based on total investments. Total investments do not include derivatives such as options, futures contracts, forward contracts, and swap contracts, if applicable. |
Description | Shares | Market Value | ||||||
COMMON STOCK†† — 96.2% | ||||||||
Communication Services — 10.5% | ||||||||
Alphabet Inc, Cl A * | 315,189 | $ | 41,246 | |||||
Alphabet Inc, Cl C * | 179,382 | 23,652 | ||||||
Liberty Global PLC, Cl C * | 3,042 | 56 | ||||||
Liberty Media -Liberty Formula One, Cl C * | 83,655 | 5,212 | ||||||
Meta Platforms Inc, Cl A * | 170,341 | 51,138 | ||||||
Netflix Inc * | 27,074 | 10,223 | ||||||
Pinterest Inc, Cl A * | 66,703 | 1,803 | ||||||
Spotify Technology SA * | 8,695 | 1,345 | ||||||
TKO Group Holdings Inc | 8,665 | 728 | ||||||
Trade Desk Inc/The, Cl A * | 50,647 | 3,958 | ||||||
ZoomInfo Technologies Inc, Cl A * | 88,263 | 1,447 | ||||||
| 140,808 | ||||||||
Consumer Discretionary — 13.0% | ||||||||
Airbnb Inc, Cl A * | 4,846 | 665 | ||||||
Amazon.com Inc, Cl A * | 396,608 | 50,417 | ||||||
AutoZone Inc * | 7,536 | 19,141 | ||||||
Booking Holdings Inc * | 1,620 | 4,996 | ||||||
Chewy Inc, Cl A * | 25,244 | 461 | ||||||
Coupang Inc, Cl A * | 93,526 | 1,590 | ||||||
Deckers Outdoor Corp * | 173 | 89 | ||||||
DR Horton Inc | 42,185 | 4,534 | ||||||
DraftKings Inc, Cl A * | 164,962 | 4,856 | ||||||
Etsy Inc * | 3,075 | 199 | ||||||
Expedia Group Inc * | 1,339 | 138 | ||||||
Genuine Parts Co | 26,103 | 3,769 | ||||||
H&R Block Inc | 9,441 | 406 | ||||||
Home Depot Inc/The | 10,188 | 3,078 | ||||||
Lennar Corp, Cl B | 1,853 | 189 | ||||||
Lowe's Cos Inc | 57,464 | 11,943 | ||||||
Marriott International Inc/MD, Cl A | 3,820 | 751 | ||||||
MercadoLibre Inc * | 4,967 | 6,298 | ||||||
Meritage Homes Corp | 6,295 | 770 | ||||||
MGM Resorts International * | 58,387 | 2,146 | ||||||
Mobileye Global Inc, Cl A * | 81,115 | 3,370 | ||||||
Description | Shares | Market Value | ||||||
COMMON STOCK†† (continued) | ||||||||
Mohawk Industries Inc * | 1,487 | $ | 128 | |||||
NIKE Inc, Cl B | 60,595 | 5,794 | ||||||
Norwegian Cruise Line Holdings Ltd * | 21,889 | 361 | ||||||
O'Reilly Automotive Inc * | 7,922 | 7,200 | ||||||
PulteGroup Inc | 54,910 | 4,066 | ||||||
Royal Caribbean Cruises Ltd * | 2,012 | 185 | ||||||
Skechers USA Inc, Cl A * | 32,016 | 1,567 | ||||||
Taylor Morrison Home Corp, Cl A * | 18,463 | 787 | ||||||
Tesla Inc * | 58,244 | 14,574 | ||||||
TJX Cos Inc/The | 150,649 | 13,390 | ||||||
Toll Brothers Inc | 46,007 | 3,403 | ||||||
Trip.com Group Ltd ADR * | 86,894 | 3,039 | ||||||
| 174,300 | ||||||||
Consumer Staples — 4.2% | ||||||||
Celsius Holdings Inc * | 17,980 | 3,085 | ||||||
Coca-Cola Co/The | 75,660 | 4,236 | ||||||
Colgate-Palmolive Co | 126,272 | 8,979 | ||||||
Costco Wholesale Corp | 3,536 | 1,998 | ||||||
Coty Inc, Cl A * | 16,142 | 177 | ||||||
Kenvue Inc | 225,765 | 4,533 | ||||||
Kraft Heinz Co/The | 59,538 | 2,003 | ||||||
Lamb Weston Holdings Inc | 55,226 | 5,106 | ||||||
Mondelez International Inc, Cl A | 98,641 | 6,846 | ||||||
PepsiCo Inc | 111,887 | 18,958 | ||||||
Walmart Inc | 958 | 153 | ||||||
| 56,074 | ||||||||
Energy — 1.3% | ||||||||
EOG Resources Inc | 45,649 | 5,786 | ||||||
EQT Corp | 9,238 | 375 | ||||||
PBF Energy Inc, Cl A | 38,514 | 2,062 | ||||||
Schlumberger NV, Cl A | 111,197 | 6,483 | ||||||
Southwestern Energy Co * | 200,758 | 1,295 | ||||||
TechnipFMC PLC | 7,165 | 146 | ||||||
Transocean Ltd * | 193,459 | 1,588 | ||||||
| 17,735 | ||||||||
Financials — 9.1% | ||||||||
Apollo Global Management Inc | 36,181 | 3,248 | ||||||
Bank of America Corp | 94,551 | 2,589 | ||||||
BlackRock Inc | 1,784 | 1,153 | ||||||
Block Inc, Cl A * | 32,003 | 1,416 | ||||||
Citigroup Inc | 7,309 | 301 | ||||||
CME Group Inc, Cl A | 79,658 | 15,949 | ||||||
Comerica Inc | 59,823 | 2,486 | ||||||
Corebridge Financial Inc | 74,387 | 1,469 | ||||||
FactSet Research Systems Inc | 21,024 | 9,193 | ||||||
Fidelity National Information Services Inc, Cl B | 2,591 | 143 | ||||||
First Horizon Corp | 99,100 | 1,092 | ||||||
JPMorgan Chase & Co | 19,185 | 2,782 | ||||||
Kinsale Capital Group Inc | 2,062 | 854 | ||||||
Mastercard Inc, Cl A | 45,899 | 18,172 | ||||||
SEI Institutional Managed Trust
75
SCHEDULE OF INVESTMENTS
September 30, 2023
Large Cap Growth Fund (Continued)
Description | Shares | Market Value | ||||||
COMMON STOCK†† (continued) | ||||||||
Moody's Corp | 56,109 | $ | 17,740 | |||||
MSCI Inc, Cl A | 22,296 | 11,440 | ||||||
Rocket Cos Inc, Cl A * | 86,582 | 708 | ||||||
S&P Global Inc | 29,839 | 10,903 | ||||||
Shift4 Payments Inc, Cl A * | 5,335 | 295 | ||||||
Synchrony Financial | 4,438 | 136 | ||||||
Unum Group | 56,598 | 2,784 | ||||||
Visa Inc, Cl A | 69,839 | 16,064 | ||||||
Wells Fargo & Co | 7,416 | 303 | ||||||
| 121,220 | ||||||||
Health Care — 10.9% | ||||||||
AbbVie Inc | 7,433 | 1,108 | ||||||
Acadia Healthcare Co Inc, Cl A * | 55,112 | 3,875 | ||||||
AstraZeneca PLC ADR | 55,109 | 3,732 | ||||||
Becton Dickinson & Co | 33,516 | 8,665 | ||||||
Boston Scientific Corp * | 93,898 | 4,958 | ||||||
Cardinal Health Inc | 18,584 | 1,613 | ||||||
Cigna Group/The | 3,615 | 1,034 | ||||||
CVS Health Corp | 2,303 | 161 | ||||||
Danaher Corp, Cl A | 17,668 | 4,383 | ||||||
Dexcom Inc * | 7,091 | 661 | ||||||
Doximity Inc, Cl A * | 49,526 | 1,051 | ||||||
Edwards Lifesciences Corp, Cl A * | 3,462 | 240 | ||||||
Eli Lilly & Co | 30,145 | 16,192 | ||||||
Exact Sciences Corp * | 6,631 | 452 | ||||||
Gilead Sciences Inc | 2,479 | 186 | ||||||
Humana Inc | 17,193 | 8,365 | ||||||
Intuitive Surgical Inc * | 4,684 | 1,369 | ||||||
Johnson & Johnson | 76,698 | 11,946 | ||||||
McKesson Corp | 28,272 | 12,294 | ||||||
Medpace Holdings Inc * | 763 | 185 | ||||||
Mettler-Toledo International Inc * | 4,953 | 5,488 | ||||||
Natera Inc * | 138,997 | 6,151 | ||||||
Neurocrine Biosciences Inc * | 1,358 | 153 | ||||||
Penumbra Inc * | 6,973 | 1,687 | ||||||
Regeneron Pharmaceuticals Inc * | 870 | 716 | ||||||
Tenet Healthcare Corp * | 7,093 | 467 | ||||||
TransMedics Group Inc * | 98,798 | 5,409 | ||||||
UnitedHealth Group Inc | 69,382 | 34,982 | ||||||
Universal Health Services Inc, Cl B | 3,256 | 409 | ||||||
Vaxcyte Inc * | 66,530 | 3,392 | ||||||
Vertex Pharmaceuticals Inc * | 13,046 | 4,536 | ||||||
| 145,860 | ||||||||
Industrials — 7.6% | ||||||||
3M Co | 7,272 | 681 | ||||||
AMETEK Inc | 12,211 | 1,804 | ||||||
Automatic Data Processing Inc | 878 | 211 | ||||||
Axon Enterprise Inc * | 9,125 | 1,816 | ||||||
Boeing Co/The * | 2,862 | 549 | ||||||
Builders FirstSource Inc * | 46,014 | 5,728 | ||||||
Carrier Global Corp | 188,395 | 10,399 | ||||||
Description | Shares | Market Value | ||||||
COMMON STOCK†† (continued) | ||||||||
Caterpillar Inc, Cl A | 16,229 | $ | 4,431 | |||||
Ceridian HCM Holding Inc * | 32,250 | 2,188 | ||||||
Cintas Corp | 444 | 214 | ||||||
Copart Inc * | 6,672 | 288 | ||||||
Eaton Corp PLC | 14,363 | 3,063 | ||||||
Fortune Brands Innovations Inc | 36,548 | 2,272 | ||||||
GFL Environmental Inc | 267,076 | 8,482 | ||||||
Graco Inc | 106,207 | 7,740 | ||||||
Lockheed Martin Corp | 6,451 | 2,638 | ||||||
Middleby Corp/The * | 56,329 | 7,210 | ||||||
NEXTracker Inc, Cl A * | 3,165 | 127 | ||||||
nVent Electric PLC | 25,023 | 1,326 | ||||||
Otis Worldwide Corp | 89,773 | 7,210 | ||||||
Owens Corning | 1,322 | 180 | ||||||
Parker-Hannifin Corp, Cl A | 12,064 | 4,699 | ||||||
Paylocity Holding Corp * | 3,479 | 632 | ||||||
Republic Services Inc | 18,694 | 2,664 | ||||||
RTX Corp | 30,047 | 2,162 | ||||||
Saia Inc * | 1,406 | 561 | ||||||
Trane Technologies PLC | 23,384 | 4,745 | ||||||
TransDigm Group Inc * | 10,955 | 9,237 | ||||||
Vertiv Holdings Co, Cl A | 64,253 | 2,390 | ||||||
WESCO International Inc | 7,055 | 1,015 | ||||||
Westinghouse Air Brake Technologies Corp | 44,777 | 4,758 | ||||||
| 101,420 | ||||||||
Information Technology — 36.8% | ||||||||
Adobe Inc * | 40,615 | 20,710 | ||||||
Advanced Micro Devices Inc * | 23,334 | 2,399 | ||||||
Allegro MicroSystems Inc * | 39,065 | 1,248 | ||||||
Analog Devices Inc | 62,341 | 10,915 | ||||||
Apple Inc | 603,623 | 103,346 | ||||||
Applied Materials Inc | 31,113 | 4,308 | ||||||
AppLovin Corp, Cl A * | 14,284 | 571 | ||||||
Arista Networks Inc * | 57,918 | 10,653 | ||||||
Autodesk Inc, Cl A * | 16,602 | 3,435 | ||||||
Broadcom Inc | 12,145 | 10,087 | ||||||
Cadence Design Systems Inc * | 36,015 | 8,438 | ||||||
Crowdstrike Holdings Inc, Cl A * | 21,855 | 3,658 | ||||||
Datadog Inc, Cl A * | 32,459 | 2,957 | ||||||
DocuSign Inc, Cl A * | 22,594 | 949 | ||||||
Dropbox Inc, Cl A * | 1,946 | 53 | ||||||
Fair Isaac Corp * | 5,771 | 5,012 | ||||||
Fortinet Inc * | 20,213 | 1,186 | ||||||
Guidewire Software Inc, Cl Z * | 25,608 | 2,305 | ||||||
Hewlett Packard Enterprise Co | 30,465 | 529 | ||||||
HubSpot Inc * | 11,996 | 5,908 | ||||||
Intel Corp | 8,701 | 309 | ||||||
Intuit Inc | 18,738 | 9,574 | ||||||
Jabil Inc | 46,085 | 5,848 | ||||||
Keysight Technologies Inc * | 885 | 117 | ||||||
KLA Corp | 14,990 | 6,875 | ||||||
Manhattan Associates Inc * | 13,173 | 2,604 | ||||||
76
SEI Institutional Managed Trust
Description | Shares | Market Value | ||||||
COMMON STOCK†† (continued) | ||||||||
Marvell Technology Inc | 135,269 | $ | 7,322 | |||||
Microsoft Corp | 461,400 | 145,687 | ||||||
MongoDB Inc, Cl A * | 548 | 190 | ||||||
NVIDIA Corp | 151,930 | 66,088 | ||||||
ON Semiconductor Corp * | 97,742 | 9,085 | ||||||
Oracle Corp, Cl B | 148,966 | 15,778 | ||||||
Palo Alto Networks Inc * | 22,875 | 5,363 | ||||||
Pegasystems Inc | 20,607 | 895 | ||||||
Salesforce Inc * | 1,471 | 298 | ||||||
ServiceNow Inc * | 11,017 | 6,158 | ||||||
Snowflake Inc, Cl A * | 2,989 | 457 | ||||||
Taiwan Semiconductor Manufacturing Co Ltd ADR | 56,210 | 4,885 | ||||||
TE Connectivity Ltd | 9,088 | 1,123 | ||||||
Tenable Holdings Inc * | 23,203 | 1,039 | ||||||
Teradata Corp * | 19,920 | 897 | ||||||
Teradyne Inc | 12,221 | 1,228 | ||||||
UiPath Inc, Cl A * | 90,732 | 1,552 | ||||||
| 492,039 | ||||||||
Materials — 2.4% | ||||||||
Air Products and Chemicals Inc | 6,461 | 1,831 | ||||||
Ecolab Inc | 4,671 | 791 | ||||||
Linde PLC | 34,896 | 12,994 | ||||||
Martin Marietta Materials Inc, Cl A | 15,492 | 6,359 | ||||||
Nucor Corp | 812 | 127 | ||||||
Sherwin-Williams Co/The, Cl A | 34,927 | 8,908 | ||||||
Steel Dynamics Inc | 6,794 | 729 | ||||||
| 31,739 | ||||||||
Description | Shares | Market Value | ||||||
COMMON STOCK†† (continued) | ||||||||
Real Estate — 0.4% | ||||||||
Brixmor Property Group Inc ‡ | 26,675 | $ | 554 | |||||
EastGroup Properties Inc ‡ | 12,115 | 2,018 | ||||||
Federal Realty Investment Trust ‡ | 4,696 | 426 | ||||||
STAG Industrial Inc ‡ | 57,873 | 1,997 | ||||||
| 4,995 | ||||||||
Total Common Stock | ||||||||
(Cost $713,485) ($ Thousands) | 1,286,190 | |||||||
| ||||||||
U.S. TREASURY OBLIGATION — 2.6% | ||||||||
United States Treasury Bill | ||||||||
5.330%, 11/30/2023 (A) | $ | 35,500 | 35,190 | |||||
Total U.S. Treasury Obligation | ||||||||
(Cost $35,189) ($ Thousands) | 35,190 | |||||||
| ||||||||
CASH EQUIVALENT — 1.3% | ||||||||
SEI Daily Income Trust, Government Fund, Institutional Class | ||||||||
5.210%**† | 16,819,241 | 16,819 | ||||||
Total Cash Equivalent | ||||||||
(Cost $16,819) ($ Thousands) | 16,819 | |||||||
Total Investments in Securities — 100.1% | ||||||||
(Cost $765,493) ($ Thousands) | $ | 1,338,199 | ||||||
A list of the open futures contracts held at September 30, 2023 is as follows:
Type of Contract | Number of | Expiration Date | Notional Amount (Thousands) | Value | Unrealized Appreciation/ | |||||||||||||||
Long Contracts | ||||||||||||||||||||
Russell 2000 Index E-MINI | 7 | Dec-2023 | $ | 628 | $ | 630 | $ | 2 | ||||||||||||
S&P 500 Index E-MINI | 38 | Dec-2023 | 8,287 | 8,218 | (69 | ) | ||||||||||||||
S&P Mid Cap 400 Index E-MINI | 2 | Dec-2023 | 503 | 504 | 1 | |||||||||||||||
| $ | 9,418 | $ | 9,352 | $ | (66 | ) | ||||||||||||||
SEI Institutional Managed Trust
77
SCHEDULE OF INVESTMENTS
September 30, 2023
Large Cap Growth Fund (Continued)
A list of the open OTC swap agreements held by the Fund at September 30, 2023, is as follows:
Total Return Swap | ||||||||||||||||||||||||||||||||||||||||
Counterparty | Reference Entity/ Obligation | Fund Pays | Fund Receives | Payment Frequency | Termination Date | Currency | Notional | Value | Upfront Payments/ | Net Unrealized | ||||||||||||||||||||||||||||||
Bank of America NA | United States Custom Basket of Securities | New York Federal Overnight Bank Fund Rate + 0.40% | Asset Returns | Annually | 04/15/2025 | USD | 38,311 | $ | (696 | ) | $ | – | $ | (696 | ) | |||||||||||||||||||||||||
| $ | (696 | ) | $ | – | $ | (696 | ) | |||||||||||||||||||||||||||||||||
The following table represents the top 50 individual stock exposures or those exceeding 1% of the Custom Basket Total Return Swap as of September 30, 2023:
United States Custom Basket of Long Securities
Shares | Description | Notional Amount (Thousands) | Value (Thousands) | Percentage of Basket | ||||||||||||
| 6,416 | LAM RESEARCH CORP REGISTERED SHS | $ | 3,998 | $ | 27,156 | 10.4 | % | |||||||||
| 18,179 | ATLASSIAN CORP REGISTERED SHS -A- | 3,691 | (38,030 | ) | 9.6 | |||||||||||
| 6,898 | UNITED RENTALS INC REGISTERED SHS | 3,118 | (60,298 | ) | 8.1 | |||||||||||
| 26,535 | AGILENT TECHNOLOGIES INC REGISTERED SHS | 3,076 | (117,264 | ) | 8.0 | |||||||||||
| 25,760 | SIMON PROPERTY GROUP INC REGISTERED SHS | 2,999 | (174,773 | ) | 7.8 | |||||||||||
| 89,139 | VISTRA CORP REGISTERED SHS | 2,934 | 38,941 | 7.7 | ||||||||||||
| 14,662 | EQUIFAX INC REGISTERED SHS | 2,886 | (209,593 | ) | 7.5 | |||||||||||
| 11,978 | WORKDAY INC SHS -A- | 2,885 | (319,866 | ) | 7.5 | |||||||||||
| 8,380 | GOLDMAN SACHS GROUP INC REGISTERED SHS | 2,870 | (143,896 | ) | 7.5 | |||||||||||
| 26,682 | EXPEDIA GROUP INC REGISTERED SHS | 2,853 | (111,342 | ) | 7.4 | |||||||||||
| 24,194 | INTERCONTINENTAL EXCHANGE INC REGISTERED SHS | 2,800 | (135,934 | ) | 7.3 | |||||||||||
| 76,710 | PURE STORAGE INC REGISTERED SHS -A- | 2,781 | (56,001 | ) | 7.3 | |||||||||||
| 39,181 | CVS HEALTH CORP REGISTERED SHS | 2,777 | (47,317 | ) | 7.2 | |||||||||||
| 18,890 | CLOROX CO REGISTERED SHS | 2,762 | (308,652 | ) | 7.2 | |||||||||||
| 38,512 | EDISON INTERNATIONAL REGISTERED SHS | 2,756 | (298,347 | ) | 7.2 | |||||||||||
| 83,198 | SYNCHRONY FINANCIAL REGISTERED SHS | 2,706 | (168,255 | ) | 7.1 | |||||||||||
| 24,794 | ALLSTATE CORP REGISTERED SHS | 2,697 | 83,596 | 7.0 | ||||||||||||
| 76,165 | INVITATION HOMES INC REGISTERED SHS | 2,688 | (283,295 | ) | 7.0 | |||||||||||
| 27,328 | ROYAL CARIBBEAN CRUISES LTD (DOING BUSINESS AS ROY | 2,662 | (150,214 | ) | 6.9 | |||||||||||
| 14,476 | AVALONBAY COMMUNITIES INC REGISTERED SHS | 2,662 | (159,362 | ) | 6.9 | |||||||||||
| 35,086 | GODADDY INC REGISTERED SHS -A- | 2,659 | (52,956 | ) | 6.9 | |||||||||||
| 61,702 | CITIGROUP INC REGISTERED SHS | 2,635 | (103,351 | ) | 6.9 | |||||||||||
| 95,871 | DROPBOX INC REGISTERED SHS -A- | 2,584 | 21,097 | 6.7 | ||||||||||||
| 67,254 | INTEL CORP REGISTERED SHS | 2,548 | (166,474 | ) | 6.6 | |||||||||||
| 15,302 | TRAVELERS COMPANIES INC REGISTERED SHS | 2,522 | (12,203 | ) | 6.6 | |||||||||||
| 28,367 | CARDINAL HEALTH INC REGISTERED SHS | 2,489 | (31,918 | ) | 6.5 | |||||||||||
| 11,046 | ESSEX PROPERTY TRUST REGISTERED SHS | 2,488 | (126,726 | ) | 6.5 | |||||||||||
| 210,885 | KEYCORP REGISTERED SHS | 2,472 | (218,644 | ) | 6.4 | |||||||||||
| 11,539 | BOEING CO REGISTERED SHS | 2,401 | (194,928 | ) | 6.3 | |||||||||||
| 9,548 | VERISK ANALYTICS INC REGISTERED SHS | 2,345 | (92,354 | ) | 6.1 | |||||||||||
| 29,904 | PULTEGROUP INC REGISTERED SHS | 2,281 | (66,676 | ) | 6.0 | |||||||||||
| 18,389 | AGCO CORP REGISTERED SHS | 2,260 | (91,587 | ) | 5.9 | |||||||||||
| 63,129 | NUTANIX INC REGISTERED SHS -A- | 2,234 | (37,505 | ) | 5.8 | |||||||||||
| 47,571 | VENTAS INC REGISTERED SHS | 2,123 | (133,636 | ) | 5.5 | |||||||||||
| 26,205 | TOLL BROTHERS INC REGISTERED SHS | 2,041 | (107,001 | ) | 5.3 | |||||||||||
| 208,209 | VIATRIS INC REGISTERED SHS | 2,034 | 13,729 | 5.3 | ||||||||||||
| 34,282 | ALLISON TRANSMISSION HOLDINGS INC REGISTERED SHS | 2,033 | (12,536 | ) | 5.3 | |||||||||||
| 98,743 | NEWS CORP REGISTERED SHS -A- | 2,003 | (17,115 | ) | 5.2 | |||||||||||
| 101,314 | LIBERTY GLOBAL PLC REGISTERED SHS -C- | 1,992 | (115,876 | ) | 5.2 | |||||||||||
| 25,464 | TEXTRON INC REGISTERED SHS | 1,941 | 45,929 | 5.1 | ||||||||||||
| 23,839 | ELASTIC N.V. BEARER AND REGISTERED SHARES | 1,866 | 71,317 | 4.9 | ||||||||||||
| 108,252 | NORWEGIAN CRUISE LINE HOLDINGS LTD REGISTERED SHS | 1,865 | (85,338 | ) | 4.9 | |||||||||||
| 38,526 | UBER TECHNOLOGIES INC REGISTERED SHS | 1,831 | (64,901 | ) | 4.8 | |||||||||||
| 50,386 | DENTSPLY SIRONA INC REGISTERED SHS | 1,791 | (67,790 | ) | 4.7 | |||||||||||
78
SEI Institutional Managed Trust
Shares | Description | Notional Amount (Thousands) | Value (Thousands) | Percentage of Basket | ||||||||||||
| 15,380 | LENNAR CORP REGISTERED SHS -A- | $ | 1,765 | $ | (43,169 | ) | 4.6 | % | ||||||||
| 4,639 | EVEREST GROUP LTD REGISTERED SHS | 1,759 | (11,620 | ) | 4.6 | |||||||||||
| 43,048 | US FOODS HOLDING CORP REGISTERED SHS | 1,747 | (42,322 | ) | 4.6 | |||||||||||
| 24,028 | MICRON TECHNOLOGY INC REGISTERED SHS | 1,679 | (48,590 | ) | 4.4 | |||||||||||
| 2,402 | CABLE ONE INC REGISTERED SHS | 1,492 | (16,341 | ) | 3.9 | |||||||||||
| 23,575 | INCYTE CORP REGISTERED SHS | 1,475 | (117,615 | ) | 3.8 | |||||||||||
| 95,407 | CARNIVAL CORPORATION SHS | 1,449 | (143,472 | ) | 3.8 | |||||||||||
| 7,878 | SNOWFLAKE INC REGISTERED SHS -A- | 1,279 | (78,790 | ) | 3.3 | |||||||||||
| 60,475 | TECHNIPFMC PLC REGISTERED SHS | 1,262 | (34,253 | ) | 3.3 | |||||||||||
| 30,014 | SMARTSHEET INC REGISTERED SHS -A- | 1,261 | (50,861 | ) | 3.3 | |||||||||||
| 57,406 | EXELIXIS INC REGISTERED SHS | 1,252 | (811 | ) | 3.3 | |||||||||||
| 3,386 | MONGODB INC REGISTERED SHS -A- | 1,226 | (59,212 | ) | 3.2 | |||||||||||
| 165,924 | ADT INC REGISTERED SHS | 1,012 | (13,451 | ) | 2.6 | |||||||||||
| 10,354 | MOHAWK INDUSTRIES INC REGISTERED SHS | 969 | (84,118 | ) | 2.5 | |||||||||||
| 2,355 | NETFLIX INC REGISTERED SHS | 935 | (49,579 | ) | 2.4 | |||||||||||
| 13,078 | CENTENE CORP REGISTERED SHS | 887 | 15,957 | 2.3 | ||||||||||||
| 74,227 | COTY INC REGISTERED SHS -A- | 884 | (71,740 | ) | 2.3 | |||||||||||
| 3,988 | UNITED THERAPEUTICS CORP REGISTERED SHS | 878 | 20,636 | 2.3 | ||||||||||||
| 25,691 | THE KRAFT HEINZ COMPANY REGISTERED SHS | 859 | 14,642 | 2.2 | ||||||||||||
| 8,700 | WYNN RESORTS LTD REGISTERED SHS | 844 | (53,462 | ) | 2.2 | |||||||||||
| 26,982 | ALKERMES PLC REGISTERED SHS | 799 | (44,937 | ) | 2.1 | |||||||||||
| 7,078 | D.R. HORTON INC REGISTERED SHS | 795 | (36,451 | ) | 2.1 | |||||||||||
| 6,430 | GENERAL ELECTRIC CO REGISTERED SHS | 743 | (33,336 | ) | 1.9 | |||||||||||
| 5,701 | SAREPTA THERAPEUTICS INC REGISTERED SHS | 675 | 14,696 | 1.8 | ||||||||||||
| 4,163 | ZSCALER INC REGISTERED SHS | 650 | (3,862 | ) | 1.7 | |||||||||||
| 11,113 | PBF ENERGY INC REGISTERED SHS -A- | 599 | (5,787 | ) | 1.6 | |||||||||||
| 3,764 | NUCOR CORP REGISTERED SHS | 585 | 4,119 | 1.5 | ||||||||||||
| 12,644 | EBAY INC REGISTERED SHS | 563 | (7,485 | ) | 1.5 | |||||||||||
| 4,876 | NEUROCRINE BIOSCIENCES INC REGISTERED SHS | 548 | (976 | ) | 1.4 | |||||||||||
| 29,642 | ZOOMINFO TECHNOLOGIES INC REGISTERED SHS -A- | 510 | (27,967 | ) | 1.3 | |||||||||||
| 10,883 | TAYLOR MORRISON HOME CORPORATION REGISTERED SHS | 486 | (24,579 | ) | 1.3 | |||||||||||
| 663 | BLACKROCK INC REGISTERED SHS | 462 | (32,699 | ) | 1.2 | |||||||||||
| 17,499 | PINTEREST INC REGISTERED SHS -A- | 450 | 27,015 | 1.2 | ||||||||||||
| 161 | AUTOZONE INC REGISTERED SHS | 407 | 830 | 1.1 | ||||||||||||
United States Custom Basket of Short Securities
Shares | Description | Notional Amount (Thousands) | Value (Thousands) | Percentage of Basket | ||||||||||||
| (16,662 | ) | CELANESE CORP REGISTERED SHS | $ | (2,137 | ) | $ | 51 | (5.6 | )% | |||||||
| (17,283 | ) | EXXON MOBIL CORP REGISTERED SHS | (2,017 | ) | (11 | ) | (5.3 | ) | ||||||||
| (18,163 | ) | RAYMOND JAMES FINANCIAL INC REGISTERED SHS | (1,956 | ) | 129 | (5.1 | ) | |||||||||
| (13,453 | ) | WILLIAMS-SONOMA INC REGISTERED SHS | (1,937 | ) | (163 | ) | (5.1 | ) | ||||||||
| (29,873 | ) | KKR & CO INC REGISTERED SHS | (1,924 | ) | 88 | (5.0 | ) | |||||||||
| (69,517 | ) | FIFTH THIRD BANCORP REGISTERED SHS | (1,908 | ) | 128 | (5.0 | ) | |||||||||
| (7,237 | ) | ICON PLC REGISTERED SHS | (1,894 | ) | 117 | (4.9 | ) | |||||||||
| (11,940 | ) | FIVE BELOW INC REGISTERED SHS | (1,875 | ) | (41 | ) | (4.9 | ) | ||||||||
| (50,636 | ) | ZIONS BANCORPORATION NA REGISTERED SHS | (1,869 | ) | 109 | (4.9 | ) | |||||||||
| (104,088 | ) | REGIONS FINANCIAL CORP REGISTERED SHS | (1,869 | ) | 59 | (4.9 | ) | |||||||||
| (28,151 | ) | HASBRO INC REGISTERED SHS | (1,868 | ) | 11 | (4.9 | ) | |||||||||
| (13,418 | ) | AMERICAN WATER WORKS CO INC REGISTERED SHS | (1,864 | ) | 207 | (4.9 | ) | |||||||||
| (15,037 | ) | CONOCOPHILLIPS REGISTERED SHS | (1,858 | ) | 52 | (4.8 | ) | |||||||||
| (14,463 | ) | PNC FINANCIAL SERVICES GROUP INC REGISTERED SHS | (1,827 | ) | 57 | (4.8 | ) | |||||||||
| (29,004 | ) | W.P. CAREY INC REGISTERED SHS | (1,822 | ) | 232 | (4.8 | ) | |||||||||
| (151,737 | ) | NEW YORK COMMUNITY BANCORP INC REGISTERED SHS | (1,735 | ) | 16 | (4.5 | ) | |||||||||
| (9,932 | ) | FIRST SOLAR INC REGISTERED SHS | (1,729 | ) | 129 | (4.5 | ) | |||||||||
| (21,652 | ) | COSTAR GROUP INC REGISTERED SHS | (1,713 | ) | 52 | (4.5 | ) | |||||||||
| (23,492 | ) | NORTHERN TRUST CORP REGISTERED SHS | (1,708 | ) | 63 | (4.5 | ) | |||||||||
| (13,486 | ) | SUN COMMUNITIES INC REGISTERED SHS | (1,696 | ) | 91 | (4.4 | ) | |||||||||
| (10,831 | ) | JACK HENRY & ASSOCIATES INC REGISTERED SHS | (1,673 | ) | 35 | (4.4 | ) | |||||||||
| (101,812 | ) | SPIRIT AEROSYSTEMS HOLDINGS INC SHS -A- | (1,631 | ) | (7 | ) | (4.3 | ) | ||||||||
SEI Institutional Managed Trust
79
SCHEDULE OF INVESTMENTS
September 30, 2023
Large Cap Growth Fund (Concluded)
Shares | Description | Notional Amount (Thousands) | Value (Thousands) | Percentage of Basket | ||||||||||||
| (30,017 | ) | REALTY INCOME CORP REGISTERED SHS | $ | (1,624 | ) | $ | 121 | (4.2) | % | |||||||
| (9,298 | ) | CHART INDUSTRIES INC REGISTERED SHS | (1,595 | ) | 26 | (4.2 | ) | |||||||||
| (7,075 | ) | MARKETAXESS HOLDING INC REGISTERED SHS | (1,589 | ) | 82 | (4.1 | ) | |||||||||
| (4,225 | ) | TYLER TECHNOLOGIES INC REGISTERED SHS | (1,586 | ) | (43 | ) | (4.1 | ) | ||||||||
| (17,247 | ) | LIBERTY BROADBAND CORP REGISTERED SHS SERIES -C- | (1,584 | ) | 11 | (4.1 | ) | |||||||||
| (86,715 | ) | VF CORP REGISTERED SHS | (1,575 | ) | 18 | (4.1 | ) | |||||||||
| (16,933 | ) | ENTEGRIS INC REGISTERED SHS | (1,558 | ) | (29 | ) | (4.1 | ) | ||||||||
| (7,830 | ) | ASPEN TECHNOLOGY INC REGISTERED SHS | (1,544 | ) | (52 | ) | (4.0 | ) | ||||||||
| (23,712 | ) | TREX COMPANY INC REGISTERED SHS | (1,539 | ) | 81 | (4.0 | ) | |||||||||
| (10,919 | ) | SOLAREDGE TECHNOLOGIES INC REGISTERED SHS | (1,532 | ) | 127 | (4.0 | ) | |||||||||
| (15,805 | ) | CULLEN/FROST BANKERS INC REGISTERED SHS | (1,518 | ) | 80 | (4.0 | ) | |||||||||
| (54,491 | ) | HP INC REGISTERED SHS | (1,490 | ) | 78 | (3.9 | ) | |||||||||
| (6,040 | ) | RBC BEARINGS INC REGISTERED SHS | (1,451 | ) | 40 | (3.8 | ) | |||||||||
| (24,337 | ) | AGREE REALTY CORP REGISTERED SHS | (1,447 | ) | 101 | (3.8 | ) | |||||||||
| (45,260 | ) | NEW FORTRESS ENERGY INC REGISTERED SHS -A- | (1,426 | ) | (59 | ) | (3.7 | ) | ||||||||
| (37,632 | ) | ESSENTIAL UTILITIES INC REGISTERED SHS | (1,419 | ) | 130 | (3.7 | ) | |||||||||
| (3,436 | ) | SAIA INC REGISTERED SHS | (1,398 | ) | 32 | (3.6 | ) | |||||||||
| (84,020 | ) | HEALTHCARE REALTY TRUST INCORPORATED SHS -A- | (1,387 | ) | 108 | (3.6 | ) | |||||||||
| (11,713 | ) | GENERAC HOLDINGS INC REGISTERED SHS | (1,308 | ) | 35 | (3.4 | ) | |||||||||
| (22,844 | ) | PROSPERITY BANCSHARES INC REGISTERED SHS | (1,299 | ) | 43 | (3.4 | ) | |||||||||
| (13,002 | ) | LAMB WESTON HOLDINGS INC REGISTERED SHS | (1,295 | ) | 96 | (3.4 | ) | |||||||||
| (10,611 | ) | CHURCHILL DOWNS INC REGISTERED SHS | (1,269 | ) | 41 | (3.3 | ) | |||||||||
| (171,710 | ) | NU HOLDINGS LIMITED REGISTERED SHS -A- | (1,264 | ) | 23 | (3.3 | ) | |||||||||
| (148,142 | ) | PLUG POWER INC REGISTERED SHS | (1,262 | ) | 141 | (3.3 | ) | |||||||||
| (5,150 | ) | PIONEER NATURAL RESOURCES COMPANY REGISTERED SHS | (1,205 | ) | 16 | (3.1 | ) | |||||||||
| (24,158 | ) | COMMERCE BANCSHARES INC REGISTERED SHS | (1,172 | ) | 9 | (3.1 | ) | |||||||||
| (21,121 | ) | INTRA-CELLULAR THERAPIES INC REGISTERED SHS | (1,162 | ) | 65 | (3.0 | ) | |||||||||
| (4,055 | ) | ERIE INDEMNITY CO SHS -A- | (1,158 | ) | (32 | ) | (3.0 | ) | ||||||||
| (21,094 | ) | NOBLE CORPORATION PLC REGISTERED SHS -A- | (1,118 | ) | 74 | (2.9 | ) | |||||||||
| (20,898 | ) | IAC INC REGISTERED SHS | (1,105 | ) | 55 | (2.9 | ) | |||||||||
| (5,568 | ) | CELSIUS HOLDINGS INC REGISTERED SHS | (1,100 | ) | 147 | (2.9 | ) | |||||||||
| (2,142 | ) | ROPER TECHNOLOGIES INC REGISTERED SHS | (1,062 | ) | 27 | (2.8 | ) | |||||||||
| (5,256 | ) | PRIMERICA INC REGISTERED SHS | (1,058 | ) | 41 | (2.8 | ) | |||||||||
| (6,137 | ) | SPS COMMERCE INC REGISTERED SHS | (1,080 | ) | 35 | (2.8 | ) | |||||||||
| (5,267 | ) | GLOBANT S.A. REGISTERED SHS | (1,057 | ) | 17 | (2.8 | ) | |||||||||
| (19,006 | ) | THE SCOTTS MIRACLE-GRO CO SHS -A- | (1,046 | ) | 67 | (2.7 | ) | |||||||||
| (28,102 | ) | SPIRIT REALTY CAPITAL INC REGISTERED SHS | (1,023 | ) | 65 | (2.7 | ) | |||||||||
| (5,763 | ) | LANCASTER COLONY CORP REGISTERED SHS | (994 | ) | 40 | (2.6 | ) | |||||||||
| (5,718 | ) | FABRINET BEARER SHS | (866 | ) | (86 | ) | (2.3 | ) | ||||||||
| (143,250 | ) | LUCID GROUP INC REGISTERED SHS | (848 | ) | 50 | (2.2 | ) | |||||||||
| (5,342 | ) | NOVANTA INC REGISTERED SHS | (837 | ) | 73 | (2.2 | ) | |||||||||
| (14,781 | ) | PARSONS CORPORATION REGISTERED SHS | (812 | ) | 9 | (2.1 | ) | |||||||||
| (4,642 | ) | MSA SAFETY INC REGISTERED SHS | (800 | ) | 71 | (2.1 | ) | |||||||||
| (8,699 | ) | BOK FINANCIAL CORP REGISTERED SHS | (726 | ) | 32 | (1.9 | ) | |||||||||
| (6,440 | ) | ROYAL GOLD INC REGISTERED SHS | (725 | ) | 42 | (1.9 | ) | |||||||||
| (3,963 | ) | KARUNA THERAPEUTICS INC REGISTERED SHS | (717 | ) | 49 | (1.9 | ) | |||||||||
| (6,342 | ) | DICK'S SPORTING GOODS INC REGISTERED SHS | (712 | ) | 25 | (1.9 | ) | |||||||||
| (9,360 | ) | BJ'S WHOLESALE CLUB HOLDINGS INC REGISTERED SHS | (683 | ) | 15 | (1.8 | ) | |||||||||
| (1,851 | ) | BERKSHIRE HATHAWAY INC REGISTERED SHS -B- | (681 | ) | 69 | (1.8 | ) | |||||||||
| (3,116 | ) | CHARLES RIVER LABORATORIES INTERNATIONAL INC REGIS | (648 | ) | 39 | (1.7 | ) | |||||||||
| (56,103 | ) | CCC INTELLIGENT SOLUTIONS HOLDINGS INC REGISTERED | (646 | ) | (102 | ) | (1.7 | ) | ||||||||
| (5,961 | ) | TEXAS ROADHOUSE INC REGISTERED SHS | (603 | ) | 29 | (1.6 | ) | |||||||||
| (12,610 | ) | WOLFSPEED INC REGISTERED SHS | (551 | ) | 72 | (1.4 | ) | |||||||||
| (44,862 | ) | ROIVANT SCIENCES LIMITED REGISTERED SHS | (506 | ) | (16 | ) | (1.3 | ) | ||||||||
| (11,689 | ) | WEBSTER FINANCIAL CORP (CONN) REGISTERED SHS | (487 | ) | 17 | (1.3 | ) | |||||||||
| (22,716 | ) | ANNALY CAPITAL MANAGEMENT INC REGISTERED SHS | (467 | ) | 26 | (1.2 | ) | |||||||||
| (1,998 | ) | STERIS PLC REGISTERED SHS | (459 | ) | 20 | (1.2 | ) | |||||||||
| (1,591 | ) | MEDPACE HOLDINGS INC REGISTERED SHS | (445 | ) | 143 | (1.2 | ) | |||||||||
80
SEI Institutional Managed Trust
| Percentages are based on Net Assets of $1,336,600 ($ Thousands). |
* | Non-income producing security. |
** | The rate reported is the 7-day effective yield as of September 30, 2023. |
† | Investment in Affiliated Security (see Note 6). |
†† | Narrow industries are utilized for compliance purposes, whereas broad sectors are utilized for reporting. |
‡ | Real Estate Investment Trust. |
(A) | Interest rate represents the security's effective yield at the time of purchase. |
The following is a summary of the level of inputs used as of September 30, 2023, in valuing the Fund's investments and other financial instruments carried at value ($ Thousands): | ||||||||||||||||
Investments in Securities | Level 1 | Level 2 | Level 3 | Total | ||||||||||||
Common Stock | 1,286,190 | – | – | 1,286,190 | ||||||||||||
U.S. Treasury Obligation | – | 35,190 | – | 35,190 | ||||||||||||
Cash Equivalent | 16,819 | – | – | 16,819 | ||||||||||||
Total Investments in Securities | 1,303,009 | 35,190 | – | 1,338,199 | ||||||||||||
Other Financial Instruments | Level 1 | Level 2 | Level 3 | Total | ||||||||||||
Futures Contracts* | ||||||||||||||||
Unrealized Appreciation | 3 | – | – | 3 | ||||||||||||
Unrealized Depreciation | (69 | ) | – | – | (69 | ) | ||||||||||
OTC Swap | ||||||||||||||||
Total Return Swap* | ||||||||||||||||
Unrealized Depreciation | – | (696 | ) | – | (696 | ) | ||||||||||
Total Other Financial Instruments | (66 | ) | (696 | ) | – | (762 | ) | |||||||||
* | Futures contracts and Swap contracts are valued at the unrealized appreciation (depreciation) on the instrument. |
For more information on valuation inputs, see Note 2 — Significant Accounting Policies in Notes to Financial Statements.
The following is a summary of the Fund’s transactions with affiliates for the year ended September 30, 2023, ($ Thousands):
Security Description | Value | Purchases | Proceeds | Realized Gain/(Loss) | Change in Unrealized Appreciation/(Depreciation) | Value | Income | Capital Gains | ||||||||||||||||||||||||
SEI Liquidity Fund, LP | $ | 45 | $ | 25,207 | $ | (25,252 | ) | $ | — | $ | — | $ | — | $ | 52 | $ | — | |||||||||||||||
SEI Daily Income Trust, Government Fund, | 13,898 | 304,067 | (301,146 | ) | — | — | 16,819 | 780 | — | |||||||||||||||||||||||
Totals | $ | 13,943 | $ | 329,274 | $ | (326,398 | ) | $ | – | $ | — | $ | 16,819 | $ | 832 | $ | — | |||||||||||||||
Amounts designated as “—” are either $0 or have been rounded to $0.
See “Glossary” for abbreviations.
The accompanying notes are an integral part of the financial statements.
SEI Institutional Managed Trust
81
SCHEDULE OF INVESTMENTS
September 30, 2023
Large Cap Index Fund
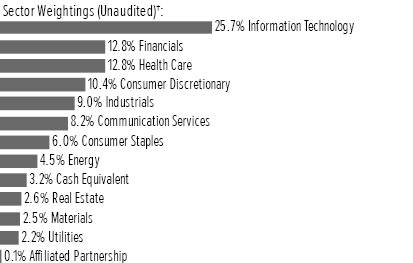
† | Percentages are based on total investments. Total investments do not include derivatives such as options, futures contracts, forward contract, and swap contracts, if applicable. |
Description | Shares | Market Value | ||||||
COMMON STOCK†† — 96.6% | ||||||||
Communication Services — 8.2% | ||||||||
Activision Blizzard Inc | 17,881 | $ | 1,674 | |||||
Alphabet Inc, Cl A * | 146,260 | 19,140 | ||||||
Alphabet Inc, Cl C * | 125,175 | 16,504 | ||||||
AMC Entertainment Holdings Inc, Cl A * | 1,563 | 13 | ||||||
AT&T Inc | 176,101 | 2,645 | ||||||
Cable One Inc | 138 | 85 | ||||||
Charter Communications Inc, Cl A * | 2,472 | 1,087 | ||||||
Comcast Corp, Cl A | 100,676 | 4,464 | ||||||
DISH Network Corp, Cl A * | 6,511 | 38 | ||||||
Electronic Arts Inc | 6,706 | 807 | ||||||
Fox Corp, Cl A | 6,431 | 201 | ||||||
Fox Corp, Cl B | 3,400 | 98 | ||||||
Frontier Communications Parent Inc * | 6,000 | 94 | ||||||
GCI Liberty Inc * | 2,200 | — | ||||||
IAC Inc * | 1,798 | 91 | ||||||
Interpublic Group of Cos Inc/The | 9,400 | 269 | ||||||
Iridium Communications Inc | 3,200 | 146 | ||||||
Liberty Broadband Corp, Cl A * | 400 | 36 | ||||||
Liberty Broadband Corp, Cl C * | 2,858 | 261 | ||||||
Liberty Media -Liberty Formula One, Cl A * | 500 | 28 | ||||||
Liberty Media -Liberty Formula One, Cl C * | 4,700 | 293 | ||||||
Liberty Media -Liberty Live, Cl A * | 521 | 17 | ||||||
Liberty Media -Liberty Live, Cl C * | 1,209 | 39 | ||||||
Liberty Media -Liberty SiriusXM * | 3,998 | 102 | ||||||
Liberty Media -Liberty SiriusXM, Cl A * | 2,000 | 51 | ||||||
Live Nation Entertainment Inc * | 3,790 | 315 | ||||||
Madison Square Garden Sports Corp | 496 | 87 | ||||||
Match Group Inc * | 6,799 | 266 | ||||||
Meta Platforms Inc, Cl A * | 54,474 | 16,354 | ||||||
Netflix Inc * | 10,829 | 4,089 | ||||||
New York Times Co/The, Cl A | 4,012 | 165 | ||||||
News Corp, Cl A | 9,400 | 189 | ||||||
News Corp, Cl B | 2,800 | 58 | ||||||
Description | Shares | Market Value | ||||||
COMMON STOCK†† (continued) | ||||||||
Nexstar Media Group Inc, Cl A | 800 | $ | 115 | |||||
Omnicom Group Inc | 4,826 | 359 | ||||||
Paramount Global, Cl A | 219 | 3 | ||||||
Paramount Global, Cl B | 14,353 | 185 | ||||||
Pinterest Inc, Cl A * | 14,776 | 399 | ||||||
Playtika Holding Corp * | 637 | 6 | ||||||
ROBLOX Corp, Cl A * | 11,200 | 324 | ||||||
Roku Inc, Cl A * | 3,045 | 215 | ||||||
Sirius XM Holdings Inc (A) | 16,018 | 72 | ||||||
Spotify Technology SA * | 3,460 | 535 | ||||||
Take-Two Interactive Software Inc, Cl A * | 4,104 | 576 | ||||||
TKO Group Holdings Inc | 1,100 | 93 | ||||||
T-Mobile US Inc | 13,114 | 1,837 | ||||||
Trade Desk Inc/The, Cl A * | 10,851 | 848 | ||||||
TripAdvisor Inc * | 2,600 | 43 | ||||||
Verizon Communications Inc | 103,479 | 3,354 | ||||||
Walt Disney Co/The * | 44,944 | 3,643 | ||||||
Warner Bros Discovery Inc * | 54,020 | 587 | ||||||
ZoomInfo Technologies Inc, Cl A * | 7,500 | 123 | ||||||
| 83,023 | ||||||||
Consumer Discretionary — 10.4% | ||||||||
ADT Inc | 5,828 | 35 | ||||||
Advance Auto Parts Inc | 1,517 | 85 | ||||||
Airbnb Inc, Cl A * | 10,000 | 1,372 | ||||||
Amazon.com Inc, Cl A * | 221,692 | 28,182 | ||||||
Aptiv PLC * | 6,653 | 656 | ||||||
Aramark | 5,891 | 204 | ||||||
AutoNation Inc * | 694 | 105 | ||||||
AutoZone Inc * | 453 | 1,151 | ||||||
Bath & Body Works Inc | 5,600 | 189 | ||||||
Best Buy Co Inc | 4,880 | 339 | ||||||
Booking Holdings Inc * | 934 | 2,880 | ||||||
BorgWarner Inc | 5,700 | 230 | ||||||
Boyd Gaming Corp | 1,800 | 110 | ||||||
Bright Horizons Family Solutions Inc * | 1,400 | 114 | ||||||
Brunswick Corp/DE | 1,800 | 142 | ||||||
Burlington Stores Inc * | 1,553 | 210 | ||||||
Caesars Entertainment Inc * | 5,000 | 232 | ||||||
Capri Holdings Ltd * | 2,800 | 147 | ||||||
CarMax Inc * | 3,900 | 276 | ||||||
Carnival Corp * | 24,327 | 334 | ||||||
Carter's Inc | 1,000 | 69 | ||||||
Cava Group Inc * | 400 | 12 | ||||||
Chipotle Mexican Grill Inc, Cl A * | 683 | 1,251 | ||||||
Choice Hotels International Inc | 728 | 89 | ||||||
Churchill Downs Inc | 1,722 | 200 | ||||||
Columbia Sportswear Co | 900 | 67 | ||||||
Coupang Inc, Cl A * | 26,800 | 456 | ||||||
Crocs Inc * | 1,500 | 132 | ||||||
Darden Restaurants Inc | 2,999 | 430 | ||||||
Deckers Outdoor Corp * | 601 | 309 | ||||||
Dick's Sporting Goods Inc | 1,492 | 162 | ||||||
82
SEI Institutional Managed Trust
Description | Shares | Market Value | ||||||
COMMON STOCK†† (continued) | ||||||||
Domino's Pizza Inc | 860 | $ | 326 | |||||
DoorDash Inc, Cl A * | 7,364 | 585 | ||||||
DR Horton Inc | 7,638 | 821 | ||||||
DraftKings Inc, Cl A * | 10,400 | 306 | ||||||
eBay Inc | 13,106 | 578 | ||||||
Etsy Inc * | 3,104 | 200 | ||||||
Expedia Group Inc * | 3,524 | 363 | ||||||
Five Below Inc * | 1,383 | 223 | ||||||
Floor & Decor Holdings Inc, Cl A * | 2,600 | 235 | ||||||
Ford Motor Co | 96,385 | 1,197 | ||||||
GameStop Corp, Cl A *(A) | 6,900 | 114 | ||||||
Gap Inc/The | 5,300 | 56 | ||||||
Garmin Ltd | 3,757 | 395 | ||||||
General Motors Co | 33,749 | 1,113 | ||||||
Gentex Corp | 5,935 | 193 | ||||||
Genuine Parts Co | 3,476 | 502 | ||||||
Grand Canyon Education Inc * | 800 | 94 | ||||||
H&R Block Inc | 3,700 | 159 | ||||||
Harley-Davidson Inc, Cl A | 3,300 | 109 | ||||||
Hasbro Inc | 3,202 | 212 | ||||||
Hilton Worldwide Holdings Inc | 6,284 | 944 | ||||||
Home Depot Inc/The | 24,946 | 7,538 | ||||||
Hyatt Hotels Corp, Cl A | 1,094 | 116 | ||||||
Kohl's Corp | 3,025 | 63 | ||||||
Las Vegas Sands Corp | 8,246 | 378 | ||||||
Lear Corp | 1,494 | 201 | ||||||
Leggett & Platt Inc | 3,200 | 81 | ||||||
Lennar Corp, Cl A | 6,089 | 683 | ||||||
Lennar Corp, Cl B | 350 | 36 | ||||||
Lithia Motors Inc, Cl A | 630 | 186 | ||||||
LKQ Corp | 6,588 | 326 | ||||||
Lowe's Cos Inc | 14,426 | 2,998 | ||||||
Lucid Group Inc *(A) | 19,400 | 108 | ||||||
Lululemon Athletica Inc * | 2,748 | 1,060 | ||||||
Macy's Inc | 7,100 | 82 | ||||||
Marriott International Inc/MD, Cl A | 6,055 | 1,190 | ||||||
Marriott Vacations Worldwide Corp | 900 | 91 | ||||||
Mattel Inc * | 8,700 | 192 | ||||||
McDonald's Corp | 17,961 | 4,732 | ||||||
MGM Resorts International * | 7,153 | 263 | ||||||
Mister Car Wash Inc * | 2,100 | 12 | ||||||
Mohawk Industries Inc * | 1,332 | 114 | ||||||
Murphy USA Inc | 500 | 171 | ||||||
Newell Brands Inc, Cl B | 10,070 | 91 | ||||||
NIKE Inc, Cl B | 29,244 | 2,796 | ||||||
Nordstrom Inc | 3,000 | 45 | ||||||
Norwegian Cruise Line Holdings Ltd * | 10,263 | 169 | ||||||
NVR Inc * | 75 | 447 | ||||||
Ollie's Bargain Outlet Holdings Inc * | 1,561 | 120 | ||||||
O'Reilly Automotive Inc * | 1,450 | 1,318 | ||||||
Peloton Interactive Inc, Cl A * | 7,927 | 40 | ||||||
Penn Entertainment Inc * | 3,800 | 87 | ||||||
Description | Shares | Market Value | ||||||
COMMON STOCK†† (continued) | ||||||||
Penske Automotive Group Inc, Cl A | 500 | $ | 84 | |||||
Petco Health & Wellness Co Inc, Cl A * | 2,300 | 9 | ||||||
Phinia Inc | 1,200 | 32 | ||||||
Planet Fitness Inc, Cl A * | 2,200 | 108 | ||||||
Polaris Inc | 1,331 | 139 | ||||||
Pool Corp | 921 | 328 | ||||||
PulteGroup Inc | 5,300 | 392 | ||||||
PVH Corp | 1,549 | 119 | ||||||
QuantumScape Corp, Cl A *(A) | 6,600 | 44 | ||||||
Ralph Lauren Corp, Cl A | 984 | 114 | ||||||
RH * | 453 | 120 | ||||||
Rivian Automotive Inc, Cl A * | 16,200 | 393 | ||||||
Ross Stores Inc | 8,244 | 931 | ||||||
Royal Caribbean Cruises Ltd * | 5,823 | 537 | ||||||
Service Corp International/US | 3,700 | 211 | ||||||
Skechers USA Inc, Cl A * | 3,253 | 159 | ||||||
Starbucks Corp | 27,701 | 2,528 | ||||||
Tapestry Inc | 5,908 | 170 | ||||||
Tempur Sealy International Inc | 4,100 | 178 | ||||||
Tesla Inc * | 67,873 | 16,983 | ||||||
Texas Roadhouse Inc, Cl A | 1,700 | 163 | ||||||
Thor Industries Inc | 1,300 | 124 | ||||||
TJX Cos Inc/The | 28,359 | 2,521 | ||||||
Toll Brothers Inc | 2,700 | 200 | ||||||
TopBuild Corp * | 758 | 191 | ||||||
Tractor Supply Co | 2,701 | 548 | ||||||
Travel + Leisure Co | 1,763 | 65 | ||||||
Ulta Beauty Inc * | 1,230 | 491 | ||||||
Under Armour Inc, Cl A * | 4,815 | 33 | ||||||
Under Armour Inc, Cl C * | 5,600 | 36 | ||||||
Vail Resorts Inc | 970 | 215 | ||||||
Valvoline Inc | 4,000 | 129 | ||||||
VF Corp | 8,964 | 158 | ||||||
Victoria's Secret & Co * | 2,266 | 38 | ||||||
Wayfair Inc, Cl A * | 2,023 | 123 | ||||||
Wendy's Co/The | 4,200 | 86 | ||||||
Whirlpool Corp | 1,338 | 179 | ||||||
Williams-Sonoma Inc | 1,600 | 249 | ||||||
Wingstop Inc, Cl A | 700 | 126 | ||||||
Wyndham Hotels & Resorts Inc | 2,063 | 143 | ||||||
Wynn Resorts Ltd | 2,615 | 242 | ||||||
YETI Holdings Inc * | 2,100 | 101 | ||||||
Yum! Brands Inc | 6,909 | 863 | ||||||
| 105,232 | ||||||||
Consumer Staples — 6.0% | ||||||||
Albertsons Cos Inc, Cl A | 10,300 | 234 | ||||||
Altria Group Inc | 43,950 | 1,848 | ||||||
Archer-Daniels-Midland Co | 13,088 | 987 | ||||||
BJ's Wholesale Club Holdings Inc * | 3,300 | 236 | ||||||
Boston Beer Co Inc/The, Cl A * | 240 | 93 | ||||||
Brown-Forman Corp, Cl A | 1,240 | 72 | ||||||
Brown-Forman Corp, Cl B | 4,622 | 267 | ||||||
SEI Institutional Managed Trust
83
SCHEDULE OF INVESTMENTS
September 30, 2023
Large Cap Index Fund (Continued)
Description | Shares | Market Value | ||||||
COMMON STOCK†† (continued) | ||||||||
Bunge Ltd | 3,700 | $ | 401 | |||||
Campbell Soup Co | 4,700 | 193 | ||||||
Casey's General Stores Inc | 896 | 243 | ||||||
Celsius Holdings Inc * | 1,200 | 206 | ||||||
Church & Dwight Co Inc | 6,010 | 551 | ||||||
Clorox Co/The | 3,071 | 402 | ||||||
Coca-Cola Co/The | 95,794 | 5,363 | ||||||
Colgate-Palmolive Co | 20,179 | 1,435 | ||||||
Conagra Brands Inc | 11,849 | 325 | ||||||
Constellation Brands Inc, Cl A | 3,986 | 1,002 | ||||||
Costco Wholesale Corp | 10,864 | 6,138 | ||||||
Coty Inc, Cl A * | 9,339 | 102 | ||||||
Darling Ingredients Inc * | 3,823 | 200 | ||||||
Dollar General Corp | 5,445 | 576 | ||||||
Dollar Tree Inc * | 5,156 | 549 | ||||||
Estee Lauder Cos Inc/The, Cl A | 5,780 | 835 | ||||||
Flowers Foods Inc | 4,900 | 109 | ||||||
Freshpet Inc * | 1,200 | 79 | ||||||
General Mills Inc | 14,461 | 925 | ||||||
Grocery Outlet Holding Corp * | 2,300 | 66 | ||||||
Hershey Co/The | 3,642 | 729 | ||||||
Hormel Foods Corp | 7,037 | 268 | ||||||
Ingredion Inc | 1,610 | 158 | ||||||
J M Smucker Co/The | 2,454 | 302 | ||||||
Kellanova | 6,485 | 386 | ||||||
Kenvue Inc | 42,554 | 854 | ||||||
Keurig Dr Pepper Inc | 23,385 | 738 | ||||||
Kimberly-Clark Corp | 8,290 | 1,002 | ||||||
Kraft Heinz Co/The | 19,749 | 664 | ||||||
Kroger Co/The | 15,988 | 715 | ||||||
Lamb Weston Holdings Inc | 3,600 | 333 | ||||||
McCormick & Co Inc/MD | 6,182 | 468 | ||||||
Molson Coors Beverage Co, Cl B | 4,395 | 279 | ||||||
Mondelez International Inc, Cl A | 33,446 | 2,321 | ||||||
Monster Beverage Corp * | 18,278 | 968 | ||||||
Olaplex Holdings Inc * | 3,500 | 7 | ||||||
PepsiCo Inc | 33,930 | 5,749 | ||||||
Performance Food Group Co * | 3,800 | 224 | ||||||
Philip Morris International Inc | 38,163 | 3,533 | ||||||
Pilgrim's Pride Corp * | 900 | 21 | ||||||
Post Holdings Inc * | 1,307 | 112 | ||||||
Procter & Gamble Co/The | 57,930 | 8,450 | ||||||
Reynolds Consumer Products Inc | 1,500 | 38 | ||||||
Seaboard Corp | 6 | 22 | ||||||
Spectrum Brands Holdings Inc | 1,057 | 83 | ||||||
Sysco Corp, Cl A | 12,463 | 823 | ||||||
Target Corp, Cl A | 11,302 | 1,250 | ||||||
Tyson Foods Inc, Cl A | 6,908 | 349 | ||||||
US Foods Holding Corp * | 5,497 | 218 | ||||||
Walgreens Boots Alliance Inc | 17,841 | 397 | ||||||
Walmart Inc | 35,071 | 5,609 | ||||||
| 60,507 | ||||||||
Description | Shares | Market Value | ||||||
COMMON STOCK†† (continued) | ||||||||
Energy — 4.5% | ||||||||
Antero Midstream Corp | 8,900 | $ | 107 | |||||
Antero Resources Corp * | 6,900 | 175 | ||||||
APA Corp | 7,600 | 312 | ||||||
Baker Hughes Co, Cl A | 24,902 | 879 | ||||||
Cheniere Energy Inc | 5,973 | 991 | ||||||
Chesapeake Energy Corp | 3,200 | 276 | ||||||
Chevron Corp | 43,499 | 7,335 | ||||||
ConocoPhillips | 29,804 | 3,570 | ||||||
Coterra Energy Inc | 18,314 | 495 | ||||||
Devon Energy Corp | 15,761 | 752 | ||||||
Diamondback Energy Inc, Cl A | 4,429 | 686 | ||||||
DT Midstream Inc | 2,506 | 133 | ||||||
EOG Resources Inc | 14,482 | 1,836 | ||||||
EQT Corp | 8,767 | 356 | ||||||
Exxon Mobil Corp | 98,571 | 11,590 | ||||||
Halliburton Co | 22,045 | 893 | ||||||
Hess Corp | 6,849 | 1,048 | ||||||
HF Sinclair Corp | 3,400 | 194 | ||||||
Kinder Morgan Inc | 48,134 | 798 | ||||||
Marathon Oil Corp | 15,492 | 414 | ||||||
Marathon Petroleum Corp | 10,412 | 1,576 | ||||||
New Fortress Energy Inc, Cl A | 1,500 | 49 | ||||||
NOV Inc | 9,700 | 203 | ||||||
Occidental Petroleum Corp | 17,123 | 1,111 | ||||||
ONEOK Inc | 10,961 | 695 | ||||||
Ovintiv Inc | 6,200 | 295 | ||||||
Phillips 66 | 11,362 | 1,365 | ||||||
Pioneer Natural Resources Co | 5,674 | 1,302 | ||||||
Range Resources Corp | 5,800 | 188 | ||||||
Schlumberger NV, Cl A | 35,075 | 2,045 | ||||||
Southwestern Energy Co * | 26,600 | 172 | ||||||
Targa Resources Corp | 5,500 | 471 | ||||||
TechnipFMC PLC | 10,700 | 218 | ||||||
Texas Pacific Land Corp | 149 | 272 | ||||||
Valero Energy Corp | 8,674 | 1,229 | ||||||
Williams Cos Inc/The | 29,873 | 1,006 | ||||||
| 45,037 | ||||||||
Financials — 12.7% | ||||||||
Affiliated Managers Group Inc | 871 | 113 | ||||||
Affirm Holdings Inc, Cl A * | 5,600 | 119 | ||||||
Aflac Inc | 14,746 | 1,132 | ||||||
AGNC Investment Corp ‡ | 14,928 | 141 | ||||||
Allstate Corp/The | 6,480 | 722 | ||||||
Ally Financial Inc | 6,658 | 178 | ||||||
American Express Co | 14,514 | 2,165 | ||||||
American Financial Group Inc/OH | 1,843 | 206 | ||||||
American International Group Inc | 17,803 | 1,079 | ||||||
Ameriprise Financial Inc | 2,536 | 836 | ||||||
Annaly Capital Management Inc ‡ | 12,193 | 229 | ||||||
Aon PLC, Cl A | 4,947 | 1,604 | ||||||
Apollo Global Management Inc | 12,847 | 1,153 | ||||||
84
SEI Institutional Managed Trust
Description | Shares | Market Value | ||||||
COMMON STOCK†† (continued) | ||||||||
Arch Capital Group Ltd * | 8,789 | $ | 701 | |||||
Ares Management Corp, Cl A | 4,000 | 411 | ||||||
Arthur J Gallagher & Co | 5,205 | 1,186 | ||||||
Assurant Inc | 1,300 | 187 | ||||||
Assured Guaranty Ltd | 1,414 | 86 | ||||||
Axis Capital Holdings Ltd | 2,023 | 114 | ||||||
Bank of America Corp | 171,402 | 4,693 | ||||||
Bank of New York Mellon Corp/The | 19,185 | 818 | ||||||
Bank OZK | 2,600 | 96 | ||||||
Berkshire Hathaway Inc, Cl B * | 45,020 | 15,770 | ||||||
BlackRock Inc | 3,619 | 2,340 | ||||||
Blackstone Inc, Cl A | 17,499 | 1,875 | ||||||
Block Inc, Cl A * | 13,253 | 587 | ||||||
Blue Owl Capital Inc, Cl A | 10,800 | 140 | ||||||
BOK Financial Corp | 700 | 56 | ||||||
Brighthouse Financial Inc * | 1,700 | 83 | ||||||
Brown & Brown Inc | 5,800 | 405 | ||||||
Capital One Financial Corp | 9,263 | 899 | ||||||
Carlyle Group Inc/The | 5,300 | 160 | ||||||
Cboe Global Markets Inc | 2,600 | 406 | ||||||
Charles Schwab Corp/The | 36,427 | 2,000 | ||||||
Chubb Ltd | 10,110 | 2,105 | ||||||
Cincinnati Financial Corp | 3,800 | 389 | ||||||
Citigroup Inc | 47,780 | 1,965 | ||||||
Citizens Financial Group Inc | 11,559 | 310 | ||||||
CME Group Inc, Cl A | 8,833 | 1,769 | ||||||
CNA Financial Corp | 752 | 30 | ||||||
Coinbase Global Inc, Cl A * | 4,100 | 308 | ||||||
Columbia Banking System Inc | 5,366 | 109 | ||||||
Comerica Inc | 3,253 | 135 | ||||||
Commerce Bancshares Inc/MO | 2,824 | 135 | ||||||
Corebridge Financial Inc | 3,900 | 77 | ||||||
Credit Acceptance Corp, Cl A * | 136 | 63 | ||||||
Cullen/Frost Bankers Inc | 1,514 | 138 | ||||||
Discover Financial Services | 6,071 | 526 | ||||||
East West Bancorp Inc | 3,500 | 184 | ||||||
Equitable Holdings Inc | 8,700 | 247 | ||||||
Euronet Worldwide Inc * | 1,200 | 95 | ||||||
Evercore Inc, Cl A | 883 | 122 | ||||||
Everest Group Ltd | 1,016 | 378 | ||||||
FactSet Research Systems Inc | 985 | 431 | ||||||
Fidelity National Financial Inc | 6,410 | 265 | ||||||
Fidelity National Information Services Inc, Cl B | 14,519 | 802 | ||||||
Fifth Third Bancorp | 16,600 | 420 | ||||||
First American Financial Corp | 2,500 | 141 | ||||||
First Citizens BancShares Inc/NC, Cl A | 290 | 400 | ||||||
First Hawaiian Inc | 3,000 | 54 | ||||||
First Horizon Corp | 13,200 | 145 | ||||||
Fiserv Inc, Cl A * | 14,928 | 1,686 | ||||||
FleetCor Technologies Inc * | 1,711 | 437 | ||||||
FNB Corp/PA | 9,200 | 99 | ||||||
Description | Shares | Market Value | ||||||
COMMON STOCK†† (continued) | ||||||||
Franklin Resources Inc | 6,900 | $ | 170 | |||||
Global Payments Inc | 6,377 | 736 | ||||||
Globe Life Inc | 2,201 | 239 | ||||||
Goldman Sachs Group Inc/The | 7,940 | 2,569 | ||||||
Hanover Insurance Group Inc/The, Cl A | 926 | 103 | ||||||
Hartford Financial Services Group Inc/The | 7,559 | 536 | ||||||
Houlihan Lokey Inc, Cl A | 1,300 | 139 | ||||||
Huntington Bancshares Inc/OH | 35,138 | 365 | ||||||
Interactive Brokers Group Inc, Cl A | 2,421 | 210 | ||||||
Intercontinental Exchange Inc | 13,912 | 1,531 | ||||||
Invesco Ltd | 8,762 | 127 | ||||||
Jack Henry & Associates Inc | 1,794 | 271 | ||||||
Janus Henderson Group PLC | 3,200 | 83 | ||||||
Jefferies Financial Group Inc | 4,600 | 168 | ||||||
JPMorgan Chase & Co | 71,045 | 10,303 | ||||||
Kemper Corp, Cl A | 1,455 | 61 | ||||||
KeyCorp | 23,188 | 249 | ||||||
Kinsale Capital Group Inc | 500 | 207 | ||||||
KKR & Co Inc | 15,900 | 979 | ||||||
Lazard Ltd, Cl A | 2,900 | 90 | ||||||
Lincoln National Corp | 4,077 | 101 | ||||||
Loews Corp | 4,489 | 284 | ||||||
LPL Financial Holdings Inc | 1,892 | 450 | ||||||
M&T Bank Corp | 4,077 | 516 | ||||||
Markel Group Inc * | 320 | 471 | ||||||
MarketAxess Holdings Inc | 875 | 187 | ||||||
Marsh & McLennan Cos Inc | 12,195 | 2,321 | ||||||
Mastercard Inc, Cl A | 20,595 | 8,154 | ||||||
MetLife Inc | 15,915 | 1,001 | ||||||
MGIC Investment Corp | 7,100 | 118 | ||||||
Moody's Corp | 3,856 | 1,219 | ||||||
Morgan Stanley | 29,562 | 2,414 | ||||||
Morningstar Inc, Cl A | 600 | 141 | ||||||
MSCI Inc, Cl A | 1,887 | 968 | ||||||
Nasdaq Inc, Cl A | 8,400 | 408 | ||||||
New York Community Bancorp Inc | 17,900 | 203 | ||||||
Northern Trust Corp | 5,050 | 351 | ||||||
NU Holdings Ltd, Cl A * | 56,400 | 409 | ||||||
Old Republic International Corp | 6,700 | 180 | ||||||
OneMain Holdings Inc, Cl A | 2,681 | 107 | ||||||
PayPal Holdings Inc * | 27,620 | 1,615 | ||||||
Pinnacle Financial Partners Inc | 1,900 | 127 | ||||||
PNC Financial Services Group Inc/The | 9,756 | 1,198 | ||||||
Popular Inc | 1,700 | 107 | ||||||
Primerica Inc | 881 | 171 | ||||||
Principal Financial Group Inc, Cl A | 5,934 | 428 | ||||||
Progressive Corp/The | 14,407 | 2,007 | ||||||
Prosperity Bancshares Inc | 2,100 | 115 | ||||||
Prudential Financial Inc | 8,962 | 850 | ||||||
Raymond James Financial Inc | 4,605 | 462 | ||||||
Regions Financial Corp | 22,912 | 394 | ||||||
Reinsurance Group of America Inc, Cl A | 1,624 | 236 | ||||||
SEI Institutional Managed Trust
85
SCHEDULE OF INVESTMENTS
September 30, 2023
Large Cap Index Fund (Continued)
Description | Shares | Market Value | ||||||
COMMON STOCK†† (continued) | ||||||||
RenaissanceRe Holdings Ltd | 1,175 | $ | 233 | |||||
Rithm Capital Corp ‡ | 11,640 | 108 | ||||||
RLI Corp | 1,000 | 136 | ||||||
Robinhood Markets Inc, Cl A * | 16,100 | 158 | ||||||
Rocket Cos Inc, Cl A * | 2,800 | 23 | ||||||
Ryan Specialty Holdings Inc, Cl A * | 2,200 | 106 | ||||||
S&P Global Inc | 7,851 | 2,869 | ||||||
SEI Investments Co † | 2,500 | 151 | ||||||
Shift4 Payments Inc, Cl A * | 1,300 | 72 | ||||||
SLM Corp | 5,340 | 73 | ||||||
SoFi Technologies Inc * | 22,300 | 178 | ||||||
Starwood Property Trust Inc ‡ | 7,100 | 137 | ||||||
State Street Corp | 7,809 | 523 | ||||||
Stifel Financial Corp | 2,500 | 154 | ||||||
Synchrony Financial | 10,168 | 311 | ||||||
Synovus Financial Corp | 3,600 | 100 | ||||||
T Rowe Price Group Inc | 5,471 | 574 | ||||||
TFS Financial Corp | 1,417 | 17 | ||||||
Toast Inc, Cl A * | 8,600 | 161 | ||||||
TPG Inc, Cl A | 1,700 | 51 | ||||||
Tradeweb Markets Inc, Cl A | 2,800 | 225 | ||||||
Travelers Cos Inc/The | 5,670 | 926 | ||||||
Truist Financial Corp | 32,527 | 931 | ||||||
Unum Group | 4,775 | 235 | ||||||
US Bancorp | 37,680 | 1,246 | ||||||
UWM Holdings Corp | 2,800 | 14 | ||||||
Virtu Financial Inc, Cl A | 2,400 | 41 | ||||||
Visa Inc, Cl A | 39,819 | 9,159 | ||||||
Voya Financial Inc | 2,400 | 159 | ||||||
W R Berkley Corp | 4,950 | 314 | ||||||
Webster Financial Corp | 4,268 | 172 | ||||||
Wells Fargo & Co | 90,315 | 3,690 | ||||||
Western Alliance Bancorp | 2,800 | 129 | ||||||
Western Union Co/The | 9,000 | 119 | ||||||
WEX Inc * | 995 | 187 | ||||||
White Mountains Insurance Group Ltd | 34 | 51 | ||||||
Willis Towers Watson PLC | 2,604 | 544 | ||||||
Wintrust Financial Corp | 1,500 | 113 | ||||||
XP Inc, Cl A | 8,100 | 187 | ||||||
Zions Bancorp NA | 3,500 | 122 | ||||||
| 128,203 | ||||||||
Health Care — 12.8% | ||||||||
10X Genomics Inc, Cl A * | 2,398 | 99 | ||||||
Abbott Laboratories | 42,633 | 4,129 | ||||||
AbbVie Inc | 43,385 | 6,467 | ||||||
Acadia Healthcare Co Inc, Cl A * | 2,300 | 162 | ||||||
Agilent Technologies Inc | 7,254 | 811 | ||||||
agilon health Inc * | 7,170 | 127 | ||||||
Align Technology Inc * | 1,851 | 565 | ||||||
Alnylam Pharmaceuticals Inc * | 3,027 | 536 | ||||||
Amedisys Inc * | 800 | 75 | ||||||
Amgen Inc, Cl A | 13,145 | 3,533 | ||||||
Description | Shares | Market Value | ||||||
COMMON STOCK†† (continued) | ||||||||
Apellis Pharmaceuticals Inc * | 2,400 | $ | 91 | |||||
Avantor Inc * | 16,820 | 355 | ||||||
Azenta Inc * | 1,700 | 85 | ||||||
Baxter International Inc | 12,365 | 467 | ||||||
Becton Dickinson & Co | 7,009 | 1,812 | ||||||
Biogen Inc * | 3,559 | 915 | ||||||
BioMarin Pharmaceutical Inc * | 4,567 | 404 | ||||||
Bio-Rad Laboratories Inc, Cl A * | 556 | 199 | ||||||
Bio-Techne Corp | 3,896 | 265 | ||||||
Boston Scientific Corp * | 35,338 | 1,866 | ||||||
Bristol-Myers Squibb Co | 51,736 | 3,003 | ||||||
Bruker Corp | 2,600 | 162 | ||||||
Cardinal Health Inc | 6,200 | 538 | ||||||
Catalent Inc * | 4,423 | 201 | ||||||
Cencora Inc, Cl A | 3,995 | 719 | ||||||
Centene Corp * | 13,281 | 915 | ||||||
Certara Inc * | 3,100 | 45 | ||||||
Charles River Laboratories International Inc * | 1,203 | 236 | ||||||
Chemed Corp | 392 | 204 | ||||||
Cigna Group/The | 7,150 | 2,045 | ||||||
Cooper Cos Inc/The, Cl A | 1,168 | 371 | ||||||
CVS Health Corp | 31,508 | 2,200 | ||||||
Danaher Corp, Cl A | 16,234 | 4,028 | ||||||
DaVita Inc * | 1,300 | 123 | ||||||
DENTSPLY SIRONA Inc | 5,300 | 181 | ||||||
Dexcom Inc * | 9,472 | 884 | ||||||
Doximity Inc, Cl A * | 2,900 | 62 | ||||||
Edwards Lifesciences Corp, Cl A * | 14,747 | 1,022 | ||||||
Elanco Animal Health Inc * | 11,877 | 133 | ||||||
Elevance Health Inc | 5,832 | 2,539 | ||||||
Eli Lilly & Co | 20,870 | 11,210 | ||||||
Encompass Health Corp | 2,400 | 161 | ||||||
Enovis Corp * | 1,366 | 72 | ||||||
Envista Holdings Corp * | 4,000 | 112 | ||||||
Exact Sciences Corp * | 4,400 | 300 | ||||||
Exelixis Inc * | 7,800 | 170 | ||||||
Fortrea Holdings Inc * | 2,301 | 66 | ||||||
GE HealthCare Technologies Inc | 9,604 | 653 | ||||||
Gilead Sciences Inc | 30,744 | 2,304 | ||||||
Globus Medical Inc, Cl A * | 3,000 | 149 | ||||||
HCA Healthcare Inc | 5,004 | 1,231 | ||||||
Henry Schein Inc * | 3,147 | 234 | ||||||
Hologic Inc * | 5,900 | 409 | ||||||
Horizon Therapeutics Plc * | 5,500 | 636 | ||||||
Humana Inc | 3,104 | 1,510 | ||||||
ICON PLC * | 2,000 | 492 | ||||||
ICU Medical Inc * | 519 | 62 | ||||||
IDEXX Laboratories Inc * | 2,023 | 885 | ||||||
Illumina Inc * | 3,928 | 539 | ||||||
Incyte Corp * | 4,543 | 262 | ||||||
Inspire Medical Systems Inc * | 700 | 139 | ||||||
86
SEI Institutional Managed Trust
Description | Shares | Market Value | ||||||
COMMON STOCK†† (continued) | ||||||||
Insulet Corp * | 1,719 | $ | 274 | |||||
Integra LifeSciences Holdings Corp * | 1,900 | 73 | ||||||
Intuitive Surgical Inc * | 8,583 | 2,509 | ||||||
Ionis Pharmaceuticals Inc * | 3,500 | 159 | ||||||
IQVIA Holdings Inc * | 4,505 | 886 | ||||||
Jazz Pharmaceuticals PLC * | 1,480 | 192 | ||||||
Johnson & Johnson | 59,309 | 9,237 | ||||||
Karuna Therapeutics Inc * | 900 | 152 | ||||||
Laboratory Corp of America Holdings | 2,201 | 442 | ||||||
Maravai LifeSciences Holdings Inc, Cl A * | 3,000 | 30 | ||||||
Masimo Corp * | 1,000 | 88 | ||||||
McKesson Corp | 3,342 | 1,453 | ||||||
Medpace Holdings Inc * | 600 | 145 | ||||||
Medtronic PLC | 32,703 | 2,563 | ||||||
Merck & Co Inc | 62,472 | 6,431 | ||||||
Mettler-Toledo International Inc * | 566 | 627 | ||||||
Mirati Therapeutics Inc * | 1,100 | 48 | ||||||
Moderna Inc * | 8,181 | 845 | ||||||
Molina Healthcare Inc * | 1,395 | 457 | ||||||
Natera Inc * | 2,600 | 115 | ||||||
Neurocrine Biosciences Inc * | 2,384 | 268 | ||||||
Novocure Ltd * | 2,675 | 43 | ||||||
Organon & Co | 6,270 | 109 | ||||||
Penumbra Inc * | 900 | 218 | ||||||
Perrigo Co PLC | 3,493 | 112 | ||||||
Pfizer Inc | 138,975 | 4,610 | ||||||
Premier Inc, Cl A | 3,200 | 69 | ||||||
QIAGEN NV * | 5,700 | 231 | ||||||
Quest Diagnostics Inc | 2,800 | 341 | ||||||
QuidelOrtho Corp * | 1,300 | 95 | ||||||
R1 RCM Inc * | 4,000 | 60 | ||||||
Regeneron Pharmaceuticals Inc * | 2,513 | 2,068 | ||||||
Repligen Corp * | 1,350 | 215 | ||||||
ResMed Inc | 3,553 | 525 | ||||||
Revvity Inc | 3,141 | 348 | ||||||
Roivant Sciences Ltd * | 8,700 | 102 | ||||||
Royalty Pharma PLC, Cl A | 9,100 | 247 | ||||||
Sarepta Therapeutics Inc * | 2,200 | 267 | ||||||
Seagen Inc * | 3,407 | 723 | ||||||
Shockwave Medical Inc * | 900 | 179 | ||||||
Sotera Health Co * | 2,700 | 40 | ||||||
STERIS PLC | 2,440 | 535 | ||||||
Stryker Corp | 8,698 | 2,377 | ||||||
Tandem Diabetes Care Inc * | 1,662 | 35 | ||||||
Teladoc Health Inc * | 4,310 | 80 | ||||||
Teleflex Inc | 1,139 | 224 | ||||||
Tenet Healthcare Corp * | 2,500 | 165 | ||||||
Thermo Fisher Scientific Inc | 9,447 | 4,782 | ||||||
Ultragenyx Pharmaceutical Inc * | 1,700 | 61 | ||||||
United Therapeutics Corp * | 1,072 | 242 | ||||||
UnitedHealth Group Inc | 22,885 | 11,538 | ||||||
Universal Health Services Inc, Cl B | 1,475 | 185 | ||||||
Description | Shares | Market Value | ||||||
COMMON STOCK†† (continued) | ||||||||
Veeva Systems Inc, Cl A * | 3,568 | $ | 726 | |||||
Vertex Pharmaceuticals Inc * | 6,296 | 2,189 | ||||||
Viatris Inc, Cl W | 29,230 | 288 | ||||||
Waters Corp * | 1,399 | 384 | ||||||
West Pharmaceutical Services Inc | 1,828 | 686 | ||||||
Zimmer Biomet Holdings Inc | 5,122 | 575 | ||||||
Zoetis Inc, Cl A | 11,425 | 1,988 | ||||||
| 128,826 | ||||||||
Industrials — 9.0% | ||||||||
3M Co | 13,552 | 1,269 | ||||||
A O Smith Corp | 3,100 | 205 | ||||||
Acuity Brands Inc | 719 | 122 | ||||||
Advanced Drainage Systems Inc | 1,600 | 182 | ||||||
AECOM | 3,300 | 274 | ||||||
AGCO Corp | 1,500 | 177 | ||||||
Air Lease Corp, Cl A | 2,500 | 99 | ||||||
Alaska Air Group Inc * | 3,200 | 119 | ||||||
Allegion plc | 2,150 | 224 | ||||||
Allison Transmission Holdings Inc | 2,200 | 130 | ||||||
American Airlines Group Inc * | 16,472 | 211 | ||||||
AMETEK Inc | 5,683 | 840 | ||||||
Armstrong World Industries Inc | 1,100 | 79 | ||||||
Automatic Data Processing Inc | 10,174 | 2,448 | ||||||
Avis Budget Group Inc * | 500 | 90 | ||||||
Axon Enterprise Inc * | 1,743 | 347 | ||||||
AZEK Co Inc/The, Cl A * | 3,000 | 89 | ||||||
Boeing Co/The * | 13,738 | 2,633 | ||||||
Booz Allen Hamilton Holding Corp, Cl A | 3,240 | 354 | ||||||
Broadridge Financial Solutions Inc | 2,825 | 506 | ||||||
Builders FirstSource Inc * | 3,100 | 386 | ||||||
BWX Technologies Inc, Cl W | 2,300 | 172 | ||||||
CACI International Inc, Cl A * | 592 | 186 | ||||||
Carlisle Cos Inc | 1,224 | 317 | ||||||
Carrier Global Corp | 20,452 | 1,129 | ||||||
Caterpillar Inc, Cl A | 12,667 | 3,458 | ||||||
Ceridian HCM Holding Inc * | 3,555 | 241 | ||||||
CH Robinson Worldwide Inc | 2,755 | 237 | ||||||
ChargePoint Holdings Inc *(A) | 6,800 | 34 | ||||||
Cintas Corp | 2,101 | 1,011 | ||||||
Clarivate PLC * | 12,400 | 83 | ||||||
Clean Harbors Inc * | 1,200 | 201 | ||||||
CNH Industrial NV | 24,300 | 294 | ||||||
Concentrix Corp | 1,100 | 88 | ||||||
Copart Inc * | 21,056 | 907 | ||||||
Core & Main Inc, Cl A * | 2,000 | 58 | ||||||
Crane Co | 1,200 | 107 | ||||||
CSX Corp | 49,200 | 1,513 | ||||||
Cummins Inc | 3,444 | 787 | ||||||
Curtiss-Wright Corp | 900 | 176 | ||||||
Deere & Co | 6,662 | 2,514 | ||||||
Delta Air Lines Inc, Cl A | 15,721 | 582 | ||||||
Donaldson Co Inc, Cl A | 3,000 | 179 | ||||||
SEI Institutional Managed Trust
87
SCHEDULE OF INVESTMENTS
September 30, 2023
Large Cap Index Fund (Continued)
Description | Shares | Market Value | ||||||
COMMON STOCK†† (continued) | ||||||||
Dover Corp | 3,451 | $ | 481 | |||||
Driven Brands Holdings Inc * | 1,500 | 19 | ||||||
Dun & Bradstreet Holdings Inc | 6,900 | 69 | ||||||
Eaton Corp PLC | 9,811 | 2,093 | ||||||
EMCOR Group Inc | 1,100 | 231 | ||||||
Emerson Electric Co | 14,046 | 1,356 | ||||||
Equifax Inc | 2,979 | 546 | ||||||
Esab Corp | 1,366 | 96 | ||||||
Expeditors International of Washington Inc | 3,700 | 424 | ||||||
Fastenal Co, Cl A | 13,987 | 764 | ||||||
FedEx Corp | 5,660 | 1,499 | ||||||
Ferguson PLC | 5,100 | 839 | ||||||
Flowserve Corp | 3,200 | 127 | ||||||
Fortive Corp | 8,659 | 642 | ||||||
Fortune Brands Innovations Inc | 3,161 | 197 | ||||||
FTI Consulting Inc * | 852 | 152 | ||||||
Gates Industrial Corp PLC * | 2,600 | 30 | ||||||
Generac Holdings Inc * | 1,500 | 163 | ||||||
General Dynamics Corp | 6,055 | 1,338 | ||||||
General Electric Co | 26,714 | 2,953 | ||||||
Genpact Ltd | 4,400 | 159 | ||||||
Graco Inc | 4,200 | 306 | ||||||
GXO Logistics Inc * | 2,833 | 166 | ||||||
Hayward Holdings Inc * | 3,300 | 47 | ||||||
HEICO Corp | 1,150 | 186 | ||||||
HEICO Corp, Cl A | 2,000 | 258 | ||||||
Hertz Global Holdings Inc * | 3,500 | 43 | ||||||
Hexcel Corp, Cl A | 2,000 | 130 | ||||||
Honeywell International Inc | 16,351 | 3,021 | ||||||
Howmet Aerospace Inc | 9,300 | 430 | ||||||
Hubbell Inc, Cl B | 1,305 | 409 | ||||||
Huntington Ingalls Industries Inc, Cl A | 927 | 190 | ||||||
IDEX Corp | 1,803 | 375 | ||||||
Illinois Tool Works Inc | 7,489 | 1,725 | ||||||
Ingersoll Rand Inc | 9,949 | 634 | ||||||
ITT Inc | 2,048 | 201 | ||||||
Jacobs Solutions Inc | 3,095 | 423 | ||||||
JB Hunt Transport Services Inc | 2,010 | 379 | ||||||
Johnson Controls International PLC | 16,826 | 895 | ||||||
KBR Inc | 3,400 | 200 | ||||||
Kirby Corp * | 1,500 | 124 | ||||||
Knight-Swift Transportation Holdings Inc, Cl A | 3,927 | 197 | ||||||
L3Harris Technologies Inc | 4,597 | 800 | ||||||
Landstar System Inc | 892 | 158 | ||||||
Leidos Holdings Inc | 3,400 | 313 | ||||||
Lennox International Inc | 778 | 291 | ||||||
Lincoln Electric Holdings Inc | 1,342 | 244 | ||||||
Lockheed Martin Corp | 5,588 | 2,285 | ||||||
Lyft Inc, Cl A * | 8,300 | 88 | ||||||
ManpowerGroup Inc | 1,288 | 94 | ||||||
Masco Corp | 5,500 | 294 | ||||||
Description | Shares | Market Value | ||||||
COMMON STOCK†† (continued) | ||||||||
MasTec Inc * | 1,600 | $ | 115 | |||||
MDU Resources Group Inc | 4,900 | 96 | ||||||
Mercury Systems Inc * | 1,300 | 48 | ||||||
Middleby Corp/The * | 1,339 | 171 | ||||||
MSA Safety Inc | 858 | 135 | ||||||
MSC Industrial Direct Co Inc, Cl A | 1,179 | 116 | ||||||
Nordson Corp | 1,443 | 322 | ||||||
Norfolk Southern Corp | 5,615 | 1,106 | ||||||
Northrop Grumman Corp | 3,531 | 1,554 | ||||||
nVent Electric PLC | 4,000 | 212 | ||||||
Old Dominion Freight Line Inc, Cl A | 2,411 | 986 | ||||||
Oshkosh Corp | 1,600 | 153 | ||||||
Otis Worldwide Corp | 10,126 | 813 | ||||||
Owens Corning | 2,160 | 295 | ||||||
PACCAR Inc | 12,582 | 1,070 | ||||||
Parker-Hannifin Corp, Cl A | 3,156 | 1,229 | ||||||
Paychex Inc | 7,890 | 910 | ||||||
Paycom Software Inc | 1,266 | 328 | ||||||
Paycor HCM Inc * | 1,400 | 32 | ||||||
Paylocity Holding Corp * | 1,035 | 188 | ||||||
Pentair PLC | 4,100 | 266 | ||||||
Plug Power Inc *(A) | 13,800 | 105 | ||||||
Quanta Services Inc | 3,500 | 655 | ||||||
RB Global Inc | 4,490 | 281 | ||||||
RBC Bearings Inc * | 700 | 164 | ||||||
Regal Rexnord Corp | 1,600 | 229 | ||||||
Republic Services Inc | 5,046 | 719 | ||||||
Robert Half Inc | 2,600 | 191 | ||||||
Rockwell Automation Inc | 2,849 | 814 | ||||||
Rollins Inc | 6,400 | 239 | ||||||
RTX Corp | 35,897 | 2,584 | ||||||
Ryder System Inc | 1,100 | 118 | ||||||
Saia Inc * | 600 | 239 | ||||||
Schneider National Inc, Cl B | 1,500 | 42 | ||||||
Science Applications International Corp | 1,300 | 137 | ||||||
Sensata Technologies Holding PLC | 3,700 | 140 | ||||||
SiteOne Landscape Supply Inc * | 1,052 | 172 | ||||||
Snap-on Inc | 1,279 | 326 | ||||||
Southwest Airlines Co, Cl A | 14,844 | 402 | ||||||
Spirit AeroSystems Holdings Inc, Cl A | 2,700 | 44 | ||||||
SS&C Technologies Holdings Inc | 5,300 | 278 | ||||||
Stanley Black & Decker Inc | 3,757 | 314 | ||||||
Stericycle Inc, Cl A * | 2,400 | 107 | ||||||
Sunrun Inc * | 5,409 | 68 | ||||||
Tetra Tech Inc | 1,300 | 198 | ||||||
Textron Inc | 4,838 | 378 | ||||||
Timken Co/The | 1,600 | 118 | ||||||
Toro Co/The | 2,600 | 216 | ||||||
Trane Technologies PLC | 5,620 | 1,140 | ||||||
TransDigm Group Inc * | 1,325 | 1,117 | ||||||
TransUnion | 4,800 | 345 | ||||||
Trex Co Inc * | 2,700 | 166 | ||||||
88
SEI Institutional Managed Trust
Description | Shares | Market Value | ||||||
COMMON STOCK†† (continued) | ||||||||
Uber Technologies Inc * | 47,729 | $ | 2,195 | |||||
U-Haul Holding Co * | 237 | 13 | ||||||
U-Haul Holding Co, Cl B | 2,533 | 133 | ||||||
Union Pacific Corp | 15,036 | 3,062 | ||||||
United Airlines Holdings Inc * | 8,173 | 346 | ||||||
United Parcel Service Inc, Cl B | 17,820 | 2,778 | ||||||
United Rentals Inc | 1,643 | 730 | ||||||
Valmont Industries Inc | 459 | 110 | ||||||
Verisk Analytics Inc, Cl A | 3,549 | 838 | ||||||
Vertiv Holdings Co, Cl A | 8,600 | 320 | ||||||
Waste Management Inc | 9,950 | 1,517 | ||||||
Watsco Inc | 776 | 293 | ||||||
WESCO International Inc | 1,100 | 158 | ||||||
Westinghouse Air Brake Technologies Corp | 4,366 | 464 | ||||||
WillScot Mobile Mini Holdings Corp, Cl A * | 4,800 | 200 | ||||||
Woodward Inc | 1,442 | 179 | ||||||
WW Grainger Inc | 1,111 | 769 | ||||||
XPO Inc * | 2,733 | 204 | ||||||
Xylem Inc/NY | 5,838 | 531 | ||||||
| 91,173 | ||||||||
Information Technology — 25.7% | ||||||||
Accenture PLC, Cl A | 15,579 | 4,784 | ||||||
Adobe Inc * | 11,303 | 5,763 | ||||||
Advanced Micro Devices Inc * | 39,423 | 4,053 | ||||||
Akamai Technologies Inc * | 3,800 | 405 | ||||||
Allegro MicroSystems Inc * | 1,800 | 58 | ||||||
Alteryx Inc, Cl A * | 1,636 | 62 | ||||||
Amdocs Ltd | 3,000 | 253 | ||||||
Amphenol Corp, Cl A | 14,332 | 1,204 | ||||||
Analog Devices Inc | 12,437 | 2,178 | ||||||
ANSYS Inc * | 2,175 | 647 | ||||||
Apple Inc | 367,277 | 62,882 | ||||||
Applied Materials Inc | 20,797 | 2,879 | ||||||
AppLovin Corp, Cl A * | 5,100 | 204 | ||||||
Arista Networks Inc * | 6,152 | 1,132 | ||||||
Arrow Electronics Inc, Cl A * | 1,431 | 179 | ||||||
Aspen Technology Inc * | 631 | 129 | ||||||
Atlassian Corp, Cl A * | 3,543 | 714 | ||||||
Autodesk Inc, Cl A * | 5,282 | 1,093 | ||||||
Avnet Inc | 2,300 | 111 | ||||||
Bentley Systems Inc, Cl B | 4,800 | 241 | ||||||
BILL Holdings Inc * | 2,541 | 276 | ||||||
Broadcom Inc | 9,935 | 8,252 | ||||||
Cadence Design Systems Inc * | 6,602 | 1,547 | ||||||
CCC Intelligent Solutions Holdings Inc * | 4,500 | 60 | ||||||
CDW Corp/DE | 3,345 | 675 | ||||||
Ciena Corp * | 3,700 | 175 | ||||||
Cirrus Logic Inc * | 1,400 | 104 | ||||||
Cisco Systems Inc | 100,881 | 5,423 | ||||||
Cloudflare Inc, Cl A * | 7,000 | 441 | ||||||
Cognex Corp | 4,400 | 187 | ||||||
Cognizant Technology Solutions Corp, Cl A | 12,461 | 844 | ||||||
Description | Shares | Market Value | ||||||
COMMON STOCK†† (continued) | ||||||||
Coherent Corp * | 3,085 | $ | 101 | |||||
Confluent Inc, Cl A * | 4,500 | 133 | ||||||
Corning Inc, Cl B | 18,614 | 567 | ||||||
Crane NXT Co | 1,300 | 72 | ||||||
Crowdstrike Holdings Inc, Cl A * | 5,141 | 861 | ||||||
Datadog Inc, Cl A * | 6,700 | 610 | ||||||
DocuSign Inc, Cl A * | 4,920 | 207 | ||||||
Dolby Laboratories Inc, Cl A | 1,453 | 115 | ||||||
DoubleVerify Holdings Inc * | 2,900 | 81 | ||||||
Dropbox Inc, Cl A * | 6,300 | 172 | ||||||
DXC Technology Co * | 5,081 | 106 | ||||||
Dynatrace Inc * | 6,000 | 280 | ||||||
Elastic NV * | 1,900 | 154 | ||||||
Enphase Energy Inc * | 3,240 | 389 | ||||||
Entegris Inc | 3,700 | 347 | ||||||
EPAM Systems Inc * | 1,392 | 356 | ||||||
F5 Inc, Cl A * | 1,481 | 239 | ||||||
Fair Isaac Corp * | 630 | 547 | ||||||
First Solar Inc * | 2,600 | 420 | ||||||
Five9 Inc * | 1,800 | 116 | ||||||
Fortinet Inc * | 16,135 | 947 | ||||||
Gartner Inc * | 1,925 | 661 | ||||||
Gen Digital Inc | 13,801 | 244 | ||||||
Gitlab Inc, Cl A * | 2,200 | 100 | ||||||
GLOBALFOUNDRIES Inc *(A) | 2,000 | 116 | ||||||
Globant SA * | 1,053 | 208 | ||||||
GoDaddy Inc, Cl A * | 3,725 | 277 | ||||||
Guidewire Software Inc, Cl Z * | 1,982 | 178 | ||||||
HashiCorp Inc, Cl A * | 2,400 | 55 | ||||||
Hewlett Packard Enterprise Co | 31,707 | 551 | ||||||
HP Inc | 21,201 | 545 | ||||||
HubSpot Inc * | 1,071 | 527 | ||||||
Informatica Inc, Cl A * | 900 | 19 | ||||||
Intel Corp | 102,676 | 3,650 | ||||||
International Business Machines Corp | 22,337 | 3,134 | ||||||
Intuit Inc | 6,699 | 3,423 | ||||||
IPG Photonics Corp * | 772 | 78 | ||||||
Jabil Inc | 3,100 | 393 | ||||||
Juniper Networks Inc | 7,900 | 220 | ||||||
Keysight Technologies Inc * | 4,332 | 573 | ||||||
KLA Corp | 3,395 | 1,557 | ||||||
Kyndryl Holdings Inc * | 5,177 | 78 | ||||||
Lam Research Corp | 3,261 | 2,044 | ||||||
Lattice Semiconductor Corp * | 3,300 | 284 | ||||||
Littelfuse Inc | 600 | 148 | ||||||
Lumentum Holdings Inc * | 1,800 | 81 | ||||||
Manhattan Associates Inc * | 1,505 | 297 | ||||||
Marvell Technology Inc | 20,959 | 1,135 | ||||||
Microchip Technology Inc | 13,250 | 1,034 | ||||||
Micron Technology Inc | 26,873 | 1,828 | ||||||
Microsoft Corp | 183,175 | 57,838 | ||||||
MKS Instruments Inc | 1,700 | 147 | ||||||
SEI Institutional Managed Trust
89
SCHEDULE OF INVESTMENTS
September 30, 2023
Large Cap Index Fund (Continued)
Description | Shares | Market Value | ||||||
COMMON STOCK†† (continued) | ||||||||
MongoDB Inc, Cl A * | 1,564 | $ | 541 | |||||
Monolithic Power Systems Inc | 1,084 | 501 | ||||||
Motorola Solutions Inc | 4,064 | 1,106 | ||||||
National Instruments Corp | 3,227 | 192 | ||||||
nCino inc * | 1,900 | 60 | ||||||
NCR Corp * | 3,023 | 82 | ||||||
NetApp Inc | 5,200 | 395 | ||||||
New Relic Inc * | 1,400 | 120 | ||||||
Nutanix Inc, Cl A * | 5,559 | 194 | ||||||
NVIDIA Corp | 58,523 | 25,457 | ||||||
Okta Inc, Cl A * | 3,716 | 303 | ||||||
ON Semiconductor Corp * | 10,557 | 981 | ||||||
Oracle Corp, Cl B | 37,393 | 3,961 | ||||||
Palantir Technologies Inc, Cl A * | 45,920 | 735 | ||||||
Palo Alto Networks Inc * | 7,423 | 1,740 | ||||||
Pegasystems Inc | 1,100 | 48 | ||||||
Procore Technologies Inc * | 1,900 | 124 | ||||||
PTC Inc * | 2,765 | 392 | ||||||
Pure Storage Inc, Cl A * | 7,100 | 253 | ||||||
Qorvo Inc * | 2,424 | 231 | ||||||
QUALCOMM Inc | 27,457 | 3,049 | ||||||
RingCentral Inc, Cl A * | 2,155 | 64 | ||||||
Roper Technologies Inc | 2,617 | 1,267 | ||||||
Salesforce Inc * | 23,304 | 4,726 | ||||||
SentinelOne Inc, Cl A * | 4,900 | 83 | ||||||
ServiceNow Inc * | 5,036 | 2,815 | ||||||
Skyworks Solutions Inc | 3,926 | 387 | ||||||
Smartsheet Inc, Cl A * | 3,000 | 121 | ||||||
Snowflake Inc, Cl A * | 7,600 | 1,161 | ||||||
Splunk Inc * | 3,782 | 553 | ||||||
Synopsys Inc * | 3,767 | 1,729 | ||||||
TD SYNNEX Corp | 1,000 | 100 | ||||||
Teledyne Technologies Inc * | 1,094 | 447 | ||||||
Teradata Corp * | 2,397 | 108 | ||||||
Teradyne Inc | 3,854 | 387 | ||||||
Texas Instruments Inc | 22,357 | 3,555 | ||||||
Trimble Inc * | 6,100 | 329 | ||||||
Twilio Inc, Cl A * | 4,158 | 243 | ||||||
Tyler Technologies Inc * | 1,060 | 409 | ||||||
Ubiquiti Inc | 69 | 10 | ||||||
UiPath Inc, Cl A * | 9,300 | 159 | ||||||
Unity Software Inc * | 7,053 | 221 | ||||||
Universal Display Corp | 1,142 | 179 | ||||||
VeriSign Inc * | 2,248 | 455 | ||||||
Viasat Inc * | 2,900 | 54 | ||||||
VMware Inc, Cl A * | 5,375 | 895 | ||||||
Vontier Corp | 3,763 | 116 | ||||||
Western Digital Corp * | 7,992 | 365 | ||||||
Wolfspeed Inc * | 3,230 | 123 | ||||||
Workday Inc, Cl A * | 4,839 | 1,040 | ||||||
Zebra Technologies Corp, Cl A * | 1,284 | 304 | ||||||
Zoom Video Communications Inc, Cl A * | 6,200 | 434 | ||||||
Description | Shares | Market Value | ||||||
COMMON STOCK†† (continued) | ||||||||
Zscaler Inc * | 2,164 | $ | 337 | |||||
| 258,839 | ||||||||
Materials — 2.5% | ||||||||
Air Products and Chemicals Inc | 5,485 | 1,555 | ||||||
Albemarle Corp | 2,820 | 480 | ||||||
Alcoa Corp | 4,400 | 128 | ||||||
Amcor PLC | 36,200 | 332 | ||||||
AptarGroup Inc | 1,600 | 200 | ||||||
Ardagh Metal Packaging SA | 5,550 | 17 | ||||||
Ashland Inc | 1,100 | 90 | ||||||
Avery Dennison Corp | 1,966 | 359 | ||||||
Axalta Coating Systems Ltd * | 5,400 | 145 | ||||||
Ball Corp | 7,535 | 375 | ||||||
Berry Global Group Inc | 2,977 | 184 | ||||||
Celanese Corp, Cl A | 2,438 | 306 | ||||||
CF Industries Holdings Inc | 4,737 | 406 | ||||||
Chemours Co/The | 3,600 | 101 | ||||||
Cleveland-Cliffs Inc * | 12,600 | 197 | ||||||
Corteva Inc | 17,534 | 897 | ||||||
Crown Holdings Inc | 2,600 | 230 | ||||||
Dow Inc | 17,375 | 896 | ||||||
DuPont de Nemours Inc | 11,238 | 838 | ||||||
Eagle Materials Inc | 859 | 143 | ||||||
Eastman Chemical Co | 2,932 | 225 | ||||||
Ecolab Inc | 6,088 | 1,031 | ||||||
Element Solutions Inc | 5,500 | 108 | ||||||
FMC Corp | 3,010 | 202 | ||||||
Freeport-McMoRan Inc, Cl B | 35,102 | 1,309 | ||||||
Ginkgo Bioworks Holdings Inc * | 40,200 | 73 | ||||||
Graphic Packaging Holding Co | 7,500 | 167 | ||||||
Huntsman Corp | 4,405 | 108 | ||||||
International Flavors & Fragrances Inc | 6,269 | 427 | ||||||
International Paper Co | 8,491 | 301 | ||||||
Linde PLC | 12,100 | 4,505 | ||||||
Louisiana-Pacific Corp | 1,600 | 88 | ||||||
LyondellBasell Industries NV, Cl A | 6,361 | 602 | ||||||
Martin Marietta Materials Inc, Cl A | 1,516 | 622 | ||||||
Mosaic Co/The | 8,100 | 288 | ||||||
MP Materials Corp * | 2,400 | 46 | ||||||
NewMarket Corp | 182 | 83 | ||||||
Newmont Corp | 19,555 | 723 | ||||||
Nucor Corp | 6,141 | 960 | ||||||
Olin Corp | 3,200 | 160 | ||||||
Packaging Corp of America | 2,164 | 332 | ||||||
PPG Industries Inc | 5,788 | 751 | ||||||
Reliance Steel & Aluminum Co | 1,429 | 375 | ||||||
Royal Gold Inc, Cl A | 1,647 | 175 | ||||||
RPM International Inc | 3,100 | 294 | ||||||
Scotts Miracle-Gro Co/The, Cl A | 1,077 | 56 | ||||||
Sealed Air Corp | 3,600 | 118 | ||||||
Sherwin-Williams Co/The, Cl A | 5,842 | 1,490 | ||||||
Silgan Holdings Inc | 2,030 | 88 | ||||||
90
SEI Institutional Managed Trust
Description | Shares | Market Value | ||||||
COMMON STOCK†† (continued) | ||||||||
Sonoco Products Co | 2,400 | $ | 131 | |||||
Southern Copper Corp | 2,100 | 158 | ||||||
SSR Mining Inc | 5,300 | 70 | ||||||
Steel Dynamics Inc | 3,949 | 423 | ||||||
United States Steel Corp | 5,600 | 182 | ||||||
Vulcan Materials Co | 3,239 | 654 | ||||||
Westlake Corp | 832 | 104 | ||||||
Westrock Co | 6,300 | 226 | ||||||
| 25,534 | ||||||||
Real Estate — 2.6% | ||||||||
Agree Realty Corp ‡ | 2,300 | 127 | ||||||
Alexandria Real Estate Equities Inc ‡ | 4,248 | 425 | ||||||
American Homes 4 Rent, Cl A ‡ | 8,300 | 280 | ||||||
American Tower Corp, Cl A ‡ | 11,484 | 1,889 | ||||||
Americold Realty Trust Inc ‡ | 6,700 | 204 | ||||||
Apartment Income REIT Corp ‡ | 3,665 | 113 | ||||||
AvalonBay Communities Inc ‡ | 3,459 | 594 | ||||||
Boston Properties Inc ‡ | 3,962 | 236 | ||||||
Brixmor Property Group Inc ‡ | 7,400 | 154 | ||||||
Camden Property Trust ‡ | 2,569 | 243 | ||||||
CBRE Group Inc, Cl A * | 7,700 | 569 | ||||||
CoStar Group Inc * | 9,900 | 761 | ||||||
Cousins Properties Inc ‡ | 4,000 | 81 | ||||||
Crown Castle Inc ‡ | 10,636 | 979 | ||||||
CubeSmart ‡ | 5,400 | 206 | ||||||
Digital Realty Trust Inc, Cl A ‡ | 7,373 | 892 | ||||||
EastGroup Properties Inc ‡ | 1,100 | 183 | ||||||
EPR Properties, Cl A ‡ | 1,900 | 79 | ||||||
Equinix Inc ‡ | 2,335 | 1,696 | ||||||
Equity LifeStyle Properties Inc ‡ | 4,300 | 274 | ||||||
Equity Residential ‡ | 9,283 | 545 | ||||||
Essex Property Trust Inc ‡ | 1,517 | 322 | ||||||
Extra Space Storage Inc ‡ | 5,165 | 628 | ||||||
Federal Realty Investment Trust ‡ | 2,046 | 185 | ||||||
First Industrial Realty Trust Inc ‡ | 3,300 | 157 | ||||||
Gaming and Leisure Properties Inc ‡ | 6,110 | 278 | ||||||
Healthcare Realty Trust Inc, Cl A ‡ | 9,200 | 140 | ||||||
Healthpeak Properties Inc ‡ | 13,370 | 245 | ||||||
Highwoods Properties Inc ‡ | 2,778 | 57 | ||||||
Host Hotels & Resorts Inc ‡ | 17,602 | 283 | ||||||
Howard Hughes Holdings Inc * | 863 | 64 | ||||||
Invitation Homes Inc ‡ | 15,000 | 475 | ||||||
Iron Mountain Inc ‡ | 7,200 | 428 | ||||||
Jones Lang LaSalle Inc * | 1,203 | 170 | ||||||
Kilroy Realty Corp ‡ | 2,800 | 89 | ||||||
Kimco Realty Corp ‡ | 15,105 | 266 | ||||||
Lamar Advertising Co, Cl A ‡ | 2,200 | 184 | ||||||
Medical Properties Trust Inc ‡ | 15,735 | 86 | ||||||
Mid-America Apartment Communities Inc ‡ | 2,900 | 373 | ||||||
National Storage Affiliates Trust ‡ | 2,000 | 63 | ||||||
NNN REIT Inc ‡ | 4,400 | 156 | ||||||
Omega Healthcare Investors Inc ‡ | 5,945 | 197 | ||||||
Description | Shares | Market Value | ||||||
COMMON STOCK†† (continued) | ||||||||
Park Hotels & Resorts Inc ‡ | 5,800 | $ | 71 | |||||
Prologis Inc ‡ | 22,712 | 2,549 | ||||||
Public Storage ‡ | 3,856 | 1,016 | ||||||
Rayonier Inc ‡ | 3,800 | 108 | ||||||
Realty Income Corp ‡ | 16,539 | 826 | ||||||
Regency Centers Corp ‡ | 4,300 | 256 | ||||||
Rexford Industrial Realty Inc ‡ | 5,100 | 252 | ||||||
SBA Communications Corp, Cl A ‡ | 2,637 | 528 | ||||||
Simon Property Group Inc ‡ | 7,935 | 857 | ||||||
Spirit Realty Capital Inc ‡ | 3,378 | 113 | ||||||
STAG Industrial Inc ‡ | 4,400 | 152 | ||||||
Sun Communities Inc ‡ | 2,983 | 353 | ||||||
UDR Inc ‡ | 8,000 | 285 | ||||||
Ventas Inc ‡ | 9,790 | 412 | ||||||
VICI Properties Inc, Cl A ‡ | 24,594 | 716 | ||||||
Vornado Realty Trust ‡ | 4,600 | 104 | ||||||
Welltower Inc ‡ | 12,200 | 999 | ||||||
Weyerhaeuser Co ‡ | 17,997 | 552 | ||||||
WP Carey Inc ‡ | 5,290 | 286 | ||||||
Zillow Group Inc, Cl A * | 1,400 | 63 | ||||||
Zillow Group Inc, Cl C * | 3,900 | 180 | ||||||
| 26,054 | ||||||||
Utilities — 2.2% | ||||||||
AES Corp/The | 16,300 | 248 | ||||||
Alliant Energy Corp | 6,121 | 297 | ||||||
Ameren Corp | 6,525 | 488 | ||||||
American Electric Power Co Inc | 12,629 | 950 | ||||||
American Water Works Co Inc | 4,765 | 590 | ||||||
Atmos Energy Corp | 3,566 | 378 | ||||||
Avangrid Inc | 1,900 | 57 | ||||||
Brookfield Renewable Corp, Cl A | 3,400 | 81 | ||||||
CenterPoint Energy Inc | 15,455 | 415 | ||||||
Clearway Energy Inc, Cl A | 900 | 18 | ||||||
Clearway Energy Inc, Cl C | 2,100 | 44 | ||||||
CMS Energy Corp | 7,110 | 378 | ||||||
Consolidated Edison Inc | 8,479 | 725 | ||||||
Constellation Energy Corp | 8,013 | 874 | ||||||
Dominion Energy Inc | 20,502 | 916 | ||||||
DTE Energy Co | 5,113 | 508 | ||||||
Duke Energy Corp | 18,912 | 1,669 | ||||||
Edison International | 9,249 | 585 | ||||||
Entergy Corp | 5,189 | 480 | ||||||
Essential Utilities Inc | 6,100 | 209 | ||||||
Evergy Inc | 5,417 | 275 | ||||||
Eversource Energy | 8,498 | 494 | ||||||
Exelon Corp | 24,439 | 924 | ||||||
FirstEnergy Corp | 13,300 | 455 | ||||||
Hawaiian Electric Industries Inc * | 2,800 | 34 | ||||||
IDACORP Inc, Cl A | 1,300 | 122 | ||||||
National Fuel Gas Co | 2,300 | 119 | ||||||
NextEra Energy Inc | 49,755 | 2,850 | ||||||
NiSource Inc | 10,100 | 249 | ||||||
SEI Institutional Managed Trust
91
SCHEDULE OF INVESTMENTS
September 30, 2023
Large Cap Index Fund (Concluded)
Description | Shares | Market Value | ||||||
COMMON STOCK†† (continued) | ||||||||
NRG Energy Inc | 5,600 | $ | 216 | |||||
OGE Energy Corp | 4,900 | 163 | ||||||
PG&E Corp * | 49,006 | 790 | ||||||
Pinnacle West Capital Corp | 2,800 | 206 | ||||||
PPL Corp | 18,103 | 427 | ||||||
Public Service Enterprise Group Inc | 12,204 | 695 | ||||||
Sempra | 15,462 | 1,052 | ||||||
Southern Co/The | 26,762 | 1,732 | ||||||
UGI Corp | 5,030 | 116 | ||||||
Vistra Corp | 8,969 | 298 | ||||||
WEC Energy Group Inc | 7,784 | 627 | ||||||
Xcel Energy Inc | 13,490 | 772 | ||||||
| 22,526 | ||||||||
Total Common Stock | ||||||||
(Cost $658,727) ($ Thousands) | 974,954 | |||||||
Description |
| Market Value | ||||||
AFFILIATED PARTNERSHIP — 0.1% | ||||||||
SEI Liquidity Fund, LP | ||||||||
5.410% **†(B) | 568,415 | $ | 567 | |||||
Total Affiliated Partnership | ||||||||
(Cost $569) ($ Thousands) | 567 | |||||||
CASH EQUIVALENT — 3.2% | ||||||||
SEI Daily Income Trust, Government Fund, Institutional Class | ||||||||
5.210%**† | 32,499,428 | 32,499 | ||||||
Total Cash Equivalent | ||||||||
(Cost $32,499) ($ Thousands) | 32,499 | |||||||
Total Investments in Securities — 99.9% | ||||||||
(Cost $691,795) ($ Thousands) | $ | 1,008,020 | ||||||
A list of the open futures contracts held by the Fund at September 30, 2023 is as follows:
Type of Contract | Number of | Expiration Date | Notional Amount (Thousands) | Value | Unrealized Appreciation/ | |||||||||||||||
Long Contracts | ||||||||||||||||||||
S&P 500 Index E-MINI | 118 | Dec-2023 | $ | 26,106 | $ | 25,521 | $ | (585 | ) | |||||||||||
S&P Mid Cap 400 Index E-MINI | 2 | Dec-2023 | 526 | 504 | (22 | ) | ||||||||||||||
S&P Mid Cap 400 Index E-MINI | 33 | Dec-2023 | 8,316 | 8,317 | 1 | |||||||||||||||
| $ | 34,948 | $ | 34,342 | $ | (606 | ) | ||||||||||||||
| Percentages are based on Net Assets of $1,009,373 ($ Thousands). |
* | Non-income producing security. |
** | The rate reported is the 7-day effective yield as of September 30, 2023. |
‡ | Real Estate Investment Trust. |
† | Investment in Affiliated Security (see Note 6). |
†† | Narrow industries are utilized for compliance purposes, whereas broad sectors are utilized for reporting. |
(A) | Certain securities or partial positions of certain securities are on loan at September 30, 2023. |
(B) | This security was purchased with cash collateral held from securities on loan (see Note 12). The total market value of such securities as of September 30, 2023 was $567 ($ Thousands). |
The following is a summary of the level of inputs used as of September 30, 2023, in valuing the Fund's investments and other financial instruments carried at value ($ Thousands): | ||||||||||||||||
Investments in Securities | Level 1 | Level 2 | Level 3 | Total | ||||||||||||
Common Stock | 974,954 | – | – | 974,954 | ||||||||||||
Affiliated Partnership | – | 567 | – | 567 | ||||||||||||
Cash Equivalent | 32,499 | – | – | 32,499 | ||||||||||||
Total Investments in Securities | 1,007,453 | 567 | – | 1,008,020 | ||||||||||||
Other Financial Instruments | Level 1 | Level 2 | Level 3 | Total | ||||||||||||
Futures Contracts* | ||||||||||||||||
Unrealized Appreciation | 1 | – | – | 1 | ||||||||||||
Unrealized Depreciation | (607 | ) | – | – | (607 | ) | ||||||||||
Total Other Financial Instruments | (606 | ) | – | – | (606 | ) | ||||||||||
* | Futures contracts are valued at the unrealized appreciation (depreciation) on the instrument. |
For more information on valuation inputs, see Note 2 — Significant Accounting Policies in Notes to Financial Statements.
92
SEI Institutional Managed Trust
The following is a summary of the Fund’s transactions with affiliates for the year ended September 30, 2023 ($ Thousands):
| Security Description | Value 9/30/2022 | Purchases at Cost | Proceeds from Sales | Realized Gain/ (Loss) | Change in Unrealized Appreciation/ (Depreciation) | Value 9/30/2023 | Income | Capital Gains | ||||||||||||||||||||||||
| SEI Investments Co | $ | 137 | $ | — | $ | (18 | ) | $ | (4 | ) | $ | 36 | $ | 151 | $ | 2 | $ | — | ||||||||||||||
| SEI Liquidity Fund, LP | 855 | 4,925 | (5,212 | ) | — | (1 | ) | 567 | 106 | — | ||||||||||||||||||||||
| SEI Daily Income Trust, Government Fund, Institutional Class | 5,327 | 177,609 | (150,437 | ) | — | — | 32,499 | 453 | — | |||||||||||||||||||||||
| Totals | $ | 6,319 | $ | 182,534 | $ | (155,667 | ) | $ | (4 | ) | $ | 35 | $ | 33,217 | $ | 561 | $ | — | ||||||||||||||
Amounts designated as “—” are either $0 or have been rounded to $0.
See “Glossary” for abbreviations.
The accompanying notes are an integral part of the financial statements.
SEI Institutional Managed Trust
93
SCHEDULE OF INVESTMENTS
September 30, 2023
Tax-Managed Large Cap Fund

† | Percentages are based on total investments. Total investments do not include derivatives such as options, futures contracts, forward contracts, and swap contracts, if applicable. |
Description | Shares | Market Value | ||||||
COMMON STOCK — 99.3% | ||||||||
Communication Services — 6.3% | ||||||||
Alphabet Inc, Cl A * | 524,280 | $ | 68,607 | |||||
Alphabet Inc, Cl C * | 456,960 | 60,250 | ||||||
AT&T Inc | 209,514 | 3,147 | ||||||
BCE Inc | 196,245 | 7,491 | ||||||
Charter Communications Inc, Cl A * | 12,696 | 5,584 | ||||||
Comcast Corp, Cl A | 240,091 | 10,646 | ||||||
Electronic Arts Inc | 44,812 | 5,395 | ||||||
Meta Platforms Inc, Cl A * | 123,988 | 37,222 | ||||||
Omnicom Group Inc | 149,711 | 11,150 | ||||||
Paramount Global, Cl B | 97,736 | 1,261 | ||||||
Sirius XM Holdings Inc (A) | 752,237 | 3,400 | ||||||
TEGNA Inc | 281,870 | 4,107 | ||||||
Verizon Communications Inc | 97,068 | 3,146 | ||||||
Walt Disney Co/The * | 198,106 | 16,057 | ||||||
Warner Bros Discovery Inc * | 82,533 | 896 | ||||||
| 238,359 | ||||||||
Consumer Discretionary — 9.6% | ||||||||
Amazon.com Inc, Cl A * | 368,960 | 46,902 | ||||||
AutoZone Inc * | 16,513 | 41,943 | ||||||
Best Buy Co Inc | 85,787 | 5,960 | ||||||
Booking Holdings Inc * | 2,537 | 7,824 | ||||||
BorgWarner Inc | 89,239 | 3,603 | ||||||
Brinker International Inc * | 141,821 | 4,480 | ||||||
Darden Restaurants Inc | 3,127 | 448 | ||||||
Dick's Sporting Goods Inc | 94,331 | 10,242 | ||||||
Domino's Pizza Inc | 16,892 | 6,398 | ||||||
DR Horton Inc | 16,198 | 1,741 | ||||||
eBay Inc | 127,055 | 5,602 | ||||||
Genuine Parts Co | 79,642 | 11,499 | ||||||
Goodyear Tire & Rubber Co/The * | 406,438 | 5,052 | ||||||
Grand Canyon Education Inc * | 9,300 | 1,087 | ||||||
Description | Shares | Market Value | ||||||
COMMON STOCK (continued) | ||||||||
Harley-Davidson Inc, Cl A | 88,020 | $ | 2,910 | |||||
Home Depot Inc/The | 28,380 | 8,575 | ||||||
Lear Corp | 45,049 | 6,046 | ||||||
Lowe's Cos Inc | 320,236 | 66,558 | ||||||
Magna International Inc, Cl A | 19,822 | 1,063 | ||||||
NIKE Inc, Cl B | 357,743 | 34,207 | ||||||
O'Reilly Automotive Inc * | 1,906 | 1,732 | ||||||
Phinia Inc | 17,847 | 478 | ||||||
PulteGroup Inc | 251,522 | 18,625 | ||||||
Ross Stores Inc | 102,513 | 11,579 | ||||||
Royal Caribbean Cruises Ltd * | 63,155 | 5,819 | ||||||
Starbucks Corp | 68,046 | 6,211 | ||||||
TJX Cos Inc/The | 374,562 | 33,291 | ||||||
TopBuild Corp * | 22,379 | 5,630 | ||||||
Whirlpool Corp | 59,551 | 7,962 | ||||||
| 363,467 | ||||||||
Consumer Staples — 7.6% | ||||||||
Altria Group Inc | 257,075 | 10,810 | ||||||
Archer-Daniels-Midland Co | 50,878 | 3,837 | ||||||
Coca-Cola Co/The | 123,765 | 6,928 | ||||||
Conagra Brands Inc | 261,734 | 7,177 | ||||||
Constellation Brands Inc, Cl A | 10,975 | 2,758 | ||||||
Costco Wholesale Corp | 10,979 | 6,203 | ||||||
Diageo PLC ADR | 65,244 | 9,733 | ||||||
Dollar General Corp | 192,477 | 20,364 | ||||||
Estee Lauder Cos Inc/The, Cl A | 35,000 | 5,059 | ||||||
Hershey Co/The | 26,426 | 5,287 | ||||||
Ingredion Inc | 26,094 | 2,568 | ||||||
J M Smucker Co/The | 115,422 | 14,187 | ||||||
Kenvue Inc | 36,176 | 727 | ||||||
Kimberly-Clark Corp | 41,873 | 5,060 | ||||||
Kraft Heinz Co/The | 115,076 | 3,871 | ||||||
Kroger Co/The | 798,798 | 35,746 | ||||||
Lamb Weston Holdings Inc | 16,377 | 1,514 | ||||||
Molson Coors Beverage Co, Cl B | 246,452 | 15,672 | ||||||
Mondelez International Inc, Cl A | 24,475 | 1,699 | ||||||
Monster Beverage Corp * | 27,454 | 1,454 | ||||||
PepsiCo Inc | 208,587 | 35,343 | ||||||
Philip Morris International Inc | 284,061 | 26,298 | ||||||
Procter & Gamble Co/The | 233,806 | 34,103 | ||||||
Sysco Corp, Cl A | 22,279 | 1,472 | ||||||
Target Corp, Cl A | 53,833 | 5,952 | ||||||
Tyson Foods Inc, Cl A | 253,116 | 12,780 | ||||||
Unilever PLC ADR | 123,044 | 6,078 | ||||||
Walmart Inc | 42,652 | 6,821 | ||||||
| 289,501 | ||||||||
Energy — 4.7% | ||||||||
Canadian Natural Resources Ltd | 281,401 | 18,198 | ||||||
Chevron Corp | 212,408 | 35,816 | ||||||
ConocoPhillips | 204,582 | �� | 24,509 | |||||
Devon Energy Corp | 357,504 | 17,053 | ||||||
94
SEI Institutional Managed Trust
Description | Shares | Market Value | ||||||
COMMON STOCK (continued) | ||||||||
Exxon Mobil Corp | 129,439 | $ | 15,220 | |||||
HF Sinclair Corp | 40,846 | 2,325 | ||||||
Marathon Petroleum Corp | 154,884 | 23,440 | ||||||
Phillips 66 | 109,951 | 13,211 | ||||||
Shell PLC ADR | 44,038 | 2,835 | ||||||
Valero Energy Corp | 173,346 | 24,565 | ||||||
| 177,172 | ||||||||
Financials — 16.5% | ||||||||
Aflac Inc | 136,144 | 10,449 | ||||||
Allstate Corp/The | 49,660 | 5,533 | ||||||
American Financial Group Inc/OH | 11,100 | 1,239 | ||||||
Ameriprise Financial Inc | 82,444 | 27,180 | ||||||
Assurant Inc | 33,412 | 4,797 | ||||||
Assured Guaranty Ltd | 31,872 | 1,929 | ||||||
Bank of America Corp | 1,369,018 | 37,484 | ||||||
Berkshire Hathaway Inc, Cl B * | 93,247 | 32,664 | ||||||
Capital One Financial Corp | 43,778 | 4,249 | ||||||
Citigroup Inc | 120,793 | 4,968 | ||||||
CME Group Inc, Cl A | 77,815 | 15,580 | ||||||
Discover Financial Services | 126,480 | 10,957 | ||||||
Everest Group Ltd | 38,172 | 14,187 | ||||||
FactSet Research Systems Inc | 11,209 | 4,901 | ||||||
Fifth Third Bancorp | 501,389 | 12,700 | ||||||
Goldman Sachs Group Inc/The | 21,644 | 7,003 | ||||||
Hartford Financial Services Group Inc/The | 66,936 | 4,746 | ||||||
Intercontinental Exchange Inc | 53,724 | 5,911 | ||||||
JPMorgan Chase & Co | 429,166 | 62,238 | ||||||
KeyCorp | 78,556 | 845 | ||||||
KKR & Co Inc | 76,949 | 4,740 | ||||||
Lincoln National Corp | 21,062 | 520 | ||||||
Markel Group Inc * | 11,893 | 17,512 | ||||||
Marsh & McLennan Cos Inc | 138,328 | 26,324 | ||||||
Mastercard Inc, Cl A | 168,189 | 66,588 | ||||||
Moody's Corp | 186,253 | 58,888 | ||||||
Morgan Stanley | 311,935 | 25,476 | ||||||
MSCI Inc, Cl A | 64,006 | 32,840 | ||||||
Navient Corp | 263,511 | 4,538 | ||||||
PNC Financial Services Group Inc/The | 36,433 | 4,473 | ||||||
Popular Inc | 95,304 | 6,005 | ||||||
Progressive Corp/The | 23,730 | 3,306 | ||||||
Prudential Financial Inc | 17,700 | 1,680 | ||||||
Regions Financial Corp | 599,114 | 10,305 | ||||||
S&P Global Inc | 15,849 | 5,791 | ||||||
Travelers Cos Inc/The | 119,703 | 19,549 | ||||||
Truist Financial Corp | 32,333 | 925 | ||||||
Visa Inc, Cl A | 220,523 | 50,722 | ||||||
Voya Financial Inc | 156,840 | 10,422 | ||||||
Wells Fargo & Co | 92,870 | 3,795 | ||||||
| 623,959 | ||||||||
Health Care — 14.8% | ||||||||
Abbott Laboratories | 84,496 | 8,183 | ||||||
Description | Shares | Market Value | ||||||
COMMON STOCK (continued) | ||||||||
AbbVie Inc | 92,048 | $ | 13,721 | |||||
Amgen Inc, Cl A | 144,184 | 38,751 | ||||||
AstraZeneca PLC ADR | 99,185 | 6,717 | ||||||
Becton Dickinson & Co | �� | 113,758 | 29,410 | |||||
Biogen Inc * | 23,794 | 6,115 | ||||||
Bristol-Myers Squibb Co | 192,866 | 11,194 | ||||||
Cardinal Health Inc | 36,074 | 3,132 | ||||||
Cencora Inc, Cl A | 137,635 | 24,770 | ||||||
Centene Corp * | 19,739 | 1,360 | ||||||
Cigna Group/The | 27,340 | 7,821 | ||||||
CVS Health Corp | 312,048 | 21,787 | ||||||
Edwards Lifesciences Corp, Cl A * | 61,914 | 4,289 | ||||||
Elevance Health Inc | 10,844 | 4,722 | ||||||
Eli Lilly & Co | 17,885 | 9,607 | ||||||
Gilead Sciences Inc | 120,443 | 9,026 | ||||||
HCA Healthcare Inc | 109,165 | 26,852 | ||||||
Horizon Therapeutics Plc * | 53,775 | 6,221 | ||||||
Humana Inc | 11,818 | 5,750 | ||||||
IDEXX Laboratories Inc * | 13,040 | 5,702 | ||||||
Intuitive Surgical Inc * | 21,300 | 6,226 | ||||||
Johnson & Johnson | 532,816 | 82,986 | ||||||
McKesson Corp | 12,923 | 5,620 | ||||||
Medtronic PLC | 46,357 | 3,632 | ||||||
Merck & Co Inc | 563,613 | 58,024 | ||||||
Mettler-Toledo International Inc * | 28,371 | 31,437 | ||||||
Novartis AG ADR | 32,225 | 3,282 | ||||||
Novo Nordisk A/S ADR | 64,742 | 5,888 | ||||||
Organon & Co | 16,268 | 282 | ||||||
Pfizer Inc | 706,138 | 23,423 | ||||||
QuidelOrtho Corp * | 38,206 | 2,791 | ||||||
United Therapeutics Corp * | 22,931 | 5,179 | ||||||
UnitedHealth Group Inc | 158,185 | 79,755 | ||||||
Veeva Systems Inc, Cl A * | 4,706 | 957 | ||||||
Vertex Pharmaceuticals Inc * | 2,576 | 896 | ||||||
Zoetis Inc, Cl A | 33,352 | 5,803 | ||||||
| 561,311 | ||||||||
Industrials — 10.0% | ||||||||
AerCap Holdings NV * | 20,386 | 1,278 | ||||||
AGCO Corp | 52,600 | 6,222 | ||||||
Alaska Air Group Inc * | 221,974 | 8,231 | ||||||
Carlisle Cos Inc | 6,137 | 1,591 | ||||||
Carrier Global Corp | 357,041 | 19,709 | ||||||
Caterpillar Inc, Cl A | 25,261 | 6,896 | ||||||
Chart Industries Inc * | 29,522 | 4,993 | ||||||
Cummins Inc | 8,214 | 1,877 | ||||||
Deere & Co | 14,637 | 5,524 | ||||||
Delta Air Lines Inc, Cl A | 128,832 | 4,767 | ||||||
Eaton Corp PLC | 27,035 | 5,766 | ||||||
Expeditors International of Washington Inc | 28,492 | 3,266 | ||||||
FedEx Corp | 20,626 | 5,464 | ||||||
Fortive Corp | 67,655 | 5,017 | ||||||
Graco Inc | 542,313 | 39,524 | ||||||
SEI Institutional Managed Trust
95
SCHEDULE OF INVESTMENTS
September 30, 2023
Tax-Managed Large Cap Fund (Continued)
Description | Shares | Market Value | ||||||
COMMON STOCK (continued) | ||||||||
GXO Logistics Inc * | 423,868 | $ | 24,860 | |||||
Honeywell International Inc | 44,277 | 8,180 | ||||||
Huntington Ingalls Industries Inc, Cl A | 41,706 | 8,532 | ||||||
Illinois Tool Works Inc | 47,481 | 10,935 | ||||||
Johnson Controls International PLC | 490,100 | 26,078 | ||||||
L3Harris Technologies Inc | 25,220 | 4,391 | ||||||
Lockheed Martin Corp | 15,688 | 6,416 | ||||||
ManpowerGroup Inc | 18,167 | 1,332 | ||||||
Middleby Corp/The * | 100,000 | 12,800 | ||||||
Northrop Grumman Corp | 13,751 | 6,053 | ||||||
Oshkosh Corp | 61,954 | 5,912 | ||||||
PACCAR Inc | 64,500 | 5,484 | ||||||
Robert Half Inc | 25,692 | 1,883 | ||||||
RTX Corp | 247,761 | 17,831 | ||||||
Siemens AG ADR | 170,436 | 12,178 | ||||||
Southwest Airlines Co, Cl A | 86,460 | 2,340 | ||||||
SPX Technologies Inc * | 76,761 | 6,248 | ||||||
Textron Inc | 190,528 | 14,888 | ||||||
Timken Co/The | 112,333 | 8,255 | ||||||
TransDigm Group Inc * | 27,487 | 23,175 | ||||||
United Parcel Service Inc, Cl B | 10,028 | 1,563 | ||||||
Waste Management Inc | 18,232 | 2,779 | ||||||
WW Grainger Inc | 64,211 | 44,424 | ||||||
| 376,662 | ||||||||
Information Technology — 21.9% | ||||||||
Adobe Inc * | 132,912 | 67,772 | ||||||
Amphenol Corp, Cl A | 104,624 | 8,787 | ||||||
Analog Devices Inc | 99,044 | 17,342 | ||||||
Apple Inc | 800,024 | 136,972 | ||||||
Applied Materials Inc | 148,944 | 20,621 | ||||||
Arista Networks Inc * | 90,886 | 16,717 | ||||||
ASML Holding NV, Cl G | 1,198 | 705 | ||||||
Broadcom Inc | 18,065 | 15,004 | ||||||
Cadence Design Systems Inc * | 10,238 | 2,399 | ||||||
Cisco Systems Inc | 488,328 | 26,252 | ||||||
Cognizant Technology Solutions Corp, Cl A | 8,912 | 604 | ||||||
Corning Inc, Cl B | 177,573 | 5,411 | ||||||
Dropbox Inc, Cl A * | 116,763 | 3,179 | ||||||
Fair Isaac Corp * | 6,327 | 5,495 | ||||||
Hewlett Packard Enterprise Co | 307,307 | 5,338 | ||||||
HP Inc | 477,135 | 12,262 | ||||||
Intel Corp | 334,938 | 11,907 | ||||||
International Business Machines Corp | 6,932 | 973 | ||||||
Intuit Inc | 105,948 | 54,133 | ||||||
Juniper Networks Inc | 27,209 | 756 | ||||||
Keysight Technologies Inc * | 96,705 | 12,795 | ||||||
Lam Research Corp | 9,589 | 6,010 | ||||||
Marvell Technology Inc | 74,923 | 4,056 | ||||||
Microchip Technology Inc | 501,948 | 39,177 | ||||||
Micron Technology Inc | 156,515 | 10,648 | ||||||
Microsoft Corp | 486,353 | 153,566 | ||||||
Motorola Solutions Inc | 21,734 | 5,917 | ||||||
Description | Shares | Market Value | ||||||
COMMON STOCK (continued) | ||||||||
NetApp Inc | 45,929 | $ | 3,485 | |||||
NVIDIA Corp | 8,767 | 3,813 | ||||||
Oracle Corp, Cl B | 453,993 | 48,087 | ||||||
QUALCOMM Inc | 67,431 | 7,489 | ||||||
Roper Technologies Inc | 56,426 | 27,326 | ||||||
Salesforce Inc * | 55,295 | 11,213 | ||||||
SAP SE ADR | 178,714 | 23,111 | ||||||
Seagate Technology Holdings PLC | 92,139 | 6,077 | ||||||
ServiceNow Inc * | 10,437 | 5,834 | ||||||
Texas Instruments Inc | 44,297 | 7,044 | ||||||
VeriSign Inc * | 91,384 | 18,508 | ||||||
Vishay Intertechnology Inc | 410,078 | 10,137 | ||||||
VMware Inc, Cl A * | 71,053 | 11,829 | ||||||
Western Digital Corp * | 33,750 | 1,540 | ||||||
| 830,291 | ||||||||
Materials — 5.2% | ||||||||
Air Products and Chemicals Inc | 64,126 | 18,173 | ||||||
Cabot Corp | 81,410 | 5,639 | ||||||
Celanese Corp, Cl A | 28,298 | 3,552 | ||||||
Corteva Inc | 64,004 | 3,275 | ||||||
Dow Inc | 162,912 | 8,400 | ||||||
DuPont de Nemours Inc | 37,261 | 2,779 | ||||||
Eastman Chemical Co | 135,211 | 10,373 | ||||||
Ecolab Inc | 34,773 | 5,891 | ||||||
Huntsman Corp | 531,983 | 12,980 | ||||||
Ingevity Corp * | 14,131 | 673 | ||||||
Linde PLC | 123,959 | 46,156 | ||||||
LyondellBasell Industries NV, Cl A | 74,826 | 7,086 | ||||||
O-I Glass Inc, Cl I * | 451,358 | 7,551 | ||||||
Reliance Steel & Aluminum Co | 11,055 | 2,899 | ||||||
Sherwin-Williams Co/The, Cl A | 164,735 | 42,016 | ||||||
Steel Dynamics Inc | 152,103 | 16,309 | ||||||
Sylvamo Corp | 12,276 | 539 | ||||||
Westrock Co | 27,405 | 981 | ||||||
| 195,272 | ||||||||
Real Estate — 1.2% | ||||||||
American Tower Corp, Cl A ‡ | 101,757 | 16,734 | ||||||
Brandywine Realty Trust ‡ | 24,300 | 110 | ||||||
CBRE Group Inc, Cl A * | 41,173 | 3,041 | ||||||
Crown Castle Inc ‡ | 34,157 | 3,143 | ||||||
Equinix Inc ‡ | 1,986 | 1,442 | ||||||
Healthpeak Properties Inc ‡ | 38,867 | 714 | ||||||
Invitation Homes Inc ‡ | 28,203 | 894 | ||||||
Omega Healthcare Investors Inc ‡ | 57,622 | 1,911 | ||||||
Public Storage ‡ | 4,106 | 1,082 | ||||||
Sabra Health Care REIT Inc ‡ | 246,508 | 3,436 | ||||||
SBA Communications Corp, Cl A ‡ | 18,373 | 3,678 | ||||||
Service Properties Trust ‡ | 574,963 | 4,421 | ||||||
Welltower Inc ‡ | 70,223 | 5,753 | ||||||
| 46,359 | ||||||||
96
SEI Institutional Managed Trust
Description | Shares | Market Value | ||||||
COMMON STOCK (continued) | ||||||||
Utilities — 1.5% | ||||||||
Ameren Corp | 64,109 | $ | 4,797 | |||||
American Electric Power Co Inc | 57,553 | 4,329 | ||||||
Constellation Energy Corp | 56,029 | 6,112 | ||||||
Duke Energy Corp | 117,536 | 10,374 | ||||||
Edison International | 97,576 | 6,175 | ||||||
Exelon Corp | 132,096 | 4,992 | ||||||
FirstEnergy Corp | 22,694 | 776 | ||||||
NextEra Energy Inc | 192,725 | 11,041 | ||||||
NRG Energy Inc | 138,699 | 5,343 | ||||||
UGI Corp | 111,831 | 2,572 | ||||||
Vistra Corp | 40,284 | 1,337 | ||||||
| 57,848 | ||||||||
Total Common Stock | ||||||||
(Cost $1,251,306) ($ Thousands) | 3,760,201 | |||||||
Description |
| Market Value | ||||||
AFFILIATED PARTNERSHIP — 0.1% | ||||||||
SEI Liquidity Fund, LP | ||||||||
5.410% **†(B) | 3,635,169 | $ | 3,657 | |||||
Total Affiliated Partnership | ||||||||
(Cost $3,635) ($ Thousands) | 3,657 | |||||||
CASH EQUIVALENT — 0.7% | ||||||||
SEI Daily Income Trust, Government Fund, Institutional Class | ||||||||
5.210%**† | 26,386,668 | 26,387 | ||||||
Total Cash Equivalent | ||||||||
(Cost $26,387) ($ Thousands) | 26,387 | |||||||
Total Investments in Securities — 100.1% | ||||||||
(Cost $1,281,328) ($ Thousands) | $ | 3,790,245 | ||||||
A list of the open futures contracts held by the Fund at September 30, 2023 is as follows:
Type of Contract | Number of | Expiration Date | Notional Amount (Thousands) | Value | Unrealized Depreciation(Thousands) | |||||||||||||||
Long Contracts | ||||||||||||||||||||
S&P 500 Index E-MINI | 42 | Dec-2023 | $ | 9,358 | $ | 9,083 | $ | (275 | ) | |||||||||||
S&P Mid Cap 400 Index E-MINI | 16 | Dec-2023 | 4,124 | 4,033 | (91 | ) | ||||||||||||||
| $ | 13,482 | $ | 13,116 | $ | (366 | ) | ||||||||||||||
| Percentages are based on Net Assets of $3,788,156 ($ Thousands). |
* | Non-income producing security. |
** | The rate reported is the 7-day effective yield as of September 30, 2023. |
‡ | Real Estate Investment Trust. |
† | Investment in Affiliated Security (see Note 6). |
(A) | Certain securities or partial positions of certain securities are on loan at September 30, 2023. |
(B) | This security was purchased with cash collateral held from securities on loan (see Note 12). The total market value of such securities as of September 30, 2023 was $3,657 ($ Thousands). |
The following is a summary of the level of inputs used as of September 30, 2023, in valuing the Fund's investments and other financial instruments carried at value ($ Thousands): | ||||||||||||||||
Investments in Securities | Level 1 | Level 2 | Level 3 | Total | ||||||||||||
Common Stock | 3,760,201 | – | – | 3,760,201 | ||||||||||||
Affiliated Partnership | – | 3,657 | – | 3,657 | ||||||||||||
Cash Equivalent | 26,387 | – | – | 26,387 | ||||||||||||
Total Investments in Securities | 3,786,588 | 3,657 | – | 3,790,245 | ||||||||||||
Other Financial Instruments | Level 1 | Level 2 | Level 3 | Total | ||||||||||||
Futures Contracts* | ||||||||||||||||
Unrealized Depreciation | (366 | ) | – | – | (366 | ) | ||||||||||
Total Other Financial Instruments | (366 | ) | – | – | (366 | ) | ||||||||||
* | Futures contracts are valued at the unrealized depreciation on the instrument. |
For more information on valuation inputs, see Note 2 — Significant Accounting Policies in Notes to Financial Statements.
SEI Institutional Managed Trust
97
SCHEDULE OF INVESTMENTS
September 30, 2023
Tax-Managed Large Cap Fund (Concluded)
The following is a summary of the Fund’s transactions with affiliates for the year ended September 30, 2023 ($ Thousands):
Security Description | Value | Purchases | Proceeds | Realized Gain/(Loss) | Change in Unrealized Appreciation/(Depreciation) | Value | Income | Capital Gains | ||||||||||||||||||||||||
SEI Liquidity Fund, LP | $ | 28,547 | $ | 318,445 | $ | (343,356 | ) | $ | (3 | ) | $ | 24 | $ | 3,657 | $ | 345 | $ | 1 | ||||||||||||||
SEI Daily Income Trust, Government Fund, | 21,654 | 614,191 | (609,458 | ) | — | — | 26,387 | 835 | — | |||||||||||||||||||||||
Totals | $ | 50,201 | $ | 932,636 | $ | (952,814 | ) | $ | (3 | ) | $ | 24 | $ | 30,044 | $ | 1,180 | $ | 1 | ||||||||||||||
Amounts designated as “—” are either $0 or have been rounded to $0.
See “Glossary” for abbreviations.
The accompanying notes are an integral part of the financial statements.
98
SEI Institutional Managed Trust
SCHEDULE OF INVESTMENTS
September 30, 2023
S&P 500 Index Fund
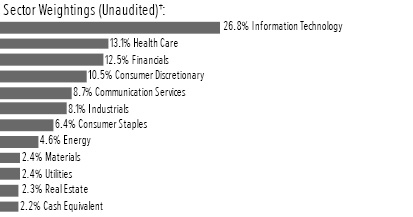
† | Percentages are based on total investments. Total investments do not include derivatives such as options, futures contracts, forward contracts, and swap contracts, if applicable. |
Description | Shares | Market Value | ||||||
COMMON STOCK†† — 97.7% | ||||||||
Communication Services — 8.7% | ||||||||
Activision Blizzard Inc | 16,852 | $ | 1,578 | |||||
Alphabet Inc, Cl A * | 139,690 | 18,280 | ||||||
Alphabet Inc, Cl C * | 118,805 | 15,664 | ||||||
AT&T Inc | 168,117 | 2,525 | ||||||
Charter Communications Inc, Cl A * | 2,432 | 1,070 | ||||||
Comcast Corp, Cl A | 96,905 | 4,297 | ||||||
Electronic Arts Inc | 5,778 | 696 | ||||||
Fox Corp, Cl A | 5,986 | 187 | ||||||
Fox Corp, Cl B | 3,181 | 92 | ||||||
Interpublic Group of Cos Inc/The | 9,101 | 261 | ||||||
Live Nation Entertainment Inc * | 3,400 | 282 | ||||||
Match Group Inc * | 6,700 | 263 | ||||||
Meta Platforms Inc, Cl A * | 52,337 | 15,712 | ||||||
Netflix Inc * | 10,465 | 3,952 | ||||||
News Corp, Cl A | 8,975 | 180 | ||||||
News Corp, Cl B | 2,700 | 56 | ||||||
Omnicom Group Inc | 4,704 | 350 | ||||||
Paramount Global, Cl B | 11,817 | 152 | ||||||
Take-Two Interactive Software Inc, Cl A * | 3,700 | 519 | ||||||
T-Mobile US Inc | 12,226 | 1,712 | ||||||
Verizon Communications Inc | 98,913 | 3,206 | ||||||
Walt Disney Co/The * | 43,024 | 3,487 | ||||||
Warner Bros Discovery Inc * | 52,074 | 566 | ||||||
| 75,087 | ||||||||
Consumer Discretionary — 10.5% | ||||||||
Airbnb Inc, Cl A * | 10,000 | 1,372 | ||||||
Amazon.com Inc, Cl A * | 213,689 | 27,164 | ||||||
Aptiv PLC * | 6,370 | 628 | ||||||
AutoZone Inc * | 427 | 1,085 | ||||||
Bath & Body Works Inc | 5,427 | 183 | ||||||
Best Buy Co Inc | 4,654 | 323 | ||||||
Booking Holdings Inc * | 840 | 2,591 | ||||||
BorgWarner Inc | 5,553 | 224 | ||||||
Caesars Entertainment Inc * | 5,200 | 241 | ||||||
CarMax Inc * | 3,800 | 269 | ||||||
Description | Shares | Market Value | ||||||
COMMON STOCK†† (continued) | ||||||||
Carnival Corp * | 23,784 | $ | 326 | |||||
Chipotle Mexican Grill Inc, Cl A * | 662 | 1,213 | ||||||
Darden Restaurants Inc | 2,818 | 404 | ||||||
Domino's Pizza Inc | 795 | 301 | ||||||
DR Horton Inc | 7,258 | 780 | ||||||
eBay Inc | 12,549 | 553 | ||||||
Etsy Inc * | 2,900 | 187 | ||||||
Expedia Group Inc * | 3,355 | 346 | ||||||
Ford Motor Co | 92,370 | 1,147 | ||||||
Garmin Ltd | 3,671 | 386 | ||||||
General Motors Co | 32,647 | 1,076 | ||||||
Genuine Parts Co | 3,296 | 476 | ||||||
Hasbro Inc | 3,096 | 205 | ||||||
Hilton Worldwide Holdings Inc | 6,200 | 931 | ||||||
Home Depot Inc/The | 23,658 | 7,149 | ||||||
Las Vegas Sands Corp | 7,700 | 353 | ||||||
Lennar Corp, Cl A | 5,974 | 670 | ||||||
LKQ Corp | 6,100 | 302 | ||||||
Lowe's Cos Inc | 13,809 | 2,870 | ||||||
Marriott International Inc/MD, Cl A | 5,900 | 1,160 | ||||||
McDonald's Corp | 17,154 | 4,519 | ||||||
MGM Resorts International * | 6,600 | 243 | ||||||
Mohawk Industries Inc * | 1,300 | 112 | ||||||
NIKE Inc, Cl B | 28,950 | 2,768 | ||||||
Norwegian Cruise Line Holdings Ltd * | 10,200 | 168 | ||||||
NVR Inc * | 78 | 465 | ||||||
O'Reilly Automotive Inc * | 1,440 | 1,309 | ||||||
Pool Corp | 922 | 328 | ||||||
PulteGroup Inc | 5,299 | 392 | ||||||
Ralph Lauren Corp, Cl A | 1,005 | 117 | ||||||
Ross Stores Inc | 8,019 | 906 | ||||||
Royal Caribbean Cruises Ltd * | 5,500 | 507 | ||||||
Starbucks Corp | 27,004 | 2,465 | ||||||
Tapestry Inc | 5,519 | 159 | ||||||
Tesla Inc * | 65,038 | 16,274 | ||||||
TJX Cos Inc/The | 27,086 | 2,407 | ||||||
Tractor Supply Co | 2,580 | 524 | ||||||
Ulta Beauty Inc * | 1,197 | 478 | ||||||
VF Corp | 7,665 | 135 | ||||||
Whirlpool Corp | 1,312 | 175 | ||||||
Wynn Resorts Ltd | 2,429 | 224 | ||||||
Yum! Brands Inc | 6,570 | 821 | ||||||
| 90,411 | ||||||||
Consumer Staples — 6.4% | ||||||||
Altria Group Inc | 41,973 | 1,765 | ||||||
Archer-Daniels-Midland Co | 12,618 | 952 | ||||||
Brown-Forman Corp, Cl B | 4,365 | 252 | ||||||
Bunge Ltd | 3,600 | 390 | ||||||
Campbell Soup Co | 4,684 | 192 | ||||||
Church & Dwight Co Inc | 5,776 | 529 | ||||||
Clorox Co/The | 2,902 | 380 | ||||||
Coca-Cola Co/The | 91,548 | 5,125 | ||||||
SEI Institutional Managed Trust
99
SCHEDULE OF INVESTMENTS
September 30, 2023
S&P 500 Index Fund (Continued)
Description | Shares | Market Value | ||||||
COMMON STOCK†† (continued) | ||||||||
Colgate-Palmolive Co | 19,495 | $ | 1,386 | |||||
Conagra Brands Inc | 11,465 | 314 | ||||||
Constellation Brands Inc, Cl A | 3,807 | 957 | ||||||
Costco Wholesale Corp | 10,419 | 5,886 | ||||||
Dollar General Corp | 5,181 | 548 | ||||||
Dollar Tree Inc * | 4,854 | 517 | ||||||
Estee Lauder Cos Inc/The, Cl A | 5,450 | 788 | ||||||
General Mills Inc | 13,786 | 882 | ||||||
Hershey Co/The | 3,412 | 683 | ||||||
Hormel Foods Corp | 6,908 | 263 | ||||||
J M Smucker Co/The | 2,453 | 302 | ||||||
Kellanova | 6,167 | 367 | ||||||
Kenvue Inc | 40,560 | 815 | ||||||
Keurig Dr Pepper Inc | 23,700 | 748 | ||||||
Kimberly-Clark Corp | 7,903 | 955 | ||||||
Kraft Heinz Co/The | 18,708 | 629 | ||||||
Kroger Co/The | 15,336 | 686 | ||||||
Lamb Weston Holdings Inc | 3,500 | 324 | ||||||
McCormick & Co Inc/MD | 5,932 | 449 | ||||||
Molson Coors Beverage Co, Cl B | 4,451 | 283 | ||||||
Mondelez International Inc, Cl A | 32,020 | 2,222 | ||||||
Monster Beverage Corp * | 17,508 | 927 | ||||||
PepsiCo Inc | 32,379 | 5,486 | ||||||
Philip Morris International Inc | 36,527 | 3,382 | ||||||
Procter & Gamble Co/The | 55,472 | 8,091 | ||||||
Sysco Corp, Cl A | 11,920 | 787 | ||||||
Target Corp, Cl A | 10,828 | 1,197 | ||||||
Tyson Foods Inc, Cl A | 6,703 | 339 | ||||||
Walgreens Boots Alliance Inc | 17,057 | 379 | ||||||
Walmart Inc | 33,573 | 5,369 | ||||||
| 55,546 | ||||||||
Energy — 4.6% | ||||||||
APA Corp | 7,231 | 297 | ||||||
Baker Hughes Co, Cl A | 23,749 | 839 | ||||||
Chevron Corp | 41,729 | 7,036 | ||||||
ConocoPhillips | 28,228 | 3,382 | ||||||
Coterra Energy Inc | 18,013 | 487 | ||||||
Devon Energy Corp | 15,113 | 721 | ||||||
Diamondback Energy Inc, Cl A | 4,251 | 658 | ||||||
EOG Resources Inc | 13,707 | 1,738 | ||||||
EQT Corp | 8,700 | 353 | ||||||
Exxon Mobil Corp | 94,252 | 11,082 | ||||||
Halliburton Co | 21,142 | 856 | ||||||
Hess Corp | 6,475 | 991 | ||||||
Kinder Morgan Inc | 46,282 | 767 | ||||||
Marathon Oil Corp | 14,456 | 387 | ||||||
Marathon Petroleum Corp | 9,438 | 1,428 | ||||||
Occidental Petroleum Corp | 15,662 | 1,016 | ||||||
ONEOK Inc | 13,709 | 870 | ||||||
Phillips 66 | 10,487 | 1,260 | ||||||
Pioneer Natural Resources Co | 5,466 | 1,255 | ||||||
Schlumberger NV, Cl A | 33,500 | 1,953 | ||||||
Description | Shares | Market Value | ||||||
COMMON STOCK†† (continued) | ||||||||
Targa Resources Corp | 5,400 | $ | 463 | |||||
Valero Energy Corp | 8,353 | 1,184 | ||||||
Williams Cos Inc/The | 28,669 | 966 | ||||||
| 39,989 | ||||||||
Financials — 12.5% | ||||||||
Aflac Inc | 12,734 | 977 | ||||||
Allstate Corp/The | 6,259 | 697 | ||||||
American Express Co | 13,695 | 2,043 | ||||||
American International Group Inc | 16,735 | 1,014 | ||||||
Ameriprise Financial Inc | 2,381 | 785 | ||||||
Aon PLC, Cl A | 4,801 | 1,557 | ||||||
Arch Capital Group Ltd * | 8,700 | 693 | ||||||
Arthur J Gallagher & Co | 5,049 | 1,151 | ||||||
Assurant Inc | 1,305 | 187 | ||||||
Bank of America Corp | 163,109 | 4,466 | ||||||
Bank of New York Mellon Corp/The | 18,299 | 780 | ||||||
Berkshire Hathaway Inc, Cl B * | 42,890 | 15,024 | ||||||
BlackRock Inc | 3,269 | 2,113 | ||||||
Blackstone Inc, Cl A | 16,700 | 1,789 | ||||||
Brown & Brown Inc | 5,600 | 391 | ||||||
Capital One Financial Corp | 8,949 | 868 | ||||||
Cboe Global Markets Inc | 2,500 | 391 | ||||||
Charles Schwab Corp/The | 34,959 | 1,919 | ||||||
Chubb Ltd | 9,701 | 2,020 | ||||||
Cincinnati Financial Corp | 3,683 | 377 | ||||||
Citigroup Inc | 45,298 | 1,863 | ||||||
Citizens Financial Group Inc | 11,100 | 297 | ||||||
CME Group Inc, Cl A | 8,412 | 1,684 | ||||||
Comerica Inc | 3,092 | 128 | ||||||
Discover Financial Services | 6,008 | 520 | ||||||
Everest Group Ltd | 1,037 | 385 | ||||||
FactSet Research Systems Inc | 900 | 394 | ||||||
Fidelity National Information Services Inc, Cl B | 13,865 | 766 | ||||||
Fifth Third Bancorp | 16,311 | 413 | ||||||
Fiserv Inc, Cl A * | 14,305 | 1,616 | ||||||
FleetCor Technologies Inc * | 1,729 | 441 | ||||||
Franklin Resources Inc | 6,738 | 166 | ||||||
Global Payments Inc | 6,183 | 713 | ||||||
Globe Life Inc | 2,139 | 233 | ||||||
Goldman Sachs Group Inc/The | 7,718 | 2,497 | ||||||
Hartford Financial Services Group Inc/The | 7,186 | 510 | ||||||
Huntington Bancshares Inc/OH | 34,614 | 360 | ||||||
Intercontinental Exchange Inc | 13,205 | 1,453 | ||||||
Invesco Ltd | 11,116 | 161 | ||||||
Jack Henry & Associates Inc | 1,700 | 257 | ||||||
JPMorgan Chase & Co | 68,408 | 9,921 | ||||||
KeyCorp | 22,583 | 243 | ||||||
Loews Corp | 4,362 | 276 | ||||||
M&T Bank Corp | 3,934 | 497 | ||||||
MarketAxess Holdings Inc | 856 | 183 | ||||||
Marsh & McLennan Cos Inc | 11,659 | 2,219 | ||||||
100
SEI Institutional Managed Trust
Description | Shares | Market Value | ||||||
COMMON STOCK†† (continued) | ||||||||
Mastercard Inc, Cl A | 19,597 | $ | 7,759 | |||||
MetLife Inc | 14,839 | 934 | ||||||
Moody's Corp | 3,671 | 1,161 | ||||||
Morgan Stanley | 30,036 | 2,453 | ||||||
MSCI Inc, Cl A | 1,884 | 967 | ||||||
Nasdaq Inc, Cl A | 7,977 | 388 | ||||||
Northern Trust Corp | 4,909 | 341 | ||||||
PayPal Holdings Inc * | 25,829 | 1,510 | ||||||
PNC Financial Services Group Inc/The | 9,413 | 1,156 | ||||||
Principal Financial Group Inc, Cl A | 5,357 | 386 | ||||||
Progressive Corp/The | 13,785 | 1,920 | ||||||
Prudential Financial Inc | 8,566 | 813 | ||||||
Raymond James Financial Inc | 4,558 | 458 | ||||||
Regions Financial Corp | 22,363 | 385 | ||||||
S&P Global Inc | 7,705 | 2,815 | ||||||
State Street Corp | 7,545 | 505 | ||||||
Synchrony Financial | 9,863 | 302 | ||||||
T Rowe Price Group Inc | 5,293 | 555 | ||||||
Travelers Cos Inc/The | 5,356 | 875 | ||||||
Truist Financial Corp | 31,306 | 896 | ||||||
US Bancorp | 36,638 | 1,211 | ||||||
Visa Inc, Cl A | 37,849 | 8,706 | ||||||
W R Berkley Corp | 4,800 | 305 | ||||||
Wells Fargo & Co | 86,173 | 3,521 | ||||||
Willis Towers Watson PLC | 2,469 | 516 | ||||||
Zions Bancorp NA | 3,486 | 122 | ||||||
| 108,398 | ||||||||
Health Care — 13.0% | ||||||||
Abbott Laboratories | 40,912 | 3,962 | ||||||
AbbVie Inc | 41,513 | 6,188 | ||||||
Agilent Technologies Inc | 6,915 | 773 | ||||||
Align Technology Inc * | 1,686 | 515 | ||||||
Amgen Inc, Cl A | 12,522 | 3,365 | ||||||
Baxter International Inc | 12,035 | 454 | ||||||
Becton Dickinson & Co | 6,878 | 1,778 | ||||||
Biogen Inc * | 3,406 | 875 | ||||||
Bio-Rad Laboratories Inc, Cl A * | 531 | 190 | ||||||
Bio-Techne Corp | 3,752 | 255 | ||||||
Boston Scientific Corp * | 34,476 | 1,820 | ||||||
Bristol-Myers Squibb Co | 49,203 | 2,856 | ||||||
Cardinal Health Inc | 6,059 | 526 | ||||||
Catalent Inc * | 4,200 | 191 | ||||||
Cencora Inc, Cl A | 3,796 | 683 | ||||||
Centene Corp * | 12,889 | 888 | ||||||
Charles River Laboratories International Inc * | 1,160 | 227 | ||||||
Cigna Group/The | 6,943 | 1,986 | ||||||
Cooper Cos Inc/The, Cl A | 1,204 | 383 | ||||||
CVS Health Corp | 30,176 | 2,107 | ||||||
Danaher Corp, Cl A | 15,512 | 3,849 | ||||||
DaVita Inc * | 1,356 | 128 | ||||||
DENTSPLY SIRONA Inc | 5,009 | 171 | ||||||
Description | Shares | Market Value | ||||||
COMMON STOCK†† (continued) | ||||||||
Dexcom Inc * | 9,072 | $ | 846 | |||||
Edwards Lifesciences Corp, Cl A * | 14,242 | 987 | ||||||
Elevance Health Inc | 5,529 | 2,408 | ||||||
Eli Lilly & Co | 18,739 | 10,065 | ||||||
GE HealthCare Technologies Inc | 9,162 | 623 | ||||||
Gilead Sciences Inc | 29,314 | 2,197 | ||||||
HCA Healthcare Inc | 4,781 | 1,176 | ||||||
Henry Schein Inc * | 3,100 | 230 | ||||||
Hologic Inc * | 5,900 | 410 | ||||||
Humana Inc | 2,931 | 1,426 | ||||||
IDEXX Laboratories Inc * | 1,923 | 841 | ||||||
Illumina Inc * | 3,696 | 507 | ||||||
Incyte Corp * | 4,400 | 254 | ||||||
Insulet Corp * | 1,600 | 255 | ||||||
Intuitive Surgical Inc * | 8,207 | 2,399 | ||||||
IQVIA Holdings Inc * | 4,296 | 845 | ||||||
Johnson & Johnson | 56,643 | 8,822 | ||||||
Laboratory Corp of America Holdings | 2,110 | 424 | ||||||
McKesson Corp | 3,143 | 1,367 | ||||||
Medtronic PLC | 31,279 | 2,451 | ||||||
Merck & Co Inc | 59,714 | 6,148 | ||||||
Mettler-Toledo International Inc * | 524 | 581 | ||||||
Moderna Inc * | 7,700 | 795 | ||||||
Molina Healthcare Inc * | 1,379 | 452 | ||||||
Organon & Co | 6,017 | 105 | ||||||
Pfizer Inc | 132,860 | 4,407 | ||||||
Quest Diagnostics Inc | 2,624 | 320 | ||||||
Regeneron Pharmaceuticals Inc * | 2,544 | 2,094 | ||||||
ResMed Inc | 3,409 | 504 | ||||||
Revvity Inc | 2,998 | 332 | ||||||
STERIS PLC | 2,345 | 515 | ||||||
Stryker Corp | 7,926 | 2,166 | ||||||
Teleflex Inc | 1,129 | 222 | ||||||
Thermo Fisher Scientific Inc | 9,026 | 4,569 | ||||||
UnitedHealth Group Inc | 21,772 | 10,977 | ||||||
Universal Health Services Inc, Cl B | 1,500 | 189 | ||||||
Vertex Pharmaceuticals Inc * | 6,027 | 2,096 | ||||||
Viatris Inc, Cl W | 28,757 | 284 | ||||||
Waters Corp * | 1,372 | 376 | ||||||
West Pharmaceutical Services Inc | 1,722 | 646 | ||||||
Zimmer Biomet Holdings Inc | 4,974 | 558 | ||||||
Zoetis Inc, Cl A | 10,845 | 1,887 | ||||||
| 112,926 | ||||||||
Industrials — 8.1% | ||||||||
3M Co | 12,971 | 1,214 | ||||||
A O Smith Corp | 3,000 | 198 | ||||||
Alaska Air Group Inc * | 3,000 | 111 | ||||||
Allegion plc | 2,070 | 216 | ||||||
American Airlines Group Inc * | 15,309 | 196 | ||||||
AMETEK Inc | 5,400 | 798 | ||||||
Automatic Data Processing Inc | 9,715 | 2,337 | ||||||
Axon Enterprise Inc * | 1,600 | 318 | ||||||
SEI Institutional Managed Trust
101
SCHEDULE OF INVESTMENTS
September 30, 2023
S&P 500 Index Fund (Continued)
Description | Shares | Market Value | ||||||
COMMON STOCK†† (continued) | ||||||||
Boeing Co/The * | 13,255 | $ | 2,541 | |||||
Broadridge Financial Solutions Inc | 2,784 | 498 | ||||||
Carrier Global Corp | 19,631 | 1,084 | ||||||
Caterpillar Inc, Cl A | 11,993 | 3,274 | ||||||
Ceridian HCM Holding Inc * | 3,700 | 251 | ||||||
CH Robinson Worldwide Inc | 2,805 | 242 | ||||||
Cintas Corp | 2,032 | 977 | ||||||
Copart Inc * | 20,200 | 870 | ||||||
CSX Corp | 47,199 | 1,451 | ||||||
Cummins Inc | 3,298 | 753 | ||||||
Deere & Co | 6,411 | 2,419 | ||||||
Delta Air Lines Inc, Cl A | 15,113 | 559 | ||||||
Dover Corp | 3,337 | 466 | ||||||
Eaton Corp PLC | 9,420 | 2,009 | ||||||
Emerson Electric Co | 13,475 | 1,301 | ||||||
Equifax Inc | 2,889 | 529 | ||||||
Expeditors International of Washington Inc | 3,477 | 399 | ||||||
Fastenal Co, Cl A | 13,418 | 733 | ||||||
FedEx Corp | 5,411 | 1,433 | ||||||
Fortive Corp | 8,287 | 615 | ||||||
Generac Holdings Inc * | 1,454 | 158 | ||||||
General Dynamics Corp | 5,244 | 1,159 | ||||||
General Electric Co | 25,588 | 2,829 | ||||||
Honeywell International Inc | 15,620 | 2,886 | ||||||
Howmet Aerospace Inc | 8,578 | 397 | ||||||
Huntington Ingalls Industries Inc, Cl A | 947 | 194 | ||||||
IDEX Corp | 1,800 | 374 | ||||||
Illinois Tool Works Inc | 6,465 | 1,489 | ||||||
Ingersoll Rand Inc | 9,633 | 614 | ||||||
Jacobs Solutions Inc | 2,962 | 404 | ||||||
JB Hunt Transport Services Inc | 1,951 | 368 | ||||||
Johnson Controls International PLC | 16,072 | 855 | ||||||
L3Harris Technologies Inc | 4,409 | 768 | ||||||
Leidos Holdings Inc | 3,243 | 299 | ||||||
Lockheed Martin Corp | 5,300 | 2,167 | ||||||
Masco Corp | 5,384 | 288 | ||||||
Nordson Corp | 1,300 | 290 | ||||||
Norfolk Southern Corp | 5,386 | 1,061 | ||||||
Northrop Grumman Corp | 3,330 | 1,466 | ||||||
Old Dominion Freight Line Inc, Cl A | 2,144 | 877 | ||||||
Otis Worldwide Corp | 9,750 | 783 | ||||||
PACCAR Inc | 12,300 | 1,046 | ||||||
Parker-Hannifin Corp, Cl A | 2,971 | 1,157 | ||||||
Paychex Inc | 7,569 | 873 | ||||||
Paycom Software Inc | 1,159 | 301 | ||||||
Pentair PLC | 3,966 | 257 | ||||||
Quanta Services Inc | 3,418 | 639 | ||||||
Republic Services Inc | 4,783 | 682 | ||||||
Robert Half Inc | 2,532 | 186 | ||||||
Rockwell Automation Inc | 2,726 | 779 | ||||||
Rollins Inc | 5,500 | 205 | ||||||
RTX Corp | 34,328 | 2,471 | ||||||
Description | Shares | Market Value | ||||||
COMMON STOCK†† (continued) | ||||||||
Snap-on Inc | 1,207 | $ | 308 | |||||
Southwest Airlines Co, Cl A | 13,962 | 378 | ||||||
Stanley Black & Decker Inc | 3,608 | 302 | ||||||
Textron Inc | 4,707 | 368 | ||||||
Trane Technologies PLC | 5,370 | 1,090 | ||||||
TransDigm Group Inc * | 1,320 | 1,113 | ||||||
Union Pacific Corp | 14,341 | 2,920 | ||||||
United Airlines Holdings Inc * | 7,700 | 326 | ||||||
United Parcel Service Inc, Cl B | 17,068 | 2,660 | ||||||
United Rentals Inc | 1,614 | 718 | ||||||
Verisk Analytics Inc, Cl A | 3,426 | 809 | ||||||
Waste Management Inc | 8,684 | 1,324 | ||||||
Westinghouse Air Brake Technologies Corp | 4,271 | 454 | ||||||
WW Grainger Inc | 1,064 | 736 | ||||||
Xylem Inc/NY | 5,700 | 519 | ||||||
| 70,139 | ||||||||
Information Technology — 26.8% | ||||||||
Accenture PLC, Cl A | 14,856 | 4,562 | ||||||
Adobe Inc * | 10,747 | 5,480 | ||||||
Advanced Micro Devices Inc * | 37,925 | 3,899 | ||||||
Akamai Technologies Inc * | 3,604 | 384 | ||||||
Amphenol Corp, Cl A | 13,960 | 1,173 | ||||||
Analog Devices Inc | 11,772 | 2,061 | ||||||
ANSYS Inc * | 2,007 | 597 | ||||||
Apple Inc | 345,993 | 59,238 | ||||||
Applied Materials Inc | 19,741 | 2,733 | ||||||
Arista Networks Inc * | 5,870 | 1,080 | ||||||
Autodesk Inc, Cl A * | 5,055 | 1,046 | ||||||
Broadcom Inc | 9,710 | 8,065 | ||||||
Cadence Design Systems Inc * | 6,351 | 1,488 | ||||||
CDW Corp/DE | 3,147 | 635 | ||||||
Cisco Systems Inc | 95,878 | 5,154 | ||||||
Cognizant Technology Solutions Corp, Cl A | 11,905 | 806 | ||||||
Corning Inc, Cl B | 17,908 | 546 | ||||||
DXC Technology Co * | 4,830 | 101 | ||||||
Enphase Energy Inc * | 3,200 | 385 | ||||||
EPAM Systems Inc * | 1,400 | 358 | ||||||
F5 Inc, Cl A * | 1,360 | 219 | ||||||
Fair Isaac Corp * | 600 | 521 | ||||||
First Solar Inc * | 2,500 | 404 | ||||||
Fortinet Inc * | 15,290 | 897 | ||||||
Gartner Inc * | 1,856 | 638 | ||||||
Gen Digital Inc | 13,747 | 243 | ||||||
Hewlett Packard Enterprise Co | 30,791 | 535 | ||||||
HP Inc | 20,372 | 524 | ||||||
Intel Corp | 98,137 | 3,489 | ||||||
International Business Machines Corp | 21,368 | 2,998 | ||||||
Intuit Inc | 6,559 | 3,351 | ||||||
Juniper Networks Inc | 7,600 | 211 | ||||||
Keysight Technologies Inc * | 4,132 | 547 | ||||||
KLA Corp | 3,177 | 1,457 | ||||||
Lam Research Corp | 3,178 | 1,992 | ||||||
102
SEI Institutional Managed Trust
Description | Shares | Market Value | ||||||
COMMON STOCK†† (continued) | ||||||||
Microchip Technology Inc | 12,913 | $ | 1,008 | |||||
Micron Technology Inc | 25,769 | 1,753 | ||||||
Microsoft Corp | 174,884 | 55,220 | ||||||
Monolithic Power Systems Inc | 1,150 | 531 | ||||||
Motorola Solutions Inc | 3,882 | 1,057 | ||||||
NetApp Inc | 5,085 | 386 | ||||||
NVIDIA Corp | 58,111 | 25,278 | ||||||
NXP Semiconductors NV | 6,076 | 1,215 | ||||||
ON Semiconductor Corp * | 10,100 | 939 | ||||||
Oracle Corp, Cl B | 37,071 | 3,927 | ||||||
Palo Alto Networks Inc * | 7,159 | 1,678 | ||||||
PTC Inc * | 2,757 | 391 | ||||||
Qorvo Inc * | 2,400 | 229 | ||||||
QUALCOMM Inc | 26,232 | 2,913 | ||||||
Roper Technologies Inc | 2,513 | 1,217 | ||||||
Salesforce Inc * | 22,962 | 4,656 | ||||||
Seagate Technology Holdings PLC | 4,600 | 303 | ||||||
ServiceNow Inc * | 4,785 | 2,675 | ||||||
Skyworks Solutions Inc | 3,816 | 376 | ||||||
SolarEdge Technologies Inc * | 1,300 | 168 | ||||||
Synopsys Inc * | 3,571 | 1,639 | ||||||
TE Connectivity Ltd | 7,409 | 915 | ||||||
Teledyne Technologies Inc * | 1,118 | 457 | ||||||
Teradyne Inc | 3,715 | 373 | ||||||
Texas Instruments Inc | 21,344 | 3,394 | ||||||
Trimble Inc * | 5,800 | 312 | ||||||
Tyler Technologies Inc * | 1,020 | 394 | ||||||
VeriSign Inc * | 2,095 | 424 | ||||||
Western Digital Corp * | 7,674 | 350 | ||||||
Zebra Technologies Corp, Cl A * | 1,173 | 277 | ||||||
| 232,272 | ||||||||
Materials — 2.4% | ||||||||
Air Products and Chemicals Inc | 5,221 | 1,480 | ||||||
Albemarle Corp | 2,757 | 469 | ||||||
Amcor PLC | 35,032 | 321 | ||||||
Avery Dennison Corp | 1,864 | 340 | ||||||
Ball Corp | 7,372 | 367 | ||||||
Celanese Corp, Cl A | 2,352 | 295 | ||||||
CF Industries Holdings Inc | 4,650 | 399 | ||||||
Corteva Inc | 16,673 | 853 | ||||||
Dow Inc | 16,606 | 856 | ||||||
DuPont de Nemours Inc | 10,799 | 806 | ||||||
Eastman Chemical Co | 2,820 | 216 | ||||||
Ecolab Inc | 5,816 | 985 | ||||||
FMC Corp | 3,000 | 201 | ||||||
Freeport-McMoRan Inc, Cl B | 33,663 | 1,255 | ||||||
International Flavors & Fragrances Inc | 6,126 | 418 | ||||||
International Paper Co | 8,252 | 293 | ||||||
Linde PLC | 11,446 | 4,262 | ||||||
LyondellBasell Industries NV, Cl A | 5,974 | 566 | ||||||
Martin Marietta Materials Inc, Cl A | 1,469 | 603 | ||||||
Mosaic Co/The | 7,909 | 282 | ||||||
Description | Shares | Market Value | ||||||
COMMON STOCK†† (continued) | ||||||||
Newmont Corp | 18,625 | $ | 688 | |||||
Nucor Corp | 5,827 | 911 | ||||||
Packaging Corp of America | 2,100 | 322 | ||||||
PPG Industries Inc | 5,505 | 715 | ||||||
Sealed Air Corp | 3,428 | 113 | ||||||
Sherwin-Williams Co/The, Cl A | 5,545 | 1,414 | ||||||
Steel Dynamics Inc | 3,800 | 407 | ||||||
Vulcan Materials Co | 3,149 | 636 | ||||||
Westrock Co | 5,984 | 214 | ||||||
| 20,687 | ||||||||
Real Estate — 2.3% | ||||||||
Alexandria Real Estate Equities Inc ‡ | 3,723 | 373 | ||||||
American Tower Corp, Cl A ‡ | 10,997 | 1,808 | ||||||
AvalonBay Communities Inc ‡ | 3,328 | 572 | ||||||
Boston Properties Inc ‡ | 3,400 | 202 | ||||||
Camden Property Trust ‡ | 2,500 | 236 | ||||||
CBRE Group Inc, Cl A * | 7,409 | 547 | ||||||
CoStar Group Inc * | 9,600 | 738 | ||||||
Crown Castle Inc ‡ | 10,164 | 935 | ||||||
Digital Realty Trust Inc, Cl A ‡ | 6,869 | 831 | ||||||
Equinix Inc ‡ | 2,196 | 1,595 | ||||||
Equity Residential ‡ | 8,144 | 478 | ||||||
Essex Property Trust Inc ‡ | 1,521 | 323 | ||||||
Extra Space Storage Inc ‡ | 4,999 | 608 | ||||||
Federal Realty Investment Trust ‡ | 1,800 | 163 | ||||||
Healthpeak Properties Inc ‡ | 13,200 | 242 | ||||||
Host Hotels & Resorts Inc ‡ | 17,174 | 276 | ||||||
Invitation Homes Inc ‡ | 13,500 | 428 | ||||||
Iron Mountain Inc ‡ | 6,838 | 407 | ||||||
Kimco Realty Corp ‡ | 14,913 | 262 | ||||||
Mid-America Apartment Communities Inc ‡ | 2,740 | 353 | ||||||
Prologis Inc ‡ | 21,680 | 2,433 | ||||||
Public Storage ‡ | 3,687 | 972 | ||||||
Realty Income Corp ‡ | 16,728 | 835 | ||||||
Regency Centers Corp ‡ | 3,699 | 220 | ||||||
SBA Communications Corp, Cl A ‡ | 2,549 | 510 | ||||||
Simon Property Group Inc ‡ | 7,706 | 833 | ||||||
UDR Inc ‡ | 7,400 | 264 | ||||||
Ventas Inc ‡ | 9,332 | 393 | ||||||
VICI Properties Inc, Cl A ‡ | 23,600 | 687 | ||||||
Welltower Inc ‡ | 12,259 | 1,004 | ||||||
Weyerhaeuser Co ‡ | 17,461 | 535 | ||||||
| 20,063 | ||||||||
Utilities — 2.4% | ||||||||
AES Corp/The | 16,090 | 244 | ||||||
Alliant Energy Corp | 5,900 | 286 | ||||||
Ameren Corp | 6,253 | 468 | ||||||
American Electric Power Co Inc | 12,115 | 911 | ||||||
American Water Works Co Inc | 4,557 | 564 | ||||||
Atmos Energy Corp | 3,400 | 360 | ||||||
CenterPoint Energy Inc | 15,085 | 405 | ||||||
SEI Institutional Managed Trust
103
SCHEDULE OF INVESTMENTS
September 30, 2023
S&P 500 Index Fund (Concluded)
Description | Shares | Market Value | ||||||
COMMON STOCK†† (continued) | ||||||||
CMS Energy Corp | 7,001 | $ | 372 | |||||
Consolidated Edison Inc | 8,136 | 696 | ||||||
Constellation Energy Corp | 7,651 | 835 | ||||||
Dominion Energy Inc | 19,630 | 877 | ||||||
DTE Energy Co | 4,876 | 484 | ||||||
Duke Energy Corp | 18,091 | 1,597 | ||||||
Edison International | 8,957 | 567 | ||||||
Entergy Corp | 5,026 | 465 | ||||||
Evergy Inc | 5,499 | 279 | ||||||
Eversource Energy | 8,335 | 485 | ||||||
Exelon Corp | 23,355 | 883 | ||||||
FirstEnergy Corp | 12,123 | 414 | ||||||
NextEra Energy Inc | 47,571 | 2,725 | ||||||
NiSource Inc | 9,844 | 243 | ||||||
NRG Energy Inc | 5,481 | 211 | ||||||
PG&E Corp * | 49,200 | 794 | ||||||
Pinnacle West Capital Corp | 2,649 | 195 | ||||||
PPL Corp | 17,571 | 414 | ||||||
Public Service Enterprise Group Inc | 11,730 | 667 | ||||||
Sempra | 14,690 | 999 | ||||||
Description | Shares | Market Value | ||||||
COMMON STOCK†† (continued) | ||||||||
Southern Co/The | 25,619 | $ | 1,658 | |||||
WEC Energy Group Inc | 7,371 | 594 | ||||||
Xcel Energy Inc | 12,936 | 740 | ||||||
| 20,432 | ||||||||
Total Common Stock | ||||||||
(Cost $232,948) ($ Thousands) | 845,950 | |||||||
CASH EQUIVALENT — 2.2% | ||||||||
SEI Daily Income Trust, Government Fund, Institutional Class | ||||||||
5.210%**† | 19,012,292 | 19,012 | ||||||
Total Cash Equivalent | ||||||||
(Cost $19,012) ($ Thousands) | 19,012 | |||||||
Total Investments in Securities — 99.9% | ||||||||
(Cost $251,960) ($ Thousands) | $ | 864,962 | ||||||
A list of the open futures contracts held by the Fund at September 30, 2023 is as follows:
Type of Contract | Number of | Expiration Date | Notional Amount (Thousands) | Value | Unrealized Depreciation(Thousands) | |||||||||||||||
Long Contracts | ||||||||||||||||||||
S&P 500 Index E-MINI | 94 | Dec-2023 | $ | 21,283 | $ | 20,330 | $ | (953 | ) | |||||||||||
| Percentages are based on Net Assets of $866,005 ($ Thousands). |
* | Non-income producing security. |
** | The rate reported is the 7-day effective yield as of September 30, 2023. |
‡ | Real Estate Investment Trust. |
† | Investment in Affiliated Security (see Note 6). |
†† | Narrow industries are utilized for compliance purposes, whereas broad sectors are utilized for reporting. |
The following is a summary of the level of inputs used as of September 30, 2023, in valuing the Fund's investments and other financial instruments carried at value ($ Thousands): | ||||||||||||||||
Investments in Securities | Level 1 | Level 2 | Level 3 | Total | ||||||||||||
Common Stock | 845,950 | – | – | 845,950 | ||||||||||||
Cash Equivalent | 19,012 | – | – | 19,012 | ||||||||||||
Total Investments in Securities | 864,962 | – | – | 864,962 | ||||||||||||
Other Financial Instruments | Level 1 | Level 2 | Level 3 | Total | ||||||||||||
Futures Contracts* | ||||||||||||||||
Unrealized Depreciation | (953 | ) | – | – | (953 | ) | ||||||||||
Total Other Financial Instruments | (953 | ) | – | – | (953 | ) | ||||||||||
* | Futures contracts are valued at the unrealized depreciation on the instrument. |
For more information on valuation inputs, see Note 2 — Significant Accounting Policies in Notes to Financial Statements.
104
SEI Institutional Managed Trust
The following is a summary of the Fund’s transactions with affiliates for the year ended September 30, 2023 ($ Thousands):
Security Description | Value 9/30/2022 | Purchases at Cost | Proceeds from Sales | Realized Gain/ (Loss) | Change in Unrealized Appreciation/ (Depreciation) | Value 9/30/2023 | Income | Capital Gains | ||||||||||||||||||||||||
SEI Liquidity Fund, LP | $ | 1 | $ | 142 | $ | (143 | ) | $ | — | $ | — | $ | — | $ | 6 | $ | — | |||||||||||||||
SEI Daily Income Trust, Government Fund, Institutional Class | 2,986 | 140,872 | (124,846 | ) | — | — | 19,012 | 332 | — | |||||||||||||||||||||||
Totals | $ | 2,987 | $ | 141,014 | $ | (124,989 | ) | $ | — | $ | — | $ | 19,012 | $ | 338 | $ | — | |||||||||||||||
Amounts designated as “—” are either $0 or have been rounded to $0.
See “Glossary” for abbreviations.
The accompanying notes are an integral part of the financial statements.
SEI Institutional Managed Trust
105
SCHEDULE OF INVESTMENTS
September 30, 2023
Small Cap Fund
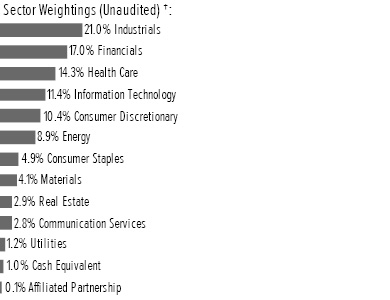
† | Percentages are based on total investments. Total investments do not include derivatives such as options, futures contracts, forward contracts, and swap contracts, if applicable. |
Description | Shares | Market Value | ||||||
COMMON STOCK — 99.0% | ||||||||
Communication Services — 2.8% | ||||||||
Advantage Solutions Inc * | 56,500 | $ | 160 | |||||
Cable One Inc | 1,536 | 946 | ||||||
Cardlytics Inc * | 14,000 | 231 | ||||||
Cinemark Holdings Inc * | 199,046 | 3,652 | ||||||
Cogent Communications Holdings Inc | 16,793 | 1,039 | ||||||
EchoStar Corp, Cl A * | 8,660 | 145 | ||||||
Eventbrite Inc, Cl A * | 57,680 | 569 | ||||||
Gambling.com Group * | 27,500 | 360 | ||||||
IDT Corp, Cl B * | 13,680 | 302 | ||||||
Liberty Latin America Ltd, Cl A * | 71,694 | 585 | ||||||
Lions Gate Entertainment Corp, Cl A * | 128,192 | 1,087 | ||||||
Nexstar Media Group Inc, Cl A | 7,179 | 1,029 | ||||||
Shutterstock Inc | 19,547 | 744 | ||||||
Spok Holdings Inc | 35,270 | 503 | ||||||
TEGNA Inc | 27,168 | 396 | ||||||
Thryv Holdings Inc * | 24,960 | 469 | ||||||
Vimeo Inc * | 106,270 | 376 | ||||||
Yelp Inc, Cl A * | 26,900 | 1,119 | ||||||
Ziff Davis Inc * | 11,667 | 743 | ||||||
| 14,455 | ||||||||
Consumer Discretionary — 10.4% | ||||||||
2U Inc * | 104,090 | 257 | ||||||
Aaron's Co Inc/The | 73,095 | 765 | ||||||
Abercrombie & Fitch Co, Cl A * | 20,317 | 1,145 | ||||||
Accel Entertainment Inc, Cl A * | 80,300 | 879 | ||||||
Advance Auto Parts Inc | 7,259 | 406 | ||||||
American Eagle Outfitters Inc | 34,452 | 572 | ||||||
Bally's Corp * | 21,010 | 275 | ||||||
Beazer Homes USA Inc, Cl A * | 19,768 | 492 | ||||||
Biglari Holdings Inc, Cl B * | 2,946 | 489 | ||||||
BJ's Restaurants Inc * | 29,150 | 684 | ||||||
Description | Shares | Market Value | ||||||
COMMON STOCK (continued) | ||||||||
Bloomin' Brands Inc | 132,179 | $ | 3,250 | |||||
Bluegreen Vacations Holding Corp, Cl A | 27,003 | 991 | ||||||
Brinker International Inc * | 96,965 | 3,063 | ||||||
Brunswick Corp/DE | 15,254 | 1,205 | ||||||
Build-A-Bear Workshop Inc * | 31,550 | 928 | ||||||
Carrols Restaurant Group Inc * | 109,523 | 722 | ||||||
Carter's Inc | 17,942 | 1,241 | ||||||
Century Casinos Inc * | 33,719 | 173 | ||||||
Cheesecake Factory Inc/The | 16,462 | 499 | ||||||
Chico's FAS Inc * | 39,480 | 295 | ||||||
Churchill Downs Inc | 10,515 | 1,220 | ||||||
Chuy's Holdings Inc * | 12,043 | 429 | ||||||
Coursera Inc * | 64,500 | 1,206 | ||||||
Deckers Outdoor Corp * | 627 | 322 | ||||||
Denny's Corp, Cl A * | 27,430 | 232 | ||||||
Designer Brands Inc, Cl A | 47,860 | 606 | ||||||
Destination XL Group Inc * | 49,080 | 220 | ||||||
Dick's Sporting Goods Inc | 6,650 | 722 | ||||||
Domino's Pizza Inc | 3,054 | 1,157 | ||||||
Dorman Products Inc * | 10,123 | 767 | ||||||
Duolingo Inc, Cl A * | 4,651 | 771 | ||||||
El Pollo Loco Holdings Inc * | 15,960 | 143 | ||||||
Ermenegildo Zegna NV | 44,000 | 613 | ||||||
Ethan Allen Interiors Inc | 18,330 | 548 | ||||||
First Watch Restaurant Group Inc * | 55,074 | 952 | ||||||
Frontdoor Inc * | 18,000 | 551 | ||||||
Goodyear Tire & Rubber Co/The * | 33,031 | 411 | ||||||
Hasbro Inc | 7,000 | 463 | ||||||
Hooker Furnishings | 9,015 | 175 | ||||||
Hovnanian Enterprises, Cl A * | 8,390 | 853 | ||||||
Inspired Entertainment Inc * | 75,376 | 902 | ||||||
Latham Group Inc * | 62,881 | 176 | ||||||
Legacy Housing Corp * | 35,791 | 695 | ||||||
Light & Wonder Inc, Cl A * | 7,419 | 529 | ||||||
Lindblad Expeditions Holdings Inc * | 27,420 | 197 | ||||||
M/I Homes Inc * | 4,683 | 394 | ||||||
Marine Products Corp | 14,288 | 203 | ||||||
MarineMax Inc * | 6,130 | 201 | ||||||
MasterCraft Boat Holdings Inc * | 35,620 | 792 | ||||||
Modine Manufacturing Co * | 34,063 | 1,558 | ||||||
Monarch Casino & Resort Inc | 5,395 | 335 | ||||||
Movado Group Inc | 29,036 | 794 | ||||||
Murphy USA Inc | 5,849 | 1,999 | ||||||
OneSpaWorld Holdings Ltd * | 47,366 | 531 | ||||||
Oxford Industries Inc, Cl A | 4,418 | 425 | ||||||
PlayAGS Inc * | 131,258 | 856 | ||||||
Pool Corp | 2,972 | 1,058 | ||||||
Potbelly Corp * | 50,940 | 397 | ||||||
Rush Street Interactive * | 69,830 | 323 | ||||||
Shake Shack Inc, Cl A * | 8,498 | 494 | ||||||
Steven Madden Ltd | 22,016 | 699 | ||||||
Stoneridge Inc * | 6,600 | 132 | ||||||
106
SEI Institutional Managed Trust
Description | Shares | Market Value | ||||||
COMMON STOCK (continued) | ||||||||
Target Hospitality Corp * | 58,667 | $ | 932 | |||||
Topgolf Callaway Brands Corp * | 46,949 | 650 | ||||||
Travel + Leisure Co | 27,154 | 997 | ||||||
Urban Outfitters Inc * | 104,934 | 3,430 | ||||||
Valvoline Inc * | 25,365 | 818 | ||||||
Vera Bradley Inc * | 37,140 | 246 | ||||||
Wingstop Inc, Cl A | 7,632 | 1,373 | ||||||
Xponential Fitness Inc, Cl A * | 29,830 | 462 | ||||||
YETI Holdings Inc * | 18,494 | 892 | ||||||
| 54,182 | ||||||||
Consumer Staples — 4.9% | ||||||||
BellRing Brands Inc * | 29,229 | 1,205 | ||||||
Casey's General Stores Inc | 5,199 | 1,412 | ||||||
Celsius Holdings Inc * | 6,036 | 1,036 | ||||||
Duckhorn Portfolio Inc/The * | 83,700 | 859 | ||||||
elf Beauty Inc * | 9,378 | 1,030 | ||||||
Hain Celestial Group Inc/The * | 29,717 | 308 | ||||||
Hostess Brands Inc, Cl A * | 26,514 | 883 | ||||||
Ingles Markets Inc, Cl A | 6,280 | 473 | ||||||
Ingredion Inc | 9,691 | 954 | ||||||
Inter Parfums Inc | 13,801 | 1,854 | ||||||
Lancaster Colony Corp | 3,568 | 589 | ||||||
Medifast Inc | 18,908 | 1,415 | ||||||
MGP Ingredients Inc | 6,123 | 646 | ||||||
National Beverage Corp, Cl A * | 10,900 | 512 | ||||||
Natural Grocers by Vitamin Cottage Inc | 34,257 | 442 | ||||||
Nature's Sunshine Products Inc * | 47,381 | 785 | ||||||
Performance Food Group Co * | 17,332 | 1,020 | ||||||
Pilgrim's Pride Corp * | 147,871 | 3,376 | ||||||
PriceSmart Inc | 7,900 | 588 | ||||||
Sovos Brands Inc * | 45,129 | 1,018 | ||||||
TreeHouse Foods Inc * | 27,390 | 1,194 | ||||||
USANA Health Sciences Inc * | 18,690 | 1,095 | ||||||
Village Super Market Inc, Cl A | 22,899 | 518 | ||||||
Vita Coco Co Inc/The * | 30,169 | 786 | ||||||
Vital Farms Inc * | 115,284 | 1,335 | ||||||
| 25,333 | ||||||||
Energy — 8.8% | ||||||||
AESI Holdings, Cl A | 19,000 | 422 | ||||||
Arch Resources Inc | 2,400 | 410 | ||||||
Archrock Inc | 43,800 | 552 | ||||||
Berry Corp | 144,640 | 1,186 | ||||||
Bristow Group Inc * | 20,868 | 588 | ||||||
Cactus Inc, Cl A | 20,505 | 1,030 | ||||||
California Resources Corp | 9,200 | 515 | ||||||
Centrus Energy Corp, Cl A * | 28,950 | 1,643 | ||||||
ChampionX Corp | 35,113 | 1,251 | ||||||
Chord Energy Corp | 8,477 | 1,374 | ||||||
Civitas Resources Inc | 32,294 | 2,612 | ||||||
CNX Resources Corp * | 31,912 | 721 | ||||||
CONSOL Energy Inc | 5,700 | 598 | ||||||
Description | Shares | Market Value | ||||||
COMMON STOCK (continued) | ||||||||
Crescent Point Energy Corp | 74,479 | $ | 618 | |||||
Delek US Holdings Inc | 141,101 | 4,009 | ||||||
Diamond Offshore Drilling * | 28,664 | 421 | ||||||
DMC Global Inc * | 44,618 | 1,092 | ||||||
Dorian LPG Ltd * | 22,634 | 650 | ||||||
Energy Fuels Inc/Canada * | 51,000 | 419 | ||||||
Excelerate Energy, Cl A | 52,680 | 898 | ||||||
Expro Group Holdings NV * | 26,899 | 625 | ||||||
Gulfport Energy Corp * | 9,720 | 1,153 | ||||||
Helix Energy Solutions Group Inc * | 57,110 | 638 | ||||||
HF Sinclair Corp | 19,160 | 1,091 | ||||||
Matador Resources Co | 21,318 | 1,268 | ||||||
Noble Corp PLC | 12,462 | 631 | ||||||
Northern Oil and Gas Inc | 49,358 | 1,986 | ||||||
Oceaneering International Inc, Cl A * | 25,621 | 659 | ||||||
Oil States International Inc * | 33,050 | 277 | ||||||
PBF Energy Inc, Cl A | 9,300 | 498 | ||||||
Permian Resources Corp, Cl A | 140,000 | 1,954 | ||||||
Ranger Energy Services Inc, Cl A | 77,738 | 1,102 | ||||||
REX American Resources Corp * | 19,172 | 781 | ||||||
RPC Inc | 69,950 | 625 | ||||||
Select Water Solutions Inc, Cl A | 36,500 | 290 | ||||||
SFL Corp Ltd | 55,446 | 618 | ||||||
Solaris Oilfield Infrastructure Inc, Cl A | 98,826 | 1,053 | ||||||
Southwestern Energy Co * | 427,397 | 2,757 | ||||||
TechnipFMC PLC | 28,492 | 580 | ||||||
Teekay Corp * | 142,750 | 881 | ||||||
Teekay Tankers Ltd, Cl A | 16,728 | 696 | ||||||
TETRA Technologies Inc * | 178,080 | 1,136 | ||||||
Tidewater Inc * | 19,016 | 1,351 | ||||||
Transocean Ltd * | 58,000 | 476 | ||||||
Uranium Energy * | 75,000 | 386 | ||||||
VAALCO Energy Inc | 128,230 | 563 | ||||||
Weatherford International PLC * | 8,183 | 739 | ||||||
| 45,823 | ||||||||
Financials — 17.0% | ||||||||
AFC Gamma Inc ‡ | 22,068 | 259 | ||||||
Affirm Holdings Inc, Cl A * | 18,500 | 393 | ||||||
Amalgamated Financial Corp | 9,130 | 157 | ||||||
A-Mark Precious Metals Inc | 15,880 | 466 | ||||||
Ambac Financial Group Inc * | 81,750 | 986 | ||||||
American Equity Investment Life Holding Co * | 48,578 | 2,606 | ||||||
Arrow Financial Corp | 219 | 4 | ||||||
AssetMark Financial Holdings Inc * | 61,388 | 1,540 | ||||||
Atlanticus Holdings Corp * | 18,686 | 566 | ||||||
AvidXchange Holdings Inc * | 18,800 | 178 | ||||||
Banco Latinoamericano de Comercio Exterior SA, Cl E | 24,276 | 515 | ||||||
Bank OZK | 30,656 | 1,136 | ||||||
Byline Bancorp Inc | 12,540 | 247 | ||||||
Cantaloupe Inc * | 92,688 | 579 | ||||||
SEI Institutional Managed Trust
107
SCHEDULE OF INVESTMENTS
September 30, 2023
Small Cap Fund (Continued)
Description | Shares | Market Value | ||||||
COMMON STOCK (continued) | ||||||||
Capital Bancorp Inc | 11,234 | $ | 215 | |||||
Capital City Bank Group Inc | 18,688 | 557 | ||||||
Carter Bankshares Inc * | 15,208 | 191 | ||||||
Cass Information Systems Inc | 11,720 | 437 | ||||||
Chimera Investment Corp ‡ | 127,610 | 697 | ||||||
City Holding Co | 6,300 | 569 | ||||||
Civista Bancshares Inc | 18,241 | 283 | ||||||
CNO Financial Group Inc | 158,281 | 3,756 | ||||||
Coastal Financial Corp/WA * | 19,077 | 819 | ||||||
Cohen & Steers Inc | 17,248 | 1,081 | ||||||
Columbia Banking System Inc | 210,818 | 4,280 | ||||||
Comerica Inc | 25,230 | 1,048 | ||||||
Crawford & Co, Cl A | 80,921 | 756 | ||||||
CrossFirst Bankshares Inc * | 22,630 | 228 | ||||||
Enova International Inc * | 4,110 | 209 | ||||||
Esquire Financial Holdings Inc | 15,584 | 712 | ||||||
Essent Group Ltd | 12,200 | 577 | ||||||
FactSet Research Systems Inc | 2,616 | 1,144 | ||||||
Federal Agricultural Mortgage Corp, Cl C | 2,850 | 440 | ||||||
First American Financial Corp | 16,600 | 938 | ||||||
First Commonwealth Financial Corp | 148,190 | 1,809 | ||||||
First Community Bankshares Inc | 17,640 | 520 | ||||||
First Financial Corp/IN | 5,780 | 195 | ||||||
First Interstate BancSystem Inc, Cl A | 47,080 | 1,174 | ||||||
FirstCash Holdings Inc | 6,329 | 635 | ||||||
Flywire Corp * | 20,800 | 663 | ||||||
FNB Corp/PA | 178,033 | 1,921 | ||||||
Globe Life Inc | 8,871 | 965 | ||||||
Goosehead Insurance Inc, Cl A * | 14,600 | 1,088 | ||||||
Great Southern Bancorp Inc | 8,100 | 388 | ||||||
Hamilton Lane Inc, Cl A | 21,603 | 1,954 | ||||||
Hanmi Financial Corp | 8,180 | 133 | ||||||
Hanover Insurance Group Inc/The, Cl A | 8,000 | 888 | ||||||
HBT Financial Inc | 25,000 | 456 | ||||||
HCI Group Inc | 4,190 | 227 | ||||||
Heritage Commerce Corp | 44,663 | 378 | ||||||
Heritage Global Inc * | 167,777 | 523 | ||||||
Heritage Insurance Holdings Inc * | 136,568 | 886 | ||||||
Home BancShares Inc/AR | 54,565 | 1,143 | ||||||
HomeTrust Bancshares Inc | 17,390 | 377 | ||||||
I3 Verticals Inc, Cl A * | 8,772 | 185 | ||||||
Independent Bank Corp | 18,430 | 905 | ||||||
Independent Bank Corp/MI | 15,040 | 276 | ||||||
International Money Express Inc * | 22,527 | 381 | ||||||
Jack Henry & Associates Inc | 7,054 | 1,066 | ||||||
Jackson Financial Inc, Cl A | 49,477 | 1,891 | ||||||
KeyCorp | 171,414 | 1,844 | ||||||
Kinsale Capital Group Inc | 3,997 | 1,655 | ||||||
Lincoln National Corp | 122,589 | 3,027 | ||||||
Macatawa Bank Corp | 53,210 | 477 | ||||||
Mercantile Bank Corp | 12,752 | 394 | ||||||
Merchants Bancorp/IN | 39,590 | 1,097 | ||||||
Description | Shares | Market Value | ||||||
COMMON STOCK (continued) | ||||||||
Metrocity Bankshares Inc | 7,846 | $ | 154 | |||||
MGIC Investment Corp | 50,530 | 843 | ||||||
Morningstar Inc, Cl A | 4,300 | 1,007 | ||||||
Mr Cooper Group Inc * | 19,100 | 1,023 | ||||||
National Bank Holdings Corp, Cl A | 12,000 | 357 | ||||||
New York Community Bancorp Inc | 34,000 | 386 | ||||||
NMI Holdings Inc, Cl A * | 58,223 | 1,577 | ||||||
Northrim BanCorp Inc | 3,210 | 127 | ||||||
OFG Bancorp | 42,797 | 1,278 | ||||||
Old National Bancorp/IN, Cl A | 257,038 | 3,737 | ||||||
Old Second Bancorp Inc | 35,080 | 477 | ||||||
Orrstown Financial Services Inc | 16,710 | 351 | ||||||
Oscar Health Inc, Cl A * | 90,000 | 501 | ||||||
Paymentus Holdings, Cl A * | 38,600 | 641 | ||||||
Payoneer Global Inc * | 102,000 | 624 | ||||||
Paysafe Ltd * | 45,197 | 542 | ||||||
Peapack-Gladstone Financial Corp | 9,550 | 245 | ||||||
PennyMac Financial Services Inc | 5,158 | 344 | ||||||
Peoples Bancorp Inc/OH | 6,720 | 171 | ||||||
Peoples Financial Services Corp | 6,214 | 249 | ||||||
Pinnacle Financial Partners Inc | 16,823 | 1,128 | ||||||
Primerica Inc | 7,183 | 1,394 | ||||||
Prosperity Bancshares Inc | 15,189 | 829 | ||||||
Regional Management Corp | 25,347 | 702 | ||||||
Remitly Global Inc * | 52,262 | 1,318 | ||||||
Repay Holdings Corp, Cl A * | 30,830 | 234 | ||||||
Security National Financial Corp, Cl A * | 15,270 | 120 | ||||||
Selectquote Inc * | 247,220 | 289 | ||||||
Sierra Bancorp | 18,880 | 358 | ||||||
Skyward Specialty Insurance Group * | 16,000 | 438 | ||||||
Southern Missouri Bancorp Inc | 3,011 | 117 | ||||||
Stellar Bancorp Inc | 8,250 | 176 | ||||||
StepStone Group Inc, Cl A | 14,875 | 470 | ||||||
Summit Financial Group Inc | 7,280 | 164 | ||||||
Third Coast Bancshares Inc * | 29,915 | 512 | ||||||
Universal Insurance Holdings Inc | 55,435 | 777 | ||||||
Univest Financial Corp | 50,472 | 877 | ||||||
Valley National Bancorp | 110,000 | 942 | ||||||
Wintrust Financial Corp | 19,356 | 1,461 | ||||||
World Acceptance Corp * | 8,363 | 1,063 | ||||||
Zions Bancorp NA | 59,002 | 2,059 | ||||||
| 88,152 | ||||||||
Health Care — 14.4% | ||||||||
ACADIA Pharmaceuticals Inc * | 19,899 | 415 | ||||||
ADMA Biologics Inc * | 250,692 | 897 | ||||||
Akero Therapeutics Inc * | 10,524 | 532 | ||||||
Alector Inc * | 82,500 | 535 | ||||||
Alignment Healthcare * | 44,940 | 312 | ||||||
Alkermes PLC * | 21,000 | 588 | ||||||
ALX Oncology Holdings Inc * | 76,127 | 365 | ||||||
Amedisys Inc * | 11,475 | 1,072 | ||||||
Amicus Therapeutics Inc * | 48,928 | 595 | ||||||
108
SEI Institutional Managed Trust
Description | Shares | Market Value | ||||||
COMMON STOCK (continued) | ||||||||
AMN Healthcare Services Inc * | 40,418 | $ | 3,443 | |||||
Amneal Pharmaceuticals Inc * | 110,670 | 467 | ||||||
Amphastar Pharmaceuticals Inc * | 12,707 | 584 | ||||||
ANI Pharmaceuticals Inc * | 20,407 | 1,185 | ||||||
Anika Therapeutics Inc * | 7,330 | 137 | ||||||
Arcturus Therapeutics Holdings Inc * | 2,754 | 70 | ||||||
AtriCure Inc * | 12,721 | 557 | ||||||
Avidity Biosciences Inc * | 31,050 | 198 | ||||||
Avita Medical * | 23,206 | 339 | ||||||
Axonics Inc * | 8,780 | 493 | ||||||
Axsome Therapeutics Inc * | 5,411 | 378 | ||||||
Biohaven Ltd * | 15,000 | 390 | ||||||
Bridgebio Pharma Inc * | 15,813 | 417 | ||||||
Brookdale Senior Living Inc, Cl A * | 146,028 | 605 | ||||||
CareDx Inc * | 51,950 | 364 | ||||||
Castle Biosciences Inc * | 9,520 | 161 | ||||||
Catalyst Pharmaceuticals Inc * | 41,309 | 483 | ||||||
Chemed Corp | 2,086 | 1,084 | ||||||
Coherus Biosciences Inc * | 39,230 | 147 | ||||||
Collegium Pharmaceutical Inc * | 83,315 | 1,862 | ||||||
Community Health Systems Inc * | 41,440 | 120 | ||||||
Computer Programs and Systems Inc * | 7,880 | 126 | ||||||
Corcept Therapeutics Inc * | 18,000 | 490 | ||||||
Crinetics Pharmaceuticals Inc * | 15,000 | 446 | ||||||
Cross Country Healthcare Inc * | 116,117 | 2,879 | ||||||
Cymabay Therapeutics Inc * | 74,613 | 1,113 | ||||||
Disc Medicine Inc, Cl A * | 10,250 | 482 | ||||||
Eagle Pharmaceuticals Inc/DE * | 28,650 | 452 | ||||||
Emergent BioSolutions Inc * | 84,400 | 287 | ||||||
Encompass Health Corp | 42,441 | 2,850 | ||||||
Ensign Group Inc/The | 15,898 | 1,477 | ||||||
Envista Holdings Corp * | 26,311 | 734 | ||||||
Generation Bio Co * | 35,081 | 133 | ||||||
Glaukos Corp * | 8,124 | 611 | ||||||
Globus Medical Inc, Cl A * | 11,111 | 552 | ||||||
GoodRx Holdings, Cl A * | 95,308 | 537 | ||||||
Haemonetics Corp * | 7,354 | 659 | ||||||
HealthEquity Inc * | 17,675 | 1,291 | ||||||
HealthStream Inc | 60,564 | 1,307 | ||||||
Heron Therapeutics Inc * | 110,681 | 114 | ||||||
Hims & Hers Health Inc * | 64,527 | 406 | ||||||
Ideaya Biosciences * | 15,500 | 418 | ||||||
ImmunoGen Inc * | 67,505 | 1,071 | ||||||
Immunovant Inc * | 19,598 | 752 | ||||||
Inmode * | 29,000 | 883 | ||||||
Innoviva Inc * | 32,903 | 427 | ||||||
Insmed Inc * | 19,200 | 485 | ||||||
Integra LifeSciences Holdings Corp * | 73,686 | 2,814 | ||||||
Intra-Cellular Therapies Inc, Cl A * | 10,649 | 555 | ||||||
Ionis Pharmaceuticals Inc * | 8,500 | 386 | ||||||
iRadimed Corp * | 34,995 | 1,553 | ||||||
iTeos Therapeutics Inc * | 55,633 | 609 | ||||||
Description | Shares | Market Value | ||||||
COMMON STOCK (continued) | ||||||||
Kiniksa Pharmaceuticals Ltd, Cl A * | 88,767 | $ | 1,542 | |||||
Kodiak Sciences Inc * | 79,980 | 144 | ||||||
Krystal Biotech Inc * | 2,981 | 346 | ||||||
LeMaitre Vascular Inc | 31,956 | 1,741 | ||||||
MacroGenics Inc * | 27,910 | 130 | ||||||
Medpace Holdings Inc * | 1,780 | 431 | ||||||
Merit Medical Systems Inc * | 8,907 | 615 | ||||||
Mersana Therapeutics Inc * | 104,370 | 133 | ||||||
MiMedx Group Inc * | 59,547 | 434 | ||||||
Mirum Pharmaceuticals Inc * | 22,130 | 699 | ||||||
NanoString Technologies Inc * | 72,090 | 124 | ||||||
NeoGenomics Inc * | 34,250 | 421 | ||||||
Nurix Therapeutics Inc * | 58,940 | 463 | ||||||
OptimizeRx Corp * | 15,765 | 123 | ||||||
Option Care Health Inc * | 20,188 | 653 | ||||||
OraSure Technologies Inc * | 180,480 | 1,070 | ||||||
Organogenesis Holdings Inc, Cl A * | 209,125 | 665 | ||||||
Orthofix Medical Inc * | 16,710 | 215 | ||||||
Patterson Cos Inc | 19,100 | 566 | ||||||
Pennant Group Inc/The * | 26,170 | 291 | ||||||
Perrigo Co PLC | 33,066 | 1,056 | ||||||
PetIQ Inc, Cl A * | 20,520 | 404 | ||||||
Phreesia Inc * | 20,517 | 383 | ||||||
PMV Pharmaceuticals Inc * | 23,520 | 144 | ||||||
Prestige Consumer Healthcare Inc, Cl A * | 28,348 | 1,621 | ||||||
Privia Health Group Inc * | 7,110 | 164 | ||||||
Quanterix Corp * | 37,679 | 1,023 | ||||||
Quest Diagnostics Inc | 7,703 | 939 | ||||||
QuidelOrtho Corp * | 9,203 | 672 | ||||||
Rigel Pharmaceuticals Inc * | 193,906 | 209 | ||||||
RxSight Inc * | 18,229 | 508 | ||||||
Sana Biotechnology Inc * | 71,100 | 275 | ||||||
SI-BONE Inc * | 28,000 | 595 | ||||||
SIGA Technologies Inc * | 148,320 | 779 | ||||||
Simulations Plus Inc | 3,300 | 138 | ||||||
Soleno Therapeutics * | 14,300 | 422 | ||||||
STERIS PLC | 6,457 | 1,417 | ||||||
Stoke Therapeutics Inc * | 25,214 | 99 | ||||||
Surgery Partners Inc * | 14,600 | 427 | ||||||
Surmodics Inc * | 34,252 | 1,099 | ||||||
Sutro Biopharma Inc * | 36,157 | 125 | ||||||
Tango Therapeutics Inc * | 37,000 | 417 | ||||||
TransMedics Group Inc * | 6,123 | 335 | ||||||
UFP Technologies Inc * | 2,456 | 397 | ||||||
UroGen Pharma * | 18,700 | 262 | ||||||
US Physical Therapy Inc | 12,113 | 1,111 | ||||||
Utah Medical Products Inc | 2,416 | 208 | ||||||
Vanda Pharmaceuticals Inc * | 219,757 | 949 | ||||||
Viemed Healthcare Inc * | 79,707 | 536 | ||||||
Voyager Therapeutics Inc * | 52,266 | 405 | ||||||
Y-mAbs Therapeutics Inc * | 141,600 | 772 | ||||||
SEI Institutional Managed Trust
109
SCHEDULE OF INVESTMENTS
September 30, 2023
Small Cap Fund (Continued)
Description | Shares | Market Value | ||||||
COMMON STOCK (continued) | ||||||||
Zimvie Inc * | 15,340 | $ | 144 | |||||
| 74,535 | ||||||||
Industrials — 21.1% | ||||||||
AAON Inc | 10,537 | 599 | ||||||
AAR Corp * | 10,500 | 625 | ||||||
ABM Industries Inc | 107,733 | 4,310 | ||||||
ACCO Brands Corp | 365,567 | 2,098 | ||||||
AeroVironment Inc * | 10,700 | 1,193 | ||||||
Air Lease Corp, Cl A | 26,625 | 1,049 | ||||||
Alamo Group Inc | 3,165 | 547 | ||||||
Allison Transmission Holdings Inc | 17,137 | 1,012 | ||||||
API Group Corp * | 26,196 | 679 | ||||||
Applied Industrial Technologies Inc, Cl A | 8,544 | 1,321 | ||||||
ArcBest Corp | 3,387 | 344 | ||||||
Archer Aviation, Cl A *(A) | 64,407 | 326 | ||||||
Arcosa Inc | 6,024 | 433 | ||||||
Argan Inc | 10,854 | 494 | ||||||
Aris Water Solutions, Cl A | 12,520 | 125 | ||||||
Astec Industries Inc | 14,200 | 669 | ||||||
Astronics Corp * | 35,930 | 570 | ||||||
Asure Software Inc * | 47,402 | 448 | ||||||
AZEK Co Inc/The, Cl A * | 32,490 | 966 | ||||||
Babcock & Wilcox Enterprises * | 180,939 | 762 | ||||||
Barrett Business Services Inc | 9,003 | 812 | ||||||
Blue Bird Corp * | 11,198 | 239 | ||||||
Boise Cascade Co | 4,609 | 475 | ||||||
Booz Allen Hamilton Holding Corp, Cl A | 12,038 | 1,315 | ||||||
BrightView Holdings Inc * | 125,730 | 974 | ||||||
Brink's Co/The | 8,800 | 639 | ||||||
Broadridge Financial Solutions Inc | 7,396 | 1,324 | ||||||
BWX Technologies Inc, Cl W | 39,122 | 2,933 | ||||||
CACI International Inc, Cl A * | 3,577 | 1,123 | ||||||
Carlisle Cos Inc | 4,335 | 1,124 | ||||||
Cimpress PLC * | 7,523 | 527 | ||||||
CIRCOR International Inc * | 14,346 | 800 | ||||||
Clean Harbors Inc * | 8,473 | 1,418 | ||||||
Comfort Systems USA Inc | 6,897 | 1,175 | ||||||
Commercial Vehicle Group Inc * | 108,084 | 839 | ||||||
Construction Partners Inc, Cl A * | 17,500 | 640 | ||||||
Costamare Inc | 107,614 | 1,035 | ||||||
Covenant Logistics Group Inc, Cl A | 7,950 | 349 | ||||||
CSG Systems International Inc | 10,461 | 535 | ||||||
CSW Industrials Inc | 3,518 | 617 | ||||||
Curtiss-Wright Corp | 2,600 | 509 | ||||||
Daseke Inc * | 11,866 | 61 | ||||||
Distribution Solutions Group * | 10,060 | 262 | ||||||
DXP Enterprises Inc/TX * | 31,049 | 1,085 | ||||||
Eagle Bulk Shipping Inc | 15,940 | 670 | ||||||
EMCOR Group Inc | 11,360 | 2,390 | ||||||
Enerpac Tool Group Corp, Cl A | 21,925 | 580 | ||||||
EnerSys | 6,430 | 609 | ||||||
Ennis Inc | 55,013 | 1,167 | ||||||
Description | Shares | Market Value | ||||||
COMMON STOCK (continued) | ||||||||
EnPro Industries Inc | 9,177 | $ | 1,112 | |||||
Enviri * | 36,576 | 264 | ||||||
ExlService Holdings Inc * | 25,150 | 705 | ||||||
First Advantage Corp * | 14,080 | 194 | ||||||
Forrester Research Inc * | 6,868 | 199 | ||||||
Franklin Covey Co * | 26,852 | 1,153 | ||||||
FTAI Aviation Ltd | 17,645 | 627 | ||||||
Gates Industrial Corp PLC * | 52,487 | 609 | ||||||
GATX Corp | 4,449 | 484 | ||||||
Genco Shipping & Trading Ltd | 11,253 | 157 | ||||||
GFL Environmental Inc | 37,105 | 1,178 | ||||||
Gibraltar Industries Inc * | 8,700 | 587 | ||||||
Global Industrial | 8,560 | 287 | ||||||
Gorman-Rupp Co/The | 17,597 | 579 | ||||||
H&E Equipment Services Inc | 14,952 | 646 | ||||||
Heidrick & Struggles International Inc | 16,326 | 408 | ||||||
Heritage-Crystal Clean Inc * | 13,316 | 604 | ||||||
Hexcel Corp, Cl A | 11,302 | 736 | ||||||
Hudson Technologies Inc * | 124,700 | 1,659 | ||||||
Huron Consulting Group Inc * | 31,298 | 3,260 | ||||||
Hyster-Yale Materials Handling Inc | 31,923 | 1,423 | ||||||
IBEX Holdings Ltd * | 52,964 | 818 | ||||||
ICF International Inc, Cl A | 3,950 | 477 | ||||||
IES Holdings * | 5,400 | 356 | ||||||
Insperity Inc, Cl A | 11,170 | 1,090 | ||||||
Interface Inc, Cl A | 13,960 | 137 | ||||||
ITT Inc | 14,803 | 1,449 | ||||||
Karat Packaging | 26,435 | 610 | ||||||
Kelly Services Inc, Cl A | 28,640 | 521 | ||||||
Kennametal Inc | 17,426 | 434 | ||||||
Kirby Corp * | 5,800 | 480 | ||||||
Korn Ferry | 17,911 | 850 | ||||||
L B Foster Co, Cl A * | 35,000 | 662 | ||||||
Landstar System Inc | 5,648 | 999 | ||||||
Legalzoom.com Inc * | 57,353 | 627 | ||||||
LSI Industries Inc | 35,810 | 569 | ||||||
Manitowoc Co Inc/The * | 67,453 | 1,015 | ||||||
Masonite International Corp * | 10,679 | 996 | ||||||
McGrath RentCorp | 6,433 | 645 | ||||||
Mistras Group * | 34,678 | 189 | ||||||
MSA Safety Inc | 1,977 | 312 | ||||||
MYR Group Inc * | 4,073 | 549 | ||||||
National Presto Industries Inc | 1,860 | 135 | ||||||
Nordson Corp | 4,792 | 1,069 | ||||||
nVent Electric PLC | 10,886 | 577 | ||||||
Owens Corning | 4,449 | 607 | ||||||
PAM Transportation Services Inc * | 19,264 | 415 | ||||||
Park-Ohio Holdings Corp | 31,827 | 634 | ||||||
Parsons Corp * | 20,391 | 1,108 | ||||||
Powell Industries Inc | 21,723 | 1,801 | ||||||
Preformed Line Products Co | 2,150 | 350 | ||||||
Primoris Services Corp | 37,914 | 1,241 | ||||||
110
SEI Institutional Managed Trust
Description | Shares | Market Value | ||||||
COMMON STOCK (continued) | ||||||||
Radiant Logistics Inc * | 93,631 | $ | 529 | |||||
Regal Rexnord Corp | 6,392 | 913 | ||||||
REV Group Inc | 50,034 | 801 | ||||||
Rush Enterprises Inc, Cl A | 18,573 | 758 | ||||||
Safe Bulkers Inc | 124,042 | 402 | ||||||
Simpson Manufacturing Co Inc | 7,285 | 1,091 | ||||||
SkyWest Inc * | 11,904 | 499 | ||||||
SP Plus Corp * | 15,279 | 552 | ||||||
SPX Technologies Inc * | 12,849 | 1,046 | ||||||
Standex International Corp | 20,810 | 3,032 | ||||||
Steelcase Inc, Cl A | 69,493 | 776 | ||||||
Sterling Infrastructure Inc * | 13,862 | 1,019 | ||||||
Tennant Co | 7,200 | 534 | ||||||
Terex Corp | 25,485 | 1,468 | ||||||
Tetra Tech Inc | 8,095 | 1,231 | ||||||
Thermon Group Holdings Inc * | 22,200 | 610 | ||||||
Transcat Inc * | 3,900 | 382 | ||||||
TransUnion | 13,631 | 979 | ||||||
TriNet Group Inc * | 4,800 | 559 | ||||||
TTEC Holdings Inc | 19,336 | 507 | ||||||
UFP Industries Inc | 9,452 | 968 | ||||||
UniFirst Corp/MA | 5,282 | 861 | ||||||
Upwork Inc * | 68,232 | 775 | ||||||
V2X Inc * | 13,330 | 689 | ||||||
Valmont Industries Inc | 7,501 | 1,802 | ||||||
Vertiv Holdings Co, Cl A | 18,481 | 688 | ||||||
Vicor Corp * | 6,600 | 389 | ||||||
Watts Water Technologies Inc, Cl A | 3,200 | 553 | ||||||
WESCO International Inc | 6,190 | 890 | ||||||
Willis Lease Finance * | 3,840 | 162 | ||||||
XPO Inc * | 8,560 | 639 | ||||||
| 109,493 | ||||||||
Information Technology — 11.4% | ||||||||
8x8 Inc * | 266,830 | 672 | ||||||
A10 Networks Inc | 33,569 | 505 | ||||||
ACM Research Inc, Cl A * | 57,724 | 1,045 | ||||||
Aehr Test Systems * | 10,554 | 482 | ||||||
Agilysys Inc * | 6,148 | 407 | ||||||
Alkami Technology Inc * | 35,221 | 642 | ||||||
Amplitude Inc, Cl A * | 19,220 | 222 | ||||||
Appfolio Inc, Cl A * | 6,105 | 1,115 | ||||||
Applied Optoelectronics Inc * | 30,000 | 329 | ||||||
AppLovin Corp, Cl A * | 15,437 | 617 | ||||||
Arlo Technologies Inc * | 83,009 | 855 | ||||||
Aviat Networks Inc * | 15,520 | 484 | ||||||
Axcelis Technologies Inc * | 5,416 | 883 | ||||||
Badger Meter Inc | 7,479 | 1,076 | ||||||
Belden Inc | 20,488 | 1,978 | ||||||
Blackbaud Inc, Cl A * | 6,330 | 445 | ||||||
Clearfield Inc * | 10,455 | 300 | ||||||
Cognex Corp | 19,794 | 840 | ||||||
CommVault Systems Inc * | 8,714 | 589 | ||||||
Description | Shares | Market Value | ||||||
COMMON STOCK (continued) | ||||||||
Credo Technology Group Holding Ltd * | 25,420 | $ | 388 | |||||
Digi International Inc * | 16,512 | 446 | ||||||
Diodes Inc * | 10,486 | 827 | ||||||
Dropbox Inc, Cl A * | 12,041 | 328 | ||||||
eGain Corp * | 54,866 | 336 | ||||||
Elastic NV * | 6,500 | 528 | ||||||
Entegris Inc | 4,059 | 381 | ||||||
Extreme Networks Inc * | 22,060 | 534 | ||||||
Fabrinet * | 7,736 | 1,289 | ||||||
Fastly Inc, Cl A * | 56,728 | 1,087 | ||||||
Freshworks, Cl A * | 53,691 | 1,069 | ||||||
Hackett Group Inc/The | 20,465 | 483 | ||||||
Harmonic Inc, Cl A * | 136,693 | 1,316 | ||||||
Immersion Corp | 66,120 | 437 | ||||||
Intapp Inc * | 16,754 | 562 | ||||||
IonQ Inc * | 22,851 | 340 | ||||||
Iteris Inc * | 122,683 | 508 | ||||||
Itron Inc * | 8,475 | 513 | ||||||
Kimball Electronics Inc * | 14,930 | 409 | ||||||
Kulicke & Soffa Industries Inc | 22,931 | 1,115 | ||||||
Littelfuse Inc | 4,309 | 1,066 | ||||||
LivePerson Inc * | 30,990 | 121 | ||||||
LiveRamp Holdings Inc * | 21,000 | 606 | ||||||
Lumentum Holdings Inc * | 19,469 | 880 | ||||||
MACOM Technology Solutions Holdings Inc * | 7,607 | 621 | ||||||
Mitek Systems Inc * | 15,216 | 163 | ||||||
National Instruments Corp | 7,033 | 419 | ||||||
Nutanix Inc, Cl A * | 14,500 | 506 | ||||||
Olo Inc, Cl A * | 29,960 | 182 | ||||||
Onto Innovation Inc * | 6,927 | 883 | ||||||
OSI Systems Inc * | 7,655 | 904 | ||||||
PAR Technology * | 11,400 | 439 | ||||||
PC Connection Inc | 22,107 | 1,180 | ||||||
PDF Solutions Inc * | 18,040 | 584 | ||||||
Photronics Inc * | 225,754 | 4,562 | ||||||
Power Integrations Inc | 14,039 | 1,071 | ||||||
PROS Holdings Inc * | 17,700 | 613 | ||||||
Pure Storage Inc, Cl A * | 10,989 | 391 | ||||||
Qualys Inc * | 3,727 | 569 | ||||||
Rambus Inc * | 14,677 | 819 | ||||||
Ribbon Communications Inc * | 43,490 | 117 | ||||||
Rimini Street Inc * | 63,420 | 139 | ||||||
Sanmina Corp * | 7,849 | 426 | ||||||
Sapiens International Corp NV | 19,300 | 549 | ||||||
Silicon Laboratories Inc * | 4,375 | 507 | ||||||
Silicon Motion Technology Corp ADR * | 52,153 | 2,673 | ||||||
SolarWinds Corp * | 65,680 | 620 | ||||||
Sprinklr Inc, Cl A * | 75,893 | 1,050 | ||||||
SPS Commerce Inc * | 3,501 | 597 | ||||||
Squarespace Inc, Cl A * | 19,314 | 560 | ||||||
Super Micro Computer Inc * | 9,951 | 2,729 | ||||||
SEI Institutional Managed Trust
111
SCHEDULE OF INVESTMENTS
September 30, 2023
Small Cap Fund (Concluded)
Description | Shares | Market Value | ||||||
COMMON STOCK (continued) | ||||||||
Tenable Holdings Inc * | 14,170 | $ | 635 | |||||
Unisys Corp * | 72,670 | 251 | ||||||
Universal Display Corp | 11,228 | 1,763 | ||||||
Veeco Instruments Inc * | 13,895 | 391 | ||||||
Viavi Solutions Inc * | 119,194 | 1,089 | ||||||
Vishay Precision Group Inc * | 25,420 | 854 | ||||||
Workiva Inc, Cl A * | 6,514 | 660 | ||||||
Yext Inc * | 60,078 | 380 | ||||||
Zuora Inc, Cl A * | 63,168 | 520 | ||||||
| 59,471 | ||||||||
Materials — 4.1% | ||||||||
Alpha Metallurgical Resources Inc | 2,450 | 636 | ||||||
AptarGroup Inc | 3,750 | 469 | ||||||
Axalta Coating Systems Ltd * | 38,918 | 1,047 | ||||||
Cabot Corp | 8,263 | 572 | ||||||
Carpenter Technology Corp | 19,532 | 1,313 | ||||||
Chase Corp | 3,260 | 415 | ||||||
Clearwater Paper Corp * | 33,400 | 1,211 | ||||||
Commercial Metals Co, Cl A | 63,979 | 3,161 | ||||||
Eagle Materials Inc | 2,526 | 421 | ||||||
Element Solutions Inc | 47,477 | 931 | ||||||
Hawkins Inc | 8,700 | 512 | ||||||
Haynes International Inc | 15,389 | 716 | ||||||
Ingevity Corp * | 20,665 | 984 | ||||||
Innospec Inc | 4,987 | 510 | ||||||
Koppers Holdings Inc | 13,800 | 546 | ||||||
Livent Corp * | 52,259 | 962 | ||||||
O-I Glass Inc, Cl I * | 60,729 | 1,016 | ||||||
Olympic Steel Inc | 5,388 | 303 | ||||||
Quaker Chemical Corp | 8,544 | 1,367 | ||||||
Reliance Steel & Aluminum Co | 5,740 | 1,505 | ||||||
Silgan Holdings Inc | 19,214 | 828 | ||||||
SunCoke Energy Inc | 63,890 | 648 | ||||||
Universal Stainless & Alloy Products Inc * | 42,800 | 561 | ||||||
Worthington Industries Inc | 8,418 | 520 | ||||||
| 21,154 | ||||||||
Real Estate — 2.9% | ||||||||
Alexander's Inc ‡ | 1,640 | 299 | ||||||
Braemar Hotels & Resorts Inc ‡ | 70,000 | 194 | ||||||
Corporate Office Properties Trust ‡ | 33,968 | 810 | ||||||
CubeSmart ‡ | 23,900 | 911 | ||||||
Douglas Elliman Inc * | 64,650 | 146 | ||||||
Essential Properties Realty Trust Inc ‡ | 26,067 | 564 | ||||||
eXp World Holdings Inc | 65,705 | 1,067 | ||||||
Forestar Group Inc * | 40,398 | 1,088 | ||||||
Hersha Hospitality Trust, Cl A ‡ | 23,640 | 233 | ||||||
Highwoods Properties Inc ‡ | 66,538 | 1,371 | ||||||
Kennedy-Wilson Holdings Inc | 54,917 | 810 | ||||||
National Storage Affiliates Trust ‡ | 24,328 | 772 | ||||||
Newmark Group Inc, Cl A | 127,556 | 820 | ||||||
NexPoint Residential Trust Inc ‡ | 21,941 | 706 | ||||||
Description | Shares | Market Value | ||||||
COMMON STOCK (continued) | ||||||||
Orion Office Inc ‡ | 166,860 | $ | 869 | |||||
RMR Group Inc/The, Cl A | 25,058 | 615 | ||||||
Ryman Hospitality Properties Inc ‡ | 7,098 | 591 | ||||||
St Joe Co/The | 8,200 | 446 | ||||||
STAG Industrial Inc ‡ | 38,927 | 1,343 | ||||||
Tanger Factory Outlet Centers Inc ‡ | 22,155 | 501 | ||||||
Terreno Realty Corp ‡ | 16,410 | 932 | ||||||
Universal Health Realty Income Trust ‡ | 3,100 | 125 | ||||||
| 15,213 | ||||||||
Utilities — 1.2% | ||||||||
American States Water Co | 7,000 | 551 | ||||||
Black Hills Corp, Cl A | 12,481 | 631 | ||||||
Brookfield Infrastructure Corp, Cl A | 28,859 | 1,020 | ||||||
Chesapeake Utilities Corp | 9,205 | 900 | ||||||
Genie Energy Ltd, Cl B | 15,950 | 235 | ||||||
IDACORP Inc, Cl A | 9,935 | 930 | ||||||
Portland General Electric Co | 33,774 | 1,367 | ||||||
Pure Cycle Corp * | 14,410 | 138 | ||||||
Spire Inc | 8,900 | 504 | ||||||
| 6,276 | ||||||||
Total Common Stock | ||||||||
(Cost $454,140) ($ Thousands) | 514,087 | |||||||
AFFILIATED PARTNERSHIP — 0.1% | ||||||||
SEI Liquidity Fund, LP | ||||||||
5.410% **†(B) | 380,379 | 381 | ||||||
Total Affiliated Partnership | ||||||||
(Cost $380) ($ Thousands) | 381 | |||||||
CASH EQUIVALENT — 1.0% | ||||||||
SEI Daily Income Trust, Government Fund, Institutional Class | ||||||||
5.210%**† | 5,314,121 | 5,314 | ||||||
Total Cash Equivalent | ||||||||
(Cost $5,314) ($ Thousands) | 5,314 | |||||||
Total Investments in Securities — 100.1% | ||||||||
(Cost $459,834) ($ Thousands) | $ | 519,782 | ||||||
112
SEI Institutional Managed Trust
| Percentages are based on Net Assets of $519,328 ($ Thousands). |
* | Non-income producing security. |
** | The rate reported is the 7-day effective yield as of September 30, 2023. |
‡ | Real Estate Investment Trust. |
† | Investment in Affiliated Security (see Note 6). |
(A) | Certain securities or partial positions of certain securities are on loan at September 30, 2023. |
(B) | This security was purchased with cash collateral held from securities on loan (see Note 12). The total market value of such securities as of September 30, 2023 was $381 ($ Thousands). |
The following is a summary of the level of inputs used as of September 30, 2023, in valuing the Fund's investments and other financial instruments carried at value ($ Thousands): | ||||||||||||||||
Investments in Securities | Level 1 | Level 2 | Level 3 | Total | ||||||||||||
Common Stock | 514,087 | – | – | 514,087 | ||||||||||||
Affiliated Partnership | – | 381 | – | 381 | ||||||||||||
Cash Equivalent | 5,314 | – | – | 5,314 | ||||||||||||
Total Investments in Securities | 519,401 | 381 | – | 519,782 | ||||||||||||
Amounts designated as “—” are either $0 or have been rounded to $0.
For more information on valuation inputs, see Note 2 — Significant Accounting Policies in Notes to Financial Statements.
The following is a summary of the Fund’s transactions with affiliates for the year ended September 30, 2023 ($ Thousands):
Security Description | Value | Purchases | Proceeds | Realized Gain/(Loss) | Change in Unrealized Appreciation/(Depreciation) | Value | Income | Capital Gains | ||||||||||||||||||||||||
SEI Liquidity Fund, LP | $ | 2,751 | $ | 20,127 | $ | (22,497 | ) | $ | — | $ | — | $ | 381 | $ | 31 | $ | — | |||||||||||||||
SEI Daily Income Trust, Government Fund, | 9,050 | 161,889 | (165,625 | ) | — | — | 5,314 | 294 | — | |||||||||||||||||||||||
Totals | $ | 11,801 | $ | 182,016 | $ | (188,122 | ) | $ | – | $ | – | $ | 5,695 | $ | 325 | $ | — | |||||||||||||||
Amounts designated as “—” are either $0 or have been rounded to $0.
See “Glossary” for abbreviations.
The accompanying notes are an integral part of the financial statements.
SEI Institutional Managed Trust
113
SCHEDULE OF INVESTMENTS
September 30, 2023
Small Cap Value Fund
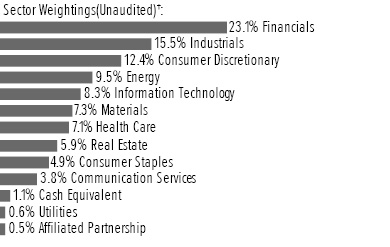
† | Percentages are based on total investments. Total investments do not include derivatives such as options, futures contracts, forward contracts, and swap contracts, if applicable. |
Description | Shares | Market Value | ||||||
COMMON STOCK — 98.8% | ||||||||
Communication Services — 3.8% | ||||||||
Advantage Solutions Inc * | 30,014 | $ | 85 | |||||
AMC Networks Inc, Cl A * | 18,606 | 219 | ||||||
Cargurus Inc, Cl A * | 2,575 | 45 | ||||||
Cinemark Holdings Inc * | 148,325 | 2,722 | ||||||
EchoStar Corp, Cl A * | 11,083 | 186 | ||||||
Entravision Communications Corp, Cl A | 16,827 | 62 | ||||||
John Wiley & Sons Inc, Cl A | 23,541 | 875 | ||||||
Nexstar Media Group Inc, Cl A | 32,011 | 4,589 | ||||||
Scholastic Corp, Cl B | 8,835 | 337 | ||||||
Telephone and Data Systems Inc | 26,718 | 489 | ||||||
Yelp Inc, Cl A * | 4,325 | 180 | ||||||
Ziff Davis Inc * | 49,867 | 3,176 | ||||||
| 12,965 | ||||||||
Consumer Discretionary — 12.4% | ||||||||
Aaron's Co Inc/The | 30,736 | 322 | ||||||
Academy Sports & Outdoors Inc | 12,479 | 590 | ||||||
Adient PLC * | 24,000 | 881 | ||||||
Advance Auto Parts Inc | 5,400 | 302 | ||||||
American Axle & Manufacturing Holdings Inc * | 68,840 | 500 | ||||||
Big 5 Sporting Goods Corp (A) | 6,921 | 49 | ||||||
Biglari Holdings Inc, Cl B * | 234 | 39 | ||||||
Bloomin' Brands Inc | 135,172 | 3,324 | ||||||
Brinker International Inc * | 72,561 | 2,292 | ||||||
Capri Holdings Ltd * | 12,553 | 660 | ||||||
Carriage Services Inc, Cl A | 12,332 | 348 | ||||||
Carter's Inc | 10,155 | 702 | ||||||
Cato Corp/The, Cl A | 5,737 | 44 | ||||||
Chico's FAS Inc * | 33,606 | 251 | ||||||
Dick's Sporting Goods Inc | 7,236 | 786 | ||||||
Genesco Inc * | 11,971 | 369 | ||||||
G-III Apparel Group Ltd * | 21,184 | 528 | ||||||
Goodyear Tire & Rubber Co/The * | 50,217 | 624 | ||||||
Group 1 Automotive Inc | 6,949 | 1,867 | ||||||
Description | Shares | Market Value | ||||||
COMMON STOCK (continued) | ||||||||
Guess? inc, Cl 3 | 32,177 | $ | 696 | |||||
H&R Block Inc | 25,382 | 1,093 | ||||||
Harley-Davidson Inc, Cl A | 20,598 | 681 | ||||||
Haverty Furniture Cos Inc | 25,587 | 736 | ||||||
Helen of Troy Ltd * | 7,946 | 926 | ||||||
Jack in the Box Inc | 7,693 | 531 | ||||||
KB Home | 19,017 | 880 | ||||||
La-Z-Boy Inc, Cl Z | 45,360 | 1,401 | ||||||
Lithia Motors Inc, Cl A | 10,821 | 3,196 | ||||||
Macy's Inc | 54,449 | 632 | ||||||
MasterCraft Boat Holdings Inc * | 5,463 | 121 | ||||||
Meritage Homes Corp | 11,030 | 1,350 | ||||||
Modine Manufacturing Co * | 49,683 | 2,273 | ||||||
Movado Group Inc | 4,903 | 134 | ||||||
ODP Corp/The * | 28,464 | 1,314 | ||||||
Perdoceo Education Corp | 20,135 | 344 | ||||||
Playa Hotels & Resorts NV * | 57,420 | 416 | ||||||
PVH Corp | 9,314 | 713 | ||||||
Sally Beauty Holdings Inc * | 50,067 | 420 | ||||||
Shoe Carnival Inc | 1,654 | 40 | ||||||
Signet Jewelers Ltd | 14,832 | 1,065 | ||||||
Taylor Morrison Home Corp, Cl A * | 25,611 | 1,091 | ||||||
Thor Industries Inc | 4,360 | 415 | ||||||
Travel + Leisure Co | 13,435 | 493 | ||||||
Tri Pointe Homes Inc * | 76,114 | 2,082 | ||||||
Upbound Group Inc | 20,611 | 607 | ||||||
Urban Outfitters Inc * | 64,226 | 2,100 | ||||||
Vera Bradley Inc * | 9,000 | 59 | ||||||
Victoria's Secret & Co * | 55,411 | 924 | ||||||
Vista Outdoor Inc * | 2,602 | 86 | ||||||
Winnebago Industries Inc | 19,911 | 1,184 | ||||||
| 42,481 | ||||||||
Consumer Staples — 4.9% | ||||||||
Andersons Inc/The | 9,843 | 507 | ||||||
Cal-Maine Foods Inc | 11,977 | 580 | ||||||
Coca-Cola Consolidated Inc | 1,814 | 1,154 | ||||||
Dole PLC | 21,592 | 250 | ||||||
Energizer Holdings Inc | 21,372 | 685 | ||||||
Herbalife Ltd * | 21,359 | 299 | ||||||
Ingles Markets Inc, Cl A | 15,909 | 1,198 | ||||||
Ingredion Inc | 11,812 | 1,162 | ||||||
Medifast Inc | 17,514 | 1,311 | ||||||
Nature's Sunshine Products Inc * | 5,125 | 85 | ||||||
Nu Skin Enterprises Inc, Cl A | 3,050 | 65 | ||||||
Pilgrim's Pride Corp * | 111,098 | 2,536 | ||||||
SpartanNash Co | 22,015 | 484 | ||||||
Spectrum Brands Holdings Inc | 40,713 | 3,190 | ||||||
Sprouts Farmers Market Inc * | 43,546 | 1,864 | ||||||
US Foods Holding Corp * | 30,423 | 1,208 | ||||||
Village Super Market Inc, Cl A | 13,897 | 315 | ||||||
| 16,893 | ||||||||
114
SEI Institutional Managed Trust
Description | Shares | Market Value | ||||||
COMMON STOCK (continued) | ||||||||
Energy — 9.5% | ||||||||
Bristow Group Inc * | 6,871 | $ | 193 | |||||
California Resources Corp | 33,399 | 1,871 | ||||||
Chevron Corp | 11,304 | 1,906 | ||||||
Chord Energy Corp | 5,267 | 854 | ||||||
Civitas Resources Inc | 30,689 | 2,482 | ||||||
CNX Resources Corp * | 23,446 | 529 | ||||||
Comstock Resources Inc | 55,909 | 617 | ||||||
CONSOL Energy Inc | 9,762 | 1,024 | ||||||
Crescent Point Energy Corp | 58,231 | 483 | ||||||
Delek US Holdings Inc | 105,137 | 2,987 | ||||||
DHT Holdings Inc | 51,583 | 531 | ||||||
DT Midstream Inc | 59,826 | 3,166 | ||||||
HF Sinclair Corp | 48,215 | 2,745 | ||||||
International Seaways Inc | 2,216 | 100 | ||||||
Magnolia Oil & Gas Corp, Cl A | 82,409 | 1,888 | ||||||
Murphy Oil Corp | 19,957 | 905 | ||||||
Overseas Shipholding Group Inc, Cl A * | 12,695 | 56 | ||||||
Par Pacific Holdings Inc * | 15,601 | 561 | ||||||
Patterson-UTI Energy Inc | 81,945 | 1,134 | ||||||
PBF Energy Inc, Cl A | 49,846 | 2,668 | ||||||
Ranger Energy Services Inc, Cl A | 5,000 | 71 | ||||||
REX American Resources Corp * | 4,506 | 183 | ||||||
Scorpio Tankers Inc | 2,500 | 135 | ||||||
Southwestern Energy Co * | 316,421 | 2,041 | ||||||
TechnipFMC PLC | 114,390 | 2,327 | ||||||
Teekay Corp * | 22,021 | 136 | ||||||
World Kinect Corp | 48,623 | 1,091 | ||||||
| 32,684 | ||||||||
Financials — 23.2% | ||||||||
AFC Gamma Inc ‡ | 6,041 | 71 | ||||||
Amalgamated Financial Corp | 4,384 | 76 | ||||||
A-Mark Precious Metals Inc | 5,257 | 154 | ||||||
American Equity Investment Life Holding Co * | 36,504 | 1,958 | ||||||
Apollo Commercial Real Estate Finance Inc ‡ | 25,820 | 262 | ||||||
Arbor Realty Trust Inc ‡(A) | 61,105 | 928 | ||||||
Associated Banc-Corp | 64,500 | 1,104 | ||||||
Axis Capital Holdings Ltd | 14,142 | 797 | ||||||
B Riley Financial Inc | 11,063 | 453 | ||||||
Banco Latinoamericano de Comercio Exterior SA, Cl E | 35,074 | 744 | ||||||
Bank of NT Butterfield & Son Ltd/The | 16,200 | 439 | ||||||
Bank OZK | 22,104 | 819 | ||||||
BankUnited Inc | 43,741 | 993 | ||||||
Bankwell Financial Group Inc | 1,565 | 38 | ||||||
Banner Corp | 11,870 | 503 | ||||||
Bar Harbor Bankshares | 4,295 | 102 | ||||||
BayCom Corp | 4,440 | 85 | ||||||
BCB Bancorp Inc | 4,000 | 45 | ||||||
Berkshire Hills Bancorp Inc | 31,937 | 640 | ||||||
Description | Shares | Market Value | ||||||
COMMON STOCK (continued) | ||||||||
BGC Group, Cl A | 412,220 | $ | 2,177 | |||||
Blue Ridge Bankshares Inc * | 5,776 | 26 | ||||||
Bread Financial Holdings | 16,313 | 558 | ||||||
BrightSpire Capital Inc, Cl A ‡ | 60,228 | 377 | ||||||
Business First Bancshares Inc | 5,863 | 110 | ||||||
Camden National Corp | 19,308 | 545 | ||||||
Capital Bancorp Inc | 2,753 | 53 | ||||||
Carlyle Secured Lending Inc | 35,256 | 511 | ||||||
Carter Bankshares Inc * | 7,203 | 90 | ||||||
Cathay General Bancorp | 33,530 | 1,166 | ||||||
Central Pacific Financial Corp | 31,526 | 526 | ||||||
Civista Bancshares Inc | 4,598 | 71 | ||||||
CNB Financial Corp/PA | 5,063 | 92 | ||||||
CNO Financial Group Inc | 217,714 | 5,166 | ||||||
Columbia Banking System Inc | 169,917 | 3,449 | ||||||
Comerica Inc | 18,926 | 786 | ||||||
Community Trust Bancorp Inc | 13,277 | 455 | ||||||
Crawford & Co, Cl A | 5,301 | 50 | ||||||
CrossFirst Bankshares Inc * | 11,080 | 112 | ||||||
Customers Bancorp Inc * | 6,976 | 240 | ||||||
Donnelley Financial Solutions Inc * | 15,887 | 894 | ||||||
Enova International Inc * | 5,759 | 293 | ||||||
Enterprise Bancorp Inc | 2,900 | 79 | ||||||
Euronet Worldwide Inc * | 14,489 | 1,150 | ||||||
Federated Hermes Inc, Cl B | 23,783 | 806 | ||||||
Financial Institutions Inc | 4,854 | 82 | ||||||
First American Financial Corp | 9,999 | 565 | ||||||
First Bank/Hamilton NJ | 4,774 | 51 | ||||||
First Busey Corp | 44,959 | 864 | ||||||
First Business Financial Services Inc | 2,400 | 72 | ||||||
First Commonwealth Financial Corp | 169,206 | 2,066 | ||||||
First Financial Corp/IN | 12,855 | 435 | ||||||
First Merchants Corp | 40,264 | 1,120 | ||||||
Flushing Financial Corp | 36,137 | 474 | ||||||
FNB Corp/PA | 208,246 | 2,247 | ||||||
FS KKR Capital Corp | 28,720 | 566 | ||||||
Fulton Financial Corp | 55,078 | 667 | ||||||
Genworth Financial Inc, Cl A * | 245,337 | 1,438 | ||||||
Golub Capital BDC Inc | 45,732 | 671 | ||||||
Great Southern Bancorp Inc | 6,770 | 324 | ||||||
Green Dot Corp, Cl A * | 14,020 | 195 | ||||||
Greenlight Capital Re Ltd, Cl A * | 7,364 | 79 | ||||||
Hancock Whitney Corp, Cl A | 27,473 | 1,016 | ||||||
Hanmi Financial Corp | 29,050 | 471 | ||||||
Hercules Capital Inc, Cl A | 45,031 | 739 | ||||||
Hilltop Holdings Inc | 18,566 | 527 | ||||||
HomeStreet Inc | 21,061 | 164 | ||||||
HomeTrust Bancshares Inc | 4,006 | 87 | ||||||
Hope Bancorp Inc | 111,362 | 986 | ||||||
Horizon Bancorp Inc/IN | 1,050 | 11 | ||||||
Independent Bank Corp/MI | 6,278 | 115 | ||||||
Invesco Mortgage Capital Inc ‡ | 19,075 | 191 | ||||||
SEI Institutional Managed Trust
115
SCHEDULE OF INVESTMENTS
September 30, 2023
Small Cap Value Fund (Continued)
Description | Shares | Market Value | ||||||
COMMON STOCK (continued) | ||||||||
Jackson Financial Inc, Cl A | 64,220 | $ | 2,454 | |||||
KeyCorp | 128,695 | 1,385 | ||||||
Ladder Capital Corp, Cl A ‡ | 57,181 | 587 | ||||||
LendingClub Corp * | 30,082 | 184 | ||||||
Lincoln National Corp | 91,169 | 2,251 | ||||||
Mercantile Bank Corp | 4,399 | 136 | ||||||
Merchants Bancorp/IN | 5,228 | 145 | ||||||
MGIC Investment Corp | 68,696 | 1,147 | ||||||
Mid Penn Bancorp Inc | 4,546 | 92 | ||||||
Midland States Bancorp Inc | 6,502 | 134 | ||||||
MidWestOne Financial Group Inc | 4,386 | 89 | ||||||
MVB Financial Corp | 3,000 | 68 | ||||||
Navient Corp | 52,282 | 900 | ||||||
New Mountain Finance Corp | 33,690 | 436 | ||||||
OceanFirst Financial Corp | 18,679 | 270 | ||||||
OFG Bancorp | 80,213 | 2,395 | ||||||
Old National Bancorp/IN, Cl A | 168,307 | 2,447 | ||||||
Orrstown Financial Services Inc | 3,530 | 74 | ||||||
Oscar Health Inc, Cl A * | 5,967 | 33 | ||||||
Pacific Premier Bancorp Inc | 40,779 | 887 | ||||||
PacWest Bancorp (A) | 85,500 | 676 | ||||||
Pathward Financial Inc | 9,035 | 416 | ||||||
PCB Bancorp | 3,500 | 54 | ||||||
Peapack-Gladstone Financial Corp | 5,377 | 138 | ||||||
PennantPark Investment Corp | 59,673 | 393 | ||||||
PennyMac Financial Services Inc | 10,289 | 685 | ||||||
Peoples Bancorp Inc/OH | 15,549 | 395 | ||||||
Peoples Financial Services Corp | 840 | 34 | ||||||
Popular Inc | 16,259 | 1,024 | ||||||
PROG Holdings Inc * | 4,900 | 163 | ||||||
QCR Holdings Inc | 4,736 | 230 | ||||||
Radian Group Inc | 37,161 | 933 | ||||||
RBB Bancorp | 4,906 | 63 | ||||||
Redwood Trust Inc ‡ | 42,981 | 306 | ||||||
Republic Bancorp Inc/KY, Cl A | 9,189 | 405 | ||||||
Rithm Capital Corp ‡ | 102,861 | 956 | ||||||
Sierra Bancorp | 4,509 | 85 | ||||||
Simmons First National Corp, Cl A | 53,831 | 913 | ||||||
SiriusPoint Ltd * | 30,519 | 310 | ||||||
Sixth Street Specialty Lending Inc | 33,142 | 677 | ||||||
SmartFinancial Inc | 2,250 | 48 | ||||||
South Plains Financial Inc | 3,417 | 90 | ||||||
Starwood Property Trust Inc ‡ | 134,464 | 2,602 | ||||||
Summit Financial Group Inc | 3,604 | 81 | ||||||
Synovus Financial Corp | 27,579 | 767 | ||||||
Third Coast Bancshares Inc * | 4,000 | 68 | ||||||
TowneBank | 19,422 | 445 | ||||||
Universal Insurance Holdings Inc | 3,880 | 54 | ||||||
Veritex Holdings Inc | 29,758 | 534 | ||||||
Victory Capital Holdings Inc, Cl A | 18,408 | 614 | ||||||
Washington Federal Inc | 25,690 | 658 | ||||||
Description | Shares | Market Value | ||||||
COMMON STOCK (continued) | ||||||||
Zions Bancorp NA | 68,438 | $ | 2,388 | |||||
| 79,535 | ||||||||
Health Care — 7.1% | ||||||||
Alkermes PLC * | 7,800 | 218 | ||||||
AMN Healthcare Services Inc * | 41,488 | 3,534 | ||||||
Amneal Pharmaceuticals Inc * | 88,778 | 375 | ||||||
Amphastar Pharmaceuticals Inc * | 12,697 | 584 | ||||||
Avanos Medical Inc * | 24,955 | 505 | ||||||
Catalyst Pharmaceuticals Inc * | 3,087 | 36 | ||||||
Collegium Pharmaceutical Inc * | 46,009 | 1,028 | ||||||
Computer Programs and Systems Inc * | 18,821 | 300 | ||||||
Cross Country Healthcare Inc * | 115,114 | 2,854 | ||||||
Dynavax Technologies Corp * | 37,828 | 559 | ||||||
Eagle Pharmaceuticals Inc/DE * | 3,432 | 54 | ||||||
Enovis Corp * | 33,372 | 1,760 | ||||||
Exelixis Inc * | 47,296 | 1,033 | ||||||
Globus Medical Inc, Cl A * | 19,849 | 985 | ||||||
Inmode * | 21,800 | 664 | ||||||
Innoviva Inc * | 18,530 | 241 | ||||||
Integra LifeSciences Holdings Corp * | 36,137 | 1,380 | ||||||
Ironwood Pharmaceuticals Inc, Cl A * | 102,153 | 984 | ||||||
Ligand Pharmaceuticals Inc * | 1,726 | 103 | ||||||
LivaNova PLC * | 25,676 | 1,358 | ||||||
Organon & Co | 41,532 | 721 | ||||||
Patterson Cos Inc | 33,387 | 990 | ||||||
Pediatrix Medical Group Inc * | 26,858 | 341 | ||||||
Point Biopharma Global Inc, Cl A * | 7,627 | 51 | ||||||
Premier Inc, Cl A | 26,685 | 574 | ||||||
Prestige Consumer Healthcare Inc, Cl A * | 17,008 | 973 | ||||||
QuidelOrtho Corp * | 11,591 | 847 | ||||||
Select Medical Holdings Corp | 20,553 | 519 | ||||||
SIGA Technologies Inc * | 16,082 | 84 | ||||||
Vanda Pharmaceuticals Inc * | 17,148 | 74 | ||||||
Varex Imaging Corp * | 4,500 | 85 | ||||||
Veradigm Inc * | 33,601 | 441 | ||||||
Zimvie Inc * | 6,970 | 66 | ||||||
Zymeworks * | 17,902 | 113 | ||||||
| 24,434 | ||||||||
Industrials — 15.6% | ||||||||
ABM Industries Inc | 62,595 | 2,504 | ||||||
ACCO Brands Corp | 372,872 | 2,140 | ||||||
Alaska Air Group Inc * | 14,531 | 539 | ||||||
Allison Transmission Holdings Inc | 21,615 | 1,277 | ||||||
Apogee Enterprises Inc | 17,725 | 835 | ||||||
ArcBest Corp | 15,377 | 1,563 | ||||||
Argan Inc | 1,080 | 49 | ||||||
Atkore Inc * | 12,422 | 1,853 | ||||||
BlueLinx Holdings Inc * | 2,564 | 211 | ||||||
Boise Cascade Co | 11,596 | 1,195 | ||||||
BWX Technologies Inc, Cl W | 46,648 | 3,498 | ||||||
Conduent Inc * | 50,217 | 175 | ||||||
116
SEI Institutional Managed Trust
Description | Shares | Market Value | ||||||
COMMON STOCK (continued) | ||||||||
CoreCivic Inc *‡ | 22,280 | $ | 251 | |||||
Costamare Inc | 14,000 | 135 | ||||||
CSG Systems International Inc | 13,951 | 713 | ||||||
Deluxe Corp | 19,464 | 368 | ||||||
Eagle Bulk Shipping Inc | 4,025 | 169 | ||||||
EMCOR Group Inc | 3,649 | 768 | ||||||
Encore Wire Corp | 12,391 | 2,261 | ||||||
Ennis Inc | 20,851 | 442 | ||||||
Esab Corp | 32,598 | 2,289 | ||||||
Fluor Corp * | 11,861 | 435 | ||||||
Gates Industrial Corp PLC * | 46,172 | 536 | ||||||
GXO Logistics Inc * | 54,488 | 3,196 | ||||||
Heidrick & Struggles International Inc | 5,834 | 146 | ||||||
Hillenbrand Inc | 11,392 | 482 | ||||||
Hub Group Inc, Cl A * | 716 | 56 | ||||||
Interface Inc, Cl A | 37,821 | 371 | ||||||
JetBlue Airways Corp * | 12,059 | 55 | ||||||
Kaman Corp, Cl A | 28,620 | 562 | ||||||
Kelly Services Inc, Cl A | 29,293 | 533 | ||||||
Kennametal Inc | 13,610 | 339 | ||||||
ManpowerGroup Inc | 6,659 | 488 | ||||||
Masterbrand Inc * | 9,500 | 115 | ||||||
Matson Inc | 10,588 | 939 | ||||||
MDU Resources Group Inc | 24,379 | 477 | ||||||
Middleby Corp/The * | 3,030 | 388 | ||||||
Moog Inc, Cl A | 10,993 | 1,242 | ||||||
Mueller Industries Inc | 24,540 | 1,844 | ||||||
OPENLANE Inc * | 147,955 | 2,208 | ||||||
Park-Ohio Holdings Corp | 10,024 | 200 | ||||||
Primoris Services Corp | 24,133 | 790 | ||||||
Quanex Building Products Corp | 7,434 | 209 | ||||||
Radiant Logistics Inc * | 7,598 | 43 | ||||||
RB Global Inc | 15,171 | 948 | ||||||
Resources Connection Inc | 4,888 | 73 | ||||||
Rush Enterprises Inc, Cl A | 23,343 | 953 | ||||||
Ryder System Inc | 18,652 | 1,995 | ||||||
Safe Bulkers Inc | 21,291 | 69 | ||||||
SkyWest Inc * | 8,292 | 348 | ||||||
Steelcase Inc, Cl A | 15,000 | 168 | ||||||
Terex Corp | 35,699 | 2,057 | ||||||
Timken Co/The | 13,285 | 976 | ||||||
Titan International Inc * | 15,000 | 201 | ||||||
TrueBlue Inc * | 11,651 | 171 | ||||||
Tutor Perini Corp * | 13,978 | 109 | ||||||
UFP Industries Inc | 3,523 | 361 | ||||||
Universal Logistics Holdings Inc | 2,000 | 50 | ||||||
Verra Mobility Corp, Cl A * | 98,491 | 1,842 | ||||||
Wabash National Corp | 55,633 | 1,175 | ||||||
WESCO International Inc | 12,834 | 1,846 | ||||||
XPO Inc * | 16,839 | 1,257 | ||||||
| 53,488 | ||||||||
Description | Shares | Market Value | ||||||
COMMON STOCK (continued) | ||||||||
Information Technology — 8.4% | ||||||||
ACI Worldwide Inc * | 40,170 | $ | 906 | |||||
Amkor Technology Inc | 84,822 | 1,917 | ||||||
Avnet Inc | 26,696 | 1,286 | ||||||
Cirrus Logic Inc * | 9,933 | 735 | ||||||
Clearfield Inc * | 7,334 | 210 | ||||||
Consensus Cloud Solutions Inc * | 22,601 | 569 | ||||||
Diodes Inc * | 15,717 | 1,239 | ||||||
Immersion Corp | 10,000 | 66 | ||||||
Insight Enterprises Inc * | 5,441 | 792 | ||||||
Jabil Inc | 18,856 | 2,393 | ||||||
NCR Corp * | 29,392 | 793 | ||||||
NetScout Systems Inc * | 5,753 | 161 | ||||||
Photronics Inc * | 188,921 | 3,818 | ||||||
Rimini Street Inc * | 11,454 | 25 | ||||||
Sanmina Corp * | 48,457 | 2,630 | ||||||
ScanSource Inc * | 14,488 | 439 | ||||||
Silicon Motion Technology Corp ADR * | 39,187 | 2,008 | ||||||
Super Micro Computer Inc * | 6,492 | 1,780 | ||||||
TD SYNNEX Corp | 7,992 | 798 | ||||||
Teledyne Technologies Inc * | 3,013 | 1,231 | ||||||
Teradata Corp * | 18,278 | 823 | ||||||
TTM Technologies Inc * | 53,247 | 686 | ||||||
Unisys Corp * | 21,481 | 74 | ||||||
Verint Systems Inc * | 76,622 | 1,762 | ||||||
Vishay Intertechnology Inc | 43,074 | 1,065 | ||||||
Xerox Holdings Corp | 30,438 | 478 | ||||||
| 28,684 | ||||||||
Materials — 7.3% | ||||||||
AdvanSix Inc | 22,626 | 703 | ||||||
Alpha Metallurgical Resources Inc | 4,767 | 1,238 | ||||||
Ashland Inc | 27,666 | 2,260 | ||||||
Axalta Coating Systems Ltd * | 93,387 | 2,512 | ||||||
Chemours Co/The | 18,405 | 516 | ||||||
Clearwater Paper Corp * | 4,178 | 151 | ||||||
Commercial Metals Co, Cl A | 83,775 | 4,139 | ||||||
FMC Corp | 24,337 | 1,630 | ||||||
FutureFuel Corp | 6,785 | 49 | ||||||
Greif Inc, Cl A | 23,839 | 1,593 | ||||||
Huntsman Corp | 34,538 | 843 | ||||||
Ingevity Corp * | 9,390 | 447 | ||||||
Knife River Corp * | 6,094 | 297 | ||||||
Koppers Holdings Inc | 21,610 | 855 | ||||||
LSB Industries Inc * | 9,000 | 92 | ||||||
Minerals Technologies Inc | 1,133 | 62 | ||||||
O-I Glass Inc, Cl I * | 43,751 | 732 | ||||||
Rayonier Advanced Materials Inc * | 20,000 | 71 | ||||||
Ryerson Holding Corp | 20,467 | 595 | ||||||
Silgan Holdings Inc | 102,733 | 4,429 | ||||||
SunCoke Energy Inc | 84,927 | 862 | ||||||
Sylvamo Corp | 6,400 | 281 | ||||||
Valhi Inc | 1,055 | 14 | ||||||
SEI Institutional Managed Trust
117
SCHEDULE OF INVESTMENTS
September 30, 2023
Small Cap Value Fund (Concluded)
Description | Shares | Market Value | ||||||
COMMON STOCK (continued) | ||||||||
Warrior Met Coal Inc | 16,011 | $ | 818 | |||||
| 25,189 | ||||||||
Real Estate — 6.0% | ||||||||
Acadia Realty Trust ‡ | 1,711 | 25 | ||||||
Alexander & Baldwin Inc ‡ | 10,570 | 177 | ||||||
American Assets Trust Inc ‡ | 34,805 | 677 | ||||||
Apple Hospitality REIT Inc ‡ | 50,728 | 778 | ||||||
Brandywine Realty Trust ‡ | 55,921 | 254 | ||||||
Brixmor Property Group Inc ‡ | 27,974 | 581 | ||||||
Chatham Lodging Trust ‡ | 44,210 | 423 | ||||||
City Office REIT Inc ‡ | 10,937 | 46 | ||||||
DiamondRock Hospitality Co ‡ | 19,970 | 160 | ||||||
Diversified Healthcare Trust ‡ | 56,685 | 110 | ||||||
EPR Properties, Cl A ‡ | 22,621 | 940 | ||||||
Equity Commonwealth *‡ | 51,915 | 954 | ||||||
Forestar Group Inc * | 5,053 | 136 | ||||||
Franklin Street Properties Corp ‡ | 70,949 | 131 | ||||||
Gaming and Leisure Properties Inc ‡ | 78,515 | 3,576 | ||||||
Global Net Lease Inc ‡ | 54,281 | 522 | ||||||
Highwoods Properties Inc ‡ | 50,047 | 1,031 | ||||||
Kite Realty Group Trust ‡ | 41,313 | 885 | ||||||
Marcus & Millichap Inc | 3,088 | 91 | ||||||
Medical Properties Trust Inc ‡ | 219,399 | 1,196 | ||||||
Newmark Group Inc, Cl A | 171,544 | 1,103 | ||||||
Office Properties Income Trust ‡ | 18,671 | 77 | ||||||
Orion Office Inc ‡ | 16,000 | 83 | ||||||
Pebblebrook Hotel Trust ‡ | 6,360 | 86 | ||||||
Piedmont Office Realty Trust Inc, Cl A ‡ | 63,565 | 357 | ||||||
PotlatchDeltic Corp ‡ | 16,663 | 756 | ||||||
Regency Centers Corp ‡ | 2,906 | 173 | ||||||
RLJ Lodging Trust ‡ | 92,181 | 902 | ||||||
Sabra Health Care Inc ‡ | 104,511 | 1,457 | ||||||
Service Properties Trust ‡ | 43,395 | 334 | ||||||
SITE Centers Corp ‡ | 4,500 | 55 | ||||||
Summit Hotel Properties Inc ‡ | 4,100 | 24 | ||||||
Sunstone Hotel Investors Inc ‡ | 54,292 | 508 | ||||||
Tanger Factory Outlet Centers Inc ‡ | 52,296 | 1,182 | ||||||
Uniti Group Inc ‡ | 118,592 | 560 | ||||||
Xenia Hotels & Resorts Inc ‡ | 5,651 | 67 | ||||||
| 20,417 | ||||||||
Utilities — 0.6% | ||||||||
Genie Energy Ltd, Cl B | 5,000 | 74 | ||||||
National Fuel Gas Co | 24,004 | 1,246 | ||||||
Northwest Natural Holding Co | 4,168 | 159 | ||||||
ONE Gas Inc | 2,026 | 138 | ||||||
Otter Tail Corp | 2,199 | 167 | ||||||
Pure Cycle Corp * | 6,950 | 67 | ||||||
Description | Shares | Market Value | ||||||
COMMON STOCK (continued) | ||||||||
UGI Corp | 12,698 | $ | 292 | |||||
| 2,143 | ||||||||
Total Common Stock | ||||||||
(Cost $282,792) ($ Thousands) | 338,913 | |||||||
AFFILIATED PARTNERSHIP — 0.5% | ||||||||
SEI Liquidity Fund, LP | ||||||||
5.410% **†(B) | 1,685,883 | 1,689 | ||||||
Total Affiliated Partnership | ||||||||
(Cost $1,686) ($ Thousands) | 1,689 | |||||||
CASH EQUIVALENT — 1.1% | ||||||||
SEI Daily Income Trust, Government Fund, Institutional Class | ||||||||
5.210%**† | 3,705,790 | 3,706 | ||||||
Total Cash Equivalent | ||||||||
(Cost $3,706) ($ Thousands) | 3,706 | |||||||
Total Investments in Securities — 100.4% | ||||||||
(Cost $288,184) ($ Thousands) | $ | 344,308 | ||||||
| Percentages are based on Net Assets of $343,050 ($ Thousands). |
* | Non-income producing security. |
** | The rate reported is the 7-day effective yield as of September 30, 2023. |
‡ | Real Estate Investment Trust. |
† | Investment in Affiliated Security (see Note 6). |
(A) | Certain securities or partial positions of certain securities are on loan at September 30, 2023. |
(B) | This security was purchased with cash collateral held from securities on loan (see Note 12). The total market value of such securities as of September 30, 2023 was $1,689 ($ Thousands). |
The following is a summary of the level of inputs used as of September 30, 2023, in valuing the Fund's investments carried at value ($ Thousands): | ||||||||||||||||
Investments in Securities | Level 1 | Level 2 | Level 3 | Total | ||||||||||||
Common Stock | 338,913 | – | – | 338,913 | ||||||||||||
Affiliated Partnership | – | 1,689 | – | 1,689 | ||||||||||||
Cash Equivalent | 3,706 | – | – | 3,706 | ||||||||||||
Total Investments in Securities | 342,619 | 1,689 | – | 344,308 | ||||||||||||
For more information on valuation inputs, see Note 2 — Significant Accounting Policies in Notes to Financial Statements.
118
SEI Institutional Managed Trust
The following is a summary of the Fund’s transactions with affiliates for the year ended September 30, 2023 ($ Thousands):
Security Description | Value | Purchases | Proceeds | Realized Gain/(Loss) | Change in Unrealized Appreciation/(Depreciation) | Value | Income | Capital Gains | ||||||||||||||||||||||||
SEI Liquidity Fund, LP | $ | 675 | $ | 19,363 | $ | (18,350 | ) | $ | — | $ | 1 | $ | 1,689 | $ | 73 | $ | — | |||||||||||||||
SEI Daily Income Trust, Government Fund, | 10,063 | 96,580 | (102,937 | ) | — | — | 3,706 | 204 | — | |||||||||||||||||||||||
Totals | $ | 10,738 | $ | 115,943 | $ | (121,287 | ) | $ | – | $ | 1 | $ | 5,395 | $ | 277 | $ | — | |||||||||||||||
Amounts designated as “—” are either $0 or have been rounded to $0.
See “Glossary” for abbreviations.
The accompanying notes are an integral part of the financial statements.
SEI Institutional Managed Trust
119
SCHEDULE OF INVESTMENTS
September 30, 2023
Small Cap Growth Fund
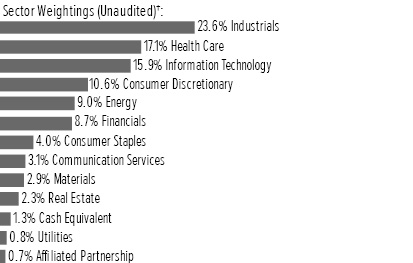
† | Percentages are based on total investments. Total investments do not include derivatives such as options, futures contracts, forward contracts, and swap contracts, if applicable. |
Description | Shares | Market Value | ||||||
COMMON STOCK — 98.7% | ||||||||
Communication Services — 3.1% | ||||||||
Angi Inc, Cl A * | 290,189 | $ | 574 | |||||
Cargurus Inc, Cl A * | 139,442 | 2,443 | ||||||
Gambling.com Group * | 39,600 | 518 | ||||||
Reservoir Media Inc * | 114,232 | 697 | ||||||
Shutterstock Inc | 7,874 | 300 | ||||||
TechTarget Inc * | 38,339 | 1,164 | ||||||
Vivid Seats, Cl A * | 71,498 | 459 | ||||||
Yelp Inc, Cl A * | 34,782 | 1,447 | ||||||
Ziff Davis Inc * | 9,207 | 586 | ||||||
ZipRecruiter Inc, Cl A * | 111,409 | 1,336 | ||||||
| 9,524 | ||||||||
Consumer Discretionary — 10.7% | ||||||||
Aaron's Co Inc/The | 44,320 | 464 | ||||||
Abercrombie & Fitch Co, Cl A * | 20,355 | 1,147 | ||||||
Atmus Filtration Technologies Inc *(A) | 46,495 | 969 | ||||||
Beazer Homes USA Inc, Cl A * | 8,491 | 212 | ||||||
BJ's Restaurants Inc * | 24,095 | 565 | ||||||
Bluegreen Vacations Holding Corp, Cl A | 3,373 | 124 | ||||||
Boot Barn Holdings Inc * | 1,140 | 93 | ||||||
Canada Goose Holdings Inc *(A) | 51,447 | 754 | ||||||
Carvana Co, Cl A * | 2,036 | 85 | ||||||
Chuy's Holdings Inc * | 12,700 | 452 | ||||||
Clarus Corp | 75,805 | 573 | ||||||
Coursera Inc * | 34,995 | 654 | ||||||
Crocs Inc * | 10,087 | 890 | ||||||
Deckers Outdoor Corp * | 933 | 480 | ||||||
Ethan Allen Interiors Inc | 5,890 | 176 | ||||||
Everi Holdings Inc * | 118,944 | 1,572 | ||||||
First Watch Restaurant Group Inc * | 30,400 | 526 | ||||||
Frontdoor Inc * | 37,700 | 1,153 | ||||||
Grand Canyon Education Inc * | 9,733 | 1,138 | ||||||
Group 1 Automotive Inc | 2,668 | 717 | ||||||
Hanesbrands Inc | 99,520 | 394 | ||||||
Description | Shares | Market Value | ||||||
COMMON STOCK (continued) | ||||||||
Hasbro Inc | 10,210 | $ | 675 | |||||
Installed Building Products Inc | 4,201 | 525 | ||||||
KB Home | 27,898 | 1,291 | ||||||
M/I Homes Inc * | 4,967 | 417 | ||||||
MDC Holdings Inc | 11,859 | 489 | ||||||
Meritage Homes Corp | 1,779 | 218 | ||||||
Modine Manufacturing Co * | 44,399 | 2,031 | ||||||
Movado Group Inc | 2,718 | 74 | ||||||
Murphy USA Inc | 3,144 | 1,074 | ||||||
National Vision Holdings Inc * | 33,474 | 542 | ||||||
NEOGAMES SA * | 35,787 | 966 | ||||||
PlayAGS Inc * | 191,084 | 1,246 | ||||||
Sally Beauty Holdings Inc * | 84,314 | 707 | ||||||
Signet Jewelers Ltd | 5,584 | 401 | ||||||
Skechers USA Inc, Cl A * | 37,342 | 1,828 | ||||||
Skyline Champion Corp * | 3,116 | 199 | ||||||
Stoneridge Inc * | 90,624 | 1,819 | ||||||
Stride Inc * | 19,935 | 898 | ||||||
Taylor Morrison Home Corp, Cl A * | 11,005 | 469 | ||||||
TRI Pointe Homes Inc * | 37,281 | 1,020 | ||||||
Upbound Group Inc | 15,900 | 468 | ||||||
Urban Outfitters Inc * | 34,667 | 1,133 | ||||||
Vista Outdoor Inc * | 12,660 | 419 | ||||||
WW International Inc * | 12,916 | 143 | ||||||
YETI Holdings Inc * | 14,676 | 708 | ||||||
| 32,898 | ||||||||
Consumer Staples — 4.0% | ||||||||
Beauty Health Co/The * | 141,576 | 852 | ||||||
BellRing Brands Inc * | 24,725 | 1,019 | ||||||
Celsius Holdings Inc * | 7,624 | 1,308 | ||||||
Chefs' Warehouse Inc/The * | 9,505 | 201 | ||||||
Coca-Cola Consolidated Inc | 246 | 157 | ||||||
Dole PLC | 48,138 | 558 | ||||||
elf Beauty Inc * | 15,477 | 1,700 | ||||||
Hostess Brands Inc, Cl A * | 10,609 | 353 | ||||||
Inter Parfums Inc | 7,093 | 953 | ||||||
MGP Ingredients Inc | 9,088 | 959 | ||||||
Primo Water Corp | 27,659 | 382 | ||||||
Sprouts Farmers Market Inc * | 13,882 | 594 | ||||||
Turning Point Brands Inc | 100,014 | 2,309 | ||||||
Utz Brands Inc | 37,500 | 504 | ||||||
Vita Coco Co Inc/The * | 20,967 | 546 | ||||||
| 12,395 | ||||||||
Energy — 9.1% | ||||||||
AESI Holdings, Cl A | 30,685 | 682 | ||||||
Arch Resources Inc | 3,555 | 607 | ||||||
Archrock Inc | 78,680 | 991 | ||||||
California Resources Corp | 13,557 | 759 | ||||||
Centrus Energy Corp, Cl A * | 8,728 | 496 | ||||||
Chord Energy Corp | 2,870 | 465 | ||||||
Civitas Resources Inc | 20,294 | 1,641 | ||||||
120
SEI Institutional Managed Trust
Description | Shares | Market Value | ||||||
COMMON STOCK (continued) | ||||||||
CONSOL Energy Inc | 8,410 | $ | 882 | |||||
CVR Energy Inc | 17,387 | 592 | ||||||
DHT Holdings Inc | 60,362 | 622 | ||||||
Diamond Offshore Drilling * | 34,862 | 512 | ||||||
Dril-Quip Inc * | 21,322 | 601 | ||||||
Energy Fuels Inc/Canada * | 74,500 | 612 | ||||||
Gulfport Energy Corp * | 6,512 | 773 | ||||||
International Seaways Inc | 14,532 | 654 | ||||||
Newpark Resources Inc, Cl A * | 74,361 | 514 | ||||||
Noble Corp PLC | 18,103 | 917 | ||||||
Northern Oil and Gas Inc | 20,367 | 819 | ||||||
Oceaneering International Inc, Cl A * | 41,125 | 1,058 | ||||||
Par Pacific Holdings Inc * | 19,864 | 714 | ||||||
PBF Energy Inc, Cl A | 26,392 | 1,413 | ||||||
Peabody Energy Corp | 20,997 | 546 | ||||||
Permian Resources Corp, Cl A | 66,359 | 926 | ||||||
Scorpio Tankers Inc | 11,978 | 648 | ||||||
SFL Corp Ltd | 37,418 | 417 | ||||||
TechnipFMC PLC | 38,736 | 788 | ||||||
Teekay Tankers Ltd, Cl A | 12,620 | 525 | ||||||
TETRA Technologies Inc * | 114,930 | 733 | ||||||
Tidewater Inc * | 25,426 | 1,807 | ||||||
Transocean Ltd * | 82,000 | 673 | ||||||
Uranium Energy * | 97,835 | 504 | ||||||
Viper Energy Partners LP | 37,850 | 1,055 | ||||||
Weatherford International PLC * | 33,210 | 3,000 | ||||||
| 27,946 | ||||||||
Financials — 8.8% | ||||||||
Affirm Holdings Inc, Cl A * | 27,531 | 586 | ||||||
AvidXchange Holdings Inc * | 43,000 | 408 | ||||||
Axos Financial Inc * | 17,514 | 663 | ||||||
Banco Latinoamericano de Comercio Exterior SA, Cl E | 4,185 | 89 | ||||||
Bancorp Inc/The * | 12,697 | 438 | ||||||
BGC Group, Cl A | 52,185 | 276 | ||||||
Coastal Financial Corp/WA * | 2,916 | 125 | ||||||
Donnelley Financial Solutions Inc * | 6,564 | 369 | ||||||
Enact Holdings | 20,134 | 548 | ||||||
Enova International Inc * | 10,972 | 558 | ||||||
EVERTEC Inc | 14,496 | 539 | ||||||
EZCORP Inc, Cl A * | 71,305 | 588 | ||||||
FB Financial Corp | 15,992 | 453 | ||||||
Federal Agricultural Mortgage Corp, Cl C | 9,682 | 1,494 | ||||||
First BanCorp/Puerto Rico | 42,726 | 575 | ||||||
First Financial Bancorp | 23,612 | 463 | ||||||
Goosehead Insurance Inc, Cl A * | 7,891 | 588 | ||||||
Independent Bank Corp | 10,566 | 519 | ||||||
International Money Express Inc * | 82,043 | 1,389 | ||||||
Kinsale Capital Group Inc | 4,382 | 1,815 | ||||||
Mr Cooper Group Inc * | 42,561 | 2,280 | ||||||
Navient Corp | 55,976 | 964 | ||||||
New York Community Bancorp Inc | 41,972 | 476 | ||||||
Description | Shares | Market Value | ||||||
COMMON STOCK (continued) | ||||||||
NMI Holdings Inc, Cl A * | 26,008 | $ | 705 | |||||
OFG Bancorp | 20,192 | 603 | ||||||
Old National Bancorp/IN, Cl A | 36,800 | 535 | ||||||
Pathward Financial Inc | 11,351 | 523 | ||||||
Payoneer Global Inc * | 24,898 | 152 | ||||||
PennyMac Financial Services Inc | 10,980 | 731 | ||||||
Peoples Bancorp Inc/OH | 19,470 | 494 | ||||||
Preferred Bank/Los Angeles CA | 9,400 | 585 | ||||||
PROG Holdings Inc * | 28,679 | 952 | ||||||
Radian Group Inc | 21,342 | 536 | ||||||
Remitly Global Inc * | 44,482 | 1,122 | ||||||
S&T Bancorp Inc | 20,351 | 551 | ||||||
Skyward Specialty Insurance Group * | 46,972 | 1,285 | ||||||
Southside Bancshares Inc | 17,703 | 508 | ||||||
Trustmark Corp | 22,700 | 493 | ||||||
WisdomTree Inc | 179,852 | 1,259 | ||||||
| 27,237 | ||||||||
Health Care — 17.2% | ||||||||
4D Molecular Therapeutics Inc * | 36,306 | 462 | ||||||
ACADIA Pharmaceuticals Inc * | 29,840 | 622 | ||||||
Addus HomeCare Corp * | 5,354 | 456 | ||||||
ADMA Biologics Inc * | 141,877 | 508 | ||||||
Alkermes PLC * | 21,544 | 603 | ||||||
Amphastar Pharmaceuticals Inc * | 16,531 | 760 | ||||||
Amylyx Pharmaceuticals Inc * | 14,594 | 267 | ||||||
ANI Pharmaceuticals Inc * | 9,745 | 566 | ||||||
Arbutus Biopharma Corp * | 14,072 | 29 | ||||||
Arvinas Inc * | 27,587 | 542 | ||||||
Aurinia Pharmaceuticals Inc * | 53,626 | 417 | ||||||
Avita Medical * | 36,606 | 535 | ||||||
Axogen Inc * | 72,239 | 361 | ||||||
Axonics Inc * | 9,258 | 520 | ||||||
Axsome Therapeutics Inc * | 5,780 | 404 | ||||||
Biohaven Ltd * | 18,407 | 479 | ||||||
Bridgebio Pharma Inc * | 31,986 | 843 | ||||||
C4 Therapeutics Inc * | 174,183 | 324 | ||||||
Catalyst Pharmaceuticals Inc * | 66,023 | 772 | ||||||
Certara Inc * | 50,651 | 736 | ||||||
Collegium Pharmaceutical Inc * | 1,410 | 31 | ||||||
CONMED Corp | 2,523 | 254 | ||||||
Corcept Therapeutics Inc * | 26,315 | 717 | ||||||
CorVel Corp * | 578 | 114 | ||||||
Crinetics Pharmaceuticals Inc * | 20,566 | 612 | ||||||
Cross Country Healthcare Inc * | 12,713 | 315 | ||||||
Cymabay Therapeutics Inc * | 56,421 | 841 | ||||||
Definitive Healthcare Corp, Cl A * | 87,545 | 699 | ||||||
Disc Medicine Inc, Cl A * | 14,299 | 672 | ||||||
Ensign Group Inc/The | 6,253 | 581 | ||||||
Evolent Health Inc, Cl A * | 7,665 | 209 | ||||||
Glaukos Corp * | 10,289 | 774 | ||||||
Haemonetics Corp * | 5,845 | 524 | ||||||
HealthEquity Inc * | 43,297 | 3,163 | ||||||
SEI Institutional Managed Trust
121
SCHEDULE OF INVESTMENTS
September 30, 2023
Small Cap Growth Fund (Continued)
Description | Shares | Market Value | ||||||
COMMON STOCK (continued) | ||||||||
Hims & Hers Health Inc * | 33,247 | $ | 209 | |||||
Ideaya Biosciences * | 22,712 | 613 | ||||||
ImmunoGen Inc * | 91,449 | 1,451 | ||||||
Immunovant Inc * | 26,386 | 1,013 | ||||||
Inhibrx Inc * | 31,482 | 578 | ||||||
Inmode * | 13,636 | 415 | ||||||
Insmed Inc * | 26,136 | 660 | ||||||
Integer Holdings Corp * | 6,502 | 510 | ||||||
Intercept Pharmaceuticals Inc * | 3,085 | 57 | ||||||
Intra-Cellular Therapies Inc, Cl A * | 8,403 | 438 | ||||||
Ionis Pharmaceuticals Inc * | 10,627 | 482 | ||||||
iTeos Therapeutics Inc * | 7,324 | 80 | ||||||
Kiniksa Pharmaceuticals Ltd, Cl A * | 109,283 | 1,898 | ||||||
Krystal Biotech Inc * | 3,752 | 435 | ||||||
Lantheus Holdings Inc * | 17,263 | 1,199 | ||||||
Ligand Pharmaceuticals Inc * | 7,840 | 470 | ||||||
LivaNova PLC * | 8,778 | 464 | ||||||
Madrigal Pharmaceuticals Inc * | 438 | 64 | ||||||
MaxCyte Inc * | 171,225 | 534 | ||||||
Medpace Holdings Inc * | 9,352 | 2,264 | ||||||
Merit Medical Systems Inc * | 23,178 | 1,600 | ||||||
MiMedx Group Inc * | 160,190 | 1,168 | ||||||
Nevro Corp * | 37,078 | 713 | ||||||
NextGen Healthcare Inc * | 16,738 | 397 | ||||||
Nuvalent Inc, Cl A * | 14,146 | 650 | ||||||
Omnicell Inc * | 6,797 | 306 | ||||||
Option Care Health Inc * | 20,465 | 662 | ||||||
OraSure Technologies Inc * | 30,135 | 179 | ||||||
ORIC Pharmaceuticals Inc * | 77,940 | 472 | ||||||
Paragon 28 Inc * | 60,418 | 758 | ||||||
Pediatrix Medical Group Inc * | 52,442 | 667 | ||||||
Prestige Consumer Healthcare Inc, Cl A * | 3,273 | 187 | ||||||
PROCEPT BioRobotics Corp * | 8,515 | 279 | ||||||
Progyny Inc * | 16,095 | 548 | ||||||
Quanterix Corp * | 23,885 | 648 | ||||||
QuidelOrtho Corp * | 37,522 | 2,741 | ||||||
RayzeBio * | 6,700 | 149 | ||||||
Relay Therapeutics Inc * | 48,495 | 408 | ||||||
Revance Therapeutics Inc * | 7,036 | 81 | ||||||
RxSight Inc * | 22,017 | 614 | ||||||
SI-BONE Inc * | 5,117 | 109 | ||||||
Sight Sciences Inc * | 68,908 | 232 | ||||||
Silk Road Medical Inc * | 46,900 | 703 | ||||||
Soleno Therapeutics * | 18,800 | 555 | ||||||
Sonendo Inc * | 161,953 | 121 | ||||||
SpringWorks Therapeutics Inc * | 24,732 | 572 | ||||||
Supernus Pharmaceuticals Inc * | 6,547 | 180 | ||||||
Tandem Diabetes Care Inc * | 18,711 | 389 | ||||||
Tango Therapeutics Inc * | 49,416 | 556 | ||||||
Tenet Healthcare Corp * | 6,819 | 449 | ||||||
TG Therapeutics Inc * | 8,673 | 72 | ||||||
TransMedics Group Inc * | 8,251 | 452 | ||||||
Description | Shares | Market Value | ||||||
COMMON STOCK (continued) | ||||||||
UFP Technologies Inc * | 2,761 | $ | 446 | |||||
UroGen Pharma * | 27,411 | 384 | ||||||
Veracyte Inc * | 53,189 | 1,188 | ||||||
| 53,181 | ||||||||
Industrials — 23.8% | ||||||||
AAON Inc | 10,902 | 620 | ||||||
ACV Auctions Inc, Cl A * | 125,658 | 1,908 | ||||||
AeroVironment Inc * | 6,472 | 722 | ||||||
Air Transport Services Group Inc * | 23,967 | 500 | ||||||
Alight Inc, Cl A * | 369,802 | 2,622 | ||||||
Allegiant Travel Co, Cl A | 7,768 | 597 | ||||||
Applied Industrial Technologies Inc, Cl A | 9,971 | 1,542 | ||||||
ArcBest Corp | 4,466 | 454 | ||||||
Archer Aviation, Cl A *(A) | 93,000 | 471 | ||||||
Arcosa Inc | 18,724 | 1,346 | ||||||
Atkore Inc * | 5,551 | 828 | ||||||
Avis Budget Group Inc * | 756 | 136 | ||||||
Beacon Roofing Supply Inc * | 8,233 | 635 | ||||||
Boise Cascade Co | 7,560 | 779 | ||||||
Brink's Co/The | 8,293 | 602 | ||||||
BWX Technologies Inc, Cl W | 9,300 | 697 | ||||||
Byrna Technologies Inc * | 122,117 | 274 | ||||||
Cimpress PLC * | 26,358 | 1,845 | ||||||
Comfort Systems USA Inc | 8,702 | 1,483 | ||||||
Curtiss-Wright Corp | 3,828 | 749 | ||||||
Dycom Industries Inc * | 7,437 | 662 | ||||||
Eagle Bulk Shipping Inc | 2,259 | 95 | ||||||
EMCOR Group Inc | 5,328 | 1,121 | ||||||
Encore Wire Corp | 3,802 | 694 | ||||||
EnerSys | 5,446 | 516 | ||||||
Ennis Inc | 4,669 | 99 | ||||||
ESCO Technologies Inc | 6,951 | 726 | ||||||
ExlService Holdings Inc * | 49,435 | 1,386 | ||||||
Forrester Research Inc * | 56,575 | 1,635 | ||||||
FTAI Aviation Ltd | 25,654 | 912 | ||||||
GMS Inc * | 13,993 | 895 | ||||||
Greenbrier Cos Inc/The | 22,450 | 898 | ||||||
Griffon Corp | 11,856 | 470 | ||||||
H&E Equipment Services Inc | 11,154 | 482 | ||||||
Heartland Express Inc | 35,022 | 515 | ||||||
Heritage-Crystal Clean Inc * | 59,468 | 2,697 | ||||||
Hillenbrand Inc | 4,333 | 183 | ||||||
HNI Corp | 21,461 | 743 | ||||||
Hudson Technologies Inc * | 227,915 | 3,031 | ||||||
Huron Consulting Group Inc * | 14,192 | 1,478 | ||||||
ICF International Inc, Cl A | 5,749 | 695 | ||||||
IES Holdings * | 7,800 | 514 | ||||||
Janus International Group Inc * | 58,750 | 629 | ||||||
John Bean Technologies Corp, Cl A | 6,683 | 703 | ||||||
Kadant Inc | 4,260 | 961 | ||||||
Kirby Corp * | 32,257 | 2,671 | ||||||
Korn Ferry | 1,896 | 90 | ||||||
122
SEI Institutional Managed Trust
Description | Shares | Market Value | ||||||
COMMON STOCK (continued) | ||||||||
Legalzoom.com Inc * | 130,601 | $ | 1,429 | |||||
Limbach Holdings Inc * | 2,901 | 92 | ||||||
Manitowoc Co Inc/The * | 38,351 | 577 | ||||||
Matson Inc | 33,370 | 2,961 | ||||||
McGrath RentCorp | 6,090 | 610 | ||||||
Montrose Environmental Group Inc * | 19,698 | 576 | ||||||
MSA Safety Inc | 3,262 | 514 | ||||||
MYR Group Inc * | 15,024 | 2,025 | ||||||
nVent Electric PLC | 13,802 | 731 | ||||||
Owens Corning | 6,593 | 899 | ||||||
Parsons Corp * | 14,440 | 785 | ||||||
Powell Industries Inc | 10,935 | 907 | ||||||
Primoris Services Corp | 21,619 | 708 | ||||||
RB Global Inc | 40,122 | 2,508 | ||||||
Rocket Lab USA Inc * | 15,740 | 69 | ||||||
Rush Enterprises Inc, Cl A | 6,514 | 266 | ||||||
Safe Bulkers Inc | 30,960 | 100 | ||||||
Shoals Technologies Group Inc, Cl A * | 9,320 | 170 | ||||||
Simpson Manufacturing Co Inc | 9,709 | 1,455 | ||||||
SkyWest Inc * | 17,341 | 727 | ||||||
SP Plus Corp * | 27,772 | 1,003 | ||||||
SPX Technologies Inc * | 5,876 | 478 | ||||||
Standex International Corp | 4,594 | 669 | ||||||
Sterling Infrastructure Inc * | 8,216 | 604 | ||||||
Tennant Co | 19,709 | 1,461 | ||||||
Terex Corp | 10,594 | 610 | ||||||
Titan Machinery Inc * | 20,065 | 533 | ||||||
Transcat Inc * | 7,997 | 783 | ||||||
TriNet Group Inc * | 12,011 | 1,399 | ||||||
Upwork Inc * | 43,577 | 495 | ||||||
Vertiv Holdings Co, Cl A | 23,739 | 883 | ||||||
Vicor Corp * | 9,160 | 539 | ||||||
Watts Water Technologies Inc, Cl A | 3,069 | 530 | ||||||
XPO Inc * | 10,887 | 813 | ||||||
| 73,220 | ||||||||
Information Technology — 16.0% | ||||||||
8x8 Inc * | 319,791 | 806 | ||||||
A10 Networks Inc | 11,420 | 172 | ||||||
ACI Worldwide Inc * | 24,865 | 561 | ||||||
ACM Research Inc, Cl A * | 81,578 | 1,477 | ||||||
Aehr Test Systems * | 16,679 | 762 | ||||||
Alkami Technology Inc * | 108,622 | 1,979 | ||||||
Allegro MicroSystems Inc * | 45,120 | 1,441 | ||||||
Amplitude Inc, Cl A * | 43,138 | 499 | ||||||
Appfolio Inc, Cl A * | 7,315 | 1,336 | ||||||
Applied Optoelectronics Inc * | 47,926 | 526 | ||||||
AppLovin Corp, Cl A * | 24,150 | 965 | ||||||
Arlo Technologies Inc * | 42,844 | 441 | ||||||
Asana Inc, Cl A * | 3,000 | 55 | ||||||
Axcelis Technologies Inc * | 8,691 | 1,417 | ||||||
Badger Meter Inc | 14,125 | 2,032 | ||||||
Belden Inc | 17,823 | 1,721 | ||||||
Description | Shares | Market Value | ||||||
COMMON STOCK (continued) | ||||||||
Box Inc, Cl A * | 11,251 | $ | 272 | |||||
C3.ai Inc, Cl A * | 4,282 | 109 | ||||||
Calix Inc * | 14,067 | 645 | ||||||
Clear Secure, Cl A | 28,232 | 538 | ||||||
Clearwater Analytics Holdings Inc, Cl A * | 24,803 | 480 | ||||||
Consensus Cloud Solutions Inc * | 89,733 | 2,259 | ||||||
Credo Technology Group Holding Ltd * | 35,996 | 549 | ||||||
Digi International Inc * | 9,393 | 254 | ||||||
Dropbox Inc, Cl A * | 19,258 | 524 | ||||||
Elastic NV * | 10,380 | 843 | ||||||
Extreme Networks Inc * | 52,214 | 1,264 | ||||||
Fabrinet * | 6,678 | 1,113 | ||||||
Fastly Inc, Cl A * | 46,284 | 887 | ||||||
Freshworks, Cl A * | 41,541 | 827 | ||||||
Hackett Group Inc/The | 6,806 | 161 | ||||||
Impinj Inc * | 3,778 | 208 | ||||||
Instructure Holdings Inc * | 6,419 | 163 | ||||||
Intapp Inc * | 4,024 | 135 | ||||||
IonQ Inc * | 39,109 | 582 | ||||||
MACOM Technology Solutions Holdings Inc * | 20,087 | 1,639 | ||||||
Mirion Technologies Inc, Cl A * | 276,996 | 2,069 | ||||||
Model N Inc * | 20,452 | 499 | ||||||
Monday.com Ltd * | 4,376 | 697 | ||||||
Nutanix Inc, Cl A * | 23,307 | 813 | ||||||
Onto Innovation Inc * | 9,930 | 1,266 | ||||||
OSI Systems Inc * | 5,236 | 618 | ||||||
PagerDuty Inc * | 69,097 | 1,554 | ||||||
PAR Technology * | 16,700 | 644 | ||||||
PDF Solutions Inc * | 16,746 | 543 | ||||||
Progress Software Corp | 10,100 | 531 | ||||||
Pure Storage Inc, Cl A * | 13,444 | 479 | ||||||
Qualys Inc * | 11,052 | 1,686 | ||||||
Rambus Inc * | 8,679 | 484 | ||||||
Silicon Laboratories Inc * | 531 | 62 | ||||||
SolarWinds Corp * | 50,364 | 475 | ||||||
Sprinklr Inc, Cl A * | 51,149 | 708 | ||||||
Sprout Social Inc, Cl A * | 2,110 | 105 | ||||||
SPS Commerce Inc * | 9,670 | 1,650 | ||||||
Super Micro Computer Inc * | 6,246 | 1,713 | ||||||
Tenable Holdings Inc * | 14,084 | 631 | ||||||
Universal Display Corp | 4,653 | 730 | ||||||
Veeco Instruments Inc * | 41,588 | 1,169 | ||||||
Xerox Holdings Corp | 37,843 | 594 | ||||||
| 49,362 | ||||||||
Materials — 2.9% | ||||||||
Alpha Metallurgical Resources Inc | 7,091 | 1,842 | ||||||
American Vanguard Corp, Cl B | 4,806 | 52 | ||||||
AptarGroup Inc | 5,515 | 690 | ||||||
ATI Inc * | 14,267 | 587 | ||||||
Carpenter Technology Corp | 21,911 | 1,473 | ||||||
Clearwater Paper Corp * | 14,816 | 537 | ||||||
SEI Institutional Managed Trust
123
SCHEDULE OF INVESTMENTS
September 30, 2023
Small Cap Growth Fund (Concluded)
Description | Shares | Market Value | ||||||
COMMON STOCK (continued) | ||||||||
Commercial Metals Co, Cl A | 11,551 | $ | 571 | |||||
Eagle Materials Inc | 3,040 | 506 | ||||||
Livent Corp * | 24,962 | 459 | ||||||
O-I Glass Inc, Cl I * | 27,189 | 455 | ||||||
Orion SA | 11,032 | 235 | ||||||
Ranpak Holdings Corp, Cl A * | 174,868 | 951 | ||||||
Warrior Met Coal Inc | 2,473 | 126 | ||||||
Worthington Industries Inc | 8,576 | 530 | ||||||
| 9,014 | ||||||||
Real Estate — 2.3% | ||||||||
Acadia Realty Trust ‡ | 42,232 | 606 | ||||||
Alexander & Baldwin Inc ‡ | 10,340 | 173 | ||||||
Essential Properties Realty Trust Inc ‡ | 26,996 | 584 | ||||||
Forestar Group Inc * | 3,252 | 88 | ||||||
GEO Group *‡ | 14,045 | 115 | ||||||
Getty Realty Corp ‡ | 17,871 | 495 | ||||||
Independence Realty Trust Inc ‡ | 7,145 | 100 | ||||||
Innovative Industrial Properties Inc, Cl A ‡ | 7,266 | 550 | ||||||
Kite Realty Group Trust ‡ | 27,627 | 592 | ||||||
LXP Industrial Trust, Cl B ‡ | 59,210 | 527 | ||||||
Newmark Group Inc, Cl A | 36,897 | 237 | ||||||
Phillips Edison & Co Inc ‡ | 16,718 | 561 | ||||||
Plymouth Industrial REIT Inc ‡ | 29,676 | 622 | ||||||
St Joe Co/The | 11,897 | 646 | ||||||
Tanger Factory Outlet Centers Inc ‡ | 53,600 | 1,211 | ||||||
| 7,107 | ||||||||
Utilities — 0.8% | ||||||||
Northwest Natural Holding Co | 14,371 | 548 | ||||||
ONE Gas Inc | 7,722 | 527 | ||||||
Otter Tail Corp | 11,828 | 898 | ||||||
Portland General Electric Co | 10,315 | 418 | ||||||
| 2,391 | ||||||||
Total Common Stock | ||||||||
(Cost $280,056) ($ Thousands) | 304,275 | |||||||
Description | Shares | Market Value | ||||||
AFFILIATED PARTNERSHIP — 0.8% | ||||||||
SEI Liquidity Fund, LP | ||||||||
5.410% **†(B) | 2,407,465 | $ | 2,403 | |||||
Total Affiliated Partnership | ||||||||
(Cost $2,407) ($ Thousands) | 2,403 | |||||||
CASH EQUIVALENT — 1.3% | ||||||||
SEI Daily Income Trust, Government Fund, Institutional Class | ||||||||
5.210%**† | 3,886,677 | 3,887 | ||||||
Total Cash Equivalent | ||||||||
(Cost $3,887) ($ Thousands) | 3,887 | |||||||
Total Investments in Securities — 100.8% | ||||||||
(Cost $286,350) ($ Thousands) | $ | 310,565 | ||||||
| Percentages are based on Net Assets of $308,042 ($ Thousands). |
* | Non-income producing security. |
** | The rate reported is the 7-day effective yield as of September 30, 2023. |
† | Investment in Affiliated Security (see Note 6). |
‡ | Real Estate Investment Trust. |
(A) | Certain securities or partial positions of certain securities are on loan at September 30, 2023. |
(B) | This security was purchased with cash collateral held from securities on loan (see Note 12). The total market value of such securities as of September 30, 2023 was $2,403 ($ Thousands). |
The following is a summary of the level of inputs used as of September 30, 2023, in valuing the Fund's investments and other financial instruments carried at value ($ Thousands): | ||||||||||||||||
Investments in Securities | Level 1 | Level 2 | Level 3 | Total | ||||||||||||
Common Stock | 304,275 | – | – | 304,275 | ||||||||||||
Affiliated Partnership | – | 2,403 | – | 2,403 | ||||||||||||
Cash Equivalent | 3,887 | – | – | 3,887 | ||||||||||||
Total Investments in Securities | 308,162 | 2,403 | – | 310,565 | ||||||||||||
For more information on valuation inputs, see Note 2 — Significant Accounting Policies in Notes to Financial Statements.
The following is a summary of the Fund’s transactions with affiliates for the year ended September 30, 2023 ($ Thousands):
Security Description | Value | Purchases | Proceeds | Realized Gain/(Loss) | Change in Unrealized Appreciation/(Depreciation) | Value | Income | Capital Gains | ||||||||||||||||||||||||
SEI Liquidity Fund, LP | $ | 3,740 | $ | 38,783 | $ | (40,121 | ) | $ | — | $ | 1 | $ | 2,403 | $ | 70 | $ | — | |||||||||||||||
SEI Daily Income Trust, Government Fund, | 6,614 | 75,969 | (78,696 | ) | — | — | 3,887 | 173 | — | |||||||||||||||||||||||
Totals | $ | 10,354 | $ | 114,752 | $ | (118,817 | ) | $ | – | $ | 1 | $ | 6,290 | $ | 243 | $ | — | |||||||||||||||
Amounts designated as “—” are either $0 or have been rounded to $0.
See “Glossary” for abbreviations. The accompanying notes are an integral part of the financial statements.
124
SEI Institutional Managed Trust
SCHEDULE OF INVESTMENTS
September 30, 2023
Tax-Managed Small/Mid Cap Fund
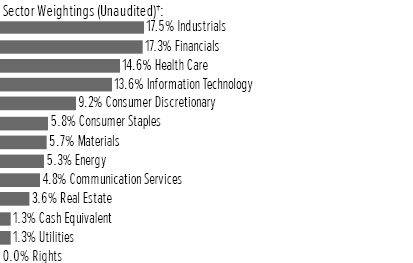
† | Percentages are based on total investments. Total investments do not include derivatives such as options, futures contracts, forward contracts, and swap contracts, if applicable. |
Description | Shares | Market Value | ||||||
COMMON STOCK — 98.7% | ||||||||
Communication Services — 4.8% | ||||||||
Cinemark Holdings Inc * | 458,087 | $ | 8,406 | |||||
Cogent Communications Holdings Inc | 18,392 | 1,138 | ||||||
EchoStar Corp, Cl A * | 34,053 | 570 | ||||||
Electronic Arts Inc | 2,290 | 276 | ||||||
Eventbrite Inc, Cl A * | 121,618 | 1,199 | ||||||
IAC Inc * | 3,105 | 156 | ||||||
Interpublic Group of Cos Inc/The | 24,754 | 709 | ||||||
Iridium Communications Inc | 9,732 | 443 | ||||||
John Wiley & Sons Inc, Cl A | 17,485 | 650 | ||||||
Lions Gate Entertainment Corp, Cl A * | 84,240 | 714 | ||||||
Match Group Inc * | 1,449 | 57 | ||||||
Nexstar Media Group Inc, Cl A | 68,960 | 9,887 | ||||||
Ooma Inc * | 8,203 | 107 | ||||||
Playstudios Inc * | 271,381 | 863 | ||||||
Shutterstock Inc | 14,686 | 559 | ||||||
Take-Two Interactive Software Inc, Cl A * | 3,431 | 482 | ||||||
TKO Group Holdings Inc | 44,598 | 3,749 | ||||||
Ziff Davis Inc * | 114,457 | 7,290 | ||||||
| 37,255 | ||||||||
Consumer Discretionary — 9.2% | ||||||||
Abercrombie & Fitch Co, Cl A * | 3,827 | 216 | ||||||
Accel Entertainment Inc, Cl A * | 55,670 | 610 | ||||||
Advance Auto Parts Inc | 8,059 | 451 | ||||||
American Eagle Outfitters Inc | 12,590 | 209 | ||||||
Asbury Automotive Group Inc * | 3,907 | 899 | ||||||
AutoNation Inc * | 1,730 | 262 | ||||||
Bloomin' Brands Inc | 223,448 | 5,495 | ||||||
Bright Horizons Family Solutions Inc * | 1,538 | 125 | ||||||
Brinker International Inc * | 203,887 | 6,441 | ||||||
Carrols Restaurant Group Inc * | 466,421 | 3,074 | ||||||
Carter's Inc | 16,460 | 1,138 | ||||||
Cavco Industries Inc * | 947 | 251 | ||||||
Description | Shares | Market Value | ||||||
COMMON STOCK (continued) | ||||||||
Coursera Inc * | 68,450 | $ | 1,279 | |||||
Dave & Buster's Entertainment Inc * | 43,840 | 1,625 | ||||||
Deckers Outdoor Corp * | 3,400 | 1,748 | ||||||
Duolingo Inc, Cl A * | 9,465 | 1,570 | ||||||
Ermenegildo Zegna NV | 48,262 | 672 | ||||||
Etsy Inc * | 6,503 | 420 | ||||||
Frontdoor Inc * | 21,087 | 645 | ||||||
Group 1 Automotive Inc | 4,472 | 1,202 | ||||||
Haverty Furniture Cos Inc | 17,831 | 513 | ||||||
Helen of Troy Ltd * | 8,526 | 994 | ||||||
Hibbett Inc | 17,681 | 840 | ||||||
LCI Industries | 16,429 | 1,929 | ||||||
Lithia Motors Inc, Cl A | 24,454 | 7,222 | ||||||
LKQ Corp | 47,920 | 2,372 | ||||||
Modine Manufacturing Co * | 122,254 | 5,593 | ||||||
Murphy USA Inc | 6,857 | 2,343 | ||||||
Ollie's Bargain Outlet Holdings Inc * | 3,893 | 300 | ||||||
Overstock.com Inc * | 25,391 | 402 | ||||||
Penske Automotive Group Inc, Cl A | 1,099 | 184 | ||||||
Pool Corp | 14,595 | 5,197 | ||||||
Shake Shack Inc, Cl A * | 4,949 | 287 | ||||||
Skechers USA Inc, Cl A * | 19,536 | 956 | ||||||
Standard Motor Products Inc | 2,314 | 78 | ||||||
Stride Inc * | 38,570 | 1,737 | ||||||
Taylor Morrison Home Corp, Cl A * | 45,726 | 1,948 | ||||||
Urban Outfitters Inc * | 129,062 | 4,219 | ||||||
Vail Resorts Inc | 9,517 | 2,112 | ||||||
Victoria's Secret & Co * | 133,072 | 2,220 | ||||||
Whirlpool Corp | 3,320 | 444 | ||||||
Williams-Sonoma Inc | 2,639 | 410 | ||||||
Winmark Corp | 1,329 | 496 | ||||||
| 71,128 | ||||||||
Consumer Staples — 5.8% | ||||||||
BellRing Brands Inc * | 10,378 | 428 | ||||||
BJ's Wholesale Club Holdings Inc * | 24,382 | 1,740 | ||||||
Calavo Growers Inc | 17,731 | 447 | ||||||
Cal-Maine Foods Inc | 80 | 4 | ||||||
Casey's General Stores Inc | 3,572 | 970 | ||||||
Central Garden & Pet Co, Cl A * | 15,496 | 621 | ||||||
Coca-Cola Consolidated Inc | 2,500 | 1,591 | ||||||
Darling Ingredients Inc * | 16,819 | 878 | ||||||
elf Beauty Inc * | 11,364 | 1,248 | ||||||
Flowers Foods Inc | 23,770 | 527 | ||||||
Fresh Del Monte Produce Inc | 51,983 | 1,343 | ||||||
Freshpet Inc * | 8,866 | 584 | ||||||
Hostess Brands Inc, Cl A * | 77,581 | 2,584 | ||||||
Ingles Markets Inc, Cl A | 6,621 | 499 | ||||||
Ingredion Inc | 14,851 | 1,461 | ||||||
Inter Parfums Inc | 6,330 | 850 | ||||||
J & J Snack Foods Corp | 7,030 | 1,151 | ||||||
John B Sanfilippo & Son Inc | 5,357 | 529 | ||||||
Kroger Co/The | 6,156 | 276 | ||||||
SEI Institutional Managed Trust
125
SCHEDULE OF INVESTMENTS
September 30, 2023
Tax-Managed Small/Mid Cap Fund (Continued)
Description | Shares | Market Value | ||||||
COMMON STOCK (continued) | ||||||||
Medifast Inc | 40,132 | $ | 3,004 | |||||
Pilgrim's Pride Corp * | 231,359 | 5,282 | ||||||
PriceSmart Inc | 12,015 | 894 | ||||||
Primo Water Corp | 86,629 | 1,196 | ||||||
Seaboard Corp | 144 | 541 | ||||||
Seneca Foods Corp, Cl A * | 315 | 17 | ||||||
Sovos Brands Inc * | 61,466 | 1,386 | ||||||
Spectrum Brands Holdings Inc | 75,995 | 5,954 | ||||||
Sprouts Farmers Market Inc * | 27,834 | 1,191 | ||||||
TreeHouse Foods Inc * | 33,391 | 1,455 | ||||||
Universal Corp/VA | 18,077 | 854 | ||||||
US Foods Holding Corp * | 10,313 | 410 | ||||||
USANA Health Sciences Inc * | 18,330 | 1,074 | ||||||
Vector Group Ltd | 6,608 | 70 | ||||||
Village Super Market Inc, Cl A | 16,517 | 374 | ||||||
Vita Coco Co Inc/The * | 32,446 | 845 | ||||||
Vital Farms Inc * | 77,527 | 898 | ||||||
Weis Markets Inc | 27,069 | 1,705 | ||||||
| 44,881 | ||||||||
Energy — 5.3% | ||||||||
Ardmore Shipping Corp | 27,181 | 353 | ||||||
ChampionX Corp | 14,821 | 528 | ||||||
CNX Resources Corp * | 16,326 | 369 | ||||||
Coterra Energy Inc | 69,602 | 1,883 | ||||||
Delek US Holdings Inc | 331,230 | 9,410 | ||||||
DHT Holdings Inc | 83,305 | 858 | ||||||
Diamondback Energy Inc, Cl A | 12,076 | 1,870 | ||||||
DT Midstream Inc | 76,021 | 4,023 | ||||||
Golar LNG Ltd | 5,175 | 125 | ||||||
Gulfport Energy Corp * | 11,603 | 1,377 | ||||||
HF Sinclair Corp | 40,000 | 2,277 | ||||||
International Seaways Inc | 21,180 | 953 | ||||||
Magnolia Oil & Gas Corp, Cl A | 80,870 | 1,853 | ||||||
Marathon Petroleum Corp | 7,296 | 1,104 | ||||||
Par Pacific Holdings Inc * | 21,115 | 759 | ||||||
Pioneer Natural Resources Co | 4,198 | 964 | ||||||
Southwestern Energy Co * | 659,689 | 4,255 | ||||||
TechnipFMC PLC | 164,634 | 3,349 | ||||||
Teekay Corp * | 107,083 | 661 | ||||||
Teekay Tankers Ltd, Cl A | 23,249 | 968 | ||||||
Tidewater Inc * | 18,164 | 1,291 | ||||||
Viper Energy Partners LP | 71,469 | 1,992 | ||||||
| 41,222 | ||||||||
Financials — 17.3% | ||||||||
1st Source Corp | 7,047 | 297 | ||||||
Allstate Corp/The | 990 | 110 | ||||||
American Equity Investment Life Holding Co | 158,197 | 8,486 | ||||||
American Financial Group Inc/OH | 13,674 | 1,527 | ||||||
Ameriprise Financial Inc | 4,701 | 1,550 | ||||||
Arch Capital Group Ltd * | 10,008 | 798 | ||||||
Argo Group International Holdings Ltd | 54,585 | 1,629 | ||||||
Description | Shares | Market Value | ||||||
COMMON STOCK (continued) | ||||||||
AssetMark Financial Holdings Inc * | 92,841 | $ | 2,328 | |||||
Axos Financial Inc * | 48,113 | 1,822 | ||||||
Banco Latinoamericano de Comercio Exterior SA, Cl E | 26,811 | 568 | ||||||
Bank of NT Butterfield & Son Ltd/The | 5,799 | 157 | ||||||
Bank OZK | 55,988 | 2,075 | ||||||
BankUnited Inc | 6,774 | 154 | ||||||
BGC Group, Cl A | 1,099,126 | 5,803 | ||||||
Cambridge Bancorp | 2,114 | 132 | ||||||
Cantaloupe Inc * | 89,709 | 561 | ||||||
Capital City Bank Group Inc | 9,652 | 288 | ||||||
Cass Information Systems Inc | 8,453 | 315 | ||||||
Cboe Global Markets Inc | 3,600 | 562 | ||||||
City Holding Co | 9,869 | 892 | ||||||
CNO Financial Group Inc | 310,638 | 7,371 | ||||||
Columbia Banking System Inc | 323,229 | 6,562 | ||||||
Comerica Inc | 29,273 | 1,216 | ||||||
Community Trust Bancorp Inc | 21,646 | 742 | ||||||
Diamond Hill Investment Group Inc | 3,975 | 670 | ||||||
Donnelley Financial Solutions Inc * | 39,415 | 2,218 | ||||||
Eagle Bancorp Inc | 21,162 | 454 | ||||||
Employers Holdings Inc | 17,888 | 715 | ||||||
Enstar Group Ltd * | 314 | 76 | ||||||
Enterprise Financial Services Corp | 16,282 | 611 | ||||||
Essent Group Ltd | 23,800 | 1,125 | ||||||
Euronet Worldwide Inc * | 33,730 | 2,677 | ||||||
Everest Group Ltd | 6,060 | 2,252 | ||||||
EVERTEC Inc | 55,000 | 2,045 | ||||||
Federal Agricultural Mortgage Corp, Cl C | 1,256 | 194 | ||||||
Financial Institutions Inc | 27,226 | 458 | ||||||
First American Financial Corp | 3,200 | 181 | ||||||
First Citizens BancShares Inc/NC, Cl A | 775 | 1,070 | ||||||
First Commonwealth Financial Corp | 316,920 | 3,870 | ||||||
First Community Bankshares Inc | 66,479 | 1,958 | ||||||
First Financial Bancorp | 20,000 | 392 | ||||||
First Interstate BancSystem Inc, Cl A | 51,000 | 1,272 | ||||||
First Merchants Corp | 66,622 | 1,853 | ||||||
FirstCash Holdings Inc | 1,666 | 167 | ||||||
Flywire Corp * | 44,351 | 1,414 | ||||||
FNB Corp/PA | 494,669 | 5,337 | ||||||
GCM Grosvenor Inc | 25,774 | 200 | ||||||
Global Payments Inc | 1,009 | 116 | ||||||
Goosehead Insurance Inc, Cl A * | 2,366 | 176 | ||||||
Great Southern Bancorp Inc | 13,042 | 625 | ||||||
Hanover Insurance Group Inc/The, Cl A | 25,705 | 2,853 | ||||||
Heritage Global Inc * | 2,180 | 7 | ||||||
Heritage Insurance Holdings Inc | 268,724 | 1,744 | ||||||
HomeTrust Bancshares Inc | 4,975 | 108 | ||||||
Horace Mann Educators Corp, Cl A | 66,934 | 1,967 | ||||||
Independent Bank Corp/MI | 12,857 | 236 | ||||||
Jackson Financial Inc, Cl A | 78,072 | 2,984 | ||||||
KeyCorp | 154,602 | 1,663 | ||||||
126
SEI Institutional Managed Trust
Description | Shares | Market Value | ||||||
COMMON STOCK (continued) | ||||||||
Lincoln National Corp | 266,434 | $ | 6,578 | |||||
MarketAxess Holdings Inc | 350 | 75 | ||||||
Merchants Bancorp/IN | 59,391 | 1,646 | ||||||
Mid Penn Bancorp Inc | 12,735 | 256 | ||||||
MidWestOne Financial Group Inc | 30,180 | 614 | ||||||
NMI Holdings Inc, Cl A * | 16,031 | 434 | ||||||
OceanFirst Financial Corp | 15,666 | 227 | ||||||
OFG Bancorp | 133,441 | 3,985 | ||||||
Old National Bancorp/IN, Cl A | 241,949 | 3,518 | ||||||
Oscar Health Inc, Cl A * | 186,181 | 1,037 | ||||||
Pacific Premier Bancorp Inc | 120,479 | 2,622 | ||||||
PacWest Bancorp | 122,955 | 973 | ||||||
Patria Investments, Cl A | 13,793 | 201 | ||||||
Paymentus Holdings, Cl A * | 113,366 | 1,882 | ||||||
Payoneer Global Inc * | 190,021 | 1,163 | ||||||
Peoples Bancorp Inc/OH | 7,310 | 186 | ||||||
PJT Partners Inc, Cl A | 14,364 | 1,141 | ||||||
Popular Inc | 11,261 | 710 | ||||||
Preferred Bank/Los Angeles CA | 13,055 | 813 | ||||||
ProAssurance Corp | 26,146 | 494 | ||||||
Reinsurance Group of America Inc, Cl A | 7,938 | 1,152 | ||||||
Remitly Global Inc * | 92,754 | 2,339 | ||||||
RenaissanceRe Holdings Ltd | 6,494 | 1,285 | ||||||
Republic Bancorp Inc/KY, Cl A | 17,019 | 750 | ||||||
Selective Insurance Group Inc | 19,688 | 2,031 | ||||||
Sierra Bancorp | 10,091 | 191 | ||||||
Starwood Property Trust Inc ‡ | 199,041 | 3,851 | ||||||
Third Coast Bancshares Inc * | 10,257 | 175 | ||||||
United Fire Group Inc | 791 | 16 | ||||||
Univest Financial Corp | 12,387 | 215 | ||||||
Westamerica BanCorp | 18,168 | 786 | ||||||
Zions Bancorp NA | 68,397 | 2,386 | ||||||
| 133,365 | ||||||||
Health Care — 14.6% | ||||||||
ACADIA Pharmaceuticals Inc * | 87,758 | 1,829 | ||||||
ADMA Biologics Inc * | 263,628 | 944 | ||||||
Agios Pharmaceuticals Inc * | 30,842 | 763 | ||||||
Akero Therapeutics Inc * | 30,983 | 1,567 | ||||||
Alkermes PLC * | 68,608 | 1,922 | ||||||
Amicus Therapeutics Inc * | 171,173 | 2,081 | ||||||
AMN Healthcare Services Inc * | 89,425 | 7,617 | ||||||
Amphastar Pharmaceuticals Inc * | 39,594 | 1,821 | ||||||
AnaptysBio Inc * | 16,840 | 302 | ||||||
ANI Pharmaceuticals Inc * | 36,413 | 2,114 | ||||||
Anika Therapeutics Inc * | 49,576 | 924 | ||||||
Ascendis Pharma A/S ADR * | 5,923 | 555 | ||||||
AtriCure Inc * | 17,038 | 746 | ||||||
Atrion Corp | 1 | — | ||||||
Avanos Medical Inc * | 72,042 | 1,457 | ||||||
Avista Public Acquisition Corp II, Cl W * | 67,355 | 350 | ||||||
Axonics Inc * | 10,000 | 561 | ||||||
BioCryst Pharmaceuticals Inc * | 72,555 | 514 | ||||||
Description | Shares | Market Value | ||||||
COMMON STOCK (continued) | ||||||||
Biohaven Ltd * | 7,698 | $ | 200 | |||||
Catalyst Pharmaceuticals Inc * | 44,621 | 522 | ||||||
Cencora Inc, Cl A | 4,713 | 848 | ||||||
Charles River Laboratories International Inc * | 7,525 | 1,475 | ||||||
Chemed Corp | 5,665 | 2,944 | ||||||
Collegium Pharmaceutical Inc * | 144,126 | 3,221 | ||||||
Corcept Therapeutics Inc * | 24,000 | 654 | ||||||
CorVel Corp * | 3,132 | 616 | ||||||
Crinetics Pharmaceuticals Inc * | 6,227 | 185 | ||||||
Cross Country Healthcare Inc * | 277,044 | 6,868 | ||||||
Cullinan Oncology Inc * | 12,802 | 116 | ||||||
CVRx Inc * | 36,296 | 551 | ||||||
Cymabay Therapeutics Inc * | 15,367 | 229 | ||||||
Day One Biopharmaceuticals Inc * | 14,368 | 176 | ||||||
Deciphera Pharmaceuticals Inc * | 22,192 | 282 | ||||||
DENTSPLY SIRONA Inc | 5,362 | 183 | ||||||
Doximity Inc, Cl A * | 38,504 | 817 | ||||||
Edgewise Therapeutics Inc * | 14,482 | 83 | ||||||
Encompass Health Corp | 19,928 | 1,338 | ||||||
Enovis Corp * | 57,084 | 3,010 | ||||||
Ensign Group Inc/The | 4,885 | 454 | ||||||
Evolus Inc * | 48,067 | 439 | ||||||
Globus Medical Inc, Cl A * | 20,046 | 995 | ||||||
GoodRx Holdings, Cl A * | 346,710 | 1,952 | ||||||
Haemonetics Corp * | 23,458 | 2,101 | ||||||
HealthEquity Inc * | 15,081 | 1,102 | ||||||
HealthStream Inc | 61,213 | 1,321 | ||||||
Hims & Hers Health Inc * | 68,848 | 433 | ||||||
ICON PLC * | 7,886 | 1,942 | ||||||
ICU Medical Inc * | 5,669 | 675 | ||||||
IDEXX Laboratories Inc * | 458 | 200 | ||||||
ImmunoGen Inc * | 91,670 | 1,455 | ||||||
Incyte Corp * | 3,300 | 191 | ||||||
Insmed Inc * | 22,493 | 568 | ||||||
Integra LifeSciences Holdings Corp * | 114,280 | 4,364 | ||||||
Ionis Pharmaceuticals Inc * | 6,047 | 274 | ||||||
Iovance Biotherapeutics Inc * | 68,123 | 310 | ||||||
iRadimed Corp | 4,219 | 187 | ||||||
Ironwood Pharmaceuticals Inc, Cl A * | 22,753 | 219 | ||||||
Jazz Pharmaceuticals PLC * | 5,000 | 647 | ||||||
Kiniksa Pharmaceuticals Ltd, Cl A * | 31,021 | 539 | ||||||
Lantheus Holdings Inc * | 5,359 | 372 | ||||||
LeMaitre Vascular Inc | 3,528 | 192 | ||||||
Ligand Pharmaceuticals Inc * | 20,252 | 1,213 | ||||||
LivaNova PLC * | 68,306 | 3,612 | ||||||
Madrigal Pharmaceuticals Inc * | 1,113 | 163 | ||||||
Masimo Corp * | 3,863 | 339 | ||||||
Medpace Holdings Inc * | 12,810 | 3,102 | ||||||
Merit Medical Systems Inc * | 17,000 | 1,173 | ||||||
Mettler-Toledo International Inc * | 411 | 455 | ||||||
National HealthCare Corp | 4,888 | 313 | ||||||
SEI Institutional Managed Trust
127
SCHEDULE OF INVESTMENTS
September 30, 2023
Tax-Managed Small/Mid Cap Fund (Continued)
Description | Shares | Market Value | ||||||
COMMON STOCK (continued) | ||||||||
National Research Corp, Cl A | 12,793 | $ | 568 | |||||
NeoGenomics Inc * | 51,646 | 635 | ||||||
Neurocrine Biosciences Inc * | 11,777 | 1,325 | ||||||
NextGen Healthcare Inc * | 35,438 | 841 | ||||||
OmniAB Inc * | 11,714 | — | ||||||
Option Care Health Inc * | 42,714 | 1,382 | ||||||
OraSure Technologies Inc * | 166,742 | 989 | ||||||
Pacira BioSciences Inc * | 44,489 | 1,365 | ||||||
Penumbra Inc * | 1,427 | 345 | ||||||
Perrigo Co PLC | 34,247 | 1,094 | ||||||
Phibro Animal Health Corp, Cl A | 94,132 | 1,202 | ||||||
Phreesia Inc * | 24,280 | 454 | ||||||
Point Biopharma Global Inc, Cl A * | 14,694 | 98 | ||||||
Prestige Consumer Healthcare Inc, Cl A * | 46,904 | 2,682 | ||||||
Puma Biotechnology Inc * | 172,696 | 454 | ||||||
Quanterix Corp * | 41,966 | 1,139 | ||||||
REGENXBIO Inc * | 35,675 | 587 | ||||||
Revance Therapeutics Inc * | 61,071 | 700 | ||||||
Revvity Inc | 12,707 | 1,407 | ||||||
Shockwave Medical Inc * | 1,170 | 233 | ||||||
SI-BONE Inc * | 19,280 | 410 | ||||||
Supernus Pharmaceuticals Inc * | 43,377 | 1,196 | ||||||
Surgery Partners Inc * | 29,500 | 863 | ||||||
Surmodics Inc * | 37,162 | 1,193 | ||||||
Tabula Rasa HealthCare Inc * | 80,000 | 825 | ||||||
Taro Pharmaceutical Industries Ltd * | 25,554 | 964 | ||||||
Teleflex Inc | 5,740 | 1,127 | ||||||
Tenet Healthcare Corp * | 6,108 | 402 | ||||||
Theravance Biopharma Inc * | 3,763 | 32 | ||||||
UFP Technologies Inc * | 9,200 | 1,485 | ||||||
United Therapeutics Corp * | 7,055 | 1,594 | ||||||
Utah Medical Products Inc | 4,566 | 393 | ||||||
Varex Imaging Corp * | 31,710 | 596 | ||||||
Ventyx Biosciences Inc * | 2,985 | 104 | ||||||
Viemed Healthcare Inc * | 122,739 | 826 | ||||||
Voyager Therapeutics Inc * | 128,115 | 993 | ||||||
WaVe Life Sciences Ltd * | 7,045 | 41 | ||||||
Xencor Inc * | 12,980 | 262 | ||||||
| 112,493 | ||||||||
Industrials — 17.5% | ||||||||
A O Smith Corp | 4,400 | 291 | ||||||
AAON Inc | 24,624 | 1,400 | ||||||
AAR Corp * | 15,000 | 893 | ||||||
ABM Industries Inc | 127,439 | 5,099 | ||||||
ACCO Brands Corp | 635,856 | 3,650 | ||||||
Acuity Brands Inc | 2,320 | 395 | ||||||
Advanced Drainage Systems Inc | 15,809 | 1,800 | ||||||
AECOM | 13,579 | 1,128 | ||||||
AeroVironment Inc * | 8,052 | 898 | ||||||
Alamo Group Inc | 3,073 | 531 | ||||||
Apogee Enterprises Inc | 8,561 | 403 | ||||||
Applied Industrial Technologies Inc, Cl A | 12,000 | 1,855 | ||||||
Description | Shares | Market Value | ||||||
COMMON STOCK (continued) | ||||||||
Astec Industries Inc | 30,606 | $ | 1,442 | |||||
Asure Software Inc * | 24,481 | 232 | ||||||
Barrett Business Services Inc | 2,176 | 196 | ||||||
Boise Cascade Co | 4,228 | 436 | ||||||
Bowman Consulting Group Ltd, Cl A * | 15,185 | 426 | ||||||
Brady Corp, Cl A | 372 | 20 | ||||||
Brink's Co/The | 1,514 | 110 | ||||||
Broadridge Financial Solutions Inc | 1,700 | 304 | ||||||
Builders FirstSource Inc * | 9,855 | 1,227 | ||||||
BWX Technologies Inc, Cl W | 92,285 | 6,919 | ||||||
CACI International Inc, Cl A * | 1,073 | 337 | ||||||
Casella Waste Systems Inc, Cl A * | 5,000 | 381 | ||||||
CBIZ Inc * | 22,449 | 1,165 | ||||||
CECO Environmental Corp * | 52,254 | 834 | ||||||
Cintas Corp | 3,186 | 1,532 | ||||||
Clean Harbors Inc * | 7,022 | 1,175 | ||||||
CRA International Inc | 11,678 | 1,177 | ||||||
CSG Systems International Inc | 16,685 | 853 | ||||||
CSW Industrials Inc | 1,824 | 320 | ||||||
Curtiss-Wright Corp | 12,804 | 2,505 | ||||||
Ducommun Inc * | 8,335 | 363 | ||||||
EMCOR Group Inc | 17,604 | 3,704 | ||||||
Esab Corp | 75,081 | 5,272 | ||||||
ExlService Holdings Inc * | 109,076 | 3,058 | ||||||
Exponent Inc | 25,514 | 2,184 | ||||||
Franklin Covey Co * | 7,478 | 321 | ||||||
FTI Consulting Inc * | 6,375 | 1,137 | ||||||
Gorman-Rupp Co/The | 6,501 | 214 | ||||||
GXO Logistics Inc * | 87,444 | 5,129 | ||||||
H&E Equipment Services Inc | 14,490 | 626 | ||||||
Heartland Express Inc | 53,253 | 782 | ||||||
Heritage-Crystal Clean Inc * | 29,302 | 1,329 | ||||||
Hillenbrand Inc | 8,146 | 345 | ||||||
Hub Group Inc, Cl A * | 12,964 | 1,018 | ||||||
Hubbell Inc, Cl B | 1,071 | 336 | ||||||
Huntington Ingalls Industries Inc, Cl A | 1,235 | 253 | ||||||
Huron Consulting Group Inc * | 1,476 | 154 | ||||||
Hyster-Yale Materials Handling Inc | 16,740 | 746 | ||||||
IDEX Corp | 4,000 | 832 | ||||||
Kadant Inc | 10,046 | 2,266 | ||||||
Kaman Corp, Cl A | 70,405 | 1,383 | ||||||
Kennametal Inc | 33,177 | 825 | ||||||
Kforce Inc | 10,057 | 600 | ||||||
L3Harris Technologies Inc | 2,036 | 354 | ||||||
Landstar System Inc | 8,600 | 1,522 | ||||||
Legalzoom.com Inc * | 31,420 | 344 | ||||||
LSI Industries Inc | 81,218 | 1,290 | ||||||
Marten Transport Ltd | 49,401 | 974 | ||||||
Masonite International Corp * | 28,376 | 2,645 | ||||||
Matthews International Corp, Cl A | 45,895 | 1,786 | ||||||
McGrath RentCorp | 6,000 | 601 | ||||||
Miller Industries Inc/TN | 36,016 | 1,412 | ||||||
128
SEI Institutional Managed Trust
Description | Shares | Market Value | ||||||
COMMON STOCK (continued) | ||||||||
MSA Safety Inc | 10,698 | $ | 1,687 | |||||
MSC Industrial Direct Co Inc, Cl A | 3,679 | 361 | ||||||
Mueller Industries Inc | 8,000 | 601 | ||||||
MYR Group Inc * | 22,025 | 2,968 | ||||||
National Presto Industries Inc | 7,176 | 520 | ||||||
Old Dominion Freight Line Inc, Cl A | 5,536 | 2,265 | ||||||
OPENLANE Inc * | 259,680 | 3,874 | ||||||
Park Aerospace Corp | 81,129 | 1,260 | ||||||
Powell Industries Inc | 10,713 | 888 | ||||||
Primoris Services Corp | 29,688 | 972 | ||||||
Radiant Logistics Inc * | 17,857 | 101 | ||||||
RB Global Inc | 40,510 | 2,532 | ||||||
RBC Bearings Inc * | 4,000 | 936 | ||||||
Resources Connection Inc | 21,841 | 326 | ||||||
Rush Enterprises Inc, Cl A | 58,383 | 2,384 | ||||||
RXO Inc * | 50,356 | 993 | ||||||
Schneider National Inc, Cl B | 13,231 | 366 | ||||||
Science Applications International Corp | 13,698 | 1,446 | ||||||
Simpson Manufacturing Co Inc | 7,500 | 1,124 | ||||||
SP Plus Corp * | 1,746 | 63 | ||||||
Standex International Corp | 5,842 | 851 | ||||||
Tennant Co | 12,618 | 936 | ||||||
Terex Corp | 16,656 | 960 | ||||||
Tetra Tech Inc | 26,187 | 3,981 | ||||||
Textainer Group Holdings Ltd | 47,803 | 1,781 | ||||||
Toro Co/The | 2,800 | 233 | ||||||
UFP Industries Inc | 9,396 | 962 | ||||||
UniFirst Corp/MA | 1,278 | 208 | ||||||
United Rentals Inc | 4,375 | 1,945 | ||||||
Upwork Inc * | 37,909 | 431 | ||||||
Verra Mobility Corp, Cl A * | 125,782 | 2,352 | ||||||
WESCO International Inc | 28,639 | 4,119 | ||||||
Westinghouse Air Brake Technologies Corp | 3,600 | 383 | ||||||
WNS Holdings Ltd ADR * | 33,143 | 2,269 | ||||||
XPO Inc * | 55,015 | 4,107 | ||||||
Xylem Inc/NY | 4,342 | 395 | ||||||
| 135,319 | ||||||||
Information Technology — 13.6% | ||||||||
A10 Networks Inc | 113,184 | 1,701 | ||||||
ACI Worldwide Inc * | 184,078 | 4,153 | ||||||
Agilysys Inc * | 17,117 | 1,132 | ||||||
Amdocs Ltd | 14,000 | 1,183 | ||||||
Amkor Technology Inc | 28,193 | 637 | ||||||
ANSYS Inc * | 2,600 | 774 | ||||||
Appfolio Inc, Cl A * | 977 | 178 | ||||||
Arista Networks Inc * | 9,558 | 1,758 | ||||||
Arlo Technologies Inc * | 92,723 | 955 | ||||||
Aspen Technology Inc * | 9,268 | 1,893 | ||||||
Axcelis Technologies Inc * | 16,688 | 2,721 | ||||||
Bel Fuse Inc, Cl B | 28,255 | 1,348 | ||||||
Blackbaud Inc, Cl A * | 21,437 | 1,507 | ||||||
Cadence Design Systems Inc * | 9,084 | 2,128 | ||||||
Description | Shares | Market Value | ||||||
COMMON STOCK (continued) | ||||||||
Calix Inc * | 22,676 | $ | 1,039 | |||||
Cambium Networks Corp * | 33,991 | 249 | ||||||
Clearfield Inc * | 1,632 | 47 | ||||||
CommVault Systems Inc * | 19,305 | 1,305 | ||||||
Consensus Cloud Solutions Inc * | 61,270 | 1,543 | ||||||
CTS Corp | 7,000 | 292 | ||||||
Digi International Inc * | 21,257 | 574 | ||||||
Diodes Inc * | 15,000 | 1,183 | ||||||
eGain Corp * | 43,177 | 265 | ||||||
Entegris Inc | 17,353 | 1,630 | ||||||
EPAM Systems Inc * | 2,034 | 520 | ||||||
Fabrinet * | 2,627 | 438 | ||||||
Fair Isaac Corp * | 1,635 | 1,420 | ||||||
Fastly Inc, Cl A * | 81,769 | 1,568 | ||||||
Freshworks, Cl A * | 27,144 | 541 | ||||||
Gartner Inc * | 1,518 | 522 | ||||||
GoDaddy Inc, Cl A * | 20,705 | 1,542 | ||||||
Hackett Group Inc/The | 37,239 | 878 | ||||||
Ichor Holdings Ltd * | 10,411 | 322 | ||||||
Insight Enterprises Inc * | 21,641 | 3,149 | ||||||
Intapp Inc * | 43,878 | 1,471 | ||||||
Iteris Inc * | 200,952 | 832 | ||||||
Kyndryl Holdings Inc * | 25,247 | 381 | ||||||
Lattice Semiconductor Corp * | 14,532 | 1,249 | ||||||
LiveRamp Holdings Inc * | 35,399 | 1,021 | ||||||
Lumentum Holdings Inc * | 2,779 | 126 | ||||||
MACOM Technology Solutions Holdings Inc * | 5,522 | 450 | ||||||
Manhattan Associates Inc * | 10,280 | 2,032 | ||||||
Monolithic Power Systems Inc | 2,213 | 1,022 | ||||||
ON Semiconductor Corp * | 42,625 | 3,962 | ||||||
OSI Systems Inc * | 184 | 22 | ||||||
Palo Alto Networks Inc * | 2,358 | 553 | ||||||
PDF Solutions Inc * | 6,638 | 215 | ||||||
Perficient Inc * | 12,505 | 724 | ||||||
Photronics Inc * | 341,905 | 6,910 | ||||||
Power Integrations Inc | 10,000 | 763 | ||||||
Progress Software Corp | 5,788 | 304 | ||||||
PROS Holdings Inc * | 41,930 | 1,452 | ||||||
PTC Inc * | 19,109 | 2,707 | ||||||
Qualys Inc * | 12,281 | 1,873 | ||||||
Rambus Inc * | 12,784 | 713 | ||||||
RingCentral Inc, Cl A * | 773 | 23 | ||||||
Semtech Corp * | 5,382 | 139 | ||||||
Silicon Motion Technology Corp ADR * | 102,899 | 5,274 | ||||||
SolarWinds Corp * | 161,176 | 1,522 | ||||||
Sprinklr Inc, Cl A * | 12,658 | 175 | ||||||
SPS Commerce Inc * | 16,563 | 2,826 | ||||||
Squarespace Inc, Cl A * | 11,670 | 338 | ||||||
Super Micro Computer Inc * | 26,125 | 7,164 | ||||||
Synopsys Inc * | 4,279 | 1,964 | ||||||
Teledyne Technologies Inc * | 13,141 | 5,369 | ||||||
SEI Institutional Managed Trust
129
SCHEDULE OF INVESTMENTS
September 30, 2023
Tax-Managed Small/Mid Cap Fund (Concluded)
Description | Shares | Market Value | ||||||
COMMON STOCK (continued) | ||||||||
Tenable Holdings Inc * | 29,500 | $ | 1,322 | |||||
Teradyne Inc | 11,312 | 1,136 | ||||||
Tyler Technologies Inc * | 4,508 | 1,741 | ||||||
Verint Systems Inc * | 112,718 | 2,591 | ||||||
Vishay Precision Group Inc * | 10,000 | 336 | ||||||
Wix.com Ltd * | 11,682 | 1,072 | ||||||
Yext Inc * | 99,074 | 627 | ||||||
Zuora Inc, Cl A * | 223,206 | 1,839 | ||||||
| 105,335 | ||||||||
Materials — 5.7% | ||||||||
Alamos Gold Inc, Cl A | 47,569 | 537 | ||||||
Albemarle Corp | 3,497 | 595 | ||||||
Ashland Inc | 55,852 | 4,562 | ||||||
Avery Dennison Corp | 2,472 | 451 | ||||||
Axalta Coating Systems Ltd * | 170,448 | 4,585 | ||||||
Balchem Corp | 14,444 | 1,792 | ||||||
Carpenter Technology Corp | 10,434 | 701 | ||||||
Century Aluminum Co * | 59,619 | 429 | ||||||
Chase Corp | 3,821 | 486 | ||||||
Commercial Metals Co, Cl A | 177,556 | 8,773 | ||||||
Crown Holdings Inc | 4,800 | 425 | ||||||
FMC Corp | 63,800 | 4,273 | ||||||
Fortitude Gold Corp | 40,846 | 244 | ||||||
Hawkins Inc | 12,136 | 714 | ||||||
Ingevity Corp * | 36,000 | 1,714 | ||||||
Materion Corp | 9,421 | 960 | ||||||
NewMarket Corp | 1,035 | 471 | ||||||
Novagold Resources Inc * | 116,696 | 448 | ||||||
Packaging Corp of America | 2,600 | 399 | ||||||
Reliance Steel & Aluminum Co | 1,602 | 420 | ||||||
Royal Gold Inc, Cl A | 2,923 | 311 | ||||||
Silgan Holdings Inc | 243,629 | 10,503 | ||||||
Universal Stainless & Alloy Products Inc * | 44,326 | 581 | ||||||
| 44,374 | ||||||||
Real Estate — 3.6% | ||||||||
Alexander & Baldwin Inc ‡ | 26,193 | 438 | ||||||
Alexander's Inc ‡ | 5,898 | 1,075 | ||||||
Centerspace ‡ | 15,417 | 929 | ||||||
Community Healthcare Trust Inc ‡ | 384 | 11 | ||||||
CoStar Group Inc * | 26,241 | 2,018 | ||||||
EastGroup Properties Inc ‡ | 14,800 | 2,465 | ||||||
Elme Communities ‡ | 42,047 | 574 | ||||||
Equity Commonwealth ‡ | 10,526 | 193 | ||||||
Equity LifeStyle Properties Inc ‡ | 20,564 | 1,310 | ||||||
FRP Holdings Inc * | 4,575 | 247 | ||||||
Gaming and Leisure Properties Inc ‡ | 164,643 | 7,499 | ||||||
Getty Realty Corp ‡ | 28,351 | 786 | ||||||
Gladstone Commercial Corp ‡ | 24,848 | 302 | ||||||
Highwoods Properties Inc ‡ | 120,516 | 2,484 | ||||||
Howard Hughes Holdings Inc * | 9,600 | 712 | ||||||
Independence Realty Trust Inc ‡ | 67,618 | 951 | ||||||
Description | Shares | Market Value | ||||||
COMMON STOCK (continued) | ||||||||
Invitation Homes Inc ‡ | 23,648 | $ | 749 | |||||
Medical Properties Trust Inc ‡ | 649 | 4 | ||||||
Newmark Group Inc, Cl A | 450,766 | 2,898 | ||||||
Regency Centers Corp ‡ | 1,254 | 75 | ||||||
Ryman Hospitality Properties Inc ‡ | 10,995 | 916 | ||||||
Saul Centers Inc ‡ | 2,859 | 101 | ||||||
Sun Communities Inc ‡ | 1,400 | 166 | ||||||
Universal Health Realty Income Trust ‡ | 4,242 | 171 | ||||||
Ventas Inc ‡ | 7,436 | 313 | ||||||
| 27,387 | ||||||||
Utilities — 1.3% | ||||||||
ALLETE Inc | 3,589 | 190 | ||||||
Artesian Resources Corp, Cl A | 22,433 | 942 | ||||||
Chesapeake Utilities Corp | 6,037 | 590 | ||||||
IDACORP Inc, Cl A | 10,909 | 1,022 | ||||||
MGE Energy Inc | 16,399 | 1,124 | ||||||
Middlesex Water Co | 16,481 | 1,092 | ||||||
Northwest Natural Holding Co | 4,942 | 189 | ||||||
NorthWestern Corp | 11,200 | 538 | ||||||
Otter Tail Corp | 19,000 | 1,442 | ||||||
Portland General Electric Co | 43,378 | 1,756 | ||||||
UGI Corp | 6,450 | 148 | ||||||
Unitil Corp | 12,924 | 552 | ||||||
York Water Co/The | 9,081 | 340 | ||||||
| 9,925 | ||||||||
Total Common Stock | ||||||||
(Cost $471,544) ($ Thousands) | 762,684 | |||||||
Number of Rights | ||||||||
RIGHTS — 0.0% | ||||||||
Abiomed Inc *‡‡ | 967 | – | ||||||
Total Rights | ||||||||
(Cost $—) ($ Thousands) | – | |||||||
| ||||||||
CASH EQUIVALENT — 1.3% | ||||||||
SEI Daily Income Trust, Government Fund, Institutional Class | ||||||||
5.210%**† | 9,783,062 | 9,783 | ||||||
Total Cash Equivalent | ||||||||
(Cost $9,783) ($ Thousands) | 9,783 | |||||||
Total Investments in Securities — 100.0% | ||||||||
(Cost $481,327) ($ Thousands) | $ | 772,467 | ||||||
130
SEI Institutional Managed Trust
Amounts designated as “—” are either $0 or have been rounded to $0.
| Percentages are based on Net Assets of $773,120 ($ Thousands). |
* | Non-income producing security. |
** | The rate reported is the 7-day effective yield as of September 30, 2023. |
‡ | Real Estate Investment Trust. |
‡‡ | Expiration date not available. |
† | Investment in Affiliated Security (see Note 6). |
As of September 30, 2023, all of the Fund's investments were considered Level 1, in accordance with the authoritative guidance on fair value measurements and disclosure under U.S. GAAP. |
For more information on valuation inputs, see Note 2 — Significant Accounting Policies in Notes to Financial Statements.
The following is a summary of the Fund’s transactions with affiliates for the year ended September 30, 2023 ($ Thousands):
Security Description | Value 9/30/2022 | Purchases at Cost | Proceeds from Sales | Realized Gain/ (Loss) | Change in Unrealized Appreciation/ (Depreciation) | Value 9/30/2023 | Income | Capital Gains | ||||||||||||||||||||||||
SEI Liquidity Fund, LP | $ | 525 | $ | 20,167 | $ | (20,684 | ) | $ | — | $ | (8 | ) | $ | — | $ | 26 | $ | — | ||||||||||||||
SEI Daily Income Trust, Government Fund, Institutional Class | 10,783 | 168,559 | (169,559 | ) | — | — | 9,783 | 408 | — | |||||||||||||||||||||||
Totals | $ | 11,308 | $ | 188,726 | $ | (190,243 | ) | $ | — | $ | (8 | ) | $ | 9,783 | $ | 434 | $ | — | ||||||||||||||
Amounts designated as “—” are either $0 or have been rounded to $0.
See “Glossary” for abbreviations.
The accompanying notes are an integral part of the financial statements.
SEI Institutional Managed Trust
131
SCHEDULE OF INVESTMENTS
September 30, 2023
Mid-Cap Fund
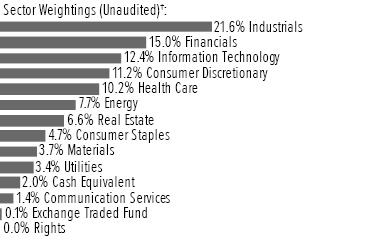
† | Percentages are based on total investments. Total investments do not include derivatives such as options, futures contracts, forward contracts, and swap contracts, if applicable. |
Description | Shares | Market Value | ||||||
COMMON STOCK — 97.9% | ||||||||
Communication Services — 1.4% | ||||||||
Liberty Broadband Corp, Cl C * | 1,005 | $ | 92 | |||||
Live Nation Entertainment Inc * | 4,200 | 349 | ||||||
Pinterest Inc, Cl A * | 2,200 | 59 | ||||||
Playtika Holding Corp * | 10,490 | 101 | ||||||
Roku Inc, Cl A * | 2,080 | 147 | ||||||
Trade Desk Inc/The, Cl A * | 1,750 | 137 | ||||||
Warner Bros Discovery Inc * | 11,340 | 123 | ||||||
| 1,008 | ||||||||
Consumer Discretionary — 11.2% | ||||||||
Advance Auto Parts Inc | 1,006 | 56 | ||||||
Aptiv PLC * | 1,200 | 118 | ||||||
AutoNation Inc * | 1,169 | 177 | ||||||
AutoZone Inc * | 113 | 287 | ||||||
Bath & Body Works Inc | 8,200 | 277 | ||||||
BorgWarner Inc | 5,895 | 238 | ||||||
Boyd Gaming Corp | 2,634 | 160 | ||||||
Caesars Entertainment Inc * | 1,920 | 89 | ||||||
CarMax Inc * | 5,400 | 382 | ||||||
Carnival Corp * | 11,870 | 163 | ||||||
Carter's Inc | 1,612 | 111 | ||||||
Chipotle Mexican Grill Inc, Cl A * | 124 | 227 | ||||||
Columbia Sportswear Co | 2,647 | 196 | ||||||
Coupang Inc, Cl A * | 3,390 | 58 | ||||||
Darden Restaurants Inc | 740 | 106 | ||||||
Domino's Pizza Inc | 420 | 159 | ||||||
DoorDash Inc, Cl A * | 850 | 68 | ||||||
DR Horton Inc | 1,500 | 161 | ||||||
eBay Inc | 4,700 | 207 | ||||||
Expedia Group Inc * | 1,750 | 180 | ||||||
Grand Canyon Education Inc * | 1,050 | 123 | ||||||
H&R Block Inc | 2,450 | 105 | ||||||
Harley-Davidson Inc, Cl A | 8,666 | 287 | ||||||
Hasbro Inc | 3,783 | 250 | ||||||
Description | Shares | Market Value | ||||||
COMMON STOCK (continued) | ||||||||
Hilton Worldwide Holdings Inc | 740 | $ | 111 | |||||
Lennar Corp, Cl A | 2,180 | 245 | ||||||
Lennar Corp, Cl B | 1,585 | 162 | ||||||
LKQ Corp | 5,895 | 292 | ||||||
Lululemon Athletica Inc * | 491 | 189 | ||||||
MGM Resorts International | 2,420 | 89 | ||||||
Mohawk Industries Inc * | 1,540 | 132 | ||||||
NVR Inc * | 10 | 60 | ||||||
O'Reilly Automotive Inc * | 260 | 236 | ||||||
Polaris Inc | 690 | 72 | ||||||
PulteGroup Inc | 5,142 | 381 | ||||||
Rivian Automotive Inc, Cl A * | 3,880 | 94 | ||||||
Ross Stores Inc | 2,150 | 243 | ||||||
Royal Caribbean Cruises Ltd * | 4,250 | 392 | ||||||
Toll Brothers Inc | 4,720 | 349 | ||||||
TopBuild Corp * | 1,470 | 370 | ||||||
Travel + Leisure Co | 2,480 | 91 | ||||||
Valvoline Inc | 6,003 | 194 | ||||||
Wynn Resorts Ltd | 830 | 77 | ||||||
Yum! Brands Inc | 3,130 | 391 | ||||||
| 8,355 | ||||||||
Consumer Staples — 4.7% | ||||||||
Boston Beer Co Inc/The, Cl A * | 180 | 70 | ||||||
Brown-Forman Corp, Cl A | 1,900 | 110 | ||||||
Brown-Forman Corp, Cl B | 2,667 | 154 | ||||||
Casey's General Stores Inc | 597 | 162 | ||||||
Celsius Holdings Inc * | 1,162 | 200 | ||||||
Church & Dwight Co Inc | 2,380 | 218 | ||||||
Constellation Brands Inc, Cl A | 908 | 228 | ||||||
Darling Ingredients Inc * | 7,176 | 375 | ||||||
Dollar Tree Inc * | 1,540 | 164 | ||||||
Hershey Co/The | 1,104 | 221 | ||||||
Ingredion Inc | 2,172 | 214 | ||||||
Kroger Co/The | 4,270 | 191 | ||||||
Lamb Weston Holdings Inc | 4,163 | 385 | ||||||
Performance Food Group Co * | 1,830 | 108 | ||||||
Post Holdings Inc * | 1,070 | 92 | ||||||
TreeHouse Foods Inc * | 5,648 | 246 | ||||||
Tyson Foods Inc, Cl A | 5,296 | 267 | ||||||
US Foods Holding Corp * | 2,300 | 91 | ||||||
| 3,496 | ||||||||
Energy — 7.7% | ||||||||
Antero Midstream Corp | 7,440 | 89 | ||||||
Antero Resources Corp * | 4,770 | 121 | ||||||
APA Corp | 5,940 | 244 | ||||||
Baker Hughes Co, Cl A | 10,010 | 354 | ||||||
ChampionX Corp | 8,030 | 286 | ||||||
Cheniere Energy Inc | 3,380 | 561 | ||||||
Chesapeake Energy Corp | 690 | 59 | ||||||
Chevron Corp | 704 | 119 | ||||||
Coterra Energy Inc | 9,048 | 245 | ||||||
132
SEI Institutional Managed Trust
Description | Shares | Market Value | ||||||
COMMON STOCK (continued) | ||||||||
DT Midstream Inc | 1,875 | $ | 99 | |||||
EQT Corp | 5,320 | 216 | ||||||
Halliburton Co | 4,510 | 183 | ||||||
HF Sinclair Corp | 3,010 | 171 | ||||||
Marathon Petroleum Corp | 665 | 101 | ||||||
ONEOK Inc | 5,865 | 372 | ||||||
Ovintiv Inc | 2,280 | 108 | ||||||
Permian Resources Corp, Cl A | 12,731 | 178 | ||||||
Phillips 66 | 3,095 | 372 | ||||||
Pioneer Natural Resources Co | 1,088 | 250 | ||||||
Range Resources Corp | 6,900 | 224 | ||||||
Southwestern Energy Co * | 24,560 | 158 | ||||||
Targa Resources Corp | 6,066 | 520 | ||||||
TechnipFMC PLC | 16,310 | 332 | ||||||
Texas Pacific Land Corp | 42 | 77 | ||||||
Valero Energy Corp | 850 | 120 | ||||||
Williams Cos Inc/The | 4,052 | 136 | ||||||
| 5,695 | ||||||||
Financials — 15.0% | ||||||||
Affiliated Managers Group Inc | 890 | 116 | ||||||
Aflac Inc | 2,910 | 223 | ||||||
Allstate Corp/The | 4,852 | 541 | ||||||
American International Group Inc | 5,597 | 339 | ||||||
Ameriprise Financial Inc | 886 | 292 | ||||||
Apollo Global Management Inc | 8,268 | 742 | ||||||
Arch Capital Group Ltd * | 2,527 | 201 | ||||||
Assurant Inc | 670 | 96 | ||||||
Axis Capital Holdings Ltd | 1,300 | 73 | ||||||
Bank of New York Mellon Corp/The | 4,480 | 191 | ||||||
Bank OZK | 4,630 | 172 | ||||||
Block Inc, Cl A * | 2,466 | 109 | ||||||
Chimera Investment Corp ‡ | 20,232 | 111 | ||||||
Cincinnati Financial Corp | 2,740 | 280 | ||||||
Evercore Inc, Cl A | 690 | 95 | ||||||
Everest Group Ltd | 1,117 | 415 | ||||||
Eversource Energy | 2,140 | 124 | ||||||
Fidelity National Information Services Inc, Cl B | 3,160 | 175 | ||||||
First Horizon Corp | 22,803 | 251 | ||||||
FleetCor Technologies Inc * | 1,777 | 454 | ||||||
Global Payments Inc | 3,248 | 375 | ||||||
Globe Life Inc | 737 | 80 | ||||||
Jefferies Financial Group Inc | 3,550 | 130 | ||||||
Kinsale Capital Group Inc | 430 | 178 | ||||||
Loews Corp | 1,340 | 85 | ||||||
Markel Group Inc * | 110 | 162 | ||||||
MarketAxess Holdings Inc | 940 | 201 | ||||||
MGIC Investment Corp | 25,950 | 433 | ||||||
MSCI Inc, Cl A | 1,061 | 544 | ||||||
Nasdaq Inc, Cl A | 1,386 | 67 | ||||||
New York Community Bancorp Inc | 6,150 | 70 | ||||||
Pinnacle Financial Partners Inc | 9,242 | 620 | ||||||
Description | Shares | Market Value | ||||||
COMMON STOCK (continued) | ||||||||
Primerica Inc | 1,553 | $ | 301 | |||||
Progressive Corp/The | 2,776 | 387 | ||||||
Prudential Financial Inc | 660 | 63 | ||||||
Reinsurance Group of America Inc, Cl A | 3,554 | 516 | ||||||
RenaissanceRe Holdings Ltd | 480 | 95 | ||||||
RLI Corp | 1,730 | 235 | ||||||
Stifel Financial Corp | 2,193 | 135 | ||||||
StoneCo Ltd, Cl A * | 8,750 | 93 | ||||||
Synchrony Financial | 6,190 | 189 | ||||||
Unum Group | 1,500 | 74 | ||||||
Voya Financial Inc | 3,470 | 231 | ||||||
W R Berkley Corp | 3,742 | 238 | ||||||
Webster Financial Corp | 3,651 | 147 | ||||||
Western Union Co/The | 16,730 | 221 | ||||||
WEX Inc * | 470 | 88 | ||||||
XP Inc, Cl A | 2,380 | 55 | ||||||
Zions Bancorp NA | 3,550 | 124 | ||||||
| 11,137 | ||||||||
Health Care — 10.2% | ||||||||
Align Technology Inc * | 1,330 | 406 | ||||||
Cencora Inc, Cl A | 2,231 | 401 | ||||||
Centene Corp * | 3,862 | 266 | ||||||
DENTSPLY SIRONA Inc | 4,460 | 152 | ||||||
Dexcom Inc * | 2,870 | 268 | ||||||
Encompass Health Corp | 4,555 | 306 | ||||||
Envista Holdings Corp * | 5,336 | 149 | ||||||
Exelixis Inc * | 3,780 | 83 | ||||||
Globus Medical Inc, Cl A * | 8,900 | 442 | ||||||
Hologic Inc * | 3,310 | 230 | ||||||
Horizon Therapeutics Plc * | 780 | 90 | ||||||
ICON PLC * | 2,160 | 532 | ||||||
IDEXX Laboratories Inc * | 1,020 | 446 | ||||||
Incyte Corp * | 4,760 | 275 | ||||||
Inspire Medical Systems Inc * | 880 | 175 | ||||||
Insulet Corp * | 360 | 57 | ||||||
IQVIA Holdings Inc * | 1,778 | 350 | ||||||
Jazz Pharmaceuticals PLC * | 844 | 109 | ||||||
Laboratory Corp of America Holdings | 1,975 | 397 | ||||||
Medpace Holdings Inc * | 1,310 | 317 | ||||||
Mettler-Toledo International Inc * | 241 | 267 | ||||||
Molina Healthcare Inc * | 970 | 318 | ||||||
Neurocrine Biosciences Inc * | 940 | 106 | ||||||
ResMed Inc | 550 | 81 | ||||||
Royalty Pharma PLC, Cl A | 2,713 | 74 | ||||||
Seagen Inc * | 420 | 89 | ||||||
United Therapeutics Corp * | 330 | 75 | ||||||
Veeva Systems Inc, Cl A * | 2,039 | 415 | ||||||
Waters Corp * | 413 | 113 | ||||||
West Pharmaceutical Services Inc | 870 | 326 | ||||||
Zimmer Biomet Holdings Inc | 2,056 | 231 | ||||||
| 7,546 | ||||||||
SEI Institutional Managed Trust
133
SCHEDULE OF INVESTMENTS
September 30, 2023
Mid-Cap Fund (Continued)
Description | Shares | Market Value | ||||||
COMMON STOCK (continued) | ||||||||
Industrials — 21.6% | ||||||||
A O Smith Corp | 3,510 | $ | 232 | |||||
AECOM | 730 | 61 | ||||||
AerCap Holdings NV * | 4,341 | 272 | ||||||
Alaska Air Group Inc * | 2,900 | 108 | ||||||
Allegion plc | 4,108 | 428 | ||||||
Allison Transmission Holdings Inc | 2,950 | 174 | ||||||
AMETEK Inc | 967 | 143 | ||||||
Carlisle Cos Inc | 992 | 257 | ||||||
Carrier Global Corp | 3,890 | 215 | ||||||
Cintas Corp | 1,000 | 481 | ||||||
Clarivate PLC * | 10,389 | 70 | ||||||
Clean Harbors Inc * | 2,818 | 472 | ||||||
CNH Industrial NV | 6,720 | 81 | ||||||
Copart Inc * | 3,600 | 155 | ||||||
Delta Air Lines Inc, Cl A | 6,600 | 244 | ||||||
Dover Corp | 2,999 | 418 | ||||||
EMCOR Group Inc | 2,350 | 494 | ||||||
Esab Corp | 3,540 | 249 | ||||||
Fastenal Co, Cl A | 9,327 | 510 | ||||||
Flowserve Corp | 2,970 | 118 | ||||||
Genpact Ltd | 5,642 | 204 | ||||||
GXO Logistics Inc * | 1,760 | 103 | ||||||
Hexcel Corp, Cl A | 3,578 | 233 | ||||||
Huntington Ingalls Industries Inc, Cl A | 520 | 106 | ||||||
Ingersoll Rand Inc | 1,940 | 124 | ||||||
ITT Inc | 1,010 | 99 | ||||||
Kirby Corp * | 4,620 | 383 | ||||||
Leidos Holdings Inc | 3,085 | 284 | ||||||
Lincoln Electric Holdings Inc | 350 | 64 | ||||||
MSC Industrial Direct Co Inc, Cl A | 940 | 92 | ||||||
nVent Electric PLC | 5,323 | 282 | ||||||
Old Dominion Freight Line Inc, Cl A | 480 | 196 | ||||||
Oshkosh Corp | 4,570 | 436 | ||||||
Otis Worldwide Corp | 7,115 | 571 | ||||||
PACCAR Inc | 5,505 | 468 | ||||||
Parker-Hannifin Corp, Cl A | 1,826 | 711 | ||||||
Paychex Inc | 4,870 | 562 | ||||||
Quanta Services Inc | 370 | 69 | ||||||
RBC Bearings Inc * | 600 | 141 | ||||||
Regal Rexnord Corp | 2,891 | 413 | ||||||
Republic Services Inc | 1,644 | 234 | ||||||
Rockwell Automation Inc | 265 | 76 | ||||||
Ryder System Inc | 3,550 | 380 | ||||||
Schneider National Inc, Cl B | 1,624 | 45 | ||||||
Snap-on Inc | 1,426 | 364 | ||||||
Southwest Airlines Co, Cl A | 4,400 | 119 | ||||||
Tetra Tech Inc | 1,670 | 254 | ||||||
Textron Inc | 3,980 | 311 | ||||||
Timken Co/The | 1,410 | 104 | ||||||
Trane Technologies PLC | 853 | 173 | ||||||
TransDigm Group Inc * | 170 | 143 | ||||||
Description | Shares | Market Value | ||||||
COMMON STOCK (continued) | ||||||||
United Airlines Holdings Inc * | 7,080 | $ | 300 | |||||
United Rentals Inc | 998 | 444 | ||||||
Verisk Analytics Inc, Cl A | 1,530 | 362 | ||||||
Vertiv Holdings Co, Cl A | 2,770 | 103 | ||||||
Watsco Inc | 233 | 88 | ||||||
WESCO International Inc | 1,490 | 214 | ||||||
Westinghouse Air Brake Technologies Corp | 1,913 | 203 | ||||||
WillScot Mobile Mini Holdings Corp, Cl A * | 6,860 | 285 | ||||||
Woodward Inc | 1,410 | 175 | ||||||
WW Grainger Inc | 793 | 549 | ||||||
Xylem Inc/NY | 4,190 | 381 | ||||||
| 16,030 | ||||||||
Information Technology — 12.4% | ||||||||
Akamai Technologies Inc * | 5,430 | 578 | ||||||
Amdocs Ltd | 3,196 | 270 | ||||||
Amphenol Corp, Cl A | 935 | 78 | ||||||
ANSYS Inc * | 657 | 195 | ||||||
AppLovin Corp, Cl A * | 4,180 | 167 | ||||||
Arista Networks Inc * | 1,020 | 188 | ||||||
Avnet Inc | 3,845 | 185 | ||||||
BILL Holdings Inc * | 535 | 58 | ||||||
Cadence Design Systems Inc * | 1,095 | 257 | ||||||
Ciena Corp * | 4,380 | 207 | ||||||
Cirrus Logic Inc * | 1,790 | 132 | ||||||
Cloudflare Inc, Cl A * | 1,318 | 83 | ||||||
Cognizant Technology Solutions Corp, Cl A | 1,620 | 110 | ||||||
Crowdstrike Holdings Inc, Cl A * | 700 | 117 | ||||||
Datadog Inc, Cl A * | 2,035 | 185 | ||||||
DocuSign Inc, Cl A * | 4,450 | 187 | ||||||
DoubleVerify Holdings Inc * | 5,610 | 157 | ||||||
F5 Inc, Cl A * | 2,085 | 336 | ||||||
Fair Isaac Corp * | 233 | 202 | ||||||
Fortinet Inc * | 1,440 | 84 | ||||||
Gen Digital Inc | 9,830 | 174 | ||||||
HubSpot Inc * | 557 | 274 | ||||||
Jabil Inc | 1,780 | 226 | ||||||
Juniper Networks Inc | 2,150 | 60 | ||||||
Keysight Technologies Inc * | 1,269 | 168 | ||||||
Lattice Semiconductor Corp * | 2,290 | 197 | ||||||
Manhattan Associates Inc * | 2,295 | 454 | ||||||
Marvell Technology Inc | 4,850 | 262 | ||||||
Microchip Technology Inc | 4,676 | 365 | ||||||
MongoDB Inc, Cl A * | 389 | 135 | ||||||
Motorola Solutions Inc | 220 | 60 | ||||||
NCR Corp * | 3,950 | 107 | ||||||
New Relic Inc * | 3,010 | 258 | ||||||
Nutanix Inc, Cl A * | 3,700 | 129 | ||||||
Okta Inc, Cl A * | 1,210 | 99 | ||||||
Palantir Technologies Inc, Cl A * | 5,040 | 81 | ||||||
Pegasystems Inc | 3,131 | 136 | ||||||
PTC Inc * | 1,612 | 228 | ||||||
Pure Storage Inc, Cl A * | 2,670 | 95 | ||||||
134
SEI Institutional Managed Trust
Description | Shares | Market Value | ||||||
COMMON STOCK (continued) | ||||||||
Qorvo Inc * | 1,989 | $ | 190 | |||||
Smartsheet Inc, Cl A * | 2,066 | 84 | ||||||
Splunk Inc * | 1,720 | 252 | ||||||
Synopsys Inc * | 574 | 263 | ||||||
Teradata Corp * | 5,450 | 245 | ||||||
UiPath Inc, Cl A * | 5,450 | 93 | ||||||
Unity Software Inc * | 1,830 | 57 | ||||||
Universal Display Corp | 743 | 117 | ||||||
VeriSign Inc * | 602 | 122 | ||||||
Vontier Corp | 6,389 | 198 | ||||||
Zoom Video Communications Inc, Cl A * | 2,670 | 187 | ||||||
Zscaler Inc * | 780 | 121 | ||||||
| 9,213 | ||||||||
Materials — 3.7% | ||||||||
AptarGroup Inc | 1,320 | 165 | ||||||
Axalta Coating Systems Ltd * | 10,308 | 277 | ||||||
Berry Global Group Inc | 3,229 | 200 | ||||||
CF Industries Holdings Inc | 1,950 | 167 | ||||||
Cleveland-Cliffs Inc * | 5,406 | 85 | ||||||
Eagle Materials Inc | 2,210 | 368 | ||||||
FMC Corp | �� | 2,305 | 154 | |||||
International Flavors & Fragrances Inc | 1,721 | 117 | ||||||
Livent Corp * | 10,129 | 187 | ||||||
NewMarket Corp | 423 | 193 | ||||||
Nucor Corp | 3,190 | 499 | ||||||
PPG Industries Inc | 650 | 84 | ||||||
Scotts Miracle-Gro Co/The, Cl A | 1,148 | 59 | ||||||
SSR Mining Inc | 12,750 | 169 | ||||||
| 2,724 | ||||||||
Real Estate — 6.6% | ||||||||
Alexandria Real Estate Equities Inc ‡ | 2,019 | 202 | ||||||
AvalonBay Communities Inc ‡ | 444 | 76 | ||||||
Camden Property Trust ‡ | 1,190 | 113 | ||||||
CubeSmart ‡ | 3,990 | 152 | ||||||
Digital Realty Trust Inc, Cl A ‡ | 2,014 | 244 | ||||||
EPR Properties, Cl A ‡ | 7,190 | 299 | ||||||
Equity LifeStyle Properties Inc ‡ | 1,260 | 80 | ||||||
Equity Residential ‡ | 1,190 | 70 | ||||||
Essex Property Trust Inc ‡ | 1,074 | 228 | ||||||
Federal Realty Investment Trust ‡ | 670 | 61 | ||||||
Healthcare Realty Trust Inc, Cl A ‡ | 2,712 | 41 | ||||||
Healthpeak Properties Inc ‡ | 8,940 | 164 | ||||||
Host Hotels & Resorts Inc ‡ | 17,696 | 284 | ||||||
Invitation Homes Inc ‡ | 2,600 | 82 | ||||||
Kimco Realty Corp ‡ | 7,620 | 134 | ||||||
Mid-America Apartment Communities Inc ‡ | 1,106 | 142 | ||||||
National Storage Affiliates Trust ‡ | 2,010 | 64 | ||||||
NNN REIT Inc ‡ | 7,461 | 264 | ||||||
Park Hotels & Resorts Inc ‡ | 9,880 | 122 | ||||||
Rexford Industrial Realty Inc ‡ | 12,750 | 629 | ||||||
SBA Communications Corp, Cl A ‡ | 1,260 | 252 | ||||||
Description | Shares | Market Value | ||||||
COMMON STOCK (continued) | ||||||||
Simon Property Group Inc ‡ | 863 | $ | 93 | |||||
Ventas Inc ‡ | 9,943 | 419 | ||||||
VICI Properties Inc, Cl A ‡ | 2,880 | 84 | ||||||
Welltower Inc ‡ | 6,365 | 522 | ||||||
Zillow Group Inc, Cl A * | 1,770 | 79 | ||||||
| 4,900 | ||||||||
Utilities — 3.4% | ||||||||
Alliant Energy Corp | 1,490 | 72 | ||||||
CenterPoint Energy Inc | 10,632 | 285 | ||||||
CMS Energy Corp | 1,280 | 68 | ||||||
Consolidated Edison Inc | 810 | 69 | ||||||
DTE Energy Co | 2,503 | 248 | ||||||
Entergy Corp | 3,157 | 292 | ||||||
Evergy Inc | 3,198 | 162 | ||||||
IDACORP Inc, Cl A | 972 | 91 | ||||||
National Fuel Gas Co | 1,725 | 90 | ||||||
NiSource Inc | 14,267 | 352 | ||||||
PPL Corp | 10,580 | 249 | ||||||
UGI Corp | 4,683 | 108 | ||||||
WEC Energy Group Inc | 4,005 | 323 | ||||||
Xcel Energy Inc | 2,510 | 144 | ||||||
| 2,553 | ||||||||
Total Common Stock | ||||||||
(Cost $69,395) ($ Thousands) | 72,657 | |||||||
EXCHANGE TRADED FUND — 0.1% | ||||||||
iShares Russell Mid-Cap Value ETF | 921 | 96 | ||||||
Total Exchange Traded Fund | ||||||||
(Cost $99) ($ Thousands) | 96 | |||||||
Number of Rights | ||||||||
RIGHTS — 0.0% | ||||||||
Abiomed Inc *‡‡ | 160 | – | ||||||
Total Rights | ||||||||
(Cost $—) ($ Thousands) | – | |||||||
SEI Institutional Managed Trust
135
SCHEDULE OF INVESTMENTS
September 30, 2023
Mid-Cap Fund (Concluded)
Description | Shares | Market Value | ||||||
CASH EQUIVALENT — 2.0% | ||||||||
SEI Daily Income Trust, Government Fund, Institutional Class | ||||||||
5.210%**† | 1,511,944 | $ | 1,512 | |||||
Total Cash Equivalent | ||||||||
(Cost $1,512) ($ Thousands) | 1,512 | |||||||
Total Investments in Securities — 100.0% | ||||||||
(Cost $71,006) ($ Thousands) | $ | 74,265 | ||||||
| Percentages are based on a Net Assets of $74,243 ($ Thousands). |
* | Non-income producing security. |
** | The rate reported is the 7-day effective yield as of September 30, 2023. |
‡ | Real Estate Investment Trust. |
‡‡ | Expiration date not available. |
† | Investment in Affiliated Security (see Note 6). |
As of September 30, 2023, all of the Fund's investments were considered Level 1, in accordance with the authoritative guidance on fair value measurements and disclosure under U.S. GAAP. |
For more information on valuation inputs, see Note 2 — Significant Accounting Policies in Notes to Financial Statements.
The following is a summary of the Fund’s transactions with affiliates for the year ended September 30, 2023 ($ Thousands):
Security Description | Value | Purchases at Cost | Proceeds from Sales | Realized Gain/ (Loss) | Change in Unrealized Appreciation/(Depreciation) | Value | Income | Capital Gains | ||||||||||||||||||||||||
SEI Liquidity Fund, LP | $ | — | $ | 630 | $ | (630 | ) | $ | — | $ | — | $ | — | $ | 1 | $ | — | |||||||||||||||
SEI Daily Income Trust, Government Fund, Institutional Class | 2,161 | 15,165 | (15,814 | ) | — | — | 1,512 | 62 | — | |||||||||||||||||||||||
Totals | $ | 2,161 | $ | 15,795 | $ | (16,444 | ) | $ | — | $ | — | $ | 1,512 | $ | 63 | $ | — | |||||||||||||||
Amounts designated as “—” are $0 or have been rounded to $0.
See “Glossary” for abbreviations.
The accompanying notes are an integral part of the financial statements.
136
SEI Institutional Managed Trust
SCHEDULE OF INVESTMENTS
September 30, 2023
U.S. Managed Volatility Fund

† | Percentages are based on total investments. Total investments do not include derivatives such as options, futures contracts, forward contracts, and swap contracts, if applicable. |
Description | Shares | Market Value | ||||||
COMMON STOCK — 97.6% | ||||||||
Communication Services — 6.9% | ||||||||
Advantage Solutions Inc * | 33,948 | $ | 97 | |||||
AT&T Inc | 580,400 | 8,718 | ||||||
Comcast Corp, Cl A | 229,030 | 10,155 | ||||||
Electronic Arts Inc | 9,152 | 1,102 | ||||||
Fox Corp, Cl A | 92,000 | 2,870 | ||||||
Madison Square Garden Sports Corp * | 9,360 | 1,650 | ||||||
Netflix Inc * | 7,026 | 2,653 | ||||||
Omnicom Group Inc | 28,400 | 2,115 | ||||||
Ooma Inc * | 8,119 | 106 | ||||||
Shutterstock Inc | 3,969 | 151 | ||||||
SK Telecom Co Ltd ADR | 84,213 | 1,807 | ||||||
Spok Holdings Inc | 21,108 | 301 | ||||||
Spotify Technology SA * | 15,243 | 2,357 | ||||||
TEGNA Inc | 171,600 | 2,500 | ||||||
T-Mobile US Inc * | 1,349 | 189 | ||||||
Verizon Communications Inc | 458,861 | 14,872 | ||||||
| 51,643 | ||||||||
Consumer Discretionary — 6.0% | ||||||||
AutoZone Inc * | 1,755 | 4,458 | ||||||
Best Buy Co Inc | 38,033 | 2,642 | ||||||
Canadian Tire Corp Ltd, Cl A | 23,000 | 2,485 | ||||||
Duolingo Inc, Cl A * | 432 | 72 | ||||||
eBay Inc | 57,400 | 2,531 | ||||||
Frontdoor Inc * | 2,289 | 70 | ||||||
Gentex Corp | 31,857 | 1,037 | ||||||
Graham Holdings Co, Cl B | 318 | 185 | ||||||
Grand Canyon Education Inc * | 41,360 | 4,834 | ||||||
H&R Block Inc | 84,700 | 3,647 | ||||||
Honda Motor Co Ltd ADR | 145,242 | 4,886 | ||||||
Lowe's Cos Inc | 15,500 | 3,222 | ||||||
Murphy USA Inc | 9,200 | 3,144 | ||||||
ODP Corp/The * | 438 | 20 | ||||||
O'Reilly Automotive Inc * | 5,616 | 5,104 | ||||||
Description | Shares | Market Value | ||||||
COMMON STOCK (continued) | ||||||||
Papa John's International Inc, Cl A | 194 | $ | 13 | |||||
Perdoceo Education Corp | 21,996 | 376 | ||||||
Texas Roadhouse Inc, Cl A | 10,493 | 1,008 | ||||||
Toyota Motor Corp ADR (A) | 14,200 | 2,552 | ||||||
Whirlpool Corp | 14,200 | 1,899 | ||||||
Yum! Brands Inc | 6,117 | 764 | ||||||
| 44,949 | ||||||||
Consumer Staples — 17.6% | ||||||||
Altria Group Inc | 153,127 | 6,439 | ||||||
Andersons Inc/The | 7,238 | 373 | ||||||
Archer-Daniels-Midland Co | 83,802 | 6,320 | ||||||
BJ's Wholesale Club Holdings Inc * | 2,392 | 171 | ||||||
Boston Beer Co Inc/The, Cl A * | 2,640 | 1,028 | ||||||
Calavo Growers Inc | 9,018 | 228 | ||||||
Cal-Maine Foods Inc | 10,290 | 498 | ||||||
Campbell Soup Co | 110,125 | 4,524 | ||||||
Casey's General Stores Inc | 3,903 | 1,060 | ||||||
Central Garden & Pet Co, Cl A * | 4,444 | 178 | ||||||
Church & Dwight Co Inc | 30,018 | 2,751 | ||||||
Clorox Co/The | 27,909 | 3,658 | ||||||
Coca-Cola Consolidated Inc | 281 | 179 | ||||||
Colgate-Palmolive Co | 47,221 | 3,358 | ||||||
Conagra Brands Inc | 279,991 | 7,677 | ||||||
Costco Wholesale Corp | 5,964 | 3,369 | ||||||
Dole PLC | 33,397 | 387 | ||||||
Dollar General Corp | 6,856 | 725 | ||||||
Flowers Foods Inc | 105,065 | 2,330 | ||||||
Fresh Del Monte Produce Inc | 6,999 | 181 | ||||||
General Mills Inc | 100,582 | 6,436 | ||||||
Herbalife Ltd * | 18,808 | 263 | ||||||
Hershey Co/The | 202 | 40 | ||||||
Hormel Foods Corp | 47,695 | 1,814 | ||||||
Hostess Brands Inc, Cl A * | 21,208 | 706 | ||||||
Ingles Markets Inc, Cl A | 3,060 | 231 | ||||||
Ingredion Inc | 63,292 | 6,228 | ||||||
J & J Snack Foods Corp | 3,532 | 578 | ||||||
J M Smucker Co/The | 32,023 | 3,936 | ||||||
John B Sanfilippo & Son Inc | 5,822 | 575 | ||||||
Kellanova | 145,444 | 8,655 | ||||||
Keurig Dr Pepper Inc | 146,558 | 4,627 | ||||||
Kimberly-Clark Corp | 12,820 | 1,549 | ||||||
Kraft Heinz Co/The | 219,400 | 7,381 | ||||||
Kroger Co/The | 242,300 | 10,843 | ||||||
Lancaster Colony Corp | 3,084 | 509 | ||||||
Medifast Inc | 225 | 17 | ||||||
Molson Coors Beverage Co, Cl B | 89,600 | 5,698 | ||||||
Mondelez International Inc, Cl A | 7,355 | 510 | ||||||
Monster Beverage Corp * | 13,726 | 727 | ||||||
National Beverage Corp, Cl A * | 2,890 | 136 | ||||||
Oil-Dri Corp of America | 2,824 | 174 | ||||||
PepsiCo Inc | 1,124 | 190 | ||||||
Philip Morris International Inc | 17,889 | 1,656 | ||||||
SEI Institutional Managed Trust
137
SCHEDULE OF INVESTMENTS
September 30, 2023
U.S. Managed Volatility Fund (Continued)
Description | Shares | Market Value | ||||||
COMMON STOCK (continued) | ||||||||
Pilgrim's Pride Corp * | 39,068 | $ | 892 | |||||
PriceSmart Inc | 1,738 | 129 | ||||||
Procter & Gamble Co/The | 33,179 | 4,840 | ||||||
Reynolds Consumer Products Inc | 38,612 | 990 | ||||||
Seaboard Corp | 170 | 638 | ||||||
Simply Good Foods Co/The * | 2,568 | 89 | ||||||
SpartanNash Co | 3,986 | 88 | ||||||
Sprouts Farmers Market Inc * | 569 | 24 | ||||||
TreeHouse Foods Inc * | 6,763 | 295 | ||||||
Tyson Foods Inc, Cl A | 18,211 | 920 | ||||||
Universal Corp/VA | 12,189 | 575 | ||||||
USANA Health Sciences Inc * | 5,476 | 321 | ||||||
Vector Group Ltd | 29,933 | 319 | ||||||
Village Super Market Inc, Cl A | 10,265 | 232 | ||||||
Vital Farms Inc * | 27,399 | 317 | ||||||
Walmart Inc | 50,384 | 8,058 | ||||||
WD-40 Co | 126 | 26 | ||||||
Weis Markets Inc | 52,874 | 3,331 | ||||||
| 130,997 | ||||||||
Energy — 3.5% | ||||||||
Chesapeake Energy Corp | 54,186 | 4,673 | ||||||
Chevron Corp | 50,200 | 8,465 | ||||||
DT Midstream Inc | 44,600 | 2,360 | ||||||
Exxon Mobil Corp | 87,143 | 10,246 | ||||||
Teekay Corp * | 17,377 | 107 | ||||||
Teekay Tankers Ltd, Cl A | 4,609 | 192 | ||||||
| 26,043 | ||||||||
Financials — 10.5% | ||||||||
AFC Gamma Inc ‡ | 4,147 | 49 | ||||||
Aflac Inc | 129,800 | 9,962 | ||||||
Allstate Corp/The | 16,574 | 1,846 | ||||||
American Financial Group Inc/OH | 8,300 | 927 | ||||||
AMERISAFE Inc | 269 | 13 | ||||||
Aon PLC, Cl A | 3,955 | 1,282 | ||||||
AssetMark Financial Holdings Inc * | 9,153 | 230 | ||||||
Bank First Corp (A) | 1,616 | 125 | ||||||
Bank of New York Mellon Corp/The | 159,600 | 6,807 | ||||||
Bankwell Financial Group Inc | 613 | 15 | ||||||
Berkshire Hathaway Inc, Cl B * | 12,300 | 4,309 | ||||||
Byline Bancorp Inc | 2,258 | 44 | ||||||
Canadian Imperial Bank of Commerce | 58,800 | 2,280 | ||||||
Cboe Global Markets Inc | 19,676 | 3,074 | ||||||
Chicago Atlantic Real Estate Finance ‡ | 8,092 | 119 | ||||||
Chubb Ltd | 2,040 | 425 | ||||||
Colony Bankcorp Inc | 4,625 | 46 | ||||||
Donegal Group Inc, Cl A | 3,918 | 56 | ||||||
Employers Holdings Inc | 13,176 | 526 | ||||||
Everest Group Ltd | 8,710 | 3,237 | ||||||
FleetCor Technologies Inc * | 3,270 | 835 | ||||||
Hanover Insurance Group Inc/The, Cl A | 21,384 | 2,373 | ||||||
Hartford Financial Services Group Inc/The | 111,000 | 7,871 | ||||||
Description | Shares | Market Value | ||||||
COMMON STOCK (continued) | ||||||||
Horace Mann Educators Corp, Cl A | 4,166 | $ | 122 | |||||
James River Group Holdings Ltd | 8,695 | 133 | ||||||
Loblaw Cos Ltd | 38,800 | 3,312 | ||||||
MarketAxess Holdings Inc | 1,305 | 279 | ||||||
MetLife Inc | 38,700 | 2,435 | ||||||
Northeast Community Bancorp | 6,939 | 102 | ||||||
OceanFirst Financial Corp | 89,610 | 1,297 | ||||||
Old Republic International Corp | 97,000 | 2,613 | ||||||
Orrstown Financial Services Inc | 709 | 15 | ||||||
Progressive Corp/The | 6,204 | 864 | ||||||
Safety Insurance Group Inc | 4,276 | 292 | ||||||
SiriusPoint Ltd * | 2,414 | 25 | ||||||
Travelers Cos Inc/The | 34,506 | 5,635 | ||||||
W R Berkley Corp | 59,506 | 3,778 | ||||||
Washington Federal Inc | 79,300 | 2,032 | ||||||
Westamerica BanCorp | 4,203 | 182 | ||||||
Western Union Co/The | 606,338 | 7,992 | ||||||
Willis Towers Watson PLC | 3,706 | 774 | ||||||
| 78,333 | ||||||||
Health Care — 19.0% | ||||||||
Abbott Laboratories | 6,401 | 620 | ||||||
AbbVie Inc | 10,800 | 1,610 | ||||||
ACADIA Pharmaceuticals Inc * | 12,884 | 269 | ||||||
ADMA Biologics Inc * | 49,356 | 177 | ||||||
Agilent Technologies Inc | 10,663 | 1,192 | ||||||
Alkermes PLC * | 17,384 | 487 | ||||||
Amgen Inc, Cl A | 45,919 | 12,341 | ||||||
Amicus Therapeutics Inc * | 8,197 | 100 | ||||||
Amneal Pharmaceuticals Inc * | 49,348 | 208 | ||||||
Amylyx Pharmaceuticals Inc * | 2,255 | 41 | ||||||
ANI Pharmaceuticals Inc * | 454 | 26 | ||||||
Anika Therapeutics Inc * | 9,807 | 183 | ||||||
Arcturus Therapeutics Holdings Inc * | 4,909 | 125 | ||||||
Ardelyx Inc * | 16,947 | 69 | ||||||
Aurinia Pharmaceuticals Inc * | 19,839 | 154 | ||||||
Avantor Inc * | 15,977 | 337 | ||||||
Bristol-Myers Squibb Co | 175,120 | 10,164 | ||||||
Bruker Corp | 11,426 | 712 | ||||||
Cardinal Health Inc | 69,300 | 6,017 | ||||||
Catalyst Pharmaceuticals Inc * | 15,830 | 185 | ||||||
Cigna Group/The | 4,472 | 1,279 | ||||||
Collegium Pharmaceutical Inc * | 7,984 | 178 | ||||||
Corcept Therapeutics Inc * | 6,036 | 165 | ||||||
CVS Health Corp | 119,726 | 8,359 | ||||||
Danaher Corp, Cl A | 1,137 | 282 | ||||||
DaVita Inc * | 9,829 | 929 | ||||||
Deciphera Pharmaceuticals Inc * | 14,951 | 190 | ||||||
Dynavax Technologies Corp * | 2,740 | 41 | ||||||
Eagle Pharmaceuticals Inc/DE * | 15,398 | 243 | ||||||
Elevance Health Inc | 6,787 | 2,955 | ||||||
Embecta | 7,885 | 119 | ||||||
Exelixis Inc * | 151,002 | 3,299 | ||||||
138
SEI Institutional Managed Trust
Description | Shares | Market Value | ||||||
COMMON STOCK (continued) | ||||||||
Fortrea Holdings Inc * | 6,400 | $ | 183 | |||||
Gilead Sciences Inc | 195,146 | 14,624 | ||||||
Haemonetics Corp * | 314 | 28 | ||||||
Halozyme Therapeutics Inc * | 7,354 | 281 | ||||||
Harmony Biosciences Holdings Inc * | 3,696 | 121 | ||||||
HealthStream Inc | 1,980 | 43 | ||||||
Hologic Inc * | 31,188 | 2,165 | ||||||
Humana Inc | 9,607 | 4,674 | ||||||
Incyte Corp * | 60,581 | 3,500 | ||||||
Innoviva Inc * | 20,653 | 268 | ||||||
Intra-Cellular Therapies Inc, Cl A * | 4,382 | 228 | ||||||
iRadimed Corp | 2,170 | 96 | ||||||
Jazz Pharmaceuticals PLC * | 37,755 | 4,887 | ||||||
Johnson & Johnson | 46,500 | 7,242 | ||||||
Kiniksa Pharmaceuticals Ltd, Cl A * | 2,915 | 51 | ||||||
LeMaitre Vascular Inc | 3,372 | 184 | ||||||
Ligand Pharmaceuticals Inc * | 883 | 53 | ||||||
McKesson Corp | 19,000 | 8,262 | ||||||
Merck & Co Inc | 113,726 | 11,708 | ||||||
Mesa Laboratories Inc | 556 | 58 | ||||||
Mettler-Toledo International Inc * | 693 | 768 | ||||||
MiMedx Group Inc * | 35,725 | 260 | ||||||
Mirum Pharmaceuticals Inc * | 4,824 | 152 | ||||||
National HealthCare Corp | 2,728 | 175 | ||||||
Neurocrine Biosciences Inc * | 35,989 | 4,049 | ||||||
OraSure Technologies Inc * | 63,075 | 374 | ||||||
Organon & Co | 97,639 | 1,695 | ||||||
Patterson Cos Inc | 6,524 | 193 | ||||||
Pediatrix Medical Group Inc * | 1,363 | 17 | ||||||
Pfizer Inc | 253,916 | 8,422 | ||||||
Phibro Animal Health Corp, Cl A | 12,502 | 160 | ||||||
Point Biopharma Global Inc, Cl A * | 8,549 | 57 | ||||||
Premier Inc, Cl A | 19,048 | 410 | ||||||
Prestige Consumer Healthcare Inc, Cl A * | 2,747 | 157 | ||||||
Progyny Inc * | 393 | 13 | ||||||
Quest Diagnostics Inc | 21,600 | 2,632 | ||||||
Regeneron Pharmaceuticals Inc * | 179 | 147 | ||||||
Revvity Inc | 697 | 77 | ||||||
SIGA Technologies Inc | 4,462 | 23 | ||||||
Supernus Pharmaceuticals Inc * | 7,096 | 196 | ||||||
Tactile Systems Technology Inc * | 3,553 | 50 | ||||||
UFP Technologies Inc * | 1,114 | 180 | ||||||
United Therapeutics Corp * | 8,204 | 1,853 | ||||||
UroGen Pharma * | 852 | 12 | ||||||
Vanda Pharmaceuticals Inc * | 56,656 | 245 | ||||||
Varex Imaging Corp * | 1,943 | 37 | ||||||
Voyager Therapeutics Inc * | 8,799 | 68 | ||||||
Waters Corp * | 8,437 | 2,314 | ||||||
West Pharmaceutical Services Inc | 8,106 | 3,042 | ||||||
Zimmer Biomet Holdings Inc | 17,094 | 1,918 | ||||||
Zymeworks * | 18,460 | 117 | ||||||
Description | Shares | Market Value | ||||||
COMMON STOCK (continued) | ||||||||
Zynex Inc *(A) | 9,475 | $ | 76 | |||||
| 141,601 | ||||||||
Industrials — 9.9% | ||||||||
Allison Transmission Holdings Inc | 111,800 | 6,603 | ||||||
Barrett Business Services Inc | 1,660 | 150 | ||||||
Booz Allen Hamilton Holding Corp, Cl A | 18,880 | 2,063 | ||||||
Casella Waste Systems Inc, Cl A * | 3,466 | 264 | ||||||
CH Robinson Worldwide Inc | 9,849 | 848 | ||||||
Cintas Corp | 991 | 477 | ||||||
CSG Systems International Inc | 57,900 | 2,960 | ||||||
Cummins Inc | 27,500 | 6,283 | ||||||
Donaldson Co Inc, Cl A | 19,932 | 1,189 | ||||||
EMCOR Group Inc | 2,897 | 609 | ||||||
Enerpac Tool Group Corp, Cl A | 13,747 | 363 | ||||||
Exponent Inc | 525 | 45 | ||||||
Ferguson PLC | 5,044 | 830 | ||||||
FTI Consulting Inc * | 1,069 | 191 | ||||||
General Dynamics Corp | 6,738 | 1,489 | ||||||
Genpact Ltd | 28,220 | 1,022 | ||||||
Golden Ocean Group Ltd | 36,812 | 290 | ||||||
Huntington Ingalls Industries Inc, Cl A | 16,083 | 3,290 | ||||||
IBEX Holdings Ltd * | 6,828 | 105 | ||||||
L3Harris Technologies Inc | 1,005 | 175 | ||||||
Landstar System Inc | 14,776 | 2,614 | ||||||
Leidos Holdings Inc | 2,626 | 242 | ||||||
Lockheed Martin Corp | 22,362 | 9,145 | ||||||
ManpowerGroup Inc | 9,909 | 727 | ||||||
Maximus Inc | 3,452 | 258 | ||||||
McGrath RentCorp | 405 | 41 | ||||||
MSC Industrial Direct Co Inc, Cl A | 2,371 | 233 | ||||||
National Presto Industries | 5,408 | 392 | ||||||
Northrop Grumman Corp | 13,461 | 5,925 | ||||||
Otis Worldwide Corp | 34,882 | 2,801 | ||||||
PACCAR Inc | 40,600 | 3,452 | ||||||
Powell Industries Inc | 1,312 | 109 | ||||||
Preformed Line Products Co | 321 | 52 | ||||||
Rollins Inc | 68,252 | 2,548 | ||||||
Schneider National Inc, Cl B | 123,271 | 3,413 | ||||||
Science Applications International Corp | 38,100 | 4,021 | ||||||
Snap-on Inc | 23,330 | 5,951 | ||||||
TrueBlue Inc * | 5,926 | 87 | ||||||
Werner Enterprises Inc | 68,070 | 2,651 | ||||||
| 73,908 | ||||||||
Information Technology — 13.8% | ||||||||
A10 Networks Inc | 18,153 | 273 | ||||||
ACI Worldwide Inc * | 9,046 | 204 | ||||||
Adeia Inc | 37,229 | 398 | ||||||
Adobe Inc * | 785 | 400 | ||||||
Amdocs Ltd | 164,590 | 13,906 | ||||||
Appfolio Inc, Cl A * | 935 | 171 | ||||||
Arrow Electronics Inc, Cl A * | 38,000 | 4,759 | ||||||
SEI Institutional Managed Trust
139
SCHEDULE OF INVESTMENTS
September 30, 2023
U.S. Managed Volatility Fund (Continued)
Description | Shares | Market Value | ||||||
COMMON STOCK (continued) | ||||||||
Avnet Inc | 101,300 | $ | 4,882 | |||||
Benchmark Electronics Inc | 865 | 21 | ||||||
Brightcove Inc * | 14,210 | 47 | ||||||
Canon Inc ADR | 212,800 | 5,107 | ||||||
Cirrus Logic Inc * | 475 | 35 | ||||||
Cisco Systems Inc | 256,955 | 13,814 | ||||||
Cognizant Technology Solutions Corp, Cl A | 1,612 | 109 | ||||||
CommVault Systems Inc * | 5,611 | 379 | ||||||
CoreCard Corp * | 2,107 | 42 | ||||||
Diodes Inc * | 511 | 40 | ||||||
Dolby Laboratories Inc, Cl A | 24,029 | 1,905 | ||||||
DoubleVerify Holdings Inc * | 9,758 | 273 | ||||||
EPAM Systems Inc * | 4,096 | 1,047 | ||||||
F5 Inc, Cl A * | 2,062 | 332 | ||||||
Fortinet Inc * | 3,033 | 178 | ||||||
Gen Digital Inc | 25,573 | 452 | ||||||
GoDaddy Inc, Cl A * | 1,110 | 83 | ||||||
Hackett Group Inc/The | 6,420 | 152 | ||||||
Hewlett Packard Enterprise Co | 418,100 | 7,262 | ||||||
Insight Enterprises Inc * | 28,800 | 4,190 | ||||||
InterDigital Inc | 2,733 | 219 | ||||||
International Business Machines Corp | 91,500 | 12,838 | ||||||
Juniper Networks Inc | 182,515 | 5,072 | ||||||
Kimball Electronics Inc * | 1,246 | 34 | ||||||
LiveRamp Holdings Inc * | 11,133 | 321 | ||||||
Manhattan Associates Inc * | 2,268 | 448 | ||||||
Mitek Systems Inc * | 9,629 | 103 | ||||||
Motorola Solutions Inc | 1,294 | 352 | ||||||
NetApp Inc | 43,000 | 3,263 | ||||||
NVE Corp | 3,435 | 282 | ||||||
Open Text Corp | 57,000 | 2,010 | ||||||
Oracle Corp, Cl B | 90,400 | 9,575 | ||||||
OSI Systems Inc * | 1,883 | 222 | ||||||
Photronics Inc * | 1,034 | 21 | ||||||
PTC Inc * | 16,329 | 2,314 | ||||||
QUALCOMM Inc | 7,996 | 888 | ||||||
Qualys Inc * | 1,281 | 195 | ||||||
Sapiens International Corp NV | 15,080 | 429 | ||||||
Skyworks Solutions Inc | 11,492 | 1,133 | ||||||
Synopsys Inc * | 1,500 | 689 | ||||||
Teradata Corp * | 23,269 | 1,048 | ||||||
VeriSign Inc * | 3,129 | 634 | ||||||
Yext Inc * | 31,009 | 196 | ||||||
| 102,747 | ||||||||
Materials — 3.9% | ||||||||
Balchem Corp | 1,603 | 199 | ||||||
Berry Global Group Inc | 78,277 | 4,846 | ||||||
Graphic Packaging Holding Co | 82,700 | 1,842 | ||||||
International Paper Co | 47,300 | 1,678 | ||||||
Myers Industries Inc | 8,510 | 153 | ||||||
NewMarket Corp | 24,356 | 11,083 | ||||||
Reliance Steel & Aluminum Co | 11,400 | 2,989 | ||||||
Description | Shares | Market Value | ||||||
COMMON STOCK (continued) | ||||||||
Silgan Holdings Inc | 42,389 | $ | 1,827 | |||||
Sonoco Products Co | 43,400 | 2,359 | ||||||
Southern Copper Corp | 11,490 | 865 | ||||||
SSR Mining Inc | 109,250 | 1,452 | ||||||
| 29,293 | ||||||||
Real Estate — 0.9% | ||||||||
American Tower Corp, Cl A ‡ | 11,056 | 1,818 | ||||||
Apartment Income Corp ‡ | 33,047 | 1,015 | ||||||
Crown Castle Inc ‡ | 962 | 89 | ||||||
Easterly Government Properties Inc, Cl A ‡ | 25,099 | 287 | ||||||
Equity Commonwealth ‡ | 5,307 | 97 | ||||||
InvenTrust Properties Corp ‡ | 3,265 | 78 | ||||||
Omega Healthcare Investors Inc ‡ | 825 | 27 | ||||||
Postal Realty Trust Inc, Cl A ‡ | 12,316 | 166 | ||||||
Public Storage ‡ | 4,338 | 1,143 | ||||||
RMR Group Inc/The, Cl A | 3,682 | 90 | ||||||
SBA Communications Corp, Cl A ‡ | 3,955 | 792 | ||||||
Weyerhaeuser Co ‡ | 20,736 | 636 | ||||||
| 6,238 | ||||||||
Utilities — 5.6% | ||||||||
ALLETE Inc | 1,771 | 93 | ||||||
Avista Corp | 1,317 | 43 | ||||||
California Water Service Group, Cl A | 3,737 | 177 | ||||||
Chesapeake Utilities Corp | 1,936 | 189 | ||||||
Consolidated Edison Inc | 3,337 | 285 | ||||||
Consolidated Water Co Ltd | 9,740 | 277 | ||||||
DTE Energy Co | 5,087 | 505 | ||||||
Edison International | 3,167 | 200 | ||||||
Entergy Corp | 41,932 | 3,879 | ||||||
Essential Utilities Inc | 9,453 | 325 | ||||||
Evergy Inc | 119,827 | 6,075 | ||||||
Exelon Corp | 40,700 | 1,538 | ||||||
Genie Energy Ltd, Cl B | 7,938 | 117 | ||||||
MGE Energy Inc | 4,324 | 296 | ||||||
Middlesex Water Co | 795 | 53 | ||||||
National Fuel Gas Co | 93,461 | 4,852 | ||||||
Northwest Natural Holding Co | 5,992 | 229 | ||||||
NorthWestern Corp | 1,589 | 76 | ||||||
OGE Energy Corp | 116,908 | 3,897 | ||||||
ONE Gas Inc | 5,658 | 386 | ||||||
Otter Tail Corp | 55,888 | 4,243 | ||||||
PG&E Corp * | 112,677 | 1,817 | ||||||
Pinnacle West Capital Corp | 15,164 | 1,117 | ||||||
Portland General Electric Co | 3,640 | 147 | ||||||
PPL Corp | 142,100 | 3,348 | ||||||
Public Service Enterprise Group Inc | 45,900 | 2,612 | ||||||
Pure Cycle Corp * | 5,061 | 49 | ||||||
SJW Group | 2,240 | 135 | ||||||
Southwest Gas Holdings Inc | 3,196 | 193 | ||||||
Spire Inc | 2,651 | 150 | ||||||
140
SEI Institutional Managed Trust
Description | Shares | Market Value | ||||||
COMMON STOCK (continued) | ||||||||
UGI Corp | 170,597 | $ | 3,924 | |||||
| 41,227 | ||||||||
Total Common Stock | ||||||||
(Cost $654,985) ($ Thousands) | 726,979 | |||||||
AFFILIATED PARTNERSHIP — 0.4% | ||||||||
SEI Liquidity Fund, LP | ||||||||
5.410% **†(B) | 2,812,655 | 2,813 | ||||||
Total Affiliated Partnership | ||||||||
(Cost $2,813) ($ Thousands) | 2,813 | |||||||
CASH EQUIVALENT — 2.1% | ||||||||
SEI Daily Income Trust, Government Fund, Institutional Class | ||||||||
5.210%**† | 15,573,065 | 15,573 | ||||||
Total Cash Equivalent | ||||||||
(Cost $15,573) ($ Thousands) | 15,573 | |||||||
Total Investments in Securities — 100.1% | ||||||||
(Cost $673,371) ($ Thousands) | $ | 745,365 | ||||||
A list of the open futures contracts held by the Fund at September 30, 2023, is as follows:
Type of Contract | Number of | Expiration Date | Notional Amount (Thousands) | Value | Unrealized Depreciation(Thousands) | |||||||||||||||
Long Contracts | ||||||||||||||||||||
S&P 500 Index E-MINI | 49 | Dec-2023 | $ | 10,846 | $ | 10,597 | $ | (249 | ) | |||||||||||
| Percentages are based on a Net Assets of $744,725 ($ Thousands). |
* | Non-income producing security. |
** | The rate reported is the 7-day effective yield as of September 30, 2023. |
‡ | Real Estate Investment Trust. |
† | Investment in Affiliated Security (see Note 6). |
(A) | Certain securities or partial positions of certain securities are on loan at September 30, 2023. |
(B) | This security was purchased with cash collateral held from securities on loan (see Note 12). The total market value of such securities as of September 30, 2023 was $2,813 ($ Thousands). |
| The following is a summary of the level of inputs used as of September 30, 2023, in valuing the Fund's investments and other financial instruments carried at value ($ Thousands): | ||||||||||||||||
| Investments in Securities | Level 1 ($) | Level 2 ($) | Level 3 ($) | Total ($) | ||||||||||||
| Common Stock | 726,979 | – | – | 726,979 | ||||||||||||
| Affiliated Partnership | – | 2,813 | – | 2,813 | ||||||||||||
| Cash Equivalent | 15,573 | – | – | 15,573 | ||||||||||||
| Total Investments in Securities | 742,552 | 2,813 | – | 745,365 | ||||||||||||
Other Financial Instruments | Level 1 | Level 2 | Level 3 | Total | ||||||||||||
Futures Contracts* | ||||||||||||||||
Unrealized Depreciation | (249 | ) | – | – | (249 | ) | ||||||||||
Total Other Financial Instruments | (249 | ) | – | – | (249 | ) | ||||||||||
* | Futures contracts are valued at the unrealized depreciation on the instrument. |
For more information on valuation inputs, see Note 2 — Significant Accounting Policies in Notes to Financial Statements.
SEI Institutional Managed Trust
141
SCHEDULE OF INVESTMENTS
September 30, 2023
U.S. Managed Volatility Fund (Concluded)
The following is a summary of the Fund’s transactions with affiliates for the year ended September 30, 2023 ($ Thousands):
| Security Description | Value 9/30/2022 | Purchases at Cost | Proceeds from Sales | Realized Gain/ (Loss) | Change in Unrealized Appreciation/ (Depreciation) | Value 9/30/2023 | Income | Capital Gains | ||||||||||||||||||||||||
| SEI Liquidity Fund, LP | $ | 7,816 | $ | 24,910 | $ | (29,913 | ) | $ | (1 | ) | $ | 1 | $ | 2,813 | $ | 123 | $ | — | ||||||||||||||
| SEI Daily Income Trust, Government Fund, Institutional Class | 9,947 | 211,809 | (206,183 | ) | — | — | 15,573 | 667 | — | |||||||||||||||||||||||
| Totals | $ | 17,763 | $ | 236,719 | $ | (236,096 | ) | $ | (1 | ) | $ | 1 | $ | 18,386 | $ | 790 | $ | — | ||||||||||||||
Amounts designated as “—” are $0 or have been rounded to $0.
See “Glossary” for abbreviations.
The accompanying notes are an integral part of the financial statements.
142
SEI Institutional Managed Trust
SCHEDULE OF INVESTMENTS
September 30, 2023
Global Managed Volatility Fund
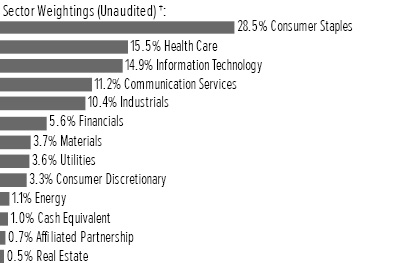
† | Percentages are based on total investments. Total investments do not include derivatives such as options, futures contracts, forward contracts, and swap contracts, if applicable. |
Description | Shares | Market Value | ||||||
COMMON STOCK — 96.9% | ||||||||
Australia — 0.2% | ||||||||
Aurizon Holdings Ltd | 263,069 | $ | 592 | |||||
Rio Tinto Ltd | 13,776 | 1,010 | ||||||
| 1,602 | ||||||||
Austria — 0.0% | ||||||||
Eurotelesites * | 11,212 | 49 | ||||||
Oberbank AG | 162 | 11 | ||||||
Telekom Austria AG, Cl A | 44,848 | 313 | ||||||
| 373 | ||||||||
Belgium — 0.4% | ||||||||
Ageas SA/NV | 21,222 | 877 | ||||||
Anheuser-Busch InBev SA/NV | 9,736 | 541 | ||||||
Solvay SA | 18,858 | 2,093 | ||||||
TINC Comm VA | 2,066 | 27 | ||||||
| 3,538 | ||||||||
Brazil — 0.3% | ||||||||
Yara International ASA | 62,078 | 2,364 | ||||||
Canada — 1.9% | ||||||||
BCE Inc | 71,138 | 2,715 | ||||||
Canadian Utilities Ltd, Cl A | 38,800 | 824 | ||||||
CGI Inc, Cl A * | 24,800 | 2,456 | ||||||
Emera Inc | 800 | 28 | ||||||
Empire Co Ltd, Cl A | 93,700 | 2,561 | ||||||
Fairfax Financial Holdings Ltd | 2,400 | 1,968 | ||||||
George Weston Ltd | 7,500 | 835 | ||||||
Loblaw Cos Ltd | 30,200 | 2,578 | ||||||
Metro Inc/CN, Cl A | 22,600 | 1,179 | ||||||
| 15,144 | ||||||||
China — 0.3% | ||||||||
CITIC Telecom International Holdings Ltd | 1,597,000 | 631 | ||||||
Wilmar International Ltd | 612,400 | 1,674 | ||||||
| 2,305 | ||||||||
Description | Shares | Market Value | ||||||
COMMON STOCK (continued) | ||||||||
Denmark — 0.9% | ||||||||
Carlsberg AS, Cl B | 19,717 | $ | 2,496 | |||||
Novo Nordisk A/S, Cl B | 49,388 | 4,515 | ||||||
| 7,011 | ||||||||
Finland — 0.6% | ||||||||
Elisa Oyj | 100,676 | 4,678 | ||||||
Kemira Oyj | 15,212 | 238 | ||||||
Orion Oyj, Cl A | 259 | 10 | ||||||
| 4,926 | ||||||||
France — 2.5% | ||||||||
ABC arbitrage | 4,265 | 26 | ||||||
Air Liquide SA | 19,174 | 3,245 | ||||||
Bollore SE | 89,650 | 483 | ||||||
Bouygues SA | 12,806 | 449 | ||||||
Carrefour SA | 185,782 | 3,203 | ||||||
Edenred SE | 5,966 | 375 | ||||||
Eiffage SA | 4,383 | 418 | ||||||
Legrand SA | 14,100 | 1,303 | ||||||
Orange SA | 474,977 | 5,461 | ||||||
Sanofi | 40,287 | 4,329 | ||||||
Vivendi SE | 22,345 | 196 | ||||||
| 19,488 | ||||||||
Hong Kong — 2.7% | ||||||||
APT Satellite Holdings Ltd | 202,000 | 57 | ||||||
CK Asset Holdings Ltd | 20,000 | 105 | ||||||
CK Hutchison Holdings Ltd | 738,000 | 3,918 | ||||||
CLP Holdings Ltd, Cl B | 531,656 | 3,925 | ||||||
Dah Sing Banking Group Ltd | 108,898 | 72 | ||||||
HKT Trust & HKT Ltd | 3,008,834 | 3,137 | ||||||
Langham Hospitality Investments and Langham Hospitality Investments Ltd | 425,500 | 41 | ||||||
Miramar Hotel & Investment | 49,000 | 65 | ||||||
MTR Corp Ltd | 208,000 | 822 | ||||||
PCCW Ltd | 4,732,000 | 2,155 | ||||||
Power Assets Holdings Ltd | 800,000 | 3,863 | ||||||
Regal Hotels International Holdings Ltd * | 77,509 | 27 | ||||||
SmarTone Telecommunications Holdings Ltd | 118,020 | 60 | ||||||
Swire Pacific Ltd, Cl A | 145,000 | 976 | ||||||
VTech Holdings Ltd | 42,069 | 252 | ||||||
WH Group Ltd | 3,884,000 | 2,033 | ||||||
| 21,508 | ||||||||
Israel — 2.3% | ||||||||
Arad | 3,532 | 56 | ||||||
Check Point Software Technologies Ltd * | 74,824 | 9,972 | ||||||
FIBI Holdings Ltd | 1,748 | 80 | ||||||
First International Bank Of Israel Ltd/The | 121,452 | 5,242 | ||||||
Isracard Ltd | 5 | – | ||||||
Nice Ltd * | 6,521 | 1,114 | ||||||
Radware Ltd * | 18,480 | 313 | ||||||
SEI Institutional Managed Trust
143
SCHEDULE OF INVESTMENTS
September 30, 2023
Global Managed Volatility Fund (Continued)
Description | Shares | Market Value | ||||||
COMMON STOCK (continued) | ||||||||
Rami Levy Chain Stores Hashikma Marketing 2006 Ltd | 3,623 | $ | 207 | |||||
Tower Semiconductor Ltd * | 33,017 | 808 | ||||||
| 17,792 | ||||||||
Italy — 0.3% | ||||||||
Assicurazioni Generali SpA | 75,095 | 1,540 | ||||||
UniCredit SpA | 3,678 | 88 | ||||||
UnipolSai Assicurazioni | 167,176 | 405 | ||||||
| 2,033 | ||||||||
Japan — 9.2% | ||||||||
Achilles Corp | 2,500 | 24 | ||||||
Aichi Electric Co Ltd | 600 | 15 | ||||||
Akatsuki | 11,700 | 34 | ||||||
Albis Co Ltd | 1,600 | 26 | ||||||
Alinco Inc | 2,700 | 19 | ||||||
Amano Corp | 18,800 | 414 | ||||||
Amiyaki Tei Co Ltd | 1,300 | 33 | ||||||
Anritsu Corp | 162,000 | 1,159 | ||||||
Arcs Co Ltd | 43,600 | 796 | ||||||
Asahi Co Ltd | 24,200 | 205 | ||||||
Asante Inc (A) | 10,700 | 113 | ||||||
Autobacs Seven Co Ltd | 19,500 | 207 | ||||||
Axial Retailing Inc | 2,300 | 58 | ||||||
Belc Co Ltd | 4,700 | 216 | ||||||
Benesse Holdings Inc, Cl A | 75,800 | 929 | ||||||
Canon Inc | 79,900 | 1,930 | ||||||
Canon Marketing Japan Inc | 7,100 | 184 | ||||||
Cawachi Ltd | 29,900 | 498 | ||||||
Chiyoda Integre | 1,600 | 30 | ||||||
Chubu Electric Power Co Inc | 327,300 | 4,183 | ||||||
CI Takiron Corp | 37,000 | 142 | ||||||
COLOPL * | 10,800 | 43 | ||||||
Computer Engineering & Consulting Ltd | 18,100 | 194 | ||||||
COMSYS Holdings Corp | 34,300 | 719 | ||||||
Create Medic Co Ltd | 5,677 | 34 | ||||||
Dai Nippon Toryo Co Ltd | 7,800 | 51 | ||||||
Daiken Medical | 6,500 | 23 | ||||||
Dainichiseika Color & Chemicals Manufacturing | 1,800 | 27 | ||||||
Earth Corp | 21,200 | 699 | ||||||
Eco's | 1,800 | 25 | ||||||
Eizo Corp | 8,600 | 292 | ||||||
EXEO Group | 18,800 | 386 | ||||||
Ezaki Glico Co Ltd | 34,200 | 941 | ||||||
FAN Communications Inc | 8,000 | 21 | ||||||
Feed One | 5,100 | 27 | ||||||
FJ Next Holdings Co Ltd | 14,600 | 103 | ||||||
France Bed Holdings | 3,600 | 29 | ||||||
FTGroup Co Ltd | 2,900 | 25 | ||||||
Fujicco Co Ltd | 22,500 | 291 | ||||||
Fujiya Co Ltd | 2,900 | 49 | ||||||
Description | Shares | Market Value | ||||||
COMMON STOCK (continued) | ||||||||
Fukuda Denshi Co Ltd | 200 | $ | 7 | |||||
Gakkyusha Co Ltd | 5,600 | 76 | ||||||
H.U. Group Holdings | 12,900 | 220 | ||||||
Heiwado Co Ltd | 59,000 | 1,031 | ||||||
Hitachi Ltd | 569 | 35 | ||||||
Hokuto Corp (A) | 53,000 | 646 | ||||||
House Foods Group Inc | 33,200 | 694 | ||||||
Icom | 1,000 | 22 | ||||||
Itochu-Shokuhin Co Ltd | 2,003 | 92 | ||||||
Japan Oil Transportation Co Ltd | 2,100 | 38 | ||||||
Japan Tobacco Inc | 326,700 | 7,531 | ||||||
JM Holdings | 3,600 | 47 | ||||||
J-Oil Mills | 4,300 | 51 | ||||||
JSP Corp | 29,000 | 397 | ||||||
Kajima Corp | 54,600 | 890 | ||||||
Kaken Pharmaceutical Co Ltd | 30,400 | 713 | ||||||
Kakiyasu Honten Co Ltd | 5,531 | 92 | ||||||
Kansai Electric Power Co Inc/The | 228,800 | 3,185 | ||||||
Kato Sangyo Co Ltd | 27,800 | 741 | ||||||
Kewpie Corp | 11,900 | 192 | ||||||
Key Coffee Inc (A) | 7,400 | 100 | ||||||
KFC Holdings Japan Ltd | 6,000 | 120 | ||||||
Komeri Co Ltd | 19,200 | 405 | ||||||
Kuriyama Holdings | 4,200 | 25 | ||||||
Kyorin Pharmaceutical | 104,700 | 1,285 | ||||||
Kyosan Electric Manufacturing Co Ltd | 9,800 | 32 | ||||||
Lawson Inc | 15,800 | 728 | ||||||
Lion Corp | 55,800 | 552 | ||||||
Marvelous Inc | 5,300 | 25 | ||||||
McDonald's Holdings Co Japan Ltd | 27,600 | 1,056 | ||||||
Megmilk Snow Brand Co Ltd | 37,800 | 581 | ||||||
MEIJI Holdings Co Ltd | 23,100 | 575 | ||||||
Ministop Co Ltd | 4,700 | 46 | ||||||
Miroku Jyoho Service Co Ltd | 6,500 | 72 | ||||||
Mitsubishi Shokuhin Co Ltd | 18,900 | 494 | ||||||
Mitsui DM Sugar Holdings Co Ltd | 15,000 | 303 | ||||||
Miyoshi Oil & Fat Co Ltd | 16,300 | 128 | ||||||
Mochida Pharmaceutical Co Ltd | 2,200 | 49 | ||||||
Morozoff Ltd | 1,200 | 30 | ||||||
MS&AD Insurance Group Holdings Inc | 35,300 | 1,300 | ||||||
Musashi Co Ltd | 2,400 | 30 | ||||||
Nagatanien Holdings Co Ltd | 1,700 | 25 | ||||||
Nichirei Corp | 10,300 | 227 | ||||||
Nichirin Co Ltd | 6,200 | 125 | ||||||
Nihon Chouzai Co Ltd | 31,100 | 308 | ||||||
Nihon Denkei Co Ltd | 2,000 | 28 | ||||||
Nikko Co Ltd/Hyogo | 5,600 | 25 | ||||||
Nippn Corp | 111,234 | 1,620 | ||||||
Nippon BS Broadcasting Corp | 1,700 | 10 | ||||||
Nippon Carbon | 900 | 28 | ||||||
Nippon Telegraph & Telephone Corp (A) | 3,468,700 | 4,105 | ||||||
Nisshin Oillio Group Ltd/The | 6,452 | 181 | ||||||
144
SEI Institutional Managed Trust
Description | Shares | Market Value | ||||||
COMMON STOCK (continued) | ||||||||
Nissin Foods Holdings Co Ltd | 5,000 | $ | 416 | |||||
Nittoc Construction Co Ltd | 17,600 | 129 | ||||||
Oiles Corp | 21,200 | 285 | ||||||
Okinawa Cellular Telephone Co | 10,800 | 233 | ||||||
Okumura | 6,000 | 181 | ||||||
Okuwa Co Ltd | 9,000 | 53 | ||||||
Osaki Electric Co Ltd | 13,700 | 62 | ||||||
Otsuka Holdings Co Ltd | 12,500 | 445 | ||||||
OUG Holdings Inc | 2,236 | 36 | ||||||
Prima Meat Packers | 8,500 | 140 | ||||||
Raito Kogyo Co Ltd | 13,200 | 183 | ||||||
Rasa Corp | 3,900 | 44 | ||||||
Ricoh Co Ltd | 87,600 | 758 | ||||||
RYODEN CORP | 2,300 | 36 | ||||||
San-A Co Ltd, Cl A | 35,300 | 1,131 | ||||||
Sanki Engineering Co Ltd | 32,000 | 348 | ||||||
Sankyo Co Ltd | 28,500 | 1,309 | ||||||
Sanyo Chemical Industries | 1,200 | 33 | ||||||
Senko Group Holdings | 21,000 | 148 | ||||||
Showa Sangyo Co Ltd | 18,900 | 387 | ||||||
SKY Perfect JSAT Holdings Inc | 154,000 | 721 | ||||||
SoftBank Corp | 500,200 | 5,667 | ||||||
Software Service | 900 | 61 | ||||||
Sompo Holdings Inc | 10,700 | 461 | ||||||
SPK Corp | 1,900 | 25 | ||||||
SRA Holdings | 6,400 | 149 | ||||||
ST Corp | 5,400 | 54 | ||||||
Sugi Holdings Co Ltd | 8,900 | 354 | ||||||
SUMCO Corp | 2,800 | 37 | ||||||
Sumitomo Corp | 1,500 | 30 | ||||||
Sundrug Co Ltd | 69,100 | 1,878 | ||||||
Tachibana Eletech Co Ltd | 3,700 | 69 | ||||||
Takamatsu Construction Group Co Ltd | 14,900 | 266 | ||||||
Takasago International Corp | 2,300 | 46 | ||||||
Tekken Corp | 8,500 | 121 | ||||||
Tobishima | 4,600 | 43 | ||||||
TOKAI Holdings Corp | 100,700 | 625 | ||||||
Tokyo Individualized Educational Institute Inc | 8,500 | 28 | ||||||
Tokyo Seimitsu Co Ltd | 7,300 | 366 | ||||||
Tokyu Construction Co Ltd | 84,000 | 439 | ||||||
Toyo Ink SC Holdings Co Ltd | 26,400 | 414 | ||||||
Trend Micro Inc/Japan * | 99,700 | 3,787 | ||||||
Unicafe Inc * | 6,400 | 41 | ||||||
United Super Markets Holdings Inc | 113,100 | 810 | ||||||
Uoriki Co Ltd (A) | 5,800 | 83 | ||||||
Valor Holdings Co Ltd | 19,600 | 287 | ||||||
Vital KSK Holdings Inc | 21,700 | 146 | ||||||
Warabeya Nichiyo Holdings Co Ltd | 1,300 | 25 | ||||||
Wowow Inc | 19,124 | 146 | ||||||
Yamatane Corp | 2,700 | 38 | ||||||
Yamato Holdings Co Ltd | 23,000 | 375 | ||||||
Description | Shares | Market Value | ||||||
COMMON STOCK (continued) | ||||||||
Yamaura Corp | 2,900 | $ | 24 | |||||
Yaoko Co Ltd | 17,300 | 891 | ||||||
Yashima Denki Co Ltd | 2,600 | 23 | ||||||
Yasuda Logistics Corp | 3,700 | 26 | ||||||
Zenkoku Hosho Co Ltd | 4,000 | 132 | ||||||
Zenrin Co Ltd | 23,900 | 146 | ||||||
| 71,703 | ||||||||
Netherlands — 2.6% | ||||||||
Koninklijke Ahold Delhaize NV | 368,976 | 11,141 | ||||||
Koninklijke KPN NV | 235,773 | 778 | ||||||
Shell PLC | 92,510 | 2,988 | ||||||
Wolters Kluwer NV | 42,753 | 5,190 | ||||||
| 20,097 | ||||||||
New Zealand — 0.5% | ||||||||
Spark New Zealand Ltd | 1,257,480 | 3,634 | ||||||
Norway — 1.4% | ||||||||
AF Gruppen ASA | 449 | 5 | ||||||
AMSC ASA | 7,860 | 30 | ||||||
Bouvet ASA | 2,334 | 13 | ||||||
DNB Bank ASA | 47,025 | 953 | ||||||
Equinor ASA | 16,857 | 556 | ||||||
Kongsberg Gruppen ASA | 7,523 | 312 | ||||||
Noram Drilling | 6,118 | 30 | ||||||
Orkla ASA | 286,136 | 2,151 | ||||||
Sparebank 1 Oestlandet | 3,854 | 48 | ||||||
SpareBank 1 SMN | 19,625 | 253 | ||||||
SpareBank 1 Sorost-Norge | 3,479 | 17 | ||||||
Sparebanken Vest | 26,910 | 267 | ||||||
Storebrand | 35,817 | 293 | ||||||
Telenor ASA | 487,942 | 5,572 | ||||||
Veidekke ASA | 19,659 | 180 | ||||||
| 10,680 | ||||||||
Portugal — 0.4% | ||||||||
Jeronimo Martins SGPS SA | 96,723 | 2,177 | ||||||
NOS SGPS SA | 57,922 | 214 | ||||||
REN - Redes Energeticas Nacionais SGPS SA | 303,209 | 777 | ||||||
| 3,168 | ||||||||
Singapore — 0.9% | ||||||||
Bukit Sembawang Estates Ltd | 11,000 | 31 | ||||||
Fraser and Neave Ltd | 20,400 | 16 | ||||||
Genting Singapore Ltd | 610,400 | 378 | ||||||
Jardine Cycle & Carriage Ltd | 44,800 | 1,048 | ||||||
Jardine Matheson Holdings Ltd | 38,500 | 1,787 | ||||||
Kimly Ltd | 90,400 | 21 | ||||||
Oversea-Chinese Banking Corp Ltd | 94,200 | 884 | ||||||
Sheng Siong Group Ltd | 1,367,374 | 1,523 | ||||||
Singapore Exchange Ltd | 80,000 | 571 | ||||||
Venture Corp Ltd | 82,600 | 749 | ||||||
| 7,008 | ||||||||
SEI Institutional Managed Trust
145
SCHEDULE OF INVESTMENTS
September 30, 2023
Global Managed Volatility Fund (Continued)
Description | Shares | Market Value | ||||||
COMMON STOCK (continued) | ||||||||
Spain — 1.3% | ||||||||
ACS Actividades de Construccion y Servicios SA | 15,896 | $ | 573 | |||||
Aena SME SA | 11,081 | 1,673 | ||||||
Cia de Distribucion Integral Logista Holdings SA | 30,628 | 785 | ||||||
Endesa SA | 24,986 | 510 | ||||||
Iberdrola SA | 317,367 | 3,560 | ||||||
Redeia Corp SA | 147,558 | 2,327 | ||||||
Telefonica SA | 179,827 | 736 | ||||||
| 10,164 | ||||||||
Sweden — 0.7% | ||||||||
Essity AB, Cl B | 101,494 | 2,204 | ||||||
Industrivarden AB, Cl C | 20,204 | 537 | ||||||
Investor, Cl A | 56,833 | 1,085 | ||||||
Securitas, Cl B | 87,418 | 697 | ||||||
Volvo AB, Cl A | 23,916 | 501 | ||||||
Volvo AB, Cl B | 36,143 | 750 | ||||||
| 5,774 | ||||||||
Switzerland — 5.1% | ||||||||
Berner Kantonalbank AG | 248 | 65 | ||||||
BKW AG | 2,434 | 430 | ||||||
Chocoladefabriken Lindt & Spruengli AG | 31 | 345 | ||||||
Emmi AG | 102 | 96 | ||||||
Holcim AG | 14,779 | 950 | ||||||
Kuehne + Nagel International AG | 11,522 | 3,287 | ||||||
Nestle SA | 53,225 | 6,036 | ||||||
Novartis AG | 88,750 | 9,107 | ||||||
Plazza AG | 133 | 43 | ||||||
PSP Swiss Property AG | 15,921 | 1,883 | ||||||
Roche Holding AG | 33,118 | 9,140 | ||||||
St Galler Kantonalbank AG | 157 | 86 | ||||||
Swatch Group AG/The | 10,799 | 529 | ||||||
Swatch Group AG/The, Cl B | 3,197 | 823 | ||||||
Swisscom AG | 12,308 | 7,322 | ||||||
| 40,142 | ||||||||
United Kingdom — 5.1% | ||||||||
BAE Systems PLC | 32,670 | 398 | ||||||
British American Tobacco PLC | 31,628 | 995 | ||||||
Bunzl PLC | 32,823 | 1,172 | ||||||
Coca-Cola Europacific Partners PLC | 74,449 | 4,652 | ||||||
Cranswick PLC | 2,584 | 112 | ||||||
GSK PLC | 357,498 | 6,510 | ||||||
J Sainsbury PLC | 78,875 | 243 | ||||||
RELX PLC | 216,341 | 7,328 | ||||||
Rightmove PLC | 8,040 | 55 | ||||||
Sage Group PLC/The | 521,011 | 6,289 | ||||||
Shell PLC | 94,810 | 3,016 | ||||||
Spirent Communications PLC | 426,652 | 719 | ||||||
Tesco PLC | 632,263 | 2,039 | ||||||
Unilever PLC | 71,444 | 3,542 | ||||||
Description | Shares | Market Value | ||||||
COMMON STOCK (continued) | ||||||||
Vodafone Group PLC | 2,790,072 | $ | 2,616 | |||||
| 39,686 | ||||||||
United States — 57.3% | ||||||||
AbbVie Inc | 21,300 | 3,175 | ||||||
Air Products and Chemicals Inc | 7,755 | 2,198 | ||||||
Alphabet Inc, Cl A * | 48,117 | 6,297 | ||||||
Alphabet Inc, Cl C * | 19,915 | 2,626 | ||||||
Altria Group Inc | 126,106 | 5,303 | ||||||
Amdocs Ltd | 75,235 | 6,357 | ||||||
American Business Bank * | 1,369 | 42 | ||||||
American Electric Power Co Inc | 4,931 | 371 | ||||||
AMETEK Inc | 21,787 | 3,219 | ||||||
Amgen Inc, Cl A | 31,966 | 8,591 | ||||||
Aon PLC, Cl A | 4,108 | 1,332 | ||||||
Apple Inc | 40,228 | 6,887 | ||||||
AptarGroup Inc | 41,469 | 5,185 | ||||||
Arrow Electronics Inc, Cl A * | 8,441 | 1,057 | ||||||
AT&T Inc | 398,708 | 5,989 | ||||||
Automatic Data Processing Inc | 837 | 201 | ||||||
AutoZone Inc * | 1,564 | 3,973 | ||||||
Bank of New York Mellon Corp/The | 15,549 | 663 | ||||||
Becton Dickinson & Co | 12,110 | 3,131 | ||||||
Berkshire Hathaway Inc, Cl B * | 33,703 | 11,806 | ||||||
Box Inc, Cl A * | 45,859 | 1,110 | ||||||
Brady Corp, Cl A | 5,478 | 301 | ||||||
Bristol-Myers Squibb Co | 116,758 | 6,777 | ||||||
CACI International Inc, Cl A * | 1,129 | 354 | ||||||
Cadence Design Systems Inc * | 15,875 | 3,720 | ||||||
Campbell Soup Co | 52,458 | 2,155 | ||||||
Cardinal Health Inc | 17,340 | 1,505 | ||||||
Casey's General Stores Inc | 19,357 | 5,256 | ||||||
Cboe Global Markets Inc | 16,051 | 2,507 | ||||||
Centene Corp * | 7,762 | 535 | ||||||
Chemed Corp | 5,263 | 2,735 | ||||||
Chubb Ltd | 2,889 | 601 | ||||||
Church & Dwight Co Inc | 78,791 | 7,220 | ||||||
Cigna Group/The | 6,628 | 1,896 | ||||||
Cintas Corp | 6,498 | 3,126 | ||||||
Cisco Systems Inc | 189,604 | 10,193 | ||||||
Clorox Co/The | 48,867 | 6,405 | ||||||
Coca-Cola Co/The | 100,764 | 5,641 | ||||||
Cognizant Technology Solutions Corp, Cl A | 4,618 | 313 | ||||||
Colgate-Palmolive Co | 101,625 | 7,227 | ||||||
Comcast Corp, Cl A | 13,492 | 598 | ||||||
CommVault Systems Inc * | 60,311 | 4,078 | ||||||
Conagra Brands Inc | 89,243 | 2,447 | ||||||
Consolidated Edison Inc | 15,762 | 1,348 | ||||||
Corebridge Financial Inc | 63,177 | 1,248 | ||||||
Costco Wholesale Corp | 9,470 | 5,350 | ||||||
CSG Systems International Inc | 7,264 | 371 | ||||||
CVS Health Corp | 71,748 | 5,009 | ||||||
Dolby Laboratories Inc, Cl A | 59,231 | 4,695 | ||||||
146
SEI Institutional Managed Trust
Description | Shares | Market Value | ||||||
COMMON STOCK (continued) | ||||||||
Domino's Pizza Inc | 1,822 | $ | 690 | |||||
Donaldson Co Inc, Cl A | 1,718 | 102 | ||||||
Duke Energy Corp | 22,584 | 1,993 | ||||||
eBay Inc | 101,624 | 4,481 | ||||||
Ecolab Inc | 9,824 | 1,664 | ||||||
Electronic Arts Inc | 88,467 | 10,651 | ||||||
Elevance Health Inc | 1,275 | 555 | ||||||
Ennis Inc | 1,617 | 34 | ||||||
Eversource Energy | 1,089 | 63 | ||||||
Exelixis Inc * | 43,650 | 954 | ||||||
F5 Inc, Cl A * | 23,604 | 3,804 | ||||||
Fair Isaac Corp * | 3,197 | 2,777 | ||||||
Ferguson PLC | 5,019 | 825 | ||||||
Fox Corp, Cl A | 23,607 | 737 | ||||||
Fox Corp, Cl B | 44,708 | 1,291 | ||||||
General Dynamics Corp | 16,480 | 3,642 | ||||||
General Mills Inc | 90,248 | 5,775 | ||||||
Genuine Parts Co | 8,154 | 1,177 | ||||||
Gilead Sciences Inc | 111,231 | 8,336 | ||||||
Graco Inc | 67,214 | 4,899 | ||||||
Graham Holdings Co, Cl B | 745 | 434 | ||||||
Grand Canyon Education Inc * | 9,807 | 1,146 | ||||||
HealthStream Inc | 22,240 | 480 | ||||||
Hershey Co/The | 30,678 | 6,138 | ||||||
Hologic Inc * | 10,065 | 699 | ||||||
Humana Inc | 15,170 | 7,380 | ||||||
Huntington Ingalls Industries Inc, Cl A | 304 | 62 | ||||||
Incyte Corp * | 122,545 | 7,079 | ||||||
Ingredion Inc | 5,713 | 562 | ||||||
Innospec Inc | 884 | 90 | ||||||
Insight Enterprises Inc * | 4,201 | 611 | ||||||
Inter Parfums Inc | 2,685 | 361 | ||||||
International Business Machines Corp | 35,834 | 5,028 | ||||||
J M Smucker Co/The | 19,923 | 2,449 | ||||||
Johnson & Johnson | 67,969 | 10,586 | ||||||
Juniper Networks Inc | 175,983 | 4,891 | ||||||
Kellanova | 124,039 | 7,382 | ||||||
Kimberly-Clark Corp | 101,627 | 12,282 | ||||||
Kraft Heinz Co/The | 154,865 | 5,210 | ||||||
Landstar System Inc | 5,469 | 968 | ||||||
Leidos Holdings Inc | 5,136 | 473 | ||||||
Lockheed Martin Corp | 19,737 | 8,072 | ||||||
Marsh & McLennan Cos Inc | 38,416 | 7,311 | ||||||
McCormick & Co Inc/MD | 21,868 | 1,654 | ||||||
McDonald's Corp | 8,422 | 2,219 | ||||||
McKesson Corp | 17,246 | 7,499 | ||||||
MGIC Investment Corp | 16,424 | 274 | ||||||
Microsoft Corp | 22,457 | 7,091 | ||||||
Molina Healthcare Inc * | 3,348 | 1,098 | ||||||
Mondelez International Inc, Cl A | 105,890 | 7,349 | ||||||
Motorola Solutions Inc | 18,930 | 5,153 | ||||||
MSC Industrial Direct Co Inc, Cl A | 17,243 | 1,692 | ||||||
Description | Shares | Market Value | ||||||
COMMON STOCK (continued) | ||||||||
NetApp Inc | 22,928 | $ | 1,740 | |||||
NetScout Systems Inc * | 49,711 | 1,393 | ||||||
New Mountain Finance Corp | 22,317 | 289 | ||||||
NewMarket Corp | 2,858 | 1,300 | ||||||
Northrop Grumman Corp | 8,122 | 3,575 | ||||||
Nova * | 2,765 | 311 | ||||||
NVR Inc * | 64 | 382 | ||||||
Oracle Corp, Cl B | 32,677 | 3,461 | ||||||
O'Reilly Automotive Inc * | 1,137 | 1,033 | ||||||
PACCAR Inc | 23,113 | 1,965 | ||||||
PepsiCo Inc | 41,651 | 7,057 | ||||||
Pfizer Inc | 68,125 | 2,260 | ||||||
Philip Morris International Inc | 74,471 | 6,895 | ||||||
Phillips 66 | 12,963 | 1,557 | ||||||
Prestige Consumer Healthcare Inc, Cl A * | 3,716 | 213 | ||||||
Procter & Gamble Co/The | 72,810 | 10,620 | ||||||
Public Storage ‡ | 185 | 49 | ||||||
Regeneron Pharmaceuticals Inc * | 263 | 216 | ||||||
Reliance Steel & Aluminum Co | 2,579 | 676 | ||||||
Republic Services Inc | 35,417 | 5,047 | ||||||
Roper Technologies Inc | 3,070 | 1,487 | ||||||
Royal Gold Inc, Cl A | 48,520 | 5,159 | ||||||
RPM International Inc | 10,985 | 1,041 | ||||||
Sherwin-Williams Co/The, Cl A | 1,542 | 393 | ||||||
Synopsys Inc * | 7,134 | 3,274 | ||||||
Sysco Corp, Cl A | 31,012 | 2,048 | ||||||
TJX Cos Inc/The | 16,073 | 1,429 | ||||||
T-Mobile US Inc | 6,063 | 849 | ||||||
Ulta Beauty Inc * | 1,751 | 699 | ||||||
United Therapeutics Corp * | 4,556 | 1,029 | ||||||
UnitedHealth Group Inc | 134 | 68 | ||||||
USANA Health Sciences Inc * | 11,882 | 696 | ||||||
VeriSign Inc * | 12,640 | 2,560 | ||||||
Verisk Analytics Inc, Cl A | 968 | 229 | ||||||
Verizon Communications Inc | 245,592 | 7,960 | ||||||
Vertex Pharmaceuticals Inc * | 2,534 | 881 | ||||||
VMware Inc, Cl A * | 1,674 | 279 | ||||||
Walgreens Boots Alliance Inc | 135,041 | 3,003 | ||||||
Walmart Inc | 66,701 | 10,667 | ||||||
Waste Management Inc | 2,314 | 353 | ||||||
WP Carey Inc ‡ | 28,859 | 1,561 | ||||||
Yelp Inc, Cl A * | 10,407 | 433 | ||||||
Zimmer Biomet Holdings Inc | 1,375 | 154 | ||||||
| 447,588 | ||||||||
Total Common Stock | ||||||||
(Cost $743,759) ($ Thousands) | 757,728 | |||||||
SEI Institutional Managed Trust
147
SCHEDULE OF INVESTMENTS
September 30, 2023
Global Managed Volatility Fund (Continued)
Description | Shares | Market Value | ||||||
PREFERRED STOCK — 0.5% | ||||||||
Germany — 0.5% | ||||||||
Bayerische Motoren Werke AG, 7.000% | 5,482 | $ | 512 | |||||
Henkel AG & Co KGaA (B) | 43,203 | 3,086 | ||||||
Total Preferred Stock | ||||||||
(Cost $3,763) ($ Thousands) | 3,598 | |||||||
| �� | ||||||||
AFFILIATED PARTNERSHIP — 0.7% | ||||||||
SEI Liquidity Fund, LP | ||||||||
5.410% **†(C) | 5,171,055 | 5,171 | ||||||
Total Affiliated Partnership | ||||||||
(Cost $5,172) ($ Thousands) | 5,171 | |||||||
CASH EQUIVALENT — 1.0% | ||||||||
SEI Daily Income Trust, Government Fund, Institutional Class | ||||||||
5.210%**† | 8,087,761 | 8,088 | ||||||
Total Cash Equivalent | ||||||||
(Cost $8,088) ($ Thousands) | 8,088 | |||||||
Total Investments in Securities — 99.1% | ||||||||
(Cost $760,782) ($ Thousands) | $ | 774,585 | ||||||
148
SEI Institutional Managed Trust
A list of the open futures contracts held by the Fund at September 30, 2023, is as follows:
Type of Contract | Number of | Expiration Date | Notional Amount (Thousands) | Value | Unrealized Appreciation/ | |||||||||||||||
Long Contracts | ||||||||||||||||||||
Euro STOXX 50 | 17 | Dec-2023 | $ | 774 | $ | 757 | $ | (8 | ) | |||||||||||
FTSE 100 Index | 3 | Dec-2023 | 278 | 281 | 2 | |||||||||||||||
Hang Seng Index | 3 | Oct-2023 | 344 | 342 | – | |||||||||||||||
S&P 500 Index E-MINI | 17 | Dec-2023 | 3,842 | 3,677 | (166 | ) | ||||||||||||||
SPI 200 Index | 2 | Dec-2023 | 235 | 228 | (5 | ) | ||||||||||||||
TOPIX Index | 4 | Dec-2023 | 628 | 623 | (6 | ) | ||||||||||||||
| $ | 6,101 | $ | 5,908 | $ | (183 | ) | ||||||||||||||
A list of the open forward foreign currency contracts held by the Fund at September 30, 2023, is as follows:
Counterparty | Settlement Date | Currency to Deliver | Currency to Receive | Unrealized Appreciation | ||||||||||||||||||||
Barclays PLC | 10/16/23 | CHF | 19,486 | USD | 21,897 | $ | 563 | |||||||||||||||||
Barclays PLC | 10/16/23 | SEK | 74,604 | USD | 6,718 | (154 | ) | |||||||||||||||||
Barclays PLC | 10/16/23 | JPY | 5,463,516 | USD | 37,247 | 546 | ||||||||||||||||||
BNP Paribas | 10/16/23 | NOK | 68,287 | USD | 6,386 | (35 | ) | |||||||||||||||||
Brown Brothers Harriman | 10/16/23 | AUD | 32 | USD | 20 | — | ||||||||||||||||||
Brown Brothers Harriman | 10/16/23 | USD | 22 | AUD | 34 | — | ||||||||||||||||||
Brown Brothers Harriman | 10/16/23 | USD | 28 | AUD | 43 | — | ||||||||||||||||||
Brown Brothers Harriman | 10/16/23 | NZD | 67 | USD | 40 | (1 | ) | |||||||||||||||||
Brown Brothers Harriman | 10/16/23 | SGD | 43 | USD | 32 | — | ||||||||||||||||||
Brown Brothers Harriman | 10/16/23 | SGD | 30 | USD | 22 | — | ||||||||||||||||||
Brown Brothers Harriman | 10/16/23 | USD | 122 | NZD | 204 | 1 | ||||||||||||||||||
Brown Brothers Harriman | 10/16/23 | USD | 11 | NZD | 18 | — | ||||||||||||||||||
Brown Brothers Harriman | 10/16/23 | USD | 63 | SGD | 87 | — | ||||||||||||||||||
Brown Brothers Harriman | 10/16/23 | USD | 95 | SGD | 129 | — | ||||||||||||||||||
Brown Brothers Harriman | 10/16/23 | CAD | 93 | USD | 69 | — | ||||||||||||||||||
Brown Brothers Harriman | 10/16/23 | CAD | 70 | USD | 52 | — | ||||||||||||||||||
Brown Brothers Harriman | 10/16/23 | USD | 57 | DKK | 401 | — | ||||||||||||||||||
Brown Brothers Harriman | 10/16/23 | USD | 109 | DKK | 759 | (1 | ) | |||||||||||||||||
Brown Brothers Harriman | 10/16/23 | USD | 26 | CAD | 35 | — | ||||||||||||||||||
Brown Brothers Harriman | 10/16/23 | USD | 312 | CAD | 421 | (1 | ) | |||||||||||||||||
Brown Brothers Harriman | 10/16/23 | USD | 356 | NOK | 3,816 | 3 | ||||||||||||||||||
Brown Brothers Harriman | 10/16/23 | USD | 3 | NOK | 28 | — | ||||||||||||||||||
Brown Brothers Harriman | 10/16/23 | GBP | 340 | USD | 420 | 5 | ||||||||||||||||||
Brown Brothers Harriman | 10/16/23 | GBP | 96 | USD | 117 | — | ||||||||||||||||||
Brown Brothers Harriman | 10/16/23 | USD | 485 | HKD | 3,791 | (1 | ) | |||||||||||||||||
Brown Brothers Harriman | 10/16/23 | USD | 462 | SEK | 5,102 | 8 | ||||||||||||||||||
Brown Brothers Harriman | 10/16/23 | USD | 28 | SEK | 299 | — | ||||||||||||||||||
Brown Brothers Harriman | 10/16/23 | CHF | 570 | USD | 632 | 9 | ||||||||||||||||||
Brown Brothers Harriman | 10/16/23 | USD | 229 | GBP | 188 | — | ||||||||||||||||||
Brown Brothers Harriman | 10/16/23 | USD | 439 | GBP | 356 | (4 | ) | |||||||||||||||||
Brown Brothers Harriman | 10/16/23 | DKK | 546 | USD | 78 | 1 | ||||||||||||||||||
Brown Brothers Harriman | 10/16/23 | DKK | 134 | USD | 19 | — | ||||||||||||||||||
Brown Brothers Harriman | 10/16/23 | USD | 168 | CHF | 154 | — | ||||||||||||||||||
Brown Brothers Harriman | 10/16/23 | USD | 607 | CHF | 547 | (9 | ) | |||||||||||||||||
Brown Brothers Harriman | 10/16/23 | EUR | 660 | USD | 705 | 5 | ||||||||||||||||||
Brown Brothers Harriman | 10/16/23 | EUR | 162 | USD | 172 | — | ||||||||||||||||||
SEI Institutional Managed Trust
149
SCHEDULE OF INVESTMENTS
September 30, 2023
Global Managed Volatility Fund (Concluded)
Counterparty | Settlement Date | Currency to Deliver | Currency to Receive | Unrealized Appreciation | ||||||||||||||||||||
Brown Brothers Harriman | 10/16/23 | HKD | 1,057 | USD | 135 | $ | — | |||||||||||||||||
Brown Brothers Harriman | 10/16/23 | USD | 291 | JPY | 43,404 | — | ||||||||||||||||||
Brown Brothers Harriman | 10/16/23 | USD | 943 | JPY | 138,982 | (9 | ) | |||||||||||||||||
Brown Brothers Harriman | 10/16/23 | USD | 274 | EUR | 259 | 1 | ||||||||||||||||||
Brown Brothers Harriman | 10/16/23 | USD | 1,223 | EUR | 1,145 | (10 | ) | |||||||||||||||||
Brown Brothers Harriman | 10/16/23 | SEK | 1,737 | USD | 156 | (4 | ) | |||||||||||||||||
Brown Brothers Harriman | 10/16/23 | NOK | 1,819 | USD | 169 | (2 | ) | |||||||||||||||||
Brown Brothers Harriman | 10/16/23 | JPY | 73,309 | USD | 497 | 4 | ||||||||||||||||||
Brown Brothers Harriman | 10/16/23 | JPY | 16,489 | USD | 111 | — | ||||||||||||||||||
Standard Chartered | 10/16/23 | NZD | 3,290 | USD | 1,941 | (35 | ) | |||||||||||||||||
Standard Chartered | 10/16/23 | GBP | 14,461 | USD | 18,037 | 386 | ||||||||||||||||||
Standard Chartered | 10/16/23 | DKK | 27,020 | USD | 3,896 | 56 | ||||||||||||||||||
Standard Chartered | 10/16/23 | HKD | 92,099 | USD | 11,776 | 12 | ||||||||||||||||||
Westpac Banking | 10/16/23 | AUD | 1,260 | USD | 808 | (5 | ) | |||||||||||||||||
Westpac Banking | 10/16/23 | SGD | 4,959 | USD | 3,647 | 11 | ||||||||||||||||||
Westpac Banking | 10/16/23 | CAD | 8,659 | USD | 6,388 | (18 | ) | |||||||||||||||||
Westpac Banking | 10/16/23 | EUR | 33,281 | USD | 35,779 | 526 | ||||||||||||||||||
| $ | 1,848 | |||||||||||||||||||||||
| Percentages are based on Net Assets of $781,654 ($ Thousands). |
* | Non-income producing security. |
** | The rate reported is the 7-day effective yield as of September 30, 2023. |
‡ | Real Estate Investment Trust. |
† | Investment in Affiliated Security (see Note 6). |
(A) | Certain securities or partial positions of certain securities are on loan at September 30, 2023. |
(B) | No interest rate available. |
(C) | This security was purchased with cash collateral held from securities on loan (see Note 12). The total market value of such securities as of September 30, 2023 was $5,171 ($ Thousands). |
The following is a summary of the level of inputs used as of September 30, 2023, in valuing the Fund's investments and other financial instruments carried at value ($ Thousands): | ||||||||||||||||
Investments in Securities | Level 1 | Level 2 | Level 3 | Total | ||||||||||||
Common Stock | 728,354 | 29,374 | – | 757,728 | ||||||||||||
Preferred Stock | 3,598 | – | – | 3,598 | ||||||||||||
Affiliated Partnership | – | 5,171 | – | 5,171 | ||||||||||||
Cash Equivalent | 8,088 | – | – | 8,088 | ||||||||||||
Total Investments in Securities | 740,040 | 34,545 | – | 774,585 | ||||||||||||
Other Financial Instruments | Level 1 | Level 2 | Level 3 | Total | ||||||||||||
Futures Contracts* | ||||||||||||||||
Unrealized Appreciation | 2 | – | – | 2 | ||||||||||||
Unrealized Depreciation | (185 | ) | – | – | (185 | ) | ||||||||||
Forward Contracts* | ||||||||||||||||
Unrealized Appreciation | – | 2,137 | – | 2,137 | ||||||||||||
Unrealized Depreciation | – | (289 | ) | – | (289 | ) | ||||||||||
Total Other Financial Instruments | (183 | ) | 1,848 | – | 1,665 | |||||||||||
* | Futures contracts and forward contracts are valued at unrealized appreciation (depreciation) on the instrument. |
For more information on valuation inputs, see Note 2 — Significant Accounting Policies in Notes to Financial Statements.
The following is a summary of the Fund’s transactions with affiliates for the year ended September 30, 2023 ($ Thousands):
Security Description | Value | Purchases | Proceeds | Realized Gain/(Loss) | Change in Unrealized Appreciation/(Depreciation) | Value | Income | Capital Gains | ||||||||||||||||||||||||
SEI Liquidity Fund, LP | $ | 17,355 | $ | 124,602 | $ | (136,794 | ) | $ | 5 | $ | 3 | $ | 5,171 | $ | 68 | $ | — | |||||||||||||||
SEI Daily Income Trust, Government Fund, | 8,497 | 161,825 | (162,234 | ) | — | — | 8,088 | 489 | — | |||||||||||||||||||||||
Totals | $ | 25,852 | $ | 286,427 | $ | (299,028 | ) | $ | 5 | $ | 3 | $ | 13,259 | $ | 557 | $ | — | |||||||||||||||
Amounts designated as “—” are either $0 or have been rounded to $0.
150
SEI Institutional Managed Trust
See “Glossary” for abbreviations.
The accompanying notes are an integral part of the financial statements.
SEI Institutional Managed Trust
151
SCHEDULE OF INVESTMENTS
September 30, 2023
Tax-Managed Managed Volatility Fund

† | Percentages are based on total investments. Total investments do not include derivatives such as options, futures contracts, forward contracts, and swap contracts, if applicable. |
Description | Shares | Market Value | ||||||
COMMON STOCK — 97.6% | ||||||||
Communication Services — 2.6% | ||||||||
Cogeco Communications Inc | 16,400 | $ | 763 | |||||
Comcast Corp, Cl A | 63,700 | 2,824 | ||||||
Fox Corp, Cl A | 83,711 | 2,612 | ||||||
Fox Corp, Cl B | 29,292 | 846 | ||||||
Madison Square Garden Sports Corp * | 8,894 | 1,568 | ||||||
New York Times Co/The, Cl A | 90,194 | 3,716 | ||||||
T-Mobile US Inc * | 33,605 | 4,706 | ||||||
Verizon Communications Inc | 115,208 | 3,734 | ||||||
| 20,769 | ||||||||
Consumer Discretionary — 4.4% | ||||||||
AutoZone Inc * | 7,000 | 17,780 | ||||||
Darden Restaurants Inc | 6,293 | 901 | ||||||
Honda Motor Co Ltd ADR | 129,300 | 4,350 | ||||||
McDonald's Corp | 24,867 | 6,551 | ||||||
Murphy USA Inc | 8,800 | 3,007 | ||||||
Toyota Motor Corp ADR (A) | 16,500 | 2,966 | ||||||
| 35,555 | ||||||||
Consumer Staples — 15.9% | ||||||||
Altria Group Inc | 51,246 | 2,155 | ||||||
Archer-Daniels-Midland Co | 5,480 | 413 | ||||||
Campbell Soup Co | 38,959 | 1,600 | ||||||
Casey's General Stores Inc | 522 | 142 | ||||||
Church & Dwight Co Inc | 71,294 | 6,533 | ||||||
Clorox Co/The | 19,287 | 2,528 | ||||||
Coca-Cola Co/The | 64,543 | 3,613 | ||||||
Coca-Cola Europacific Partners PLC | 49,400 | 3,086 | ||||||
Colgate-Palmolive Co | 57,659 | 4,100 | ||||||
Costco Wholesale Corp | 10,788 | 6,095 | ||||||
Dollar General Corp | 15,091 | 1,597 | ||||||
General Mills Inc | 93,567 | 5,987 | ||||||
Hershey Co/The | 32,131 | 6,429 | ||||||
Hormel Foods Corp | 91,843 | 3,493 | ||||||
J M Smucker Co/The | 49,370 | 6,068 | ||||||
Description | Shares | Market Value | ||||||
COMMON STOCK (continued) | ||||||||
Kellanova | 78,461 | $ | 4,669 | |||||
Kimberly-Clark Corp | 41,715 | 5,041 | ||||||
Kroger Co/The | 297,700 | 13,322 | ||||||
Lamb Weston Holdings Inc | 28,333 | 2,620 | ||||||
McCormick & Co Inc/MD | 71,893 | 5,438 | ||||||
Metro Inc/CN, Cl A | 58,400 | 3,047 | ||||||
PepsiCo Inc | 56,305 | 9,540 | ||||||
Procter & Gamble Co/The | 39,918 | 5,822 | ||||||
Target Corp, Cl A | 4,068 | 450 | ||||||
Tyson Foods Inc, Cl A | 24,086 | 1,216 | ||||||
Walmart Inc | 142,335 | 22,764 | ||||||
| 127,768 | ||||||||
Energy — 1.2% | ||||||||
Chevron Corp | 14,200 | 2,395 | ||||||
DT Midstream Inc | 7,200 | 381 | ||||||
Shell PLC ADR | 48,400 | 3,116 | ||||||
Williams Cos Inc/The | 96,414 | 3,248 | ||||||
| 9,140 | ||||||||
Financials — 14.6% | ||||||||
Aflac Inc | 112,800 | 8,657 | ||||||
Allstate Corp/The | 50,000 | 5,570 | ||||||
American Financial Group Inc/OH | 41,500 | 4,634 | ||||||
Berkshire Hathaway Inc, Cl B * | 28,900 | 10,124 | ||||||
Cboe Global Markets Inc | 46,588 | 7,278 | ||||||
Chubb Ltd | 12,399 | 2,581 | ||||||
Cullen/Frost Bankers Inc | 10,482 | 956 | ||||||
Erie Indemnity Co, Cl A | 17,122 | 5,030 | ||||||
Everest Group Ltd | 32,294 | 12,003 | ||||||
Eversource Energy | 68,092 | 3,960 | ||||||
First Hawaiian Inc | 144,598 | 2,610 | ||||||
Hanover Insurance Group Inc/The, Cl A | 19,700 | 2,186 | ||||||
Jack Henry & Associates Inc | 10,939 | 1,653 | ||||||
M&T Bank Corp | 13,412 | 1,696 | ||||||
MGIC Investment Corp | 108,239 | 1,807 | ||||||
Morningstar Inc, Cl A | 16,200 | 3,795 | ||||||
National Bank of Canada | 54,700 | 3,651 | ||||||
Progressive Corp/The | 110,900 | 15,448 | ||||||
RenaissanceRe Holdings Ltd | 31,431 | 6,221 | ||||||
Travelers Cos Inc/The | 83,286 | 13,601 | ||||||
White Mountains Insurance Group Ltd | 2,847 | 4,258 | ||||||
| 117,719 | ||||||||
Health Care — 22.2% | ||||||||
AbbVie Inc | 88,890 | 13,250 | ||||||
Amgen Inc, Cl A | 16,800 | 4,515 | ||||||
AstraZeneca PLC ADR | 75,200 | 5,093 | ||||||
Bristol-Myers Squibb Co | 140,271 | 8,141 | ||||||
Cencora Inc, Cl A | 14,727 | 2,650 | ||||||
Chemed Corp | 11,131 | 5,785 | ||||||
CVS Health Corp | 31,417 | 2,194 | ||||||
Danaher Corp, Cl A | 14,581 | 3,618 | ||||||
Elevance Health Inc | 41,000 | 17,852 | ||||||
152
SEI Institutional Managed Trust
Description | Shares | Market Value | ||||||
COMMON STOCK (continued) | ||||||||
Eli Lilly & Co | 47,000 | $ | 25,245 | |||||
Gilead Sciences Inc | 42,973 | 3,220 | ||||||
Henry Schein Inc * | 2,850 | 212 | ||||||
Humana Inc | 23,845 | 11,601 | ||||||
Incyte Corp * | 79,688 | 4,604 | ||||||
Johnson & Johnson | 51,781 | 8,065 | ||||||
McKesson Corp | 8,957 | 3,895 | ||||||
Merck & Co Inc | 165,345 | 17,022 | ||||||
Mettler-Toledo International Inc * | 3,168 | 3,510 | ||||||
Neurocrine Biosciences Inc * | 49,986 | 5,623 | ||||||
Pfizer Inc | 166,394 | 5,519 | ||||||
Quest Diagnostics Inc | 50,752 | 6,185 | ||||||
Thermo Fisher Scientific Inc | 3,267 | 1,654 | ||||||
United Therapeutics Corp * | 13,098 | 2,958 | ||||||
UnitedHealth Group Inc | 33,000 | 16,638 | ||||||
| 179,049 | ||||||||
Industrials — 12.0% | ||||||||
3M Co | 21,260 | 1,990 | ||||||
Automatic Data Processing Inc | 11,680 | 2,810 | ||||||
Carrier Global Corp | 50,700 | 2,799 | ||||||
CH Robinson Worldwide Inc | 33,696 | 2,902 | ||||||
CSG Systems International Inc | 37,600 | 1,922 | ||||||
Cummins Inc | 10,600 | 2,422 | ||||||
EMCOR Group Inc | 13,365 | 2,812 | ||||||
General Dynamics Corp | 11,900 | 2,629 | ||||||
L3Harris Technologies Inc | 22,600 | 3,935 | ||||||
Landstar System Inc | 11,414 | 2,020 | ||||||
Lockheed Martin Corp | 5,885 | 2,407 | ||||||
Northrop Grumman Corp | 40,245 | 17,715 | ||||||
Quanta Services Inc | 32,700 | 6,117 | ||||||
Republic Services Inc | 131,000 | 18,669 | ||||||
Rollins Inc | 32,521 | 1,214 | ||||||
RTX Corp | 127,200 | 9,155 | ||||||
Schneider National Inc, Cl B | 126,110 | 3,492 | ||||||
Waste Management Inc | 74,421 | 11,345 | ||||||
| 96,355 | ||||||||
Information Technology — 18.4% | ||||||||
Amdocs Ltd | 225,113 | 19,020 | ||||||
Apple Inc | 135,100 | 23,130 | ||||||
Cisco Systems Inc | 77,409 | 4,162 | ||||||
F5 Inc, Cl A * | 21,963 | 3,539 | ||||||
International Business Machines Corp | 9,600 | 1,347 | ||||||
Microsoft Corp | 82,896 | 26,174 | ||||||
Motorola Solutions Inc | 87,964 | 23,947 | ||||||
NetApp Inc | 46,296 | 3,513 | ||||||
Oracle Corp, Cl B | 211,986 | 22,454 | ||||||
Qorvo Inc * | 29,520 | 2,818 | ||||||
Synopsys Inc * | 39,300 | 18,038 | ||||||
| 148,142 | ||||||||
Materials — 2.4% | ||||||||
AptarGroup Inc | 6,262 | 783 | ||||||
Description | Shares | Market Value | ||||||
COMMON STOCK (continued) | ||||||||
Avery Dennison Corp | 26,300 | $ | 4,804 | |||||
Corteva Inc | 74,350 | 3,804 | ||||||
NewMarket Corp | 7,800 | 3,549 | ||||||
Royal Gold Inc, Cl A | 15,330 | 1,630 | ||||||
Sealed Air Corp | 58,400 | 1,919 | ||||||
Silgan Holdings Inc | 58,400 | 2,518 | ||||||
| 19,007 | ||||||||
Real Estate — 0.2% | ||||||||
Equity LifeStyle Properties Inc ‡ | 29,390 | 1,872 | ||||||
Utilities — 3.7% | ||||||||
Ameren Corp | 64,500 | 4,827 | ||||||
American Electric Power Co Inc | 34,124 | 2,567 | ||||||
DTE Energy Co | 38,099 | 3,782 | ||||||
Duke Energy Corp | 37,738 | 3,331 | ||||||
Entergy Corp | 17,400 | 1,609 | ||||||
National Fuel Gas Co | 34,340 | 1,783 | ||||||
NextEra Energy Inc | 25,080 | 1,437 | ||||||
Portland General Electric Co | 52,500 | 2,125 | ||||||
Public Service Enterprise Group Inc | 37,300 | 2,123 | ||||||
Southern Co/The | 19,305 | 1,249 | ||||||
WEC Energy Group Inc | 63,946 | 5,151 | ||||||
| 29,984 | ||||||||
Total Common Stock | ||||||||
(Cost $359,124) ($ Thousands) | 785,360 | |||||||
AFFILIATED PARTNERSHIP — 0.4% | ||||||||
SEI Liquidity Fund, LP | ||||||||
5.410% **†(B) | 3,175,193 | 3,171 | ||||||
Total Affiliated Partnership | ||||||||
(Cost $3,176) ($ Thousands) | 3,171 | |||||||
CASH EQUIVALENT — 2.2% | ||||||||
SEI Daily Income Trust, Government Fund, Institutional Class | ||||||||
5.210%**† | 18,107,138 | 18,107 | ||||||
Total Cash Equivalent | ||||||||
(Cost $18,107) ($ Thousands) | 18,107 | |||||||
Total Investments in Securities — 100.2% | ||||||||
(Cost $380,407) ($ Thousands) | $ | 806,638 | ||||||
SEI Institutional Managed Trust
153
SCHEDULE OF INVESTMENTS
September 30, 2023
Tax-Managed Managed Volatility Fund (Concluded)
A list of the open futures contracts held by the Fund at September 30, 2023, is as follows:
Type of Contract | Number of | Expiration Date | Notional Amount (Thousands) | Value | Unrealized Depreciation(Thousands) | |||||||||||||||
Long Contracts | ||||||||||||||||||||
S&P 500 Index E-MINI | 52 | Dec-2023 | $ | 11,447 | $ | 11,246 | $ | (201 | ) | |||||||||||
| Percentages are based on a Net Assets of $805,267 ($ Thousands). |
* | Non-income producing security. |
** | The rate reported is the 7-day effective yield as of September 30, 2023. |
‡ | Real Estate Investment Trust. |
† | Investment in Affiliated Security (see Note 6). |
(A) | Certain securities or partial positions of certain securities are on loan at September 30, 2023. |
(B) | This security was purchased with cash collateral held from securities on loan (see Note 12). The total market value of such securities as of September 30, 2023 was $3,171 ($ Thousands). |
The following is a summary of the level of inputs used as of September 30, 2023, in valuing the Fund's investments and other financial instruments carried at value ($ Thousands): |
Investments in Securities | Level 1 | Level 2 | Level 3 | Total | ||||||||||||
Common Stock | 785,360 | – | – | 785,360 | ||||||||||||
Affiliated Partnership | – | 3,171 | – | 3,171 | ||||||||||||
Cash Equivalent | 18,107 | – | – | 18,107 | ||||||||||||
Total Investments in Securities | 803,467 | 3,171 | – | 806,638 | ||||||||||||
Other Financial Instruments | Level 1 | Level 2 | Level 3 | Total | ||||||||||||
Futures Contracts* | ||||||||||||||||
Unrealized Depreciation | (201 | ) | – | – | (201 | ) | ||||||||||
Total Other Financial Instruments | (201 | ) | – | – | (201 | ) | ||||||||||
* | Futures contracts are valued at unrealized depreciation on the instrument. |
For more information on valuation inputs, see Note 2 — Significant Accounting Policies in Notes to Financial Statements.
The following is a summary of the Fund’s transactions with affiliates for the year ended September 30, 2023 ($ Thousands):
Security Description | Value 9/30/2022 | Purchases at Cost | Proceeds from Sales | Realized Gain/ (Loss) | Change in Unrealized Appreciation/ (Depreciation) | Value 9/30/2023 | Income | Capital Gains | ||||||||||||||||||||||||
SEI Liquidity Fund, LP | $ | 3,473 | $ | 14,202 | $ | (14,499 | ) | $ | — | $ | (5 | ) | $ | 3,171 | $ | 26 | $ | — | ||||||||||||||
SEI Daily Income Trust, Government Fund, Institutional Class | 14,834 | 248,227 | (244,954 | ) | — | — | 18,107 | 731 | — | |||||||||||||||||||||||
Totals | $ | 18,307 | $ | 262,429 | $ | (259,453 | ) | $ | — | $ | (5 | ) | $ | 21,278 | $ | 757 | $ | — | ||||||||||||||
Amounts designated as “—” are either $0 or have been rounded to $0.
See “Glossary” for abbreviations.
The accompanying notes are an integral part of the financial statements.
154
SEI Institutional Managed Trust
SCHEDULE OF INVESTMENTS
September 30, 2023
Tax-Managed International Managed Volatility Fund
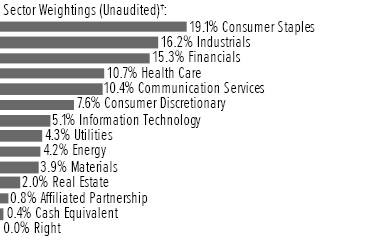
† | Percentages are based on total investments. Total investments do not include derivatives such as options, futures contracts, forward contracts, and swap contracts, if applicable. |
Description | Shares | Market Value | ||||||
COMMON STOCK — 97.0% | ||||||||
Australia — 4.5% | ||||||||
Abacus Storage King *‡ | 226,087 | $ | 152 | |||||
AGL Energy Ltd | 194,391 | 1,346 | ||||||
ANZ Group Holdings | 58,114 | 962 | ||||||
Aurizon Holdings Ltd | 268,095 | 604 | ||||||
Bendigo & Adelaide Bank | 52,109 | 300 | ||||||
BlueScope Steel Ltd | 9,491 | 119 | ||||||
Brambles Ltd | 207,892 | 1,921 | ||||||
carsales.com | 14,723 | 265 | ||||||
Coles Group Ltd | 8,068 | 81 | ||||||
CSL Ltd | 3,288 | 532 | ||||||
Deterra Royalties Ltd | 32,233 | 100 | ||||||
Dexus ‡ | 96,625 | 455 | ||||||
Elders Ltd | 98,563 | 368 | ||||||
Harvey Norman Holdings Ltd (A) | 390,215 | 975 | ||||||
JB Hi-Fi Ltd | 30,746 | 901 | ||||||
Metcash, Cl A | 234,562 | 572 | ||||||
Orica Ltd | 14,489 | 146 | ||||||
REA Group Ltd | 1,021 | 102 | ||||||
Rio Tinto Ltd | 7,909 | 580 | ||||||
Rio Tinto PLC | 4,743 | 300 | ||||||
Rio Tinto PLC ADR | 3,379 | 215 | ||||||
Sonic Healthcare Ltd | 12,126 | 233 | ||||||
Telstra Group Ltd, Cl B | 316,051 | 785 | ||||||
Ventia Services Group Pty | 214,403 | 390 | ||||||
Vicinity Ltd ‡ | 82,259 | 90 | ||||||
Viva Energy Group | 202,300 | 392 | ||||||
Wesfarmers Ltd | 18,824 | 642 | ||||||
Woolworths Group Ltd | 17,215 | 415 | ||||||
| 13,943 | ||||||||
Austria — 0.3% | ||||||||
ANDRITZ AG | 5,099 | 258 | ||||||
CA Immobilien Anlagen AG | 4,737 | 158 | ||||||
Eurotelesites * | 20,380 | 89 | ||||||
S Immo AG | 9,548 | – | ||||||
Description | Shares | Market Value | ||||||
COMMON STOCK (continued) | ||||||||
Telekom Austria AG, Cl A | 81,520 | $ | 570 | |||||
| 1,075 | ||||||||
Belgium — 1.1% | ||||||||
Ageas SA/NV | 32,273 | 1,333 | ||||||
Etablissements Franz Colruyt NV | 25,637 | 1,112 | ||||||
Proximus SADP | 93,819 | 765 | ||||||
UCB SA, Cl A | 2,296 | 188 | ||||||
| 3,398 | ||||||||
Brazil — 0.1% | ||||||||
Yara International ASA | 7,932 | 302 | ||||||
Canada — 2.1% | ||||||||
Bank of Nova Scotia/The, Cl C | 7,856 | 354 | ||||||
Canadian Imperial Bank of Commerce | 21,358 | 828 | ||||||
Canadian Tire Corp Ltd, Cl A | 14,654 | 1,583 | ||||||
Cogeco Communications Inc | 13,978 | 650 | ||||||
iA Financial Corp Inc | 5,898 | 372 | ||||||
Loblaw Cos Ltd | 24,108 | 2,058 | ||||||
Stella-Jones | 13,355 | 645 | ||||||
| 6,490 | ||||||||
China — 0.1% | ||||||||
Wilmar International Ltd | 124,500 | 340 | ||||||
Denmark — 3.4% | ||||||||
AP Moller - Maersk A/S, Cl B | 317 | 573 | ||||||
Carlsberg AS, Cl B | 12,982 | 1,643 | ||||||
Coloplast A/S, Cl B | 6,536 | 694 | ||||||
Danske Bank A/S | 48,402 | 1,130 | ||||||
DSV A/S | 3,193 | 598 | ||||||
Genmab A/S * | 1,478 | 526 | ||||||
Jyske Bank A/S * | 2,041 | 150 | ||||||
Novo Nordisk A/S, Cl B | 30,258 | 2,766 | ||||||
Scandinavian Tobacco Group A/S | 66,734 | 1,019 | ||||||
Solar, Cl B * | 2,119 | 143 | ||||||
Sydbank A/S | 22,507 | 1,074 | ||||||
UIE | 5,640 | 141 | ||||||
| 10,457 | ||||||||
Finland — 1.7% | ||||||||
Elisa Oyj | 29,457 | 1,369 | ||||||
Kemira Oyj | 45,914 | 716 | ||||||
Kesko Oyj, Cl B | 56,495 | 1,015 | ||||||
Metsa Board, Cl B | 58,373 | 470 | ||||||
Orion Oyj, Cl B | 23,517 | 927 | ||||||
TietoEVRY Oyj | 32,713 | 738 | ||||||
| 5,235 | ||||||||
France — 9.2% | ||||||||
Air Liquide SA | 3,881 | 657 | ||||||
Arkema SA | 3,142 | 311 | ||||||
AXA SA | 35,579 | 1,062 | ||||||
BNP Paribas SA | 3,209 | 205 | ||||||
SEI Institutional Managed Trust
155
SCHEDULE OF INVESTMENTS
September 30, 2023
Tax-Managed International Managed Volatility Fund (Continued)
Description | Shares | Market Value | ||||||
COMMON STOCK (continued) | ||||||||
Caisse Regionale de Credit Agricole Mutuel Brie Picardie | 5,335 | $ | 104 | |||||
Caisse Regionale de Credit Agricole Mutuel Sud Rhone Alpes | 886 | 117 | ||||||
Carrefour SA | 157,009 | 2,707 | ||||||
Cie Generale des Etablissements Michelin SCA | 59,833 | 1,842 | ||||||
Credit Agricole | 22,471 | 278 | ||||||
Danone SA | 36,496 | 2,019 | ||||||
Eiffage SA | 5,270 | 502 | ||||||
Engie SA | 76,712 | 1,180 | ||||||
Euroapi * | 2,998 | 38 | ||||||
Eutelsat Communications SA (A) | 71,639 | 424 | ||||||
Hermes International SCA | 132 | 242 | ||||||
Legrand SA | 7,583 | 701 | ||||||
L'Oreal SA | 465 | 194 | ||||||
Metropole Television SA | 61,744 | 783 | ||||||
Orange SA | 368,164 | 4,233 | ||||||
Pernod Ricard SA | 2,108 | 352 | ||||||
Sanofi | 56,446 | 6,065 | ||||||
Societe BIC SA | 22,897 | 1,514 | ||||||
Thales SA, Cl A | 5,065 | 714 | ||||||
TotalEnergies SE | 22,396 | 1,477 | ||||||
Vivendi SE | 69,656 | 612 | ||||||
| 28,333 | ||||||||
Germany — 4.4% | ||||||||
Bayer AG | 31,044 | 1,494 | ||||||
Bayerische Motoren Werke AG | 2,582 | 264 | ||||||
Beiersdorf AG | 12,795 | 1,655 | ||||||
Deutsche Boerse AG | 2,569 | 445 | ||||||
Deutsche Post | 28,985 | 1,183 | ||||||
Deutsche Telekom AG | 155,073 | 3,262 | ||||||
E.ON SE | 10,939 | 130 | ||||||
Fresenius Medical Care AG & Co KGaA | 3,728 | 161 | ||||||
Hannover Rueck SE | 1,509 | 332 | ||||||
Henkel AG & Co KGaA | 3,258 | 206 | ||||||
Hornbach Holding AG & Co KGaA | 11,109 | 711 | ||||||
Knorr-Bremse AG | 2,220 | 141 | ||||||
Merck KGaA | 3,447 | 577 | ||||||
Muenchener Rueckversicherungs-Gesellschaft AG in Muenchen | 5,589 | 2,184 | ||||||
Siemens Healthineers AG | 2,446 | 124 | ||||||
Sirius Real Estate Ltd | 87,389 | 92 | ||||||
Suedzucker | 18,604 | 277 | ||||||
Talanx | 3,767 | 239 | ||||||
| 13,477 | ||||||||
Hong Kong — 3.3% | ||||||||
Bank of East Asia | 83,200 | 103 | ||||||
CK Asset Holdings Ltd | 364,000 | 1,912 | ||||||
CK Hutchison Holdings Ltd | 338,000 | 1,794 | ||||||
CK Infrastructure Holdings Ltd | 61,000 | 288 | ||||||
Description | Shares | Market Value | ||||||
COMMON STOCK (continued) | ||||||||
CLP Holdings Ltd, Cl B | 92,000 | $ | 679 | |||||
HK Electric Investments & HK Electric Investments Ltd | 639,000 | 366 | ||||||
HKT Trust & HKT Ltd | 324,000 | 338 | ||||||
Kerry Properties Ltd | 197,000 | 334 | ||||||
Link REIT ‡ | 68,400 | 334 | ||||||
MTR Corp Ltd | 33,500 | 132 | ||||||
Pacific Textiles Holdings | 656,000 | 135 | ||||||
PCCW Ltd | 579,704 | 264 | ||||||
Power Assets Holdings Ltd | 154,000 | 744 | ||||||
SmarTone Telecommunications Holdings Ltd | 328,500 | 166 | ||||||
VTech Holdings Ltd | 260,400 | 1,558 | ||||||
WH Group Ltd | 1,875,500 | 982 | ||||||
| 10,129 | ||||||||
Indonesia — 0.3% | ||||||||
First Resources | 797,000 | 893 | ||||||
Ireland — 0.1% | ||||||||
Glanbia | 26,450 | 437 | ||||||
Israel — 2.3% | ||||||||
Bank Hapoalim BM | 92,415 | 825 | ||||||
Bank Leumi Le-Israel BM | 78,198 | 649 | ||||||
Bezeq The Israeli Telecommunication Corp Ltd | 461,150 | 653 | ||||||
Check Point Software Technologies Ltd * | 17,915 | 2,388 | ||||||
Elbit Systems Ltd | 1,473 | 292 | ||||||
First International Bank Of Israel Ltd/The | 3,372 | 146 | ||||||
Kerur Holdings Ltd | 4,845 | 106 | ||||||
Mizrahi Tefahot Bank Ltd | 12,013 | 437 | ||||||
Nice ADR * | 3,036 | 516 | ||||||
Oil Refineries Ltd | 1,752,180 | 579 | ||||||
Radware Ltd * | 6,154 | 104 | ||||||
Shufersal Ltd * | 26,493 | 123 | ||||||
Tower Semiconductor Ltd * | 7,280 | 178 | ||||||
| 6,996 | ||||||||
Italy — 1.7% | ||||||||
A2A SpA | 582,186 | 1,039 | ||||||
ACEA SpA | 9,012 | 98 | ||||||
Assicurazioni Generali SpA | 15,478 | 317 | ||||||
Enel SpA | 61,229 | 377 | ||||||
Eni SpA | 87,471 | 1,413 | ||||||
Snam SpA | 134,161 | 632 | ||||||
Terna - Rete Elettrica Nazionale | 27,136 | 205 | ||||||
UnipolSai Assicurazioni | 507,575 | 1,229 | ||||||
| 5,310 | ||||||||
Japan — 26.0% | ||||||||
AEON Investment Corp ‡ | 489 | 480 | ||||||
Anritsu Corp | 35,400 | 253 | ||||||
Arcs Co Ltd | 38,800 | 708 | ||||||
Autobacs Seven Co Ltd | 9,200 | 98 | ||||||
156
SEI Institutional Managed Trust
Description | Shares | Market Value | ||||||
COMMON STOCK (continued) | ||||||||
Bandai Namco Holdings Inc | 6,900 | $ | 141 | |||||
Bridgestone | 26,900 | 1,051 | ||||||
Brother Industries Ltd | 51,100 | 825 | ||||||
Canon Inc | 117,800 | 2,846 | ||||||
Choushimaru Co Ltd | 10,500 | 102 | ||||||
Chubu Electric Power Co Inc | 63,100 | 806 | ||||||
Citizen Watch (A) | 85,000 | 524 | ||||||
Daicel Corp | 75,100 | 630 | ||||||
Daiichi Sankyo Co Ltd | 7,500 | 206 | ||||||
Daiki Aluminium Industry Co Ltd | 9,800 | 86 | ||||||
Daito Trust Construction Co Ltd | 1,700 | 179 | ||||||
DCM Holdings Co Ltd | 84,300 | 686 | ||||||
Earth Corp | 10,100 | 333 | ||||||
EDION Corp | 77,600 | 769 | ||||||
ENEOS Holdings Inc | 365,400 | 1,444 | ||||||
Ezaki Glico Co Ltd | 16,900 | 465 | ||||||
Fuji Nihon Seito | 7,600 | 53 | ||||||
Fujicco Co Ltd | 7,900 | 102 | ||||||
FUJIFILM Holdings Corp | 12,200 | 708 | ||||||
Heiwado Co Ltd | 7,900 | 138 | ||||||
Honda Motor Co Ltd | 114,600 | 1,292 | ||||||
House Foods Group Inc | 9,900 | 207 | ||||||
Hoya Corp | 1,500 | 154 | ||||||
Inpex Corp | 80,600 | 1,218 | ||||||
ITOCHU Corp | 62,600 | 2,268 | ||||||
Itochu Enex Co Ltd | 67,200 | 678 | ||||||
Itoham Yonekyu Holdings | 32,080 | 871 | ||||||
Japan Post Bank Co Ltd | 61,500 | 536 | ||||||
Japan Post Holdings Co Ltd | 182,800 | 1,467 | ||||||
Japan Post Insurance Co Ltd | 7,200 | 122 | ||||||
Japan Real Estate Investment Corp ‡ | 26 | 102 | �� | |||||
Japan Tobacco Inc | 123,900 | 2,856 | ||||||
Kajima Corp | 151,300 | 2,467 | ||||||
Kaken Pharmaceutical Co Ltd | 12,700 | 298 | ||||||
Kamigumi Co Ltd | 10,100 | 208 | ||||||
Kaneka Corp | 24,800 | 645 | ||||||
Kansai Electric Power Co Inc/The | 47,000 | 654 | ||||||
Kato Sangyo Co Ltd | 8,700 | 232 | ||||||
KDDI Corp | 85,500 | 2,622 | ||||||
Keihanshin Building Co Ltd | 14,200 | 131 | ||||||
Keisei Electric Railway | 4,674 | 162 | ||||||
Kewpie Corp | 18,100 | 292 | ||||||
Kinden Corp | 67,500 | 984 | ||||||
Kirin Holdings Co Ltd | 72,700 | 1,020 | ||||||
Kobayashi Pharmaceutical Co Ltd | 9,900 | 443 | ||||||
Komeri Co Ltd | 5,200 | 110 | ||||||
K's Holdings Corp | 103,300 | 950 | ||||||
Kuraray Co Ltd | 171,300 | 2,033 | ||||||
Kurimoto Ltd | 5,300 | 98 | ||||||
Kyorin Pharmaceutical | 8,100 | 99 | ||||||
Lawson Inc | 13,400 | 617 | ||||||
Lintec | 38,500 | 617 | ||||||
Description | Shares | Market Value | ||||||
COMMON STOCK (continued) | ||||||||
Lion Corp | 10,600 | $ | 105 | |||||
Marubeni Corp | 17,400 | 272 | ||||||
Maruichi Steel Tube Ltd | 4,400 | 110 | ||||||
McDonald's Holdings Co Japan Ltd | 6,600 | 253 | ||||||
Megmilk Snow Brand Co Ltd | 25,000 | 384 | ||||||
MEIJI Holdings Co Ltd | 40,500 | 1,009 | ||||||
MIRAIT ONE corp | 50,300 | 663 | ||||||
Mitsubishi Corp | 3,200 | 153 | ||||||
Mitsubishi Electric | 67,600 | 838 | ||||||
Mitsubishi Shokuhin Co Ltd | 23,100 | 604 | ||||||
Mitsubishi UFJ Financial Group | 205,800 | 1,749 | ||||||
Mitsui & Co Ltd | 28,400 | 1,032 | ||||||
Mitsui Chemicals Inc | 8,900 | 231 | ||||||
Mizuho Financial Group Inc | 181,080 | 3,083 | ||||||
Morinaga | 10,800 | 391 | ||||||
Morinaga Milk Industry Co Ltd | 3,000 | 113 | ||||||
Morishita Jintan Co Ltd | 10,900 | 174 | ||||||
MS&AD Insurance Group Holdings Inc | 47,700 | 1,756 | ||||||
NEC Corp | 6,400 | 354 | ||||||
Nichirei Corp | 6,500 | 143 | ||||||
Nippn Corp | 17,100 | 249 | ||||||
NIPPON EXPRESS HOLDINGS INC | 18,800 | 983 | ||||||
Nippon Kayaku | 11,300 | 95 | ||||||
Nippon Light Metal Holdings Co Ltd | 20,600 | 232 | ||||||
Nippon Telegraph & Telephone Corp | 2,763,500 | 3,270 | ||||||
Nippon Television Holdings | 80,400 | 815 | ||||||
Nisshin Seifun Group Inc | 55,700 | 711 | ||||||
Nissin Foods Holdings Co Ltd | 2,500 | 208 | ||||||
Niterra | 12,400 | 281 | ||||||
Nitto Fuji Flour Milling Co Ltd | 5,000 | 164 | ||||||
Oji Holdings Corp | 25,200 | 106 | ||||||
Okinawa Cellular Telephone Co | 6,200 | 134 | ||||||
Osaka Gas Co Ltd | 38,600 | 637 | ||||||
Otsuka Corp | 9,100 | 386 | ||||||
Otsuka Holdings Co Ltd | 16,600 | 591 | ||||||
Sankyo Co Ltd | 38,600 | 1,773 | ||||||
Sankyu | 20,900 | 724 | ||||||
Secom Co Ltd | 8,500 | 578 | ||||||
Seiko Epson Corp (A) | 40,500 | 638 | ||||||
Seino Holdings | 58,300 | 819 | ||||||
Sekisui Chemical Co Ltd | 5,700 | 82 | ||||||
Sekisui House Ltd | 47,600 | 950 | ||||||
Senko Group Holdings | 73,200 | 514 | ||||||
Shimizu Corp | 43,700 | 304 | ||||||
Showa Sangyo Co Ltd | 5,500 | 113 | ||||||
SoftBank Corp | 30,000 | 340 | ||||||
Sompo Holdings Inc | 2,400 | 103 | ||||||
Sugi Holdings Co Ltd | 4,400 | 175 | ||||||
Sumitomo Corp | 38,800 | 776 | ||||||
Sumitomo Heavy Industries | 33,900 | 861 | ||||||
Sumitomo Mitsui Financial Group Inc | 46,500 | 2,289 | ||||||
Sumitomo Mitsui Trust Holdings | 29,800 | 1,124 | ||||||
SEI Institutional Managed Trust
157
SCHEDULE OF INVESTMENTS
September 30, 2023
Tax-Managed International Managed Volatility Fund (Continued)
Description | Shares | Market Value | ||||||
COMMON STOCK (continued) | ||||||||
Sundrug Co Ltd | 23,400 | $ | 636 | |||||
Taisei Corp | 8,100 | 286 | ||||||
Takeda Pharmaceutical Co Ltd | 2,600 | 81 | ||||||
Techno Ryowa | 18,100 | 164 | ||||||
Teijin Ltd | 35,600 | 347 | ||||||
Toho Holdings Co Ltd | 5,000 | 107 | ||||||
TOPPAN Holdings | 5,800 | 139 | ||||||
Toyota Boshoku | 27,800 | 508 | ||||||
Trend Micro Inc/Japan | 10,300 | 391 | ||||||
USS Co Ltd | 18,000 | 298 | ||||||
Valor Holdings Co Ltd | 29,600 | 434 | ||||||
Yamada Denki Co Ltd | 239,100 | 736 | ||||||
Yamaguchi Financial Group | 92,500 | 812 | ||||||
Yamato Holdings Co Ltd | 10,600 | 173 | ||||||
Yamazaki Baking Co Ltd | 5,700 | 105 | ||||||
Zaoh | 8,700 | 148 | ||||||
| 79,893 | ||||||||
Jordan — 0.3% | ||||||||
Hikma Pharmaceuticals PLC | 40,058 | 1,021 | ||||||
Netherlands — 2.7% | ||||||||
ABN AMRO Bank NV | 11,695 | 166 | ||||||
Koninklijke Ahold Delhaize NV | 180,028 | 5,436 | ||||||
Koninklijke KPN NV | 143,332 | 473 | ||||||
NN Group NV | 37,509 | 1,209 | ||||||
Shell PLC | 3,555 | 115 | ||||||
Wolters Kluwer NV | 7,314 | 888 | ||||||
| 8,287 | ||||||||
New Zealand — 0.7% | ||||||||
Fisher & Paykel Healthcare Corp Ltd | 19,131 | 248 | ||||||
Fletcher Building Ltd | 104,623 | 295 | ||||||
Freightways Group | 23,121 | 113 | ||||||
Genesis Energy Ltd | 103,452 | 152 | ||||||
Mercury NZ Ltd | 109,078 | 400 | ||||||
Meridian Energy Ltd | 35,190 | 109 | ||||||
Spark New Zealand Ltd | 279,432 | 808 | ||||||
| 2,125 | ||||||||
Norway — 1.2% | ||||||||
DNB Bank ASA | 22,448 | 455 | ||||||
Equinor ASA | 19,060 | 629 | ||||||
Norsk Hydro ASA | 28,454 | 180 | ||||||
Olav Thon Eiendomsselskap ASA | 6,096 | 94 | ||||||
Orkla ASA | 235,293 | 1,769 | ||||||
SpareBank 1 SR-Bank | 17,208 | 198 | ||||||
Telenor ASA | 19,327 | 221 | ||||||
| 3,546 | ||||||||
Portugal — 1.0% | ||||||||
Jeronimo Martins SGPS SA | 71,566 | 1,611 | ||||||
NOS SGPS SA | 119,287 | 440 | ||||||
REN - Redes Energeticas Nacionais SGPS SA | 252,953 | 648 | ||||||
Description | Shares | Market Value | ||||||
COMMON STOCK (continued) | ||||||||
Sonae SGPS | 383,487 | $ | 373 | |||||
| 3,072 | ||||||||
Singapore — 4.4% | ||||||||
DBS Group Holdings Ltd | 108,700 | 2,679 | ||||||
Genting Singapore Ltd | 729,700 | 452 | ||||||
Jardine Cycle & Carriage Ltd | 111,500 | 2,608 | ||||||
Jardine Matheson Holdings Ltd | 16,800 | 780 | ||||||
Mapletree Logistics Trust ‡ | 154,270 | 190 | ||||||
Oversea-Chinese Banking Corp Ltd | 209,100 | 1,962 | ||||||
Sheng Siong Group Ltd | 383,000 | 427 | ||||||
Singapore Airlines Ltd | 52,300 | 248 | ||||||
Singapore Exchange Ltd | 86,000 | 614 | ||||||
Singapore Technologies Engineering Ltd | 276,200 | 791 | ||||||
Straits Trading | 74,500 | 108 | ||||||
United Overseas Bank Ltd | 89,200 | 1,863 | ||||||
Venture Corp Ltd | 88,300 | 800 | ||||||
| 13,522 | ||||||||
South Africa — 0.0% | ||||||||
Thungela Resources | 1,394 | 13 | ||||||
Spain — 2.2% | ||||||||
Acerinox | 47,448 | 460 | ||||||
Aena SME SA | 2,173 | 328 | ||||||
CaixaBank SA | 14,847 | 60 | ||||||
Cia de Distribucion Integral Logista Holdings SA | 90,492 | 2,319 | ||||||
Endesa SA | 25,772 | 526 | ||||||
Faes Farma | 56,056 | 190 | ||||||
Iberdrola SA | 59,519 | 668 | ||||||
Industria de Diseno Textil SA | 17,785 | 664 | ||||||
Redeia Corp SA | 10,044 | 158 | ||||||
Repsol SA, Cl A | 58,369 | 962 | ||||||
Telefonica SA | 87,372 | 358 | ||||||
| 6,693 | ||||||||
Sweden — 2.0% | ||||||||
Axfood AB | 21,817 | 503 | ||||||
Betsson, Cl B | 47,500 | 526 | ||||||
Epiroc, Cl B | 14,793 | 239 | ||||||
Essity AB, Cl B | 28,604 | 621 | ||||||
Industrivarden AB, Cl C | 25,423 | 675 | ||||||
Investor, Cl A | 30,576 | 584 | ||||||
KNOW IT AB | 7,589 | 89 | ||||||
Nordea Bank Abp, Cl A | 48,067 | 531 | ||||||
Nyfosa | 18,745 | 101 | ||||||
Securitas, Cl B | 69,432 | 554 | ||||||
Svenska Cellulosa AB SCA, Cl B | 11,438 | 158 | ||||||
Swedbank AB, Cl A | 32,836 | 608 | ||||||
Swedish Orphan Biovitrum AB * | 4,761 | 98 | ||||||
Telefonaktiebolaget LM Ericsson, Cl B | 39,170 | 192 | ||||||
Volvo AB, Cl B | 26,274 | 546 | ||||||
| 6,025 | ||||||||
158
SEI Institutional Managed Trust
Description | Shares | Market Value | ||||||
COMMON STOCK (continued) | ||||||||
Switzerland — 8.1% | ||||||||
ABB Ltd | 11,765 | $ | 422 | |||||
Alcon Inc | 3,282 | 254 | ||||||
ALSO Holding AG | 606 | 153 | ||||||
Baloise Holding AG | 7,522 | 1,093 | ||||||
Basellandschaftliche Kantonalbank | 201 | 195 | ||||||
Berner Kantonalbank AG | 473 | 125 | ||||||
BKW AG | 5,701 | 1,006 | ||||||
Chocoladefabriken Lindt & Spruengli AG | 74 | 824 | ||||||
EFG International | 25,425 | 289 | ||||||
Emmi AG | 591 | 558 | ||||||
EMS-Chemie Holding AG | 206 | 140 | ||||||
Helvetia Holding | 3,743 | 525 | ||||||
Holcim AG | 10,987 | 706 | ||||||
Kuehne + Nagel International AG | 328 | 94 | ||||||
Nestle SA | 10,269 | 1,165 | ||||||
Novartis AG | 54,952 | 5,639 | ||||||
PSP Swiss Property AG | 3,886 | 460 | ||||||
Roche Holding AG | 14,311 | 3,918 | ||||||
Romande Energie Holding | 1,900 | 116 | ||||||
Sika AG | 1,337 | 341 | ||||||
Sonova Holding AG | 3,097 | 737 | ||||||
Swatch Group AG/The | 1,962 | 96 | ||||||
Swiss Life Holding AG | 1,728 | 1,080 | ||||||
Swiss Prime Site AG | 3,598 | 330 | ||||||
Swisscom AG | 5,867 | 3,490 | ||||||
Thurgauer Kantonalbank | 927 | 124 | ||||||
TX Group AG | 559 | 56 | ||||||
Valiant Holding AG | 8,341 | 865 | ||||||
Vetropack Holding, Cl A | 3,654 | 162 | ||||||
Zurich Insurance Group AG | 226 | 104 | ||||||
| 25,067 | ||||||||
United Kingdom — 13.6% | ||||||||
3i Group | 18,195 | 460 | ||||||
AstraZeneca PLC ADR | 5,620 | 381 | ||||||
Atalaya Mining | 44,952 | 187 | ||||||
B&M European Value Retail SA | 189,317 | 1,355 | ||||||
BAE Systems PLC | 390,677 | 4,758 | ||||||
Balfour Beatty | 86,049 | 337 | ||||||
Bank of Georgia Group | 15,678 | 706 | ||||||
BP PLC | 235,524 | 1,528 | ||||||
British American Tobacco PLC | 43,064 | 1,355 | ||||||
BT Group PLC, Cl A | 650,300 | 926 | ||||||
Bunzl PLC | 27,294 | 975 | ||||||
Centamin | 91,997 | 94 | ||||||
Coca-Cola Europacific Partners PLC | 9,448 | 590 | ||||||
Computacenter PLC | 33,825 | 1,044 | ||||||
DCC PLC | 1,124 | 63 | �� | |||||
Diageo PLC | 12,148 | 450 | ||||||
Endeavour Mining | 6,795 | 132 | ||||||
Ferguson PLC | 3,272 | 542 | ||||||
Finsbury Food Group PLC | 134,390 | 180 | ||||||
Description | Shares | Market Value | ||||||
COMMON STOCK (continued) | ||||||||
GSK PLC | 217,541 | $ | 3,962 | |||||
Haleon PLC | 31,313 | 130 | ||||||
Howden Joinery Group PLC | 31,799 | 286 | ||||||
HSBC Holdings PLC | 99,862 | 786 | ||||||
Imperial Brands PLC | 127,280 | 2,590 | ||||||
Inchcape PLC | 24,346 | 225 | ||||||
J Sainsbury PLC | 577,505 | 1,782 | ||||||
Kingfisher PLC | 155,257 | 423 | ||||||
Land Securities Group PLC ‡ | 30,716 | 221 | ||||||
National Grid PLC | 23,951 | 286 | ||||||
Pearson PLC | 74,394 | 789 | ||||||
Premier Foods | 334,775 | 490 | ||||||
QinetiQ Group PLC | 391,128 | 1,522 | ||||||
Reckitt Benckiser Group PLC | 3,414 | 241 | ||||||
RELX PLC | 23,211 | 786 | ||||||
Sage Group PLC/The | 82,555 | 997 | ||||||
Serco Group | 253,401 | 461 | ||||||
Shell PLC | 80,736 | 2,568 | ||||||
Smith & Nephew PLC | 8,186 | 102 | ||||||
Standard Chartered PLC | 15,772 | 146 | ||||||
Tate & Lyle | 7,110 | 59 | ||||||
Tesco PLC | 736,784 | 2,376 | ||||||
Unilever PLC | 58,454 | 2,898 | ||||||
United Utilities Group PLC, Cl B | 8,064 | 93 | ||||||
Vodafone Group PLC | 1,379,779 | 1,294 | ||||||
Woodside Energy Group | 5,009 | 116 | ||||||
YouGov | 8,551 | 78 | ||||||
| 41,770 | ||||||||
United States — 0.2% | ||||||||
Ferguson PLC | 1,744 | 287 | ||||||
GSK PLC ADR | 9,074 | 329 | ||||||
Taro Pharmaceutical Industries Ltd * | 2,666 | 100 | ||||||
| 716 | ||||||||
Total Common Stock | ||||||||
(Cost $247,213) ($ Thousands) | 298,565 | |||||||
PREFERRED STOCK — 0.7% | ||||||||
Germany — 0.7% | ||||||||
Henkel AG & Co KGaA (B) | 30,256 | 2,161 | ||||||
Total Preferred Stock | ||||||||
(Cost $1,993) ($ Thousands) | 2,161 | |||||||
SEI Institutional Managed Trust
159
SCHEDULE OF INVESTMENTS
September 30, 2023
Tax-Managed International Managed Volatility Fund (Concluded)
Description | Number of Rights | Market Value | ||||||
RIGHT — 0.0% | ||||||||
Australia — 0.0% | ||||||||
Abacus Property Group *‡‡ | 40,372 | $ | – | |||||
Total Right | ||||||||
(Cost $—) ($ Thousands) | – | |||||||
| ||||||||
AFFILIATED PARTNERSHIP — 0.8% | ||||||||
SEI Liquidity Fund, LP | ||||||||
5.410% **†(C) | 2,587,671 | 2,591 | ||||||
Total Affiliated Partnership | ||||||||
(Cost $2,588) ($ Thousands) | 2,591 | |||||||
CASH EQUIVALENT — 0.4% | ||||||||
SEI Daily Income Trust, Government Fund, Institutional Class | ||||||||
5.210%**† | 1,095,896 | 1,096 | ||||||
Total Cash Equivalent | ||||||||
(Cost $1,096) ($ Thousands) | 1,096 | |||||||
Total Investments in Securities — 98.9% | ||||||||
(Cost $252,890) ($ Thousands) | $ | 304,413 | ||||||
160
SEI Institutional Managed Trust
A list of the open futures contracts held by the Fund at September 30, 2023, is as follows:
Type of Contract | Number of | Expiration Date | Notional Amount (Thousands) | Value | Unrealized Appreciation/ | |||||||||||||||
Long Contracts | ||||||||||||||||||||
Euro STOXX 50 | 7 | Dec-2023 | $ | 314 | $ | 311 | $ | (1 | ) | |||||||||||
FTSE 100 Index | 2 | Dec-2023 | 188 | 187 | 2 | |||||||||||||||
Hang Seng Index | 1 | Oct-2023 | 112 | 114 | 2 | |||||||||||||||
SPI 200 Index | 2 | Dec-2023 | 227 | 229 | 1 | |||||||||||||||
TOPIX Index | 1 | Dec-2023 | 159 | 156 | (3 | ) | ||||||||||||||
| $ | 1,000 | $ | 997 | $ | 1 | |||||||||||||||
| Percentages are based on Net Assets of $307,731 ($ Thousands). |
* | Non-income producing security. |
** | The rate reported is the 7-day effective yield as of September 30, 2023. |
‡ | Real Estate Investment Trust. |
‡‡ | Expiration date not available. |
† | Investment in Affiliated Security (see Note 6). |
(A) | Certain securities or partial positions of certain securities are on loan at September 30, 2023. |
(B) | No interest rate available. |
(C) | This security was purchased with cash collateral held from securities on loan (see Note 12). The total market value of such securities as of September 30, 2023 was $2,591 ($ Thousands). |
The following is a summary of the level of inputs used as of September 30, 2023, in valuing the Fund's investments and other financial instruments carried at value ($ Thousands): | ||||||||||||||||
Investments in Securities | Level 1 | Level 2 | Level 3 | Total | ||||||||||||
Common Stock | 284,720 | 13,845 | — | 298,565 | ||||||||||||
Preferred Stock | 2,161 | — | — | 2,161 | ||||||||||||
Right | — | — | — | ^ | — | |||||||||||
Affiliated Partnership | — | 2,591 | — | 2,591 | ||||||||||||
Cash Equivalent | 1,096 | — | — | 1,096 | ||||||||||||
Total Investments in Securities | 287,977 | 16,436 | — | 304,413 | ||||||||||||
Other Financial Instruments | Level 1 | Level 2 | Level 3 | Total | ||||||||||||
Futures Contracts* | ||||||||||||||||
Unrealized Appreciation | 5 | – | – | 5 | ||||||||||||
Unrealized Depreciation | (4 | ) | – | – | (4 | ) | ||||||||||
Total Other Financial Instruments | 1 | – | – | 1 | ||||||||||||
^ This category includes securities with a value less than $500.
* | Futures contracts are valued at unrealized appreciation (depreciation) on the instrument. |
For more information on valuation inputs, see Note 2 — Significant Accounting Policies in Notes to Financial Statements.
The following is a summary of the Fund’s transactions with affiliates for the year ended September 30, 2023 ($ Thousands):
Security Description | Value | Purchases | Proceeds | Realized Gain/(Loss) | Change in Unrealized Appreciation/(Depreciation) | Value | Income | Capital Gains | ||||||||||||||||||||||||
SEI Liquidity Fund, LP | $ | 18,526 | $ | 83,760 | $ | (99,701 | ) | $ | 3 | $ | 3 | $ | 2,591 | $ | 79 | $ | — | |||||||||||||||
SEI Daily Income Trust, Government Fund, | 2,754 | 55,866 | (57,524 | ) | — | — | 1,096 | 159 | — | |||||||||||||||||||||||
Totals | $ | 21,280 | $ | 139,626 | $ | (157,225 | ) | $ | 3 | $ | 3 | $ | 3,687 | $ | 238 | $ | — | |||||||||||||||
Amounts designated as “—” are either $0 or have been rounded to $0.
See “Glossary” for abbreviations.
The accompanying notes are an integral part of the financial statements.
SEI Institutional Managed Trust
161
SCHEDULE OF INVESTMENTS
September 30, 2023
Real Estate Fund
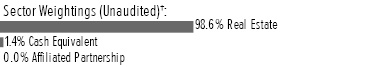
† | Percentages are based on total investments. Total investments do not include derivatives such as options, futures contracts, forward contracts, and swap contracts, if applicable. |
Description | Shares | Market Value | ||||||
COMMON STOCK†† — 98.5% | ||||||||
Real Estate — 98.5% | ||||||||
Acadia Realty Trust ‡ | 8,260 | $ | 119 | |||||
Alexandria Real Estate Equities Inc ‡ | 16,260 | 1,628 | ||||||
American Homes 4 Rent, Cl A ‡ | 33,006 | 1,112 | ||||||
American Tower Corp, Cl A ‡ | 11,770 | 1,936 | ||||||
AvalonBay Communities Inc ‡ | 15,050 | 2,585 | ||||||
Boston Properties Inc ‡ | 20,230 | 1,203 | ||||||
Brixmor Property Group Inc ‡ | 53,440 | 1,110 | ||||||
CareTrust REIT Inc ‡ | 28,110 | 576 | ||||||
Cousins Properties Inc ‡ | 40,510 | 825 | ||||||
DiamondRock Hospitality Co ‡ | 53,800 | 432 | ||||||
Digital Realty Trust Inc, Cl A ‡ | 30,010 | 3,632 | ||||||
Douglas Emmett Inc ‡ | 53,359 | 681 | ||||||
Elme Communities ‡ | 28,826 | 393 | ||||||
Equinix Inc ‡ | 8,235 | 5,981 | ||||||
Equity Residential ‡ | 47,943 | 2,815 | ||||||
Extra Space Storage Inc ‡ | 26,479 | 3,219 | ||||||
First Industrial Realty Trust Inc ‡ | 36,670 | 1,745 | ||||||
Healthpeak Properties Inc ‡ | 79,580 | 1,461 | ||||||
Highwoods Properties Inc ‡ | 10,950 | 226 | ||||||
Host Hotels & Resorts Inc ‡ | 96,080 | 1,544 | ||||||
Independence Realty Trust Inc ‡ | 10,923 | 154 | ||||||
Invitation Homes Inc ‡ | 65,390 | 2,072 | ||||||
Kilroy Realty Corp ‡ | 22,150 | 700 | ||||||
Kimco Realty Corp ‡ | 93,740 | 1,649 | ||||||
Medical Properties Trust Inc ‡ | 47,933 | 261 | ||||||
Mid-America Apartment Communities Inc ‡ | 5,220 | 672 | ||||||
Omega Healthcare Investors Inc ‡ | 27,860 | 924 | ||||||
Prologis Inc ‡ | 60,210 | 6,756 | ||||||
Public Storage ‡ | 10,080 | 2,656 | ||||||
Retail Opportunity Investments Corp ‡ | 55,209 | 683 | ||||||
Rexford Industrial Realty Inc ‡ | 32,940 | 1,626 | ||||||
RPT Realty ‡ | 46,255 | 488 | ||||||
SBA Communications Corp, Cl A ‡ | 5,800 | 1,161 | ||||||
Simon Property Group Inc ‡ | 22,636 | 2,445 | ||||||
Sun Communities Inc ‡ | 19,950 | 2,361 | ||||||
Tricon Residential Inc | 99,350 | 735 | ||||||
UDR Inc ‡ | 49,734 | 1,774 | ||||||
Urban Edge Properties ‡ | 28,180 | 430 | ||||||
Ventas Inc ‡ | 62,800 | 2,646 | ||||||
Welltower Inc ‡ | 39,030 | 3,197 | ||||||
Description | Shares | Market Value | ||||||
COMMON STOCK†† (continued) | ||||||||
Xenia Hotels & Resorts Inc ‡ | 44,673 | $ | 526 | |||||
Total Common Stock | ||||||||
(Cost $59,885) ($ Thousands) | 67,139 | |||||||
AFFILIATED PARTNERSHIP — 0.0% | ||||||||
SEI Liquidity Fund, LP | ||||||||
5.410% **†(A) | 4,714 | 4 | ||||||
Total Affiliated Partnership | ||||||||
(Cost $5) ($ Thousands) | 4 | |||||||
CASH EQUIVALENT — 1.4% | ||||||||
SEI Daily Income Trust, Government Fund, Institutional Class | ||||||||
5.210%**† | 973,227 | 973 | ||||||
Total Cash Equivalent | ||||||||
(Cost $973) ($ Thousands) | 973 | |||||||
Total Investments in Securities — 99.9% | ||||||||
(Cost $60,863) ($ Thousands) | $ | 68,116 | ||||||
162
SEI Institutional Managed Trust
| Percentages are based on Net Assets of $68,206 ($ Thousands). |
** | The rate reported is the 7-day effective yield as of September 30, 2023. |
‡ | Real Estate Investment Trust. |
† | Investment in Affiliated Security (see Note 6). |
†† | Narrow industries are utilized for compliance purposes, whereas broad sectors are utilized for reporting. |
(A) | This security was purchased with cash collateral held from securities on loan (see Note 12). The total market value of such securities as of September 30, 2023 was $4 ($ Thousands). |
The following is a summary of the level of inputs used as of September 30, 2023, in valuing the Fund's investments and other financial instruments carried at value ($ Thousands): | ||||||||||||||||
Investments in Securities | Level 1 | Level 2 | Level 3 | Total | ||||||||||||
Common Stock | 67,139 | – | – | 67,139 | ||||||||||||
Affiliated Partnership | – | 4 | – | 4 | ||||||||||||
Cash Equivalent | 973 | – | – | 973 | ||||||||||||
Total Investments in Securities | 68,112 | 4 | – | 68,116 | ||||||||||||
For more information on valuation inputs, see Note 2 – Significant Accounting Policies in Notes to Financial Statements.
The following is a summary of the Fund’s transactions with affiliates for the year ended September 30, 2023 ($ Thousands):
Security Description | Value 9/30/2022 | Purchases at Cost | Proceeds from Sales | Realized Gain/ (Loss) | Change in Unrealized Appreciation/ (Depreciation) | Value 9/30/2023 | Income | Capital Gains | ||||||||||||||||||||||||
SEI Liquidity Fund, LP | $ | 3 | $ | 1 | $ | — | $ | — | $ | — | $ | 4 | $ | — | $ | — | ||||||||||||||||
SEI Daily Income Trust, Government Fund, Institutional Class | 2,110 | 18,167 | (19,304 | ) | — | — | 973 | 45 | — | |||||||||||||||||||||||
Totals | $ | 2,113 | $ | 18,168 | $ | (19,304 | ) | $ | — | $ | — | $ | 977 | $ | 45 | $ | — | |||||||||||||||
Amounts designated as “-” are either $0 or have been rounded to be $0.
See “Glossary” for abbreviations.
The accompanying notes are an integral part of the financial statements.
SEI Institutional Managed Trust
163
SCHEDULE OF INVESTMENTS
September 30, 2023
Core Fixed Income Fund
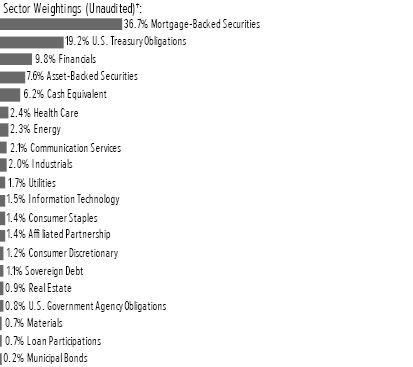
† | Percentages are based on total investments. Total investments do not include derivatives such as options, futures contracts, forward contracts, and swap contracts, if applicable. |
Description | Face Amount | Market Value | ||||||
MORTGAGE-BACKED SECURITIES — 42.7% | ||||||||
Agency Mortgage-Backed Obligations — 37.6% | ||||||||
FHLMC | ||||||||
7.500%, 05/01/2031 to 02/01/2038 | $ | 182 | $ | 184 | ||||
7.000%, 05/01/2024 to 03/01/2039 | 48 | 51 | ||||||
6.500%, 10/01/2031 to 07/01/2053 | 5,244 | 5,284 | ||||||
6.000%, 02/01/2032 to 06/01/2053 | 1,861 | 1,843 | ||||||
5.500%, 01/01/2024 to 07/01/2053 | 8,721 | 8,441 | ||||||
5.000%, 05/01/2033 to 06/01/2053 | 8,658 | 8,229 | ||||||
4.600%, 02/01/2030 | 400 | 379 | ||||||
4.500%, 04/01/2035 to 12/01/2052 | 9,534 | 8,881 | ||||||
4.000%, 08/01/2041 to 02/01/2053 | 14,243 | 12,918 | ||||||
3.500%, 12/01/2033 to 06/01/2052 | 27,937 | 24,605 | ||||||
3.000%, 03/01/2031 to 06/01/2052 | 34,546 | 29,109 | ||||||
2.500%, 10/01/2031 to 05/01/2052 | 68,480 | 55,181 | ||||||
2.000%, 06/01/2040 to 05/01/2052 | 63,472 | 49,535 | ||||||
1.500%, 11/01/2040 to 05/01/2051 | 16,939 | 12,471 | ||||||
0.000%, 07/15/2031(A) | 265 | 180 | ||||||
FHLMC ARM | ||||||||
7.136%, RFUCCT1Y + 1.605%, 09/01/2043(B) | 40 | 40 | ||||||
7.042%, RFUCCT1Y + 1.650%, 03/01/2043(B) | 64 | 64 | ||||||
6.881%, RFUCCT1Y + 1.635%, 07/01/2043(B) | 39 | 40 | ||||||
6.835%, RFUCCT1Y + 1.637%, 09/01/2045(B) | 619 | 622 | ||||||
6.809%, RFUCCT1Y + 1.642%, 08/01/2043(B) | 62 | 62 | ||||||
Description | Face Amount | Market Value | ||||||
MORTGAGE-BACKED SECURITIES (continued) | ||||||||
6.339%, RFUCCT1Y + 1.683%, 02/01/2043(B) | $ | 105 | $ | 106 | ||||
6.233%, RFUCCT1Y + 1.770%, 09/01/2042(B) | 70 | 71 | ||||||
6.091%, RFUCCT1Y + 1.642%, 10/01/2043(B) | 78 | 78 | ||||||
6.016%, RFUCCT1Y + 1.724%, 01/01/2044(B) | 147 | 148 | ||||||
5.769%, RFUCCT1Y + 1.611%, 10/01/2043(B) | 77 | 79 | ||||||
5.551%, RFUCCT1Y + 1.687%, 09/01/2047(B) | 430 | 430 | ||||||
5.427%, RFUCCT1Y + 1.637%, 04/01/2048(B) | 896 | 898 | ||||||
5.407%, RFUCCT1Y + 1.628%, 11/01/2043(B) | 62 | 62 | ||||||
5.235%, SOFR30A + 2.293%, 06/01/2053(B) | 323 | 316 | ||||||
5.120%, SOFR30A + 2.216%, 08/01/2053(B) | 312 | 304 | ||||||
5.023%, RFUCCT1Y + 1.637%, 03/01/2049(B) | 364 | 363 | ||||||
4.299%, SOFR30A + 2.130%, 07/01/2052(B) | 480 | 454 | ||||||
4.189%, SOFR30A + 2.304%, 05/01/2053(B) | 1,482 | 1,411 | ||||||
4.123%, SOFR30A + 2.380%, 09/01/2052(B) | 274 | 258 | ||||||
4.118%, SOFR30A + 2.191%, 10/01/2052(B) | 3,421 | 3,154 | ||||||
3.986%, SOFR30A + 2.140%, 08/01/2052(B) | 554 | 508 | ||||||
3.913%, SOFR30A + 2.130%, 07/01/2052(B) | 406 | 380 | ||||||
3.137%, RFUCCT1Y + 1.640%, 11/01/2048(B) | 440 | 424 | ||||||
3.097%, RFUCCT1Y + 1.621%, 02/01/2050(B) | 221 | 209 | ||||||
3.005%, RFUCCT1Y + 1.628%, 11/01/2048(B) | 1,228 | 1,138 | ||||||
2.895%, RFUCCT1Y + 1.640%, 05/01/2049(B) | 267 | 262 | ||||||
2.871%, RFUCCT1Y + 1.619%, 11/01/2047(B) | 416 | 394 | ||||||
FHLMC CMO, Ser 1997-1983, Cl Z | ||||||||
6.500%, 12/15/2023 | 2 | 2 | ||||||
FHLMC CMO, Ser 2001-2277, Cl B | ||||||||
7.500%, 01/15/2031 | 16 | 17 | ||||||
FHLMC CMO, Ser 2002-2399, Cl XG | ||||||||
6.500%, 01/15/2032 | 143 | 144 | ||||||
FHLMC CMO, Ser 2006-R007, Cl ZA | ||||||||
6.000%, 05/15/2036 | 403 | 409 | ||||||
164
SEI Institutional Managed Trust
Description | Face Amount | Market Value | ||||||
MORTGAGE-BACKED SECURITIES (continued) | ||||||||
FHLMC CMO, Ser 2007-3281, Cl AI, IO | ||||||||
1.002%, 02/15/2037(B) | $ | 31 | $ | 2 | ||||
FHLMC CMO, Ser 2007-3294, Cl CB | ||||||||
5.500%, 03/15/2037 | 86 | 85 | ||||||
FHLMC CMO, Ser 2007-3316, Cl JO, PO | ||||||||
0.000%, 05/15/2037(A) | 1 | 1 | ||||||
FHLMC CMO, Ser 2008-3451, Cl SB, IO | ||||||||
0.602%, 05/15/2038(B) | 4 | – | ||||||
FHLMC CMO, Ser 2010-3621, Cl SB, IO | ||||||||
0.802%, 01/15/2040(B) | 22 | 2 | ||||||
FHLMC CMO, Ser 2011-3924, Cl NC | ||||||||
4.000%, 09/15/2041 | 434 | 406 | ||||||
FHLMC CMO, Ser 2011-3947, Cl SG, IO | ||||||||
0.522%, 10/15/2041(B) | 177 | 12 | ||||||
FHLMC CMO, Ser 2012-264, Cl 30 | ||||||||
3.000%, 07/15/2042 | 864 | 756 | ||||||
FHLMC CMO, Ser 2012-271, Cl 30 | ||||||||
3.000%, 08/15/2042 | 230 | 203 | ||||||
FHLMC CMO, Ser 2012-271, Cl F5 | ||||||||
5.928%, SOFR30A + 0.614%, 08/15/2042(B) | 284 | 276 | ||||||
FHLMC CMO, Ser 2012-272, Cl F1 | ||||||||
5.928%, SOFR30A + 0.614%, 08/15/2042(B) | 448 | 434 | ||||||
FHLMC CMO, Ser 2012-280, Cl F1 | ||||||||
5.928%, SOFR30A + 0.614%, 09/15/2042(B) | 458 | 443 | ||||||
FHLMC CMO, Ser 2012-283, Cl IO, IO | ||||||||
3.500%, 10/15/2027 | 105 | 4 | ||||||
FHLMC CMO, Ser 2012-4047, Cl CX | ||||||||
3.500%, 05/15/2042 | 821 | 716 | ||||||
FHLMC CMO, Ser 2012-4054, Cl SA, IO | ||||||||
0.622%, 08/15/2039(B) | 332 | 20 | ||||||
FHLMC CMO, Ser 2012-4091, Cl EX | ||||||||
3.375%, 07/15/2042 | 290 | 260 | ||||||
FHLMC CMO, Ser 2012-4117, Cl HB | ||||||||
2.500%, 10/15/2042 | 283 | 233 | ||||||
FHLMC CMO, Ser 2012-4122, Cl FP | ||||||||
5.828%, SOFR30A + 0.514%, 10/15/2042(B) | 331 | 320 | ||||||
FHLMC CMO, Ser 2012-4146, Cl DI, IO | ||||||||
3.000%, 12/15/2031 | 222 | 11 | ||||||
FHLMC CMO, Ser 2013-4194, Cl BI, IO | ||||||||
3.500%, 04/15/2043 | 47 | 8 | ||||||
FHLMC CMO, Ser 2013-4203, Cl PS, IO | ||||||||
0.822%, 09/15/2042(B) | 169 | 11 | ||||||
FHLMC CMO, Ser 2013-4205, Cl PA | ||||||||
1.750%, 05/15/2043 | 285 | 233 | ||||||
FHLMC CMO, Ser 2013-4210, Cl Z | ||||||||
3.000%, 05/15/2043 | 72 | 54 | ||||||
FHLMC CMO, Ser 2013-4239, Cl IO, IO | ||||||||
3.500%, 06/15/2027 | 62 | 2 | ||||||
Description | Face Amount | Market Value | ||||||
MORTGAGE-BACKED SECURITIES (continued) | ||||||||
FHLMC CMO, Ser 2013-4240, Cl FA | ||||||||
5.928%, SOFR30A + 0.614%, 08/15/2043(B) | $ | 839 | $ | 812 | ||||
FHLMC CMO, Ser 2013-4248, Cl FT | ||||||||
5.928%, SOFR30A + 0.614%, 09/15/2043(B) | 288 | 280 | ||||||
FHLMC CMO, Ser 2013-4286, Cl VF | ||||||||
5.878%, SOFR30A + 0.564%, 12/15/2043(B) | 612 | 593 | ||||||
FHLMC CMO, Ser 2014-328, Cl S4, IO | ||||||||
0.074%, 02/15/2038(B) | 10 | – | ||||||
FHLMC CMO, Ser 2014-4335, Cl SW, IO | ||||||||
0.572%, 05/15/2044(B) | 36 | 3 | ||||||
FHLMC CMO, Ser 2014-4391, Cl MZ | ||||||||
3.000%, 09/15/2044 | 131 | 108 | ||||||
FHLMC CMO, Ser 2014-4415, Cl IO, IO | ||||||||
0.212%, 04/15/2041(B) | 109 | 5 | ||||||
FHLMC CMO, Ser 2015-4446, Cl CP | ||||||||
2.250%, 03/15/2045 | 390 | 330 | ||||||
FHLMC CMO, Ser 2015-4479, Cl HA | ||||||||
3.750%, 05/15/2039(C) | 54 | 54 | ||||||
FHLMC CMO, Ser 2016-353, Cl S1, IO | ||||||||
0.572%, 12/15/2046(B) | 254 | 20 | ||||||
FHLMC CMO, Ser 2016-4582, Cl HA | ||||||||
3.000%, 09/15/2045 | 1,427 | 1,281 | ||||||
FHLMC CMO, Ser 2016-4614, Cl FG | ||||||||
5.928%, SOFR30A + 0.614%, 09/15/2046(B) | 328 | 317 | ||||||
FHLMC CMO, Ser 2016-4628, Cl KF | ||||||||
5.928%, SOFR30A + 0.614%, 01/15/2055(B) | 404 | 384 | ||||||
FHLMC CMO, Ser 2016-4631, Cl FA | ||||||||
5.928%, SOFR30A + 0.614%, 11/15/2046(B) | 552 | 532 | ||||||
FHLMC CMO, Ser 2016-4639, Cl HZ | ||||||||
3.250%, 04/15/2053(C) | 1,877 | 1,366 | ||||||
FHLMC CMO, Ser 2017-356, Cl 300 | ||||||||
3.000%, 09/15/2047 | 1,185 | 1,020 | ||||||
FHLMC CMO, Ser 2017-4719, Cl LA | ||||||||
3.500%, 09/15/2047 | 406 | 362 | ||||||
FHLMC CMO, Ser 2017-4719, Cl LM | ||||||||
3.000%, 09/15/2047 | 324 | 279 | ||||||
FHLMC CMO, Ser 2017-4742, Cl PA | ||||||||
3.000%, 10/15/2047 | 858 | 747 | ||||||
FHLMC CMO, Ser 2018-4793, Cl FD | ||||||||
5.728%, SOFR30A + 0.414%, 06/15/2048(B) | 127 | 121 | ||||||
FHLMC CMO, Ser 2018-4813, Cl CJ | ||||||||
3.000%, 08/15/2048 | 181 | 153 | ||||||
FHLMC CMO, Ser 2018-4818, Cl CA | ||||||||
3.000%, 04/15/2048 | 406 | 349 | ||||||
SEI Institutional Managed Trust
165
SCHEDULE OF INVESTMENTS
September 30, 2023
Core Fixed Income Fund (Continued)
Description | Face Amount | Market Value | ||||||
MORTGAGE-BACKED SECURITIES (continued) | ||||||||
FHLMC CMO, Ser 2018-4826, Cl KF | ||||||||
5.728%, SOFR30A + 0.414%, 09/15/2048(B) | $ | 264 | $ | 252 | ||||
FHLMC CMO, Ser 2018-4846, Cl PA | ||||||||
4.000%, 06/15/2047 | 33 | 32 | ||||||
FHLMC CMO, Ser 2018-4857, Cl JA | ||||||||
3.350%, 01/15/2049 | 1,317 | 1,210 | ||||||
FHLMC CMO, Ser 2019-4880, Cl DA | ||||||||
3.000%, 05/15/2050 | 587 | 513 | ||||||
FHLMC CMO, Ser 2019-4903, Cl NF | ||||||||
5.829%, SOFR30A + 0.514%, 08/25/2049(B) | 256 | 247 | ||||||
FHLMC CMO, Ser 2019-4927, Cl BG | ||||||||
3.000%, 11/25/2049 | 554 | 481 | ||||||
FHLMC CMO, Ser 2019-4937, Cl MD | ||||||||
2.500%, 10/25/2049 | 566 | 478 | ||||||
FHLMC CMO, Ser 2019-4941, Cl GA | ||||||||
2.000%, 12/15/2047 | 317 | 255 | ||||||
FHLMC CMO, Ser 2020-4979, Cl UC | ||||||||
1.500%, 06/25/2050 | 1,022 | 792 | ||||||
FHLMC CMO, Ser 2020-4991, Cl QV | ||||||||
2.000%, 09/25/2045 | 280 | 215 | ||||||
FHLMC CMO, Ser 2020-4993, Cl KF | ||||||||
5.879%, SOFR30A + 0.564%, 07/25/2050(B) | 2,336 | 2,229 | ||||||
FHLMC CMO, Ser 2020-4995, Cl IC, IO | ||||||||
4.500%, 07/25/2050 | 712 | 117 | ||||||
FHLMC CMO, Ser 2020-5004, Cl FM | ||||||||
5.779%, SOFR30A + 0.464%, 08/25/2050(B) | 496 | 470 | ||||||
FHLMC CMO, Ser 2020-5010, Cl JI, IO | ||||||||
2.500%, 09/25/2050 | 711 | 108 | ||||||
FHLMC CMO, Ser 2020-5010, Cl IK, IO | ||||||||
2.500%, 09/25/2050 | 264 | 39 | ||||||
FHLMC CMO, Ser 2020-5012, Cl BI, IO | ||||||||
4.000%, 09/25/2050 | 2,654 | 483 | ||||||
FHLMC CMO, Ser 2020-5013, Cl IN, IO | ||||||||
2.500%, 09/25/2050 | 321 | 50 | ||||||
FHLMC CMO, Ser 2020-5018, Cl MI, IO | ||||||||
2.000%, 10/25/2050 | 499 | 65 | ||||||
FHLMC CMO, Ser 2020-5020, Cl ET | ||||||||
3.500%, 10/25/2050 | 451 | 396 | ||||||
FHLMC CMO, Ser 2020-5040, Cl IB, IO | ||||||||
2.500%, 11/25/2050 | 141 | 24 | ||||||
FHLMC CMO, Ser 2020-5059, Cl IB, IO | ||||||||
2.500%, 01/25/2051 | 670 | 105 | ||||||
FHLMC CMO, Ser 2021-5070, Cl DI, IO | ||||||||
4.000%, 02/25/2051 | 2,258 | 416 | ||||||
FHLMC CMO, Ser 2021-5071, Cl IH, IO | ||||||||
2.500%, 02/25/2051 | 495 | 65 | ||||||
FHLMC CMO, Ser 2021-5085, Cl NI, IO | ||||||||
2.000%, 03/25/2051 | 1,019 | 117 | ||||||
Description | Face Amount | Market Value | ||||||
MORTGAGE-BACKED SECURITIES (continued) | ||||||||
FHLMC CMO, Ser 2021-5091, Cl AB | ||||||||
1.500%, 03/25/2051 | $ | 959 | $ | 736 | ||||
FHLMC CMO, Ser 2021-5092, Cl AP | ||||||||
2.000%, 04/25/2041 | 397 | 331 | ||||||
FHLMC CMO, Ser 2021-5116, Cl PB | ||||||||
2.250%, 02/25/2051 | 579 | 473 | ||||||
FHLMC CMO, Ser 2021-5118, Cl CA | ||||||||
1.500%, 10/15/2033 | 473 | 399 | ||||||
FHLMC CMO, Ser 2021-5119, Cl AB | ||||||||
1.500%, 08/25/2049 | 435 | 332 | ||||||
FHLMC CMO, Ser 2021-5119, Cl QF | ||||||||
5.515%, SOFR30A + 0.200%, 06/25/2051(B) | 710 | 664 | ||||||
FHLMC CMO, Ser 2021-5140, Cl NI, IO | ||||||||
2.500%, 05/25/2049 | 966 | 138 | ||||||
FHLMC CMO, Ser 2021-5143, Cl GA | ||||||||
2.000%, 06/25/2049 | 355 | 276 | ||||||
FHLMC CMO, Ser 2021-5156, Cl DC | ||||||||
2.000%, 09/25/2051 | 611 | 500 | ||||||
FHLMC CMO, Ser 2021-5159, Cl UA | ||||||||
2.500%, 12/25/2048 | 602 | 510 | ||||||
FHLMC CMO, Ser 2021-5178, Cl TP | ||||||||
2.500%, 04/25/2049 | 811 | 679 | ||||||
FHLMC CMO, Ser 2021-5182, Cl M | ||||||||
2.500%, 05/25/2049 | 511 | 429 | ||||||
FHLMC CMO, Ser 2021-5182, Cl D | ||||||||
2.500%, 11/25/2043 | 2,410 | 2,115 | ||||||
FHLMC CMO, Ser 2021-5184, Cl AB | ||||||||
2.500%, 05/25/2048 | 353 | 299 | ||||||
FHLMC CMO, Ser 2022-5194, Cl G | ||||||||
2.500%, 01/25/2051 | 684 | 547 | ||||||
FHLMC CMO, Ser 2022-5201, Cl CA | ||||||||
2.500%, 07/25/2048 | 746 | 640 | ||||||
FHLMC CMO, Ser 2022-5202, Cl BH | ||||||||
2.000%, 12/25/2047 | 386 | 337 | ||||||
FHLMC CMO, Ser 2022-5202, Cl IN, IO | ||||||||
3.000%, 01/25/2047 | 746 | 100 | ||||||
FHLMC CMO, Ser 2022-5202, Cl LA | ||||||||
2.500%, 05/25/2049 | 737 | 621 | ||||||
FHLMC CMO, Ser 2022-5203, Cl G | ||||||||
2.500%, 11/25/2048 | 327 | 275 | ||||||
FHLMC CMO, Ser 2022-5207, Cl PA | ||||||||
3.000%, 06/25/2051 | 753 | 640 | ||||||
FHLMC CMO, Ser 2022-5217, Cl CD | ||||||||
2.500%, 07/25/2049 | 627 | 554 | ||||||
FHLMC CMO, Ser 2022-5220, Cl QK | ||||||||
3.500%, 09/25/2050 | 1,106 | 1,013 | ||||||
FHLMC CMO, Ser 2022-5224, Cl HL | ||||||||
4.000%, 04/25/2052 | 2,100 | 1,787 | ||||||
FHLMC CMO, Ser 2023-5300, Cl C | ||||||||
2.000%, 09/25/2047 | 971 | 871 | ||||||
166
SEI Institutional Managed Trust
Description | Face Amount | Market Value | ||||||
MORTGAGE-BACKED SECURITIES (continued) | ||||||||
FHLMC CMO, Ser 2023-5335, Cl FB | ||||||||
6.128%, SOFR30A + 0.814%, 10/15/2039(B) | $ | 964 | $ | 964 | ||||
FHLMC CMO, Ser 2023-5338, Cl FH | ||||||||
5.728%, SOFR30A + 0.414%, 04/15/2045(B) | 914 | 881 | ||||||
FHLMC Multiclass Certificates, Ser P009, Cl A2 | ||||||||
1.878%, 01/25/2031 | 500 | 401 | ||||||
FHLMC Multifamily Structured Pass Through Certificates, Ser 152, Cl X1, IO | ||||||||
0.301%, 11/25/2032(B) | 12,996 | 188 | ||||||
FHLMC Multifamily Structured Pass Through Certificates, Ser 154, Cl X1, IO | ||||||||
0.527%, 01/25/2033(B) | 13,098 | 382 | ||||||
FHLMC Multifamily Structured Pass Through Certificates, Ser 155, Cl X1, IO | ||||||||
0.421%, 04/25/2033(B) | 8,997 | 208 | ||||||
FHLMC Multifamily Structured Pass Through Certificates, Ser K106, Cl X1, IO | ||||||||
1.477%, 01/25/2030(B) | 3,479 | 232 | ||||||
FHLMC Multifamily Structured Pass Through Certificates, Ser K109, Cl A2 | ||||||||
1.558%, 04/25/2030 | 500 | 401 | ||||||
FHLMC Multifamily Structured Pass Through Certificates, Ser K128, Cl X1, IO | ||||||||
0.612%, 03/25/2031(B) | 8,431 | 249 | ||||||
FHLMC Multifamily Structured Pass Through Certificates, Ser K136, Cl X1, IO | ||||||||
0.495%, 12/25/2031(B) | 10,973 | 249 | ||||||
FHLMC Multifamily Structured Pass Through Certificates, Ser K149, Cl X1, IO | ||||||||
0.403%, 08/25/2032(B) | 10,982 | 236 | ||||||
FHLMC Multifamily Structured Pass Through Certificates, Ser K751, Cl A2 | ||||||||
4.412%, 03/25/2030 | 200 | 191 | ||||||
FHLMC Multifamily Structured Pass Through Certificates, Ser KG08, Cl A2 | ||||||||
4.134%, 05/25/2033(B) | 963 | 880 | ||||||
FHLMC Multifamily Structured Pass-Through Certificates, Ser K047, Cl A2 | ||||||||
3.329%, 05/25/2025(B) | 280 | 270 | ||||||
FHLMC Multifamily Structured Pass-Through Certificates, Ser K064, Cl X1, IO | ||||||||
0.735%, 03/25/2027(B) | 4,530 | 78 | ||||||
FHLMC Multifamily Structured Pass-Through Certificates, Ser K094, Cl X1, IO | ||||||||
1.014%, 06/25/2029(B) | 1,983 | 80 | ||||||
FHLMC Multifamily Structured Pass-Through Certificates, Ser K094, Cl XAM, IO | ||||||||
1.283%, 06/25/2029(B) | 4,850 | 271 | ||||||
Description | Face Amount | Market Value | ||||||
MORTGAGE-BACKED SECURITIES (continued) | ||||||||
FHLMC Multifamily Structured Pass-Through Certificates, Ser K095, Cl XAM, IO | ||||||||
1.374%, 06/25/2029(B) | $ | 700 | $ | 42 | ||||
FHLMC Multifamily Structured Pass-Through Certificates, Ser K110, Cl X1, IO | ||||||||
1.813%, 04/25/2030(B) | 1,293 | 107 | ||||||
FHLMC Multifamily Structured Pass-Through Certificates, Ser K736, Cl X1, IO | ||||||||
1.410%, 07/25/2026(B) | 960 | 27 | ||||||
FHLMC Multifamily Structured Pass-Through Certificates, Ser K741, Cl X1, IO | ||||||||
0.653%, 12/25/2027(B) | 2,986 | 58 | ||||||
FHLMC Multifamily Structured Pass-Through Certificates, Ser K743, Cl X1, IO | ||||||||
1.025%, 05/25/2028(B) | 3,988 | 141 | ||||||
FHLMC Multifamily Structured Pass-Through Certificates, Ser KC05, Cl X1, IO | ||||||||
1.365%, 06/25/2027(B) | 1,439 | 36 | ||||||
FHLMC Multifamily Structured Pass-Through Certificates, Ser KLU1, Cl A4 | ||||||||
2.854%, 01/25/2031 | 600 | 524 | ||||||
FHLMC Multifamily Structured Pass-Through Certificates, Ser KSG2, Cl A2 | ||||||||
2.091%, 11/25/2031(B) | 710 | 562 | ||||||
FHLMC Multifamily Structured Pass-Through Certificates, Ser S8FX, Cl A2 | ||||||||
3.291%, 03/25/2027 | 320 | 298 | ||||||
FHLMC Multifamily Structured Pass-Through Certificates, Ser X3FX, Cl A2FX | ||||||||
3.000%, 06/25/2027 | 580 | 542 | ||||||
FHLMC Multifamily WI Certificates Series, Ser K160, Cl A2 | ||||||||
4.500%, 12/25/2033 | 300 | 281 | ||||||
FHLMC Reference REMIC CMO, Ser 2006-R006, Cl ZA | ||||||||
6.000%, 04/15/2036 | 253 | 258 | ||||||
FHLMC STACR REMIC Trust, Ser 2020-DNA1, Cl B1 | ||||||||
7.729%, SOFR30A + 2.414%, 01/25/2050(B)(D) | 590 | 593 | ||||||
FHLMC Structured Pass-Through Certificates, Ser 2007-76, Cl 2A | ||||||||
2.335%, 10/25/2037(B) | 60 | 50 | ||||||
FNMA | ||||||||
7.500%, 10/01/2037 to 04/01/2039 | 66 | 69 | ||||||
7.000%, 09/01/2026 to 02/01/2053 | 221 | 225 | ||||||
6.500%, 05/01/2027 to 05/01/2053 | 6,756 | 6,808 | ||||||
6.000%, 01/01/2024 to 07/01/2053 | 6,218 | 6,166 | ||||||
5.800%, 10/01/2033 | 100 | 103 | ||||||
5.500%, 02/01/2035 to 09/01/2056 | 7,425 | 7,228 | ||||||
5.430%, 11/01/2028 | 100 | 101 | ||||||
5.340%, 09/01/2028 | 100 | 101 | ||||||
5.140%, 11/01/2033 | 1,200 | 1,193 | ||||||
SEI Institutional Managed Trust
167
SCHEDULE OF INVESTMENTS
September 30, 2023
Core Fixed Income Fund (Continued)
Description | Face Amount | Market Value | ||||||
MORTGAGE-BACKED SECURITIES (continued) | ||||||||
5.130%, 10/01/2028 | $ | 200 | $ | 199 | ||||
5.050%, 10/01/2028 | 400 | 395 | ||||||
5.000%, 06/01/2038 to 05/01/2053 | 6,571 | 6,296 | ||||||
4.830%, 09/01/2028 | 200 | 197 | ||||||
4.740%, 06/01/2030 | 200 | 192 | ||||||
4.680%, 07/01/2033 | 100 | 96 | ||||||
4.500%, 04/01/2025 to 08/01/2058 | 21,938 | 20,362 | ||||||
4.420%, 04/01/2033 | 100 | 93 | ||||||
4.200%, 01/01/2029 | 775 | 737 | ||||||
4.060%, 07/01/2032 | 298 | 271 | ||||||
4.000%, 01/01/2027 to 06/01/2057 | 45,031 | 41,109 | ||||||
3.900%, 08/01/2032 | 200 | 178 | ||||||
3.890%, 07/01/2032 | 600 | 534 | ||||||
3.880%, 07/01/2032 | 98 | 90 | ||||||
3.850%, 08/01/2032 | 200 | 177 | ||||||
3.840%, 07/01/2032 | 100 | 90 | ||||||
3.560%, 07/01/2032 | 100 | 88 | ||||||
3.520%, 06/01/2032 | 100 | 88 | ||||||
3.500%, 05/01/2033 to 06/01/2052 | 49,088 | 43,063 | ||||||
3.450%, 03/01/2029 | 57 | 52 | ||||||
3.345%, 06/01/2032 | 100 | 87 | ||||||
3.250%, 05/01/2029 | 58 | 53 | ||||||
3.160%, 05/01/2029 | 179 | 161 | ||||||
3.020%, 05/01/2026 | 550 | 514 | ||||||
3.000%, 12/01/2031 to 07/01/2060 | 124,845 | 105,754 | ||||||
2.930%, 06/01/2030 | 75 | 66 | ||||||
2.900%, 11/01/2029 | 493 | 433 | ||||||
2.820%, 07/01/2027 | 549 | 504 | ||||||
2.500%, 03/01/2035 to 09/01/2061 | 83,132 | 66,949 | ||||||
2.455%, 04/01/2040 | 1,920 | 1,253 | ||||||
2.150%, 02/01/2032(B) | 239 | 190 | ||||||
2.000%, 05/01/2036 to 04/01/2052 | 164,539 | 128,357 | ||||||
1.850%, 09/01/2035 | 542 | 440 | ||||||
1.500%, 10/01/2041 to 02/01/2052 | 18,484 | 13,836 | ||||||
FNMA ARM | ||||||||
6.953%, RFUCCT1Y + 1.560%, 03/01/2043(B) | 10 | 10 | ||||||
6.739%, RFUCCT1Y + 1.560%, 06/01/2043(B) | 45 | 45 | ||||||
6.571%, RFUCCT1Y + 1.653%, 01/01/2043(B) | 44 | 45 | ||||||
6.341%, 12MTA + 1.929%, 11/01/2035(B) | 145 | 143 | ||||||
6.279%, 12MTA + 1.848%, 10/01/2035(B) | 37 | 36 | ||||||
6.237%, 12MTA + 1.859%, 11/01/2035(B) | 31 | 30 | ||||||
6.221%, 12MTA + 1.854%, 10/01/2035(B) | 141 | 139 | ||||||
5.627%, RFUCCT1Y + 1.581%, 10/01/2043(B) | 163 | 164 | ||||||
4.797%, RFUCCT1Y + 1.578%, 06/01/2045(B) | 238 | 239 | ||||||
Description | Face Amount | Market Value | ||||||
MORTGAGE-BACKED SECURITIES (continued) | ||||||||
4.687%, RFUCCT1Y + 1.584%, 01/01/2046(B) | $ | 608 | $ | 610 | ||||
4.653%, SOFR30A + 2.130%, 08/01/2052(B) | 887 | 852 | ||||||
4.633%, SOFR30A + 2.123%, 08/01/2052(B) | 870 | 824 | ||||||
4.627%, SOFR30A + 2.125%, 08/01/2052(B) | 1,149 | 1,103 | ||||||
4.345%, SOFR30A + 2.124%, 07/01/2052(B) | 1,006 | 957 | ||||||
4.303%, SOFR30A + 2.125%, 08/01/2052(B) | 1,056 | 1,004 | ||||||
4.240%, SOFR30A + 2.127%, 11/01/2052(B) | 676 | 649 | ||||||
4.218%, SOFR30A + 2.370%, 09/01/2052(B) | 271 | 256 | ||||||
4.168%, SOFR30A + 2.120%, 07/01/2052(B) | 824 | 764 | ||||||
4.149%, SOFR30A + 2.132%, 10/01/2052(B) | 1,969 | 1,883 | ||||||
4.136%, SOFR30A + 2.120%, 09/01/2052(B) | 776 | 743 | ||||||
3.968%, SOFR30A + 2.120%, 08/01/2052(B) | 236 | 217 | ||||||
3.679%, SOFR30A + 2.370%, 08/01/2052(B) | 579 | 538 | ||||||
3.027%, RFUCCT1Y + 1.603%, 03/01/2050(B) | 949 | 927 | ||||||
2.752%, RFUCCT1Y + 1.606%, 06/01/2050(B) | 400 | 361 | ||||||
FNMA CMO, Ser 1999-11, Cl Z | ||||||||
5.500%, 03/25/2029 | 65 | 62 | ||||||
FNMA CMO, Ser 2005-29, Cl ZA | ||||||||
5.500%, 04/25/2035 | 111 | 111 | ||||||
FNMA CMO, Ser 2006-112, Cl ST, IO | ||||||||
1.271%, 11/25/2036(B) | 215 | 7 | ||||||
FNMA CMO, Ser 2009-103, Cl MB | ||||||||
5.179%, 12/25/2039(B) | 15 | 15 | ||||||
FNMA CMO, Ser 2009-86, Cl BO, PO | ||||||||
0.000%, 03/25/2037(A) | 339 | 286 | ||||||
FNMA CMO, Ser 2011-59, Cl NZ | ||||||||
5.500%, 07/25/2041 | 786 | 784 | ||||||
FNMA CMO, Ser 2011-87, Cl SG, IO | ||||||||
1.121%, 04/25/2040(B) | 34 | 1 | ||||||
FNMA CMO, Ser 2011-96, Cl SA, IO | ||||||||
1.121%, 10/25/2041(B) | 414 | 26 | ||||||
FNMA CMO, Ser 2012-101, Cl AI, IO | ||||||||
3.000%, 06/25/2027 | 49 | 1 | ||||||
FNMA CMO, Ser 2012-101, Cl BI, IO | ||||||||
4.000%, 09/25/2027 | 7 | – | ||||||
FNMA CMO, Ser 2012-111, Cl FC | ||||||||
5.829%, SOFR30A + 0.514%, 10/25/2042(B) | 360 | 351 | ||||||
168
SEI Institutional Managed Trust
Description | Face Amount | Market Value | ||||||
MORTGAGE-BACKED SECURITIES (continued) | ||||||||
FNMA CMO, Ser 2012-118, Cl VZ | ||||||||
3.000%, 11/25/2042 | $ | 395 | $ | 344 | ||||
FNMA CMO, Ser 2012-133, Cl JF | ||||||||
5.779%, SOFR30A + 0.464%, 12/25/2042(B) | 383 | 369 | ||||||
FNMA CMO, Ser 2012-133, Cl CS, IO | ||||||||
0.721%, 12/25/2042(B) | 115 | 10 | ||||||
FNMA CMO, Ser 2012-151, Cl NX | ||||||||
1.500%, 01/25/2043 | 302 | 245 | ||||||
FNMA CMO, Ser 2012-28, Cl B | ||||||||
6.500%, 06/25/2039 | 3 | 3 | ||||||
FNMA CMO, Ser 2012-35, Cl SC, IO | ||||||||
1.071%, 04/25/2042(B) | 96 | 9 | ||||||
FNMA CMO, Ser 2012-46, Cl BA | ||||||||
6.000%, 05/25/2042 | 102 | 103 | ||||||
FNMA CMO, Ser 2012-74, Cl OA, PO | ||||||||
0.000%, 03/25/2042(A) | 9 | 8 | ||||||
FNMA CMO, Ser 2012-74, Cl SA, IO | ||||||||
1.221%, 03/25/2042(B) | 116 | 6 | ||||||
FNMA CMO, Ser 2012-75, Cl AO, PO | ||||||||
0.000%, 03/25/2042(A) | 18 | 16 | ||||||
FNMA CMO, Ser 2013-11, Cl AP | ||||||||
1.500%, 01/25/2043 | 1,000 | 866 | ||||||
FNMA CMO, Ser 2013-111, Cl PL | ||||||||
2.000%, 12/25/2042 | 261 | 223 | ||||||
FNMA CMO, Ser 2013-124, Cl SB, IO | ||||||||
0.521%, 12/25/2043(B) | 186 | 15 | ||||||
FNMA CMO, Ser 2013-126, Cl CS, IO | ||||||||
0.721%, 09/25/2041(B) | 145 | 7 | ||||||
FNMA CMO, Ser 2013-15, Cl FA | ||||||||
5.779%, SOFR30A + 0.464%, 03/25/2043(B) | 460 | 444 | ||||||
FNMA CMO, Ser 2013-35, Cl CL | ||||||||
3.000%, 02/25/2043 | 6,875 | 6,376 | ||||||
FNMA CMO, Ser 2013-43, Cl BP | ||||||||
1.750%, 05/25/2043 | 355 | 291 | ||||||
FNMA CMO, Ser 2013-54, Cl BS, IO | ||||||||
0.721%, 06/25/2043(B) | 69 | 6 | ||||||
FNMA CMO, Ser 2013-73, Cl IB, IO | ||||||||
3.500%, 07/25/2028 | 23 | 1 | ||||||
FNMA CMO, Ser 2013-73, Cl IA, IO | ||||||||
3.000%, 09/25/2032 | 166 | 9 | ||||||
FNMA CMO, Ser 2013-9, Cl BC | ||||||||
6.500%, 07/25/2042 | 120 | 124 | ||||||
FNMA CMO, Ser 2013-9, Cl CB | ||||||||
5.500%, 04/25/2042 | 966 | 964 | ||||||
FNMA CMO, Ser 2013-9, Cl SA, IO | ||||||||
0.721%, 03/25/2042(B) | 143 | 6 | ||||||
FNMA CMO, Ser 2014-25, Cl EL | ||||||||
3.000%, 05/25/2044 | 431 | 373 | ||||||
FNMA CMO, Ser 2014-47, Cl AI, IO | ||||||||
0.255%, 08/25/2044(B) | 77 | 3 | ||||||
Description | Face Amount | Market Value | ||||||
MORTGAGE-BACKED SECURITIES (continued) | ||||||||
FNMA CMO, Ser 2014-6, Cl Z | ||||||||
2.500%, 02/25/2044 | $ | 255 | $ | 206 | ||||
FNMA CMO, Ser 2014-74, Cl PC | ||||||||
2.500%, 06/25/2044 | 348 | 314 | ||||||
FNMA CMO, Ser 2015-20, Cl EF | ||||||||
5.779%, SOFR30A + 0.464%, 04/25/2045(B) | 1,059 | 1,017 | ||||||
FNMA CMO, Ser 2015-26, Cl GF | ||||||||
5.729%, SOFR30A + 0.414%, 05/25/2045(B) | 668 | 643 | ||||||
FNMA CMO, Ser 2015-32, Cl FA | ||||||||
5.729%, SOFR30A + 0.414%, 05/25/2045(B) | 406 | 389 | ||||||
FNMA CMO, Ser 2015-48, Cl FB | ||||||||
5.729%, SOFR30A + 0.414%, 07/25/2045(B) | 500 | 479 | ||||||
FNMA CMO, Ser 2015-55, Cl IO, IO | ||||||||
0.309%, 08/25/2055(B) | 196 | 8 | ||||||
FNMA CMO, Ser 2015-56, Cl AS, IO | ||||||||
0.721%, 08/25/2045(B) | 28 | 2 | ||||||
FNMA CMO, Ser 2015-65, Cl CZ | ||||||||
3.500%, 09/25/2045 | 265 | 208 | ||||||
FNMA CMO, Ser 2015-8, Cl AP | ||||||||
2.000%, 03/25/2045 | 774 | 652 | ||||||
FNMA CMO, Ser 2015-84, Cl PA | ||||||||
1.700%, 08/25/2033 | 1,165 | 1,039 | ||||||
FNMA CMO, Ser 2016-19, Cl FD | ||||||||
5.829%, SOFR30A + 0.514%, 04/25/2046(B) | 1,445 | 1,420 | ||||||
FNMA CMO, Ser 2016-37, Cl MJ | ||||||||
3.500%, 08/25/2043 | 40 | 39 | ||||||
FNMA CMO, Ser 2016-48, Cl MA | ||||||||
2.000%, 06/25/2038 | 1,181 | 1,043 | ||||||
FNMA CMO, Ser 2016-57, Cl PC | ||||||||
1.750%, 06/25/2046 | 2,396 | 1,914 | ||||||
FNMA CMO, Ser 2017-13, Cl PA | ||||||||
3.000%, 08/25/2046 | 476 | 421 | ||||||
FNMA CMO, Ser 2017-76, Cl SB, IO | ||||||||
0.671%, 10/25/2057(B) | 762 | 68 | ||||||
FNMA CMO, Ser 2017-78, Cl FC | ||||||||
5.779%, SOFR30A + 0.464%, 10/25/2047(B) | 484 | 465 | ||||||
FNMA CMO, Ser 2017-85, Cl SC, IO | ||||||||
0.771%, 11/25/2047(B) | 228 | 16 | ||||||
FNMA CMO, Ser 2018-14, Cl KC | ||||||||
3.000%, 03/25/2048 | 845 | 768 | ||||||
FNMA CMO, Ser 2018-38, Cl MA | ||||||||
3.300%, 06/25/2048 | 645 | 589 | ||||||
FNMA CMO, Ser 2018-43, Cl CT | ||||||||
3.000%, 06/25/2048 | 666 | 571 | ||||||
FNMA CMO, Ser 2018-54, Cl KA | ||||||||
3.500%, 01/25/2047 | 217 | 205 | ||||||
SEI Institutional Managed Trust
169
SCHEDULE OF INVESTMENTS
September 30, 2023
Core Fixed Income Fund (Continued)
Description | Face Amount | Market Value | ||||||
MORTGAGE-BACKED SECURITIES (continued) | ||||||||
FNMA CMO, Ser 2018-64, Cl A | ||||||||
3.000%, 09/25/2048 | $ | 417 | $ | 352 | ||||
FNMA CMO, Ser 2018-8, Cl KL | ||||||||
2.500%, 03/25/2047 | 231 | 193 | ||||||
FNMA CMO, Ser 2018-85, Cl EA | ||||||||
3.500%, 12/25/2048 | 361 | 331 | ||||||
FNMA CMO, Ser 2019-15, Cl FA | ||||||||
5.929%, SOFR30A + 0.614%, 04/25/2049(B) | 257 | 248 | ||||||
FNMA CMO, Ser 2019-25, Cl PA | ||||||||
3.000%, 05/25/2048 | 779 | 688 | ||||||
FNMA CMO, Ser 2019-41, Cl FG | ||||||||
5.929%, SOFR30A + 0.614%, 08/25/2059(B) | 597 | 571 | ||||||
FNMA CMO, Ser 2019-43, Cl FC | ||||||||
5.829%, SOFR30A + 0.514%, 08/25/2049(B) | 512 | 493 | ||||||
FNMA CMO, Ser 2019-67, Cl FB | ||||||||
5.879%, SOFR30A + 0.564%, 11/25/2049(B) | 254 | 244 | ||||||
FNMA CMO, Ser 2019-79, Cl FA | ||||||||
5.929%, SOFR30A + 0.614%, 01/25/2050(B) | 1,243 | 1,199 | ||||||
FNMA CMO, Ser 2020-25, Cl BI, IO | ||||||||
3.500%, 01/25/2047 | 606 | 95 | ||||||
FNMA CMO, Ser 2020-34, Cl F | ||||||||
5.879%, SOFR30A + 0.564%, 06/25/2050(B) | 355 | 341 | ||||||
FNMA CMO, Ser 2020-45, Cl JL | ||||||||
3.000%, 07/25/2040 | 967 | 842 | ||||||
FNMA CMO, Ser 2020-47, Cl GZ | ||||||||
2.000%, 07/25/2050 | 427 | 227 | ||||||
FNMA CMO, Ser 2020-48, Cl DA | ||||||||
2.000%, 07/25/2050 | 1,194 | 951 | ||||||
FNMA CMO, Ser 2020-48, Cl AB | ||||||||
2.000%, 07/25/2050 | 397 | 314 | ||||||
FNMA CMO, Ser 2020-56, Cl AQ | ||||||||
2.000%, 08/25/2050 | 900 | 658 | ||||||
FNMA CMO, Ser 2020-56, Cl DI, IO | ||||||||
2.500%, 08/25/2050 | 310 | 48 | ||||||
FNMA CMO, Ser 2020-57, Cl TA | ||||||||
2.000%, 04/25/2050 | 1,007 | 841 | ||||||
FNMA CMO, Ser 2020-59, Cl NC | ||||||||
3.000%, 08/25/2040 | 530 | 465 | ||||||
FNMA CMO, Ser 2020-64, Cl IB, IO | ||||||||
4.000%, 09/25/2050 | 864 | 169 | ||||||
FNMA CMO, Ser 2020-65, Cl JI, IO | ||||||||
4.000%, 09/25/2050 | 1,774 | 318 | ||||||
FNMA CMO, Ser 2020-65, Cl EI, IO | ||||||||
4.000%, 09/25/2050 | 1,507 | 284 | ||||||
FNMA CMO, Ser 2020-65, Cl DI, IO | ||||||||
4.000%, 09/25/2050 | 1,010 | 189 | ||||||
Description | Face Amount | Market Value | ||||||
MORTGAGE-BACKED SECURITIES (continued) | ||||||||
FNMA CMO, Ser 2020-73, Cl KI, IO | ||||||||
3.000%, 10/25/2050 | $ | 618 | $ | 102 | ||||
FNMA CMO, Ser 2020-96, Cl IN, IO | ||||||||
3.000%, 01/25/2051 | 712 | 112 | ||||||
FNMA CMO, Ser 2021-1, Cl IG, IO | ||||||||
2.500%, 02/25/2051 | 169 | 28 | ||||||
FNMA CMO, Ser 2021-22, Cl MN | ||||||||
2.750%, 10/25/2050 | 577 | 483 | ||||||
FNMA CMO, Ser 2021-27, Cl EC | ||||||||
1.500%, 05/25/2051 | 1,715 | 1,303 | ||||||
FNMA CMO, Ser 2021-42, Cl AC | ||||||||
2.000%, 02/25/2051 | 470 | 382 | ||||||
FNMA CMO, Ser 2021-43, Cl IO, IO | ||||||||
2.500%, 06/25/2051 | 1,489 | 224 | ||||||
FNMA CMO, Ser 2021-65, Cl JA | ||||||||
2.000%, 01/25/2046 | 298 | 251 | ||||||
FNMA CMO, Ser 2021-73, Cl A | ||||||||
2.500%, 11/25/2049 | 612 | 508 | ||||||
FNMA CMO, Ser 2021-78, Cl ND | ||||||||
1.500%, 11/25/2051 | 978 | 765 | ||||||
FNMA CMO, Ser 2021-78, Cl PA | ||||||||
2.500%, 11/25/2051 | 549 | 457 | ||||||
FNMA CMO, Ser 2021-86, Cl MA | ||||||||
2.500%, 11/25/2047 | 1,014 | 867 | ||||||
FNMA CMO, Ser 2021-91, Cl AB | ||||||||
2.500%, 09/25/2049 | 587 | 488 | ||||||
FNMA CMO, Ser 2022-11, Cl A | ||||||||
2.500%, 07/25/2047 | 1,513 | 1,313 | ||||||
FNMA CMO, Ser 2022-28, Cl CA | ||||||||
2.000%, 01/25/2048 | 600 | 522 | ||||||
FNMA CMO, Ser 2022-3, Cl N | ||||||||
2.000%, 10/25/2047 | 1,811 | 1,503 | ||||||
FNMA CMO, Ser 2022-86, Cl IO, IO | ||||||||
2.500%, 05/25/2050 | 766 | 107 | ||||||
FNMA CMO, Ser 2023-37, Cl FH | ||||||||
5.829%, SOFR30A + 0.514%, 01/25/2050(B) | 1,015 | 980 | ||||||
FNMA CMO, Ser 2023-38, Cl FC | ||||||||
5.979%, SOFR30A + 0.664%, 06/25/2040(B) | 655 | 645 | ||||||
FNMA Connecticut Avenue Securities, Ser 2014-C02, Cl 1M2 | ||||||||
8.029%, SOFR30A + 2.714%, 05/25/2024(B) | 330 | 333 | ||||||
FNMA Connecticut Avenue Securities, Ser 2014-C03, Cl 1M2 | ||||||||
8.429%, SOFR30A + 3.114%, 07/25/2024(B) | 1,228 | 1,245 | ||||||
FNMA Interest CMO, Ser 2005-360, Cl 2, IO | ||||||||
5.000%, 08/25/2035 | 440 | 77 | ||||||
FNMA Interest CMO, Ser 2012-409, Cl C22, IO | ||||||||
4.500%, 11/25/2039 | 132 | 24 | ||||||
170
SEI Institutional Managed Trust
Description | Face Amount | Market Value | ||||||
MORTGAGE-BACKED SECURITIES (continued) | ||||||||
FNMA Interest CMO, Ser 2012-409, Cl C13, IO | ||||||||
3.500%, 11/25/2041 | $ | 109 | $ | 17 | ||||
FNMA Interest CMO, Ser 2012-409, Cl C2, IO | ||||||||
3.000%, 04/25/2027 | 93 | 3 | ||||||
FNMA Interest CMO, Ser 2012-411, Cl A3 | ||||||||
3.000%, 08/25/2042 | 575 | 498 | ||||||
FNMA Interest CMO, Ser 2012-414, Cl A35 | ||||||||
3.500%, 10/25/2042 | 856 | 769 | ||||||
FNMA Interest CMO, Ser 2018-424, Cl C11, IO | ||||||||
3.500%, 02/25/2048 | 1,141 | 212 | ||||||
FNMA Interest CMO, Ser 2022-427, Cl C73, IO | ||||||||
3.000%, 12/25/2048 | 1,825 | 293 | ||||||
FNMA TBA | ||||||||
6.500%, 10/15/2053 to 11/15/2053 | 14,815 | 14,882 | ||||||
6.000%, 12/01/2037 to 11/15/2053 | 42,655 | 42,091 | ||||||
5.500%, 10/15/2053 | 41,698 | 40,296 | ||||||
5.000%, 10/15/2053 | 52,239 | 49,284 | ||||||
4.500%, 10/15/2053 | 28,424 | 26,097 | ||||||
4.000%, 10/15/2053 | 24,649 | 21,943 | ||||||
3.500%, 10/15/2053 | 19,255 | 16,558 | ||||||
3.000%, 10/15/2053 | 30,090 | 24,877 | ||||||
2.500%, 10/15/2027 to 10/01/2042 | 11,646 | 9,465 | ||||||
2.000%, 10/15/2038 to 10/15/2053 | 37,652 | 28,931 | ||||||
FNMA, Ser 2014-M8, Cl X2, IO | ||||||||
0.395%, 06/25/2024(B) | 2,397 | 1 | ||||||
FNMA, Ser M15, Cl 1A2 | ||||||||
3.700%, 01/25/2036 | 100 | 87 | ||||||
FNMA, Ser M36, Cl X1, IO | ||||||||
1.540%, 09/25/2034(B) | 527 | 33 | ||||||
FREMF Mortgage Trust, Ser 2019-KF58, Cl B | ||||||||
7.576%, SOFR30A + 2.264%, 01/25/2026(B)(D) | 709 | 667 | ||||||
GNMA | ||||||||
8.000%, 11/15/2029 to 09/15/2030 | 24 | 24 | ||||||
7.500%, 03/15/2029 to 10/15/2037 | 28 | 29 | ||||||
7.000%, 09/15/2031 | 11 | 12 | ||||||
6.500%, 07/15/2028 to 12/15/2035 | 624 | 632 | ||||||
6.000%, 01/15/2029 to 07/20/2053 | 2,282 | 2,277 | ||||||
5.505%, 07/20/2060(B) | 1 | 1 | ||||||
5.500%, 11/20/2052 to 05/20/2053 | 3,707 | 3,600 | ||||||
5.000%, 07/20/2040 to 05/20/2053 | 6,989 | 6,682 | ||||||
4.700%, 09/20/2061(B) | 67 | 65 | ||||||
4.500%, 04/20/2041 to 09/20/2052 | 10,573 | 9,877 | ||||||
4.435%, 01/20/2069(B) | 4 | 4 | ||||||
4.000%, 06/20/2047 to 04/20/2053 | 11,666 | 10,628 | ||||||
3.625%, H15T1Y + 1.500%, 02/20/2034(B) | 72 | 71 | ||||||
3.500%, 04/20/2045 to 12/20/2052 | 15,794 | 13,963 | ||||||
3.000%, 09/15/2042 to 04/20/2053 | 30,818 | 26,282 | ||||||
Description | Face Amount | Market Value | ||||||
MORTGAGE-BACKED SECURITIES (continued) | ||||||||
2.500%, 12/20/2037 to 12/20/2052 | $ | 14,749 | $ | 12,094 | ||||
2.000%, 09/20/2050 to 02/20/2051 | 3,871 | 3,072 | ||||||
GNMA CMO, Ser 2007-17, Cl IB, IO | ||||||||
0.811%, 04/20/2037(B) | 215 | 6 | ||||||
GNMA CMO, Ser 2007-51, Cl SG, IO | ||||||||
1.141%, 08/20/2037(B) | 30 | 1 | ||||||
GNMA CMO, Ser 2007-78, Cl SA, IO | ||||||||
1.085%, 12/16/2037(B) | 295 | 9 | ||||||
GNMA CMO, Ser 2009-66, Cl XS, IO | ||||||||
1.355%, 07/16/2039(B) | 150 | 5 | ||||||
GNMA CMO, Ser 2010-4, Cl NS, IO | ||||||||
0.945%, 01/16/2040(B) | 2,020 | 143 | ||||||
GNMA CMO, Ser 2010-85, Cl HS, IO | ||||||||
1.211%, 01/20/2040(B) | 3 | – | ||||||
GNMA CMO, Ser 2010-H11, Cl FA | ||||||||
6.443%, TSFR1M + 1.114%, 06/20/2060(B) | 340 | 340 | ||||||
GNMA CMO, Ser 2010-H27, Cl FA | ||||||||
5.812%, TSFR1M + 0.494%, 12/20/2060(B) | 628 | 624 | ||||||
GNMA CMO, Ser 2010-H28, Cl FE | ||||||||
5.832%, TSFR1M + 0.514%, 12/20/2060(B) | 191 | 190 | ||||||
GNMA CMO, Ser 2011-H08, Cl FG | ||||||||
5.912%, TSFR1M + 0.594%, 03/20/2061(B) | 222 | 221 | ||||||
GNMA CMO, Ser 2011-H08, Cl FD | ||||||||
5.932%, TSFR1M + 0.614%, 02/20/2061(B) | 95 | 95 | ||||||
GNMA CMO, Ser 2011-H09, Cl AF | ||||||||
5.932%, TSFR1M + 0.614%, 03/20/2061(B) | 124 | 124 | ||||||
GNMA CMO, Ser 2012-141, Cl WA | ||||||||
4.516%, 11/16/2041(B) | 164 | 154 | ||||||
GNMA CMO, Ser 2012-34, Cl SA, IO | ||||||||
0.611%, 03/20/2042(B) | 231 | 19 | ||||||
GNMA CMO, Ser 2012-43, Cl SN, IO | ||||||||
1.155%, 04/16/2042(B) | 40 | 4 | ||||||
GNMA CMO, Ser 2012-98, Cl SA, IO | ||||||||
0.655%, 08/16/2042(B) | 99 | 8 | ||||||
GNMA CMO, Ser 2012-H25, Cl FA | ||||||||
4.700%, TSFR1M + 0.814%, 12/20/2061(B) | 6 | 6 | ||||||
GNMA CMO, Ser 2012-H27, Cl AI, IO | ||||||||
1.683%, 10/20/2062(B) | 399 | 10 | ||||||
GNMA CMO, Ser 2013-152, Cl HA | ||||||||
2.500%, 06/20/2043 | 555 | 492 | ||||||
GNMA CMO, Ser 2013-53, Cl OI, IO | ||||||||
3.500%, 04/20/2043 | 73 | 8 | ||||||
GNMA CMO, Ser 2013-69, Cl AI, IO | ||||||||
3.500%, 05/20/2043 | 248 | 37 | ||||||
GNMA CMO, Ser 2014-181, Cl L | ||||||||
3.000%, 12/20/2044 | 334 | 288 | ||||||
SEI Institutional Managed Trust
171
SCHEDULE OF INVESTMENTS
September 30, 2023
Core Fixed Income Fund (Continued)
Description | Face Amount | Market Value | ||||||
MORTGAGE-BACKED SECURITIES (continued) | ||||||||
GNMA CMO, Ser 2014-5, Cl SP, IO | ||||||||
0.705%, 06/16/2043(B) | $ | 64 | $ | 2 | ||||
GNMA CMO, Ser 2014-H10, Cl TA | ||||||||
6.032%, TSFR1M + 0.714%, 04/20/2064(B) | 392 | 390 | ||||||
GNMA CMO, Ser 2015-144, Cl CA | ||||||||
2.500%, 10/20/2045 | 575 | 484 | ||||||
GNMA CMO, Ser 2015-161, Cl GF | ||||||||
5.739%, TSFR1M + 0.414%, 11/20/2045(B) | 313 | 301 | ||||||
GNMA CMO, Ser 2015-167, Cl OI, IO | ||||||||
4.000%, 04/16/2045 | 65 | 12 | ||||||
GNMA CMO, Ser 2015-H10, Cl FC | ||||||||
5.698%, TSFR1M + 0.594%, 04/20/2065(B) | 238 | 236 | ||||||
GNMA CMO, Ser 2015-H18, Cl FA | ||||||||
5.882%, TSFR1M + 0.564%, 06/20/2065(B) | 84 | 83 | ||||||
GNMA CMO, Ser 2015-H20, Cl FA | ||||||||
5.902%, TSFR1M + 0.584%, 08/20/2065(B) | 170 | 169 | ||||||
GNMA CMO, Ser 2016-135, Cl SB, IO | ||||||||
0.655%, 10/16/2046(B) | 391 | 43 | ||||||
GNMA CMO, Ser 2016-93, Cl AB | ||||||||
1.750%, 07/20/2044 | 610 | 470 | ||||||
GNMA CMO, Ser 2017-139, Cl GA | ||||||||
3.000%, 09/20/2047 | 1,299 | 1,129 | ||||||
GNMA CMO, Ser 2017-167, Cl BQ | ||||||||
2.500%, 08/20/2044 | 461 | 411 | ||||||
GNMA CMO, Ser 2017-H15, Cl KI, IO | ||||||||
0.834%, 07/20/2067(B) | 460 | 22 | ||||||
GNMA CMO, Ser 2017-H18, Cl BI, IO | ||||||||
1.184%, 09/20/2067(B) | 2,947 | 81 | ||||||
GNMA CMO, Ser 2017-H20, Cl IB, IO | ||||||||
0.342%, 10/20/2067(B) | 208 | 7 | ||||||
GNMA CMO, Ser 2017-H22, Cl IC, IO | ||||||||
0.574%, 11/20/2067(B) | 92 | 3 | ||||||
GNMA CMO, Ser 2018-65, Cl DC | ||||||||
3.500%, 05/20/2048 | 414 | 358 | ||||||
GNMA CMO, Ser 2018-H06, Cl PF | ||||||||
5.732%, TSFR1M + 0.414%, 02/20/2068(B) | 167 | 166 | ||||||
GNMA CMO, Ser 2018-H07, Cl FD | ||||||||
5.732%, TSFR1M + 0.414%, 05/20/2068(B) | 333 | 332 | ||||||
GNMA CMO, Ser 2019-90, Cl AB | ||||||||
3.000%, 07/20/2049 | 274 | 235 | ||||||
GNMA CMO, Ser 2020-123, Cl NI, IO | ||||||||
2.500%, 08/20/2050 | 605 | 81 | ||||||
GNMA CMO, Ser 2020-123, Cl IL, IO | ||||||||
2.500%, 08/20/2050 | 216 | 28 | ||||||
GNMA CMO, Ser 2020-127, Cl IN, IO | ||||||||
2.500%, 08/20/2050 | 297 | 40 | ||||||
Description | Face Amount | Market Value | ||||||
MORTGAGE-BACKED SECURITIES (continued) | ||||||||
GNMA CMO, Ser 2020-129, Cl IE, IO | ||||||||
2.500%, 09/20/2050 | $ | 230 | $ | 31 | ||||
GNMA CMO, Ser 2020-160, Cl YI, IO | ||||||||
2.500%, 10/20/2050 | 855 | 113 | ||||||
GNMA CMO, Ser 2020-160, Cl IH, IO | ||||||||
2.500%, 10/20/2050 | 159 | 22 | ||||||
GNMA CMO, Ser 2020-160, Cl VI, IO | ||||||||
2.500%, 10/20/2050 | 230 | 33 | ||||||
GNMA CMO, Ser 2020-175, Cl GI, IO | ||||||||
2.000%, 11/20/2050 | 296 | 31 | ||||||
GNMA CMO, Ser 2020-181, Cl WI, IO | ||||||||
2.000%, 12/20/2050 | 1,919 | 206 | ||||||
GNMA CMO, Ser 2020-47, Cl NI, IO | ||||||||
3.500%, 04/20/2050 | 210 | 35 | ||||||
GNMA CMO, Ser 2020-47, Cl MI, IO | ||||||||
3.500%, 04/20/2050 | 497 | 85 | ||||||
GNMA CMO, Ser 2020-H09, Cl NF | ||||||||
6.682%, TSFR1M + 1.364%, 04/20/2070(B) | 214 | 215 | ||||||
GNMA CMO, Ser 2020-H09, Cl FL | ||||||||
4.849%, TSFR1M + 1.264%, 05/20/2070(B) | 558 | 553 | ||||||
GNMA CMO, Ser 2020-H12, Cl F | ||||||||
5.531%, TSFR1M + 0.614%, 07/20/2070(B) | 49 | 47 | ||||||
GNMA CMO, Ser 2020-H13, Cl FA | ||||||||
5.000%, TSFR1M + 0.564%, 07/20/2070(B) | 572 | 553 | ||||||
GNMA CMO, Ser 2021-115, Cl MI, IO | ||||||||
2.500%, 05/20/2051 | 395 | 41 | ||||||
GNMA CMO, Ser 2021-176, Cl IN, IO | ||||||||
2.500%, 10/20/2051 | 1,033 | 141 | ||||||
GNMA CMO, Ser 2021-188, Cl PA | ||||||||
2.000%, 10/20/2051 | 1,718 | 1,391 | ||||||
GNMA CMO, Ser 2021-191, Cl NI, IO | ||||||||
3.000%, 10/20/2051 | 642 | 115 | ||||||
GNMA CMO, Ser 2021-227, Cl E | ||||||||
2.500%, 07/20/2050 | 2,438 | 2,022 | ||||||
GNMA CMO, Ser 2021-23, Cl MG | ||||||||
1.500%, 02/20/2051 | 1,160 | 920 | ||||||
GNMA CMO, Ser 2021-27, Cl Q | ||||||||
5.000%, 02/20/2051 | 449 | 418 | ||||||
GNMA CMO, Ser 2021-27, Cl CW | ||||||||
5.001%, 02/20/2051(B) | 645 | 610 | ||||||
GNMA CMO, Ser 2021-27, Cl BD | ||||||||
5.000%, 02/20/2051 | 482 | 462 | ||||||
GNMA CMO, Ser 2021-27, Cl NT | ||||||||
5.000%, 02/20/2051 | 506 | 470 | ||||||
GNMA CMO, Ser 2021-29, Cl TI, IO | ||||||||
2.500%, 02/20/2051 | 456 | 76 | ||||||
GNMA CMO, Ser 2021-57, Cl BI, IO | ||||||||
3.000%, 03/20/2051 | 1,358 | 202 | ||||||
172
SEI Institutional Managed Trust
Description | Face Amount | Market Value | ||||||
MORTGAGE-BACKED SECURITIES (continued) | ||||||||
GNMA CMO, Ser 2021-8, Cl CY | ||||||||
5.000%, 01/20/2051 | $ | 454 | $ | 439 | ||||
GNMA CMO, Ser 2021-96, Cl VI, IO | ||||||||
2.500%, 06/20/2051 | 863 | 117 | ||||||
GNMA CMO, Ser 2022-107, Cl C | ||||||||
2.500%, 06/20/2051 | 2,141 | 1,741 | ||||||
GNMA CMO, Ser 2022-153, Cl KA | ||||||||
4.000%, 12/20/2049 | 582 | 549 | ||||||
GNMA CMO, Ser 2022-189, Cl PT | ||||||||
2.500%, 10/20/2051 | 855 | 676 | ||||||
GNMA CMO, Ser 2022-191, Cl BY | ||||||||
4.000%, 08/20/2041 | 2,619 | 2,351 | ||||||
GNMA CMO, Ser 2022-191, Cl B | ||||||||
4.000%, 06/20/2041 | 2,408 | 2,158 | ||||||
GNMA CMO, Ser 2022-197, Cl LF | ||||||||
6.014%, SOFR30A + 0.700%, 11/20/2052(B) | 1,882 | 1,832 | ||||||
GNMA CMO, Ser 2022-205, Cl A | ||||||||
2.000%, 09/20/2051 | 767 | 579 | ||||||
GNMA CMO, Ser 2022-31, Cl GH | ||||||||
2.500%, 12/20/2049 | 1,399 | 1,189 | ||||||
GNMA CMO, Ser 2022-5, Cl BA | ||||||||
2.000%, 10/20/2049 | 2,553 | 2,078 | ||||||
GNMA CMO, Ser 2022-50, Cl DC | ||||||||
2.500%, 08/20/2051 | 645 | 544 | ||||||
GNMA CMO, Ser 2022-66, Cl CG | ||||||||
3.500%, 04/20/2052 | 1,218 | 1,120 | ||||||
GNMA CMO, Ser 2022-84, Cl A | ||||||||
2.500%, 01/20/2052 | 4,089 | 3,344 | ||||||
GNMA CMO, Ser 2022-99, Cl JW | ||||||||
2.500%, 01/20/2052 | 200 | 152 | ||||||
GNMA TBA | ||||||||
6.500%, 10/15/2053 to 11/15/2053 | 6,600 | 6,634 | ||||||
6.000%, 12/01/2033 | 3,900 | 3,864 | ||||||
5.500%, 11/01/2034 | 11,875 | 11,523 | ||||||
5.000%, 10/01/2033 | 7,124 | 6,751 | ||||||
4.500%, 10/15/2053 | 5,750 | 5,312 | ||||||
4.000%, 10/15/2053 | 2,225 | 2,005 | ||||||
3.500%, 10/15/2053 | 10,183 | 8,919 | ||||||
3.000%, 10/15/2053 | 1,900 | 1,610 | ||||||
2.500%, 10/15/2053 | 18,732 | 15,308 | ||||||
2.000%, 10/15/2053 | 100 | 79 | ||||||
GNMA, Ser 103, Cl AD | ||||||||
1.450%, 01/16/2063 | 760 | 547 | ||||||
GNMA, Ser 107, Cl AD | ||||||||
2.839%, 11/16/2047(B) | 224 | 192 | ||||||
GNMA, Ser 110, Cl IO, IO | ||||||||
0.873%, 11/16/2063(B) | 2,366 | 150 | ||||||
GNMA, Ser 113, Cl Z | ||||||||
2.000%, 09/16/2061 | 2,256 | 1,247 | ||||||
GNMA, Ser 14, Cl AB | ||||||||
1.340%, 06/16/2063 | 507 | 370 | ||||||
Description | Face Amount | Market Value | ||||||
MORTGAGE-BACKED SECURITIES (continued) | ||||||||
GNMA, Ser 196, Cl BE | ||||||||
3.000%, 10/16/2064(B) | $ | 600 | $ | 404 | ||||
GNMA, Ser 2012-112, Cl IO, IO | ||||||||
0.111%, 02/16/2053(B) | 290 | 1 | ||||||
GNMA, Ser 2012-152, Cl IO, IO | ||||||||
0.611%, 01/16/2054(B) | 2,148 | 44 | ||||||
GNMA, Ser 2012-27, Cl IO, IO | ||||||||
0.236%, 04/16/2053(B) | 372 | 1 | ||||||
GNMA, Ser 2013-96, Cl IO, IO | ||||||||
0.051%, 10/16/2054(B) | 628 | 1 | ||||||
GNMA, Ser 2014-47, Cl IA, IO | ||||||||
0.148%, 02/16/2048(B) | 48 | – | ||||||
GNMA, Ser 2014-50, Cl IO, IO | ||||||||
0.628%, 09/16/2055(B) | 238 | 6 | ||||||
GNMA, Ser 2014-92, Cl IX, IO | ||||||||
0.100%, 05/16/2054(B) | 2,845 | 11 | ||||||
GNMA, Ser 2015-5, Cl IK, IO | ||||||||
0.276%, 11/16/2054(B) | 2,340 | 17 | ||||||
GNMA, Ser 2019-71, Cl PT | ||||||||
3.000%, 06/20/2049 | 150 | 131 | ||||||
GNMA, Ser 21, Cl AH | ||||||||
1.400%, 06/16/2063 | 87 | 64 | ||||||
GNMA, Ser 210, Cl IO, IO | ||||||||
0.695%, 07/16/2064(B) | 1,487 | 95 | ||||||
GNMA, Ser 216, Cl IO, IO | ||||||||
0.750%, 07/16/2065(B) | 1,492 | 95 | ||||||
GNMA, Ser 220, Cl E | ||||||||
3.000%, 10/16/2064(B) | 500 | 345 | ||||||
GNMA, Ser 3, Cl IO, IO | ||||||||
0.640%, 02/16/2061(B) | 679 | 34 | ||||||
GNMA, Ser 3, Cl B | ||||||||
1.850%, 02/16/2061 | 300 | 134 | ||||||
GNMA, Ser 41, Cl IO, IO | ||||||||
0.592%, 07/16/2058(B) | 510 | 14 | ||||||
GNMA, Ser 59, Cl IO, IO | ||||||||
0.571%, 02/16/2062(B) | 3,409 | 167 | ||||||
GNMA, Ser 60, Cl IO, IO | ||||||||
0.826%, 05/16/2063(B) | 2,262 | 132 | ||||||
GNMA, Ser 92, Cl IA, IO | ||||||||
0.611%, 06/16/2064(B) | 2,000 | 122 | ||||||
GNMA, Ser 92, Cl AH | ||||||||
2.000%, 06/16/2064 | 2,100 | 1,494 | ||||||
| 1,262,677 | ||||||||
Non-Agency Mortgage-Backed Obligations — 5.1% | ||||||||
Alen Mortgage Trust, Ser ACEN, Cl A | ||||||||
6.598%, TSFR1M + 1.264%, 04/15/2034(B)(D) | 885 | 802 | ||||||
Alternative Loan Trust, Ser 2006-18CB, Cl A6 | ||||||||
6.863%, 07/25/2036(B) | 142 | 100 | ||||||
SEI Institutional Managed Trust
173
SCHEDULE OF INVESTMENTS
September 30, 2023
Core Fixed Income Fund (Continued)
Description | Face Amount | Market Value | ||||||
MORTGAGE-BACKED SECURITIES (continued) | ||||||||
American Home Mortgage Investment Trust, Ser 2005-1, Cl 6A | ||||||||
7.886%, TSFR6M + 2.428%, 06/25/2045(B) | $ | 331 | $ | 327 | ||||
American Home Mortgage Investment Trust, Ser 2005-4, Cl 5A | ||||||||
7.654%, TSFR6M + 2.178%, 11/25/2045(B) | 667 | 283 | ||||||
American Home Mortgage Investment Trust, Ser 2006-1, Cl 12A1 | ||||||||
5.834%, TSFR1M + 0.514%, 03/25/2046(B) | 1,914 | 1,603 | ||||||
Angel Oak Mortgage Trust, Ser 2020-2, Cl A1A | ||||||||
2.531%, 01/26/2065(B)(D) | 261 | 236 | ||||||
Angel Oak Mortgage Trust, Ser 2020-5, Cl A1 | ||||||||
1.373%, 05/25/2065(B)(D) | 76 | 69 | ||||||
Angel Oak Mortgage Trust, Ser 2021-6, Cl A1 | ||||||||
1.458%, 09/25/2066(B)(D) | 486 | 374 | ||||||
Angel Oak Mortgage Trust, Ser 2022-2, Cl A1 | ||||||||
3.353%, 01/25/2067(B)(D) | 4,624 | 4,038 | ||||||
Arbor Multifamily Mortgage Securities Trust, Ser MF2, Cl B | ||||||||
2.560%, 06/15/2054(B)(D) | 615 | 446 | ||||||
AREIT, Ser 2022-CRE7, Cl A | ||||||||
7.573%, TSFR1M + 2.242%, 06/17/2039(B)(D) | 2,050 | 2,047 | ||||||
BAMLL Commercial Mortgage Securities Trust, Ser 2018-PARK, Cl A | ||||||||
4.227%, 08/10/2038(B)(D) | 1,790 | 1,567 | ||||||
BAMLL Re-REMIC Trust, Ser 2016-GG10, Cl AJA | ||||||||
5.818%, 08/10/2045(B)(D) | 721 | 150 | ||||||
BANK, Ser BNK40, Cl A4 | ||||||||
3.507%, 03/15/2064(B) | 605 | 505 | ||||||
BANK, Ser BNK42, Cl A5 | ||||||||
4.493%, 06/15/2055(B) | 655 | 590 | ||||||
BANK, Ser BNK43, Cl A5 | ||||||||
4.399%, 08/15/2055 | 1,715 | 1,530 | ||||||
BBCMS Mortgage Trust, Ser C2, Cl ASB | ||||||||
4.236%, 12/15/2051 | 211 | 201 | ||||||
BBCMS Mortgage Trust, Ser C6, Cl A2 | ||||||||
2.690%, 02/15/2053 | 660 | 617 | ||||||
BBCMS Trust, Ser 2015-SRCH, Cl A1 | ||||||||
3.312%, 08/10/2035(D) | 416 | 378 | ||||||
Bear Stearns Adjustable Rate Mortgage Trust, Ser 2004-2, Cl 14A | ||||||||
3.859%, 05/25/2034(B) | 4 | 4 | ||||||
Bear Stearns ARM Trust, Ser 2003-7, Cl 9A | ||||||||
4.511%, 10/25/2033(B) | 209 | 188 | ||||||
Description | Face Amount | Market Value | ||||||
MORTGAGE-BACKED SECURITIES (continued) | ||||||||
Bear Stearns Asset Backed Securities I Trust, Ser 2005-AC8, Cl A3, IO | ||||||||
2.216%, 11/25/2035(B) | $ | 2,326 | $ | 357 | ||||
Bear Stearns Asset-Backed Securities I Trust, Ser 2005-AC6, Cl 1A3 | ||||||||
5.500%, 09/25/2035(B) | 478 | 441 | ||||||
Bear Stearns Mortgage Funding Trust, Ser 2007-AR3, Cl 1A1 | ||||||||
5.574%, TSFR1M + 0.254%, 03/25/2037(B) | 2,352 | 1,968 | ||||||
Benchmark Mortgage Trust, Ser B33, Cl A5 | ||||||||
3.458%, 03/15/2055 | 935 | 788 | ||||||
Benchmark Mortgage Trust, Ser B35, Cl A5 | ||||||||
4.593%, 05/15/2055(B) | 485 | 425 | ||||||
Benchmark Mortgage Trust, Ser B35, Cl AS | ||||||||
4.593%, 05/15/2055(B) | 775 | 645 | ||||||
BMO Mortgage Trust, Ser C1, Cl A1 | ||||||||
2.198%, 02/15/2055 | 589 | 551 | ||||||
BPR Trust, Ser OANA, Cl A | ||||||||
7.230%, TSFR1M + 1.898%, 04/15/2037(B)(D) | 430 | 422 | ||||||
BPR Trust, Ser STAR, Cl A | ||||||||
8.564%, TSFR1M + 3.232%, 08/15/2024(B)(D) | 1,785 | 1,772 | ||||||
BPR Trust, Ser TY, Cl A | ||||||||
6.498%, TSFR1M + 1.164%, 09/15/2038(B)(D) | 415 | 399 | ||||||
Bunker Hill Loan Depositary Trust, Ser 2019-2, Cl A1 | ||||||||
2.879%, 07/25/2049(C)(D) | 324 | 299 | ||||||
Bunker Hill Loan Depositary Trust, Ser 2019-3, Cl A1 | ||||||||
2.724%, 11/25/2059(C)(D) | 155 | 148 | ||||||
BWAY Mortgage Trust, Ser 1740, Cl A | ||||||||
2.917%, 01/10/2035(D) | 1,540 | 955 | ||||||
BX Commercial Mortgage Trust, Ser 2019-XL, Cl F | ||||||||
7.447%, TSFR1M + 2.114%, 10/15/2036(B)(D) | 2,303 | 2,279 | ||||||
BX Commercial Mortgage Trust, Ser 2019-XL, Cl A | ||||||||
6.367%, TSFR1M + 1.034%, 10/15/2036(B)(D) | 3,825 | 3,814 | ||||||
BX Commercial Mortgage Trust, Ser 2023-VLT2, Cl E | ||||||||
11.203%, TSFR1M + 5.871%, 06/15/2040(B)(D) | 1,740 | 1,733 | ||||||
BX Commercial Mortgage Trust, Ser VIV4, Cl A | ||||||||
2.843%, 03/09/2044(D) | 2,000 | 1,626 | ||||||
174
SEI Institutional Managed Trust
Description | Face Amount | Market Value | ||||||
MORTGAGE-BACKED SECURITIES (continued) | ||||||||
BX Commercial Mortgage Trust, Ser VOLT, Cl A | ||||||||
6.147%, TSFR1M + 0.814%, 09/15/2036(B)(D) | $ | 2,867 | $ | 2,790 | ||||
BX Commercial Mortgage Trust, Ser XL2, Cl A | ||||||||
6.135%, TSFR1M + 0.803%, 10/15/2038(B)(D) | 703 | 687 | ||||||
BX Trust, Ser 2019-OC11, Cl A | ||||||||
3.202%, 12/09/2041(D) | 1,200 | 1,011 | ||||||
BX Trust, Ser MMP, Cl A | ||||||||
6.376%, TSFR1M + 1.044%, 08/15/2036(B)(D) | 388 | 380 | ||||||
CD Commercial Mortgage Trust, Ser 2006-CD2, Cl X, IO | ||||||||
0.023%, 01/15/2046(B)(D) | 11 | – | ||||||
CD Commercial Mortgage Trust, Ser 2017-CD3, Cl A4 | ||||||||
3.631%, 02/10/2050 | 310 | 279 | ||||||
CFCRE Commercial Mortgage Trust, Ser 2017-C8, Cl A4 | ||||||||
3.572%, 06/15/2050 | 371 | 339 | ||||||
CFCRE Commercial Mortgage Trust, Ser 2017-C8, Cl ASB | ||||||||
3.367%, 06/15/2050 | 216 | 206 | ||||||
CFCRE Commercial Mortgage Trust, Ser C4, Cl AM | ||||||||
3.691%, 05/10/2058 | 2,502 | 2,278 | ||||||
CFK Trust, Ser 2020-MF2, Cl E | ||||||||
3.573%, 03/15/2039(B)(D) | 2,840 | 2,159 | ||||||
CFK Trust, Ser MF2, Cl F | ||||||||
3.573%, 03/15/2039(B)(D) | 2,960 | 2,134 | ||||||
Chase Mortgage Finance, Ser 2007-A1, Cl 2A1 | ||||||||
5.269%, 02/25/2037(B) | 5 | 5 | ||||||
Chase Mortgage Finance, Ser 2007-A1, Cl 9A1 | ||||||||
4.738%, 02/25/2037(B) | 3 | 3 | ||||||
Chase Mortgage Finance, Ser 2007-A2, Cl 1A1 | ||||||||
5.155%, 06/25/2035(B) | 4 | 4 | ||||||
CIM Trust, Ser 2018-INV1, Cl A4 | ||||||||
4.000%, 08/25/2048(B)(D) | 48 | 43 | ||||||
CIM Trust, Ser 2021-R6, Cl A1 | ||||||||
1.425%, 07/25/2061(B)(D) | 1,058 | 893 | ||||||
CIM TRUST, Ser 2022-R2, Cl A1 | ||||||||
3.750%, 12/25/2061(B)(D) | 667 | 601 | ||||||
Citigroup Commercial Mortgage Trust, Ser 2013-375P, Cl A | ||||||||
3.251%, 05/10/2035(D) | 230 | 214 | ||||||
Citigroup Commercial Mortgage Trust, Ser 2019-GC41, Cl A5 | ||||||||
2.869%, 08/10/2056 | 2,680 | 2,267 | ||||||
Description | Face Amount | Market Value | ||||||
MORTGAGE-BACKED SECURITIES (continued) | ||||||||
Citigroup Global Markets Mortgage Securities VII, Ser 2003-HYB1, Cl A | ||||||||
6.240%, 09/25/2033(B) | $ | 3 | $ | 3 | ||||
COLT Mortgage Loan Trust, Ser 2021-2, Cl A1 | ||||||||
0.924%, 08/25/2066(B)(D) | 641 | 485 | ||||||
COLT Mortgage Loan Trust, Ser 2021-4, Cl A1 | ||||||||
1.397%, 10/25/2066(B)(D) | 695 | 534 | ||||||
COMM Mortgage Trust, Ser 2013-CR12, Cl AM | ||||||||
4.300%, 10/10/2046 | 130 | 113 | ||||||
COMM Mortgage Trust, Ser 2013-CR12, Cl C | ||||||||
5.112%, 10/10/2046(B) | 70 | 25 | ||||||
COMM Mortgage Trust, Ser 2013-CR12, Cl B | ||||||||
4.762%, 10/10/2046(B) | 120 | 85 | ||||||
COMM Mortgage Trust, Ser 2013-CR6, Cl B | ||||||||
3.397%, 03/10/2046(D) | 140 | 118 | ||||||
COMM Mortgage Trust, Ser 2014-UBS2, Cl XA, IO | ||||||||
1.188%, 03/10/2047(B) | 1,148 | – | ||||||
COMM Mortgage Trust, Ser 2014-UBS2, Cl A5 | ||||||||
3.961%, 03/10/2047 | 236 | 234 | ||||||
COMM Mortgage Trust, Ser 2014-UBS3, Cl AM | ||||||||
4.012%, 06/10/2047 | 285 | 278 | ||||||
COMM Mortgage Trust, Ser 2015-LC19, Cl XA, IO | ||||||||
1.222%, 02/10/2048(B) | 5,188 | 46 | ||||||
COMM Mortgage Trust, Ser 2017-PANW, Cl A | ||||||||
3.244%, 10/10/2029(D) | 410 | 370 | ||||||
COMM Mortgage Trust, Ser CBM, Cl A2 | ||||||||
2.896%, 02/10/2037(D) | 1,085 | 1,024 | ||||||
COMM Mortgage Trust, Ser CR13, Cl A4 | ||||||||
4.194%, 11/10/2046(B) | 188 | 187 | ||||||
COMM Mortgage Trust, Ser CR14, Cl B | ||||||||
4.672%, 02/10/2047(B) | 850 | 750 | ||||||
COMM Mortgage Trust, Ser CR26, Cl C | ||||||||
4.614%, 10/10/2048(B) | 870 | 767 | ||||||
COMM Mortgage Trust, Ser LC23, Cl A3 | ||||||||
3.521%, 10/10/2048 | 353 | 340 | ||||||
COMM Mortgage Trust, Ser UBS4, Cl A4 | ||||||||
3.420%, 08/10/2047 | 729 | 712 | ||||||
Commercial Mortgage Pass-Through Certificates, Ser 2012-CR4, Cl AM | ||||||||
3.251%, 10/15/2045 | 590 | 498 | ||||||
Connecticut Avenue Securities Trust, Ser 2019-R07, Cl 1M2 | ||||||||
7.529%, SOFR30A + 2.214%, 10/25/2039(B)(D) | 47 | 47 | ||||||
SEI Institutional Managed Trust
175
SCHEDULE OF INVESTMENTS
September 30, 2023
Core Fixed Income Fund (Continued)
Description | Face Amount | Market Value | ||||||
MORTGAGE-BACKED SECURITIES (continued) | ||||||||
Connecticut Avenue Securities Trust, Ser 2020-R01, Cl 1M2 | ||||||||
7.479%, SOFR30A + 2.164%, 01/25/2040(B)(D) | $ | 165 | $ | 166 | ||||
Credit Suisse First Boston Mortgage Securities, Ser 2003-29, Cl 5A1 | ||||||||
7.000%, 12/25/2033 | 11 | 11 | ||||||
Credit Suisse First Boston Mortgage Securities, Ser 2003-AR24, Cl 2A4 | ||||||||
5.672%, 10/25/2033(B) | 258 | 247 | ||||||
Credit Suisse Mortgage Trust, Ser 2022-7R, Cl 1A1 | ||||||||
8.816%, SOFR30A + 3.500%, 10/25/2066(B)(D) | 1,274 | 1,231 | ||||||
CSAIL Commercial Mortgage Trust, Ser 2015-C3, Cl A3 | ||||||||
3.447%, 08/15/2048 | 459 | 440 | ||||||
CSAIL Commercial Mortgage Trust, Ser C20, Cl A3 | ||||||||
2.805%, 03/15/2054 | 810 | 648 | ||||||
CSAIL Commercial Mortgage Trust, Ser C3, Cl ASB | ||||||||
3.448%, 08/15/2048 | 505 | 496 | ||||||
CSMC Trust, Ser 2014-USA, Cl E | ||||||||
4.373%, 09/15/2037(D) | 290 | 155 | ||||||
CSMC Trust, Ser 2017-CHOP, Cl G | ||||||||
10.794%, PRIME + 5.350%, 07/15/2032(B)(D) | 1,000 | 916 | ||||||
CSMC Trust, Ser 2017-PFHP, Cl A | ||||||||
6.330%, TSFR1M + 0.997%, 12/15/2030(B)(D) | 1,190 | 1,133 | ||||||
CSMC Trust, Ser 2017-RPL1, Cl M2 | ||||||||
2.962%, 07/25/2057(B)(D) | 1,760 | 1,212 | ||||||
CSMC Trust, Ser 2018-J1, Cl A2 | ||||||||
3.500%, 02/25/2048(B)(D) | 1,724 | 1,477 | ||||||
CSMC Trust, Ser 2020-RPL4, Cl A1 | ||||||||
2.000%, 01/25/2060(B)(D) | 551 | 467 | ||||||
CSMC Trust, Ser 2021-RPL3, Cl A1 | ||||||||
2.000%, 01/25/2060(B)(D) | 1,515 | 1,258 | ||||||
CSMC Trust, Ser 2021-RPL4, Cl A1 | ||||||||
1.796%, 12/27/2060(B)(D) | 426 | 396 | ||||||
CSMC Trust, Ser 2021-RPL6, Cl A1 | ||||||||
2.000%, 10/25/2060(B)(D) | 1,373 | 1,189 | ||||||
CSMC, Ser 2014-11R, Cl 9A2 | ||||||||
5.709%, TSFR1M + 0.254%, 10/27/2036(B)(D) | 1,653 | 1,251 | ||||||
CSMC, Ser 2014-USA, Cl A2 | ||||||||
3.953%, 09/15/2037(D) | 1,310 | 1,118 | ||||||
CSMC, Ser 2022-ATH2, Cl A1 | ||||||||
4.547%, 05/25/2067(B)(D) | 2,858 | 2,699 | ||||||
CSMC, Ser MARK, Cl A | ||||||||
8.028%, TSFR1M + 2.695%, 06/15/2039(B)(D) | 480 | 476 | ||||||
Description | Face Amount | Market Value | ||||||
MORTGAGE-BACKED SECURITIES (continued) | ||||||||
DBCCRE Mortgage Trust, Ser 2014-ARCP, Cl A | ||||||||
4.238%, 01/10/2034(D) | $ | 1,175 | $ | 1,158 | ||||
DBCCRE Mortgage Trust, Ser 2018-ARCP, Cl C | ||||||||
5.099%, 01/10/2034(B)(D) | 550 | 538 | ||||||
DC Office Trust, Ser 2019-MTC, Cl A | ||||||||
2.965%, 09/15/2045(D) | 1,240 | 979 | ||||||
DSLA Mortgage Loan Trust, Ser 2004-AR2, Cl A2B | ||||||||
6.242%, TSFR1M + 0.914%, 11/19/2044(B) | 237 | 219 | ||||||
ELP Commercial Mortgage Trust, Ser ELP, Cl C | ||||||||
6.767%, TSFR1M + 1.434%, 11/15/2038(B)(D) | 2,500 | 2,437 | ||||||
EQUS Mortgage Trust, Ser EQAZ, Cl B | ||||||||
6.548%, TSFR1M + 1.214%, 10/15/2038(B)(D) | 790 | 768 | ||||||
EQUS Mortgage Trust, Ser EQAZ, Cl A | ||||||||
6.202%, TSFR1M + 0.869%, 10/15/2038(B)(D) | 816 | 797 | ||||||
EverBank Mortgage Loan Trust, Ser 2018-1, Cl A22 | ||||||||
3.500%, 02/25/2048(B)(D) | 128 | 109 | ||||||
FHLMC STACR REMIC Trust, Ser 2021-DNA6, Cl B1 | ||||||||
8.715%, SOFR30A + 3.400%, 10/25/2041(B)(D) | 920 | 930 | ||||||
FHLMC STACR REMIC Trust, Ser 2021-DNA6, Cl M2 | ||||||||
6.815%, SOFR30A + 1.500%, 10/25/2041(B)(D) | 5,746 | 5,663 | ||||||
FHLMC STACR REMIC Trust, Ser 2022-DNA2, Cl M2 | ||||||||
9.065%, SOFR30A + 3.750%, 02/25/2042(B)(D) | 440 | 451 | ||||||
FHLMC STACR REMIC Trust, Ser 2022-DNA2, Cl M1B | ||||||||
7.715%, SOFR30A + 2.400%, 02/25/2042(B)(D) | 1,220 | 1,226 | ||||||
FHLMC STACR REMIC Trust, Ser 2022-DNA3, Cl B1 | ||||||||
10.965%, SOFR30A + 5.650%, 04/25/2042(B)(D) | 420 | 445 | ||||||
FHLMC Structured Agency Credit Risk Debt Notes, Ser 2023-DNA2, Cl M1A | ||||||||
7.415%, SOFR30A + 2.100%, 04/25/2043(B)(D) | 1,633 | 1,649 | ||||||
Flagstar Mortgage Trust, Ser 2018-2, Cl A4 | ||||||||
3.500%, 04/25/2048(B)(D) | 30 | 29 | ||||||
176
SEI Institutional Managed Trust
Description | Face Amount | Market Value | ||||||
MORTGAGE-BACKED SECURITIES (continued) | ||||||||
GPMT, Ser 2021-FL3, Cl A | ||||||||
6.695%, TSFR1M + 1.364%, 07/16/2035(B)(D) | $ | 621 | $ | 613 | ||||
GS Mortgage Securities II, Ser 2017-SLP, Cl C | ||||||||
3.924%, 10/10/2032(D) | 1,310 | 1,277 | ||||||
GS Mortgage Securities II, Ser ARDN, Cl B | ||||||||
7.097%, TSFR1M + 1.764%, 11/15/2036(B)(D) | 1,623 | 1,567 | ||||||
GS Mortgage Securities II, Ser GC30, Cl B | ||||||||
4.160%, 05/10/2050(B) | 480 | 434 | ||||||
GS Mortgage Securities II, Ser SRP5, Cl A | ||||||||
7.248%, TSFR1M + 1.800%, 09/15/2031(B)(D) | 2,581 | 2,145 | ||||||
GS Mortgage Securities Trust, Ser 2013-GC16, Cl B | ||||||||
5.161%, 11/10/2046(B) | 192 | 190 | ||||||
GS Mortgage Securities Trust, Ser 2014-GC18, Cl A4 | ||||||||
4.074%, 01/10/2047 | 977 | 971 | ||||||
GS Mortgage Securities Trust, Ser 2014-GC26, Cl B | ||||||||
4.215%, 11/10/2047(B) | 680 | 597 | ||||||
GS Mortgage Securities Trust, Ser GSA2, Cl A4 | ||||||||
1.721%, 12/12/2053 | 1,055 | 809 | ||||||
GS Mortgage Securities Trust, Ser ROSS, Cl A | ||||||||
6.598%, TSFR1M + 1.264%, 05/15/2026(B)(D) | 2,170 | 1,913 | ||||||
GS Mortgage-Backed Securities Trust, Ser 2018-RPL1, Cl A1A | ||||||||
3.750%, 10/25/2057(D) | 1,739 | 1,639 | ||||||
GS Mortgage-Backed Securities Trust, Ser 2022-PJ2, Cl A24 | ||||||||
3.000%, 06/25/2052(B)(D) | 790 | 679 | ||||||
GSMPS Mortgage Loan Trust, Ser 1998-1, Cl A | ||||||||
8.000%, 09/19/2027(B)(D) | 10 | 9 | ||||||
GSR Mortgage Loan Trust, Ser 2003-13, Cl 1A1 | ||||||||
5.561%, 10/25/2033(B) | 86 | 84 | ||||||
GSR Mortgage Loan Trust, Ser 2004-8F, Cl 2A3 | ||||||||
6.000%, 09/25/2034 | 8 | 8 | ||||||
GSR Mortgage Loan Trust, Ser 2007-1F, Cl 2A4 | ||||||||
5.500%, 01/25/2037 | 1 | 2 | ||||||
HarborView Mortgage Loan, Ser 2004-3, Cl 1A | ||||||||
4.278%, 05/19/2034(B) | 352 | 335 | ||||||
Description | Face Amount | Market Value | ||||||
MORTGAGE-BACKED SECURITIES (continued) | ||||||||
HIT Trust, Ser HI32, Cl A | ||||||||
7.723%, TSFR1M + 2.391%, 07/15/2024(B)(D) | $ | 1,512 | $ | 1,510 | ||||
Hudson Yards Mortgage Trust, Ser 2019-30HY, Cl A | ||||||||
3.228%, 07/10/2039(D) | 1,225 | 1,035 | ||||||
Hudson Yards Mortgage Trust, Ser 2019-55HY, Cl A | ||||||||
3.041%, 12/10/2041(B)(D) | 1,240 | 1,021 | ||||||
Impact Funding, Ser 2010-1, Cl A1 | ||||||||
5.314%, 01/25/2051(D) | 398 | 386 | ||||||
JPMBB Commercial Mortgage Securities Trust, Ser 2013-C17, Cl B | ||||||||
5.032%, 01/15/2047(B) | 130 | 117 | ||||||
JPMBB Commercial Mortgage Securities Trust, Ser 2014-C22, Cl C | ||||||||
4.700%, 09/15/2047(B) | 120 | 91 | ||||||
JPMBB Commercial Mortgage Securities Trust, Ser 2014-C23, Cl A4 | ||||||||
3.670%, 09/15/2047 | 275 | 269 | ||||||
JPMBB Commercial Mortgage Securities Trust, Ser 2015-C28, Cl A3 | ||||||||
2.912%, 10/15/2048 | 1,160 | 1,120 | ||||||
JPMBB Commercial Mortgage Securities Trust, Ser 2015-C30, Cl A5 | ||||||||
3.822%, 07/15/2048 | 568 | 535 | ||||||
JPMBB Commercial Mortgage Securities Trust, Ser C15, Cl AS | ||||||||
4.420%, 11/15/2045 | 179 | 178 | ||||||
JPMBB Commercial Mortgage Securities Trust, Ser C17, Cl A4 | ||||||||
4.199%, 01/15/2047 | 120 | 118 | ||||||
JPMBB Commercial Mortgage Securities Trust, Ser C21, Cl AS | ||||||||
3.997%, 08/15/2047 | 415 | 400 | ||||||
JPMorgan Chase Commercial Mortgage Securities Trust, Ser 2007-LD12, Cl AJ | ||||||||
6.561%, 02/15/2051(B) | 1 | 1 | ||||||
JPMorgan Chase Commercial Mortgage Securities Trust, Ser 2014-C20, Cl C | ||||||||
4.673%, 07/15/2047(B) | 380 | 283 | ||||||
JPMorgan Chase Commercial Mortgage Securities Trust, Ser 2019-OSB, Cl A | ||||||||
3.397%, 06/05/2039(D) | 1,500 | 1,272 | ||||||
JPMorgan Chase Commercial Mortgage Securities Trust, Ser C16, Cl A4 | ||||||||
4.166%, 12/15/2046 | 39 | 39 | ||||||
JPMorgan Chase Commercial Mortgage Securities Trust, Ser JP4, Cl A3 | ||||||||
3.393%, 12/15/2049 | 206 | 191 | ||||||
JPMorgan Mortgage Trust, Ser 2006-A2, Cl 4A1 | ||||||||
5.594%, 08/25/2034(B) | 23 | 23 | ||||||
SEI Institutional Managed Trust
177
SCHEDULE OF INVESTMENTS
September 30, 2023
Core Fixed Income Fund (Continued)
Description | Face Amount | Market Value | ||||||
MORTGAGE-BACKED SECURITIES (continued) | ||||||||
JPMorgan Mortgage Trust, Ser 2006-A2, Cl 5A3 | ||||||||
5.103%, 11/25/2033(B) | $ | 7 | $ | 7 | ||||
JPMorgan Mortgage Trust, Ser 2015-5, Cl A9 | ||||||||
6.652%, 05/25/2045(B)(D) | 21 | 21 | ||||||
JPMorgan Mortgage Trust, Ser 2018-4, Cl A1 | ||||||||
3.500%, 10/25/2048(B)(D) | 93 | 80 | ||||||
JPMorgan Mortgage Trust, Ser 2018-5, Cl A1 | ||||||||
3.500%, 10/25/2048(B)(D) | 295 | 250 | ||||||
JPMorgan Mortgage Trust, Ser 2020-1, Cl A3A | ||||||||
3.000%, 06/25/2050(B)(D) | 137 | 114 | ||||||
JPMorgan Mortgage Trust, Ser 2022-3, Cl A2 | ||||||||
3.000%, 08/25/2052(B)(D) | 494 | 389 | ||||||
Legacy Mortgage Asset Trust, Ser 2021-GS2, Cl A1 | ||||||||
1.750%, 04/25/2061(C)(D) | 463 | 427 | ||||||
Lehman XS Trust, Ser 2007-16N, Cl 2A2 | ||||||||
7.134%, TSFR1M + 1.814%, 09/25/2047(B) | 3,656 | 3,115 | ||||||
Master Resecuritization Trust, Ser 2005, Cl 3, PO | ||||||||
0.000%, 05/28/2035(A)(D) | 2 | 1 | ||||||
MASTR Reperforming Loan Trust, Ser 2005-1, Cl 1A1 | ||||||||
6.000%, 08/25/2034(D) | 1,012 | 637 | ||||||
Med Trust, Ser MDLN, Cl A | ||||||||
6.397%, TSFR1M + 1.064%, 11/15/2038(B)(D) | 1,308 | 1,275 | ||||||
Merrill Lynch Mortgage Investors Trust, Ser 2003-A4, Cl 2A | ||||||||
5.700%, 07/25/2033(B) | 6 | 5 | ||||||
MFA Trust, Ser 2021-RPL1, Cl A1 | ||||||||
1.131%, 07/25/2060(B)(D) | 492 | 423 | ||||||
MHC Trust, Ser MHC2, Cl A | ||||||||
6.297%, TSFR1M + 0.964%, 05/15/2038(B)(D) | 763 | 750 | ||||||
Mill City Mortgage Loan Trust, Ser 2021-NMR1, Cl A1 | ||||||||
1.125%, 11/25/2060(B)(D) | 551 | 504 | ||||||
ML-CFC Commercial Mortgage Trust, Ser 2007-5, Cl AJ | ||||||||
5.450%, 08/12/2048(B) | 82 | 20 | ||||||
ML-CFC Commercial Mortgage Trust, Ser 2007-5, Cl AJFL | ||||||||
5.450%, 08/12/2048(B)(D) | 11 | 3 | ||||||
ML-CFC Commercial Mortgage Trust, Ser 2007-9, Cl AJ | ||||||||
6.193%, 09/12/2049(B) | 14 | 13 | ||||||
Description | Face Amount | Market Value | ||||||
MORTGAGE-BACKED SECURITIES (continued) | ||||||||
Morgan Stanley BAML Trust, Ser 2012-CKSV, Cl A2 | ||||||||
3.277%, 10/15/2030(D) | $ | 709 | $ | 585 | ||||
Morgan Stanley Bank of America Merrill Lynch Trust, Ser 2013-C9, Cl AS | ||||||||
3.456%, 05/15/2046 | 15 | 14 | ||||||
Morgan Stanley Bank of America Merrill Lynch Trust, Ser 2015-C25, Cl A5 | ||||||||
3.635%, 10/15/2048 | 250 | 236 | ||||||
Morgan Stanley Bank of America Merrill Lynch Trust, Ser C34, Cl B | ||||||||
4.111%, 11/15/2052(B) | 1,030 | 879 | ||||||
Morgan Stanley Capital I Trust, Ser 2007-IQ16, Cl AJ | ||||||||
6.282%, 12/12/2049(B) | 53 | 26 | ||||||
Morgan Stanley Capital I Trust, Ser 2016-BNK2, Cl XA, IO | ||||||||
1.086%, 11/15/2049(B) | 2,788 | 63 | ||||||
Morgan Stanley Capital I Trust, Ser 2017-ASHF, Cl A | ||||||||
6.355%, TSFR1M + 1.022%, 11/15/2034(B)(D) | 35 | 34 | ||||||
Morgan Stanley Capital I Trust, Ser 2019-BPR, Cl A | ||||||||
7.322%, TSFR1M + 1.992%, 05/15/2036(B)(D) | 1,352 | 1,301 | ||||||
Morgan Stanley Capital I Trust, Ser HR8, Cl A3 | ||||||||
1.790%, 07/15/2053 | 576 | 446 | ||||||
Morgan Stanley Capital I Trust, Ser L8, Cl AS | ||||||||
3.921%, 04/15/2055(B) | 580 | 471 | ||||||
Morgan Stanley Residential Mortgage Loan Trust, Ser 2021-2, Cl A3 | ||||||||
2.500%, 05/25/2051(B)(D) | 5,302 | 4,001 | ||||||
MSCG Trust, Ser 2015-ALDR, Cl A2 | ||||||||
3.577%, 06/07/2035(B)(D) | 620 | 570 | ||||||
New Residential Mortgage Loan Trust, Ser 2017-1A, Cl A1 | ||||||||
4.000%, 02/25/2057(B)(D) | 472 | 436 | ||||||
New Residential Mortgage Loan Trust, Ser 2019-NQM4, Cl A1 | ||||||||
2.492%, 09/25/2059(B)(D) | 122 | 112 | ||||||
New Residential Mortgage Loan Trust, Ser 2021-NQM3, Cl A3 | ||||||||
1.516%, 11/27/2056(B)(D) | 340 | 270 | ||||||
New Residential Mortgage Loan Trust, Ser 2022-NQM4, Cl A1 | ||||||||
5.000%, 06/25/2062(C)(D) | 1,715 | 1,657 | ||||||
NewRez Warehouse Securitization Trust, Ser 2021-1, Cl A | ||||||||
6.184%, TSFR1M + 0.864%, 05/25/2055(B)(D) | 1,696 | 1,689 | ||||||
178
SEI Institutional Managed Trust
Description | Face Amount | Market Value | ||||||
MORTGAGE-BACKED SECURITIES (continued) | ||||||||
OBX Trust, Ser 2019-EXP1, Cl 1A3 | ||||||||
4.000%, 01/25/2059(B)(D) | $ | 31 | $ | 29 | ||||
OBX Trust, Ser 2020-EXP3, Cl 2A1A | ||||||||
6.334%, TSFR1M + 1.014%, 01/25/2060(B)(D) | 14 | 14 | ||||||
OBX Trust, Ser 2021-NQM2, Cl A1 | ||||||||
1.101%, 05/25/2061(B)(D) | 479 | 358 | ||||||
OBX Trust, Ser 2021-NQM3, Cl A3 | ||||||||
1.362%, 07/25/2061(B)(D) | 1,058 | 775 | ||||||
One Bryant Park Trust, Ser 2019-OBP, Cl A | ||||||||
2.516%, 09/15/2054(D) | 1,570 | 1,247 | ||||||
PHH Alternative Mortgage Trust, Ser 2007-3, Cl A3 | ||||||||
6.034%, TSFR1M + 0.714%, 07/25/2037(B) | 2,568 | 2,421 | ||||||
Prime Mortgage Trust, Ser 2004-CL1, Cl 1A1 | ||||||||
6.000%, 02/25/2034 | 6 | 6 | ||||||
Prime Mortgage Trust, Ser 2004-CL1, Cl 1, PO | ||||||||
0.000%, 02/25/2034(A) | 2 | 1 | ||||||
Prime Mortgage Trust, Ser 2006-DR1, Cl 2A1 | ||||||||
5.500%, 05/25/2035(D) | 539 | 453 | ||||||
PRKCM Trust, Ser 2022-AFC1, Cl A1A | ||||||||
4.100%, 04/25/2057(B)(D) | 1,630 | 1,500 | ||||||
RATE Mortgage Trust, Ser 2021-HB1, Cl A1 | ||||||||
2.500%, 12/25/2051(B)(D) | 2,016 | 1,520 | ||||||
Rate Mortgage Trust, Ser 2021-J1, Cl A7 | ||||||||
2.500%, 07/25/2051(B)(D) | 279 | 234 | ||||||
Rate Mortgage Trust, Ser 2021-J1, Cl A1 | ||||||||
2.500%, 07/25/2051(B)(D) | 390 | 294 | ||||||
Rate Mortgage Trust, Ser 2022-J1, Cl A7 | ||||||||
3.000%, 01/25/2052(B)(D) | 878 | 691 | ||||||
RBSCF Trust, Ser 2013-GSP, Cl A | ||||||||
3.961%, 01/15/2032(B)(D) | 445 | 438 | ||||||
RCKT Mortgage Trust, Ser 2021-3, Cl A1 | ||||||||
2.500%, 07/25/2051(B)(D) | 467 | 352 | ||||||
RCKT Mortgage Trust, Ser 2022-2, Cl A2 | ||||||||
2.500%, 02/25/2052(B)(D) | 584 | 440 | ||||||
Residential Asset Securitization Trust, Ser 2004-IP2, Cl 2A1 | ||||||||
3.707%, 12/25/2034(B) | 192 | 171 | ||||||
Residential Mortgage Loan Trust, Ser 2019-3, Cl A1 | ||||||||
2.633%, 09/25/2059(B)(D) | 145 | 140 | ||||||
Seasoned Credit Risk Transfer Trust, Ser 2016-1, Cl M2 | ||||||||
3.750%, 09/25/2055(B)(D) | 2,145 | 1,896 | ||||||
Seasoned Credit Risk Transfer Trust, Ser 2019-1, Cl M | ||||||||
4.750%, 07/25/2058(B)(D) | 2,840 | 2,577 | ||||||
Sequoia Mortgage Trust, Ser 2018-CH4, Cl B1B | ||||||||
4.991%, 10/25/2048(B)(D) | 1,121 | 1,051 | ||||||
Description | Face Amount | Market Value | ||||||
MORTGAGE-BACKED SECURITIES (continued) | ||||||||
SFAVE Commercial Mortgage Securities Trust, Ser 2015-5AVE, Cl A2B | ||||||||
4.144%, 01/05/2043(B)(D) | $ | 75 | $ | 49 | ||||
SFAVE Commercial Mortgage Securities Trust, Ser 2015-5AVE, Cl A1 | ||||||||
3.872%, 01/05/2043(B)(D) | 390 | 259 | ||||||
Stack Infrastructure Issuer, Ser 2019-1A, Cl A2 | ||||||||
4.540%, 02/25/2044(D) | 111 | 110 | ||||||
STAR Trust, Ser 2021-1, Cl A1 | ||||||||
1.219%, 05/25/2065(B)(D) | 221 | 191 | ||||||
Starwood Mortgage Residential Trust, Ser 2020-1, Cl A1 | ||||||||
2.275%, 02/25/2050(B)(D) | 43 | 40 | ||||||
Starwood Mortgage Residential Trust, Ser 2020-3, Cl A1 | ||||||||
1.486%, 04/25/2065(B)(D) | 156 | 144 | ||||||
Starwood Mortgage Residential Trust, Ser 2020-INV1, Cl A1 | ||||||||
1.027%, 11/25/2055(B)(D) | 176 | 154 | ||||||
Starwood Mortgage Residential Trust, Ser 2021-4, Cl A1 | ||||||||
1.162%, 08/25/2056(B)(D) | 616 | 505 | ||||||
Structured Asset Mortgage Investments II Trust, Ser 2007-AR3, Cl 2A1 | ||||||||
5.624%, TSFR1M + 0.304%, 09/25/2047(B) | 1,926 | 1,699 | ||||||
Structured Asset Securities Mortgage Pass-Through Certificates, Ser 2003-24A, Cl 3A2 | ||||||||
7.075%, 07/25/2033(B) | 24 | 23 | ||||||
Structured Asset Securities Mortgage Pass-Through Certificates, Ser 2003-37A, Cl 2A | ||||||||
5.324%, 12/25/2033(B) | 9 | 9 | ||||||
Towd Point Mortgage Trust, Ser 2017-5, Cl A1 | ||||||||
5.280%, TSFR1M + 0.714%, 02/25/2057(B)(D) | 192 | 192 | ||||||
Towd Point Mortgage Trust, Ser 2017-6, Cl M1 | ||||||||
3.250%, 10/25/2057(B)(D) | 1,050 | 898 | ||||||
Towd Point Mortgage Trust, Ser 2019-4, Cl A1 | ||||||||
2.900%, 10/25/2059(B)(D) | 675 | 618 | ||||||
Towd Point Mortgage Trust, Ser 2019-MH1, Cl A1 | ||||||||
3.000%, 11/25/2058(B)(D) | 532 | 527 | ||||||
Towd Point Mortgage Trust, Ser 2020-3, Cl A1 | ||||||||
3.088%, 02/25/2063(B)(D) | 745 | 689 | ||||||
SEI Institutional Managed Trust
179
SCHEDULE OF INVESTMENTS
September 30, 2023
Core Fixed Income Fund (Continued)
Description | Face Amount | Market Value | ||||||
MORTGAGE-BACKED SECURITIES (continued) | ||||||||
Towd Point Mortgage Trust, Ser 2021-1, Cl A1 | ||||||||
2.250%, 11/25/2061(B)(D) | $ | 457 | $ | 406 | ||||
Towd Point Mortgage Trust, Ser 2022-4, Cl A1 | ||||||||
3.750%, 09/25/2062(D) | 430 | 387 | ||||||
UBS Commercial Mortgage Trust, Ser C4, Cl A3 | ||||||||
3.301%, 10/15/2050 | 401 | 364 | ||||||
Verus Securitization Trust, Ser 2019-4, Cl A1 | ||||||||
3.642%, 11/25/2059(C)(D) | 201 | 191 | ||||||
Verus Securitization Trust, Ser 2019-INV3, Cl A1 | ||||||||
2.692%, 11/25/2059(B)(D) | 155 | 148 | ||||||
Verus Securitization Trust, Ser 2020-2, Cl A1 | ||||||||
2.226%, 05/25/2060(B)(D) | 115 | 113 | ||||||
Verus Securitization Trust, Ser 2021-1, Cl A1 | ||||||||
0.815%, 01/25/2066(B)(D) | 292 | 243 | ||||||
Verus Securitization Trust, Ser 2021-2, Cl A1 | ||||||||
1.031%, 02/25/2066(B)(D) | 579 | 482 | ||||||
Verus Securitization Trust, Ser 2021-3, Cl A1 | ||||||||
1.046%, 06/25/2066(B)(D) | 440 | 364 | ||||||
Verus Securitization Trust, Ser 2021-4, Cl A1 | ||||||||
0.938%, 07/25/2066(B)(D) | 563 | 424 | ||||||
Verus Securitization Trust, Ser 2021-5, Cl A1 | ||||||||
1.013%, 09/25/2066(B)(D) | 1,393 | 1,093 | ||||||
Verus Securitization Trust, Ser 2021-7, Cl A1 | ||||||||
1.829%, 10/25/2066(B)(D) | 646 | 538 | ||||||
Verus Securitization Trust, Ser 2021-8, Cl A1 | ||||||||
1.824%, 11/25/2066(B)(D) | 619 | 510 | ||||||
Verus Securitization Trust, Ser 2021-R1, Cl A1 | ||||||||
0.820%, 10/25/2063(B)(D) | 235 | 209 | ||||||
Verus Securitization Trust, Ser 2021-R3, Cl A1 | ||||||||
1.020%, 04/25/2064(B)(D) | 264 | 231 | ||||||
Visio Trust, Ser 2020-1R, Cl A1 | ||||||||
1.312%, 11/25/2055(D) | 189 | 166 | ||||||
WaMu Mortgage Pass-Through Certificates, Ser 2003-AR10, Cl A7 | ||||||||
4.693%, 10/25/2033(B) | 17 | 16 | ||||||
WaMu Mortgage Pass-Through Certificates, Ser 2003-AR7, Cl A7 | ||||||||
5.612%, 08/25/2033(B) | 10 | 9 | ||||||
WaMu Mortgage Pass-Through Certificates, Ser 2003-AR9, Cl 1A6 | ||||||||
5.684%, 09/25/2033(B) | 18 | 16 | ||||||
WaMu Mortgage Pass-Through Certificates, Ser 2003-S4, Cl 2A10 | ||||||||
2.519%, 06/25/2033(B) | 3 | 2 | ||||||
WaMu Mortgage Pass-Through Certificates, Ser 2003-S9, Cl A8 | ||||||||
5.250%, 10/25/2033 | 39 | 36 | ||||||
Description | Face Amount | Market Value | ||||||
MORTGAGE-BACKED SECURITIES (continued) | ||||||||
WaMu Mortgage Pass-Through Certificates, Ser 2004-AR3, Cl A2 | ||||||||
4.516%, 06/25/2034(B) | $ | 10 | $ | 9 | ||||
WaMu Mortgage Pass-Through Certificates, Ser 2004-RA4, Cl 3A | ||||||||
7.500%, 07/25/2034 | 60 | 60 | ||||||
WaMu Mortgage Pass-Through Certificates, Ser 2005-AR13, Cl A1A3 | ||||||||
6.994%, TSFR1M + 1.674%, 10/25/2045(B) | 144 | 136 | ||||||
WaMu Mortgage Pass-Through Certificates, Ser 2005-AR15, Cl A1A1 | ||||||||
5.954%, TSFR1M + 0.634%, 11/25/2045(B) | 3,392 | 3,054 | ||||||
WaMu Mortgage Pass-Through Certificates, Ser 2007-OA1, Cl A1A | ||||||||
5.326%, 12MTA + 0.700%, 02/25/2047(B) | 975 | 803 | ||||||
Washington Mutual Mortgage Pass-Through Certificates Trust, Ser 2007-OA2, Cl 2A | ||||||||
5.326%, 12MTA + 0.700%, 01/25/2047(B) | 625 | 493 | ||||||
Waterfall Commercial Mortgage Trust, Ser 2015-SBC5, Cl A | ||||||||
4.104%, 09/14/2022(B)(D) | 51 | 49 | ||||||
Wells Fargo Commercial Mortgage Trust, Ser 2014-LC18, Cl A5 | ||||||||
3.405%, 12/15/2047 | 570 | 547 | ||||||
Wells Fargo Commercial Mortgage Trust, Ser 2016-C36, Cl XA, IO | ||||||||
1.301%, 11/15/2059(B) | 4,415 | 118 | ||||||
Wells Fargo Mortgage Backed Securities Trust, Ser 2005-AR7, Cl B1 | ||||||||
4.702%, 05/25/2035(B) | 1,287 | 948 | ||||||
WFRBS Commercial Mortgage Trust, Ser 2014-C19, Cl B | ||||||||
4.723%, 03/15/2047(B) | 110 | 103 | ||||||
WFRBS Commercial Mortgage Trust, Ser 2014-C21, Cl B | ||||||||
4.213%, 08/15/2047(B) | 300 | 270 | ||||||
WFRBS Commercial Mortgage Trust, Ser C22, Cl B | ||||||||
4.371%, 09/15/2057(B) | 245 | 215 | ||||||
| 170,123 | ||||||||
Total Mortgage-Backed Securities | ||||||||
(Cost $1,566,997) ($ Thousands) | 1,432,800 | |||||||
180
SEI Institutional Managed Trust
Description | Face Amount | Market Value | ||||||
CORPORATE OBLIGATIONS — 30.4% | ||||||||
Communication Services — 2.5% | ||||||||
Alphabet | ||||||||
2.050%, 08/15/2050 | $ | 150 | $ | 82 | ||||
1.900%, 08/15/2040 | 250 | 156 | ||||||
1.100%, 08/15/2030 | 240 | 187 | ||||||
0.450%, 08/15/2025 | 110 | 101 | ||||||
AT&T | ||||||||
5.550%, 08/15/2041 | 130 | 116 | ||||||
5.400%, 02/15/2034 | 2,149 | 2,011 | ||||||
5.350%, 09/01/2040 | 130 | 116 | ||||||
5.250%, 03/01/2037 | 2,420 | 2,198 | ||||||
5.150%, 03/15/2042 | 25 | 21 | ||||||
4.850%, 03/01/2039 | 750 | 635 | ||||||
4.500%, 05/15/2035 | 370 | 315 | ||||||
4.350%, 06/15/2045 | 350 | 262 | ||||||
3.800%, 02/15/2027 | 318 | 299 | ||||||
3.800%, 12/01/2057 | 1,124 | 712 | ||||||
3.650%, 09/15/2059 | 422 | 257 | ||||||
3.550%, 09/15/2055 | 2,097 | 1,284 | ||||||
3.500%, 06/01/2041 | 288 | 200 | ||||||
3.500%, 09/15/2053 | 2,465 | 1,523 | ||||||
2.550%, 12/01/2033 | 290 | 213 | ||||||
2.300%, 06/01/2027 | 750 | 664 | ||||||
2.250%, 02/01/2032 | 60 | 45 | ||||||
1.700%, 03/25/2026 | 1,135 | 1,030 | ||||||
1.650%, 02/01/2028 | 20 | 17 | ||||||
CCO Holdings | ||||||||
4.750%, 02/01/2032 (D) | 250 | 200 | ||||||
4.500%, 08/15/2030 (D) | 50 | 41 | ||||||
4.500%, 05/01/2032 | 1,240 | 973 | ||||||
Charter Communications Operating | ||||||||
6.834%, 10/23/2055 | 70 | 62 | ||||||
6.484%, 10/23/2045 | 110 | 96 | ||||||
6.384%, 10/23/2035 | 10 | 9 | ||||||
5.750%, 04/01/2048 | 1,097 | 876 | ||||||
5.500%, 04/01/2063 | 320 | 237 | ||||||
5.375%, 04/01/2038 | 663 | 542 | ||||||
5.375%, 05/01/2047 | 191 | 146 | ||||||
5.250%, 04/01/2053 | 1,000 | 747 | ||||||
5.125%, 07/01/2049 | 160 | 117 | ||||||
4.908%, 07/23/2025 | 1,924 | 1,880 | ||||||
4.800%, 03/01/2050 | 3,110 | 2,175 | ||||||
4.400%, 04/01/2033 (E) | 800 | 680 | ||||||
4.200%, 03/15/2028 | 1,263 | 1,159 | ||||||
3.750%, 02/15/2028 | 85 | 77 | ||||||
3.500%, 06/01/2041 | 155 | 98 | ||||||
3.500%, 03/01/2042 | 1,160 | 717 | ||||||
Comcast | ||||||||
7.050%, 03/15/2033 | 90 | 98 | ||||||
5.350%, 11/15/2027 | 594 | 594 | ||||||
4.950%, 10/15/2058 | 60 | 52 | ||||||
4.400%, 08/15/2035 | 1,770 | 1,563 | ||||||
Description | Face Amount | Market Value | ||||||
CORPORATE OBLIGATIONS (continued) | ||||||||
4.250%, 10/15/2030 | $ | 730 | $ | 672 | ||||
4.200%, 08/15/2034 | 220 | 192 | ||||||
4.150%, 10/15/2028 | 2,220 | 2,103 | ||||||
4.000%, 08/15/2047 | 90 | 67 | ||||||
4.000%, 03/01/2048 | 70 | 52 | ||||||
3.999%, 11/01/2049 | 259 | 192 | ||||||
3.969%, 11/01/2047 | 418 | 312 | ||||||
3.950%, 10/15/2025 | 90 | 87 | ||||||
3.750%, 04/01/2040 | 200 | 155 | ||||||
3.450%, 02/01/2050 | 140 | 95 | ||||||
3.400%, 04/01/2030 | 280 | 247 | ||||||
3.400%, 07/15/2046 | 60 | 41 | ||||||
3.300%, 04/01/2027 | 190 | 177 | ||||||
3.250%, 11/01/2039 | 60 | 44 | ||||||
3.150%, 03/01/2026 | 390 | 370 | ||||||
2.987%, 11/01/2063 | 337 | 186 | ||||||
2.937%, 11/01/2056 | 533 | 303 | ||||||
2.887%, 11/01/2051 | 410 | 242 | ||||||
2.800%, 01/15/2051 | 280 | 164 | ||||||
1.500%, 02/15/2031 | 1,420 | 1,073 | ||||||
Discovery Communications | ||||||||
4.000%, 09/15/2055 | 315 | 189 | ||||||
DISH DBS | ||||||||
7.750%, 07/01/2026 | 120 | 90 | ||||||
5.875%, 11/15/2024 | 410 | 382 | ||||||
5.750%, 12/01/2028 (D) | 30 | 23 | ||||||
5.250%, 12/01/2026 (D) | 170 | 144 | ||||||
5.125%, 06/01/2029 | 280 | 155 | ||||||
Fox | ||||||||
5.476%, 01/25/2039 | 520 | 449 | ||||||
Meta Platforms | ||||||||
5.750%, 05/15/2063 | 570 | 537 | ||||||
5.600%, 05/15/2053 | 2,515 | 2,381 | ||||||
4.450%, 08/15/2052 | 10 | 8 | ||||||
Paramount Global | ||||||||
6.875%, 04/30/2036 | 620 | 564 | ||||||
5.900%, 10/15/2040 | 455 | 354 | ||||||
4.950%, 05/19/2050 | 365 | 247 | ||||||
4.750%, 05/15/2025 | 457 | 445 | ||||||
SES GLOBAL Americas Holdings | ||||||||
5.300%, 03/25/2044 (D) | 1,200 | 808 | ||||||
Sprint Spectrum | ||||||||
5.152%, 03/20/2028 (D) | 3,197 | 3,141 | ||||||
4.738%, 03/20/2025 (D) | 2,297 | 2,272 | ||||||
Take-Two Interactive Software | ||||||||
4.000%, 04/14/2032 | 1,265 | 1,103 | ||||||
Telefonica Emisiones | ||||||||
5.213%, 03/08/2047 | 150 | 120 | ||||||
T-Mobile USA | ||||||||
5.750%, 01/15/2034 | 586 | 572 | ||||||
5.050%, 07/15/2033 | 750 | 696 | ||||||
4.950%, 03/15/2028 | 600 | 582 | ||||||
SEI Institutional Managed Trust
181
SCHEDULE OF INVESTMENTS
September 30, 2023
Core Fixed Income Fund (Continued)
Description | Face Amount | Market Value | ||||||
CORPORATE OBLIGATIONS (continued) | ||||||||
4.800%, 07/15/2028 | $ | 599 | $ | 576 | ||||
4.500%, 04/15/2050 | 600 | 460 | ||||||
3.875%, 04/15/2030 | 2,210 | 1,958 | ||||||
3.750%, 04/15/2027 | 3,157 | 2,950 | ||||||
3.500%, 04/15/2025 | 1,910 | 1,843 | ||||||
3.500%, 04/15/2031 | 710 | 600 | ||||||
3.400%, 10/15/2052 | 1,230 | 768 | ||||||
3.375%, 04/15/2029 | 270 | 237 | ||||||
2.875%, 02/15/2031 | 240 | 195 | ||||||
2.700%, 03/15/2032 | 70 | 55 | ||||||
2.625%, 02/15/2029 | 330 | 279 | ||||||
2.550%, 02/15/2031 | 1,142 | 909 | ||||||
2.250%, 02/15/2026 | 731 | 673 | ||||||
1.500%, 02/15/2026 | 202 | 183 | ||||||
Verizon Communications | ||||||||
5.500%, 03/16/2047 | 60 | 56 | ||||||
5.250%, 03/16/2037 | 805 | 751 | ||||||
5.050%, 05/09/2033 | 1,648 | 1,540 | ||||||
4.862%, 08/21/2046 | 50 | 41 | ||||||
4.500%, 08/10/2033 | 500 | 445 | ||||||
4.400%, 11/01/2034 | 2,062 | 1,788 | ||||||
4.329%, 09/21/2028 | 1,106 | 1,039 | ||||||
4.125%, 08/15/2046 | 320 | 239 | ||||||
4.016%, 12/03/2029 | 714 | 647 | ||||||
4.000%, 03/22/2050 | 140 | 100 | ||||||
3.875%, 02/08/2029 | 210 | 192 | ||||||
3.850%, 11/01/2042 | 610 | 451 | ||||||
3.700%, 03/22/2061 | 195 | 124 | ||||||
3.400%, 03/22/2041 | 130 | 92 | ||||||
3.150%, 03/22/2030 | 360 | 307 | ||||||
3.000%, 03/22/2027 | 140 | 129 | ||||||
2.875%, 11/20/2050 | 150 | 87 | ||||||
2.650%, 11/20/2040 | 809 | 512 | ||||||
2.625%, 08/15/2026 | 1,000 | 924 | ||||||
2.550%, 03/21/2031 | 779 | 620 | ||||||
2.355%, 03/15/2032 | 447 | 341 | ||||||
2.100%, 03/22/2028 | 400 | 344 | ||||||
1.750%, 01/20/2031 | 410 | 309 | ||||||
Vmed O2 UK Financing I | ||||||||
4.750%, 07/15/2031 (D) | 630 | 509 | ||||||
Vodafone Group | ||||||||
4.875%, 06/19/2049 | 1,544 | 1,233 | ||||||
Walt Disney | ||||||||
6.650%, 11/15/2037 | 235 | 252 | ||||||
6.200%, 12/15/2034 | 65 | 68 | ||||||
4.625%, 03/23/2040 | 500 | 437 | ||||||
3.500%, 05/13/2040 | 790 | 592 | ||||||
Warnermedia Holdings | ||||||||
6.412%, 03/15/2026 | 390 | 390 | ||||||
5.391%, 03/15/2062 | 574 | 424 | ||||||
5.141%, 03/15/2052 | 6,472 | 4,809 | ||||||
5.050%, 03/15/2042 | 3,294 | 2,547 | ||||||
Description | Face Amount | Market Value | ||||||
CORPORATE OBLIGATIONS (continued) | ||||||||
4.279%, 03/15/2032 | $ | 1,410 | $ | 1,197 | ||||
4.054%, 03/15/2029 | 270 | 241 | ||||||
3.755%, 03/15/2027 | 200 | 185 | ||||||
| 83,267 | ||||||||
Consumer Discretionary — 1.4% | ||||||||
ADT Security | ||||||||
4.125%, 08/01/2029 (D) | 20 | 17 | ||||||
Amazon.com | ||||||||
4.950%, 12/05/2044 | 500 | 466 | ||||||
4.250%, 08/22/2057 | 110 | 88 | ||||||
4.050%, 08/22/2047 | 380 | 305 | ||||||
3.875%, 08/22/2037 | 1,290 | 1,101 | ||||||
3.600%, 04/13/2032 | 1,240 | 1,100 | ||||||
3.450%, 04/13/2029 | 310 | 286 | ||||||
3.300%, 04/13/2027 | 150 | 141 | ||||||
3.150%, 08/22/2027 | 680 | 633 | ||||||
2.800%, 08/22/2024 | 245 | 239 | ||||||
2.500%, 06/03/2050 | 550 | 322 | ||||||
2.100%, 05/12/2031 | 300 | 241 | ||||||
1.500%, 06/03/2030 | 350 | 277 | ||||||
1.200%, 06/03/2027 | 672 | 584 | ||||||
Comcast | ||||||||
4.049%, 11/01/2052 | 292 | 217 | ||||||
Cox Communications | ||||||||
2.600%, 06/15/2031 (D) | 915 | 713 | ||||||
CSC Holdings | ||||||||
4.500%, 11/15/2031 (D) | 1,200 | 849 | ||||||
4.125%, 12/01/2030 (D) | 590 | 418 | ||||||
3.375%, 02/15/2031 (D) | 200 | 136 | ||||||
Ford Motor | ||||||||
6.100%, 08/19/2032 | 380 | 358 | ||||||
5.291%, 12/08/2046 | 99 | 75 | ||||||
3.250%, 02/12/2032 | 480 | 370 | ||||||
Ford Motor Credit | ||||||||
7.350%, 03/06/2030 | 890 | 901 | ||||||
7.200%, 06/10/2030 | 566 | 569 | ||||||
5.125%, 06/16/2025 | 400 | 387 | ||||||
5.113%, 05/03/2029 | 420 | 385 | ||||||
4.950%, 05/28/2027 | 850 | 798 | ||||||
4.125%, 08/17/2027 | 200 | 182 | ||||||
4.000%, 11/13/2030 | 470 | 393 | ||||||
3.815%, 11/02/2027 | 261 | 232 | ||||||
3.810%, 01/09/2024 | 300 | 297 | ||||||
3.625%, 06/17/2031 | 380 | 307 | ||||||
2.900%, 02/16/2028 | 200 | 170 | ||||||
2.900%, 02/10/2029 | 572 | 469 | ||||||
General Motors | ||||||||
6.600%, 04/01/2036 | 40 | 39 | ||||||
6.250%, 10/02/2043 | 260 | 233 | ||||||
6.125%, 10/01/2025 | 320 | 320 | ||||||
5.950%, 04/01/2049 | 80 | 68 | ||||||
182
SEI Institutional Managed Trust
Description | Face Amount | Market Value | ||||||
CORPORATE OBLIGATIONS (continued) | ||||||||
5.600%, 10/15/2032 | $ | 150 | $ | 140 | ||||
5.200%, 04/01/2045 | 240 | 186 | ||||||
5.150%, 04/01/2038 | 240 | 200 | ||||||
General Motors Financial | ||||||||
5.000%, 04/09/2027 | 180 | 173 | ||||||
4.350%, 01/17/2027 | 110 | 103 | ||||||
Hanesbrands | ||||||||
4.875%, 05/15/2026 (D) | 210 | 192 | ||||||
Harley-Davidson Financial Services | ||||||||
6.500%, 03/10/2028 (D) | 451 | 446 | ||||||
Hilton Domestic Operating | ||||||||
5.750%, 05/01/2028 (D) | 150 | 145 | ||||||
5.375%, 05/01/2025 (D) | 460 | 452 | ||||||
Home Depot | ||||||||
4.250%, 04/01/2046 | 48 | 38 | ||||||
3.900%, 12/06/2028 | 40 | 38 | ||||||
3.900%, 06/15/2047 | 60 | 46 | ||||||
3.750%, 02/15/2024 | 66 | 66 | ||||||
3.350%, 04/15/2050 | 710 | 484 | ||||||
3.300%, 04/15/2040 | 350 | 261 | ||||||
2.700%, 04/15/2030 | 320 | 273 | ||||||
2.500%, 04/15/2027 | 280 | 255 | ||||||
Hyundai Capital America | ||||||||
6.200%, 09/21/2030 (D) | 733 | 722 | ||||||
5.950%, 09/21/2026 (D) | 820 | 818 | ||||||
5.700%, 06/26/2030 (D) | 596 | 573 | ||||||
5.600%, 03/30/2028 (D) | 941 | 921 | ||||||
5.500%, 03/30/2026 (D) | 302 | 298 | ||||||
Hyundai Capital America MTN | ||||||||
1.300%, 01/08/2026 (D) | 570 | 513 | ||||||
0.800%, 01/08/2024 (D) | 237 | 234 | ||||||
Las Vegas Sands | ||||||||
3.200%, 08/08/2024 | 1,980 | 1,915 | ||||||
2.900%, 06/25/2025 | 210 | 196 | ||||||
Lennar | ||||||||
4.750%, 11/29/2027 | 410 | 395 | ||||||
4.500%, 04/30/2024 | 140 | 139 | ||||||
Lowe's | ||||||||
5.850%, 04/01/2063 | 150 | 138 | ||||||
5.750%, 07/01/2053 | 302 | 282 | ||||||
5.625%, 04/15/2053 | 734 | 667 | ||||||
5.000%, 04/15/2040 | 725 | 636 | ||||||
4.500%, 04/15/2030 | 200 | 187 | ||||||
4.250%, 04/01/2052 | 567 | 418 | ||||||
Marriott International | ||||||||
5.550%, 10/15/2028 | 439 | 434 | ||||||
2.750%, 10/15/2033 | 469 | 354 | ||||||
McDonald's | ||||||||
5.450%, 08/14/2053 | 589 | 554 | ||||||
4.800%, 08/14/2028 | 586 | 573 | ||||||
McDonald's MTN | ||||||||
4.875%, 12/09/2045 | 260 | 225 | ||||||
Description | Face Amount | Market Value | ||||||
CORPORATE OBLIGATIONS (continued) | ||||||||
4.450%, 03/01/2047 | $ | 240 | $ | 195 | ||||
4.450%, 09/01/2048 | 72 | 59 | ||||||
4.200%, 04/01/2050 | 530 | 411 | ||||||
3.800%, 04/01/2028 | 170 | 160 | ||||||
3.700%, 01/30/2026 | 220 | 212 | ||||||
3.625%, 09/01/2049 | 180 | 127 | ||||||
3.600%, 07/01/2030 | 290 | 259 | ||||||
3.500%, 03/01/2027 | 510 | 480 | ||||||
3.500%, 07/01/2027 | 200 | 187 | ||||||
1.450%, 09/01/2025 | 80 | 74 | ||||||
MDC Holdings | ||||||||
6.000%, 01/15/2043 | 30 | 25 | ||||||
Mercedes-Benz Finance North America | ||||||||
2.700%, 06/14/2024 (D) | 595 | 582 | ||||||
Newell Brands | ||||||||
5.200%, 04/01/2026 | 110 | 104 | ||||||
NIKE | ||||||||
3.375%, 03/27/2050 (E) | 520 | 371 | ||||||
3.250%, 03/27/2040 | 210 | 159 | ||||||
2.850%, 03/27/2030 | 150 | 130 | ||||||
2.750%, 03/27/2027 | 410 | 379 | ||||||
2.400%, 03/27/2025 | 260 | 248 | ||||||
Nissan Motor | ||||||||
4.345%, 09/17/2027 (D) | 1,100 | 1,004 | ||||||
3.522%, 09/17/2025 (D) | 1,190 | 1,124 | ||||||
Sands China | ||||||||
5.650%, 08/08/2028 | 320 | 301 | ||||||
5.375%, 08/08/2025 | 1,580 | 1,531 | ||||||
4.300%, 01/08/2026 | 420 | 392 | ||||||
3.100%, 03/08/2029 | 690 | 571 | ||||||
2.550%, 03/08/2027 (E) | 460 | 399 | ||||||
Starbucks | ||||||||
3.500%, 11/15/2050 | 435 | 294 | ||||||
3.350%, 03/12/2050 | 120 | 79 | ||||||
Time Warner Cable | ||||||||
7.300%, 07/01/2038 | 530 | 511 | ||||||
6.750%, 06/15/2039 | 10 | 9 | ||||||
6.550%, 05/01/2037 | 268 | 243 | ||||||
5.875%, 11/15/2040 | 1,405 | 1,164 | ||||||
5.500%, 09/01/2041 | 1,599 | 1,251 | ||||||
Time Warner Entertainment | ||||||||
8.375%, 07/15/2033 | 270 | 290 | ||||||
Toyota Motor Credit MTN | ||||||||
5.250%, 09/11/2028 | 586 | 583 | ||||||
Tractor Supply | ||||||||
5.250%, 05/15/2033 | 360 | 340 | ||||||
Virgin Media Secured Finance | ||||||||
5.500%, 05/15/2029 (D) | 250 | 223 | ||||||
VOC Escrow | ||||||||
5.000%, 02/15/2028 (D) | 380 | 346 | ||||||
Volkswagen Group of America Finance | ||||||||
0.875%, 11/22/2023 (D) | 1,055 | 1,048 | ||||||
SEI Institutional Managed Trust
183
SCHEDULE OF INVESTMENTS
September 30, 2023
Core Fixed Income Fund (Continued)
Description | Face Amount | Market Value | ||||||
CORPORATE OBLIGATIONS (continued) | ||||||||
Wynn Macau | ||||||||
5.625%, 08/26/2028 (D) | $ | 500 | $ | 433 | ||||
Wynn Resorts Finance | ||||||||
7.125%, 02/15/2031 (D) | 310 | 294 | ||||||
| 45,968 | ||||||||
Consumer Staples — 1.7% | ||||||||
Altria Group | ||||||||
6.200%, 02/14/2059 | 76 | 71 | ||||||
5.950%, 02/14/2049 | 960 | 862 | ||||||
5.800%, 02/14/2039 | 630 | 584 | ||||||
4.800%, 02/14/2029 | 28 | 27 | ||||||
4.400%, 02/14/2026 | 514 | 499 | ||||||
3.875%, 09/16/2046 | 240 | 157 | ||||||
3.400%, 02/04/2041 | 600 | 390 | ||||||
2.450%, 02/04/2032 | 770 | 581 | ||||||
2.350%, 05/06/2025 | 130 | 123 | ||||||
Anheuser-Busch | ||||||||
4.900%, 02/01/2046 | 2,140 | 1,865 | ||||||
4.700%, 02/01/2036 | 1,519 | 1,392 | ||||||
3.650%, 02/01/2026 | 1,135 | 1,090 | ||||||
Anheuser-Busch InBev Worldwide | ||||||||
5.550%, 01/23/2049 | 475 | 455 | ||||||
5.450%, 01/23/2039 | 645 | 623 | ||||||
4.750%, 01/23/2029 | 120 | 116 | ||||||
4.600%, 04/15/2048 | 59 | 50 | ||||||
4.375%, 04/15/2038 | 802 | 695 | ||||||
4.350%, 06/01/2040 | 560 | 476 | ||||||
4.000%, 04/13/2028 | 160 | 152 | ||||||
3.500%, 06/01/2030 | 200 | 178 | ||||||
Bacardi | ||||||||
5.400%, 06/15/2033 (D) | 1,515 | 1,420 | ||||||
4.450%, 05/15/2025 (D) | 1,545 | 1,499 | ||||||
BAT Capital | ||||||||
5.650%, 03/16/2052 | 590 | 472 | ||||||
5.282%, 04/02/2050 | 1,260 | 955 | ||||||
4.758%, 09/06/2049 | 81 | 57 | ||||||
4.540%, 08/15/2047 | 2,583 | 1,778 | ||||||
4.390%, 08/15/2037 | 61 | 47 | ||||||
3.734%, 09/25/2040 | 10 | 7 | ||||||
3.557%, 08/15/2027 | 791 | 724 | ||||||
3.222%, 08/15/2024 | 97 | 94 | ||||||
BAT International Finance | ||||||||
5.931%, 02/02/2029 | 1,128 | 1,107 | ||||||
Bunge Finance | ||||||||
2.750%, 05/14/2031 | 64 | 52 | ||||||
1.630%, 08/17/2025 | 309 | 285 | ||||||
Coca-Cola | ||||||||
3.375%, 03/25/2027 | 380 | 360 | ||||||
2.600%, 06/01/2050 | 190 | 116 | ||||||
2.500%, 06/01/2040 | 20 | 14 | ||||||
Description | Face Amount | Market Value | ||||||
CORPORATE OBLIGATIONS (continued) | ||||||||
Constellation Brands | ||||||||
5.250%, 11/15/2048 | $ | 619 | $ | 549 | ||||
4.900%, 05/01/2033 | 147 | 137 | ||||||
4.750%, 05/09/2032 | 227 | 210 | ||||||
4.350%, 05/09/2027 | 320 | 306 | ||||||
3.600%, 05/09/2024 | 230 | 227 | ||||||
2.250%, 08/01/2031 | 80 | 62 | ||||||
Costco Wholesale | ||||||||
3.000%, 05/18/2027 | 284 | 265 | ||||||
2.750%, 05/18/2024 | 183 | 179 | ||||||
1.600%, 04/20/2030 | 450 | 361 | ||||||
1.375%, 06/20/2027 | 780 | 682 | ||||||
CVS Health | ||||||||
4.875%, 07/20/2035 | 88 | 79 | ||||||
Danone | ||||||||
2.589%, 11/02/2023 (D) | 1,370 | 1,366 | ||||||
Haleon US Capital | ||||||||
3.625%, 03/24/2032 | 490 | 420 | ||||||
3.375%, 03/24/2027 | 410 | 381 | ||||||
3.375%, 03/24/2029 | 290 | 260 | ||||||
Hershey | ||||||||
0.900%, 06/01/2025 | 130 | 121 | ||||||
Imperial Brands Finance | ||||||||
3.500%, 07/26/2026 (D) | 635 | 594 | ||||||
3.125%, 07/26/2024 (D) | 2,250 | 2,193 | ||||||
JBS USA LUX | ||||||||
6.750%, 03/15/2034 (D) | 1,995 | 1,941 | ||||||
6.500%, 12/01/2052 | 1,915 | 1,714 | ||||||
3.000%, 02/02/2029 | 1,205 | 1,011 | ||||||
3.000%, 05/15/2032 | 1,520 | 1,147 | ||||||
Kenvue | ||||||||
5.200%, 03/22/2063 (D) | 150 | 136 | ||||||
5.050%, 03/22/2028 (D) | 601 | 593 | ||||||
5.050%, 03/22/2053 (D) | 674 | 612 | ||||||
4.900%, 03/22/2033 (D) | 1,147 | 1,096 | ||||||
Keurig Dr Pepper | ||||||||
4.500%, 04/15/2052 | 565 | 446 | ||||||
Kraft Heinz Foods | ||||||||
7.125%, 08/01/2039 (D) | 10 | 11 | ||||||
6.875%, 01/26/2039 | 40 | 42 | ||||||
6.750%, 03/15/2032 | 10 | 11 | ||||||
5.500%, 06/01/2050 | 220 | 201 | ||||||
5.200%, 07/15/2045 | 360 | 314 | ||||||
5.000%, 06/04/2042 | 120 | 104 | ||||||
4.875%, 10/01/2049 | 270 | 225 | ||||||
4.625%, 10/01/2039 | 10 | 8 | ||||||
4.375%, 06/01/2046 | 160 | 125 | ||||||
4.250%, 03/01/2031 | 110 | 100 | ||||||
3.000%, 06/01/2026 | 380 | 356 | ||||||
Mars | ||||||||
3.200%, 04/01/2030 (D) | 210 | 184 | ||||||
2.700%, 04/01/2025 (D) | 370 | 354 | ||||||
184
SEI Institutional Managed Trust
Description | Face Amount | Market Value | ||||||
CORPORATE OBLIGATIONS (continued) | ||||||||
2.375%, 07/16/2040 (D) | $ | 300 | $ | 190 | ||||
Mondelez International | ||||||||
1.500%, 05/04/2025 | 660 | 617 | ||||||
PepsiCo | ||||||||
2.875%, 10/15/2049 | 60 | 39 | ||||||
2.625%, 03/19/2027 | 50 | 46 | ||||||
2.250%, 03/19/2025 | 50 | 48 | ||||||
1.625%, 05/01/2030 | 440 | 354 | ||||||
Philip Morris International | ||||||||
5.750%, 11/17/2032 | 152 | 148 | ||||||
5.625%, 09/07/2033 | 1,582 | 1,521 | ||||||
5.500%, 09/07/2030 | 414 | 403 | ||||||
5.375%, 02/15/2033 | 1,567 | 1,485 | ||||||
5.250%, 09/07/2028 | 636 | 623 | ||||||
5.125%, 11/17/2027 | 795 | 779 | ||||||
5.125%, 02/15/2030 | 2,400 | 2,302 | ||||||
5.000%, 11/17/2025 | 638 | 630 | ||||||
4.875%, 02/15/2028 | 1,304 | 1,263 | ||||||
4.500%, 03/20/2042 | 130 | 104 | ||||||
2.100%, 05/01/2030 | 290 | 231 | ||||||
Pilgrim's Pride | ||||||||
6.250%, 07/01/2033 | 780 | 733 | ||||||
3.500%, 03/01/2032 | 350 | 271 | ||||||
Procter & Gamble | ||||||||
3.000%, 03/25/2030 | 240 | 213 | ||||||
Reckitt Benckiser Treasury Services | ||||||||
2.750%, 06/26/2024 (D) | 830 | 811 | ||||||
Reynolds American | ||||||||
8.125%, 05/01/2040 | 570 | 595 | ||||||
7.250%, 06/15/2037 | 390 | 394 | ||||||
5.850%, 08/15/2045 | 3,140 | 2,601 | ||||||
Walmart | ||||||||
4.500%, 04/15/2053 | 453 | 390 | ||||||
4.100%, 04/15/2033 | 754 | 690 | ||||||
3.300%, 04/22/2024 | 60 | 59 | ||||||
1.800%, 09/22/2031 | 110 | 86 | ||||||
1.500%, 09/22/2028 | 230 | 195 | ||||||
| 56,317 | ||||||||
Energy — 2.7% | ||||||||
Aker BP | ||||||||
6.000%, 06/13/2033 (D) | 950 | 918 | ||||||
5.600%, 06/13/2028 (D) | 886 | 866 | ||||||
Apache | ||||||||
7.750%, 12/15/2029 | 140 | 143 | ||||||
5.350%, 07/01/2049 | 230 | 176 | ||||||
5.250%, 02/01/2042 | 90 | 71 | ||||||
5.100%, 09/01/2040 | 205 | 163 | ||||||
4.750%, 04/15/2043 | 390 | 284 | ||||||
4.250%, 01/15/2044 | 890 | 581 | ||||||
BP Capital Markets America | ||||||||
4.893%, 09/11/2033 | 715 | 671 | ||||||
Description | Face Amount | Market Value | ||||||
CORPORATE OBLIGATIONS (continued) | ||||||||
4.812%, 02/13/2033 | $ | 2,785 | $ | 2,607 | ||||
3.633%, 04/06/2030 | 320 | 288 | ||||||
3.410%, 02/11/2026 | 1,110 | 1,061 | ||||||
3.119%, 05/04/2026 | 230 | 217 | ||||||
3.001%, 03/17/2052 | 351 | 215 | ||||||
3.000%, 02/24/2050 | 940 | 586 | ||||||
Cameron LNG | ||||||||
3.302%, 01/15/2035 (D) | 660 | 525 | ||||||
2.902%, 07/15/2031 (D) | 140 | 116 | ||||||
Canadian Natural Resources | ||||||||
6.450%, 06/30/2033 | 50 | 50 | ||||||
Cheniere Corpus Christi Holdings | ||||||||
3.700%, 11/15/2029 | 938 | 832 | ||||||
Cheniere Energy | ||||||||
4.625%, 10/15/2028 | 260 | 239 | ||||||
Cheniere Energy Partners | ||||||||
4.000%, 03/01/2031 | 100 | 86 | ||||||
3.250%, 01/31/2032 | 530 | 421 | ||||||
Chevron | ||||||||
2.895%, 03/03/2024 | 560 | 554 | ||||||
1.995%, 05/11/2027 | 180 | 161 | ||||||
Chevron USA | ||||||||
3.850%, 01/15/2028 | 200 | 190 | ||||||
3.250%, 10/15/2029 | 50 | 45 | ||||||
Columbia Pipelines Operating | ||||||||
6.544%, 11/15/2053 (D) | 330 | 323 | ||||||
6.036%, 11/15/2033 (D) | 940 | 917 | ||||||
Conoco Funding | ||||||||
7.250%, 10/15/2031 | 180 | 199 | ||||||
ConocoPhillips | ||||||||
5.900%, 10/15/2032 | 10 | 10 | ||||||
5.900%, 05/15/2038 | 420 | 417 | ||||||
4.150%, 11/15/2034 | 280 | 243 | ||||||
Continental Resources | ||||||||
5.750%, 01/15/2031 (D) | 370 | 347 | ||||||
4.900%, 06/01/2044 | 80 | 59 | ||||||
4.375%, 01/15/2028 | 520 | 482 | ||||||
3.800%, 06/01/2024 | 200 | 197 | ||||||
2.268%, 11/15/2026 (D) | 2,070 | 1,834 | ||||||
Coterra Energy | ||||||||
4.375%, 03/15/2029 | 780 | 721 | ||||||
3.900%, 05/15/2027 | 970 | 911 | ||||||
DCP Midstream Operating | ||||||||
6.450%, 11/03/2036 (D) | 110 | 108 | ||||||
Devon Energy | ||||||||
7.875%, 09/30/2031 | 660 | 724 | ||||||
5.875%, 06/15/2028 | 40 | 40 | ||||||
5.850%, 12/15/2025 | 50 | 50 | ||||||
5.600%, 07/15/2041 | 920 | 814 | ||||||
5.250%, 10/15/2027 | 46 | 45 | ||||||
5.000%, 06/15/2045 | 1,232 | 992 | ||||||
4.750%, 05/15/2042 | 187 | 148 | ||||||
SEI Institutional Managed Trust
185
SCHEDULE OF INVESTMENTS
September 30, 2023
Core Fixed Income Fund (Continued)
Description | Face Amount | Market Value | ||||||
CORPORATE OBLIGATIONS (continued) | ||||||||
4.500%, 01/15/2030 | $ | 304 | $ | 276 | ||||
Diamondback Energy | ||||||||
6.250%, 03/15/2033 | 1,870 | 1,871 | ||||||
6.250%, 03/15/2053 | 748 | 713 | ||||||
3.500%, 12/01/2029 | 500 | 444 | ||||||
3.250%, 12/01/2026 | 30 | 28 | ||||||
Ecopetrol | ||||||||
5.875%, 05/28/2045 | 1,276 | 841 | ||||||
5.375%, 06/26/2026 | 200 | 192 | ||||||
4.625%, 11/02/2031 | 160 | 122 | ||||||
Energy Transfer | ||||||||
9.654%, TSFR3M + 0.000%(B)(F) | 90 | 84 | ||||||
7.125%, H15T5Y + 5.306%(B)(F) | 580 | 500 | ||||||
6.750%, H15T5Y + 5.134%(B)(F) | 500 | 462 | ||||||
6.500%, H15T5Y + 5.694%(B)(F) | 200 | 184 | ||||||
6.250%, 04/15/2049 | 130 | 119 | ||||||
6.125%, 12/15/2045 | 240 | 213 | ||||||
5.750%, 02/15/2033 | 1,095 | 1,053 | ||||||
5.500%, 06/01/2027 | 118 | 116 | ||||||
5.400%, 10/01/2047 | 2,154 | 1,777 | ||||||
5.350%, 05/15/2045 | 465 | 381 | ||||||
5.300%, 04/01/2044 | 640 | 521 | ||||||
5.300%, 04/15/2047 | 779 | 633 | ||||||
5.250%, 04/15/2029 | 1,165 | 1,117 | ||||||
5.000%, 05/15/2050 | 1,405 | 1,102 | ||||||
4.950%, 05/15/2028 | 996 | 953 | ||||||
4.950%, 06/15/2028 | 180 | 172 | ||||||
4.500%, 11/01/2023 | 690 | 689 | ||||||
4.400%, 03/15/2027 | 133 | 126 | ||||||
4.000%, 10/01/2027 | 600 | 557 | ||||||
3.750%, 05/15/2030 | 1,250 | 1,089 | ||||||
Enterprise Products Operating | ||||||||
7.550%, 04/15/2038 | 40 | 44 | ||||||
6.650%, 10/15/2034 | 220 | 232 | ||||||
5.700%, 02/15/2042 | 40 | 38 | ||||||
5.375%, TSFR3M + 2.832%, 02/15/2078 (B) | 150 | 125 | ||||||
5.350%, 01/31/2033 | 900 | 880 | ||||||
4.850%, 03/15/2044 | 430 | 369 | ||||||
4.800%, 02/01/2049 | 60 | 51 | ||||||
4.200%, 01/31/2050 | 120 | 93 | ||||||
4.150%, 10/16/2028 | 1,605 | 1,505 | ||||||
3.950%, 01/31/2060 | 220 | 155 | ||||||
3.700%, 01/31/2051 | 270 | 191 | ||||||
3.125%, 07/31/2029 | 170 | 149 | ||||||
2.800%, 01/31/2030 | 540 | 458 | ||||||
EOG Resources | ||||||||
4.950%, 04/15/2050 | 450 | 398 | ||||||
4.375%, 04/15/2030 | 120 | 113 | ||||||
4.150%, 01/15/2026 | 340 | 330 | ||||||
3.900%, 04/01/2035 | 390 | 331 | ||||||
Description | Face Amount | Market Value | ||||||
CORPORATE OBLIGATIONS (continued) | ||||||||
EQM Midstream Partners | ||||||||
5.500%, 07/15/2028 | $ | 30 | $ | 28 | ||||
EQT | ||||||||
6.125%, 02/01/2025 | 17 | 17 | ||||||
5.000%, 01/15/2029 | 150 | 141 | ||||||
3.900%, 10/01/2027 | 1,020 | 943 | ||||||
3.625%, 05/15/2031 (D) | 320 | 271 | ||||||
3.125%, 05/15/2026 (D) | 10 | 9 | ||||||
Exxon Mobil | ||||||||
4.327%, 03/19/2050 | 60 | 49 | ||||||
4.114%, 03/01/2046 | 533 | 428 | ||||||
3.482%, 03/19/2030 | 460 | 415 | ||||||
3.452%, 04/15/2051 | 200 | 140 | ||||||
3.043%, 03/01/2026 | 660 | 626 | ||||||
2.992%, 03/19/2025 | 450 | 435 | ||||||
Galaxy Pipeline Assets Bidco | ||||||||
2.940%, 09/30/2040 (D) | 244 | 187 | ||||||
2.625%, 03/31/2036 (D) | 458 | 354 | ||||||
2.160%, 03/31/2034 (D) | 612 | 510 | ||||||
1.750%, 09/30/2027 (D) | 579 | 534 | ||||||
Halliburton | ||||||||
5.000%, 11/15/2045 | 80 | 68 | ||||||
4.850%, 11/15/2035 | 60 | 54 | ||||||
3.800%, 11/15/2025 | 17 | 16 | ||||||
Hess | ||||||||
6.000%, 01/15/2040 | 880 | 829 | ||||||
5.800%, 04/01/2047 | 770 | 702 | ||||||
5.600%, 02/15/2041 | 325 | 293 | ||||||
HF Sinclair | ||||||||
5.875%, 04/01/2026 | 620 | 618 | ||||||
KazMunayGas National JSC | ||||||||
5.750%, 04/19/2047 (D) | 340 | 264 | ||||||
Kinder Morgan | ||||||||
5.550%, 06/01/2045 | 300 | 258 | ||||||
5.200%, 03/01/2048 | 455 | 372 | ||||||
5.050%, 02/15/2046 | 170 | 136 | ||||||
4.300%, 06/01/2025 | 510 | 497 | ||||||
4.300%, 03/01/2028 | 150 | 141 | ||||||
Kinder Morgan Energy Partners | ||||||||
5.500%, 03/01/2044 | 415 | 353 | ||||||
5.400%, 09/01/2044 | 20 | 17 | ||||||
MEG Energy | ||||||||
5.875%, 02/01/2029 (D) | 80 | 75 | ||||||
MPLX | ||||||||
5.650%, 03/01/2053 | 158 | 136 | ||||||
5.500%, 02/15/2049 | 390 | 330 | ||||||
5.000%, 03/01/2033 | 905 | 825 | ||||||
4.950%, 03/14/2052 | 1,718 | 1,344 | ||||||
4.875%, 12/01/2024 | 320 | 316 | ||||||
4.800%, 02/15/2029 | 330 | 313 | ||||||
4.700%, 04/15/2048 | 430 | 326 | ||||||
4.500%, 04/15/2038 | 520 | 421 | ||||||
186
SEI Institutional Managed Trust
Description | Face Amount | Market Value | ||||||
CORPORATE OBLIGATIONS (continued) | ||||||||
Northwest Pipeline | ||||||||
4.000%, 04/01/2027 | $ | 219 | $ | 207 | ||||
Occidental Petroleum | ||||||||
7.875%, 09/15/2031 | 610 | 660 | ||||||
7.500%, 05/01/2031 | 870 | 923 | ||||||
6.950%, 07/01/2024 | 136 | 137 | ||||||
6.600%, 03/15/2046 | 360 | 354 | ||||||
6.450%, 09/15/2036 | 280 | 275 | ||||||
5.550%, 03/15/2026 | 110 | 109 | ||||||
4.625%, 06/15/2045 | 280 | 201 | ||||||
4.400%, 04/15/2046 | 120 | 88 | ||||||
4.200%, 03/15/2048 | 170 | 118 | ||||||
4.100%, 02/15/2047 | 600 | 395 | ||||||
3.400%, 04/15/2026 | 270 | 252 | ||||||
3.000%, 02/15/2027 | 300 | 269 | ||||||
ONEOK | ||||||||
6.625%, 09/01/2053 | 1,560 | 1,527 | ||||||
6.050%, 09/01/2033 | 620 | 609 | ||||||
5.800%, 11/01/2030 | 290 | 284 | ||||||
5.550%, 11/01/2026 | 180 | 179 | ||||||
Parsley Energy | ||||||||
4.125%, 02/15/2028 (D) | 60 | 55 | ||||||
Pertamina Persero | ||||||||
6.000%, 05/03/2042 (D) | 300 | 272 | ||||||
Petrobras Global Finance BV | ||||||||
6.850%, 06/05/2115 | 790 | 678 | ||||||
6.250%, 03/17/2024 | 1,394 | 1,389 | ||||||
5.299%, 01/27/2025 | 1,278 | 1,254 | ||||||
Petroleos Mexicanos | ||||||||
6.950%, 01/28/2060 | 345 | 204 | ||||||
6.625%, 06/15/2035 | 475 | 318 | ||||||
6.375%, 01/23/2045 | 1,555 | 908 | ||||||
4.875%, 01/18/2024 | 32 | 32 | ||||||
2.460%, 12/15/2025 | 461 | 443 | ||||||
2.378%, 04/15/2025 | 203 | 197 | ||||||
Petroleos Mexicanos MTN | ||||||||
6.875%, 08/04/2026 | 120 | 111 | ||||||
6.750%, 09/21/2047 | 2,132 | 1,263 | ||||||
Phillips 66 | ||||||||
1.300%, 02/15/2026 | 405 | 366 | ||||||
Pioneer Natural Resources | ||||||||
2.150%, 01/15/2031 | 660 | 521 | ||||||
1.900%, 08/15/2030 | 240 | 188 | ||||||
1.125%, 01/15/2026 | 110 | 100 | ||||||
Plains All American Pipeline | ||||||||
3.550%, 12/15/2029 | 495 | 426 | ||||||
Range Resources | ||||||||
4.875%, 05/15/2025 | 120 | 116 | ||||||
Reliance Industries | ||||||||
3.625%, 01/12/2052 (D) | 870 | 555 | ||||||
2.875%, 01/12/2032 (D) | 320 | 255 | ||||||
Description | Face Amount | Market Value | ||||||
CORPORATE OBLIGATIONS (continued) | ||||||||
Rockies Express Pipeline | ||||||||
6.875%, 04/15/2040 (D) | $ | 830 | $ | 728 | ||||
4.950%, 07/15/2029 (D) | 1,600 | 1,425 | ||||||
Sabine Pass Liquefaction | ||||||||
5.750%, 05/15/2024 | 300 | 300 | ||||||
5.000%, 03/15/2027 | 1,265 | 1,227 | ||||||
Saudi Arabian Oil | ||||||||
1.250%, 11/24/2023 (D) | 450 | 447 | ||||||
Schlumberger Holdings | ||||||||
3.900%, 05/17/2028 (D) | 475 | 441 | ||||||
Schlumberger Investment | ||||||||
3.650%, 12/01/2023 | 61 | 61 | ||||||
Shell International Finance BV | ||||||||
4.550%, 08/12/2043 | 280 | 238 | ||||||
4.375%, 05/11/2045 | 470 | 386 | ||||||
4.125%, 05/11/2035 | 1,356 | 1,194 | ||||||
3.250%, 04/06/2050 | 840 | 558 | ||||||
2.875%, 05/10/2026 | 900 | 849 | ||||||
2.750%, 04/06/2030 | 440 | 378 | ||||||
Southern Natural Gas | ||||||||
8.000%, 03/01/2032 | 170 | 187 | ||||||
Southwestern Energy | ||||||||
5.375%, 02/01/2029 | 20 | 18 | ||||||
5.375%, 03/15/2030 | 80 | 73 | ||||||
4.750%, 02/01/2032 | 190 | 163 | ||||||
Tallgrass Energy Partners | ||||||||
6.000%, 12/31/2030 (D) | 20 | 18 | ||||||
Targa Resources | ||||||||
5.200%, 07/01/2027 | 540 | 529 | ||||||
4.200%, 02/01/2033 | 250 | 213 | ||||||
Targa Resources Partners | ||||||||
5.500%, 03/01/2030 | 130 | 122 | ||||||
5.000%, 01/15/2028 | 100 | 95 | ||||||
4.875%, 02/01/2031 | 370 | 331 | ||||||
4.000%, 01/15/2032 | 40 | 34 | ||||||
Tennessee Gas Pipeline | ||||||||
8.375%, 06/15/2032 | 1,140 | 1,259 | ||||||
2.900%, 03/01/2030 (D) | 1,560 | 1,303 | ||||||
TransCanada PipeLines | ||||||||
4.625%, 03/01/2034 | 965 | 841 | ||||||
Transcontinental Gas Pipe Line | ||||||||
7.850%, 02/01/2026 | 60 | 62 | ||||||
Venture Global Calcasieu Pass | ||||||||
3.875%, 11/01/2033 (D) | 290 | 225 | ||||||
Western Midstream Operating | ||||||||
5.500%, 08/15/2048 | 244 | 194 | ||||||
5.300%, 03/01/2048 | 162 | 126 | ||||||
5.250%, 02/01/2050 | 210 | 164 | ||||||
4.650%, 07/01/2026 | 40 | 38 | ||||||
4.500%, 03/01/2028 | 60 | 56 | ||||||
4.050%, 02/01/2030 | 1,200 | 1,049 | ||||||
3.100%, 02/01/2025 | 390 | 373 | ||||||
SEI Institutional Managed Trust
187
SCHEDULE OF INVESTMENTS
September 30, 2023
Core Fixed Income Fund (Continued)
Description | Face Amount | Market Value | ||||||
CORPORATE OBLIGATIONS (continued) | ||||||||
Williams | ||||||||
7.750%, 06/15/2031 | $ | 841 | $ | 902 | ||||
7.500%, 01/15/2031 | 100 | 106 | ||||||
5.750%, 06/24/2044 | 51 | 46 | ||||||
5.400%, 03/04/2044 | 84 | 73 | ||||||
3.750%, 06/15/2027 | 1,044 | 971 | ||||||
| 91,276 | ||||||||
Financials — 11.4% | ||||||||
ABN AMRO Bank | ||||||||
4.750%, 07/28/2025 (D) | 360 | 349 | ||||||
AerCap Ireland Capital DAC | ||||||||
3.400%, 10/29/2033 | 975 | 754 | ||||||
Agree | ||||||||
4.800%, 10/01/2032 | 283 | 251 | ||||||
Ally Financial | ||||||||
1.450%, 10/02/2023 | 670 | 670 | ||||||
American Express | ||||||||
5.389%, SOFRRATE + 0.970%, 07/28/2027 (B) | 5,238 | 5,165 | ||||||
5.282%, SOFRRATE + 1.280%, 07/27/2029 (B) | 1,487 | 1,450 | ||||||
5.043%, SOFRRATE + 1.835%, 05/01/2034 (B) | 338 | 312 | ||||||
4.050%, 05/03/2029 | 530 | 493 | ||||||
3.375%, 05/03/2024 | 480 | 472 | ||||||
American International Group | ||||||||
3.900%, 04/01/2026 | 264 | 253 | ||||||
3.875%, 01/15/2035 | 210 | 174 | ||||||
2.500%, 06/30/2025 | 212 | 200 | ||||||
American Tower | ||||||||
3.125%, 01/15/2027 | 253 | 231 | ||||||
Aon | ||||||||
6.250%, 09/30/2040 | 19 | 19 | ||||||
2.600%, 12/02/2031 | 2,080 | 1,642 | ||||||
Apollo Management Holdings | ||||||||
4.400%, 05/27/2026 (D) | 530 | 505 | ||||||
Arthur J Gallagher | ||||||||
5.750%, 03/02/2053 | 155 | 142 | ||||||
3.050%, 03/09/2052 | 1,370 | 793 | ||||||
Athene Global Funding | ||||||||
6.048%, SOFRINDX + 0.700%, 05/24/2024 (B)(D) | 2,025 | 2,017 | ||||||
3.205%, 03/08/2027 (D) | 635 | 569 | ||||||
2.950%, 11/12/2026 (D) | 2,090 | 1,876 | ||||||
1.985%, 08/19/2028 (D) | 30 | 24 | ||||||
1.608%, 06/29/2026 (D) | 1,365 | 1,192 | ||||||
Athene Holding | ||||||||
4.125%, 01/12/2028 | 605 | 553 | ||||||
Avolon Holdings Funding | ||||||||
3.950%, 07/01/2024 (D) | 715 | 700 | ||||||
2.875%, 02/15/2025 (D) | 975 | 920 | ||||||
Description | Face Amount | Market Value | ||||||
CORPORATE OBLIGATIONS (continued) | ||||||||
2.528%, 11/18/2027 (D) | $ | 779 | $ | 658 | ||||
Banco Santander | ||||||||
4.175%, H15T1Y + 2.000%, 03/24/2028 (B) | 200 | 185 | ||||||
2.746%, 05/28/2025 | 1,200 | 1,130 | ||||||
1.722%, H15T1Y + 0.900%, 09/14/2027 (B) | 390 | 341 | ||||||
Bank of America | ||||||||
5.933%, SOFRRATE + 1.340%, 09/15/2027 (B) | 1,612 | 1,600 | ||||||
5.872%, SOFRRATE + 1.840%, 09/15/2034 (B) | 1,128 | 1,098 | ||||||
5.819%, SOFRRATE + 1.570%, 09/15/2029 (B) | 2,257 | 2,229 | ||||||
5.288%, SOFRRATE + 1.910%, 04/25/2034 (B) | 2,302 | 2,142 | ||||||
4.571%, SOFRRATE + 1.830%, 04/27/2033 (B) | 2,350 | 2,087 | ||||||
3.419%, TSFR3M + 1.302%, 12/20/2028 (B) | 3,330 | 2,987 | ||||||
2.592%, SOFRRATE + 2.150%, 04/29/2031 (B) | 530 | 426 | ||||||
2.572%, SOFRRATE + 1.210%, 10/20/2032 (B) | 3,620 | 2,782 | ||||||
2.299%, SOFRRATE + 1.220%, 07/21/2032 (B) | 1,505 | 1,140 | ||||||
1.734%, SOFRRATE + 0.960%, 07/22/2027 (B) | 4,245 | 3,762 | ||||||
1.658%, SOFRRATE + 0.910%, 03/11/2027 (B) | 5,025 | 4,508 | ||||||
Bank of America MTN | ||||||||
5.000%, 01/21/2044 | 830 | 730 | ||||||
4.450%, 03/03/2026 | 1,157 | 1,114 | ||||||
4.376%, SOFRRATE + 1.580%, 04/27/2028 (B) | 1,140 | 1,076 | ||||||
4.330%, TSFR3M + 1.782%, 03/15/2050 (B) | 260 | 202 | ||||||
4.250%, 10/22/2026 | 80 | 76 | ||||||
4.244%, TSFR3M + 2.076%, 04/24/2038 (B) | 179 | 147 | ||||||
4.200%, 08/26/2024 | 1,530 | 1,503 | ||||||
4.125%, 01/22/2024 | 290 | 289 | ||||||
4.083%, TSFR3M + 3.412%, 03/20/2051 (B) | 1,630 | 1,205 | ||||||
4.000%, 04/01/2024 | 1,309 | 1,297 | ||||||
4.000%, 01/22/2025 | 1,070 | 1,041 | ||||||
3.974%, TSFR3M + 1.472%, 02/07/2030 (B) | 1,900 | 1,706 | ||||||
3.970%, TSFR3M + 1.332%, 03/05/2029 (B) | 625 | 573 | ||||||
3.824%, TSFR3M + 1.837%, 01/20/2028 (B) | 631 | 586 | ||||||
188
SEI Institutional Managed Trust
Description | Face Amount | Market Value | ||||||
CORPORATE OBLIGATIONS (continued) | ||||||||
3.593%, TSFR3M + 1.632%, 07/21/2028 (B) | $ | 1,364 | $ | 1,246 | ||||
3.500%, 04/19/2026 | 780 | 736 | ||||||
3.093%, TSFR3M + 1.352%, 10/01/2025 (B) | 1,925 | 1,862 | ||||||
2.972%, SOFRRATE + 1.330%, 02/04/2033 (B) | 690 | 544 | ||||||
2.884%, TSFR3M + 1.452%, 10/22/2030 (B) | 265 | 221 | ||||||
2.551%, SOFRRATE + 1.050%, 02/04/2028 (B) | 524 | 467 | ||||||
2.496%, TSFR3M + 1.252%, 02/13/2031 (B) | 755 | 605 | ||||||
2.087%, SOFRRATE + 1.060%, 06/14/2029 (B) | 6,025 | 5,044 | ||||||
1.197%, SOFRRATE + 1.010%, 10/24/2026 (B) | 720 | 651 | ||||||
Bank of Montreal | ||||||||
5.717%, 09/25/2028 | 1,465 | 1,449 | ||||||
Bank of Montreal MTN | ||||||||
1.850%, 05/01/2025 | 880 | 826 | ||||||
Bank of New York Mellon | ||||||||
4.947%, SOFRRATE + 1.026%, 04/26/2027 (B) | 877 | 856 | ||||||
4.543%, SOFRRATE + 1.169%, 02/01/2029 (B) | 1,085 | 1,034 | ||||||
3.400%, 05/15/2024 | 530 | 522 | ||||||
Bank of New York Mellon MTN | ||||||||
4.967%, SOFRRATE + 1.606%, 04/26/2034 (B) | 147 | 136 | ||||||
3.250%, 09/11/2024 | 100 | 97 | ||||||
1.600%, 04/24/2025 | 260 | 244 | ||||||
Bank of Nova Scotia | ||||||||
4.900%, H15T5Y + 4.551%(B)(F) | 510 | 467 | ||||||
4.588%, H15T5Y + 2.050%, 05/04/2037 (B) | 390 | 325 | ||||||
1.300%, 06/11/2025 | 480 | 444 | ||||||
Barclays | ||||||||
7.437%, H15T1Y + 3.500%, 11/02/2033 (B) | 207 | 213 | ||||||
6.692%, SOFRRATE + 2.620%, 09/13/2034 (B) | 757 | 739 | ||||||
6.490%, SOFRRATE + 2.220%, 09/13/2029 (B) | 879 | 872 | ||||||
6.224%, SOFRRATE + 2.980%, 05/09/2034 (B) | 919 | 870 | ||||||
5.088%, US0003M + 3.054%, 06/20/2030 (B) | 1,630 | 1,457 | ||||||
4.375%, 01/12/2026 | 2,270 | 2,175 | ||||||
Barclays MTN | ||||||||
4.972%, US0003M + 1.902%, 05/16/2029 (B) | 310 | 290 | ||||||
Description | Face Amount | Market Value | ||||||
CORPORATE OBLIGATIONS (continued) | ||||||||
Berkshire Hathaway Finance | ||||||||
4.250%, 01/15/2049 | $ | 870 | $ | 713 | ||||
BNP Paribas | ||||||||
5.335%, H15T1Y + 1.500%, 06/12/2029 (B)(D) | 1,183 | 1,149 | ||||||
5.125%, H15T1Y + 1.450%, 01/13/2029 (B)(D) | 1,670 | 1,612 | ||||||
4.705%, TSFR3M + 2.497%, 01/10/2025 (B)(D) | 690 | 687 | ||||||
4.625%, 03/13/2027 (D) | 200 | 190 | ||||||
4.400%, 08/14/2028 (D) | 1,087 | 1,010 | ||||||
3.375%, 01/09/2025 (D) | 290 | 280 | ||||||
2.219%, SOFRRATE + 2.074%, 06/09/2026 (B)(D) | 600 | 560 | ||||||
BNP Paribas MTN | ||||||||
4.375%, USSW5 + 1.483%, 03/01/2033 (B)(D) | 400 | 355 | ||||||
3.052%, SOFRRATE + 1.507%, 01/13/2031 (B)(D) | 200 | 165 | ||||||
BPCE | ||||||||
5.150%, 07/21/2024 (D) | 410 | 403 | ||||||
BPCE MTN | ||||||||
5.975%, SOFRRATE + 2.100%, 01/18/2027 (B)(D) | 1,560 | 1,543 | ||||||
Brighthouse Financial | ||||||||
3.850%, 12/22/2051 | 266 | 156 | ||||||
Brighthouse Financial Global Funding MTN | ||||||||
1.000%, 04/12/2024 (D) | 1,505 | 1,465 | ||||||
Canadian Imperial Bank of Commerce | ||||||||
6.092%, 10/03/2033 | 2,935 | 2,915 | ||||||
5.986%, 10/03/2028 | 1,291 | 1,288 | ||||||
5.926%, 10/02/2026 | 1,115 | 1,115 | ||||||
Cantor Fitzgerald | ||||||||
4.500%, 04/14/2027 (D) | 1,135 | 1,057 | ||||||
Capital One Financial | ||||||||
3.273%, SOFRRATE + 1.790%, 03/01/2030 (B) | 1,850 | 1,547 | ||||||
Cboe Global Markets | ||||||||
3.000%, 03/16/2032 | 1,330 | 1,088 | ||||||
Charles Schwab | ||||||||
6.136%, SOFRRATE + 2.010%, 08/24/2034 (B) | 788 | 766 | ||||||
5.875%, 08/24/2026 | 1,020 | 1,017 | ||||||
5.643%, SOFRRATE + 2.210%, 05/19/2029 (B) | 1,330 | 1,303 | ||||||
Chubb INA Holdings | ||||||||
3.350%, 05/03/2026 | 200 | 190 | ||||||
3.150%, 03/15/2025 | 74 | 71 | ||||||
CI Financial | ||||||||
4.100%, 06/15/2051 | 1,020 | 590 | ||||||
3.200%, 12/17/2030 | 1,255 | 952 | ||||||
Citadel | ||||||||
4.875%, 01/15/2027 (D) | 660 | 627 | ||||||
SEI Institutional Managed Trust
189
SCHEDULE OF INVESTMENTS
September 30, 2023
Core Fixed Income Fund (Continued)
Description | Face Amount | Market Value | ||||||
CORPORATE OBLIGATIONS (continued) | ||||||||
Citibank | ||||||||
5.803%, 09/29/2028 | $ | 1,465 | $ | 1,465 | ||||
Citigroup | ||||||||
9.699%, TSFR3M + 4.330%(B)(F) | 360 | 359 | ||||||
8.125%, 07/15/2039 | 1,064 | 1,251 | ||||||
6.675%, 09/13/2043 | 70 | 70 | ||||||
6.625%, 06/15/2032 | 100 | 101 | ||||||
6.300%, TSFR3M + 3.685%(B)(F) | 300 | 292 | ||||||
6.174%, SOFRRATE + 2.661%, 05/25/2034 (B) | 2,201 | 2,103 | ||||||
5.950%, TSFR3M + 4.167%(B)(F) | 590 | 563 | ||||||
5.610%, SOFRRATE + 1.546%, 09/29/2026 (B) | 2,720 | 2,692 | ||||||
5.500%, 09/13/2025 | 690 | 682 | ||||||
5.300%, 05/06/2044 | 225 | 192 | ||||||
4.910%, SOFRRATE + 2.086%, 05/24/2033 (B) | 370 | 337 | ||||||
4.750%, 05/18/2046 | 100 | 78 | ||||||
4.658%, SOFRRATE + 1.887%, 05/24/2028 (B) | 340 | 325 | ||||||
4.650%, 07/30/2045 | 903 | 725 | ||||||
4.450%, 09/29/2027 | 1,005 | 943 | ||||||
4.412%, SOFRRATE + 3.914%, 03/31/2031 (B) | 2,750 | 2,474 | ||||||
4.400%, 06/10/2025 | 1,080 | 1,048 | ||||||
4.300%, 11/20/2026 | 240 | 228 | ||||||
4.125%, 07/25/2028 | 210 | 191 | ||||||
4.075%, TSFR3M + 1.454%, 04/23/2029 (B) | 81 | 75 | ||||||
3.980%, TSFR3M + 1.600%, 03/20/2030 (B) | 1,860 | 1,670 | ||||||
3.878%, TSFR3M + 1.430%, 01/24/2039 (B) | 59 | 46 | ||||||
3.785%, SOFRRATE + 1.939%, 03/17/2033 (B) | 970 | 809 | ||||||
3.352%, TSFR3M + 1.158%, 04/24/2025 (B) | 125 | 123 | ||||||
3.300%, 04/27/2025 | 120 | 115 | ||||||
3.200%, 10/21/2026 | 440 | 406 | ||||||
3.106%, SOFRRATE + 2.842%, 04/08/2026 (B) | 350 | 334 | ||||||
3.070%, SOFRRATE + 1.280%, 02/24/2028 (B) | 305 | 277 | ||||||
3.057%, SOFRRATE + 1.351%, 01/25/2033 (B) | 3,160 | 2,498 | ||||||
2.976%, SOFRRATE + 1.422%, 11/05/2030 (B) | 715 | 599 | ||||||
2.572%, SOFRRATE + 2.107%, 06/03/2031 (B) | 2,085 | 1,663 | ||||||
2.561%, SOFRRATE + 1.167%, 05/01/2032 (B) | 2,880 | 2,229 | ||||||
2.520%, SOFRRATE + 1.177%, 11/03/2032 (B) | 360 | 274 | ||||||
Description | Face Amount | Market Value | ||||||
CORPORATE OBLIGATIONS (continued) | ||||||||
1.462%, SOFRRATE + 0.770%, 06/09/2027 (B) | $ | 375 | $ | 331 | ||||
CME Group | ||||||||
3.000%, 03/15/2025 | 51 | 49 | ||||||
Constellation Insurance | ||||||||
6.800%, 01/24/2030 (D) | 625 | 557 | ||||||
Cooperatieve Rabobank UA | ||||||||
5.564%, H15T1Y + 1.400%, 02/28/2029 (B)(D) | 2,147 | 2,092 | ||||||
4.375%, 08/04/2025 | 1,780 | 1,718 | ||||||
3.758%, H15T1Y + 1.420%, 04/06/2033 (B)(D) | 1,790 | 1,492 | ||||||
3.649%, H15T1Y + 1.220%, 04/06/2028 (B)(D) | 420 | 386 | ||||||
Credit Agricole MTN | ||||||||
4.000%, USSW5 + 1.644%, 01/10/2033 (B)(D) | 250 | 221 | ||||||
1.907%, SOFRRATE + 1.676%, 06/16/2026 (B)(D) | 400 | 372 | ||||||
Credit Suisse NY | ||||||||
7.950%, 01/09/2025 | 1,220 | 1,242 | ||||||
7.500%, 02/15/2028 | 1,240 | 1,297 | ||||||
2.950%, 04/09/2025 | 520 | 494 | ||||||
Credit Suisse NY MTN | ||||||||
3.700%, 02/21/2025 | 1,320 | 1,272 | ||||||
CTR Partnership | ||||||||
3.875%, 06/30/2028 (D) | 90 | 77 | ||||||
Danske Bank | ||||||||
6.466%, H15T1Y + 2.100%, 01/09/2026 (B)(D) | 1,115 | 1,113 | ||||||
5.375%, 01/12/2024 (D) | 650 | 647 | ||||||
3.244%, US0003M + 1.591%, 12/20/2025 (B)(D) | 220 | 211 | ||||||
Danske Bank MTN | ||||||||
6.259%, H15T1Y + 1.180%, 09/22/2026 (B)(D) | 250 | 250 | ||||||
4.375%, 06/12/2028 (D) | 200 | 184 | ||||||
Deutsche Bank NY | ||||||||
3.742%, SOFRRATE + 2.257%, 01/07/2033 (B) | 1,178 | 845 | ||||||
DNB Bank | ||||||||
1.605%, H15T1Y + 0.680%, 03/30/2028 (B)(D) | 2,065 | 1,774 | ||||||
F&G Global Funding | ||||||||
1.750%, 06/30/2026 (D) | 810 | 715 | ||||||
Farmers Exchange Capital | ||||||||
7.200%, 07/15/2048 (D) | 1,021 | 953 | ||||||
7.050%, 07/15/2028 (D) | 1,000 | 992 | ||||||
Farmers Exchange Capital II | ||||||||
6.151%, US0003M + 3.744%, 11/01/2053 (B)(D) | 1,650 | 1,531 | ||||||
Federal Realty Investment Trust | ||||||||
3.950%, 01/15/2024 | 359 | 357 | ||||||
190
SEI Institutional Managed Trust
Description | Face Amount | Market Value | ||||||
CORPORATE OBLIGATIONS (continued) | ||||||||
Fiserv | ||||||||
5.625%, 08/21/2033 | $ | 1,157 | $ | 1,121 | ||||
5.600%, 03/02/2033 | 1,463 | 1,418 | ||||||
5.375%, 08/21/2028 | 882 | 871 | ||||||
Goldman Sachs Capital II | ||||||||
6.439%, TSFR3M + 1.029%(B)(F) | 10 | 8 | ||||||
Goldman Sachs Group | ||||||||
6.750%, 10/01/2037 | 30 | 30 | ||||||
6.250%, 02/01/2041 | 1,050 | 1,059 | ||||||
5.150%, 05/22/2045 | 820 | 703 | ||||||
4.750%, 10/21/2045 | 370 | 311 | ||||||
4.250%, 10/21/2025 | 850 | 819 | ||||||
4.223%, TSFR3M + 1.563%, 05/01/2029 (B) | 1,300 | 1,202 | ||||||
3.814%, TSFR3M + 1.420%, 04/23/2029 (B) | 350 | 318 | ||||||
3.750%, 02/25/2026 | 345 | 328 | ||||||
3.691%, TSFR3M + 1.772%, 06/05/2028 (B) | 380 | 350 | ||||||
3.615%, SOFRRATE + 1.846%, 03/15/2028 (B) | 170 | 157 | ||||||
3.500%, 04/01/2025 | 540 | 520 | ||||||
3.500%, 11/16/2026 | 900 | 837 | ||||||
3.272%, TSFR3M + 1.463%, 09/29/2025 (B) | 1,130 | 1,095 | ||||||
3.210%, SOFRRATE + 1.513%, 04/22/2042 (B) | 120 | 81 | ||||||
2.908%, SOFRRATE + 1.472%, 07/21/2042 (B) | 260 | 168 | ||||||
2.650%, SOFRRATE + 1.264%, 10/21/2032 (B) | 1,305 | 1,007 | ||||||
2.383%, SOFRRATE + 1.248%, 07/21/2032 (B) | 4,535 | 3,454 | ||||||
1.948%, SOFRRATE + 0.913%, 10/21/2027 (B) | 95 | 84 | ||||||
1.542%, SOFRRATE + 0.818%, 09/10/2027 (B) | 5,645 | 4,943 | ||||||
1.431%, SOFRRATE + 0.798%, 03/09/2027 (B) | 1,150 | 1,024 | ||||||
1.217%, 12/06/2023 | 2,710 | 2,688 | ||||||
0.925%, SOFRRATE + 0.486%, 10/21/2024 (B) | 1,370 | 1,359 | ||||||
Goldman Sachs Group MTN | ||||||||
4.000%, 03/03/2024 | 690 | 684 | ||||||
3.850%, 07/08/2024 | 330 | 325 | ||||||
Guardian Life Global Funding | ||||||||
1.100%, 06/23/2025 (D) | 190 | 174 | ||||||
Healthcare Realty Holdings | ||||||||
3.875%, 05/01/2025 | 15 | 14 | ||||||
2.400%, 03/15/2030 | 170 | 131 | ||||||
HSBC Bank USA | ||||||||
7.000%, 01/15/2039 | 275 | 283 | ||||||
Description | Face Amount | Market Value | ||||||
CORPORATE OBLIGATIONS (continued) | ||||||||
HSBC Holdings | ||||||||
6.332%, SOFRRATE + 2.650%, 03/09/2044 (B) | $ | 902 | $ | 866 | ||||
5.887%, SOFRRATE + 1.570%, 08/14/2027 (B) | 1,535 | 1,516 | ||||||
4.762%, SOFRRATE + 2.530%, 03/29/2033 (B) | 420 | 358 | ||||||
4.755%, SOFRRATE + 2.110%, 06/09/2028 (B) | 220 | 208 | ||||||
4.583%, TSFR3M + 1.796%, 06/19/2029 (B) | 260 | 240 | ||||||
4.375%, 11/23/2026 | 345 | 327 | ||||||
4.300%, 03/08/2026 | 1,710 | 1,642 | ||||||
4.250%, 03/14/2024 | 510 | 505 | ||||||
4.250%, 08/18/2025 | 560 | 539 | ||||||
3.973%, TSFR3M + 1.872%, 05/22/2030 (B) | 860 | 756 | ||||||
2.804%, SOFRRATE + 1.187%, 05/24/2032 (B) | 395 | 306 | ||||||
2.357%, SOFRRATE + 1.947%, 08/18/2031 (B) | 370 | 284 | ||||||
2.206%, SOFRRATE + 1.285%, 08/17/2029 (B) | 295 | 243 | ||||||
2.099%, SOFRRATE + 1.929%, 06/04/2026 (B) | 2,640 | 2,461 | ||||||
2.013%, SOFRRATE + 1.732%, 09/22/2028 (B) | 2,785 | 2,364 | ||||||
1.645%, SOFRRATE + 1.538%, 04/18/2026 (B) | 330 | 307 | ||||||
1.589%, SOFRRATE + 1.290%, 05/24/2027 (B) | 815 | 719 | ||||||
ILFC E-Capital Trust II | ||||||||
7.459%, 12/21/2065 (B)(D) | 400 | 301 | ||||||
ING Groep | ||||||||
6.114%, SOFRRATE + 2.090%, 09/11/2034 (B) | 605 | 588 | ||||||
6.083%, SOFRRATE + 1.560%, 09/11/2027 (B) | 878 | 874 | ||||||
Intercontinental Exchange | ||||||||
4.950%, 06/15/2052 | 150 | 130 | ||||||
4.600%, 03/15/2033 | 710 | 651 | ||||||
1.850%, 09/15/2032 | 1,470 | 1,075 | ||||||
Intesa Sanpaolo MTN | ||||||||
5.017%, 06/26/2024 (D) | 2,320 | 2,265 | ||||||
Invitation Homes Operating Partnership | ||||||||
2.000%, 08/15/2031 | 1,548 | 1,146 | ||||||
Jackson Financial | ||||||||
3.125%, 11/23/2031 | 1,405 | 1,077 | ||||||
JPMorgan Chase | ||||||||
8.750%, 09/01/2030 | 970 | 1,121 | ||||||
6.184%, TSFR3M + 0.812%, 02/01/2027 (B) | 1,590 | 1,496 | ||||||
SEI Institutional Managed Trust
191
SCHEDULE OF INVESTMENTS
September 30, 2023
Core Fixed Income Fund (Continued)
Description | Face Amount | Market Value | ||||||
CORPORATE OBLIGATIONS (continued) | ||||||||
5.299%, SOFRRATE + 1.450%, 07/24/2029 (B) | $ | 1,910 | $ | 1,858 | ||||
4.950%, 06/01/2045 | 430 | 368 | ||||||
4.452%, TSFR3M + 1.592%, 12/05/2029 (B) | 300 | 280 | ||||||
4.260%, TSFR3M + 1.842%, 02/22/2048 (B) | 84 | 65 | ||||||
4.250%, 10/01/2027 | 720 | 683 | ||||||
4.203%, TSFR3M + 1.522%, 07/23/2029 (B) | 800 | 741 | ||||||
4.023%, TSFR3M + 1.262%, 12/05/2024 (B) | 1,480 | 1,473 | ||||||
3.882%, TSFR3M + 1.622%, 07/24/2038 (B) | 325 | 260 | ||||||
3.875%, 09/10/2024 | 1,140 | 1,117 | ||||||
3.625%, 05/13/2024 | 230 | 227 | ||||||
3.625%, 12/01/2027 | 230 | 212 | ||||||
3.109%, SOFRRATE + 2.440%, 04/22/2051 (B) | 130 | 81 | ||||||
2.956%, TSFR3M + 2.515%, 05/13/2031 (B) | 300 | 247 | ||||||
2.950%, 10/01/2026 | 377 | 349 | ||||||
2.947%, SOFRRATE + 1.170%, 02/24/2028 (B) | 650 | 590 | ||||||
2.739%, TSFR3M + 1.510%, 10/15/2030 (B) | 855 | 715 | ||||||
2.580%, TSFR3M + 1.250%, 04/22/2032 (B) | 165 | 130 | ||||||
2.545%, SOFRRATE + 1.180%, 11/08/2032 (B) | 1,380 | 1,068 | ||||||
2.522%, SOFRRATE + 2.040%, 04/22/2031 (B) | 450 | 365 | ||||||
2.301%, SOFRRATE + 1.160%, 10/15/2025 (B) | 1,190 | 1,141 | ||||||
2.083%, SOFRRATE + 1.850%, 04/22/2026 (B) | 830 | 779 | ||||||
2.069%, SOFRRATE + 1.015%, 06/01/2029 (B) | 1,285 | 1,083 | ||||||
2.005%, TSFR3M + 1.585%, 03/13/2026 (B) | 660 | 622 | ||||||
1.953%, SOFRRATE + 1.065%, 02/04/2032 (B) | 3,020 | 2,290 | ||||||
1.578%, SOFRRATE + 0.885%, 04/22/2027 (B) | 5,190 | 4,632 | ||||||
1.561%, SOFRRATE + 0.605%, 12/10/2025 (B) | 2,070 | 1,956 | ||||||
1.045%, SOFRRATE + 0.800%, 11/19/2026 (B) | 400 | 360 | ||||||
1.040%, TSFR3M + 0.695%, 02/04/2027 (B) | 115 | 102 | ||||||
0.969%, TSFR3M + 0.580%, 06/23/2025 (B) | 3,475 | 3,335 | ||||||
Description | Face Amount | Market Value | ||||||
CORPORATE OBLIGATIONS (continued) | ||||||||
KeyBank MTN | ||||||||
5.000%, 01/26/2033 | $ | 696 | $ | 586 | ||||
KKR Group Finance II | ||||||||
5.500%, 02/01/2043 (D)(E) | 80 | 70 | ||||||
Lloyds Banking Group | ||||||||
4.976%, H15T1Y + 2.300%, 08/11/2033 (B) | 1,790 | 1,588 | ||||||
4.375%, 03/22/2028 | 390 | 364 | ||||||
4.344%, 01/09/2048 | 200 | 137 | ||||||
3.870%, H15T1Y + 3.500%, 07/09/2025 (B) | 1,190 | 1,167 | ||||||
1.627%, H15T1Y + 0.850%, 05/11/2027 (B) | 2,000 | 1,774 | ||||||
Macquarie Group | ||||||||
4.442%, SOFRRATE + 2.405%, 06/21/2033 (B)(D) | 330 | 281 | ||||||
1.340%, SOFRRATE + 1.069%, 01/12/2027 (B)(D) | 1,590 | 1,423 | ||||||
Macquarie Group MTN | ||||||||
5.033%, US0003M + 1.750%, 01/15/2030 (B)(D) | 635 | 606 | ||||||
2.871%, SOFRRATE + 1.532%, 01/14/2033 (B)(D) | 545 | 412 | ||||||
Massachusetts Mutual Life Insurance | ||||||||
3.729%, 10/15/2070 (D) | 88 | 54 | ||||||
Mercury General | ||||||||
4.400%, 03/15/2027 | 935 | 872 | ||||||
MetLife | ||||||||
6.400%, 12/15/2036 | 420 | 410 | ||||||
5.700%, 06/15/2035 | 15 | 15 | ||||||
5.375%, 07/15/2033 | 1,267 | 1,218 | ||||||
MetLife Capital Trust IV | ||||||||
7.875%, 12/15/2037 (D) | 800 | 828 | ||||||
Metropolitan Life Global Funding I | ||||||||
3.450%, 12/18/2026 (D) | 1,955 | 1,834 | ||||||
Metropolitan Life Global Funding I MTN | ||||||||
5.150%, 03/28/2033 (D) | 700 | 663 | ||||||
5.000%, 01/06/2026 (D) | 660 | 652 | ||||||
Mitsubishi UFJ Financial Group | ||||||||
5.719%, H15T1Y + 1.080%, 02/20/2026 (B) | 1,760 | 1,749 | ||||||
5.063%, H15T1Y + 1.550%, 09/12/2025 (B) | 1,620 | 1,602 | ||||||
4.080%, H15T1Y + 1.300%, 04/19/2028 (B) | 400 | 376 | ||||||
3.837%, H15T1Y + 1.125%, 04/17/2026 (B) | 380 | 367 | ||||||
Morgan Stanley | ||||||||
6.342%, SOFRRATE + 2.560%, 10/18/2033 (B) | 1,028 | 1,034 | ||||||
5.948%, H15T5Y + 2.430%, 01/19/2038 (B) | 585 | 547 | ||||||
192
SEI Institutional Managed Trust
Description | Face Amount | Market Value | ||||||
CORPORATE OBLIGATIONS (continued) | ||||||||
5.449%, SOFRRATE + 1.630%, 07/20/2029 (B) | $ | 1,264 | $ | 1,232 | ||||
5.123%, SOFRRATE + 1.730%, 02/01/2029 (B) | 298 | 287 | ||||||
2.484%, SOFRRATE + 1.360%, 09/16/2036 (B) | 1,040 | 755 | ||||||
1.593%, SOFRRATE + 0.879%, 05/04/2027 (B) | 770 | 685 | ||||||
Morgan Stanley MTN | ||||||||
5.250%, SOFRRATE + 1.870%, 04/21/2034 (B) | 2,676 | 2,485 | ||||||
5.164%, SOFRRATE + 1.590%, 04/20/2029 (B) | 298 | 287 | ||||||
4.431%, TSFR3M + 1.890%, 01/23/2030 (B) | 10 | 9 | ||||||
3.971%, US0003M + 1.455%, 07/22/2038 (B) | 119 | 94 | ||||||
3.772%, TSFR3M + 1.402%, 01/24/2029 (B) | 1,985 | 1,810 | ||||||
3.622%, SOFRRATE + 3.120%, 04/01/2031 (B) | 1,920 | 1,654 | ||||||
2.699%, SOFRRATE + 1.143%, 01/22/2031 (B) | 520 | 425 | ||||||
2.511%, SOFRRATE + 1.200%, 10/20/2032 (B) | 2,170 | 1,660 | ||||||
2.239%, SOFRRATE + 1.178%, 07/21/2032 (B) | 150 | 113 | ||||||
2.188%, SOFRRATE + 1.990%, 04/28/2026 (B) | 1,300 | 1,221 | ||||||
1.928%, SOFRRATE + 1.020%, 04/28/2032 (B) | 850 | 631 | ||||||
1.794%, SOFRRATE + 1.034%, 02/13/2032 (B) | 2,350 | 1,740 | ||||||
1.512%, SOFRRATE + 0.858%, 07/20/2027 (B) | 555 | 491 | ||||||
1.164%, SOFRRATE + 0.560%, 10/21/2025 (B) | 4,860 | 4,588 | ||||||
Nasdaq | ||||||||
5.550%, 02/15/2034 | 1,080 | 1,031 | ||||||
National Securities Clearing | ||||||||
1.500%, 04/23/2025 (D) | 330 | 310 | ||||||
Nationwide Building Society MTN | ||||||||
2.972%, SOFRRATE + 1.290%, 02/16/2028 (B)(D) | 1,375 | 1,230 | ||||||
Nationwide Mutual Insurance | ||||||||
7.961%, US0003M + 2.290%, 12/15/2024 (B)(D) | 3,735 | 3,735 | ||||||
NatWest Group | ||||||||
7.472%, H15T1Y + 2.850%, 11/10/2026 (B) | 1,085 | 1,107 | ||||||
4.892%, US0003M + 1.754%, 05/18/2029 (B) | 200 | 187 | ||||||
Description | Face Amount | Market Value | ||||||
CORPORATE OBLIGATIONS (continued) | ||||||||
4.269%, US0003M + 1.762%, 03/22/2025 (B) | $ | 815 | $ | 806 | ||||
1.642%, H15T1Y + 0.900%, 06/14/2027 (B) | 920 | 813 | ||||||
New York Life Global Funding | ||||||||
0.950%, 06/24/2025 (D) | 340 | 313 | ||||||
Northwestern Mutual Life Insurance | ||||||||
3.625%, 09/30/2059 (D) | 1,112 | 709 | ||||||
Park Aerospace Holdings | ||||||||
5.500%, 02/15/2024 (D) | 212 | 211 | ||||||
Physicians Realty | ||||||||
2.625%, 11/01/2031 | 700 | 527 | ||||||
PNC Bank | ||||||||
3.875%, 04/10/2025 | 430 | 415 | ||||||
PNC Financial Services Group | ||||||||
6.037%, SOFRINDX + 2.140%, 10/28/2033 (B) | 1,045 | 1,014 | ||||||
5.812%, SOFRRATE + 1.322%, 06/12/2026 (B) | 250 | 248 | ||||||
5.582%, SOFRRATE + 1.841%, 06/12/2029 (B) | 2,315 | 2,246 | ||||||
5.068%, SOFRRATE + 1.933%, 01/24/2034 (B) | 1,375 | 1,247 | ||||||
Principal Life Global Funding II | ||||||||
2.250%, 11/21/2024 (D) | 1,465 | 1,403 | ||||||
1.250%, 06/23/2025 (D) | 160 | 148 | ||||||
Prospect Capital | ||||||||
3.706%, 01/22/2026 | 395 | 357 | ||||||
Prudential Financial MTN | ||||||||
5.625%, 05/12/2041 | 10 | 9 | ||||||
Royal Bank of Canada MTN | ||||||||
1.150%, 06/10/2025 | 460 | 425 | ||||||
S&P Global | ||||||||
5.250%, 09/15/2033 (D) | 439 | 428 | ||||||
Santander Holdings USA | ||||||||
6.565%, SOFRRATE + 2.700%, 06/12/2029 (B) | 382 | 373 | ||||||
6.499%, SOFRRATE + 2.356%, 03/09/2029 (B) | 697 | 680 | ||||||
4.500%, 07/17/2025 | 80 | 77 | ||||||
Santander UK Group Holdings | ||||||||
4.796%, US0003M + 1.570%, 11/15/2024 (B) | 3,050 | 3,044 | ||||||
2.896%, SOFRRATE + 1.475%, 03/15/2032 (B) | 610 | 471 | ||||||
2.469%, SOFRRATE + 1.220%, 01/11/2028 (B) | 510 | 444 | ||||||
1.673%, SOFRRATE + 0.989%, 06/14/2027 (B) | 445 | 389 | ||||||
1.532%, H15T1Y + 1.250%, 08/21/2026 (B) | 235 | 213 | ||||||
1.089%, SOFRRATE + 0.787%, 03/15/2025 (B) | 2,475 | 2,408 | ||||||
SEI Institutional Managed Trust
193
SCHEDULE OF INVESTMENTS
September 30, 2023
Core Fixed Income Fund (Continued)
Description | Face Amount | Market Value | ||||||
CORPORATE OBLIGATIONS (continued) | ||||||||
Scentre Group Trust 1 | ||||||||
3.625%, 01/28/2026 (D) | $ | 635 | $ | 603 | ||||
Societe Generale MTN | ||||||||
7.367%, 01/10/2053 (D) | 520 | 472 | ||||||
2.625%, 01/22/2025 (D) | 735 | 699 | ||||||
State Street | ||||||||
3.300%, 12/16/2024 | 70 | 68 | ||||||
Teachers Insurance & Annuity Association of America | ||||||||
6.850%, 12/16/2039 (D) | 124 | 130 | ||||||
4.900%, 09/15/2044 (D) | 240 | 202 | ||||||
3.300%, 05/15/2050 (D) | 2,455 | 1,552 | ||||||
The Vanguard Group | ||||||||
3.050%, 08/22/2050 | 670 | 383 | ||||||
Toronto-Dominion Bank MTN | ||||||||
4.456%, 06/08/2032 | 1,420 | 1,273 | ||||||
2.800%, 03/10/2027 | 1,300 | 1,182 | ||||||
1.150%, 06/12/2025 | 460 | 426 | ||||||
Truist Financial MTN | ||||||||
6.047%, SOFRRATE + 2.050%, 06/08/2027 (B) | 968 | 957 | ||||||
4.260%, SOFRRATE + 1.456%, 07/28/2026 (B) | 1,590 | 1,531 | ||||||
Trust Fibra Uno | ||||||||
6.390%, 01/15/2050 (D) | 344 | 263 | ||||||
UBS | ||||||||
5.650%, 09/11/2028 | 849 | 835 | ||||||
UBS MTN | ||||||||
4.500%, 06/26/2048 (D) | 440 | 365 | ||||||
UBS Group | ||||||||
9.016%, SOFRRATE + 5.020%, 11/15/2033 (B)(D) | 3,418 | 3,947 | ||||||
7.000%, USSW5 + 4.344%(B)(D)(F) | 1,640 | 1,616 | ||||||
6.537%, SOFRRATE + 3.920%, 08/12/2033 (B)(D) | 5,860 | 5,792 | ||||||
6.442%, SOFRRATE + 3.700%, 08/11/2028 (B)(D) | 762 | 761 | ||||||
6.373%, SOFRRATE + 3.340%, 07/15/2026 (B)(D) | 605 | 603 | ||||||
6.327%, H15T1Y + 1.600%, 12/22/2027 (B)(D) | 406 | 405 | ||||||
6.301%, H15T1Y + 2.000%, 09/22/2034 (B)(D) | 457 | 446 | ||||||
6.246%, H15T1Y + 1.800%, 09/22/2029 (B)(D) | 605 | 599 | ||||||
4.751%, H15T1Y + 1.750%, 05/12/2028 (B)(D) | 360 | 340 | ||||||
4.488%, H15T1Y + 1.550%, 05/12/2026 (B)(D) | 320 | 310 | ||||||
4.282%, 01/09/2028 (D) | 875 | 804 | ||||||
4.253%, 03/23/2028 (D) | 350 | 322 | ||||||
4.194%, SOFRRATE + 3.730%, 04/01/2031 (B)(D) | 1,200 | 1,048 | ||||||
Description | Face Amount | Market Value | ||||||
CORPORATE OBLIGATIONS (continued) | ||||||||
4.125%, 09/24/2025 (D) | $ | 200 | $ | 192 | ||||
3.750%, 03/26/2025 | 1,085 | 1,044 | ||||||
3.091%, SOFRRATE + 1.730%, 05/14/2032 (B)(D) | 1,875 | 1,481 | ||||||
2.746%, H15T1Y + 1.100%, 02/11/2033 (B)(D) | 210 | 159 | ||||||
2.593%, SOFRRATE + 1.560%, 09/11/2025 (B)(D) | 960 | 924 | ||||||
2.193%, SOFRRATE + 2.044%, 06/05/2026 (B)(D) | 1,070 | 995 | ||||||
1.494%, H15T1Y + 0.850%, 08/10/2027 (B)(D) | 610 | 532 | ||||||
1.305%, SOFRINDX + 0.980%, 02/02/2027 (B)(D) | 2,825 | 2,505 | ||||||
US Bancorp | ||||||||
5.850%, SOFRRATE + 2.090%, 10/21/2033 (B) | 1,065 | 1,008 | ||||||
5.836%, SOFRRATE + 2.260%, 06/12/2034 (B) | 810 | 764 | ||||||
5.775%, SOFRRATE + 2.020%, 06/12/2029 (B) | 490 | 477 | ||||||
5.727%, SOFRRATE + 1.430%, 10/21/2026 (B) | 185 | 184 | ||||||
4.839%, SOFRRATE + 1.600%, 02/01/2034 (B) | 1,905 | 1,677 | ||||||
4.653%, SOFRRATE + 1.230%, 02/01/2029 (B) | 1,850 | 1,731 | ||||||
1.450%, 05/12/2025 (E) | 780 | 728 | ||||||
US Bancorp MTN | ||||||||
2.215%, SOFRRATE + 0.730%, 01/27/2028 (B) | 70 | 62 | ||||||
WEA Finance | ||||||||
4.750%, 09/17/2044 (D) | 230 | 147 | ||||||
3.750%, 09/17/2024 (D) | 990 | 952 | ||||||
Wells Fargo | ||||||||
7.950%, 11/15/2029 | 495 | 526 | ||||||
6.070%, TSFR3M + 0.762%, 01/15/2027 (B) | 1,200 | 1,137 | ||||||
5.389%, SOFRRATE + 2.020%, 04/24/2034 (B) | 450 | 421 | ||||||
5.375%, 11/02/2043 | 400 | 347 | ||||||
3.000%, 10/23/2026 | 1,030 | 946 | ||||||
2.188%, SOFRRATE + 2.000%, 04/30/2026 (B) | 2,760 | 2,591 | ||||||
Wells Fargo MTN | ||||||||
5.574%, SOFRRATE + 1.740%, 07/25/2029 (B) | 1,392 | 1,358 | ||||||
5.557%, SOFRRATE + 1.990%, 07/25/2034 (B) | 1,066 | 1,009 | ||||||
5.013%, TSFR3M + 4.502%, 04/04/2051 (B) | 4,075 | 3,424 | ||||||
4.900%, 11/17/2045 | 909 | 729 | ||||||
194
SEI Institutional Managed Trust
Description | Face Amount | Market Value | ||||||
CORPORATE OBLIGATIONS (continued) | ||||||||
4.897%, SOFRRATE + 2.100%, 07/25/2033 (B) | $ | 3,803 | $ | 3,442 | ||||
4.750%, 12/07/2046 | 700 | 546 | ||||||
4.650%, 11/04/2044 | 261 | 203 | ||||||
4.611%, SOFRRATE + 2.130%, 04/25/2053 (B) | 298 | 233 | ||||||
4.478%, TSFR3M + 4.032%, 04/04/2031 (B) | 1,880 | 1,706 | ||||||
4.400%, 06/14/2046 | 1,370 | 1,014 | ||||||
4.150%, 01/24/2029 | 1,010 | 927 | ||||||
3.750%, 01/24/2024 | 250 | 248 | ||||||
3.584%, TSFR3M + 1.572%, 05/22/2028 (B) | 515 | 472 | ||||||
3.526%, SOFRRATE + 1.510%, 03/24/2028 (B) | 3,275 | 3,008 | ||||||
3.350%, SOFRRATE + 1.500%, 03/02/2033 (B) | 4,775 | 3,860 | ||||||
3.196%, TSFR3M + 1.432%, 06/17/2027 (B) | 1,550 | 1,439 | ||||||
2.879%, TSFR3M + 1.432%, 10/30/2030 (B) | 20 | 17 | ||||||
2.406%, TSFR3M + 1.087%, 10/30/2025 (B) | 1,005 | 963 | ||||||
2.393%, SOFRRATE + 2.100%, 06/02/2028 (B) | 75 | 66 | ||||||
2.164%, TSFR3M + 1.012%, 02/11/2026 (B) | 1,695 | 1,600 | ||||||
Westpac Banking | ||||||||
2.668%, H15T5Y + 1.750%, 11/15/2035 (B) | 420 | 315 | ||||||
Willis North America | ||||||||
5.350%, 05/15/2033 | 1,600 | 1,493 | ||||||
| 382,371 | ||||||||
Health Care — 2.8% | ||||||||
Abbott Laboratories | ||||||||
4.900%, 11/30/2046 | 470 | 428 | ||||||
4.750%, 11/30/2036 | 861 | 818 | ||||||
1.400%, 06/30/2030 | 677 | 538 | ||||||
AbbVie | ||||||||
4.875%, 11/14/2048 | 70 | 61 | ||||||
4.625%, 10/01/2042 | 38 | 32 | ||||||
4.550%, 03/15/2035 | 748 | 680 | ||||||
4.500%, 05/14/2035 | 656 | 593 | ||||||
4.450%, 05/14/2046 | 198 | 162 | ||||||
4.300%, 05/14/2036 | 427 | 374 | ||||||
4.250%, 11/21/2049 | 3,229 | 2,556 | ||||||
4.050%, 11/21/2039 | 318 | 260 | ||||||
3.800%, 03/15/2025 | 460 | 447 | ||||||
3.750%, 11/14/2023 | 100 | 100 | ||||||
3.600%, 05/14/2025 | 210 | 203 | ||||||
3.200%, 11/21/2029 | 2,143 | 1,891 | ||||||
2.950%, 11/21/2026 | 380 | 353 | ||||||
Description | Face Amount | Market Value | ||||||
CORPORATE OBLIGATIONS (continued) | ||||||||
2.600%, 11/21/2024 | $ | 1,820 | $ | 1,755 | ||||
Aetna | ||||||||
3.875%, 08/15/2047 | 90 | 63 | ||||||
Alcon Finance | ||||||||
3.000%, 09/23/2029 (D) | 1,975 | 1,700 | ||||||
Amgen | ||||||||
6.375%, 06/01/2037 | 910 | 929 | ||||||
5.750%, 03/02/2063 | 448 | 413 | ||||||
5.650%, 03/02/2053 | 3,064 | 2,868 | ||||||
5.250%, 03/02/2025 | 1,501 | 1,490 | ||||||
5.250%, 03/02/2033 | 1,075 | 1,028 | ||||||
5.150%, 11/15/2041 | 332 | 293 | ||||||
4.875%, 03/01/2053 | 970 | 807 | ||||||
4.663%, 06/15/2051 | 269 | 218 | ||||||
4.400%, 05/01/2045 | 375 | 297 | ||||||
3.625%, 05/22/2024 | 130 | 128 | ||||||
3.150%, 02/21/2040 | 190 | 134 | ||||||
2.770%, 09/01/2053 | 263 | 146 | ||||||
2.000%, 01/15/2032 | 1,515 | 1,150 | ||||||
Astrazeneca Finance | ||||||||
4.900%, 03/03/2030 | 901 | 878 | ||||||
4.875%, 03/03/2028 | 659 | 647 | ||||||
Bausch Health | ||||||||
7.250%, 05/30/2029 (D)(E) | 170 | 68 | ||||||
6.250%, 02/15/2029 (D) | 500 | 197 | ||||||
5.500%, 11/01/2025 (D) | 20 | 18 | ||||||
Bayer US Finance | ||||||||
3.375%, 10/08/2024 (D) | 800 | 779 | ||||||
Bayer US Finance II | ||||||||
4.875%, 06/25/2048 (D) | 1,795 | 1,431 | ||||||
4.700%, 07/15/2064 (D) | 210 | 151 | ||||||
4.625%, 06/25/2038 (D) | 420 | 345 | ||||||
4.375%, 12/15/2028 (D) | 4,578 | 4,255 | ||||||
4.250%, 12/15/2025 (D) | 520 | 501 | ||||||
Becton Dickinson | ||||||||
4.685%, 12/15/2044 | 264 | 222 | ||||||
3.734%, 12/15/2024 | 287 | 280 | ||||||
3.700%, 06/06/2027 | 121 | 113 | ||||||
3.363%, 06/06/2024 | 758 | 745 | ||||||
Bristol-Myers Squibb | ||||||||
4.550%, 02/20/2048 | 129 | 108 | ||||||
4.350%, 11/15/2047 | 51 | 41 | ||||||
3.400%, 07/26/2029 | 124 | 112 | ||||||
3.200%, 06/15/2026 | 506 | 480 | ||||||
2.900%, 07/26/2024 | 785 | 767 | ||||||
Centene | ||||||||
4.625%, 12/15/2029 | 390 | 351 | ||||||
4.250%, 12/15/2027 | 260 | 240 | ||||||
3.375%, 02/15/2030 | 230 | 192 | ||||||
3.000%, 10/15/2030 | 3,073 | 2,479 | ||||||
2.625%, 08/01/2031 | 40 | 30 | ||||||
SEI Institutional Managed Trust
195
SCHEDULE OF INVESTMENTS
September 30, 2023
Core Fixed Income Fund (Continued)
Description | Face Amount | Market Value | ||||||
CORPORATE OBLIGATIONS (continued) | ||||||||
Cigna Group | ||||||||
4.900%, 12/15/2048 | $ | 830 | $ | 700 | ||||
4.800%, 08/15/2038 | 500 | 440 | ||||||
4.375%, 10/15/2028 | 810 | 766 | ||||||
4.125%, 11/15/2025 | 290 | 281 | ||||||
3.400%, 03/01/2027 | 380 | 354 | ||||||
3.400%, 03/15/2050 | 120 | 79 | ||||||
3.400%, 03/15/2051 | 588 | 385 | ||||||
CommonSpirit Health | ||||||||
4.350%, 11/01/2042 | 110 | 89 | ||||||
2.782%, 10/01/2030 | 1,135 | 934 | ||||||
CVS Health | ||||||||
5.125%, 02/21/2030 | 1,375 | 1,322 | ||||||
5.125%, 07/20/2045 | 670 | 564 | ||||||
5.050%, 03/25/2048 | 2,370 | 1,969 | ||||||
5.000%, 02/20/2026 | 1,295 | 1,275 | ||||||
4.780%, 03/25/2038 | 565 | 487 | ||||||
4.300%, 03/25/2028 | 809 | 766 | ||||||
4.250%, 04/01/2050 | 30 | 22 | ||||||
4.125%, 04/01/2040 | 160 | 124 | ||||||
3.875%, 07/20/2025 | 515 | 498 | ||||||
3.750%, 04/01/2030 | 540 | 477 | ||||||
3.625%, 04/01/2027 | 360 | 336 | ||||||
2.700%, 08/21/2040 | 500 | 315 | ||||||
2.125%, 09/15/2031 | 370 | 283 | ||||||
1.875%, 02/28/2031 | 110 | 84 | ||||||
CVS Pass-Through Trust | ||||||||
5.926%, 01/10/2034 (D) | 61 | 58 | ||||||
DH Europe Finance II Sarl | ||||||||
2.200%, 11/15/2024 | 740 | 711 | ||||||
Elevance Health | ||||||||
4.625%, 05/15/2042 | 41 | 34 | ||||||
4.550%, 05/15/2052 | 250 | 202 | ||||||
4.100%, 05/15/2032 | 270 | 241 | ||||||
3.650%, 12/01/2027 | 220 | 204 | ||||||
3.500%, 08/15/2024 | 90 | 88 | ||||||
3.350%, 12/01/2024 | 1,425 | 1,383 | ||||||
Eli Lilly | ||||||||
4.950%, 02/27/2063 | 209 | 189 | ||||||
4.700%, 02/27/2033 | 301 | 290 | ||||||
Fresenius Medical Care US Finance III | ||||||||
1.875%, 12/01/2026 (D) | 1,345 | 1,173 | ||||||
Gilead Sciences | ||||||||
5.650%, 12/01/2041 | 35 | 34 | ||||||
4.750%, 03/01/2046 | 380 | 325 | ||||||
4.500%, 02/01/2045 | 10 | 8 | ||||||
3.700%, 04/01/2024 | 410 | 406 | ||||||
3.650%, 03/01/2026 | 460 | 440 | ||||||
2.600%, 10/01/2040 | 468 | 309 | ||||||
HCA | ||||||||
5.900%, 06/01/2053 | 1,052 | 947 | ||||||
5.875%, 02/01/2029 | 410 | 403 | ||||||
Description | Face Amount | Market Value | ||||||
CORPORATE OBLIGATIONS (continued) | ||||||||
5.625%, 09/01/2028 | $ | 60 | $ | 59 | ||||
5.500%, 06/15/2047 | 965 | 824 | ||||||
5.375%, 02/01/2025 | 160 | 158 | ||||||
5.375%, 09/01/2026 | 155 | 152 | ||||||
5.250%, 04/15/2025 | 820 | 810 | ||||||
5.250%, 06/15/2026 | 650 | 636 | ||||||
5.250%, 06/15/2049 | 2,150 | 1,766 | ||||||
5.200%, 06/01/2028 | 181 | 175 | ||||||
4.625%, 03/15/2052 | 288 | 216 | ||||||
4.500%, 02/15/2027 | 20 | 19 | ||||||
3.625%, 03/15/2032 | 693 | 575 | ||||||
3.500%, 09/01/2030 | 1,630 | 1,379 | ||||||
3.500%, 07/15/2051 | 672 | 420 | ||||||
2.375%, 07/15/2031 | 945 | 723 | ||||||
Humana | ||||||||
4.950%, 10/01/2044 | 60 | 50 | ||||||
4.800%, 03/15/2047 | 30 | 25 | ||||||
4.625%, 12/01/2042 | 170 | 139 | ||||||
4.500%, 04/01/2025 | 80 | 79 | ||||||
3.950%, 03/15/2027 | 70 | 66 | ||||||
3.700%, 03/23/2029 | 3,205 | 2,924 | ||||||
2.150%, 02/03/2032 | 130 | 98 | ||||||
Johnson & Johnson | ||||||||
3.700%, 03/01/2046 | 170 | 132 | ||||||
3.625%, 03/03/2037 | 260 | 219 | ||||||
3.500%, 01/15/2048 | 92 | 70 | ||||||
3.400%, 01/15/2038 | 173 | 140 | ||||||
2.625%, 01/15/2025 | 86 | 83 | ||||||
2.450%, 09/01/2060 | 655 | 363 | ||||||
Medtronic | ||||||||
4.625%, 03/15/2045 | 9 | 8 | ||||||
Merck | ||||||||
5.150%, 05/17/2063 | 228 | 208 | ||||||
5.000%, 05/17/2053 | 1,098 | 999 | ||||||
4.500%, 05/17/2033 | 152 | 142 | ||||||
1.450%, 06/24/2030 | 300 | 235 | ||||||
New York and Presbyterian Hospital | ||||||||
3.563%, 08/01/2036 | 730 | 576 | ||||||
Pfizer | ||||||||
4.000%, 12/15/2036 | 815 | 703 | ||||||
2.625%, 04/01/2030 | 440 | 376 | ||||||
1.700%, 05/28/2030 | 420 | 337 | ||||||
Pfizer Investment Enterprises Pte | ||||||||
5.340%, 05/19/2063 | 590 | 539 | ||||||
5.300%, 05/19/2053 | 2,101 | 1,952 | ||||||
4.750%, 05/19/2033 | 3,683 | 3,482 | ||||||
Royalty Pharma | ||||||||
1.200%, 09/02/2025 | 535 | 486 | ||||||
RWJ Barnabas Health | ||||||||
3.949%, 07/01/2046 | 1,030 | 774 | ||||||
Takeda Pharmaceutical | ||||||||
4.400%, 11/26/2023 | 933 | 931 | ||||||
196
SEI Institutional Managed Trust
Description | Face Amount | Market Value | ||||||
CORPORATE OBLIGATIONS (continued) | ||||||||
Tenet Healthcare | ||||||||
4.375%, 01/15/2030 | $ | 20 | $ | 17 | ||||
Teva Pharmaceutical Finance Netherlands III BV | ||||||||
8.125%, 09/15/2031 | 200 | 207 | ||||||
7.125%, 01/31/2025 | 390 | 391 | ||||||
5.125%, 05/09/2029 | 1,780 | 1,609 | ||||||
4.750%, 05/09/2027 | 200 | 184 | ||||||
3.150%, 10/01/2026 | 1,580 | 1,408 | ||||||
UnitedHealth Group | ||||||||
5.875%, 02/15/2053 | 1,638 | 1,644 | ||||||
5.800%, 03/15/2036 | 280 | 284 | ||||||
5.200%, 04/15/2063 | 311 | 278 | ||||||
4.625%, 07/15/2035 | 523 | 483 | ||||||
4.450%, 12/15/2048 | 90 | 74 | ||||||
4.250%, 04/15/2047 | 450 | 358 | ||||||
4.250%, 06/15/2048 | 110 | 88 | ||||||
4.200%, 05/15/2032 | 290 | 265 | ||||||
4.000%, 05/15/2029 | 992 | 928 | ||||||
3.875%, 12/15/2028 | 170 | 160 | ||||||
3.875%, 08/15/2059 | 360 | 256 | ||||||
3.700%, 08/15/2049 | 150 | 108 | ||||||
3.125%, 05/15/2060 | 50 | 30 | ||||||
3.050%, 05/15/2041 | 141 | 99 | ||||||
2.300%, 05/15/2031 | 80 | 65 | ||||||
2.000%, 05/15/2030 | 140 | 113 | ||||||
1.250%, 01/15/2026 | 170 | 155 | ||||||
Universal Health Services | ||||||||
1.650%, 09/01/2026 | 685 | 604 | ||||||
Viatris | ||||||||
4.000%, 06/22/2050 | 505 | 305 | ||||||
Wyeth | ||||||||
5.950%, 04/01/2037 | 470 | 483 | ||||||
| 92,984 | ||||||||
Industrials — 2.4% | ||||||||
3M | ||||||||
3.700%, 04/15/2050 (E) | 660 | 470 | ||||||
3.050%, 04/15/2030 (E) | 90 | 78 | ||||||
2.375%, 08/26/2029 (E) | 390 | 326 | ||||||
Adani International Container Terminal Pvt | ||||||||
3.000%, 02/16/2031 (D) | 248 | 186 | ||||||
AerCap Ireland Capital DAC | ||||||||
3.500%, 01/15/2025 | 232 | 224 | ||||||
3.300%, 01/30/2032 | 4,118 | 3,273 | ||||||
3.150%, 02/15/2024 | 560 | 554 | ||||||
3.000%, 10/29/2028 | 3,515 | 3,014 | ||||||
2.450%, 10/29/2026 | 3,530 | 3,162 | ||||||
1.650%, 10/29/2024 | 1,395 | 1,327 | ||||||
1.150%, 10/29/2023 | 1,865 | 1,858 | ||||||
Air Lease | ||||||||
5.300%, 02/01/2028 | 450 | 435 | ||||||
Description | Face Amount | Market Value | ||||||
CORPORATE OBLIGATIONS (continued) | ||||||||
3.625%, 04/01/2027 | $ | 221 | $ | 200 | ||||
3.625%, 12/01/2027 | 216 | 195 | ||||||
3.375%, 07/01/2025 | 310 | 295 | ||||||
3.250%, 03/01/2025 | 1,645 | 1,574 | ||||||
Air Lease MTN | ||||||||
2.300%, 02/01/2025 | 355 | 336 | ||||||
Allied Universal Holdco | ||||||||
6.625%, 07/15/2026 (D) | 20 | 19 | ||||||
Boeing | ||||||||
5.930%, 05/01/2060 | 160 | 144 | ||||||
5.805%, 05/01/2050 | 1,911 | 1,730 | ||||||
5.705%, 05/01/2040 | 690 | 637 | ||||||
5.150%, 05/01/2030 | 940 | 898 | ||||||
4.875%, 05/01/2025 | 2,075 | 2,039 | ||||||
3.750%, 02/01/2050 | 941 | 639 | ||||||
3.625%, 03/01/2048 | 23 | 15 | ||||||
3.550%, 03/01/2038 | 196 | 144 | ||||||
3.250%, 02/01/2035 | 1,541 | 1,185 | ||||||
3.200%, 03/01/2029 | 490 | 430 | ||||||
3.100%, 05/01/2026 | 160 | 149 | ||||||
2.800%, 03/01/2027 | 190 | 172 | ||||||
2.700%, 02/01/2027 | 140 | 127 | ||||||
2.196%, 02/04/2026 | 1,957 | 1,797 | ||||||
1.433%, 02/04/2024 | 2,065 | 2,032 | ||||||
Builders FirstSource | ||||||||
4.250%, 02/01/2032 (D) | 80 | 66 | ||||||
Burlington Northern Santa Fe | ||||||||
7.290%, 06/01/2036 | 90 | 99 | ||||||
5.400%, 06/01/2041 | 50 | 47 | ||||||
4.450%, 01/15/2053 | 120 | 99 | ||||||
4.150%, 12/15/2048 | 150 | 118 | ||||||
4.050%, 06/15/2048 | 124 | 96 | ||||||
2.875%, 06/15/2052 | 120 | 74 | ||||||
Canadian Pacific Railway | ||||||||
6.125%, 09/15/2115 | 44 | 43 | ||||||
1.750%, 12/02/2026 | 129 | 115 | ||||||
1.350%, 12/02/2024 | 670 | 635 | ||||||
Carrier Global | ||||||||
3.577%, 04/05/2050 | 30 | 20 | ||||||
Cintas No. 2 | ||||||||
4.000%, 05/01/2032 | 1,190 | 1,073 | ||||||
3.700%, 04/01/2027 | 400 | 379 | ||||||
Crowley Conro | ||||||||
4.181%, 08/15/2043 | 395 | 361 | ||||||
Deere | ||||||||
3.750%, 04/15/2050 (E) | 530 | 419 | ||||||
3.100%, 04/15/2030 | 100 | 88 | ||||||
Delta Air Lines | ||||||||
7.375%, 01/15/2026 | 580 | 587 | ||||||
4.750%, 10/20/2028 (D) | 1,432 | 1,361 | ||||||
4.500%, 10/20/2025 (D) | 367 | 357 | ||||||
4.375%, 04/19/2028 | 153 | 140 | ||||||
SEI Institutional Managed Trust
197
SCHEDULE OF INVESTMENTS
September 30, 2023
Core Fixed Income Fund (Continued)
Description | Face Amount | Market Value | ||||||
CORPORATE OBLIGATIONS (continued) | ||||||||
2.900%, 10/28/2024 | $ | 60 | $ | 58 | ||||
Delta Air Lines Pass-Through Trust, Ser 2020-1, Cl AA | ||||||||
2.000%, 06/10/2028 | 3,282 | 2,865 | ||||||
DP World MTN | ||||||||
5.625%, 09/25/2048 (D) | 990 | 876 | ||||||
Eaton | ||||||||
7.625%, 04/01/2024 | 75 | 76 | ||||||
4.150%, 11/02/2042 | 140 | 114 | ||||||
Emerson Electric | ||||||||
2.800%, 12/21/2051 | 280 | 170 | ||||||
Equifax | ||||||||
2.600%, 12/15/2025 | 255 | 237 | ||||||
General Dynamics | ||||||||
4.250%, 04/01/2040 | 880 | 747 | ||||||
4.250%, 04/01/2050 | 200 | 164 | ||||||
3.500%, 05/15/2025 | 60 | 58 | ||||||
3.250%, 04/01/2025 | 160 | 155 | ||||||
General Electric MTN | ||||||||
6.106%, TSFR3M + 0.742%, 08/15/2036 (B) | 2,400 | 2,142 | ||||||
GFL Environmental | ||||||||
4.250%, 06/01/2025 (D) | 250 | 240 | ||||||
H&E Equipment Services | ||||||||
3.875%, 12/15/2028 (D) | 80 | 68 | ||||||
Ingersoll Rand | ||||||||
5.700%, 08/14/2033 | 591 | 570 | ||||||
John Deere Capital MTN | ||||||||
5.150%, 09/08/2026 | 1,025 | 1,022 | ||||||
5.150%, 09/08/2033 | 1,025 | 1,002 | ||||||
4.950%, 07/14/2028 | 895 | 883 | ||||||
4.700%, 06/10/2030 | 938 | 902 | ||||||
4.150%, 09/15/2027 | 1,419 | 1,367 | ||||||
L3Harris Technologies | ||||||||
5.400%, 01/15/2027 | 1,046 | 1,037 | ||||||
5.400%, 07/31/2033 | 2,122 | 2,040 | ||||||
5.054%, 04/27/2045 | 180 | 156 | ||||||
4.854%, 04/27/2035 | 80 | 73 | ||||||
Lockheed Martin | ||||||||
4.750%, 02/15/2034 | 1,078 | 1,021 | ||||||
4.500%, 05/15/2036 | 90 | 82 | ||||||
4.150%, 06/15/2053 | 1,220 | 962 | ||||||
4.070%, 12/15/2042 | 91 | 75 | ||||||
3.900%, 06/15/2032 | 230 | 206 | ||||||
Mileage Plus Holdings | ||||||||
6.500%, 06/20/2027 (D) | 382 | 379 | ||||||
Northrop Grumman | ||||||||
5.250%, 05/01/2050 | 350 | 323 | ||||||
4.400%, 05/01/2030 | 345 | 323 | ||||||
4.030%, 10/15/2047 | 192 | 147 | ||||||
3.250%, 01/15/2028 | 1,074 | 985 | ||||||
2.930%, 01/15/2025 | 810 | 781 | ||||||
Description | Face Amount | Market Value | ||||||
CORPORATE OBLIGATIONS (continued) | ||||||||
Otis Worldwide | ||||||||
3.112%, 02/15/2040 | $ | 335 | $ | 239 | ||||
2.056%, 04/05/2025 | 220 | 208 | ||||||
Parker-Hannifin | ||||||||
4.250%, 09/15/2027 | 760 | 726 | ||||||
2.700%, 06/14/2024 | 400 | 391 | ||||||
Prime Security Services Borrower | ||||||||
5.750%, 04/15/2026 (D) | 320 | 311 | ||||||
Protective Life Global Funding | ||||||||
1.618%, 04/15/2026 (D) | 2,170 | 1,948 | ||||||
Quanta Services | ||||||||
0.950%, 10/01/2024 | 537 | 508 | ||||||
Republic Services | ||||||||
5.000%, 04/01/2034 | 452 | 428 | ||||||
4.875%, 04/01/2029 | 452 | 439 | ||||||
3.950%, 05/15/2028 | 335 | 315 | ||||||
1.450%, 02/15/2031 | 1,650 | 1,240 | ||||||
RTX Corp | ||||||||
5.375%, 02/27/2053 | 353 | 319 | ||||||
4.625%, 11/16/2048 | 51 | 41 | ||||||
4.500%, 06/01/2042 | 320 | 262 | ||||||
4.450%, 11/16/2038 | 63 | 53 | ||||||
4.150%, 05/15/2045 | 59 | 45 | ||||||
4.125%, 11/16/2028 | 280 | 261 | ||||||
3.950%, 08/16/2025 | 190 | 184 | ||||||
3.150%, 12/15/2024 | 200 | 194 | ||||||
3.030%, 03/15/2052 | 430 | 259 | ||||||
2.250%, 07/01/2030 | 420 | 338 | ||||||
Siemens Financieringsmaatschappij | ||||||||
1.200%, 03/11/2026 (D) | 1,120 | 1,011 | ||||||
Spirit Loyalty Cayman | ||||||||
8.000%, 09/20/2025 (D) | 375 | 375 | ||||||
Union Pacific | ||||||||
3.839%, 03/20/2060 | 1,030 | 722 | ||||||
3.750%, 07/15/2025 | 340 | 329 | ||||||
3.750%, 02/05/2070 | 230 | 154 | ||||||
3.375%, 02/14/2042 | 323 | 237 | ||||||
3.250%, 02/05/2050 | 480 | 323 | ||||||
2.891%, 04/06/2036 | 1,595 | 1,208 | ||||||
2.800%, 02/14/2032 | 389 | 321 | ||||||
2.375%, 05/20/2031 | 286 | 232 | ||||||
United Airlines | ||||||||
4.625%, 04/15/2029 (D) | 510 | 438 | ||||||
4.375%, 04/15/2026 (D) | 300 | 278 | ||||||
United Airlines Class A Pass Through Trust | ||||||||
5.800%, 01/15/2036 | 2,100 | 2,041 | ||||||
United Parcel Service | ||||||||
5.200%, 04/01/2040 (E) | 240 | 228 | ||||||
United Rentals North America | ||||||||
4.875%, 01/15/2028 | 150 | 140 | ||||||
3.875%, 11/15/2027 | 100 | 91 | ||||||
3.875%, 02/15/2031 | 920 | 765 | ||||||
198
SEI Institutional Managed Trust
Description | Face Amount | Market Value | ||||||
CORPORATE OBLIGATIONS (continued) | ||||||||
3.750%, 01/15/2032 | $ | 300 | $ | 242 | ||||
US Airways Pass-Through Trust, Ser 2012-2, Cl A | ||||||||
4.625%, 06/03/2025 | 408 | 393 | ||||||
Veralto | ||||||||
5.500%, 09/18/2026 (D) | 568 | 565 | ||||||
Vertiv Group | ||||||||
4.125%, 11/15/2028 (D) | 140 | 123 | ||||||
Waste Management | ||||||||
4.875%, 02/15/2029 | 892 | 872 | ||||||
4.875%, 02/15/2034 | 892 | 844 | ||||||
| 78,788 | ||||||||
Information Technology — 1.7% | ||||||||
Apple | ||||||||
4.850%, 05/10/2053 | 151 | 138 | ||||||
4.375%, 05/13/2045 | 360 | 311 | ||||||
4.150%, 05/10/2030 | 449 | 428 | ||||||
3.950%, 08/08/2052 | 423 | 332 | ||||||
3.200%, 05/13/2025 | 64 | 62 | ||||||
3.200%, 05/11/2027 | 232 | 218 | ||||||
2.650%, 05/11/2050 | 236 | 144 | ||||||
2.650%, 02/08/2051 | 184 | 112 | ||||||
2.450%, 08/04/2026 | 1,410 | 1,310 | ||||||
2.375%, 02/08/2041 | 218 | 146 | ||||||
Broadcom | ||||||||
4.926%, 05/15/2037 (D) | 929 | 801 | ||||||
4.150%, 11/15/2030 | 370 | 328 | ||||||
3.469%, 04/15/2034 (D) | 301 | 236 | ||||||
3.419%, 04/15/2033 (D) | 529 | 423 | ||||||
3.187%, 11/15/2036 (D) | 10 | 7 | ||||||
3.150%, 11/15/2025 | 352 | 333 | ||||||
3.137%, 11/15/2035 (D) | 1,960 | 1,429 | ||||||
2.600%, 02/15/2033 (D) | 962 | 717 | ||||||
2.450%, 02/15/2031 (D) | 471 | 368 | ||||||
CommScope | ||||||||
6.000%, 03/01/2026 (D) | 200 | 187 | ||||||
4.750%, 09/01/2029 (D) | 140 | 103 | ||||||
Corning | ||||||||
5.450%, 11/15/2079 | 570 | 479 | ||||||
Dell International | ||||||||
6.020%, 06/15/2026 | 39 | 39 | ||||||
Global Payments | ||||||||
4.450%, 06/01/2028 | 1,845 | 1,710 | ||||||
Intel | ||||||||
5.900%, 02/10/2063 | 420 | 398 | ||||||
5.700%, 02/10/2053 | 298 | 279 | ||||||
5.625%, 02/10/2043 | 172 | 164 | ||||||
5.125%, 02/10/2030 | 320 | 314 | ||||||
4.750%, 03/25/2050 | 170 | 140 | ||||||
3.700%, 07/29/2025 | 223 | 216 | ||||||
3.050%, 08/12/2051 | 270 | 164 | ||||||
Description | Face Amount | Market Value | ||||||
CORPORATE OBLIGATIONS (continued) | ||||||||
2.800%, 08/12/2041 | $ | 259 | $ | 170 | ||||
1.600%, 08/12/2028 | 540 | 457 | ||||||
International Business Machines | ||||||||
3.000%, 05/15/2024 | 1,510 | 1,484 | ||||||
Intuit | ||||||||
5.500%, 09/15/2053 | 586 | 562 | ||||||
5.250%, 09/15/2026 | 1,466 | 1,463 | ||||||
5.200%, 09/15/2033 | 1,320 | 1,285 | ||||||
5.125%, 09/15/2028 | 1,319 | 1,305 | ||||||
KLA | ||||||||
3.300%, 03/01/2050 | 246 | 163 | ||||||
Kyndryl Holdings | ||||||||
2.050%, 10/15/2026 | 1,350 | 1,178 | ||||||
Marvell Technology | ||||||||
5.950%, 09/15/2033 | 440 | 432 | ||||||
5.750%, 02/15/2029 | 440 | 436 | ||||||
1.650%, 04/15/2026 | 1,030 | 931 | ||||||
Mastercard | ||||||||
3.850%, 03/26/2050 | 80 | 62 | ||||||
3.375%, 04/01/2024 | 80 | 79 | ||||||
Micron Technology | ||||||||
5.875%, 02/09/2033 | 416 | 397 | ||||||
5.375%, 04/15/2028 | 1,509 | 1,457 | ||||||
3.477%, 11/01/2051 | 147 | 90 | ||||||
Microsoft | ||||||||
4.100%, 02/06/2037 | 251 | 227 | ||||||
3.625%, 12/15/2023 | 89 | 89 | ||||||
3.450%, 08/08/2036 | 710 | 599 | ||||||
3.300%, 02/06/2027 | 480 | 455 | ||||||
3.041%, 03/17/2062 | 199 | 126 | ||||||
2.921%, 03/17/2052 | 365 | 239 | ||||||
2.875%, 02/06/2024 | 1,010 | 1,001 | ||||||
2.700%, 02/12/2025 | 250 | 241 | ||||||
2.525%, 06/01/2050 | 546 | 333 | ||||||
NVIDIA | ||||||||
3.700%, 04/01/2060 | 310 | 227 | ||||||
3.500%, 04/01/2040 | 430 | 338 | ||||||
3.500%, 04/01/2050 | 1,150 | 838 | ||||||
2.850%, 04/01/2030 | 230 | 201 | ||||||
NXP BV | ||||||||
4.400%, 06/01/2027 | 325 | 308 | ||||||
3.250%, 05/11/2041 | 294 | 198 | ||||||
2.700%, 05/01/2025 | 280 | 266 | ||||||
2.500%, 05/11/2031 | 299 | 233 | ||||||
Open Text Holdings | ||||||||
4.125%, 02/15/2030 (D) | 20 | 17 | ||||||
4.125%, 12/01/2031 (D) | 30 | 24 | ||||||
Oracle | ||||||||
6.900%, 11/09/2052 | 1,105 | 1,138 | ||||||
5.550%, 02/06/2053 | 401 | 351 | ||||||
4.650%, 05/06/2030 | 330 | 309 | ||||||
4.375%, 05/15/2055 | 181 | 130 | ||||||
SEI Institutional Managed Trust
199
SCHEDULE OF INVESTMENTS
September 30, 2023
Core Fixed Income Fund (Continued)
Description | Face Amount | Market Value | ||||||
CORPORATE OBLIGATIONS (continued) | ||||||||
4.000%, 07/15/2046 | $ | 523 | $ | 369 | ||||
3.950%, 03/25/2051 | 2,971 | 2,037 | ||||||
3.900%, 05/15/2035 | 1,720 | 1,406 | ||||||
3.800%, 11/15/2037 | 2,255 | 1,721 | ||||||
3.650%, 03/25/2041 | 800 | 571 | ||||||
3.600%, 04/01/2040 | 915 | 661 | ||||||
3.600%, 04/01/2050 | 410 | 265 | ||||||
2.950%, 11/15/2024 | 315 | 305 | ||||||
2.950%, 04/01/2030 | 860 | 724 | ||||||
2.875%, 03/25/2031 | 1,200 | 980 | ||||||
1.650%, 03/25/2026 | 890 | 806 | ||||||
PayPal Holdings | ||||||||
2.300%, 06/01/2030 (E) | 1,770 | 1,447 | ||||||
1.650%, 06/01/2025 | 400 | 374 | ||||||
Prosus | ||||||||
3.832%, 02/08/2051 (D) | 320 | 177 | ||||||
Prosus MTN | ||||||||
4.027%, 08/03/2050 (D) | 730 | 418 | ||||||
3.061%, 07/13/2031 (D) | 2,100 | 1,559 | ||||||
QUALCOMM | ||||||||
6.000%, 05/20/2053 | 679 | 689 | ||||||
Roper Technologies | ||||||||
1.000%, 09/15/2025 | 420 | 384 | ||||||
Salesforce | ||||||||
3.700%, 04/11/2028 | 670 | 632 | ||||||
Sprint | ||||||||
7.125%, 06/15/2024 | 1,015 | 1,021 | ||||||
Sprint Capital | ||||||||
8.750%, 03/15/2032 | 1,310 | 1,515 | ||||||
Tencent Holdings MTN | ||||||||
3.975%, 04/11/2029 (D) | 600 | 545 | ||||||
3.840%, 04/22/2051 (D) | 675 | 430 | ||||||
3.680%, 04/22/2041 (D) | 680 | 470 | ||||||
Texas Instruments | ||||||||
5.050%, 05/18/2063 | 451 | 400 | ||||||
5.000%, 03/14/2053 | 752 | 681 | ||||||
4.900%, 03/14/2033 | 599 | 579 | ||||||
4.150%, 05/15/2048 | 300 | 242 | ||||||
1.750%, 05/04/2030 | 290 | 235 | ||||||
TSMC Global | ||||||||
1.375%, 09/28/2030 (D) | 1,365 | 1,041 | ||||||
Visa | ||||||||
4.300%, 12/14/2045 | 690 | 584 | ||||||
3.650%, 09/15/2047 | 235 | 178 | ||||||
3.150%, 12/14/2025 | 670 | 640 | ||||||
VMware | ||||||||
4.700%, 05/15/2030 | 541 | 498 | ||||||
1.400%, 08/15/2026 | 876 | 773 | ||||||
1.000%, 08/15/2024 | 937 | 898 | ||||||
Description | Face Amount | Market Value | ||||||
CORPORATE OBLIGATIONS (continued) | ||||||||
Vontier | ||||||||
1.800%, 04/01/2026 | $ | 495 | $ | 443 | ||||
| 58,573 | ||||||||
Materials — 0.8% | ||||||||
Amcor Finance USA | ||||||||
3.625%, 04/28/2026 | 2,425 | 2,290 | ||||||
Anglo American Capital | ||||||||
5.500%, 05/02/2033 (D) | 409 | 383 | ||||||
4.750%, 04/10/2027 (D) | 720 | 690 | ||||||
4.750%, 03/16/2052 (D) | 850 | 645 | ||||||
4.000%, 09/11/2027 (D) | 200 | 187 | ||||||
3.625%, 09/11/2024 (D) | 710 | 693 | ||||||
ArcelorMittal | ||||||||
7.000%, 10/15/2039 | 120 | 120 | ||||||
Ball | ||||||||
3.125%, 09/15/2031 | 370 | 290 | ||||||
Barrick North America Finance | ||||||||
5.750%, 05/01/2043 | 290 | 279 | ||||||
5.700%, 05/30/2041 | 509 | 487 | ||||||
Berry Global | ||||||||
1.650%, 01/15/2027 | 2,985 | 2,566 | ||||||
BHP Billiton Finance USA | ||||||||
5.000%, 09/30/2043 | 410 | 370 | ||||||
4.875%, 02/27/2026 | 1,503 | 1,482 | ||||||
4.125%, 02/24/2042 | 40 | 32 | ||||||
Celanese US Holdings | ||||||||
6.550%, 11/15/2030 | 1,510 | 1,477 | ||||||
6.050%, 03/15/2025 | 345 | 344 | ||||||
Dow Chemical | ||||||||
5.250%, 11/15/2041 | 25 | 22 | ||||||
4.800%, 05/15/2049 | 360 | 289 | ||||||
DuPont de Nemours | ||||||||
4.493%, 11/15/2025 | 830 | 810 | ||||||
First Quantum Minerals | ||||||||
8.625%, 06/01/2031 (D) | 200 | 199 | ||||||
6.875%, 10/15/2027 (D) | 220 | 211 | ||||||
Freeport-McMoRan | ||||||||
5.450%, 03/15/2043 | 785 | 670 | ||||||
4.625%, 08/01/2030 | 180 | 162 | ||||||
4.550%, 11/14/2024 | 40 | 39 | ||||||
Glencore Finance Canada | ||||||||
6.900%, 11/15/2037 (D) | 311 | 313 | ||||||
6.000%, 11/15/2041 (D) | 109 | 100 | ||||||
5.550%, 10/25/2042 (D) | 135 | 117 | ||||||
Glencore Funding | ||||||||
6.500%, 10/06/2033 (D) | 880 | 878 | ||||||
4.125%, 03/12/2024 (D) | 1,340 | 1,329 | ||||||
4.000%, 03/27/2027 (D) | 1,200 | 1,126 | ||||||
3.875%, 10/27/2027 (D) | 220 | 204 | ||||||
International Flavors & Fragrances | ||||||||
5.000%, 09/26/2048 | 1,535 | 1,144 | ||||||
200
SEI Institutional Managed Trust
Description | Face Amount | Market Value | ||||||
CORPORATE OBLIGATIONS (continued) | ||||||||
4.375%, 06/01/2047 | $ | 230 | $ | 154 | ||||
3.468%, 12/01/2050 (D) | 55 | 32 | ||||||
3.268%, 11/15/2040 (D) | 135 | 85 | ||||||
2.300%, 11/01/2030 (D) | 1,570 | 1,181 | ||||||
MEGlobal BV MTN | ||||||||
4.250%, 11/03/2026 (D) | 480 | 456 | ||||||
OCP | ||||||||
5.125%, 06/23/2051 (D) | 360 | 238 | ||||||
4.500%, 10/22/2025 (D) | 400 | 384 | ||||||
3.750%, 06/23/2031 (D)(E) | 410 | 323 | ||||||
Orbia Advance | ||||||||
2.875%, 05/11/2031 (D) | 780 | 607 | ||||||
1.875%, 05/11/2026 (D) | 820 | 730 | ||||||
Southern Copper | ||||||||
5.250%, 11/08/2042 (E) | 2,220 | 1,919 | ||||||
Suzano Austria GmbH | ||||||||
3.750%, 01/15/2031 | 1,400 | 1,151 | ||||||
3.125%, 01/15/2032 | 70 | 54 | ||||||
Teck Resources | ||||||||
6.250%, 07/15/2041 | 5 | 4 | ||||||
6.000%, 08/15/2040 | 30 | 27 | ||||||
Vale Overseas | ||||||||
6.875%, 11/21/2036 | 874 | 879 | ||||||
6.250%, 08/10/2026 | 32 | 33 | ||||||
| 28,205 | ||||||||
Real Estate — 1.0% | ||||||||
Agree | ||||||||
2.600%, 06/15/2033 | 128 | 93 | ||||||
2.000%, 06/15/2028 | 564 | 467 | ||||||
American Assets Trust | ||||||||
3.375%, 02/01/2031 | 1,370 | 1,025 | ||||||
American Homes 4 Rent | ||||||||
4.300%, 04/15/2052 | 756 | 547 | ||||||
3.625%, 04/15/2032 | 2,057 | 1,702 | ||||||
American Tower | ||||||||
5.900%, 11/15/2033 | 880 | 859 | ||||||
5.800%, 11/15/2028 | 733 | 727 | ||||||
5.650%, 03/15/2033 | 590 | 567 | ||||||
5.550%, 07/15/2033 | 1,280 | 1,220 | ||||||
5.500%, 03/15/2028 | 600 | 589 | ||||||
2.950%, 01/15/2051 | 150 | 85 | ||||||
2.700%, 04/15/2031 | 1,650 | 1,308 | ||||||
1.875%, 10/15/2030 | 1,430 | 1,082 | ||||||
AvalonBay Communities MTN | ||||||||
2.450%, 01/15/2031 | 1,155 | 932 | ||||||
Boston Properties | ||||||||
3.400%, 06/21/2029 | 720 | 603 | ||||||
Brandywine Operating Partnership | ||||||||
3.950%, 11/15/2027 | 17 | 14 | ||||||
Brixmor Operating Partnership | ||||||||
2.500%, 08/16/2031 | 496 | 375 | ||||||
Description | Face Amount | Market Value | ||||||
CORPORATE OBLIGATIONS (continued) | ||||||||
Camden Property Trust | ||||||||
2.800%, 05/15/2030 | $ | 265 | $ | 224 | ||||
Crown Castle | ||||||||
5.000%, 01/11/2028 | 1,004 | 970 | ||||||
4.800%, 09/01/2028 | 296 | 281 | ||||||
3.800%, 02/15/2028 | 297 | 272 | ||||||
3.650%, 09/01/2027 | 410 | 376 | ||||||
2.900%, 04/01/2041 | 299 | 192 | ||||||
1.050%, 07/15/2026 | 809 | 710 | ||||||
Equinix | ||||||||
3.900%, 04/15/2032 | 1,715 | 1,465 | ||||||
Essential Properties | ||||||||
2.950%, 07/15/2031 | 805 | 587 | ||||||
Essex Portfolio | ||||||||
2.550%, 06/15/2031 | 268 | 208 | ||||||
Extra Space Storage | ||||||||
3.900%, 04/01/2029 | 226 | 203 | ||||||
3.875%, 12/15/2027 | 5 | 4 | ||||||
2.550%, 06/01/2031 | 735 | 572 | ||||||
2.400%, 10/15/2031 | 525 | 402 | ||||||
2.350%, 03/15/2032 | 340 | 257 | ||||||
2.200%, 10/15/2030 | 371 | 288 | ||||||
GLP Capital | ||||||||
5.375%, 04/15/2026 | 1,690 | 1,639 | ||||||
5.250%, 06/01/2025 | 80 | 78 | ||||||
4.000%, 01/15/2030 | 223 | 189 | ||||||
4.000%, 01/15/2031 | 50 | 42 | ||||||
3.250%, 01/15/2032 | 1,211 | 940 | ||||||
Healthcare Realty Holdings | ||||||||
3.625%, 01/15/2028 | 115 | 102 | ||||||
3.100%, 02/15/2030 | 1,645 | 1,370 | ||||||
2.050%, 03/15/2031 | 273 | 197 | ||||||
Hudson Pacific Properties | ||||||||
4.650%, 04/01/2029 | 580 | 437 | ||||||
3.950%, 11/01/2027 | 1,401 | 1,106 | ||||||
Invitation Homes Operating Partnership | ||||||||
4.150%, 04/15/2032 | 516 | 444 | ||||||
Mid-America Apartments | ||||||||
4.300%, 10/15/2023 | 265 | 265 | ||||||
NNN REIT | ||||||||
5.600%, 10/15/2033 | 441 | 416 | ||||||
Physicians Realty | ||||||||
3.950%, 01/15/2028 | 30 | 27 | ||||||
Realty Income | ||||||||
5.625%, 10/13/2032 | 525 | 507 | ||||||
4.900%, 07/15/2033 | 501 | 458 | ||||||
2.850%, 12/15/2032 | 376 | 294 | ||||||
2.200%, 06/15/2028 | 277 | 237 | ||||||
Regency Centers | ||||||||
2.950%, 09/15/2029 | 711 | 605 | ||||||
Rexford Industrial Realty | ||||||||
2.150%, 09/01/2031 | 512 | 382 | ||||||
SEI Institutional Managed Trust
201
SCHEDULE OF INVESTMENTS
September 30, 2023
Core Fixed Income Fund (Continued)
Description | Face Amount | Market Value | ||||||
CORPORATE OBLIGATIONS (continued) | ||||||||
Sabra Health Care | ||||||||
3.900%, 10/15/2029 | $ | 715 | $ | 594 | ||||
Simon Property Group | ||||||||
2.450%, 09/13/2029 | 1,020 | 848 | ||||||
STORE Capital | ||||||||
4.625%, 03/15/2029 | 331 | 283 | ||||||
4.500%, 03/15/2028 | 298 | 262 | ||||||
2.750%, 11/18/2030 | 459 | 329 | ||||||
2.700%, 12/01/2031 | 180 | 123 | ||||||
Sun Communities Operating | ||||||||
4.200%, 04/15/2032 | 519 | 443 | ||||||
VICI Properties | ||||||||
5.750%, 02/01/2027 (D) | 185 | 179 | ||||||
5.625%, 05/15/2052 | 552 | 457 | ||||||
5.125%, 05/15/2032 | 1,300 | 1,164 | ||||||
4.950%, 02/15/2030 | 25 | 23 | ||||||
4.625%, 06/15/2025 (D) | 100 | 97 | ||||||
4.500%, 09/01/2026 (D) | 375 | 352 | ||||||
4.500%, 01/15/2028 (D) | 238 | 217 | ||||||
4.125%, 08/15/2030 (D) | 184 | 157 | ||||||
3.875%, 02/15/2029 (D) | 630 | 544 | ||||||
3.750%, 02/15/2027 (D) | 30 | 27 | ||||||
Welltower | ||||||||
4.500%, 01/15/2024 | 102 | 101 | ||||||
| 35,141 | ||||||||
Utilities — 2.0% | ||||||||
AEP Texas | ||||||||
6.650%, 02/15/2033 | 500 | 512 | ||||||
Alabama Power | ||||||||
3.700%, 12/01/2047 | 965 | 677 | ||||||
American Electric Power | ||||||||
5.699%, 08/15/2025 | 875 | 870 | ||||||
American Transmission Systems | ||||||||
2.650%, 01/15/2032 (D) | 1,406 | 1,111 | ||||||
Arizona Public Service | ||||||||
5.550%, 08/01/2033 | 1,120 | 1,086 | ||||||
Baltimore Gas and Electric | ||||||||
5.400%, 06/01/2053 | 449 | 412 | ||||||
2.250%, 06/15/2031 | 402 | 320 | ||||||
Berkshire Hathaway Energy | ||||||||
2.850%, 05/15/2051 | 1,060 | 611 | ||||||
Boston Gas | ||||||||
4.487%, 02/15/2042 (D) | 35 | 27 | ||||||
CenterPoint Energy Houston Electric | ||||||||
5.200%, 10/01/2028 | 440 | 437 | ||||||
3.600%, 03/01/2052 | 296 | 207 | ||||||
Chile Electricity Lux MPC Sarl | ||||||||
6.010%, 01/20/2033 (D) | 885 | 881 | ||||||
Cleco Power | ||||||||
6.000%, 12/01/2040 | 700 | 630 | ||||||
Description | Face Amount | Market Value | ||||||
CORPORATE OBLIGATIONS (continued) | ||||||||
Comision Federal de Electricidad | ||||||||
3.875%, 07/26/2033 (D) | $ | 270 | $ | 204 | ||||
Commonwealth Edison | ||||||||
5.300%, 02/01/2053 | 120 | 110 | ||||||
Consolidated Edison of New York | ||||||||
5.200%, 03/01/2033 | 841 | 812 | ||||||
4.450%, 03/15/2044 | 1,120 | 896 | ||||||
3.950%, 04/01/2050 | 130 | 96 | ||||||
3.350%, 04/01/2030 | 180 | 158 | ||||||
Constellation Energy Generation | ||||||||
5.600%, 03/01/2028 | 935 | 929 | ||||||
Consumers Energy | ||||||||
2.500%, 05/01/2060 | 250 | 131 | ||||||
Dominion Energy | ||||||||
3.071%, 08/15/2024 (C) | 980 | 954 | ||||||
DTE Electric | ||||||||
3.650%, 03/01/2052 | 214 | 150 | ||||||
2.950%, 03/01/2050 | 469 | 291 | ||||||
DTE Energy | ||||||||
2.529%, 10/01/2024 (C) | 830 | 801 | ||||||
1.050%, 06/01/2025 | 1,055 | 973 | ||||||
Duke Energy | ||||||||
5.750%, 09/15/2033 | 235 | 231 | ||||||
3.500%, 06/15/2051 | 83 | 54 | ||||||
3.150%, 08/15/2027 | 280 | 255 | ||||||
2.550%, 06/15/2031 | 293 | 232 | ||||||
0.900%, 09/15/2025 | 705 | 641 | ||||||
Duke Energy Carolinas | ||||||||
5.350%, 01/15/2053 | 603 | 551 | ||||||
4.950%, 01/15/2033 | 1,498 | 1,423 | ||||||
4.250%, 12/15/2041 | 628 | 503 | ||||||
4.000%, 09/30/2042 | 1,000 | 767 | ||||||
3.550%, 03/15/2052 | 364 | 249 | ||||||
2.850%, 03/15/2032 | 499 | 407 | ||||||
2.550%, 04/15/2031 | 274 | 224 | ||||||
Duke Energy Florida | ||||||||
3.200%, 01/15/2027 | 1,080 | 1,012 | ||||||
2.400%, 12/15/2031 | 401 | 317 | ||||||
Duke Energy Indiana | ||||||||
4.200%, 03/15/2042 | 30 | 24 | ||||||
2.750%, 04/01/2050 | 280 | 160 | ||||||
Duke Energy Ohio | ||||||||
5.250%, 04/01/2033 | 845 | 816 | ||||||
Duke Energy Progress | ||||||||
5.250%, 03/15/2033 | 299 | 290 | ||||||
4.100%, 05/15/2042 | 425 | 329 | ||||||
2.500%, 08/15/2050 | 406 | 222 | ||||||
Entergy Arkansas | ||||||||
5.150%, 01/15/2033 | 603 | 579 | ||||||
2.650%, 06/15/2051 | 362 | 201 | ||||||
Evergy Metro | ||||||||
5.300%, 10/01/2041 | 100 | 90 | ||||||
202
SEI Institutional Managed Trust
Description | Face Amount | Market Value | ||||||
CORPORATE OBLIGATIONS (continued) | ||||||||
Eversource Energy | ||||||||
5.125%, 05/15/2033 | $ | 850 | $ | 791 | ||||
2.900%, 10/01/2024 | 1,610 | 1,560 | ||||||
1.650%, 08/15/2030 | 457 | 350 | ||||||
Exelon | ||||||||
5.625%, 06/15/2035 | 760 | 730 | ||||||
5.600%, 03/15/2053 | 197 | 179 | ||||||
FirstEnergy | ||||||||
4.150%, 07/15/2027 | 940 | 874 | ||||||
1.600%, 01/15/2026 | 180 | 162 | ||||||
FirstEnergy Transmission | ||||||||
5.450%, 07/15/2044 (D) | 35 | 31 | ||||||
Florida Power & Light | ||||||||
4.400%, 05/15/2028 | 1,560 | 1,504 | ||||||
Indiana Michigan Power | ||||||||
4.550%, 03/15/2046 | 325 | 264 | ||||||
Interstate Power and Light | ||||||||
5.700%, 10/15/2033 | 1,255 | 1,234 | ||||||
Jersey Central Power & Light | ||||||||
4.700%, 04/01/2024 (D) | 700 | 694 | ||||||
2.750%, 03/01/2032 (D) | 1,517 | 1,188 | ||||||
KeySpan Gas East | ||||||||
5.994%, 03/06/2033 (D) | 55 | 53 | ||||||
3.586%, 01/18/2052 (D) | 2,295 | 1,412 | ||||||
2.742%, 08/15/2026 (D) | 1,025 | 933 | ||||||
Louisville Gas and Electric | ||||||||
5.450%, 04/15/2033 | 1,135 | 1,112 | ||||||
Metropolitan Edison | ||||||||
5.200%, 04/01/2028 (D) | 452 | 441 | ||||||
4.300%, 01/15/2029 (D) | 473 | 439 | ||||||
MidAmerican Energy | ||||||||
5.850%, 09/15/2054 | 117 | 115 | ||||||
5.350%, 01/15/2034 | 351 | 346 | ||||||
4.800%, 09/15/2043 | 830 | 708 | ||||||
2.700%, 08/01/2052 | 347 | 197 | ||||||
Mid-Atlantic Interstate Transmission | ||||||||
4.100%, 05/15/2028 (D) | 162 | 151 | ||||||
Mississippi Power | ||||||||
4.250%, 03/15/2042 | 200 | 154 | ||||||
3.100%, 07/30/2051 | 482 | 286 | ||||||
National Rural Utilities Cooperative Finance MTN | ||||||||
1.875%, 02/07/2025 | 275 | 261 | ||||||
NextEra Energy Capital Holdings | ||||||||
6.051%, 03/01/2025 | 1,095 | 1,097 | ||||||
NiSource | ||||||||
5.800%, 02/01/2042 | 149 | 135 | ||||||
NSTAR Electric | ||||||||
3.100%, 06/01/2051 | 247 | 154 | ||||||
Pacific Gas and Electric | ||||||||
6.100%, 01/15/2029 | 1,669 | 1,630 | ||||||
5.250%, 03/01/2052 | 125 | 96 | ||||||
Description | Face Amount | Market Value | ||||||
CORPORATE OBLIGATIONS (continued) | ||||||||
4.950%, 07/01/2050 | $ | 1,285 | $ | 958 | ||||
4.750%, 02/15/2044 | 135 | 100 | ||||||
4.500%, 07/01/2040 | 138 | 103 | ||||||
4.200%, 06/01/2041 | 232 | 163 | ||||||
3.950%, 12/01/2047 | 945 | 605 | ||||||
3.500%, 08/01/2050 | 130 | 77 | ||||||
3.300%, 08/01/2040 | 60 | 38 | ||||||
2.500%, 02/01/2031 | 1,595 | 1,214 | ||||||
2.100%, 08/01/2027 | 1,509 | 1,290 | ||||||
1.700%, 11/15/2023 | 1,560 | 1,551 | ||||||
PacifiCorp | ||||||||
5.500%, 05/15/2054 | 481 | 408 | ||||||
2.900%, 06/15/2052 | 1,330 | 732 | ||||||
PECO Energy | ||||||||
4.150%, 10/01/2044 | 900 | 701 | ||||||
2.850%, 09/15/2051 | 485 | 287 | ||||||
Pennsylvania Electric | ||||||||
5.150%, 03/30/2026 (D) | 302 | 296 | ||||||
3.250%, 03/15/2028 (D) | 392 | 352 | ||||||
Perusahaan Perseroan Persero Perusahaan Listrik Negara MTN | ||||||||
6.150%, 05/21/2048 (D) | 500 | 443 | ||||||
Piedmont Natural Gas | ||||||||
5.050%, 05/15/2052 | 1,100 | 910 | ||||||
Public Service Electric and Gas | ||||||||
5.450%, 08/01/2053 | 46 | 44 | ||||||
5.200%, 08/01/2033 | 740 | 723 | ||||||
Public Service Electric and Gas MTN | ||||||||
5.125%, 03/15/2053 | 545 | 497 | ||||||
2.700%, 05/01/2050 | 188 | 111 | ||||||
2.050%, 08/01/2050 | 111 | 57 | ||||||
1.900%, 08/15/2031 | 686 | 532 | ||||||
Public Service of Colorado | ||||||||
5.250%, 04/01/2053 | 1,090 | 949 | ||||||
Public Service of Oklahoma | ||||||||
3.150%, 08/15/2051 | 271 | 163 | ||||||
Southern California Edison | ||||||||
4.125%, 03/01/2048 | 729 | 540 | ||||||
4.050%, 03/15/2042 | 5 | 4 | ||||||
3.700%, 08/01/2025 | 99 | 95 | ||||||
Southern California Gas | ||||||||
2.550%, 02/01/2030 | 900 | 745 | ||||||
Southern Gas Capital | ||||||||
5.875%, 03/15/2041 | 700 | 656 | ||||||
4.400%, 05/30/2047 | 500 | 378 | ||||||
Southwestern Electric Power | ||||||||
1.650%, 03/15/2026 | 1,575 | 1,427 | ||||||
Southwestern Public Service | ||||||||
3.750%, 06/15/2049 | 845 | 578 | ||||||
Texas Electric Market Stabilization Funding N | ||||||||
4.265%, 08/01/2034 (D) | 2,587 | 2,421 | ||||||
SEI Institutional Managed Trust
203
SCHEDULE OF INVESTMENTS
September 30, 2023
Core Fixed Income Fund (Continued)
Description | Face Amount | Market Value | ||||||
CORPORATE OBLIGATIONS (continued) | ||||||||
Virginia Electric & Power | ||||||||
4.650%, 08/15/2043 | $ | 585 | $ | 481 | ||||
Virginia Electric and Power | ||||||||
5.450%, 04/01/2053 | 135 | 123 | ||||||
5.000%, 04/01/2033 | 1,041 | 976 | ||||||
2.950%, 11/15/2051 | 402 | 239 | ||||||
Vistra Operations | ||||||||
4.300%, 07/15/2029 (D) | 1,590 | 1,390 | ||||||
WEC Energy Group | ||||||||
0.800%, 03/15/2024 | 595 | 581 | ||||||
Wisconsin Electric Power | ||||||||
1.700%, 06/15/2028 | 255 | 217 | ||||||
| 67,299 | ||||||||
Total Corporate Obligations | ||||||||
(Cost $1,144,070) ($ Thousands) | 1,020,189 | |||||||
U.S. TREASURY OBLIGATIONS — 22.3% | ||||||||
U.S. Treasury Bills | ||||||||
5.441%, 01/30/2024 (G) | 11,200 | 11,002 | ||||||
5.414%, 02/15/2024 (G) | 1,930 | 1,892 | ||||||
5.377%, 12/14/2023 (G) | 8,625 | 8,532 | ||||||
5.367%, 11/28/2023 (G) | 20,125 | 19,955 | ||||||
5.304%, 11/07/2023 (G) | 8,580 | 8,535 | ||||||
U.S. Treasury Bonds | ||||||||
5.250%, 11/15/2028 | 384 | 394 | ||||||
4.375%, 08/15/2043 (E) | 76,162 | 71,057 | ||||||
4.125%, 08/15/2053 | 47,394 | 43,025 | ||||||
3.875%, 02/15/2043 | 92 | 80 | ||||||
3.875%, 05/15/2043 | 15,445 | 13,428 | ||||||
3.625%, 08/15/2043 | 240 | 200 | ||||||
3.625%, 02/15/2053 | 965 | 798 | ||||||
3.625%, 05/15/2053 | 15,199 | 12,584 | ||||||
3.375%, 11/15/2048 | 1,080 | 847 | ||||||
3.250%, 05/15/2042 | 1,785 | 1,422 | ||||||
3.125%, 08/15/2044 | 280 | 214 | ||||||
3.125%, 05/15/2048 | 5,285 | 3,958 | ||||||
3.000%, 02/15/2049 | 3,290 | 2,405 | ||||||
3.000%, 08/15/2052 | 12,169 | 8,867 | ||||||
2.875%, 08/15/2045 | 320 | 232 | ||||||
2.875%, 05/15/2049 | 740 | 528 | ||||||
2.875%, 05/15/2052 | 9,055 | 6,420 | ||||||
2.375%, 02/15/2042 | 8,773 | 6,064 | ||||||
2.375%, 05/15/2051 | 12,200 | 7,737 | ||||||
2.000%, 11/15/2041 | 39,918 | 25,905 | ||||||
2.000%, 02/15/2050 | 400 | 233 | ||||||
2.000%, 08/15/2051 | 10,293 | 5,939 | ||||||
1.875%, 02/15/2041 | 8,376 | 5,403 | ||||||
1.875%, 02/15/2051 | 4,200 | 2,354 | ||||||
1.875%, 11/15/2051 | 8,331 | 4,644 | ||||||
Description | Face Amount | Market Value | ||||||
U.S. TREASURY OBLIGATIONS (continued) | ||||||||
1.750%, 08/15/2041 (H) | $ | 28,950 | $ | 18,028 | ||||
1.625%, 11/15/2050 | 9,823 | 5,145 | ||||||
1.375%, 11/15/2040 | 22,737 | 13,457 | ||||||
1.375%, 08/15/2050 | 2,500 | 1,220 | ||||||
1.125%, 05/15/2040 | 869 | 499 | ||||||
1.125%, 08/15/2040 | 14,946 | 8,496 | ||||||
0.000%, 05/15/2049 (G) | 5,380 | 1,605 | ||||||
U.S. Treasury Inflation Protected Securities | ||||||||
1.375%, 07/15/2033 | 8,352 | 7,722 | ||||||
1.250%, 04/15/2028 | 7,306 | 6,946 | ||||||
1.125%, 01/15/2033 | 9,585 | 8,656 | ||||||
U.S. Treasury Notes | ||||||||
5.000%, 08/31/2025 | 19,872 | 19,832 | ||||||
5.000%, 09/30/2025 | 45,885 | 45,842 | ||||||
4.750%, 07/31/2025 | 5,230 | 5,195 | ||||||
4.625%, 09/15/2026 | 47,277 | 47,044 | ||||||
4.625%, 09/30/2028 | 105,256 | 105,322 | ||||||
4.500%, 11/30/2024 | 42 | 42 | ||||||
4.500%, 07/15/2026 | 7,909 | 7,836 | ||||||
4.375%, 10/31/2024 | 196 | 194 | ||||||
4.375%, 08/15/2026 | 4,350 | 4,296 | ||||||
4.375%, 08/31/2028 | 32,086 | 31,768 | ||||||
4.250%, 05/31/2025 | 4,780 | 4,709 | ||||||
4.250%, 10/15/2025 | 6,081 | 5,986 | ||||||
4.125%, 01/31/2025 (H) | 4,703 | 4,630 | ||||||
4.125%, 08/31/2030 | 5,537 | 5,374 | ||||||
4.000%, 02/15/2026 | 87 | 85 | ||||||
3.875%, 03/31/2025 | 3,545 | 3,474 | ||||||
3.875%, 04/30/2025 | 8,904 | 8,723 | ||||||
3.875%, 08/15/2033 | 23,607 | 22,305 | ||||||
3.750%, 04/15/2026 | 3,320 | 3,229 | ||||||
3.500%, 01/31/2028 | 9 | 9 | ||||||
3.250%, 06/30/2029 | 10,350 | 9,618 | ||||||
3.000%, 07/15/2025 | 1,715 | 1,653 | ||||||
2.875%, 08/15/2028 | 2,582 | 2,384 | ||||||
2.750%, 04/30/2027 | 3,020 | 2,824 | ||||||
2.750%, 07/31/2027 | 8,269 | 7,703 | ||||||
2.750%, 05/31/2029 | 1,407 | 1,275 | ||||||
2.625%, 07/31/2029 | 18,740 | 16,814 | ||||||
2.375%, 03/31/2029 | 8,851 | 7,880 | ||||||
2.000%, 11/15/2026 | 3,734 | 3,435 | ||||||
1.750%, 12/31/2026 | 1,541 | 1,402 | ||||||
1.500%, 08/15/2026 | 3,001 | 2,735 | ||||||
1.375%, 10/31/2028 | 7,051 | 6,016 | ||||||
1.250%, 09/30/2028 | 1,950 | 1,657 | ||||||
1.125%, 02/29/2028 | 2,252 | 1,938 | ||||||
1.125%, 08/31/2028 | 650 | 550 | ||||||
1.000%, 07/31/2028 | 2,941 | 2,481 | ||||||
0.750%, 05/31/2026 | 488 | 438 | ||||||
204
SEI Institutional Managed Trust
Description | Face Amount | Market Value | ||||||
U.S. TREASURY OBLIGATIONS (continued) | ||||||||
0.375%, 07/31/2027 | $ | 5,766 | $ | 4,898 | ||||
Total U.S. Treasury Obligations | ||||||||
(Cost $816,265) ($ Thousands) | 748,024 | |||||||
ASSET-BACKED SECURITIES — 8.8% | ||||||||
Automotive — 2.2% | ||||||||
Ally Auto Receivables Trust, Ser 2022-3, Cl A4 | ||||||||
5.070%, 06/15/2031 | 336 | 333 | ||||||
Americredit Automobile Receivables Trust, Ser 2022-1, Cl A2 | ||||||||
2.050%, 01/20/2026 | 62 | 62 | ||||||
AmeriCredit Automobile Receivables Trust, Ser 2022-2, Cl A3 | ||||||||
4.380%, 04/18/2028 | 1,140 | 1,120 | ||||||
Americredit Automobile Receivables Trust, Ser 2023-1, Cl A3 | ||||||||
5.620%, 11/18/2027 | 295 | 294 | ||||||
AmeriCredit Automobile Receivables Trust, Ser 2023-2, Cl A3 | ||||||||
5.810%, 05/18/2028 | 586 | 585 | ||||||
ARI Fleet Lease Trust, Ser 2022-A, Cl A2 | ||||||||
3.120%, 01/15/2031 (D) | 430 | 424 | ||||||
Avis Budget Rental Car Funding AESOP, Ser 2019-3A, Cl A | ||||||||
2.360%, 03/20/2026 (D) | 295 | 281 | ||||||
Avis Budget Rental Car Funding AESOP, Ser 2020-1A, Cl A | ||||||||
2.330%, 08/20/2026 (D) | 430 | 403 | ||||||
Avis Budget Rental Car Funding AESOP, Ser 2020-2A, Cl A | ||||||||
2.020%, 02/20/2027 (D) | 2,800 | 2,555 | ||||||
Avis Budget Rental Car Funding AESOP, Ser 2023-4A, Cl A | ||||||||
5.490%, 06/20/2029 (D) | 1,240 | 1,207 | ||||||
Avis Budget Rental Car Funding AESOP, Ser 2023-5A, Cl A | ||||||||
5.780%, 04/20/2028 (D) | 1,070 | 1,059 | ||||||
Avis Budget Rental Car Funding AESOP, Ser 2023-6A, Cl A | ||||||||
5.810%, 12/20/2029 (D) | 554 | 545 | ||||||
BMW Vehicle Lease Trust, Ser 2023-1, Cl A3 | ||||||||
5.160%, 11/25/2025 | 205 | 203 | ||||||
BMW Vehicle Lease Trust, Ser 2023-1, Cl A4 | ||||||||
5.070%, 06/25/2026 | 462 | 457 | ||||||
BMW Vehicle Owner Trust, Ser 2023-A, Cl A3 | ||||||||
5.470%, 02/25/2028 | 320 | 319 | ||||||
Description | Face Amount | Market Value | ||||||
ASSET-BACKED SECURITIES (continued) | ||||||||
Capital One Prime Auto Receivables Trust, Ser 2022-2, Cl A3 | ||||||||
3.660%, 05/17/2027 | $ | 1,095 | $ | 1,063 | ||||
Capital One Prime Auto Receivables Trust, Ser 2023-1, Cl A3 | ||||||||
4.870%, 02/15/2028 | 1,911 | 1,882 | ||||||
Carmax Auto Owner Trust, Ser 2023-3, Cl A3 | ||||||||
5.280%, 05/15/2028 | 440 | 437 | ||||||
Chase Auto Owner Trust, Ser 2022-AA, Cl A4 | ||||||||
3.990%, 03/27/2028 (D) | 439 | 422 | ||||||
Donlen Fleet Lease Funding 2, Ser 2021-2, Cl B | ||||||||
0.980%, 12/11/2034 (D) | 575 | 553 | ||||||
Donlen Fleet Lease Funding 2, Ser 2021-2, Cl C | ||||||||
1.200%, 12/11/2034 (D) | 1,010 | 966 | ||||||
Enterprise Fleet Financing, Ser 2023-1, Cl A3 | ||||||||
5.420%, 10/22/2029 (D) | 565 | 557 | ||||||
Enterprise Fleet Funding, Ser 2021-1, Cl A3 | ||||||||
0.700%, 12/21/2026 (D) | 425 | 405 | ||||||
Ford Credit Auto Owner Trust, Ser 2022-1, Cl A | ||||||||
3.880%, 11/15/2034 (D) | 1,195 | 1,123 | ||||||
Ford Credit Auto Owner Trust, Ser 2022-D, Cl A4 | ||||||||
5.300%, 03/15/2028 | 307 | 304 | ||||||
Ford Credit Auto Owner Trust, Ser 2023-1, Cl A | ||||||||
4.850%, 08/15/2035 (D) | 778 | 754 | ||||||
Ford Credit Auto Owner Trust, Ser 2023-2, Cl A | ||||||||
5.280%, 02/15/2036 (D) | 1,357 | 1,336 | ||||||
Ford Credit Auto Owner Trust, Ser 2023-2, Cl B | ||||||||
5.920%, 02/15/2036 (D) | 1,230 | 1,214 | ||||||
Ford Credit Auto Owner Trust, Ser 2023-2, Cl C | ||||||||
6.160%, 02/15/2036 (D) | 1,280 | 1,261 | ||||||
Ford Credit Auto Owner Trust, Ser 2023-A, Cl A3 | ||||||||
4.650%, 02/15/2028 | 1,286 | 1,262 | ||||||
Ford Credit Floorplan Master Owner Trust A, Ser 2023-1, Cl A1 | ||||||||
4.920%, 05/15/2028 (D) | 1,174 | 1,152 | ||||||
Foursight Capital Automobile Receivables Trust, Ser 2022-1, Cl A2 | ||||||||
1.150%, 09/15/2025 (D) | 31 | 31 | ||||||
GM Financial Automobile Leasing Trust, Ser 2022-3, Cl A3 | ||||||||
4.010%, 09/22/2025 | 840 | 830 | ||||||
SEI Institutional Managed Trust
205
SCHEDULE OF INVESTMENTS
September 30, 2023
Core Fixed Income Fund (Continued)
Description | Face Amount | Market Value | ||||||
ASSET-BACKED SECURITIES (continued) | ||||||||
GM Financial Automobile Leasing Trust, Ser 2023-2, Cl A4 | ||||||||
5.090%, 05/20/2027 | $ | 417 | $ | 411 | ||||
GM Financial Automobile Leasing Trust, Ser 2023-3, Cl A3 | ||||||||
5.380%, 11/20/2026 | 776 | 773 | ||||||
GM Financial Automobile Leasing Trust, Ser 2023-3, Cl A4 | ||||||||
5.440%, 08/20/2027 | 264 | 263 | ||||||
GM Financial Consumer Automobile Receivables Trust, Ser 2022-4, Cl A3 | ||||||||
4.820%, 08/16/2027 | 513 | 506 | ||||||
GM Financial Revolving Receivables Trust, Ser 2022-1, Cl A | ||||||||
5.910%, 10/11/2035 (D) | 807 | 813 | ||||||
GM Financial Revolving Receivables Trust, Ser 2023-1, Cl A | ||||||||
5.120%, 04/11/2035 (D) | 202 | 198 | ||||||
GMF Floorplan Owner Revolving Trust, Ser 2023-1, Cl A1 | ||||||||
5.340%, 06/15/2028 (D) | 779 | 772 | ||||||
Hertz Vehicle Financing III, Ser 2022-1A, Cl A | ||||||||
1.990%, 06/25/2026 (D) | 700 | 656 | ||||||
Hertz Vehicle Financing III, Ser 2022-3A, Cl A | ||||||||
3.370%, 03/25/2025 (D) | 460 | 457 | ||||||
Hertz Vehicle Financing III, Ser 2023-2A, Cl A | ||||||||
5.570%, 09/25/2029 (D) | 1,526 | 1,486 | ||||||
Hertz Vehicle Financing III, Ser 2023-4A, Cl A | ||||||||
6.150%, 03/25/2030 (D) | 877 | 874 | ||||||
Hertz Vehicle Financing, Ser 2022-4A, Cl A | ||||||||
3.730%, 09/25/2026 (D) | 363 | 348 | ||||||
Honda Auto Receivables Owner Trust, Ser 2022-2, Cl A3 | ||||||||
3.730%, 07/20/2026 | 575 | 560 | ||||||
Honda Auto Receivables Owner Trust, Ser 2023-1, Cl A3 | ||||||||
5.040%, 04/21/2027 | 1,346 | 1,332 | ||||||
Hyundai Auto Lease Securitization Trust, Ser 2022-C, Cl A3 | ||||||||
4.380%, 10/15/2025 (D) | 725 | 716 | ||||||
Hyundai Auto Lease Securitization Trust, Ser 2023-B, Cl A4 | ||||||||
5.170%, 04/15/2027 (D) | 663 | 652 | ||||||
Hyundai Auto Lease Securitization Trust, Ser 2023-C, Cl A3 | ||||||||
5.800%, 12/15/2026 (D) | 2,355 | 2,352 | ||||||
Hyundai Auto Lease Securitization Trust, Ser 2023-C, Cl A4 | ||||||||
5.840%, 09/15/2027 (D) | 437 | 437 | ||||||
Description | Face Amount | Market Value | ||||||
ASSET-BACKED SECURITIES (continued) | ||||||||
Hyundai Auto Receivables Trust, Ser 2021-C, Cl A4 | ||||||||
1.030%, 12/15/2027 | $ | 566 | $ | 521 | ||||
Hyundai Auto Receivables Trust, Ser 2022-A, Cl A3 | ||||||||
2.220%, 10/15/2026 | 1,061 | 1,027 | ||||||
Hyundai Auto Receivables Trust, Ser 2022-A, Cl A4 | ||||||||
2.350%, 04/17/2028 | 361 | 338 | ||||||
Hyundai Auto Receivables Trust, Ser 2023-A, Cl A4 | ||||||||
4.480%, 07/17/2028 | 604 | 589 | ||||||
Hyundai Auto Receivables Trust, Ser 2023-B, Cl A3 | ||||||||
5.480%, 04/17/2028 | 342 | 341 | ||||||
JPMorgan Chase Bank - CACLN, Ser 2020-2, Cl B | ||||||||
0.840%, 02/25/2028 (D) | 63 | 62 | ||||||
JPMorgan Chase Bank - CACLN, Ser 2021-2, Cl B | ||||||||
0.889%, 12/26/2028 (D) | 183 | 178 | ||||||
JPMorgan Chase Bank - CACLN, Ser 2021-3, Cl B | ||||||||
0.760%, 02/26/2029 (D) | 603 | 576 | ||||||
Mercedes-Benz Auto Lease Trust, Ser 2023-A, Cl A3 | ||||||||
4.740%, 01/15/2027 | 892 | 878 | ||||||
Mercedes-Benz Auto Receivables Trust, Ser 2022-1, Cl A4 | ||||||||
5.250%, 02/15/2029 | 711 | 707 | ||||||
Mercedes-Benz Auto Receivables Trust, Ser 2023-1, Cl A4 | ||||||||
4.310%, 04/16/2029 | 544 | 526 | ||||||
Nissan Auto Lease Trust, Ser 2023-B, Cl A3 | ||||||||
5.690%, 07/15/2026 | 2,217 | 2,213 | ||||||
Nissan Auto Lease Trust, Ser 2023-B, Cl A4 | ||||||||
5.610%, 11/15/2027 | 586 | 585 | ||||||
Nissan Auto Receivables Owner Trust, Ser 2022-B, Cl A4 | ||||||||
4.450%, 11/15/2029 | 434 | 423 | ||||||
Nissan Auto Receivables Owner Trust, Ser 2023-A, Cl A4 | ||||||||
4.850%, 06/17/2030 | 313 | 308 | ||||||
OCCU Auto Receivables Trust, Ser 2023-1A, Cl A3 | ||||||||
6.230%, 06/15/2028 (D) | 645 | 645 | ||||||
PenFed Auto Receivables Owner Trust, Ser 2022-A, Cl A3 | ||||||||
3.960%, 04/15/2026 (D) | 648 | 639 | ||||||
PenFed Auto Receivables Owner Trust, Ser 2022-A, Cl A4 | ||||||||
4.180%, 12/15/2028 (D) | 318 | 310 | ||||||
206
SEI Institutional Managed Trust
Description | Face Amount | Market Value | ||||||
ASSET-BACKED SECURITIES (continued) | ||||||||
Santander Drive Auto Receivables Trust, Ser 2021-2, Cl C | ||||||||
0.900%, 06/15/2026 | $ | 300 | $ | 297 | ||||
Santander Drive Auto Receivables Trust, Ser 2022-2, Cl A3 | ||||||||
2.980%, 10/15/2026 | 954 | 946 | ||||||
Santander Drive Auto Receivables Trust, Ser 2022-3, Cl A3 | ||||||||
3.400%, 12/15/2026 | 1,012 | 1,002 | ||||||
Santander Drive Auto Receivables Trust, Ser 2022-4, Cl A3 | ||||||||
4.140%, 02/16/2027 | 882 | 874 | ||||||
Santander Drive Auto Receivables Trust, Ser 2022-5, Cl A3 | ||||||||
4.110%, 08/17/2026 | 680 | 675 | ||||||
Santander Drive Auto Receivables Trust, Ser 2022-6, Cl A3 | ||||||||
4.490%, 11/16/2026 | 2,530 | 2,511 | ||||||
Santander Drive Auto Receivables Trust, Ser 2022-7, Cl A3 | ||||||||
5.750%, 04/15/2027 | 363 | 362 | ||||||
Santander Retail Auto Lease Trust, Ser 2022-B, Cl A3 | ||||||||
3.280%, 11/20/2025 (D) | 1,115 | 1,092 | ||||||
SFS Auto Receivables Securitization Trust, Ser 2023-1A, Cl A3 | ||||||||
5.470%, 10/20/2028 (D) | 865 | 856 | ||||||
Toyota Auto Loan Extended Note Trust, Ser 2019-1A, Cl A | ||||||||
2.560%, 11/25/2031 (D) | 440 | 430 | ||||||
Toyota Auto Loan Extended Note Trust, Ser 2020-1A, Cl A | ||||||||
1.350%, 05/25/2033 (D) | 1,360 | 1,263 | ||||||
Toyota Auto Loan Extended Note Trust, Ser 2021-1A, Cl A | ||||||||
1.070%, 02/27/2034 (D) | 190 | 170 | ||||||
Toyota Auto Loan Extended Note Trust, Ser 2022-1A, Cl A | ||||||||
3.820%, 04/25/2035 (D) | 1,500 | 1,411 | ||||||
Toyota Auto Loan Extended Note Trust, Ser 2023-1A, Cl A | ||||||||
4.930%, 06/25/2036 (D) | 1,890 | 1,846 | ||||||
Toyota Auto Receivables Owner Trust, Ser 2022-D, Cl A4 | ||||||||
5.430%, 04/17/2028 | 389 | 389 | ||||||
Toyota Auto Receivables Owner Trust, Ser 2023-A, Cl A4 | ||||||||
4.420%, 08/15/2028 | 513 | 499 | ||||||
Toyota Auto Receivables Owner Trust, Ser 2023-B, Cl A3 | ||||||||
4.710%, 02/15/2028 | 2,129 | 2,087 | ||||||
Description | Face Amount | Market Value | ||||||
ASSET-BACKED SECURITIES (continued) | ||||||||
Toyota Auto Receivables Owner Trust, Ser 2023-C, Cl A3 | ||||||||
5.160%, 04/17/2028 | $ | 1,219 | $ | 1,209 | ||||
Toyota Lease Owner Trust, Ser 2023-A, Cl A3 | ||||||||
4.930%, 04/20/2026 (D) | 1,130 | 1,116 | ||||||
Veridian Auto Receivables Trust, Ser 2023-1A, Cl A3 | ||||||||
5.560%, 03/15/2028 (D) | 1,195 | 1,181 | ||||||
Volkswagen Auto Lease Trust, Ser 2022-A, Cl A3 | ||||||||
3.440%, 07/21/2025 | 430 | 424 | ||||||
Volkswagen Auto Loan Enhanced Trust, Ser 2023-1, Cl A3 | ||||||||
5.020%, 06/20/2028 | 1,387 | 1,372 | ||||||
World Omni Automobile Lease Securitization Trust, Ser 2023-A, Cl A3 | ||||||||
5.070%, 09/15/2026 | 440 | 435 | ||||||
World Omni Select Auto Trust, Ser 2023-A, Cl A2A | ||||||||
5.920%, 03/15/2027 | 728 | 726 | ||||||
| 73,044 | ||||||||
Credit Cards — 0.5% | ||||||||
American Express Credit Account Master Trust, Ser 2022-2, Cl A | ||||||||
3.390%, 05/15/2027 | 785 | 757 | ||||||
American Express Credit Account Master Trust, Ser 2023-1, Cl A | ||||||||
4.870%, 05/15/2028 | 745 | 736 | ||||||
BA Credit Card Trust, Ser 2023-A1, Cl A1 | ||||||||
4.790%, 05/15/2028 | 583 | 575 | ||||||
Capital One Multi-Asset Execution Trust, Ser 2022-A2, Cl A | ||||||||
3.490%, 05/15/2027 | 931 | 899 | ||||||
Capital One Multi-Asset Execution Trust, Ser 2023-A1, Cl A | ||||||||
4.420%, 05/15/2028 | 750 | 731 | ||||||
Citibank Credit Card Issuance Trust, Ser 2017-A6, Cl A6 | ||||||||
6.218%, TSFR1M + 0.884%, 05/14/2029 (B) | 2,340 | 2,350 | ||||||
Discover Card Execution Note Trust, Ser 2022-A3, Cl A3 | ||||||||
3.560%, 07/15/2027 | 1,377 | 1,329 | ||||||
Discover Card Execution Note Trust, Ser 2023-A1, Cl A | ||||||||
4.310%, 03/15/2028 | 1,511 | 1,471 | ||||||
Discover Card Execution Note Trust, Ser 2023-A2, Cl A | ||||||||
4.930%, 06/15/2028 | 2,639 | 2,607 | ||||||
Golden Credit Card Trust, Ser 2022-4A, Cl A | ||||||||
4.310%, 09/15/2027 (D) | 1,255 | 1,224 | ||||||
SEI Institutional Managed Trust
207
SCHEDULE OF INVESTMENTS
September 30, 2023
Core Fixed Income Fund (Continued)
Description | Face Amount | Market Value | ||||||
ASSET-BACKED SECURITIES (continued) | ||||||||
Mercury Financial Credit Card Master Trust, Ser 2022-1A, Cl B | ||||||||
3.200%, 09/21/2026 (D) | $ | 580 | $ | 556 | ||||
Synchrony Card Funding, Ser 2022-A2, Cl A | ||||||||
3.860%, 07/15/2028 | 474 | 459 | ||||||
Synchrony Card Funding, Ser 2023-A1, Cl A | ||||||||
5.540%, 07/15/2029 | 2,362 | 2,358 | ||||||
| 16,052 | ||||||||
Mortgage Related Securities — 0.1% | ||||||||
Aegis Asset-Backed Securities Mortgage Pass Through Certificates, Ser 2003-3, Cl M1 | ||||||||
6.484%, TSFR1M + 1.164%, 01/25/2034 (B) | 476 | 463 | ||||||
Bear Stearns Asset-Backed Securities I Trust, Ser 2004-HE10, Cl M1 | ||||||||
5.628%, TSFR1M + 1.089%, 12/25/2034 (B) | 215 | 212 | ||||||
Citigroup Mortgage Loan Trust, Ser 2006-HE2, Cl M1 | ||||||||
5.869%, TSFR1M + 0.549%, 08/25/2036 (B) | 628 | 625 | ||||||
Master Asset-Backed Securities Trust, Ser 2007-HE1, Cl A4 | ||||||||
5.714%, TSFR1M + 0.394%, 05/25/2037 (B) | 5,500 | 4,178 | ||||||
Morgan Stanley ABS Capital I Trust, Ser 2005-HE1, Cl M1 | ||||||||
6.109%, TSFR1M + 0.789%, 12/25/2034 (B) | 174 | 165 | ||||||
| 5,643 | ||||||||
Non-Agency Mortgage-Backed Obligations — 0.8% | ||||||||
Angel Oak Mortgage Trust, Ser 2023-1, Cl A1 | ||||||||
4.750%, 09/26/2067 (C)(D) | 1,755 | 1,671 | ||||||
BANK 2022, Ser BNK44, Cl A5 | ||||||||
5.937%, 11/15/2055 (B) | 430 | 425 | ||||||
BANK 2023, Ser BNK46, Cl A4 | ||||||||
5.745%, 08/15/2056 | 440 | 431 | ||||||
Bayview MSR Opportunity Master Fund Trust, Ser 2021-5, Cl A5 | ||||||||
2.500%, 11/25/2051 (B)(D) | 3,176 | 2,670 | ||||||
BBCMS Mortgage Trust, Ser C18, Cl A5 | ||||||||
5.710%, 12/15/2055 (B) | 675 | 665 | ||||||
Benchmark Mortgage Trust, Ser B38, Cl A4 | ||||||||
5.525%, 04/15/2056 | 450 | 437 | ||||||
Benchmark Mortgage Trust, Ser V3, Cl A3 | ||||||||
6.363%, 07/15/2056 (B) | 450 | 455 | ||||||
Description | Face Amount | Market Value | ||||||
ASSET-BACKED SECURITIES (continued) | ||||||||
BLP Commercial Mortgage Trust, Ser IND, Cl A | ||||||||
7.024%, TSFR1M + 1.692%, 03/15/2040 (B)(D) | $ | 450 | $ | 448 | ||||
BX Trust, Ser LBA, Cl AV | ||||||||
6.248%, TSFR1M + 0.914%, 02/15/2036 (B)(D) | 356 | 349 | ||||||
Citigroup Commercial Mortgage Trust, Ser C5, Cl AS | ||||||||
4.408%, 06/10/2051 (B) | 2,229 | 2,021 | ||||||
Connecticut Avenue Securities Trust, Ser 2019-R03, Cl 1B1 | ||||||||
9.529%, SOFR30A + 4.214%, 09/25/2031 (B)(D) | 800 | 836 | ||||||
Connecticut Avenue Securities Trust, Ser 2023-R06, Cl 1M2 | ||||||||
8.015%, SOFR30A + 2.700%, 07/25/2043 (B)(D) | 1,920 | 1,930 | ||||||
EFMT, Ser 2023-1, Cl A3 | ||||||||
6.544%, 02/25/2068 (C)(D) | 1,468 | 1,443 | ||||||
GS Mortgage Securities II, Ser SHIP, Cl A | ||||||||
4.466%, 09/10/2038 (B)(D) | 995 | 951 | ||||||
GS Mortgage Securities Trust, Ser GC32, Cl A3 | ||||||||
3.498%, 07/10/2048 | 325 | 310 | ||||||
LAQ Mortgage Trust, Ser LAQ, Cl A | ||||||||
7.424%, TSFR1M + 2.091%, 03/15/2036 (B)(D) | 355 | 354 | ||||||
Med Trust, Ser MDLN, Cl G | ||||||||
10.697%, TSFR1M + 5.364%, 11/15/2038 (B)(D) | 1,493 | 1,411 | ||||||
OBX Trust, Ser 2023-NQM3, Cl A1 | ||||||||
5.949%, 02/25/2063 (C)(D) | 1,557 | 1,539 | ||||||
Oceanview Mortgage Trust, Ser 2021-3, Cl A5 | ||||||||
2.500%, 07/25/2051 (B)(D) | 3,656 | 3,082 | ||||||
PRKCM Trust, Ser 2023-AFC1, Cl A1 | ||||||||
6.598%, 02/25/2058 (C)(D) | 1,626 | 1,617 | ||||||
SCOTT Trust, Ser SFS, Cl A | ||||||||
5.910%, 03/15/2040 (D) | 1,110 | 1,076 | ||||||
SG Commercial Mortgage Securities Trust, Ser C5, Cl A3 | ||||||||
2.779%, 10/10/2048 | 460 | 426 | ||||||
Wells Fargo Commercial Mortgage Trust, Ser C26, Cl AS | ||||||||
3.580%, 02/15/2048 | 1,840 | 1,744 | ||||||
| 26,291 | ||||||||
Other Asset-Backed Securities — 5.2% | ||||||||
Academic Loan Funding Trust, Ser 2012-1A, Cl A2 | ||||||||
6.529%, SOFR30A + 1.214%, 12/27/2044 (B)(D) | 885 | 873 | ||||||
208
SEI Institutional Managed Trust
Description | Face Amount | Market Value | ||||||
ASSET-BACKED SECURITIES (continued) | ||||||||
ACRES Commercial Realty, Ser 2021-FL1, Cl A | ||||||||
6.647%, TSFR1M + 1.314%, 06/15/2036 (B)(D) | $ | 1,629 | $ | 1,592 | ||||
AIG CLO, Ser 2021-1A, Cl A1R | ||||||||
6.708%, TSFR3M + 1.382%, 04/20/2032 (B)(D) | 3,400 | 3,393 | ||||||
Aligned Data Centers Issuer, Ser 2022-1A, Cl A2 | ||||||||
6.350%, 10/15/2047 (D) | 70 | 68 | ||||||
American Homes 4 Rent Trust, Ser 2015-SFR1, Cl A | ||||||||
3.467%, 04/17/2052 (D) | 1,845 | 1,776 | ||||||
AMMC CLO 15, Ser 2021-15A, Cl BR3 | ||||||||
7.220%, TSFR3M + 1.912%, 01/15/2032 (B)(D) | 1,100 | 1,088 | ||||||
AMMC CLO XIII, Ser 2021-13A, Cl A1R2 | ||||||||
6.657%, TSFR3M + 1.312%, 07/24/2029 (B)(D) | 1,043 | 1,042 | ||||||
Applebee's Funding, Ser 2023-1A, Cl A2 | ||||||||
7.824%, 03/05/2053 (D) | 1,790 | 1,765 | ||||||
Arbor Realty Commercial Real Estate Notes, Ser 2021-FL3, Cl A | ||||||||
6.517%, TSFR1M + 1.184%, 08/15/2034 (B)(D) | 3,213 | 3,165 | ||||||
Cedar Funding XII CLO, Ser 2021-12A, Cl BR | ||||||||
7.213%, TSFR3M + 1.862%, 10/25/2034 (B)(D) | 3,000 | 2,948 | ||||||
Chase Funding Mortgage Loan Asset-Backed Certificates, Ser 2003-6, Cl 1A5 | ||||||||
4.827%, 11/25/2034 (C) | 22 | 21 | ||||||
CIFC Funding, Ser 2021-7A, Cl A1 | ||||||||
6.737%, TSFR3M + 1.392%, 01/23/2035 (B)(D) | 3,500 | 3,480 | ||||||
CIT Education Loan Trust, Ser 2007-1, Cl A | ||||||||
5.595%, SOFR90A + 0.352%, 03/25/2042 (B)(D) | 651 | 627 | ||||||
Citicorp Residential Mortgage Trust, Ser 2007-1, Cl A5 | ||||||||
4.899%, 03/25/2037 (C) | 485 | 476 | ||||||
CNH Equipment Trust, Ser 2022-B, Cl A3 | ||||||||
3.890%, 08/16/2027 | 1,360 | 1,325 | ||||||
CNH Equipment Trust, Ser 2022-C, Cl A3 | ||||||||
5.150%, 04/17/2028 | 1,255 | 1,241 | ||||||
College Ave Student Loans, Ser 2021-C, Cl A2 | ||||||||
2.320%, 07/26/2055 (D) | 681 | 586 | ||||||
College Avenue Student Loans, Ser 2017-A, Cl A1 | ||||||||
7.084%, TSFR1M + 1.764%, 11/26/2046 (B)(D) | 285 | 286 | ||||||
Description | Face Amount | Market Value | ||||||
ASSET-BACKED SECURITIES (continued) | ||||||||
College Avenue Student Loans, Ser 2018-A, Cl A2 | ||||||||
4.130%, 12/26/2047 (D) | $ | 193 | $ | 182 | ||||
College Avenue Student Loans, Ser 2019-A, Cl A2 | ||||||||
3.280%, 12/28/2048 (D) | 372 | 341 | ||||||
College Avenue Student Loans, Ser 2021-B, Cl A2 | ||||||||
1.760%, 06/25/2052 (D) | 315 | 269 | ||||||
Countrywide Asset-Backed Certificates, Ser 2004-5, Cl 1A | ||||||||
5.934%, TSFR1M + 0.614%, 10/25/2034 (B) | 280 | 267 | ||||||
Countrywide Asset-Backed Certificates, Ser 2004-6, Cl 1A1 | ||||||||
5.974%, TSFR1M + 0.654%, 12/25/2034 (B) | 198 | 190 | ||||||
Countrywide Asset-Backed Certificates, Ser 2007-13, Cl 2A2 | ||||||||
6.234%, TSFR1M + 0.914%, 10/25/2047 (B) | 1,093 | 969 | ||||||
Countrywide Home Equity Loan Trust, Ser 2006-F, Cl 2A1A | ||||||||
5.587%, TSFR1M + 0.254%, 07/15/2036 (B) | 162 | 150 | ||||||
CSEMC, Ser 2020-1, Cl A | ||||||||
7.252%, 08/09/2024 | 1,236 | 1,201 | ||||||
CWABS Asset-backed Certificates Series, Ser 2007-12, Cl 2A4 | ||||||||
6.784%, TSFR1M + 1.464%, 08/25/2047 (B) | 5,400 | 4,861 | ||||||
Dell Equipment Finance Trust, Ser 2022-2, Cl A3 | ||||||||
4.140%, 07/22/2027 (D) | 775 | 760 | ||||||
Dividend Solar Loans, Ser 2019-1, Cl A | ||||||||
3.670%, 08/22/2039 (D) | 1,011 | 862 | ||||||
DLLAA, Ser 2023-1A, Cl A3 | ||||||||
5.640%, 02/22/2028 (D) | 300 | 299 | ||||||
DLLAD, Ser 2023-1A, Cl A3 | ||||||||
4.790%, 01/20/2028 (D) | 1,325 | 1,295 | ||||||
DLLST, Ser 2022-1A, Cl A3 | ||||||||
3.400%, 01/21/2025 (D) | 1,409 | 1,396 | ||||||
Dryden XXVI Senior Loan Fund, Ser 2018-26A, Cl AR | ||||||||
6.470%, TSFR3M + 1.162%, 04/15/2029 (B)(D) | 896 | 893 | ||||||
Educational Funding of the South, Ser 2011-1, Cl A2 | ||||||||
5.966%, SOFR90A + 0.912%, 04/25/2035 (B) | 80 | 79 | ||||||
Educational Funding, Ser 2006-1A, Cl A3 | ||||||||
5.963%, TSFR3M + 0.000%, 04/25/2033 (B)(D) | 1,384 | 894 | ||||||
SEI Institutional Managed Trust
209
SCHEDULE OF INVESTMENTS
September 30, 2023
Core Fixed Income Fund (Continued)
Description | Face Amount | Market Value | ||||||
ASSET-BACKED SECURITIES (continued) | ||||||||
EDvestinU Private Education Loan Issue No. 4, Ser 2022-A, Cl A | ||||||||
5.250%, 11/25/2040 (D) | $ | 607 | $ | 590 | ||||
First Franklin Mortgage Loan Trust, Ser 2004-FF5, Cl A3C | ||||||||
6.434%, TSFR1M + 1.114%, 08/25/2034 (B) | 214 | 198 | ||||||
FirstKey Homes Trust, Ser 2020-SFR2, Cl A | ||||||||
1.266%, 10/19/2037 (D) | 3,361 | 3,049 | ||||||
FNMA Grantor Trust, Ser 2017-T1, Cl A | ||||||||
2.898%, 06/25/2027 | 199 | 182 | ||||||
Ford Credit Floorplan Master Owner Trust A, Ser 2018-4, Cl A | ||||||||
4.060%, 11/15/2030 | 1,860 | 1,728 | ||||||
Fremont Home Loan Trust, Ser 2005-E, Cl 2A4 | ||||||||
6.094%, TSFR1M + 0.774%, 01/25/2036 (B) | 3,983 | 3,725 | ||||||
Global SC Finance II SRL, Ser 2014-1A, Cl A2 | ||||||||
3.090%, 07/17/2029 (D) | 141 | 138 | ||||||
GoldenTree Loan Opportunities IX, Ser 2018-9A, Cl AR2 | ||||||||
6.741%, TSFR3M + 1.372%, 10/29/2029 (B)(D) | 1,460 | 1,459 | ||||||
GoodLeap Sustainable Home Solutions Trust, Ser 2021-4GS, Cl A | ||||||||
1.930%, 07/20/2048 (D) | 825 | 605 | ||||||
GreatAmerica Leasing Receivables Funding Series, Ser 2022-1, Cl A3 | ||||||||
5.080%, 09/15/2026 (D) | 750 | 740 | ||||||
GSAMP Trust, Ser 2003-SEA, Cl A1 | ||||||||
5.834%, TSFR1M + 0.914%, 02/25/2033 (B) | 280 | 269 | ||||||
GSAMP Trust, Ser 2005-WMC3, Cl A2C | ||||||||
6.094%, TSFR1M + 0.774%, 12/25/2035 (B) | 4,894 | 4,732 | ||||||
GSAMP Trust, Ser 2006-HE3, Cl A2D | ||||||||
5.934%, TSFR1M + 0.614%, 05/25/2046 (B) | 4,254 | 3,908 | ||||||
Hildene Community Funding CDO, Ser 2021-1A, Cl ARR | ||||||||
2.600%, 11/01/2035 (D) | 1,162 | 1,008 | ||||||
Hilton Grand Vacations Trust, Ser 2020-AA, Cl A | ||||||||
2.740%, 02/25/2039 (D) | 424 | 397 | ||||||
Home Partners of America Trust, Ser 2019-2, Cl A | ||||||||
2.703%, 10/19/2039 (D) | 1,416 | 1,255 | ||||||
JGWPT XXX, Ser 2013-3A, Cl A | ||||||||
4.080%, 01/17/2073 (D) | 668 | 581 | ||||||
JGWPT XXXII, Ser 2014-2A, Cl A | ||||||||
3.610%, 01/17/2073 (D) | 877 | 727 | ||||||
Description | Face Amount | Market Value | ||||||
ASSET-BACKED SECURITIES (continued) | ||||||||
LMREC, Ser 2019-CRE3, Cl A | ||||||||
6.838%, TSFR1M + 1.514%, 12/22/2035 (B)(D) | $ | 1,117 | $ | 1,108 | ||||
Lunar Structured Aircraft Portfolio Notes, Ser 2021-1, Cl A | ||||||||
2.636%, 10/15/2046 (D) | 950 | 815 | ||||||
Madison Park Funding XXVII, Ser 2018-27A, Cl A2 | ||||||||
6.938%, TSFR3M + 1.612%, 04/20/2030 (B)(D) | 1,550 | 1,525 | ||||||
Magnetite VII, Ser 2018-7A, Cl A1R2 | ||||||||
6.370%, TSFR3M + 1.062%, 01/15/2028 (B)(D) | 638 | 636 | ||||||
MF1, Ser 2020-FL4, Cl A | ||||||||
7.147%, TSFR1M + 1.814%, 11/15/2035 (B)(D) | 509 | 507 | ||||||
MF1, Ser 2021-FL7, Cl A | ||||||||
6.525%, TSFR1M + 1.194%, 10/16/2036 (B)(D) | 875 | 860 | ||||||
MF1, Ser 2022-FL8, Cl A | ||||||||
6.677%, TSFR1M + 1.350%, 02/19/2037 (B)(D) | 2,380 | 2,347 | ||||||
MFA Trust, Ser 2021-NQM2, Cl A1 | ||||||||
1.029%, 11/25/2064 (B)(D) | 270 | 219 | ||||||
Mid-State Trust XI, Ser 2003-11, Cl A1 | ||||||||
4.864%, 07/15/2038 | 846 | 815 | ||||||
Morgan Stanley Resecuritization Trust, Ser 2015-R7, Cl 1BXA | ||||||||
7.060%, 02/26/2029 (B)(D) | 679 | 623 | ||||||
MVW, Ser 2021-1WA, Cl B | ||||||||
1.440%, 01/22/2041 (D) | 194 | 175 | ||||||
Navient Private Education Loan Trust, Ser 2014-AA, Cl A3 | ||||||||
7.047%, TSFR1M + 1.714%, 10/15/2031 (B)(D) | 295 | 295 | ||||||
Navient Private Education Loan Trust, Ser 2016-AA, Cl A2B | ||||||||
7.597%, TSFR1M + 2.264%, 12/15/2045 (B)(D) | 187 | 188 | ||||||
Navient Private Education Loan Trust, Ser 2018-BA, Cl A2A | ||||||||
3.610%, 12/15/2059 (D) | 194 | 188 | ||||||
Navient Private Education Refi Loan Trust, Ser 2018-CA, Cl A2 | ||||||||
3.520%, 06/16/2042 (D) | 18 | 17 | ||||||
Navient Private Education Refi Loan Trust, Ser 2018-DA, Cl A2A | ||||||||
4.000%, 12/15/2059 (D) | 1,183 | 1,131 | ||||||
Navient Private Education Refi Loan Trust, Ser 2019-A, Cl A2A | ||||||||
3.420%, 01/15/2043 (D) | 425 | 409 | ||||||
210
SEI Institutional Managed Trust
Description | Face Amount | Market Value | ||||||
ASSET-BACKED SECURITIES (continued) | ||||||||
Navient Private Education Refi Loan Trust, Ser 2019-CA, Cl A2 | ||||||||
3.130%, 02/15/2068 (D) | $ | 688 | $ | 652 | ||||
Navient Private Education Refi Loan Trust, Ser 2019-D, Cl A2A | ||||||||
3.010%, 12/15/2059 (D) | 962 | 885 | ||||||
Navient Private Education Refi Loan Trust, Ser 2019-FA, Cl A2 | ||||||||
2.600%, 08/15/2068 (D) | 1,471 | 1,349 | ||||||
Navient Private Education Refi Loan Trust, Ser 2020-BA, Cl A2 | ||||||||
2.120%, 01/15/2069 (D) | 343 | 311 | ||||||
Navient Private Education Refi Loan Trust, Ser 2020-DA, Cl A | ||||||||
1.690%, 05/15/2069 (D) | 130 | 116 | ||||||
Navient Private Education Refi Loan Trust, Ser 2020-GA, Cl A | ||||||||
1.170%, 09/16/2069 (D) | 542 | 480 | ||||||
Navient Private Education Refi Loan Trust, Ser 2021-A, Cl A | ||||||||
0.840%, 05/15/2069 (D) | 85 | 74 | ||||||
Navient Private Education Refi Loan Trust, Ser 2021-BA, Cl A | ||||||||
0.940%, 07/15/2069 (D) | 230 | 198 | ||||||
Navient Private Education Refi Loan Trust, Ser 2021-CA, Cl A | ||||||||
1.060%, 10/15/2069 (D) | 970 | 824 | ||||||
Navient Private Education Refi Loan Trust, Ser 2021-EA, Cl A | ||||||||
0.970%, 12/16/2069 (D) | 1,298 | 1,086 | ||||||
Navient Private Education Refi Loan Trust, Ser 2021-FA, Cl A | ||||||||
1.110%, 02/18/2070 (D) | 854 | 712 | ||||||
Navient Private Education Refi Loan Trust, Ser 2021-GA, Cl A | ||||||||
1.580%, 04/15/2070 (D) | 203 | 171 | ||||||
Navient Private Education Refi Loan Trust, Ser 2022-A, Cl A | ||||||||
2.230%, 07/15/2070 (D) | 616 | 532 | ||||||
Navient Student Loan Trust, Ser 2014-1, Cl A3 | ||||||||
5.939%, SOFR30A + 0.624%, 06/25/2031 (B) | 1,732 | 1,673 | ||||||
Navient Student Loan Trust, Ser 2016-2A, Cl A3 | ||||||||
6.929%, SOFR30A + 1.614%, 06/25/2065 (B)(D) | 1,013 | 1,017 | ||||||
Navient Student Loan Trust, Ser 2017-1A, Cl A3 | ||||||||
6.579%, SOFR30A + 1.264%, 07/26/2066 (B)(D) | �� | 751 | 749 | |||||
Description | Face Amount | Market Value | ||||||
ASSET-BACKED SECURITIES (continued) | ||||||||
Navient Student Loan Trust, Ser 2017-3A, Cl A3 | ||||||||
6.479%, SOFR30A + 1.164%, 07/26/2066 (B)(D) | $ | 2,607 | $ | 2,586 | ||||
Navient Student Loan Trust, Ser 2019-BA, Cl A2A | ||||||||
3.390%, 12/15/2059 (D) | 969 | 916 | ||||||
Navient Student Loan Trust, Ser 2021-1A, Cl A1A | ||||||||
1.310%, 12/26/2069 (D) | 375 | 312 | ||||||
Navient Student Loan Trust, Ser 2021-3A, Cl A1A | ||||||||
1.770%, 08/25/2070 (D) | 925 | 789 | ||||||
Nelnet Student Loan Trust, Ser 2004-3, Cl A5 | ||||||||
5.496%, SOFR90A + 0.442%, 10/27/2036 (B) | 301 | 295 | ||||||
Nelnet Student Loan Trust, Ser 2004-4, Cl A5 | ||||||||
5.476%, SOFR90A + 0.422%, 01/25/2037 (B) | 481 | 474 | ||||||
Nelnet Student Loan Trust, Ser 2005-1, Cl A5 | ||||||||
5.426%, SOFR90A + 0.372%, 10/25/2033 (B) | 1,770 | 1,733 | ||||||
Nelnet Student Loan Trust, Ser 2005-2, Cl A5 | ||||||||
5.603%, SOFR90A + 0.362%, 03/23/2037 (B) | 1,460 | 1,430 | ||||||
Nelnet Student Loan Trust, Ser 2005-3, Cl A5 | ||||||||
5.623%, SOFR90A + 0.382%, 12/24/2035 (B) | 1,449 | 1,422 | ||||||
Nelnet Student Loan Trust, Ser 2005-4, Cl A4 | ||||||||
5.683%, SOFR90A + 0.442%, 03/22/2032 (B) | 242 | 235 | ||||||
Nelnet Student Loan Trust, Ser 2014-2A, Cl A3 | ||||||||
6.279%, SOFR30A + 0.964%, 07/27/2037 (B)(D) | 950 | 937 | ||||||
Nelnet Student Loan Trust, Ser 2014-4A, Cl A2 | ||||||||
6.379%, SOFR30A + 1.064%, 11/25/2048 (B)(D) | 1,985 | 1,960 | ||||||
Nelnet Student Loan Trust, Ser 2019-5, Cl A | ||||||||
2.530%, 10/25/2067 (D) | 576 | 510 | ||||||
Nelnet Student Loan Trust, Ser 2021-A, Cl APT1 | ||||||||
1.360%, 04/20/2062 (D) | 403 | 359 | ||||||
Nelnet Student Loan Trust, Ser 2021-CA, Cl AFX | ||||||||
1.320%, 04/20/2062 (D) | 775 | 694 | ||||||
SEI Institutional Managed Trust
211
SCHEDULE OF INVESTMENTS
September 30, 2023
Core Fixed Income Fund (Continued)
Description | Face Amount | Market Value | ||||||
ASSET-BACKED SECURITIES (continued) | ||||||||
New Economy Assets Phase 1 Sponsor, Ser 2021-1, Cl B1 | ||||||||
2.410%, 10/20/2061 (D) | $ | 3,245 | $ | 2,698 | ||||
Oak Street Investment Grade Net Lease Fund, Ser 2020-1A, Cl A1 | ||||||||
1.850%, 11/20/2050 (D) | 1,065 | 944 | ||||||
Octagon Investment Partners XIV, Ser 2021-1A, Cl AARR | ||||||||
6.520%, TSFR3M + 1.212%, 07/15/2029 (B)(D) | 2,564 | 2,556 | ||||||
Octane Receivables Trust, Ser 2023-1A, Cl A | ||||||||
5.870%, 05/21/2029 (D) | 702 | 699 | ||||||
Origen Manufactured Housing Contract Trust, Ser 2006-A, Cl A2 | ||||||||
6.850%, 10/15/2037 (B) | 449 | 402 | ||||||
Palmer Square CLO, Ser 2021-3A, Cl A1AR | ||||||||
6.706%, TSFR3M + 1.342%, 11/15/2031 (B)(D) | 2,600 | 2,588 | ||||||
Progress Residential Trust, Ser 2019-SFR3, Cl A | ||||||||
2.271%, 09/17/2036 (D) | 1,057 | 1,019 | ||||||
Rockford Tower CLO, Ser 2021-2A, Cl AR | ||||||||
6.741%, TSFR3M + 1.362%, 08/20/2032 (B)(D) | 3,150 | 3,130 | ||||||
SBA Small Business Investment, Ser 2018-10B, Cl 1 | ||||||||
3.548%, 09/10/2028 | 561 | 514 | ||||||
SBA Small Business Investment, Ser 2022-10A, Cl 1 | ||||||||
2.938%, 03/10/2032 | 856 | 743 | ||||||
SBA Small Business Investment, Ser 2022-10B, Cl 1 | ||||||||
4.262%, 09/10/2032 | 440 | 406 | ||||||
Sequoia Infrastructure Funding I Ltd., Ser 2021-1A, Cl A | ||||||||
6.970%, TSFR3M + 1.662%, 04/15/2031 (B)(D) | 314 | 314 | ||||||
Sierra Timeshare Receivables Funding, Ser 2018-3A, Cl B | ||||||||
3.870%, 09/20/2035 (D) | 335 | 332 | ||||||
Sierra Timeshare Receivables Funding, Ser 2021-2A, Cl A | ||||||||
1.350%, 09/20/2038 (D) | 261 | 244 | ||||||
SLM Private Credit Student Loan Trust, Ser 2005-A, Cl A4 | ||||||||
5.981%, TSFR3M + 0.572%, 12/15/2038 (B) | 808 | 783 | ||||||
SLM Student Loan Trust, Ser 2003-7A, Cl A5A | ||||||||
6.682%, SOFR90A + 1.462%, 12/15/2033 (B)(D) | 1,417 | 1,393 | ||||||
Description | Face Amount | Market Value | ||||||
ASSET-BACKED SECURITIES (continued) | ||||||||
SLM Student Loan Trust, Ser 2005-4, Cl A4 | ||||||||
5.486%, SOFR90A + 0.432%, 07/25/2040 (B) | $ | 2,687 | $ | 2,630 | ||||
SLM Student Loan Trust, Ser 2006-8, Cl A6 | ||||||||
5.476%, SOFR90A + 0.422%, 01/25/2041 (B) | 1,736 | 1,691 | ||||||
SLM Student Loan Trust, Ser 2007-7, Cl B | ||||||||
6.066%, SOFR90A + 1.012%, 10/27/2070 (B) | 1,050 | 951 | ||||||
SLM Student Loan Trust, Ser 2008-2, Cl B | ||||||||
6.516%, SOFR90A + 1.462%, 01/25/2083 (B) | 685 | 651 | ||||||
SLM Student Loan Trust, Ser 2008-3, Cl B | ||||||||
6.516%, SOFR90A + 1.462%, 04/26/2083 (B) | 685 | 598 | ||||||
SLM Student Loan Trust, Ser 2008-4, Cl A4 | ||||||||
6.966%, SOFR90A + 1.912%, 07/25/2022 (B) | 393 | 393 | ||||||
SLM Student Loan Trust, Ser 2008-4, Cl B | ||||||||
7.166%, SOFR90A + 2.112%, 04/25/2073 (B) | 685 | 661 | ||||||
SLM Student Loan Trust, Ser 2008-5, Cl A4 | ||||||||
7.016%, SOFR90A + 1.962%, 07/25/2023 (B) | 65 | 65 | ||||||
SLM Student Loan Trust, Ser 2008-5, Cl B | ||||||||
7.166%, SOFR90A + 2.112%, 07/25/2073 (B) | 685 | 663 | ||||||
SLM Student Loan Trust, Ser 2008-6, Cl A4 | ||||||||
6.416%, SOFR90A + 1.362%, 07/25/2023 (B) | 2,117 | 2,094 | ||||||
SLM Student Loan Trust, Ser 2008-6, Cl B | ||||||||
7.166%, SOFR90A + 2.112%, 07/26/2083 (B) | 685 | 646 | ||||||
SLM Student Loan Trust, Ser 2008-7, Cl B | ||||||||
7.166%, SOFR90A + 2.112%, 07/26/2083 (B) | 685 | 629 | ||||||
SLM Student Loan Trust, Ser 2009-3, Cl A | ||||||||
6.179%, SOFR30A + 0.864%, 01/25/2045 (B)(D) | 366 | 362 | ||||||
SLM Student Loan Trust, Ser 2021-10A, Cl A4 | ||||||||
6.152%, SOFR90A + 0.931%, 12/17/2068 (B)(D) | 737 | 731 | ||||||
SMB Private Education Loan Trust, Ser 2016-B, Cl A2A | ||||||||
2.430%, 02/17/2032 (D) | 127 | 123 | ||||||
SMB Private Education Loan Trust, Ser 2016-B, Cl A2B | ||||||||
6.897%, TSFR1M + 1.564%, 02/17/2032 (B)(D) | 110 | 110 | ||||||
SMB Private Education Loan Trust, Ser 2016-C, Cl A2B | ||||||||
6.547%, TSFR1M + 1.214%, 09/15/2034 (B)(D) | 117 | 117 | ||||||
212
SEI Institutional Managed Trust
Description | Face Amount | Market Value | ||||||
ASSET-BACKED SECURITIES (continued) | ||||||||
SMB Private Education Loan Trust, Ser 2018-C, Cl A2A | ||||||||
3.630%, 11/15/2035 (D) | $ | 265 | $ | 254 | ||||
SMB Private Education Loan Trust, Ser 2020-B, Cl A1A | ||||||||
1.290%, 07/15/2053 (D) | 118 | 105 | ||||||
SMB Private Education Loan Trust, Ser 2020-PTA, Cl A2A | ||||||||
1.600%, 09/15/2054 (D) | 686 | 608 | ||||||
SMB Private Education Loan Trust, Ser 2020-PTB, Cl A2A | ||||||||
1.600%, 09/15/2054 (D) | 1,891 | 1,676 | ||||||
SMB Private Education Loan Trust, Ser 2021-A, Cl A2B | ||||||||
1.590%, 01/15/2053 (D) | 406 | 352 | ||||||
SMB Private Education Loan Trust, Ser 2021-A, Cl APT1 | ||||||||
1.070%, 01/15/2053 (D) | 1,184 | 1,012 | ||||||
SMB Private Education Loan Trust, Ser 2021-B, Cl A | ||||||||
1.310%, 07/17/2051 (D) | 1,138 | 1,005 | ||||||
SMB Private Education Loan Trust, Ser 2021-D, Cl A1A | ||||||||
1.340%, 03/17/2053 (D) | 589 | 517 | ||||||
SMB Private Education Loan Trust, Ser 2021-E, Cl A1A | ||||||||
1.680%, 02/15/2051 (D) | 808 | 719 | ||||||
SMB Private Education Loan Trust, Ser 2023-B, Cl A1B | ||||||||
7.113%, SOFR30A + 1.800%, 10/16/2056 (B)(D) | 735 | 740 | ||||||
SoFi Consumer Loan Program Trust, Ser 2023-1S, Cl A | ||||||||
5.810%, 05/15/2031 (D) | 168 | 168 | ||||||
SoFi Professional Loan Program Trust, Ser 2020-C, Cl AFX | ||||||||
1.950%, 02/15/2046 (D) | 83 | 74 | ||||||
SoFi Professional Loan Program Trust, Ser 2021-A, Cl AFX | ||||||||
1.030%, 08/17/2043 (D) | 280 | 234 | ||||||
SoFi Professional Loan Program Trust, Ser 2021-B, Cl AFX | ||||||||
1.140%, 02/15/2047 (D) | 669 | 550 | ||||||
South Carolina Student Loan, Ser 2015-A, Cl A | ||||||||
6.934%, TSFR1M + 1.614%, 01/25/2036 (B) | 636 | 635 | ||||||
Store Master Funding I-VII XIV XIX XX, Ser 2021-1A, Cl A1 | ||||||||
2.120%, 06/20/2051 (D) | 1,483 | 1,221 | ||||||
Description | Face Amount | Market Value | ||||||
ASSET-BACKED SECURITIES (continued) | ||||||||
Structured Asset Investment Loan Trust, Ser 2004-8, Cl A2 | ||||||||
5.984%, TSFR1M + 0.664%, 09/25/2034 (B) | $ | 335 | $ | 316 | ||||
Structured Asset Securities Mortgage Loan Trust, Ser 2007-WF1, Cl A1 | ||||||||
5.854%, TSFR1M + 0.534%, 02/25/2037 (B) | 2,133 | 2,049 | ||||||
Structured Asset Securities Mortgage Pass-Through Certificates, Ser 2002-AL1, Cl A2 | ||||||||
3.450%, 02/25/2032 | 2 | 2 | ||||||
STWD, Ser 2019-FL1, Cl A | ||||||||
6.527%, TSFR1M + 1.194%, 07/15/2038 (B)(D) | 169 | 165 | ||||||
Sunrun Vulcan Issuer, Ser 2021-1A, Cl A | ||||||||
2.460%, 01/30/2052 (D) | 649 | 535 | ||||||
T-Mobile US Trust, Ser 2022-1A, Cl A | ||||||||
4.910%, 05/22/2028 (D) | 684 | 675 | ||||||
Towd Point Mortgage Trust, Ser 2017-4, Cl A1 | ||||||||
2.750%, 06/25/2057 (B)(D) | 500 | 472 | ||||||
Trestles CLO IV, Ser 2021-4A, Cl B1 | ||||||||
7.295%, TSFR3M + 1.962%, 07/21/2034 (B)(D) | 3,445 | 3,412 | ||||||
United States Small Business Administration, Ser 2019-20D, Cl 1 | ||||||||
2.980%, 04/01/2039 | 157 | 139 | ||||||
United States Small Business Administration, Ser 2019-25G, Cl 1 | ||||||||
2.690%, 07/01/2044 | 276 | 232 | ||||||
United States Small Business Administration, Ser 2022-25E, Cl 1 | ||||||||
3.940%, 05/01/2047 | 484 | 436 | ||||||
United States Small Business Administration, Ser 2022-25F, Cl 1 | ||||||||
4.010%, 06/01/2047 | 708 | 638 | ||||||
United States Small Business Administration, Ser 2022-25G, Cl 1 | ||||||||
3.930%, 07/01/2047 | 4,680 | 4,220 | ||||||
United States Small Business Administration, Ser 2022-25H, Cl 1 | ||||||||
3.800%, 08/01/2047 | 2,695 | 2,404 | ||||||
Verizon Master Trust, Ser 2022-2, Cl A | ||||||||
1.530%, 07/20/2028 | 610 | 577 | ||||||
Verizon Master Trust, Ser 2022-4, Cl A | ||||||||
3.400%, 11/20/2028 | 1,298 | 1,250 | ||||||
Verizon Master Trust, Ser 2022-6, Cl A | ||||||||
3.670%, 01/22/2029 | 768 | 742 | ||||||
Verizon Master Trust, Ser 2023-1, Cl A | ||||||||
4.490%, 01/22/2029 | 2,664 | 2,607 | ||||||
Verizon Master Trust, Ser 2023-2, Cl A | ||||||||
4.890%, 04/13/2028 | 434 | 428 | ||||||
SEI Institutional Managed Trust
213
SCHEDULE OF INVESTMENTS
September 30, 2023
Core Fixed Income Fund (Continued)
Description | Face Amount | Market Value | ||||||
ASSET-BACKED SECURITIES (continued) | ||||||||
Verizon Master Trust, Ser 2023-4, Cl A1A | ||||||||
5.160%, 06/20/2029 | $ | 1,987 | $ | 1,972 | ||||
Verizon Master Trust, Ser 2023-6, Cl A | ||||||||
5.350%, 09/22/2031 (D) | 2,530 | 2,511 | ||||||
Wells Fargo Home Equity Asset-Backed Securities Trust, Ser 2006-2, Cl M2 | ||||||||
5.724%, TSFR1M + 0.404%, 07/25/2036 (B) | 4,167 | 4,079 | ||||||
| 174,901 | ||||||||
Total Asset-Backed Securities | ||||||||
(Cost $306,698) ($ Thousands) | 295,931 | |||||||
SOVEREIGN DEBT — 1.3% | ||||||||
Argentine Republic Government International Bond | ||||||||
3.500%, 07/09/2041(C) | 1,460 | 373 | ||||||
1.000%, 07/09/2029 | 203 | 56 | ||||||
0.750%, 07/09/2030(C) | 832 | 237 | ||||||
Bermuda Government International Bond | ||||||||
5.000%, 07/15/2032(D) | 339 | 316 | ||||||
Brazilian Government International Bond | ||||||||
5.000%, 01/27/2045 | 3,400 | 2,513 | ||||||
4.750%, 01/14/2050 | 1,300 | 898 | ||||||
4.625%, 01/13/2028 | 3,090 | 2,967 | ||||||
Colombia Government International Bond | ||||||||
5.625%, 02/26/2044 | 660 | 471 | ||||||
5.000%, 06/15/2045 | 830 | 543 | ||||||
4.125%, 02/22/2042 | 680 | 410 | ||||||
3.250%, 04/22/2032 | 670 | 481 | ||||||
Export Finance & Insurance | ||||||||
4.625%, 10/26/2027(D) | 1,079 | 1,069 | ||||||
Export-Import Bank of India | ||||||||
3.375%, 08/05/2026(D)(E) | 350 | 329 | ||||||
Indonesia Government International Bond | ||||||||
3.700%, 10/30/2049 | 460 | 321 | ||||||
Indonesia Treasury Bond | ||||||||
6.500%, 02/15/2031 | IDR | 21,001,000 | 1,332 | |||||
6.375%, 04/15/2032 | 58,803,000 | 3,709 | ||||||
Inter-American Development Bank MTN | ||||||||
7.350%, 10/06/2030 | INR | 417,000 | 4,979 | |||||
Israel Government International Bond | ||||||||
4.500%, 01/17/2033 | $ | 731 | 680 | |||||
3.375%, 01/15/2050 | 280 | 186 | ||||||
2.750%, 07/03/2030 | 470 | 399 | ||||||
Kenya Government International Bond | ||||||||
7.250%, 02/28/2028(D) | 200 | 160 | ||||||
6.875%, 06/24/2024 | 200 | 185 | ||||||
6.300%, 01/23/2034(D) | 960 | 637 | ||||||
Description | Face Amount | Market Value | ||||||
SOVEREIGN DEBT (continued) | ||||||||
Mexico Government International Bond | ||||||||
6.338%, 05/04/2053 | $ | 597 | $ | 543 | ||||
6.050%, 01/11/2040 | 1,210 | 1,117 | ||||||
4.750%, 03/08/2044 | 10,080 | 7,720 | ||||||
3.771%, 05/24/2061 | 266 | 156 | ||||||
3.750%, 01/11/2028 | 390 | 361 | ||||||
3.500%, 02/12/2034 | 1,039 | 812 | ||||||
2.659%, 05/24/2031 | 4,300 | 3,393 | ||||||
Nigeria Government International Bond | ||||||||
7.143%, 02/23/2030(D) | 240 | 189 | ||||||
6.500%, 11/28/2027(D) | 220 | 183 | ||||||
Panama Government International Bond | ||||||||
6.853%, 03/28/2054 | 655 | 608 | ||||||
4.500%, 04/01/2056 | 540 | 355 | ||||||
2.252%, 09/29/2032 | 620 | 448 | ||||||
Paraguay Government International Bond | ||||||||
5.850%, 08/21/2033(D) | 685 | 648 | ||||||
5.400%, 03/30/2050(D) | 342 | 269 | ||||||
3.849%, 06/28/2033(D) | 350 | 287 | ||||||
Peruvian Government International Bond | ||||||||
5.625%, 11/18/2050(E) | 600 | 554 | ||||||
2.783%, 01/23/2031 | 300 | 246 | ||||||
Provincia de Buenos Aires Government Bond MTN | ||||||||
6.375%, 09/01/2037(C)(D) | 3,005 | 978 | ||||||
Republic of Italy Government International Bond | ||||||||
3.875%, 05/06/2051 | 237 | 154 | ||||||
Russian Federal Bond - OFZ | ||||||||
6.900%, 05/23/2029(I) | RUB | 126,230 | 407 | |||||
2.270%, 03/16/2039(I) | 55,840 | 132 | ||||||
Total Sovereign Debt | ||||||||
(Cost $53,542) ($ Thousands) | 42,811 | |||||||
U.S. GOVERNMENT AGENCY OBLIGATIONS — 0.9% | ||||||||
FHLB | ||||||||
5.370%, 05/21/2024 | $ | 11,600 | 11,566 | |||||
5.300%, 05/22/2024 | 11,820 | 11,785 | ||||||
1.250%, 09/30/2031 (C) | 1,455 | 1,160 | ||||||
FHLMC MTN | ||||||||
0.000%, 12/14/2029(A) | 1,213 | 899 | ||||||
FNMA | ||||||||
1.900%, 01/25/2036 | 1,343 | 917 | ||||||
1.520%, 08/21/2035 | 1,498 | 990 | ||||||
0.000%, 11/15/2030(A) | 3,564 | 2,506 | ||||||
Resolution Funding Interest | ||||||||
0.000%, 01/15/2030(A) | 905 | 665 | ||||||
214
SEI Institutional Managed Trust
Description | Face Amount | Market Value | ||||||
U.S. GOVERNMENT AGENCY OBLIGATIONS (continued) | ||||||||
Resolution Funding Principal | ||||||||
0.000%, 04/15/2030(A) | $ | 1,165 | $ | 836 | ||||
Total U.S. Government Agency Obligations | ||||||||
(Cost $33,838) ($ Thousands) | 31,324 | |||||||
LOAN PARTICIPATIONS — 0.8% | ||||||||
Air Canada, Term Loan, 1st Lien | ||||||||
9.128%, 08/11/2028 (B) | 415 | 415 | ||||||
Ali Group | ||||||||
7.431%, 07/30/2029 (B) | 414 | 413 | ||||||
Allied Universal Holdco LLC (f/k/a USAGM Holdco, LLC), Initial U.S. Dollar Term Loan, 1st Lien | ||||||||
9.166%, CME Term SOFR + 3.750%, 05/12/2028 (B)(J) | 1,169 | 1,127 | ||||||
Alterra Moutain Company, Series B-2 Term Loan, 1st Lien | ||||||||
8.931%, 08/17/2028 (B) | 554 | 552 | ||||||
AMWINS Group Inc. | ||||||||
8.181%, 02/19/2028 | 119 | 119 | ||||||
APi Group DE, Inc., Initial Term Loan, 1st Lien | ||||||||
7.931%, LIBOR + 2.500%, 10/01/2026 (B) | 473 | 474 | ||||||
Asurion | ||||||||
9.666%, 08/19/2028 (B) | 555 | 538 | ||||||
Asurion, LLC, New B-8 Term Loan, 1st Lien | ||||||||
8.681%, LIBOR + 3.250%, 12/23/2026 (B) | 324 | 317 | ||||||
Asurion, LLC, New B-9 Term Loan, 1st Lien | ||||||||
8.681%, CME Term SOFR + 0.000%, 07/31/2027 (B) | 371 | 358 | ||||||
Athena Helath Group, Initial Term Loan | ||||||||
8.568%, 02/15/2029 (B) | 1,170 | 1,146 | ||||||
Avolon TLB Borrower 1 LLC | ||||||||
7.675%, 12/01/2027 | 123 | 123 | ||||||
Brown Group Holdings, LLC, Initial Term Loan, 1st Lien | ||||||||
8.166%, CME Term SOFR + 2.750%, 06/07/2028 (B) | 568 | 562 | ||||||
Caesars Entertainment, Term Loan, 1st Lien | ||||||||
8.666%, 02/06/2030 (B) | 70 | 70 | ||||||
Castlelake Avia | ||||||||
8.421%, 10/22/2026 (B) | 394 | 393 | ||||||
Charter Communications Operating LLC, Lien1 | ||||||||
7.116%, 04/30/2025 | 614 | 614 | ||||||
Citaldel Securities LP | ||||||||
7.931%, 07/29/2030 | 562 | 561 | ||||||
Description | Face Amount | Market Value | ||||||
LOAN PARTICIPATIONS (continued) | ||||||||
Clarios Global, Term Loan, 1st Lien | ||||||||
9.066%, 05/06/2030 (B) | $ | 260 | $ | 259 | ||||
DCert Buyer, Inc., Initial Term Loan, 1st Lien | ||||||||
9.316%, CME Term SOFR + 4.000%, 10/16/2026 (B) | 1,206 | 1,197 | ||||||
Deerfield Dakota Holding, LLC, Initial Dollar Term Loan, 1st Lien | ||||||||
9.140%, CME Term SOFR + 3.750%, 04/09/2027 (B) | 784 | 764 | ||||||
Energizer Holdings | ||||||||
7.688%, 12/22/2027 | 172 | 171 | ||||||
Entain PLC | ||||||||
7.990%, 03/29/2027 | 116 | 115 | ||||||
EyeCare Partners, LLC, Term Loan, 1st Lien | ||||||||
9.181%, CME Term SOFR + 3.750%, 02/18/2027 (B) | 203 | 142 | ||||||
First Eagle Holdings, Term Loan | ||||||||
7.990%, 02/01/2027 | 250 | 248 | ||||||
Focus Financial, Term Loan, 1st Lien | ||||||||
8.566%, 06/30/2028 | 782 | 779 | ||||||
Gainwell Acquisition Corp., Term B Loan, 1st Lien | ||||||||
9.490%, CME Term SOFR + 4.000%, 10/01/2027 (B) | 1,326 | 1,292 | ||||||
Garda World Security Corp | ||||||||
9.746%, CME Term SOFR + 4.250%, 10/30/2026 (B) | 268 | 267 | ||||||
GFL Environmental | ||||||||
7.824%, 05/31/2027 | 32 | 32 | ||||||
Global Medical Response, Inc., 2021 Refinancing Term Loan, 1st Lien | ||||||||
9.780%, CME Term SOFR + 4.250%, 10/02/2025 (B) | 704 | 488 | ||||||
Grifols Worldwide Operations Limited, Dollar Tranche B Term Loan, 1st Lien | ||||||||
7.416%, LIBOR + 2.000%, 11/15/2027 (B) | 600 | 589 | ||||||
GTCR W Merger Sub LLC | ||||||||
0.000%, 09/20/2030 (J)(K) | 1,560 | 1,559 | ||||||
Harbor Freight Tools USA, Inc | ||||||||
8.181%, 10/19/2027 | 649 | 643 | ||||||
Icon Public Limited Company, Lux Term Loan, 1st Lien | ||||||||
7.902%, 07/03/2028 (B) | 502 | 502 | ||||||
Icon Public Limited Company, U.S. Term Loan, 1st Lien | ||||||||
7.902%, 07/03/2028 (B) | 125 | 125 | ||||||
KKR Apple Bidco, LLC, Term Loan, 1st Lien | ||||||||
8.181%, 09/22/2028 (B) | 407 | 404 | ||||||
Magenta Buyer LLC, Initial Term Loan, 1st Lien | ||||||||
10.631%, CME Term SOFR + 5.000%, 07/27/2028 (B)(J) | 208 | 154 | ||||||
SEI Institutional Managed Trust
215
SCHEDULE OF INVESTMENTS
September 30, 2023
Core Fixed Income Fund (Continued)
Description | Face Amount | Market Value | ||||||
LOAN PARTICIPATIONS (continued) | ||||||||
PCI Gaming Authority, Term B Facility Loan | ||||||||
7.931%, 05/29/2026 (B) | $ | 389 | $ | 388 | ||||
Peraton Corp., Term B Loan, 1st Lien | ||||||||
9.166%, CME Term SOFR + 3.750%, 02/01/2028 (B) | 893 | 890 | ||||||
Phoenix Guarantor Inc., Tranche B-1 Term Loan, 1st Lien | ||||||||
8.681%, CME Term SOFR + 3.250%, 03/05/2026 (B) | 916 | 909 | ||||||
Project Sky, Term Loan, 1st Lien | ||||||||
9.166%, 10/08/2028 (B) | 246 | 241 | ||||||
Scientific Games/Lights & Wonder | ||||||||
8.434%, 04/14/2029 (B) | 889 | 888 | ||||||
Setanta Aircraft | ||||||||
7.652%, 11/05/2028 | 1,060 | 1,059 | ||||||
Sotera Health Holdings, LLC, Refinancing Loan, 1st Lien | ||||||||
8.181%, 12/11/2026 (B) | 1,050 | 1,039 | ||||||
Triton Water Holdings, Inc., Initial Term Loan, 1st Lien | ||||||||
8.902%, CME Term SOFR + 3.500%, 03/31/2028 (B) | 772 | 751 | ||||||
UFC Holdings, Term Loan, 1st Lien | ||||||||
8.369%, 04/29/2026 | 822 | 820 | ||||||
United AirLines, Inc., Class B Term Loan, 1st Lien | ||||||||
9.182%, CME Term SOFR + 0.000%, 04/21/2028 (B) | 644 | 644 | ||||||
VFH Parent, Initial Term Loan | ||||||||
8.418%, 01/13/2029 (B) | 406 | 402 | ||||||
Virgin Media Bristol LLC, N Facility, 1st Lien | ||||||||
7.947%, CME Term SOFR + 2.500%, 01/31/2028 (B) | 144 | 140 | ||||||
Zebra Buyer LLC | ||||||||
8.949%, 11/01/2028 (B)(J) | 248 | 245 | ||||||
Total Loan Participations | ||||||||
(Cost $26,438) ($ Thousands) | 25,928 | |||||||
MUNICIPAL BONDS — 0.3% | ||||||||
California — 0.1% | ||||||||
California State University, Ser B, RB | ||||||||
2.374%, 11/01/2035 | 635 | 460 | ||||||
California State, Health Facilities Financing Authority, RB | ||||||||
3.000%, 08/15/2051 | 785 | 545 | ||||||
Description | Face Amount | Market Value | ||||||
MUNICIPAL BONDS (continued) | ||||||||
Regents of the University of California, Medical Center Pooled Revenue, Ser N, RB | ||||||||
3.256%, 05/15/2060 | $ | 740 | $ | 464 | ||||
| 1,469 | ||||||||
Georgia — 0.1% | ||||||||
Georgia State, Municipal Electric Authority, RB | ||||||||
7.055%, 04/01/2057 | 1,040 | 1,018 | ||||||
Nevada — 0.0% | ||||||||
Clark County, Department of Aviation, Ser C, RB | ||||||||
6.820%, 07/01/2045 | 728 | 816 | ||||||
New York — 0.1% | ||||||||
Metropolitan New York, Transportation Authority, Ser C2, RB | ||||||||
5.175%, 11/15/2049 | 260 | 223 | ||||||
New York and New Jersey, Port Authority, RB | ||||||||
4.458%, 10/01/2062 | 505 | 416 | ||||||
New York City, Transitional Finance Authority Future Tax Secured Revenue, Sub-Ser B-3, RB | ||||||||
2.000%, 08/01/2035 | 1,000 | 687 | ||||||
New York City, Transitional Finance Authority Future Tax Secured Revenue, Sub-Ser D-3, RB | ||||||||
2.400%, 11/01/2032 | 610 | 475 | ||||||
New York City, Transitional Finance Authority, Future Tax Secured Revenue, Sub-Ser, RB | ||||||||
5.508%, 08/01/2037 | 325 | 319 | ||||||
New York State, Dormitory Authority, RB | ||||||||
5.628%, 03/15/2039 | 400 | 398 | ||||||
5.289%, 03/15/2033 | 850 | 836 | ||||||
| 3,354 | ||||||||
Ohio — 0.0% | ||||||||
Ohio State University, Ser A, RB | ||||||||
4.800%, 06/01/2111 | 433 | 360 | ||||||
Texas — 0.0% | ||||||||
Board of Regents of the University of Texas System, Ser B, RB | ||||||||
2.439%, 08/15/2049 | 295 | 176 | ||||||
North Texas, Tollway Authority, Ser B, RB | ||||||||
6.718%, 01/01/2049 | 632 | 712 | ||||||
| 888 | ||||||||
216
SEI Institutional Managed Trust
Description | Face Amount | Market Value | ||||||
MUNICIPAL BONDS (continued) | ||||||||
Virginia — 0.0% | ||||||||
University of Virginia, RB | ||||||||
2.256%, 09/01/2050 | $ | 480 | $ | 273 | ||||
Total Municipal Bonds | ||||||||
(Cost $10,110) ($ Thousands) | 8,178 | |||||||
| ||||||||
AFFILIATED PARTNERSHIP — 1.6% | ||||||||
SEI Liquidity Fund, LP | ||||||||
5.410% **†(L) | 53,274,210 | 53,339 | ||||||
Total Affiliated Partnership | ||||||||
(Cost $53,268) ($ Thousands) | 53,339 | |||||||
CASH EQUIVALENT — 7.2% | ||||||||
SEI Daily Income Trust, Government Fund, Institutional Class | ||||||||
5.210%**† | 241,390,016 | 241,390 | ||||||
Total Cash Equivalent | ||||||||
(Cost $241,390) ($ Thousands) | 241,390 | |||||||
Description | Shares | Market Value | ||||||
PURCHASED OPTIONS — 0.0% | ||||||||
Total Purchased Options | ||||||||
(Cost $907) ($ Thousands) | $ | 1,384 | ||||||
Total Investments in Securities — 116.3% | ||||||||
(Cost $4,253,523) ($ Thousands) | $ | 3,901,298 | ||||||
WRITTEN OPTIONS — (0.0)% | ||||||||
Total Written Options | ||||||||
(Premiums Received $1,240) ($ Thousands) | $ | (2,165 | ) | |||||
A list of the exchange traded option contracts held by the Fund at September 30, 2023, is as follows:
Description | Number of Contracts | Notional Amount | Exercise Price | Expiration Date | Value | |||||||||||||||
PURCHASED OPTIONS — 0.0% | ||||||||||||||||||||
Put Options | ||||||||||||||||||||
December 2023, SOFR 1yr MidCurve Dec23P 95.88 | 155 | $ | 37,152 | $ | 95.88 | 12/16/2023 | $ | 227 | ||||||||||||
December 2023, SOFR 1yr MidCurve Dec23P 96 | 118 | 28,320 | 96.00 | 12/16/2023 | 202 | |||||||||||||||
October 2023, SOFR 1yr MidCurve Oct23P 97 | 179 | 43,407 | 97.00 | 10/21/2023 | 712 | |||||||||||||||
September 2023, U.S. Long Bond Future Option | 31 | 3,518 | 113.50 | 10/21/2023 | – | |||||||||||||||
USD Put/Aud Call | 8,700,000 | 5,843 | 0.67 | 11/18/2023 | 6 | |||||||||||||||
| 118,240 | 1,147 | |||||||||||||||||||
Call Options | – | |||||||||||||||||||
November 2023, U.S. 5 Year Future Option | 443 | 46,847 | 105.75 | 10/21/2023 | 173 | |||||||||||||||
November 2023, U.S. 5 Year Future Option | 163 | 17,278 | 106.00 | 10/21/2023 | 50 | |||||||||||||||
November 2023, U.S. 5 Year Future Option | 61 | 6,481 | 106.25 | 10/21/2023 | 14 | |||||||||||||||
September 2023, U.S. Long Bond Future Option | 189 | 22,775 | 120.50 | 10/21/2023 | – | |||||||||||||||
| 93,381 | 237 | |||||||||||||||||||
Total Purchased Options | $ | 211,621 | $ | 1,384 | ||||||||||||||||
WRITTEN OPTIONS — (0.1)% | ||||||||||||||||||||
Put Options | ||||||||||||||||||||
June 2024, 3 Month SOFR OPT Jun24P 97.5 | (1,176 | ) | $ | (277,830 | ) | 94.50 | 06/22/2024 | $ | (566 | ) | ||||||||||
December 2023, SOFR 1yr MidCurve Dec23P 95.25 | (310 | ) | (73,819 | ) | 95.25 | 12/16/2023 | (149 | ) | ||||||||||||
December 2023, SOFR 1yr MidCurve Dec23P 95.38 | (236 | ) | (56,268 | ) | 95.38 | 12/16/2023 | (149 | ) | ||||||||||||
October 2023, SOFR 1yr MidCurve Oct23P 96.25 | (179 | ) | (43,072 | ) | 96.25 | 10/21/2023 | (377 | ) | ||||||||||||
SEI Institutional Managed Trust
217
SCHEDULE OF INVESTMENTS
September 30, 2023
Core Fixed Income Fund (Continued)
Description | Number of Contracts | Notional Amount | Exercise Price | Expiration Date | Value | |||||||||||||||
WRITTEN OPTIONS (continued) | ||||||||||||||||||||
October 2023, SOFR 1yr MidCurve Oct23P 96.5 | (179 | ) | $ | (43,184 | ) | $ | 96.50 | 10/21/2023 | $ | (488 | ) | |||||||||
November 2023, U.S. 5 Year Future Option | (211 | ) | (22,260 | ) | 105.50 | 10/21/2023 | (133 | ) | ||||||||||||
December 2023, U.S. Bond Future Option Dec23P 112 | (93 | ) | (10,416 | ) | 112.00 | 11/18/2023 | (179 | ) | ||||||||||||
| (526,849 | ) | (2,041 | ) | |||||||||||||||||
Call Options | ||||||||||||||||||||
September 2024, 3 Month SOFR OPT Sep24C 96.88 | (118 | ) | (28,578 | ) | 96.88 | 09/21/2024 | (39 | ) | ||||||||||||
September 2024, 3 Month SOFR OPT Sep24C 97 | (283 | ) | (68,627 | ) | 97.00 | 09/21/2024 | (85 | ) | ||||||||||||
September 2023, U.S. Long Bond Future Option | (31 | ) | (3,674 | ) | 118.50 | 10/21/2023 | – | |||||||||||||
| (100,879 | ) | (124 | ) | |||||||||||||||||
Total Written Options | $ | (627,728 | ) | $ | (2,165 | ) | ||||||||||||||
A list of the open futures contracts held by the Fund at September 30, 2023, is as follows:
Type of Contract | Number of | Expiration Date | Notional Amount (Thousands) | Value | Unrealized Appreciation/ | |||||||||||||||
Long Contracts | ||||||||||||||||||||
3 Month SOFR | 398 | Mar-2026 | $ | 95,625 | $ | 95,565 | $ | (60 | ) | |||||||||||
Euro-Bobl | 37 | Dec-2023 | 4,719 | 4,534 | (38 | ) | ||||||||||||||
Euro-OAT | 79 | Dec-2023 | 10,887 | 10,305 | (243 | ) | ||||||||||||||
U.S. 2-Year Treasury Note | 1,968 | Dec-2023 | 400,172 | 398,935 | (1,237 | ) | ||||||||||||||
U.S. 5-Year Treasury Note | 1,069 | Dec-2023 | 113,841 | 112,629 | (1,212 | ) | ||||||||||||||
U.S. 10-Year Treasury Note | 58 | Dec-2023 | 6,376 | 6,267 | (109 | ) | ||||||||||||||
U.S. Long Treasury Bond | 235 | Dec-2023 | 27,855 | 26,739 | (1,116 | ) | ||||||||||||||
U.S. Ultra Long Treasury Bond | 673 | Dec-2023 | 85,349 | 79,877 | (5,472 | ) | ||||||||||||||
Ultra 10-Year U.S. Treasury Note | 9 | Dec-2023 | 1,036 | 1,004 | (32 | ) | ||||||||||||||
| 745,860 | 735,855 | (9,519 | ) | |||||||||||||||||
Short Contracts | ||||||||||||||||||||
Euro-Buxl | (4 | ) | Dec-2023 | $ | (577 | ) | $ | (518 | ) | $ | 41 | |||||||||
U.S. 2-Year Treasury Note | (235 | ) | Dec-2023 | (47,685 | ) | (47,637 | ) | 48 | ||||||||||||
U.S. 5-Year Treasury Note | (1,077 | ) | Dec-2023 | (114,020 | ) | (113,472 | ) | 548 | ||||||||||||
U.S. 10-Year Treasury Note | (63 | ) | Dec-2023 | (6,844 | ) | (6,808 | ) | 36 | ||||||||||||
U.S. Long Treasury Bond | (144 | ) | Dec-2023 | (17,303 | ) | (16,385 | ) | 918 | ||||||||||||
Ultra 10-Year U.S. Treasury Note | (480 | ) | Dec-2023 | (55,072 | ) | (53,550 | ) | 1,522 | ||||||||||||
| (241,501 | ) | (238,370 | ) | 3,113 | ||||||||||||||||
| $ | 504,359 | $ | 497,485 | $ | (6,406 | ) | ||||||||||||||
A list of the open forward foreign currency contracts held by the Fund at September 30, 2023, is as follows:
Counterparty | Settlement Date | Currency to Deliver | Currency to Receive | Unrealized Appreciation | ||||||||||||||||||||
BNP Paribas | 10/20/23 | EUR | 4,034 | NOK | 46,790 | $ | 127 | |||||||||||||||||
BNP Paribas | 10/20/23 | USD | 7,026 | AUD | 10,529 | (227 | ) | |||||||||||||||||
BNP Paribas | 10/20/23 | CAD | 9,671 | USD | 7,190 | 33 | ||||||||||||||||||
BNP Paribas | 10/20/23 | USD | 18,209 | CAD | 24,132 | (353 | ) | |||||||||||||||||
Citigroup | 10/20/23 | CAD | 2,950 | USD | 2,226 | 43 | ||||||||||||||||||
Goldman Sachs | 10/20/23 | IDR | 759,546 | USD | 50 | 1 | ||||||||||||||||||
218
SEI Institutional Managed Trust
Counterparty | Settlement Date | Currency to Deliver | Currency to Receive | Unrealized Appreciation | ||||||||||||||||||||
Morgan Stanley | 10/20/23 | EUR | 161 | USD | 172 | $ | 1 | |||||||||||||||||
Morgan Stanley | 10/20/23 | GBP | 3,904 | USD | 5,062 | 297 | ||||||||||||||||||
Morgan Stanley | 10/20/23 | USD | 4,374 | EUR | 3,961 | (177 | ) | |||||||||||||||||
Morgan Stanley | 10/20/23 | USD | 17,232 | JPY | 2,401,276 | (1,081 | ) | |||||||||||||||||
Morgan Stanley | 10/20/23 | CNH | 60,232 | USD | 8,377 | 104 | ||||||||||||||||||
| $ | (1,232 | ) | ||||||||||||||||||||||
A list of the open OTC swap agreements held by the Fund at September 30, 2023, is as follows:
Interest Rate Swap |
Counterparty | Fund Pays | Fund Receives | Payment Frequency | Termination Date | Currency | Notional Amount | Value | Upfront Payments | Net Unrealized | |||||||||||||||||||||||||||
Citibank | 0.2375 | BRL-CDI | Annual | 01/02/2029 | BRL | 70,430 | $ | (533 | ) | $ | – | $ | (533 | ) | ||||||||||||||||||||||
A list of the open centrally cleared swap agreements held by the Fund at September 30, 2023, is as follows:
Interest Rate Swaps |
Fund Pays | Fund Receives | Payment Frequency | Termination Date | Currency | Notional Amount | Value | Upfront Payments/ Receipts | Net Unrealized | ||||||||||||||||||||||||||||
USD-SOFR-OIS COMPOUND | 4% FIXED | Annual | 02/29/2028 | USD | 46,200 | $ | (649 | ) | $ | (8 | ) | $ | (641 | ) | ||||||||||||||||||||||
USD-SOFR-OIS COMPOUND | 4.18% FIXED | Annual | 02/29/2028 | USD | 74,070 | (534 | ) | 56 | (590 | ) | ||||||||||||||||||||||||||
LE - 2.85% FIXED | USD-SOFR-OIS COMPOUND | Annual | 02/15/2029 | USD | 10,144 | 723 | (16 | ) | 739 | |||||||||||||||||||||||||||
0.0327% FIXED | USD-SOFR-OIS COMPOUND | Annual | 04/30/2029 | USD | 7,015 | 370 | 26 | 344 | ||||||||||||||||||||||||||||
3.85% FIXED | USD-SOFR-OIS COMPOUND | Annual | 06/30/2029 | USD | 7,436 | 182 | 2 | 180 | ||||||||||||||||||||||||||||
1.52% FIXED | USD-SOFR-COMPOUND 2/15/47 | Annual | 02/15/2047 | USD | 5,559 | 2,161 | (61 | ) | 2,222 | |||||||||||||||||||||||||||
0.026% FIXED | USD-SOFR-OIS-COMPOUND | Annual | 02/15/2048 | USD | 9,739 | 2,258 | 924 | 1,334 | ||||||||||||||||||||||||||||
3.05% FIXED | USD-SOFR-OIS COMPOUND | Annual | 02/15/2048 | USD | 10,834 | 1,774 | 502 | 1,272 | ||||||||||||||||||||||||||||
USD-SOFR-OIS COMPOUND | 3.15% | Annual | 05/15/2048 | USD | 10,146 | 1,509 | 121 | 1,388 | ||||||||||||||||||||||||||||
.50% FIXED | SD-SOFR-OIS-COMPOUND | Annual | 04/21/2052 | USD | 5,290 | 1,354 | 8 | 1,346 | ||||||||||||||||||||||||||||
FIXED 3.52 % | SOFRRAT | Annual | 12/20/2053 | USD | 7,131 | 562 | – | 562 | ||||||||||||||||||||||||||||
| $ | 9,710 | $ | 1,554 | $ | 8,156 | |||||||||||||||||||||||||||||||
Credit Default Swap - Buy Protection |
Reference Entity/ Obligation | Pay Rate | Payment Frequency | Termination Date | Notional Amount | Value | Upfront Payments/ Receipts | Net Unrealized | |||||||||||||||||||||
CDS-CDX.NA.HY.4112 | 5.00% | Quarterly | 12/20/2028 | $ | 9,051 | $ | (86 | ) | $ | (65 | ) | $ | (21 | ) | ||||||||||||||
Credit Default Swap - Sell Protection |
Reference Entity/ Obligation | Receive Rate | Payment Frequency | Termination Date | Notional Amount | Value | Upfront Payments/ Receipts | Net Unrealized | |||||||||||||||||||||
CDS-CDX.NA.IG.4112 | 1.00% | Quarterly | 12/20/2028 | $ | 127,395 | $ | 1,557 | $ | 1,656 | $ | (99 | ) | ||||||||||||||||
SEI Institutional Managed Trust
219
SCHEDULE OF INVESTMENTS
September 30, 2023
Core Fixed Income Fund (Concluded)
| Percentages are based on Net Assets of $3,355,468 ($ Thousands). |
** | The rate reported is the 7-day effective yield as of September 30, 2023. |
† | Investment in Affiliated Security (see Note 6). |
(A) | Zero coupon security. |
(B) | Variable or floating rate security. The rate shown is the effective interest rate as of period end. The rates on certain securities are not based on published reference rates and spreads and are either determined by the issuer or agent based on current market conditions; by using a formula based on the rates of underlying loans; or by adjusting periodically based on prevailing interest rates. |
(C) | Step coupon security. Coupon rate will either increase (step-up bond) or decrease (step-down bond) at regular intervals until maturity. Interest rate shown reflects the rate currently in effect. |
(D) | Security exempt from registration under Rule 144A of the Securities Act of 1933. These securities may be resold in transactions exempt from registration normally to qualified institutions. On September 30, 2023, the value of these securities amounted to $473,781 ($ Thousands), representing 14.1% of the Net Assets of the Fund. |
(E) | Certain securities or partial positions of certain securities are on loan at September 30, 2023. |
(F) | Perpetual security with no stated maturity date. |
(G) | Interest rate represents the security's effective yield at the time of purchase. |
(H) | Security, or a portion thereof, has been pledged as collateral on open futures contracts. The total market value of such securities as of September 30, 2023 was $1,529 ($ Thousands). |
(I) | Security is in default on interest payment. |
(J) | Unsettled bank loan. Interest rate may not be available. |
(K) | No interest rate available. |
(L) | This security was purchased with cash collateral held from securities on loan (see Note 12). The total market value of such securities as of September 30, 2023 was $53,339 ($ Thousands). |
The following is a summary of the level of inputs used as of September 30, 2023, in valuing the Fund's investments and other financial instruments carried at value ($ Thousands): |
Investments in Securities | Level 1 | Level 2 | Level 3 | Total | ||||||||||||
Mortgage-Backed Securities | – | 1,432,800 | – | 1,432,800 | ||||||||||||
Corporate Obligations | – | 1,020,189 | – | 1,020,189 | ||||||||||||
U.S. Treasury Obligations | – | 748,024 | – | 748,024 | ||||||||||||
Asset-Backed Securities | – | 295,931 | – | 295,931 | ||||||||||||
Sovereign Debt | – | 42,811 | – | 42,811 | ||||||||||||
U.S. Government Agency Obligations | – | 31,324 | – | 31,324 | ||||||||||||
Loan Participations | – | 25,928 | – | 25,928 | ||||||||||||
Municipal Bonds | – | 8,178 | – | 8,178 | ||||||||||||
Affiliated Partnership | – | 53,339 | – | 53,339 | ||||||||||||
Purchased Options | 1,384 | – | – | 1,384 | ||||||||||||
Cash Equivalent | 241,390 | – | – | 241,390 | ||||||||||||
Total Investments in Securities | 242,774 | 3,658,524 | – | 3,901,298 | ||||||||||||
Other Financial Instruments | Level 1 | Level 2 | Level 3 | Total | ||||||||||||
Written Options | (2,165 | ) | – | – | (2,165 | ) | ||||||||||
Futures Contracts* | ||||||||||||||||
Unrealized Appreciation | 3,113 | – | – | 3,113 | ||||||||||||
Unrealized Depreciation | (9,519 | ) | – | – | (9,519 | ) | ||||||||||
Forward Contracts* | ||||||||||||||||
Unrealized Appreciation | – | 606 | – | 606 | ||||||||||||
Unrealized Depreciation | – | (1,838 | ) | – | (1,838 | ) | ||||||||||
OTC Swap | ||||||||||||||||
Interest Rate Swap* | ||||||||||||||||
Unrealized Depreciation | – | (533 | ) | – | (533 | ) | ||||||||||
Centrally Cleared Swaps | ||||||||||||||||
Credit Default Swaps* | ||||||||||||||||
Unrealized Depreciation | – | (120 | ) | – | (120 | ) | ||||||||||
Interest Rate Swaps* | ||||||||||||||||
Unrealized Appreciation | – | 9,387 | – | 9,387 | ||||||||||||
Unrealized Depreciation | – | (1,231 | ) | – | (1,231 | ) | ||||||||||
Total Other Financial Instruments | (8,571 | ) | 6,271 | – | (2,300 | ) | ||||||||||
* | Futures contracts, forward contracts and swaps contracts are valued at the unrealized appreciation (depreciation) on the instrument. |
For more information on valuation inputs, see Note 2 – Significant Accounting Policies in Notes to Financial Statements.
220
SEI Institutional Managed Trust
The following is a summary of the Fund’s transactions with affiliates for the year ended September 30, 2023 ($ Thousands):
| Security Description | Value 9/30/2022 | Purchases at Cost | Proceeds from Sales | Realized Gain/(Loss) | Change in Unrealized Appreciation/(Depreciation) | Value 9/30/2023 | Income | Capital Gains | ||||||||||||||||||||||||
| SEI Liquidity Fund, LP | $ | 254,770 | $ | 1,329,060 | $ | (1,530,557 | ) | $ | 11 | $ | 55 | $ | 53,339 | $ | 152 | $ | — | |||||||||||||||
| SEI Daily Income Trust, Government Fund, Institutional Class | 113,748 | 2,796,039 | (2,668,397 | ) | — | — | 241,390 | 4,071 | — | |||||||||||||||||||||||
| Totals | $ | 368,518 | $ | 4,125,099 | $ | (4,198,954 | ) | $ | 11 | $ | 55 | $ | 294,729 | $ | 4,223 | $ | — | |||||||||||||||
Amounts designated as “—” are either $0 or have been rounded to $0.
See “Glossary” for abbreviations.
The accompanying notes are an integral part of the financial statements.
SEI Institutional Managed Trust
221
SCHEDULE OF INVESTMENTS
September 30, 2023
High Yield Bond Fund
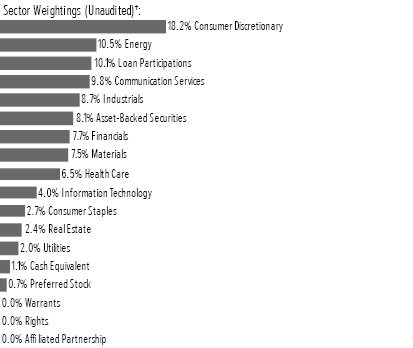
† | Percentages are based on total investments. Total investments do not include derivatives such as options, futures contracts, forward contracts, and swap contracts, if applicable. |
Description | Face Amount | Market Value | ||||||
CORPORATE OBLIGATIONS — 77.5% | ||||||||
Communication Services — 9.5% | ||||||||
Altice France | ||||||||
8.125%, 02/01/2027 (A) | $ | 380 | $ | 337 | ||||
5.500%, 01/15/2028 (A) | 220 | 169 | ||||||
5.500%, 10/15/2029 (A) | 2,542 | 1,828 | ||||||
5.125%, 07/15/2029 (A) | 396 | 282 | ||||||
Altice France Holding | ||||||||
10.500%, 05/15/2027 (A) | 9,324 | 5,815 | ||||||
6.000%, 02/15/2028 (A) | 811 | 401 | ||||||
AMC Networks | ||||||||
5.000%, 04/01/2024 | 837 | 825 | ||||||
4.250%, 02/15/2029 | 1,126 | 691 | ||||||
ANGI Group | ||||||||
3.875%, 08/15/2028 (A) | 2,499 | 1,955 | ||||||
Audacy Capital | ||||||||
6.750%, 03/31/2029 (A)(B)(C) | 3,784 | 71 | ||||||
6.500%, 05/01/2027 (A)(B)(C) | 1,717 | 34 | ||||||
Beasley Mezzanine Holdings | ||||||||
8.625%, 02/01/2026 (A) | 3,570 | 2,291 | ||||||
Belo | ||||||||
7.250%, 09/15/2027 | 250 | 243 | ||||||
C&W Senior Financing Designated Activity | ||||||||
6.875%, 09/15/2027 (A) | 569 | 500 | ||||||
CCO Holdings | ||||||||
5.375%, 06/01/2029 (A) | 1,183 | 1,061 | ||||||
5.125%, 05/01/2027 (A) | 8,761 | 8,163 | ||||||
5.000%, 02/01/2028 (A) | 2,747 | 2,495 | ||||||
4.750%, 03/01/2030 (A) | 1,515 | 1,272 | ||||||
4.750%, 02/01/2032 (A) | 62 | 49 | ||||||
Description | Face Amount | Market Value | ||||||
CORPORATE OBLIGATIONS (continued) | ||||||||
4.500%, 08/15/2030 (A) | $ | 4,355 | $ | 3,575 | ||||
4.500%, 05/01/2032 | 2,270 | 1,782 | ||||||
4.250%, 02/01/2031 (A) | 4,134 | 3,291 | ||||||
4.250%, 01/15/2034 (A) | 275 | 202 | ||||||
Cinemark USA | ||||||||
8.750%, 05/01/2025 (A) | 96 | 96 | ||||||
5.250%, 07/15/2028 (A) | 135 | 120 | ||||||
Clear Channel Outdoor Holdings Inc | ||||||||
7.750%, 04/15/2028 (A) | 290 | 232 | ||||||
7.500%, 06/01/2029 (A) | 529 | 404 | ||||||
5.125%, 08/15/2027 (A) | 689 | 612 | ||||||
Consolidated Communications | ||||||||
6.500%, 10/01/2028 (A) | 2,155 | 1,684 | ||||||
DISH DBS | ||||||||
7.750%, 07/01/2026 | 4,515 | 3,386 | ||||||
7.375%, 07/01/2028 | 3,722 | 2,345 | ||||||
5.875%, 11/15/2024 | 2,967 | 2,762 | ||||||
5.750%, 12/01/2028 (A) | 1,035 | 796 | ||||||
5.250%, 12/01/2026 (A) | 1,945 | 1,653 | ||||||
5.125%, 06/01/2029 | 2,160 | 1,197 | ||||||
DISH Network | ||||||||
11.750%, 11/15/2027 (A) | 6,371 | 6,419 | ||||||
Front Range BidCo | ||||||||
4.000%, 03/01/2027 (A) | 5,657 | 4,197 | ||||||
Frontier Communications Holdings | ||||||||
8.750%, 05/15/2030 (A) | 206 | 196 | ||||||
6.750%, 05/01/2029 (A) | 49 | 38 | ||||||
6.000%, 01/15/2030 (A) | 93 | 68 | ||||||
5.875%, 10/15/2027 (A) | 1,453 | 1,321 | ||||||
5.875%, 11/01/2029 | 102 | 74 | ||||||
5.000%, 05/01/2028 (A) | 680 | 581 | ||||||
Gannett Holdings | ||||||||
6.000%, 11/01/2026 (A) | 158 | 136 | ||||||
Gray Escrow II | ||||||||
5.375%, 11/15/2031 (A) | 3,789 | 2,480 | ||||||
Gray Television | ||||||||
7.000%, 05/15/2027 (A) | 565 | 486 | ||||||
5.875%, 07/15/2026 (A) | 75 | 67 | ||||||
4.750%, 10/15/2030 (A) | 3,773 | 2,500 | ||||||
Hughes Satellite Systems | ||||||||
5.250%, 08/01/2026 | 562 | 505 | ||||||
iHeartCommunications | ||||||||
8.375%, 05/01/2027 | 580 | 416 | ||||||
6.375%, 05/01/2026 | 2,003 | 1,726 | ||||||
5.250%, 08/15/2027 (A) | 295 | 234 | ||||||
Intelsat Jackson Holdings | ||||||||
6.500%, 03/15/2030 (A) | 1,447 | 1,283 | ||||||
Intelsat Jackson Holdings (Escrow Security) | ||||||||
9.750%, 07/15/2025 (A)(B)(D) | 2,202 | – | ||||||
8.500%, 10/15/2024 (A)(B)(D) | 1,695 | – | ||||||
5.500%, 08/01/2023 (B)(D) | 268 | – | ||||||
222
SEI Institutional Managed Trust
Description | Face Amount | Market Value | ||||||
CORPORATE OBLIGATIONS (continued) | ||||||||
Level 3 Financing | ||||||||
10.500%, 05/15/2030 (A) | $ | 1,534 | $ | 1,544 | ||||
4.625%, 09/15/2027 (A) | 3,685 | 2,650 | ||||||
4.250%, 07/01/2028 (A) | 1,618 | 1,008 | ||||||
3.875%, 11/15/2029 (A) | 400 | 369 | ||||||
3.750%, 07/15/2029 (A) | 320 | 179 | ||||||
3.625%, 01/15/2029 (A) | 2,605 | 1,459 | ||||||
Live Nation Entertainment | ||||||||
6.500%, 05/15/2027 (A) | 426 | 420 | ||||||
5.625%, 03/15/2026 (A) | 309 | 297 | ||||||
4.875%, 11/01/2024 (A) | 582 | 572 | ||||||
4.750%, 10/15/2027 (A) | 3,020 | 2,765 | ||||||
Lumen Technologies | ||||||||
5.625%, 04/01/2025 | 274 | 227 | ||||||
5.375%, 06/15/2029 (A) | 263 | 84 | ||||||
5.125%, 12/15/2026 (A) | 1,176 | 641 | ||||||
4.500%, 01/15/2029 (A) | 110 | 34 | ||||||
4.000%, 02/15/2027 (A) | 1,924 | 1,267 | ||||||
News | ||||||||
5.125%, 02/15/2032 (A) | 140 | 123 | ||||||
3.875%, 05/15/2029 (A) | 199 | 171 | ||||||
Nexstar Media | ||||||||
5.625%, 07/15/2027 (A) | 1,100 | 979 | ||||||
4.750%, 11/01/2028 (A) | 2,752 | 2,278 | ||||||
Sable International Finance | ||||||||
5.750%, 09/07/2027 (A) | 854 | 775 | ||||||
Scripps Escrow | ||||||||
5.875%, 07/15/2027 (A) | 190 | 141 | ||||||
Scripps Escrow II | ||||||||
3.875%, 01/15/2029 (A) | 2,577 | 1,938 | ||||||
Sinclair Television Group | ||||||||
5.125%, 02/15/2027 (A) | 215 | 172 | ||||||
4.125%, 12/01/2030 (A) | 100 | 62 | ||||||
Sirius XM Radio | ||||||||
5.500%, 07/01/2029 (A) | 1,034 | 914 | ||||||
5.000%, 08/01/2027 (A) | 1,730 | 1,580 | ||||||
4.125%, 07/01/2030 (A) | 85 | 68 | ||||||
4.000%, 07/15/2028 (A) | 522 | 446 | ||||||
3.125%, 09/01/2026 (A) | 250 | 223 | ||||||
Spanish Broadcasting System | ||||||||
9.750%, 03/01/2026 (A) | 2,645 | 1,769 | ||||||
Stagwell Global | ||||||||
5.625%, 08/15/2029 (A) | 353 | 285 | ||||||
TEGNA | ||||||||
4.625%, 03/15/2028 | 1,955 | 1,691 | ||||||
Telecom Italia Capital | ||||||||
6.000%, 09/30/2034 | 1,406 | 1,172 | ||||||
Telesat Canada | ||||||||
6.500%, 10/15/2027 (A) | 1,482 | 756 | ||||||
5.625%, 12/06/2026 (A) | 3,224 | 2,216 | ||||||
United States Cellular | ||||||||
6.700%, 12/15/2033 | 420 | 408 | ||||||
Description | Face Amount | Market Value | ||||||
CORPORATE OBLIGATIONS (continued) | ||||||||
Urban One | ||||||||
7.375%, 02/01/2028 (A) | $ | 3,070 | $ | 2,633 | ||||
Vmed O2 UK Financing I | ||||||||
4.250%, 01/31/2031 (A) | 1,530 | 1,218 | ||||||
VTR Comunicaciones | ||||||||
5.125%, 01/15/2028 (A) | 1,300 | 731 | ||||||
Windstream Escrow | ||||||||
7.750%, 08/15/2028 (A) | 4,870 | 3,871 | ||||||
WMG Acquisition | ||||||||
3.000%, 02/15/2031 (A) | 1,366 | 1,073 | ||||||
| 116,555 | ||||||||
Consumer Discretionary — 17.6% | ||||||||
1011778 BC ULC | ||||||||
4.375%, 01/15/2028 (A) | 1,360 | 1,226 | ||||||
4.000%, 10/15/2030 (A) | 185 | 153 | ||||||
3.875%, 01/15/2028 (A) | 2,935 | 2,633 | ||||||
Academy | ||||||||
6.000%, 11/15/2027 (A) | 1,120 | 1,059 | ||||||
Acushnet | ||||||||
7.375%, 10/15/2028 (A) | 413 | 415 | ||||||
Adient Global Holdings Ltd | ||||||||
8.250%, 04/15/2031 (A) | 257 | 257 | ||||||
7.000%, 04/15/2028 (A) | 17 | 17 | ||||||
4.875%, 08/15/2026 (A) | 2,395 | 2,259 | ||||||
ADT Security | ||||||||
4.875%, 07/15/2032 (A) | 1,563 | 1,305 | ||||||
4.125%, 08/01/2029 (A) | 276 | 233 | ||||||
Adtalem Global Education | ||||||||
5.500%, 03/01/2028 (A) | 888 | 813 | ||||||
Advance Auto Parts | ||||||||
5.900%, 03/09/2026 | 1,143 | 1,104 | ||||||
Altice Financing | ||||||||
5.750%, 08/15/2029 (A) | 3,019 | 2,474 | ||||||
5.000%, 01/15/2028 (A) | 3,863 | 3,299 | ||||||
American Axle & Manufacturing | ||||||||
6.875%, 07/01/2028 | 488 | 443 | ||||||
6.500%, 04/01/2027 | 305 | 289 | ||||||
6.250%, 03/15/2026 | 83 | 80 | ||||||
5.000%, 10/01/2029 | 112 | 91 | ||||||
Aramark Services | ||||||||
5.000%, 02/01/2028 (A) | 282 | 261 | ||||||
Asbury Automotive Group | ||||||||
4.625%, 11/15/2029 (A) | 1,246 | 1,070 | ||||||
4.500%, 03/01/2028 | 1,661 | 1,487 | ||||||
Ashton Woods USA | ||||||||
6.625%, 01/15/2028 (A) | 2,572 | 2,426 | ||||||
Aston Martin Capital Holdings | ||||||||
10.500%, 11/30/2025 (A) | 1,634 | 1,654 | ||||||
Aventine (Escrow Security) | ||||||||
0.000%, 10/15/2049 (B)(D)(E) | 2,750 | – | ||||||
SEI Institutional Managed Trust
223
SCHEDULE OF INVESTMENTS
September 30, 2023
High Yield Bond Fund (Continued)
Description | Face Amount | Market Value | ||||||
CORPORATE OBLIGATIONS (continued) | ||||||||
Bath & Body Works | ||||||||
7.600%, 07/15/2037 | $ | 370 | $ | 324 | ||||
7.500%, 06/15/2029 | 271 | 268 | ||||||
6.875%, 11/01/2035 | 964 | 861 | ||||||
6.750%, 07/01/2036 | 2,225 | 1,949 | ||||||
6.625%, 10/01/2030 (A) | 1,730 | 1,622 | ||||||
5.250%, 02/01/2028 | 1,719 | 1,591 | ||||||
Boyne USA | ||||||||
4.750%, 05/15/2029 (A) | 168 | 147 | ||||||
Brookfield Residential Properties | ||||||||
5.000%, 06/15/2029 (A) | 135 | 111 | ||||||
4.875%, 02/15/2030 (A) | 1,800 | 1,464 | ||||||
Caesars Entertainment | ||||||||
8.125%, 07/01/2027 (A) | 420 | 422 | ||||||
7.000%, 02/15/2030 (A) | 3,650 | 3,552 | ||||||
6.250%, 07/01/2025 (A) | 2,432 | 2,399 | ||||||
4.625%, 10/15/2029 (A) | 1,781 | 1,508 | ||||||
Carnival | ||||||||
10.500%, 06/01/2030 (A) | 1,431 | 1,474 | ||||||
9.875%, 08/01/2027 (A) | 680 | 710 | ||||||
7.625%, 03/01/2026 (A) | 2,759 | 2,684 | ||||||
7.000%, 08/15/2029 (A) | 102 | 101 | ||||||
6.000%, 05/01/2029 (A) | 2,854 | 2,434 | ||||||
5.750%, 03/01/2027 (A) | 4,706 | 4,260 | ||||||
4.000%, 08/01/2028 (A) | 673 | 583 | ||||||
Carnival Holdings Bermuda | ||||||||
10.375%, 05/01/2028 (A) | 674 | 723 | ||||||
Carvana | ||||||||
14.000%cash/0% PIK, 06/01/2031 (A) | 267 | 209 | ||||||
13.000%cash/0% PIK, 06/01/2030 (A) | 225 | 175 | ||||||
12.000%cash/0% PIK, 12/01/2028 (A) | 1,612 | 1,266 | ||||||
CD&R Smokey Buyer | ||||||||
6.750%, 07/15/2025 (A) | 434 | 418 | ||||||
Cedar Fair | ||||||||
5.375%, 04/15/2027 | 140 | 131 | ||||||
5.250%, 07/15/2029 | 295 | 256 | ||||||
Clarios Global | ||||||||
8.500%, 05/15/2027 (A) | 3,975 | 3,964 | ||||||
6.750%, 05/15/2025 (A) | 576 | 572 | ||||||
6.750%, 05/15/2028 (A) | 198 | 193 | ||||||
6.250%, 05/15/2026 (A) | 486 | 475 | ||||||
CMG Media | ||||||||
8.875%, 12/15/2027 (A) | 4,100 | 3,209 | ||||||
Cooper-Standard Automotive | ||||||||
13.500%cash/0% PIK, 03/31/2027 (A) | 1,543 | 1,583 | ||||||
5.625%cash/0% PIK, 05/15/2027 (A) | 921 | 615 | ||||||
CSC Holdings | ||||||||
11.250%, 05/15/2028 (A) | 1,059 | 1,055 | ||||||
7.500%, 04/01/2028 (A) | 880 | 572 | ||||||
6.500%, 02/01/2029 (A) | 1,625 | 1,346 | ||||||
5.750%, 01/15/2030 (A) | 5,976 | 3,348 | ||||||
5.250%, 06/01/2024 | 1,573 | 1,496 | ||||||
Description | Face Amount | Market Value | ||||||
CORPORATE OBLIGATIONS (continued) | ||||||||
4.625%, 12/01/2030 (A) | $ | 1,370 | $ | 728 | ||||
4.500%, 11/15/2031 (A) | 299 | 212 | ||||||
3.375%, 02/15/2031 (A) | 463 | 316 | ||||||
Dana | ||||||||
5.625%, 06/15/2028 | 320 | 293 | ||||||
Diamond Sports Group | ||||||||
6.625%, 08/15/2027 (A)(B) | 3,243 | 65 | ||||||
5.375%, 08/15/2026 (A)(B) | 6,139 | 123 | ||||||
DirecTV Financing | ||||||||
5.875%, 08/15/2027 (A) | 2,521 | 2,229 | ||||||
Dornoch Debt Merger Sub | ||||||||
6.625%, 10/15/2029 (A) | 2,401 | 1,985 | ||||||
eG Global Finance | ||||||||
8.500%, 10/30/2025 (A) | 490 | 482 | ||||||
6.750%, 02/07/2025 (A) | 3,898 | 3,830 | ||||||
Empire Resorts | ||||||||
7.750%, 11/01/2026 (A) | 3,625 | 2,954 | ||||||
EquipmentShare.com | ||||||||
9.000%, 05/15/2028 (A) | 392 | 377 | ||||||
Fertitta Entertainment | ||||||||
6.750%, 01/15/2030 (A) | 2,159 | 1,760 | ||||||
Fontainebleau Las Vegas Holdings | ||||||||
11.000%, 06/15/2015 (A)(B) | 3,108 | – | ||||||
Ford Motor | ||||||||
4.750%, 01/15/2043 | 2,200 | 1,606 | ||||||
Ford Motor Credit | ||||||||
7.350%, 03/06/2030 | 450 | 456 | ||||||
7.200%, 06/10/2030 | 200 | 201 | ||||||
6.950%, 03/06/2026 | 200 | 200 | ||||||
6.950%, 06/10/2026 | 1,830 | 1,828 | ||||||
6.800%, 05/12/2028 | 3,822 | 3,818 | ||||||
5.125%, 06/16/2025 | 880 | 852 | ||||||
5.113%, 05/03/2029 | 3,825 | 3,501 | ||||||
4.687%, 06/09/2025 | 655 | 629 | ||||||
4.542%, 08/01/2026 | 730 | 685 | ||||||
4.271%, 01/09/2027 | 735 | 679 | ||||||
4.134%, 08/04/2025 | 250 | 237 | ||||||
4.125%, 08/17/2027 | 1,219 | 1,110 | ||||||
4.063%, 11/01/2024 | 1,594 | 1,543 | ||||||
4.000%, 11/13/2030 | 1,647 | 1,376 | ||||||
3.815%, 11/02/2027 | 685 | 610 | ||||||
3.810%, 01/09/2024 | 43 | 43 | ||||||
3.375%, 11/13/2025 | 1,200 | 1,113 | ||||||
2.900%, 02/16/2028 | 2,430 | 2,069 | ||||||
2.900%, 02/10/2029 | 965 | 792 | ||||||
2.700%, 08/10/2026 | 200 | 178 | ||||||
Ford Motor Credit MTN | ||||||||
4.389%, 01/08/2026 | 715 | 675 | ||||||
Gap | ||||||||
3.625%, 10/01/2029 (A) | 158 | 117 | ||||||
GCI | ||||||||
4.750%, 10/15/2028 (A) | 599 | 517 | ||||||
224
SEI Institutional Managed Trust
Description | Face Amount | Market Value | ||||||
CORPORATE OBLIGATIONS (continued) | ||||||||
Goodyear Tire & Rubber | ||||||||
5.250%, 04/30/2031 | $ | 122 | $ | 103 | ||||
5.250%, 07/15/2031 | 304 | 252 | ||||||
5.000%, 05/31/2026 | 573 | 547 | ||||||
5.000%, 07/15/2029 | 322 | 277 | ||||||
Hanesbrands | ||||||||
9.000%, 02/15/2031 (A) | 87 | 83 | ||||||
Hilton Domestic Operating | ||||||||
5.750%, 05/01/2028 (A) | 246 | 238 | ||||||
4.875%, 01/15/2030 | 50 | 46 | ||||||
4.000%, 05/01/2031 (A) | 2,960 | 2,488 | ||||||
3.750%, 05/01/2029 (A) | 2,409 | 2,083 | ||||||
3.625%, 02/15/2032 (A) | 1,566 | 1,262 | ||||||
Hilton Worldwide Finance | ||||||||
4.875%, 04/01/2027 | 2,181 | 2,075 | ||||||
International Game Technology | ||||||||
6.250%, 01/15/2027 (A) | 1,070 | 1,047 | ||||||
4.125%, 04/15/2026 (A) | 1,400 | 1,317 | ||||||
Jacobs Entertainment | ||||||||
6.750%, 02/15/2029 (A) | 2,951 | 2,598 | ||||||
Jaguar Land Rover Automotive | ||||||||
5.500%, 07/15/2029 (A) | 2,350 | 2,009 | ||||||
KFC Holding | ||||||||
4.750%, 06/01/2027 (A) | 2,306 | 2,191 | ||||||
Kohl's | ||||||||
4.625%, 05/01/2031 | 855 | 574 | ||||||
4.250%, 07/17/2025 | 570 | 529 | ||||||
LBM Acquisition | ||||||||
6.250%, 01/15/2029 (A) | 2,884 | 2,365 | ||||||
LCM Investments Holdings II | ||||||||
4.875%, 05/01/2029 (A) | 2,470 | 2,100 | ||||||
LCPR Senior Secured Financing DAC | ||||||||
6.750%, 10/15/2027 (A) | 1,997 | 1,834 | ||||||
Liberty Interactive | ||||||||
8.250%, 02/01/2030 | 4,905 | 1,585 | ||||||
Life Time | ||||||||
5.750%, 01/15/2026 (A) | 1,365 | 1,323 | ||||||
Lions Gate Capital Holdings | ||||||||
5.500%, 04/15/2029 (A) | 1,431 | 943 | ||||||
Lithia Motors | ||||||||
4.375%, 01/15/2031 (A) | 1,041 | 861 | ||||||
3.875%, 06/01/2029 (A) | 341 | 288 | ||||||
MajorDrive Holdings IV | ||||||||
6.375%, 06/01/2029 (A) | 2,315 | 1,905 | ||||||
Marriott Ownership Resorts | ||||||||
4.500%, 06/15/2029 (A) | 65 | 54 | ||||||
Mattamy Group | ||||||||
4.625%, 03/01/2030 (A) | 713 | 607 | ||||||
Mattel | ||||||||
3.375%, 04/01/2026 (A) | 1,570 | 1,452 | ||||||
McGraw-Hill Education | ||||||||
5.750%, 08/01/2028 (A) | 2,165 | 1,868 | ||||||
Description | Face Amount | Market Value | ||||||
CORPORATE OBLIGATIONS (continued) | ||||||||
MGM Resorts International | ||||||||
6.750%, 05/01/2025 | $ | 320 | $ | 318 | ||||
5.750%, 06/15/2025 | 674 | 659 | ||||||
4.750%, 10/15/2028 | 2,891 | 2,547 | ||||||
Michaels | ||||||||
7.875%, 05/01/2029 (A) | 2,240 | 1,462 | ||||||
Midcontinent Communications | ||||||||
5.375%, 08/15/2027 (A) | 472 | 437 | ||||||
Midwest Gaming Borrower | ||||||||
4.875%, 05/01/2029 (A) | 1,227 | 1,045 | ||||||
NCL | ||||||||
8.375%, 02/01/2028 (A) | 61 | 62 | ||||||
5.875%, 03/15/2026 (A) | 890 | 822 | ||||||
5.875%, 02/15/2027 (A) | 1,544 | 1,468 | ||||||
NESCO Holdings II | ||||||||
5.500%, 04/15/2029 (A) | 271 | 238 | ||||||
Newell Brands | ||||||||
6.625%, 09/15/2029 | 70 | 67 | ||||||
6.375%, 09/15/2027 | 200 | 191 | ||||||
6.375%, 04/01/2036 | 70 | 57 | ||||||
5.200%, 04/01/2026 | 410 | 386 | ||||||
Nordstrom | ||||||||
4.375%, 04/01/2030 | 134 | 103 | ||||||
PECF USS Intermediate Holding III | ||||||||
8.000%, 11/15/2029 (A) | 2,340 | 1,269 | ||||||
PetSmart | ||||||||
7.750%, 02/15/2029 (A) | 1,085 | 1,011 | ||||||
4.750%, 02/15/2028 (A) | 1,335 | 1,169 | ||||||
PM General Purchaser | ||||||||
9.500%, 10/01/2028 (A) | 348 | 323 | ||||||
QVC | ||||||||
4.850%, 04/01/2024 | 1,840 | 1,768 | ||||||
4.750%, 02/15/2027 | 835 | 512 | ||||||
4.450%, 02/15/2025 | 1,005 | 879 | ||||||
4.375%, 09/01/2028 | 873 | 458 | ||||||
Radiate Holdco | ||||||||
6.500%, 09/15/2028 (A) | 2,305 | 1,210 | ||||||
4.500%, 09/15/2026 (A) | 3,765 | 2,860 | ||||||
Raptor Acquisition | ||||||||
4.875%, 11/01/2026 (A) | 233 | 218 | ||||||
Royal Caribbean Cruises | ||||||||
11.625%, 08/15/2027 (A) | 2,461 | 2,670 | ||||||
11.500%, 06/01/2025 (A) | 96 | 101 | ||||||
9.250%, 01/15/2029 (A) | 225 | 238 | ||||||
8.250%, 01/15/2029 (A) | 225 | 233 | ||||||
7.250%, 01/15/2030 (A) | 165 | 164 | ||||||
5.500%, 08/31/2026 (A) | 1,431 | 1,351 | ||||||
Service International | ||||||||
7.500%, 04/01/2027 | 640 | 650 | ||||||
4.000%, 05/15/2031 | 14 | 11 | ||||||
3.375%, 08/15/2030 | 61 | 49 | ||||||
SEI Institutional Managed Trust
225
SCHEDULE OF INVESTMENTS
September 30, 2023
High Yield Bond Fund (Continued)
Description | Face Amount | Market Value | ||||||
CORPORATE OBLIGATIONS (continued) | ||||||||
Shea Homes | ||||||||
4.750%, 04/01/2029 | $ | 825 | $ | 716 | ||||
Shutterfly Finance | ||||||||
9.750%, 10/01/2027 (A) | 83 | 83 | ||||||
8.500%cash/0% PIK, 10/01/2027 (A) | 518 | 343 | ||||||
Six Flags Entertainment | ||||||||
7.250%, 05/15/2031 (A) | 933 | 876 | ||||||
5.500%, 04/15/2027 (A) | 90 | 83 | ||||||
Six Flags Theme Parks | ||||||||
7.000%, 07/01/2025 (A) | 82 | 82 | ||||||
Sonic Automotive | ||||||||
4.625%, 11/15/2029 (A) | 244 | 202 | ||||||
Specialty Building Products Holdings | ||||||||
6.375%, 09/30/2026 (A) | 2,628 | 2,457 | ||||||
SRS Distribution | ||||||||
6.125%, 07/01/2029 (A) | 1,154 | 983 | ||||||
6.000%, 12/01/2029 (A) | 1,133 | 951 | ||||||
4.625%, 07/01/2028 (A) | 332 | 287 | ||||||
Staples | ||||||||
10.750%, 04/15/2027 (A) | 580 | 340 | ||||||
7.500%, 04/15/2026 (A) | 2,063 | 1,697 | ||||||
Station Casinos | ||||||||
4.500%, 02/15/2028 (A) | 2,006 | 1,750 | ||||||
StoneMor | ||||||||
8.500%, 05/15/2029 (A) | 2,130 | 1,752 | ||||||
Studio City | ||||||||
7.000%, 02/15/2027 (A) | 475 | 448 | ||||||
Studio City Finance | ||||||||
5.000%, 01/15/2029 (A) | 2,405 | 1,808 | ||||||
Superior Plus | ||||||||
4.500%, 03/15/2029 (A) | 202 | 175 | ||||||
Telenet Finance Luxembourg Notes Sarl | ||||||||
5.500%, 03/01/2028 (A) | 1,200 | 1,080 | ||||||
Tempur Sealy International | ||||||||
4.000%, 04/15/2029 (A) | 530 | 443 | ||||||
3.875%, 10/15/2031 (A) | 1,351 | 1,042 | ||||||
Time Warner Entertainment | ||||||||
8.375%, 07/15/2033 | 1,028 | 1,105 | ||||||
Univision Communications | ||||||||
8.000%, 08/15/2028 (A) | 177 | 172 | ||||||
7.375%, 06/30/2030 (A) | 216 | 198 | ||||||
6.625%, 06/01/2027 (A) | 40 | 37 | ||||||
4.500%, 05/01/2029 (A) | 165 | 134 | ||||||
Vail Resorts | ||||||||
6.250%, 05/15/2025 (A) | 437 | 435 | ||||||
Victoria's Secret | ||||||||
4.625%, 07/15/2029 (A) | 2,659 | 1,928 | ||||||
Viking Cruises | ||||||||
9.125%, 07/15/2031 (A) | 195 | 195 | ||||||
5.875%, 09/15/2027 (A) | 2,030 | 1,853 | ||||||
Virgin Media Finance | ||||||||
5.000%, 07/15/2030 (A) | 493 | 387 | ||||||
Description | Face Amount | Market Value | ||||||
CORPORATE OBLIGATIONS (continued) | ||||||||
Virgin Media Secured Finance | ||||||||
5.500%, 05/15/2029 (A) | $ | 170 | $ | 151 | ||||
4.500%, 08/15/2030 (A) | 480 | 397 | ||||||
Virgin Media Vendor Financing Notes IV DAC | ||||||||
5.000%, 07/15/2028 (A) | 2,212 | 1,909 | ||||||
Vista Outdoor | ||||||||
4.500%, 03/15/2029 (A) | 408 | 341 | ||||||
VTR Comunicaciones | ||||||||
4.375%, 04/15/2029 (A) | 305 | 168 | ||||||
VZ Secured Financing BV | ||||||||
5.000%, 01/15/2032 (A) | 500 | 393 | ||||||
White Capital Buyer | ||||||||
6.875%, 10/15/2028 (A) | 105 | 93 | ||||||
White Capital Parent | ||||||||
8.250%cash/0% PIK, 03/15/2026 (A) | 2,275 | 2,195 | ||||||
Wolverine World Wide | ||||||||
4.000%, 08/15/2029 (A) | 2,762 | 2,047 | ||||||
WW International | ||||||||
4.500%, 04/15/2029 (A) | 1,440 | 1,012 | ||||||
Wynn Las Vegas | ||||||||
5.500%, 03/01/2025 (A) | 730 | 718 | ||||||
Wynn Resorts Finance | ||||||||
5.125%, 10/01/2029 (A) | 384 | 336 | ||||||
Yum! Brands | ||||||||
6.875%, 11/15/2037 | 1,065 | 1,081 | ||||||
5.375%, 04/01/2032 | 95 | 87 | ||||||
3.625%, 03/15/2031 | 2,335 | 1,922 | ||||||
Ziggo Bond BV | ||||||||
6.000%, 01/15/2027 (A) | 363 | 332 | ||||||
| 216,441 | ||||||||
Consumer Staples — 2.7% | ||||||||
Albertsons | ||||||||
5.875%, 02/15/2028 (A) | 125 | 120 | ||||||
4.875%, 02/15/2030 (A) | 470 | 424 | ||||||
4.625%, 01/15/2027 (A) | 1,285 | 1,213 | ||||||
3.500%, 03/15/2029 (A) | 453 | 386 | ||||||
3.250%, 03/15/2026 (A) | 196 | 182 | ||||||
B&G Foods | ||||||||
5.250%, 04/01/2025 | 552 | 542 | ||||||
Central Garden & Pet | ||||||||
5.125%, 02/01/2028 | 350 | 326 | ||||||
4.125%, 10/15/2030 | 242 | 202 | ||||||
4.125%, 04/30/2031 (A) | 168 | 137 | ||||||
Chobani | ||||||||
4.625%, 11/15/2028 (A) | 514 | 453 | ||||||
Coty | ||||||||
6.625%, 07/15/2030 (A) | 511 | 499 | ||||||
5.000%, 04/15/2026 (A) | 1,143 | 1,098 | ||||||
4.750%, 01/15/2029 (A) | 1,945 | 1,754 | ||||||
Edgewell Personal Care | ||||||||
5.500%, 06/01/2028 (A) | 310 | 286 | ||||||
226
SEI Institutional Managed Trust
Description | Face Amount | Market Value | ||||||
CORPORATE OBLIGATIONS (continued) | ||||||||
4.125%, 04/01/2029 (A) | $ | 192 | $ | 163 | ||||
Energizer Holdings | ||||||||
6.500%, 12/31/2027 (A) | 133 | 125 | ||||||
4.750%, 06/15/2028 (A) | 474 | 410 | ||||||
4.375%, 03/31/2029 (A) | 627 | 523 | ||||||
High Ridge Brands Co. (Escrow Security) | ||||||||
9.772%, 03/15/2025 (A)(B) | 445 | – | ||||||
HLF Financing Sarl | ||||||||
4.875%, 06/01/2029 (A) | 2,345 | 1,665 | ||||||
JBS USA LUX | ||||||||
5.500%, 01/15/2030 | 1,655 | 1,545 | ||||||
Lamb Weston Holdings | ||||||||
4.125%, 01/31/2030 (A) | 1,430 | 1,223 | ||||||
LSF9 Atlantis Holdings | ||||||||
7.750%, 02/15/2026 (A) | 3,373 | 3,063 | ||||||
New Albertsons | ||||||||
8.700%, 05/01/2030 | 955 | 1,006 | ||||||
8.000%, 05/01/2031 | 910 | 935 | ||||||
Performance Food Group | ||||||||
6.875%, 05/01/2025 (A) | 50 | 50 | ||||||
5.500%, 10/15/2027 (A) | 360 | 341 | ||||||
4.250%, 08/01/2029 (A) | 465 | 402 | ||||||
Post Holdings | ||||||||
5.750%, 03/01/2027 (A) | 15 | 15 | ||||||
5.625%, 01/15/2028 (A) | 1,444 | 1,365 | ||||||
5.500%, 12/15/2029 (A) | 2,577 | 2,336 | ||||||
4.625%, 04/15/2030 (A) | 83 | 71 | ||||||
Rite Aid | ||||||||
8.000%, 11/15/2026 (A) | 3,047 | 1,793 | ||||||
7.500%, 07/01/2025 (A) | 846 | 499 | ||||||
Sigma Holdco BV | ||||||||
7.875%, 05/15/2026 (A) | 3,082 | 2,583 | ||||||
Spectrum Brands | ||||||||
5.500%, 07/15/2030 (A) | 617 | 559 | ||||||
5.000%, 10/01/2029 (A) | 100 | 91 | ||||||
3.875%, 03/15/2031 (A) | 93 | 75 | ||||||
Triton Water Holdings | ||||||||
6.250%, 04/01/2029 (A) | 3,094 | 2,529 | ||||||
US Foods | ||||||||
6.875%, 09/15/2028 (A) | 1,796 | 1,792 | ||||||
4.625%, 06/01/2030 (A) | 230 | 200 | ||||||
| 32,981 | ||||||||
Energy — 10.2% | ||||||||
Aethon United BR | ||||||||
8.250%, 02/15/2026 (A) | 1,216 | 1,206 | ||||||
Antero Midstream Partners | ||||||||
7.875%, 05/15/2026 (A) | 323 | 326 | ||||||
5.750%, 03/01/2027 (A) | 50 | 48 | ||||||
5.750%, 01/15/2028 (A) | 295 | 278 | ||||||
5.375%, 06/15/2029 (A) | 246 | 225 | ||||||
Description | Face Amount | Market Value | ||||||
CORPORATE OBLIGATIONS (continued) | ||||||||
Antero Resources | ||||||||
8.375%, 07/15/2026 (A) | $ | 260 | $ | 268 | ||||
7.625%, 02/01/2029 (A) | 742 | 752 | ||||||
5.375%, 03/01/2030 (A) | 1,030 | 949 | ||||||
Apache | ||||||||
5.100%, 09/01/2040 | 2,111 | 1,677 | ||||||
Archrock Partners | ||||||||
6.875%, 04/01/2027 (A) | 275 | 266 | ||||||
6.250%, 04/01/2028 (A) | 1,462 | 1,361 | ||||||
Ascent Resources Utica Holdings | ||||||||
8.250%, 12/31/2028 (A) | 1,623 | 1,606 | ||||||
7.000%, 11/01/2026 (A) | 1,238 | 1,209 | ||||||
5.875%, 06/30/2029 (A) | 1,250 | 1,124 | ||||||
Baytex Energy | ||||||||
8.750%, 04/01/2027 (A) | 325 | 330 | ||||||
8.500%, 04/30/2030 (A) | 315 | 319 | ||||||
Blue Racer Midstream | ||||||||
7.625%, 12/15/2025 (A) | 2,721 | 2,731 | ||||||
Buckeye Partners | ||||||||
4.500%, 03/01/2028 (A) | 400 | 351 | ||||||
4.125%, 03/01/2025 (A) | 230 | 218 | ||||||
4.125%, 12/01/2027 | 135 | 119 | ||||||
California Resources | ||||||||
7.125%, 02/01/2026 (A) | 374 | 376 | ||||||
Callon Petroleum | ||||||||
8.000%, 08/01/2028 (A) | 225 | 225 | ||||||
7.500%, 06/15/2030 (A) | 1,035 | 1,004 | ||||||
Cheniere Energy Partners | ||||||||
4.000%, 03/01/2031 | 389 | 332 | ||||||
3.250%, 01/31/2032 | 260 | 207 | ||||||
Chesapeake Energy | ||||||||
7.500%, 10/01/2026 (B)(D) | 2,515 | 47 | ||||||
7.000%, 10/01/2024 (B)(D) | 1,135 | 23 | ||||||
Chesapeake Energy Corp | ||||||||
6.750%, 04/15/2029 (A) | 2,585 | 2,530 | ||||||
Chord Energy Corp | ||||||||
6.375%, 06/01/2026 (A) | 274 | 269 | ||||||
CITGO Petroleum | ||||||||
6.375%, 06/15/2026 (A) | 1,025 | 1,012 | ||||||
Civitas Resources | ||||||||
8.750%, 07/01/2031 (A) | 1,959 | 2,001 | ||||||
8.375%, 07/01/2028 (A) | 314 | 320 | ||||||
CNX Midstream Partners | ||||||||
4.750%, 04/15/2030 (A) | 54 | 45 | ||||||
CNX Resources | ||||||||
7.375%, 01/15/2031 (A) | 147 | 144 | ||||||
Comstock Resources | ||||||||
6.750%, 03/01/2029 (A) | 4,639 | 4,267 | ||||||
5.875%, 01/15/2030 (A) | 157 | 136 | ||||||
Crescent Energy Finance | ||||||||
9.250%, 02/15/2028 (A) | 839 | 856 | ||||||
7.250%, 05/01/2026 (A) | 815 | 799 | ||||||
SEI Institutional Managed Trust
227
SCHEDULE OF INVESTMENTS
September 30, 2023
High Yield Bond Fund (Continued)
Description | Face Amount | Market Value | ||||||
CORPORATE OBLIGATIONS (continued) | ||||||||
Crestwood Midstream Partners | ||||||||
8.000%, 04/01/2029 (A) | $ | 698 | $ | 716 | ||||
7.375%, 02/01/2031 (A) | 97 | 99 | ||||||
Delek Logistics Partners | ||||||||
6.750%, 05/15/2025 | 811 | 795 | ||||||
Diamond Foreign Asset | ||||||||
8.500%, 10/01/2030 (A) | 138 | 138 | ||||||
DT Midstream | ||||||||
4.375%, 06/15/2031 (A) | 103 | 87 | ||||||
4.125%, 06/15/2029 (A) | 205 | 177 | ||||||
Earthstone Energy Holdings | ||||||||
8.000%, 04/15/2027 (A) | 1,040 | 1,064 | ||||||
Encino Acquisition Partners Holdings | ||||||||
8.500%, 05/01/2028 (A) | 2,347 | 2,254 | ||||||
Energy Transfer | ||||||||
5.500%, 06/01/2027 | 1,564 | 1,538 | ||||||
EnLink Midstream | ||||||||
6.500%, 09/01/2030 (A) | 93 | 90 | ||||||
5.375%, 06/01/2029 | 2,996 | 2,772 | ||||||
EnLink Midstream Partners | ||||||||
5.600%, 04/01/2044 | 955 | 793 | ||||||
Enviva Partners | ||||||||
6.500%, 01/15/2026 (A) | 2,475 | 2,017 | ||||||
EQM Midstream Partners | ||||||||
7.500%, 06/01/2027 (A) | 2,174 | 2,178 | ||||||
7.500%, 06/01/2030 (A) | 134 | 135 | ||||||
6.500%, 07/01/2027 (A) | 712 | 695 | ||||||
6.500%, 07/15/2048 | 2,443 | 2,148 | ||||||
6.000%, 07/01/2025 (A) | 67 | 66 | ||||||
4.750%, 01/15/2031 (A) | 1,104 | 950 | ||||||
4.500%, 01/15/2029 (A) | 1,629 | 1,450 | ||||||
Genesis Energy | ||||||||
8.875%, 04/15/2030 | 357 | 349 | ||||||
8.000%, 01/15/2027 | 752 | 725 | ||||||
7.750%, 02/01/2028 | 1,508 | 1,429 | ||||||
6.500%, 10/01/2025 | 20 | 20 | ||||||
Greenfire Resources | ||||||||
12.000%, 10/01/2028 (A) | 1,415 | 1,392 | ||||||
Gulfport Energy Corp | ||||||||
8.000%, 05/17/2026 (A) | 1,025 | 1,027 | ||||||
Gulfport Energy Operating (Escrow Security) | ||||||||
6.375%, 05/15/2025 (D) | 183 | – | ||||||
6.375%, 01/15/2026 (B) | 585 | 1 | ||||||
6.000%, 10/15/2024 (B) | 215 | – | ||||||
Harvest Midstream I | ||||||||
7.500%, 09/01/2028 (A) | 1,000 | 967 | ||||||
Hess Midstream Operations | ||||||||
5.625%, 02/15/2026 (A) | 330 | 319 | ||||||
5.500%, 10/15/2030 (A) | 415 | 377 | ||||||
4.250%, 02/15/2030 (A) | 1,777 | 1,498 | ||||||
Hilcorp Energy I | ||||||||
6.250%, 11/01/2028 (A) | 10 | 9 | ||||||
Description | Face Amount | Market Value | ||||||
CORPORATE OBLIGATIONS (continued) | ||||||||
6.250%, 04/15/2032 (A) | $ | 85 | $ | 76 | ||||
6.000%, 04/15/2030 (A) | 101 | 91 | ||||||
Holly Energy Partners | ||||||||
6.375%, 04/15/2027 (A) | 160 | 157 | ||||||
Howard Midstream Energy Partners | ||||||||
8.875%, 07/15/2028 (A) | 210 | 212 | ||||||
6.750%, 01/15/2027 (A) | 3,055 | 2,902 | ||||||
ITT Holdings | ||||||||
6.500%, 08/01/2029 (A) | 2,778 | 2,355 | ||||||
Kinetik Holdings | ||||||||
5.875%, 06/15/2030 (A) | 129 | 121 | ||||||
Moss Creek Resources Holdings | ||||||||
10.500%, 05/15/2027 (A) | 36 | 36 | ||||||
7.500%, 01/15/2026 (A) | 2,964 | 2,871 | ||||||
Nabors Industries | ||||||||
7.250%, 01/15/2026 (A) | 93 | 90 | ||||||
5.750%, 02/01/2025 | 325 | 318 | ||||||
New Fortress Energy | ||||||||
6.750%, 09/15/2025 (A) | 1,403 | 1,339 | ||||||
6.500%, 09/30/2026 (A) | 2,246 | 2,068 | ||||||
NGL Energy Operating | ||||||||
7.500%, 02/01/2026 (A) | 2,146 | 2,122 | ||||||
NGL Energy Partners | ||||||||
6.125%, 03/01/2025 | 1,540 | 1,512 | ||||||
Northern Oil and Gas | ||||||||
8.750%, 06/15/2031 (A) | 565 | 569 | ||||||
8.125%, 03/01/2028 (A) | 1,749 | 1,747 | ||||||
Northriver Midstream Finance | ||||||||
5.625%, 02/15/2026 (A) | 1,240 | 1,182 | ||||||
NuStar Logistics | ||||||||
6.375%, 10/01/2030 | 685 | 649 | ||||||
6.000%, 06/01/2026 | 255 | 247 | ||||||
5.750%, 10/01/2025 | 114 | 111 | ||||||
5.625%, 04/28/2027 | 115 | 110 | ||||||
Occidental Petroleum | ||||||||
8.875%, 07/15/2030 | 338 | 380 | ||||||
6.625%, 09/01/2030 | 150 | 152 | ||||||
PBF Holding | ||||||||
7.875%, 09/15/2030 (A) | 1,755 | 1,748 | ||||||
Precision Drilling | ||||||||
7.125%, 01/15/2026 (A) | 340 | 336 | ||||||
6.875%, 01/15/2029 (A) | 61 | 58 | ||||||
Range Resources | ||||||||
8.250%, 01/15/2029 | 407 | 417 | ||||||
4.875%, 05/15/2025 | 285 | 277 | ||||||
Rockcliff Energy II | ||||||||
5.500%, 10/15/2029 (A) | 2,497 | 2,247 | ||||||
Rockies Express Pipeline | ||||||||
4.800%, 05/15/2030 (A) | 1,239 | 1,069 | ||||||
Seventy Seven Operating (Escrow Security) | ||||||||
6.625%, 01/15/2020 (B)(D) | 1,869 | – | ||||||
228
SEI Institutional Managed Trust
Description | Face Amount | Market Value | ||||||
CORPORATE OBLIGATIONS (continued) | ||||||||
Shelf Drilling Holdings | ||||||||
9.625%, 04/15/2029 (A) | $ | 1,210 | $ | 1,197 | ||||
Sitio Royalties Operating Partnership | ||||||||
7.875%, 11/01/2028 (A) | 2,015 | 2,020 | ||||||
SM Energy | ||||||||
6.750%, 09/15/2026 | 514 | 505 | ||||||
6.625%, 01/15/2027 | 73 | 71 | ||||||
6.500%, 07/15/2028 | 113 | 108 | ||||||
5.625%, 06/01/2025 | 295 | 289 | ||||||
Southwestern Energy | ||||||||
5.375%, 02/01/2029 | 32 | 30 | ||||||
5.375%, 03/15/2030 | 289 | 263 | ||||||
4.750%, 02/01/2032 | 63 | 54 | ||||||
Strathcona Resources | ||||||||
6.875%, 08/01/2026 (A) | 2,255 | 2,125 | ||||||
Summit Midstream Holdings | ||||||||
9.000%, 10/15/2026 (A)(F) | 159 | 152 | ||||||
5.750%, 04/15/2025 | 2,095 | 1,959 | ||||||
Sunoco | ||||||||
5.875%, 03/15/2028 | 1,585 | 1,521 | ||||||
4.500%, 05/15/2029 | 1,248 | 1,095 | ||||||
4.500%, 04/30/2030 | 1,347 | 1,166 | ||||||
Tallgrass Energy Partners | ||||||||
7.500%, 10/01/2025 (A) | 386 | 385 | ||||||
6.000%, 03/01/2027 (A) | 270 | 254 | ||||||
6.000%, 12/31/2030 (A) | 4,335 | 3,826 | ||||||
6.000%, 09/01/2031 (A) | 722 | 629 | ||||||
5.500%, 01/15/2028 (A) | 70 | 64 | ||||||
Targa Resources Partners | ||||||||
6.875%, 01/15/2029 | 192 | 192 | ||||||
6.500%, 07/15/2027 | 523 | 527 | ||||||
4.875%, 02/01/2031 | 250 | 224 | ||||||
4.000%, 01/15/2032 | 167 | 141 | ||||||
TerraForm Power Operating | ||||||||
5.000%, 01/31/2028 (A) | 3,107 | 2,820 | ||||||
4.750%, 01/15/2030 (A) | 375 | 320 | ||||||
Transocean | ||||||||
11.500%, 01/30/2027 (A) | 915 | 960 | ||||||
8.750%, 02/15/2030 (A) | 83 | 85 | ||||||
8.000%, 02/01/2027 (A) | 1,780 | 1,713 | ||||||
7.500%, 04/15/2031 | 510 | 442 | ||||||
7.250%, 11/01/2025 (A) | 3,080 | 3,026 | ||||||
6.800%, 03/15/2038 | 1,927 | 1,466 | ||||||
Transocean Titan Financing | ||||||||
8.375%, 02/01/2028 (A) | 58 | 59 | ||||||
Valaris | ||||||||
8.375%, 04/30/2030 (A) | 124 | 124 | ||||||
Venture Global Calcasieu Pass | ||||||||
4.125%, 08/15/2031 (A) | 1,205 | 989 | ||||||
3.875%, 08/15/2029 (A) | 255 | 214 | ||||||
3.875%, 11/01/2033 (A) | 435 | 338 | ||||||
Description | Face Amount | Market Value | ||||||
CORPORATE OBLIGATIONS (continued) | ||||||||
Venture Global LNG | ||||||||
8.125%, 06/01/2028 (A) | $ | 4,316 | $ | 4,273 | ||||
Vital Energy | ||||||||
10.125%, 01/15/2028 | 100 | 102 | ||||||
9.750%, 10/15/2030 | 90 | 92 | ||||||
Weatherford International | ||||||||
8.625%, 04/30/2030 (A) | 1,657 | 1,670 | ||||||
Western Midstream Operating | ||||||||
5.250%, 02/01/2050 | 2,924 | 2,278 | ||||||
| 125,568 | ||||||||
Financials — 7.7% | ||||||||
Acrisure | ||||||||
10.125%, 08/01/2026 (A) | 1,211 | 1,242 | ||||||
7.000%, 11/15/2025 (A) | 854 | 829 | ||||||
4.250%, 02/15/2029 (A) | 807 | 678 | ||||||
AG Issuer | ||||||||
6.250%, 03/01/2028 (A) | 1,208 | 1,128 | ||||||
Alliant Holdings Intermediate | ||||||||
6.750%, 10/15/2027 (A) | 1,505 | 1,400 | ||||||
Armor Holdco | ||||||||
8.500%, 11/15/2029 (A) | 1,845 | 1,606 | ||||||
AssuredPartners | ||||||||
5.625%, 01/15/2029 (A) | 2,520 | 2,182 | ||||||
Blackstone Mortgage Trust | ||||||||
3.750%, 01/15/2027 (A) | 984 | 827 | ||||||
Blackstone Private Credit Fund | ||||||||
2.625%, 12/15/2026 | 2,248 | 1,935 | ||||||
Block | ||||||||
3.500%, 06/01/2031 | 296 | 233 | ||||||
2.750%, 06/01/2026 | 135 | 121 | ||||||
Blue Owl Capital | ||||||||
3.400%, 07/15/2026 | 1,587 | 1,423 | ||||||
Bread Financial Holdings | ||||||||
4.750%, 12/15/2024 (A) | 840 | 814 | ||||||
BroadStreet Partners | ||||||||
5.875%, 04/15/2029 (A) | 2,520 | 2,223 | ||||||
Brookfield Property REIT | ||||||||
4.500%, 04/01/2027 (A) | 5,029 | 4,191 | ||||||
Citigroup | ||||||||
3.875%, H15T5Y + 3.417%(G)(H) | 854 | 729 | ||||||
Coinbase Global | ||||||||
3.625%, 10/01/2031 (A) | 80 | 53 | ||||||
3.375%, 10/01/2028 (A) | 1,498 | 1,079 | ||||||
Comerica Bank | ||||||||
2.500%, 07/23/2024 | 854 | 817 | ||||||
CPI CG | ||||||||
8.625%, 03/15/2026 (A) | 1,328 | 1,308 | ||||||
Finance of America Funding | ||||||||
7.875%, 11/15/2025 (A) | 4,607 | 3,799 | ||||||
FirstCash | ||||||||
5.625%, 01/01/2030 (A) | 2,135 | 1,921 | ||||||
SEI Institutional Managed Trust
229
SCHEDULE OF INVESTMENTS
September 30, 2023
High Yield Bond Fund (Continued)
Description | Face Amount | Market Value | ||||||
CORPORATE OBLIGATIONS (continued) | ||||||||
Freedom Mortgage | ||||||||
12.000%, 10/01/2028 (A) | $ | 575 | $ | 585 | ||||
7.625%, 05/01/2026 (A) | 1,235 | 1,151 | ||||||
6.625%, 01/15/2027 (A) | 355 | 312 | ||||||
GTCR W-2 Merger Sub | ||||||||
7.500%, 01/15/2031 (A) | 1,146 | 1,148 | ||||||
HAT Holdings I | ||||||||
6.000%, 04/15/2025 (A) | 957 | 931 | ||||||
3.750%, 09/15/2030 (A) | 910 | 696 | ||||||
3.375%, 06/15/2026 (A) | 577 | 513 | ||||||
Hunt | ||||||||
5.250%, 04/15/2029 (A) | 953 | 748 | ||||||
JPMorgan Chase | ||||||||
5.000%, TSFR3M + 3.380%(G)(H) | 856 | 827 | ||||||
Ladder Capital Finance Holdings LLLP | ||||||||
5.250%, 10/01/2025 (A) | 857 | 825 | ||||||
4.750%, 06/15/2029 (A) | 1,225 | 990 | ||||||
4.250%, 02/01/2027 (A) | 2,653 | 2,320 | ||||||
LD Holdings Group | ||||||||
6.500%, 11/01/2025 (A) | 2,430 | 2,018 | ||||||
6.125%, 04/01/2028 (A) | 2,689 | 1,694 | ||||||
LPL Holdings | ||||||||
4.625%, 11/15/2027 (A) | 1,568 | 1,449 | ||||||
4.375%, 05/15/2031 (A) | 1,267 | 1,084 | ||||||
4.000%, 03/15/2029 (A) | 130 | 113 | ||||||
Midcap Financial Issuer Trust | ||||||||
6.500%, 05/01/2028 (A) | 2,050 | 1,770 | ||||||
5.625%, 01/15/2030 (A) | 1,451 | 1,125 | ||||||
MPH Acquisition Holdings | ||||||||
5.750%, 11/01/2028 (A) | 414 | 311 | ||||||
5.500%, 09/01/2028 (A) | 271 | 230 | ||||||
MSCI | ||||||||
4.000%, 11/15/2029 (A) | 1,902 | 1,670 | ||||||
Nationstar Mortgage Holdings | ||||||||
6.000%, 01/15/2027 (A) | 60 | 57 | ||||||
5.750%, 11/15/2031 (A) | 270 | 223 | ||||||
5.500%, 08/15/2028 (A) | 2,341 | 2,065 | ||||||
5.125%, 12/15/2030 (A) | 138 | 112 | ||||||
5.000%, 02/01/2026 (A) | 853 | 797 | ||||||
Navient | ||||||||
9.375%, 07/25/2030 | 1,420 | 1,400 | ||||||
NFP | ||||||||
6.875%, 08/15/2028 (A) | 2,345 | 2,009 | ||||||
OneMain Finance | ||||||||
9.000%, 01/15/2029 | 404 | 402 | ||||||
7.125%, 03/15/2026 | 2,326 | 2,278 | ||||||
6.625%, 01/15/2028 | 262 | 242 | ||||||
5.375%, 11/15/2029 | 1,050 | 879 | ||||||
4.000%, 09/15/2030 | 1,279 | 960 | ||||||
3.875%, 09/15/2028 | 253 | 203 | ||||||
3.500%, 01/15/2027 | 440 | 377 | ||||||
Description | Face Amount | Market Value | ||||||
CORPORATE OBLIGATIONS (continued) | ||||||||
Osaic Holdings | ||||||||
10.750%, 08/01/2027 (A) | $ | 2,350 | $ | 2,364 | ||||
Paysafe Finance | ||||||||
4.000%, 06/15/2029 (A) | 540 | 453 | ||||||
PennyMac Financial Services | ||||||||
5.750%, 09/15/2031 (A) | 425 | 348 | ||||||
5.375%, 10/15/2025 (A) | 561 | 533 | ||||||
4.250%, 02/15/2029 (A) | 4,968 | 4,020 | ||||||
PRA Group | ||||||||
5.000%, 10/01/2029 (A) | 1,882 | 1,429 | ||||||
Rithm Capital | ||||||||
6.250%, 10/15/2025 (A) | 1,832 | 1,738 | ||||||
Rocket Mortgage | ||||||||
4.000%, 10/15/2033 (A) | 2,302 | 1,738 | ||||||
3.625%, 03/01/2029 (A) | 1,987 | 1,643 | ||||||
2.875%, 10/15/2026 (A) | 918 | 809 | ||||||
Sabre GLBL | ||||||||
11.250%, 12/15/2027 (A) | 2,940 | 2,698 | ||||||
Starwood Property Trust | ||||||||
3.625%, 07/15/2026 (A) | 815 | 723 | ||||||
United Wholesale Mortgage | ||||||||
5.750%, 06/15/2027 (A) | 1,374 | 1,243 | ||||||
5.500%, 11/15/2025 (A) | 1,788 | 1,701 | ||||||
5.500%, 04/15/2029 (A) | 142 | 120 | ||||||
VistaJet Malta Finance | ||||||||
6.375%, 02/01/2030 (A) | 8,383 | 6,475 | ||||||
WeWork | ||||||||
15.000%cash/0% PIK, 08/15/2027 (A)(B) | 1,853 | 903 | ||||||
11.000%cash/0% PIK, 08/15/2027 (A)(B) | 2,325 | 233 | ||||||
| 94,223 | ||||||||
Health Care — 6.4% | ||||||||
180 Medical Inc | ||||||||
3.875%, 10/15/2029 (A) | 200 | 169 | ||||||
Acadia Healthcare | ||||||||
5.500%, 07/01/2028 (A) | 441 | 410 | ||||||
5.000%, 04/15/2029 (A) | 610 | 549 | ||||||
AHP Health Partners | ||||||||
5.750%, 07/15/2029 (A) | 251 | 211 | ||||||
Air Methods | ||||||||
8.000%, 05/15/2025 (A) | 4,269 | 21 | ||||||
Akumin | ||||||||
7.000%, 11/01/2025 (A)(C) | 3,955 | 2,966 | ||||||
Akumin Escrow | ||||||||
7.500%, 08/01/2028 (A)(C) | 1,230 | 816 | ||||||
AthenaHealth Group | ||||||||
6.500%, 02/15/2030 (A) | 175 | 146 | ||||||
Avantor Funding | ||||||||
4.625%, 07/15/2028 (A) | 549 | 501 | ||||||
3.875%, 11/01/2029 (A) | 2,166 | 1,851 | ||||||
230
SEI Institutional Managed Trust
Description | Face Amount | Market Value | ||||||
CORPORATE OBLIGATIONS (continued) | ||||||||
Bausch & Lomb Escrow | ||||||||
8.375%, 10/01/2028 (A) | $ | 855 | $ | 858 | ||||
Bausch Health | ||||||||
14.000%, 10/15/2030 (A) | 536 | 316 | ||||||
11.000%, 09/30/2028 (A) | 1,607 | 1,090 | ||||||
9.000%, 12/15/2025 (A) | 2,355 | 2,142 | ||||||
6.125%, 02/01/2027 (A) | 859 | 534 | ||||||
5.750%, 08/15/2027 (A) | 220 | 131 | ||||||
5.500%, 11/01/2025 (A) | 1,545 | 1,368 | ||||||
5.250%, 01/30/2030 (A) | 2,780 | 1,044 | ||||||
5.250%, 02/15/2031 (A) | 193 | 74 | ||||||
5.000%, 01/30/2028 (A) | 215 | 88 | ||||||
5.000%, 02/15/2029 (A) | 445 | 169 | ||||||
4.875%, 06/01/2028 (A) | 910 | 518 | ||||||
Bausch Health Americas | ||||||||
9.250%, 04/01/2026 (A) | 390 | 353 | ||||||
8.500%, 01/31/2027 (A) | 444 | 225 | ||||||
Centene | ||||||||
4.625%, 12/15/2029 | 832 | 749 | ||||||
Charles River Laboratories International | ||||||||
4.000%, 03/15/2031 (A) | 1,015 | 859 | ||||||
3.750%, 03/15/2029 (A) | 385 | 330 | ||||||
CHS | ||||||||
8.000%, 03/15/2026 (A) | 555 | 529 | ||||||
6.875%, 04/15/2029 (A) | 1,200 | 637 | ||||||
6.125%, 04/01/2030 (A) | 214 | 109 | ||||||
6.000%, 01/15/2029 (A) | 255 | 206 | ||||||
5.625%, 03/15/2027 (A) | 2,856 | 2,450 | ||||||
5.250%, 05/15/2030 (A) | 1,082 | 822 | ||||||
4.750%, 02/15/2031 (A) | 1,671 | 1,183 | ||||||
DaVita | ||||||||
4.625%, 06/01/2030 (A) | 525 | 431 | ||||||
3.750%, 02/15/2031 (A) | 588 | 447 | ||||||
Embecta | ||||||||
6.750%, 02/15/2030 (A) | 335 | 274 | ||||||
5.000%, 02/15/2030 (A) | 2,110 | 1,646 | ||||||
Emergent BioSolutions | ||||||||
3.875%, 08/15/2028 (A) | 307 | 128 | ||||||
Encompass Health | ||||||||
4.750%, 02/01/2030 | 1,516 | 1,341 | ||||||
4.625%, 04/01/2031 | 450 | 381 | ||||||
4.500%, 02/01/2028 | 430 | 392 | ||||||
Endo DAC | ||||||||
9.500%, 07/31/2027 (A)(B) | 1,406 | 99 | ||||||
6.000%, 06/30/2028 (A)(B) | 1,302 | 91 | ||||||
Endo Luxembourg Finance I Sarl | ||||||||
6.125%, 04/01/2029 (A)(B) | 1,485 | 1,051 | ||||||
Envision Healthcare | ||||||||
8.750%, 10/15/2026 (A)(B) | 1,825 | 89 | ||||||
Global Medical Response | ||||||||
6.500%, 10/01/2025 (A) | 4,238 | 2,871 | ||||||
Description | Face Amount | Market Value | ||||||
CORPORATE OBLIGATIONS (continued) | ||||||||
Grifols | ||||||||
4.750%, 10/15/2028 (A) | $ | 1,722 | $ | 1,468 | ||||
HCA | ||||||||
3.500%, 09/01/2030 | 1,676 | 1,418 | ||||||
Heartland Dental | ||||||||
10.500%, 04/30/2028 (A) | 1,565 | 1,575 | ||||||
Hologic | ||||||||
3.250%, 02/15/2029 (A) | 263 | 222 | ||||||
IQVIA | ||||||||
5.000%, 10/15/2026 (A) | 805 | 770 | ||||||
5.000%, 05/15/2027 (A) | 2,012 | 1,896 | ||||||
Legacy LifePoint Health | ||||||||
4.375%, 02/15/2027 (A) | 135 | 116 | ||||||
LifePoint Health | ||||||||
5.375%, 01/15/2029 (A) | 1,333 | 931 | ||||||
Mallinckrodt International Finance | ||||||||
11.500%, 12/15/2028 (A)(B) | 575 | 511 | ||||||
10.000%, 06/15/2029 (A)(B) | 236 | 17 | ||||||
Medline Borrower | ||||||||
5.250%, 10/01/2029 (A) | 1,170 | 1,012 | ||||||
3.875%, 04/01/2029 (A) | 3,479 | 2,941 | ||||||
Molina Healthcare | ||||||||
4.375%, 06/15/2028 (A) | 2,416 | 2,165 | ||||||
3.875%, 11/15/2030 (A) | 1,825 | 1,510 | ||||||
Monitronics International | ||||||||
9.125%, 04/01/2020 (B)(D) | 3,385 | – | ||||||
Option Care Health | ||||||||
4.375%, 10/31/2029 (A) | 1,104 | 954 | ||||||
Organon | ||||||||
5.125%, 04/30/2031 (A) | 1,403 | 1,124 | ||||||
4.125%, 04/30/2028 (A) | 781 | 679 | ||||||
Owens & Minor | ||||||||
6.625%, 04/01/2030 (A) | 270 | 239 | ||||||
4.500%, 03/31/2029 (A) | 307 | 253 | ||||||
Par Pharmaceutical | ||||||||
7.500%, 04/01/2027 (A)(B) | 1,373 | 975 | ||||||
Pediatrix Medical Group | ||||||||
5.375%, 02/15/2030 (A) | 1,775 | 1,563 | ||||||
Prime Security Services Borrower | ||||||||
3.375%, 08/31/2027 (A) | 684 | 599 | ||||||
Radiology Partners | ||||||||
9.250%, 02/01/2028 (A) | 3,033 | 1,198 | ||||||
RegionalCare Hospital Partners Holdings | ||||||||
9.750%, 12/01/2026 (A) | 567 | 549 | ||||||
RP Escrow Issuer | ||||||||
5.250%, 12/15/2025 (A) | 8,711 | 6,319 | ||||||
Tenet Healthcare | ||||||||
6.750%, 05/15/2031 (A) | 752 | 725 | ||||||
6.250%, 02/01/2027 | 447 | 432 | ||||||
6.125%, 10/01/2028 | 3,888 | 3,650 | ||||||
6.125%, 06/15/2030 | 1,976 | 1,853 | ||||||
5.125%, 11/01/2027 | 673 | 626 | ||||||
SEI Institutional Managed Trust
231
SCHEDULE OF INVESTMENTS
September 30, 2023
High Yield Bond Fund (Continued)
Description | Face Amount | Market Value | ||||||
CORPORATE OBLIGATIONS (continued) | ||||||||
4.875%, 01/01/2026 | $ | 3,531 | $ | 3,383 | ||||
4.625%, 06/15/2028 | 2,434 | 2,191 | ||||||
4.375%, 01/15/2030 | 800 | 688 | ||||||
4.250%, 06/01/2029 | 51 | 44 | ||||||
| 78,261 | ||||||||
Industrials — 8.2% | ||||||||
ACCO Brands | ||||||||
4.250%, 03/15/2029 (A) | 545 | 456 | ||||||
Allegiant Travel | ||||||||
7.250%, 08/15/2027 (A) | 858 | 808 | ||||||
Allied Universal Holdco | ||||||||
6.625%, 07/15/2026 (A) | 899 | 852 | ||||||
4.625%, 06/01/2028 (A) | 400 | 333 | ||||||
Allison Transmission | ||||||||
5.875%, 06/01/2029 (A) | 210 | 198 | ||||||
4.750%, 10/01/2027 (A) | 1,546 | 1,427 | ||||||
3.750%, 01/30/2031 (A) | 250 | 202 | ||||||
American Airlines | ||||||||
5.750%, 04/20/2029 (A) | 4,916 | 4,572 | ||||||
5.500%, 04/20/2026 (A) | 1,358 | 1,326 | ||||||
American Builders & Contractors Supply | ||||||||
4.000%, 01/15/2028 (A) | 1,046 | 927 | ||||||
APi Group DE | ||||||||
4.750%, 10/15/2029 (A) | 135 | 118 | ||||||
4.125%, 07/15/2029 (A) | 214 | 180 | ||||||
Artera Services | ||||||||
9.033%, 12/04/2025 (A) | 1,408 | 1,299 | ||||||
Avianca Midco 2 | ||||||||
9.000%, 12/01/2028 (A) | 1,763 | 1,498 | ||||||
Avis Budget Car Rental | ||||||||
5.750%, 07/15/2027 (A) | 1,135 | 1,073 | ||||||
5.375%, 03/01/2029 (A) | 558 | 496 | ||||||
4.750%, 04/01/2028 (A) | 60 | 53 | ||||||
Beacon Roofing Supply | ||||||||
4.500%, 11/15/2026 (A) | 1,350 | 1,260 | ||||||
Bombardier | ||||||||
7.875%, 04/15/2027 (A) | 2,011 | 1,962 | ||||||
7.500%, 03/15/2025 (A) | 175 | 174 | ||||||
7.500%, 02/01/2029 (A) | 853 | 810 | ||||||
Builders FirstSource | ||||||||
6.375%, 06/15/2032 (A) | 241 | 227 | ||||||
4.250%, 02/01/2032 (A) | 203 | 166 | ||||||
BWX Technologies | ||||||||
4.125%, 06/30/2028 (A) | 762 | 674 | ||||||
4.125%, 04/15/2029 (A) | 969 | 848 | ||||||
Camelot Return Merger Sub | ||||||||
8.750%, 08/01/2028 (A) | 1,750 | 1,688 | ||||||
Chart Industries | ||||||||
9.500%, 01/01/2031 (A) | 1,897 | 2,016 | ||||||
7.500%, 01/01/2030 (A) | 134 | 135 | ||||||
Description | Face Amount | Market Value | ||||||
CORPORATE OBLIGATIONS (continued) | ||||||||
Clean Harbors | ||||||||
6.375%, 02/01/2031 (A) | $ | 569 | $ | 553 | ||||
Conduent Business Services | ||||||||
6.000%, 11/01/2029 (A) | 310 | 265 | ||||||
CoreCivic | ||||||||
8.250%, 04/15/2026 | 347 | 352 | ||||||
CP Atlas Buyer | ||||||||
7.000%, 12/01/2028 (A) | 1,857 | 1,456 | ||||||
Deluxe | ||||||||
8.000%, 06/01/2029 (A) | 2,480 | 2,046 | ||||||
Emerald Debt Merger Sub | ||||||||
6.625%, 12/15/2030 (A) | 3,116 | 3,000 | ||||||
EnPro Industries | ||||||||
5.750%, 10/15/2026 | 232 | 222 | ||||||
Enviri | ||||||||
5.750%, 07/31/2027 (A) | 465 | 409 | ||||||
First Student Bidco | ||||||||
4.000%, 07/31/2029 (A) | 15 | 13 | ||||||
Garda World Security | ||||||||
9.500%, 11/01/2027 (A) | 315 | 301 | ||||||
6.000%, 06/01/2029 (A) | 242 | 198 | ||||||
GFL Environmental | ||||||||
5.125%, 12/15/2026 (A) | 335 | 319 | ||||||
4.750%, 06/15/2029 (A) | 2,291 | 2,037 | ||||||
4.375%, 08/15/2029 (A) | 1,264 | 1,098 | ||||||
4.000%, 08/01/2028 (A) | 679 | 593 | ||||||
3.500%, 09/01/2028 (A) | 1,415 | 1,218 | ||||||
Global Infrastructure Solutions | ||||||||
7.500%, 04/15/2032 (A) | 175 | 150 | ||||||
5.625%, 06/01/2029 (A) | 332 | 273 | ||||||
GrafTech Finance | ||||||||
4.625%, 12/15/2028 (A) | 955 | 738 | ||||||
GrafTech Global Enterprises | ||||||||
9.875%, 12/15/2028 (A) | 918 | 870 | ||||||
Griffon | ||||||||
5.750%, 03/01/2028 | 500 | 454 | ||||||
H&E Equipment Services | ||||||||
3.875%, 12/15/2028 (A) | 2,285 | 1,951 | ||||||
Hawaiian Brand Intellectual Property | ||||||||
5.750%, 01/20/2026 (A) | 1,168 | 1,051 | ||||||
Hertz | ||||||||
5.000%, 12/01/2029 (A) | 633 | 496 | ||||||
4.625%, 12/01/2026 (A) | 888 | 787 | ||||||
Hertz (Escrow Security) | ||||||||
7.125%, 08/01/2026 (A)(B) | 465 | 39 | ||||||
6.000%, 01/15/2028 (A)(B) | 450 | 36 | ||||||
5.500%, 10/15/2024 (A)(B) | 559 | 17 | ||||||
Icahn Enterprises | ||||||||
5.250%, 05/15/2027 | 1,145 | 1,006 | ||||||
4.750%, 09/15/2024 | 1,342 | 1,293 | ||||||
JELD-WEN | ||||||||
4.875%, 12/15/2027 (A) | 250 | 221 | ||||||
232
SEI Institutional Managed Trust
Description | Face Amount | Market Value | ||||||
CORPORATE OBLIGATIONS (continued) | ||||||||
4.625%, 12/15/2025 (A) | $ | 145 | $ | 139 | ||||
Korn Ferry | ||||||||
4.625%, 12/15/2027 (A) | 1,697 | 1,561 | ||||||
Madison IAQ | ||||||||
5.875%, 06/30/2029 (A) | 1,098 | 884 | ||||||
4.125%, 06/30/2028 (A) | 170 | 147 | ||||||
Masonite International | ||||||||
5.375%, 02/01/2028 (A) | 298 | 277 | ||||||
MasTec | ||||||||
4.500%, 08/15/2028 (A) | 433 | 389 | ||||||
Mileage Plus Holdings | ||||||||
6.500%, 06/20/2027 (A) | 1,886 | 1,869 | ||||||
MIWD Holdco II | ||||||||
5.500%, 02/01/2030 (A) | 221 | 183 | ||||||
Monitronics International (Escrow Security) | ||||||||
9.125%, 04/01/2020 (B)(D) | 5,936 | – | ||||||
Neptune Bidco US | ||||||||
9.290%, 04/15/2029 (A) | 569 | 515 | ||||||
PGT Innovations | ||||||||
4.375%, 10/01/2029 (A) | 1,125 | 1,037 | ||||||
Pitney Bowes | ||||||||
7.250%, 03/15/2029 (A) | 1,615 | 1,185 | ||||||
6.875%, 03/15/2027 (A) | 1,095 | 862 | ||||||
Prime Security Services Borrower | ||||||||
5.750%, 04/15/2026 (A) | 1,189 | 1,154 | ||||||
Regal Rexnord | ||||||||
6.400%, 04/15/2033 (A) | 178 | 171 | ||||||
6.300%, 02/15/2030 (A) | 127 | 123 | ||||||
6.050%, 04/15/2028 (A) | 300 | 292 | ||||||
Ritchie Bros Holdings | ||||||||
7.750%, 03/15/2031 (A) | 859 | 872 | ||||||
6.750%, 03/15/2028 (A) | 721 | 719 | ||||||
Rolls-Royce | ||||||||
5.750%, 10/15/2027 (A) | 1,431 | 1,381 | ||||||
Science Applications International | ||||||||
4.875%, 04/01/2028 (A) | 1,172 | 1,064 | ||||||
Sensata Technologies | ||||||||
4.000%, 04/15/2029 (A) | 816 | 703 | ||||||
3.750%, 02/15/2031 (A) | 20 | 16 | ||||||
Signature Aviation US Holdings | ||||||||
4.000%, 03/01/2028 (A) | 1,133 | 1,008 | ||||||
Spirit AeroSystems | ||||||||
9.375%, 11/30/2029 (A) | 170 | 173 | ||||||
7.500%, 04/15/2025 (A) | 1,119 | 1,098 | ||||||
Spirit Loyalty Cayman | ||||||||
8.000%, 09/20/2025 (A) | 1,374 | 1,373 | ||||||
SPX FLOW | ||||||||
8.750%, 04/01/2030 (A) | 1,176 | 1,087 | ||||||
SS&C Technologies | ||||||||
5.500%, 09/30/2027 (A) | 607 | 573 | ||||||
Standard Industries | ||||||||
5.000%, 02/15/2027 (A) | 2,301 | 2,133 | ||||||
Description | Face Amount | Market Value | ||||||
CORPORATE OBLIGATIONS (continued) | ||||||||
4.750%, 01/15/2028 (A) | $ | 778 | $ | 702 | ||||
4.375%, 07/15/2030 (A) | 2,281 | 1,889 | ||||||
3.375%, 01/15/2031 (A) | 88 | 68 | ||||||
Stericycle | ||||||||
3.875%, 01/15/2029 (A) | 284 | 245 | ||||||
Team Health Holdings | ||||||||
6.375%, 02/01/2025 (A) | 2,667 | 2,056 | ||||||
Terex | ||||||||
5.000%, 05/15/2029 (A) | 335 | 300 | ||||||
TK Elevator US Newco | ||||||||
5.250%, 07/15/2027 (A) | 1,548 | 1,419 | ||||||
TransDigm | ||||||||
6.875%, 12/15/2030 (A) | 3,160 | 3,098 | ||||||
6.750%, 08/15/2028 (A) | 668 | 658 | ||||||
6.250%, 03/15/2026 (A) | 2,865 | 2,815 | ||||||
5.500%, 11/15/2027 | 1,982 | 1,856 | ||||||
TriNet Group | ||||||||
7.125%, 08/15/2031 (A) | 172 | 170 | ||||||
Triumph Group | ||||||||
9.000%, 03/15/2028 (A) | 108 | 107 | ||||||
7.750%, 08/15/2025 | 280 | 266 | ||||||
Tutor Perini | ||||||||
6.875%, 05/01/2025 (A) | 2,787 | 2,548 | ||||||
Uber Technologies | ||||||||
7.500%, 09/15/2027 (A) | 135 | 136 | ||||||
4.500%, 08/15/2029 (A) | 249 | 223 | ||||||
United Airlines | ||||||||
4.625%, 04/15/2029 (A) | 1,968 | 1,692 | ||||||
4.375%, 04/15/2026 (A) | 1,562 | 1,444 | ||||||
United Rentals North America | ||||||||
6.000%, 12/15/2029 (A) | 1,173 | 1,142 | ||||||
5.250%, 01/15/2030 | 1,650 | 1,526 | ||||||
4.000%, 07/15/2030 | 850 | 725 | ||||||
3.875%, 11/15/2027 | 1,719 | 1,556 | ||||||
US Airways Pass Through Trust | ||||||||
3.950%, 11/15/2025 | 379 | 359 | ||||||
VistaJet Malta Finance | ||||||||
9.500%, 06/01/2028 (A) | 602 | 528 | ||||||
Wesco Aircraft Holdings | ||||||||
13.125%, 11/15/2027 (A)(B) | 100 | 3 | ||||||
9.000%, 11/15/2026 (A)(B) | 599 | 57 | ||||||
WESCO Distribution | ||||||||
7.250%, 06/15/2028 (A) | 473 | 475 | ||||||
7.125%, 06/15/2025 (A) | 361 | 362 | ||||||
XPO | ||||||||
6.250%, 06/01/2028 (A) | 150 | 145 | ||||||
| 100,798 | ||||||||
Information Technology — 3.8% | ||||||||
ACI Worldwide | ||||||||
5.750%, 08/15/2026 (A) | 394 | 382 | ||||||
SEI Institutional Managed Trust
233
SCHEDULE OF INVESTMENTS
September 30, 2023
High Yield Bond Fund (Continued)
Description | Face Amount | Market Value | ||||||
CORPORATE OBLIGATIONS (continued) | ||||||||
Ahead DB Holdings | ||||||||
6.625%, 05/01/2028 (A) | $ | 2,292 | $ | 1,936 | ||||
ams-OSRAM | ||||||||
7.000%, 07/31/2025 (A) | 1,617 | 1,594 | ||||||
Arches Buyer | ||||||||
6.125%, 12/01/2028 (A) | 84 | 68 | ||||||
4.250%, 06/01/2028 (A) | 218 | 186 | ||||||
Black Knight InfoServ | ||||||||
3.625%, 09/01/2028 (A) | 859 | 769 | ||||||
Ciena | ||||||||
4.000%, 01/31/2030 (A) | 1,085 | 918 | ||||||
Clarivate Science Holdings | ||||||||
4.875%, 07/01/2029 (A) | 184 | 157 | ||||||
3.875%, 07/01/2028 (A) | 164 | 142 | ||||||
Coherent | ||||||||
5.000%, 12/15/2029 (A) | 3,050 | 2,645 | ||||||
CommScope | ||||||||
8.250%, 03/01/2027 (A) | 5,614 | 3,669 | ||||||
7.125%, 07/01/2028 (A) | 2,085 | 1,247 | ||||||
6.000%, 03/01/2026 (A) | 810 | 756 | ||||||
4.750%, 09/01/2029 (A) | 389 | 286 | ||||||
CommScope Technologies | ||||||||
6.000%, 06/15/2025 (A) | 1,981 | 1,886 | ||||||
5.000%, 03/15/2027 (A) | 200 | 113 | ||||||
Consensus Cloud Solutions | ||||||||
6.500%, 10/15/2028 (A) | 2,060 | 1,756 | ||||||
Crowdstrike Holdings | ||||||||
3.000%, 02/15/2029 | 926 | 780 | ||||||
Elastic | ||||||||
4.125%, 07/15/2029 (A) | 1,503 | 1,280 | ||||||
Entegris | ||||||||
4.375%, 04/15/2028 (A) | 182 | 162 | ||||||
3.625%, 05/01/2029 (A) | 786 | 668 | ||||||
Entegris Escrow | ||||||||
5.950%, 06/15/2030 (A) | 247 | 229 | ||||||
4.750%, 04/15/2029 (A) | 3,337 | 3,000 | ||||||
Fair Isaac | ||||||||
4.000%, 06/15/2028 (A) | 1,431 | 1,279 | ||||||
Go Daddy Operating | ||||||||
5.250%, 12/01/2027 (A) | 951 | 897 | ||||||
3.500%, 03/01/2029 (A) | 2,351 | 1,978 | ||||||
Imola Merger | ||||||||
4.750%, 05/15/2029 (A) | 813 | 713 | ||||||
ION Trading Technologies Sarl | ||||||||
5.750%, 05/15/2028 (A) | 2,145 | 1,870 | ||||||
NCR | ||||||||
6.125%, 09/01/2029 (A) | 305 | 313 | ||||||
5.750%, 09/01/2027 (A) | 455 | 458 | ||||||
5.125%, 04/15/2029 (A) | 323 | 285 | ||||||
5.000%, 10/01/2028 (A) | 147 | 131 | ||||||
NCR Atleos Escrow | ||||||||
9.500%, 04/01/2029 (A) | 279 | 270 | ||||||
Description | Face Amount | Market Value | ||||||
CORPORATE OBLIGATIONS (continued) | ||||||||
ON Semiconductor | ||||||||
3.875%, 09/01/2028 (A) | $ | 471 | $ | 417 | ||||
Open Text Holdings | ||||||||
4.125%, 02/15/2030 (A) | 1,842 | 1,541 | ||||||
Presidio Holdings | ||||||||
4.875%, 02/01/2027 (A) | 260 | 240 | ||||||
RingCentral | ||||||||
8.500%, 08/15/2030 (A) | 204 | 197 | ||||||
Seagate HDD Cayman | ||||||||
8.500%, 07/15/2031 (A) | 40 | 41 | ||||||
8.250%, 12/15/2029 (A) | 162 | 166 | ||||||
3.375%, 07/15/2031 | 829 | 578 | ||||||
Sprint | ||||||||
7.625%, 02/15/2025 | 1,898 | 1,926 | ||||||
Synaptics | ||||||||
4.000%, 06/15/2029 (A) | 2,310 | 1,906 | ||||||
Veritas US | ||||||||
7.500%, 09/01/2025 (A) | 2,235 | 1,867 | ||||||
ViaSat | ||||||||
6.500%, 07/15/2028 (A) | 2,175 | 1,506 | ||||||
5.625%, 09/15/2025 (A) | 1,413 | 1,306 | ||||||
Western Digital | ||||||||
4.750%, 02/15/2026 | 1,375 | 1,310 | ||||||
Xerox Holdings | ||||||||
5.500%, 08/15/2028 (A) | 1,423 | 1,197 | ||||||
| 47,021 | ||||||||
Materials — 7.3% | ||||||||
Alcoa Nederland Holding BV | ||||||||
5.500%, 12/15/2027 (A) | 600 | 570 | ||||||
ARD Finance | ||||||||
6.500%cash/0% PIK, 06/30/2027 (A) | 3,114 | 2,349 | ||||||
Ardagh Metal Packaging Finance USA | ||||||||
3.250%, 09/01/2028 (A) | 840 | 700 | ||||||
Ardagh Packaging Finance | ||||||||
5.250%, 04/30/2025 (A) | 1,258 | 1,226 | ||||||
5.250%, 08/15/2027 (A) | 2,548 | 2,126 | ||||||
4.125%, 08/15/2026 (A) | 845 | 773 | ||||||
Ashland | ||||||||
6.875%, 05/15/2043 | 851 | 815 | ||||||
ASP Unifrax Holdings | ||||||||
5.250%, 09/30/2028 (A) | 3,028 | 2,156 | ||||||
ATI | ||||||||
7.250%, 08/15/2030 | 147 | 146 | ||||||
5.875%, 12/01/2027 | 174 | 165 | ||||||
5.125%, 10/01/2031 | 80 | 69 | ||||||
4.875%, 10/01/2029 | 160 | 141 | ||||||
Axalta Coating Systems | ||||||||
4.750%, 06/15/2027 (A) | 394 | 366 | ||||||
3.375%, 02/15/2029 (A) | 205 | 171 | ||||||
Baffinland Iron Mines | ||||||||
8.750%, 07/15/2026 (A) | 2,725 | 2,652 | ||||||
234
SEI Institutional Managed Trust
Description | Face Amount | Market Value | ||||||
CORPORATE OBLIGATIONS (continued) | ||||||||
Ball | ||||||||
6.000%, 06/15/2029 | $ | 1,778 | $ | 1,726 | ||||
3.125%, 09/15/2031 | 1,150 | 901 | ||||||
2.875%, 08/15/2030 | 1,751 | 1,387 | ||||||
Big River Steel | ||||||||
6.625%, 01/31/2029 (A) | 298 | 294 | ||||||
Carpenter Technology | ||||||||
7.625%, 03/15/2030 | 60 | 60 | ||||||
6.375%, 07/15/2028 | 184 | 178 | ||||||
CF Industries | ||||||||
5.150%, 03/15/2034 | 1,619 | 1,488 | ||||||
Chemours | ||||||||
5.750%, 11/15/2028 (A) | 1,539 | 1,335 | ||||||
4.625%, 11/15/2029 (A) | 1,208 | 972 | ||||||
Cleveland-Cliffs | ||||||||
6.750%, 04/15/2030 (A) | 1,009 | 943 | ||||||
Cleveland-Cliffs Inc | ||||||||
4.625%, 03/01/2029 (A) | 213 | 186 | ||||||
Clydesdale Acquisition Holdings | ||||||||
8.750%, 04/15/2030 (A) | 772 | 662 | ||||||
Compass Minerals International | ||||||||
6.750%, 12/01/2027 (A) | 2,157 | 2,044 | ||||||
Cornerstone Chemical | ||||||||
13.000%, 08/26/2024 (C)(D) | 703 | 703 | ||||||
10.250%cash/0% PIK, 09/01/2027 (A)(B)(C)(D) | 7,095 | 4,257 | ||||||
CVR Partners | ||||||||
6.125%, 06/15/2028 (A) | 1,301 | 1,169 | ||||||
Domtar | ||||||||
6.750%, 10/01/2028 (A) | 2,940 | 2,435 | ||||||
Element Solutions | ||||||||
3.875%, 09/01/2028 (A) | 2,462 | 2,125 | ||||||
ERO Copper | ||||||||
6.500%, 02/15/2030 (A) | 2,010 | 1,729 | ||||||
First Quantum Minerals | ||||||||
8.625%, 06/01/2031 (A) | 1,229 | 1,223 | ||||||
7.500%, 04/01/2025 (A) | 707 | 706 | ||||||
6.875%, 10/15/2027 (A) | 2,349 | 2,253 | ||||||
FMG Resources August 2006 PTY | ||||||||
4.500%, 09/15/2027 (A) | 772 | 699 | ||||||
Freeport-McMoRan | ||||||||
5.450%, 03/15/2043 | 300 | 256 | ||||||
5.400%, 11/14/2034 | 925 | 846 | ||||||
Glatfelter | ||||||||
4.750%, 11/15/2029 (A) | 154 | 101 | ||||||
Graham Packaging | ||||||||
7.125%, 08/15/2028 (A) | 185 | 155 | ||||||
INEOS Finance | ||||||||
6.750%, 05/15/2028 (A) | 200 | 187 | ||||||
INEOS Quattro Finance II | ||||||||
3.375%, 01/15/2026 (A) | 1,304 | 1,188 | ||||||
Description | Face Amount | Market Value | ||||||
CORPORATE OBLIGATIONS (continued) | ||||||||
Innophos Holdings | ||||||||
9.375%, 02/15/2028 (A) | $ | 2,550 | $ | 2,443 | ||||
Knife River | ||||||||
7.750%, 05/01/2031 (A) | 90 | 90 | ||||||
LABL | ||||||||
10.500%, 07/15/2027 (A) | 295 | 277 | ||||||
6.750%, 07/15/2026 (A) | 1,167 | 1,131 | ||||||
LSB Industries | ||||||||
6.250%, 10/15/2028 (A) | 1,640 | 1,486 | ||||||
Mauser Packaging Solutions Holding | ||||||||
9.250%, 04/15/2027 (A) | 490 | 428 | ||||||
7.875%, 08/15/2026 (A) | 1,030 | 994 | ||||||
Methanex | ||||||||
5.125%, 10/15/2027 | 1,361 | 1,255 | ||||||
Mountain Province Diamonds | ||||||||
9.000%, 12/15/2025 (A)(D) | 1,989 | 1,939 | ||||||
Neiman Marcus Group (Escrow Security) | ||||||||
8.750%cash/0% PIK, 10/15/2022 (A)(B)(D) | 762 | 96 | ||||||
8.000%, 10/15/2022 (A)(B)(D) | 820 | 103 | ||||||
NMG Holding | ||||||||
7.125%, 04/01/2026 (A) | 615 | 577 | ||||||
Northwest Acquisitions ULC | ||||||||
7.125%, 11/01/2022 (A)(B)(D) | 2,115 | – | ||||||
NOVA Chemicals | ||||||||
5.250%, 06/01/2027 (A) | 550 | 476 | ||||||
5.000%, 05/01/2025 (A) | 859 | 809 | ||||||
4.875%, 06/01/2024 (A) | 300 | 295 | ||||||
4.250%, 05/15/2029 (A) | 213 | 166 | ||||||
Novelis | ||||||||
4.750%, 01/30/2030 (A) | 275 | 238 | ||||||
3.875%, 08/15/2031 (A) | 2,020 | 1,613 | ||||||
3.250%, 11/15/2026 (A) | 735 | 657 | ||||||
OI European Group BV | ||||||||
4.750%, 02/15/2030 (A) | 2,060 | 1,792 | ||||||
Olympus Water US Holding | ||||||||
9.750%, 11/15/2028 (A) | 1,438 | 1,435 | ||||||
Owens-Brockway Glass Container | ||||||||
6.625%, 05/13/2027 (A) | 352 | 343 | ||||||
Pactiv Evergreen Group Issuer | ||||||||
4.000%, 10/15/2027 (A) | 1,093 | 970 | ||||||
Polar US Borrower | ||||||||
6.750%, 05/15/2026 (A) | 2,046 | 1,023 | ||||||
Rain Carbon | ||||||||
12.250%, 09/01/2029 (A) | 1,150 | 1,206 | ||||||
Rain CII Carbon | ||||||||
7.250%, 04/01/2025 (A) | 33 | 32 | ||||||
SCIH Salt Holdings | ||||||||
6.625%, 05/01/2029 (A) | 4,158 | 3,563 | ||||||
4.875%, 05/01/2028 (A) | 195 | 172 | ||||||
Scotts Miracle-Gro | ||||||||
4.500%, 10/15/2029 | 420 | 344 | ||||||
SEI Institutional Managed Trust
235
SCHEDULE OF INVESTMENTS
September 30, 2023
High Yield Bond Fund (Continued)
Description | Face Amount | Market Value | ||||||
CORPORATE OBLIGATIONS (continued) | ||||||||
4.375%, 02/01/2032 | $ | 212 | $ | 159 | ||||
4.000%, 04/01/2031 | 470 | 359 | ||||||
Sealed Air | ||||||||
6.125%, 02/01/2028 (A) | 1,436 | 1,391 | ||||||
Smyrna Ready Mix Concrete | ||||||||
6.000%, 11/01/2028 (A) | 790 | 730 | ||||||
Summit Materials | ||||||||
5.250%, 01/15/2029 (A) | 1,709 | 1,552 | ||||||
Tacora Resources | ||||||||
13.000%cash/0% PIK, 09/08/2023 (A)(C)(D) | 127 | 127 | ||||||
8.250%, 05/15/2026 (A)(B)(C) | 1,685 | 918 | ||||||
Taseko Mines | ||||||||
7.000%, 02/15/2026 (A) | 1,297 | 1,212 | ||||||
Trident TPI Holdings | ||||||||
12.750%, 12/31/2028 (A) | 1,607 | 1,679 | ||||||
TriMas | ||||||||
4.125%, 04/15/2029 (A) | 294 | 252 | ||||||
Trinseo Materials Operating | ||||||||
5.375%, 09/01/2025 (A) | 104 | 96 | ||||||
5.125%, 04/01/2029 (A) | 266 | 139 | ||||||
Trivium Packaging Finance BV | ||||||||
8.500%, 08/15/2027 (A) | 2,045 | 1,869 | ||||||
5.500%, 08/15/2026 (A) | 1,299 | 1,211 | ||||||
Tronox | ||||||||
4.625%, 03/15/2029 (A) | 4,199 | 3,389 | ||||||
Venator Finance Sarl | ||||||||
9.500%, 07/01/2025 (A)(B) | 250 | 100 | ||||||
5.750%, 07/15/2025 (A)(B) | 280 | 12 | ||||||
WR Grace Holdings | ||||||||
5.625%, 08/15/2029 (A) | 2,941 | 2,378 | ||||||
4.875%, 06/15/2027 (A) | 305 | 280 | ||||||
| 90,439 | ||||||||
Real Estate — 2.1% | ||||||||
Brookfield Property REIT | ||||||||
5.750%, 05/15/2026 (A) | 45 | 41 | ||||||
Diversified Healthcare Trust | ||||||||
4.750%, 05/01/2024 | 2,260 | 2,135 | ||||||
4.750%, 02/15/2028 | 1,150 | 839 | ||||||
4.375%, 03/01/2031 | 2,955 | 2,046 | ||||||
Iron Mountain | ||||||||
5.250%, 03/15/2028 (A) | 756 | 699 | ||||||
5.250%, 07/15/2030 (A) | 865 | 756 | ||||||
5.000%, 07/15/2028 (A) | 294 | 267 | ||||||
4.875%, 09/15/2029 (A) | 3,294 | 2,887 | ||||||
4.500%, 02/15/2031 (A) | 234 | 192 | ||||||
Outfront Media Capital | ||||||||
4.250%, 01/15/2029 (A) | 2,085 | 1,655 | ||||||
Realogy Group | ||||||||
5.250%, 04/15/2030 (A) | 372 | 258 | ||||||
Description | Face Amount | Market Value | ||||||
CORPORATE OBLIGATIONS (continued) | ||||||||
RHP Hotel Properties | ||||||||
7.250%, 07/15/2028 (A) | $ | 77 | $ | 76 | ||||
4.750%, 10/15/2027 | 723 | 658 | ||||||
4.500%, 02/15/2029 (A) | 454 | 389 | ||||||
SBA Communications | ||||||||
3.125%, 02/01/2029 | 1,320 | 1,101 | ||||||
Service Properties Trust | ||||||||
5.500%, 12/15/2027 | 460 | 393 | ||||||
4.950%, 02/15/2027 | 1,955 | 1,651 | ||||||
4.375%, 02/15/2030 | 3,465 | 2,487 | ||||||
4.350%, 10/01/2024 | 848 | 813 | ||||||
3.950%, 01/15/2028 | 215 | 167 | ||||||
Uniti Group | ||||||||
10.500%, 02/15/2028 (A) | 587 | 575 | ||||||
6.000%, 01/15/2030 (A) | 836 | 531 | ||||||
VICI Properties | ||||||||
5.750%, 02/01/2027 (A) | 204 | 197 | ||||||
5.625%, 05/01/2024 (A) | 185 | 184 | ||||||
4.625%, 06/15/2025 (A) | 261 | 252 | ||||||
4.625%, 12/01/2029 (A) | 153 | 136 | ||||||
4.500%, 09/01/2026 (A) | 125 | 117 | ||||||
4.500%, 01/15/2028 (A) | 95 | 87 | ||||||
4.250%, 12/01/2026 (A) | 429 | 400 | ||||||
4.125%, 08/15/2030 (A) | 3,161 | 2,688 | ||||||
3.875%, 02/15/2029 (A) | 227 | 196 | ||||||
3.750%, 02/15/2027 (A) | 1,840 | 1,670 | ||||||
| 26,543 | ||||||||
Utilities — 2.0% | ||||||||
AmeriGas Partners | ||||||||
9.375%, 06/01/2028 (A) | 142 | 144 | ||||||
5.875%, 08/20/2026 | 120 | 115 | ||||||
5.750%, 05/20/2027 | 110 | 103 | ||||||
Calpine | ||||||||
5.000%, 02/01/2031 (A) | 175 | 141 | ||||||
4.625%, 02/01/2029 (A) | 902 | 755 | ||||||
4.500%, 02/15/2028 (A) | 3,273 | 2,950 | ||||||
Clearway Energy Operating LLC | ||||||||
3.750%, 02/15/2031 (A) | 2,119 | 1,671 | ||||||
FirstEnergy | ||||||||
4.150%, 07/15/2027 | 1,438 | 1,337 | ||||||
NRG Energy | ||||||||
10.250%, H15T5Y + 5.920%(A)(G)(H) | 1,883 | 1,844 | ||||||
7.000%, 03/15/2033 (A) | 264 | 255 | ||||||
6.625%, 01/15/2027 | 505 | 495 | ||||||
5.750%, 01/15/2028 | 155 | 145 | ||||||
5.250%, 06/15/2029 (A) | 340 | 300 | ||||||
3.875%, 02/15/2032 (A) | 1,011 | 759 | ||||||
3.625%, 02/15/2031 (A) | 3,164 | 2,401 | ||||||
3.375%, 02/15/2029 (A) | 145 | 117 | ||||||
Pattern Energy Operations | ||||||||
4.500%, 08/15/2028 (A) | 1,659 | 1,441 | ||||||
236
SEI Institutional Managed Trust
Description | Face Amount | Market Value | ||||||
CORPORATE OBLIGATIONS (continued) | ||||||||
PG&E | ||||||||
5.250%, 07/01/2030 | $ | 1,552 | $ | 1,349 | ||||
5.000%, 07/01/2028 | 289 | 262 | ||||||
Pike | ||||||||
5.500%, 09/01/2028 (A) | 202 | 177 | ||||||
Solaris Midstream Holdings | ||||||||
7.625%, 04/01/2026 (A) | 1,262 | 1,218 | ||||||
Talen Energy Supply | ||||||||
8.625%, 06/01/2030 (A) | 1,670 | 1,712 | ||||||
Vistra | ||||||||
7.000%, H15T5Y + 5.740%(A)(G)(H) | 250 | 228 | ||||||
Vistra Operations | ||||||||
7.750%, 10/15/2031 (A) | 255 | 251 | ||||||
5.625%, 02/15/2027 (A) | 430 | 408 | ||||||
5.000%, 07/31/2027 (A) | 2,726 | 2,506 | ||||||
4.375%, 05/01/2029 (A) | 961 | 826 | ||||||
4.300%, 07/15/2029 (A) | 375 | 328 | ||||||
| 24,238 | ||||||||
Total Corporate Obligations | ||||||||
(Cost $1,066,992) ($ Thousands) | 953,068 | |||||||
LOAN PARTICIPATIONS — 10.0% | ||||||||
1236904 B.C. LTD., Initial Term Loan, 1st Lien | ||||||||
10.931%, CME Term SOFR + 5.614%, 03/04/2027 (G) | 173 | 164 | ||||||
AAdvantage Loyality IP Ltd. (American Airlines, Inc.), Initial Term Loan, 1st Lien | ||||||||
10.338%, LIBOR + 4.750%, 04/20/2028 (G) | 280 | 288 | ||||||
ACProducts Holdings, Inc., Initial Term Loan, 1st Lien | ||||||||
9.902%, CME Term SOFR + 4.250%, 05/17/2028 (G)(I) | 327 | 269 | ||||||
Adient U.S., LLC, Term B-1 Loan, 1st Lien | ||||||||
8.681%, LIBOR + 3.500%, 04/10/2028 (G) | 180 | 179 | ||||||
Ahead DB Holdings, LLC, Term B Loan, 1st Lien | ||||||||
9.240%, CME Term SOFR + 3.750%, 10/18/2027 (G) | 99 | 99 | ||||||
Alchemy US Holdco 1, LLC, Initial Term Loan, 1st Lien | ||||||||
12.860%, LIBOR + 5.500%, 10/10/2025 (G) | 984 | 971 | ||||||
AlixPartners, LLP, Initial Dollar Term Loan, 1st Lien | ||||||||
8.181%, 02/04/2028 | 375 | 375 | ||||||
Description | Face Amount | Market Value | ||||||
LOAN PARTICIPATIONS (continued) | ||||||||
Alvogen Pharma US, Inc., June 2002 Loan, 1st Lien | ||||||||
13.040%, CME Term SOFR + 7.500%, 06/30/2025 (G) | $ | 1,710 | $ | 1,556 | ||||
AP Core Holdings II, LLC, Term B-1 Loan, 1st Lien | ||||||||
10.931%, CME Term SOFR + 5.500%, 09/01/2027 (G) | 291 | 285 | ||||||
AP Core Holdings II, LLC, Term B-2 Loan, 1st Lien | ||||||||
10.931%, CME Term SOFR + 5.500%, 09/01/2027 (G) | 1,000 | 970 | ||||||
ASP Unifrax Holdings, Inc., USD Term Loan, 1st Lien | ||||||||
9.290%, 12/12/2025 (G) | 618 | 575 | ||||||
Avaya Inc., Initial Term Loan, 1st Lien | ||||||||
13.816%, CME Term SOFR + 8.500%, 08/01/2028 (G) | 4,046 | 3,561 | ||||||
Blackhawk Network Cov-Lite, Term Loan, 2nd Lien | ||||||||
12.432%, 06/15/2026 | 1,412 | 1,370 | ||||||
BYJU's Alpha, Inc., Initial Term Loan | ||||||||
15.250%, LIBOR + 6.000%, 11/24/2026 (B)(G) | 3,057 | 984 | ||||||
Carestream Health, Inc., Term Loan, 1st Lien | ||||||||
12.990%, CME Term SOFR + 7.500%, 09/30/2027 (G) | 1,971 | 1,557 | ||||||
Castle US Holding Corp., Dollar Term B-2 Loan, 1st Lien | ||||||||
9.684%, 01/29/2027 (I) | 1,098 | 862 | ||||||
Castle US Holding Corp., Initial Dollar Term Loan, 1st Lien | ||||||||
9.434%, CME Term SOFR + 3.750%, 01/29/2027 (G)(I) | 962 | 752 | ||||||
Chemours Company, Tranche B-3 US$Term Loan, 1st Lien | ||||||||
8.816%, 08/18/2028 (G) | 630 | 622 | ||||||
Claire's Stores, Inc., Initial Term Loan, 1st Lien | ||||||||
11.916%, CME Term SOFR + 6.500%, 12/18/2026 (G) | 1,099 | 1,010 | ||||||
Clear Channel Outdoor Holdings, Inc., Term B Loan, 1st Lien | ||||||||
9.131%, CME Term SOFR + 3.500%, 08/21/2026 (G) | 99 | 96 | ||||||
ClubCorp Holdings, Inc., Term B Loan, 1st Lien | ||||||||
8.181%, LIBOR + 2.750%, 09/18/2024 (G) | 1,809 | 1,777 | ||||||
SEI Institutional Managed Trust
237
SCHEDULE OF INVESTMENTS
September 30, 2023
High Yield Bond Fund (Continued)
��
Description | Face Amount | Market Value | ||||||
LOAN PARTICIPATIONS (continued) | ||||||||
CMG Media Corporation, 2021 Term B Loan, 1st Lien | ||||||||
8.990%, CME Term SOFR + 3.500%, 12/17/2026 (G) | $ | 343 | $ | 313 | ||||
Commscope, Inc., Initial Term Loan, 1st Lien | ||||||||
8.681%, LIBOR + 3.250%, 04/06/2026 (G) | 230 | 209 | ||||||
ConvergeOne Holdings, Corp., Initial Term Loan, 1st Lien | ||||||||
10.372%, 01/04/2026 (G) | 2,080 | 1,258 | ||||||
Cornerstone Chemical – Unfunded Term Loan | ||||||||
0.000%, 08/26/2024 (C)(E) | 328 | — | ||||||
DexKo Global Inc., Closing Date Dollar Term Loan, 1st Lien | ||||||||
9.402%, CME Term SOFR + 3.750%, 10/04/2028 (G) | 340 | 331 | ||||||
DIRECTV Financing, LLC, Closing Date Term Loan, 1st Lien | ||||||||
10.431%, CME Term SOFR + 5.000%, 08/02/2027 (G) | 1,185 | 1,157 | ||||||
Dominion Diamond, 1st Lien | ||||||||
10.000%, 06/30/2026 (D) | 785 | 785 | ||||||
East Valley Tourist Development Authority , Term Loan, 1st Lien | ||||||||
13.152%, CME Term SOFR + 7.500%, 11/23/2026 (D)(G) | 2,492 | 2,425 | ||||||
Envision Healthcare Corp., First Out Term Loan, 1st Lien | ||||||||
13.267%, CME Term SOFR + 7.875%, 03/31/2027 (B)(G) | 727 | 849 | ||||||
Envision Healthcare Corp., Second Out Term Loan, 1st Lien | ||||||||
9.640%, CME Term SOFR + 4.250%, 03/31/2027 (B)(G)(I) | 8,509 | 1,915 | ||||||
Envision Healthcare Corp., Third Out Term Loan, 1st Lien | ||||||||
8.992%, CME Term SOFR + 3.750%, 03/31/2027 (B)(G) | 805 | 1 | ||||||
Epic Crude Services, LP, Term Loan, 1st Lien | ||||||||
10.929%, LIBOR + 5.000%, 03/02/2026 (G) | 906 | 887 | ||||||
Epic Y-Grade Services, LP, Term Loan, 1st Lien | ||||||||
11.523%, 06/30/2027 (G) | 7,889 | 7,357 | ||||||
First Student Bidco Inc., 2022 Incremental Term B Loan, 1st Lien | ||||||||
9.490%, CME Term SOFR + 4.000%, 07/21/2028 (G) | 252 | 248 | ||||||
Description | Face Amount | Market Value | ||||||
LOAN PARTICIPATIONS (continued) | ||||||||
First Student Bidco Inc., 2022 Incremental Term C Loan, 1st Lien | ||||||||
9.490%, CME Term SOFR + 4.000%, 07/21/2028 (G) | $ | 18 | $ | 17 | ||||
First Student Bidco Inc., Initial Term B Loan, 1st Lien | ||||||||
8.652%, LIBOR + 3.000%, 07/21/2028 (G) | 241 | 235 | ||||||
First Student Bidco Inc., Initial Term C Loan, 1st Lien | ||||||||
8.652%, LIBOR + 3.000%, 07/21/2028 (G) | 90 | 88 | ||||||
Foresight Energy Operating LLC, Tranche A Term Loan, 1st Lien | ||||||||
13.159%, CME Term SOFR + 8.000%, 06/30/2027 (G) | 220 | 209 | ||||||
Fortrea Holdings Inc., Initial Term B Loan, 1st Lien | ||||||||
9.066%, 07/01/2030 (G) | 894 | 890 | ||||||
Freeport LNG Investments, LLLP, 1st Lien | ||||||||
8.588%, 11/16/2026 | 1,544 | 1,513 | ||||||
GatesAir, Term Loan | ||||||||
14.986%, 08/01/2027 (C)(D) | 1,138 | 1,138 | ||||||
Genesys Cloud Services Holdings I, LLC, Initial Dollar Term Loan (2020), 1st Lien | ||||||||
9.431%, CME Term SOFR + 4.000%, 12/01/2027 (G) | 278 | 278 | ||||||
Global Medical Response, Inc., 2018 New Term Loan, 1st Lien | ||||||||
9.881%, CME Term SOFR + 4.250%, 03/14/2025 (G) | 1,984 | 1,378 | ||||||
Global Medical Response, Inc., 2021 Refinancing Term Loan, 1st Lien | ||||||||
9.780%, CME Term SOFR + 4.250%, 10/02/2025 (G) | 4,035 | 2,796 | ||||||
Graham Packaging Co. Inc., Initial Term Loan (2021), 1st Lien | ||||||||
8.431%, CME Term SOFR + 3.000%, 08/04/2027 (G) | 337 | 336 | ||||||
GTCR W Merger Sub LLC | ||||||||
0.000%, 09/20/2030 (E)(I) | 755 | 754 | ||||||
Gulf Finance, LLC, Term Loan, 1st Lien | ||||||||
12.631%, CME Term SOFR + 6.750%, 08/25/2026 (G) | 672 | 673 | ||||||
12.194%, CME Term SOFR + 6.750%, 08/25/2026 (G) | 1,209 | 1,210 | ||||||
Hercules Achievement, Inc. (Varsity Brands Holding Co., Inc.), Third Amendment Extended Term Loan, 1st Lien | ||||||||
10.431%, CME Term SOFR + 5.000%, 12/15/2026 (G) | 498 | 486 | ||||||
238
SEI Institutional Managed Trust
Description | Face Amount | Market Value | ||||||
LOAN PARTICIPATIONS (continued) | ||||||||
HUB International Ltd., 2023 Refinancing Term Loan, 1st Lien | ||||||||
9.584%, CME Term SOFR + 4.250%, 06/20/2030 (G) | $ | 100 | $ | 100 | ||||
J.C. Penney Corporation Inc., Term Loan, 1st Lien | ||||||||
5.250%, 06/21/2024 (B)(D)(G) | 2,253 | — | ||||||
Journey Personal Care Corp., Initial Term Loan, 1st Lien | ||||||||
9.981%, LIBOR + 4.250%, 03/01/2028 (G) | 1,794 | 1,687 | ||||||
Jump Financial, LLC, Term Loan, 1st Lien | ||||||||
10.152%, CME Term SOFR + 4.500%, 08/07/2028 (G) | 2,201 | 2,085 | ||||||
LABL, Inc., Initial Dollar Term Loan, 1st Lien | ||||||||
10.416%, CME Term SOFR + 5.000%, 10/29/2028 (G) | 282 | 281 | ||||||
Lannett Takeback Exit Term Loan, 1st Lien | ||||||||
2.000%, 06/16/2030 (D) | 566 | 566 | ||||||
Libbey Glass LLC, Incremental Term Loan, 1st Lien | ||||||||
11.923%, 11/22/2027 (I) | 1,260 | 1,193 | ||||||
Life Time, Inc., 2023 Refinancing Term Loan, 1st Lien | ||||||||
10.611%, CME Term SOFR + 4.500%, 01/15/2026 (G) | 465 | 466 | ||||||
LifeScan Global Corporation, Initial Term Loan, 1st Lien | ||||||||
11.747%, 12/31/2026 | 8,276 | 6,524 | ||||||
Lightstone Holdco, LLC, Extended Term B Loan, 1st Lien | ||||||||
11.066%, CME Term SOFR + 5.750%, 01/29/2027 (G) | 1,136 | 1,056 | ||||||
Lightstone Holdco, LLC, Extended Term C Loan, 1st Lien | ||||||||
11.066%, CME Term SOFR + 5.750%, 01/29/2027 (G) | 64 | 60 | ||||||
Madison IAQ, LLC, Initial Term Loan, 1st Lien | ||||||||
8.689%, LIBOR + 3.250%, 06/21/2028 (G) | 245 | 241 | ||||||
Magenta Buyer LLC, Initial Term Loan, 1st Lien | ||||||||
10.631%, CME Term SOFR + 5.000%, 07/27/2028 (G)(I) | 4,211 | 3,121 | ||||||
Magnite, Inc., Initial Term Loan, 1st Lien | ||||||||
10.929%, LIBOR + 5.000%, 04/28/2028 (G) | 84 | 84 | ||||||
10.684%, LIBOR + 5.000%, 04/28/2028 (G) | 84 | 84 | ||||||
10.431%, LIBOR + 5.000%, 04/28/2028 (G) | 456 | 456 | ||||||
Mallinckrodt International Finance | ||||||||
9.000%, 08/28/2024 | 151 | 156 | ||||||
Description | Face Amount | Market Value | ||||||
LOAN PARTICIPATIONS (continued) | ||||||||
Mashantucket (Western) Pequot Tribe, Term B Loan, 1st Lien | ||||||||
12.556%, 02/16/2025 | $ | 2,667 | $ | 2,633 | ||||
Mavenir Systems, Inc., Initial Term Loan, 1st Lien | ||||||||
11.127%, CME Term SOFR + 5.750%, 08/18/2028 (G) | 527 | 415 | ||||||
10.389%, CME Term SOFR + 4.750%, 08/18/2028 (G)(I) | 4,895 | 3,856 | ||||||
Medline Borrower, LP, Initial Dollar Term Loan, 1st Lien | ||||||||
8.681%, CME Term SOFR + 3.250%, 10/23/2028 (G) | 165 | 164 | ||||||
Mileage Plus Holdings, LLC (Mileage Plus Intellectual Property Assets, Ltd.), Initial Term Loan, 1st Lien | ||||||||
10.798%, LIBOR + 5.250%, 06/21/2027 (G) | 1,702 | 1,766 | ||||||
Mitnick Corporate Purchaser, Inc., Initial Term Loan, 1st Lien | ||||||||
9.969%, CME Term SOFR + 4.750%, 05/02/2029 (G) | 812 | 781 | ||||||
MLN US HoldCo, LLC, Term B Loan, 1st Lien | ||||||||
10.011%, LIBOR + 4.500%, 11/30/2025 (G) | 647 | 45 | ||||||
Mountaineer Merger Corp., Initial Term Loan, 1st Lien | ||||||||
12.876%, 10/26/2028 (G) | 1,831 | 1,422 | ||||||
MPH Acquisition Holdings LLC, Initial Term Loan, 1st Lien | ||||||||
9.916%, CME Term SOFR + 4.250%, 09/01/2028 (G) | 233 | 219 | ||||||
Naked Juice LLC, Initial Loan, 2nd Lien | ||||||||
11.490%, CME Term SOFR + 6.000%, 01/24/2030 (G) | 1,767 | 1,426 | ||||||
NEP Group, Inc., Initial Dollar Term Loan, 1st Lien | ||||||||
8.681%, 10/20/2025 (G) | 1,207 | 1,164 | ||||||
Netsmart, Inc., Initial Term Loan, 1st Lien | ||||||||
9.431%, 10/01/2027 | 875 | 875 | ||||||
Nexus Buyer LLC, Initial Term Loan, 2nd Lien | ||||||||
11.666%, CME Term SOFR + 6.250%, 11/05/2029 (G) | 667 | 629 | ||||||
Open Text Corporation, 2023 Replacement Term Loan, 1st Lien | ||||||||
8.166%, 01/31/2030 (G) | 589 | 589 | ||||||
Osaic Holdings, Inc., Term B-2 Loan, 1st Lien | ||||||||
9.816%, 08/17/2028 | 470 | 469 | ||||||
SEI Institutional Managed Trust
239
SCHEDULE OF INVESTMENTS
September 30, 2023
High Yield Bond Fund (Continued)
Description | Face Amount | Market Value | ||||||
LOAN PARTICIPATIONS (continued) | ||||||||
Park River Holdings Inc., Initial Term Loan, 1st Lien | ||||||||
8.522%, LIBOR + 3.250%, 12/28/2027 (G) | $ | 125 | $ | 120 | ||||
Petco Health and Wellness Co., Inc., Initial Term Loan, 1st Lien | ||||||||
8.902%, CME Term SOFR + 3.250%, 03/03/2028 (G) | 328 | 324 | ||||||
Pluto Acquisition I, Inc., 2021 Term Loan, 1st Lien | ||||||||
9.684%, CME Term SOFR + 4.000%, 06/22/2026 (G)(I) | 2,707 | 2,355 | ||||||
Prairie ECI Acquiror LP, Initial Term Loan, 1st Lien | ||||||||
10.166%, 03/11/2026 | 588 | 587 | ||||||
Premier Brands Group Holdings LLC, Initial Loan, 1st Lien | ||||||||
14.469%, 03/20/2024 (C) | 1,109 | 829 | ||||||
Pretium PKG Holdings, Inc., Initial Term Loan, 1st Lien | ||||||||
9.530%, LIBOR + 4.000%, 10/02/2028 (G) | 949 | 573 | ||||||
9.441%, LIBOR + 4.000%, 10/02/2028 (G) | 236 | 142 | ||||||
Pug LLC, Term B-2 Loan, 1st Lien | ||||||||
9.681%, CME Term SOFR + 4.250%, 02/12/2027 (D)(G) | 317 | 300 | ||||||
Pug LLC, USD Term B Loan, 1st Lien | ||||||||
8.931%, CME Term SOFR + 3.500%, 02/12/2027 (G) | 1,744 | 1,642 | ||||||
Quest Software US Holdings Inc., Initial Loan, 2nd Lien | ||||||||
13.019%, CME Term SOFR + 7.500%, 02/01/2030 (G) | 614 | 418 | ||||||
Sabre GLBL Inc., 2021 Other Term B-1 Loan, 1st Lien | ||||||||
8.931%, CME Term SOFR + 3.500%, 12/17/2027 (G)(I) | 999 | 872 | ||||||
Sabre GLBL Inc., 2021 Other Term B-2 Loan, 1st Lien | ||||||||
8.931%, CME Term SOFR + 3.500%, 12/17/2027 (G)(I) | 1,567 | 1,367 | ||||||
Sabre GLBL Inc., 2022 Other Term B Loan, 1st Lien | ||||||||
9.666%, CME Term SOFR + 4.250%, 06/30/2028 (G) | 1,217 | 1,063 | ||||||
Serta Simmons Bedding, LLC, Initial Term Loan, 1st Lien | ||||||||
12.739%, 06/29/2028 | 48 | 48 | ||||||
Shutterfly, 2nd Lien | ||||||||
10.242%, 10/01/2027 | 168 | 111 | ||||||
Description | Face Amount | Market Value | ||||||
LOAN PARTICIPATIONS (continued) | ||||||||
SPX Flow, Inc., Term Loan, 1st Lien | ||||||||
9.916%, CME Term SOFR + 4.500%, 04/05/2029 (G) | $ | 176 | $ | 176 | ||||
Staples, Inc., 2019 Refinancing New Term B-1 Loan, 1st Lien | ||||||||
10.634%, LIBOR + 5.000%, 04/16/2026 (G) | 1,027 | 879 | ||||||
Star Parent Inc | ||||||||
9.386%, 09/19/2030 | 115 | 112 | ||||||
Station Casinos LLC, Term B-1Facility Loan, 1st Lien | ||||||||
7.666%, 02/08/2027 (G) | 948 | 945 | ||||||
Sunshine Luxembourg VII S.a r.l., Facility B3, 1st Lien | ||||||||
9.240%, CME Term SOFR + 3.750%, 10/01/2026 (G) | 768 | 766 | ||||||
Syniverse Holdings, LLC, Initial Term Loan, 1st Lien | ||||||||
12.390%, CME Term SOFR + 7.000%, 05/13/2027 (G) | 1,304 | 1,140 | ||||||
Talen Energy Supply, LLC, Initial Term B Loan, 1st Lien | ||||||||
9.877%, 05/17/2030 (G) | 436 | 437 | ||||||
Talen Energy Supply, LLC, Initial Term C Loan, 1st Lien | ||||||||
9.877%, 05/17/2030 (G) | 204 | 205 | ||||||
Team Health Holdings, Inc., Extended Term Loan, 1st Lien | ||||||||
10.566%, CME Term SOFR + 5.250%, 03/02/2027 (G) | 5,257 | 3,969 | ||||||
TK Elevator Midco GmbH, Facility B1 (USD), 1st Lien | ||||||||
9.381%, LIBOR + 3.500%, 07/30/2027 (G) | 269 | 269 | ||||||
Tortoise Borrower, LLC, Initial Term Loan, 1st Lien | ||||||||
9.038%, 01/31/2025 | 1,000 | 406 | ||||||
Travelport Finance (Luxembourg) S.a r.l., Consented Term Loan, Other | ||||||||
13.890%, CME Term SOFR + 8.500%, 05/29/2026 (G)(I) | 1,013 | 581 | ||||||
Traverse Midstream Partners LLC, Advance, 1st Lien | ||||||||
9.216%, CME Term SOFR + 3.750%, 02/16/2028 (G) | 983 | 980 | ||||||
Triton Water Holdings, Inc., Initial Term Loan, 1st Lien | ||||||||
8.902%, CME Term SOFR + 3.500%, 03/31/2028 (G) | 202 | 197 | ||||||
Tutor Perini Corp., Term Loan, 1st Lien | ||||||||
10.181%, LIBOR + 4.750%, 08/18/2027 (D)(G) | 1,796 | 1,707 | ||||||
240
SEI Institutional Managed Trust
Description | Face Amount | Market Value | ||||||
LOAN PARTICIPATIONS (continued) | ||||||||
U.S. Renal Care, Inc., Closing Date Term Loan, 1st Lien | ||||||||
10.607%, 06/20/2028 (G) | $ | 401 | $ | 265 | ||||
Univision Communications Inc., 2021 Replacement Converted First-Lien Term Loan, 1st Lien | ||||||||
8.681%, LIBOR + 3.250%, 03/15/2026 (G) | 1,723 | 1,718 | ||||||
Venator Finance Sarl (Venator Materials LLC), Final Order Term Loan, 1st Lien | ||||||||
15.334%, CME Term SOFR + 10.000%, 08/08/2024 (G) | 182 | 189 | ||||||
VeriFone Systems, Inc., Initial Term Loan, 1st Lien | ||||||||
9.653%, LIBOR + 4.000%, 08/20/2025 (G) | 1,492 | 1,372 | ||||||
Vida Capital, Inc., Initial Term Loan, 1st Lien | ||||||||
11.431%, 10/01/2026 (I) | 4,773 | 3,914 | ||||||
WarHorse Gaming, LLC, Closing Date Term Loan, 1st Lien | ||||||||
14.668%, 06/30/2028 | 1,615 | 1,603 | ||||||
WaterBridge Midstream Operating LLC, Initial Term Loan, 1st Lien | ||||||||
11.363%, LIBOR + 5.750%, 06/22/2026 (G) | 510 | 510 | ||||||
Wellful Inc., Initial Term Loan, 1st Lien | ||||||||
11.681%, CME Term SOFR + 6.250%, 04/21/2027 (G)(I) | 2,407 | 2,035 | ||||||
White Cap Supply Holdings, LLC, Initial Closing Date Term Loan, 1st Lien | ||||||||
9.066%, CME Term SOFR + 3.750%, 10/19/2027 (G) | 432 | 431 | ||||||
Xplornet Communications, Inc., Refinancing Term Loan, 1st Lien | ||||||||
9.652%, 10/02/2028 (I) | 3,341 | 2,610 | ||||||
Zayo Group Holdings, Inc., Initial Dollar Term Loan, 1st Lien | ||||||||
8.431%, CME Term SOFR + 3.000%, 03/09/2027 (G) | 1,781 | 1,450 | ||||||
Total Loan Participations | ||||||||
(Cost $130,922) ($ Thousands) | 122,288 | |||||||
ASSET-BACKED SECURITIES — 8.0% | ||||||||
Other Asset-Backed Securities — 8.0% | ||||||||
Ares XXXIV CLO, Ser 2020-2A, Cl FR | ||||||||
14.170%, TSFR3M + 8.862%, 04/17/2033 (A)(D)(G) | 1,446 | 1,218 | ||||||
Battalion CLO VII, Ser 2014-7A | ||||||||
0.000%, 07/17/2028 (A)(D)(E)(G) | 4,490 | – | ||||||
Description | Face Amount | Market Value | ||||||
ASSET-BACKED SECURITIES (continued) | ||||||||
Battalion CLO VIII, Ser 2015-8A | ||||||||
0.000%, 07/18/2030 (A)(D)(E)(G) | $ | 3,390 | $ | 988 | ||||
Battalion CLO X, Ser 2016-10A | ||||||||
0.000%, 01/25/2035 (A)(D)(E)(G) | 4,450 | 3,088 | ||||||
Battalion CLO XI, Ser 2017-11A | ||||||||
0.000%, 04/24/2034 (A)(D)(E)(G) | 5,857 | 3,163 | ||||||
Battalion CLO XII, Ser 2018-12A | ||||||||
0.000%, 05/17/2031 (A)(D)(E)(G) | 4,663 | 1,637 | ||||||
Battalion CLO XIV, Ser 2019-14A | ||||||||
0.000%, 04/20/2032 (D)(E) | 3,427 | 2,344 | ||||||
Battalion CLO XVI, Ser 2019-16A | ||||||||
0.000%, 12/19/2032 (A)(D)(E)(G) | 2,128 | 1,149 | ||||||
Battalion CLO XX, Ser 2021-20A | ||||||||
0.000%, 07/15/2034 (D)(E) | 4,839 | 3,020 | ||||||
Benefit Street Partners CLO III, Ser 2013-IIIA | ||||||||
0.000%, 07/20/2029 (A)(D)(E)(G) | 2,531 | 292 | ||||||
Benefit Street Partners CLO IV | ||||||||
0.000%, 07/20/2026 (A)(D)(J) | 7 | 2,301 | ||||||
Benefit Street Partners CLO IX | ||||||||
0.000%, 07/20/2025 (A)(D)(J) | 2,293 | 808 | ||||||
Benefit Street Partners CLO V-B | ||||||||
0.000%, 04/20/2031 (D)(E) | 10,259 | 3,457 | ||||||
Benefit Street Partners CLO VI, Ser 2015-VIA | ||||||||
0.000%, 10/18/2029 (A)(D)(E)(G) | 7,502 | 3,367 | ||||||
Benefit Street Partners CLO VII, Ser 2015-VIII | ||||||||
0.000%, 07/18/2027 (D)(E)(G) | 6,715 | 26 | ||||||
Benefit Street Partners CLO VIII | ||||||||
0.000%, 01/20/2028 (A)(D)(E) | 6,720 | 1,780 | ||||||
Benefit Street Partners CLO X, Ser 2016-10A | ||||||||
0.000%, 04/20/2034 (A)(D)(E)(G) | 7,631 | 4,235 | ||||||
Benefit Street Partners CLO XIV, Ser 2018-14A | ||||||||
0.000%, 04/20/2031 (A)(D)(E)(G) | 3,809 | 1,731 | ||||||
Benefit Street Partners CLO XVIII, Ser 2019-18A | ||||||||
0.000%, 10/15/2034 (A)(D)(E)(G) | 3,486 | 2,537 | ||||||
Benefit Street Partners CLO XX, Ser 2020-20A | ||||||||
0.000%, 07/15/2034 (A)(D)(E)(G) | 2,261 | 1,875 | ||||||
Benefit Street Partners CLO XXIII, Ser 2021-23A | ||||||||
0.000%, 04/25/2034 (D)(E) | 3,157 | 2,338 | ||||||
Cathedral Lake CLO III, Ser 2015-3A | ||||||||
0.000%, 01/15/2026 (A)(D)(E)(G) | 2,725 | 681 | ||||||
Cathedral Lake V, Ser 2018-5A | ||||||||
0.000%, 10/21/2030 (A)(D)(E)(G) | 3,139 | 753 | ||||||
Great Lakes CLO, Ser 2015-1A | ||||||||
0.000%, 01/16/2030 (A)(D)(E)(G) | 4,519 | 1,982 | ||||||
Great Lakes CLO, Ser 2015-1A, Cl ER | ||||||||
12.930%, TSFR3M + 7.622%, 01/16/2030 (A)(D)(G) | 3,253 | 3,021 | ||||||
SEI Institutional Managed Trust
241
SCHEDULE OF INVESTMENTS
September 30, 2023
High Yield Bond Fund (Continued)
Description | Face Amount | Market Value | ||||||
ASSET-BACKED SECURITIES (continued) | ||||||||
Great Lakes CLO, Ser 2015-1A, Cl FR | ||||||||
15.570%, TSFR3M + 10.262%, 01/16/2030 (A)(D)(G) | $ | 1,198 | $ | 1,026 | ||||
Great Lakes CLO, Ser 2017-1A, Cl ER | ||||||||
12.760%, TSFR3M + 7.762%, 10/15/2029 (A)(D)(G) | 3,321 | 3,117 | ||||||
Ivy Hill Middle Market Credit Fund VII, Ser 2013-7A | ||||||||
0.000%, 10/20/2033 (A)(D)(E)(G) | 2,484 | 1,385 | ||||||
Ivy Hill Middle Market Credit Fund XII, Ser 2017-12A | ||||||||
0.000%, 07/20/2033 (A)(D)(E)(G) | 651 | 472 | ||||||
Ivy Hill Middle Market Credit Fund XIV, Ser 2018-14A | ||||||||
0.000%, 04/18/2030 (A)(D)(E)(G) | 1,169 | 693 | ||||||
Ivy Hill Middle Market Credit Fund XIV, Ser 2018-14A, Cl D | ||||||||
12.642%, TSFR3M + 7.332%, 04/18/2030 (A)(D)(G) | 1,559 | 1,394 | ||||||
LCM CLO, Ser 31A | ||||||||
0.000%, 01/20/2032 (D)(E) | 1,115 | 662 | ||||||
Lockwood Grove CLO, Ser 2014-1A | ||||||||
0.000%, 01/25/2030 (A)(D)(E)(G) | 3,797 | 778 | ||||||
Lockwood Grove CLO, Ser 2018-1A, Cl ERR | ||||||||
11.463%, TSFR3M + 6.112%, 01/25/2030 (A)(D)(G) | 2,499 | 2,130 | ||||||
Neuberger Berman CLO XXII, Ser 2016-22A | ||||||||
0.000%, 10/17/2027 (A)(D)(E)(G) | 3,640 | 1,056 | ||||||
Neuberger Berman Loan Advisers CLO XLI, Ser 2021-41 | ||||||||
0.000%, 04/15/2034 (D)(E) | 1,924 | 1,314 | ||||||
Neuberger Berman Loan Advisers CLO XXXIX, Ser 2020-39 | ||||||||
0.000%, 01/20/2032 (D)(E) | 3,294 | 1,832 | ||||||
Neuberger Berman Loan Advisers CLO, Ser 2020-36A, Cl INC | ||||||||
0.000%, 04/20/2033 (A)(D)(E)(G) | 1,095 | 690 | ||||||
Neuberger Berman Loan Advisers CLO, Ser 2020-36A, Cl SPIN | ||||||||
0.114%, 04/20/2033 (A)(D)(G) | 14 | 9 | ||||||
NewStar Fairfield Fund CLO, Ser 2015-2A | ||||||||
0.000%, 04/20/2030 (A)(D)(E)(G) | 7,983 | 2,697 | ||||||
OCP CLO, Ser 2017-14A | ||||||||
0.000%, 11/20/2030 (A)(D)(E)(G) | 1,655 | 593 | ||||||
OCP CLO, Ser 2020-19A | ||||||||
0.000%, 10/20/2034 (A)(D)(E)(G) | 1,224 | 1,041 | ||||||
OCP CLO, Ser 2021-21A | ||||||||
0.000%, 07/20/2034 (D)(E) | 4,413 | 3,110 | ||||||
TCP Whitney CLO, Ser 2017-1I | ||||||||
0.000%, 08/20/2029 (D)(E)(G) | 9,085 | 5,469 | ||||||
TCW CLO, Ser 2017-1A | ||||||||
0.000%, 10/29/2034 (A)(D)(E)(G) | 4,194 | 2,223 | ||||||
Description | Face Amount | Market Value | ||||||
ASSET-BACKED SECURITIES (continued) | ||||||||
TCW CLO, Ser 2018-1A | ||||||||
0.000%, 04/25/2031 (A)(D)(E)(G) | $ | 2,978 | $ | 1,274 | ||||
TCW CLO, Ser 2019-2A | ||||||||
0.000%, 10/20/2032 (A)(D)(E)(G) | 3,528 | 2,152 | ||||||
TCW CLO, Ser 2020-1 | ||||||||
0.000%, 04/20/2028 (D)(E) | 5,352 | 2,837 | ||||||
Venture CLO, Ser 2018-35A | ||||||||
0.000%, 10/22/2031 (A)(D)(E)(G) | 11,892 | 3,805 | ||||||
Venture XXV CLO, Ser 2016-25A | ||||||||
0.000%, 04/20/2029 (A)(D)(E)(G) | 2,030 | 305 | ||||||
Venture XXVI CLO, Ser 2017-26A | ||||||||
0.000%, 01/20/2029 (A)(D)(E)(G) | 1,609 | 137 | ||||||
Venture XXVIII CLO, Ser 2017-28A | ||||||||
0.000%, 07/20/2030 (A)(D)(E)(G) | 3,228 | 549 | ||||||
Voya CLO, Ser 2020-2 | ||||||||
0.000%, 07/19/2034 (D)(E) | 4,414 | 3,642 | ||||||
Wind River CLO, Ser 2021-3 | ||||||||
0.000%, 07/20/2033 (D)(E) | 6,577 | 4,334 | ||||||
Total Asset-Backed Securities | ||||||||
(Cost $43,947) ($ Thousands) | 98,517 | |||||||
| ||||||||
COMMON STOCK — 1.1% | ||||||||
21st Century Oncology Private Company *(D) | 15,311 | 218 | ||||||
Aquity Holdings Inc *(C)(D) | 85,745 | 933 | ||||||
Arctic Canadian Diamond Company Ltd *(D) | 1,054 | 330 | ||||||
AVAYA Inc. * | 127,790 | 1,070 | ||||||
Burgundy Diamond Mines * | 2,083,693 | 242 | ||||||
Carestream Health Holdings Inc *(D) | 69,956 | 1,182 | ||||||
CHC Group LLC * | 399 | — | ||||||
Chesapeake Energy Corp | 3,418 | 295 | ||||||
Chord Energy Corp | 1,079 | 175 | ||||||
Clear Channel Outdoor Holdings Inc, Cl A * | 166,327 | 263 | ||||||
Copper Property CTL Pass-Through Trust | 118,100 | 1,252 | ||||||
EP Energy Corp * | 15,235 | 99 | ||||||
Frontier Communications Parent Inc * | 9,642 | 151 | ||||||
Guitar Center *(C)(D) | 13,905 | 2,113 | ||||||
Gulfport Energy Corp * | 3,218 | 382 | ||||||
Gymboree Holding Corp *(C)(D) | 40,312 | — | ||||||
iHeartMedia Inc * | 8,286 | 26 | ||||||
Intelsat Jackson Holdings *(D) | 39,892 | 908 | ||||||
Lannett (D) | 93,813 | 168 | ||||||
Lumileds Common Bright Bidco * | 5,202 | 2 | ||||||
Mallinckrodt PLC *(D) | 8,281 | 1 | ||||||
Medical Card Systems *(D) | 284,758 | 126 | ||||||
Monitronics International (D) | 5,065 | 81 | ||||||
MYT Holding LLC, Ser B *(D) | 274,755 | 96 | ||||||
National CineMedia | 14,231 | 64 | ||||||
Neiman Marcus Group *(D) | 6,554 | 1,147 | ||||||
Nine West FKA Premier Brands *(D) | 92,548 | 56 | ||||||
242
SEI Institutional Managed Trust
Description | Shares | Market Value | ||||||
COMMON STOCK (continued) | ||||||||
Parker Drilling Co *(D) | 79,089 | $ | 1,028 | |||||
Penney Borrower LLC *(D) | 19,723 | 54 | ||||||
Quad/Graphics Inc * | 54 | — | ||||||
SandRidge Energy Inc | 20 | — | ||||||
Serta Simmons Bedding | 11,559 | 127 | ||||||
SSB Equipment Company | 11,559 | — | ||||||
VICI Properties Inc, Cl A ‡ | 31,678 | 922 | ||||||
Windstream Services * | 23,081 | 219 | ||||||
Total Common Stock | ||||||||
(Cost $18,637) ($ Thousands) | 13,730 | |||||||
PREFERRED STOCK — 0.7% | ||||||||
Claire's Stores, 0.000% *(D)(H) | 875 | 976 | ||||||
Crestwood Equity Partners, 9.250% (H) | 113,214 | 1,099 | ||||||
FHLMC, 5.919% (G)(H) | 16,903 | 52 | ||||||
FNMA, 0.000% *(G)(H) | 24,650 | 79 | ||||||
Foresight, 0.000% *(D)(H) | 32,601 | 481 | ||||||
Guitar Center, 0.000% *(C)(D)(H) | 365 | 34 | ||||||
Gulfport Energy Corp cash/0% PIK, 10.000% (D)(H) | 28 | 237 | ||||||
Ladenburg Thalmann Financial Services, 6.500% | 65,290 | 1,179 | ||||||
MPLX, 9.538% (D)(H) | 23,039 | 779 | ||||||
MYT Holding LLC, 10.000% | 325,766 | 204 | ||||||
Qurate Retail, 8.000% | 6,857 | 196 | ||||||
Syniverse, 0.000% *(D)(H) | 3,045,470 | 2,915 | ||||||
Total Preferred Stock | ||||||||
(Cost $8,337) ($ Thousands) | 8,231 | |||||||
| ||||||||
CONVERTIBLE BONDS — 0.5% | ||||||||
Authentic Brands | ||||||||
5.000%, 09/01/2029(D) | $ | 265 | 266 | |||||
Chesapeake Energy Corp (Escrow Security) | ||||||||
5.500%, 09/15/2026(B) | 100 | 2 | ||||||
DISH Network | ||||||||
2.375%, 03/15/2024 | 1,469 | 1,410 | ||||||
3.375%, 08/15/2026 | 465 | 280 | ||||||
Liberty Interactive | ||||||||
4.000%, 11/15/2029 | 123 | 29 | ||||||
3.750%, 02/15/2030 | 3,676 | 910 | ||||||
North Sea Natural Resources | ||||||||
0.000%, (D)(E)(H) | 570 | 570 | ||||||
0.000%, (D)(E) | 80 | 81 | ||||||
Description | Face Amount | Market Value | ||||||
CONVERTIBLE BONDS (continued) | ||||||||
Silver Airways LLC | ||||||||
15.000%, 12/31/2027(D) | $ | 3,196 | $ | 3,196 | ||||
Total Convertible Bonds | ||||||||
(Cost $7,878) ($ Thousands) | 6,744 | |||||||
Number of Warrants | ||||||||
WARRANTS — 0.0% | ||||||||
Guitar Center, Expires 12/22/2070 | ||||||||
Strike Price $100.00 *(C)(D) | 3,680 | 213 | ||||||
Guitar Center, Expires 12/22/2070 | ||||||||
Strike Price $160.00 *(C)(D) | 3,681 | 101 | ||||||
Intelsat Jackson Holdings | ||||||||
Strike Price $– *‡‡(C)(D) | 4 | – | ||||||
Neiman Marcus Group | ||||||||
Strike Price $– *‡‡(D) | 3,938 | 64 | ||||||
Tacora Resources | ||||||||
Strike Price $– *‡‡(C)(D) | 3,398,032 | – | ||||||
Windstream | ||||||||
Strike Price $– *‡‡ | 104 | 1 | ||||||
Total Warrants | ||||||||
(Cost $329) ($ Thousands) | 379 | |||||||
Number of Rights | ||||||||
RIGHTS — 0.0% | ||||||||
Intelsat Jackson Holdings *‡‡(D) | 8,350 | – | ||||||
Total Rights | ||||||||
(Cost $—) ($ Thousands) | – | |||||||
| ||||||||
AFFILIATED PARTNERSHIP — 0.0% | ||||||||
SEI Liquidity Fund, LP | ||||||||
5.410% **†(K) | 1,146 | 1 | ||||||
Total Affiliated Partnership | ||||||||
(Cost $1) ($ Thousands) | 1 | |||||||
CASH EQUIVALENT — 1.1% | ||||||||
SEI Daily Income Trust, Government Fund, Institutional Class | ||||||||
5.210%**† | 13,031,239 | 13,031 | ||||||
Total Cash Equivalent | ||||||||
(Cost $13,031) ($ Thousands) | 13,031 | |||||||
Total Investments in Securities — 98.9% | ||||||||
(Cost $1,290,074) ($ Thousands) | $ | 1,215,989 | ||||||
SEI Institutional Managed Trust
243
SCHEDULE OF INVESTMENTS
September 30, 2023
High Yield Bond Fund (Continued)
A list of the open forward foreign currency contracts held by the Fund at September 30, 2023, is as follows:
Counterparty | Settlement Date | Currency to Deliver | Currency to Receive | Unrealized | ||||||||||||||||||||
Barclays PLC | 12/21/23 | AUD | 620 | USD | 399 | $ | (2 | ) | ||||||||||||||||
| Percentages are based on Net Assets of $1,229,003 ($ Thousands). |
* | Non-income producing security. |
** | The rate reported is the 7-day effective yield as of September 30, 2023. |
‡ | Real Estate Investment Trust. |
‡‡ | Expiration date not available. |
† | Investment in Affiliated Security (see Note 6). |
(A) | Security exempt from registration under Rule 144A of the Securities Act of 1933. These securities may be resold in transactions exempt from registration normally to qualified institutions. On September 30, 2023, the value of these securities amounted to $837,910 ($ Thousands), representing 68.2% of the Net Assets of the Fund. |
(B) | Security is in default on interest payment. |
(C) | Security considered restricted, excluding 144A. The total market value of such securities as of September 30, 2023 was $15,253 ($ Thousands) and represented 1.2% of the Net Assets of the Fund. See table below for acquisition dates and acquisition cost. |
(D) | Level 3 security in accordance with fair value hierarchy. |
(E) | No interest rate available. |
(F) | Step coupon security. Coupon rate will either increase (step-up bond) or decrease (step-down bond) at regular intervals until maturity. Interest rate shown reflects the rate currently in effect. |
(G) | Variable or floating rate security. The rate shown is the effective interest rate as of period end. The rates on certain securities are not based on published reference rates and spreads and are either determined by the issuer or agent based on current market conditions; by using a formula based on the rates of underlying loans; or by adjusting periodically based on prevailing interest rates. |
(H) | Perpetual security with no stated maturity date. |
(I) | Unsettled bank loan. Interest rate may not be available. |
(J) | Zero coupon security. |
(K) | This security was purchased with cash collateral held from securities on loan (see Note 12). The total market value of such securities as of September 30, 2023 was $1 ($ Thousands). |
The following is a summary of the level of inputs used as of September 30, 2023, in valuing the Fund's investments and other financial instruments carried at value ($ Thousands): | ||||||||||||||||
Investments in Securities | Level 1 | Level 2 | Level 3 | Total | ||||||||||||
Corporate Obligations | – | 945,773 | 7,295 | 953,068 | ||||||||||||
Loan Participations | – | 115,367 | 6,921 | 122,288 | ||||||||||||
Asset-Backed Securities | – | – | 98,517 | 98,517 | ||||||||||||
Common Stock | 3,871 | 1,419 | 8,440 | 13,730 | ||||||||||||
Preferred Stock | 1,374 | 1,434 | 5,423 | 8,231 | ||||||||||||
Convertible Bonds | – | 2,630 | 4,114 | 6,744 | ||||||||||||
Warrants | – | 1 | 378 | 379 | ||||||||||||
Rights | – | – | – | ^ | – | ^ | ||||||||||
Affiliated Partnership | – | 1 | – | 1 | ||||||||||||
Cash Equivalent | 13,031 | – | – | 13,031 | ||||||||||||
Total Investments in Securities | 18,276 | 1,066,625 | 131,088 | 1,215,989 | ||||||||||||
Other Financial Instruments | Level 1 | Level 2 | Level 3 | Total | ||||||||||||
Forward Contracts* | ||||||||||||||||
Unrealized Depreciation | – | (2 | ) | – | (2 | ) | ||||||||||
Total Other Financial Instruments | – | (2 | ) | – | (2 | ) | ||||||||||
^ This category includes securities with a value of $0.
* Forward contracts are valued at the unrealized depreciation on the instrument.
The following is a reconciliation of the investments in which significant unobservable inputs (Level 3) were used in determining value ($ Thousands):
Investments in Corporate Obligations | Investments in Loan Participations | Investments in Asset-Backed Securities | Investments in Common Stock | Investments in Preferred Stock | Investments in Convertible Bonds | Investments in Warrants | Investments in Rights | |||||||||||||||||||||||||
Balance as of October 1, 2022 | $ | 538 | $ | 13,138 | $ | 117,365 | $ | 11,298 | $ | 6,339 | $ | 2,030 | $ | 910 | $ | – | ^ | |||||||||||||||
Accrued discounts/premiums | – | 13 | (633 | ) | – | – | 3 | – | – | |||||||||||||||||||||||
Realized gain/(loss) | – | (588 | ) | 8,547 | 193 | 291 | – | – | – | |||||||||||||||||||||||
Change in unrealized appreciation/(depreciation) | (1,000 | ) | 952 | 7,078 | (1,292 | ) | (195 | ) | 279 | (346 | ) | – | ||||||||||||||||||||
Purchases | 703 | 2,536 | 14 | 53 | 363 | 1,859 | – | – | ||||||||||||||||||||||||
Sales | – | (6,427 | ) | (33,854 | ) | (70 | ) | (1,375 | ) | (57 | ) | – | – | |||||||||||||||||||
Net transfer into Level 3 | 7,054 | – | – | 1 | – | – | – | – | ||||||||||||||||||||||||
Net transfer out of Level 3 | – | (2,703 | ) | – | (1,743 | ) | – | – | (186 | ) | – | |||||||||||||||||||||
Ending Balance as of September 30, 2023(1) | $ | 7,295 | $ | 6,921 | $ | 98,517 | $ | 8,440 | $ | 5,423 | $ | 4,114 | $ | 378 | $ | – | ^ | |||||||||||||||
Changes in unrealized gains/(losses) included in earnings related to securities still held at reporting date | $ | (2,155 | ) | $ | 774 | $ | 5,519 | $ | (3,310 | ) | $ | 60 | $ | 278 | $ | (215 | ) | $ | – | |||||||||||||
(1) Of the $131,088 ($ Thousands) in Level 3 securities as of September 30, 2023, $23,969 ($ Thousands) or 2.0% of the Net Assets of the Fund are not valued via third party pricing vendors and broker quotes. When significant, the disclosure of the unobservable inputs and the interrelationships and sensitivity between these inputs are required for those Level 3 securities that are not valued by third party pricing vendors or broker quotes.
^ This category includes securities with a value of $0.
244
SEI Institutional Managed Trust
For the year ended September 30, 2023, there were transfers between Level 2 and Level 3 assets and liabilities due to the availability of observable inputs to determine fair value.
| Category | Market Value at September 30, 2023 ($ Thousands) | Valuation Technique | Unobservable Inputs | Range Input Value(s) (Average Input Value) | ||||||||||||
| Corporate Bonds | 6,522 | Weighted valuation techniques | EBITDA | $32.4m | ||||||||||||
| EBITDA multiple | 5.9x – 11.5x | |||||||||||||||
| Replacement cost per ton | $225 - $2,800 | |||||||||||||||
| Weighted average cost of capital | 12.7% | |||||||||||||||
Priced at $0.01 as a placeholder for future disputed claims related to litigation | None | N/A | ||||||||||||||
Priced at $0.01 as a placeholder for future disputed claims related to litigation | None | N/A | ||||||||||||||
Priced at $0.01 as a placeholder for future disputed claims related to litigation | None | N/A | ||||||||||||||
Estimated recovery model | Estimated total claims case | $418.0M - $419.0m | ||||||||||||||
| Estimated debt claims | $140.0m | |||||||||||||||
Estimated recovery model | Estimated total claims case | $418.0M - $419.0m | ||||||||||||||
| Estimated debt claims | $140.0m | |||||||||||||||
Discounted cash flow model | Implied total yield | 9.8% - 10.8% | ||||||||||||||
Enterprise value coverage analysis | Enterprise value | $350.0m | ||||||||||||||
| Illiquidity discount | 10.0% | |||||||||||||||
| Loan Participations | 5,617 | Discounted cash flow model | Implied total yield | 9.8% - 10.2% | ||||||||||||
Discounted cash flow model | Implied total credit spread | 10.7% - 11.7% | ||||||||||||||
Implied total yield | Implied total yield | 8.1% - 9.1% | ||||||||||||||
Enterprise value coverage analysis | EBITA | $266.0m | ||||||||||||||
| EBITA multiple | 0.40x – 0.60x | |||||||||||||||
| Weighted average cost of capital | 18.0% - 20.0% | |||||||||||||||
Valuation case probability weighting | 12.5% - 75.0% | |||||||||||||||
| Common Stock | 4,218 | Comparable multiple analysis using an average forward EBITDA multiple of publicly traded peers, discounted to account for smaller scale of operations ownership | None | N/A | ||||||||||||
Priced at $0.01 based on the low probability of future payouts | None | N/A | ||||||||||||||
Priced at $0.01 based on the low probability of future payouts | None | N/A | ||||||||||||||
Weighted valuation techniques | Equity value | $240.0m | ||||||||||||||
| Illiquidity discount | 20.0% | |||||||||||||||
Market comparable approach | EBITDA | $156.0m - $176.0m | ||||||||||||||
| EBITDA multiple | 3.75x - 4.75x | |||||||||||||||
Valuation case probability weighting | 33.0% | |||||||||||||||
Weighted valuation techniques | EBITDA | $140.0m - $173.0m | ||||||||||||||
| EBITDA multiple | 5.25x - 7.50x | |||||||||||||||
| Weighted average cost of capital | 18.3% | |||||||||||||||
Valuation case probability weighting | 50.0% | |||||||||||||||
Weighted valuation techniques | EBITDA | $266.0m | ||||||||||||||
| EBITDA multiple | 0.40x – 0.60x | |||||||||||||||
| Weighted average cost of capital | 18.0% - 20.0% | |||||||||||||||
Valuation case probability weighting | 12.5% - 75.0% | |||||||||||||||
Estimated recovery model | Estimated excess RBC | $32.0m | ||||||||||||||
| Estimated indemnity escrow | $25.0m | |||||||||||||||
| Discount rate | 40.0% - 50.0% | |||||||||||||||
Discounted cash flow model | Deferred cash + earn out payments | $28.0m | ||||||||||||||
| Discount rate | 5.6% - 7.7% | |||||||||||||||
Cost of equity | 20.0% - 25.0% | |||||||||||||||
| Preferred Stock | 3,186 | Priced base off conversion value to the common stock. Details: $1,000 par value per preferred share is convertible into GPOR common stock at $14.00 per share conversion price, therefore each preferred share is convertible into ~71.43 GPOR common shares. Valuation methodology is 1 GPOR preferred share equals 71.43 x GPOR common stock price. | None | N/A | ||||||||||||
SEI Institutional Managed Trust
245
SCHEDULE OF INVESTMENTS
September 30, 2023
High Yield Bond Fund (Concluded)
Weighted valuation techniques | EBITDA | $140.0m - $173.0m | ||||||||||||||
| EBITDA multiple | 5.25x – 7.50x | |||||||||||||||
| Weighted average cost of capital | 18.3% | |||||||||||||||
Valuation case probability weighting | 50.0% | |||||||||||||||
Comparable yield approach | Implied total yield | 12.3% - 14.3% | ||||||||||||||
| Convertible Bonds | 4,113 | Guideline public company analysis | EBITDA | $1,074.0m - $1,119.0m | ||||||||||||
| EBITDA multiple | 18.0x – 20.5x | |||||||||||||||
Milestone approach | Convertible note balance | $44.3m | ||||||||||||||
| Converted equity balance | 50.2% | |||||||||||||||
| Projected barrels | 2.9bn | |||||||||||||||
Milestone approach | Convertible note balance | $44.3m | ||||||||||||||
| Converted equity balance | 50.2% | |||||||||||||||
| Projected barrels | 2.9bn | |||||||||||||||
Discounted cash flow model | Implied total yield | 18.0% - 20.0% | ||||||||||||||
| Warrants | 313 | Weighted valuation techniques | EBITDA | $140.0m – $173.0m | ||||||||||||
| EBITDA multiple | 5.25x – 7.50x | |||||||||||||||
| Weighted average cost of capital | 18.3% | |||||||||||||||
Valuation case probability weighting | 50.0% | |||||||||||||||
Weighted valuation techniques | EBITDA | $140.0m - $173.0m | ||||||||||||||
| EBITDA multiple | 5.25x – 7.50x | |||||||||||||||
| Weighted average cost of capital | 18.3% | |||||||||||||||
Valuation case probability weighting | 50.0% | |||||||||||||||
Weighted valuation techniques | EBITDA | $140.0m - $173.0m | ||||||||||||||
| EBITDA multiple | 5.25x – 7.50x | |||||||||||||||
| Weighted average cost of capital | 18.3% | |||||||||||||||
Valuation case probability weighting | �� | 50.0% | ||||||||||||||
Total | $ | 23,969 | ||||||||||||||
For more information on valuation inputs, see Note 2 – Significant Accounting Policies in Notes to Financial Statements.
The following is a summary of the Fund’s transactions with affiliates for the year ended September 30, 2023 ($ Thousands):
Security Description | Value 9/30/2022 | Purchases at Cost | Proceeds from Sales | Realized Gain/ (Loss) | Change in Unrealized Appreciation/ (Depreciation) | Value 9/30/2023 | Income | Capital Gains | ||||||||||||||||||||||||
SEI Liquidity Fund, LP | $ | 1 | $ | — | $ | — | $ | — | $ | — | $ | 1 | $ | — | $ | — | ||||||||||||||||
SEI Daily Income Trust, Government Fund, Institutional Class | 15,930 | 542,590 | (545,489 | ) | — | — | 13,031 | 1,294 | — | |||||||||||||||||||||||
Totals | $ | 15,931 | $ | 542,590 | $ | (545,489 | ) | $ | — | $ | — | $ | 13,032 | $ | 1,294 | $ | — | |||||||||||||||
246
SEI Institutional Managed Trust
A list of the restricted securities, excluding 144a, held by the Fund at September 30, 2023, is as follows:
Description | Face Amount ($ Thousands)/ Number of Shares/Number of Warrants | Acquisition Date | Cost ($ Thousands) | Market Value | ||||||||||||
Corporate Obligations | ||||||||||||||||
Akumin | $ | 3,955 | 10/26/2020 | $ | 3,600 | $ | 2,966 | |||||||||
Akumin Escrow | 1,230 | 7/30/2021 | 1,202 | 816 | ||||||||||||
Audacy Capital | 3,784 | 3/12/2021 | 3,170 | 71 | ||||||||||||
Audacy Capital | 1,717 | 4/24/2019 | 1,113 | 34 | ||||||||||||
Cornerstone Chemical | 703 | 9/28/2023 | 703 | 703 | ||||||||||||
Cornerstone Chemical | 7,095 | 3/15/2023 | 6,850 | 4,257 | ||||||||||||
Tacora Resources | 127 | 5/24/2023 | 123 | 127 | ||||||||||||
Tacora Resources | 1,685 | 5/7/2021 | 1,753 | 918 | ||||||||||||
Loan Participations | ||||||||||||||||
Cornerstone Chemical - Unfunded Term Loan | 328 | 9/6/2023 | – | – | ||||||||||||
GatesAir, Term Loan | 1,138 | 8/9/2022 | 1,110 | 1,138 | ||||||||||||
Premier Brands Group Holdings LLC, Initial Loan, 1st Lien | 1,109 | 3/21/2019 | 1,081 | 829 | ||||||||||||
Common Stock | ||||||||||||||||
Aquity Holdings Inc | 85,745 | 3/12/2019 | – | 933 | ||||||||||||
Guitar Center | 13,905 | 1/8/2021 | 1,762 | 2,113 | ||||||||||||
Gymboree Holding Corp | 40,312 | 10/2/2017 | 672 | – | ||||||||||||
Preferred Stock | ||||||||||||||||
Guitar Center | 365 | 1/8/2021 | 34 | 34 | ||||||||||||
Warrants | ||||||||||||||||
Guitar Center | 3,680 | 1/8/2021 | 197 | 213 | ||||||||||||
Guitar Center | 3,681 | 1/8/2021 | 132 | 101 | ||||||||||||
Intelsat Jackson Holdings | 4 | 3/3/2022 | – | – | ||||||||||||
Tacora Resources | 3,398,032 | 5/24/2023 | – | – | ||||||||||||
| $ | 23,502 | $ | 15,253 | |||||||||||||
Amounts designated as “—” are either $0 or have been rounded to $0.
See “Glossary” for abbreviations.
The accompanying notes are an integral part of the financial statements.
SEI Institutional Managed Trust
247
SCHEDULE OF INVESTMENTS
September 30, 2023
Conservative Income Fund

† | Percentages are based on total investments. Total investments do not include derivatives such as options, futures contracts, forward contracts, and swap contracts, if applicable. |
Description | Face Amount | Market Value | ||||||
COMMERCIAL PAPER — 46.0% | ||||||||
Consumer Discretionary — 4.6% | ||||||||
American Honda Finance | ||||||||
5.571%, 10/24/2023 (A) | $ | 4,000 | $ | 3,985 | ||||
Hyundai Capital America | ||||||||
5.504%, 10/26/2023 (A)(B) | 4,000 | 3,983 | ||||||
Mercedes-Benz Finance North America | ||||||||
5.361%, 10/11/2023 (A)(B) | 10,000 | 9,983 | ||||||
VW Credit | ||||||||
5.611%, 11/02/2023 (A)(B) | 4,000 | 3,979 | ||||||
| 21,930 | ||||||||
Consumer Staples — 0.8% | ||||||||
Keurig Dr Pepper | ||||||||
5.498%, 10/10/2023 (A)(B) | 4,000 | 3,993 | ||||||
Financials — 37.4% | ||||||||
Albion Capital | ||||||||
5.272%, 10/20/2023 (A) | 2,000 | 1,994 | ||||||
Alinghi Funding | ||||||||
5.706%, 03/28/2024 (A)(B) | 2,000 | 1,943 | ||||||
5.653%, 01/04/2024 (A)(B) | 7,000 | 6,896 | ||||||
ANZ Bank New Zealand | ||||||||
5.314%, 11/09/2023 (A)(B) | 1,620 | 1,610 | ||||||
Aquitaine Funding | ||||||||
5.355%, 10/02/2023 (A)(B) | 10,000 | 9,996 | ||||||
Australia & New Zealand Banking Group | ||||||||
5.863%, 07/30/2024 (A)(B) | 1,000 | 953 | ||||||
5.544%, 11/08/2023 (A)(B) | 4,000 | 3,976 | ||||||
Autobahn Funding | ||||||||
5.415%, 10/13/2023 (A)(B) | 5,000 | 4,990 | ||||||
Bayerische Landesbank | ||||||||
5.336%, 10/06/2023 (A) | 10,000 | 9,990 | ||||||
Bedford Row Funding | ||||||||
5.356%, 10/04/2023 (A)(B) | 10,000 | 9,993 | ||||||
BNG Bank | ||||||||
5.343%, 10/05/2023 (A)(B) | 7,000 | 6,994 | ||||||
BPCE | ||||||||
5.822%, 02/07/2024 (A)(B) | 3,000 | 2,939 | ||||||
Britannia Funding | ||||||||
5.622%, 12/07/2023 (A)(B) | 1,500 | 1,484 | ||||||
Description | Face Amount | Market Value | ||||||
COMMERCIAL PAPER (continued) | ||||||||
5.605%, 10/10/2023 (A)(B) | $ | 3,000 | $ | 2,995 | ||||
5.436%, 10/24/2023 (A)(B) | 4,000 | 3,985 | ||||||
CDP Financial | ||||||||
5.580%, 12/04/2023 (A)(B) | 4,000 | 3,960 | ||||||
5.555%, 05/29/2024 (A)(B) | 10,000 | 9,622 | ||||||
Chariot Funding | ||||||||
5.393%, 10/20/2023 (A)(B) | 6,000 | 5,981 | ||||||
Charta | ||||||||
5.587%, 10/05/2023 (A)(B) | 5,000 | 4,995 | ||||||
5.566%, 10/04/2023 (A)(B) | 3,000 | 2,998 | ||||||
Columbia Funding | ||||||||
5.807%, 02/01/2024 (A)(B) | 1,600 | 1,569 | ||||||
5.803%, 03/05/2024 (A)(B) | 5,300 | 5,169 | ||||||
Cooperatieve Rabobank UA | ||||||||
5.583%, 12/01/2023 (A) | 2,000 | 1,981 | ||||||
DNB Bank | ||||||||
5.899%, 06/13/2024 (A)(B) | 3,000 | 2,880 | ||||||
Federation des Caisses Desjardins du Quebec | ||||||||
5.578%, 12/05/2023 (A)(B) | 3,000 | 2,969 | ||||||
FMS Wertmanagement | ||||||||
5.688%, 05/03/2024 (A)(B) | 500 | 483 | ||||||
0.000%, 05/02/2024 (B)(C) | 500 | 484 | ||||||
ING US Funding | ||||||||
5.395%, 11/08/2007 (A) | 1,500 | 1,491 | ||||||
Lloyds Bank | ||||||||
5.446%, 11/13/2023 (A) | 3,000 | 2,979 | ||||||
Longship Funding | ||||||||
5.364%, 10/02/2023 (A)(B) | 3,000 | 2,998 | ||||||
5.336%, 10/04/2023 (A)(B) | 7,000 | 6,995 | ||||||
LSEGA Financing | ||||||||
5.540%, 11/02/2023 (A)(B) | 4,000 | 3,979 | ||||||
Mackinac Funding | ||||||||
5.814%, 03/06/2024 (A)(B) | 2,000 | 1,950 | ||||||
5.785%, 03/15/2024 (A)(B) | 2,000 | 1,947 | ||||||
Macquarie Bank | ||||||||
5.556%, 11/01/2023 (A)(B) | 5,000 | 4,975 | ||||||
5.327%, 11/06/2023 (A)(B) | 730 | 726 | ||||||
5.188%, 10/23/2023 (A)(B) | 3,000 | 2,989 | ||||||
Mitsubishi HC Finance America | ||||||||
5.594%, 10/16/2023 (A) | 4,000 | 3,990 | ||||||
National Australia Bank | ||||||||
5.787%, 04/15/2024 (A)(B) | 2,000 | 1,939 | ||||||
Podium Funding Trust | ||||||||
5.774%, 01/16/2024 (A) | 2,500 | 2,458 | ||||||
5.744%, 02/08/2024 (A) | 2,500 | 2,449 | ||||||
5.433%, 11/06/2023 (A) | 3,500 | 3,480 | ||||||
Pricoa Short Term Funding | ||||||||
5.808%, 05/06/2024 (A)(B) | 3,000 | 2,897 | ||||||
Sony Capital | ||||||||
5.456%, 10/03/2023 (A)(B) | 4,000 | 3,998 | ||||||
248
SEI Institutional Managed Trust
Description | Face Amount | Market Value | ||||||
COMMERCIAL PAPER (continued) | ||||||||
Svenska Handelsbanken | ||||||||
5.871%, 06/03/2024 (A) | $ | 1,060 | $ | 1,019 | ||||
Swedbank | ||||||||
5.806%, 03/14/2024 (A) | 2,000 | 1,948 | ||||||
UBS | ||||||||
5.990%, 05/31/2024 (A)(B) | 1,000 | 961 | ||||||
Versailles Commercial Paper | ||||||||
5.801%, 01/02/2024 (A) | 2,000 | 1,971 | ||||||
5.786%, 03/04/2024 (A) | 2,000 | 1,951 | ||||||
Victory Receivables | ||||||||
5.558%, 10/11/2023 (A)(B) | 3,000 | 2,995 | ||||||
Westpac Banking | ||||||||
5.697%, 03/13/2024 (A)(B) | 2,500 | 2,436 | ||||||
| 179,350 | ||||||||
Industrials — 1.5% | ||||||||
Penske Truck Leasing | ||||||||
5.542%, 10/23/2023 (A) | 4,000 | 3,985 | ||||||
ST Engineering North America | ||||||||
5.447%, 11/02/2023 (A)(B) | 3,000 | 2,985 | ||||||
| 6,970 | ||||||||
Materials — 1.7% | ||||||||
Amcor Finance USA | ||||||||
5.575%, 10/17/2023 (A)(B) | 4,000 | 3,989 | ||||||
Vulcan Materials | ||||||||
5.493%, 10/03/2023 (A)(B) | 4,000 | 3,997 | ||||||
| 7,986 | ||||||||
Total Commercial Paper | ||||||||
(Cost $220,313) ($ Thousands) | 220,229 | |||||||
CORPORATE OBLIGATIONS — 6.1% | ||||||||
Consumer Discretionary — 0.8% | ||||||||
Jets Stadium Development | ||||||||
5.920%, 04/01/2047 (B)(D) | 3,900 | 3,900 | ||||||
Financials — 5.3% | ||||||||
Bank of Nova Scotia | ||||||||
5.800%, SOFRRATE + 0.490%, 01/26/2024 | 1,000 | 1,001 | ||||||
Credit Agricole Corporate and Investment Bank | ||||||||
5.710%, SOFRRATE + 0.380%, 11/17/2023 (D) | 2,000 | 2,001 | ||||||
National Australia Bank | ||||||||
5.820%, 04/08/2024 | 3,000 | 2,999 | ||||||
5.820%, 04/12/2024 | 1,000 | 1,001 | ||||||
Old Line Funding | ||||||||
5.700%, 01/08/2024 | 3,000 | 3,001 | ||||||
Description | Face Amount | Market Value | ||||||
CORPORATE OBLIGATIONS (continued) | ||||||||
Podium Funding Trust | ||||||||
5.720%, 01/03/2024 | $ | 1,000 | $ | 1,000 | ||||
State Street Bank & Trust | ||||||||
5.830%, SOFRRATE + 0.500%, 03/28/2024 (D) | 2,000 | 2,001 | ||||||
Sumitomo Mitsui Banking | ||||||||
5.660%, SOFRRATE + 0.340%, 11/13/2023 (D) | 2,500 | 2,501 | ||||||
Svenska Handelsbanken NY | ||||||||
5.880%, SOFRRATE + 0.550%, 04/29/2024 (D) | 2,000 | 2,002 | ||||||
Thunder Bay Funding | ||||||||
5.700%, 01/08/2024 | 2,000 | 2,001 | ||||||
Wells Fargo Bank | ||||||||
5.970%, SOFRRATE + 0.640%, 07/17/2024 (D) | 1,000 | 1,001 | ||||||
5.830%, SOFRRATE + 0.500%, 01/22/2024 (D) | 2,000 | 2,002 | ||||||
Westpac Banking | ||||||||
5.900%, SOFRRATE + 0.580%, 05/17/2024 (D) | 1,000 | 1,001 | ||||||
5.800%, 04/19/2024 | 2,000 | 2,001 | ||||||
| 25,513 | ||||||||
Total Corporate Obligations | ||||||||
(Cost $29,400) ($ Thousands) | 29,413 | |||||||
U.S. TREASURY OBLIGATIONS — 1.6% | ||||||||
U.S. Treasury Note | ||||||||
5.587%, USBMMY3M + 0.169%, 04/30/2025 (D) | 500 | 500 | ||||||
5.403%, USBMMY3M + -0.015%, 01/31/2024 (D) | 7,000 | 7,000 | ||||||
Total U.S. Treasury Obligations | ||||||||
(Cost $7,502) ($ Thousands) | 7,500 | |||||||
CERTIFICATES OF DEPOSIT — 27.1% | ||||||||
Australia & New Zealand Banking Group | ||||||||
5.810%, 04/02/2024 (B) | 1,000 | 1,001 | ||||||
Bank of America | ||||||||
6.000%, 08/21/2024 | 1,000 | 1,000 | ||||||
5.950%, 07/15/2024 | 1,000 | 1,001 | ||||||
5.900%, 05/14/2024 | 2,000 | 2,000 | ||||||
5.750%, 01/09/2024 | 2,750 | 2,750 | ||||||
5.440%, 02/06/2024 | 1,839 | 1,839 | ||||||
5.250%, 01/31/2024 | 3,000 | 3,000 | ||||||
Bank of Nova Scotia | ||||||||
5.820%, 11/06/2023 (B) | 2,000 | 2,001 | ||||||
SEI Institutional Managed Trust
249
SCHEDULE OF INVESTMENTS
September 30, 2023
Conservative Income Fund (Concluded)
Description | Face Amount | Market Value | ||||||
CERTIFICATES OF DEPOSIT (continued) | ||||||||
5.820%, 06/13/2024 | $ | 1,500 | $ | 1,500 | ||||
BNP Paribas NY | ||||||||
5.950%, 02/05/2024 | 1,200 | 1,202 | ||||||
5.250%, 01/31/2024 | 2,000 | 1,996 | ||||||
BNZ International Funding | ||||||||
5.701%, 10/27/2023 (B) | 2,000 | 2,000 | ||||||
BPCE | ||||||||
5.690%, 10/31/2023 (B) | 5,000 | 5,001 | ||||||
Canadian Imperial Bank of Commerce NY | ||||||||
5.930%, 06/28/2024 | 1,500 | 1,499 | ||||||
5.800%, 06/07/2024 | 2,500 | 2,497 | ||||||
5.600%, 12/01/2023 | 2,000 | 2,001 | ||||||
5.600%, 03/04/2024 | 1,500 | 1,500 | ||||||
5.400%, 11/09/2023 | 1,000 | 1,000 | ||||||
5.400%, 02/08/2024 | 2,000 | 1,998 | ||||||
Citibank | ||||||||
5.920%, 06/20/2024 | 2,000 | 2,000 | ||||||
5.890%, 05/10/2024 | 2,000 | 2,000 | ||||||
5.880%, 05/08/2024 | 2,000 | 2,000 | ||||||
5.800%, 02/26/2024 | 725 | 725 | ||||||
5.800%, 03/04/2024 | 2,000 | 2,000 | ||||||
5.800%, 03/18/2024 | 1,500 | 1,500 | ||||||
Collateralized Commercial Paper V | ||||||||
5.790%, 02/15/2024 | 2,000 | 2,000 | ||||||
Commonwealth Bank of Australia | ||||||||
5.800%, 03/18/2024 (B) | 2,500 | 2,502 | ||||||
5.400%, 02/16/2024 (B) | 1,250 | 1,249 | ||||||
Concord Minutemen Capital | ||||||||
5.660%, 12/07/2023 | 3,500 | 3,500 | ||||||
Credit Agricole Corporate and Investment Bank | ||||||||
0.000%, 12/13/2023 | 1,000 | 1,000 | ||||||
DNB Bank | ||||||||
5.790%, 04/29/2024 (B) | 1,000 | 1,000 | ||||||
HSBC Bank | ||||||||
5.970%, 07/25/2024 (B) | 2,000 | 2,002 | ||||||
5.380%, 11/08/2023 | 5,000 | 4,999 | ||||||
Macquarie Bank | ||||||||
5.740%, 01/16/2024 (B) | 4,000 | 4,001 | ||||||
5.680%, 02/16/2024 (B) | 3,000 | 3,001 | ||||||
Mitsubishi UFJ Trust and Banking | ||||||||
5.710%, 02/14/2024 | 2,500 | 2,501 | ||||||
5.330%, 10/03/2023 | 5,000 | 5,000 | ||||||
Mizuho Bank | ||||||||
5.750%, 01/31/2024 | 3,000 | 3,001 | ||||||
5.710%, 02/20/2024 | 3,000 | 3,001 | ||||||
5.650%, 10/20/2023 | 3,500 | 3,501 | ||||||
MUFG Bank | ||||||||
5.620%, 11/01/2023 | 4,000 | 4,001 | ||||||
Natixis NY | ||||||||
5.220%, 10/13/2023 | 1,500 | 1,500 | ||||||
Description | Face Amount | Market Value | ||||||
CERTIFICATES OF DEPOSIT (continued) | ||||||||
Nordea Bank Abp | ||||||||
5.850%, 04/26/2024 | $ | 1,175 | $ | 1,176 | ||||
5.830%, 04/12/2024 | 2,000 | 2,002 | ||||||
Royal Bank of Canada | ||||||||
6.100%, 10/19/2023 | 1,000 | 1,000 | ||||||
5.960%, 09/19/2024 | 1,500 | 1,501 | ||||||
5.900%, 05/23/2024 (B) | 1,750 | 1,752 | ||||||
Standard Chartered Bank NY | ||||||||
5.210%, 10/31/2023 | 2,000 | 1,999 | ||||||
Starbird Funding | ||||||||
5.660%, 03/07/2024 (B) | 2,000 | 2,000 | ||||||
5.650%, 11/10/2023 (B) | 4,000 | 4,001 | ||||||
Sumitomo Mitsu Banking | ||||||||
6.230%, 11/30/2023 | 1,000 | 1,001 | ||||||
5.790%, 01/08/2024 | 2,000 | 2,001 | ||||||
5.730%, 01/29/2024 | 3,000 | 3,002 | ||||||
5.710%, 02/20/2024 | 3,000 | 3,001 | ||||||
Sumitomo Mitsui Trust Bank | ||||||||
5.600%, 11/29/2023 | 2,000 | 2,000 | ||||||
Toronto-Dominion Bank | ||||||||
6.000%, 10/02/2024 | 2,000 | 2,002 | ||||||
5.800%, 01/29/2024 | 3,000 | 3,002 | ||||||
5.270%, 01/24/2024 | 2,000 | 1,996 | ||||||
Toyota Motor Credit | ||||||||
5.687%, 02/22/2024 | 910 | 910 | ||||||
Westpac Banking | ||||||||
5.820%, 04/19/2024 (B) | 1,000 | 1,001 | ||||||
Total Certificates of Deposit | ||||||||
(Cost $130,098) ($ Thousands) | 130,117 | |||||||
| ||||||||
CASH EQUIVALENT — 0.0% | ||||||||
SEI Daily Income Trust, Government Fund, Institutional Class | ||||||||
5.210%**† | 107,051 | 107 | ||||||
Total Cash Equivalent | ||||||||
(Cost $107) ($ Thousands) | 107 | |||||||
Face Amount | ||||||||
REPURCHASE AGREEMENTS — 18.8% | ||||||||
Bank of America Securities | ||||||||
5.300%, dated 9/29/2023, to be repurchased on 10/2/2023, repurchase price $62,127,429 (collateralized by various FCSB obligations, ranging in par value $2,296,000 - $29,252,000, 0.320% - 4.490%, 6/17/2024 - 4/20/2037; with total market value $63,342,022) (E) | $ | 62,100 | 62,100 | |||||
250
SEI Institutional Managed Trust
Description | Face Amount | Market Value | ||||||
REPURCHASE AGREEMENTS (continued) | ||||||||
Goldman Sachs & Co | ||||||||
5.300%, dated 9/29/2023, to be repurchased on 10/2/2023, repurchase price $20,008,832 (collateralized by various GNMA obligations, ranging in par value $500,000 - $16,728,697, 3.180% - 5.500%, 12/15/2038 - 10/15/2057; with total market value $20,400,000) (E) | $ | 20,000 | $ | 20,000 | ||||
TD Securities | ||||||||
5.310%, dated 9/29/2023, to be repurchased on 10/2/2023, repurchase price $8,003,540 (collateralized by various U.S. Treasury obligations, ranging in par value $42,800 - $603,400, 0.500% - 4.125%, 11/30/2023 - 12/31/2029; with total market value $8,160,083) (E) | 8,000 | 8,000 | ||||||
Total Repurchase Agreements | ||||||||
(Cost $90,100) ($ Thousands) | 90,100 | |||||||
Total Investments in Securities — 99.6% | ||||||||
(Cost $477,520) ($ Thousands) | $ | 477,466 | ||||||
| Percentages are based on Net Assets of $479,303 ($ Thousands). |
** | The rate reported is the 7-day effective yield as of September 30, 2023. |
† | Investment in Affiliated Security (see Note 6). |
(A) | Interest rate represents the security's effective yield at the time of purchase. |
(B) | Security exempt from registration under Rule 144A of the Securities Act of 1933. These securities may be resold in transactions exempt from registration normally to qualified institutions. On September 30, 2023, the value of these securities amounted to $210,970 ($ Thousands), representing 44.0% of the Net Assets of the Fund. |
(C) | No interest rate available. |
(D) | Variable or floating rate security. The rate shown is the effective interest rate as of period end. The rates on certain securities are not based on published reference rates and spreads and are either determined by the issuer or agent based on current market conditions; by using a formula based on the rates of underlying loans; or by adjusting periodically based on prevailing interest rates. |
(E) | Tri-Party Repurchase Agreement. |
The following is a summary of the level of inputs used as of September 30, 2023, in valuing the Fund's investments and other financial instruments carried at value ($ Thousands): | ||||||||||||||||
Investments in Securities | Level 1 | Level 2 | Level 3 | Total | ||||||||||||
Commercial Paper | – | 220,229 | – | 220,229 | ||||||||||||
Corporate Obligations | – | 29,413 | – | 29,413 | ||||||||||||
U.S. Treasury Obligations | – | 7,500 | – | 7,500 | ||||||||||||
Certificates of Deposit | – | 130,117 | – | 130,117 | ||||||||||||
Cash Equivalent | 107 | – | – | 107 | ||||||||||||
Repurchase Agreements | – | 90,100 | – | 90,100 | ||||||||||||
Total Investments in Securities | 107 | 477,359 | – | 477,466 | ||||||||||||
For more information on valuation inputs, see Note 2 – Significant Accounting Policies in Notes to Financial Statements.
The following is a summary of the Fund’s transactions with affiliates for the year ended September 30, 2023 ($ Thousands):
Security Description | Value 9/30/2022 | Purchases at Cost | Proceeds from Sales | Realized Gain/ (Loss) | Change in Unrealized Appreciation/ (Depreciation) | Value 9/30/2023 | Income | Capital Gains | ||||||||||||||||||||||||
SEI Daily Income Trust, Government Fund, Institutional Class | $ | — | $ | 7,627,739 | $ | (7,627,632 | ) | $ | — | $ | — | $ | 107 | $ | 23 | $ | — | |||||||||||||||
Amounts designated as “—” are either $0 or have been rounded to $0.
See “Glossary” for abbreviations.
The accompanying notes are an integral part of the financial statements.
SEI Institutional Managed Trust
251
SCHEDULE OF INVESTMENTS
September 30, 2023
Tax-Free Conservative Income Fund

† | Percentages are based on total investments. Total investments do not include derivatives such as options, futures contracts, forward contracts, and swap contracts, if applicable. |
Description | Face Amount | Market Value | ||||||
MUNICIPAL BONDS — 99.6% | ||||||||
Alabama — 1.7% | ||||||||
Mobile, Industrial Development Board, RB | ||||||||
3.150%, 06/01/2034 (A) | $ | 2,900 | $ | 2,900 | ||||
Arizona — 0.9% | ||||||||
Yavapai County, Industrial Development Authority, Drake Cement Project, Ser A, RB | ||||||||
4.050%, 09/01/2035 (A)(B) | 1,500 | 1,500 | ||||||
Colorado — 2.9% | ||||||||
Colorado Springs, Utilities System Revenue, Ser C-REMK, RB | ||||||||
4.050%, 11/01/2040 (A) | 1,150 | 1,150 | ||||||
3.850%, 11/01/2028 (A) | 3,700 | 3,700 | ||||||
| 4,850 | ||||||||
Connecticut — 5.0% | ||||||||
Connecticut State, Health & Educational Facilities Authority, Gaylord Hospital, Ser B, RB | ||||||||
3.880%, 07/01/2037 (A)(B) | 2,500 | 2,500 | ||||||
Connecticut State, Housing Finance Authority, Mortgage Finance Program, Sub-Ser F-3, RB | ||||||||
4.100%, 05/15/2040 (A) | 3,000 | 3,000 | ||||||
Connecticut State, Ser C, GO | ||||||||
3.880%, 05/15/2034 (A) | 2,870 | 2,870 | ||||||
| 8,370 | ||||||||
Delaware — 0.4% | ||||||||
University of Delaware, RB | ||||||||
2.900%, 11/01/2035 (A) | 750 | 750 | ||||||
District of Columbia — 0.4% | ||||||||
Tender Option Bond Trust Receipts, Ser 2019-XG0267, RB | ||||||||
4.030%, 10/01/2053 (A)(B)(C) | 610 | 610 | ||||||
Florida — 6.0% | ||||||||
Gainesville, Utilities System Revenue, Ser B-REMK, RB | ||||||||
3.000%, 10/01/2042 (A) | 2,000 | 2,000 | ||||||
Hillsborough County, Industrial Development Authority, Baycare Health Systems, RB | ||||||||
2.900%, 11/01/2038 (A)(B) | 1,000 | 1,000 | ||||||
Description | Face Amount | Market Value | ||||||
MUNICIPAL BONDS (continued) | ||||||||
Lucie County, Florida Power & Light Project, RB | ||||||||
3.100%, 09/01/2028 (A) | $ | 7,050 | $ | 7,050 | ||||
| 10,050 | ||||||||
Georgia — 0.2% | ||||||||
Georgia State, Main Street Natural Gas, Ser B, RB | ||||||||
5.000%, 03/01/2024 | 290 | 290 | ||||||
Idaho — 0.7% | ||||||||
Idaho State, Housing & Finance Association, Traditions at Boise Apartments Project, Ser A, RB | ||||||||
3.250%, 09/01/2044 (A) | 1,100 | 1,100 | ||||||
Illinois — 3.2% | ||||||||
Illinois State, Development Finance Authority, YMCA Metropolitan Chicago Project, RB | ||||||||
3.450%, 06/01/2029 (A)(B) | 3,800 | 3,800 | ||||||
Illinois State, Finance Authority, University of Chicago, RB | ||||||||
3.970%, 07/01/2038 (A) | 1,500 | 1,500 | ||||||
| 5,300 | ||||||||
Indiana — 1.1% | ||||||||
Tender Option Bond Trust Receipts, Ser 2016-XL0019, RB | ||||||||
4.130%, 04/01/2030 (A)(C) | 1,770 | 1,770 | ||||||
Iowa — 5.8% | ||||||||
Iowa State, Finance Authority, Disaster Area Economic Development, CJ Bio America Project, RB | ||||||||
3.970%, 12/01/2041 (A)(B)(C) | 7,500 | 7,500 | ||||||
Iowa State, Finance Authority, Mortgage-Backed Securities Program, RB, GNMA/FNMA/FHLMC | ||||||||
3.950%, 01/01/2047 (A) | 700 | 700 | ||||||
Iowa State, Finance Authority, Pollution Control Facilities, MidAmerican Energy Project, RB | ||||||||
3.400%, 09/01/2036 (A) | 1,600 | 1,600 | ||||||
| 9,800 | ||||||||
Louisiana — 0.9% | ||||||||
Saint James Parish, Nucor Steel Louisiana LLC Project, Ser 2010A-1, RB | ||||||||
3.840%, 11/01/2040 (A) | 1,500 | 1,500 | ||||||
252
SEI Institutional Managed Trust
Description | Face Amount | Market Value | ||||||
MUNICIPAL BONDS (continued) | ||||||||
Maryland — 0.6% | ||||||||
Maryland State, Community Development Administration, Department of Housing and Community Development, Crusader Arms Apartments Project, Ser D, RB | ||||||||
3.900%, 02/01/2041 (A) | $ | 1,070 | $ | 1,070 | ||||
Massachusetts — 1.2% | ||||||||
Somerville, GO | ||||||||
5.000%, 05/30/2024 | 2,000 | 2,016 | ||||||
Michigan — 0.8% | ||||||||
Central Michigan University, Ser A, RB | ||||||||
3.900%, 10/01/2032 (A)(B) | 1,400 | 1,400 | ||||||
Mississippi — 3.3% | ||||||||
Mississippi State, Business Finance, Chevron USA Project, Ser D, RB | ||||||||
3.000%, 12/01/2030 (A) | 2,400 | 2,400 | ||||||
Mississippi State, Business Finance, Chevron USA Project, Ser J, RB | ||||||||
3.000%, 11/01/2035 (A) | 3,200 | 3,200 | ||||||
| 5,600 | ||||||||
Missouri — 4.1% | ||||||||
Kansas City, Special Obligation, H Roe Bartle Project, Ser E, RB | ||||||||
3.350%, 04/15/2034 (A)(B) | 3,300 | 3,300 | ||||||
RBC Municipal Products Trust, Ser C-16, RB | ||||||||
4.030%, 09/01/2039 (A)(B)(C) | 3,500 | 3,500 | ||||||
| 6,800 | ||||||||
Nevada — 2.4% | ||||||||
Clark County, Department of Aviation, Sub-Ser D-2B, RB | ||||||||
3.350%, 07/01/2040 (A)(B) | 4,000 | 4,000 | ||||||
New Jersey — 8.2% | ||||||||
Cranford, GO | ||||||||
5.000%, 06/20/2024 | 3,760 | 3,779 | ||||||
5.000%, 08/22/2024 | 1,560 | 1,570 | ||||||
Hudson County, Improvement Authority, Local Unit Loan Program, RB | ||||||||
5.000%, 07/24/2024 | 1,000 | 1,007 | ||||||
Plainsboro, GO | ||||||||
5.000%, 07/25/2024 | 3,000 | 3,020 | ||||||
South Amboy, GO | ||||||||
5.000%, 06/28/2024 | 4,361 | 4,381 | ||||||
| 13,757 | ||||||||
Description | Face Amount | Market Value | ||||||
MUNICIPAL BONDS (continued) | ||||||||
New Mexico — 0.7% | ||||||||
New Mexico State, Hospital Equipment Loan Council, Presbyterian Healthcare Services, RB | ||||||||
4.100%, 08/01/2034 (A) | $ | 600 | $ | 600 | ||||
2.950%, 08/01/2034 (A) | 600 | 600 | ||||||
| 1,200 | ||||||||
New York — 15.5% | ||||||||
Mount Pleasant, Central School District, GO | ||||||||
5.000%, 06/28/2024 | 3,050 | 3,067 | ||||||
New York City, Housing Development Authority, RB, FHA | ||||||||
4.100%, 11/01/2060 (A) | 2,000 | 2,000 | ||||||
4.100%, 05/01/2061 (A) | 1,600 | 1,600 | ||||||
New York City, Municipal Water Finance Authority, RB | ||||||||
3.000%, 06/15/2053 (A) | 1,400 | 1,400 | ||||||
New York City, Ser A-3, GO | ||||||||
2.900%, 09/01/2049 (A) | 1,400 | 1,400 | ||||||
New York City, Sub-Ser B, GO | ||||||||
3.000%, 10/01/2046 (A) | 5,300 | 5,300 | ||||||
New York City, Transitional Finance Authority, Future Tax Secured Revenue, Sub-Ser A-4, RB | ||||||||
3.000%, 08/01/2039 (A) | 700 | 700 | ||||||
New York City, Water & Sewer System, RB | ||||||||
2.900%, 06/15/2048 (A) | 900 | 900 | ||||||
New York State, Dormitory Authority, BDS Rockefeller University, RB | ||||||||
3.850%, 07/01/2032 (A) | 4,900 | 4,900 | ||||||
New York State, Housing Finance Agency, Ser A, RB | ||||||||
3.420%, 11/01/2050 (A)(B) | 2,500 | 2,500 | ||||||
Tender Option Bond Trust Receipts, Ser 2023-XF1450, RB | ||||||||
4.010%, 03/15/2054 (A)(C) | 2,200 | 2,200 | ||||||
| 25,967 | ||||||||
North Carolina — 2.6% | ||||||||
Charlotte, Governmental Facilities Project, RB | ||||||||
3.850%, 06/01/2033 (A) | 1,760 | 1,760 | ||||||
University of North Carolina, Hospital at Chapel Hill, Ser B-REMK, RB | ||||||||
3.850%, 02/01/2029 (A) | 2,675 | 2,675 | ||||||
| 4,435 | ||||||||
Ohio — 1.3% | ||||||||
Ohio State University, RB | ||||||||
3.250%, 06/01/2043 (A) | 2,200 | 2,200 | ||||||
SEI Institutional Managed Trust
253
SCHEDULE OF INVESTMENTS
September 30, 2023
Tax-Free Conservative Income Fund (Concluded)
Description | Face Amount | Market Value | ||||||
MUNICIPAL BONDS (continued) | ||||||||
Oregon — 1.7% | ||||||||
Oregon State, Facilities Authority, Ser B, RB | ||||||||
2.900%, 08/01/2034 (A)(B) | $ | 2,800 | $ | 2,800 | ||||
Pennsylvania — 2.7% | ||||||||
Montgomery County, Industrial Development Authority, Acts Retirement Life Communities, RB, AGC | ||||||||
3.050%, 11/15/2029 (A) | 175 | 175 | ||||||
Pennsylvania State, Economic Development Financing Authority, PPL Energy Supply Project, RB | ||||||||
4.300%, 12/01/2037 (A)(B) | 3,300 | 3,300 | ||||||
Pennsylvania State, Turnpike Commission, RB | ||||||||
3.850%, 12/01/2038 (A)(B) | 1,100 | 1,100 | ||||||
| 4,575 | ||||||||
South Carolina — 4.7% | ||||||||
South Carolina State, Jobs-Economic Development Authority, RB, FHLB | ||||||||
4.000%, 03/01/2063 (A)(B) | 3,000 | 3,000 | ||||||
South Carolina State, Public Service Authority, Ser A, RB | ||||||||
3.350%, 01/01/2036 (A)(B) | 4,400 | 4,400 | ||||||
Tender Option Bond Trust Receipts, Ser 2022-XG0398, RB, BAM | ||||||||
4.100%, 12/01/2055 (A)(C) | 500 | 500 | ||||||
| 7,900 | ||||||||
South Dakota — 3.0% | ||||||||
South Dakota State, Housing Development Authority, RB | ||||||||
4.130%, 11/01/2046 (A) | 2,200 | 2,200 | ||||||
South Dakota State, Housing Development Authority, Ser A, RB | ||||||||
4.130%, 11/01/2062 (A) | 2,885 | 2,885 | ||||||
| 5,085 | ||||||||
Tennessee — 0.2% | ||||||||
Clarksville, Public Building Authority, Pooled Financing, RB | ||||||||
3.950%, 06/01/2029 (A)(B) | 280 | 280 | ||||||
Texas — 11.2% | ||||||||
Harris County, Health Facilities Development Authority, Methodist Hospital System Project, RB | ||||||||
3.000%, 12/01/2041 (A) | 4,500 | 4,500 | ||||||
Pasadena, Independent School District, Ser B, GO, AGM | ||||||||
4.100%, 02/01/2035 (A) | 1,300 | 1,300 | ||||||
Description | Face Amount | Market Value | ||||||
MUNICIPAL BONDS (continued) | ||||||||
Port Arthur, Navigation District, Industrial Development, Petrochemicals USA Project, RB | ||||||||
3.400%, 03/01/2039 (A) | $ | 5,300 | $ | 5,300 | ||||
Tarrant County, Cultural Education Facilities Finance, Christus Health, RB | ||||||||
3.500%, 07/01/2047 (A)(B) | 1,525 | 1,525 | ||||||
Texas State, Veterans Bonds, GO | ||||||||
3.400%, 12/01/2046 (A) | 1,900 | 1,900 | ||||||
Texas State, Veterans Bonds, Ser B, GO | ||||||||
3.550%, 12/01/2042 (A) | 2,250 | 2,250 | ||||||
Texas State, Veterans Bonds, Ser B-REMK, GO | ||||||||
3.550%, 12/01/2043 (A) | 2,000 | 2,000 | ||||||
| 18,775 | ||||||||
Utah — 1.0% | ||||||||
Utah State, Water Finance Agency, Ser B-2-REMK, RB | ||||||||
4.000%, 10/01/2035 (A) | 1,705 | 1,705 | ||||||
Virginia — 1.2% | ||||||||
Fairfax County, Industrial Development Authority, Inova Health System Project, RB | ||||||||
4.090%, 05/15/2042 (A) | 2,050 | 2,050 | ||||||
Washington — 0.9% | ||||||||
Washington State, Housing Finance Commission, Ser VR, RB | ||||||||
3.950%, 12/01/2046 (A) | 1,585 | 1,585 | ||||||
West Virginia — 0.6% | ||||||||
West Virginia State, Hospital Finance Authority, West Virginia University, RB | ||||||||
3.850%, 06/01/2034 (A)(B) | 1,080 | 1,080 | ||||||
Wisconsin — 2.5% | ||||||||
Wisconsin State, Housing & Economic Development Authority, Ser B, RB | ||||||||
3.950%, 03/01/2041 (A) | 2,320 | 2,320 | ||||||
Wisconsin State, Housing & Economic Development Authority, Ser C, RB | ||||||||
4.100%, 05/01/2046 (A) | 1,800 | 1,800 | ||||||
| 4,120 | ||||||||
Total Municipal Bonds | ||||||||
(Cost $167,253) ($ Thousands) | 167,190 | |||||||
Total Investments in Securities — 99.6% | ||||||||
(Cost $167,253) ($ Thousands) | $ | 167,190 | ||||||
254
SEI Institutional Managed Trust
| Percentages are based on Net Assets of $167,895 ($ Thousands). |
(A) | Variable or floating rate security. The rate shown is the effective interest rate as of period end. The rates on certain securities are not based on published reference rates and spreads and are either determined by the issuer or agent based on current market conditions; by using a formula based on the rates of underlying loans; or by adjusting periodically based on prevailing interest rates. |
(B) | Securities are held in connection with a letter of credit issued by a major bank. |
(C) | Security exempt from registration under Rule 144A of the Securities Act of 1933. These securities may be resold in transactions exempt from registration normally to qualified institutions. On September 30, 2023, the value of these securities amounted to $16,080 ($ Thousands), representing 9.6% of the Net Assets of the Fund. |
As of September 30, 2023, all of the Fund's investments were considered Level 2, in accordance with the authoritative guidance on fair value measurements and disclosure under U.S. GAAP. |
For more information on valuation inputs, see Note 2 – Significant Accounting Policies in Notes to Financial Statements.
See “Glossary” for abbreviations.
The accompanying notes are an integral part of the financial statements.
SEI Institutional Managed Trust
255
SCHEDULE OF INVESTMENTS
September 30, 2023
Real Return Fund

† | Percentages are based on total investments. |
Description | Face Amount | Market Value | ||||||
U.S. TREASURY OBLIGATIONS — 99.1% | ||||||||
U.S. Treasury Inflation Protected Securities | ||||||||
3.625%, 04/15/2028 | $ | 4,723 | $ | 4,962 | ||||
2.375%, 01/15/2025 | 7,916 | 7,821 | ||||||
2.375%, 01/15/2027 | 4,902 | 4,865 | ||||||
2.000%, 01/15/2026 | 5,073 | 4,973 | ||||||
1.750%, 01/15/2028 | 4,802 | 4,664 | ||||||
1.625%, 10/15/2027 | 12,557 | 12,190 | ||||||
1.250%, 04/15/2028 | 12,463 | 11,849 | ||||||
0.750%, 07/15/2028 | 9,981 | 9,287 | ||||||
0.625%, 01/15/2026 | 10,753 | 10,222 | ||||||
0.500%, 01/15/2028 | 11,451 | 10,553 | ||||||
0.375%, 07/15/2025 | 12,791 | 12,245 | ||||||
0.375%, 01/15/2027 | 9,971 | 9,274 | ||||||
0.375%, 07/15/2027 | 11,168 | 10,356 | ||||||
0.250%, 01/15/2025 | 11,657 | 11,212 | ||||||
0.125%, 10/15/2024 | 11,369 | 11,022 | ||||||
0.125%, 04/15/2025 | 9,293 | 8,864 | ||||||
0.125%, 10/15/2025 | 11,328 | 10,734 | ||||||
0.125%, 04/15/2026 | 8,724 | 8,150 | ||||||
0.125%, 07/15/2026 | 10,715 | 10,015 | ||||||
0.125%, 10/15/2026 | 12,113 | 11,264 | ||||||
Description | Face Amount | Market Value | ||||||
U.S. TREASURY OBLIGATIONS (continued) | ||||||||
0.125%, 04/15/2027 | $ | 12,375 | $ | 11,359 | ||||
Total U.S. Treasury Obligations | ||||||||
(Cost $209,879) ($ Thousands) | 195,881 | |||||||
| ||||||||
CASH EQUIVALENT — 0.8% | ||||||||
SEI Daily Income Trust, Government Fund, Institutional Class | ||||||||
5.210%**† | 1,546,698 | 1,547 | ||||||
Total Cash Equivalent | ||||||||
(Cost $1,547) ($ Thousands) | 1,547 | |||||||
Total Investments in Securities — 99.9% | ||||||||
(Cost $211,426) ($ Thousands) | $ | 197,428 | ||||||
| Percentages are based on Net Assets of $197,680 ($ Thousands). |
** | The rate reported is the 7-day effective yield as of September 30, 2023. |
† | Investment in Affiliated Security (see Note 6). |
The following is a summary of the level of inputs used as of September 30, 2023, in valuing the Fund's investments carried at value ($ Thousands): | ||||||||||||||||
Investments in Securities | Level 1 | Level 2 | Level 3 | Total | ||||||||||||
U.S. Treasury Obligations | – | 195,881 | – | 195,881 | ||||||||||||
Cash Equivalent | 1,547 | – | – | 1,547 | ||||||||||||
Total Investments in Securities | 1,547 | 195,881 | – | 197,428 | ||||||||||||
For more information on valuation inputs, see Note 2 — Significant Accounting Policies in Notes to Financial Statements.
The following is a summary of the Fund’s transactions with affiliates for the year ended September 30, 2023 ($Thousands):
Security Description | Value 9/30/2022 | Purchases at Cost | Proceeds from Sales | Realized Gain/ (Loss) | Change in Unrealized Appreciation/ (Depreciation) | Value 9/30/2023 | Income | Capital Gains | ||||||||||||||||||||||||
SEI Daily Income Trust, Government Fund, Institutional Class | $ | 1,251 | $ | 70,191 | $ | (69,895 | ) | $ | — | $ | — | $ | 1,547 | $ | 27 | $ | — | |||||||||||||||
Amounts designated as “—” are either $0 or have been rounded to $0.
See “Glossary” for abbreviations.
The accompanying notes are an integral part of the financial statements.
256
SEI Institutional Managed Trust
CONSOLIDATED SCHEDULE OF INVESTMENTS
September 30, 2023
Dynamic Asset Allocation Fund
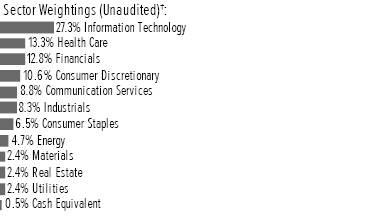
† | Percentages are based on total investments. Total investments do not include derivatives such as options, futures contracts, forward contracts, and swap contracts, if applicable. |
Description | Shares | Market Value | ||||||
COMMON STOCK — 79.9% | ||||||||
Communication Services — 7.1% | ||||||||
Activision Blizzard Inc | 10,897 | $ | 1,020 | |||||
Alphabet Inc, Cl A * | 90,196 | 11,803 | ||||||
Alphabet Inc, Cl C * | 76,711 | 10,114 | ||||||
AT&T Inc | 109,354 | 1,643 | ||||||
Charter Communications Inc, Cl A * | 1,543 | 679 | ||||||
Comcast Corp, Cl A | 62,454 | 2,769 | ||||||
Electronic Arts Inc | 3,725 | 448 | ||||||
Fox Corp, Cl A | 3,871 | 121 | ||||||
Fox Corp, Cl B | 2,366 | 68 | ||||||
Interpublic Group of Cos Inc/The | 5,927 | 170 | ||||||
Live Nation Entertainment Inc * | 2,307 | 192 | ||||||
Match Group Inc * | 4,206 | 165 | ||||||
Meta Platforms Inc, Cl A * | 33,725 | 10,125 | ||||||
Netflix Inc * | 6,709 | 2,533 | ||||||
News Corp, Cl A | 5,662 | 114 | ||||||
News Corp, Cl B | 2,017 | 42 | ||||||
Omnicom Group Inc | 3,043 | 227 | ||||||
Paramount Global, Cl B | 8,271 | 107 | ||||||
Take-Two Interactive Software Inc, Cl A * | 2,421 | 340 | ||||||
T-Mobile US Inc | 7,771 | 1,088 | ||||||
Verizon Communications Inc | 63,686 | 2,064 | ||||||
Walt Disney Co/The * | 27,766 | 2,250 | ||||||
Warner Bros Discovery Inc * | 34,364 | 373 | ||||||
| 48,455 | ||||||||
Consumer Discretionary — 8.6% | ||||||||
Airbnb Inc, Cl A * | 6,400 | 878 | ||||||
Amazon.com Inc, Cl A * | 138,070 | 17,551 | ||||||
Aptiv PLC * | 4,172 | 411 | ||||||
AutoZone Inc * | 309 | 785 | ||||||
Bath & Body Works Inc | 3,429 | 116 | ||||||
Best Buy Co Inc | 3,030 | 211 | ||||||
Booking Holdings Inc * | 535 | 1,650 | ||||||
BorgWarner Inc | 3,837 | 155 | ||||||
Caesars Entertainment Inc * | 3,254 | 151 | ||||||
CarMax Inc * | 2,545 | 180 | ||||||
Description | Shares | Market Value | ||||||
COMMON STOCK (continued) | ||||||||
Carnival Corp * | 15,226 | $ | 209 | |||||
Chipotle Mexican Grill Inc, Cl A * | 450 | 824 | ||||||
Darden Restaurants Inc | 1,842 | 264 | ||||||
Domino's Pizza Inc | 484 | 183 | ||||||
DR Horton Inc | 4,647 | 499 | ||||||
eBay Inc | 8,318 | 367 | ||||||
Etsy Inc * | 1,991 | 129 | ||||||
Expedia Group Inc * | 2,212 | 228 | ||||||
Ford Motor Co | 60,008 | 745 | ||||||
Garmin Ltd | 2,300 | 242 | ||||||
General Motors Co | 21,362 | 704 | ||||||
Genuine Parts Co | 2,225 | 321 | ||||||
Hasbro Inc | 1,909 | 126 | ||||||
Hilton Worldwide Holdings Inc | 3,886 | 584 | ||||||
Home Depot Inc/The | 15,249 | 4,608 | ||||||
Las Vegas Sands Corp | 5,119 | 235 | ||||||
Lennar Corp, Cl A | 3,890 | 437 | ||||||
LKQ Corp | 3,816 | 189 | ||||||
Lowe's Cos Inc | 8,883 | 1,846 | ||||||
Marriott International Inc/MD, Cl A | 3,873 | 761 | ||||||
McDonald's Corp | 11,137 | 2,934 | ||||||
MGM Resorts International | 4,042 | 149 | ||||||
Mohawk Industries Inc * | 920 | 79 | ||||||
NIKE Inc, Cl B | 18,684 | 1,787 | ||||||
Norwegian Cruise Line Holdings Ltd * | 6,214 | 102 | ||||||
NVR Inc * | 49 | 292 | ||||||
O'Reilly Automotive Inc * | 918 | 834 | ||||||
Pool Corp | 616 | 219 | ||||||
PulteGroup Inc | 3,473 | 257 | ||||||
Ralph Lauren Corp, Cl A | 628 | 73 | ||||||
Ross Stores Inc | 5,126 | 579 | ||||||
Royal Caribbean Cruises Ltd * | 3,466 | 319 | ||||||
Starbucks Corp | 17,326 | 1,581 | ||||||
Tapestry Inc | 3,553 | 102 | ||||||
Tesla Inc * | 42,015 | 10,513 | ||||||
TJX Cos Inc/The | 17,410 | 1,547 | ||||||
Tractor Supply Co | 1,674 | 340 | ||||||
Ulta Beauty Inc * | 723 | 289 | ||||||
VF Corp | 4,919 | 87 | ||||||
Whirlpool Corp | 769 | 103 | ||||||
Wynn Resorts Ltd | 1,545 | 143 | ||||||
Yum! Brands Inc | 4,360 | 545 | ||||||
| 58,463 | ||||||||
Consumer Staples — 5.2% | ||||||||
Altria Group Inc | 26,816 | 1,128 | ||||||
Archer-Daniels-Midland Co | 8,221 | 620 | ||||||
Brown-Forman Corp, Cl B | 2,960 | 171 | ||||||
Bunge Ltd | 2,300 | 249 | ||||||
Campbell Soup Co | 3,234 | 133 | ||||||
Church & Dwight Co Inc | 3,685 | 338 | ||||||
Clorox Co/The | 1,935 | 254 | ||||||
Coca-Cola Co/The | 59,204 | 3,314 | ||||||
SEI Institutional Managed Trust
257
CONSOLIDATED SCHEDULE OF INVESTMENTS
September 30, 2023
Dynamic Asset Allocation Fund (Continued)
Description | Shares | Market Value | ||||||
COMMON STOCK (continued) | ||||||||
Colgate-Palmolive Co | 12,421 | $ | 883 | |||||
Conagra Brands Inc | 7,263 | 199 | ||||||
Constellation Brands Inc, Cl A | 2,428 | 610 | ||||||
Costco Wholesale Corp | 6,677 | 3,772 | ||||||
Dollar General Corp | 3,271 | 346 | ||||||
Dollar Tree Inc * | 3,196 | 340 | ||||||
Estee Lauder Cos Inc/The, Cl A | 3,570 | 516 | ||||||
General Mills Inc | 9,040 | 578 | ||||||
Hershey Co/The | 2,276 | 455 | ||||||
Hormel Foods Corp | 4,423 | 168 | ||||||
J M Smucker Co/The | 1,630 | 200 | ||||||
Kellanova | 3,919 | 233 | ||||||
Kenvue Inc | 26,574 | 534 | ||||||
Keurig Dr Pepper Inc | 15,092 | 476 | ||||||
Kimberly-Clark Corp | 5,179 | 626 | ||||||
Kraft Heinz Co/The | 12,243 | 412 | ||||||
Kroger Co/The | 10,088 | 451 | ||||||
Lamb Weston Holdings Inc | 2,201 | 204 | ||||||
McCormick & Co Inc/MD | 3,780 | 286 | ||||||
Molson Coors Beverage Co, Cl B | 2,895 | 184 | ||||||
Mondelez International Inc, Cl A | 20,548 | 1,426 | ||||||
Monster Beverage Corp * | 11,144 | 590 | ||||||
PepsiCo Inc | 20,958 | 3,551 | ||||||
Philip Morris International Inc | 23,758 | 2,200 | ||||||
Procter & Gamble Co/The | 35,902 | 5,237 | ||||||
Sysco Corp, Cl A | 7,611 | 503 | ||||||
Target Corp, Cl A | 7,026 | 777 | ||||||
Tyson Foods Inc, Cl A | 4,375 | 221 | ||||||
Walgreens Boots Alliance Inc | 10,924 | 243 | ||||||
Walmart Inc | 21,399 | 3,422 | ||||||
| 35,850 | ||||||||
Energy — 3.8% | ||||||||
APA Corp | 4,952 | 204 | ||||||
Baker Hughes Co, Cl A | 15,468 | 546 | ||||||
Chevron Corp | 27,074 | 4,565 | ||||||
ConocoPhillips | 18,149 | 2,174 | ||||||
Coterra Energy Inc | 11,241 | 304 | ||||||
Devon Energy Corp | 9,595 | 458 | ||||||
Diamondback Energy Inc, Cl A | 2,623 | 406 | ||||||
EOG Resources Inc | 8,799 | 1,115 | ||||||
EQT Corp | 5,600 | 227 | ||||||
Exxon Mobil Corp | 60,826 | 7,152 | ||||||
Halliburton Co | 13,478 | 546 | ||||||
Hess Corp | 4,196 | 642 | ||||||
Kinder Morgan Inc | 28,998 | 481 | ||||||
Marathon Oil Corp | 9,659 | 258 | ||||||
Marathon Petroleum Corp | 6,037 | 914 | ||||||
Occidental Petroleum Corp | 10,015 | 650 | ||||||
ONEOK Inc | 8,906 | 565 | ||||||
Phillips 66 | 6,685 | 803 | ||||||
Pioneer Natural Resources Co | 3,568 | 819 | ||||||
Schlumberger NV, Cl A | 21,778 | 1,270 | ||||||
Description | Shares | Market Value | ||||||
COMMON STOCK (continued) | ||||||||
Targa Resources Corp | 3,400 | $ | 292 | |||||
Valero Energy Corp | 5,274 | 747 | ||||||
Williams Cos Inc/The | 18,229 | 614 | ||||||
| 25,752 | ||||||||
Financials — 10.3% | ||||||||
Aflac Inc | 8,271 | 635 | ||||||
Allstate Corp/The | 4,090 | 456 | ||||||
American Express Co | 8,797 | 1,313 | ||||||
American International Group Inc | 10,869 | 659 | ||||||
Ameriprise Financial Inc | 1,523 | 502 | ||||||
Aon PLC, Cl A | 3,076 | 997 | ||||||
Arch Capital Group Ltd * | 5,725 | 456 | ||||||
Arthur J Gallagher & Co | 3,219 | 734 | ||||||
Assurant Inc | 743 | 107 | ||||||
Bank of America Corp | 105,500 | 2,889 | ||||||
Bank of New York Mellon Corp/The | 10,813 | 461 | ||||||
Berkshire Hathaway Inc, Cl B * | 27,680 | 9,696 | ||||||
BlackRock Inc | 2,161 | 1,397 | ||||||
Blackstone Inc, Cl A | 10,700 | 1,146 | ||||||
Brown & Brown Inc | 3,539 | 247 | ||||||
Capital One Financial Corp | 5,898 | 572 | ||||||
Cboe Global Markets Inc | 1,627 | 254 | ||||||
Charles Schwab Corp/The | 22,516 | 1,236 | ||||||
Chubb Ltd | 6,293 | 1,310 | ||||||
Cincinnati Financial Corp | 2,503 | 256 | ||||||
Citigroup Inc | 29,120 | 1,198 | ||||||
Citizens Financial Group Inc | 7,508 | 201 | ||||||
CME Group Inc, Cl A | 5,472 | 1,096 | ||||||
Comerica Inc | 1,983 | 82 | ||||||
Discover Financial Services | 3,808 | 330 | ||||||
Everest Group Ltd | 673 | 250 | ||||||
Eversource Energy | 5,401 | 314 | ||||||
FactSet Research Systems Inc | 574 | 251 | ||||||
Fidelity National Information Services Inc, Cl B | 9,235 | 511 | ||||||
Fifth Third Bancorp | 10,419 | 264 | ||||||
Fiserv Inc, Cl A * | 9,377 | 1,059 | ||||||
FleetCor Technologies Inc * | 1,144 | 292 | ||||||
Franklin Resources Inc | 4,243 | 104 | ||||||
Global Payments Inc | 4,059 | 468 | ||||||
Globe Life Inc | 1,400 | 152 | ||||||
Goldman Sachs Group Inc/The | 5,055 | 1,636 | ||||||
Hartford Financial Services Group Inc/The | 4,799 | 340 | ||||||
Huntington Bancshares Inc/OH | 21,962 | 228 | ||||||
Intercontinental Exchange Inc | 8,608 | 947 | ||||||
Invesco Ltd | 6,878 | 100 | ||||||
Jack Henry & Associates Inc | 1,150 | 174 | ||||||
JPMorgan Chase & Co | 44,198 | 6,410 | ||||||
KeyCorp | 14,812 | 159 | ||||||
Loews Corp | 2,755 | 175 | ||||||
M&T Bank Corp | 2,576 | 326 | ||||||
MarketAxess Holdings Inc | 553 | 118 | ||||||
258
SEI Institutional Managed Trust
Description | Shares | Market Value | ||||||
COMMON STOCK (continued) | ||||||||
Marsh & McLennan Cos Inc | 7,515 | $ | 1,430 | |||||
Mastercard Inc, Cl A | 12,670 | 5,016 | ||||||
MetLife Inc | 9,711 | 611 | ||||||
Moody's Corp | 2,362 | 747 | ||||||
Morgan Stanley | 19,328 | 1,579 | ||||||
MSCI Inc, Cl A | 1,199 | 615 | ||||||
Nasdaq Inc, Cl A | 5,191 | 252 | ||||||
Northern Trust Corp | 3,322 | 231 | ||||||
PayPal Holdings Inc * | 16,859 | 986 | ||||||
PNC Financial Services Group Inc/The | 5,981 | 734 | ||||||
Principal Financial Group Inc, Cl A | 3,467 | 250 | ||||||
Progressive Corp/The | 8,968 | 1,249 | ||||||
Prudential Financial Inc | 5,660 | 537 | ||||||
Raymond James Financial Inc | 2,993 | 301 | ||||||
Regions Financial Corp | 14,934 | 257 | ||||||
S&P Global Inc | 4,961 | 1,813 | ||||||
Synchrony Financial | 6,644 | 203 | ||||||
T Rowe Price Group Inc | 3,389 | 355 | ||||||
Travelers Cos Inc/The | 3,404 | 556 | ||||||
Truist Financial Corp | 20,648 | 591 | ||||||
US Bancorp | 23,470 | 776 | ||||||
Visa Inc, Cl A | 24,418 | 5,616 | ||||||
W R Berkley Corp | 3,057 | 194 | ||||||
Wells Fargo & Co | 55,411 | 2,264 | ||||||
Willis Towers Watson PLC | 1,638 | 342 | ||||||
Zions Bancorp NA | 2,233 | 78 | ||||||
| 70,091 | ||||||||
Health Care — 10.7% | ||||||||
Abbott Laboratories | 26,453 | 2,562 | ||||||
AbbVie Inc | 26,892 | 4,009 | ||||||
Agilent Technologies Inc | 4,609 | 515 | ||||||
Align Technology Inc * | 1,098 | 335 | ||||||
Amgen Inc, Cl A | 8,154 | 2,191 | ||||||
Baxter International Inc | 7,749 | 292 | ||||||
Becton Dickinson & Co | 4,358 | 1,127 | ||||||
Biogen Inc * | 2,236 | 575 | ||||||
Bio-Rad Laboratories Inc, Cl A * | 333 | 119 | ||||||
Bio-Techne Corp | 2,392 | 163 | ||||||
Boston Scientific Corp * | 21,984 | 1,161 | ||||||
Bristol-Myers Squibb Co | 31,910 | 1,852 | ||||||
Cardinal Health Inc | 4,023 | 349 | ||||||
Catalent Inc * | 2,977 | 136 | ||||||
Cencora Inc, Cl A | 2,499 | 450 | ||||||
Centene Corp * | 8,282 | 570 | ||||||
Charles River Laboratories International Inc * | 765 | 150 | ||||||
Cigna Group/The | 4,504 | 1,288 | ||||||
Cooper Cos Inc/The, Cl A | 766 | 244 | ||||||
CVS Health Corp | 19,647 | 1,372 | ||||||
Danaher Corp, Cl A | 9,962 | 2,472 | ||||||
DaVita Inc * | 915 | 87 | ||||||
DENTSPLY SIRONA Inc | 3,221 | 110 | ||||||
Description | Shares | Market Value | ||||||
COMMON STOCK (continued) | ||||||||
Dexcom Inc * | 5,966 | $ | 557 | |||||
Edwards Lifesciences Corp, Cl A * | 9,151 | 634 | ||||||
Elevance Health Inc | 3,616 | 1,574 | ||||||
Eli Lilly & Co | 12,074 | 6,485 | ||||||
GE HealthCare Technologies Inc | 6,043 | 411 | ||||||
Gilead Sciences Inc | 18,855 | 1,413 | ||||||
HCA Healthcare Inc | 3,053 | 751 | ||||||
Henry Schein Inc * | 2,049 | 152 | ||||||
Hologic Inc * | 3,729 | 259 | ||||||
Humana Inc | 1,865 | 907 | ||||||
IDEXX Laboratories Inc * | 1,243 | 544 | ||||||
Illumina Inc * | 2,437 | 335 | ||||||
Incyte Corp * | 2,871 | 166 | ||||||
Insulet Corp * | 1,100 | 175 | ||||||
Intuitive Surgical Inc * | 5,382 | 1,573 | ||||||
IQVIA Holdings Inc * | 2,815 | 554 | ||||||
Johnson & Johnson | 36,654 | 5,709 | ||||||
Laboratory Corp of America Holdings | 1,353 | 272 | ||||||
McKesson Corp | 2,008 | 873 | ||||||
Medtronic PLC | 20,387 | 1,598 | ||||||
Merck & Co Inc | 38,611 | 3,975 | ||||||
Mettler-Toledo International Inc * | 360 | 399 | ||||||
Moderna Inc * | 5,081 | 525 | ||||||
Molina Healthcare Inc * | 860 | 282 | ||||||
Organon & Co | 3,792 | 66 | ||||||
Pfizer Inc | 85,922 | 2,850 | ||||||
Quest Diagnostics Inc | 1,696 | 207 | ||||||
Regeneron Pharmaceuticals Inc * | 1,651 | 1,359 | ||||||
ResMed Inc | 2,264 | 335 | ||||||
Revvity Inc | 1,883 | 208 | ||||||
STERIS PLC | 1,474 | 323 | ||||||
Stryker Corp | 5,112 | 1,397 | ||||||
Teleflex Inc | 700 | 137 | ||||||
Thermo Fisher Scientific Inc | 5,849 | 2,961 | ||||||
UnitedHealth Group Inc | 14,087 | 7,103 | ||||||
Universal Health Services Inc, Cl B | 992 | 125 | ||||||
Vertex Pharmaceuticals Inc * | 3,895 | 1,354 | ||||||
Viatris Inc, Cl W | 17,483 | 172 | ||||||
Waters Corp * | 946 | 259 | ||||||
West Pharmaceutical Services Inc | 1,079 | 405 | ||||||
Zimmer Biomet Holdings Inc | 3,273 | 367 | ||||||
Zoetis Inc, Cl A | 6,917 | 1,203 | ||||||
| 73,083 | ||||||||
Industrials — 6.6% | ||||||||
3M Co | 8,417 | 788 | ||||||
A O Smith Corp | 1,910 | 126 | ||||||
Alaska Air Group Inc * | 1,914 | 71 | ||||||
Allegion plc | 1,433 | 149 | ||||||
American Airlines Group Inc * | 9,781 | 125 | ||||||
AMETEK Inc | 3,510 | 519 | ||||||
Automatic Data Processing Inc | 6,292 | 1,514 | ||||||
Axon Enterprise Inc * | 1,000 | 199 | ||||||
SEI Institutional Managed Trust
259
CONSOLIDATED SCHEDULE OF INVESTMENTS
September 30, 2023
Dynamic Asset Allocation Fund (Continued)
Description | Shares | Market Value | ||||||
COMMON STOCK (continued) | ||||||||
Boeing Co/The * | 8,587 | $ | 1,646 | |||||
Broadridge Financial Solutions Inc | 1,834 | 328 | ||||||
Carrier Global Corp | 12,942 | 714 | ||||||
Caterpillar Inc, Cl A | 7,738 | 2,112 | ||||||
Ceridian HCM Holding Inc * | 2,306 | 156 | ||||||
CH Robinson Worldwide Inc | 1,798 | 155 | ||||||
Cintas Corp | 1,298 | 624 | ||||||
Copart Inc * | 13,210 | 569 | ||||||
CSX Corp | 30,714 | 944 | ||||||
Cummins Inc | 2,180 | 498 | ||||||
Deere & Co | 4,102 | 1,548 | ||||||
Delta Air Lines Inc, Cl A | 9,787 | 362 | ||||||
Dover Corp | 2,141 | 299 | ||||||
Eaton Corp PLC | 6,092 | 1,299 | ||||||
Emerson Electric Co | 8,720 | 842 | ||||||
Equifax Inc | 1,865 | 342 | ||||||
Expeditors International of Washington Inc | 2,192 | 251 | ||||||
Fastenal Co, Cl A | 8,831 | 483 | ||||||
FedEx Corp | 3,495 | 926 | ||||||
Fortive Corp | 5,370 | 398 | ||||||
Generac Holdings Inc * | 983 | 107 | ||||||
General Dynamics Corp | 3,464 | 765 | ||||||
General Electric Co | 16,682 | 1,844 | ||||||
Honeywell International Inc | 10,132 | 1,872 | ||||||
Howmet Aerospace Inc | 5,632 | 260 | ||||||
Huntington Ingalls Industries Inc, Cl A | 573 | 117 | ||||||
IDEX Corp | 1,148 | 239 | ||||||
Illinois Tool Works Inc | 4,163 | 959 | ||||||
Ingersoll Rand Inc | 6,179 | 394 | ||||||
Jacobs Solutions Inc | 1,832 | 250 | ||||||
JB Hunt Transport Services Inc | 1,287 | 243 | ||||||
Johnson Controls International PLC | 10,185 | 542 | ||||||
L3Harris Technologies Inc | 2,887 | 503 | ||||||
Leidos Holdings Inc | 2,204 | 203 | ||||||
Lockheed Martin Corp | 3,423 | 1,400 | ||||||
Masco Corp | 3,459 | 185 | ||||||
Nordson Corp | 863 | 193 | ||||||
Norfolk Southern Corp | 3,471 | 684 | ||||||
Northrop Grumman Corp | 2,161 | 951 | ||||||
Old Dominion Freight Line Inc, Cl A | 1,363 | 558 | ||||||
Otis Worldwide Corp | 6,435 | 517 | ||||||
PACCAR Inc | 7,850 | 667 | ||||||
Parker-Hannifin Corp, Cl A | 1,986 | 774 | ||||||
Paychex Inc | 4,991 | 576 | ||||||
Paycom Software Inc | 687 | 178 | ||||||
Pentair PLC | 2,664 | 172 | ||||||
Quanta Services Inc | 2,183 | 408 | ||||||
Republic Services Inc | 3,198 | 456 | ||||||
Robert Half Inc | 1,584 | 116 | ||||||
Rockwell Automation Inc | 1,755 | 502 | ||||||
Rollins Inc | 3,520 | 131 | ||||||
RTX Corp | 22,231 | 1,600 | ||||||
Description | Shares | Market Value | ||||||
COMMON STOCK (continued) | ||||||||
Snap-on Inc | 818 | $ | 209 | |||||
Southwest Airlines Co, Cl A | 9,027 | 244 | ||||||
Stanley Black & Decker Inc | 2,399 | 200 | ||||||
Textron Inc | 3,186 | 249 | ||||||
Trane Technologies PLC | 3,537 | 718 | ||||||
TransDigm Group Inc * | 837 | 706 | ||||||
Union Pacific Corp | 9,285 | 1,891 | ||||||
United Airlines Holdings Inc * | 4,978 | 211 | ||||||
United Parcel Service Inc, Cl B | 10,976 | 1,711 | ||||||
United Rentals Inc | 1,018 | 453 | ||||||
Verisk Analytics Inc, Cl A | 2,215 | 523 | ||||||
Waste Management Inc | 5,687 | 867 | ||||||
Westinghouse Air Brake Technologies Corp | 2,762 | 294 | ||||||
WW Grainger Inc | 625 | 432 | ||||||
Xylem Inc/NY | 3,666 | 334 | ||||||
| 45,395 | ||||||||
Information Technology — 21.9% | ||||||||
Accenture PLC, Cl A | 9,553 | 2,934 | ||||||
Adobe Inc * | 6,938 | 3,538 | ||||||
Advanced Micro Devices Inc * | 24,458 | 2,515 | ||||||
Akamai Technologies Inc * | 2,363 | 252 | ||||||
Amphenol Corp, Cl A | 8,975 | 754 | ||||||
Analog Devices Inc | 7,620 | 1,334 | ||||||
ANSYS Inc * | 1,340 | 399 | ||||||
Apple Inc | 223,459 | 38,258 | ||||||
Applied Materials Inc | 12,692 | 1,757 | ||||||
Arista Networks Inc * | 3,800 | 699 | ||||||
Autodesk Inc, Cl A * | 3,310 | 685 | ||||||
Broadcom Inc | 6,261 | 5,200 | ||||||
Cadence Design Systems Inc * | 4,164 | 976 | ||||||
CDW Corp/DE | 2,078 | 419 | ||||||
Cisco Systems Inc | 61,880 | 3,327 | ||||||
Cognizant Technology Solutions Corp, Cl A | 7,607 | 515 | ||||||
Corning Inc, Cl B | 11,634 | 354 | ||||||
DXC Technology Co * | 3,309 | 69 | ||||||
Enphase Energy Inc * | 2,088 | 251 | ||||||
EPAM Systems Inc * | 918 | 235 | ||||||
F5 Inc, Cl A * | 849 | 137 | ||||||
Fair Isaac Corp * | 400 | 347 | ||||||
First Solar Inc * | 1,500 | 242 | ||||||
Fortinet Inc * | 10,100 | 593 | ||||||
Gartner Inc * | 1,171 | 402 | ||||||
Gen Digital Inc | 8,609 | 152 | ||||||
Hewlett Packard Enterprise Co | 19,524 | 339 | ||||||
HP Inc | 13,421 | 345 | ||||||
Intel Corp | 63,462 | 2,256 | ||||||
International Business Machines Corp | 13,828 | 1,940 | ||||||
Intuit Inc | 4,222 | 2,157 | ||||||
Juniper Networks Inc | 4,954 | 138 | ||||||
Keysight Technologies Inc * | 2,787 | 369 | ||||||
KLA Corp | 2,110 | 968 | ||||||
Lam Research Corp | 2,027 | 1,270 | ||||||
260
SEI Institutional Managed Trust
Description | Shares | Market Value | ||||||
COMMON STOCK (continued) | ||||||||
Microchip Technology Inc | 8,239 | $ | 643 | |||||
Micron Technology Inc | 16,744 | 1,139 | ||||||
Microsoft Corp | 113,006 | 35,682 | ||||||
Monolithic Power Systems Inc | 670 | 309 | ||||||
Motorola Solutions Inc | 2,514 | 684 | ||||||
NetApp Inc | 3,276 | 249 | ||||||
NVIDIA Corp | 37,518 | 16,320 | ||||||
ON Semiconductor Corp * | 6,699 | 623 | ||||||
Oracle Corp, Cl B | 23,917 | 2,533 | ||||||
Palo Alto Networks Inc * | 4,600 | 1,078 | ||||||
PTC Inc * | 1,628 | 231 | ||||||
Qorvo Inc * | 1,631 | �� | 156 | |||||
QUALCOMM Inc | 17,103 | 1,899 | ||||||
Roper Technologies Inc | 1,623 | 786 | ||||||
Salesforce Inc * | 14,728 | 2,987 | ||||||
Seagate Technology Holdings PLC | 2,905 | 192 | ||||||
ServiceNow Inc * | 3,107 | 1,737 | ||||||
Skyworks Solutions Inc | 2,446 | 241 | ||||||
SolarEdge Technologies Inc * | 864 | 112 | ||||||
Synopsys Inc * | 2,291 | 1,051 | ||||||
TE Connectivity Ltd | 4,861 | 600 | ||||||
Teledyne Technologies Inc * | 690 | 282 | ||||||
Teradyne Inc | 2,388 | 240 | ||||||
Texas Instruments Inc | 13,804 | 2,195 | ||||||
Trimble Inc * | 3,728 | 201 | ||||||
Tyler Technologies Inc * | 609 | 235 | ||||||
VeriSign Inc * | 1,412 | 286 | ||||||
Western Digital Corp * | 4,824 | 220 | ||||||
Zebra Technologies Corp, Cl A * | 777 | 184 | ||||||
| 149,221 | ||||||||
Materials — 1.9% | ||||||||
Air Products and Chemicals Inc | 3,419 | 969 | ||||||
Albemarle Corp | 1,790 | 304 | ||||||
Amcor PLC | 22,572 | 207 | ||||||
Avery Dennison Corp | 1,219 | 223 | ||||||
Ball Corp | 4,790 | 238 | ||||||
Celanese Corp, Cl A | 1,626 | 204 | ||||||
CF Industries Holdings Inc | 2,936 | 252 | ||||||
Corteva Inc | 10,604 | 543 | ||||||
Dow Inc | 10,517 | 542 | ||||||
DuPont de Nemours Inc | 7,145 | 533 | ||||||
Eastman Chemical Co | 1,810 | 139 | ||||||
Ecolab Inc | 3,810 | 645 | ||||||
FMC Corp | 1,862 | 125 | ||||||
Freeport-McMoRan Inc, Cl B | 21,912 | 817 | ||||||
International Flavors & Fragrances Inc | 3,882 | 265 | ||||||
International Paper Co | 5,008 | 178 | ||||||
Linde PLC | 7,420 | 2,763 | ||||||
LyondellBasell Industries NV, Cl A | 3,875 | 367 | ||||||
Martin Marietta Materials Inc, Cl A | 892 | 366 | ||||||
Mosaic Co/The | 5,156 | 184 | ||||||
Newmont Corp | 12,355 | 457 | ||||||
Description | Shares | Market Value | ||||||
COMMON STOCK (continued) | ||||||||
Nucor Corp | 3,762 | $ | 588 | |||||
Packaging Corp of America | 1,435 | 220 | ||||||
PPG Industries Inc | 3,589 | 466 | ||||||
Sealed Air Corp | 2,157 | 71 | ||||||
Sherwin-Williams Co/The, Cl A | 3,541 | 903 | ||||||
Steel Dynamics Inc | 2,251 | 241 | ||||||
Vulcan Materials Co | 2,031 | 410 | ||||||
Westrock Co | 3,812 | 136 | ||||||
| 13,356 | ||||||||
Real Estate — 1.9% | ||||||||
Alexandria Real Estate Equities Inc ‡ | 2,395 | 240 | ||||||
American Tower Corp, Cl A ‡ | 7,127 | 1,172 | ||||||
AvalonBay Communities Inc ‡ | 2,145 | 368 | ||||||
Boston Properties Inc ‡ | 2,111 | 126 | ||||||
Camden Property Trust ‡ | 1,700 | 161 | ||||||
CBRE Group Inc, Cl A * | 4,883 | 361 | ||||||
CoStar Group Inc * | 6,259 | 481 | ||||||
Crown Castle Inc ‡ | 6,663 | 613 | ||||||
Digital Realty Trust Inc, Cl A ‡ | 4,441 | 537 | ||||||
Equinix Inc ‡ | 1,411 | 1,025 | ||||||
Equity Residential ‡ | 5,309 | 312 | ||||||
Essex Property Trust Inc ‡ | 1,015 | 215 | ||||||
Extra Space Storage Inc ‡ | 3,241 | 394 | ||||||
Federal Realty Investment Trust ‡ | 1,052 | 95 | ||||||
Healthpeak Properties Inc ‡ | 8,361 | 154 | ||||||
Host Hotels & Resorts Inc ‡ | 10,923 | 176 | ||||||
Invitation Homes Inc ‡ | 8,900 | 282 | ||||||
Iron Mountain Inc ‡ | 4,478 | 266 | ||||||
Kimco Realty Corp ‡ | 9,474 | 167 | ||||||
Mid-America Apartment Communities Inc ‡ | 1,839 | 237 | ||||||
Prologis Inc ‡ | 14,137 | 1,586 | ||||||
Public Storage ‡ | 2,369 | 624 | ||||||
Realty Income Corp ‡ | 10,474 | 523 | ||||||
Regency Centers Corp ‡ | 2,294 | 136 | ||||||
SBA Communications Corp, Cl A ‡ | 1,681 | 336 | ||||||
Simon Property Group Inc ‡ | 5,102 | 551 | ||||||
UDR Inc ‡ | 4,695 | 167 | ||||||
Ventas Inc ‡ | 6,137 | 259 | ||||||
VICI Properties Inc, Cl A ‡ | 15,656 | 456 | ||||||
Welltower Inc ‡ | 7,741 | 634 | ||||||
Weyerhaeuser Co ‡ | 11,205 | 344 | ||||||
| 12,998 | ||||||||
Utilities — 1.9% | ||||||||
AES Corp/The | 10,155 | 154 | ||||||
Alliant Energy Corp | 3,829 | 186 | ||||||
Ameren Corp | 3,929 | 294 | ||||||
American Electric Power Co Inc | 7,848 | 590 | ||||||
American Water Works Co Inc | 3,023 | 374 | ||||||
Atmos Energy Corp | 2,207 | 234 | ||||||
CenterPoint Energy Inc | 9,682 | 260 | ||||||
CMS Energy Corp | 4,487 | 238 | ||||||
SEI Institutional Managed Trust
261
CONSOLIDATED SCHEDULE OF INVESTMENTS
September 30, 2023
Dynamic Asset Allocation Fund (Continued)
Description | Shares | Market Value | ||||||
COMMON STOCK (continued) | ||||||||
Consolidated Edison Inc | 5,228 | $ | 447 | |||||
Constellation Energy Corp | 4,860 | 530 | ||||||
Dominion Energy Inc | 12,748 | 569 | ||||||
DTE Energy Co | 2,995 | 297 | ||||||
Duke Energy Corp | 11,785 | 1,040 | ||||||
Edison International | 5,827 | 369 | ||||||
Entergy Corp | 3,147 | 291 | ||||||
Evergy Inc | 3,443 | 175 | ||||||
Exelon Corp | 15,009 | 567 | ||||||
FirstEnergy Corp | 7,573 | 259 | ||||||
NextEra Energy Inc | 30,721 | 1,760 | ||||||
NiSource Inc | 6,644 | 164 | ||||||
NRG Energy Inc | 3,496 | 135 | ||||||
PG&E Corp * | 31,327 | 505 | ||||||
Pinnacle West Capital Corp | 1,817 | 134 | ||||||
PPL Corp | 11,344 | 267 | ||||||
Public Service Enterprise Group Inc | 7,640 | 435 | ||||||
Sempra | 9,622 | 655 | ||||||
Southern Co/The | 16,685 | 1,080 | ||||||
WEC Energy Group Inc | 4,879 | 393 | ||||||
Xcel Energy Inc | 8,559 | 490 | ||||||
| 12,892 | ||||||||
Total Common Stock | ||||||||
(Cost $251,603) ($ Thousands) | 545,556 | |||||||
Description |
| Market Value | ||||||
FOREIGN COMMON STOCK — 0.1% | ||||||||
China — 0.1% | ||||||||
NXP Semiconductors NV | 3,915 | $ | 783 | |||||
Total Foreign Common Stock | ||||||||
(Cost $789) ($ Thousands) | 783 | |||||||
CASH EQUIVALENT — 0.4% | ||||||||
SEI Daily Income Trust, Government Fund, Institutional Class | ||||||||
5.210%**† | 2,778,669 | 2,779 | ||||||
Total Cash Equivalent | ||||||||
(Cost $2,779) ($ Thousands) | 2,779 | |||||||
PURCHASED OPTIONS — 1.0% | ||||||||
Total Purchased Options | ||||||||
(Cost $4,822) ($ Thousands) | 6,937 | |||||||
Total Investments in Securities — 81.4% | ||||||||
(Cost $259,993) ($ Thousands) | $ | 556,055 | ||||||
WRITTEN OPTIONS — (0.2)% | ||||||||
Total Written Options | ||||||||
(Premiums Received $1,309) ($ Thousands) | $ | (1,514 | ) | |||||
A list of open exchange traded options contracts for the Fund at September 30, 2023, is as follows:
Description | Number of Contracts | Notional Amount | Exercise Price | Expiration Date | Value | |||||||||||||||
PURCHASED OPTIONS — 1.0% | ||||||||||||||||||||
Put Options | ||||||||||||||||||||
S&P 500 Index | 21,639 | $ | 94,129 | $ | 4,350.00 | 7/20/2024 | $ | 4,817 | ||||||||||||
S&P 500 Index | 16,243 | 70,656 | 4,350.00 | 12/16/2023 | 2,120 | |||||||||||||||
Total Purchased Options | $ | 164,785 | $ | 6,937 | ||||||||||||||||
WRITTEN OPTIONS — (0.2)% | ||||||||||||||||||||
Put Options | ||||||||||||||||||||
S&P 500 Index | (16,243 | ) | $ | (64,159 | ) | 3,950.00 | 12/16/2023 | $ | (568 | ) | ||||||||||
S&P 500 Index | (21,639 | ) | (71,408 | ) | 3,300.00 | 07/20/2024 | (946 | ) | ||||||||||||
Total Written Options | $ | (135,567 | ) | $ | (1,514 | ) | ||||||||||||||
262
SEI Institutional Managed Trust
A list of the open futures contracts held by the Fund at September 30, 2023 is as follows:
Type of Contract | Number of | Expiration Date | Notional Amount (Thousands) | Value | Unrealized Depreciation(Thousands) | |||||||||||||||
Long Contracts | ||||||||||||||||||||
S&P 500 Index E-MINI^ | 319 | Dec-2023 | $ | 71,691 | $ | 68,992 | $ | (2,699 | ) | |||||||||||
A list of the open OTC swap agreements held by the Fund at September 30, 2023, is as follows:
Total Return Swaps |
Counterparty | Reference Entity/ Obligation | Fund Pays | Fund Receives | Payment Frequency | Termination Date | Currency | Notional | Value | Upfront Payments/ | Net Unrealized | ||||||||||||||||||||||||||||||
Goldman Sachs^ | Bloomberg Commodity Index Total Return | 3 Month Treasury Bill RATE + 7.5 BPS | Index Return | Annually | 12/13/2023 | USD | 49,000 | $ | (588 | ) | $ | – | $ | (588 | ) | |||||||||||||||||||||||||
Goldman Sachs | S&P 500 EQWG USD TR | SOFR RATE INDEX + 0.75 BPS | Index Return | Quarterly | 10/31/2023 | USD | 74,282 | (6,903 | ) | – | (6,903 | ) | ||||||||||||||||||||||||||||
| $ | (7,491 | ) | $ | – | $ | (7,491 | ) | |||||||||||||||||||||||||||||||||
A list of the open centrally cleared swap agreements held by the Fund at September 30, 2023, is as follows:
Interest Rate Swaps |
| Fund Pays | Fund Receives | Payment Frequency | Termination Date | Currency | Notional Amount (Thousands) | Value (Thousands) | Upfront Payments/ Receipts (Thousands) | Net Unrealized Appreciation (Depreciation) (Thousands) | ||||||||||||||||||||
2.659%^ | U.S. Consumer Price Index (CPI) | Annually | 2/27/2033 | USD | 103,200 | $ | 1,715 | $ | – | $ | 1,715 | |||||||||||||||||
Fixed 0.280960% | Floating (MUTKCALM Index) | Annually | 05/15/2026 | JPY | 102,200,000 | 1,920 | – | 1,920 | ||||||||||||||||||||
| 0.29283% | JPY Unsecured Overnight Call Rate TONAR | Annually | 05/15/2026 | JPY | 81,000,000 | 1,458 | – | 1,458 | ||||||||||||||||||||
Floating EUROSTR OIS Compound | Fixed 3.087% | Annually | 09/09/2025 | EUR | 470,000 | (675 | ) | – | (675 | ) | ||||||||||||||||||
Fixed 4.2625% | Floating USD SOFR OIS Compound | Annually | 09/09/2025 | USD | 512,000 | 1,334 | – | 1,334 | ||||||||||||||||||||
| $ | 5,752 | $ | – | $ | 5,752 | |||||||||||||||||||||||
| Percentages are based on Net Assets of $682,737 ($ Thousands). |
^ | Security is held by the Dynamic Commodity Strategy Subsidiary Ltd. as of September 30, 2023. |
* | Non-income producing security. |
** | The rate reported is the 7-day effective yield as of September 30, 2023. |
† | Investment in Affiliated Security (see Note 6). |
The following is a summary of the level of inputs used as of September 30, 2023, in valuing the Fund's investments and other financial instruments carried at value ($ Thousands):
Investments in Securities | Level 1 | Level 2 | Level 3 | Total | ||||||||||||
Common Stock | 545,556 | – | – | 545,556 | ||||||||||||
Foreign Common Stock | 783 | – | – | 783 | ||||||||||||
Cash Equivalent | 2,779 | – | – | 2,779 | ||||||||||||
Purchased Options | 6,937 | – | – | 6,937 | ||||||||||||
Total Investments in Securities | 556,055 | – | – | 556,055 | ||||||||||||
Other Financial Instruments | Level 1 | Level 2 | Level 3 | Total | ||||||||||||
Written Options | (1,514 | ) | – | – | (1,514 | ) | ||||||||||
Futures Contracts* | ||||||||||||||||
Unrealized Depreciation | (2,699 | ) | – | – | (2,699 | ) | ||||||||||
OTC Swaps | ||||||||||||||||
Total Return Swaps* | ||||||||||||||||
Unrealized Depreciation | – | (7,491 | ) | – | (7,491 | ) | ||||||||||
Centrally Cleared Swaps | ||||||||||||||||
Interest Rate Swaps* | ||||||||||||||||
Unrealized Appreciation | – | 6,427 | – | 6,427 | ||||||||||||
Unrealized Depreciation | – | (675 | ) | – | (675 | ) | ||||||||||
Total Other Financial Instruments | (4,213 | ) | (1,739 | ) | – | (5,952 | ) | |||||||||
* | Futures contracts and swap contracts are valued at the unrealized appreciation/(depreciation) on the instruments. |
For more information on valuation inputs, see Note 2 — Significant Accounting Policies in Notes to Financial Statements.
SEI Institutional Managed Trust
263
CONSOLIDATED SCHEDULE OF INVESTMENTS
September 30, 2023
Dynamic Asset Allocation Fund (Concluded)
The following is a summary of the Fund’s transactions with affiliates for the year ended September 30, 2023 ($ Thousands):
Security Description | Value | Purchases | Proceeds | Realized Gain/(Loss) | Change in Unrealized Appreciation/(Depreciation) | Value | Income | Capital Gains | ||||||||||||||||||||||||
SEI Daily Income Trust, Government Fund, | $ | 6,875 | $ | 78,790 | $ | (82,886 | ) | $ | — | $ | — | $ | 2,779 | $ | 318 | $ | — | |||||||||||||||
| ||||||||||||||||||||||||||||||||
Amounts designated as “—” are either $0 or have been rounded to $0.
See “Glossary” for abbreviations.
The accompanying notes are an integral part of the financial statements.
264
SEI Institutional Managed Trust
SCHEDULE OF INVESTMENTS
September 30, 2023
Multi-Strategy Alternative Fund
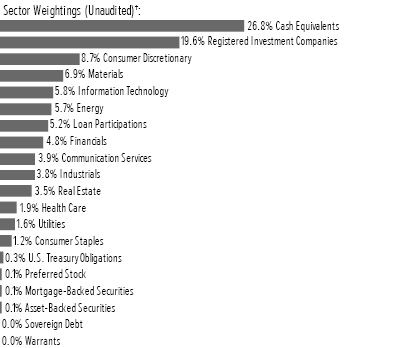
† | Percentages are based on total investments. Total investments do not include derivatives such as options, futures contracts, forward contracts, and swap contracts, if applicable. |
Description | Face Amount | Market Value | ||||||
CORPORATE OBLIGATIONS — 23.2% | ||||||||
Communication Services — 1.9% | ||||||||
Altice France | ||||||||
5.500%, 10/15/2029 (A) | $ | 310 | $ | 223 | ||||
Altice France Holding | ||||||||
10.500%, 05/15/2027 (A) | 95 | 59 | ||||||
Audacy Capital | ||||||||
6.750%, 03/31/2029 (A)(B)(C) | 335 | 6 | ||||||
6.500%, 05/01/2027 (A)(B)(C) | 220 | 5 | ||||||
Beasley Mezzanine Holdings | ||||||||
8.625%, 02/01/2026 (A) | 695 | 446 | ||||||
CCO Holdings | ||||||||
6.375%, 09/01/2029 (A) | 366 | 341 | ||||||
5.375%, 06/01/2029 (A) | 75 | 67 | ||||||
4.500%, 08/15/2030 (A) | 130 | 107 | ||||||
4.250%, 02/01/2031 (A) | 125 | 100 | ||||||
4.250%, 01/15/2034 (A) | 65 | 48 | ||||||
Charter Communications Operating | ||||||||
3.950%, 06/30/2062 | 155 | 88 | ||||||
DISH DBS | ||||||||
7.750%, 07/01/2026 | 545 | 409 | ||||||
7.375%, 07/01/2028 | 185 | 117 | ||||||
5.750%, 12/01/2028 (A) | 320 | 246 | ||||||
5.250%, 12/01/2026 (A) | 205 | 174 | ||||||
5.125%, 06/01/2029 | 220 | 122 | ||||||
Front Range BidCo | ||||||||
4.000%, 03/01/2027 (A) | 220 | 163 | ||||||
Gray Escrow II | ||||||||
5.375%, 11/15/2031 (A) | 1,030 | 674 | ||||||
Gray Television | ||||||||
7.000%, 05/15/2027 (A) | 85 | 73 | ||||||
Description | Face Amount | Market Value | ||||||
CORPORATE OBLIGATIONS (continued) | ||||||||
5.875%, 07/15/2026 (A) | $ | 5 | $ | 4 | ||||
4.750%, 10/15/2030 (A) | 365 | 242 | ||||||
Level 3 Financing | ||||||||
10.500%, 05/15/2030 (A) | 251 | 253 | ||||||
4.250%, 07/01/2028 (A) | 150 | 93 | ||||||
3.875%, 11/15/2029 (A) | 140 | 129 | ||||||
3.625%, 01/15/2029 (A) | 105 | 59 | ||||||
Lumen Technologies | ||||||||
4.000%, 02/15/2027 (A) | 280 | 184 | ||||||
Spanish Broadcasting System | ||||||||
9.750%, 03/01/2026 (A) | 610 | 408 | ||||||
Stagwell Global | ||||||||
5.625%, 08/15/2029 (A) | 325 | 262 | ||||||
Urban One | ||||||||
7.375%, 02/01/2028 (A) | 1,107 | 949 | ||||||
Vmed O2 UK Financing I | ||||||||
4.250%, 01/31/2031 (A) | 230 | 183 | ||||||
VTR Comunicaciones | ||||||||
5.125%, 01/15/2028 (A) | 215 | 121 | ||||||
Windstream Escrow | ||||||||
7.750%, 08/15/2028 (A) | 795 | 632 | ||||||
| 6,987 | ||||||||
Consumer Discretionary — 5.8% | ||||||||
1011778 BC ULC | ||||||||
4.375%, 01/15/2028 (A) | 260 | 234 | ||||||
Abercrombie & Fitch Management | ||||||||
8.750%, 07/15/2025 (A) | 304 | 309 | ||||||
Academy | ||||||||
6.000%, 11/15/2027 (A) | 251 | 237 | ||||||
Allwyn Entertainment Financing UK | ||||||||
7.875%, 04/30/2029 (A) | 261 | 264 | ||||||
Altice Financing | ||||||||
5.750%, 08/15/2029 (A) | 225 | 184 | ||||||
American Greetings | ||||||||
8.750%, 04/15/2025 (A) | 129 | 128 | ||||||
Bath & Body Works | ||||||||
7.600%, 07/15/2037 | 5 | 5 | ||||||
6.750%, 07/01/2036 | 175 | 153 | ||||||
6.625%, 10/01/2030 (A) | 60 | 56 | ||||||
BCPE Ulysses Intermediate | ||||||||
7.750%cash/0% PIK, 04/01/2027 (A) | 335 | 292 | ||||||
Brinker International | ||||||||
5.000%, 10/01/2024 (A) | 645 | 629 | ||||||
Brookfield Residential Properties | ||||||||
5.000%, 06/15/2029 (A) | 20 | 17 | ||||||
4.875%, 02/15/2030 (A) | 260 | 211 | ||||||
Caesars Entertainment | ||||||||
7.000%, 02/15/2030 (A) | 165 | 161 | ||||||
6.250%, 07/01/2025 (A) | 1,375 | 1,356 | ||||||
Caesars Resort Collection | ||||||||
5.750%, 07/01/2025 (A) | 409 | 407 | ||||||
SEI Institutional Managed Trust
265
SCHEDULE OF INVESTMENTS
September 30, 2023
Multi-Strategy Alternative Fund (Continued)
Description | Face Amount | Market Value | ||||||
CORPORATE OBLIGATIONS (continued) | ||||||||
Carnival | ||||||||
9.875%, 08/01/2027 (A) | $ | 35 | $ | 36 | ||||
6.000%, 05/01/2029 (A) | 165 | 141 | ||||||
5.750%, 03/01/2027 (A) | 531 | 481 | ||||||
4.000%, 08/01/2028 (A) | 45 | 39 | ||||||
CEC Entertainment | ||||||||
6.750%, 05/01/2026 (A) | 347 | 328 | ||||||
Clarios Global | ||||||||
6.750%, 05/15/2025 (A) | 570 | 566 | ||||||
6.250%, 05/15/2026 (A) | 740 | 724 | ||||||
CMG Media | ||||||||
8.875%, 12/15/2027 (A) | 655 | 513 | ||||||
Crocs | ||||||||
4.125%, 08/15/2031 (A) | 261 | 202 | ||||||
CSC Holdings | ||||||||
7.500%, 04/01/2028 (A) | 100 | 65 | ||||||
5.750%, 01/15/2030 (A) | 90 | 50 | ||||||
Dave & Buster's | ||||||||
7.625%, 11/01/2025 (A) | 297 | 297 | ||||||
Diamond Sports Group | ||||||||
6.625%, 08/15/2027 (A)(B) | 312 | 6 | ||||||
5.375%, 08/15/2026 (A)(B) | 480 | 10 | ||||||
Dream Finders Homes | ||||||||
8.250%, 08/15/2028 (A) | 294 | 296 | ||||||
Empire Resorts | ||||||||
7.750%, 11/01/2026 (A) | 645 | 526 | ||||||
Ford Motor Credit | ||||||||
7.350%, 03/06/2030 | 145 | 147 | ||||||
5.113%, 05/03/2029 | 500 | 457 | ||||||
4.271%, 01/09/2027 | 30 | 28 | ||||||
3.815%, 11/02/2027 | 200 | 178 | ||||||
2.900%, 02/16/2028 | 110 | 94 | ||||||
2.900%, 02/10/2029 | 530 | 435 | ||||||
Golden Entertainment | ||||||||
7.625%, 04/15/2026 (A) | 993 | 991 | ||||||
Hilton Domestic Operating | ||||||||
4.000%, 05/01/2031 (A) | 350 | 294 | ||||||
Hyatt Hotels | ||||||||
1.800%, 10/01/2024 | 824 | 790 | ||||||
Jacobs Entertainment | ||||||||
6.750%, 02/15/2029 (A) | 375 | 328 | ||||||
Las Vegas Sands | ||||||||
3.200%, 08/08/2024 | 2,232 | 2,159 | ||||||
2.900%, 06/25/2025 | 102 | 95 | ||||||
Liberty Interactive | ||||||||
8.250%, 02/01/2030 | 745 | 241 | ||||||
McGraw-Hill Education | ||||||||
5.750%, 08/01/2028 (A) | 120 | 104 | ||||||
Monitronics International | ||||||||
9.125%, 04/01/2020 (B)(D) | 550 | – | ||||||
Monitronics International (Escrow Security) | ||||||||
9.125%, 04/01/2020 (B)(D) | 495 | – | ||||||
Description | Face Amount | Market Value | ||||||
CORPORATE OBLIGATIONS (continued) | ||||||||
NCL | ||||||||
8.375%, 02/01/2028 (A) | $ | 90 | $ | 91 | ||||
5.875%, 03/15/2026 (A) | 638 | 589 | ||||||
5.875%, 02/15/2027 (A) | 110 | 105 | ||||||
3.625%, 12/15/2024 (A) | 329 | 316 | ||||||
NCL Finance | ||||||||
6.125%, 03/15/2028 (A) | 118 | 104 | ||||||
PetSmart | ||||||||
4.750%, 02/15/2028 (A) | 521 | 456 | ||||||
QVC | ||||||||
4.750%, 02/15/2027 | 465 | 285 | ||||||
4.450%, 02/15/2025 | 140 | 123 | ||||||
4.375%, 09/01/2028 | 95 | 50 | ||||||
Radiate Holdco | ||||||||
6.500%, 09/15/2028 (A) | 100 | 53 | ||||||
4.500%, 09/15/2026 (A) | 390 | 296 | ||||||
Royal Caribbean Cruises | ||||||||
11.625%, 08/15/2027 (A) | 569 | 617 | ||||||
11.500%, 06/01/2025 (A) | 396 | 418 | ||||||
StoneMor | ||||||||
8.500%, 05/15/2029 (A) | 355 | 292 | ||||||
Sugarhouse HSP Gaming Prop Mezz | ||||||||
5.875%, 05/15/2025 (A) | 344 | 332 | ||||||
Viking Cruises | ||||||||
6.250%, 05/15/2025 (A) | 968 | 947 | ||||||
VTR Comunicaciones | ||||||||
4.375%, 04/15/2029 (A) | 65 | 36 | ||||||
WW International | ||||||||
4.500%, 04/15/2029 (A) | 265 | 186 | ||||||
Wynn Las Vegas | ||||||||
5.500%, 03/01/2025 (A) | 658 | 647 | ||||||
Yum! Brands | ||||||||
5.375%, 04/01/2032 | 160 | 146 | ||||||
3.625%, 03/15/2031 | 45 | 37 | ||||||
| 21,390 | ||||||||
Consumer Staples — 1.2% | ||||||||
Albertsons | ||||||||
7.500%, 03/15/2026 (A) | 1,452 | 1,472 | ||||||
4.875%, 02/15/2030 (A) | 190 | 171 | ||||||
4.625%, 01/15/2027 (A) | 85 | 81 | ||||||
B&G Foods | ||||||||
5.250%, 04/01/2025 | 300 | 294 | ||||||
Coty | ||||||||
6.500%, 04/15/2026 (A) | 143 | 142 | ||||||
5.000%, 04/15/2026 (A) | 721 | 693 | ||||||
New Albertsons | ||||||||
8.700%, 05/01/2030 | 200 | 211 | ||||||
8.000%, 05/01/2031 | 40 | 41 | ||||||
Performance Food Group | ||||||||
6.875%, 05/01/2025 (A) | 365 | 365 | ||||||
266
SEI Institutional Managed Trust
Description | Face Amount | Market Value | ||||||
CORPORATE OBLIGATIONS (continued) | ||||||||
Post Holdings | ||||||||
5.750%, 03/01/2027 (A) | $ | 327 | $ | 314 | ||||
5.625%, 01/15/2028 (A) | 180 | 170 | ||||||
Rite Aid | ||||||||
8.000%, 11/15/2026 (A) | 420 | 247 | ||||||
7.500%, 07/01/2025 (A) | 75 | 44 | ||||||
| 4,245 | ||||||||
Energy — 3.3% | ||||||||
Ascent Resources Utica Holdings | ||||||||
8.250%, 12/31/2028 (A) | 374 | 370 | ||||||
7.000%, 11/01/2026 (A) | 178 | 174 | ||||||
Baytex Energy | ||||||||
8.750%, 04/01/2027 (A) | 292 | 297 | ||||||
Chesapeake Energy | ||||||||
7.500%, 10/01/2026 (D) | 170 | 3 | ||||||
7.000%, 10/01/2024 (D) | 55 | 1 | ||||||
Crescent Energy Finance | ||||||||
9.250%, 02/15/2028 (A) | 260 | 265 | ||||||
Earthstone Energy Holdings | ||||||||
9.875%, 07/15/2031 (A) | 55 | 60 | ||||||
8.000%, 04/15/2027 (A) | 677 | 693 | ||||||
EnLink Midstream | ||||||||
6.500%, 09/01/2030 (A) | 25 | 24 | ||||||
5.625%, 01/15/2028 (A) | 80 | 76 | ||||||
5.375%, 06/01/2029 | 230 | 213 | ||||||
Genesis Energy | ||||||||
8.000%, 01/15/2027 | 195 | 188 | ||||||
7.750%, 02/01/2028 | 185 | 175 | ||||||
Greenfire Resources | ||||||||
12.000%, 10/01/2028 (A) | 235 | 231 | ||||||
Murphy Oil | ||||||||
5.875%, 12/01/2027 | 410 | 398 | ||||||
5.750%, 08/15/2025 | 218 | 218 | ||||||
Nabors Industries | ||||||||
5.750%, 02/01/2025 | 147 | 144 | ||||||
NGL Energy Operating | ||||||||
7.500%, 02/01/2026 (A) | 581 | 575 | ||||||
Northern Oil and Gas | ||||||||
8.125%, 03/01/2028 (A) | 200 | 200 | ||||||
Oceaneering International | ||||||||
6.000%, 02/01/2028 (A) | 71 | 67 | ||||||
Patterson-UTI Energy | ||||||||
7.150%, 10/01/2033 | 93 | 93 | ||||||
PBF Holding | ||||||||
7.875%, 09/15/2030 (A) | 229 | 228 | ||||||
6.000%, 02/15/2028 | 794 | 749 | ||||||
Range Resources | ||||||||
4.875%, 05/15/2025 | 848 | 822 | ||||||
Rockcliff Energy II | ||||||||
5.500%, 10/15/2029 (A) | 449 | 404 | ||||||
Description | Face Amount | Market Value | ||||||
CORPORATE OBLIGATIONS (continued) | ||||||||
Shelf Drilling Holdings | ||||||||
9.625%, 04/15/2029 (A) | $ | 429 | $ | 425 | ||||
SM Energy | ||||||||
6.750%, 09/15/2026 | 171 | 168 | ||||||
5.625%, 06/01/2025 | 1,495 | 1,463 | ||||||
Southwestern Energy | ||||||||
5.700%, 01/23/2025 | 550 | 542 | ||||||
Strathcona Resources | ||||||||
6.875%, 08/01/2026 (A) | 600 | 565 | ||||||
Transocean | ||||||||
11.500%, 01/30/2027 (A) | 872 | 915 | ||||||
8.000%, 02/01/2027 (A) | 265 | 255 | ||||||
7.500%, 04/15/2031 | 95 | 82 | ||||||
7.250%, 11/01/2025 (A) | 120 | 118 | ||||||
Valaris | ||||||||
8.375%, 04/30/2030 (A) | 307 | 307 | ||||||
Venture Global Calcasieu Pass | ||||||||
4.125%, 08/15/2031 (A) | 510 | 418 | ||||||
Vital Energy | ||||||||
10.125%, 01/15/2028 | 137 | 140 | ||||||
9.750%, 10/15/2030 | 138 | 141 | ||||||
| 12,207 | ||||||||
Financials — 0.9% | ||||||||
Armor Holdco | ||||||||
8.500%, 11/15/2029 (A) | 290 | 252 | ||||||
CPI CG | ||||||||
8.625%, 03/15/2026 (A) | 300 | 296 | ||||||
Finance of America Funding | ||||||||
7.875%, 11/15/2025 (A) | 680 | 561 | ||||||
Freedom Mortgage | ||||||||
12.000%, 10/01/2028 (A) | 90 | 92 | ||||||
6.625%, 01/15/2027 (A) | 230 | 202 | ||||||
Ladder Capital Finance Holdings LLLP | ||||||||
4.250%, 02/01/2027 (A) | 275 | 240 | ||||||
LD Holdings Group | ||||||||
6.500%, 11/01/2025 (A) | 600 | 498 | ||||||
6.125%, 04/01/2028 (A) | 200 | 126 | ||||||
Novo Banco MTN | ||||||||
3.500%, 01/02/2043 | EUR | 20 | 15 | |||||
3.500%, 01/23/2043 | 240 | 187 | ||||||
PennyMac Financial Services | ||||||||
5.750%, 09/15/2031 (A) | $ | 190 | 155 | |||||
4.250%, 02/15/2029 (A) | 275 | 223 | ||||||
Sabre GLBL | ||||||||
11.250%, 12/15/2027 (A) | 120 | 110 | ||||||
Starwood Property Trust | ||||||||
3.625%, 07/15/2026 (A) | 180 | 160 | ||||||
VistaJet Malta Finance | ||||||||
6.375%, 02/01/2030 (A) | 245 | 189 | ||||||
SEI Institutional Managed Trust
267
SCHEDULE OF INVESTMENTS
September 30, 2023
Multi-Strategy Alternative Fund (Continued)
Description | Face Amount | Market Value | ||||||
CORPORATE OBLIGATIONS (continued) | ||||||||
WeWork | ||||||||
15.000%cash/8.000% PIK, 08/15/2027 (A)(B) | $ | 287 | $ | 140 | ||||
11.000%cash/11.000% PIK, 08/15/2027 (A)(B) | 360 | 36 | ||||||
| 3,482 | ||||||||
Health Care — 1.8% | ||||||||
Akumin | ||||||||
7.000%, 11/01/2025 (A)(C) | 865 | 649 | ||||||
Akumin Escrow | ||||||||
7.500%, 08/01/2028 (A)(C) | 300 | 199 | ||||||
Bausch Health | ||||||||
6.250%, 02/15/2029 (A) | 235 | 93 | ||||||
5.500%, 11/01/2025 (A) | 90 | 80 | ||||||
5.250%, 01/30/2030 (A) | 155 | 58 | ||||||
5.000%, 02/15/2029 (A) | 20 | 7 | ||||||
4.875%, 06/01/2028 (A) | 125 | 71 | ||||||
CHS | ||||||||
6.000%, 01/15/2029 (A) | 161 | 130 | ||||||
5.250%, 05/15/2030 (A) | 233 | 177 | ||||||
4.750%, 02/15/2031 (A) | 528 | 374 | ||||||
Embecta | ||||||||
6.750%, 02/15/2030 (A) | 165 | 135 | ||||||
Endo DAC | ||||||||
9.500%, 07/31/2027 (A)(B) | 194 | 14 | ||||||
6.000%, 06/30/2028 (A)(B) | 193 | 13 | ||||||
5.875%, 10/15/2024 (A)(B) | 85 | 59 | ||||||
Endo Luxembourg Finance I Sarl | ||||||||
6.125%, 04/01/2029 (A)(B) | 165 | 117 | ||||||
Envision Healthcare | ||||||||
8.750%, 10/15/2026 (A)(B) | 145 | 7 | ||||||
Global Medical Response | ||||||||
6.500%, 10/01/2025 (A) | 270 | 183 | ||||||
Jazz Securities DAC | ||||||||
4.375%, 01/15/2029 (A) | 402 | 350 | ||||||
LifePoint Health | ||||||||
11.000%, 10/15/2030 (A) | 102 | 102 | ||||||
Medline Borrower | ||||||||
3.875%, 04/01/2029 (A) | 210 | 178 | ||||||
Molina Healthcare | ||||||||
4.375%, 06/15/2028 (A) | 200 | 179 | ||||||
3.875%, 11/15/2030 (A) | 125 | 104 | ||||||
Par Pharmaceutical | ||||||||
7.500%, 04/01/2027 (A)(B) | 85 | 60 | ||||||
Prime Security Services Borrower | ||||||||
5.250%, 04/15/2024 (A) | 1,710 | 1,698 | ||||||
Radiology Partners | ||||||||
9.250%, 02/01/2028 (A) | 255 | 101 | ||||||
RP Escrow Issuer | ||||||||
5.250%, 12/15/2025 (A) | 1,185 | 860 | ||||||
Description | Face Amount | Market Value | ||||||
CORPORATE OBLIGATIONS (continued) | ||||||||
Tenet Healthcare | ||||||||
6.750%, 05/15/2031 (A) | $ | 105 | $ | 101 | ||||
6.125%, 10/01/2028 | 55 | 52 | ||||||
6.125%, 06/15/2030 | 365 | 342 | ||||||
4.375%, 01/15/2030 | 220 | 189 | ||||||
| 6,682 | ||||||||
Industrials — 3.0% | ||||||||
Air Canada | ||||||||
3.875%, 08/15/2026 (A) | 417 | 378 | ||||||
American Airlines | ||||||||
11.750%, 07/15/2025 (A) | 537 | 577 | ||||||
5.750%, 04/20/2029 (A) | 80 | 75 | ||||||
Avianca Midco 2 | ||||||||
9.000%, 12/01/2028 (A) | 368 | 312 | ||||||
Bombardier | ||||||||
7.875%, 04/15/2027 (A) | 231 | 225 | ||||||
Builders FirstSource | ||||||||
4.250%, 02/01/2032 (A) | 240 | 197 | ||||||
Camelot Return Merger Sub | ||||||||
8.750%, 08/01/2028 (A) | 337 | 325 | ||||||
CDW | ||||||||
4.125%, 05/01/2025 | 41 | 40 | ||||||
Cimpress | ||||||||
7.000%, 06/15/2026 | 394 | 369 | ||||||
Cornerstone Building Brands | ||||||||
6.125%, 01/15/2029 (A) | 280 | 212 | ||||||
Delta Air Lines | ||||||||
2.900%, 10/28/2024 | 445 | 428 | ||||||
Garda World Security | ||||||||
6.000%, 06/01/2029 (A) | 610 | 499 | ||||||
GFL Environmental | ||||||||
3.750%, 08/01/2025 (A) | 326 | 309 | ||||||
Hawaiian Brand Intellectual Property | ||||||||
5.750%, 01/20/2026 (A) | 233 | 210 | ||||||
JELD-WEN | ||||||||
4.875%, 12/15/2027 (A) | 557 | 491 | ||||||
4.625%, 12/15/2025 (A) | 506 | 486 | ||||||
Mileage Plus Holdings | ||||||||
6.500%, 06/20/2027 (A) | 327 | 324 | ||||||
PGT Innovations | ||||||||
4.375%, 10/01/2029 (A) | 245 | 226 | ||||||
Pitney Bowes | ||||||||
7.250%, 03/15/2029 (A) | 275 | 202 | ||||||
6.875%, 03/15/2027 (A) | 215 | 169 | ||||||
Prime Security Services Borrower | ||||||||
5.750%, 04/15/2026 (A) | 187 | 181 | ||||||
Team Health Holdings | ||||||||
6.375%, 02/01/2025 (A) | 110 | 85 | ||||||
Titan International | ||||||||
7.000%, 04/30/2028 | 293 | 274 | ||||||
268
SEI Institutional Managed Trust
Description | Face Amount | Market Value | ||||||
CORPORATE OBLIGATIONS (continued) | ||||||||
TransDigm | ||||||||
6.875%, 12/15/2030 (A) | $ | 270 | $ | 265 | ||||
6.750%, 08/15/2028 (A) | 393 | 387 | ||||||
6.250%, 03/15/2026 (A) | 868 | 853 | ||||||
Tutor Perini | ||||||||
6.875%, 05/01/2025 (A) | 95 | 87 | ||||||
Uber Technologies | ||||||||
8.000%, 11/01/2026 (A) | 1,253 | 1,268 | ||||||
7.500%, 05/15/2025 (A) | 1,347 | 1,355 | ||||||
United Airlines | ||||||||
4.625%, 04/15/2029 (A) | 115 | 99 | ||||||
4.375%, 04/15/2026 (A) | 115 | 106 | ||||||
| 11,014 | ||||||||
Information Technology — 0.7% | ||||||||
CDW | ||||||||
5.500%, 12/01/2024 | 24 | 24 | ||||||
Coherent | ||||||||
5.000%, 12/15/2029 (A) | 275 | 238 | ||||||
CommScope | ||||||||
8.250%, 03/01/2027 (A) | 225 | 147 | ||||||
7.125%, 07/01/2028 (A) | 620 | 371 | ||||||
6.000%, 03/01/2026 (A) | 150 | 140 | ||||||
CommScope Technologies | ||||||||
6.000%, 06/15/2025 (A) | 36 | 34 | ||||||
5.000%, 03/15/2027 (A) | 35 | 20 | ||||||
Gen Digital | ||||||||
5.000%, 04/15/2025 (A) | 878 | 858 | ||||||
Presidio Holdings | ||||||||
8.250%, 02/01/2028 (A) | 300 | 287 | ||||||
Virtusa | ||||||||
7.125%, 12/15/2028 (A) | 408 | 329 | ||||||
| 2,448 | ||||||||
Materials — 1.7% | ||||||||
Ardagh Packaging Finance | ||||||||
5.250%, 08/15/2027 (A) | 250 | 209 | ||||||
Axalta Coating Systems | ||||||||
3.375%, 02/15/2029 (A) | 280 | 233 | ||||||
Baffinland Iron Mines | ||||||||
8.750%, 07/15/2026 (A) | 610 | 594 | ||||||
Ball | ||||||||
3.125%, 09/15/2031 | 215 | 168 | ||||||
Canpack | ||||||||
3.875%, 11/15/2029 (A) | 104 | 85 | ||||||
Celanese US Holdings | ||||||||
6.700%, 11/15/2033 | 303 | 295 | ||||||
6.550%, 11/15/2030 | 92 | 90 | ||||||
6.350%, 11/15/2028 | 46 | 45 | ||||||
Cleveland-Cliffs | ||||||||
6.750%, 03/15/2026 (A) | 228 | 227 | ||||||
Description | Face Amount | Market Value | ||||||
CORPORATE OBLIGATIONS (continued) | ||||||||
Cornerstone Chemical | ||||||||
13.000%, 08/26/2024 (C)(D) | $ | 114 | $ | 114 | ||||
10.250%cash/10.250% PIK, 09/01/2027 (A)(B)(C)(D) | 1,155 | 693 | ||||||
Domtar | ||||||||
6.750%, 10/01/2028 (A) | 490 | 406 | ||||||
Innophos Holdings | ||||||||
9.375%, 02/15/2028 (A) | 250 | 240 | ||||||
Iris Holdings | ||||||||
8.750%cash/0% PIK, 02/15/2026 (A) | 5 | 5 | ||||||
LSB Industries | ||||||||
6.250%, 10/15/2028 (A) | 190 | 172 | ||||||
Mineral Resources | ||||||||
8.125%, 05/01/2027 (A) | 105 | 104 | ||||||
Mineral Resources MTN | ||||||||
8.500%, 05/01/2030 (A) | 105 | 103 | ||||||
8.000%, 11/01/2027 (A) | 35 | 34 | ||||||
Mountain Province Diamonds | ||||||||
9.000%, 12/15/2025 (A)(D) | 223 | 217 | ||||||
Nobian Finance BV | ||||||||
3.625%, 07/15/2026 | EUR | 105 | 100 | |||||
Northwest Acquisitions ULC | ||||||||
7.125%, 11/01/2022 (A)(B)(C)(D) | $ | 460 | – | |||||
NOVA Chemicals | ||||||||
4.875%, 06/01/2024 (A) | 546 | 536 | ||||||
Olympus Water US Holding | ||||||||
9.750%, 11/15/2028 (A) | 512 | 511 | ||||||
Rain Carbon | ||||||||
12.250%, 09/01/2029 (A) | 215 | 225 | ||||||
Rain CII Carbon | ||||||||
7.250%, 04/01/2025 (A) | 6 | 6 | ||||||
Tacora Resources | ||||||||
13.000%cash/13.000% PIK, 09/08/2023 (A)(C)(D) | 23 | 24 | ||||||
8.250%, 05/15/2026 (A)(B)(C) | 305 | 166 | ||||||
Trivium Packaging Finance BV | ||||||||
5.500%, 08/15/2026 (A) | 417 | 389 | ||||||
Tronox | ||||||||
4.625%, 03/15/2029 (A) | 355 | 287 | ||||||
| 6,278 | ||||||||
Real Estate — 2.0% | ||||||||
Diversified Healthcare Trust | ||||||||
9.750%, 06/15/2025 | 104 | 100 | ||||||
4.750%, 05/01/2024 | 450 | 426 | ||||||
4.750%, 02/15/2028 | 100 | 73 | ||||||
4.375%, 03/01/2031 | 445 | 308 | ||||||
GLP Capital | ||||||||
3.350%, 09/01/2024 | 109 | 106 | ||||||
Park Intermediate Holdings | ||||||||
7.500%, 06/01/2025 (A) | 1,276 | 1,274 | ||||||
SEI Institutional Managed Trust
269
SCHEDULE OF INVESTMENTS
September 30, 2023
Multi-Strategy Alternative Fund (Continued)
Description | Face Amount | Market Value | ||||||
CORPORATE OBLIGATIONS (continued) | ||||||||
Service Properties Trust | ||||||||
5.500%, 12/15/2027 | $ | 255 | $ | 218 | ||||
4.950%, 02/15/2027 | 417 | 352 | ||||||
4.950%, 10/01/2029 | 55 | 42 | ||||||
4.750%, 10/01/2026 | 424 | 364 | ||||||
4.650%, 03/15/2024 | 421 | 415 | ||||||
4.500%, 03/15/2025 | 478 | 447 | ||||||
4.375%, 02/15/2030 | 390 | 280 | ||||||
4.350%, 10/01/2024 | 602 | 577 | ||||||
3.950%, 01/15/2028 | 371 | 289 | ||||||
VICI Properties | ||||||||
5.625%, 05/01/2024 (A) | 995 | 989 | ||||||
4.625%, 06/15/2025 (A) | 641 | 619 | ||||||
3.500%, 02/15/2025 (A) | 454 | 434 | ||||||
| 7,313 | ||||||||
Utilities — 0.9% | ||||||||
Alexander Funding Trust | ||||||||
1.841%, 11/15/2023 (A) | 131 | 130 | ||||||
Vistra Operations | ||||||||
5.625%, 02/15/2027 (A) | 140 | 133 | ||||||
5.500%, 09/01/2026 (A) | 55 | 52 | ||||||
5.125%, 05/13/2025 (A) | 536 | 522 | ||||||
4.875%, 05/13/2024 (A) | 93 | 92 | ||||||
3.550%, 07/15/2024 (A) | 2,484 | 2,423 | ||||||
| 3,352 | ||||||||
Total Corporate Obligations | ||||||||
(Cost $93,765) ($ Thousands) | 85,398 | |||||||
| ||||||||
COMMON STOCK — 20.9% | ||||||||
Communication Services — 1.9% | ||||||||
AVAYA Inc. * | 14,995 | 125 | ||||||
Clear Channel Outdoor Holdings Inc, Cl A * | 5,490 | 9 | ||||||
Madison Square Garden Entertainment, Cl A * | 21,800 | 717 | ||||||
Pinterest Inc, Cl A * | 123,222 | 3,331 | ||||||
Take-Two Interactive Software Inc, Cl A * | 3,716 | 522 | ||||||
TripAdvisor Inc * | 130,995 | 2,172 | ||||||
Urban One | 10,131 | 51 | ||||||
Urban One, Cl A | 9,095 | 46 | ||||||
Windstream Services * | 11,015 | 104 | ||||||
| 7,077 | ||||||||
Consumer Discretionary — 2.4% | ||||||||
ADT Inc | 3,290 | 20 | ||||||
Caesars Entertainment Inc * | 2,136 | 99 | ||||||
Crocs Inc * | 12,688 | 1,120 | ||||||
Everi Holdings Inc * | 9,495 | 126 | ||||||
Golden Entertainment Inc | 2,140 | 73 | ||||||
Description | Shares | Market Value | ||||||
COMMON STOCK (continued) | ||||||||
Guitar Center *(C)(D) | 2,167 | $ | 329 | |||||
Monitronics International (D) | 443 | 7 | ||||||
Penn Entertainment Inc * | 95,162 | 2,184 | ||||||
PlayAGS Inc * | 21,369 | 139 | ||||||
Vail Resorts Inc | 11,097 | 2,462 | ||||||
Victoria's Secret & Co * | 124,803 | 2,082 | ||||||
WW International Inc * | 4,370 | 48 | ||||||
| 8,689 | ||||||||
Energy — 1.9% | ||||||||
Diamondback Energy Inc, Cl A (E) | 17,219 | 2,667 | ||||||
Greenfire Resources * | 27,132 | 134 | ||||||
Parker Drilling Co *(D) | 4,414 | 58 | ||||||
RPC Inc | 213,318 | 1,907 | ||||||
Transocean Ltd *(E) | 272,498 | 2,237 | ||||||
| 7,003 | ||||||||
Financials — 3.7% | ||||||||
Assured Guaranty Ltd (E) | 43,954 | 2,660 | ||||||
Fidelity National Information Services Inc, Cl B | 38,231 | 2,113 | ||||||
Fifth Third Bancorp | 54,691 | 1,385 | ||||||
Marqeta Inc, Cl A * | 118,697 | 710 | ||||||
Morgan Stanley | 34,419 | 2,811 | ||||||
Penney Borrower LLC *(D) | 3,070 | 8 | ||||||
Robinhood Markets Inc, Cl A * | 247,183 | 2,425 | ||||||
Unum Group | 29,144 | 1,434 | ||||||
| 13,546 | ||||||||
Health Care — 0.0% | ||||||||
Carestream Health Holdings Inc *(D) | 5,876 | 99 | ||||||
Community Health Systems Inc * | 1,053 | 3 | ||||||
Iovance Biotherapeutics Inc * | 4,350 | 20 | ||||||
Lannett (D) | 15,243 | 27 | ||||||
| 149 | ||||||||
Industrials — 0.5% | ||||||||
Dycom Industries Inc * | 18,815 | 1,674 | ||||||
Hawaiian Holdings Inc * | 7,722 | 49 | ||||||
| 1,723 | ||||||||
Information Technology — 4.7% | ||||||||
Aquity Holdings Inc *(C)(D) | 3,945 | 43 | ||||||
Cirrus Logic Inc * | 22,037 | 1,630 | ||||||
Elastic NV * | 13,882 | 1,128 | ||||||
Entegris Inc (E) | 24,573 | 2,308 | ||||||
Everbridge Inc * | 61,764 | 1,385 | ||||||
Five9 Inc * | 17,531 | 1,127 | ||||||
HubSpot Inc * | 1,437 | 708 | ||||||
Methode Electronics Inc | 7,654 | 175 | ||||||
Microsoft Corp | 2,231 | 704 | ||||||
Monday.com Ltd * | 2,636 | 420 | ||||||
MongoDB Inc, Cl A * | 3,180 | 1,100 | ||||||
SentinelOne Inc, Cl A * | 84,948 | 1,432 | ||||||
270
SEI Institutional Managed Trust
Description | Shares | Market Value | ||||||
COMMON STOCK (continued) | ||||||||
Vishay Intertechnology Inc (E) | 94,191 | $ | 2,328 | |||||
Western Digital Corp * | 15,855 | 723 | ||||||
Zoom Video Communications Inc, Cl A * | 30,986 | 2,167 | ||||||
| 17,378 | ||||||||
Materials — 3.9% | ||||||||
Alcoa Corp (E) | 68,882 | 2,002 | ||||||
Arctic Canadian Diamond Company Ltd *(D) | 228 | 71 | ||||||
ATI Inc *(E) | 59,565 | 2,451 | ||||||
Burgundy Diamond Mines * | 450,932 | 52 | ||||||
Century Aluminum Co * | 301,750 | 2,170 | ||||||
Constellium, Cl A * | 149,476 | 2,721 | ||||||
Freeport-McMoRan Inc, Cl B (E) | 63,293 | 2,360 | ||||||
Libbey Glass Inc. *(D) | 1,227 | 9 | ||||||
Olin Corp (E) | 46,276 | 2,313 | ||||||
West Fraser Timber Co Ltd, Cl O | 5,218 | 381 | ||||||
| 14,530 | ||||||||
Real Estate — 1.3% | ||||||||
Copper Property CTL Pass-Through Trust | 18,673 | 198 | ||||||
Kimco Realty Corp ‡ | 202,111 | 3,555 | ||||||
Park Hotels & Resorts Inc ‡ | 93,166 | 1,148 | ||||||
| 4,901 | ||||||||
Utilities — 0.6% | ||||||||
Consolidated Edison Inc | 8,270 | 707 | ||||||
Duke Energy Corp | 15,945 | 1,407 | ||||||
Lumileds Common Bright Bidco * | 965 | 1 | ||||||
| 2,115 | ||||||||
Total Common Stock | ||||||||
(Cost $78,034) ($ Thousands) | 77,111 | |||||||
REGISTERED INVESTMENT COMPANIES — 18.8% | ||||||||
Merger Fund , Cl I | 4,028,487 | 68,968 | ||||||
Sprott Physical Uranium Trust | 21,761 | 371 | ||||||
Total Registered Investment Companies | ||||||||
(Cost $65,743) ($ Thousands) | 69,339 | |||||||
| ||||||||
LOAN PARTICIPATIONS — 5.0% | ||||||||
1236904 B.C. LTD., Initial Term Loan, 1st Lien | ||||||||
10.931%, CME Term SOFR + 5.614%, 03/04/2027 (F) | $ | 255 | 243 | |||||
ACProducts Holdings, Inc., Initial Term Loan, 1st Lien | ||||||||
9.902%, CME Term SOFR + 4.250%, 05/17/2028 (F)(G) | 197 | 162 | ||||||
Description | Face Amount | Market Value | ||||||
LOAN PARTICIPATIONS (continued) | ||||||||
American Airlines, Inc., 2020 Term Loan, 1st Lien | ||||||||
7.318%, 01/29/2027 | $ | 125 | $ | 123 | ||||
Aquity Solutions LLC, Term Loan, 1st Lien | ||||||||
11.181%, 09/13/2026 (C)(D) | 431 | 431 | ||||||
Avaya Inc., Initial Term Loan, 1st Lien | ||||||||
13.816%, CME Term SOFR + 8.500%, 08/01/2028 (F) | 403 | 354 | ||||||
Aveanna Healthcare LLC, 2021 Extended Term Loan, 1st Lien | ||||||||
9.272%, CME Term SOFR + 3.750%, 07/17/2028 (F) | 281 | 251 | ||||||
Bluecrest, Intial Term Loan, 2nd Lien | ||||||||
13.416%, 08/31/2027 (C)(D) | 280 | 271 | ||||||
Carestream Health, Inc., Term Loan, 1st Lien | ||||||||
12.990%, CME Term SOFR + 7.500%, 09/30/2027 (F) | 549 | 434 | ||||||
Castle US Holding Corp., Dollar Term B-2 Loan, 1st Lien | ||||||||
9.684%, 01/29/2027 (G) | 164 | 129 | ||||||
Castle US Holding Corp., Initial Dollar Term Loan, 1st Lien | ||||||||
9.434%, CME Term SOFR + 3.750%, 01/29/2027 (F)(G) | 197 | 154 | ||||||
CMG Media Corporation, 2021 Term B Loan, 1st Lien | ||||||||
8.990%, CME Term SOFR + 3.500%, 12/17/2026 (F) | 119 | 109 | ||||||
ConvergeOne Holdings, Corp., Initial Term Loan, 1st Lien | ||||||||
10.372%, 01/04/2026 (F) | 322 | 194 | ||||||
Cooper’s Hawk Intermediate Holding, LLC, Initial Term Loan, 1st Lien | ||||||||
11.931%, 10/31/2026 (F) | 233 | 228 | ||||||
Cooper’s Hawk Intermediate Holding, LLC, 2022 Incremental Term Loan, 1st Lien | ||||||||
11.931%, CME Term SOFR + 6.500%, 10/31/2026 (F) | 44 | 44 | ||||||
Dominion Diamond, 1st Lien | ||||||||
10.000%, 06/30/2026 (D) | 170 | 170 | ||||||
Domtar Corporation, Initial Term Loan, 1st Lien | ||||||||
10.939%, 11/30/2028 (F) | 104 | 103 | ||||||
East Valley Tourist Development Authority , Term Loan, 1st Lien | ||||||||
13.152%, CME Term SOFR + 7.500%, 11/23/2026 (D)(F) | 155 | 151 | ||||||
Envision Healthcare Corp., First Out Term Loan, 1st Lien | ||||||||
13.267%, CME Term SOFR + 7.875%, 03/31/2027 (B)(F) | 131 | 153 | ||||||
SEI Institutional Managed Trust
271
SCHEDULE OF INVESTMENTS
September 30, 2023
Multi-Strategy Alternative Fund (Continued)
Description | Face Amount | Market Value | ||||||
LOAN PARTICIPATIONS (continued) | ||||||||
Envision Healthcare Corp., Second Out Term Loan, 1st Lien | ||||||||
9.640%, CME Term SOFR + 4.250%, 03/31/2027 (B)(F)(G) | $ | 1,207 | $ | 272 | ||||
Epic Y-Grade Services, LP, Term Loan, 1st Lien | ||||||||
11.523%, 06/30/2027 (F) | 1,494 | 1,393 | ||||||
Global Medical Response, Inc., 2018 New Term Loan, 1st Lien | ||||||||
9.881%, CME Term SOFR + 4.250%, 03/14/2025 (F) | 551 | 382 | ||||||
Global Medical Response, Inc., 2021 Refinancing Term Loan, 1st Lien | ||||||||
9.780%, CME Term SOFR + 4.250%, 10/02/2025 (F) | 896 | 621 | ||||||
Hubbard Radio, LLC, 1st Lien | ||||||||
9.960%, 03/28/2025 | 125 | 113 | ||||||
J.C. Penney Corporation Inc., Term Loan, 1st Lien | ||||||||
5.250%, 06/21/2024 (B)(D)(F) | 378 | — | ||||||
Lannett Takeback Exit Term Loan, 1st Lien | ||||||||
2.000%, 06/16/2030 (D) | 92 | 92 | ||||||
Libbey Glass LLC, Incremental Term Loan, 1st Lien | ||||||||
11.923%, 11/22/2027 (G) | 434 | 411 | ||||||
LifeScan Global Corporation, Initial Term Loan, 1st Lien | ||||||||
11.747%, 12/31/2026 | 1,813 | 1,429 | ||||||
LifeScan Global Corporation, Initial Term Loan, 2nd Lien | ||||||||
14.669%, CME Term SOFR + 9.500%, 03/31/2027 (F) | 85 | 51 | ||||||
Magenta Buyer LLC, Initial Term Loan, 1st Lien | ||||||||
10.631%, CME Term SOFR + 5.000%, 07/27/2028 (F)(G) | 897 | 665 | ||||||
Mashantucket (Western) Pequot Tribe, Term B Loan, 1st Lien | ||||||||
12.556%, 02/16/2025 | 377 | 372 | ||||||
Matrix Parent, Inc., Initial Term Loan, 1st Lien | ||||||||
10.540%, CME Term SOFR + 5.000%, 03/01/2029 (F)(G) | 592 | 405 | ||||||
Mavenir Systems, Inc., Initial Term Loan, 1st Lien | ||||||||
11.127%, CME Term SOFR + 5.750%, 08/18/2028 (F) | 78 | 61 | ||||||
10.389%, CME Term SOFR + 4.750%, 08/18/2028 (F)(G) | 864 | 681 | ||||||
McGraw-Hill Education, Inc., Initial Term Loan, 1st Lien | ||||||||
10.181%, CME Term SOFR + 4.750%, 07/28/2028 (F) | 279 | 273 | ||||||
Description | Face Amount | Market Value | ||||||
LOAN PARTICIPATIONS (continued) | ||||||||
Mountaineer Merger Corp., Initial Term Loan, 1st Lien | ||||||||
12.876%, 10/26/2028 (F) | $ | 193 | $ | 150 | ||||
Pinnacle Service Brands, LLC, Initial Term Loan, 1st Lien | ||||||||
13.659%, CME Term SOFR + 8.000%, 03/22/2026 (D)(F) | 200 | 190 | ||||||
Pluto Acquisition I, Inc., 2021 Term Loan, 1st Lien | ||||||||
9.684%, CME Term SOFR + 4.000%, 06/22/2026 (F)(G) | 497 | 432 | ||||||
Premier Brands Group Holdings LLC, Initial Loan, 1st Lien | ||||||||
14.469%, 03/20/2024 (C) | 194 | 145 | ||||||
Procera Networks, Inc., Initial Term Loan, 1st Lien | ||||||||
9.931%, CME Term SOFR + 4.500%, 10/31/2025 (F) | 259 | 221 | ||||||
Pug LLC, USD Term B Loan, 1st Lien | ||||||||
8.931%, CME Term SOFR + 3.500%, 02/12/2027 (F) | 321 | 302 | ||||||
Quantum Health, Inc., Amendment No. 1 Refinancing Term Loan, 1st Lien | ||||||||
10.184%, CME Term SOFR + 4.500%, 12/22/2027 (D)(F)(G) | 115 | 109 | ||||||
Quest Software US Holdings Inc., Initial Term Loan, 1st Lien | ||||||||
9.769%, CME Term SOFR + 4.250%, 02/01/2029 (F) | 410 | 341 | ||||||
Radiate Holdco, LLC, Amendment No. 6 Term B Loan, 1st Lien | ||||||||
8.681%, CME Term SOFR + 3.250%, 09/25/2026 (F) | 237 | 193 | ||||||
Radiology Partners, Inc., Term B Loan, 1st Lien | ||||||||
10.179%, CME Term SOFR + 4.250%, 07/09/2025 (F) | 211 | 158 | ||||||
Red Planet Borrower, LLC, Initial Term Loan, 1st Lien | ||||||||
9.166%, CME Term SOFR + 3.750%, 10/02/2028 (F)(G) | 172 | 164 | ||||||
S&S Holdings LLC, Initial Term Loan, 1st Lien | ||||||||
10.408%, CME Term SOFR + 5.000%, 03/11/2028 (F) | 283 | 270 | ||||||
Sabre GLBL Inc., 2021 Other Term B-1 Loan, 1st Lien | ||||||||
8.931%, CME Term SOFR + 3.500%, 12/17/2027 (F)(G) | 139 | 121 | ||||||
Sabre GLBL Inc., 2021 Other Term B-2 Loan, 1st Lien | ||||||||
8.931%, CME Term SOFR + 3.500%, 12/17/2027 (F)(G) | 218 | 190 | ||||||
272
SEI Institutional Managed Trust
Description | Face Amount | Market Value | ||||||
LOAN PARTICIPATIONS (continued) | ||||||||
Sabre GLBL Inc., 2022 Other Term B Loan, 1st Lien | ||||||||
9.666%, CME Term SOFR + 4.250%, 06/30/2028 (F) | $ | 230 | $ | 201 | ||||
Sabre GLBL Inc., 2022 Term B-2 Loan, 1st Lien | ||||||||
10.416%, CME Term SOFR + 5.000%, 06/30/2028 (F) | 27 | 24 | ||||||
SWF Holdings I Corp., Initial Term Loan, 1st Lien | ||||||||
9.431%, CME Term SOFR + 4.000%, 10/06/2028 (F) | 382 | 324 | ||||||
Syniverse Holdings, LLC, Initial Term Loan, 1st Lien | ||||||||
12.390%, CME Term SOFR + 7.000%, 05/13/2027 (F) | 540 | 472 | ||||||
Team Health Holdings, Inc., Extended Term Loan, 1st Lien | ||||||||
10.566%, CME Term SOFR + 5.250%, 03/02/2027 (F) | 1,052 | 794 | ||||||
TransDigm Inc., Tranche I Term Loan, 1st Lien | ||||||||
8.640%, CME Term SOFR + 3.250%, 08/24/2028 (F) | 144 | 144 | ||||||
Travelport Finance (Luxembourg) S.a r.l., Consented Term Loan, Other | ||||||||
13.890%, CME Term SOFR + 8.500%, 05/29/2026 (F)(G) | 220 | 126 | ||||||
Vida Capital, Inc., Initial Term Loan, 1st Lien | ||||||||
11.431%, 10/01/2026 (G) | 1,041 | 854 | ||||||
WarHorse Gaming, LLC, Closing Date Term Loan, 1st Lien | ||||||||
14.668%, 06/30/2028 | 269 | 267 | ||||||
Wellful Inc., Initial Term Loan, 1st Lien | ||||||||
11.681%, CME Term SOFR + 6.250%, 04/21/2027 (F)(G) | 567 | 480 | ||||||
WW International, Inc., Initial Term Loan, 1st Lien | ||||||||
8.931%, CME Term SOFR + 3.500%, 04/13/2028 (F) | 8 | 6 | ||||||
Xplornet Communications, Inc., Refinancing Term Loan, 1st Lien | ||||||||
9.652%, 10/02/2028 (G) | 711 | 556 | ||||||
Zayo Group Holdings, Inc., Initial Dollar Term Loan, 1st Lien | ||||||||
8.431%, CME Term SOFR + 3.000%, 03/09/2027 (F) | 356 | 290 | ||||||
Total Loan Participations | ||||||||
(Cost $19,426) ($ Thousands) | 18,449 | |||||||
Description | Shares | Market Value | ||||||
FOREIGN COMMON STOCK — 1.5% | ||||||||
Australia — 0.7% | ||||||||
Lynas Rare Earths * | 218,303 | $ | 956 | |||||
South32 Ltd | 749,498 | 1,640 | ||||||
| 2,596 | ||||||||
Belgium — 0.2% | ||||||||
X-Fab Silicon Foundries * | 79,372 | 823 | ||||||
Canada — 0.5% | ||||||||
Hudbay Minerals (E) | 202,950 | 988 | ||||||
NexGen Energy * | 143,981 | 860 | ||||||
| 1,848 | ||||||||
Norway — 0.1% | ||||||||
OKEA | 65,649 | 235 | ||||||
Total Foreign Common Stock | ||||||||
(Cost $6,798) ($ Thousands) | 5,502 | |||||||
| ||||||||
CONVERTIBLE BONDS — 0.3% | ||||||||
Authentic Brands | ||||||||
5.000%, 09/01/2029(D) | $ | 32 | 32 | |||||
Liberty Interactive | ||||||||
4.000%, 11/15/2029 | 55 | 13 | ||||||
3.750%, 02/15/2030 | 419 | 104 | ||||||
NextEra Energy Partners | ||||||||
2.500%, 06/15/2026(A) | 284 | 241 | ||||||
North Sea Natural Resources | ||||||||
0.000%, (D)(H)(I) | 94 | 93 | ||||||
0.000%, (D)(H) | 14 | 14 | ||||||
Silver Airways LLC | ||||||||
15.000%, 12/31/2027(D) | 595 | 595 | ||||||
Total Convertible Bonds | ||||||||
(Cost $1,196) ($ Thousands) | 1,092 | |||||||
U.S. TREASURY OBLIGATIONS — 0.3% | ||||||||
U.S. Treasury Bill | ||||||||
5.354%, 11/16/2023 (J) | 500 | 496 | ||||||
U.S. Treasury Bonds | ||||||||
3.625%, 05/15/2053 | 118 | 98 | ||||||
SEI Institutional Managed Trust
273
SCHEDULE OF INVESTMENTS
September 30, 2023
Multi-Strategy Alternative Fund (Continued)
Description | Face Amount | Market Value | ||||||
U.S. TREASURY OBLIGATIONS (continued) | ||||||||
U.S. Treasury Notes | ||||||||
4.375%, 08/31/2028 | $ | 484 | $ | 479 | ||||
Total U.S. Treasury Obligations | ||||||||
(Cost $1,088) ($ Thousands) | 1,073 | |||||||
| ||||||||
PREFERRED STOCK — 0.1% | ||||||||
Consumer Discretionary — 0.0% | ||||||||
Guitar Center *(C)(D)(I) | 39 | 4 | ||||||
Information Technology — 0.1% | ||||||||
Syniverse *(D)(I) | 496,393 | 475 | ||||||
Total Preferred Stock | ||||||||
(Cost $491) ($ Thousands) | 479 | |||||||
| ||||||||
MORTGAGE-BACKED SECURITIES — 0.1% | ||||||||
Non-Agency Mortgage-Backed Obligations — 0.1% | ||||||||
BX Commercial Mortgage Trust, Ser 2022-CSMO, Cl D | ||||||||
9.670%, TSFR1M + 4.337%, 06/15/2027(A)(F) | $ | 245 | 245 | |||||
TRTX, Ser 2021-FL4, Cl D | ||||||||
9.047%, TSFR1M + 3.714%, 03/15/2038(A)(F) | 100 | 90 | ||||||
TRTX, Ser 2021-FL4, Cl E | ||||||||
9.797%, TSFR1M + 4.464%, 03/15/2038(A)(F) | 100 | 89 | ||||||
| 424 | ||||||||
Total Mortgage-Backed Securities | ||||||||
(Cost $444) ($ Thousands) | 424 | |||||||
ASSET-BACKED SECURITIES — 0.1% | ||||||||
Other Asset-Backed Securities — 0.1% | ||||||||
STWD, Ser 2021-FL2, Cl D | ||||||||
8.245%, TSFR1M + 2.914%, 04/18/2038(A)(F) | 100 | 86 | ||||||
Description | Face Amount | Market Value | ||||||
ASSET-BACKED SECURITIES (continued) | ||||||||
STWD, Ser 2021-FL2, Cl E | ||||||||
8.995%, TSFR1M + 3.664%, 04/18/2038(A)(F) | $ | 100 | $ | 91 | ||||
Total Asset-Backed Securities | ||||||||
(Cost $200) ($ Thousands) | 177 | |||||||
SOVEREIGN DEBT — 0.0% | ||||||||
Allwyn Entertainment Financing UK | ||||||||
7.250%, 04/30/2030 | EUR | 115 | 123 | |||||
Total Sovereign Debt | ||||||||
(Cost $128) ($ Thousands) | 123 | |||||||
Number of Warrants | ||||||||
WARRANTS — 0.0% | ||||||||
Greenfire RES, Expires 09/20/2028 | ||||||||
Strike Price $– * | 1,088 | 1 | ||||||
Guitar Center, Expires 12/22/2070 | ||||||||
Strike Price $100.00 *(C)(D) | 574 | 33 | ||||||
Guitar Center, Expires 12/22/2070 | ||||||||
Strike Price $160.00 *(C)(D) | 574 | 16 | ||||||
Silver Airways LLC | ||||||||
Strike Price $– *‡‡(D) | – | – | ||||||
Tacora Resources | ||||||||
Strike Price $– *‡‡(C)(D) | 614,882 | – | ||||||
Total Warrants | ||||||||
(Cost $52) ($ Thousands) | 50 | |||||||
| ||||||||
CASH EQUIVALENTS — 25.8% | ||||||||
Morgan Stanley Institutional Liquidity Fund Treasury Securities Portfolio, Institutional Share Class | ||||||||
5.210%** | 2,889,633 | 2,890 | ||||||
SEI Daily Income Trust, Government Fund, Institutional Class | ||||||||
5.210%**† | 92,197,505 | 92,197 | ||||||
Total Cash Equivalents | ||||||||
(Cost $95,087) ($ Thousands) | 95,087 | |||||||
274
SEI Institutional Managed Trust
Description |
| Market Value | ||||||
PURCHASED OPTIONS — 0.0% | ||||||||
Total Purchased Options | ||||||||
(Cost $47) ($ Thousands) | $ | 65 | ||||||
Total Investments in Securities — 96.1% | ||||||||
(Cost $362,499) ($ Thousands) | $ | 354,369 | ||||||
COMMON STOCK SOLD SHORT— (5.8)% | ||||||||
Communication Services — (0.7)% | ||||||||
Comcast Corp, Cl A | (11,997 | ) | $ | (532 | ) | |||
T-Mobile US Inc | (3,793 | ) | (531 | ) | ||||
Yelp Inc, Cl A * | (38,924 | ) | (1,619 | ) | ||||
| (2,682 | ) | |||||||
Consumer Discretionary — (1.6)% | ||||||||
Booking Holdings Inc * | (170 | ) | (524 | ) | ||||
Boot Barn Holdings Inc * | (10,736 | ) | (872 | ) | ||||
Boyd Gaming Corp | (377 | ) | (23 | ) | ||||
Darden Restaurants Inc | (2,469 | ) | (354 | ) | ||||
Expedia Group Inc * | (5,122 | ) | (528 | ) | ||||
G-III Apparel Group Ltd * | (410 | ) | (10 | ) | ||||
Hilton Grand Vacations Inc * | (13,109 | ) | (534 | ) | ||||
Hilton Worldwide Holdings Inc | (2,368 | ) | (356 | ) | ||||
Marriott International Inc/MD, Cl A | (1,803 | ) | (354 | ) | ||||
SeaWorld Entertainment Inc * | (6,411 | ) | (296 | ) | ||||
Stitch Fix Inc, Cl A * | (180,723 | ) | (623 | ) | ||||
Texas Roadhouse Inc, Cl A | (3,666 | ) | (352 | ) | ||||
YETI Holdings Inc * | (18,353 | ) | (885 | ) | ||||
| (5,711 | ) | |||||||
Energy — (0.1)% | ||||||||
Cactus Inc, Cl A | (6,906 | ) | (347 | ) | ||||
Financials — (0.3)% | ||||||||
Affirm Holdings Inc, Cl A * | (39,101 | ) | (832 | ) | ||||
Coinbase Global Inc, Cl A * | (2,959 | ) | (222 | ) | ||||
TriplePoint Venture Growth BDC | (13,493 | ) | (141 | ) | ||||
| (1,195 | ) | |||||||
Industrials — (1.6)% | ||||||||
American Airlines Group Inc * | (85,218 | ) | (1,092 | ) | ||||
ArcBest Corp | (5,572 | ) | (566 | ) | ||||
Delta Air Lines Inc, Cl A | (28,406 | ) | (1,051 | ) | ||||
Expeditors International of Washington Inc | (7,013 | ) | (804 | ) | ||||
Plug Power Inc * | (107,354 | ) | (816 | ) | ||||
Simpson Manufacturing Co Inc | (3,588 | ) | (538 | ) | ||||
United Airlines Holdings Inc * | (25,776 | ) | (1,090 | ) | ||||
Description | Shares | Market Value | ||||||
COMMON STOCK SOLD SHORT (continued) | ||||||||
| $ | (5,957 | ) | ||||||
Information Technology — (0.9)% | ||||||||
Apple Inc | (5,149 | ) | $ | (882 | ) | |||
Corsair Gaming * | (64,772 | ) | (941 | ) | ||||
GoDaddy Inc, Cl A * | (3,965 | ) | (295 | ) | ||||
Smartsheet Inc, Cl A * | (2,926 | ) | (119 | ) | ||||
Xerox Holdings Corp | (64,330 | ) | (1,009 | ) | ||||
| (3,246 | ) | |||||||
Materials — (0.1)% | ||||||||
PureCycle Technologies * | (73,370 | ) | (412 | ) | ||||
Real Estate — (0.5)% | ||||||||
Lamar Advertising Co, Cl A | (14,064 | ) | (1,174 | ) | ||||
Pebblebrook Hotel Trust | (24,743 | ) | (336 | ) | ||||
Zillow Group Inc, Cl A * | (7,171 | ) | (321 | ) | ||||
| (1,831 | ) | |||||||
Total Common Stock Sold Short | ||||||||
(Proceeds $21,891) ($ Thousands) | (21,381 | ) | ||||||
| ||||||||
CORPORATE OBLIGATIONS SOLD SHORT — (2.8)% | ||||||||
Communication Services — (0.3)% | ||||||||
Clear Channel Outdoor Holdings | ||||||||
9.000%, 09/15/2028 (A) | $ | (897 | ) | (888 | ) | |||
Zayo Group Holdings Inc | ||||||||
6.125%, 03/01/2028 (A) | (91 | ) | (59 | ) | ||||
| (947 | ) | |||||||
Consumer Discretionary — (0.9)% | ||||||||
Bloomin' Brands | ||||||||
5.125%, 04/15/2029 (A) | (70 | ) | (61 | ) | ||||
Caesars Entertainment | ||||||||
4.625%, 10/15/2029 (A) | (625 | ) | (529 | ) | ||||
Dana | ||||||||
5.625%, 06/15/2028 | (335 | ) | (307 | ) | ||||
4.250%, 09/01/2030 | (134 | ) | (107 | ) | ||||
Fertitta Entertainment | ||||||||
4.625%, 01/15/2029 (A) | (383 | ) | (325 | ) | ||||
Guitar Center | ||||||||
8.500%, 01/15/2026 (A) | (165 | ) | (143 | ) | ||||
Hanesbrands | ||||||||
9.000%, 02/15/2031 (A) | (201 | ) | (192 | ) | ||||
Hilton Grand Vacations Borrower Escrow | ||||||||
5.000%, 06/01/2029 (A) | (205 | ) | (178 | ) | ||||
Marriott Ownership Resorts | ||||||||
4.500%, 06/15/2029 (A) | (475 | ) | (398 | ) | ||||
SEI Institutional Managed Trust
275
SCHEDULE OF INVESTMENTS
September 30, 2023
Multi-Strategy Alternative Fund (Continued)
Description | Face Amount | Market Value | ||||||
CORPORATE OBLIGATIONS SOLD SHORT (continued) | ||||||||
MGM Resorts International | ||||||||
4.750%, 10/15/2028 | $ | (245 | ) | $ | (216 | ) | ||
Michaels | ||||||||
7.875%, 05/01/2029 (A) | (66 | ) | (43 | ) | ||||
Newell Brands | ||||||||
6.375%, 09/15/2027 | (185 | ) | (176 | ) | ||||
Tempur Sealy International | ||||||||
3.875%, 10/15/2031 (A) | (304 | ) | (235 | ) | ||||
Univision Communications | ||||||||
7.375%, 06/30/2030 (A) | (329 | ) | (301 | ) | ||||
| (3,211 | ) | |||||||
Consumer Staples — (0.0)% | ||||||||
United Natural Foods | ||||||||
6.750%, 10/15/2028 (A) | (263 | ) | (201 | ) | ||||
Health Care — (0.3)% | ||||||||
AdaptHealth | ||||||||
6.125%, 08/01/2028 (A) | (75 | ) | (65 | ) | ||||
5.125%, 03/01/2030 (A) | (450 | ) | (348 | ) | ||||
Embecta | ||||||||
5.000%, 02/15/2030 (A) | (317 | ) | (247 | ) | ||||
Fortrea Holdings | ||||||||
7.500%, 07/01/2030 (A) | (350 | ) | (341 | ) | ||||
LifePoint Health | ||||||||
9.875%, 08/15/2030 (A) | (89 | ) | (86 | ) | ||||
| (1,087 | ) | |||||||
Industrials — (0.4)% | ||||||||
3M MTN | ||||||||
3.375%, 03/01/2029 | (479 | ) | (428 | ) | ||||
Allied Universal Holdco | ||||||||
9.750%, 07/15/2027 (A) | (380 | ) | (340 | ) | ||||
6.000%, 06/01/2029 (A) | (105 | ) | (78 | ) | ||||
CoreLogic | ||||||||
4.500%, 05/01/2028 (A) | (380 | ) | (289 | ) | ||||
FedEx | ||||||||
5.250%, 05/15/2050 | (145 | ) | (127 | ) | ||||
GrafTech Global Enterprises | ||||||||
9.875%, 12/15/2028 (A) | (382 | ) | (362 | ) | ||||
| (1,624 | ) | |||||||
Information Technology — (0.4)% | ||||||||
Cloud Software Group | ||||||||
9.000%, 09/30/2029 (A) | (180 | ) | (156 | ) | ||||
6.500%, 03/31/2029 (A) | (1,456 | ) | (1,288 | ) | ||||
| (1,444 | ) | |||||||
Materials — (0.5)% | ||||||||
FMG Resources August 2006 Pty | ||||||||
6.125%, 04/15/2032 (A) | (235 | ) | (214 | ) | ||||
5.875%, 04/15/2030 (A) | (205 | ) | (187 | ) | ||||
Iris Holding | ||||||||
10.000%, 12/15/2028 (A) | (230 | ) | (180 | ) | ||||
LABL | ||||||||
5.875%, 11/01/2028 (A) | (243 | ) | (218 | ) | ||||
Description | Face Amount | Market Value | ||||||
CORPORATE OBLIGATIONS SOLD SHORT (continued) | ||||||||
NOVA Chemicals | ||||||||
5.250%, 06/01/2027 (A) | $ | (345 | ) | $ | (299 | ) | ||
Scotts Miracle-Gro | ||||||||
4.500%, 10/15/2029 | (383 | ) | (313 | ) | ||||
Summit Materials | ||||||||
5.250%, 01/15/2029 (A) | (330 | ) | (300 | ) | ||||
| (1,711 | ) | |||||||
Total Corporate Obligations Sold Short | ||||||||
(Proceeds $10,555) ($ Thousands) | (10,225 | ) | ||||||
| ||||||||
FOREIGN COMMON STOCK SOLD SHORT— (0.4)% | ||||||||
Denmark — (0.3)% | ||||||||
Demant A/S * | (29,394 | ) | (1,221 | ) | ||||
Switzerland — (0.1)% | ||||||||
Logitech International | (5,689 | ) | (392 | ) | ||||
Total Foreign Common Stock Sold Short | ||||||||
(Proceeds $1,348) ($ Thousands) | (1,613 | ) | ||||||
| ||||||||
U.S. TREASURY OBLIGATIONS SOLD SHORT — (0.4)% | ||||||||
U.S. Treasury Notes | ||||||||
4.375%, 08/31/2028 | $ | (1,045 | ) | (1,035 | ) | |||
4.125%, 08/31/2030 | (86 | ) | (83 | ) | ||||
3.875%, 08/15/2033 | (363 | ) | (343 | ) | ||||
Total U.S. Treasury Obligations Sold Short | ||||||||
(Proceeds $1,487) ($ Thousands) | (1,461 | ) | ||||||
Total Investments Sold Short — (9.4)% | ||||||||
(Proceeds $35,281) ($ Thousands) | $ | (34,680 | ) | |||||
WRITTEN OPTIONS — (0.0)% | ||||||||
Total Written Options | ||||||||
(Premiums Received $17) ($ Thousands) | $ | (13 | ) | |||||
276
SEI Institutional Managed Trust
A list of the open exchange traded options contracts for the Fund at September 30, 2023, is as follows:
Description | Number of Contracts | Notional Amount | Exercise Price | Expiration Date | Value | |||||||||||||||
PURCHASED OPTIONS — 0.0% | ||||||||||||||||||||
Put Options | ||||||||||||||||||||
S&P 500 Index | 4 | $ | 1,715 | $ | 4,350.00 | 11/18/2023 | $ | 40 | ||||||||||||
S&P 500 Index | 1 | 429 | 4,400.00 | 10/21/2023 | 12 | |||||||||||||||
S&P 500 Index | 1 | 429 | 4,330.00 | 11/18/2023 | 10 | |||||||||||||||
S&P 500 Index | 3 | 1,286 | 4,200.00 | 10/21/2023 | – | |||||||||||||||
| 3,859 | 62 | |||||||||||||||||||
Call Options | – | |||||||||||||||||||
AMC | 117 | 94 | 17.00 | 12/16/2023 | 3 | |||||||||||||||
Total Purchased Options | $ | 3,953 | $ | 65 | ||||||||||||||||
WRITTEN OPTIONS — 0.0% | ||||||||||||||||||||
Put Options | ||||||||||||||||||||
S&P 500 Index | (3 | ) | $ | (1,286 | ) | 4,000.00 | 10/21/2023 | $ | – | |||||||||||
S&P 500 Index | (1 | ) | (429 | ) | 4,050.00 | 10/21/2023 | (1 | ) | ||||||||||||
S&P 500 Index | (1 | ) | (429 | ) | 4,010.00 | 11/18/2023 | (3 | ) | ||||||||||||
S&P 500 Index | (4 | ) | (1,715 | ) | 4,100.00 | 11/18/2023 | (9 | ) | ||||||||||||
Total Written Options | $ | (3,859 | ) | $ | (13 | ) | ||||||||||||||
A list of the open forward foreign currency contracts held by the Fund at September 30, 2023 is as follows:
Counterparty | Settlement Date | Currency to Deliver | Currency to Receive | Unrealized Appreciation | ||||||||||||||||||||
Barclays PLC | 10/26/23 | EUR | 187 | USD | 208 | $ | 10 | |||||||||||||||||
Barclays PLC | 12/21/23 | AUD | 134 | USD | 86 | — | ||||||||||||||||||
BNYMellon | 12/20/23 | USD | 233 | EUR | 217 | (2 | ) | |||||||||||||||||
BNYMellon | 12/20/23 | EUR | 433 | USD | 463 | 3 | ||||||||||||||||||
| $ | 11 | |||||||||||||||||||||||
A list of the open centrally cleared swap agreements held by the Fund at September 30, 2023 is as follows:
Credit Default Swaps - Buy Protection | ||||||||||||||||||||||||||||
Reference Entity/ Obligation | Pay Rate | Payment Frequency | Termination Date | Notional Amount | Value | Upfront Payments/ Receipts | Net Unrealized | |||||||||||||||||||||
CDS.HY.40 | 5.00% | Quarterly | 06/20/2028 | $ | 2,500 | $ | (42 | ) | $ | 6 | $ | (48 | ) | |||||||||||||||
CDS.HY.40 | 5.00% | Quarterly | 06/20/2028 | 1,565 | (27 | ) | – | (27 | ) | |||||||||||||||||||
CDX.HY.41 | 5.00% | Quarterly | 12/20/2028 | 1,395 | (13 | ) | (13 | ) | – | |||||||||||||||||||
CDX.IG.41 | 1.00% | Quarterly | 12/20/2028 | 7,110 | (87 | ) | (101 | ) | 14 | |||||||||||||||||||
| $ | (169 | ) | $ | (108 | ) | $ | (61 | ) | ||||||||||||||||||||
SEI Institutional Managed Trust
277
SCHEDULE OF INVESTMENTS
September 30, 2023
Multi-Strategy Alternative Fund (Concluded)
| Percentages are based on Net Assets of $368,583 ($ Thousands). |
* | Non-income producing security. |
** | The rate reported is the 7-day effective yield as of September 30, 2023. |
‡ | Real Estate Investment Trust. |
‡‡ | Expiration date not available. |
† | Investment in Affiliated Security (see Note 6). |
(A) | Security exempt from registration under Rule 144A of the Securities Act of 1933. These securities may be resold in transactions exempt from registration normally to qualified institutions. On September 30, 2023, the value of these securities amounted to $59,538 ($ Thousands), representing 16.2% of the Net Assets of the Fund. |
(B) | Security is in default on interest payment. |
(C) | Security considered restricted, excluding 144A. The total market value of such securities as of September 30, 2023 was $3,128 ($ Thousands) and represented 0.8% of the Net Assets of the Fund. See table below for acquisition dates and acquisition cost. |
(D) | Level 3 security in accordance with fair value hierarchy. |
(E) | Security, or portion thereof, has been pledged as collateral on securities sold short. The total market value of such securities as of September 30, 2023 was $19,690 ($ Thousands). |
(F) | Variable or floating rate security. The rate shown is the effective interest rate as of period end. The rates on certain securities are not based on published reference rates and spreads and are either determined by the issuer or agent based on current market conditions; by using a formula based on the rates of underlying loans; or by adjusting periodically based on prevailing interest rates. |
(G) | Unsettled bank loan. Interest rate may not be available. |
(H) | No interest rate available. |
(I) | Perpetual security with no stated maturity date. |
(J) | Interest rate represents the security's effective yield at the time of purchase. |
The following is a summary of the level of inputs used as of September 30, 2023, in valuing the Fund's investments and other financial instruments carried at value ($ Thousands): | ||||||||||||||||
Investments in Securities | Level 1 | Level 2 | Level 3 | Total | ||||||||||||
Corporate Obligations | – | 84,346 | 1,052 | 85,398 | ||||||||||||
Common Stock | 76,230 | 230 | 651 | 77,111 | ||||||||||||
Registered Investment Companies | 69,339 | – | – | 69,339 | ||||||||||||
Loan Participations | – | 17,035 | 1,414 | 18,449 | ||||||||||||
Foreign Common Stock | 5,502 | – | – | 5,502 | ||||||||||||
Convertible Bonds | – | 358 | 734 | 1,092 | ||||||||||||
U.S. Treasury Obligations | – | 1,073 | – | 1,073 | ||||||||||||
Preferred Stock | – | – | 479 | 479 | ||||||||||||
Mortgage-Backed Securities | – | 424 | – | 424 | ||||||||||||
Asset-Backed Securities | – | 177 | – | 177 | ||||||||||||
Sovereign Debt | – | 123 | – | 123 | ||||||||||||
Warrants | – | 1 | 49 | 50 | ||||||||||||
Cash Equivalents | 92,197 | 2,890 | – | 95,087 | ||||||||||||
Purchased Options | 65 | – | – | 65 | ||||||||||||
Total Investments in Securities | 243,333 | 106,657 | 4,379 | 354,369 | ||||||||||||
Securities Sold Short | ||||||||||||||||
Common Stock | (21,381 | ) | – | – | (21,381 | ) | ||||||||||
Corporate Obligations | – | (10,225 | ) | – | (10,225 | ) | ||||||||||
Foreign Common Stock | (1,613 | ) | – | – | (1,613 | ) | ||||||||||
U.S. Treasury Obligations | – | (1,461 | ) | – | (1,461 | ) | ||||||||||
Total Securities Sold Short | (22,994 | ) | (11,686 | ) | – | (34,680 | ) | |||||||||
Other Financial Instruments | Level 1 | Level 2 | Level 3 | Total | ||||||||||||
Written Options | (13 | ) | – | – | (13 | ) | ||||||||||
Forward Contracts* | ||||||||||||||||
Unrealized Appreciation | – | 13 | – | 13 | ||||||||||||
Unrealized Depreciation | – | (2 | ) | – | (2 | ) | ||||||||||
Centrally Cleared Swaps | ||||||||||||||||
Credit Default Swaps* | ||||||||||||||||
Unrealized Appreciation | – | 14 | – | 14 | ||||||||||||
Unrealized Depreciation | – | (75 | ) | – | (75 | ) | ||||||||||
Total Other Financial Instruments | (13 | ) | (50 | ) | – | (63 | ) | |||||||||
* Forward contracts and swap contracts are valued at the unrealized appreciation (depreciation) on the instrument.
The following is a reconciliation of the investments in which significant unobservable inputs (Level 3) were used in determining value ($ Thousands):
Investments in Common Stock | Investments in Corporate Obligations | Investments in Loan Participations | Investments in Convertible Bond | Investments in Preferred Stock | Investments in Warrants | |||||||||||||||||||
Balance as of October 1, 2022 | $ | 1,058 | $ | 5 | $ | 3,376 | $ | 325 | $ | 831 | $ | 283 | ||||||||||||
Accrued discounts/premiums | – | – | – | – | – | – | ||||||||||||||||||
Realized gain/(loss) | – | – | (69 | ) | – | 107 | (20 | ) | ||||||||||||||||
Change in unrealized appreciation/(depreciation) | (87 | ) | (120 | ) | (281 | ) | 31 | (45 | ) | (113 | ) | |||||||||||||
Purchases | 9 | 114 | 879 | 378 | 59 | – | ||||||||||||||||||
Sales | – | – | (1,271 | ) | – | (473 | ) | (12 | ) | |||||||||||||||
Net transfer into Level 3 | – | 1,053 | – | – | – | – | ||||||||||||||||||
Net transfer out of Level 3 | (329 | ) | – | (1,220 | ) | – | – | (89 | ) | |||||||||||||||
Ending Balance as of September 30, 2023(1) | $ | 651 | $ | 1,052 | $ | 1,414 | $ | 734 | $ | 479 | $ | 49 | ||||||||||||
Changes in unrealized gains/(losses) included in earnings related to securities still held at reporting date | $ | (295 | ) | $ | (423 | ) | $ | (305 | ) | $ | 31 | $ | (9 | ) | $ | (38 | ) | |||||||
(1) Of the $4,379 ($ Thousands) in Level 3 securities as of September 30, 2023, $3,958 ($ Thousands) or 1.1% of the Net Assets of the Fund are not valued via third party pricing vendors and broker quotes. If significant, the disclosure of the unobservable inputs and the interrelationships and sensitivity between these inputs are required for those Level 3 securities that are not valued by third party pricing vendors or broker quotes. The value of these securities is immaterial and no further disclosure is required.
278
SEI Institutional Managed Trust
For the year ended September 30, 2023, there were transfers between Level 2 and Level 3 assets and liabilities due to the availability of observable inputs to determine fair value.
For more information on valuation inputs, see Note 2 – Significant Accounting Policies in Notes to Financial Statements.
The following is a summary of the Fund’s transactions with affiliates for the year ended September 30, 2023 ($ Thousands):
Security Description | Value | Purchases | Proceeds | Realized Gain/(Loss) | Change in Unrealized Appreciation/(Depreciation) | Value | Income | Capital Gains | ||||||||||||||||||||||||
SEI Daily Income Trust, Government Fund, | $ | 117,844 | $ | 820,168 | $ | (845,815 | ) | $ | — | $ | — | $ | 92,197 | $ | 4,537 | $ | — | |||||||||||||||
| ||||||||||||||||||||||||||||||||
A list of the restricted securities, excluding 144a, held by the Fund at September 30, 2023, is as follows:
Description | Face Amount ($ Thousands)/Number of Shares/Number of Warrants | Acquisition Date | Cost ($ Thousands) | Market Value | ||||||||||||
Corporate Obligations | ||||||||||||||||
Akumin | $ | 865 | 11/6/2023 | $ | 744 | $ | 649 | |||||||||
Akumin Escrow | 300 | 8/1/2024 | 276 | 199 | ||||||||||||
Audacy Capital | 335 | 3/31/2024 | 236 | 6 | ||||||||||||
Audacy Capital | 220 | 10/20/2023 | 140 | 5 | ||||||||||||
Cornerstone Chemical | 1,155 | 11/6/2023 | 1,115 | 693 | ||||||||||||
Cornerstone Chemical | 114 | 9/28/2023 | 114 | 114 | ||||||||||||
Northwest Acquisitions ULC | 460 | 10/1/2019 | 419 | – | ||||||||||||
Tacora Resources | 305 | 11/6/2023 | 317 | 166 | ||||||||||||
Tacora Resources | 23 | 5/24/2023 | 23 | 24 | ||||||||||||
Common Stock | ||||||||||||||||
Aquity Holdings Inc | 3,945 | 3/12/2019 | – | 43 | ||||||||||||
Guitar Center | 2,167 | 1/8/2021 | 275 | 329 | ||||||||||||
Loan Participations | ||||||||||||||||
Aquity Solutions LLC, Term Loan, 1st Lien | 431 | 11/5/2021 | 431 | 431 | ||||||||||||
Bluecrest, Intial Term Loan, 2nd Lien | 280 | 9/6/2023 | 271 | 271 | ||||||||||||
Premier Brands Group Holdings LLC, Initial Loan, 1st Lien | 194 | 3/21/2019 | 185 | 145 | ||||||||||||
Preferred Stock | ||||||||||||||||
Guitar Center | 39 | 1/8/2021 | 4 | 4 | ||||||||||||
Warrants | ||||||||||||||||
Guitar Center | 1,148 | 1/8/2021 | 52 | 49 | ||||||||||||
Tacora Resources | 614,882 | 5/24/2023 | – | – | ||||||||||||
| $ | 4,602 | $ | 3,128 | |||||||||||||
Amounts designated as “—” are either $0 or have been rounded to $0.
See “Glossary” for abbreviations.
The accompanying notes are an integral part of the financial statements.
SEI Institutional Managed Trust
279
SCHEDULE OF INVESTMENTS
September 30, 2023
Liquid Alternative Fund
EXPOSURE WEIGHTINGS (Unaudited)†
Long | Short | ||
Equity Contracts | 7.9% | (3.9)% | |
Foreign Exchange Contracts | – | (35.2) | |
Interest Rate Contracts | 37.1 | (51.3) |
†Exposures are calculated as the current notional value of the futures contracts as a percentage of net assets.
A list of the open futures contracts held by the Fund at September 30, 2023 is as follows:
Type of Contract | Number of | Expiration Date | Notional Amount (Thousands) | Value | Unrealized Appreciation/ | |||||||||||||||
Long Contracts | ||||||||||||||||||||
3-Month SOFR | 8 | Mar-2025 | $ | 1,917 | $ | 1,914 | $ | (3 | ) | |||||||||||
MSCI EAFE Index | 15 | Dec-2023 | 1,576 | 1,531 | (45 | ) | ||||||||||||||
MSCI Emerging Markets | 2 | Dec-2023 | 98 | 95 | (3 | ) | ||||||||||||||
NASDAQ 100 Index E-MINI | 2 | Dec-2023 | 619 | 595 | (24 | ) | ||||||||||||||
Russell 2000 Index E-MINI | 4 | Dec-2023 | 376 | 360 | (16 | ) | ||||||||||||||
S&P Mid Cap 400 Index E-MINI | 2 | Dec-2023 | 521 | 504 | (17 | ) | ||||||||||||||
| 5,107 | 4,999 | (108 | ) | |||||||||||||||||
Short Contracts | ||||||||||||||||||||
AUD USD Currency | (4 | ) | Dec-2023 | $ | (258 | ) | $ | (258 | ) | $ | – | |||||||||
CAD Currency | (3 | ) | Dec-2023 | (222 | ) | (221 | ) | 1 | ||||||||||||
Euro FX | (7 | ) | Dec-2023 | (938 | ) | (929 | ) | 9 | ||||||||||||
Japanese Yen | (30 | ) | Dec-2023 | (2,578 | ) | (2,542 | ) | 36 | ||||||||||||
S&P 500 Index E-MINI | (2 | ) | Dec-2023 | (438 | ) | (433 | ) | 5 | ||||||||||||
U.S. 10-Year Treasury Note | (19 | ) | Dec-2023 | (2,105 | ) | (2,053 | ) | 52 | ||||||||||||
U.S. Dollar Index | (7 | ) | Dec-2023 | (735 | ) | (740 | ) | (5 | ) | |||||||||||
U.S. Long Treasury Bond | (25 | ) | Dec-2023 | (2,987 | ) | (2,845 | ) | 142 | ||||||||||||
| (10,261 | ) | (10,021 | ) | 240 | ||||||||||||||||
| $ | (5,154 | ) | $ | (5,022 | ) | $ | 132 | |||||||||||||
Percentages are based on Net Assets of $11,358 ($ Thousands).
As of September 30, 2023, all of the Fund's financial instruments carried at valued were considered Level 1, in accordance with authoritative guidance on fair value measurements and disclosure under U.S. GAAP*.
* | Futures contracts are valued at the unrealized appreciation (depreciation) on the instrument. |
For more information on valuation inputs, see Note 2 – Significant Accounting Policies in Notes to Financial Statements.
See “Glossary” for abbreviations.
The accompanying notes are an integral part of the financial statements
280
SEI Institutional Managed Trust
CONSOLIDATED SCHEDULE OF INVESTMENTS
September 30, 2023
Multi-Asset Accumulation Fund
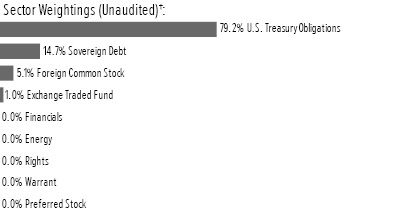
†Percentages based on total investments. Total investments do not include derivatives such as options, futures contracts, forward contracts, and swap contracts, if applicable.
Description | Face Amount | Market Value | ||||||
U.S. TREASURY OBLIGATIONS — 56.8% | ||||||||
U.S. Treasury Bills | ||||||||
5.462%, 03/28/2024 ^(A) | $ | 54,861 | $ | 53,419 | ||||
5.446%, 03/14/2024 (A) | 28,640 | 27,947 | ||||||
5.446%, 03/21/2024 ^(A) | 94,633 | 92,241 | ||||||
5.414%, 01/25/2024 ^(A) | 11,717 | 11,518 | ||||||
5.414%, 02/01/2024 ^(A) | 1,655 | 1,625 | ||||||
5.393%, 01/18/2024 ^(A)(B) | 55,000 | 54,125 | ||||||
5.356%, 12/28/2023 ^(A) | 71,644 | 70,723 | ||||||
5.310%, 11/24/2023 (A) | 80,000 | 79,375 | ||||||
5.109%, 11/16/2023 ^(A) | 111,798 | 111,058 | ||||||
5.014%, 11/09/2023 ^(A) | 160,396 | 159,500 | ||||||
5.002%, 10/26/2023 (A) | 250,000 | 249,119 | ||||||
U.S. Treasury Inflation Protected Securities | ||||||||
1.625%, 10/15/2027 | 9,184 | 8,916 | ||||||
1.375%, 02/15/2044 | 656 | 548 | ||||||
1.250%, 04/15/2028 | 9,172 | 8,720 | ||||||
1.125%, 01/15/2033 | 4,721 | 4,263 | ||||||
1.000%, 02/15/2046 | 1,161 | 881 | ||||||
1.000%, 02/15/2049 | 3,644 | 2,688 | ||||||
0.875%, 01/15/2029 | 1,332 | 1,236 | ||||||
0.750%, 07/15/2028 | 8,525 | 7,932 | ||||||
0.750%, 02/15/2045 | 974 | 707 | ||||||
0.625%, 01/15/2024 | 1,310 | 1,298 | ||||||
0.625%, 07/15/2032 | 21,568 | 18,791 | ||||||
0.625%, 02/15/2043 | 665 | 483 | ||||||
0.500%, 01/15/2028 | 12,021 | 11,079 | ||||||
0.375%, 07/15/2025 | 2,578 | 2,468 | ||||||
0.375%, 01/15/2027 | 2,531 | 2,354 | ||||||
0.375%, 07/15/2027 | 2,749 | 2,549 | ||||||
0.250%, 01/15/2025 | 645 | 621 | ||||||
0.250%, 07/15/2029 | 7,648 | 6,813 | ||||||
0.250%, 02/15/2050 | 357 | 210 | ||||||
0.125%, 07/15/2024 | 2,575 | 2,515 | ||||||
0.125%, 10/15/2025 | 2,356 | 2,233 | ||||||
0.125%, 04/15/2026 | 2,331 | 2,178 | ||||||
0.125%, 07/15/2026 | 1,275 | 1,192 | ||||||
0.125%, 04/15/2027 | 4,331 | 3,975 | ||||||
Description | Face Amount | Market Value | ||||||
U.S. TREASURY OBLIGATIONS (continued) | ||||||||
0.125%, 01/15/2030 | $ | 6,891 | $ | 6,007 | ||||
0.125%, 07/15/2030 | 6,438 | 5,579 | ||||||
0.125%, 01/15/2031 | 16,440 | 14,057 | ||||||
0.125%, 07/15/2031 | 21,670 | 18,398 | ||||||
0.125%, 01/15/2032 | 23,599 | 19,769 | ||||||
Total U.S. Treasury Obligations | ||||||||
(Cost $1,084,136) ($ Thousands) | 1,069,110 | |||||||
SOVEREIGN DEBT — 10.6% | ||||||||
Deutsche Bundesrepublik Inflation Linked Bond | ||||||||
0.500%, 04/15/2030 | EUR | 38,708 | 41,120 | |||||
0.100%, 04/15/2026 | 2,384 | 2,474 | ||||||
0.100%, 04/15/2033 | 7,651 | 7,832 | ||||||
0.100%, 04/15/2046 | 1,503 | 1,448 | ||||||
French Republic Government Bond OAT | ||||||||
3.400%, 07/25/2029 | 737 | 899 | ||||||
1.850%, 07/25/2027 | 3,743 | 4,146 | ||||||
1.800%, 07/25/2040(C) | 704 | 821 | ||||||
0.700%, 07/25/2030(C) | 17,118 | 18,116 | ||||||
0.100%, 03/01/2026(C) | 3,916 | 4,081 | ||||||
0.100%, 03/01/2028 | 2,470 | 2,536 | ||||||
0.100%, 03/01/2029 | 2,944 | 3,012 | ||||||
0.100%, 07/25/2031(C) | 12,728 | 12,813 | ||||||
0.100%, 03/01/2032(C) | 2,806 | 2,807 | ||||||
0.100%, 03/01/2036(C) | 559 | 528 | ||||||
0.100%, 07/25/2038(C) | 1,150 | 1,055 | ||||||
0.100%, 07/25/2047(C) | 1,396 | 1,161 | ||||||
Inter-American Development Bank | ||||||||
2.625%, 01/16/2024^ | $ | 375 | 372 | |||||
Italy Buoni Poliennali Del Tesoro | ||||||||
2.550%, 09/15/2041(C) | EUR | 1,055 | 1,096 | |||||
2.350%, 09/15/2024(C) | 1,235 | 1,319 | ||||||
2.350%, 09/15/2035(C) | 1,102 | 1,148 | ||||||
1.500%, 05/15/2029 | 2,036 | 2,083 | ||||||
1.300%, 05/15/2028(C) | 605 | 622 | ||||||
1.250%, 09/15/2032(C) | 2,455 | 2,382 | ||||||
0.650%, 05/15/2026 | 289 | 297 | ||||||
0.400%, 05/15/2030(C) | 2,934 | 2,764 | ||||||
0.150%, 05/15/2051(C) | 588 | 339 | ||||||
0.100%, 05/15/2033(C) | 2,277 | 1,923 | ||||||
Korea International Bond | ||||||||
2.750%, 01/19/2027^ | $ | 1,000 | 931 | |||||
United Kingdom Gilt Inflation Linked | ||||||||
4.125%, 07/22/2030 | GBP | 500 | 2,063 | |||||
2.500%, 07/17/2024 | 340 | 1,574 | ||||||
2.000%, 01/26/2035 | 932 | 2,723 | ||||||
1.250%, 11/22/2032 | 7,583 | 9,816 | ||||||
1.250%, 11/22/2055 | 1,558 | 1,816 | ||||||
SEI Institutional Managed Trust
281
CONSOLIDATED SCHEDULE OF INVESTMENTS
September 30, 2023
Multi-Asset Accumulation Fund (Continued)
Description | Face Amount | Market Value | ||||||
SOVEREIGN DEBT (continued) | ||||||||
0.750%, 11/22/2033 | GBP | 402 | $ | 495 | ||||
0.750%, 03/22/2034 | 8,862 | 10,818 | ||||||
0.250%, 03/22/2052 | 1,855 | 1,634 | ||||||
0.125%, 03/22/2024 | 1,081 | 1,309 | ||||||
0.125%, 03/22/2026 | 2,174 | 2,615 | ||||||
0.125%, 08/10/2028 | 15,116 | 18,152 | ||||||
0.125%, 03/22/2029 | 7,250 | 8,660 | ||||||
0.125%, 08/10/2031 | 4,333 | 5,154 | ||||||
0.125%, 03/22/2044 | 772 | 735 | ||||||
0.125%, 03/22/2046 | 1,452 | 1,334 | ||||||
0.125%, 08/10/2048 | 5,447 | 4,824 | ||||||
0.125%, 03/22/2058 | 5,118 | 4,082 | ||||||
0.125%, 11/22/2065 | 790 | 602 | ||||||
0.125%, 03/22/2068 | 749 | 567 | ||||||
Total Sovereign Debt | ||||||||
(Cost $221,924) ($ Thousands) | 199,098 | |||||||
| ||||||||
FOREIGN COMMON STOCK — 3.7% | ||||||||
Australia — 0.2% | ||||||||
Ampol Ltd | 9,426 | 206 | ||||||
APA Group | 26,821 | 144 | ||||||
Aristocrat Leisure Ltd | 3,212 | 85 | ||||||
ASX Ltd | 1,383 | 51 | ||||||
Aurizon Holdings Ltd | 21,309 | 48 | ||||||
BHP Group Ltd | 3,324 | 95 | ||||||
BlueScope Steel Ltd | 3,194 | 40 | ||||||
Brambles Ltd | 4,589 | 42 | ||||||
Cochlear Ltd | 834 | 137 | ||||||
Coles Group Ltd | 12,289 | 123 | ||||||
Commonwealth Bank of Australia | 792 | 51 | ||||||
Computershare Ltd | 8,847 | 148 | ||||||
CSL Ltd | 892 | 144 | ||||||
Dexus ‡ | 7,723 | 36 | ||||||
Endeavour Group Ltd/Australia | 22,375 | 76 | ||||||
Fortescue Metals Group Ltd | 3,424 | 46 | ||||||
Glencore PLC | 20,900 | 120 | ||||||
Goodman Group ‡ | 3,333 | 46 | ||||||
IDP Education Ltd | 3,370 | 47 | ||||||
Insurance Australia Group Ltd | 20,132 | 74 | ||||||
Lendlease Corp Ltd | 5,588 | 26 | ||||||
Lottery Corp Ltd/The | 30,312 | 92 | ||||||
Medibank Pvt Ltd | 28,257 | 63 | ||||||
Newcrest Mining Ltd | 5,302 | 84 | ||||||
Orica Ltd | 6,944 | 70 | ||||||
Origin Energy Ltd | 9,571 | 54 | ||||||
Qantas Airways Ltd * | 8,953 | 30 | ||||||
Ramsay Health Care Ltd | 2,924 | 98 | ||||||
Rio Tinto Ltd | 1,118 | 82 | ||||||
Rio Tinto PLC | 1,750 | 111 | ||||||
Santos Ltd | 43,557 | 222 | ||||||
Description | Shares | Market Value | ||||||
FOREIGN COMMON STOCK (continued) | ||||||||
Sonic Healthcare Ltd | 8,788 | $ | 169 | |||||
South32 Ltd | 23,300 | 51 | ||||||
Suncorp Group Ltd | 7,008 | 63 | ||||||
Telstra Group Ltd, Cl B | 34,358 | 85 | ||||||
Vicinity Ltd ‡ | 121,603 | 133 | ||||||
Washington H Soul Pattinson & Co Ltd | 10,657 | 224 | ||||||
Wesfarmers Ltd | 2,749 | 94 | ||||||
Westpac Banking Corp | 1,983 | 27 | ||||||
Woodside Energy Group Ltd | 2,545 | 60 | ||||||
Woolworths Group Ltd | 6,248 | 151 | ||||||
Xero Ltd * | 2,369 | 172 | ||||||
| 3,920 | ||||||||
Austria — 0.0% | ||||||||
Erste Group Bank AG | 1,198 | 42 | ||||||
OMV AG | 5,753 | 276 | ||||||
Verbund AG | 1,981 | 161 | ||||||
| 479 | ||||||||
Belgium — 0.1% | ||||||||
Ageas SA/NV | 1,537 | 64 | ||||||
Anheuser-Busch InBev SA/NV | 2,899 | 161 | ||||||
Argenx SE * | 357 | 174 | ||||||
D'ieteren Group | 263 | 45 | ||||||
Elia Group SA/NV | 1,988 | 195 | ||||||
KBC Group NV | 780 | 49 | ||||||
Solvay SA | 1,000 | 111 | ||||||
UCB SA, Cl A | 2,355 | 193 | ||||||
Umicore SA | 2,797 | 66 | ||||||
| 1,058 | ||||||||
Brazil — 0.0% | ||||||||
Yara International ASA | 560 | 21 | ||||||
Canada — 0.4% | ||||||||
Agnico Eagle Mines Ltd | 1,381 | 63 | ||||||
Algonquin Power & Utilities Corp | 32,126 | 191 | ||||||
Alimentation Couche-Tard Inc | 2,364 | 121 | ||||||
AltaGas Ltd | 8,963 | 173 | ||||||
ARC Resources Ltd | 15,527 | 249 | ||||||
Bank of Nova Scotia/The, Cl C | 1,239 | 56 | ||||||
Barrick Gold Corp | 5,823 | 85 | ||||||
Brookfield Asset Management Ltd, Cl A | 336 | 11 | ||||||
Brookfield Corp, Cl A | 1,346 | 42 | ||||||
CAE Inc * | 3,606 | 85 | ||||||
Cameco Corp | 7,757 | 309 | ||||||
Canadian Natural Resources Ltd | 2,511 | 163 | ||||||
Canadian Pacific Kansas City Ltd | 1,666 | 124 | ||||||
Canadian Tire Corp Ltd, Cl A | 894 | 97 | ||||||
Canadian Utilities Ltd, Cl A | 4,850 | 103 | ||||||
CCL Industries Inc, Cl B | 2,082 | 88 | ||||||
CGI Inc, Cl A * | 1,997 | 198 | ||||||
282
SEI Institutional Managed Trust
Description | Shares | Market Value | ||||||
FOREIGN COMMON STOCK (continued) | ||||||||
Constellation Software Inc/Canada | 100 | $ | 207 | |||||
Dollarama Inc | 3,557 | 246 | ||||||
Empire Co Ltd, Cl A | 4,984 | 136 | ||||||
Enbridge Inc | 4,791 | 160 | ||||||
Fairfax Financial Holdings Ltd | 161 | 132 | ||||||
First Quantum Minerals Ltd (Canada) | 2,143 | 51 | ||||||
FirstService Corp | 514 | 75 | ||||||
Franco-Nevada Corp | 892 | 120 | ||||||
George Weston Ltd | 1,417 | 158 | ||||||
Hydro One Ltd | 7,241 | 185 | ||||||
iA Financial Corp Inc | 1,313 | 83 | ||||||
IGM Financial Inc | 1,781 | 45 | ||||||
Imperial Oil Ltd | 2,811 | 174 | ||||||
Keyera Corp | 3,731 | 88 | ||||||
Kinross Gold Corp | 13,832 | 63 | ||||||
Loblaw Cos Ltd | 2,051 | 175 | ||||||
Magna International Inc, Cl A | 1,520 | 82 | ||||||
Manulife Financial Corp | 3,345 | 61 | ||||||
Metro Inc/CN, Cl A | 4,352 | 227 | ||||||
Northland Power Inc | 5,821 | 95 | ||||||
Nutrien Ltd | 1,332 | 83 | ||||||
Nuvei Corp | 1,571 | 24 | ||||||
Onex Corp | 1,334 | 79 | ||||||
Open Text Corp | 2,952 | 104 | ||||||
Parkland Corp | 6,250 | 184 | ||||||
Pembina Pipeline Corp | 4,545 | 137 | ||||||
Quebecor Inc, Cl B | 3,150 | 68 | ||||||
RB Global Inc | 2,228 | 140 | ||||||
Royal Bank of Canada | 1,147 | 101 | ||||||
Saputo Inc | 4,704 | 99 | ||||||
Shopify Inc, Cl A * | 1,129 | 62 | ||||||
Suncor Energy Inc | 5,194 | 179 | ||||||
TC Energy Corp | 4,836 | 167 | ||||||
Teck Resources Ltd, Cl B | 2,369 | 102 | ||||||
TMX Group Ltd | 6,850 | 148 | ||||||
Toronto-Dominion Bank/The | 1,857 | 112 | ||||||
Tourmaline Oil Corp | 3,283 | 166 | ||||||
Wheaton Precious Metals Corp | 2,919 | 119 | ||||||
WSP Global Inc | 1,000 | 142 | ||||||
| 6,937 | ||||||||
China — 0.0% | ||||||||
Sands China Ltd * | 36,800 | 113 | ||||||
Denmark — 0.1% | ||||||||
Carlsberg AS, Cl B | 1,231 | 156 | ||||||
Chr Hansen Holding A/S | 3,738 | 229 | ||||||
Coloplast A/S, Cl B | 1,741 | 185 | ||||||
Danske Bank A/S | 4,024 | 94 | ||||||
Demant A/S * | 3,284 | 136 | ||||||
Genmab A/S * | 210 | 75 | ||||||
Novo Nordisk A/S, Cl B | 4,602 | 421 | ||||||
Description | Shares | Market Value | ||||||
FOREIGN COMMON STOCK (continued) | ||||||||
Novozymes A/S, Cl B | 2,193 | $ | 89 | |||||
Orsted AS | 1,899 | 104 | ||||||
Pandora A/S | 852 | 88 | ||||||
Tryg A/S | 2,801 | 51 | ||||||
Vestas Wind Systems A/S | 1,472 | 32 | ||||||
| 1,660 | ||||||||
Finland — 0.1% | ||||||||
Elisa Oyj | 4,470 | 208 | ||||||
Fortum Oyj | 14,020 | 163 | ||||||
Kesko Oyj, Cl B | 5,815 | 105 | ||||||
Kone Oyj, Cl B | 1,311 | 56 | ||||||
Neste Oyj | 4,566 | 155 | ||||||
Nokia Oyj | 31,563 | 119 | ||||||
Orion Oyj, Cl B | 1,076 | 42 | ||||||
Stora Enso Oyj, Cl R | 7,398 | 93 | ||||||
UPM-Kymmene Oyj, Cl V | 3,293 | 113 | ||||||
Wartsila OYJ Abp | 4,133 | 47 | ||||||
| 1,101 | ||||||||
France — 0.2% | ||||||||
Accor SA | 1,293 | 44 | ||||||
Aeroports de Paris SA, Cl A | 373 | 44 | ||||||
Air Liquide SA | 872 | 148 | ||||||
Arkema SA | 736 | 73 | ||||||
BioMerieux | 1,345 | 131 | ||||||
Bollore SE | 21,575 | 116 | ||||||
Bouygues SA | 892 | 31 | ||||||
Capgemini SE | 565 | 99 | ||||||
Carrefour SA | 6,251 | 108 | ||||||
Cie Generale des Etablissements Michelin SCA | 1,899 | 58 | ||||||
Danone SA | 1,033 | 57 | ||||||
Dassault Systemes SE | 3,283 | 123 | ||||||
Edenred SE | 1,730 | 109 | ||||||
Eiffage SA | 687 | 66 | ||||||
Engie SA | 11,598 | 178 | ||||||
Eurazeo SE | 468 | 28 | ||||||
Euronext NV | 536 | 37 | ||||||
Gecina SA ‡ | 323 | 33 | ||||||
Getlink SE | 4,624 | 74 | ||||||
Hermes International SCA | 44 | 81 | ||||||
Ipsen SA | 736 | 97 | ||||||
Kering SA | 119 | 54 | ||||||
La Francaise des Jeux SAEM | 1,007 | 33 | ||||||
Legrand SA | 1,748 | 162 | ||||||
L'Oreal SA | 545 | 227 | ||||||
LVMH Moet Hennessy Louis Vuitton SE | 84 | 64 | ||||||
Orange SA | 26,305 | 302 | ||||||
Pernod Ricard SA | 584 | 98 | ||||||
Publicis Groupe SA | 2,309 | 175 | ||||||
Remy Cointreau SA | 674 | 83 | ||||||
SEI Institutional Managed Trust
283
CONSOLIDATED SCHEDULE OF INVESTMENTS
September 30, 2023
Multi-Asset Accumulation Fund (Continued)
Description | Shares | Market Value | ||||||
FOREIGN COMMON STOCK (continued) | ||||||||
Renault SA | 1,557 | $ | 64 | |||||
Sanofi | 904 | 97 | ||||||
Sartorius Stedim Biotech | 137 | 33 | ||||||
Sodexo SA | 477 | 49 | ||||||
STMicroelectronics NV | 2,074 | 90 | ||||||
Teleperformance SE | 223 | 28 | ||||||
Thales SA, Cl A | 220 | 31 | ||||||
TotalEnergies SE | 3,922 | 259 | ||||||
Unibail-Rodamco-Westfield *‡ | 1,316 | 65 | ||||||
Veolia Environnement SA | 6,279 | 182 | ||||||
Vinci SA | 720 | 80 | ||||||
Vivendi SE | 13,337 | 117 | ||||||
Wendel SE | 480 | 38 | ||||||
Worldline SA/France * | 1,571 | 44 | ||||||
| 4,110 | ||||||||
Germany — 0.2% | ||||||||
adidas AG | 399 | 70 | ||||||
Allianz SE | 347 | 83 | ||||||
BASF SE | 930 | 42 | ||||||
Bayerische Motoren Werke AG | 600 | 61 | ||||||
Bechtle AG | 3,183 | 149 | ||||||
Beiersdorf AG | 1,765 | 228 | ||||||
Brenntag SE | 810 | 63 | ||||||
Carl Zeiss Meditec AG | 837 | 73 | ||||||
Commerzbank AG | 4,489 | 51 | ||||||
Continental AG | 779 | 55 | ||||||
Covestro AG | 2,090 | 113 | ||||||
Deutsche Boerse AG | 198 | 34 | ||||||
Deutsche Lufthansa AG | 6,970 | 55 | ||||||
Deutsche Telekom AG | 6,455 | 136 | ||||||
E.ON SE | 19,443 | 231 | ||||||
Fresenius Medical Care AG & Co KGaA | 5,480 | 237 | ||||||
GEA Group AG | 1,568 | 58 | ||||||
Hannover Rueck SE | 313 | 69 | ||||||
Heidelberg Materials AG | 1,561 | 122 | ||||||
HelloFresh SE * | 4,883 | 146 | ||||||
Henkel AG & Co KGaA | 2,041 | 129 | ||||||
Infineon Technologies AG | 2,515 | 84 | ||||||
Knorr-Bremse AG | 603 | 39 | ||||||
Mercedes-Benz Group AG | 2,395 | 167 | ||||||
Merck KGaA | 510 | 85 | ||||||
MTU Aero Engines AG | 221 | 40 | ||||||
Muenchener Rueckversicherungs-Gesellschaft AG in Muenchen | 274 | 107 | ||||||
Puma SE | 744 | 46 | ||||||
QIAGEN NV * | 3,375 | 137 | ||||||
Rational AG | 61 | 39 | ||||||
Rheinmetall AG | 281 | 73 | ||||||
RWE AG | 3,800 | 142 | ||||||
Scout24 SE | 3,632 | 253 | ||||||
Siemens Healthineers AG | 2,595 | 132 | ||||||
Description | Shares | Market Value | ||||||
FOREIGN COMMON STOCK (continued) | ||||||||
Symrise AG, Cl A | 1,058 | $ | 101 | |||||
Telefonica Deutschland Holding AG | 49,295 | 89 | ||||||
Vonovia SE | 1,664 | 40 | ||||||
Zalando SE * | 1,399 | 31 | ||||||
| 3,810 | ||||||||
Hong Kong — 0.2% | ||||||||
AIA Group Ltd | 6,600 | 54 | ||||||
Budweiser Brewing Co APAC Ltd | 60,300 | 119 | ||||||
CK Asset Holdings Ltd | 5,931 | 31 | ||||||
CK Hutchison Holdings Ltd | 18,208 | 97 | ||||||
CK Infrastructure Holdings Ltd | 61,500 | 291 | ||||||
CLP Holdings Ltd, Cl B | 60,338 | 446 | ||||||
Galaxy Entertainment Group Ltd | 23,000 | 139 | ||||||
Hang Lung Properties Ltd | 77,000 | 105 | ||||||
HKT Trust & HKT Ltd | 449,000 | 469 | ||||||
Hong Kong & China Gas Co Ltd | 595,999 | 416 | ||||||
Power Assets Holdings Ltd | 68,474 | 331 | ||||||
Sino Land Co Ltd | 28,000 | 32 | ||||||
SITC International Holdings Co Ltd | 32,000 | 54 | ||||||
Swire Properties Ltd | 18,400 | 38 | ||||||
Techtronic Industries Co Ltd | 4,001 | 39 | ||||||
WH Group Ltd | 477,329 | 251 | ||||||
Xinyi Glass Holdings Ltd | 30,000 | 39 | ||||||
| 2,951 | ||||||||
Ireland — 0.0% | ||||||||
Flutter Entertainment PLC * | 818 | 134 | ||||||
James Hardie Industries PLC | 2,747 | 72 | ||||||
Kerry Group PLC, Cl A | 2,791 | 234 | ||||||
Kingspan Group PLC | 608 | 46 | ||||||
| 486 | ||||||||
Israel — 0.1% | ||||||||
Azrieli Group Ltd | 746 | 38 | ||||||
Bank Leumi Le-Israel BM | 7,501 | 62 | ||||||
Check Point Software Technologies Ltd * | 1,215 | 162 | ||||||
Elbit Systems Ltd | 167 | 33 | ||||||
ICL Group Ltd | 15,926 | 88 | ||||||
Nice Ltd * | 842 | 144 | ||||||
Teva Pharmaceutical Industries Ltd ADR * | 19,121 | 195 | ||||||
Tower Semiconductor Ltd * | 4,148 | 101 | ||||||
Wix.com Ltd * | 1,638 | 151 | ||||||
| 974 | ||||||||
Italy — 0.1% | ||||||||
Amplifon SpA | 4,119 | 123 | ||||||
CNH Industrial NV | 1,935 | 24 | ||||||
Davide Campari-Milano NV | 7,301 | 86 | ||||||
DiaSorin SpA | 1,085 | 99 | ||||||
Eni SpA | 15,298 | 247 | ||||||
Ferrari NV | 832 | 246 | ||||||
284
SEI Institutional Managed Trust
Description | Shares | Market Value | ||||||
FOREIGN COMMON STOCK (continued) | ||||||||
FinecoBank Banca Fineco SpA | 4,628 | $ | 56 | |||||
Infrastrutture Wireless Italiane SpA | 16,055 | 192 | ||||||
Intesa Sanpaolo SpA | 23,072 | 60 | ||||||
Nexi SpA * | 15,465 | 95 | ||||||
Poste Italiane SpA | 8,102 | 86 | ||||||
Prysmian SpA | 1,571 | 63 | ||||||
Recordati Industria Chimica e Farmaceutica SpA | 2,099 | 99 | ||||||
Snam SpA | 6,697 | 32 | ||||||
Stellantis NV | 7,212 | 139 | ||||||
Terna - Rete Elettrica Nazionale | 19,352 | 146 | ||||||
UniCredit SpA | 3,777 | 91 | ||||||
| 1,884 | ||||||||
Japan — 1.0% | ||||||||
Advantest Corp | 2,400 | 67 | ||||||
Aeon Co Ltd, Cl H | 5,400 | 107 | ||||||
Aisin Corp | 1,500 | 57 | ||||||
Ajinomoto Co Inc | 8,000 | 309 | ||||||
ANA Holdings Inc * | 3,500 | 73 | ||||||
Asahi Group Holdings Ltd | 2,400 | 90 | ||||||
Asahi Intecc Co Ltd | 2,900 | 52 | ||||||
Astellas Pharma Inc | 6,600 | 92 | ||||||
Bandai Namco Holdings Inc | 4,500 | 92 | ||||||
Brother Industries Ltd | 9,300 | 150 | ||||||
Canon Inc | 5,200 | 126 | ||||||
Capcom Co Ltd | 4,100 | 148 | ||||||
Central Japan Railway Co | 3,000 | 73 | ||||||
Chiba Bank Ltd/The, Cl B | 7,300 | 53 | ||||||
Chubu Electric Power Co Inc | 24,700 | 316 | ||||||
Chugai Pharmaceutical Co Ltd | 2,500 | 77 | ||||||
Concordia Financial Group Ltd | 15,100 | 69 | ||||||
CyberAgent Inc | 13,100 | 71 | ||||||
Dai Nippon Printing Co Ltd | 3,300 | 86 | ||||||
Daifuku Co Ltd | 2,100 | 40 | ||||||
Dai-ichi Life Holdings Inc | 2,300 | 48 | ||||||
Daiichi Sankyo Co Ltd | 3,800 | 105 | ||||||
Daito Trust Construction Co Ltd | 900 | 95 | ||||||
Daiwa House Industry Co Ltd | 1,300 | 35 | ||||||
Daiwa House REIT Investment Corp ‡ | 42 | 74 | ||||||
Dentsu Group Inc | 4,300 | 127 | ||||||
Disco Corp | 600 | 111 | ||||||
East Japan Railway Co | 1,200 | 69 | ||||||
Eisai Co Ltd | 2,000 | 111 | ||||||
ENEOS Holdings Inc | 70,100 | 277 | ||||||
Fast Retailing Co Ltd | 702 | 153 | ||||||
FUJIFILM Holdings Corp | 2,100 | 122 | ||||||
Fujitsu Ltd | 400 | 47 | ||||||
GLP J-Reit ‡ | 44 | 39 | ||||||
Hakuhodo DY Holdings Inc | 5,800 | 48 | ||||||
Hankyu Hanshin Holdings Inc | 3,600 | 123 | ||||||
Hikari Tsushin Inc | 1,400 | 214 | ||||||
Description | Shares | Market Value | ||||||
FOREIGN COMMON STOCK (continued) | ||||||||
Hirose Electric Co Ltd | 882 | $ | 102 | |||||
Hitachi Construction Machinery Co Ltd | 3,100 | 94 | ||||||
Hoya Corp | 500 | 51 | ||||||
Ibiden Co Ltd | 1,500 | 80 | ||||||
Idemitsu Kosan Co Ltd | 8,998 | 207 | ||||||
Iida Group Holdings Co Ltd | 3,400 | 57 | ||||||
Inpex Corp | 12,100 | 183 | ||||||
ITOCHU Corp | 3,700 | 134 | ||||||
Itochu Techno-Solutions Corp | 3,700 | 107 | ||||||
Japan Airlines Co Ltd | 5,500 | 107 | ||||||
Japan Exchange Group Inc | 12,200 | 227 | ||||||
Japan Metropolitan Fund Invest, Cl A ‡ | 64 | 42 | ||||||
Japan Post Bank Co Ltd | 14,500 | 126 | ||||||
Japan Post Holdings Co Ltd | 13,200 | 106 | ||||||
Japan Real Estate Investment Corp ‡ | 12 | 47 | ||||||
Japan Tobacco Inc | 6,700 | 154 | ||||||
JFE Holdings Inc | 5,400 | 79 | ||||||
JSR Corp | 1,900 | 51 | ||||||
Kansai Electric Power Co Inc/The | 26,300 | 366 | ||||||
Kao Corp | 1,800 | 67 | ||||||
KDDI Corp | 12,600 | 386 | ||||||
Keio Corp | 2,500 | 86 | ||||||
Kikkoman Corp | 900 | 47 | ||||||
Kintetsu Group Holdings Co Ltd | 4,000 | 114 | ||||||
Kirin Holdings Co Ltd | 4,100 | 57 | ||||||
Kobayashi Pharmaceutical Co Ltd | 1,100 | 49 | ||||||
Kobe Bussan Co Ltd | 2,600 | 61 | ||||||
Koei Tecmo Holdings Co Ltd | 6,960 | 99 | ||||||
Koito Manufacturing Co Ltd | 9,900 | 150 | ||||||
Komatsu Ltd | 4,100 | 111 | ||||||
Konami Group Corp | 2,000 | 106 | ||||||
Kose Corp | 1,000 | 73 | ||||||
Kubota Corp | 3,100 | 46 | ||||||
Kyocera Corp | 3,000 | 153 | ||||||
Kyowa Kirin Co Ltd | 6,400 | 112 | ||||||
Lasertec Corp | 200 | 31 | ||||||
Lixil Corp | 2,000 | 23 | ||||||
M3 Inc | 1,900 | 35 | ||||||
Marubeni Corp | 7,100 | 111 | ||||||
McDonald's Holdings Co Japan Ltd | 5,223 | 200 | ||||||
MEIJI Holdings Co Ltd | 4,800 | 120 | ||||||
Mitsubishi Chemical Group Corp, Cl B | 8,100 | 51 | ||||||
Mitsui Fudosan Co Ltd | 2,500 | 55 | ||||||
MonotaRO Co Ltd | 2,000 | 21 | ||||||
NEC Corp | 4,600 | 255 | ||||||
Nexon Co Ltd | 5,300 | 95 | ||||||
Nintendo Co Ltd | 3,040 | 127 | ||||||
Nippon Building Fund Inc ‡ | 13 | 53 | ||||||
Nippon Paint Holdings Co Ltd | 5,400 | 36 | ||||||
Nippon Prologis REIT Inc ‡ | 40 | 75 | ||||||
Nippon Sanso Holdings Corp | 2,600 | 62 | ||||||
Nippon Shinyaku Co Ltd | 3,500 | 148 | ||||||
SEI Institutional Managed Trust
285
CONSOLIDATED SCHEDULE OF INVESTMENTS
September 30, 2023
Multi-Asset Accumulation Fund (Continued)
Description | Shares | Market Value | ||||||
FOREIGN COMMON STOCK (continued) | ||||||||
Nippon Steel Corp | 4,300 | $ | 101 | |||||
Nippon Telegraph & Telephone Corp | 272,100 | 322 | ||||||
Nippon Yusen KK | 900 | 23 | ||||||
Nissan Chemical Corp | 1,800 | 77 | ||||||
Nisshin Seifun Group Inc | 4,815 | 61 | ||||||
Nissin Foods Holdings Co Ltd | 2,000 | 167 | ||||||
Nitori Holdings Co Ltd | 600 | 67 | ||||||
Nomura Holdings Inc | 12,000 | 48 | ||||||
Nomura Real Estate Holdings Inc | 8,400 | 211 | ||||||
Nomura Real Estate Master Fund Inc ‡ | 44 | 49 | ||||||
NTT Data Group Corp | 5,300 | 71 | ||||||
Obic Co Ltd | 400 | 61 | ||||||
Odakyu Electric Railway Co Ltd | 3,500 | 52 | ||||||
Oji Holdings Corp | 14,000 | 59 | ||||||
Olympus Corp | 3,600 | 47 | ||||||
Omron Corp, Cl JP | 1,100 | 49 | ||||||
Ono Pharmaceutical Co Ltd | 5,600 | 108 | ||||||
Oracle Corp Japan | 1,500 | 112 | ||||||
Oriental Land Co Ltd/Japan | 3,000 | 99 | ||||||
ORIX Corp | 3,400 | 64 | ||||||
Osaka Gas Co Ltd | 40,900 | 675 | ||||||
Otsuka Corp | 3,100 | 132 | ||||||
Otsuka Holdings Co Ltd | 3,200 | 114 | ||||||
Pan Pacific International Holdings Corp | 19,300 | 406 | ||||||
Panasonic Holdings Corp | 10,200 | 115 | ||||||
Rakuten Group Inc | 7,600 | 31 | ||||||
Renesas Electronics Corp * | 4,800 | 74 | ||||||
Rohm Co Ltd | 2,800 | 53 | ||||||
SBI Holdings Inc | 2,400 | 51 | ||||||
SCSK Corp | 4,600 | 80 | ||||||
Secom Co Ltd | 1,100 | 75 | ||||||
Seiko Epson Corp | 9,600 | 151 | ||||||
Seven & i Holdings Co Ltd | 3,600 | 141 | ||||||
SG Holdings Co Ltd | 8,000 | 103 | ||||||
Sharp Corp/Japan | 4,700 | 29 | ||||||
Shimadzu Corp | 2,300 | 61 | ||||||
Shimano Inc | 400 | 54 | ||||||
Shionogi & Co Ltd | 1,600 | 72 | ||||||
Shiseido Co Ltd | 1,900 | 67 | ||||||
Shizuoka Financial Group Inc | 12,000 | 98 | ||||||
SoftBank Corp | 18,300 | 207 | ||||||
SoftBank Group Corp | 900 | 38 | ||||||
Sompo Holdings Inc | 2,100 | 91 | ||||||
Sony Group Corp | 800 | 66 | ||||||
Square Enix Holdings Co Ltd | 3,200 | 110 | ||||||
Subaru Corp | 3,700 | 72 | ||||||
SUMCO Corp | 3,000 | 39 | ||||||
Sumitomo Chemical Co Ltd | 39,700 | 108 | ||||||
Sumitomo Corp | 6,500 | 130 | ||||||
Sumitomo Metal Mining Co Ltd | 1,000 | 29 | ||||||
Suntory Beverage & Food Ltd | 3,500 | 107 | ||||||
Sysmex Corp | 1,000 | 48 | ||||||
Description | Shares | Market Value | ||||||
FOREIGN COMMON STOCK (continued) | ||||||||
T&D Holdings Inc | 4,600 | $ | 76 | |||||
Taisei Corp | 1,900 | 67 | ||||||
Takeda Pharmaceutical Co Ltd | 4,318 | 134 | ||||||
TDK Corp | 1,500 | 56 | ||||||
Terumo Corp | 2,800 | 74 | ||||||
TIS Inc | 3,300 | 73 | ||||||
Tobu Railway Co Ltd | 5,000 | 129 | ||||||
Toho Co Ltd/Tokyo | 4,200 | 144 | ||||||
Tokio Marine Holdings Inc | 6,900 | 160 | ||||||
Tokyo Electric Power Co Holdings Inc * | 43,300 | 194 | ||||||
Tokyo Electron Ltd | 300 | 41 | ||||||
Tokyo Gas Co Ltd | 31,600 | 718 | ||||||
Tokyu Corp | 7,000 | 81 | ||||||
Toray Industries Inc | 10,000 | 52 | ||||||
Tosoh Corp | 12,700 | 163 | ||||||
Toyota Industries Corp | 700 | 55 | ||||||
Toyota Motor Corp | 8,800 | 158 | ||||||
Trend Micro Inc/Japan | 3,300 | 125 | ||||||
Unicharm Corp | 5,000 | 177 | ||||||
Welcia Holdings Co Ltd | 5,700 | 99 | ||||||
West Japan Railway Co | 3,400 | 141 | ||||||
Yakult Honsha Co Ltd | 4,200 | 102 | ||||||
Yamaha Corp | 1,100 | 30 | ||||||
Yamato Holdings Co Ltd | 2,500 | 41 | ||||||
Yaskawa Electric Corp | 1,400 | 51 | ||||||
Yokogawa Electric Corp | 3,700 | 72 | ||||||
ZOZO Inc | 1,800 | 33 | ||||||
| 18,202 | ||||||||
Jordan — 0.0% | ||||||||
Hikma Pharmaceuticals PLC | 6,315 | 161 | ||||||
Luxembourg — 0.0% | ||||||||
Eurofins Scientific SE | 1,432 | 81 | ||||||
Netherlands — 0.1% | ||||||||
ABN AMRO Bank NV | 5,808 | 83 | ||||||
Adyen NV * | 65 | 49 | ||||||
Aegon Ltd | 14,434 | 70 | ||||||
Akzo Nobel NV | 725 | 52 | ||||||
ArcelorMittal SA | 2,187 | 55 | ||||||
ASM International NV | 322 | 135 | ||||||
ASML Holding NV | 209 | 124 | ||||||
DSM-Firmenich AG | 490 | 42 | ||||||
Heineken Holding NV | 1,929 | 146 | ||||||
Heineken NV | 1,761 | 156 | ||||||
ING Groep NV | 6,781 | 90 | ||||||
JDE Peet's NV | 6,548 | 183 | ||||||
Just Eat Takeaway.com NV * | 2,362 | 29 | ||||||
Koninklijke Ahold Delhaize NV | 6,728 | 203 | ||||||
Koninklijke KPN NV | 43,321 | 143 | ||||||
286
SEI Institutional Managed Trust
Description | Shares | Market Value | ||||||
FOREIGN COMMON STOCK (continued) | ||||||||
Koninklijke Philips NV * | 3,979 | $ | 80 | |||||
OCI NV | 1,649 | 46 | ||||||
Prosus NV * | 1,957 | 58 | ||||||
Universal Music Group NV | 5,777 | 151 | ||||||
Wolters Kluwer NV | 1,366 | 166 | ||||||
| 2,061 | ||||||||
New Zealand — 0.0% | ||||||||
Auckland International Airport Ltd | 12,197 | 58 | ||||||
Fisher & Paykel Healthcare Corp Ltd | 11,240 | 146 | ||||||
Meridian Energy Ltd | 63,697 | 197 | ||||||
Spark New Zealand Ltd | 101,554 | 293 | ||||||
| 694 | ||||||||
Norway — 0.1% | ||||||||
Aker BP ASA | 6,322 | 176 | ||||||
Equinor ASA | 6,962 | 230 | ||||||
Gjensidige Forsikring ASA | 3,339 | 49 | ||||||
Kongsberg Gruppen ASA | 3,110 | 129 | ||||||
Norsk Hydro ASA | 18,290 | 116 | ||||||
Telenor ASA | 24,297 | 277 | ||||||
| 977 | ||||||||
Portugal — 0.0% | ||||||||
EDP - Energias de Portugal SA | 44,659 | 186 | ||||||
Galp Energia SGPS SA | 27,201 | 404 | ||||||
| 590 | ||||||||
Singapore — 0.1% | ||||||||
CapitaLand Ascendas REIT ‡ | 28,900 | 58 | ||||||
CapitaLand Investment Ltd/Singapore | 15,100 | 34 | ||||||
City Developments Ltd | 10,200 | 49 | ||||||
Jardine Cycle & Carriage Ltd | 9,100 | 213 | ||||||
Jardine Matheson Holdings Ltd | 3,164 | 147 | ||||||
Oversea-Chinese Banking Corp Ltd | 4,100 | 39 | ||||||
Sea Ltd ADR * | 5,508 | 242 | ||||||
Sembcorp Industries Ltd | 11,200 | 42 | ||||||
Singapore Exchange Ltd | 7,100 | 51 | ||||||
Singapore Technologies Engineering Ltd | 26,600 | �� | 76 | |||||
Singapore Telecommunications Ltd | 252,100 | 447 | ||||||
Venture Corp Ltd | 25,300 | 229 | ||||||
| 1,627 | ||||||||
South Korea — 0.0% | ||||||||
Delivery Hero SE * | 1,113 | 32 | ||||||
Spain — 0.1% | ||||||||
Acciona SA | 722 | 92 | ||||||
ACS Actividades de Construccion y Servicios SA | 1,954 | 71 | ||||||
Aena SME SA | 513 | 77 | ||||||
Description | Shares | Market Value | ||||||
FOREIGN COMMON STOCK (continued) | ||||||||
Amadeus IT Group SA, Cl A | 1,707 | $ | 104 | |||||
Banco Santander SA | 14,314 | 55 | ||||||
CaixaBank SA | 13,416 | 54 | ||||||
Cellnex Telecom SA | 4,726 | 165 | ||||||
Corp ACCIONA Energias Renovables SA | 3,758 | 97 | ||||||
EDP Renovaveis SA | 8,525 | 140 | ||||||
Enagas SA | 5,761 | 96 | ||||||
Endesa SA | 8,563 | 175 | ||||||
Ferrovial SE | 2,453 | 75 | ||||||
Grifols SA | 12,839 | 167 | ||||||
Iberdrola SA | 10,170 | 114 | ||||||
Industria de Diseno Textil SA | 6,407 | 239 | ||||||
Repsol SA, Cl A | 13,993 | 231 | ||||||
Telefonica SA | 41,335 | 169 | ||||||
| 2,121 | ||||||||
Sweden — 0.1% | ||||||||
Atlas Copco AB, Cl A | 1,380 | 19 | ||||||
Boliden AB | 2,335 | 68 | ||||||
Embracer Group AB, Cl B * | 58,052 | 117 | ||||||
Epiroc AB, Cl A | 6,391 | 122 | ||||||
EQT AB | 2,299 | 46 | ||||||
Evolution AB | 948 | 96 | ||||||
Getinge AB, Cl B | 3,429 | 61 | ||||||
Hexagon AB, Cl B | 6,475 | 56 | ||||||
Holmen AB, Cl B | 3,015 | 118 | ||||||
Indutrade AB | 8,779 | 164 | ||||||
L E Lundbergforetagen AB, Cl B | 4,595 | 193 | ||||||
Nibe Industrier AB, Cl B | 13,845 | 91 | ||||||
Nordea Bank Abp, Cl A | 6,982 | 77 | ||||||
Skandinaviska Enskilda Banken AB, Cl A | 5,484 | 66 | ||||||
SKF AB, Cl B | 7,979 | 134 | ||||||
Svenska Cellulosa AB SCA, Cl B | 8,996 | 124 | ||||||
Svenska Handelsbanken AB, Cl A | 7,194 | 65 | ||||||
Swedbank AB, Cl A | 3,925 | 73 | ||||||
Swedish Orphan Biovitrum AB * | 5,208 | 107 | ||||||
Tele2 AB, Cl B | 24,535 | 189 | ||||||
Telefonaktiebolaget LM Ericsson, Cl B | 24,467 | 120 | ||||||
Telia Co AB | 118,012 | 245 | ||||||
| 2,351 | ||||||||
Switzerland — 0.2% | ||||||||
Adecco Group AG | 1,187 | 49 | ||||||
Alcon Inc | 2,354 | 182 | ||||||
Bachem Holding AG, Cl B | 1,569 | 117 | ||||||
Baloise Holding AG | 496 | 72 | ||||||
Barry Callebaut AG | 104 | 166 | ||||||
BKW AG | 2,261 | 399 | ||||||
Chocoladefabriken Lindt & Spruengli AG | 1 | 110 | ||||||
Cie Financiere Richemont SA, Cl A | 745 | 91 | ||||||
Geberit AG | 215 | 108 | ||||||
Givaudan SA | 26 | 85 | ||||||
SEI Institutional Managed Trust
287
CONSOLIDATED SCHEDULE OF INVESTMENTS
September 30, 2023
Multi-Asset Accumulation Fund (Continued)
Description | Shares | Market Value | ||||||
FOREIGN COMMON STOCK (continued) | ||||||||
Holcim AG | 1,540 | $ | 99 | |||||
Logitech International SA | 1,488 | 103 | ||||||
Lonza Group AG | 296 | 138 | ||||||
Nestle SA | 1,850 | 210 | ||||||
Novartis AG | 1,266 | 130 | ||||||
Partners Group Holding AG | 76 | 86 | ||||||
Roche Holding AG | 484 | 142 | ||||||
Schindler Holding AG | 179 | 35 | ||||||
SGS SA | 1,025 | 86 | ||||||
SIG Group AG | 4,394 | 109 | ||||||
Sika AG | 195 | 50 | ||||||
Sonova Holding AG | 526 | 125 | ||||||
Straumann Holding AG | 960 | 123 | ||||||
Swatch Group AG/The, Cl B | 251 | 65 | ||||||
Swiss Life Holding AG | 180 | 112 | ||||||
Swiss Prime Site AG | 588 | 54 | ||||||
Swisscom AG | 729 | 434 | ||||||
Temenos AG | 2,087 | 147 | ||||||
UBS Group AG | 4,371 | 108 | ||||||
VAT Group AG | 332 | 119 | ||||||
Zurich Insurance Group AG | 87 | 40 | ||||||
| 3,894 | ||||||||
United Kingdom — 0.3% | ||||||||
Admiral Group PLC | 2,390 | 69 | ||||||
Antofagasta PLC | 6,096 | 106 | ||||||
Associated British Foods PLC | 7,753 | 196 | ||||||
AstraZeneca PLC | 1,035 | 140 | ||||||
Auto Trader Group PLC | 23,673 | 178 | ||||||
Barratt Developments PLC | 6,905 | 37 | ||||||
Berkeley Group Holdings PLC | 1,223 | 61 | ||||||
BP PLC | 46,411 | 301 | ||||||
British American Tobacco PLC | 4,565 | 144 | ||||||
BT Group PLC, Cl A | 104,801 | 149 | ||||||
Bunzl PLC | 3,000 | 107 | ||||||
Burberry Group PLC | 2,683 | 63 | ||||||
Coca-Cola Europacific Partners PLC | 3,518 | 220 | ||||||
Coca-Cola HBC AG | 4,673 | 128 | ||||||
Compass Group PLC | 3,169 | 77 | ||||||
CRH PLC | 3,263 | 181 | ||||||
DCC PLC | 732 | 41 | ||||||
Diageo PLC | 2,888 | 107 | ||||||
Experian PLC | 1,157 | 38 | ||||||
GSK PLC | 4,891 | 89 | ||||||
Haleon PLC | 22,671 | 94 | ||||||
Halma PLC | 5,482 | 130 | ||||||
Hargreaves Lansdown PLC | 4,638 | 44 | ||||||
HSBC Holdings PLC | 17,725 | 140 | ||||||
Imperial Brands PLC | 5,956 | 121 | ||||||
InterContinental Hotels Group PLC | 861 | 64 | ||||||
J Sainsbury PLC | 54,025 | 167 | ||||||
Johnson Matthey PLC | 2,742 | 55 | ||||||
Description | Shares | Market Value | ||||||
FOREIGN COMMON STOCK (continued) | ||||||||
Kingfisher PLC | 15,739 | $ | 43 | |||||
Land Securities Group PLC ‡ | 4,420 | 32 | ||||||
London Stock Exchange Group PLC | 585 | 59 | ||||||
Mondi PLC | 5,822 | 98 | ||||||
National Grid PLC | 16,672 | 199 | ||||||
NMC Health PLC * | 12,179 | — | ||||||
Ocado Group PLC * | 7,660 | 56 | ||||||
Pearson PLC | 15,564 | 165 | ||||||
Persimmon PLC | 2,512 | 33 | ||||||
Phoenix Group Holdings PLC | 7,887 | 46 | ||||||
Prudential PLC | 1,980 | 21 | ||||||
Reckitt Benckiser Group PLC | 1,696 | 120 | ||||||
RELX PLC | 3,034 | 103 | ||||||
Rentokil Initial PLC | 12,011 | 89 | ||||||
Rolls-Royce Holdings PLC * | 19,553 | 53 | ||||||
Sage Group PLC/The | 12,410 | 150 | ||||||
Segro PLC ‡ | 3,917 | 34 | ||||||
Severn Trent PLC | 3,984 | 115 | ||||||
Shell PLC | 10,804 | 344 | ||||||
Smith & Nephew PLC | 9,612 | 120 | ||||||
Smiths Group PLC | 3,056 | 60 | ||||||
Smurfit Kappa Group PLC | 3,889 | 130 | ||||||
SSE PLC | 6,499 | 128 | ||||||
Taylor Wimpey PLC | 153,902 | 220 | ||||||
Tesco PLC | 17,126 | 55 | ||||||
United Utilities Group PLC, Cl B | 16,150 | 187 | ||||||
Vodafone Group PLC | 157,079 | 147 | ||||||
Whitbread PLC | 1,289 | 55 | ||||||
WPP PLC | 14,932 | 134 | ||||||
| 6,243 | ||||||||
Total Foreign Common Stock | ||||||||
(Cost $66,414) ($ Thousands) | 68,538 | |||||||
EXCHANGE TRADED FUND — 0.7% | ||||||||
iShares iBoxx $ Investment Grade Corporate Bond ETF | 130,327 | 13,296 | ||||||
Total Exchange Traded Fund | ||||||||
(Cost $14,921) ($ Thousands) | 13,296 | |||||||
| ||||||||
CORPORATE OBLIGATIONS — 0.0%^ | ||||||||
Energy — 0.0% | ||||||||
CNOOC Petroleum North America ULC | ||||||||
5.875%, 03/10/2035 ^ | $ | 100 | 100 | |||||
288
SEI Institutional Managed Trust
Description | Face Amount | Market Value | ||||||
CORPORATE OBLIGATIONS (continued) | ||||||||
Financials — 0.0% | ||||||||
Landwirtschaftliche Rentenbank | ||||||||
2.000%, 01/13/2025 ^ | $ | 250 | $ | 239 | ||||
Total Corporate Obligations | ||||||||
(Cost $358) ($ Thousands) | 339 | |||||||
| ||||||||
COMMON STOCK — 0.0% | ||||||||
Information Technology — 0.0% | ||||||||
CyberArk Software Ltd * | 1,176 | 192 | ||||||
Total Common Stock | ||||||||
(Cost $148) ($ Thousands) | 192 | |||||||
PREFERRED STOCK — 0.0% | ||||||||
Consumer Discretionary — 0.0% | ||||||||
Porsche Automobil Holding SE (D) | 2,071 | 102 | ||||||
Description | Shares | Market Value | ||||||
PREFERRED STOCK (continued) | ||||||||
Health Care — 0.0% | ||||||||
Sartorius AG (D) | 230 | $ | 79 | |||||
Total Preferred Stock | ||||||||
(Cost $214) ($ Thousands) | 181 | |||||||
| Number of Rights | ||||||||
RIGHTS — 0.0% | ||||||||
Abiomed Inc *‡‡ | 422 | – | ||||||
Total Rights | ||||||||
(Cost $—) ($ Thousands) | – | |||||||
| Number of Warrants | ||||||||
WARRANT — 0.0% | ||||||||
Constellation Software Inc. ‡‡ | 100 | – | ||||||
Total Warrant | ||||||||
(Cost $—) ($ Thousands) | – | |||||||
Total Investments in Securities — 71.8% | ||||||||
(Cost $1,388,115) ($ Thousands) | $ | 1,350,754 | ||||||
A list of the open futures contracts held by the Fund at September 30, 2023, is as follows:
Type of Contract | Number of | Expiration Date | Notional Amount (Thousands) | Value | Unrealized Appreciation/ | |||||||||||||||
Long Contracts | ||||||||||||||||||||
Australian 10-Year Bond | 2,548 | Dec-2023 | $ | 188,151 | $ | 184,137 | $ | (4,886 | ) | |||||||||||
Australian 3-Year Bond | 170 | Dec-2023 | 11,585 | 11,558 | (86 | ) | ||||||||||||||
Brent Crude^ | 230 | Dec-2023 | 20,558 | 20,783 | 225 | |||||||||||||||
Brent Crude^ | 7 | Dec-2023 | 525 | 645 | 120 | |||||||||||||||
CAC40 10 Euro Index | 93 | Oct-2023 | 7,158 | 7,042 | (68 | ) | ||||||||||||||
Canadian 10-Year Bond | 1,228 | Dec-2023 | 107,317 | 104,571 | (3,021 | ) | ||||||||||||||
Coffee C^ | 103 | Dec-2023 | 6,206 | 5,645 | (561 | ) | ||||||||||||||
Copper^ | 49 | Dec-2023 | 4,696 | 4,578 | (118 | ) | ||||||||||||||
Corn^ | 451 | Dec-2023 | 11,111 | 10,751 | (360 | ) | ||||||||||||||
Cotton No. 2^ | 103 | Dec-2023 | 4,379 | 4,488 | 109 | |||||||||||||||
DAX Index | 34 | Dec-2023 | 14,586 | 13,972 | (401 | ) | ||||||||||||||
Euro STOXX 50 | 788 | Dec-2023 | 36,195 | 35,074 | (749 | ) | ||||||||||||||
Euro-Bobl | 761 | Dec-2023 | 96,920 | 93,261 | (1,322 | ) | ||||||||||||||
Euro-BTP | 346 | Dec-2023 | 43,315 | 40,197 | (2,079 | ) | ||||||||||||||
Euro-Bund | 258 | Dec-2023 | 37,102 | 35,139 | (1,073 | ) | ||||||||||||||
Euro-Buxl | 179 | Dec-2023 | 25,852 | 23,189 | (2,058 | ) | ||||||||||||||
Euro-OAT | 145 | Dec-2023 | 19,995 | 18,914 | (596 | ) | ||||||||||||||
Euro-Schatz | 22 | Dec-2023 | 2,462 | 2,446 | (2 | ) | ||||||||||||||
Feeder Cattle^ | 20 | Nov-2023 | 2,522 | 2,549 | 27 | |||||||||||||||
Feeder Cattle^ | 11 | Jan-2024 | 1,373 | 1,419 | 46 | |||||||||||||||
Feeder Cattle^ | 9 | Jan-2024 | 1,178 | 1,161 | (17 | ) | ||||||||||||||
FTSE 100 Index | 437 | Dec-2023 | 41,354 | 40,916 | 494 | |||||||||||||||
SEI Institutional Managed Trust
289
CONSOLIDATED SCHEDULE OF INVESTMENTS
September 30, 2023
Multi-Asset Accumulation Fund (Continued)
Type of Contract | Number of | Expiration Date | Notional Amount (Thousands) | Value | Unrealized Appreciation/ | |||||||||||||||
FTSE MIB Index | 107 | Dec-2023 | $ | 16,385 | $ | 16,020 | $ | (147 | ) | |||||||||||
FTSE Taiwan Index | 219 | Oct-2023 | 12,379 | 12,483 | 104 | |||||||||||||||
FTSE/JSE Top 40 Index | 75 | Dec-2023 | 2,741 | 2,685 | (72 | ) | ||||||||||||||
Gasoline^ | 91 | Dec-2023 | 9,260 | 8,980 | (280 | ) | ||||||||||||||
Gold^ | 230 | Dec-2023 | 45,936 | 42,920 | (3,015 | ) | ||||||||||||||
Hang Seng China Enterprises Index | 201 | Oct-2023 | 7,848 | 7,932 | 95 | |||||||||||||||
Hang Seng Index | 201 | Oct-2023 | 22,870 | 22,956 | 127 | |||||||||||||||
IBEX | 139 | Oct-2023 | 14,135 | 13,893 | (75 | ) | ||||||||||||||
IBEX | 8 | Oct-2023 | 809 | 800 | 2 | |||||||||||||||
IFSC Nifty50 Index | 394 | Oct-2023 | 15,602 | 15,532 | (70 | ) | ||||||||||||||
Japanese 10-Year Bond | 255 | Dec-2023 | 252,319 | 247,712 | (1,850 | ) | ||||||||||||||
Japanese 10-Year Government Bond E-MINI | 736 | Dec-2023 | 72,775 | 71,516 | (487 | ) | ||||||||||||||
KC HRW Wheat^ | 23 | Dec-2023 | 862 | 763 | (99 | ) | ||||||||||||||
KOSPI 200 Index | 219 | Dec-2023 | 13,935 | 13,349 | (382 | ) | ||||||||||||||
Lean Hogs^ | 77 | Dec-2023 | 2,351 | 2,211 | (140 | ) | ||||||||||||||
Live Cattle^ | 136 | Dec-2023 | 10,237 | 10,223 | (14 | ) | ||||||||||||||
Live Cattle^ | 78 | Dec-2023 | 5,747 | 5,863 | 117 | |||||||||||||||
LME Copper^ | 61 | Dec-2023 | 12,978 | 12,612 | (367 | ) | ||||||||||||||
LME Lead^ | 52 | Dec-2023 | 2,820 | 2,822 | 2 | |||||||||||||||
LME Nickel^ | 30 | Dec-2023 | 3,945 | 3,359 | (586 | ) | ||||||||||||||
LME Primary Aluminum^ | 166 | Dec-2023 | 9,376 | 9,763 | 387 | |||||||||||||||
LME Zinc^ | 170 | Dec-2023 | 10,605 | 11,274 | 669 | |||||||||||||||
Long Gilt 10-Year Bond | 845 | Dec-2023 | 101,062 | 97,114 | (575 | ) | ||||||||||||||
Low Sulphur Gasoil^ | 44 | Nov-2023 | 3,949 | 4,252 | 303 | |||||||||||||||
Low Sulphur Gasoil^ | 92 | Dec-2023 | 7,948 | 8,526 | 579 | |||||||||||||||
Mexican Bolsa Index | 9 | Dec-2023 | 275 | 267 | (5 | ) | ||||||||||||||
Natural Gas^ | 161 | Jan-2024 | 5,993 | 5,740 | (253 | ) | ||||||||||||||
Natural Gas^ | 93 | Dec-2023 | 3,225 | 3,080 | (145 | ) | ||||||||||||||
NY Harbor ULSD^ | 30 | Nov-2023 | 3,905 | 4,159 | 253 | |||||||||||||||
NY Harbor ULSD^ | 57 | Dec-2023 | 7,110 | 7,560 | 450 | |||||||||||||||
NYMEX Cocoa^ | 147 | Dec-2023 | 5,158 | 5,024 | (133 | ) | ||||||||||||||
OMX Stockholm 30 | 900 | Oct-2023 | 17,709 | 17,894 | (224 | ) | ||||||||||||||
Platinum^ | 8 | Aug-2024 | 116 | 117 | 2 | |||||||||||||||
Russell 2000 Index E-MINI | 765 | Dec-2023 | 71,754 | 68,796 | (2,957 | ) | ||||||||||||||
S&P 500 Index E-MINI | 1,814 | Dec-2023 | 408,607 | 392,323 | (16,284 | ) | ||||||||||||||
S&P Mid Cap 400 Index E-MINI | 86 | Dec-2023 | 22,394 | 21,675 | (718 | ) | ||||||||||||||
S&P TSX 60 Index | 125 | Dec-2023 | 22,211 | 21,751 | (580 | ) | ||||||||||||||
Silver^ | 132 | Dec-2023 | 15,649 | 14,817 | (832 | ) | ||||||||||||||
Soybean^ | 167 | Nov-2023 | 11,165 | 10,646 | (519 | ) | ||||||||||||||
Soybean^ | 15 | Jan-2024 | 1,012 | 971 | (41 | ) | ||||||||||||||
Soybean Meal^ | 305 | Dec-2023 | 11,851 | 11,627 | (224 | ) | ||||||||||||||
Soybean Oil^ | 187 | Dec-2023 | 6,409 | 6,264 | (144 | ) | ||||||||||||||
SPI 200 Index | 260 | Dec-2023 | 30,214 | 29,726 | (596 | ) | ||||||||||||||
Sugar No. 11^ | 580 | Mar-2024 | 17,324 | 17,201 | (122 | ) | ||||||||||||||
TOPIX Index | 499 | Dec-2023 | 79,966 | 77,697 | (950 | ) | ||||||||||||||
U.S. 2-Year Treasury Note | 791 | Dec-2023 | 161,091 | 160,344 | (747 | ) | ||||||||||||||
U.S. 5-Year Treasury Note | 1,918 | Dec-2023 | 204,140 | 202,079 | (2,061 | ) | ||||||||||||||
U.S. 10-Year Treasury Note | 2,056 | Dec-2023 | 226,618 | 222,177 | (4,442 | ) | ||||||||||||||
U.S. Long Treasury Bond | 638 | Dec-2023 | 76,746 | 72,592 | (4,153 | ) | ||||||||||||||
U.S. Ultra Long Treasury Bond | 286 | Dec-2023 | 36,528 | 33,945 | (2,584 | ) | ||||||||||||||
Wheat^ | 120 | �� | Dec-2023 | 4,069 | 3,249 | (820 | ) | |||||||||||||
WTI Crude Oil^ | 38 | Dec-2023 | 2,973 | 3,374 | 402 | |||||||||||||||
WTI Crude Oil^ | 130 | Dec-2023 | 11,742 | 11,544 | (198 | ) | ||||||||||||||
WTI Crude Oil^ | 151 | Nov-2023 | 13,171 | 13,709 | 538 | |||||||||||||||
| 2,822,539 | 2,748,343 | (60,237 | ) | |||||||||||||||||
Short Contracts | ||||||||||||||||||||
Brent Crude^ | (83 | ) | Dec-2023 | $ | (7,717 | ) | $ | (7,653 | ) | $ | 64 | |||||||||
DAX Index | (9 | ) | Dec-2023 | (3,802 | ) | (3,699 | ) | 71 | ||||||||||||
290
SEI Institutional Managed Trust
Type of Contract | Number of | Expiration Date | Notional Amount (Thousands) | Value | Unrealized Appreciation/ | |||||||||||||||
Euro-Bund | (150 | ) | Dec-2023 | $ | (21,274 | ) | $ | (20,430 | ) | $ | 434 | |||||||||
Feeder Cattle^ | (15 | ) | Nov-2023 | (1,972 | ) | (1,912 | ) | 60 | ||||||||||||
FTSE KLCI | (36 | ) | Oct-2023 | (554 | ) | (547 | ) | 6 | ||||||||||||
Gasoline^ | (1 | ) | Nov-2023 | (106 | ) | (101 | ) | 5 | ||||||||||||
MSCI Singapore Index | (96 | ) | Oct-2023 | (1,974 | ) | (2,009 | ) | (31 | ) | |||||||||||
Natural Gas^ | (45 | ) | Nov-2023 | (1,349 | ) | (1,318 | ) | 31 | ||||||||||||
OMX Stockholm 30 | (429 | ) | Oct-2023 | (8,402 | ) | (8,529 | ) | 68 | ||||||||||||
S&P TSX 60 Index | (8 | ) | Dec-2023 | (1,419 | ) | (1,392 | ) | 21 | ||||||||||||
SET 50 | (186 | ) | Dec-2023 | (939 | ) | (921 | ) | 18 | ||||||||||||
Wheat^ | (82 | ) | Dec-2023 | (2,610 | ) | (2,220 | ) | 390 | ||||||||||||
| (52,118 | ) | (50,731 | ) | 1,137 | ||||||||||||||||
| $ | 2,770,421 | $ | 2,697,612 | $ | (59,100 | ) | ||||||||||||||
A list of the open forward foreign currency contracts held by the Fund at September 30, 2023, is as follows:
Counterparty | Settlement Date | Currency to Deliver | Currency to Receive | Unrealized Appreciation | ||||||||||||||||||||
Barclays PLC | 10/30/23 | EUR | 53,500 | USD | 58,165 | $ | 1,459 | |||||||||||||||||
BNP Paribas | 10/30/23 | EUR | 17,120 | USD | 18,176 | 30 | ||||||||||||||||||
BNYMellon | 10/30/23 | GBP | 5,260 | USD | 6,409 | (12 | ) | |||||||||||||||||
BNYMellon | 10/30/23 | AUD | 5,710 | USD | 3,665 | (24 | ) | |||||||||||||||||
BNYMellon | 10/30/23 | CAD | 9,500 | USD | 7,038 | 7 | ||||||||||||||||||
BNYMellon | 10/30/23 | JPY | 2,780,160 | USD | 18,773 | 39 | ||||||||||||||||||
Citigroup | 12/20/23 | USD | 163 | IDR | 2,500,000 | (2 | ) | |||||||||||||||||
Citigroup | 12/20/23 | USD | 264 | PHP | 15,000 | 1 | ||||||||||||||||||
Citigroup | 12/20/23 | USD | 89 | PLN | 390 | — | ||||||||||||||||||
Citigroup | 12/20/23 | USD | 350 | PLN | 1,459 | (17 | ) | |||||||||||||||||
Citigroup | 12/20/23 | USD | 467 | COP | 1,958,333 | 7 | ||||||||||||||||||
Citigroup | 12/20/23 | USD | 71 | COP | 291,667 | (1 | ) | |||||||||||||||||
Citigroup | 12/20/23 | USD | 585 | THB | 20,500 | (18 | ) | |||||||||||||||||
Citigroup | 12/20/23 | USD | 1,214 | ILS | 4,617 | 4 | ||||||||||||||||||
Citigroup | 12/20/23 | THB | 1,000 | USD | 28 | — | ||||||||||||||||||
Citigroup | 12/20/23 | THB | 500 | USD | 14 | (1 | ) | |||||||||||||||||
Citigroup | 12/20/23 | USD | 259 | CZK | 6,000 | 1 | ||||||||||||||||||
Citigroup | 12/20/23 | USD | 1,245 | CZK | 28,032 | (28 | ) | |||||||||||||||||
Citigroup | 12/20/23 | USD | 1,535 | TWD | 48,500 | (19 | ) | |||||||||||||||||
Citigroup | 12/20/23 | USD | 750 | EUR | 707 | 1 | ||||||||||||||||||
Citigroup | 12/20/23 | USD | 889 | EUR | 823 | (14 | ) | |||||||||||||||||
Citigroup | 12/20/23 | PLN | 2,652 | USD | 640 | 34 | ||||||||||||||||||
Citigroup | 12/20/23 | CNH | 3,267 | USD | 451 | 1 | ||||||||||||||||||
Citigroup | 12/20/23 | CNH | 1,032 | USD | 142 | (1 | ) | |||||||||||||||||
Citigroup | 12/20/23 | SGD | 3,797 | USD | 2,810 | 17 | ||||||||||||||||||
Citigroup | 12/20/23 | SGD | 565 | USD | 414 | (1 | ) | |||||||||||||||||
Citigroup | 12/20/23 | USD | 4,393 | CLP | 3,823,017 | (139 | ) | |||||||||||||||||
Citigroup | 12/20/23 | USD | 6,945 | KRW | 9,178,881 | (90 | ) | |||||||||||||||||
Citigroup | 12/20/23 | USD | 3,966 | ZAR | 76,440 | 63 | ||||||||||||||||||
Citigroup | 12/20/23 | USD | 3,228 | ZAR | 60,940 | (17 | ) | |||||||||||||||||
Citigroup | 12/20/23 | USD | 8,006 | HUF | 2,920,496 | (141 | ) | |||||||||||||||||
Citigroup | 12/20/23 | ILS | 6,571 | USD | 1,738 | 4 | ||||||||||||||||||
Citigroup | 12/20/23 | ILS | 3,313 | USD | 870 | (5 | ) | |||||||||||||||||
SEI Institutional Managed Trust
291
CONSOLIDATED SCHEDULE OF INVESTMENTS
September 30, 2023
Multi-Asset Accumulation Fund (Continued)
Counterparty | Settlement Date | Currency to Deliver | Currency to Receive | Unrealized Appreciation | ||||||||||||||||||||
Citigroup | 12/20/23 | USD | 5,731 | CNH | 41,791 | $ | 27 | |||||||||||||||||
Citigroup | 12/20/23 | USD | 4,228 | CNH | 30,533 | (21 | ) | |||||||||||||||||
Citigroup | 12/20/23 | PHP | 10,000 | USD | 176 | (1 | ) | |||||||||||||||||
Citigroup | 12/20/23 | BRL | 8,974 | USD | 1,790 | 14 | ||||||||||||||||||
Citigroup | 12/20/23 | BRL | 2,857 | USD | 565 | (1 | ) | |||||||||||||||||
Citigroup | 12/20/23 | USD | 6,331 | BRL | 32,023 | 4 | ||||||||||||||||||
Citigroup | 12/20/23 | USD | 7,753 | BRL | 38,499 | (137 | ) | |||||||||||||||||
Citigroup | 12/20/23 | MXP | 16,000 | USD | 921 | 12 | ||||||||||||||||||
Citigroup | 12/20/23 | ZAR | 18,000 | USD | 944 | (5 | ) | |||||||||||||||||
Citigroup | 12/20/23 | USD | 5,805 | INR | 484,317 | 3 | ||||||||||||||||||
Citigroup | 12/20/23 | USD | 12,901 | INR | 1,070,808 | (59 | ) | |||||||||||||||||
Citigroup | 12/20/23 | USD | 10,675 | MXP | 190,602 | 145 | ||||||||||||||||||
Citigroup | 12/20/23 | USD | 10,949 | MXP | 188,102 | (271 | ) | |||||||||||||||||
Citigroup | 12/20/23 | GBP | 28,232 | USD | 35,320 | 848 | ||||||||||||||||||
Citigroup | 12/20/23 | GBP | 1,053 | USD | 1,280 | (5 | ) | |||||||||||||||||
Citigroup | 12/20/23 | EUR | 75,068 | USD | 81,376 | 1,594 | ||||||||||||||||||
Citigroup | 12/20/23 | EUR | 534 | USD | 567 | (1 | ) | |||||||||||||||||
Citigroup | 12/20/23 | INR | 20,000 | USD | 240 | — | ||||||||||||||||||
Citigroup | 12/20/23 | INR | 75,000 | USD | 898 | (2 | ) | |||||||||||||||||
Citigroup | 12/20/23 | HUF | 175,000 | USD | 479 | 7 | ||||||||||||||||||
Citigroup | 12/20/23 | HUF | 75,000 | USD | 201 | (2 | ) | |||||||||||||||||
Citigroup | 12/20/23 | CLP | 325,000 | USD | 368 | 6 | ||||||||||||||||||
Citigroup | 12/20/23 | CLP | 950,000 | USD | 1,049 | (9 | ) | |||||||||||||||||
Citigroup | 12/20/23 | KRW | 2,100,000 | USD | 1,587 | 18 | ||||||||||||||||||
Citigroup | 12/20/23 | KRW | 200,000 | USD | 148 | (1 | ) | |||||||||||||||||
Citigroup | 12/20/23 | IDR | 8,500,000 | USD | 551 | 2 | ||||||||||||||||||
Citigroup | 12/20/23 | IDR | 1,500,000 | USD | 97 | — | ||||||||||||||||||
JPMorgan Chase Bank | 12/20/23 | USD | 163 | IDR | 2,500,000 | (2 | ) | |||||||||||||||||
JPMorgan Chase Bank | 12/20/23 | USD | 264 | PHP | 15,000 | 1 | ||||||||||||||||||
JPMorgan Chase Bank | 12/20/23 | USD | 369 | EUR | 343 | (5 | ) | |||||||||||||||||
JPMorgan Chase Bank | 12/20/23 | USD | 89 | PLN | 390 | — | ||||||||||||||||||
JPMorgan Chase Bank | 12/20/23 | USD | 350 | PLN | 1,459 | (16 | ) | |||||||||||||||||
JPMorgan Chase Bank | 12/20/23 | USD | 467 | COP | 1,958,333 | 8 | ||||||||||||||||||
JPMorgan Chase Bank | 12/20/23 | USD | 71 | COP | 291,667 | (1 | ) | |||||||||||||||||
JPMorgan Chase Bank | 12/20/23 | USD | 585 | THB | 20,500 | (17 | ) | |||||||||||||||||
JPMorgan Chase Bank | 12/20/23 | USD | 1,214 | ILS | 4,617 | 4 | ||||||||||||||||||
JPMorgan Chase Bank | 12/20/23 | THB | 1,000 | USD | 28 | 1 | ||||||||||||||||||
JPMorgan Chase Bank | 12/20/23 | THB | 500 | USD | 14 | — | ||||||||||||||||||
JPMorgan Chase Bank | 12/20/23 | USD | 259 | CZK | 6,000 | 1 | ||||||||||||||||||
JPMorgan Chase Bank | 12/20/23 | USD | 1,245 | CZK | 28,032 | (28 | ) | |||||||||||||||||
JPMorgan Chase Bank | 12/20/23 | USD | 1,535 | TWD | 48,500 | (18 | ) | |||||||||||||||||
JPMorgan Chase Bank | 12/20/23 | PLN | 2,652 | USD | 640 | 34 | ||||||||||||||||||
JPMorgan Chase Bank | 12/20/23 | CNH | 3,267 | USD | 451 | 1 | ||||||||||||||||||
JPMorgan Chase Bank | 12/20/23 | CNH | 1,032 | USD | 142 | — | ||||||||||||||||||
JPMorgan Chase Bank | 12/20/23 | SGD | 3,797 | USD | 2,810 | 17 | ||||||||||||||||||
JPMorgan Chase Bank | 12/20/23 | SGD | 565 | USD | 414 | (1 | ) | |||||||||||||||||
JPMorgan Chase Bank | 12/20/23 | USD | 4,393 | CLP | 3,823,017 | (138 | ) | |||||||||||||||||
JPMorgan Chase Bank | 12/20/23 | USD | 6,945 | KRW | 9,178,881 | (89 | ) | |||||||||||||||||
JPMorgan Chase Bank | 12/20/23 | USD | 3,966 | ZAR | 76,440 | 63 | ||||||||||||||||||
292
SEI Institutional Managed Trust
Counterparty | Settlement Date | Currency to Deliver | Currency to Receive | Unrealized Appreciation | ||||||||||||||||||||
JPMorgan Chase Bank | 12/20/23 | USD | 3,228 | ZAR | 60,939 | $ | (16 | ) | ||||||||||||||||
JPMorgan Chase Bank | 12/20/23 | USD | 8,006 | HUF | 2,920,496 | (140 | ) | |||||||||||||||||
JPMorgan Chase Bank | 12/20/23 | ILS | 6,571 | USD | 1,738 | 4 | ||||||||||||||||||
JPMorgan Chase Bank | 12/20/23 | ILS | 3,313 | USD | 870 | (4 | ) | |||||||||||||||||
JPMorgan Chase Bank | 12/20/23 | USD | 5,731 | CNH | 41,791 | 27 | ||||||||||||||||||
JPMorgan Chase Bank | 12/20/23 | USD | 4,228 | CNH | 30,533 | (21 | ) | |||||||||||||||||
JPMorgan Chase Bank | 12/20/23 | PHP | 10,000 | USD | 176 | — | ||||||||||||||||||
JPMorgan Chase Bank | 12/20/23 | BRL | 8,974 | USD | 1,790 | 15 | ||||||||||||||||||
JPMorgan Chase Bank | 12/20/23 | BRL | 2,857 | USD | 565 | — | ||||||||||||||||||
JPMorgan Chase Bank | 12/20/23 | USD | 6,331 | BRL | 32,023 | 5 | ||||||||||||||||||
JPMorgan Chase Bank | 12/20/23 | USD | 7,753 | BRL | 38,499 | (136 | ) | |||||||||||||||||
JPMorgan Chase Bank | 12/20/23 | GBP | 15,975 | USD | 20,097 | 591 | ||||||||||||||||||
JPMorgan Chase Bank | 12/20/23 | MXP | 16,000 | USD | 921 | 13 | ||||||||||||||||||
JPMorgan Chase Bank | 12/20/23 | ZAR | 18,000 | USD | 944 | (5 | ) | |||||||||||||||||
JPMorgan Chase Bank | 12/20/23 | USD | 5,804 | INR | 484,317 | 4 | ||||||||||||||||||
JPMorgan Chase Bank | 12/20/23 | USD | 12,901 | INR | 1,070,808 | (59 | ) | |||||||||||||||||
JPMorgan Chase Bank | 12/20/23 | USD | 10,674 | MXP | 190,602 | 146 | ||||||||||||||||||
JPMorgan Chase Bank | 12/20/23 | USD | 10,949 | MXP | 188,101 | (271 | ) | |||||||||||||||||
JPMorgan Chase Bank | 12/20/23 | EUR | 72,532 | USD | 78,652 | 1,565 | ||||||||||||||||||
JPMorgan Chase Bank | 12/20/23 | EUR | 534 | USD | 567 | — | ||||||||||||||||||
JPMorgan Chase Bank | 12/20/23 | INR | 20,000 | USD | 240 | — | ||||||||||||||||||
JPMorgan Chase Bank | 12/20/23 | INR | 75,000 | USD | 898 | (1 | ) | |||||||||||||||||
JPMorgan Chase Bank | 12/20/23 | HUF | 175,000 | USD | 479 | 8 | ||||||||||||||||||
JPMorgan Chase Bank | 12/20/23 | HUF | 75,000 | USD | 201 | (1 | ) | |||||||||||||||||
JPMorgan Chase Bank | 12/20/23 | CLP | 325,000 | USD | 368 | 7 | ||||||||||||||||||
JPMorgan Chase Bank | 12/20/23 | CLP | 950,000 | USD | 1,049 | (8 | ) | |||||||||||||||||
JPMorgan Chase Bank | 12/20/23 | KRW | 2,100,000 | USD | 1,587 | 19 | ||||||||||||||||||
JPMorgan Chase Bank | 12/20/23 | KRW | 200,000 | USD | 148 | (1 | ) | |||||||||||||||||
JPMorgan Chase Bank | 12/20/23 | IDR | 8,500,000 | USD | 551 | 3 | ||||||||||||||||||
JPMorgan Chase Bank | 12/20/23 | IDR | 1,500,000 | USD | 97 | — | ||||||||||||||||||
State Street | 10/30/23 | CHF | 3,570 | USD | 3,926 | 10 | ||||||||||||||||||
State Street | 10/30/23 | HKD | 23,950 | USD | 3,063 | 3 | ||||||||||||||||||
State Street | 10/30/23 | GBP | 35,600 | USD | 45,035 | 1,584 | ||||||||||||||||||
| $ | 6,459 | |||||||||||||||||||||||
A list of the open OTC swap agreements held by the Fund at September 30, 2023 is as follows:
Total Return Swaps | ||||||||||||||||||||||||||||||||||||||||
Counterparty | Reference Entity/ Obligation | Fund Pays | Fund Receives | Payment Frequency | Termination Date | Currency | Notional Amount ($ Thousands) | Value | Upfront Payments | Net Unrealized | ||||||||||||||||||||||||||||||
JPMorgan Chase | TAIEX Index | Negative Price Return | Positive Price Return | At Maturity | 10/18/2023 | TWD | $ | 8,573 | $ | 8,316 | $ | – | $ | (257 | ) | |||||||||||||||||||||||||
Bank of America | BOVESPA Index | Positive Price Return | Positive Price Return | At Maturity | 10/18/2023 | BRL | 7,177 | 7,026 | – | (151 | ) | |||||||||||||||||||||||||||||
JPMorgan Chase | AEX Index | Negative Price Return | Positive Price Return | At Maturity | 10/20/2023 | EUR | (3,460 | ) | (3,402 | ) | – | 58 | ||||||||||||||||||||||||||||
Bank of America | HSCEI Index | Positive Price Return | Asset Return | At Maturity | 10/30/2023 | HKD | 11,708 | 11,799 | – | 90 | ||||||||||||||||||||||||||||||
JPMorgan Chase | HSCEI Index | Positive Price Return | Asset Return | At Maturity | 10/30/2023 | HKD | 11,386 | 11,444 | – | 57 | ||||||||||||||||||||||||||||||
Bank of America | KOSPI 200 Index | Negative Price Return | Positive Price Return | At Maturity | 12/14/2023 | KRW | 4,785 | 4,571 | – | (213 | ) | |||||||||||||||||||||||||||||
JPMorgan Chase | KOSPI 200 Index | Negative Price Return | Positive Price Return | At Maturity | 12/14/2023 | KRW | 1,020 | 975 | – | (45 | ) | |||||||||||||||||||||||||||||
Bank of America | SWISS MARKET Index | Negative Price Return | Positive Price Return | At Maturity | 12/15/2023 | CHF | (1,856 | ) | (1,804 | ) | – | 52 | ||||||||||||||||||||||||||||
Bank of America | WIG 20 Index | Negative Price Return | Positive Price Return | At Maturity | 12/15/2023 | PLN | 276 | 267 | – | (9 | ) | |||||||||||||||||||||||||||||
SEI Institutional Managed Trust
293
CONSOLIDATED SCHEDULE OF INVESTMENTS
September 30, 2023
Multi-Asset Accumulation Fund (Concluded)
Counterparty | Reference Entity/ Obligation | Fund Pays | Fund Receives | Payment Frequency | Termination Date | Currency | Notional Amount ($ Thousands) | Value | Upfront Payments | Net Unrealized | ||||||||||||||||||||||||||||||
Citibank | MSCI INTERNATIONAL SOUTH AFRICA NET Index | Asset Return | JIBA1M Index | Monthly | 12/20/2023 | ZAR | $ | 4,297 | $ | 7 | $ | – | $ | 7 | ||||||||||||||||||||||||||
Citibank | MSCI INTERNATIONAL SINGAPORE NET Index | Asset Return | SIBCSORA Index | Monthly | 12/20/2023 | SGD | 2,441 | (15 | ) | – | (15 | ) | ||||||||||||||||||||||||||||
Citibank | MSCI INTERNATIONAL SWEDEN NET Index | Asset Return | STBB1M Index | Monthly | 12/20/2023 | SEK | 23,623 | 4 | – | 4 | ||||||||||||||||||||||||||||||
Citibank | MSCI INTERNATIONAL MEXICO NET RETURN Index | MXIBTIIE Index | Asset Return | Monthly | 12/20/2023 | MXN | 135 | – | – | – | ||||||||||||||||||||||||||||||
Citibank | MSCI INTERNATIONAL SPAIN NET Index | Asset Return | ESTRON Index | Monthly | 12/20/2023 | EUR | 210 | 2 | – | 2 | ||||||||||||||||||||||||||||||
Citibank | MSCI INTERNATIONAL NETHERLANDS NET Index | Asset Return | ESTRON Index | Monthly | 12/20/2023 | EUR | 2,549 | 59 | – | 59 | ||||||||||||||||||||||||||||||
Citibank | MSCI INTERNATIONAL ITALY NET Index | ESTRON Index | Asset Return | Monthly | 12/20/2023 | EUR | 1,097 | (9 | ) | – | (9 | ) | ||||||||||||||||||||||||||||
Citibank | MSCI INTERNATIONAL SWITZERLAND NET Index | Asset Return | SSARON Index | Monthly | 12/20/2023 | CHF | 444 | 3 | – | 3 | ||||||||||||||||||||||||||||||
Citibank | MSCI THAILAND NET Index | Asset Return | NDEUTHF Index | Monthly | 12/20/2023 | USD | 1,094 | 65 | – | 65 | ||||||||||||||||||||||||||||||
Citibank | MSCI INTERNATIONAL CANADA NET Index | Asset Return | CAONREPO Index | Monthly | 12/20/2023 | CAD | 1,401 | 40 | – | 40 | ||||||||||||||||||||||||||||||
Bank of America | FTSE/JSE Index | Positive Price Return | Positive Price Return | At Maturity | 12/21/2023 | ZAR | (40 | ) | (39 | ) | – | 1 | ||||||||||||||||||||||||||||
| $ | 39,309 | $ | – | $ | (261 | ) | ||||||||||||||||||||||||||||||||||
| Percentages are based on Net Assets of $1,881,228 ($ Thousands). |
^ | Security, or a portion thereof, is held by the Accumulation Commodity Strategy Subsidiary, Ltd. as of September 30, 2023. |
* | Non-income producing security. |
‡ | Real Estate Investment Trust. |
‡‡ | Expiration date not available. |
(A) | Interest rate represents the security's effective yield at the time of purchase. |
(B) | Security, or a portion thereof, has been pledged as collateral on open futures contracts. The total market value of such securities as of September 30, 2023 was $54,102 ($ Thousands). |
(C) | Security exempt from registration under Rule 144A of the Securities Act of 1933. These securities may be resold in transactions exempt from registration normally to qualified institutions. On September 30, 2023, the value of these securities amounted to $55,502 ($ Thousands), representing 3.0% of the Net Assets of the Fund. |
(D) | No interest rate available. |
The following is a summary of the level of inputs used as of September 30, 2023, in valuing the Fund's investments and other financial instruments carried at value ($ Thousands): | ||||||||||||||||
Investments in Securities | Level 1 | Level 2 | Level 3 | Total | ||||||||||||
U.S. Treasury Obligations | – | 1,069,110 | – | 1,069,110 | ||||||||||||
Sovereign Debt | – | 199,098 | – | 199,098 | ||||||||||||
Foreign Common Stock | 68,072 | 466 | – | 68,538 | ||||||||||||
Exchange Traded Fund | 13,296 | – | – | 13,296 | ||||||||||||
Corporate Obligations | – | 339 | – | 339 | ||||||||||||
Common Stock | 192 | – | – | 192 | ||||||||||||
Preferred Stock | 181 | – | – | 181 | ||||||||||||
Rights | – | – | – | ^ | – | |||||||||||
Warrant | – | – | – | – | ||||||||||||
Total Investments in Securities | 81,741 | 1,269,013 | – | 1,350,754 | ||||||||||||
Other Financial Instruments | Level 1 | Level 2 | Level 3 | Total | ||||||||||||
Futures Contracts* | ||||||||||||||||
Unrealized Appreciation | 6,219 | – | – | 6,219 | ||||||||||||
Unrealized Depreciation | (65,319 | ) | – | – | (65,319 | ) | ||||||||||
Forward Contracts* | ||||||||||||||||
Unrealized Appreciation | – | 8,482 | – | 8,482 | ||||||||||||
Unrealized Depreciation | – | (2,023 | ) | – | (2,023 | ) | ||||||||||
OTC Swaps | ||||||||||||||||
Total Return Swaps* | ||||||||||||||||
Unrealized Appreciation | – | 438 | – | 438 | ||||||||||||
Unrealized Depreciation | – | (699 | ) | – | (699 | ) | ||||||||||
Total Other Financial Instruments | (59,100 | ) | 6,198 | – | (52,902 | ) | ||||||||||
^ This category includes securities with a value less than $500.
* | Futures contracts, forward contracts and swap contracts are valued at the unrealized appreciation (depreciation) on the instrument. |
For more information on valuation inputs, see Note 2 – Significant Accounting Policies in Notes to Financial Statements.
See “Glossary” for abbreviations.
Amounts designated as “—” are either $0 or have been rounded to $0.
294
SEI Institutional Managed Trust
SCHEDULE OF INVESTMENTS
September 30, 2023
Multi-Asset Income Fund

†Percentages based on total investments. Total investments do not include derivatives such as options, futures contracts, forward contracts, and swap contracts, if applicable.
Description | Face Amount | Market Value | ||||||
CORPORATE OBLIGATIONS — 51.6% | ||||||||
Communication Services — 4.3% | ||||||||
Altice France | ||||||||
5.500%, 10/15/2029 (A) | $ | 689 | $ | 496 | ||||
Altice France Holding | ||||||||
10.500%, 05/15/2027 (A) | 2,090 | 1,304 | ||||||
AMC Entertainment Holdings | ||||||||
7.500%, 02/15/2029 (A) | 290 | 201 | ||||||
AT&T | ||||||||
4.350%, 03/01/2029 | 700 | 651 | ||||||
3.500%, 06/01/2041 | 350 | 243 | ||||||
2.750%, 06/01/2031 | 375 | 300 | ||||||
2.550%, 12/01/2033 | 1,428 | 1,049 | ||||||
2.300%, 06/01/2027 | 1,009 | 893 | ||||||
1.650%, 02/01/2028 | 875 | 739 | ||||||
Bharti Airtel | ||||||||
3.250%, 06/03/2031 (A) | 1,360 | 1,121 | ||||||
CCO Holdings | ||||||||
4.750%, 02/01/2032 (A) | 1,625 | 1,300 | ||||||
4.500%, 05/01/2032 | 260 | 204 | ||||||
4.250%, 02/01/2031 (A) | 840 | 669 | ||||||
Charter Communications Operating | ||||||||
5.125%, 07/01/2049 | 200 | 146 | ||||||
4.908%, 07/23/2025 | 3,200 | 3,127 | ||||||
3.750%, 02/15/2028 | 650 | 586 | ||||||
Cinemark USA | ||||||||
5.875%, 03/15/2026 (A) | 1,025 | 984 | ||||||
DISH DBS | ||||||||
5.875%, 11/15/2024 | 890 | 828 | ||||||
5.750%, 12/01/2028 (A) | 480 | 369 | ||||||
Description | Face Amount | Market Value | ||||||
CORPORATE OBLIGATIONS (continued) | ||||||||
5.250%, 12/01/2026 (A) | $ | 580 | $ | 493 | ||||
DISH Network | ||||||||
11.750%, 11/15/2027 (A) | 720 | 725 | ||||||
Gannett Holdings | ||||||||
6.000%, 11/01/2026 (A) | 250 | 215 | ||||||
iHeartCommunications | ||||||||
8.375%, 05/01/2027 | 830 | 595 | ||||||
Intelsat Jackson Holdings (Escrow Security) | ||||||||
9.750%, 07/15/2025 (A)(B)(C) | 650 | – | ||||||
5.500%, 08/01/2023 (B)(C) | 1,747 | – | ||||||
Mauritius Investments | ||||||||
6.500%, 10/13/2026 (A) | 2,470 | 2,414 | ||||||
Meta Platforms | ||||||||
3.850%, 08/15/2032 | 875 | 776 | ||||||
3.500%, 08/15/2027 | 450 | 425 | ||||||
Millicom International Cellular | ||||||||
6.250%, 03/25/2029 (A) | 297 | 252 | ||||||
4.500%, 04/27/2031 (A) | 219 | 157 | ||||||
Scripps Escrow | ||||||||
5.875%, 07/15/2027 (A) | 1,015 | 751 | ||||||
Sinclair Television Group | ||||||||
5.125%, 02/15/2027 (A) | 495 | 396 | ||||||
Sirius XM Radio | ||||||||
4.000%, 07/15/2028 (A) | 1,140 | 973 | ||||||
T-Mobile USA | ||||||||
4.500%, 04/15/2050 | 1,516 | 1,163 | ||||||
Townsquare Media | ||||||||
6.875%, 02/01/2026 (A) | 902 | 852 | ||||||
Turk Telekomunikasyon | ||||||||
6.875%, 02/28/2025 (A) | 330 | 321 | ||||||
Urban One | ||||||||
7.375%, 02/01/2028 (A) | 1,120 | 960 | ||||||
Verizon Communications | ||||||||
2.100%, 03/22/2028 | 515 | 442 | ||||||
Vmed O2 UK Financing I | ||||||||
4.750%, 07/15/2031 (A) | 490 | 396 | ||||||
VTR Comunicaciones | ||||||||
5.125%, 01/15/2028 (A) | 346 | 195 | ||||||
Ziff Davis | ||||||||
4.625%, 10/15/2030 (A) | 670 | 567 | ||||||
ZipRecruiter | ||||||||
5.000%, 01/15/2030 (A) | 200 | 157 | ||||||
| 28,435 | ||||||||
Consumer Discretionary — 7.7% | ||||||||
Abercrombie & Fitch Management | ||||||||
8.750%, 07/15/2025 (A) | 450 | 458 | ||||||
Allen Media | ||||||||
10.500%, 02/15/2028 (A) | 570 | 326 | ||||||
Altice Financing | ||||||||
5.750%, 08/15/2029 (A) | 610 | 500 | ||||||
5.000%, 01/15/2028 (A) | 735 | 628 | ||||||
SEI Institutional Managed Trust
295
SCHEDULE OF INVESTMENTS
September 30, 2023
Multi-Asset Income Fund (Continued)
Description | Face Amount | Market Value | ||||||
CORPORATE OBLIGATIONS (continued) | ||||||||
Asbury Automotive Group | ||||||||
5.000%, 02/15/2032 (A) | $ | 280 | $ | 232 | ||||
4.625%, 11/15/2029 (A) | 505 | 434 | ||||||
Banijay Entertainment SASU | ||||||||
8.125%, 05/01/2029 (A) | 200 | 198 | ||||||
Bath & Body Works | ||||||||
6.625%, 10/01/2030 (A) | 220 | 206 | ||||||
5.250%, 02/01/2028 | 710 | 657 | ||||||
Boyne USA | ||||||||
4.750%, 05/15/2029 (A) | 910 | 796 | ||||||
Caesars Entertainment | ||||||||
7.000%, 02/15/2030 (A) | 700 | 681 | ||||||
CalAtlantic Group | ||||||||
5.250%, 06/01/2026 | 330 | 310 | ||||||
Carnival | ||||||||
10.500%, 06/01/2030 (A) | 240 | 247 | ||||||
7.000%, 08/15/2029 (A) | 370 | 365 | ||||||
5.750%, 03/01/2027 (A) | 1,020 | 923 | ||||||
4.000%, 08/01/2028 (A) | 290 | 252 | ||||||
Carnival Holdings Bermuda | ||||||||
10.375%, 05/01/2028 (A) | 430 | 461 | ||||||
Carriage Services | ||||||||
4.250%, 05/15/2029 (A) | 440 | 376 | ||||||
CD&R Smokey Buyer | ||||||||
6.750%, 07/15/2025 (A) | 441 | 425 | ||||||
Clarios Global | ||||||||
8.500%, 05/15/2027 (A) | 400 | 399 | ||||||
CSC Holdings | ||||||||
11.250%, 05/15/2028 (A) | 980 | 976 | ||||||
7.500%, 04/01/2028 (A) | 930 | 604 | ||||||
6.500%, 02/01/2029 (A) | 420 | 348 | ||||||
5.750%, 01/15/2030 (A) | 643 | 360 | ||||||
5.250%, 06/01/2024 | 300 | 285 | ||||||
4.125%, 12/01/2030 (A) | 590 | 418 | ||||||
Dealer Tire | ||||||||
8.000%, 02/01/2028 (A) | 1,734 | 1,626 | ||||||
Diamond Sports Group | ||||||||
6.625%, 08/15/2027 (A)(C) | 500 | 10 | ||||||
5.375%, 08/15/2026 (A)(C) | 330 | 7 | ||||||
DirecTV Financing | ||||||||
5.875%, 08/15/2027 (A) | 2,930 | 2,591 | ||||||
Expedia Group | ||||||||
4.625%, 08/01/2027 | 647 | 617 | ||||||
Foot Locker | ||||||||
4.000%, 10/01/2029 (A) | 820 | 591 | ||||||
Ford Motor | ||||||||
6.100%, 08/19/2032 | 740 | 697 | ||||||
3.250%, 02/12/2032 | 2,391 | 1,843 | ||||||
Ford Motor Credit | ||||||||
4.950%, 05/28/2027 | 1,019 | 957 | ||||||
3.625%, 06/17/2031 | 900 | 727 | ||||||
Description | Face Amount | Market Value | ||||||
CORPORATE OBLIGATIONS (continued) | ||||||||
Foundation Building Materials | ||||||||
6.000%, 03/01/2029 (A) | $ | 1,240 | $ | 1,032 | ||||
Full House Resorts | ||||||||
8.250%, 02/15/2028 (A) | 650 | 569 | ||||||
General Motors | ||||||||
5.950%, 04/01/2049 | 36 | 31 | ||||||
4.000%, 04/01/2025 | 250 | 242 | ||||||
General Motors Financial | ||||||||
5.650%, 01/17/2029 | 175 | 170 | ||||||
Getty Images | ||||||||
9.750%, 03/01/2027 (A) | 720 | 719 | ||||||
GrubHub Holdings | ||||||||
5.500%, 07/01/2027 (A) | 300 | 233 | ||||||
Hilton Grand Vacations Borrower Escrow | ||||||||
5.000%, 06/01/2029 (A) | 1,010 | 876 | ||||||
Hyundai Capital America | ||||||||
6.200%, 09/21/2030 (A) | 785 | 773 | ||||||
KB Home | ||||||||
7.250%, 07/15/2030 | 545 | 535 | ||||||
LCM Investments Holdings II | ||||||||
4.875%, 05/01/2029 (A) | 1,205 | 1,024 | ||||||
MajorDrive Holdings IV | ||||||||
6.375%, 06/01/2029 (A) | 1,055 | 868 | ||||||
Marriott Ownership Resorts | ||||||||
4.500%, 06/15/2029 (A) | 280 | 235 | ||||||
Match Group Holdings II | ||||||||
5.000%, 12/15/2027 (A) | 190 | 175 | ||||||
3.625%, 10/01/2031 (A) | 385 | 304 | ||||||
McClatchy | ||||||||
11.000%, 07/15/2027 (A) | 402 | 440 | ||||||
Mclaren Finance | ||||||||
7.500%, 08/01/2026 (A) | 940 | 813 | ||||||
MDC Holdings | ||||||||
6.000%, 01/15/2043 | 180 | 151 | ||||||
Melco Resorts Finance | ||||||||
5.375%, 12/04/2029 (A) | 420 | 344 | ||||||
4.875%, 06/06/2025 (A) | 200 | 189 | ||||||
MercadoLibre | ||||||||
3.125%, 01/14/2031 | 640 | 504 | ||||||
Metis Merger Sub | ||||||||
6.500%, 05/15/2029 (A) | 287 | 242 | ||||||
Michaels | ||||||||
7.875%, 05/01/2029 (A) | 530 | 346 | ||||||
Mohegan Tribal Gaming Authority | ||||||||
13.250%, 12/15/2027 (A) | 960 | 1,020 | ||||||
NCL | ||||||||
5.875%, 03/15/2026 (A) | 820 | 757 | ||||||
Newell Brands | ||||||||
6.500%, 04/01/2046 | 536 | 397 | ||||||
5.200%, 04/01/2026 | 700 | 660 | ||||||
PECF USS Intermediate Holding III | ||||||||
8.000%, 11/15/2029 (A) | 640 | 347 | ||||||
296
SEI Institutional Managed Trust
Description | Face Amount | Market Value | ||||||
CORPORATE OBLIGATIONS (continued) | ||||||||
Penske Automotive Group | ||||||||
3.750%, 06/15/2029 | $ | 848 | $ | 714 | ||||
PM General Purchaser | ||||||||
9.500%, 10/01/2028 (A) | 1,260 | 1,171 | ||||||
QVC | ||||||||
4.850%, 04/01/2024 | 460 | 442 | ||||||
4.450%, 02/15/2025 | 130 | 114 | ||||||
4.375%, 09/01/2028 | 320 | 168 | ||||||
Royal Caribbean Cruises | ||||||||
11.625%, 08/15/2027 (A) | 300 | 326 | ||||||
11.500%, 06/01/2025 (A) | 78 | 82 | ||||||
9.250%, 01/15/2029 (A) | 250 | 264 | ||||||
4.250%, 07/01/2026 (A) | 530 | 486 | ||||||
Sally Holdings | ||||||||
5.625%, 12/01/2025 | 970 | 945 | ||||||
Sands China | ||||||||
5.650%, 08/08/2028 | 240 | 226 | ||||||
3.500%, 08/08/2031 | 200 | 158 | ||||||
3.100%, 03/08/2029 | 200 | 165 | ||||||
SeaWorld Parks & Entertainment | ||||||||
5.250%, 08/15/2029 (A) | 882 | 775 | ||||||
Specialty Building Products Holdings | ||||||||
6.375%, 09/30/2026 (A) | 1,592 | 1,489 | ||||||
SRS Distribution | ||||||||
6.125%, 07/01/2029 (A) | 1,031 | 878 | ||||||
StoneMor | ||||||||
8.500%, 05/15/2029 (A) | 520 | 428 | ||||||
TKC Holdings | ||||||||
6.875%, 05/15/2028 (A) | 150 | 133 | ||||||
TopBuild | ||||||||
3.625%, 03/15/2029 (A) | 470 | 400 | ||||||
TUI Cruises GmbH | ||||||||
6.500%, 05/15/2026 (A) | EUR | 375 | 374 | |||||
Upbound Group | ||||||||
6.375%, 02/15/2029 (A) | $ | 140 | 124 | |||||
Viking Cruises | ||||||||
9.125%, 07/15/2031 (A) | 480 | 480 | ||||||
Viking Ocean Cruises Ship VII | ||||||||
5.625%, 02/15/2029 (A) | 230 | 208 | ||||||
VOC Escrow | ||||||||
5.000%, 02/15/2028 (A) | 610 | 555 | ||||||
VZ Secured Financing BV | ||||||||
5.000%, 01/15/2032 (A) | 685 | 538 | ||||||
Wheel Bidco | ||||||||
6.750%, 07/15/2026 (A) | GBP | 610 | 617 | |||||
Winnebago Industries | ||||||||
6.250%, 07/15/2028 (A) | $ | 670 | 643 | |||||
Wynn Macau | ||||||||
4.875%, 10/01/2024 (A) | 1,670 | 1,626 | ||||||
Yum! Brands | ||||||||
4.750%, 01/15/2030 (A) | 454 | 408 | ||||||
Description | Face Amount | Market Value | ||||||
CORPORATE OBLIGATIONS (continued) | ||||||||
ZF North America Capital | ||||||||
7.125%, 04/14/2030 (A) | $ | 160 | $ | 157 | ||||
4.750%, 04/29/2025 (A) | 400 | 384 | ||||||
| 51,005 | ||||||||
Consumer Staples — 1.2% | ||||||||
Altria Group | ||||||||
2.350%, 05/06/2025 | 425 | 402 | ||||||
Anheuser-Busch InBev Worldwide | ||||||||
4.750%, 01/23/2029 | 1,506 | 1,460 | ||||||
Bellis Acquisition | ||||||||
3.250%, 02/16/2026 (A) | GBP | 200 | 212 | |||||
Constellation Brands | ||||||||
3.150%, 08/01/2029 | $ | 600 | 526 | |||||
Darling Ingredients | ||||||||
6.000%, 06/15/2030 (A) | 940 | 890 | ||||||
FAGE International | ||||||||
5.625%, 08/15/2026 (A) | 470 | 455 | ||||||
H-Food Holdings | ||||||||
8.500%, 06/01/2026 (A) | 1,090 | 272 | ||||||
Kraft Heinz Foods | ||||||||
4.375%, 06/01/2046 | 1,671 | 1,302 | ||||||
Performance Food Group | ||||||||
5.500%, 10/15/2027 (A) | 450 | 426 | ||||||
Post Holdings | ||||||||
4.625%, 04/15/2030 (A) | 429 | 367 | ||||||
Prosperous Ray | ||||||||
4.625%, 11/12/2023 | 300 | 299 | ||||||
US Foods | ||||||||
4.750%, 02/15/2029 (A) | 1,171 | 1,047 | ||||||
4.625%, 06/01/2030 (A) | 580 | 504 | ||||||
| 8,162 | ||||||||
Energy — 7.2% | ||||||||
Berry Petroleum | ||||||||
7.000%, 02/15/2026 (A) | 1,000 | 958 | ||||||
Blue Racer Midstream | ||||||||
7.625%, 12/15/2025 (A) | 570 | 572 | ||||||
Cheniere Corpus Christi Holdings | ||||||||
5.125%, 06/30/2027 | 850 | 826 | ||||||
Chord Energy Corp | ||||||||
6.375%, 06/01/2026 (A) | 820 | 804 | ||||||
Civitas Resources | ||||||||
8.375%, 07/01/2028 (A) | 350 | 356 | ||||||
5.000%, 10/15/2026 (A) | 475 | 446 | ||||||
CNX Midstream Partners | ||||||||
4.750%, 04/15/2030 (A) | 430 | 358 | ||||||
Columbia Pipelines Operating | ||||||||
6.036%, 11/15/2033 (A) | 635 | 620 | ||||||
CQP Holdco | ||||||||
5.500%, 06/15/2031 (A) | 1,605 | 1,423 | ||||||
SEI Institutional Managed Trust
297
SCHEDULE OF INVESTMENTS
September 30, 2023
Multi-Asset Income Fund (Continued)
Description | Face Amount | Market Value | ||||||
CORPORATE OBLIGATIONS (continued) | ||||||||
Crescent Energy Finance | ||||||||
9.250%, 02/15/2028 (A) | $ | 320 | $ | 327 | ||||
DCP Midstream Operating | ||||||||
6.750%, 09/15/2037 (A) | 302 | 307 | ||||||
Devon Energy | ||||||||
5.850%, 12/15/2025 | 1,021 | 1,016 | ||||||
Earthstone Energy Holdings | ||||||||
9.875%, 07/15/2031 (A) | 490 | 533 | ||||||
Ecopetrol | ||||||||
6.875%, 04/29/2030 | 1,010 | 922 | ||||||
Energy Transfer | ||||||||
9.654%, TSFR3M + 0.000%(D)(E) | 230 | 215 | ||||||
7.125%, H15T5Y + 5.306%(D)(E) | 220 | 190 | ||||||
EQM Midstream Partners | ||||||||
7.500%, 06/01/2030 (A) | 330 | 331 | ||||||
Global Partners | ||||||||
6.875%, 01/15/2029 | 545 | 507 | ||||||
GNL Quintero | ||||||||
4.634%, 07/31/2029 | 282 | 270 | ||||||
Hess Midstream Operations | ||||||||
5.500%, 10/15/2030 (A) | 325 | 295 | ||||||
Hilcorp Energy I | ||||||||
6.250%, 04/15/2032 (A) | 420 | 373 | ||||||
Howard Midstream Energy Partners | ||||||||
8.875%, 07/15/2028 (A) | 775 | 782 | ||||||
6.750%, 01/15/2027 (A) | 1,415 | 1,344 | ||||||
KazMunayGas National JSC | ||||||||
4.750%, 04/19/2027 (A) | 400 | 374 | ||||||
Kinetik Holdings | ||||||||
5.875%, 06/15/2030 (A) | 775 | 727 | ||||||
Marathon Petroleum | ||||||||
3.800%, 04/01/2028 | 325 | 299 | ||||||
Matador Resources | ||||||||
6.875%, 04/15/2028 (A) | 770 | 756 | ||||||
MEG Energy | ||||||||
7.125%, 02/01/2027 (A) | 620 | 628 | ||||||
5.875%, 02/01/2029 (A) | 110 | 103 | ||||||
MPLX | ||||||||
4.800%, 02/15/2029 | 250 | 237 | ||||||
4.000%, 03/15/2028 | 950 | 879 | ||||||
Nabors Industries | ||||||||
7.375%, 05/15/2027 (A) | 1,920 | 1,857 | ||||||
Neptune Energy Bondco | ||||||||
6.625%, 05/15/2025 (A) | 800 | 792 | ||||||
Noble Finance II | ||||||||
8.000%, 04/15/2030 (A) | 755 | 765 | ||||||
Northern Oil and Gas | ||||||||
8.125%, 03/01/2028 (A) | 600 | 599 | ||||||
NuStar Logistics | ||||||||
6.375%, 10/01/2030 | 670 | 635 | ||||||
Occidental Petroleum | ||||||||
7.950%, 06/15/2039 | 1,300 | 1,409 | ||||||
Description | Face Amount | Market Value | ||||||
CORPORATE OBLIGATIONS (continued) | ||||||||
6.625%, 09/01/2030 | $ | 700 | $ | 709 | ||||
6.450%, 09/15/2036 | 230 | 226 | ||||||
4.400%, 08/15/2049 | 150 | 103 | ||||||
ONEOK | ||||||||
6.350%, 01/15/2031 | 325 | 327 | ||||||
Permian Resources Operating | ||||||||
7.000%, 01/15/2032 (A) | 210 | 207 | ||||||
5.875%, 07/01/2029 (A) | 1,050 | 988 | ||||||
Petrobras Global Finance BV | ||||||||
5.299%, 01/27/2025 | 290 | 285 | ||||||
Petroleos de Venezuela | ||||||||
6.000%, 10/28/2022 (C) | 8,860 | 377 | ||||||
6.000%, 05/16/2024 (C) | 3,790 | 199 | ||||||
6.000%, 11/15/2026 (C) | 1,110 | 58 | ||||||
5.500%, 04/12/2037 (C) | 130 | 7 | ||||||
5.375%, 04/12/2027 (C) | 2,570 | 135 | ||||||
Petroleos Mexicanos | ||||||||
7.690%, 01/23/2050 | 406 | 261 | ||||||
6.950%, 01/28/2060 | 207 | 123 | ||||||
6.500%, 03/13/2027 | 328 | 289 | ||||||
6.490%, 01/23/2027 | 73 | 65 | ||||||
5.350%, 02/12/2028 | 180 | 146 | ||||||
4.500%, 01/23/2026 | 40 | 36 | ||||||
Petroleos Mexicanos MTN | ||||||||
6.750%, 09/21/2047 | 16 | 9 | ||||||
Phillips 66 | ||||||||
3.900%, 03/15/2028 | 525 | 491 | ||||||
Plains All American Pipeline | ||||||||
9.736%, TSFR3M + 4.372%(D)(E) | 560 | 529 | ||||||
3.600%, 11/01/2024 | 175 | 170 | ||||||
QazaqGaz NC JSC | ||||||||
4.375%, 09/26/2027 (A) | 300 | 276 | ||||||
Range Resources | ||||||||
8.250%, 01/15/2029 | 930 | 953 | ||||||
4.750%, 02/15/2030 (A) | 30 | 27 | ||||||
Rockies Express Pipeline | ||||||||
7.500%, 07/15/2038 (A) | 310 | 293 | ||||||
Sabine Pass Liquefaction | ||||||||
5.625%, 03/01/2025 | 800 | 795 | ||||||
Shelf Drilling Holdings | ||||||||
9.625%, 04/15/2029 (A) | 450 | 445 | ||||||
Sitio Royalties Operating Partnership | ||||||||
7.875%, 11/01/2028 (A) | 585 | 586 | ||||||
Southwestern Energy | ||||||||
8.375%, 09/15/2028 | 790 | 816 | ||||||
4.750%, 02/01/2032 | 1,410 | 1,210 | ||||||
Summit Midstream Holdings | ||||||||
9.000%, 10/15/2026 (A)(F) | 1,454 | 1,396 | ||||||
5.750%, 04/15/2025 | 925 | 865 | ||||||
Tallgrass Energy Partners | ||||||||
6.000%, 12/31/2030 (A) | 230 | 203 | ||||||
298
SEI Institutional Managed Trust
Description | Face Amount | Market Value | ||||||
CORPORATE OBLIGATIONS (continued) | ||||||||
TechnipFMC | ||||||||
6.500%, 02/01/2026 (A) | $ | 1,050 | $ | 1,031 | ||||
Teck Resources | ||||||||
3.900%, 07/15/2030 | 250 | 217 | ||||||
Total Capital International | ||||||||
2.829%, 01/10/2030 | 1,350 | 1,171 | ||||||
Transocean | ||||||||
11.500%, 01/30/2027 (A) | 1,490 | 1,563 | ||||||
8.750%, 02/15/2030 (A) | 95 | 97 | ||||||
Transocean Poseidon | ||||||||
6.875%, 02/01/2027 (A) | 353 | 347 | ||||||
Transocean Titan Financing | ||||||||
8.375%, 02/01/2028 (A) | 230 | 234 | ||||||
USA Compression Partners | ||||||||
6.875%, 04/01/2026 | 1,175 | 1,151 | ||||||
Venture Global Calcasieu Pass | ||||||||
6.250%, 01/15/2030 (A) | 860 | 820 | ||||||
Venture Global LNG | ||||||||
8.375%, 06/01/2031 (A) | 400 | 393 | ||||||
8.125%, 06/01/2028 (A) | 1,065 | 1,055 | ||||||
Western Midstream Operating | ||||||||
5.450%, 04/01/2044 | 1,100 | 887 | ||||||
5.300%, 03/01/2048 | 530 | 413 | ||||||
YPF | ||||||||
8.500%, 07/28/2025 (A) | 700 | 625 | ||||||
6.950%, 07/21/2027 (A) | 380 | 305 | ||||||
| 47,749 | ||||||||
Financials — 11.9% | ||||||||
Accelerate360 Holdings | ||||||||
8.000%, 03/01/2028 (A) | 1,154 | 1,194 | ||||||
Acrisure | ||||||||
6.000%, 08/01/2029 (A) | 915 | 769 | ||||||
4.250%, 02/15/2029 (A) | 975 | 819 | ||||||
AG Issuer | ||||||||
6.250%, 03/01/2028 (A) | 1,116 | 1,042 | ||||||
AG TTMT Escrow Issuer | ||||||||
8.625%, 09/30/2027 (A) | 130 | 131 | ||||||
AIA Group | ||||||||
3.900%, 04/06/2028 (A) | 475 | 446 | ||||||
Alliant Holdings Intermediate | ||||||||
6.750%, 10/15/2027 (A) | 760 | 707 | ||||||
Ally Financial | ||||||||
4.700%, H15T7Y + 3.481%(D)(E) | 1,325 | 830 | ||||||
American International Group | ||||||||
3.900%, 04/01/2026 | 163 | 156 | ||||||
3.400%, 06/30/2030 | 225 | 193 | ||||||
Aspen Insurance Holdings | ||||||||
4.650%, 11/15/2023 | 40 | 40 | ||||||
Aviation Capital Group | ||||||||
1.950%, 01/30/2026 (A) | 350 | 315 | ||||||
Description | Face Amount | Market Value | ||||||
CORPORATE OBLIGATIONS (continued) | ||||||||
Avolon Holdings Funding | ||||||||
5.125%, 10/01/2023 (A) | $ | 140 | $ | 140 | ||||
4.250%, 04/15/2026 (A) | 100 | 94 | ||||||
2.875%, 02/15/2025 (A) | 1,250 | 1,180 | ||||||
B3 - Brasil Bolsa Balcao | ||||||||
4.125%, 09/20/2031 (A) | 500 | 414 | ||||||
Banco do Brasil | ||||||||
9.000%, H15T10Y + 6.362%(D)(E) | 200 | 201 | ||||||
6.250%, H15T10Y + 4.398%(D)(E) | 1,920 | 1,774 | ||||||
Banco Mercantil del Norte | ||||||||
7.500%, H15T10Y + 5.470%(A)(D)(E) | 970 | 864 | ||||||
6.750%, H15T5Y + 4.967%(A)(D)(E) | 420 | 406 | ||||||
5.875%, H15T5Y + 4.643%(A)(D)(E) | 1,340 | 1,142 | ||||||
Banco Santander | ||||||||
6.921%, 08/08/2033 | 600 | 574 | ||||||
4.250%, 04/11/2027 | 400 | 373 | ||||||
3.306%, 06/27/2029 | 400 | 347 | ||||||
2.749%, 12/03/2030 | 200 | 149 | ||||||
2.746%, 05/28/2025 | 600 | 565 | ||||||
Bank of America | ||||||||
6.250%, TSFR3M + 3.967%(D)(E) | 150 | 148 | ||||||
5.202%, SOFRRATE + 1.630%, 04/25/2029 (D) | 1,065 | 1,026 | ||||||
3.419%, TSFR3M + 1.302%, 12/20/2028 (D) | 2,115 | 1,897 | ||||||
Bank of America MTN | ||||||||
5.015%, SOFRRATE + 2.160%, 07/22/2033 (D) | 565 | 520 | ||||||
4.200%, 08/26/2024 | 225 | 221 | ||||||
3.824%, TSFR3M + 1.837%, 01/20/2028 (D) | 1,525 | 1,416 | ||||||
Bank of New York Mellon MTN | ||||||||
4.596%, SOFRRATE + 1.755%, 07/26/2030 (D) | 75 | 70 | ||||||
Banque Ouest Africaine de Developpement | ||||||||
2.750%, 01/22/2033 (A) | EUR | 1,870 | 1,406 | |||||
Barclays | ||||||||
8.000%, H15T5Y + 5.672%(D)(E) | $ | 970 | 954 | |||||
7.125%, GUKG5 + 6.579%(D)(E) | GBP | 700 | 795 | |||||
2.852%, SOFRRATE + 2.714%, 05/07/2026 (D) | $ | 725 | 684 | |||||
BBVA Bancomer | ||||||||
5.125%, H15T5Y + 2.650%, 01/18/2033 (A)(D) | 410 | 353 | ||||||
BNP Paribas | ||||||||
7.750%, H15T5Y + 4.899%(A)(D)(E) | 270 | 256 | ||||||
3.375%, 01/09/2025 (A) | 1,000 | 965 | ||||||
BPCE | ||||||||
4.625%, 09/12/2028 (A) | 500 | 466 | ||||||
2.277%, SOFRRATE + 1.312%, 01/20/2032 (A)(D) | 375 | 280 | ||||||
BroadStreet Partners | ||||||||
5.875%, 04/15/2029 (A) | 1,195 | 1,054 | ||||||
SEI Institutional Managed Trust
299
SCHEDULE OF INVESTMENTS
September 30, 2023
Multi-Asset Income Fund (Continued)
Description | Face Amount | Market Value | ||||||
CORPORATE OBLIGATIONS (continued) | ||||||||
Burford Capital Global Finance | ||||||||
9.250%, 07/01/2031 (A) | $ | 370 | $ | 375 | ||||
6.250%, 04/15/2028 (A) | 380 | 352 | ||||||
Citigroup | ||||||||
6.300%, TSFR3M + 3.685%(D)(E) | 1,250 | 1,215 | ||||||
4.910%, SOFRRATE + 2.086%, 05/24/2033 (D) | 575 | 523 | ||||||
4.125%, 07/25/2028 | 1,450 | 1,319 | ||||||
4.000%, H15T5Y + 3.597%(D)(E) | 450 | 394 | ||||||
Comerica Bank | ||||||||
2.500%, 07/23/2024 | 1,480 | 1,417 | ||||||
Cooperatieve Rabobank UA | ||||||||
4.625%, EUSA5 + 4.098%(D)(E) | EUR | 1,400 | 1,356 | |||||
Credit Agricole | ||||||||
8.125%, USSW5 + 6.185%(A)(D)(E) | $ | 710 | 705 | |||||
Credit Suisse NY | ||||||||
7.950%, 01/09/2025 | 250 | 255 | ||||||
4.750%, 08/09/2024 | 260 | 256 | ||||||
Deutsche Bank | ||||||||
6.000%, H15T5Y + 4.524%(D)(E) | 400 | 312 | ||||||
DP World MTN | ||||||||
5.625%, 09/25/2048 | 200 | 177 | ||||||
First Horizon National | ||||||||
4.000%, 05/26/2025 | 625 | 590 | ||||||
FirstCash | ||||||||
5.625%, 01/01/2030 (A) | 340 | 306 | ||||||
Freedom Mortgage | ||||||||
6.625%, 01/15/2027 (A) | 1,015 | 892 | ||||||
Global Aircraft Leasing | ||||||||
6.500%cash/0% PIK, 09/15/2024 (A) | 2,879 | 2,742 | ||||||
Global Payments | ||||||||
2.650%, 02/15/2025 | 400 | 381 | ||||||
GTCR W-2 Merger Sub | ||||||||
7.500%, 01/15/2031 (A) | 690 | 691 | ||||||
Highlands Holdings Bond Issuer | ||||||||
7.625%, 10/15/2025 (A) | 1,150 | 1,124 | ||||||
HSBC Holdings | ||||||||
4.950%, 03/31/2030 | 226 | 211 | ||||||
3.803%, TSFR3M + 1.473%, 03/11/2025 (D) | 700 | 691 | ||||||
1.645%, SOFRRATE + 1.538%, 04/18/2026 (D) | 1,000 | 930 | ||||||
Intercontinental Exchange | ||||||||
2.100%, 06/15/2030 | 800 | 643 | ||||||
Intesa Sanpaolo MTN | ||||||||
5.710%, 01/15/2026 (A) | 1,080 | 1,031 | ||||||
Itau Unibanco Holding | ||||||||
4.625%, H15T5Y + 3.222%(A)(D)(E) | 1,120 | 920 | ||||||
Jane Street Group | ||||||||
4.500%, 11/15/2029 (A) | 160 | 137 | ||||||
Description | Face Amount | Market Value | ||||||
CORPORATE OBLIGATIONS (continued) | ||||||||
JPMorgan Chase | ||||||||
4.912%, SOFRRATE + 2.080%, 07/25/2033 (D) | $ | 570 | $ | 524 | ||||
4.323%, SOFRRATE + 1.560%, 04/26/2028 (D) | 2,000 | 1,898 | ||||||
4.125%, 12/15/2026 | 333 | 317 | ||||||
2.956%, TSFR3M + 2.515%, 05/13/2031 (D) | 250 | 205 | ||||||
Ladder Capital Finance Holdings LLLP | ||||||||
4.750%, 06/15/2029 (A) | 270 | 218 | ||||||
4.250%, 02/01/2027 (A) | 70 | 61 | ||||||
Lloyds Banking Group | ||||||||
4.947%(D)(E) | EUR | 290 | 285 | |||||
LPL Holdings | ||||||||
4.000%, 03/15/2029 (A) | $ | 500 | 436 | |||||
M&T Bank | ||||||||
5.053%, SOFRRATE + 1.850%, 01/27/2034 (D) | 525 | 454 | ||||||
Macquarie Airfinance Holdings | ||||||||
8.125%, 03/30/2029 (A) | 505 | 506 | ||||||
Midcap Financial Issuer Trust | ||||||||
6.500%, 05/01/2028 (A) | 1,232 | 1,063 | ||||||
Morgan Stanley | ||||||||
4.210%, SOFRRATE + 1.610%, 04/20/2028 (D) | 1,950 | 1,833 | ||||||
Morgan Stanley MTN | ||||||||
5.164%, SOFRRATE + 1.590%, 04/20/2029 (D) | 875 | 842 | ||||||
4.889%, SOFRRATE + 2.076%, 07/20/2033 (D) | 565 | 513 | ||||||
3.950%, 04/23/2027 | 1,100 | 1,022 | ||||||
1.794%, SOFRRATE + 1.034%, 02/13/2032 (D) | 625 | 463 | ||||||
National Bank of Uzbekistan | ||||||||
4.850%, 10/21/2025 | 200 | 187 | ||||||
Nationstar Mortgage Holdings | ||||||||
5.500%, 08/15/2028 (A) | 615 | 542 | ||||||
Nationwide Building Society | ||||||||
3.960%, TSFR3M + 0.000%, 07/18/2030 (A)(D) | 450 | 396 | ||||||
NatWest Group | ||||||||
4.500%, GUKG5 + 3.992%(D)(E) | GBP | 1,160 | 1,066 | |||||
3.754%, H15T5Y + 2.100%, 11/01/2029 (D) | $ | 225 | 214 | |||||
Navient | ||||||||
9.375%, 07/25/2030 | 595 | 587 | ||||||
5.500%, 03/15/2029 | 824 | 692 | ||||||
5.000%, 03/15/2027 | 745 | 670 | ||||||
NFP | ||||||||
6.875%, 08/15/2028 (A) | 893 | 765 | ||||||
NMI Holdings | ||||||||
7.375%, 06/01/2025 (A) | 410 | 408 | ||||||
300
SEI Institutional Managed Trust
Description | Face Amount | Market Value | ||||||
CORPORATE OBLIGATIONS (continued) | ||||||||
Oxford Finance | ||||||||
6.375%, 02/01/2027 (A) | $ | 465 | $ | 431 | ||||
Paysafe Finance | ||||||||
4.000%, 06/15/2029 (A) | 400 | 336 | ||||||
PNC Financial Services Group | ||||||||
6.200%, H15T5Y + 3.238%(D)(E) | 1,350 | 1,241 | ||||||
Popular | ||||||||
7.250%, 03/13/2028 | 890 | 887 | ||||||
Raymond James Financial | ||||||||
4.650%, 04/01/2030 | 400 | 377 | ||||||
Rocket Mortgage | ||||||||
3.625%, 03/01/2029 (A) | 1,640 | 1,356 | ||||||
Saga | ||||||||
5.500%, 07/15/2026 | GBP | 610 | 588 | |||||
StoneX Group | ||||||||
8.625%, 06/15/2025 (A) | $ | 520 | 524 | |||||
Toronto-Dominion Bank | ||||||||
8.125%, H15T5Y + 4.075%, 10/31/2082 (D) | 200 | 199 | ||||||
Turkiye Vakiflar Bankasi TAO | ||||||||
6.500%, 01/08/2026 (A) | 680 | 655 | ||||||
UBS Group | ||||||||
7.000%, USSW5 + 4.344%(A)(D)(E) | 410 | 404 | ||||||
4.550%, 04/17/2026 | 802 | 770 | ||||||
3.869%, TSFR3M + 0.000%, 01/12/2029 (A)(D) | 600 | 544 | ||||||
2.746%, H15T1Y + 1.100%, 02/11/2033 (A)(D) | 340 | 257 | ||||||
UniCredit MTN | ||||||||
7.296%, USISDA05 + 4.914%, 04/02/2034 (A)(D) | 260 | 245 | ||||||
5.459%, H15T5Y + 4.750%, 06/30/2035 (A)(D) | 440 | 369 | ||||||
United Wholesale Mortgage | ||||||||
5.500%, 04/15/2029 (A) | 641 | 542 | ||||||
VistaJet Malta Finance | ||||||||
6.375%, 02/01/2030 (A) | 1,190 | 919 | ||||||
Wells Fargo | ||||||||
7.625%, H15T5Y + 3.606%(D)(E) | 540 | 544 | ||||||
5.875%, TSFR3M + 0.000%(D)(E) | 525 | 515 | ||||||
Wells Fargo MTN | ||||||||
4.897%, SOFRRATE + 2.100%, 07/25/2033 (D) | 1,235 | 1,118 | ||||||
4.100%, 06/03/2026 | 1,575 | 1,496 | ||||||
Yapi ve Kredi Bankasi MTN | ||||||||
13.875%, USSW5 + 11.245%(D)(E) | 480 | 488 | ||||||
| 78,293 | ||||||||
Health Care — 4.3% | ||||||||
AbbVie | ||||||||
3.200%, 11/21/2029 | 1,375 | 1,213 | ||||||
Description | Face Amount | Market Value | ||||||
CORPORATE OBLIGATIONS (continued) | ||||||||
AdaptHealth | ||||||||
6.125%, 08/01/2028 (A) | $ | 670 | $ | 578 | ||||
5.125%, 03/01/2030 (A) | 370 | 287 | ||||||
4.625%, 08/01/2029 (A) | 605 | 464 | ||||||
Akumin | ||||||||
7.000%, 11/01/2025 (A) | 310 | 232 | ||||||
Akumin Escrow | ||||||||
7.500%, 08/01/2028 (A) | 490 | 325 | ||||||
Amgen | ||||||||
5.250%, 03/02/2030 | 850 | 831 | ||||||
5.250%, 03/02/2033 | 900 | 860 | ||||||
APX Group | ||||||||
5.750%, 07/15/2029 (A) | 1,216 | 1,025 | ||||||
AthenaHealth Group | ||||||||
6.500%, 02/15/2030 (A) | 2,020 | 1,690 | ||||||
Bausch & Lomb Escrow | ||||||||
8.375%, 10/01/2028 (A) | 450 | 451 | ||||||
Bausch Health | ||||||||
14.000%, 10/15/2030 (A) | 18 | 11 | ||||||
7.000%, 01/15/2028 (A) | 130 | 56 | ||||||
6.125%, 02/01/2027 (A) | 280 | 174 | ||||||
5.500%, 11/01/2025 (A) | 310 | 275 | ||||||
5.000%, 01/30/2028 (A) | 60 | 24 | ||||||
5.000%, 02/15/2029 (A) | 390 | 148 | ||||||
Bayer US Finance II | ||||||||
4.375%, 12/15/2028 (A) | 300 | 279 | ||||||
4.250%, 12/15/2025 (A) | 500 | 481 | ||||||
Becton Dickinson | ||||||||
3.700%, 06/06/2027 | 690 | 647 | ||||||
2.823%, 05/20/2030 | 625 | 526 | ||||||
CAB SELAS | ||||||||
3.375%, 02/01/2028 (A) | EUR | 475 | 419 | |||||
Chrome Holdco SAS | ||||||||
5.000%, 05/31/2029 (A) | 375 | 300 | ||||||
CHS | ||||||||
8.000%, 03/15/2026 (A) | $ | 490 | 467 | |||||
6.125%, 04/01/2030 (A) | 1,270 | 646 | ||||||
4.750%, 02/15/2031 (A) | 500 | 354 | ||||||
Cidron Aida Finco S.A.R.L. | ||||||||
6.250%, 04/01/2028 (A) | GBP | 440 | 473 | |||||
CVS Health | ||||||||
4.300%, 03/25/2028 | $ | 950 | 899 | |||||
3.750%, 04/01/2030 | 590 | 522 | ||||||
DaVita | ||||||||
3.750%, 02/15/2031 (A) | 1,079 | 820 | ||||||
DH Europe Finance II S.A.R.L. | ||||||||
2.600%, 11/15/2029 | 175 | 150 | ||||||
Laboratoire Eimer Selas | ||||||||
5.000%, 02/01/2029 (A) | EUR | 225 | 186 | |||||
LifePoint Health | ||||||||
11.000%, 10/15/2030 (A) | $ | 520 | 520 | |||||
9.875%, 08/15/2030 (A) | 360 | 349 | ||||||
SEI Institutional Managed Trust
301
SCHEDULE OF INVESTMENTS
September 30, 2023
Multi-Asset Income Fund (Continued)
Description | Face Amount | Market Value | ||||||
CORPORATE OBLIGATIONS (continued) | ||||||||
5.375%, 01/15/2029 (A) | $ | 1,185 | $ | 827 | ||||
Medline Borrower | ||||||||
5.250%, 10/01/2029 (A) | 1,650 | 1,426 | ||||||
3.875%, 04/01/2029 (A) | 1,160 | 981 | ||||||
Option Care Health | ||||||||
4.375%, 10/31/2029 (A) | 690 | 596 | ||||||
Prime Security Services Borrower | ||||||||
6.250%, 01/15/2028 (A) | 330 | 306 | ||||||
Radiology Partners | ||||||||
9.250%, 02/01/2028 (A) | 365 | 144 | ||||||
Stryker | ||||||||
1.950%, 06/15/2030 | 825 | 661 | ||||||
Tenet Healthcare | ||||||||
6.125%, 06/15/2030 | 446 | 418 | ||||||
Teva Pharmaceutical Finance LLC | ||||||||
6.150%, 02/01/2036 | 1,140 | 1,011 | ||||||
Teva Pharmaceutical Finance Netherlands III BV | ||||||||
8.125%, 09/15/2031 | 550 | 569 | ||||||
4.750%, 05/09/2027 | 200 | 183 | ||||||
UnitedHealth Group | ||||||||
5.350%, 02/15/2033 | 1,525 | 1,508 | ||||||
5.300%, 02/15/2030 | 1,800 | 1,789 | ||||||
US Renal Care | ||||||||
10.625%, 06/28/2028 (A) | 151 | 100 | ||||||
Verisure Holding | ||||||||
3.250%, 02/15/2027 (A) | EUR | 475 | 451 | |||||
Zoetis | ||||||||
2.000%, 05/15/2030 | $ | 1,100 | 881 | |||||
| 28,533 | ||||||||
Industrials — 8.5% | ||||||||
AerCap Ireland Capital DAC | ||||||||
6.500%, 07/15/2025 | 285 | 285 | ||||||
4.875%, 01/16/2024 | 400 | 399 | ||||||
Aeropuerto Internacional de Tocumen | ||||||||
5.125%, 08/11/2061 (A) | 520 | 377 | ||||||
4.000%, 08/11/2041 (A) | 640 | 498 | ||||||
Aeropuertos Dominicanos Siglo XXI | ||||||||
6.750%, 03/30/2029 (A) | 350 | 340 | ||||||
Air Canada | ||||||||
3.875%, 08/15/2026 (A) | 750 | 681 | ||||||
Air Lease | ||||||||
3.250%, 03/01/2025 | 850 | 814 | ||||||
Air Lease MTN | ||||||||
3.750%, 06/01/2026 | 600 | 566 | ||||||
Allegiant Travel | ||||||||
7.250%, 08/15/2027 (A) | 295 | 278 | ||||||
Allied Universal Holdco | ||||||||
9.750%, 07/15/2027 | 649 | 580 | ||||||
6.625%, 07/15/2026 (A) | 590 | 559 | ||||||
Description | Face Amount | Market Value | ||||||
CORPORATE OBLIGATIONS (continued) | ||||||||
Allison Transmission | ||||||||
4.750%, 10/01/2027 (A) | $ | 210 | $ | 194 | ||||
American Airlines | ||||||||
7.250%, 02/15/2028 (A) | 440 | 421 | ||||||
5.750%, 04/20/2029 (A) | 991 | 922 | ||||||
5.500%, 04/20/2026 (A) | 653 | 637 | ||||||
American Airlines Pass-Through Trust | ||||||||
4.950%, 02/15/2025 | 302 | 292 | ||||||
American News | ||||||||
8.500%cash/0% PIK, 09/01/2026 (A) | 1,022 | 1,152 | ||||||
APi Group DE | ||||||||
4.750%, 10/15/2029 (A) | 143 | 125 | ||||||
4.125%, 07/15/2029 (A) | 1,286 | 1,081 | ||||||
Arcosa | ||||||||
4.375%, 04/15/2029 (A) | 500 | 436 | ||||||
BCPE Empire Holdings | ||||||||
7.625%, 05/01/2027 (A) | 990 | 940 | ||||||
Boeing | ||||||||
5.805%, 05/01/2050 | 350 | 317 | ||||||
5.150%, 05/01/2030 | 150 | 143 | ||||||
3.450%, 11/01/2028 | 375 | 338 | ||||||
3.250%, 03/01/2028 | 425 | 382 | ||||||
Bombardier | ||||||||
7.875%, 04/15/2027 (A) | 760 | 742 | ||||||
Builders FirstSource | ||||||||
4.250%, 02/01/2032 (A) | 310 | 254 | ||||||
Cargo Aircraft Management | ||||||||
4.750%, 02/01/2028 (A) | 320 | 286 | ||||||
Carriage Purchaser | ||||||||
7.875%, 10/15/2029 (A) | 220 | 167 | ||||||
Carrier Global | ||||||||
2.493%, 02/15/2027 | 1,100 | 991 | ||||||
2.242%, 02/15/2025 | 1,000 | 950 | ||||||
Chart Industries | ||||||||
7.500%, 01/01/2030 (A) | 300 | 302 | ||||||
CoreCivic | ||||||||
8.250%, 04/15/2026 | 350 | 355 | ||||||
Cornerstone Building Brands | ||||||||
6.125%, 01/15/2029 (A) | 567 | 430 | ||||||
CP Atlas Buyer | ||||||||
7.000%, 12/01/2028 (A) | 955 | 749 | ||||||
DP World MTN | ||||||||
5.625%, 09/25/2048 (A) | 250 | 221 | ||||||
Garda World Security | ||||||||
7.750%, 02/15/2028 (A) | 255 | 250 | ||||||
GEO Group | ||||||||
10.500%, 06/30/2028 | 742 | 744 | ||||||
GFL Environmental | ||||||||
5.125%, 12/15/2026 (A) | 200 | 190 | ||||||
4.750%, 06/15/2029 (A) | 760 | 676 | ||||||
4.000%, 08/01/2028 (A) | 1,188 | 1,038 | ||||||
302
SEI Institutional Managed Trust
Description | Face Amount | Market Value | ||||||
CORPORATE OBLIGATIONS (continued) | ||||||||
Global Infrastructure Solutions | ||||||||
7.500%, 04/15/2032 (A) | $ | 455 | $ | 389 | ||||
5.625%, 06/01/2029 (A) | 1,271 | 1,048 | ||||||
GYP Holdings III | ||||||||
4.625%, 05/01/2029 (A) | 470 | 405 | ||||||
H&E Equipment Services | ||||||||
3.875%, 12/15/2028 (A) | 450 | 384 | ||||||
Hillenbrand | ||||||||
3.750%, 03/01/2031 | 589 | 471 | ||||||
Husky III Holding | ||||||||
13.000%cash/0% PIK, 02/15/2025 (A) | 600 | 594 | ||||||
Icahn Enterprises | ||||||||
4.750%, 09/15/2024 | 1,011 | 974 | ||||||
IHS Holding | ||||||||
6.250%, 11/29/2028 (A) | 350 | 265 | ||||||
5.625%, 11/29/2026 (A) | 440 | 362 | ||||||
Johnson Controls International | ||||||||
4.900%, 12/01/2032 | 150 | 143 | ||||||
Legends Hospitality Holding | ||||||||
5.000%, 02/01/2026 (A) | 510 | 500 | ||||||
Madison IAQ | ||||||||
5.875%, 06/30/2029 (A) | 189 | 152 | ||||||
4.125%, 06/30/2028 (A) | 179 | 155 | ||||||
Mexico City Airport Trust | ||||||||
5.500%, 10/31/2046 | 400 | 305 | ||||||
5.500%, 07/31/2047 | 892 | 678 | ||||||
4.250%, 10/31/2026 (A) | 210 | 197 | ||||||
3.875%, 04/30/2028 (A) | 1,190 | 1,076 | ||||||
MHP Lux | ||||||||
6.950%, 04/03/2026 | 1,870 | 1,263 | ||||||
MV24 Capital BV | ||||||||
6.748%, 06/01/2034 | 2,261 | 1,995 | ||||||
Northrop Grumman | ||||||||
3.250%, 01/15/2028 | 1,950 | 1,788 | ||||||
Otis Worldwide | ||||||||
2.565%, 02/15/2030 | 1,425 | 1,181 | ||||||
Park-Ohio Industries | ||||||||
6.625%, 04/15/2027 | 740 | 642 | ||||||
Rand Parent | ||||||||
8.500%, 02/15/2030 (A) | 835 | 772 | ||||||
Regal Rexnord | ||||||||
6.300%, 02/15/2030 (A) | 575 | 555 | ||||||
RR Donnelley & Sons | ||||||||
9.750%, 07/31/2028 (A) | 230 | 230 | ||||||
Spirit AeroSystems | ||||||||
9.375%, 11/30/2029 (A) | 340 | 346 | ||||||
4.600%, 06/15/2028 | 1,777 | 1,385 | ||||||
Spirit Loyalty Cayman | ||||||||
8.000%, 09/20/2025 (A) | 823 | 822 | ||||||
Standard Industries | ||||||||
4.375%, 07/15/2030 (A) | 645 | 534 | ||||||
Description | Face Amount | Market Value | ||||||
CORPORATE OBLIGATIONS (continued) | ||||||||
Stanley Black & Decker | ||||||||
4.250%, 11/15/2028 | $ | 650 | $ | 606 | ||||
Swire Pacific Financing MTN | ||||||||
4.500%, 10/09/2023 | 200 | 200 | ||||||
Titan Acquisition | ||||||||
7.750%, 04/15/2026 (A) | 1,465 | 1,436 | ||||||
Titan International | ||||||||
7.000%, 04/30/2028 | 1,520 | 1,421 | ||||||
TK Elevator Holdco GmbH | ||||||||
7.625%, 07/15/2028 (A) | 1,546 | 1,407 | ||||||
TransDigm | ||||||||
6.750%, 08/15/2028 (A) | 390 | 384 | ||||||
6.250%, 03/15/2026 (A) | 610 | 599 | ||||||
5.500%, 11/15/2027 | 960 | 899 | ||||||
4.875%, 05/01/2029 | 359 | 316 | ||||||
4.625%, 01/15/2029 | 135 | 118 | ||||||
Triumph Group | ||||||||
9.000%, 03/15/2028 (A) | 1,615 | 1,597 | ||||||
7.750%, 08/15/2025 | 1,161 | 1,103 | ||||||
Tutor Perini | ||||||||
6.875%, 05/01/2025 (A) | 1,120 | 1,024 | ||||||
United Airlines | ||||||||
4.625%, 04/15/2029 (A) | 330 | 284 | ||||||
United Rentals North America | ||||||||
5.250%, 01/15/2030 | 530 | 490 | ||||||
4.875%, 01/15/2028 | 300 | 280 | ||||||
Vertiv Group | ||||||||
4.125%, 11/15/2028 (A) | 810 | 712 | ||||||
VistaJet Malta Finance | ||||||||
9.500%, 06/01/2028 (A) | 240 | 211 | ||||||
7.875%, 05/01/2027 (A) | 990 | 852 | ||||||
VT Topco | ||||||||
8.500%, 08/15/2030 (A) | 645 | 639 | ||||||
XPO Escrow Sub | ||||||||
7.500%, 11/15/2027 (A) | 660 | 667 | ||||||
| 55,958 | ||||||||
Information Technology — 2.7% | ||||||||
Arches Buyer | ||||||||
6.125%, 12/01/2028 (A) | 364 | 296 | ||||||
Broadcom | ||||||||
3.500%, 02/15/2041 (A) | 525 | 365 | ||||||
3.469%, 04/15/2034 (A) | 175 | 137 | ||||||
3.419%, 04/15/2033 (A) | 1,150 | 920 | ||||||
3.187%, 11/15/2036 (A) | 53 | 38 | ||||||
Castle US Holding | ||||||||
9.500%, 02/15/2028 (A) | 1,334 | 715 | ||||||
Central Parent | ||||||||
7.250%, 06/15/2029 (A) | 800 | 776 | ||||||
Clarivate Science Holdings | ||||||||
4.875%, 07/01/2029 (A) | 936 | 798 | ||||||
SEI Institutional Managed Trust
303
SCHEDULE OF INVESTMENTS
September 30, 2023
Multi-Asset Income Fund (Continued)
Description | Face Amount | Market Value | ||||||
CORPORATE OBLIGATIONS (continued) | ||||||||
CommScope | ||||||||
6.000%, 03/01/2026 (A) | $ | 210 | $ | 196 | ||||
4.750%, 09/01/2029 (A) | 460 | 338 | ||||||
Dell International | ||||||||
6.020%, 06/15/2026 | 1,525 | 1,531 | ||||||
5.300%, 10/01/2029 | 75 | 73 | ||||||
Elastic | ||||||||
4.125%, 07/15/2029 (A) | 695 | 592 | ||||||
Gen Digital | ||||||||
7.125%, 09/30/2030 (A) | 660 | 650 | ||||||
Hewlett Packard Enterprise | ||||||||
4.900%, 10/15/2025 | 1,865 | 1,831 | ||||||
Imola Merger | ||||||||
4.750%, 05/15/2029 (A) | 1,054 | 924 | ||||||
Lam Research | ||||||||
1.900%, 06/15/2030 | 300 | 241 | ||||||
MEGlobal Canada ULC MTN | ||||||||
5.875%, 05/18/2030 (A) | 460 | 455 | ||||||
NCR | ||||||||
5.125%, 04/15/2029 (A) | 380 | 335 | ||||||
NXP BV | ||||||||
3.400%, 05/01/2030 | 225 | 192 | ||||||
Open Text Holdings | ||||||||
4.125%, 02/15/2030 (A) | 3 | 3 | ||||||
Oracle | ||||||||
6.250%, 11/09/2032 | 2,175 | 2,202 | ||||||
2.950%, 04/01/2030 | 98 | 83 | ||||||
2.875%, 03/25/2031 | 550 | 449 | ||||||
Presidio Holdings | ||||||||
8.250%, 02/01/2028 (A) | 110 | 105 | ||||||
Prosus | ||||||||
3.680%, 01/21/2030 (A) | 250 | 202 | ||||||
Prosus MTN | ||||||||
4.027%, 08/03/2050 (A) | 560 | 320 | ||||||
3.061%, 07/13/2031 (A) | 300 | 223 | ||||||
SNF Group | ||||||||
3.375%, 03/15/2030 (A) | 310 | 250 | ||||||
Sprint Capital | ||||||||
8.750%, 03/15/2032 | 510 | 590 | ||||||
TeamSystem | ||||||||
3.500%, 02/15/2028 (A) | EUR | 550 | 499 | |||||
United Group BV | ||||||||
4.625%, 08/15/2028 (A) | 450 | 405 | ||||||
Vericast | ||||||||
12.500%, 12/15/2027 (A) | $ | 180 | 204 | |||||
11.000%, 09/15/2026 (A) | 240 | 251 | ||||||
Virtusa | ||||||||
7.125%, 12/15/2028 (A) | 275 | 222 | ||||||
| 17,411 | ||||||||
Description | Face Amount | Market Value | ||||||
CORPORATE OBLIGATIONS (continued) | ||||||||
Materials — 2.0% | ||||||||
Anglo American Capital | ||||||||
5.625%, 04/01/2030 (A) | $ | 500 | $ | 483 | ||||
AngloGold Ashanti Holdings | ||||||||
3.750%, 10/01/2030 | 930 | 749 | ||||||
Ardagh Metal Packaging Finance USA | ||||||||
6.000%, 06/15/2027 (A) | 210 | 202 | ||||||
4.000%, 09/01/2029 (A) | 360 | 281 | ||||||
ASP Unifrax Holdings | ||||||||
5.250%, 09/30/2028 (A) | 275 | 196 | ||||||
Avient | ||||||||
7.125%, 08/01/2030 (A) | 500 | 491 | ||||||
Axalta Coating Systems | ||||||||
3.375%, 02/15/2029 (A) | 942 | 784 | ||||||
Berry Global | ||||||||
1.570%, 01/15/2026 | 325 | 294 | ||||||
Braskem Netherlands Finance BV | ||||||||
4.500%, 01/10/2028 (A) | 270 | 239 | ||||||
Chemours | ||||||||
4.625%, 11/15/2029 (A) | 645 | 519 | ||||||
Cleveland-Cliffs | ||||||||
4.875%, 03/01/2031 (A) | 715 | 609 | ||||||
First Quantum Minerals | ||||||||
8.625%, 06/01/2031 (A) | 840 | 836 | ||||||
6.875%, 10/15/2027 (A) | 800 | 767 | ||||||
Freeport-McMoRan | ||||||||
5.450%, 03/15/2043 | 420 | 358 | ||||||
Huntsman International | ||||||||
4.500%, 05/01/2029 | 375 | 339 | ||||||
Ingevity | ||||||||
3.875%, 11/01/2028 (A) | 735 | 606 | ||||||
Newcrest Finance Pty | ||||||||
3.250%, 05/13/2030 (A) | 150 | 128 | ||||||
OCP | ||||||||
3.750%, 06/23/2031 (A) | 200 | 158 | ||||||
Owens-Brockway Glass Container | ||||||||
6.625%, 05/13/2027 (A) | 200 | 195 | ||||||
Rayonier AM Products | ||||||||
7.625%, 01/15/2026 (A) | 125 | 106 | ||||||
Sasol Financing USA | ||||||||
5.500%, 03/18/2031 | 440 | 345 | ||||||
4.375%, 09/18/2026 | 1,360 | 1,205 | ||||||
Scotts Miracle-Gro | ||||||||
4.000%, 04/01/2031 | 826 | 631 | ||||||
Sealed Air | ||||||||
6.875%, 07/15/2033 (A) | 411 | 399 | ||||||
6.125%, 02/01/2028 (A) | 200 | 194 | ||||||
Smyrna Ready Mix Concrete | ||||||||
6.000%, 11/01/2028 (A) | 710 | 656 | ||||||
Suzano Austria GmbH | ||||||||
3.125%, 01/15/2032 | 590 | 453 | ||||||
304
SEI Institutional Managed Trust
Description | Face Amount | Market Value | ||||||
CORPORATE OBLIGATIONS (continued) | ||||||||
Syngenta Finance MTN | ||||||||
1.250%, 09/10/2027 | EUR | 200 | $ | 189 | ||||
Vale Overseas | ||||||||
6.250%, 08/10/2026 | $ | 380 | 386 | |||||
WR Grace Holdings | ||||||||
5.625%, 08/15/2029 (A) | 670 | 542 | ||||||
| 13,340 | ||||||||
Real Estate — 0.8% | ||||||||
Agree | ||||||||
2.900%, 10/01/2030 | 175 | 141 | ||||||
Alexandria Real Estate Equities | ||||||||
3.375%, 08/15/2031 | 375 | 314 | ||||||
CoStar Group | ||||||||
2.800%, 07/15/2030 (A) | 625 | 504 | ||||||
Cushman & Wakefield US Borrower | ||||||||
8.875%, 09/01/2031 (A) | 300 | 290 | ||||||
Essex Portfolio | ||||||||
3.000%, 01/15/2030 | 400 | 332 | ||||||
Five Point Operating | ||||||||
7.875%, 11/15/2025 (A) | 260 | 245 | ||||||
Prologis | ||||||||
1.750%, 07/01/2030 | 300 | 233 | ||||||
Realty Income | ||||||||
4.875%, 06/01/2026 | 1,000 | 981 | ||||||
2.850%, 12/15/2032 | 375 | 293 | ||||||
Service Properties Trust | ||||||||
5.500%, 12/15/2027 | 500 | 427 | ||||||
Spirit Realty | ||||||||
3.200%, 01/15/2027 | 600 | 544 | ||||||
WP Carey | ||||||||
4.250%, 10/01/2026 | 700 | 668 | ||||||
| 4,972 | ||||||||
Utilities — 1.0% | ||||||||
Alliant Energy Finance | ||||||||
4.250%, 06/15/2028 (A) | 125 | 117 | ||||||
American Electric Power | ||||||||
2.300%, 03/01/2030 | 300 | 241 | ||||||
Berkshire Hathaway Energy | ||||||||
4.250%, 10/15/2050 | 175 | 130 | ||||||
Eskom Holdings SOC MTN | ||||||||
6.350%, 08/10/2028 | 500 | 454 | ||||||
NiSource | ||||||||
3.600%, 05/01/2030 | 50 | 44 | ||||||
Pike | ||||||||
5.500%, 09/01/2028 (A) | 983 | 860 | ||||||
Sempra | ||||||||
3.400%, 02/01/2028 | 1,075 | 978 | ||||||
Southern California Edison | ||||||||
4.200%, 03/01/2029 | 450 | 419 | ||||||
Description | Face Amount | Market Value | ||||||
CORPORATE OBLIGATIONS (continued) | ||||||||
Sunnova Energy | ||||||||
11.750%, 10/01/2028 (A) | $ | 360 | $ | 347 | ||||
5.875%, 09/01/2026 (A) | 560 | 480 | ||||||
TransAlta | ||||||||
7.750%, 11/15/2029 | 270 | 273 | ||||||
6.500%, 03/15/2040 | 980 | 919 | ||||||
Vistra Operations | ||||||||
3.550%, 07/15/2024 (A) | 1,200 | 1,170 | ||||||
| 6,432 | ||||||||
Total Corporate Obligations | ||||||||
(Cost $386,632) ($ Thousands) | 340,290 | |||||||
LOAN PARTICIPATIONS — 11.5% | ||||||||
1011778 B.C., Term Loan | ||||||||
7.566%, 09/23/2030 (D) | 420 | 418 | ||||||
19th Holdings Golf LLC, Initial Term Loan, 1st Lien | ||||||||
8.677%, CME Term SOFR + 3.000%, 02/07/2029 (B)(D) | 909 | 883 | ||||||
Acrisure, LLC, 1st Lien | ||||||||
11.121%, 02/15/2027 | 586 | 587 | ||||||
Acrisure, LLC, 2020 Term Loan, 1st Lien | ||||||||
8.931%, Syn LIBOR + 3.500%, 02/15/2027 (D) | 357 | 352 | ||||||
ADS Tactical Inc, Term Loan, 1st Lien | ||||||||
11.181%, 03/19/2026 (D) | 955 | 935 | ||||||
Adtalem Global, Term Loan, 1st Lien | ||||||||
9.431%, 08/12/2028 | 101 | 101 | ||||||
Agiliti Health, Term Loan, 1st Lien | ||||||||
8.247%, 05/01/2030 | 430 | 428 | ||||||
Allen Media LLC, Initial Term Loan, 1st Lien | ||||||||
11.040%, 02/10/2027 (D) | 956 | 848 | ||||||
Allied Universal Holdco LLC (f/k/a USAGM Holdco, LLC), Initial U.S. Dollar Term Loan, 1st Lien | ||||||||
9.166%, CME Term SOFR + 3.750%, 05/12/2028 (D)(G) | 665 | 642 | ||||||
Alterra Moutain Company, Series B-2 Term Loan, 1st Lien | ||||||||
8.931%, 08/17/2028 (D) | 523 | 521 | ||||||
Amentum Goverment Services Holdings LLC, Term Loan, 1st Lien | ||||||||
9.331%, 02/15/2029 (D) | 960 | 945 | ||||||
Amentum Government Services Holdings LLC, Initial Term Loan, 1st Lien | ||||||||
9.431%, CME Term SOFR + 3.500%, 01/29/2027 (D) | 354 | 351 | ||||||
SEI Institutional Managed Trust
305
SCHEDULE OF INVESTMENTS
September 30, 2023
Multi-Asset Income Fund (Continued)
Description | Face Amount | Market Value | ||||||
LOAN PARTICIPATIONS (continued) | ||||||||
Amentum Government Services Holdings LLC, Tranche 1 Term Loan, 1st Lien | ||||||||
9.431%, CME Term SOFR + 3.500%, 01/29/2027 (D) | $ | 178 | $ | 176 | ||||
Apollo Commercial Real Estate Finance, Inc., Term B-1 Loan, 1st Lien | ||||||||
8.931%, CME Term SOFR + 3.500%, 03/11/2028 (B)(D) | 319 | 304 | ||||||
Apollo Commercial Real Estate Finance, Inc., Term Loan, 1st Lien | ||||||||
8.181%, 05/15/2026 (D) | 19 | 19 | ||||||
Arcis Golf LLC, Initial Term Loan, 1st Lien | ||||||||
9.681%, 11/24/2028 | 690 | 689 | ||||||
Assured Partners, Term Loan | ||||||||
9.566%, 02/12/2027 (G) | 380 | 380 | ||||||
Asurion, LLC, New B-4 Term Loan, 2nd Lien | ||||||||
10.681%, 01/20/2029 (D) | 950 | 840 | ||||||
Asurion, LLC, New B-9 Term Loan, 1st Lien | ||||||||
8.681%, CME Term SOFR + 0.000%, 07/31/2027 (D) | 497 | 480 | ||||||
Athena Helath Group, Initial Term Loan | ||||||||
8.568%, 02/15/2029 (D) | 79 | 78 | ||||||
Autokiniton, Term Loan B, 1st Lien | ||||||||
9.931%, 04/06/2028 (D) | 215 | 210 | ||||||
Barnes Group, Initial Term Loan | ||||||||
8.416%, 09/03/2030 | 690 | 690 | ||||||
Brown Group Holdings, LLC, Initial Term Loan, 1st Lien | ||||||||
8.166%, CME Term SOFR + 2.750%, 06/07/2028 (D) | 974 | 964 | ||||||
Brown Group Holdings, LLC, Term Loan B-2 | ||||||||
9.173%, 07/02/2029 | 23 | 23 | ||||||
9.119%, 07/02/2029 (D) | 48 | 47 | ||||||
Caesars Entertainment, Term Loan, 1st Lien | ||||||||
8.666%, 02/06/2030 (D) | 219 | 219 | ||||||
Cardinal Parent, Inc., Initial Term Loan, 1st Lien | ||||||||
10.040%, CME Term SOFR + 4.500%, 11/12/2027 (D) | 997 | 886 | ||||||
Carnival Corporation, Intial Term Loan | ||||||||
8.327%, 08/08/2027 | 209 | 209 | ||||||
Chariot Buyer LLC, Initial Term Loan, 1st Lien | ||||||||
8.666%, 11/03/2028 (D) | 565 | 556 | ||||||
Cinemark USA, Term Loan | ||||||||
9.140%, 05/24/2030 | 502 | 501 | ||||||
9.066%, 05/24/2030 | 1,149 | 1,147 | ||||||
Citaldel Securities LP | ||||||||
7.931%, 07/29/2030 | 630 | 628 | ||||||
Clarios Global, Term Loan, 1st Lien | ||||||||
9.066%, 05/06/2030 (D) | 420 | 419 | ||||||
Description | Face Amount | Market Value | ||||||
LOAN PARTICIPATIONS (continued) | ||||||||
Clark Equipment Company, Term Loan B, 1st Lien | ||||||||
7.990%, 04/20/2029 (D) | $ | 87 | $ | 87 | ||||
Copeland, Term Loan, 1st Lien | ||||||||
8.316%, 05/31/2030 | 340 | 339 | ||||||
CPP, Term Loan, 2nd Lien | ||||||||
13.269%, 04/30/2026 | 370 | 309 | ||||||
CTC Holdings/Chicago Trading Company, Term Loan, 1st Lien | ||||||||
10.344%, 02/20/2029 (D) | 482 | 473 | ||||||
DCert Buyer, Inc., First Amendment Refinancing Loan, 2nd Lien | ||||||||
12.316%, CME Term SOFR + 7.000%, 02/19/2029 (D) | 2,190 | 2,040 | ||||||
DCert Buyer, Inc., Initial Term Loan, 1st Lien | ||||||||
9.316%, CME Term SOFR + 4.000%, 10/16/2026 (D) | 865 | 858 | ||||||
Deerfield Dakota Holding, Llc 4/7/2028 2021 Replacement Term Loan, 2nd Lien | ||||||||
12.402%, 04/07/2028 (D) | 300 | 282 | ||||||
Deerfield Dakota Holding, LLC, Initial Dollar Term Loan, 1st Lien | ||||||||
9.140%, CME Term SOFR + 3.750%, 04/09/2027 (D) | 242 | 236 | ||||||
DIRECTV Financing, LLC, Closing Date Term Loan, 1st Lien | ||||||||
10.431%, CME Term SOFR + 5.000%, 08/02/2027 (D) | 779 | 760 | ||||||
Dominion Diamond, 1st Lien | ||||||||
10.000%, 06/30/2026 (B) | 814 | 814 | ||||||
Donnelley Financial, Term Loan, 1st Lien | ||||||||
12.666%, 03/17/2028 | 655 | 653 | ||||||
Empire Today, Term Loan, 1st Lien | ||||||||
10.439%, 04/03/2028 (D) | 150 | 122 | ||||||
Energize Holdco LLC, Initial Term Loan, 1st Lien | ||||||||
9.181%, 12/08/2028 (D) | 788 | 777 | ||||||
Energize Holdco LLC, Initial Term Loan, 2nd Lien | ||||||||
12.181%, 12/07/2029 | 425 | 397 | ||||||
Engineered Machinery Holdings, Inc., Incremental Amendment No. 4 Term Loan, 1st Lien | ||||||||
7.722%, EURIBOR + 3.750%, 05/19/2028 (D) | 319 | 335 | ||||||
Engineered Machinery Holdings, Inc., Incremental Amendment No. 5 Term Loan, 1st Lien | ||||||||
9.152%, 05/19/2028 | 711 | 706 | ||||||
Entercom Media Corp., Term B-2 Loan, 1st Lien | ||||||||
8.131%, CME Term SOFR + 2.500%, 11/18/2024 (D) | 1,140 | 484 | ||||||
306
SEI Institutional Managed Trust
Description | Face Amount | Market Value | ||||||
LOAN PARTICIPATIONS (continued) | ||||||||
Equinox Holdings Inc., Incremental Term B-2 Loan, 1st Lien | ||||||||
14.731%, 03/08/2024 (D) | $ | 242 | $ | 234 | ||||
EyeCare Partners, LLC, Term Loan, 1st Lien | ||||||||
9.181%, CME Term SOFR + 3.750%, 02/18/2027 (D) | 744 | 519 | ||||||
EyeCare Partners, Term Loan, 1st Lien | ||||||||
9.181%, 11/15/2028 | 453 | 311 | ||||||
EyeCare Partners, Term Loan, 2nd Lien | ||||||||
12.181%, 11/15/2029 | 430 | 224 | ||||||
Fanatics Commercial, Term Loan, 1st Lien | ||||||||
8.828%, 11/24/2028 | 707 | 705 | ||||||
First Brand Group, Term Loan, 2nd Lien | ||||||||
14.381%, 03/30/2028 | 1,410 | 1,323 | ||||||
First Brands Group, LLC, 2021 Term Loan, 1st Lien | ||||||||
10.881%, CME Term SOFR + 5.000%, 03/30/2027 (D) | 538 | 530 | ||||||
First Brands Group, LLC, Term Loan, 1st Lien | ||||||||
10.881%, 03/30/2027 | 542 | 534 | ||||||
Focus Financial, Term Loan, 1st Lien | ||||||||
8.566%, 06/30/2028 | 565 | 563 | ||||||
7.816%, 06/30/2028 | 528 | 526 | ||||||
Froneri International Limited, Facility B1, 1st Lien | ||||||||
6.097%, Euribor + 2.375%, 01/29/2027 (D) | 330 | 343 | ||||||
Gainwell Acquisition Corp., Term B Loan, 1st Lien | ||||||||
9.490%, CME Term SOFR + 4.000%, 10/01/2027 (D) | 1,945 | 1,895 | ||||||
Garda Security, Term Loan, 1st Lien | ||||||||
9.646%, 02/01/2029 | 475 | 473 | ||||||
Garda World Security Corp | ||||||||
9.746%, CME Term SOFR + 4.250%, 10/30/2026 (D) | 679 | 677 | ||||||
Garret Motion S.A.R.L., Term Loan, 1st Lien | ||||||||
10.131%, 04/30/2028 | 286 | 286 | ||||||
9.869%, 04/30/2028 | 429 | 428 | ||||||
GEO Group, Term Loan, 1st Lien | ||||||||
12.441%, 03/23/2027 | 403 | 410 | ||||||
Getty Images, Inc., Initial Dollar Term Loan, 1st Lien | ||||||||
9.990%, CME Term SOFR + 4.500%, 02/19/2026 (D) | 354 | 354 | ||||||
Global Medical Response, Inc., 2021 Refinancing Term Loan, 1st Lien | ||||||||
9.780%, CME Term SOFR + 4.250%, 10/02/2025 (D) | 660 | 458 | ||||||
Global Tel*Link Corporation, Term Loan, 1st Lien | ||||||||
9.769%, CME Term SOFR + 0.040%, 11/29/2025 (D) | 415 | 402 | ||||||
Description | Face Amount | Market Value | ||||||
LOAN PARTICIPATIONS (continued) | ||||||||
Great Outdoors Group, LLC, Term B-2 Loan, 1st Lien | ||||||||
9.181%, 03/06/2028 (D) | $ | 787 | $ | 784 | ||||
Greystone Select, Term Loan, 1st Lien | ||||||||
10.582%, 06/16/2028 (D) | 281 | 277 | ||||||
Grinding Media, Inc., Term Loan B, 1st Lien | ||||||||
9.530%, 10/12/2028 (D) | 931 | 922 | ||||||
GTCR W Merger Sub LLC | ||||||||
0.000%, 09/20/2030 (G)(H) | 320 | 320 | ||||||
Harbor Freight Tools USA, Inc | ||||||||
8.181%, 10/19/2027 | 878 | 870 | ||||||
Hayward Industries, 1st Lien | ||||||||
8.666%, 05/30/2028 | 267 | 265 | ||||||
Hudson River Trading, LLC, Term Loan, 1st Lien | ||||||||
8.631%, CME Term SOFR + 3.000%, 03/20/2028 (D) | 1,015 | 1,008 | ||||||
Hunter Douglas, Term Loan | ||||||||
8.891%, 02/26/2029 | 233 | 227 | ||||||
Hunter Douglas, Term Loan, 1st Lien | ||||||||
8.891%, 02/26/2029 (D) | 636 | 618 | ||||||
Hyperion Insurance, Term Loan, 1st Lien | ||||||||
9.316%, 04/18/2030 | 119 | 119 | ||||||
Icebox Holdco III, Inc., Initial Term Loan, 1st Lien | ||||||||
9.402%, 12/22/2028 | 766 | 760 | ||||||
Icebox Holdco III, Inc., Initial Term Loan, 2nd Lien | ||||||||
12.402%, 12/21/2029 | 225 | 202 | ||||||
Intelsat Jackson Holdings S.A., Term B Loan, 1st Lien | ||||||||
9.772%, CME Term SOFR + 4.250%, 02/01/2029 (D) | 976 | 973 | ||||||
Jane Street Group, LLC, Dollar Term Loan, 1st Lien | ||||||||
8.181%, CME Term SOFR + 2.750%, 01/26/2028 (D) | 1,019 | 1,015 | ||||||
Jazz Pharmaceuticals Public Limited Company, Initial Dollar Term Loan, 1st Lien | ||||||||
8.931%, CME Term SOFR + 3.500%, 05/05/2028 (D) | 705 | 704 | ||||||
Jump Financial, LLC, Term Loan, 1st Lien | ||||||||
10.152%, CME Term SOFR + 4.500%, 08/07/2028 (D) | 1,872 | 1,774 | ||||||
Knight Health Holdings, Term Loan, 1st Lien | ||||||||
10.681%, 12/23/2028 | 639 | 149 | ||||||
LABL, Inc., Initial Dollar Term Loan, 1st Lien | ||||||||
10.416%, CME Term SOFR + 5.000%, 10/29/2028 (D) | 639 | 636 | ||||||
Learfield, Term Loan, 1st Lien | ||||||||
0.000%, 12/31/2027 (G)(H) | 450 | 367 | ||||||
SEI Institutional Managed Trust
307
SCHEDULE OF INVESTMENTS
September 30, 2023
Multi-Asset Income Fund (Continued)
Description | Face Amount | Market Value | ||||||
LOAN PARTICIPATIONS (continued) | ||||||||
Lids Holdings, Term Loan | ||||||||
11.060%, 12/14/2026 (B) | $ | 844 | $ | 806 | ||||
Loyalty Ventures Inc., Term B Loan, 1st Lien | ||||||||
13.750%, 11/03/2027 | 829 | 4 | ||||||
LRS Holdings, LLC, Intial Term Loan, 1st Lien | ||||||||
9.681%, 08/31/2028 | 658 | 645 | ||||||
Magenta Buyer LLC, Initial Term Loan, 1st Lien | ||||||||
10.631%, CME Term SOFR + 5.000%, 07/27/2028 (D)(G) | 446 | 330 | ||||||
Medline Borrower, LP, Initial Dollar Term Loan, 1st Lien | ||||||||
8.681%, CME Term SOFR + 3.250%, 10/23/2028 (D) | 936 | 933 | ||||||
Mercury Borrower, Inc., Initial Term Loan, 1st Lien | ||||||||
8.931%, 08/02/2028 (D) | 709 | 700 | ||||||
MPH Acquisition Holdings LLC, Initial Term Loan, 1st Lien | ||||||||
9.916%, CME Term SOFR + 4.250%, 09/01/2028 (D) | 460 | 432 | ||||||
MRI Software, Term Loan, 1st Lien | ||||||||
10.990%, 02/10/2026 | 537 | 523 | ||||||
NCL Corp, Term Loan, 1st Lien | ||||||||
7.666%, 01/02/2025 | 1,056 | 1,043 | ||||||
Neptune Bidco, Term Loan, 1st Lien | ||||||||
10.149%, 10/11/2028 | 788 | 703 | ||||||
Osaic Holdings, Inc., Term B-2 Loan, 1st Lien | ||||||||
9.816%, 08/17/2028 | 400 | 399 | ||||||
Pacific Bells, LLC, Initial Term Loan, 1st Lien | ||||||||
10.152%, 11/10/2028 | 255 | 252 | ||||||
PDS HoldCo Inc., Delayed Draw Term Loan, 1st Lien | ||||||||
10.184%, 08/18/2028 | 472 | 384 | ||||||
PECF USS Intermediate Holding III Corporation, Initial Term Loan, 1st Lien | ||||||||
9.881%, 12/15/2028 | 560 | 447 | ||||||
Peraton Corp., Term B Loan, 1st Lien | ||||||||
9.166%, CME Term SOFR + 3.750%, 02/01/2028 (D) | 1,113 | 1,110 | ||||||
Peraton Corp., Term B-1 Loan, 2nd Lien | ||||||||
12.979%, CME Term SOFR + 7.750%, 02/01/2029 (D) | 580 | 566 | ||||||
Phoenix Guarantor Inc., Tranche B-1 Term Loan, 1st Lien | ||||||||
8.681%, CME Term SOFR + 3.250%, 03/05/2026 (D) | 41 | 41 | ||||||
Planview Parent, Inc., Closing Date Term Loan, 1st Lien | ||||||||
9.652%, CME Term SOFR + 4.000%, 12/17/2027 (D)(G) | 725 | 714 | ||||||
Description | Face Amount | Market Value | ||||||
LOAN PARTICIPATIONS (continued) | ||||||||
Polyconcept, Term Loan, 1st Lien | ||||||||
10.816%, 05/18/2029 | $ | 663 | $ | 636 | ||||
Precision Medicine Group, LLC, Amendment No. 1 Refinancing Term Loan, 1st Lien | ||||||||
8.490%, CME Term SOFR + 3.000%, 11/18/2027 (D) | 740 | 730 | ||||||
Project Sky, Term Loan, 1st Lien | ||||||||
11.416%, 10/08/2029 (D) | 140 | 133 | ||||||
9.166%, 10/08/2028 (D) | 758 | 743 | ||||||
Quikrete Holdings, Inc., Term Loan, 1st Lien | ||||||||
8.181%, 03/19/2029 | 660 | 660 | ||||||
Redstone Holdco, Term Loan, 1st Lien | ||||||||
10.184%, CME Term SOFR + 4.750%, 04/27/2028 (D) | 514 | 438 | ||||||
Regionalcare Hospital Partners Holdings, Inc., Term B Loan, 1st Lien | ||||||||
9.377%, CME Term SOFR + 3.750%, 11/16/2025 (D) | 460 | 458 | ||||||
RegionalCare/Lifepoint Health, Term Loan, 1st Lien | ||||||||
0.000%, 11/16/2028 (G)(H) | 550 | 534 | ||||||
Resolute Investment Managers, Inc., Tranche C Term Loan, 1st Lien | ||||||||
9.790%, 04/30/2024 (G) | 288 | 177 | ||||||
Royal Caribbean Cruises, Term Loan, 1st Lien | ||||||||
13.881%, 07/27/2029 | 900 | 414 | ||||||
Sedgewick CMS, Term Loan, 1st Lien | ||||||||
9.066%, 02/24/2028 | 479 | 478 | ||||||
Sigma Holdco | ||||||||
8.210%, 07/02/2025 (G) | 1 | 1 | ||||||
Signature Aviation/BBA Aviation, Term Loan, 1st Lien | ||||||||
9.066%, 07/02/2029 | 19 | 19 | ||||||
SkyMiles IP Ltd. (Delta Air Lines, Inc.), Initial Term Loan, 1st Lien | ||||||||
9.076%, CME Term SOFR + 3.750%, 10/20/2027 (D) | 408 | 422 | ||||||
Smyrna Ready Mix Concrete, LLC, Initial Term Loan, 1st Lien | ||||||||
9.666%, CME Term SOFR + 4.250%, 04/02/2029 (D) | 546 | 547 | ||||||
Sotera Health, Term Loan, 1st Lien | ||||||||
9.074%, 12/11/2026 | 439 | 439 | ||||||
Spencer Gifts LLC (Spirit Halloween Superstores LLC), Term Loan, 1st Lien | ||||||||
11.416%, 06/19/2026 | 574 | 569 | ||||||
SPX Flow, Inc., Term Loan, 1st Lien | ||||||||
9.916%, CME Term SOFR + 4.500%, 04/05/2029 (D) | 767 | 764 | ||||||
Thermostat Purchaser III, Inc., Initial Term Loan, 1st Lien | ||||||||
10.073%, 08/31/2028 | 291 | 289 | ||||||
308
SEI Institutional Managed Trust
Description | Face Amount | Market Value | ||||||
LOAN PARTICIPATIONS (continued) | ||||||||
Topgolf, Term Loan, 1st Lien | ||||||||
8.916%, 03/15/2030 | $ | 418 | $ | 415 | ||||
Triton Water Holdings, Inc., Initial Term Loan, 1st Lien | ||||||||
8.902%, CME Term SOFR + 3.500%, 03/31/2028 (D) | 772 | 752 | ||||||
UFC Holdings, Term Loan, 1st Lien | ||||||||
8.369%, 04/29/2026 | 336 | 336 | ||||||
Ultimus Group Midco LLC, The, Initial Term Loan, 1st Lien | ||||||||
9.219%, CME Term SOFR + 3.750%, 05/04/2026 (D) | 241 | 240 | ||||||
United AirLines, Inc., Class B Term Loan, 1st Lien | ||||||||
9.182%, CME Term SOFR + 0.000%, 04/21/2028 (D) | 232 | 232 | ||||||
Universal Servies, Term Loan, 1st Lien | ||||||||
10.066%, 05/12/2028 | 320 | 315 | ||||||
UST Holdings, Term Loan, 1st Lien | ||||||||
8.946%, 11/20/2028 | 481 | 472 | ||||||
Verscend Holding Corp., Term B-1 Loan, 1st Lien | ||||||||
9.431%, CME Term SOFR + 4.000%, 08/27/2025 (D) | 1,045 | 1,044 | ||||||
Vertex Aerospace Services Corp., Initial Term Loan, 1st Lien | ||||||||
8.916%, CME Term SOFR + 4.000%, 12/06/2028 (D) | 765 | 765 | ||||||
Virgin Media Bristol LLC, N Facility, 1st Lien | ||||||||
7.947%, CME Term SOFR + 2.500%, 01/31/2028 (D) | 1,275 | 1,237 | ||||||
Virtusa, Term Loan | ||||||||
9.331%, 02/11/2028 | 910 | 903 | ||||||
WP CPP Holdings, Term B Loan | ||||||||
9.270%, CME Term SOFR + 3.750%, 04/30/2025 (D) | 501 | 470 | ||||||
Wwex Uni TopCo Holdings LLC, Initial Term Loan, 1st Lien | ||||||||
9.652%, 07/26/2028 (D) | 747 | 733 | ||||||
Total Loan Participations | ||||||||
(Cost $80,020) ($ Thousands) | 75,730 | |||||||
SOVEREIGN DEBT — 8.8% | ||||||||
Abu Dhabi Government International Bond MTN | ||||||||
3.875%, 04/16/2050(A) | 1,630 | 1,220 | ||||||
Adani Ports & Special Economic Zone | ||||||||
4.000%, 07/30/2027 | 910 | 767 | ||||||
3.375%, 07/24/2024 | 570 | 552 | ||||||
Description | Face Amount | Market Value | ||||||
SOVEREIGN DEBT (continued) | ||||||||
Angolan Government International Bond | ||||||||
9.375%, 05/08/2048 | $ | 200 | $ | 147 | ||||
9.125%, 11/26/2049(A) | 1,170 | 837 | ||||||
8.750%, 04/14/2032(A) | 210 | 168 | ||||||
8.000%, 11/26/2029(A) | 420 | 345 | ||||||
Argentine Republic Government International Bond | ||||||||
3.625%, 07/09/2024(F) | 1,316 | 324 | ||||||
3.500%, 07/09/2029(F) | 1,310 | 335 | ||||||
1.000%, 07/09/2029 | 262 | 73 | ||||||
0.750%, 07/09/2027(F) | 3,590 | 1,021 | ||||||
0.500%, 07/09/2029 | EUR | 6 | 1 | |||||
Azerbaijan Government International Bond | ||||||||
3.500%, 09/01/2032 | $ | 1,360 | 1,105 | |||||
Bahrain Government International Bond MTN | ||||||||
5.625%, 05/18/2034(A) | 940 | 803 | ||||||
Benin Government International Bond | ||||||||
4.875%, 01/19/2032(A) | EUR | 1,480 | 1,161 | |||||
Brazil Government International Bond | ||||||||
5.333%, 02/15/2028 | $ | 100 | 97 | |||||
Buenos Aires Government International Bond MTN | ||||||||
6.375%, 09/01/2024(A)(F) | 5,612 | 1,826 | ||||||
CBB International Sukuk Programme SPC | ||||||||
6.250%, 11/14/2024(A) | 300 | 300 | ||||||
Ciudad Autonoma De Buenos Aires | ||||||||
7.500%, 06/01/2027 | 280 | 256 | ||||||
Colombia Government International Bond | ||||||||
4.125%, 05/15/2051 | 630 | 351 | ||||||
3.125%, 04/15/2031 | 730 | 539 | ||||||
3.000%, 01/30/2030 | 730 | 559 | ||||||
Cordoba Government International Bond | ||||||||
6.990%, 06/01/2027(A)(F) | 526 | 391 | ||||||
Country Garden Holdings | ||||||||
8.000%, 01/27/2024 | 200 | 18 | ||||||
Dominican Republic International Bond | ||||||||
7.450%, 04/30/2044 | 600 | 547 | ||||||
6.850%, 01/27/2045 | 660 | 560 | ||||||
6.500%, 02/15/2048(A) | 1,270 | 1,025 | ||||||
6.400%, 06/05/2049(A) | 660 | 522 | ||||||
5.500%, 02/22/2029(A) | 240 | 219 | ||||||
4.875%, 09/23/2032 | 460 | 373 | ||||||
4.500%, 01/30/2030 | 550 | 466 | ||||||
Ecuador Government International Bond | ||||||||
6.000%, 07/31/2024(A)(F) | 352 | 179 | ||||||
2.500%, 07/31/2024(A)(F) | 1,128 | 367 | ||||||
0.000%, 07/31/2030(A)(I) | 329 | 98 | ||||||
Egypt Government International Bond | ||||||||
8.875%, 05/29/2050(A) | 710 | 383 | ||||||
8.700%, 03/01/2049(A) | 520 | 277 | ||||||
8.500%, 01/31/2047 | 450 | 239 | ||||||
SEI Institutional Managed Trust
309
SCHEDULE OF INVESTMENTS
September 30, 2023
Multi-Asset Income Fund (Continued)
Description | Face Amount | Market Value | ||||||
SOVEREIGN DEBT (continued) | ||||||||
7.903%, 02/21/2048(A) | $ | 360 | $ | 184 | ||||
5.800%, 09/30/2027 | 990 | 650 | ||||||
4.750%, 04/16/2026(A) | EUR | 100 | 74 | |||||
Gabon Government International Bond | ||||||||
7.000%, 11/24/2031(A) | $ | 350 | 259 | |||||
Gatwick Airport Finance | ||||||||
4.375%, 04/07/2026 | GBP | 660 | 746 | |||||
Guatemala Government Bond | ||||||||
6.125%, 06/01/2050(A) | $ | 530 | 456 | |||||
4.900%, 06/01/2030(A) | 280 | 254 | ||||||
4.875%, 02/13/2028 | 790 | 732 | ||||||
4.500%, 05/03/2026(A) | 770 | 729 | ||||||
4.375%, 06/05/2027(A) | 790 | 728 | ||||||
Indonesia Government International Bond | ||||||||
7.000%, 05/15/2027 | IDR | 24,044,000 | 1,576 | |||||
3.850%, 10/15/2030 | $ | 200 | 179 | |||||
2.850%, 02/14/2030 | 900 | 765 | ||||||
1.100%, 03/12/2033 | EUR | 400 | 305 | |||||
0.900%, 02/14/2027 | 180 | 169 | ||||||
Inter-American Development Bank MTN | ||||||||
7.350%, 10/06/2030 | INR | 114,000 | 1,361 | |||||
Iraq Government International Bond | ||||||||
5.800%, 01/15/2028 | $ | 158 | 145 | |||||
Ivory Coast Government International Bond | ||||||||
6.625%, 03/22/2048 | EUR | 420 | 305 | |||||
6.125%, 06/15/2033 | $ | 450 | 372 | |||||
5.250%, 03/22/2030 | EUR | 390 | 345 | |||||
4.875%, 01/30/2032(A) | 1,660 | 1,336 | ||||||
Jamaica Government International Bond | ||||||||
7.875%, 07/28/2045 | $ | 740 | 814 | |||||
Jordan Government International Bond | ||||||||
7.750%, 01/15/2028(A) | 500 | 498 | ||||||
Kenya Government International Bond | ||||||||
8.250%, 02/28/2048(A) | 260 | 177 | ||||||
Lebanon Government International Bond | ||||||||
8.250%, 05/17/2034(C) | 30 | 3 | ||||||
8.200%, 05/17/2033(C) | 40 | 3 | ||||||
7.150%, 11/20/2031(C) | 40 | 3 | ||||||
7.050%, 11/02/2035(C) | 100 | 8 | ||||||
7.000%, 03/20/2028(C) | 40 | 3 | ||||||
6.850%, 03/23/2027(C) | 100 | 8 | ||||||
6.850%, 05/25/2029(C) | 721 | 57 | ||||||
6.750%, 11/29/2027(C) | 410 | 33 | ||||||
6.650%, 04/22/2024(C) | 170 | 14 | ||||||
6.650%, 11/03/2028(C) | 80 | 6 | ||||||
6.650%, 02/26/2030(C) | 832 | 66 | ||||||
6.600%, 11/27/2026(C) | 30 | 2 | ||||||
6.200%, 02/26/2025(C) | 860 | 68 | ||||||
Mexican Bonos | ||||||||
5.750%, 03/05/2026 | MXN | 14,530 | 750 | |||||
Mexico Government International Bond | ||||||||
3.771%, 05/24/2061 | $ | 520 | 305 | |||||
Description | Face Amount | Market Value | ||||||
SOVEREIGN DEBT (continued) | ||||||||
2.659%, 05/24/2031 | $ | 920 | $ | 726 | ||||
Morocco Government International Bond | ||||||||
3.000%, 12/15/2032(A) | 730 | 555 | ||||||
1.500%, 11/27/2031(A) | EUR | 290 | 224 | |||||
Mozambique International Bond | ||||||||
9.000%, 09/15/2031(F) | $ | 220 | 172 | |||||
Nigeria Government International Bond | ||||||||
8.747%, 01/21/2031 | 1,720 | 1,447 | ||||||
7.696%, 02/23/2038(A) | 690 | 482 | ||||||
Oman Government International Bond | ||||||||
6.750%, 01/17/2048 | 200 | 184 | ||||||
6.250%, 01/25/2031(A) | 1,600 | 1,578 | ||||||
Pakistan Government International Bond | ||||||||
6.875%, 12/05/2027 | 200 | 102 | ||||||
6.000%, 04/08/2026(A) | 540 | 278 | ||||||
Pakistan Water & Power Development Authority | ||||||||
7.500%, 06/04/2031 | 420 | 183 | ||||||
Panama Government International Bond | ||||||||
4.500%, 04/01/2056 | 300 | 197 | ||||||
Papua New Guinea Government International Bond | ||||||||
8.375%, 10/04/2028(A) | 290 | 270 | ||||||
Paraguay Government International Bond | ||||||||
6.100%, 08/11/2044 | 500 | 439 | ||||||
5.600%, 03/13/2048 | 760 | 613 | ||||||
5.400%, 03/30/2050(A) | 320 | 252 | ||||||
Perusahaan Penerbit SBSN Indonesia III | ||||||||
4.550%, 03/29/2026(A) | 530 | 519 | ||||||
4.450%, 02/20/2029(A) | 330 | 315 | ||||||
Qatar Government International Bond | ||||||||
5.103%, 04/23/2048(A) | 820 | 742 | ||||||
4.817%, 03/14/2049(A) | 690 | 598 | ||||||
4.625%, 06/02/2046 | 280 | 242 | ||||||
4.400%, 04/16/2050(A) | 450 | 366 | ||||||
3.750%, 04/16/2030(A) | 200 | 187 | ||||||
Romanian Government International Bond | ||||||||
5.125%, 06/15/2048(A) | 200 | 156 | ||||||
3.375%, 01/28/2050 | EUR | 230 | 143 | |||||
2.875%, 05/26/2028 | 650 | 615 | ||||||
2.875%, 03/11/2029 | 1,490 | 1,380 | ||||||
2.124%, 07/16/2031(A) | 250 | 196 | ||||||
2.000%, 12/08/2026(A) | 590 | 570 | ||||||
2.000%, 01/28/2032(A) | 110 | 84 | ||||||
2.000%, 04/14/2033(A) | 900 | 654 | ||||||
Saudi Government International Bond MTN | ||||||||
4.500%, 04/22/2060(A) | $ | 1,070 | 821 | |||||
3.750%, 01/21/2055(A) | 220 | 146 | ||||||
3.250%, 10/22/2030(A) | 430 | 376 | ||||||
Serbia Government International Bond | ||||||||
1.500%, 06/26/2029(A) | EUR | 500 | 407 | |||||
310
SEI Institutional Managed Trust
Description | Face Amount | Market Value | ||||||
SOVEREIGN DEBT (continued) | ||||||||
South Africa Government International Bond | ||||||||
5.650%, 09/27/2047 | $ | 950 | $ | 630 | ||||
4.850%, 09/27/2027 | 890 | 821 | ||||||
4.300%, 10/12/2028 | 200 | 173 | ||||||
Sri Lanka Government International Bond | ||||||||
7.550%, 03/28/2030(A)(C) | 910 | 419 | ||||||
6.850%, 03/14/2024(A)(C) | 200 | 95 | ||||||
6.850%, 11/03/2025(C) | 570 | 271 | ||||||
6.825%, 07/18/2026(A)(C) | 250 | 119 | ||||||
6.750%, 04/18/2028(A)(C) | 360 | 167 | ||||||
Turkey Government International Bond | ||||||||
7.625%, 04/26/2029 | 560 | 537 | ||||||
6.875%, 03/17/2036 | 60 | 51 | ||||||
6.500%, 09/20/2033 | 900 | 769 | ||||||
6.000%, 03/25/2027 | 320 | 298 | ||||||
6.000%, 01/14/2041 | 1,980 | 1,459 | ||||||
4.250%, 04/14/2026 | 530 | 484 | ||||||
Ukraine Government International Bond | ||||||||
9.750%, 11/01/2030(A)(C) | 640 | 186 | ||||||
8.994%, 02/01/2026(C) | 280 | 88 | ||||||
7.750%, 09/01/2025(C) | 910 | 297 | ||||||
7.750%, 09/01/2026(C) | 230 | 68 | ||||||
7.750%, 09/01/2029(C) | 250 | 71 | ||||||
7.375%, 09/25/2034(A)(C) | 200 | 53 | ||||||
7.253%, 03/15/2035(A)(C) | 420 | 109 | ||||||
Uzbekistan Government International Bond MTN | ||||||||
4.750%, 02/20/2024(A) | 340 | 335 | ||||||
3.700%, 11/25/2030(A) | 660 | 515 | ||||||
Virgin Money UK | ||||||||
9.250%, GUKG5 + 8.307%, 06/08/2172(D)(E) | GBP | 300 | 356 | |||||
Zambia Government International Bond | ||||||||
5.375%, 09/20/2022(C) | $ | 760 | 373 | |||||
Total Sovereign Debt | ||||||||
(Cost $77,551) ($ Thousands) | 57,902 | |||||||
MORTGAGE-BACKED SECURITIES — 7.5% | ||||||||
Agency Mortgage-Backed Obligations — 0.9% | ||||||||
FHLMC | ||||||||
6.000%, 12/01/2052 | 89 | 89 | ||||||
FHLMC REMIC CMO, Ser 2020-5012, Cl DI, IO | ||||||||
4.000%, 09/25/2050 | 541 | 105 | ||||||
FHLMC REMIC CMO, Ser 2020-5020, Cl IH, IO | ||||||||
3.000%, 08/25/2050 | 472 | 77 | ||||||
Description | Face Amount | Market Value | ||||||
MORTGAGE-BACKED SECURITIES (continued) | ||||||||
FHLMC STACR REMIC Trust, Ser 2020-DNA3, Cl B1 | ||||||||
10.529%, SOFR30A + 5.214%, 06/25/2050(A)(D) | $ | 1,140 | $ | 1,234 | ||||
FHLMC STACR REMIC Trust, Ser 2020-DNA5, Cl B1 | ||||||||
10.115%, SOFR30A + 4.800%, 10/25/2050(A)(D) | 210 | 228 | ||||||
FHLMC STACR REMIC Trust, Ser 2020-DNA6, Cl B1 | ||||||||
8.315%, SOFR30A + 3.000%, 12/25/2050(A)(D) | 630 | 619 | ||||||
FHLMC STACR REMIC Trust, Ser 2021-DNA1, Cl M2 | ||||||||
7.115%, SOFR30A + 1.800%, 01/25/2051(A)(D) | 132 | 131 | ||||||
FHLMC STACR REMIC Trust, Ser 2021-DNA3, Cl B1 | ||||||||
8.815%, SOFR30A + 3.500%, 10/25/2033(A)(D) | 390 | 403 | ||||||
FHLMC STACR REMIC Trust, Ser 2021-DNA5, Cl B1 | ||||||||
8.365%, SOFR30A + 3.050%, 01/25/2034(A)(D) | 590 | 591 | ||||||
FHLMC STACR REMIC Trust, Ser 2022-DNA4, Cl M1A | ||||||||
7.515%, SOFR30A + 2.200%, 05/25/2042(A)(D) | 560 | 565 | ||||||
FNMA | ||||||||
2.789%, 01/01/2035(D) | 342 | 277 | ||||||
FNMA REMIC CMO, Ser 2015-30, Cl SJ, IO | ||||||||
0.171%, 05/25/2045(D) | 1,261 | 68 | ||||||
FNMA REMIC CMO, Ser 2017-104, Cl SB, IO | ||||||||
0.721%, 01/25/2048(D) | 870 | 73 | ||||||
FNMA REMIC CMO, Ser 2020-60, Cl NI, IO | ||||||||
4.000%, 09/25/2050 | 502 | 99 | ||||||
FNMA REMIC CMO, Ser 2020-62, Cl GI, IO | ||||||||
4.000%, 06/25/2048 | 964 | 186 | ||||||
GNMA REMIC CMO, Ser 2010-9, Cl XD, IO | ||||||||
1.155%, 01/16/2040(D) | 982 | 89 | ||||||
GNMA REMIC CMO, Ser 2013-124, Cl CS, IO | ||||||||
0.611%, 08/20/2043(D) | 105 | 9 | ||||||
GNMA REMIC CMO, Ser 2015-111, Cl IM, IO | ||||||||
4.000%, 08/20/2045 | 1,210 | 192 | ||||||
GNMA REMIC CMO, Ser 2016-109, Cl IH, IO | ||||||||
4.000%, 10/20/2045 | 683 | 113 | ||||||
GNMA REMIC CMO, Ser 2016-27, Cl IA, IO | ||||||||
4.000%, 06/20/2045 | 265 | 32 | ||||||
GNMA REMIC CMO, Ser 2017-112, Cl SJ, IO | ||||||||
0.221%, 07/20/2047(D) | 1,033 | 60 | ||||||
GNMA REMIC CMO, Ser 2018-122, Cl HS, IO | ||||||||
0.761%, 09/20/2048(D) | 290 | 28 | ||||||
SEI Institutional Managed Trust
311
SCHEDULE OF INVESTMENTS
September 30, 2023
Multi-Asset Income Fund (Continued)
Description | Face Amount | Market Value | ||||||
MORTGAGE-BACKED SECURITIES (continued) | ||||||||
GNMA REMIC CMO, Ser 2018-122, Cl SE, IO | ||||||||
0.761%, 09/20/2048(D) | $ | 396 | $ | 32 | ||||
GNMA REMIC CMO, Ser 2018-124, Cl SN, IO | ||||||||
0.761%, 09/20/2048(D) | 1,341 | 112 | ||||||
GNMA REMIC CMO, Ser 2018-67, Cl PS, IO | ||||||||
0.761%, 05/20/2048(D) | 1,269 | 100 | ||||||
GNMA REMIC CMO, Ser 2018-7, Cl DS, IO | ||||||||
0.261%, 01/20/2048(D) | 821 | 57 | ||||||
GNMA REMIC CMO, Ser 2019-1, Cl SN, IO | ||||||||
0.611%, 01/20/2049(D) | 211 | 15 | ||||||
GNMA REMIC CMO, Ser 2019-110, Cl SE, IO | ||||||||
0.661%, 09/20/2049(D) | 778 | 52 | ||||||
GNMA REMIC CMO, Ser 2019-110, Cl SD, IO | ||||||||
0.661%, 09/20/2049(D) | 592 | 44 | ||||||
GNMA REMIC CMO, Ser 2019-151, Cl NI, IO | ||||||||
3.500%, 10/20/2049 | 1,886 | 304 | ||||||
GNMA REMIC CMO, Ser 2019-6, Cl SA, IO | ||||||||
0.611%, 01/20/2049(D) | 165 | 12 | ||||||
GNMA REMIC CMO, Ser 2019-78, Cl SE, IO | ||||||||
0.661%, 06/20/2049(D) | 129 | 10 | ||||||
GNMA REMIC CMO, Ser 2020-78, Cl DI, IO | ||||||||
4.000%, 06/20/2050 | 704 | 134 | ||||||
| 6,140 | ||||||||
Non-Agency Mortgage-Backed Obligations — 6.6% | ||||||||
ACE Securities Home Equity Loan Trust, Ser 2004-HE3, Cl M1 | ||||||||
6.364%, TSFR1M + 1.044%, 11/25/2034(D) | 308 | 301 | ||||||
Alternative Loan Trust, Ser 2005-81, Cl A1 | ||||||||
5.994%, TSFR1M + 0.674%, 02/25/2037(D) | 443 | 357 | ||||||
BANK, Ser 2022-BNK44, Cl D | ||||||||
4.000%, 11/15/2032(A)(D) | 600 | 333 | ||||||
BANK, Ser 2023-BNK46, Cl XA, IO | ||||||||
0.749%, 08/15/2056(D) | 3,410 | 138 | ||||||
Barclays Commercial Mortgage Trust, Ser 2019-C5, Cl A4 | ||||||||
3.063%, 11/15/2052 | 870 | 743 | ||||||
Benchmark Mortgage Trust, Ser 2019-B10, Cl A2 | ||||||||
3.614%, 03/15/2062 | 146 | 144 | ||||||
Benchmark Mortgage Trust, Ser 2019-B11, Cl XA, IO | ||||||||
1.152%, 05/15/2052(D) | 10,436 | 397 | ||||||
Benchmark Mortgage Trust, Ser 2023-V3, Cl D | ||||||||
4.000%, 07/15/2056(A) | 500 | 345 | ||||||
BIG Commercial Mortgage Trust, Ser 2022-BIG, Cl F | ||||||||
10.768%, TSFR1M + 5.436%, 02/15/2039(A)(D) | 480 | 455 | ||||||
Description | Face Amount | Market Value | ||||||
MORTGAGE-BACKED SECURITIES (continued) | ||||||||
BRAVO Residential Funding Trust, Ser 2022-R1, Cl A | ||||||||
3.125%, 01/29/2070(A)(F) | $ | 647 | $ | 580 | ||||
BX Commercial Mortgage Trust, Ser 2019-IMC, Cl E | ||||||||
7.528%, TSFR1M + 2.196%, 04/15/2034(A)(D) | 1,970 | 1,930 | ||||||
BX Commercial Mortgage Trust, Ser 2021-XL2, Cl J | ||||||||
9.337%, TSFR1M + 4.004%, 10/15/2038(A)(D) | 391 | 369 | ||||||
BX Commercial Mortgage Trust, Ser 2023-VLT2, Cl E | ||||||||
11.203%, TSFR1M + 5.871%, 06/15/2040(A)(D) | 560 | 558 | ||||||
BX Trust, Ser 2021-SDMF, Cl F | ||||||||
7.384%, TSFR1M + 2.051%, 09/15/2034(A)(D) | 310 | 291 | ||||||
Capmark Military Housing Trust, Ser 2007-AET2, Cl A | ||||||||
6.063%, 10/10/2052(A) | 912 | 888 | ||||||
CFK Trust, Ser 2020-MF2, Cl E | ||||||||
3.573%, 03/15/2039(A)(D) | 500 | 380 | ||||||
CIM Trust, Ser 2023-R4, Cl A1 | ||||||||
5.000%, 05/25/2062(A)(D) | 542 | 523 | ||||||
Citigroup Commercial Mortgage Trust, Ser 2017-P8, Cl A3 | ||||||||
3.203%, 09/15/2050 | 770 | 698 | ||||||
Citigroup Mortgage Loan Trust, Ser 2022-A, Cl A1 | ||||||||
6.170%, 09/25/2062(A)(F) | 561 | 556 | ||||||
Connecticut Avenue Securities Trust, Ser 2018-R07, Cl 1B1 | ||||||||
9.779%, SOFR30A + 4.464%, 04/25/2031(A)(D) | 460 | 488 | ||||||
Connecticut Avenue Securities Trust, Ser 2019-R05, Cl 1B1 | ||||||||
9.529%, SOFR30A + 4.214%, 07/25/2039(A)(D) | 492 | 508 | ||||||
Connecticut Avenue Securities Trust, Ser 2021-R01, Cl 1B1 | ||||||||
8.415%, SOFR30A + 3.100%, 10/25/2041(A)(D) | 1,020 | 1,021 | ||||||
Connecticut Avenue Securities Trust, Ser 2021-R03, Cl 1B1 | ||||||||
8.065%, SOFR30A + 2.750%, 12/25/2041(A)(D) | 680 | 676 | ||||||
Connecticut Avenue Securities Trust, Ser 2022-R05, Cl 2B1 | ||||||||
9.815%, SOFR30A + 4.500%, 04/25/2042(A)(D) | 433 | 447 | ||||||
312
SEI Institutional Managed Trust
Description | Face Amount | Market Value | ||||||
MORTGAGE-BACKED SECURITIES (continued) | ||||||||
Connecticut Avenue Securities Trust, Ser 2022-R05, Cl 2M2 | ||||||||
8.315%, SOFR30A + 3.000%, 04/25/2042(A)(D) | $ | 386 | $ | 391 | ||||
Connecticut Avenue Securities, Ser 2018-C01, Cl 1B1 | ||||||||
8.979%, SOFR30A + 3.664%, 07/25/2030(D) | 570 | 604 | ||||||
Credit Suisse European Mortgage Capital, Ser 2019-1OTF, Cl A | ||||||||
8.531%, TSFR3M + 0.000%, 08/09/2024(A)(D) | 925 | 900 | ||||||
CSMC Trust, Ser 2014-USA, Cl E | ||||||||
4.373%, 09/15/2037(A) | 320 | 171 | ||||||
CSMC Trust, Ser 2017-RPL1, Cl M2 | ||||||||
2.962%, 07/25/2057(A)(D) | 1,190 | 820 | ||||||
CSMC Trust, Ser 2019-UVIL, Cl A | ||||||||
3.160%, 12/15/2041(A) | 950 | 786 | ||||||
CSMC Trust, Ser 2022-RPL4, Cl A1 | ||||||||
3.904%, 04/25/2062(A)(D) | 171 | 156 | ||||||
Ellington Financial Mortgage Trust, Ser 2020-1, Cl B1 | ||||||||
5.112%, 05/25/2065(A)(D) | 600 | 570 | ||||||
First Franklin Mortgage Loan Trust, Ser 2006-FF15, Cl A5 | ||||||||
5.594%, TSFR1M + 0.274%, 11/25/2036(D) | 366 | 358 | ||||||
GS Mortgage Securities Trust, Ser 2015-GC32, Cl D | ||||||||
3.345%, 07/10/2048 | 380 | 321 | ||||||
GS Mortgage Securities Trust, Ser 2018-LUAU, Cl G | ||||||||
9.829%, TSFR1M + 4.497%, 11/15/2032(A)(D) | 500 | 490 | ||||||
GS Mortgage Securities Trust, Ser 2018-SRP5, Cl C | ||||||||
9.698%, TSFR1M + 4.364%, 09/15/2031(A)(D) | 1,754 | 624 | ||||||
GS Mortgage Securities Trust, Ser 2020-DUNE, Cl F | ||||||||
8.705%, TSFR1M + 3.364%, 12/15/2036(A)(D) | 595 | 559 | ||||||
GS Mortgage Securities Trust, Ser 2020-DUNE, Cl A | ||||||||
6.555%, TSFR1M + 1.214%, 12/15/2036(A)(D) | 1,830 | 1,802 | ||||||
HarborView Mortgage Loan Trust, Ser 2006-10, Cl 2A1B | ||||||||
5.682%, TSFR1M + 0.354%, 11/19/2036(D) | 1,469 | 1,224 | ||||||
Impac CMB Trust, Ser 2005-4, Cl 1M1 | ||||||||
6.079%, TSFR1M + 0.544%, 05/25/2035(D) | 577 | 516 | ||||||
Description | Face Amount | Market Value | ||||||
MORTGAGE-BACKED SECURITIES (continued) | ||||||||
JPMorgan Chase Commercial Mortgage Securities Trust, Ser 2018-WPT, Cl FFL | ||||||||
8.716%, TSFR1M + 3.389%, 07/05/2033(A)(D) | $ | 910 | $ | 679 | ||||
JPMorgan Chase Commercial Mortgage Securities Trust, Ser 2019-BKWD, Cl E | ||||||||
8.548%, TSFR1M + 2.964%, 09/15/2029(A)(D) | 1,730 | 1,095 | ||||||
JPMorgan Chase Commercial Mortgage Securities Trust, Ser 2022-ACB, Cl D | ||||||||
8.213%, SOFR30A + 2.900%, 03/15/2039(A)(D) | 600 | 570 | ||||||
JPMorgan Chase Commercial Mortgage Securities Trust, Ser HTL5, Cl F | ||||||||
9.713%, TSFR1M + 4.379%, 11/15/2038(A)(D) | 710 | 671 | ||||||
Legacy Mortgage Asset Trust, Ser 2021-GS1, Cl A2 | ||||||||
3.844%, 10/25/2066(A)(F) | 660 | 511 | ||||||
Morgan Stanley Re-REMIC Trust, Ser 2010-R5, Cl 4B | ||||||||
3.466%, 06/26/2036(A)(F) | 186 | 169 | ||||||
Multifamily Connecticut Avenue Securities Trust, Ser 2019-01, Cl M10 | ||||||||
8.679%, SOFR30A + 3.364%, 10/25/2049(A)(D) | 490 | 477 | ||||||
Multifamily Connecticut Avenue Securities Trust, Ser 2020-01, Cl M10 | ||||||||
9.179%, SOFR30A + 3.864%, 03/25/2050(A)(D) | 479 | 466 | ||||||
New Residential Mortgage Loan Trust, Ser 2018-4A, Cl B1 | ||||||||
6.484%, TSFR1M + 1.164%, 01/25/2048(A)(D) | 249 | 242 | ||||||
NewRez Warehouse Securitization Trust, Ser 2021-1, Cl F | ||||||||
10.684%, TSFR1M + 5.364%, 05/25/2055(A)(D) | 468 | 468 | ||||||
Nomura Resecuritization Trust, Ser 2015-4R, Cl 5A1 | ||||||||
2.726%, TSFR1M + 0.544%, 03/26/2036(A)(D) | 218 | 201 | ||||||
PMT Credit Risk Transfer Trust, Ser 2019-3R, Cl A | ||||||||
9.129%, SOFR30A + 3.814%, 11/27/2031(A)(D) | 171 | 170 | ||||||
PRKCM Trust, Ser 2023-AFC1, Cl A3 | ||||||||
7.304%, 02/25/2058(A)(F) | 300 | 300 | ||||||
RALI Series Trust, Ser 2006-QO2, Cl A2 | ||||||||
5.974%, TSFR1M + 0.654%, 02/25/2046(D) | 1,286 | 255 | ||||||
SEI Institutional Managed Trust
313
SCHEDULE OF INVESTMENTS
September 30, 2023
Multi-Asset Income Fund (Continued)
Description | Face Amount | Market Value | ||||||
MORTGAGE-BACKED SECURITIES (continued) | ||||||||
RALI Series Trust, Ser 2007-QO2, Cl A1 | ||||||||
5.584%, TSFR1M + 0.264%, 02/25/2047(D) | $ | 789 | $ | 278 | ||||
Seasoned Credit Risk Transfer Trust, Ser 2018-1, Cl M | ||||||||
4.750%, 05/25/2057(D) | 1,463 | 1,348 | ||||||
Seasoned Credit Risk Transfer Trust, Ser 2018-3, Cl M | ||||||||
4.750%, 08/25/2057(A)(D) | 1,125 | 980 | ||||||
Seasoned Credit Risk Transfer Trust, Ser 2019-4, Cl M | ||||||||
4.500%, 02/25/2059(A)(D) | 1,720 | 1,443 | ||||||
Seasoned Credit Risk Transfer Trust, Ser 2020-1, Cl M | ||||||||
4.250%, 08/25/2059(A)(D) | 2,230 | 1,902 | ||||||
Seasoned Credit Risk Transfer Trust, Ser 2020-2, Cl M | ||||||||
4.250%, 11/25/2059(A)(D) | 830 | 717 | ||||||
Seasoned Credit Risk Transfer Trust, Ser 2020-3, Cl M | ||||||||
4.250%, 05/25/2060(A)(D) | 640 | 547 | ||||||
Seasoned Credit Risk Transfer Trust, Ser 2022-1, Cl M | ||||||||
4.500%, 11/25/2061(A)(D) | 320 | 255 | ||||||
Shops at Crystals Trust, Ser 2106-CSTL, Cl D | ||||||||
3.856%, 07/05/2036(A)(D) | 885 | 726 | ||||||
SMR Mortgage Trust, Ser 2021-IND, Cl F | ||||||||
11.332%, TSFR1M + 6.000%, 02/15/2039(A)(D) | 789 | 688 | ||||||
Soho Trust, Ser 2021-SOHO, Cl D | ||||||||
2.787%, 08/10/2038(A)(D) | 440 | 256 | ||||||
Structured Asset Securities Mortgage Loan Trust, Ser 2006-GEL4, Cl M1 | ||||||||
6.004%, TSFR1M + 0.684%, 10/25/2036(A)(D) | 890 | 856 | ||||||
Tharaldson Hotel Portfolio Trust, Ser 2018-THL, Cl E | ||||||||
8.923%, TSFR1M + 3.594%, 11/11/2034(A)(D) | 1,742 | 1,684 | ||||||
Tharaldson Hotel Portfolio Trust, Ser 2018-THL, Cl F | ||||||||
9.695%, TSFR1M + 4.367%, 11/11/2034(A)(D) | 583 | 561 | ||||||
Towd Point Mortgage Trust, Ser 2019-4, Cl B1B | ||||||||
3.500%, 10/25/2059(A)(D) | 640 | 426 | ||||||
Towd Point Mortgage Trust, Ser 2020-2, Cl A1A | ||||||||
1.636%, 04/25/2060(A)(D) | 263 | 227 | ||||||
WaMu Mortgage Pass-Through Certificates Trust, Ser 2006-AR16, Cl 2A2 | ||||||||
3.444%, 12/25/2036(D) | 487 | 416 | ||||||
Description | Face Amount | Market Value | ||||||
MORTGAGE-BACKED SECURITIES (continued) | ||||||||
Wells Fargo Commercial Mortgage Trust, Ser 2014-LC18, Cl B | ||||||||
3.959%, 12/15/2047 | $ | 390 | $ | 360 | ||||
Wells Fargo Mortgage-Backed Securities Trust, Ser 2006-AR5, Cl 2A1 | ||||||||
4.680%, 04/25/2036(D) | 340 | 313 | ||||||
| 43,675 | ||||||||
Total Mortgage-Backed Securities | ||||||||
(Cost $55,171) ($ Thousands) | 49,815 | |||||||
| ||||||||
COMMON STOCK — 5.9% | ||||||||
Communication Services — 0.4% | ||||||||
iHeartMedia Inc * | 95,895 | 303 | ||||||
Intelsat Jackson Holdings *(B) | 22,561 | 513 | ||||||
Verizon Communications Inc | 54,707 | 1,773 | ||||||
| 2,589 | ||||||||
Consumer Discretionary — 0.1% | ||||||||
Best Buy Co Inc | 5,377 | 374 | ||||||
McDonald's Corp | 1,109 | 292 | ||||||
| 666 | ||||||||
Consumer Staples — 1.2% | ||||||||
Altria Group Inc | 40,102 | 1,686 | ||||||
Clorox Co/The | 6,316 | 828 | ||||||
Coca-Cola Co/The | 5,881 | 329 | ||||||
Colgate-Palmolive Co | 1,237 | 88 | ||||||
Flowers Foods Inc | 10,839 | 240 | ||||||
General Mills Inc | 18,822 | 1,205 | ||||||
Kimberly-Clark Corp | 8,756 | 1,058 | ||||||
Mondelez International Inc, Cl A | 2,052 | 142 | ||||||
PepsiCo Inc | 2,083 | 353 | ||||||
Philip Morris International Inc | 15,518 | 1,437 | ||||||
Procter & Gamble Co/The | 3,592 | 524 | ||||||
Vector Group Ltd | 6,784 | 72 | ||||||
| 7,962 | ||||||||
Energy — 0.6% | ||||||||
Chord Energy Corp | 2,163 | 350 | ||||||
Civitas Resources Inc | 3,002 | 243 | ||||||
Coterra Energy Inc | 43,149 | 1,167 | ||||||
Noble Corp PLC | 7,982 | 404 | ||||||
Summit Midstream Partners LP * | 28,458 | 394 | ||||||
Williams Cos Inc/The | 39,114 | 1,318 | ||||||
| 3,876 | ||||||||
Financials — 0.5% | ||||||||
American Financial Group Inc/OH | 4,029 | 450 | ||||||
Artisan Partners Asset Management Inc, Cl A | 3,718 | 139 | ||||||
314
SEI Institutional Managed Trust
Description | Shares | Market Value | ||||||
COMMON STOCK (continued) | ||||||||
CME Group Inc, Cl A | 8,836 | $ | 1,769 | |||||
Cohen & Steers Inc | 1,416 | 89 | ||||||
Old Republic International Corp | 15,720 | 424 | ||||||
OneMain Holdings Inc, Cl A | 5,990 | 240 | ||||||
RLI Corp | 2,149 | 292 | ||||||
| 3,403 | ||||||||
Health Care — 1.3% | ||||||||
AbbVie Inc | 10,878 | 1,622 | ||||||
Amgen Inc, Cl A | 5,635 | 1,514 | ||||||
Bristol-Myers Squibb Co | 20,039 | 1,163 | ||||||
Gilead Sciences Inc | 19,811 | 1,485 | ||||||
Medtronic PLC | 14,066 | 1,102 | ||||||
Merck & Co Inc | 3,836 | 395 | ||||||
Pfizer Inc | 34,462 | 1,143 | ||||||
| 8,424 | ||||||||
Industrials — 0.5% | ||||||||
3M Co | 10,842 | 1,015 | ||||||
Automatic Data Processing Inc | 645 | 155 | ||||||
Illinois Tool Works Inc | 417 | 96 | ||||||
MSC Industrial Direct Co Inc, Cl A | 2,443 | 240 | ||||||
PACCAR Inc | 15,962 | 1,357 | ||||||
Watsco Inc | 687 | 260 | ||||||
| 3,123 | ||||||||
Information Technology — 0.7% | ||||||||
Broadcom Inc | 1,925 | 1,599 | ||||||
Cisco Systems Inc | 25,043 | 1,346 | ||||||
Qlik, Cl A *(B) | 56 | 92 | ||||||
Qlik, Cl B *(B) | 13,812 | — | ||||||
Texas Instruments Inc | 9,213 | 1,465 | ||||||
| 4,502 | ||||||||
Materials — 0.2% | ||||||||
Arctic Canadian Diamond Company Ltd *(B) | 824 | 258 | ||||||
LyondellBasell Industries NV, Cl A | 13,537 | 1,282 | ||||||
| 1,540 | ||||||||
Real Estate — 0.4% | ||||||||
Innovative Industrial Properties Inc, Cl A ‡ | 1,511 | 114 | ||||||
Public Storage ‡ | 5,406 | 1,425 | ||||||
VICI Properties Inc, Cl A ‡ | 34,841 | 1,014 | ||||||
| 2,553 | ||||||||
Total Common Stock | ||||||||
(Cost $37,419) ($ Thousands) | 38,638 | |||||||
FOREIGN COMMON STOCK — 5.4% | ||||||||
Australia — 0.1% | ||||||||
Deterra Royalties Ltd | 23,284 | 72 | ||||||
Dexus ‡ | 57,305 | 270 | ||||||
Description | Shares | Market Value | ||||||
FOREIGN COMMON STOCK (continued) | ||||||||
JB Hi-Fi Ltd | 6,557 | $ | 192 | |||||
Premier Investments Ltd | 4,897 | 79 | ||||||
| 613 | ||||||||
Canada — 0.3% | ||||||||
BCE Inc | 4,069 | 156 | ||||||
Canadian Natural Resources Ltd | 21,001 | 1,364 | ||||||
Gibson Energy Inc | 7,694 | 111 | ||||||
Great-West Lifeco Inc | 14,862 | 427 | ||||||
Labrador Iron Ore Royalty Corp | 3,116 | 74 | ||||||
| 2,132 | ||||||||
France — 0.4% | ||||||||
Rubis SCA | 5,050 | 114 | ||||||
Sanofi | 12,140 | 1,304 | ||||||
TotalEnergies SE | 20,397 | 1,346 | ||||||
| 2,764 | ||||||||
Hong Kong — 1.1% | ||||||||
Agricultural Bank of China Ltd, Cl H | 1,613,375 | 602 | ||||||
Bank of China Ltd, Cl H | 4,384,547 | 1,534 | ||||||
Bank of Communications Co Ltd, Cl H | 477,981 | 289 | ||||||
China CITIC Bank Corp Ltd, Cl H | 489,770 | 228 | ||||||
China Construction Bank Corp, Cl H | 2,704,763 | 1,526 | ||||||
CK Asset Holdings Ltd | 110,031 | 580 | ||||||
CK Infrastructure Holdings Ltd | 34,145 | 162 | ||||||
HKT Trust & HKT Ltd | 197,586 | 206 | ||||||
Industrial & Commercial Bank of China Ltd, Cl H | 1,779,230 | 856 | ||||||
PetroChina Co Ltd, Cl H | 1,156,114 | 871 | ||||||
Power Assets Holdings Ltd | 76,848 | 372 | ||||||
SITC International Holdings Co Ltd | 71,531 | 120 | ||||||
Want Want China Holdings Ltd | 274,457 | 179 | ||||||
| 7,525 | ||||||||
India — 0.2% | ||||||||
Bajaj Auto Ltd | 3,461 | 211 | ||||||
ITC Ltd | 151,563 | 811 | ||||||
| 1,022 | ||||||||
Indonesia — 0.2% | ||||||||
Bank Rakyat Indonesia Persero Tbk PT | 3,056,137 | 1,033 | ||||||
Italy — 0.3% | ||||||||
Assicurazioni Generali SpA | 59,767 | 1,225 | ||||||
Azimut Holding SpA | 5,873 | 129 | ||||||
Italgas SpA | 25,503 | 131 | ||||||
Poste Italiane SpA | 28,394 | 300 | ||||||
| 1,785 | ||||||||
SEI Institutional Managed Trust
315
SCHEDULE OF INVESTMENTS
September 30, 2023
Multi-Asset Income Fund (Continued)
Description | Shares | Market Value | ||||||
FOREIGN COMMON STOCK (continued) | ||||||||
Japan — 0.6% | ||||||||
Astellas Pharma Inc | 76,501 | $ | 1,063 | |||||
Japan Tobacco Inc | 66,096 | 1,524 | ||||||
Sekisui House Ltd | 31,277 | 624 | ||||||
SoftBank Corp | 15,573 | 177 | ||||||
USS Co Ltd | 11,112 | 184 | ||||||
Yamato Kogyo Co Ltd | 1,949 | 93 | ||||||
| 3,665 | ||||||||
Malaysia — 0.0% | ||||||||
Petronas Dagangan Bhd | 15,538 | 74 | ||||||
Petronas Gas Bhd | 43,248 | 155 | ||||||
| 229 | ||||||||
Netherlands — 0.1% | ||||||||
Koninklijke KPN NV | 184,001 | 608 | ||||||
New Zealand — 0.0% | ||||||||
Spark New Zealand Ltd | 102,378 | 296 | ||||||
Singapore — 0.2% | ||||||||
Oversea-Chinese Banking Corp Ltd | 132,962 | 1,248 | ||||||
South Korea — 0.0% | ||||||||
KT&G Corp | 5,369 | 343 | ||||||
Spain — 0.4% | ||||||||
Cia de Distribucion Integral Logista Holdings SA | 3,662 | 94 | ||||||
Enagas SA | 13,317 | 221 | ||||||
Industria de Diseno Textil SA | 40,479 | 1,512 | ||||||
Mapfre SA | 47,313 | 97 | ||||||
Redeia Corp SA | 22,377 | 353 | ||||||
Viscofan SA | 2,142 | 131 | ||||||
| 2,408 | ||||||||
Sweden — 0.2% | ||||||||
Nordea Bank Abp, Cl A | 96,458 | 1,066 | ||||||
Switzerland — 0.6% | ||||||||
Novartis AG | 17,609 | 1,807 | ||||||
Roche Holding AG | 4,083 | 1,118 | ||||||
Zurich Insurance Group AG | 2,460 | 1,129 | ||||||
| 4,054 | ||||||||
Taiwan — 0.2% | ||||||||
Chunghwa Telecom Co Ltd | 204,369 | 734 | ||||||
Micro-Star International Co Ltd | 33,262 | 169 | ||||||
Novatek Microelectronics Corp | 32,550 | 427 | ||||||
Description | Shares | Market Value | ||||||
FOREIGN COMMON STOCK (continued) | ||||||||
Radiant Opto-Electronics Corp | 23,758 | $ | 90 | |||||
Simplo Technology Co Ltd | 9,808 | 102 | ||||||
| 1,522 | ||||||||
United Kingdom — 0.5% | ||||||||
British American Tobacco PLC | 46,748 | 1,470 | ||||||
Games Workshop Group PLC | 1,821 | 235 | ||||||
Imperial Brands PLC | 49,536 | 1,008 | ||||||
Pagegroup PLC | 17,876 | 92 | ||||||
Taylor Wimpey PLC | 186,486 | 267 | ||||||
| 3,072 | ||||||||
Total Foreign Common Stock | ||||||||
(Cost $36,108) ($ Thousands) | 35,385 | |||||||
| ||||||||
ASSET-BACKED SECURITIES — 4.9% | ||||||||
Other Asset-Backed Securities — 4.9% | ||||||||
Aimco CLO 12, Ser 2022-12A, Cl DR | ||||||||
8.208%, TSFR3M + 2.900%, 01/17/2032(A)(D) | $ | 360 | 352 | |||||
Apidos CLO XXII, Ser 2020-22A, Cl DR | ||||||||
12.338%, TSFR3M + 7.012%, 04/20/2031(A)(D) | 1,380 | 1,317 | ||||||
Applebee's Funding, Ser 2023-1A, Cl A2 | ||||||||
7.824%, 03/05/2053(A) | 530 | 522 | ||||||
Bain Capital Credit CLO, Ser 2023-1A, Cl AN | ||||||||
6.573%, TSFR3M + 1.830%, 04/16/2036(A)(D) | 690 | 691 | ||||||
Benefit Street Partners CLO IV, Ser 2021-IVA, Cl CRRR | ||||||||
9.188%, TSFR3M + 3.862%, 01/20/2032(A)(D) | 340 | 332 | ||||||
BlueMountain CLO XXIX, Ser 2021-29A, Cl ER | ||||||||
12.473%, TSFR3M + 7.122%, 07/25/2034(A)(D) | 890 | 831 | ||||||
Bristol Park CLO, Ser 2020-1A, Cl ER | ||||||||
12.570%, TSFR3M + 7.262%, 04/15/2029(A)(D) | 500 | 462 | ||||||
Buckhorn Park CLO, Ser 2021-1A, Cl AR | ||||||||
6.692%, TSFR3M + 1.382%, 07/18/2034(A)(D) | 790 | 786 | ||||||
Canyon Capital CLO, Ser 2021-1A, Cl E | ||||||||
11.980%, TSFR3M + 6.672%, 04/15/2034(A)(D) | 280 | 257 | ||||||
Carlyle Global Market Strategies CLO, Ser 2018-2RA, Cl A1 | ||||||||
6.676%, TSFR3M + 1.312%, 05/15/2031(A)(D) | 1,041 | 1,038 | ||||||
316
SEI Institutional Managed Trust
Description | Face Amount | Market Value | ||||||
ASSET-BACKED SECURITIES (continued) | ||||||||
Carlyle US CLO, Ser 2021-2A, Cl DR | ||||||||
12.070%, TSFR3M + 6.762%, 07/15/2032(A)(D) | $ | 1,600 | $ | 1,514 | ||||
CarVal CLO VII-C, Ser 2023-1A, Cl A1 | ||||||||
7.526%, TSFR3M + 2.200%, 01/20/2035(A)(D) | 730 | 731 | ||||||
Cathedral Lake VII, Ser 2021-7RA, Cl D | ||||||||
9.852%, TSFR3M + 4.542%, 01/15/2032(A)(D) | 250 | 242 | ||||||
Catskill Park CLO, Ser 2017-1A, Cl D | ||||||||
11.588%, TSFR3M + 6.262%, 04/20/2029(A)(D) | 900 | 821 | ||||||
CIFC Funding, Ser 2017-3A, Cl C | ||||||||
9.238%, TSFR3M + 3.912%, 07/20/2030(A)(D) | 690 | 682 | ||||||
Copper River CLO, Ser 2006-1A | ||||||||
0.000%, 01/20/2021(A)(H) | 3,000 | – | ||||||
Countrywide Asset-Backed Certificates, Ser 2006-12, Cl 1A | ||||||||
5.694%, TSFR1M + 0.374%, 12/25/2036(D) | 974 | 868 | ||||||
CQS US CLO, Ser 2021-1A, Cl D1 | ||||||||
9.138%, TSFR3M + 3.812%, 01/20/2035(A)(D) | 1,850 | 1,782 | ||||||
Dryden LXXV CLO, Ser 2021-75A, Cl ER2 | ||||||||
12.170%, TSFR3M + 6.862%, 04/15/2034(A)(D) | 770 | 690 | ||||||
Dryden XLIII Senior Loan Fund, Ser 2021-43A, Cl ER3 | ||||||||
11.988%, TSFR3M + 6.662%, 04/20/2034(A)(D) | 330 | 298 | ||||||
Eaton Vance CLO, Ser 2021-2A, Cl ER | ||||||||
12.070%, TSFR3M + 6.762%, 01/15/2035(A)(D) | 500 | 476 | ||||||
Educational Funding, Ser 2006-1A, Cl A3 | ||||||||
5.963%, TSFR3M + 0.000%, 04/25/2033(A)(D) | 587 | 379 | ||||||
Fortress Credit BSL XII, Ser 2021-4A, Cl E | ||||||||
12.700%, TSFR3M + 7.392%, 10/15/2034(A)(D) | 250 | 219 | ||||||
Goldentree Loan Management US CLO 3, Ser 2018-3A, Cl D | ||||||||
8.438%, TSFR3M + 3.112%, 04/20/2030(A)(D) | 500 | 488 | ||||||
Golub Capital Partners CLO LIII, Ser 2021-53A, Cl E | ||||||||
12.288%, TSFR3M + 6.962%, 07/20/2034(A)(D) | 410 | 388 | ||||||
GoodLeap Sustainable Home Solutions Trust, Ser 2021-4GS, Cl A | ||||||||
1.930%, 07/20/2048(A) | 131 | 96 | ||||||
Description | Face Amount | Market Value | ||||||
ASSET-BACKED SECURITIES (continued) | ||||||||
GoodLeap Sustainable Home Solutions Trust, Ser 2022-1GS, Cl B | ||||||||
2.940%, 01/20/2049(A) | $ | 90 | $ | 67 | ||||
Halsey Point CLO I, Ser 2019-1A, Cl F | ||||||||
13.788%, TSFR3M + 8.462%, 01/20/2033(A)(D) | 290 | 256 | ||||||
Hardee's Funding, Ser 2020-1A, Cl A2 | ||||||||
3.981%, 12/20/2050(A) | 973 | 818 | ||||||
Hardee's Funding, Ser 2021-1A, Cl A2 | ||||||||
2.865%, 06/20/2051(A) | 156 | 123 | ||||||
HGI CRE CLO, Ser 2021-FL1, Cl C | ||||||||
7.145%, TSFR1M + 1.814%, 06/16/2036(A)(D) | 330 | 314 | ||||||
Marathon CLO II, Ser 2005-2A | ||||||||
0.000%, 12/20/2019(A)(B)(H) | 750 | – | ||||||
Marathon CLO, Ser 2019-2A, Cl BA | ||||||||
8.888%, TSFR3M + 3.562%, 01/20/2033(A)(D) | 330 | 324 | ||||||
Neuberger Berman Loan Advisers CLO 33, Ser 2021-33A, Cl DR | ||||||||
8.470%, TSFR3M + 3.162%, 10/16/2033(A)(D) | 500 | 488 | ||||||
Neuberger Berman Loan Advisers CLO 44, Ser 2021-44A, Cl E | ||||||||
11.570%, TSFR3M + 6.262%, 10/16/2034(A)(D) | 490 | 474 | ||||||
Oaktree CLO, Ser 2019-1A, Cl D | ||||||||
9.407%, TSFR3M + 4.062%, 04/22/2030(A)(D) | 250 | 234 | ||||||
Ocean Trails CLO IX, Ser 2021-9A, Cl DR | ||||||||
9.320%, TSFR3M + 4.012%, 10/15/2034(A)(D) | 500 | 477 | ||||||
Ocean Trails CLO X, Ser 2021-10A, Cl ER | ||||||||
13.140%, TSFR3M + 7.832%, 10/15/2034(A)(D) | 590 | 530 | ||||||
Ocean Trails CLO XIV, Ser 2023-14A, Cl A1 | ||||||||
7.326%, TSFR3M + 2.000%, 01/20/2035(A)(D) | 650 | 652 | ||||||
OZLM XI, Ser 2017-11A, Cl BR | ||||||||
7.931%, TSFR3M + 2.562%, 10/30/2030(A)(D) | 600 | 600 | ||||||
Palmer Square Loan Funding, Ser 2022-3A, Cl C | ||||||||
10.708%, TSFR3M + 5.400%, 04/15/2031(A)(D) | 670 | 671 | ||||||
Parallel, Ser 2020-1A, Cl CR | ||||||||
7.588%, TSFR3M + 2.262%, 07/20/2029(A)(D) | 750 | 735 | ||||||
Peace Park CLO, Ser 2021-1A, Cl E | ||||||||
11.588%, TSFR3M + 6.262%, 10/20/2034(A)(D) | 400 | 378 | ||||||
SEI Institutional Managed Trust
317
SCHEDULE OF INVESTMENTS
September 30, 2023
Multi-Asset Income Fund (Continued)
Description | Face Amount | Market Value | ||||||
ASSET-BACKED SECURITIES (continued) | ||||||||
RR, Ser 2021-18A, Cl D | ||||||||
11.820%, TSFR3M + 6.512%, 10/15/2034(A)(D) | $ | 750 | $ | 720 | ||||
Sculptor CLO XXVI, Ser 2021-26A, Cl E | ||||||||
12.838%, TSFR3M + 7.512%, 07/20/2034(A)(D) | 450 | 415 | ||||||
SMB Private Education Loan Trust, Ser 2021-A, Cl D1 | ||||||||
3.860%, 01/15/2053(A) | 509 | 456 | ||||||
SMB Private Education Loan Trust, Ser 2023-B, Cl B | ||||||||
5.770%, 10/16/2056(A) | 800 | 765 | ||||||
Sunnova Helios II, Ser 2019-AA, Cl C | ||||||||
5.320%, 06/20/2046(A) | 409 | 309 | ||||||
Sunrun Atlas Issuer, Ser 2019-2, Cl A | ||||||||
3.610%, 02/01/2055(A) | 384 | 333 | ||||||
Sycamore Tree CLO, Ser 2023-2A, Cl A | ||||||||
7.656%, TSFR3M + 2.330%, 04/20/2035(A)(D) | 750 | 753 | ||||||
Symphony CLO 37, Ser 2022-37A, Cl A1A | ||||||||
7.626%, TSFR3M + 2.300%, 10/20/2034(A)(D) | 660 | 662 | ||||||
TCI-Symphony CLO, Ser 2021-1A, Cl ER2 | ||||||||
12.313%, TSFR3M + 7.012%, 10/13/2032(A)(D) | 730 | 648 | ||||||
Tikehau US CLO I, Ser 2021-1A, Cl E | ||||||||
12.482%, TSFR3M + 7.172%, 01/18/2035(A)(D) | 1,200 | 1,072 | ||||||
TSTAT, Ser 2022-2A, Cl C | ||||||||
10.126%, TSFR3M + 4.800%, 01/20/2031(A)(D) | 480 | 484 | ||||||
Valley Stream Park CLO, Ser 2023-1A, Cl DR | ||||||||
0.000%, 10/20/2034(A)(D)(H) | 360 | 360 | ||||||
Voya CLO, Ser 2018-3A, Cl A1A | ||||||||
6.720%, TSFR3M + 1.412%, 10/15/2031(A)(D) | 250 | 250 | ||||||
Voya CLO, Ser 2021-3A, Cl DR | ||||||||
12.538%, TSFR3M + 7.212%, 04/20/2034(A)(D) | 260 | 248 | ||||||
Whitebox CLO IV, Ser 2023-4A, Cl A1 | ||||||||
6.930%, TSFR3M + 2.150%, 04/20/2036(A)(D) | 770 | 773 | ||||||
Whitehorse XII, Ser 2018-12A, Cl D | ||||||||
9.220%, TSFR3M + 3.912%, 10/15/2031(A)(D) | 250 | 231 | ||||||
Description | Face Amount | Market Value | ||||||
ASSET-BACKED SECURITIES (continued) | ||||||||
Z Capital Credit Partners CLO, Ser 2021-1A, Cl D | ||||||||
9.770%, TSFR3M + 4.462%, 07/15/2033(A)(D) | $ | 450 | $ | 424 | ||||
Total Asset-Backed Securities | ||||||||
(Cost $37,794) ($ Thousands) | 32,306 | |||||||
CONVERTIBLE BONDS — 0.2% | ||||||||
Alarm.com Holdings | ||||||||
0.000%, 01/15/2026(I) | 57 | 49 | ||||||
DISH Network | ||||||||
0.000%, 12/15/2025(I) | 970 | 648 | ||||||
DraftKings Holdings | ||||||||
0.000%, 03/15/2028(I) | 680 | 514 | ||||||
Gannett | ||||||||
6.000%, 12/01/2027(A) | 240 | 202 | ||||||
Total Convertible Bonds | ||||||||
(Cost $1,508) ($ Thousands) | 1,413 | |||||||
| ||||||||
PREFERRED STOCK — 0.2% | ||||||||
Energy — 0.2% | ||||||||
MPLX, 9.538% *(B)(E) | 35,351 | 1,195 | ||||||
Total Preferred Stock | ||||||||
(Cost $1,149) ($ Thousands) | 1,195 | |||||||
| ||||||||
MUNICIPAL BOND — 0.0% | ||||||||
Illinois — 0.0% | ||||||||
Illinois State, Build America Bonds, GO | ||||||||
7.350%, 07/01/2035 | $ | 193 | 201 | |||||
Total Municipal Bond | ||||||||
(Cost $212) ($ Thousands) | 201 | |||||||
Number of Warrants | ||||||||
WARRANTS — 0.0% | ||||||||
Noble Corp PLC, Expires 02/07/2028 | ||||||||
Strike Price $19.27 * | 2,787 | 90 | ||||||
Noble Corp PLC, Expires 02/07/2028 | ||||||||
Strike Price $23.13 * | 2,787 | 78 | ||||||
Total Warrants | ||||||||
(Cost $13) ($ Thousands) | 168 | |||||||
318
SEI Institutional Managed Trust
Description | Number of Rights | Market Value | ||||||
RIGHTS — 0.0% | ||||||||
Intelsat Jackson Holdings *‡‡(B) | 4,720 | $ | – | |||||
Total Rights | ||||||||
(Cost $—) ($ Thousands) | – | |||||||
| ||||||||
PURCHASED OPTIONS — 0.0% | ||||||||
Total Purchased Options | ||||||||
(Cost $83) ($ Thousands) | 196 | |||||||
Total Investments in Securities — 96.0% | ||||||||
(Cost $713,660) ($ Thousands) | $ | 633,239 | ||||||
WRITTEN OPTION — (0.0)% | ||||||||
Total Written Option | ||||||||
(Premiums Received $17) ($ Thousands) | $ | (60 | ) | |||||
A list of the open exchange traded options contracts held by the Fund at September 30, 2023 is as follows:
Description | Number of Contracts | Notional Amount | Exercise Price | Expiration Date | Value | |||||||||||||||
PURCHASED OPTIONS — 0.0% | ||||||||||||||||||||
Put Options | ||||||||||||||||||||
USD Call | 3,160,000 | $ | 4,201 | $ | 1.33 | 11/18/2023 | $ | 5 | ||||||||||||
USD Put | 2,210,000 | 2,963 | 1.34 | 10/21/2023 | 3 | |||||||||||||||
| 7,164 | 8 | |||||||||||||||||||
Call Options | ||||||||||||||||||||
December 2023, 3 Month SOFR | 6 | $ | 1,489 | 99.25 | 12/16/2023 | $ | – | |||||||||||||
November 2023, U.S. 10 Year Future Option | 63 | 6,962 | 110.50 | 10/21/2023 | 10 | |||||||||||||||
January 2024, U.S. 10 Year Future Option | 3 | 355 | 118.50 | 12/16/2023 | – | |||||||||||||||
USD Call | 4,100,000 | 5,182 | 1.26 | 10/21/2023 | 178 | |||||||||||||||
| 13,988 | 188 | |||||||||||||||||||
Total Purchased Options | $ | 21,152 | $ | 196 | ||||||||||||||||
WRITTEN OPTION — 0.0% | ||||||||||||||||||||
Call Options | ||||||||||||||||||||
USD Call | (4,100,000 | ) | $ | (5,053 | ) | 1.23 | 10/21/2023 | $ | (60 | ) | ||||||||||
Total Written Option | $ | (5,053 | ) | $ | (60 | ) | ||||||||||||||
A list of the open futures contracts held by the Fund at September 30, 2023 is as follows:
Type of Contract | Number of | Expiration Date | Notional Amount (Thousands) | Value | Unrealized Appreciation/ | |||||||||||||||
Long Contracts | ||||||||||||||||||||
3 Month SOFR | 52 | Decr-2024 | $ | 12,561 | $ | 12,403 | $ | (158 | ) | |||||||||||
Australian 10-Year Bond | 24 | Dec-2023 | 1,769 | 1,734 | (51 | ) | ||||||||||||||
Euro-Bobl | 5 | Dec-2023 | 638 | 613 | (5 | ) | ||||||||||||||
ICE 3-Month SONIA | 38 | Jun-2024 | 11,405 | 10,985 | 43 | |||||||||||||||
ICE 3-Month SONIA | 116 | Dec-2023 | 33,942 | 33,531 | (201 | ) | ||||||||||||||
SEI Institutional Managed Trust
319
SCHEDULE OF INVESTMENTS
September 30, 2023
Multi-Asset Income Fund (Continued)
Type of Contract | Number of | Expiration Date | Notional Amount (Thousands) | Value | Unrealized Appreciation/ | |||||||||||||||
ICE 3-Month SONIA | 37 | Dec-2023 | $ | 10,950 | $ | 10,682 | $ | 88 | ||||||||||||
ICE 3-Month SONIA | 1 | Dec-2024 | 302 | 290 | 1 | |||||||||||||||
Long Gilt 10-Year Bond | 28 | Dec-2023 | 3,333 | 3,218 | 13 | |||||||||||||||
U.S. 2-Year Treasury Note | 528 | Dec-2023 | 107,252 | 107,031 | (221 | ) | ||||||||||||||
U.S. 5-Year Treasury Note | 28 | Dec-2023 | 2,943 | 2,950 | 7 | |||||||||||||||
U.S. 5-Year Treasury Note | 28 | Dec-2023 | 2,982 | 2,950 | (32 | ) | ||||||||||||||
U.S. 10-Year Treasury Note | 77 | Dec-2023 | 8,321 | 8,321 | – | |||||||||||||||
U.S. 10-Year Treasury Note | 648 | Dec-2023 | 71,195 | 70,025 | (1,170 | ) | ||||||||||||||
U.S. Long Treasury Bond | 144 | Dec-2023 | 17,221 | 16,385 | (837 | ) | ||||||||||||||
U.S. Ultra Long Treasury Bond | 147 | Dec-2023 | 18,618 | 17,447 | (1,171 | ) | ||||||||||||||
Ultra 10-Year U.S. Treasury Note | 132 | Dec-2023 | 15,134 | 14,726 | (408 | ) | ||||||||||||||
| 318,566 | 313,291 | (4,102 | ) | |||||||||||||||||
Short Contracts | ||||||||||||||||||||
3 Month SOFR | (90 | ) | Dec-2023 | $ | (21,412 | ) | $ | (21,274 | ) | $ | 138 | |||||||||
| $ | 297,154 | $ | 292,017 | $ | (3,964 | ) | ||||||||||||||
A list of the open forward foreign currency contracts held by the Fund at September 30, 2023 is as follows:
Counterparty | Settlement Date | Currency to Deliver | Currency to Receive | Unrealized Appreciation | ||||||||||||||||||||
Barclays PLC | 12/06/23 | USD | 330 | EUR | 307 | $ | (3 | ) | ||||||||||||||||
BNP Paribas | 10/18/23 | CAD | 1,047 | USD | 774 | (1 | ) | |||||||||||||||||
BNP Paribas | 10/20/23 | EUR | 670 | USD | 730 | 20 | ||||||||||||||||||
BNP Paribas | 10/20/23 | AUD | 950 | USD | 652 | 39 | ||||||||||||||||||
BNP Paribas | 10/20/23 | USD | 2,584 | EUR | 2,360 | (84 | ) | |||||||||||||||||
BNP Paribas | 10/20/23 | USD | 3,368 | NOK | 35,787 | (1 | ) | |||||||||||||||||
BNP Paribas | 10/20/23 | USD | 3,180 | CAD | 4,310 | 9 | ||||||||||||||||||
BNP Paribas | 10/20/23 | USD | 1,326 | CAD | 1,780 | (9 | ) | |||||||||||||||||
BNP Paribas | 10/20/23 | CAD | 971 | USD | 732 | 14 | ||||||||||||||||||
BNP Paribas | 10/20/23 | CAD | 4,123 | USD | 3,042 | (8 | ) | |||||||||||||||||
BNP Paribas | 10/20/23 | USD | 6,625 | AUD | 9,977 | (182 | ) | |||||||||||||||||
BNP Paribas | 10/20/23 | NOK | 24,010 | USD | 2,369 | 111 | ||||||||||||||||||
BNP Paribas | 11/09/23 | CAD | 1,488 | USD | 1,106 | 5 | ||||||||||||||||||
Citigroup | 12/06/23 | EUR | 12,475 | USD | 13,363 | 116 | ||||||||||||||||||
Citigroup | 12/20/23 | NZD | 1,501 | USD | 884 | (18 | ) | |||||||||||||||||
Deutsche Bank | 12/20/23 | GBP | 921 | USD | 1,148 | 24 | ||||||||||||||||||
Deutsche Bank | 12/20/23 | AUD | 1,553 | USD | 994 | (11 | ) | |||||||||||||||||
Goldman Sachs | 10/20/23 | USD | 304 | MXN | 5,370 | 4 | ||||||||||||||||||
Goldman Sachs | 10/20/23 | MXN | 33,941 | USD | 1,969 | 22 | ||||||||||||||||||
JPMorgan Chase Bank | 10/16/23 | USD | 886 | GBP | 682 | (54 | ) | |||||||||||||||||
JPMorgan Chase Bank | 10/20/23 | USD | 10 | NZD | 16 | — | ||||||||||||||||||
JPMorgan Chase Bank | 10/20/23 | ZAR | 30 | USD | 2 | — | ||||||||||||||||||
JPMorgan Chase Bank | 10/20/23 | USD | 667 | AUD | 1,010 | (14 | ) | |||||||||||||||||
JPMorgan Chase Bank | 10/20/23 | AUD | 1,510 | USD | 1,021 | 45 | ||||||||||||||||||
JPMorgan Chase Bank | 10/20/23 | NOK | 5,610 | USD | 553 | 26 | ||||||||||||||||||
JPMorgan Chase Bank | 10/20/23 | IDR | 10,942,340 | USD | 725 | 18 | ||||||||||||||||||
Morgan Stanley | 10/20/23 | USD | 15 | BRL | 73 | — | ||||||||||||||||||
Morgan Stanley | 10/20/23 | USD | 542 | NOK | 5,500 | (25 | ) | |||||||||||||||||
Morgan Stanley | 10/20/23 | USD | 692 | CNH | 4,980 | (8 | ) | |||||||||||||||||
Morgan Stanley | 10/20/23 | USD | 893 | MXN | 15,790 | 12 | ||||||||||||||||||
Morgan Stanley | 10/20/23 | USD | 1,691 | EUR | 1,560 | (38 | ) | |||||||||||||||||
Morgan Stanley | 10/20/23 | USD | 2,460 | CAD | 3,297 | (20 | ) | |||||||||||||||||
320
SEI Institutional Managed Trust
Counterparty | Settlement Date | Currency to Deliver | Currency to Receive | Unrealized Appreciation | ||||||||||||||||||||
Morgan Stanley | 10/20/23 | USD | 2,857 | JPY | 398,147 | $ | (179 | ) | ||||||||||||||||
Morgan Stanley | 10/20/23 | USD | 3,259 | GBP | 2,591 | (96 | ) | |||||||||||||||||
Morgan Stanley | 10/20/23 | CNH | 4,980 | USD | 698 | 14 | ||||||||||||||||||
Morgan Stanley | 10/20/23 | MXN | 6,630 | USD | 381 | 1 | ||||||||||||||||||
Morgan Stanley | 10/20/23 | EUR | 7,002 | USD | 7,706 | 287 | ||||||||||||||||||
Morgan Stanley | 10/20/23 | GBP | 7,416 | USD | 9,524 | 472 | ||||||||||||||||||
Morgan Stanley | 10/30/23 | GBP | 1,120 | USD | 1,430 | 63 | ||||||||||||||||||
Morgan Stanley | 12/20/23 | EUR | 1,284 | USD | 1,380 | 16 | ||||||||||||||||||
Morgan Stanley | 12/20/23 | USD | 2,533 | JPY | 366,965 | (39 | ) | |||||||||||||||||
Morgan Stanley | 12/20/23 | USD | 3,048 | CHF | 2,692 | (77 | ) | |||||||||||||||||
Morgan Stanley | 12/20/23 | SEK | 10,337 | USD | 932 | (24 | ) | |||||||||||||||||
State Street | 12/20/23 | CAD | 1,953 | USD | 1,432 | (15 | ) | |||||||||||||||||
State Street | 12/20/23 | NOK | 10,660 | USD | 998 | (7 | ) | |||||||||||||||||
UBS | 11/09/23 | USD | 495 | MXN | 8,593 | (4 | ) | |||||||||||||||||
| $ | 401 | |||||||||||||||||||||||
A list of the open OTC swap agreements held by the Fund at September 30, 2023 is as follows:
Interest Rate Swap |
| Counterparty | Fund Pays | Fund Receives | Payment Frequency | Termination Date | Currency | Notional Amount (Thousands) | Value (Thousands) | Upfront Payments (Thousands) | Net Unrealized Appreciation (Depreciation) (Thousands) | |||||||||||||||||||||||
| JPMorgan Chase | 10.23 | % | BRL-CDI | Annually | 01/02/2029 | BRL | 23,190 | $ | (177 | ) | $ | – | $ | (177 | ) | |||||||||||||||||
A list of the open centrally cleared swap agreements held by the Fund at September 30, 2023 is as follows:
Interest Rate Swaps |
| Fund Pays | Fund Receives | Payment Frequency | Termination Date | Currency | Notional Amount (Thousands) | Value (Thousands) | Upfront Payments/ Receipts (Thousands) | Net Unrealized Appreciation (Depreciation) (Thousands) | |||||||||||||||||||||||||
| BZDIOVRA | 12.30% | Monthly | 01/02/2024 | BRL | 1,690 | $ | – | $ | – | $ | – | ||||||||||||||||||||||
| 12.795% | BZDIOVRA | Monthly | 01/02/2024 | BRL | 7,200 | (2 | ) | – | (2 | ) | |||||||||||||||||||||||
| 11.814% | BZDIOVRA | Monthly | 01/02/2024 | BRL | 12,765 | (2 | ) | – | (2 | ) | |||||||||||||||||||||||
| 10.95% | BZDIOVRA | Monthly | 01/02/2025 | BRL | 4,140 | (1 | ) | – | (1 | ) | |||||||||||||||||||||||
| 13.30% | BZDIOVRA | Monthly | 01/02/2025 | BRL | 4,360 | (26 | ) | – | (26 | ) | |||||||||||||||||||||||
| BZDIOVRA | 12.06% | Monthly | 01/02/2025 | BRL | 5,500 | 15 | (6 | ) | 21 | ||||||||||||||||||||||||
| BZDIOVRA | 12.063750% | Monthly | 01/02/2025 | BRL | 6,480 | 18 | – | 18 | |||||||||||||||||||||||||
| BZDIOVRA | 10.85% | Monthly | 01/02/2026 | BRL | 2,750 | 2 | – | 2 | |||||||||||||||||||||||||
| BZDIOVRA | 13.03% | Monthly | 01/04/2027 | BRL | 2,270 | 33 | 2 | 31 | |||||||||||||||||||||||||
| 10.2861% | BZDIOVRA | Monthly | 01/04/2027 | BRL | 4,470 | 12 | – | 12 | |||||||||||||||||||||||||
| BZDIOVRA | 8.495% | Monthly | 01/04/2027 | BRL | 1,200 | (15 | ) | (24 | ) | 9 | |||||||||||||||||||||||
| BZDIOVRA 1M | BRL @11.23% | Monthly | 01/04/2027 | BRL | 800 | 1 | (5 | ) | 6 | ||||||||||||||||||||||||
| 13.95% | BZDIOVRA | Monthly | 01/02/2024 | BRL | 3,790 | 3 | – | 3 | |||||||||||||||||||||||||
| 9.75% | MXIBTIIE | Monthly | 12/17/2025 | MXN | 58,410 | 36 | 14 | 22 | |||||||||||||||||||||||||
| 28-DAY MXN - TIIE | 7.2% | Monthly | 07/17/2024 | MXN | 365,383 | (691 | ) | – | (691 | ) | |||||||||||||||||||||||
| 3.05% | SD-SOFR-OIS | Annually | 02/15/2048 | USD | 2,879 | 472 | 105 | 367 | |||||||||||||||||||||||||
| 3.15% | USD-SOFR-OIS | Annually | 05/15/2048 | USD | 3,364 | 500 | – | 500 | |||||||||||||||||||||||||
| 3.25% | EUR006M | Annually | 12/20/2033 | EUR | 2,340 | 26 | (18 | ) | 44 | ||||||||||||||||||||||||
| CNRR007 | 2.0% | Quarterly | 12/20/2025 | CNY | 28,550 | (8 | ) | (9 | ) | 1 | |||||||||||||||||||||||
| CNRR007 | 2.25% | Quarterly | 12/20/2028 | CNY | 26,060 | (28 | ) | (10 | ) | (18 | ) | ||||||||||||||||||||||
| 3.25% | EUR006M | Annually | 12/20/2026 | EUR | 2,530 | 19 | 12 | 7 | |||||||||||||||||||||||||
| 3.25% | EUR006M | Annually | 12/20/2028 | EUR | 1,100 | 6 | (1 | ) | 7 | ||||||||||||||||||||||||
| 3.25% | EUR006M | Annually | 12/20/2030 | EUR | 3,040 | 18 | (16 | ) | 34 | ||||||||||||||||||||||||
SEI Institutional Managed Trust
321
SCHEDULE OF INVESTMENTS
September 30, 2023
Multi-Asset Income Fund (Concluded)
Fund Pays | Fund Receives | Payment Frequency | Termination Date | Currency | Notional Amount | Value (Thousands) | Upfront Payments/ Receipts | Net Unrealized | |||||||||||||||||||||||||||
| 3.00% | EUR006M | Annually | 12/20/2043 | EUR | 330 | $ | 16 | $ | 5 | $ | 11 | ||||||||||||||||||||||||
| 2.50% | EUR006M | Annually | 12/20/2053 | EUR | 260 | 30 | 19 | 11 | |||||||||||||||||||||||||||
| 4.25% | SONIO | Annually | 12/20/2033 | GBP | 400 | 3 | (2 | ) | 5 | ||||||||||||||||||||||||||
| KWCDC | 3.75% | Quarterly | 12/20/2025 | KRW | 188,200 | – | – | – | |||||||||||||||||||||||||||
| KWCDC | 3.50% | Quarterly | 12/20/2028 | KRW | 2,642,910 | (27 | ) | (15 | ) | (12 | ) | ||||||||||||||||||||||||
| KWCDC | 3.50% | Quarterly | 12/20/2033 | KRW | 685,990 | (13 | ) | (6 | ) | (7 | ) | ||||||||||||||||||||||||
| WIBO6M | 4.50% | Semi-Annually | 12/20/2025 | PLN | 4,150 | 4 | 6 | (2 | ) | ||||||||||||||||||||||||||
| WIBR6M | 4.25% | Semi-Annually | 12/20/2028 | PLN | 3,610 | (8 | ) | 2 | (10 | ) | |||||||||||||||||||||||||
| WIBO6M | 4.75% | Semi-Annually | 12/20/2033 | PLN | 2,420 | (9 | ) | 5 | (14 | ) | |||||||||||||||||||||||||
| 4.00% | SOFRRATE | Annually | 12/20/2028 | USD | 1,500 | 21 | 6 | 15 | |||||||||||||||||||||||||||
| 3.50% | SOFRRATE | Annually | 12/20/2033 | USD | 370 | 22 | 14 | 8 | |||||||||||||||||||||||||||
| SOFRATE | 3.696108% | Annually | 09/26/2028 | USD | 5,910 | (25 | ) | (3 | ) | (22 | ) | ||||||||||||||||||||||||
| 3.781828% | SOFRRATE | Annually | 09/22/2036 | USD | 1,370 | 34 | 2 | 32 | |||||||||||||||||||||||||||
| SOFRRATE | 3.35% | Annually | 10/26/2027 | USD | 39,920 | (391 | ) | 85 | (476 | ) | |||||||||||||||||||||||||
| 3.24% | SOFRRATE | Annually | 10/26/2035 | USD | 9,550 | 605 | 56 | 549 | |||||||||||||||||||||||||||
| 7.75% | JIBA3M | Quarterly | 12/20/2025 | ZAR | 35,640 | 25 | 10 | 15 | |||||||||||||||||||||||||||
| JIBA3M | 9.25% | Quarterly | 12/20/2033 | ZAR | 6,930 | (17 | ) | (7 | ) | (10 | ) | ||||||||||||||||||||||||
| $ | 658 | $ | 221 | $ | 437 | ||||||||||||||||||||||||||||||
Credit Default Swaps - Buy Protection |
| Reference Entity/ Obligation | Pay Rate | Payment Frequency | Termination Date | Notional Amount | Value | Upfront Payments/ Receipts | Net Unrealized | |||||||||||||||||
| CDS-CDX.NA.IG.4112/28@500 | 5.00 | % | Quarterly | 12/20/2028 | $ | 963 | $ | (9 | ) | $ | (7 | ) | $ | (2 | ) | |||||||||
| CDS-DAIGR@100BP5.1Y | 1.00 | % | Quarterly | 12/20/2024 | 1,290 | (11 | ) | (7 | ) | (4 | ) | |||||||||||||
| CDS-GM@500BP4.9Y | 5.00 | % | Quarterly | 06/20/2026 | 1,450 | (141 | ) | (154 | ) | 13 | ||||||||||||||
| $ | (161 | ) | $ | (168 | ) | $ | 7 |
Credit Default Swaps - Sell Protection |
| Reference Entity/ Obligation | Receive Rate | Payment Frequency | Termination Date | Notional Amount | Value | Upfront Payments/ Receipts | Net Unrealized | |||||||||||||||||
| CDS-CDX.NA.IG.4112/28@100 | 1.00 | % | Quarterly | 12/20/2028 | $ | 536 | $ | 7 | $ | 7 | $ | – | ||||||||||||
| CDS-F@500BPS 4.9Y | 5.00 | % | Quarterly | 06/20/2026 | 1,450 | 124 | 115 | 9 | ||||||||||||||||
| CDS-VW@100BP5.1Y | 1.00 | % | Quarterly | 12/20/2024 | 1,290 | 6 | 4 | 2 | ||||||||||||||||
| ICE CD BA 1.00 20JUN24 P | 1.00 | % | Quarterly | 06/20/2024 | 525 | 2 | 2 | – | ||||||||||||||||
| ICE CD CDXIG533 1.00 20DE | 1.00 | % | Quarterly | 12/20/2024 | 2,375 | 20 | 15 | 5 | ||||||||||||||||
| ICE CD CDXIG534 1.00 20JU | 1.00 | % | Quarterly | 06/20/2025 | 26,200 | 265 | 136 | 129 | ||||||||||||||||
| ICE CD CHILE 1.00 20DEC28 | 1.00 | % | Quarterly | 12/20/2028 | 210 | 3 | 4 | (1 | ) | |||||||||||||||
| ICE CD CXPHY534 5.00 20JU | 5.00 | % | Quarterly | 06/25/2025 | 6,092 | 159 | (81 | ) | 240 | |||||||||||||||
| ICE CD GE 1.00 20JUN26 P | 1.00 | % | Quarterly | 06/20/2026 | 1,175 | 17 | 10 | 7 | ||||||||||||||||
| ICE CD PHILIP 1.00 20DEC2 | 1.00 | % | Quarterly | 12/20/2028 | 390 | 3 | 3 | – | ||||||||||||||||
| REPUBLIC OF PERU | 1.00 | % | Quarterly | 12/20/2028 | 980 | 7 | 8 | (1 | ) | |||||||||||||||
| UNITED MEXICAN STATES | 1.00 | % | Quarterly | 12/20/2028 | 1,160 | (14 | ) | (13 | ) | (1 | ) | |||||||||||||
| $ | 599 | $ | 210 | $ | 389 |
322
SEI Institutional Managed Trust
| Percentages are based on Net Assets of $659,832 ($ Thousands). |
* | Non-income producing security. |
‡ | Real Estate Investment Trust. |
‡‡ | Expiration date not available. |
(A) | Security exempt from registration under Rule 144A of the Securities Act of 1933. These securities may be resold in transactions exempt from registration normally to qualified institutions. On September 30, 2023, the value of these securities amounted to $288,309 ($ Thousands), representing 43.7% of the Net Assets of the Fund. |
(B) | Level 3 security in accordance with fair value hierarchy. |
(C) | Security is in default on interest payment. |
(D) | Variable or floating rate security. The rate shown is the effective interest rate as of period end. The rates on certain securities are not based on published reference rates and spreads and are either determined by the issuer or agent based on current market conditions; by using a formula based on the rates of underlying loans; or by adjusting periodically based on prevailing interest rates. |
(E) | Perpetual security with no stated maturity date. |
(F) | Step coupon security. Coupon rate will either increase (step-up bond) or decrease (step-down bond) at regular intervals until maturity. Interest rate shown reflects the rate currently in effect. |
(G) | Unsettled bank loan. Interest rate may not be available. |
(H) | No interest rate available. |
(I) | Zero coupon security. |
The following is a summary of the level of inputs used as of September 30, 2023, in valuing the Fund's investments and other financial instruments carried at value ($ Thousands): |
Investments in Securities | Level 1 | Level 2 | Level 3 | Total | ||||||||||||
Corporate Obligations | – | 340,290 | – | ^ | 340,290 | |||||||||||
Loan Participations | – | 72,923 | 2,807 | 75,730 | ||||||||||||
Sovereign Debt | – | 57,902 | – | 57,902 | ||||||||||||
Mortgage-Backed Securities | – | 49,815 | – | 49,815 | ||||||||||||
Common Stock | 37,775 | – | 863 | 38,638 | ||||||||||||
Foreign Common Stock | 35,385 | – | – | 35,385 | ||||||||||||
Asset-Backed Securities | – | 32,306 | – | ^ | 32,306 | |||||||||||
Convertible Bonds | – | 1,413 | – | 1,413 | ||||||||||||
Preferred Stock | – | – | 1,195 | 1,195 | ||||||||||||
Municipal Bond | – | 201 | – | 201 | ||||||||||||
Warrants | – | 168 | – | 168 | ||||||||||||
Rights | – | – | – | ^ | – | |||||||||||
Purchased Options | 196 | – | – | 196 | ||||||||||||
Total Investments in Securities | 73,356 | 555,018 | 4,865 | 633,239 | ||||||||||||
Other Financial Instruments | Level 1 | Level 2 | Level 3 | Total | ||||||||||||
Written Options | (60 | ) | – | – | (60 | ) | ||||||||||
Futures Contracts* | ||||||||||||||||
Unrealized Appreciation | 290 | – | – | 290 | ||||||||||||
Unrealized Depreciation | (4,254 | ) | – | – | (4,254 | ) | ||||||||||
Forward Contracts* | ||||||||||||||||
Unrealized Appreciation | – | 1,318 | – | 1,318 | ||||||||||||
Unrealized Depreciation | – | (917 | ) | – | (917 | ) | ||||||||||
OTC Swap | ||||||||||||||||
Interest Rate Swap* | ||||||||||||||||
Unrealized Depreciation | – | (177 | ) | – | (177 | ) | ||||||||||
Centrally Cleared Swaps | ||||||||||||||||
Credit Default Swaps* | ||||||||||||||||
Unrealized Appreciation | – | 405 | – | 405 | ||||||||||||
Unrealized Depreciation | – | (9 | ) | – | (9 | ) | ||||||||||
Interest Rate Swaps* | ||||||||||||||||
Unrealized Appreciation | – | 1,730 | – | 1,730 | ||||||||||||
Unrealized Depreciation | – | (1,293 | ) | – | (1,293 | ) | ||||||||||
Total Other Financial Instruments | (4,024 | ) | 1,057 | – | (2,967 | ) | ||||||||||
(1) A reconciliation of Level 3 investments is presented when the Fund has a significant amount of Level 3 investments at the end of the period in relation to net assets. Management has concluded that Level 3 investments are not material in relation to net assets.
^ This category includes securities with a value less than $500.
* | Futures contracts, forward contracts and swap contracts are valued at the unrealized appreciation (depreciation) on the instrument. |
For more information on valuation inputs, see Note 2 – Significant Accounting Policies in Notes to Financial Statements.
Amounts designated as “—” are either $0 or have been rounded to $0.
See “Glossary” for abbreviations.
The accompanying notes are an integral part of the financial statements.
SEI Institutional Managed Trust
323
CONSOLIDATED SCHEDULE OF INVESTMENTS
September 30, 2023
Multi-Asset Inflation Managed Fund
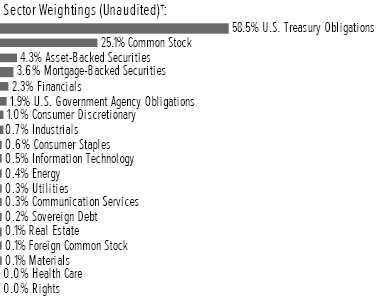
† | Percentages are based on total investments. Total investments do not include derivatives such as options, futures contracts, forward contracts, and swap contracts, if applicable. |
Description | Face Amount | Market Value | ||||||
U.S. TREASURY OBLIGATIONS — 66.8% | ||||||||
U.S. Treasury Bills ^ | ||||||||
5.408%, 07/11/2024 (A) | $ | 300 | $ | 288 | ||||
5.353%, 11/21/2023 (A) | 5,000 | 4,963 | ||||||
5.319%, 11/02/2023 (A) | 11,000 | 10,950 | ||||||
5.315%, 11/14/2023 (A) | 9,500 | 9,440 | ||||||
5.306%, 10/26/2023 (A) | 11,000 | 10,961 | ||||||
5.306%, 11/07/2023 (A) | 11,000 | 10,942 | ||||||
5.299%, 10/19/2023 (A) | 10,000 | 9,975 | ||||||
5.039%, 10/12/2023 (A) | 4,500 | 4,493 | ||||||
U.S. Treasury Inflation Protected Securities | ||||||||
0.750%, 07/15/2028 (I) | 10,952 | 10,190 | ||||||
0.375%, 07/15/2027 | 155,703 | 144,377 | ||||||
0.125%, 07/15/2024 (B) | 110,219 | 107,659 | ||||||
0.125%, 07/15/2026 (B) | 83,601 | 78,136 | ||||||
U.S. Treasury Notes ^ | ||||||||
5.618%, USBMMY3M + 0.200%, 01/31/2025 (C)(J) | 7,200 | 7,211 | ||||||
5.587%, USBMMY3M + 0.169%, 04/30/2025 (C) | 7,100 | 7,103 | ||||||
5.558%, USBMMY3M + 0.140%, 10/31/2024 (C) | 7,000 | 7,008 | ||||||
5.543%, USBMMY3M + 0.125%, 07/31/2025 (C) | 4,200 | 4,196 | ||||||
5.455%, USBMMY3M + 0.037%, 07/31/2024 (C) | 7,100 | 7,102 | ||||||
5.403%, USBMMY3M + -0.015%, 01/31/2024 (C)(J) | 9,900 | 9,901 | ||||||
5.343%, USBMMY3M + -0.075%, 04/30/2024 (C) | 5,000 | 4,999 | ||||||
5.000%, 08/31/2025 | 900 | 898 | ||||||
4.750%, 07/31/2025 | 700 | 695 | ||||||
4.625%, 02/28/2025 | 1,100 | 1,090 | ||||||
4.375%, 08/15/2026 | 700 | 691 | ||||||
Description | Face Amount | Market Value | ||||||
U.S. TREASURY OBLIGATIONS (continued) | ||||||||
4.000%, 02/15/2026 | $ | 600 | $ | 587 | ||||
Total U.S. Treasury Obligations | ||||||||
(Cost $462,369) ($ Thousands) | 453,855 | |||||||
| ||||||||
COMMON STOCK — 28.7% | ||||||||
Communication Services — 2.3% | ||||||||
Activision Blizzard Inc | 5,385 | 504 | ||||||
Alphabet Inc, Cl A * | 16,434 | 2,151 | ||||||
Alphabet Inc, Cl C * | 14,284 | 1,883 | ||||||
Anterix Inc * | 1,000 | 31 | ||||||
AT&T Inc (D) | 125,387 | 1,883 | ||||||
Cogent Communications Holdings Inc | 527 | 33 | ||||||
Electronic Arts Inc | 1,967 | 237 | ||||||
Frontier Communications Parent Inc * | 3,579 | 56 | ||||||
GCI Liberty Inc * | 1,700 | — | ||||||
Globalstar Inc * | 18,300 | 24 | ||||||
Gogo Inc * | 1,300 | 16 | ||||||
Iridium Communications Inc | 2,253 | 103 | ||||||
Liberty Media -Liberty Formula One, Cl C * | 1,436 | 90 | ||||||
Liberty Media -Liberty Live, Cl C * | 61 | 2 | ||||||
Live Nation Entertainment Inc * | 1,041 | 86 | ||||||
Lumen Technologies Inc | 18,871 | 27 | ||||||
Madison Square Garden Entertainment, Cl A * | 500 | 16 | ||||||
Madison Square Garden Sports Corp | 200 | 35 | ||||||
Marcus Corp/The | 1,500 | 23 | ||||||
Match Group Inc * | 615 | 24 | ||||||
Meta Platforms Inc, Cl A * | 6,143 | 1,844 | ||||||
Netflix Inc * | 3,045 | 1,150 | ||||||
Pinterest Inc, Cl A * | 1,527 | 41 | ||||||
ROBLOX Corp, Cl A * | 3,255 | 94 | ||||||
Roku Inc, Cl A * | 918 | 65 | ||||||
Spotify Technology SA * | 1,002 | 155 | ||||||
Take-Two Interactive Software Inc, Cl A * | 1,241 | 174 | ||||||
Telephone and Data Systems Inc | 1,600 | 29 | ||||||
TKO Group Holdings Inc | 400 | 34 | ||||||
T-Mobile US Inc | 9,820 | 1,375 | ||||||
Verizon Communications Inc | 73,484 | 2,382 | ||||||
Walt Disney Co/The * | 12,202 | 989 | ||||||
Warner Bros Discovery Inc *(D) | 14,759 | 160 | ||||||
ZoomInfo Technologies Inc, Cl A * | 897 | 15 | ||||||
| 15,731 | ||||||||
Consumer Staples — 7.1% | ||||||||
Albertsons Cos Inc, Cl A | 5,902 | 134 | ||||||
Altria Group Inc (D) | 33,833 | 1,423 | ||||||
Andersons Inc/The | 700 | 36 | ||||||
Archer-Daniels-Midland Co | 10,406 | 785 | ||||||
B&G Foods Inc, Cl A | 1,600 | 16 | ||||||
BellRing Brands Inc * | 2,498 | 103 | ||||||
324
SEI Institutional Managed Trust
Description | Shares | Market Value | ||||||
COMMON STOCK (continued) | ||||||||
Beyond Meat Inc * | 1,600 | $ | 15 | |||||
BJ's Wholesale Club Holdings Inc * | 2,723 | 194 | ||||||
Boston Beer Co Inc/The, Cl A * | 220 | 86 | ||||||
Brown-Forman Corp, Cl A | 805 | 47 | ||||||
Brown-Forman Corp, Cl B | 3,799 | 219 | ||||||
Bunge Ltd | 2,739 | 296 | ||||||
Cal-Maine Foods Inc | 923 | 45 | ||||||
Campbell Soup Co | 4,027 | 165 | ||||||
Casey's General Stores Inc | 548 | 149 | ||||||
Celsius Holdings Inc * | 1,096 | 188 | ||||||
Central Garden & Pet Co, Cl A * | 800 | 32 | ||||||
Chefs' Warehouse Inc/The * | 624 | 13 | ||||||
Church & Dwight Co Inc | 4,670 | 428 | ||||||
Clorox Co/The | 2,460 | 322 | ||||||
Coca-Cola Co/The (D) | 74,584 | 4,175 | ||||||
Coca-Cola Consolidated Inc | 92 | 59 | ||||||
Colgate-Palmolive Co | 15,536 | 1,105 | ||||||
Conagra Brands Inc | 9,676 | 265 | ||||||
Constellation Brands Inc, Cl A | 2,899 | 729 | ||||||
Costco Wholesale Corp (D) | 8,442 | 4,769 | ||||||
Coty Inc, Cl A * | 6,276 | 69 | ||||||
Darling Ingredients Inc * | 3,173 | 166 | ||||||
Dollar General Corp | 4,847 | 513 | ||||||
Dollar Tree Inc * | 3,930 | 418 | ||||||
Edgewell Personal Care Co | 1,021 | 38 | ||||||
elf Beauty Inc * | 1,018 | 112 | ||||||
Energizer Holdings Inc | 1,030 | 33 | ||||||
Estee Lauder Cos Inc/The, Cl A | 4,295 | 621 | ||||||
Flowers Foods Inc | 3,704 | 82 | ||||||
Freshpet Inc * | 959 | 63 | ||||||
General Mills Inc | 11,356 | 727 | ||||||
Grocery Outlet Holding Corp * | 1,488 | 43 | ||||||
Hain Celestial Group Inc/The * | 1,623 | 17 | ||||||
Herbalife Ltd * | 1,741 | 24 | ||||||
Hershey Co/The | 2,917 | 584 | ||||||
Hormel Foods Corp | 5,746 | 219 | ||||||
Hostess Brands Inc, Cl A * | 2,747 | 91 | ||||||
Ingles Markets Inc, Cl A | 244 | 18 | ||||||
Ingredion Inc | 1,343 | 132 | ||||||
Inter Parfums Inc | 362 | 49 | ||||||
J & J Snack Foods Corp | 289 | 47 | ||||||
J M Smucker Co/The | 2,128 | 262 | ||||||
Kellanova | 4,912 | 292 | ||||||
Kenvue Inc | 30,980 | 622 | ||||||
Keurig Dr Pepper Inc | 17,290 | 546 | ||||||
Kimberly-Clark Corp | 6,616 | 800 | ||||||
Kraft Heinz Co/The | 13,908 | 468 | ||||||
Kroger Co/The | 12,414 | 556 | ||||||
Lamb Weston Holdings Inc | 2,889 | 267 | ||||||
Lancaster Colony Corp | 382 | 63 | ||||||
McCormick & Co Inc/MD | 4,935 | 373 | ||||||
Medifast Inc | 244 | 18 | ||||||
Description | Shares | Market Value | ||||||
COMMON STOCK (continued) | ||||||||
MGP Ingredients Inc | 172 | $ | 18 | |||||
Molson Coors Beverage Co, Cl B | 3,320 | 211 | ||||||
Mondelez International Inc, Cl A | 25,773 | 1,789 | ||||||
Monster Beverage Corp * | 14,508 | 768 | ||||||
Nu Skin Enterprises Inc, Cl A | 1,000 | 21 | ||||||
PepsiCo Inc (D) | 26,490 | 4,488 | ||||||
Performance Food Group Co * | 2,982 | 176 | ||||||
Philip Morris International Inc (D) | 29,403 | 2,722 | ||||||
Pilgrim's Pride Corp * | 945 | 22 | ||||||
Post Holdings Inc * | 1,153 | 99 | ||||||
PriceSmart Inc | 400 | 30 | ||||||
Primo Water Corp | 3,197 | 44 | ||||||
Procter & Gamble Co/The (D) | 44,554 | 6,499 | ||||||
Simply Good Foods Co/The * | 1,649 | 57 | ||||||
Spectrum Brands Holdings Inc | 664 | 52 | ||||||
Sprouts Farmers Market Inc * | 2,262 | 97 | ||||||
Sysco Corp, Cl A | 9,604 | 634 | ||||||
Target Corp, Cl A | 8,570 | 948 | ||||||
TreeHouse Foods Inc * | 904 | 39 | ||||||
Tyson Foods Inc, Cl A (D) | 5,364 | 271 | ||||||
United Natural Foods Inc * | 1,213 | 17 | ||||||
Universal Corp/VA | 497 | 23 | ||||||
US Foods Holding Corp * | 4,316 | 171 | ||||||
Utz Brands Inc | 1,988 | 27 | ||||||
Vector Group Ltd | 1,726 | 18 | ||||||
Walgreens Boots Alliance Inc | 13,559 | 302 | ||||||
Walmart Inc (D) | 26,965 | 4,312 | ||||||
WD-40 Co | 260 | 53 | ||||||
Weis Markets Inc | 430 | 27 | ||||||
| 48,066 | ||||||||
Energy — 7.6% | ||||||||
Antero Midstream Corp | 9,736 | 117 | ||||||
Antero Resources Corp * | 7,702 | 195 | ||||||
APA Corp | 8,225 | 338 | ||||||
Archrock Inc | 3,390 | 43 | ||||||
Baker Hughes Co, Cl A | 26,194 | 925 | ||||||
Berry Corp | 3,100 | 25 | ||||||
Bristow Group Inc * | 534 | 15 | ||||||
Cactus Inc, Cl A | 1,812 | 91 | ||||||
California Resources Corp | 1,741 | 98 | ||||||
Callon Petroleum * | 1,389 | 54 | ||||||
ChampionX Corp | 5,340 | 190 | ||||||
Cheniere Energy Inc | 6,445 | 1,070 | ||||||
Chesapeake Energy Corp | 3,194 | 275 | ||||||
Chevron Corp (D) | 45,010 | 7,590 | ||||||
Chord Energy Corp | 1,090 | 177 | ||||||
Civitas Resources Inc | 1,679 | 136 | ||||||
Clean Energy Fuels Corp * | 5,202 | 20 | ||||||
CNX Resources Corp * | 4,229 | 95 | ||||||
Comstock Resources Inc | 2,387 | 26 | ||||||
ConocoPhillips (D) | 31,031 | 3,718 | ||||||
CONSOL Energy Inc | 977 | 103 | ||||||
SEI Institutional Managed Trust
325
CONSOLIDATED SCHEDULE OF INVESTMENTS
September 30, 2023
Multi-Asset Inflation Managed Fund (Continued)
Description | Shares | Market Value | ||||||
COMMON STOCK (continued) | ||||||||
Core Laboratories | 900 | $ | 22 | |||||
Coterra Energy Inc | 19,796 | 535 | ||||||
CVR Energy Inc | 1,100 | 37 | ||||||
Delek US Holdings Inc | 1,629 | 46 | ||||||
Denbury * | 1,416 | 139 | ||||||
Devon Energy Corp | 16,520 | 788 | ||||||
DHT Holdings Inc | 3,600 | 37 | ||||||
Diamond Offshore Drilling * | 2,078 | 31 | ||||||
Diamondback Energy Inc, Cl A | 4,653 | 721 | ||||||
Dorian LPG Ltd | 1,100 | 32 | ||||||
Dril-Quip Inc * | 1,031 | 29 | ||||||
DT Midstream Inc | 2,545 | 135 | ||||||
Energy Fuels Inc/Canada * | 4,600 | 38 | ||||||
EOG Resources Inc | 15,118 | 1,916 | ||||||
EQT Corp | 9,302 | 377 | ||||||
Equitrans Midstream Corp | 10,419 | 98 | ||||||
Expro Group Holdings NV * | 2,400 | 56 | ||||||
Exxon Mobil Corp (D) | 103,757 | 12,200 | ||||||
Green Plains Inc * | 1,600 | 48 | ||||||
Gulfport Energy Corp * | 323 | 38 | ||||||
Halliburton Co | 23,535 | 953 | ||||||
Helix Energy Solutions Group Inc * | 3,640 | 41 | ||||||
Helmerich & Payne Inc | 2,950 | 124 | ||||||
Hess Corp | 7,241 | 1,108 | ||||||
HF Sinclair Corp | 3,762 | 214 | ||||||
International Seaways Inc | 872 | 39 | ||||||
Kinder Morgan Inc | 52,929 | 878 | ||||||
Kinetik Holdings, Cl A | 700 | 24 | ||||||
Liberty Energy Inc, Cl A | 3,518 | 65 | ||||||
Magnolia Oil & Gas Corp, Cl A | 4,900 | 112 | ||||||
Marathon Oil Corp | 16,554 | 443 | ||||||
Marathon Petroleum Corp (D) | 11,337 | 1,716 | ||||||
Matador Resources Co | 3,062 | 182 | ||||||
Murphy Oil Corp | 4,076 | 185 | ||||||
Nabors Industries Ltd * | 162 | 20 | ||||||
New Fortress Energy Inc, Cl A | 1,310 | 43 | ||||||
Noble Corp PLC | 2,109 | 107 | ||||||
Nordic American Tankers Ltd | 7,400 | 30 | ||||||
Northern Oil and Gas Inc | 1,737 | 70 | ||||||
NOV Inc | 10,471 | 219 | ||||||
Occidental Petroleum Corp | 18,024 | 1,169 | ||||||
Oceaneering International Inc, Cl A * | 2,944 | 76 | ||||||
Oil States International Inc * | 2,500 | 21 | ||||||
ONEOK Inc | 11,677 | 741 | ||||||
Ovintiv Inc | 6,439 | 306 | ||||||
Par Pacific Holdings Inc * | 914 | 33 | ||||||
Patterson-UTI Energy Inc | 6,529 | 90 | ||||||
PBF Energy Inc, Cl A | 2,792 | 149 | ||||||
Peabody Energy Corp | 3,127 | 81 | ||||||
Permian Resources Corp, Cl A | 6,669 | 93 | ||||||
Phillips 66 | 11,763 | 1,413 | ||||||
Pioneer Natural Resources Co | 6,038 | 1,386 | ||||||
Description | Shares | Market Value | ||||||
COMMON STOCK (continued) | ||||||||
ProPetro Holding Corp * | 3,200 | $ | 34 | |||||
Range Resources Corp | 5,957 | 193 | ||||||
REX American Resources Corp * | 800 | 33 | ||||||
SandRidge Energy Inc | 1,300 | 20 | ||||||
Schlumberger NV, Cl A | 36,656 | 2,137 | ||||||
Seadrill * | 1,100 | 49 | ||||||
Select Water Solutions Inc, Cl A | 3,100 | 25 | ||||||
Sitio Royalties Corp, Cl A | 2,300 | 56 | ||||||
SM Energy Co | 3,033 | 120 | ||||||
Southwestern Energy Co * | 27,510 | 177 | ||||||
Talos Energy Inc * | 2,700 | 44 | ||||||
Targa Resources Corp | 6,004 | 515 | ||||||
Texas Pacific Land Corp | 148 | 270 | ||||||
Tidewater Inc * | 1,111 | 79 | ||||||
Uranium Energy * | 10,495 | 54 | ||||||
US Silica Holdings Inc * | 2,300 | 32 | ||||||
Valaris * | 1,562 | 117 | ||||||
Valero Energy Corp (D) | 9,432 | 1,337 | ||||||
Vital Energy * | 438 | 24 | ||||||
Vitesse Energy Inc | 1,100 | 25 | ||||||
Weatherford International PLC * | 1,769 | 160 | ||||||
Williams Cos Inc/The | 32,612 | 1,099 | ||||||
World Kinect Corp | 1,161 | 26 | ||||||
| 51,381 | ||||||||
Health Care — 5.7% | ||||||||
10X Genomics Inc, Cl A * | 859 | 35 | ||||||
Abbott Laboratories | 12,342 | 1,195 | ||||||
AbbVie Inc | 12,570 | 1,874 | ||||||
Acadia Healthcare Co Inc, Cl A * | 630 | 44 | ||||||
ACADIA Pharmaceuticals Inc * | 1,368 | 29 | ||||||
Agilent Technologies Inc | 2,148 | 240 | ||||||
agilon health Inc * | 1,237 | 22 | ||||||
Akero Therapeutics Inc * | 500 | 25 | ||||||
Align Technology Inc * | 556 | 170 | ||||||
Alkermes PLC * | 1,921 | 54 | ||||||
Alnylam Pharmaceuticals Inc * | 985 | 174 | ||||||
Amedisys Inc * | 244 | 23 | ||||||
Amgen Inc, Cl A (D) | 3,846 | 1,034 | ||||||
Amicus Therapeutics Inc * | 2,000 | 24 | ||||||
AMN Healthcare Services Inc * | 330 | 28 | ||||||
Amphastar Pharmaceuticals Inc * | 300 | 14 | ||||||
Apellis Pharmaceuticals Inc * | 667 | 25 | ||||||
Arrowhead Pharmaceuticals Inc * | 730 | 20 | ||||||
Avantor Inc * | 4,846 | 102 | ||||||
Axonics Inc * | 416 | 23 | ||||||
Axsome Therapeutics Inc * | 300 | 21 | ||||||
Azenta Inc * | 700 | 35 | ||||||
Baxter International Inc (D) | 3,630 | 137 | ||||||
Beam Therapeutics * | 669 | 16 | ||||||
Becton Dickinson & Co | 2,016 | 521 | ||||||
BioCryst Pharmaceuticals Inc * | 3,287 | 23 | ||||||
Biogen Inc * | 1,041 | 268 | ||||||
326
SEI Institutional Managed Trust
Description | Shares | Market Value | ||||||
COMMON STOCK (continued) | ||||||||
BioMarin Pharmaceutical Inc * | 1,420 | $ | 126 | |||||
Bio-Rad Laboratories Inc, Cl A * | 142 | 51 | ||||||
Bio-Techne Corp | 1,010 | 69 | ||||||
Blueprint Medicines Corp * | 389 | 20 | ||||||
Boston Scientific Corp * | 10,234 | 540 | ||||||
Bridgebio Pharma Inc * | 900 | 24 | ||||||
Bristol-Myers Squibb Co | 14,840 | 861 | ||||||
Bruker Corp | 802 | 50 | ||||||
Cardinal Health Inc | 1,827 | 159 | ||||||
Catalent Inc * | 1,252 | 57 | ||||||
Cencora Inc, Cl A | 1,156 | 208 | ||||||
Centene Corp * | 3,831 | 264 | ||||||
Cerevel Therapeutics Holdings * | 600 | 13 | ||||||
Certara Inc * | 1,200 | 17 | ||||||
Charles River Laboratories International Inc * | 396 | 78 | ||||||
Chemed Corp | 100 | 52 | ||||||
Cigna Group/The | 2,077 | 594 | ||||||
CONMED Corp | 359 | 36 | ||||||
Cooper Cos Inc/The, Cl A | 405 | 129 | ||||||
Crinetics Pharmaceuticals Inc * | 1,200 | 36 | ||||||
CVS Health Corp | 9,207 | 643 | ||||||
Cytokinetics Inc * | 967 | 28 | ||||||
Danaher Corp, Cl A | 4,698 | 1,166 | ||||||
DaVita Inc * | 499 | 47 | ||||||
Denali Therapeutics Inc * | 876 | 18 | ||||||
DENTSPLY SIRONA Inc | 1,315 | 45 | ||||||
Dexcom Inc * | 2,813 | 262 | ||||||
Doximity Inc, Cl A * | 621 | 13 | ||||||
Dynavax Technologies Corp * | 1,400 | 21 | ||||||
Edwards Lifesciences Corp, Cl A * | 5,467 | 379 | ||||||
Elanco Animal Health Inc * | 3,057 | 34 | ||||||
Elevance Health Inc | 1,684 | 733 | ||||||
Eli Lilly & Co | 5,846 | 3,140 | ||||||
Embecta | 800 | 12 | ||||||
Encompass Health Corp | 777 | 52 | ||||||
Enovis Corp * | 600 | 32 | ||||||
Ensign Group Inc/The | 243 | 23 | ||||||
Envista Holdings Corp * | 1,312 | 37 | ||||||
Evolent Health Inc, Cl A * | 1,100 | 30 | ||||||
Exact Sciences Corp * | 1,347 | 92 | ||||||
Exelixis Inc * | 1,765 | 39 | ||||||
GE HealthCare Technologies Inc | 2,799 | 190 | ||||||
Geron * | 6,200 | 13 | ||||||
Gilead Sciences Inc (D) | 9,381 | 703 | ||||||
Glaukos Corp * | 300 | 23 | ||||||
Globus Medical Inc, Cl A * | 616 | 31 | ||||||
Guardant Health Inc * | 1,000 | 30 | ||||||
Haemonetics Corp * | 463 | 41 | ||||||
Halozyme Therapeutics Inc * | 1,037 | 40 | ||||||
HCA Healthcare Inc | 1,518 | 373 | ||||||
HealthEquity Inc * | 444 | 32 | ||||||
Description | Shares | Market Value | ||||||
COMMON STOCK (continued) | ||||||||
Henry Schein Inc * | 773 | $ | 57 | |||||
Hologic Inc * | 1,734 | 120 | ||||||
Horizon Therapeutics Plc * | 1,612 | 187 | ||||||
Humana Inc | 841 | 409 | ||||||
ICON PLC * | 615 | 151 | ||||||
IDEXX Laboratories Inc * | 587 | 257 | ||||||
Illumina Inc * | 1,188 | 163 | ||||||
ImmunoGen Inc * | 1,600 | 25 | ||||||
Inari Medical * | 438 | 29 | ||||||
Incyte Corp * | 1,423 | 82 | ||||||
Inmode * | 500 | 15 | ||||||
Insmed Inc * | 978 | 25 | ||||||
Inspire Medical Systems Inc * | 203 | 40 | ||||||
Insulet Corp * | 491 | 78 | ||||||
Integra LifeSciences Holdings Corp * | 462 | 18 | ||||||
Intellia Therapeutics * | 968 | 31 | ||||||
Intra-Cellular Therapies Inc, Cl A * | 567 | 30 | ||||||
Intuitive Surgical Inc * | 2,485 | 726 | ||||||
Ionis Pharmaceuticals Inc * | 841 | 38 | ||||||
Iovance Biotherapeutics Inc * | 2,700 | 12 | ||||||
IQVIA Holdings Inc * | 1,321 | 260 | ||||||
iRhythm Technologies Inc * | 262 | 25 | ||||||
Jazz Pharmaceuticals PLC * | 367 | 48 | ||||||
Johnson & Johnson | 17,506 | 2,727 | ||||||
Karuna Therapeutics Inc * | 275 | 47 | ||||||
Krystal Biotech Inc * | 200 | 23 | ||||||
Laboratory Corp of America Holdings | 571 | 115 | ||||||
Lantheus Holdings Inc * | 498 | 35 | ||||||
LivaNova PLC * | 414 | 22 | ||||||
Masimo Corp * | 338 | 30 | ||||||
McKesson Corp | 992 | 431 | ||||||
Medpace Holdings Inc * | 166 | 40 | ||||||
Medtronic PLC | 9,366 | 734 | ||||||
Merck & Co Inc | 18,019 | 1,855 | ||||||
Merit Medical Systems Inc * | 444 | 31 | ||||||
Mettler-Toledo International Inc * | 151 | 167 | ||||||
Moderna Inc * | 2,477 | 256 | ||||||
Molina Healthcare Inc * | 364 | 119 | ||||||
Natera Inc * | 481 | 21 | ||||||
Neogen Corp, Cl B * | 1,862 | 35 | ||||||
NeoGenomics Inc * | 1,200 | 15 | ||||||
Neurocrine Biosciences Inc * | 720 | 81 | ||||||
Novocure Ltd * | 610 | 10 | ||||||
Omnicell Inc * | 500 | 23 | ||||||
Option Care Health Inc * | 1,155 | 37 | ||||||
Organon & Co | 1,600 | 28 | ||||||
Pacific Biosciences of California Inc * | 2,300 | 19 | ||||||
Pacira BioSciences Inc * | 527 | 16 | ||||||
Penumbra Inc * | 302 | 73 | ||||||
Perrigo Co PLC | 900 | 29 | ||||||
Pfizer Inc | 39,886 | 1,323 | ||||||
Premier Inc, Cl A | 1,400 | 30 | ||||||
SEI Institutional Managed Trust
327
CONSOLIDATED SCHEDULE OF INVESTMENTS
September 30, 2023
Multi-Asset Inflation Managed Fund (Continued)
Description | Shares | Market Value | ||||||
COMMON STOCK (continued) | ||||||||
Progyny Inc * | 716 | $ | 24 | |||||
PTC Therapeutics Inc * | 534 | 12 | ||||||
QIAGEN NV * | 1,980 | 80 | ||||||
Quest Diagnostics Inc | 811 | 99 | ||||||
QuidelOrtho Corp * | 400 | 29 | ||||||
R1 RCM Inc * | 1,648 | 25 | ||||||
Regeneron Pharmaceuticals Inc * | 742 | 611 | ||||||
Repligen Corp * | 337 | 54 | ||||||
ResMed Inc | 945 | 140 | ||||||
Revance Therapeutics Inc * | 912 | 10 | ||||||
REVOLUTION Medicines * | 955 | 26 | ||||||
Revvity Inc | 810 | 90 | ||||||
Roivant Sciences Ltd * | 2,000 | 23 | ||||||
Royalty Pharma PLC, Cl A | 2,632 | 71 | ||||||
Sarepta Therapeutics Inc * | 609 | 74 | ||||||
Schrodinger Inc/United States * | 400 | 11 | ||||||
Seagen Inc * | 976 | 207 | ||||||
Select Medical Holdings Corp | 800 | 20 | ||||||
Shockwave Medical Inc * | 270 | 54 | ||||||
Silk Road Medical Inc * | 6 | — | ||||||
Sotera Health Co * | 1,200 | 18 | ||||||
SpringWorks Therapeutics Inc * | 600 | 14 | ||||||
STAAR Surgical Co * | 497 | 20 | ||||||
STERIS PLC | 699 | 153 | ||||||
Stryker Corp | 2,552 | 697 | ||||||
Tandem Diabetes Care Inc * | 625 | 13 | ||||||
Teladoc Health Inc * | 1,010 | 19 | ||||||
Teleflex Inc | 332 | 65 | ||||||
Tenet Healthcare Corp * | 787 | 52 | ||||||
Thermo Fisher Scientific Inc | 2,721 | 1,377 | ||||||
Travere Therapeutics Inc * | 1,100 | 10 | ||||||
Twist Bioscience Corp * | 978 | 20 | ||||||
Ultragenyx Pharmaceutical Inc * | 500 | 18 | ||||||
United Therapeutics Corp * | 307 | 69 | ||||||
UnitedHealth Group Inc (D) | 6,713 | 3,385 | ||||||
Universal Health Services Inc, Cl B | 447 | 56 | ||||||
Vaxcyte Inc * | 790 | 40 | ||||||
Veeva Systems Inc, Cl A * | 989 | 201 | ||||||
Vertex Pharmaceuticals Inc * | 1,836 | 638 | ||||||
Viatris Inc, Cl W | 7,870 | 78 | ||||||
Waters Corp * | 366 | 100 | ||||||
West Pharmaceutical Services Inc | 562 | 211 | ||||||
Xencor Inc * | 1,152 | 23 | ||||||
Zimmer Biomet Holdings Inc | 1,621 | 182 | ||||||
Zoetis Inc, Cl A | 3,485 | 606 | ||||||
| 38,805 | ||||||||
Information Technology — 1.9% | ||||||||
Accenture PLC, Cl A | 1,865 | 573 | ||||||
Adobe Inc * | 1,305 | 665 | ||||||
Akamai Technologies Inc * | 400 | 43 | ||||||
Amdocs Ltd | 506 | 43 | ||||||
ANSYS Inc * | 305 | 91 | ||||||
Description | Shares | Market Value | ||||||
COMMON STOCK (continued) | ||||||||
AppLovin Corp, Cl A * | 700 | $ | 28 | |||||
Aspen Technology Inc * | 180 | 37 | ||||||
Atlassian Corp, Cl A * | 445 | 90 | ||||||
Autodesk Inc, Cl A * | 604 | 125 | ||||||
Bentley Systems Inc, Cl B | 500 | 25 | ||||||
BILL Holdings Inc * | 249 | 27 | ||||||
Cadence Design Systems Inc * | 812 | 190 | ||||||
Cloudflare Inc, Cl A * | 640 | 40 | ||||||
Cognizant Technology Solutions Corp, Cl A | 1,350 | 91 | ||||||
Confluent Inc, Cl A * | 600 | 18 | ||||||
Crowdstrike Holdings Inc, Cl A * | 482 | 81 | ||||||
Datadog Inc, Cl A * | 816 | 74 | ||||||
DocuSign Inc, Cl A * | 653 | 27 | ||||||
DXC Technology Co * | 800 | 17 | ||||||
Dynatrace Inc * | 716 | 33 | ||||||
EPAM Systems Inc * | 131 | 34 | ||||||
Fair Isaac Corp * | 87 | 76 | ||||||
Five9 Inc * | 300 | 19 | ||||||
Fortinet Inc * | 1,745 | 102 | ||||||
Gartner Inc * | 238 | 82 | ||||||
Gen Digital Inc | 1,074 | 19 | ||||||
GoDaddy Inc, Cl A * | 419 | 31 | ||||||
Guidewire Software Inc, Cl Z * | 353 | 32 | ||||||
HubSpot Inc * | 125 | 62 | ||||||
International Business Machines Corp | 2,674 | 375 | ||||||
Intuit Inc | 822 | 420 | ||||||
Manhattan Associates Inc * | 282 | 56 | ||||||
Microsoft Corp (D) | 21,300 | 6,726 | ||||||
MongoDB Inc, Cl A * | 194 | 67 | ||||||
Nutanix Inc, Cl A * | 803 | 28 | ||||||
Okta Inc, Cl A * | 416 | 34 | ||||||
Oracle Corp, Cl B | 4,496 | 476 | ||||||
Palantir Technologies Inc, Cl A * | 4,502 | 72 | ||||||
Palo Alto Networks Inc * | 859 | 201 | ||||||
PTC Inc * | 430 | 61 | ||||||
Roper Technologies Inc | 390 | 189 | ||||||
Salesforce Inc * | 2,695 | 547 | ||||||
ServiceNow Inc * | 605 | 338 | ||||||
Snowflake Inc, Cl A * | 799 | 122 | ||||||
Splunk Inc * | 394 | 58 | ||||||
Synopsys Inc * | 483 | 222 | ||||||
Twilio Inc, Cl A * | 500 | 29 | ||||||
Tyler Technologies Inc * | 169 | 65 | ||||||
UiPath Inc, Cl A * | 1,400 | 24 | ||||||
Unity Software Inc * | 650 | 20 | ||||||
VeriSign Inc * | 214 | 43 | ||||||
VMware Inc, Cl A * | 747 | 124 | ||||||
Workday Inc, Cl A * | 634 | 136 | ||||||
Zoom Video Communications Inc, Cl A * | 918 | 64 | ||||||
Zscaler Inc * | 260 | 40 | ||||||
| 13,312 | ||||||||
328
SEI Institutional Managed Trust
Description | Shares | Market Value | ||||||
COMMON STOCK (continued) | ||||||||
Real Estate — 2.7% | ||||||||
Acadia Realty Trust ‡ | 2,011 | $ | 29 | |||||
Agree Realty Corp ‡ | 1,302 | 72 | ||||||
Alexander & Baldwin Inc ‡ | 1,640 | 27 | ||||||
Alexandria Real Estate Equities Inc ‡ | 2,802 | 281 | ||||||
American Assets Trust Inc ‡ | 984 | 19 | ||||||
American Homes 4 Rent, Cl A ‡ | 5,500 | 185 | ||||||
American Tower Corp, Cl A ‡ | 7,197 | 1,184 | ||||||
Americold Realty Trust Inc ‡ | 4,338 | 132 | ||||||
Anywhere Real Estate Inc * | 2,300 | 15 | ||||||
Apartment Income Corp ‡ | 2,265 | 70 | ||||||
Apple Hospitality REIT Inc ‡ | 3,776 | 58 | ||||||
Armada Hoffler Properties Inc ‡ | 2,500 | 26 | ||||||
AvalonBay Communities Inc ‡ | 2,178 | 374 | ||||||
Boston Properties Inc ‡ | 2,505 | 149 | ||||||
Brixmor Property Group Inc ‡ | 4,280 | 89 | ||||||
Broadstone Net Lease Inc, Cl A ‡ | 2,701 | 39 | ||||||
Camden Property Trust ‡ | 1,672 | 158 | ||||||
CareTrust REIT Inc ‡ | 1,850 | 38 | ||||||
CBRE Group Inc, Cl A * | 4,957 | 366 | ||||||
Community Healthcare Trust Inc ‡ | 600 | 18 | ||||||
Compass, Cl A *‡ | 5,600 | 16 | ||||||
Corporate Office Properties Trust ‡ | 1,245 | 30 | ||||||
CoStar Group Inc * | 6,712 | 516 | ||||||
Cousins Properties Inc ‡ | 2,006 | 41 | ||||||
Crown Castle Inc ‡ | 6,749 | 621 | ||||||
CubeSmart ‡ | 3,649 | 139 | ||||||
Cushman & Wakefield PLC * | 2,903 | 22 | ||||||
DiamondRock Hospitality Co ‡ | 4,869 | 39 | ||||||
Digital Realty Trust Inc, Cl A ‡ | 4,501 | 545 | ||||||
DigitalBridge Group | 1,916 | 34 | ||||||
Douglas Emmett Inc ‡ | 2,051 | 26 | ||||||
Easterly Government Properties Inc, Cl A ‡ | 1,801 | 21 | ||||||
EastGroup Properties Inc ‡ | 762 | 127 | ||||||
Elme Communities ‡ | 1,907 | 26 | ||||||
Empire State Realty Trust Inc, Cl A ‡ | 3,635 | 29 | ||||||
EPR Properties, Cl A ‡ | 1,136 | 47 | ||||||
Equinix Inc ‡ | 1,444 | 1,049 | ||||||
Equity Commonwealth ‡ | 1,656 | 30 | ||||||
Equity LifeStyle Properties Inc ‡ | 2,777 | 177 | ||||||
Equity Residential ‡ | 5,645 | 331 | ||||||
Essential Properties Realty Trust Inc ‡ | 2,357 | 51 | ||||||
Essex Property Trust Inc ‡ | 970 | 206 | ||||||
eXp World Holdings Inc | 1,000 | 16 | ||||||
Extra Space Storage Inc ‡ | 3,773 | 459 | ||||||
Federal Realty Investment Trust ‡ | 1,223 | 111 | ||||||
First Industrial Realty Trust Inc ‡ | 2,362 | 112 | ||||||
Four Corners Property Trust Inc ‡ | 1,654 | 37 | ||||||
Gaming and Leisure Properties Inc ‡ | 4,158 | 189 | ||||||
Getty Realty Corp ‡ | 1,063 | 29 | ||||||
Global Net Lease Inc ‡ | 2,522 | 24 | ||||||
Healthcare Realty Trust Inc, Cl A ‡ | 5,463 | 83 | ||||||
Description | Shares | Market Value | ||||||
COMMON STOCK (continued) | ||||||||
Healthpeak Properties Inc ‡ | 9,107 | $ | 167 | |||||
Highwoods Properties Inc ‡ | 1,522 | 31 | ||||||
Host Hotels & Resorts Inc ‡ | 11,470 | 184 | ||||||
Howard Hughes Holdings Inc * | 800 | 59 | ||||||
Independence Realty Trust Inc ‡ | 3,270 | 46 | ||||||
Innovative Industrial Properties Inc, Cl A ‡ | 453 | 34 | ||||||
InvenTrust Properties Corp ‡ | 1,781 | 42 | ||||||
Invitation Homes Inc ‡ | 9,778 | 310 | ||||||
Iron Mountain Inc ‡ | 4,395 | 261 | ||||||
JBG SMITH Properties ‡ | 1,501 | 22 | ||||||
Jones Lang LaSalle Inc * | 725 | 102 | ||||||
Kennedy-Wilson Holdings Inc | 2,400 | 35 | ||||||
Kilroy Realty Corp ‡ | 1,674 | 53 | ||||||
Kimco Realty Corp ‡ | 9,547 | 168 | ||||||
Kite Realty Group Trust ‡ | 3,508 | 75 | ||||||
Lamar Advertising Co, Cl A ‡ | 1,259 | 105 | ||||||
LTC Properties Inc ‡ | 965 | 31 | ||||||
LXP Industrial Trust, Cl B ‡ | 4,262 | 38 | ||||||
Macerich Co/The ‡ | 3,063 | 33 | ||||||
Medical Properties Trust Inc ‡ | 8,748 | 48 | ||||||
Mid-America Apartment Communities Inc ‡ | 1,871 | 241 | ||||||
National Health Investors Inc ‡ | 646 | 33 | ||||||
National Storage Affiliates Trust ‡ | 1,425 | 45 | ||||||
NETSTREIT Corp ‡ | 1,878 | 29 | ||||||
NNN REIT Inc ‡ | 2,876 | 102 | ||||||
Omega Healthcare Investors Inc ‡ | 3,521 | 117 | ||||||
Opendoor Technologies Inc * | 6,700 | 18 | ||||||
Outfront Media Inc ‡ | 2,138 | 22 | ||||||
Park Hotels & Resorts Inc ‡ | 3,365 | 41 | ||||||
Pebblebrook Hotel Trust ‡ | 2,188 | 30 | ||||||
Phillips Edison & Co Inc ‡ | 1,658 | 56 | ||||||
Physicians Realty Trust ‡ | 2,509 | 31 | ||||||
Piedmont Office Realty Trust Inc, Cl A ‡ | 2,900 | 16 | ||||||
Postal Realty Trust Inc, Cl A ‡ | 2,000 | 27 | ||||||
PotlatchDeltic Corp ‡ | 1,143 | 52 | ||||||
Prologis Inc ‡ | 14,342 | 1,609 | ||||||
Public Storage ‡ | 2,454 | 647 | ||||||
Rayonier Inc ‡ | 2,166 | 62 | ||||||
Realty Income Corp ‡ | 10,179 | 508 | ||||||
Redfin Corp * | 1,600 | 11 | ||||||
Regency Centers Corp ‡ | 2,644 | 157 | ||||||
Retail Opportunity Investments Corp ‡ | 1,522 | 19 | ||||||
Rexford Industrial Realty Inc ‡ | 3,377 | 167 | ||||||
RLJ Lodging Trust ‡ | 3,389 | 33 | ||||||
Ryman Hospitality Properties Inc ‡ | 758 | 63 | ||||||
Sabra Health Care REIT Inc ‡ | 2,596 | 36 | ||||||
Saul Centers Inc ‡ | 648 | 23 | ||||||
SBA Communications Corp, Cl A ‡ | 1,666 | 334 | ||||||
Service Properties Trust ‡ | 3,812 | 29 | ||||||
Simon Property Group Inc ‡ | 5,015 | 542 | ||||||
SITE Centers Corp ‡ | 2,368 | 29 | ||||||
SL Green Realty Corp ‡ | 753 | 28 | ||||||
SEI Institutional Managed Trust
329
CONSOLIDATED SCHEDULE OF INVESTMENTS
September 30, 2023
Multi-Asset Inflation Managed Fund (Continued)
Description | Shares | Market Value | ||||||
COMMON STOCK (continued) | ||||||||
Spirit Realty Capital Inc ‡ | 2,103 | $ | 71 | |||||
St Joe Co/The | 700 | 38 | ||||||
STAG Industrial Inc ‡ | 2,480 | 86 | ||||||
Sun Communities Inc ‡ | 1,947 | 230 | ||||||
Sunstone Hotel Investors Inc ‡ | 4,286 | 40 | ||||||
Tanger Factory Outlet Centers Inc ‡ | 1,256 | 28 | ||||||
Terreno Realty Corp ‡ | 1,234 | 70 | ||||||
UDR Inc ‡ | 5,446 | 194 | ||||||
Uniti Group Inc ‡ | 3,500 | 17 | ||||||
Urban Edge Properties ‡ | 2,241 | 34 | ||||||
Ventas Inc ‡ | 6,184 | 261 | ||||||
Veris Residential Inc ‡ | 1,108 | 18 | ||||||
VICI Properties Inc, Cl A ‡ | 16,051 | 467 | ||||||
Vornado Realty Trust ‡ | 2,237 | 51 | ||||||
Welltower Inc ‡ | 7,758 | 636 | ||||||
Weyerhaeuser Co ‡ | 11,404 | 350 | ||||||
WP Carey Inc ‡ | 3,313 | 179 | ||||||
Xenia Hotels & Resorts Inc ‡ | 1,762 | 21 | ||||||
Zillow Group Inc, Cl A * | 876 | 39 | ||||||
Zillow Group Inc, Cl C * | 2,250 | 104 | ||||||
| 18,447 | ||||||||
Utilities — 1.4% | ||||||||
AES Corp/The | 6,326 | 96 | ||||||
ALLETE Inc | 698 | 37 | ||||||
Alliant Energy Corp | 2,214 | 107 | ||||||
Ameren Corp | 2,322 | 174 | ||||||
American Electric Power Co Inc | 4,930 | 371 | ||||||
American States Water Co | 438 | 34 | ||||||
American Water Works Co Inc | 1,737 | 215 | ||||||
Atmos Energy Corp | 1,306 | 138 | ||||||
Avangrid Inc | 876 | 26 | ||||||
Avista Corp | 876 | 28 | ||||||
Black Hills Corp, Cl A | 1,398 | 71 | ||||||
Brookfield Renewable Corp, Cl A | 955 | 23 | ||||||
California Water Service Group, Cl A | 890 | 42 | ||||||
CenterPoint Energy Inc | 5,887 | 158 | ||||||
Chesapeake Utilities Corp | 200 | 19 | ||||||
Clearway Energy Inc, Cl C | 1,083 | 23 | ||||||
CMS Energy Corp | 2,536 | 135 | ||||||
Consolidated Edison Inc | 3,330 | 285 | ||||||
Constellation Energy Corp | 3,035 | 331 | ||||||
Dominion Energy Inc | 8,801 | 393 | ||||||
DTE Energy Co | 1,800 | 179 | ||||||
Duke Energy Corp | 7,942 | 701 | ||||||
Edison International | 3,793 | 240 | ||||||
Entergy Corp | 1,837 | 170 | ||||||
Essential Utilities Inc | 2,696 | 92 | ||||||
Evergy Inc | 1,716 | 87 | ||||||
Eversource Energy | 3,303 | 192 | ||||||
Exelon Corp | 9,416 | 356 | ||||||
FirstEnergy Corp | 4,939 | 169 | ||||||
Hawaiian Electric Industries Inc | 1,510 | 19 | ||||||
Description | Shares | Market Value | ||||||
COMMON STOCK (continued) | ||||||||
IDACORP Inc, Cl A | 343 | $ | 32 | |||||
MGE Energy Inc | 425 | 29 | ||||||
National Fuel Gas Co | 862 | 45 | ||||||
New Jersey Resources Corp | 1,036 | 42 | ||||||
NextEra Energy Inc | 20,306 | 1,163 | ||||||
NiSource Inc | 3,940 | 97 | ||||||
NorthWestern Corp | 806 | 39 | ||||||
NRG Energy Inc | 1,818 | 70 | ||||||
OGE Energy Corp | 1,325 | 44 | ||||||
ONE Gas Inc | 343 | 23 | ||||||
Ormat Technologies Inc | 400 | 28 | ||||||
Otter Tail Corp | 400 | 30 | ||||||
PG&E Corp * | 15,170 | 245 | ||||||
Pinnacle West Capital Corp | 958 | 71 | ||||||
PNM Resources Inc | 491 | 22 | ||||||
Portland General Electric Co | 857 | 35 | ||||||
PPL Corp | 7,091 | 167 | ||||||
Public Service Enterprise Group Inc | 4,764 | 271 | ||||||
Sempra | 5,983 | 407 | ||||||
SJW Group | 410 | 25 | ||||||
Southern Co/The | 11,137 | 721 | ||||||
Southwest Gas Holdings Inc | 838 | 51 | ||||||
Sunnova Energy International Inc * | 1,200 | 13 | ||||||
UGI Corp | 2,040 | 47 | ||||||
Vistra Corp | 3,401 | 113 | ||||||
WEC Energy Group Inc | 3,003 | 242 | ||||||
Xcel Energy Inc | 5,236 | 300 | ||||||
York Water Co/The | 600 | 22 | ||||||
| 9,305 | ||||||||
Total Common Stock | ||||||||
(Cost $114,155) ($ Thousands) | 195,047 | |||||||
| ||||||||
CORPORATE OBLIGATIONS — 7.2% | ||||||||
Communication Services — 0.3% | ||||||||
Altice France | ||||||||
3.375%, 01/15/2028 | EUR | 117 | 92 | |||||
CCO Holdings | ||||||||
4.750%, 02/01/2032 (E) | $ | 535 | 428 | |||||
4.500%, 08/15/2030 (E) | 63 | 52 | ||||||
4.500%, 06/01/2033 (E) | 219 | 167 | ||||||
DISH DBS | ||||||||
5.250%, 12/01/2026 (E) | 1,007 | 856 | ||||||
Interpublic Group of | ||||||||
5.375%, 06/15/2033 | 246 | 230 | ||||||
Lorca Telecom Bondco | ||||||||
4.000%, 09/18/2027 | EUR | 237 | 233 | |||||
330
SEI Institutional Managed Trust
Description | Face Amount | Market Value | ||||||
CORPORATE OBLIGATIONS (continued) | ||||||||
T-Mobile USA | ||||||||
5.050%, 07/15/2033 | $ | 107 | $ | 99 | ||||
| 2,157 | ||||||||
Consumer Discretionary — 1.1% | ||||||||
Altice Financing | ||||||||
3.000%, 01/15/2028 | EUR | 237 | 211 | |||||
Booking Holdings | ||||||||
4.625%, 04/13/2030 | $ | 1,080 | 1,025 | |||||
Caesars Entertainment | ||||||||
7.000%, 02/15/2030 (E) | 220 | 214 | ||||||
Carnival | ||||||||
4.000%, 08/01/2028 (E) | 605 | 525 | ||||||
Cox Communications | ||||||||
5.700%, 06/15/2033 (E) | 127 | 122 | ||||||
ERAC USA Finance | ||||||||
4.600%, 05/01/2028 (E) | 360 | 345 | ||||||
Ford Motor | ||||||||
6.100%, 08/19/2032 | 435 | 410 | ||||||
Ford Motor Credit | ||||||||
7.350%, 11/04/2027 | 204 | 208 | ||||||
General Motors Financial | ||||||||
5.800%, 06/23/2028 | 327 | 319 | ||||||
Globo Comunicacao e Participacoes | ||||||||
4.875%, 01/22/2030 (E) | 413 | 343 | ||||||
Harley-Davidson Financial Services | ||||||||
3.050%, 02/14/2027 (E) | 700 | 625 | ||||||
Hyundai Capital America | ||||||||
6.100%, 09/21/2028 (E) | 223 | 221 | ||||||
Las Vegas Sands | ||||||||
3.900%, 08/08/2029 | 722 | 616 | ||||||
LKQ | ||||||||
6.250%, 06/15/2033 (E) | 138 | 133 | ||||||
Marriott International | ||||||||
5.750%, 05/01/2025 | 68 | 68 | ||||||
5.550%, 10/15/2028 | 140 | 138 | ||||||
4.900%, 04/15/2029 | 309 | 295 | ||||||
MDC Holdings | ||||||||
6.000%, 01/15/2043 | 389 | 326 | ||||||
Royal Caribbean Cruises | ||||||||
8.250%, 01/15/2029 (E) | 231 | 240 | ||||||
Summer BC Holdco B SARL | ||||||||
5.750%, 10/31/2026 | EUR | 237 | 230 | |||||
Time Warner Cable | ||||||||
4.500%, 09/15/2042 | $ | 330 | 229 | |||||
Wynn Macau | ||||||||
5.625%, 08/26/2028 (E) | 348 | 302 | ||||||
ZF North America Capital | ||||||||
6.875%, 04/14/2028 (E) | 569 | 557 | ||||||
| 7,702 | ||||||||
Description | Face Amount | Market Value | ||||||
CORPORATE OBLIGATIONS (continued) | ||||||||
Consumer Staples — 0.6% | ||||||||
Altria Group | ||||||||
3.400%, 05/06/2030 | $ | 745 | $ | 637 | ||||
BAT Capital | ||||||||
6.421%, 08/02/2033 | 122 | 119 | ||||||
4.906%, 04/02/2030 | 467 | 428 | ||||||
2.259%, 03/25/2028 | 1,028 | 869 | ||||||
Cargill | ||||||||
5.125%, 10/11/2032 (E) | 239 | 232 | ||||||
JBS USA LUX | ||||||||
6.750%, 03/15/2034 (E) | 286 | 278 | ||||||
Natura & Luxembourg Holdings SARL | ||||||||
6.000%, 04/19/2029 (E) | 392 | 360 | ||||||
Philip Morris International | ||||||||
5.625%, 11/17/2029 | 110 | 109 | ||||||
5.375%, 02/15/2033 | 549 | 520 | ||||||
4.875%, 02/13/2026 | 582 | 573 | ||||||
Pilgrim's Pride | ||||||||
6.875%, 05/15/2034 | 335 | 329 | ||||||
Virgolino de Oliveira Finance | ||||||||
10.500%, 01/28/2018 (E)(F) | 660 | – | ||||||
| 4,454 | ||||||||
Energy — 0.4% | ||||||||
Continental Resources | ||||||||
2.268%, 11/15/2026 (E) | 1,050 | 930 | ||||||
Ecopetrol | ||||||||
8.625%, 01/19/2029 | 512 | 514 | ||||||
Oleoducto Central | ||||||||
4.000%, 07/14/2027 (E) | 221 | 197 | ||||||
ONEOK | ||||||||
6.050%, 09/01/2033 | 203 | 199 | ||||||
ONEOK Partners | ||||||||
6.125%, 02/01/2041 | 63 | 58 | ||||||
Ovintiv | ||||||||
6.250%, 07/15/2033 | 153 | 148 | ||||||
5.650%, 05/15/2028 | 104 | 102 | ||||||
Var Energi | ||||||||
8.000%, 11/15/2032 (E) | 403 | 423 | ||||||
7.500%, 01/15/2028 (E) | 314 | 322 | ||||||
| 2,893 | ||||||||
Financials — 2.7% | ||||||||
ABN AMRO Bank | ||||||||
4.750%, 07/28/2025 (E) | 269 | 261 | ||||||
AIB Group MTN | ||||||||
4.263%, US0003M + 1.874%, 04/10/2025 (C)(E) | 438 | 432 | ||||||
Aircastle | ||||||||
5.250%, 08/11/2025 (E) | 456 | 444 | ||||||
4.125%, 05/01/2024 | 181 | 179 | ||||||
2.850%, 01/26/2028 (E) | 904 | 767 | ||||||
SEI Institutional Managed Trust
331
CONSOLIDATED SCHEDULE OF INVESTMENTS
September 30, 2023
Multi-Asset Inflation Managed Fund (Continued)
Description | Face Amount | Market Value | ||||||
CORPORATE OBLIGATIONS (continued) | ||||||||
Ally Financial | ||||||||
6.992%, SOFRRATE + 3.260%, 06/13/2029 (C) | $ | 259 | $ | 253 | ||||
Aviation Capital Group | ||||||||
6.375%, 07/15/2030 (E) | 206 | 199 | ||||||
5.500%, 12/15/2024 (E) | 352 | 346 | ||||||
4.875%, 10/01/2025 (E) | 182 | 175 | ||||||
4.375%, 01/30/2024 (E) | 161 | 160 | ||||||
4.125%, 08/01/2025 (E) | 6 | 6 | ||||||
3.500%, 11/01/2027 (E) | 165 | 146 | ||||||
1.950%, 01/30/2026 (E) | 480 | 431 | ||||||
1.950%, 09/20/2026 (E) | 153 | 133 | ||||||
Banco de Credito del Peru S.A. MTN | ||||||||
3.125%, H15T5Y + 3.000%, 07/01/2030 (C)(E) | 755 | 693 | ||||||
Banco Santander | ||||||||
6.921%, 08/08/2033 | 400 | 382 | ||||||
BNP Paribas | ||||||||
8.500%, H15T5Y + 4.354%(C)(E)(G) | 669 | 654 | ||||||
7.375%, USSW5 + 5.150%(C)(G) | 200 | 196 | ||||||
CaixaBank | ||||||||
6.684%, SOFRRATE + 2.080%, 09/13/2027 (C)(E) | 343 | 343 | ||||||
Capital One Financial | ||||||||
6.377%, SOFRRATE + 2.860%, 06/08/2034 (C) | 486 | 459 | ||||||
Charles Schwab | ||||||||
5.375%, H15T5Y + 4.971%(C)(G) | 184 | 177 | ||||||
4.000%, H15T5Y + 3.168%(C)(G) | 756 | 631 | ||||||
Citigroup | ||||||||
9.699%, TSFR3M + 4.330%(C)(G) | 125 | 125 | ||||||
7.625%, H15T5Y + 3.211%(C)(G) | 33 | 32 | ||||||
4.000%, H15T5Y + 3.597%(C)(G) | 359 | 314 | ||||||
Credit Agricole | ||||||||
6.316%, SOFRRATE + 1.860%, 10/03/2029 (C)(E) | 252 | 252 | ||||||
Deutsche Bank NY | ||||||||
7.146%, SOFRRATE + 2.520%, 07/13/2027 (C) | 177 | 178 | ||||||
3.961%, SOFRRATE + 2.581%, 11/26/2025 (C) | 315 | 304 | ||||||
2.129%, SOFRRATE + 1.870%, 11/24/2026 (C) | 347 | 314 | ||||||
Discover Bank | ||||||||
5.974%, USISOA05 + 1.730%, 08/09/2028 (C) | 475 | 435 | ||||||
Goldman Sachs Group | ||||||||
8.501%, TSFR3M + 3.136%(C)(G) | 122 | 122 | ||||||
4.125%, H15T5Y + 2.949%(C)(G) | 328 | 268 | ||||||
ING Groep | ||||||||
6.083%, SOFRRATE + 1.560%, 09/11/2027 (C) | 273 | 272 | ||||||
Description | Face Amount | Market Value | ||||||
CORPORATE OBLIGATIONS (continued) | ||||||||
Lloyds Banking Group | ||||||||
7.500%, USISDA05 + 4.496%(C)(G) | $ | 735 | $ | 687 | ||||
Lloyds Banking Group PLC | ||||||||
7.953%, H15T1Y + 3.750%, 11/15/2033 (C) | 604 | 625 | ||||||
Morgan Stanley | ||||||||
0.406%, 10/29/2027 (C) | EUR | 480 | 450 | |||||
Nationwide Building Society MTN | ||||||||
2.972%, SOFRRATE + 1.290%, 02/16/2028 (C)(E) | $ | 319 | 285 | |||||
NatWest Group | ||||||||
4.269%, US0003M + 1.762%, 03/22/2025 (C) | 569 | 563 | ||||||
OEC Finance | ||||||||
7.125%cash/0% PIK, 12/26/2046 (E) | 309 | 23 | ||||||
PNC Financial Services Group | ||||||||
8.711%, TSFR3M + 3.302%(C)(G) | 174 | 173 | ||||||
S&P Global | ||||||||
4.250%, 05/01/2029 | 166 | 157 | ||||||
Santander Holdings USA | ||||||||
4.260%, SOFRINDX + 1.380%, 06/09/2025 (C) | 196 | 192 | ||||||
2.490%, SOFRRATE + 1.249%, 01/06/2028 (C) | 67 | 58 | ||||||
Santander UK Group Holdings | ||||||||
6.833%, SOFRRATE + 2.749%, 11/21/2026 (C) | 603 | 606 | ||||||
Standard Chartered | ||||||||
7.141%, US0003M + 1.510%(C)(E)(G) | 400 | 371 | ||||||
6.000%, H15T5Y + 5.661%(C)(E)(G) | 552 | 524 | ||||||
3.971%, H15T1Y + 1.650%, 03/30/2026 (C)(E) | 239 | 230 | ||||||
Svenska Handelsbanken | ||||||||
4.750%, H15T5Y + 4.048%(C)(G) | 800 | 612 | ||||||
Swiss Re Finance Luxembourg | ||||||||
5.000%, H15T5Y + 3.582%, 04/02/2049 (C) | 600 | 562 | ||||||
Synchrony Financial | ||||||||
4.875%, 06/13/2025 | 118 | 113 | ||||||
4.500%, 07/23/2025 | 120 | 114 | ||||||
3.950%, 12/01/2027 | 118 | 104 | ||||||
2.875%, 10/28/2031 | 328 | 233 | ||||||
UniCredit | ||||||||
2.569%, H15T1Y + 2.300%, 09/22/2026 (C)(E) | 519 | 475 | ||||||
US Bancorp | ||||||||
5.300%, TSFR3M + 3.176%(C)(G) | 474 | 396 | ||||||
Wells Fargo | ||||||||
7.625%, H15T5Y + 3.606%(C)(G) | 180 | 181 | ||||||
3.900%, H15T5Y + 3.453%(C)(G) | 327 | 286 | ||||||
| 18,103 | ||||||||
332
SEI Institutional Managed Trust
Description | Face Amount | Market Value | ||||||
CORPORATE OBLIGATIONS (continued) | ||||||||
Health Care — 0.1% | ||||||||
Organon & Co | ||||||||
2.875%, 04/30/2028 | EUR | 200 | $ | 182 | ||||
Takeda Pharmaceutical | ||||||||
4.400%, 11/26/2023 | $ | 220 | 219 | |||||
| 401 | ||||||||
Industrials — 0.8% | ||||||||
AerCap Ireland Capital DAC | ||||||||
6.500%, 07/15/2025 | 190 | 191 | ||||||
4.450%, 04/03/2026 | 173 | 166 | ||||||
2.450%, 10/29/2026 | 671 | 601 | ||||||
Air Lease | ||||||||
3.625%, 04/01/2027 | 40 | 36 | ||||||
2.100%, 09/01/2028 | 178 | 148 | ||||||
Air Lease MTN | ||||||||
2.875%, 01/15/2026 | 85 | 79 | ||||||
APCOA Parking Holdings GmbH | ||||||||
4.625%, 01/15/2027 | EUR | 237 | 228 | |||||
Delta Air Lines | ||||||||
4.750%, 10/20/2028 (E) | $ | 475 | 452 | |||||
4.500%, 10/20/2025 (E) | 307 | 298 | ||||||
Embraer Netherlands Finance BV | ||||||||
5.400%, 02/01/2027 | 670 | 652 | ||||||
ENA Master Trust | ||||||||
4.000%, 05/19/2048 (E) | 272 | 195 | ||||||
Flowserve | ||||||||
2.800%, 01/15/2032 | 246 | 188 | ||||||
Honeywell International | ||||||||
4.125%, 11/02/2034 | EUR | 810 | 841 | |||||
Lima Metro Line 2 Finance | ||||||||
5.875%, 07/05/2034 | $ | 203 | 195 | |||||
4.350%, 04/05/2036 (E) | 200 | 174 | ||||||
Odebrecht Holdco Finance | ||||||||
0.000%, 09/10/2058 (E)(H) | 294 | – | ||||||
Regal Rexnord | ||||||||
6.050%, 02/15/2026 (E) | 789 | 780 | ||||||
TK Elevator Midco GmbH | ||||||||
4.375%, 07/15/2027 | EUR | 125 | 120 | |||||
Westinghouse Air Brake Technologies | ||||||||
3.200%, 06/15/2025 | $ | 141 | 134 | |||||
| 5,478 | ||||||||
Information Technology — 0.6% | ||||||||
Broadcom | ||||||||
4.926%, 05/15/2037 (E) | 535 | 461 | ||||||
3.137%, 11/15/2035 (E) | 154 | 112 | ||||||
Kyndryl Holdings | ||||||||
2.050%, 10/15/2026 | 631 | 551 | ||||||
Lenovo Group | ||||||||
5.831%, 01/27/2028 | 966 | 946 | ||||||
Description | Face Amount | Market Value | ||||||
CORPORATE OBLIGATIONS (continued) | ||||||||
NXP BV | ||||||||
5.550%, 12/01/2028 | $ | 317 | $ | 310 | ||||
Prosus | ||||||||
3.257%, 01/19/2027 (E) | 264 | 234 | ||||||
Seagate HDD Cayman | ||||||||
8.250%, 12/15/2029 (E) | 399 | 410 | ||||||
SK Hynix | ||||||||
2.375%, 01/19/2031 (E) | 290 | 218 | ||||||
Tencent Holdings MTN | ||||||||
3.240%, 06/03/2050 (E) | 439 | 252 | ||||||
TSMC Arizona | ||||||||
3.875%, 04/22/2027 | 406 | 387 | ||||||
Western Digital | ||||||||
3.100%, 02/01/2032 | 35 | 26 | ||||||
2.850%, 02/01/2029 | 157 | 126 | ||||||
| 4,033 | ||||||||
Materials — 0.1% | ||||||||
Freeport Indonesia MTN | ||||||||
4.763%, 04/14/2027 (E) | 243 | 231 | ||||||
Glencore Funding | ||||||||
6.500%, 10/06/2033 (E) | 56 | 56 | ||||||
5.400%, 05/08/2028 (E) | 261 | 254 | ||||||
Volcan Cia Minera SAA | ||||||||
4.375%, 02/11/2026 (E) | 81 | 46 | ||||||
| 587 | ||||||||
Real Estate — 0.1% | ||||||||
American Tower | ||||||||
5.800%, 11/15/2028 | 115 | 114 | ||||||
3.650%, 03/15/2027 | 235 | 218 | ||||||
Vornado Realty | ||||||||
2.150%, 06/01/2026 | 403 | 342 | ||||||
| 674 | ||||||||
Utilities — 0.4% | ||||||||
AES Panama Generation Holdings SRL | ||||||||
4.375%, 05/31/2030 (E) | 301 | 256 | ||||||
Alexander Funding Trust II | ||||||||
7.467%, 07/31/2028 (E) | 104 | 104 | ||||||
Comision Federal de Electricidad | ||||||||
4.688%, 05/15/2029 (E) | 268 | 241 | ||||||
Duke Energy Carolinas NC Storm Funding | ||||||||
2.617%, 07/01/2041 | 403 | 280 | ||||||
Electricite de France | ||||||||
9.125%, H15T5Y + 5.411%(C)(E)(G) | 238 | 248 | ||||||
Enel Finance International | ||||||||
7.500%, 10/14/2032 (E) | 400 | 427 | ||||||
Engie Energia Chile | ||||||||
3.400%, 01/28/2030 | 390 | 324 | ||||||
NRG Energy | ||||||||
7.000%, 03/15/2033 (E) | 421 | 407 | ||||||
SEI Institutional Managed Trust
333
CONSOLIDATED SCHEDULE OF INVESTMENTS
September 30, 2023
Multi-Asset Inflation Managed Fund (Continued)
Description | Face Amount | Market Value | ||||||
CORPORATE OBLIGATIONS (continued) | ||||||||
Terraform Global Operating | ||||||||
6.125%, 03/01/2026 (E) | $ | 74 | $ | 73 | ||||
Vistra | ||||||||
7.000%, H15T5Y + 5.740%(C)(E)(G) | 286 | 261 | ||||||
| 2,621 | ||||||||
Total Corporate Obligations | ||||||||
(Cost $54,422) ($ Thousands) | 49,103 | |||||||
ASSET-BACKED SECURITIES — 4.9% | ||||||||
Automotive — 1.7% | ||||||||
American Credit Acceptance Receivables Trust, Ser 2023-3, Cl B | ||||||||
6.090%, 11/12/2027(E) | 897 | 896 | ||||||
Americredit Automobile Receivables Trust, Ser 2023-1, Cl A2A | ||||||||
5.840%, 10/19/2026 | 758 | 757 | ||||||
Avis Budget Rental Car Funding AESOP, Ser 2023-3A, Cl A | ||||||||
5.440%, 02/22/2028(E) | 554 | 544 | ||||||
Avis Budget Rental Car Funding AESOP, Ser 2023-5A, Cl B | ||||||||
6.120%, 04/20/2028(E) | 424 | 416 | ||||||
Carvana Auto Receivables Trust, Ser 2021-N3, Cl C | ||||||||
1.020%, 06/12/2028 | 89 | 82 | ||||||
Carvana Auto Receivables Trust, Ser 2021-N4, Cl D | ||||||||
2.300%, 09/11/2028 | 347 | 330 | ||||||
Carvana Auto Receivables Trust, Ser 2021-P4, Cl D | ||||||||
2.610%, 09/11/2028 | 441 | 375 | ||||||
CPS Auto Receivables Trust, Ser 2022-A, Cl C | ||||||||
2.170%, 04/16/2029(E) | 611 | 584 | ||||||
FHF Trust, Ser 2021-2A, Cl A | ||||||||
0.830%, 12/15/2026(E) | 119 | 114 | ||||||
FHF Trust, Ser 2023-1A, Cl A2 | ||||||||
6.570%, 06/15/2028(E) | 411 | 407 | ||||||
Flagship Credit Auto Trust, Ser 2023-2, Cl A2 | ||||||||
5.760%, 04/15/2027(E) | 707 | 704 | ||||||
Ford Credit Auto Owner Trust, Ser 2021-1, Cl D | ||||||||
2.310%, 10/17/2033(E) | 605 | 531 | ||||||
Hertz Vehicle Financing III, Ser 2022-1A, Cl C | ||||||||
2.630%, 06/25/2026(E) | 620 | 578 | ||||||
Description | Face Amount | Market Value | ||||||
ASSET-BACKED SECURITIES (continued) | ||||||||
LAD Auto Receivables Trust, Ser 2021-1A, Cl A | ||||||||
1.300%, 08/17/2026(E) | $ | 138 | $ | 136 | ||||
LAD Auto Receivables Trust, Ser 2022-1A, Cl A | ||||||||
5.210%, 06/15/2027(E) | 449 | 445 | ||||||
Lendbuzz Securitization Trust, Ser 2023-1A, Cl A2 | ||||||||
6.920%, 08/15/2028(E) | 1,247 | 1,242 | ||||||
Lendbuzz Securitization Trust, Ser 2023-2A, Cl A2 | ||||||||
7.090%, 10/16/2028(E) | 484 | 483 | ||||||
Prestige Auto Receivables Trust, Ser 2022-1A, Cl A2 | ||||||||
5.900%, 07/15/2025(E) | 256 | 255 | ||||||
Research-Driven Pagaya Motor Asset Trust VII, Ser 2022-3A, Cl A | ||||||||
5.380%, 11/25/2030(E) | 573 | 563 | ||||||
Santander Bank Auto Credit-Linked Notes, Ser 2022-A, Cl B | ||||||||
5.281%, 05/15/2032(E) | 462 | 456 | ||||||
Santander Bank Auto Credit-Linked Notes, Ser 2022-B, Cl B | ||||||||
5.721%, 08/16/2032(E) | 427 | 425 | ||||||
Santander Bank Auto Credit-Linked Notes, Ser 2022-C, Cl B | ||||||||
6.451%, 12/15/2032(E) | 515 | 513 | ||||||
United Auto Credit Securitization Trust, Ser 2022-2, Cl A | ||||||||
4.390%, 04/10/2025(E) | 109 | 109 | ||||||
Westlake Automobile Receivables Trust, Ser 2023-2A, Cl A2A | ||||||||
5.870%, 07/15/2026(E) | 848 | 847 | ||||||
| 11,792 | ||||||||
Credit Cards — 0.1% | ||||||||
Brex Commercial Charge Card Master Trust, Ser 2022-1, Cl A | ||||||||
4.630%, 07/15/2025(E) | 1,010 | 994 | ||||||
Non-Agency Mortgage-Backed Obligations — 0.1% | ||||||||
Eagle RE, Ser 2023-1, Cl M1A | ||||||||
7.315%, SOFR30A + 2.000%, 09/26/2033(C)(E) | 511 | 511 | ||||||
Other Asset-Backed Securities — 3.0% | ||||||||
AB Issuer, Ser 2021-1, Cl A2 | ||||||||
3.734%, 07/30/2051(E) | 827 | 689 | ||||||
ACHV ABS TRUST, Ser 2023-3PL, Cl A | ||||||||
6.600%, 08/19/2030(E) | 610 | 610 | ||||||
334
SEI Institutional Managed Trust
Description | Face Amount | Market Value | ||||||
ASSET-BACKED SECURITIES (continued) | ||||||||
Affirm Asset Securitization Trust, Ser 2021-Z1, Cl A | ||||||||
1.070%, 08/15/2025(E) | $ | 53 | $ | 52 | ||||
Affirm Asset Securitization Trust, Ser 2021-Z2, Cl A | ||||||||
1.170%, 11/16/2026(E) | 70 | 68 | ||||||
Affirm Asset Securitization Trust, Ser 2022-X1, Cl A | ||||||||
1.750%, 02/15/2027(E) | 88 | 86 | ||||||
AGL CLO 12, Ser 2021-12A, Cl A1 | ||||||||
6.748%, TSFR3M + 1.422%, 07/20/2034(C)(E) | 970 | 963 | ||||||
Amur Equipment Finance Receivables XI, Ser 2022-2A, Cl A2 | ||||||||
5.300%, 06/21/2028(E) | 288 | 285 | ||||||
Atalaya Equipment Leasing Trust, Ser 2021-1A, Cl B | ||||||||
2.080%, 02/15/2027(E) | 185 | 176 | ||||||
Balboa Bay Loan Funding, Ser 2021-1A, Cl A | ||||||||
6.788%, TSFR3M + 1.462%, 07/20/2034(C)(E) | 589 | 587 | ||||||
Ballyrock CLO 15, Ser 2021-1A, Cl C | ||||||||
8.670%, TSFR3M + 3.362%, 04/15/2034(C)(E) | 600 | 586 | ||||||
Ballyrock CLO 16, Ser 2021-16A, Cl A1 | ||||||||
6.718%, TSFR3M + 1.392%, 07/20/2034(C)(E) | 1,222 | 1,214 | ||||||
Cajun Global, Ser 2021-1, Cl A2 | ||||||||
3.931%, 11/20/2051(E) | 180 | 157 | ||||||
College Ave Student Loans, Ser 2021-C, Cl B | ||||||||
2.720%, 07/26/2055(E) | 232 | 199 | ||||||
Dext ABS, Ser 2023-1, Cl A2 | ||||||||
5.990%, 03/15/2032(E) | 923 | 909 | ||||||
Diamond Issuer, Ser 2021-1A, Cl A | ||||||||
2.305%, 11/20/2051(E) | 839 | 714 | ||||||
Domino's Pizza Master Issuer, Ser 2021-1A, Cl A2I | ||||||||
2.662%, 04/25/2051(E) | 454 | 382 | ||||||
Dryden 78 CLO, Ser 2020-78A, Cl C | ||||||||
7.520%, TSFR3M + 2.212%, 04/17/2033(C)(E) | 620 | 604 | ||||||
Dryden 78 CLO, Ser 2020-78A, Cl D | ||||||||
8.570%, TSFR3M + 3.262%, 04/17/2033(C)(E) | 320 | 308 | ||||||
Elevation CLO, Ser 2020-11A, Cl C | ||||||||
7.770%, TSFR3M + 2.462%, 04/15/2033(C)(E) | 550 | 537 | ||||||
Elmwood CLO IX, Ser 2021-2A, Cl D | ||||||||
8.538%, TSFR3M + 3.212%, 07/20/2034(C)(E) | 583 | 568 | ||||||
Flatiron CLO 21, Ser 2021-1A, Cl D | ||||||||
8.482%, US0003M + 2.900%, 07/19/2034(C)(E) | 620 | 601 | ||||||
Description | Face Amount | Market Value | ||||||
ASSET-BACKED SECURITIES (continued) | ||||||||
GCI Funding I, Ser 2021-1, Cl A | ||||||||
2.380%, 06/18/2046(E) | $ | 260 | $ | 220 | ||||
Goldentree Loan Management US CLO 7, Ser 2021-7A, Cl AR | ||||||||
6.658%, TSFR3M + 1.332%, 04/20/2034(C)(E) | 651 | 646 | ||||||
Hardee's Funding, Ser 2018-1A, Cl A23 | ||||||||
5.710%, 06/20/2048(E) | 380 | 339 | ||||||
Hardee's Funding, Ser 2020-1A, Cl A2 | ||||||||
3.981%, 12/20/2050(E) | 265 | 223 | ||||||
HFX, Ser 2017-1A | ||||||||
3.647%, 03/15/2035 | 830 | 798 | ||||||
Magnetite XXVI, Ser 2021-26A, Cl A1R | ||||||||
6.733%, TSFR3M + 1.382%, 07/25/2034(C)(E) | 1,127 | 1,119 | ||||||
MVW, Ser 2021-2A, Cl B | ||||||||
1.830%, 05/20/2039(E) | 264 | 237 | ||||||
Neighborly Issuer, Ser 2021-1A, Cl A2 | ||||||||
3.584%, 04/30/2051(E) | 322 | 268 | ||||||
Neighborly Issuer, Ser 2023-1A, Cl A2 | ||||||||
7.308%, 01/30/2053(E) | 778 | 755 | ||||||
Nelnet Student Loan Trust, Ser 2021-DA, Cl AFX | ||||||||
1.630%, 04/20/2062(E) | 193 | 173 | ||||||
Neuberger Berman Loan Advisers CLO 42, Ser 2021-42A, Cl A | ||||||||
6.670%, TSFR3M + 1.362%, 07/16/2035(C)(E) | 1,141 | 1,133 | ||||||
Neuberger Berman Loan Advisers CLO 43, Ser 2021-43A, Cl A | ||||||||
6.700%, TSFR3M + 1.392%, 07/17/2035(C)(E) | 690 | 685 | ||||||
NMEF Funding, Ser 2022-B, Cl A2 | ||||||||
6.070%, 06/15/2029(E) | 319 | 317 | ||||||
OCP CLO, Ser 2021-18A, Cl AR | ||||||||
6.678%, TSFR3M + 1.352%, 07/20/2032(C)(E) | 849 | 845 | ||||||
Octane Receivables Trust, Ser 2021-2A, Cl B | ||||||||
2.020%, 09/20/2028(E) | 636 | 588 | ||||||
Rad CLO 7, Ser 2020-7A, Cl C | ||||||||
7.570%, TSFR3M + 2.262%, 04/17/2033(C)(E) | 280 | 274 | ||||||
SMB Private Education Loan Trust, Ser 2021-E, Cl A1A | ||||||||
1.680%, 02/15/2051(E) | 407 | 363 | ||||||
Upstart Securitization Trust, Ser 2021-3, Cl B | ||||||||
1.660%, 07/20/2031(E) | 530 | 519 | ||||||
SEI Institutional Managed Trust
335
CONSOLIDATED SCHEDULE OF INVESTMENTS
September 30, 2023
Multi-Asset Inflation Managed Fund (Continued)
Description | Face Amount | Market Value | ||||||
ASSET-BACKED SECURITIES (continued) | ||||||||
Voya CLO, Ser 2020-1A, Cl DR | ||||||||
8.420%, TSFR3M + 3.112%, 04/15/2031(C)(E) | $ | 250 | $ | 236 | ||||
| 20,033 | ||||||||
Total Asset-Backed Securities | ||||||||
(Cost $34,670) ($ Thousands) | 33,330 | |||||||
MORTGAGE-BACKED SECURITIES — 4.1% | ||||||||
Agency Mortgage-Backed Obligations — 0.4% | ||||||||
FHLMC CMO, Ser 2017-4693, Cl SL, IO | ||||||||
0.722%, 06/15/2047(C) | 1,007 | 85 | ||||||
FHLMC CMO, Ser 2020-4981, Cl HS, IO | ||||||||
0.671%, 06/25/2050(C) | 2,001 | 180 | ||||||
FHLMC STACR REMIC Trust, Ser 2022-DNA4, Cl M1A | ||||||||
7.515%, SOFR30A + 2.200%, 05/25/2042(C)(E) | 543 | 548 | ||||||
FNMA | ||||||||
3.000%, 02/01/2052 | 2,144 | 1,788 | ||||||
FNMA CMO, Ser 2014-78, Cl SE, IO | ||||||||
0.671%, 12/25/2044(C) | 764 | 61 | ||||||
FNMA CMO, Ser 2016-77, Cl DS, IO | ||||||||
0.571%, 10/25/2046(C) | 767 | 60 | ||||||
FNMA CMO, Ser 2017-62, Cl AS, IO | ||||||||
0.721%, 08/25/2047(C) | 849 | 77 | ||||||
FNMA CMO, Ser 2017-97, Cl LS, IO | ||||||||
0.771%, 12/25/2047(C) | 1,193 | 112 | ||||||
GNMA CMO, Ser 2017-122, Cl SA, IO | ||||||||
0.761%, 08/20/2047(C) | 614 | 58 | ||||||
GNMA CMO, Ser 2017-134, Cl SE, IO | ||||||||
0.761%, 09/20/2047(C) | 524 | 41 | ||||||
| 3,010 | ||||||||
Non-Agency Mortgage-Backed Obligations — 3.7% | ||||||||
Alternative Loan Trust, Ser 2005-20CB, Cl 3A6 | ||||||||
5.500%, 07/25/2035 | 43 | 29 | ||||||
Alternative Loan Trust, Ser 2006-24CB, Cl A16 | ||||||||
5.750%, 08/25/2036 | 234 | 124 | ||||||
Alternative Loan Trust, Ser 2006-J1, Cl 1A13 | ||||||||
5.500%, 02/25/2036 | 97 | 67 | ||||||
AREIT Trust, Ser 2022-CRE6, Cl A | ||||||||
6.563%, SOFR30A + 1.250%, 01/20/2037(C)(E) | 1,262 | 1,240 | ||||||
BAMLL Commercial Mortgage Securities Trust, Ser 2013-WBRK, Cl D | ||||||||
3.652%, 03/10/2037(C)(E) | 365 | 249 | ||||||
Description | Face Amount | Market Value | ||||||
MORTGAGE-BACKED SECURITIES (continued) | ||||||||
BAMLL Commercial Mortgage Securities Trust, Ser 2017-SCH, Cl AF | ||||||||
6.380%, TSFR1M + 1.047%, 11/15/2033(C)(E) | $ | 1,610 | $ | 1,536 | ||||
BBCMS Mortgage Trust, Ser 2020-BID, Cl A | ||||||||
7.588%, TSFR1M + 2.254%, 10/15/2037(C)(E) | 779 | 742 | ||||||
Bellemeade Re, Ser 2019-3A, Cl M1C | ||||||||
7.384%, US0001M + 1.950%, 07/25/2029(C)(E) | 185 | 186 | ||||||
Bellemeade Re, Ser 2021-1A, Cl M1C | ||||||||
8.265%, SOFR30A + 2.950%, 03/25/2031(C)(E) | 437 | 444 | ||||||
Bellemeade Re, Ser 2021-2A, Cl M1B | ||||||||
6.815%, SOFR30A + 1.500%, 06/25/2031(C)(E) | 704 | 702 | ||||||
Bellemeade Re, Ser 2022-2, Cl M1A | ||||||||
9.315%, SOFR30A + 4.000%, 09/27/2032(C)(E) | 978 | 1,005 | ||||||
BFLD Trust, Ser 2021-FPM, Cl A | ||||||||
7.048%, TSFR1M + 1.714%, 06/15/2038(C)(E) | 1,189 | 1,136 | ||||||
BX Commercial Mortgage Trust, Ser 2019-IMC, Cl D | ||||||||
7.278%, TSFR1M + 1.946%, 04/15/2034(C)(E) | 162 | 160 | ||||||
BX Commercial Mortgage Trust, Ser 2019-IMC, Cl E | ||||||||
7.528%, TSFR1M + 2.196%, 04/15/2034(C)(E) | 656 | 642 | ||||||
Chase Mortgage Finance Trust, Ser 2007-S5, Cl 1A17 | ||||||||
6.000%, 07/25/2037 | 89 | 40 | ||||||
CHL Mortgage Pass-Through Trust, Ser 2006-10, Cl 1A8 | ||||||||
6.000%, 05/25/2036 | 121 | 54 | ||||||
CHL Mortgage Pass-Through Trust, Ser 2006-13, Cl 1A19 | ||||||||
6.250%, 09/25/2036 | 58 | 25 | ||||||
COMM Mortgage Trust, Ser 2010-C1, Cl D | ||||||||
5.985%, 07/10/2046(C)(E) | 595 | 553 | ||||||
Connecticut Avenue Securities Trust, Ser 2018-R07, Cl 1M2 | ||||||||
7.829%, SOFR30A + 2.514%, 04/25/2031(C)(E) | 12 | 12 | ||||||
Connecticut Avenue Securities Trust, Ser 2019-R03, Cl 1M2 | ||||||||
7.579%, SOFR30A + 2.264%, 09/25/2031(C)(E) | – | – | ||||||
Connecticut Avenue Securities Trust, Ser 2019-R07, Cl 1M2 | ||||||||
7.529%, SOFR30A + 2.214%, 10/25/2039(C)(E) | 15 | 15 | ||||||
336
SEI Institutional Managed Trust
Description | Face Amount | Market Value | ||||||
MORTGAGE-BACKED SECURITIES (continued) | ||||||||
Connecticut Avenue Securities Trust, Ser 2020-R02, Cl 2M2 | ||||||||
7.429%, SOFR30A + 2.114%, 01/25/2040(C)(E) | $ | 103 | $ | 103 | ||||
Connecticut Avenue Securities Trust, Ser 2021-R03, Cl 1M2 | ||||||||
6.965%, SOFR30A + 1.650%, 12/25/2041(C)(E) | 319 | 313 | ||||||
Connecticut Avenue Securities Trust, Ser 2022-R01, Cl 1M2 | ||||||||
7.215%, SOFR30A + 1.900%, 12/25/2041(C)(E) | 1,023 | 1,004 | ||||||
Connecticut Avenue Securities Trust, Ser 2022-R03, Cl 1M2 | ||||||||
8.815%, SOFR30A + 3.500%, 03/25/2042(C)(E) | 838 | 861 | ||||||
Connecticut Avenue Securities Trust, Ser 2022-R04, Cl 1M2 | ||||||||
8.415%, SOFR30A + 3.100%, 03/25/2042(C)(E) | 211 | 214 | ||||||
Connecticut Avenue Securities Trust, Ser 2023-R02, Cl 1M1 | ||||||||
7.615%, SOFR30A + 2.300%, 01/25/2043(C)(E) | 412 | 417 | ||||||
Connecticut Avenue Securities Trust, Ser 2023-R04, Cl 1M1 | ||||||||
7.615%, SOFR30A + 2.300%, 05/25/2043(C)(E) | 798 | 809 | ||||||
Connecticut Avenue Securities Trust, Ser 2023-R05, Cl 1M1 | ||||||||
7.215%, SOFR30A + 1.900%, 06/25/2043(C)(E) | 750 | 753 | ||||||
Deutsche Alt-A Securities Mortgage Loan Trust, Ser 2006-AR4, Cl A2 | ||||||||
5.814%, TSFR1M + 0.494%, 12/25/2036(C) | 324 | 106 | ||||||
FHLMC Multifamily Structured Credit Risk, Ser 2021-MN1, Cl M1 | ||||||||
7.315%, SOFR30A + 2.000%, 01/25/2051(C)(E) | 76 | 73 | ||||||
FHLMC STACR REMIC Trust, Ser 2020-DNA1, Cl M2 | ||||||||
7.129%, SOFR30A + 1.814%, 01/25/2050(C)(E) | 84 | 84 | ||||||
FHLMC STACR REMIC Trust, Ser 2020-DNA5, Cl M2 | ||||||||
8.115%, SOFR30A + 2.800%, 10/25/2050(C)(E) | 214 | 216 | ||||||
FHLMC STACR REMIC Trust, Ser 2021-DNA5, Cl M2 | ||||||||
6.965%, SOFR30A + 1.650%, 01/25/2034(C)(E) | 200 | 200 | ||||||
Description | Face Amount | Market Value | ||||||
MORTGAGE-BACKED SECURITIES (continued) | ||||||||
FHLMC STACR REMIC Trust, Ser 2021-DNA6, Cl M2 | ||||||||
6.815%, SOFR30A + 1.500%, 10/25/2041(C)(E) | $ | 1,079 | $ | 1,064 | ||||
FHLMC STACR REMIC Trust, Ser 2021-DNA7, Cl M2 | ||||||||
7.115%, SOFR30A + 1.800%, 11/25/2041(C)(E) | 1,042 | 1,018 | ||||||
FHLMC STACR REMIC Trust, Ser 2021-HQA4, Cl M2 | ||||||||
7.665%, SOFR30A + 2.350%, 12/25/2041(C)(E) | 668 | 646 | ||||||
FHLMC STACR REMIC Trust, Ser 2022-DNA1, Cl M1B | ||||||||
7.165%, SOFR30A + 1.850%, 01/25/2042(C)(E) | 542 | 535 | ||||||
FHLMC STACR REMIC Trust, Ser 2022-DNA1, Cl M1A | ||||||||
6.315%, SOFR30A + 1.000%, 01/25/2042(C)(E) | 407 | 404 | ||||||
FHLMC STACR REMIC Trust, Ser 2022-DNA5, Cl M1A | ||||||||
8.265%, SOFR30A + 2.950%, 06/25/2042(C)(E) | 667 | 684 | ||||||
FHLMC STACR REMIC Trust, Ser 2022-DNA7, Cl M1A | ||||||||
7.815%, SOFR30A + 2.500%, 03/25/2052(C)(E) | 958 | 973 | ||||||
FHLMC STACR REMIC Trust, Ser 2023-DNA1, Cl M1A | ||||||||
7.415%, SOFR30A + 2.100%, 03/25/2043(C)(E) | 482 | 487 | ||||||
FHLMC STACR REMIC Trust, Ser 2023-HQA1, Cl M1A | ||||||||
7.315%, SOFR30A + 2.000%, 05/25/2043(C)(E) | 753 | 758 | ||||||
FHLMC STACR Trust, Ser 2019-DNA4, Cl M2 | ||||||||
7.379%, SOFR30A + 2.064%, 10/25/2049(C)(E) | 13 | 13 | ||||||
FHLMC Structured Agency Credit Risk Debt Notes, Ser 2023-DNA2, Cl M1A | ||||||||
7.415%, SOFR30A + 2.100%, 04/25/2043(C)(E) | 367 | 371 | ||||||
FNMA Connecticut Avenue Securities, Ser 2015-C04, Cl 1M2 | ||||||||
11.129%, SOFR30A + 5.814%, 04/25/2028(C) | 88 | 93 | ||||||
FNMA Connecticut Avenue Securities, Ser 2017-C04, Cl 2M2 | ||||||||
8.279%, SOFR30A + 2.964%, 11/25/2029(C) | 396 | 406 | ||||||
SEI Institutional Managed Trust
337
CONSOLIDATED SCHEDULE OF INVESTMENTS
September 30, 2023
Multi-Asset Inflation Managed Fund (Continued)
Description | Face Amount | Market Value | ||||||
MORTGAGE-BACKED SECURITIES (continued) | ||||||||
FNMA Connecticut Avenue Securities, Ser 2021-R02, Cl 2M2 | ||||||||
7.315%, SOFR30A + 2.000%, 11/25/2041(C)(E) | $ | 469 | $ | 461 | ||||
GS Mortgage Securities Trust, Ser 2011-GC5, Cl D | ||||||||
5.299%, 08/10/2044(C)(E) | 13 | 4 | ||||||
GS Mortgage Securities Trust, Ser 2014-GC18, Cl D | ||||||||
5.234%, 01/10/2047(C)(E) | 273 | 74 | ||||||
GS Mortgage Securities Trust, Ser 2021-1, Cl A-1 | ||||||||
2.638%, 08/17/2026 | 26 | 23 | ||||||
2.435%, 08/17/2026 | 769 | 723 | ||||||
1.433%, 08/17/2026 | 296 | 278 | ||||||
HomeBanc Mortgage Trust, Ser 2005-1, Cl A1 | ||||||||
5.934%, TSFR1M + 0.614%, 03/25/2035(C) | 52 | 42 | ||||||
JPMBB Commercial Mortgage Securities Trust, Ser 2014-C22, Cl XA, IO | ||||||||
0.943%, 09/15/2047(C) | 14,209 | 57 | ||||||
JPMorgan Chase Bank, Ser 2019-CL1, Cl M3 | ||||||||
7.534%, TSFR1M + 2.214%, 04/25/2047(C)(E) | 86 | 84 | ||||||
LB-UBS Commercial Mortgage Trust, Ser 2006-C6, Cl AJ | ||||||||
5.452%, 09/15/2039(C) | 125 | 47 | ||||||
LSTAR Commercial Mortgage Trust, Ser 2016-4, Cl A2 | ||||||||
2.579%, 03/10/2049(E) | 189 | 184 | ||||||
Natixis Commercial Mortgage Securities Trust, Ser 2019-MILE, Cl A | ||||||||
6.912%, TSFR1M + 1.579%, 07/15/2036(C)(E) | 266 | 243 | ||||||
PMT Credit Risk Transfer Trust, Ser 2019-2R, Cl A | ||||||||
9.182%, TSFR1M + 3.864%, 05/30/2025(C)(E) | 268 | 268 | ||||||
PMT Credit Risk Transfer Trust, Ser 2019-3R, Cl A | ||||||||
9.129%, SOFR30A + 3.814%, 11/27/2031(C)(E) | 30 | 30 | ||||||
PMT Credit Risk Transfer Trust, Ser 2020-1R, Cl A | ||||||||
8.779%, SOFR30A + 3.464%, 02/27/2023(C)(E) | 105 | 104 | ||||||
Wells Fargo Commercial Mortgage Trust, Ser 2016-NXS6, Cl C | ||||||||
4.535%, 11/15/2049(C) | 925 | 780 | ||||||
Description | Face Amount | Market Value | ||||||
MORTGAGE-BACKED SECURITIES (continued) | ||||||||
Wells Fargo Credit Risk Transfer Securities Trust, Ser 2015-WF1, Cl 2M2 | ||||||||
10.929%, SOFR30A + 5.614%, 11/25/2025(C)(E) | $ | 32 | $ | 33 | ||||
Wells Fargo Credit Risk Transfer Securities Trust, Ser 2015-WF1, Cl 1M2 | ||||||||
10.679%, SOFR30A + 5.364%, 11/25/2025(C)(E) | 141 | 143 | ||||||
| 25,144 | ||||||||
Total Mortgage-Backed Securities | ||||||||
(Cost $30,393) ($ Thousands) | 28,154 | |||||||
U.S. GOVERNMENT AGENCY OBLIGATIONS — 2.2% | ||||||||
FFCB^ | ||||||||
5.500%, SOFRRATE + 0.170%, 01/23/2025(C) | 2,100 | 2,100 | ||||||
5.465%, SOFRRATE + 0.135%, 11/06/2023(C) | 2,000 | 2,000 | ||||||
5.410%, SOFRRATE + 0.080%, 05/24/2024(C) | 500 | 500 | ||||||
5.370%, SOFRRATE + 0.040%, 05/15/2024(C) | 300 | 300 | ||||||
FHLB^ | ||||||||
5.490%, SOFRRATE + 0.160%, 07/10/2025(C) | 800 | 801 | ||||||
5.470%, SOFRRATE + 0.140%, 04/21/2025(C) | 1,000 | 1,000 | ||||||
0.620%, 02/26/2026 | 200 | 179 | ||||||
FHLB DN^ | ||||||||
4.910%, 02/02/2024(A)(H) | 800 | 786 | ||||||
FHLMC^ | ||||||||
5.150%, 01/27/2026 | 1,200 | 1,184 | ||||||
4.200%, 08/28/2025 | 700 | 684 | ||||||
0.400%, 05/24/2024 | 400 | 387 | ||||||
FNMA^ | ||||||||
5.060%, 02/07/2025 | 700 | 693 | ||||||
3.875%, 08/28/2024 | 800 | 787 | ||||||
0.625%, 04/22/2025 | 1,300 | 1,210 | ||||||
0.500%, 06/17/2025 | 1,500 | 1,387 | ||||||
0.375%, 06/14/2024 | 700 | 675 | ||||||
0.250%, 11/27/2023 | 100 | 99 | ||||||
Total U.S. Government Agency Obligations | ||||||||
(Cost $15,085) ($ Thousands) | 14,772 | |||||||
338
SEI Institutional Managed Trust
Description | Face Amount | Market Value | ||||||
SOVEREIGN DEBT — 0.2% | ||||||||
Colombia Government International Bond | ||||||||
3.125%, 04/15/2031 | $ | 225 | $ | 166 | ||||
Dominican Republic International Bond | ||||||||
4.875%, 09/23/2032(E) | 416 | 338 | ||||||
Magyar Export-Import Bank Zrt | ||||||||
6.125%, 12/04/2027(E) | 753 | 740 | ||||||
Total Sovereign Debt | ||||||||
(Cost $1,391) ($ Thousands) | 1,244 | |||||||
| ||||||||
FOREIGN COMMON STOCK — 0.1% | ||||||||
Cameroon — 0.0% | ||||||||
Golar LNG Ltd | 3,094 | 75 | ||||||
Canada — 0.0% | ||||||||
Aurinia Pharmaceuticals Inc * | 1,700 | 13 | ||||||
Brookfield Infrastructure Corp, Cl A | 1,190 | 42 | ||||||
Teekay Tankers Ltd, Cl A | 700 | 29 | ||||||
| 84 | ||||||||
Ghana — 0.0% | ||||||||
Kosmos Energy Ltd * | 10,746 | 88 | ||||||
Ireland — 0.0% | ||||||||
Ardmore Shipping Corp | 1,400 | 18 | ||||||
Prothena Corp PLC * | 316 | 16 | ||||||
| 34 | ||||||||
Mexico — 0.0% | ||||||||
Borr Drilling Ltd * | 5,068 | 36 | ||||||
Monaco — 0.0% | ||||||||
Scorpio Tankers Inc | 1,225 | 66 | ||||||
Norway — 0.0% | ||||||||
FLEX LNG | 616 | 18 | ||||||
SFL Corp Ltd | 3,200 | 36 | ||||||
| 54 | ||||||||
United Kingdom — 0.1% | ||||||||
TechnipFMC PLC | 10,961 | 223 | ||||||
Total Foreign Common Stock | ||||||||
(Cost $490) ($ Thousands) | 660 | |||||||
Description | Number of Rights | Market Value | ||||||
RIGHTS — 0.0% | ||||||||
Novartis AG *‡‡ | 800 | $ | – | |||||
Abiomed Inc *‡‡ | 408 | – | ||||||
Total Rights | ||||||||
(Cost $—) ($ Thousands) | – | |||||||
| ||||||||
PURCHASED OPTIONS — 0.0% | ||||||||
Total Purchased Options | ||||||||
(Cost $47) ($ Thousands) | 17 | |||||||
Total Investments in Securities — 114.2% | ||||||||
(Cost $713,022) ($ Thousands) | $ | 776,182 | ||||||
COMMON STOCK SOLD SHORT— (12.6)% | ||||||||
Communication Services — (0.6)% | ||||||||
Cable One Inc | (67 | ) | (41 | ) | ||||
Charter Communications Inc, Cl A * | (1,117 | ) | (491 | ) | ||||
Comcast Corp, Cl A | (44,737 | ) | (1,984 | ) | ||||
DISH Network Corp, Cl A * | (2,934 | ) | (17 | ) | ||||
Fox Corp, Cl A | (3,295 | ) | (103 | ) | ||||
Fox Corp, Cl B | (1,600 | ) | (46 | ) | ||||
Interpublic Group of Cos Inc/The | (4,302 | ) | (123 | ) | ||||
Liberty Broadband Corp, Cl C * | (1,308 | ) | (120 | ) | ||||
Liberty Media -Liberty Live, Cl C * | (61 | ) | (2 | ) | ||||
Liberty Media -Liberty SiriusXM * | (1,794 | ) | (46 | ) | ||||
Liberty Media -Liberty SiriusXM, Cl A * | (800 | ) | (20 | ) | ||||
New York Times Co/The, Cl A | (1,794 | ) | (74 | ) | ||||
News Corp, Cl A | (4,513 | ) | (91 | ) | ||||
News Corp, Cl B | (1,600 | ) | (33 | ) | ||||
Nexstar Media Group Inc, Cl A | (332 | ) | (48 | ) | ||||
Omnicom Group Inc | (2,183 | ) | (163 | ) | ||||
Paramount Global, Cl B | (6,020 | ) | (78 | ) | ||||
Scholastic Corp, Cl B | (500 | ) | (19 | ) | ||||
TEGNA Inc | (2,500 | ) | (36 | ) | ||||
Trade Desk Inc/The, Cl A * | (4,559 | ) | (356 | ) | ||||
| (3,891 | ) | |||||||
Consumer Discretionary — (8.4)% | ||||||||
Abercrombie & Fitch Co, Cl A * | (400 | ) | (23 | ) | ||||
Academy Sports & Outdoors Inc | (920 | ) | (43 | ) | ||||
Acushnet Holdings Corp | (980 | ) | (52 | ) | ||||
Adient PLC * | (4,182 | ) | (153 | ) | ||||
Adtalem Global Education Inc * | (600 | ) | (26 | ) | ||||
Advance Auto Parts Inc | (596 | ) | (33 | ) | ||||
Airbnb Inc, Cl A * | (5,896 | ) | (809 | ) | ||||
Amazon.com Inc, Cl A * | (36,785 | ) | (4,676 | ) | ||||
American Axle & Manufacturing Holdings Inc * | (5,330 | ) | (39 | ) | ||||
American Eagle Outfitters Inc | (1,700 | ) | (28 | ) | ||||
Aptiv PLC * | (12,943 | ) | (1,276 | ) | ||||
SEI Institutional Managed Trust
339
CONSOLIDATED SCHEDULE OF INVESTMENTS
September 30, 2023
Multi-Asset Inflation Managed Fund (Continued)
Description | Shares | Market Value | ||||||
COMMON STOCK SOLD SHORT (continued) | ||||||||
Aramark | (3,525 | ) | $ | (122 | ) | |||
Asbury Automotive Group Inc * | (191 | ) | (44 | ) | ||||
AutoNation Inc * | (226 | ) | (34 | ) | ||||
AutoZone Inc * | (177 | ) | (450 | ) | ||||
Bath & Body Works Inc | (2,102 | ) | (71 | ) | ||||
Beazer Homes USA Inc, Cl A * | (1,100 | ) | (27 | ) | ||||
Best Buy Co Inc | (2,019 | ) | (140 | ) | ||||
Bloomin' Brands Inc | (1,499 | ) | (37 | ) | ||||
Booking Holdings Inc * | (545 | ) | (1,681 | ) | ||||
Boot Barn Holdings Inc * | (210 | ) | (17 | ) | ||||
BorgWarner Inc | (11,197 | ) | (452 | ) | ||||
Boyd Gaming Corp | (1,323 | ) | (80 | ) | ||||
Bright Horizons Family Solutions Inc * | (993 | ) | (81 | ) | ||||
Brinker International Inc * | (600 | ) | (19 | ) | ||||
Brunswick Corp/DE | (2,314 | ) | (183 | ) | ||||
Burlington Stores Inc * | (602 | ) | (81 | ) | ||||
Caesars Entertainment Inc * | (2,861 | ) | (133 | ) | ||||
Capri Holdings Ltd * | (3,723 | ) | (196 | ) | ||||
CarMax Inc * | (1,548 | ) | (110 | ) | ||||
Carnival Corp * | (14,711 | ) | (202 | ) | ||||
Carter's Inc | (1,296 | ) | (90 | ) | ||||
Carvana Co, Cl A * | (700 | ) | (29 | ) | ||||
Cavco Industries Inc * | (174 | ) | (46 | ) | ||||
Century Communities Inc | (870 | ) | (58 | ) | ||||
Cheesecake Factory Inc/The | (762 | ) | (23 | ) | ||||
Chegg Inc * | (1,979 | ) | (18 | ) | ||||
Chipotle Mexican Grill Inc, Cl A * | (409 | ) | (749 | ) | ||||
Choice Hotels International Inc | (500 | ) | (61 | ) | ||||
Churchill Downs Inc | (1,088 | ) | (126 | ) | ||||
Columbia Sportswear Co | (1,109 | ) | (82 | ) | ||||
Coursera Inc * | (1,400 | ) | (26 | ) | ||||
Cracker Barrel Old Country Store Inc | (330 | ) | (22 | ) | ||||
Crocs Inc * | (1,736 | ) | (153 | ) | ||||
Dana Inc | (5,797 | ) | (85 | ) | ||||
Darden Restaurants Inc | (1,758 | ) | (252 | ) | ||||
Dave & Buster's Entertainment Inc * | (846 | ) | (31 | ) | ||||
Deckers Outdoor Corp * | (789 | ) | (406 | ) | ||||
Dick's Sporting Goods Inc | (410 | ) | (45 | ) | ||||
Domino's Pizza Inc | (532 | ) | (202 | ) | ||||
DoorDash Inc, Cl A * | (4,404 | ) | (350 | ) | ||||
Dorman Products Inc * | (1,077 | ) | (82 | ) | ||||
DR Horton Inc | (9,572 | ) | (1,029 | ) | ||||
DraftKings Inc, Cl A * | (5,924 | ) | (174 | ) | ||||
Dream Finders Homes, Cl A * | (700 | ) | (16 | ) | ||||
Duolingo Inc, Cl A * | (400 | ) | (66 | ) | ||||
eBay Inc | (5,401 | ) | (238 | ) | ||||
Etsy Inc * | (1,004 | ) | (65 | ) | ||||
Everi Holdings Inc * | (1,419 | ) | (19 | ) | ||||
Expedia Group Inc * | (2,088 | ) | (215 | ) | ||||
Fisker * | (3,663 | ) | (24 | ) | ||||
Five Below Inc * | (547 | ) | (88 | ) | ||||
Floor & Decor Holdings Inc, Cl A * | (937 | ) | (85 | ) | ||||
Description | Shares | Market Value | ||||||
COMMON STOCK SOLD SHORT (continued) | ||||||||
Foot Locker Inc, Cl A | (932 | ) | $ | (16 | ) | |||
Ford Motor Co | (183,999 | ) | (2,285 | ) | ||||
Fox Factory Holding Corp * | (1,854 | ) | (184 | ) | ||||
Frontdoor Inc * | (957 | ) | (29 | ) | ||||
GameStop Corp, Cl A * | (2,552 | ) | (42 | ) | ||||
Garmin Ltd | (4,519 | ) | (475 | ) | ||||
General Motors Co | (65,385 | ) | (2,156 | ) | ||||
Gentex Corp | (12,175 | ) | (396 | ) | ||||
Gentherm Inc * | (1,234 | ) | (67 | ) | ||||
Genuine Parts Co | (1,356 | ) | (196 | ) | ||||
G-III Apparel Group Ltd * | (1,200 | ) | (30 | ) | ||||
Goodyear Tire & Rubber Co/The * | (12,387 | ) | (154 | ) | ||||
GoPro Inc, Cl A * | (4,271 | ) | (13 | ) | ||||
Graham Holdings Co, Cl B | (100 | ) | (58 | ) | ||||
Grand Canyon Education Inc * | (372 | ) | (43 | ) | ||||
Green Brick Partners Inc * | (900 | ) | (37 | ) | ||||
Group 1 Automotive Inc | (155 | ) | (42 | ) | ||||
H&R Block Inc | (2,624 | ) | (113 | ) | ||||
Hanesbrands Inc | (9,871 | ) | (39 | ) | ||||
Harley-Davidson Inc, Cl A | (6,071 | ) | (201 | ) | ||||
Hasbro Inc | (3,745 | ) | (248 | ) | ||||
Helen of Troy Ltd * | (661 | ) | (77 | ) | ||||
Hilton Grand Vacations Inc * | (1,254 | ) | (51 | ) | ||||
Hilton Worldwide Holdings Inc | (3,834 | ) | (576 | ) | ||||
Home Depot Inc/The | (9,610 | ) | (2,904 | ) | ||||
Hovnanian Enterprises, Cl A * | (200 | ) | (20 | ) | ||||
Hyatt Hotels Corp, Cl A | (649 | ) | (69 | ) | ||||
Installed Building Products Inc | (668 | ) | (83 | ) | ||||
International Game Technology PLC | (1,333 | ) | (40 | ) | ||||
iRobot * | (694 | ) | (26 | ) | ||||
Jack in the Box Inc | (227 | ) | (16 | ) | ||||
KB Home | (2,302 | ) | (107 | ) | ||||
Kohl's Corp | (989 | ) | (21 | ) | ||||
Kontoor Brands Inc | (1,816 | ) | (80 | ) | ||||
Las Vegas Sands Corp | (4,836 | ) | (222 | ) | ||||
Laureate Education Inc, Cl A | (1,900 | ) | (27 | ) | ||||
La-Z-Boy Inc, Cl Z | (1,311 | ) | (40 | ) | ||||
LCI Industries | (1,196 | ) | (140 | ) | ||||
Lear Corp | (2,885 | ) | (387 | ) | ||||
Leggett & Platt Inc | (4,708 | ) | (120 | ) | ||||
Lennar Corp, Cl A | (7,560 | ) | (848 | ) | ||||
Lennar Corp, Cl B | (409 | ) | (42 | ) | ||||
LGI Homes Inc * | (548 | ) | (55 | ) | ||||
Light & Wonder Inc, Cl A * | (1,455 | ) | (104 | ) | ||||
Lithia Motors Inc, Cl A | (231 | ) | (68 | ) | ||||
LKQ Corp | (2,708 | ) | (134 | ) | ||||
Lowe's Cos Inc | (5,840 | ) | (1,214 | ) | ||||
Lucid Group Inc * | (34,106 | ) | (191 | ) | ||||
Lululemon Athletica Inc * | (3,346 | ) | (1,290 | ) | ||||
Luminar Technologies, Cl A * | (13,917 | ) | (63 | ) | ||||
M/I Homes Inc * | (813 | ) | (68 | ) | ||||
Macy's Inc | (3,109 | ) | (36 | ) | ||||
340
SEI Institutional Managed Trust
Description | Shares | Market Value | ||||||
COMMON STOCK SOLD SHORT (continued) | ||||||||
Malibu Boats Inc, Cl A * | (590 | ) | $ | (29 | ) | |||
Marriott International Inc/MD, Cl A | (3,718 | ) | (731 | ) | ||||
Marriott Vacations Worldwide Corp | (646 | ) | (65 | ) | ||||
Mattel Inc * | (10,545 | ) | (232 | ) | ||||
McDonald's Corp | (11,298 | ) | (2,976 | ) | ||||
MDC Holdings Inc | (1,798 | ) | (74 | ) | ||||
Meritage Homes Corp | (1,093 | ) | (134 | ) | ||||
MGM Resorts International | (4,655 | ) | (171 | ) | ||||
Modine Manufacturing Co * | (2,469 | ) | (113 | ) | ||||
Mohawk Industries Inc * | (1,805 | ) | (155 | ) | ||||
Movado Group Inc | (661 | ) | (18 | ) | ||||
Murphy USA Inc | (249 | ) | (85 | ) | ||||
National Vision Holdings Inc * | (1,000 | ) | (16 | ) | ||||
Newell Brands Inc, Cl B | (11,581 | ) | (105 | ) | ||||
NIKE Inc, Cl B | (36,360 | ) | (3,477 | ) | ||||
Nordstrom Inc | (964 | ) | (14 | ) | ||||
Norwegian Cruise Line Holdings Ltd * | (6,364 | ) | (105 | ) | ||||
NVR Inc * | (91 | ) | (543 | ) | ||||
Ollie's Bargain Outlet Holdings Inc * | (500 | ) | (39 | ) | ||||
O'Reilly Automotive Inc * | (584 | ) | (531 | ) | ||||
Oxford Industries Inc, Cl A | (326 | ) | (31 | ) | ||||
Papa John's International Inc, Cl A | (358 | ) | (24 | ) | ||||
Patrick Industries Inc | (902 | ) | (68 | ) | ||||
Peloton Interactive Inc, Cl A * | (7,079 | ) | (36 | ) | ||||
Penn Entertainment Inc * | (2,395 | ) | (55 | ) | ||||
Penske Automotive Group Inc, Cl A | (200 | ) | (33 | ) | ||||
Phinia Inc | (2,000 | ) | (54 | ) | ||||
Planet Fitness Inc, Cl A * | (1,189 | ) | (58 | ) | ||||
Polaris Inc | (1,717 | ) | (179 | ) | ||||
Pool Corp | (377 | ) | (134 | ) | ||||
PulteGroup Inc | (6,709 | ) | (497 | ) | ||||
PVH Corp | (1,821 | ) | (139 | ) | ||||
QuantumScape Corp, Cl A * | (12,787 | ) | (86 | ) | ||||
Ralph Lauren Corp, Cl A | (1,235 | ) | (143 | ) | ||||
Red Rock Resorts Inc, Cl A | (835 | ) | (34 | ) | ||||
RH * | (151 | ) | (40 | ) | ||||
Rivian Automotive Inc, Cl A * | (24,196 | ) | (587 | ) | ||||
Ross Stores Inc | (3,390 | ) | (383 | ) | ||||
Royal Caribbean Cruises Ltd * | (3,415 | ) | (315 | ) | ||||
SeaWorld Entertainment Inc * | (580 | ) | (27 | ) | ||||
Service Corp International/US | (2,164 | ) | (124 | ) | ||||
Shake Shack Inc, Cl A * | (446 | ) | (26 | ) | ||||
Signet Jewelers Ltd | (409 | ) | (29 | ) | ||||
Six Flags Entertainment Corp * | (900 | ) | (21 | ) | ||||
Skechers USA Inc, Cl A * | (3,937 | ) | (193 | ) | ||||
Skyline Champion Corp * | (1,593 | ) | (102 | ) | ||||
Sonos Inc * | (3,822 | ) | (49 | ) | ||||
Standard Motor Products Inc | (916 | ) | (31 | ) | ||||
Starbucks Corp | (17,143 | ) | (1,565 | ) | ||||
Steven Madden Ltd | (2,661 | ) | (85 | ) | ||||
Stoneridge Inc * | (1,000 | ) | (20 | ) | ||||
Strategic Education Inc | (400 | ) | (30 | ) | ||||
Description | Shares | Market Value | ||||||
COMMON STOCK SOLD SHORT (continued) | ||||||||
Stride Inc * | (600 | ) | $ | (27 | ) | |||
Sturm Ruger & Co Inc | (600 | ) | (31 | ) | ||||
Sweetgreen, Cl A * | (506 | ) | (6 | ) | ||||
Tapestry Inc | (7,169 | ) | (206 | ) | ||||
Taylor Morrison Home Corp, Cl A * | (3,227 | ) | (138 | ) | ||||
Tempur Sealy International Inc | (4,974 | ) | (216 | ) | ||||
Tesla Inc * | (19,667 | ) | (4,921 | ) | ||||
Texas Roadhouse Inc, Cl A | (1,072 | ) | (103 | ) | ||||
Thor Industries Inc | (2,287 | ) | (218 | ) | ||||
TJX Cos Inc/The | (11,447 | ) | (1,017 | ) | ||||
Toll Brothers Inc | (3,233 | ) | (239 | ) | ||||
TopBuild Corp * | (1,006 | ) | (253 | ) | ||||
Topgolf Callaway Brands Corp * | (4,099 | ) | (57 | ) | ||||
Tractor Supply Co | (1,107 | ) | (225 | ) | ||||
Travel + Leisure Co | (1,381 | ) | (51 | ) | ||||
Tri Pointe Homes Inc * | (2,985 | ) | (82 | ) | ||||
Ulta Beauty Inc * | (502 | ) | (201 | ) | ||||
Under Armour Inc, Cl A * | (5,729 | ) | (39 | ) | ||||
Under Armour Inc, Cl C * | (5,719 | ) | (36 | ) | ||||
Urban Outfitters Inc * | (800 | ) | (26 | ) | ||||
Vail Resorts Inc | (610 | ) | (135 | ) | ||||
Valvoline Inc | (1,144 | ) | (37 | ) | ||||
VF Corp | (10,728 | ) | (190 | ) | ||||
Vista Outdoor Inc * | (1,676 | ) | (56 | ) | ||||
Visteon Corp * | (1,222 | ) | (169 | ) | ||||
Wayfair Inc, Cl A * | (700 | ) | (42 | ) | ||||
Wendy's Co/The | (2,795 | ) | (57 | ) | ||||
Whirlpool Corp | (1,580 | ) | (211 | ) | ||||
Williams-Sonoma Inc | (722 | ) | (112 | ) | ||||
Wingstop Inc, Cl A | (466 | ) | (84 | ) | ||||
Winnebago Industries Inc | (1,163 | ) | (69 | ) | ||||
Wolverine World Wide Inc | (1,909 | ) | (15 | ) | ||||
Wyndham Hotels & Resorts Inc | (1,272 | ) | (88 | ) | ||||
Wynn Resorts Ltd | (1,465 | ) | (135 | ) | ||||
XPEL Inc * | (988 | ) | (76 | ) | ||||
YETI Holdings Inc * | (2,349 | ) | (113 | ) | ||||
Yum! Brands Inc | (4,290 | ) | (536 | ) | ||||
| (57,244 | ) | |||||||
Energy — 0.0% | ||||||||
Arch Resources Inc | (200 | ) | (34 | ) | ||||
Health Care — 0.0% | ||||||||
Figs Inc, Cl A * | (2,700 | ) | (16 | ) | ||||
Information Technology — (2.2)% | ||||||||
Advanced Micro Devices Inc * | (4,759 | ) | (489 | ) | ||||
Amphenol Corp, Cl A | (2,211 | ) | (186 | ) | ||||
Analog Devices Inc | (1,603 | ) | (281 | ) | ||||
Apple Inc | (26,983 | ) | (4,620 | ) | ||||
SEI Institutional Managed Trust
341
CONSOLIDATED SCHEDULE OF INVESTMENTS
September 30, 2023
Multi-Asset Inflation Managed Fund (Continued)
Description | Shares | Market Value | ||||||
COMMON STOCK SOLD SHORT (continued) | ||||||||
Applied Materials Inc | (2,692 | ) | $ | (373 | ) | |||
Arista Networks Inc * | (805 | ) | (148 | ) | ||||
Arrow Electronics Inc, Cl A * | (309 | ) | (39 | ) | ||||
Avnet Inc | (497 | ) | (24 | ) | ||||
Broadcom Inc | (1,223 | ) | (1,016 | ) | ||||
CDW Corp/DE | (453 | ) | (91 | ) | ||||
Cirrus Logic Inc * | (300 | ) | (22 | ) | ||||
Cisco Systems Inc | (13,550 | ) | (728 | ) | ||||
Cognex Corp | (722 | ) | (31 | ) | ||||
Corning Inc, Cl B | (3,044 | ) | (93 | ) | ||||
Diodes Inc * | (301 | ) | (24 | ) | ||||
Enphase Energy Inc * | (414 | ) | (50 | ) | ||||
Entegris Inc | (434 | ) | (41 | ) | ||||
F5 Inc, Cl A * | (200 | ) | (32 | ) | ||||
First Solar Inc * | (310 | ) | (50 | ) | ||||
GLOBALFOUNDRIES Inc * | (360 | ) | (21 | ) | ||||
Hewlett Packard Enterprise Co | (3,757 | ) | (65 | ) | ||||
HP Inc | (2,506 | ) | (64 | ) | ||||
Intel Corp | (12,672 | ) | (451 | ) | ||||
Jabil Inc | (320 | ) | (41 | ) | ||||
Juniper Networks Inc | (1,049 | ) | (29 | ) | ||||
Keysight Technologies Inc * | (695 | ) | (92 | ) | ||||
KLA Corp | (476 | ) | (218 | ) | ||||
Lam Research Corp | (425 | ) | (266 | ) | ||||
Lattice Semiconductor Corp * | (466 | ) | (40 | ) | ||||
Littelfuse Inc | (100 | ) | (25 | ) | ||||
Lumentum Holdings Inc * | (426 | ) | (19 | ) | ||||
Marvell Technology Inc | (2,607 | ) | (141 | ) | ||||
Microchip Technology Inc | (1,692 | ) | (132 | ) | ||||
Micron Technology Inc | (3,357 | ) | (228 | ) | ||||
Monolithic Power Systems Inc | (128 | ) | (59 | ) | ||||
Motorola Solutions Inc | (490 | ) | (133 | ) | ||||
National Instruments Corp | (500 | ) | (30 | ) | ||||
NetApp Inc | (670 | ) | (51 | ) | ||||
Novanta Inc * | (100 | ) | (14 | ) | ||||
NVIDIA Corp | (7,093 | ) | (3,085 | ) | ||||
ON Semiconductor Corp * | (1,359 | ) | (126 | ) | ||||
Pure Storage Inc, Cl A * | (821 | ) | (29 | ) | ||||
Qorvo Inc * | (292 | ) | (28 | ) | ||||
QUALCOMM Inc | (3,406 | ) | (378 | ) | ||||
Sabre Corp * | (5,200 | ) | (23 | ) | ||||
Silicon Laboratories Inc * | (100 | ) | (12 | ) | ||||
Skyworks Solutions Inc | (508 | ) | (50 | ) | ||||
Super Micro Computer Inc * | (100 | ) | (27 | ) | ||||
Teledyne Technologies Inc * | (205 | ) | (84 | ) | ||||
Teradyne Inc | (593 | ) | (60 | ) | ||||
Texas Instruments Inc | (2,916 | ) | (464 | ) | ||||
Trimble Inc * | (927 | ) | (50 | ) | ||||
Western Digital Corp * | (640 | ) | (29 | ) | ||||
Wolfspeed Inc * | (409 | ) | (16 | ) | ||||
Zebra Technologies Corp, Cl A * | (189 | ) | (45 | ) | ||||
Description | Shares | Market Value | ||||||
COMMON STOCK SOLD SHORT (continued) | ||||||||
| (14,963 | ) | |||||||
Materials — (1.4)% | ||||||||
Air Products and Chemicals Inc | (1,884 | ) | $ | (534 | ) | |||
Albemarle Corp | (1,026 | ) | (174 | ) | ||||
Alcoa Corp | (1,342 | ) | (39 | ) | ||||
Alpha Metallurgical Resources Inc | (144 | ) | (37 | ) | ||||
Amcor PLC | (11,953 | ) | (109 | ) | ||||
AptarGroup Inc | (583 | ) | (73 | ) | ||||
Ashland Inc | (400 | ) | (33 | ) | ||||
ATI Inc * | (1,064 | ) | (44 | ) | ||||
Avery Dennison Corp | (738 | ) | (135 | ) | ||||
Avient Corp | (921 | ) | (32 | ) | ||||
Axalta Coating Systems Ltd * | (1,749 | ) | (47 | ) | ||||
Balchem Corp | (300 | ) | (37 | ) | ||||
Ball Corp | (2,866 | ) | (143 | ) | ||||
Berry Global Group Inc | (1,168 | ) | (72 | ) | ||||
Cabot Corp | (500 | ) | (35 | ) | ||||
Carpenter Technology Corp | (400 | ) | (27 | ) | ||||
Celanese Corp, Cl A | (994 | ) | (125 | ) | ||||
CF Industries Holdings Inc | (1,725 | ) | (148 | ) | ||||
Chemours Co/The | (1,058 | ) | (30 | ) | ||||
Cleveland-Cliffs Inc * | (4,565 | ) | (71 | ) | ||||
Commercial Metals Co, Cl A | (1,032 | ) | (51 | ) | ||||
Constellium, Cl A * | (1,900 | ) | (35 | ) | ||||
Corteva Inc | (6,024 | ) | (308 | ) | ||||
Crown Holdings Inc | (856 | ) | (76 | ) | ||||
Dow Inc | (5,908 | ) | (305 | ) | ||||
DuPont de Nemours Inc | (4,099 | ) | (306 | ) | ||||
Eagle Materials Inc | (326 | ) | (54 | ) | ||||
Eastman Chemical Co | (1,104 | ) | (85 | ) | ||||
Ecolab Inc | (2,103 | ) | (356 | ) | ||||
Element Solutions Inc | (1,824 | ) | (36 | ) | ||||
FMC Corp | (1,012 | ) | (68 | ) | ||||
Freeport-McMoRan Inc, Cl B | (12,809 | ) | (478 | ) | ||||
Ginkgo Bioworks Holdings Inc * | (8,000 | ) | (14 | ) | ||||
Graphic Packaging Holding Co | (2,337 | ) | (52 | ) | ||||
HB Fuller Co | (459 | ) | (31 | ) | ||||
Hecla Mining Co | (5,000 | ) | (20 | ) | ||||
Huntsman Corp | (1,666 | ) | (41 | ) | ||||
International Flavors & Fragrances Inc | (2,203 | ) | (150 | ) | ||||
International Paper Co | (2,983 | ) | (106 | ) | ||||
Knife River Corp * | (400 | ) | (20 | ) | ||||
Linde PLC | (4,213 | ) | (1,569 | ) | ||||
Livent Corp * | (1,486 | ) | (27 | ) | ||||
Louisiana-Pacific Corp | (529 | ) | (29 | ) | ||||
LyondellBasell Industries NV, Cl A | (2,460 | ) | (233 | ) | ||||
Martin Marietta Materials Inc, Cl A | (628 | ) | (258 | ) | ||||
Materion Corp | (200 | ) | (20 | ) | ||||
Mosaic Co/The | (2,715 | ) | (97 | ) | ||||
MP Materials Corp * | (1,200 | ) | (23 | ) | ||||
Newmont Corp | (6,782 | ) | (251 | ) | ||||
342
SEI Institutional Managed Trust
Description | Shares | Market Value | ||||||
COMMON STOCK SOLD SHORT (continued) | ||||||||
Nucor Corp | (2,074 | ) | $ | (324 | ) | |||
O-I Glass Inc, Cl I * | (1,436 | ) | (24 | ) | ||||
Olin Corp | (790 | ) | (39 | ) | ||||
Packaging Corp of America | (767 | ) | (118 | ) | ||||
PPG Industries Inc | (2,070 | ) | (269 | ) | ||||
Quaker Chemical Corp | (58 | ) | (9 | ) | ||||
Reliance Steel & Aluminum Co | (478 | ) | (125 | ) | ||||
Royal Gold Inc, Cl A | (672 | ) | (71 | ) | ||||
RPM International Inc | (1,042 | ) | (99 | ) | ||||
Scotts Miracle-Gro Co/The, Cl A | (300 | ) | (15 | ) | ||||
Sealed Air Corp | (1,187 | ) | (39 | ) | ||||
Sensient Technologies Corp | (500 | ) | (29 | ) | ||||
Sherwin-Williams Co/The, Cl A | (2,012 | ) | (513 | ) | ||||
Silgan Holdings Inc | (900 | ) | (39 | ) | ||||
Sonoco Products Co | (800 | ) | (43 | ) | ||||
Steel Dynamics Inc | (1,305 | ) | (140 | ) | ||||
Summit Materials Inc, Cl A * | (1,097 | ) | (34 | ) | ||||
Tronox Holdings | (1,726 | ) | (23 | ) | ||||
United States Steel Corp | (2,129 | ) | (69 | ) | ||||
Vulcan Materials Co | (1,078 | ) | (218 | ) | ||||
Warrior Met Coal Inc | (600 | ) | (31 | ) | ||||
Westlake Corp | (310 | ) | (39 | ) | ||||
Westrock Co | (2,046 | ) | (73 | ) | ||||
Worthington Industries Inc | (500 | ) | (31 | ) | ||||
| (9,458 | ) | |||||||
Total Common Stock Sold Short | ||||||||
(Proceeds $94,102) ($ Thousands) | (85,606 | ) | ||||||
FOREIGN COMMON STOCK SOLD SHORT— 0.0% | ||||||||
Canada — (0.0)% | ||||||||
SSR Mining Inc | (1,500 | ) | (20 | ) | ||||
Mexico — (0.0)% | ||||||||
Southern Copper Corp | (895 | ) | (67 | ) | ||||
Description | Shares | Market Value | ||||||
FOREIGN COMMON STOCK SOLD SHORT (continued) | ||||||||
South Korea — (0.0)% | ||||||||
Coupang Inc, Cl A * | (9,733 | ) | $ | (166 | ) | |||
Total Foreign Common Stock Sold Short | ||||||||
(Proceeds $254) ($ Thousands) | (253 | ) | ||||||
Total Investments Sold Short — (12.6)% | ||||||||
(Proceeds $94,356) ($ Thousands) | $ | (85,859 | ) | |||||
WRITTEN OPTION — (0.0)% | ||||||||
Total Written Option | ||||||||
(Premiums Received $19) ($ Thousands) | $ | (7 | ) | |||||
SEI Institutional Managed Trust
343
CONSOLIDATED SCHEDULE OF INVESTMENTS
September 30, 2023
Multi-Asset Inflation Managed Fund (Continued)
A list of open exchange traded options contracts for the Fund at September 30, 2023, is as follows:
Description | Number of Contracts | Notional Amount | Exercise Price | Expiration Date | Value | |||||||||||||||
PURCHASED OPTIONS — 0.0% | ||||||||||||||||||||
Put Options | ||||||||||||||||||||
November 2023, Copper^ | 72 | $ | 5,580 | $ | 310.00 | 10/21/2023 | $ | 1 | ||||||||||||
November 2023, Copper^ | 72 | 6,300 | 350.00 | 10/21/2023 | 16 | |||||||||||||||
Total Purchased Options | $ | 11,880 | $ | 17 | ||||||||||||||||
WRITTEN OPTION — 0.0% | ||||||||||||||||||||
Put Options | ||||||||||||||||||||
November 2023, Copper^ | (144 | ) | $ | (11,880 | ) | 330.00 | 10/21/2023 | $ | (7 | ) | ||||||||||
Total Written Option | $ | (11,880 | ) | $ | (7 | ) | ||||||||||||||
A list of the open futures contracts held by the Fund at September 30, 2023, is as follows:
Type of Contract | Number of | Expiration Date | Notional Amount (Thousands) | Value | Unrealized Appreciation/ | |||||||||||||||
Long Contracts | ||||||||||||||||||||
Brent Crude^ | 27 | May-2024 | $ | 2,176 | $ | 2,321 | $ | 145 | ||||||||||||
Brent Crude^ | 14 | Jul-2024 | 1,204 | 1,187 | (18 | ) | ||||||||||||||
Brent Crude^ | 13 | Mar-2024 | 948 | 1,140 | 191 | |||||||||||||||
Brent Crude^ | 77 | Jan-2024 | 6,869 | 6,958 | 89 | |||||||||||||||
Coffee C^ | 26 | Dec-2023 | 1,553 | 1,425 | (128 | ) | ||||||||||||||
Coffee C^ | 13 | May-2024 | 756 | 721 | (35 | ) | ||||||||||||||
Coffee C^ | 13 | Mar-2024 | 768 | 718 | (50 | ) | ||||||||||||||
Copper^ | 27 | Dec-2023 | 2,559 | 2,523 | (36 | ) | ||||||||||||||
Copper^ | 15 | May-2024 | 1,431 | 1,418 | (13 | ) | ||||||||||||||
Copper^ | 34 | Mar-2024 | 3,250 | 3,200 | (50 | ) | ||||||||||||||
Corn^ | 162 | Dec-2023 | 3,922 | 3,862 | (60 | ) | ||||||||||||||
Corn^ | 45 | May-2024 | 1,140 | 1,126 | (14 | ) | ||||||||||||||
Corn^ | 46 | Mar-2024 | 1,154 | 1,131 | (23 | ) | ||||||||||||||
Cotton No. 2^ | 10 | May-2024 | 437 | 443 | 6 | |||||||||||||||
Cotton No. 2^ | 10 | Mar-2024 | 418 | 440 | 21 | |||||||||||||||
Cotton No. 2^ | 6 | Dec-2023 | 261 | 261 | 1 | |||||||||||||||
Feeder Cattle^ | 5 | Nov-2023 | 644 | 637 | (7 | ) | ||||||||||||||
Gasoline^ | 25 | Nov-2023 | 2,662 | 2,519 | (143 | ) | ||||||||||||||
Gasoline^ | 3 | Mar-2024 | 280 | 293 | 13 | |||||||||||||||
Gasoline^ | 3 | Jan-2024 | 269 | 293 | 23 | |||||||||||||||
Gasoline^ | 6 | May-2024 | 660 | 633 | (26 | ) | ||||||||||||||
Gasoline^ | 2 | Jan-2024 | 213 | 195 | (18 | ) | ||||||||||||||
Gold^ | 47 | Feb-2024 | 9,189 | 8,861 | (328 | ) | ||||||||||||||
Gold^ | 22 | Apr-2024 | 4,412 | 4,189 | (224 | ) | ||||||||||||||
Gold^ | 11 | Jun-2024 | 2,195 | 2,116 | (79 | ) | ||||||||||||||
Gold^ | 20 | Dec-2023 | 3,949 | 3,732 | (217 | ) | ||||||||||||||
KC HRW Wheat^ | 38 | Dec-2023 | 1,426 | 1,261 | (164 | ) | ||||||||||||||
KC HRW Wheat^ | 12 | May-2024 | 450 | 407 | (42 | ) | ||||||||||||||
KC HRW Wheat^ | 12 | Mar-2024 | 461 | 403 | (58 | ) | ||||||||||||||
Lean Hogs^ | 7 | Feb-2024 | 225 | 211 | (14 | ) | ||||||||||||||
Lean Hogs^ | 14 | Apr-2024 | 471 | 453 | (18 | ) | ||||||||||||||
Lean Hogs^ | 6 | Jun-2024 | 231 | 226 | (6 | ) | ||||||||||||||
Lean Hogs^ | 16 | Dec-2023 | 485 | 459 | (26 | ) | ||||||||||||||
Live Cattle^ | 6 | Dec-2023 | 420 | 451 | 31 | |||||||||||||||
Live Cattle^ | 46 | Dec-2023 | 3,506 | 3,458 | (48 | ) | ||||||||||||||
344
SEI Institutional Managed Trust
Type of Contract | Number of | Expiration Date | Notional Amount (Thousands) | Value | Unrealized Appreciation/ | |||||||||||||||
Live Cattle^ | 7 | Feb-2024 | $ | 510 | $ | 539 | $ | 29 | ||||||||||||
Live Cattle^ | 14 | Apr-2024 | 1,066 | 1,095 | 28 | |||||||||||||||
Live Cattle^ | 7 | Jun-2024 | 533 | 531 | (2 | ) | ||||||||||||||
LME Lead^ | 17 | Dec-2023 | 915 | 923 | 7 | |||||||||||||||
LME Lead^ | 25 | Nov-2023 | 1,359 | 1,355 | (4 | ) | ||||||||||||||
LME Lead^ | 5 | May-2024 | 274 | 272 | (1 | ) | ||||||||||||||
LME Lead^ | 2 | Mar-2024 | 105 | 109 | 3 | |||||||||||||||
LME Lead^ | 2 | Jan-2024 | 107 | 109 | 2 | |||||||||||||||
LME Nickel^ | 2 | Mar-2024 | 247 | 227 | (19 | ) | ||||||||||||||
LME Nickel^ | 2 | Jan-2024 | 267 | 225 | (42 | ) | ||||||||||||||
LME Nickel^ | 1 | Nov-2023 | 139 | 111 | (27 | ) | ||||||||||||||
LME Nickel^ | 4 | May-2024 | 497 | 459 | (38 | ) | ||||||||||||||
LME Primary Aluminum^ | 6 | Nov-2023 | 341 | 352 | 11 | |||||||||||||||
LME Primary Aluminum^ | 20 | May-2024 | 1,138 | 1,198 | 60 | |||||||||||||||
LME Primary Aluminum^ | 10 | Mar-2024 | 571 | 593 | 22 | |||||||||||||||
LME Primary Aluminum^ | 10 | Jan-2024 | 578 | 589 | 12 | |||||||||||||||
LME Primary Aluminum^ | 69 | Dec-2023 | 3,834 | 4,058 | 224 | |||||||||||||||
LME Zinc^ | 5 | Mar-2024 | 305 | 332 | 28 | |||||||||||||||
LME Zinc^ | 10 | Nov-2023 | 612 | 662 | 50 | |||||||||||||||
LME Zinc^ | 5 | Jan-2024 | 319 | 332 | 12 | |||||||||||||||
LME Zinc^ | 11 | May-2024 | 688 | 731 | 43 | |||||||||||||||
LME Zinc^ | 28 | Dec-2023 | 1,680 | 1,857 | 177 | |||||||||||||||
Low Sulphur Gasoil^ | 5 | Mar-2024 | 363 | 434 | 71 | |||||||||||||||
Low Sulphur Gasoil^ | 10 | May-2024 | 819 | 839 | 20 | |||||||||||||||
Low Sulphur Gasoil^ | 22 | Nov-2023 | 1,990 | 2,126 | 136 | |||||||||||||||
Low Sulphur Gasoil^ | 11 | Jan-2024 | 836 | 992 | 156 | |||||||||||||||
Natural Gas^ | 26 | Jan-2024 | 996 | 927 | (69 | ) | ||||||||||||||
Natural Gas^ | 63 | May-2024 | 1,973 | 1,900 | (73 | ) | ||||||||||||||
Natural Gas^ | 29 | Mar-2024 | 1,006 | 934 | (73 | ) | ||||||||||||||
Natural Gas^ | 123 | Nov-2023 | 4,093 | 3,603 | (490 | ) | ||||||||||||||
NY Harbor ULSD^ | 5 | May-2024 | 584 | 588 | 4 | |||||||||||||||
NY Harbor ULSD^ | 3 | Mar-2024 | 314 | 370 | 55 | |||||||||||||||
NY Harbor ULSD^ | 21 | Jan-2024 | 2,576 | 2,704 | 127 | |||||||||||||||
NY Harbor ULSD^ | 24 | Nov-2023 | 3,015 | 3,327 | 312 | |||||||||||||||
NYMEX Cocoa^ | 80 | Dec-2023 | 2,856 | 2,734 | (121 | ) | ||||||||||||||
Platinum^ | 16 | Jan-2024 | 726 | 733 | 7 | |||||||||||||||
Silver^ | 44 | Mar-2024 | 5,427 | 5,014 | (413 | ) | ||||||||||||||
Silver^ | 10 | May-2024 | 1,187 | 1,152 | (36 | ) | ||||||||||||||
Silver^ | 14 | Dec-2023 | 1,629 | 1,572 | (57 | ) | ||||||||||||||
Soybean^ | 13 | Jan-2024 | 870 | 841 | (29 | ) | ||||||||||||||
Soybean^ | 11 | Mar-2024 | 745 | 721 | (24 | ) | ||||||||||||||
Soybean^ | 21 | Mar-2024 | 1,429 | 1,388 | (41 | ) | ||||||||||||||
Soybean^ | 15 | Nov-2023 | 988 | 956 | (32 | ) | ||||||||||||||
Soybean Meal^ | 115 | Dec-2023 | 4,491 | 4,384 | (108 | ) | ||||||||||||||
Soybean Meal^ | 10 | Mar-2024 | 388 | 375 | (13 | ) | ||||||||||||||
Soybean Meal^ | 21 | May-2024 | 804 | 784 | (21 | ) | ||||||||||||||
Soybean Meal^ | 76 | Jan-2024 | 2,948 | 2,883 | (64 | ) | ||||||||||||||
Soybean Oil^ | 36 | Dec-2023 | 1,276 | 1,206 | (70 | ) | ||||||||||||||
Soybean Oil^ | 32 | Jan-2024 | 1,172 | 1,060 | (111 | ) | ||||||||||||||
Soybean Oil^ | 25 | May-2024 | 893 | 818 | (76 | ) | ||||||||||||||
Soybean Oil^ | 12 | Mar-2024 | 431 | 394 | (37 | ) | ||||||||||||||
Sugar No. 11^ | 158 | Mar-2024 | 4,711 | 4,686 | (25 | ) | ||||||||||||||
Sugar No. 11^ | 72 | May-2024 | 2,024 | 2,037 | 13 | |||||||||||||||
Sugar No. 11^ | 24 | Mar-2024 | 676 | 712 | 36 | |||||||||||||||
U.S. 5-Year Treasury Note | 374 | Dec-2023 | 39,796 | 39,404 | (392 | ) | ||||||||||||||
Wheat^ | 19 | May-2024 | 616 | 565 | (51 | ) | ||||||||||||||
Wheat^ | 20 | Mar-2024 | 661 | 574 | (87 | ) | ||||||||||||||
Wheat^ | 8 | Dec-2023 | 264 | 217 | (47 | ) | ||||||||||||||
SEI Institutional Managed Trust
345
CONSOLIDATED SCHEDULE OF INVESTMENTS
September 30, 2023
Multi-Asset Inflation Managed Fund (Continued)
Type of Contract | Number of | Expiration Date | Notional Amount (Thousands) | Value | Unrealized Appreciation/ | |||||||||||||||
WTI Crude Oil^ | 16 | Nov-2023 | $ | 1,188 | $ | 1,453 | $ | 265 | ||||||||||||
WTI Crude Oil^ | 32 | May-2024 | 2,597 | 2,620 | 23 | |||||||||||||||
WTI Crude Oil^ | 161 | Mar-2024 | 12,838 | 13,505 | 666 | |||||||||||||||
WTI Crude Oil^ | 15 | Jan-2024 | 1,059 | 1,305 | 246 | |||||||||||||||
| 190,334 | 189,167 | (1,173 | ) | |||||||||||||||||
Short Contracts | ||||||||||||||||||||
Cotton No. 2^ | (27 | ) | Dec-2023 | $ | (1,178 | ) | $ | (1,177 | ) | $ | 2 | |||||||||
Japanese 10-Year Bond | (12 | ) | Dec-2023 | (11,917 | ) | (11,657 | ) | 91 | ||||||||||||
Lean Hogs^ | (79 | ) | Dec-2023 | (2,373 | ) | (2,268 | ) | 105 | ||||||||||||
LME Lead^ | (14 | ) | Dec-2023 | (783 | ) | (760 | ) | 24 | ||||||||||||
LME Nickel^ | (5 | ) | Dec-2023 | (596 | ) | (560 | ) | 37 | ||||||||||||
MSCI EAFE Index | (98 | ) | Dec-2023 | (10,262 | ) | (10,003 | ) | 259 | ||||||||||||
Palladium^ | (13 | ) | Dec-2023 | (1,638 | ) | (1,633 | ) | 5 | ||||||||||||
S&P 500 Index E-MINI | (92 | ) | Dec-2023 | (20,725 | ) | (19,897 | ) | 828 | ||||||||||||
U.S. 2-Year Treasury Note | (16 | ) | Dec-2023 | (3,249 | ) | (3,243 | ) | 6 | ||||||||||||
U.S. Ultra Long Treasury Bond | (11 | ) | Dec-2023 | (1,383 | ) | (1,306 | ) | 78 | ||||||||||||
Ultra 10-Year U.S. Treasury Note | (5 | ) | Dec-2023 | (560 | ) | (558 | ) | 3 | ||||||||||||
Wheat^ | (32 | ) | Dec-2023 | (968 | ) | (866 | ) | 102 | ||||||||||||
WTI Crude Oil^ | (33 | ) | Dec-2023 | (2,846 | ) | (2,930 | ) | (84 | ) | |||||||||||
| (58,478 | ) | (56,858 | ) | 1,456 | ||||||||||||||||
| $ | 131,856 | $ | 132,309 | $ | 283 | |||||||||||||||
A list of the open forward foreign currency contracts held by the Fund at September 30, 2023, is as follows:
Counterparty | Settlement Date | Currency to Deliver | Currency to Receive | Unrealized Appreciation | ||||||||||||||||||||
Brown Brothers Harriman | 10/12/23 | USD | 5 | EUR | 5 | $ | — | |||||||||||||||||
Morgan Stanley | 10/12/23 | EUR | 2,453 | USD | 2,705 | 107 | ||||||||||||||||||
| $ | 107 | |||||||||||||||||||||||
A list of the open OTC swap agreements held by the Fund at September 30, 2023 is as follows:
Credit Default Swaps - Sell Protection | ||||||||||||||||||||||||||||||||
Counterparty | Reference Entity/ Obligation | Receive Rate | Payment Frequency | Termination Date | Notional Amount | Value | Upfront Payments/ Receipts | Net Unrealized | ||||||||||||||||||||||||
Deutsche Bank | CMBX.NA.BBB.6 | 3.00% | Monthly | 12/31/2049 | $ | 21 | $ | (3 | ) | $ | (1 | ) | $ | (2 | ) | |||||||||||||||||
Citibank | CMBX.NA.BBB.6 | 3.00% | Monthly | 05/11/2063 | 16 | (2 | ) | (1 | ) | (1 | ) | |||||||||||||||||||||
Citibank | CMBX.NA.BBB.6 | 3.00% | Monthly | 05/11/2063 | 15 | (2 | ) | (1 | ) | (1 | ) | |||||||||||||||||||||
Citibank | CMBX.NA.BBB.6 | 3.00% | Monthly | 05/11/2063 | 2 | — | — | — | ||||||||||||||||||||||||
Citibank | CMBX.NA.BBB.6 | 3.00% | Monthly | 05/11/2063 | 19 | (7 | ) | (2 | ) | (5 | ) | |||||||||||||||||||||
Citibank | CMBX.NA.BBB.6 | 3.00% | Monthly | 05/11/2063 | 16 | (2 | ) | (2 | ) | — | ||||||||||||||||||||||
Citibank | CMBX.NA.BBB.6 | 3.00% | Monthly | 05/11/2063 | 14 | (2 | ) | (2 | ) | — | ||||||||||||||||||||||
Citibank | CMBX.NA.BBB.6 | 3.00% | Monthly | 05/11/2063 | 16 | (2 | ) | (2 | ) | — | ||||||||||||||||||||||
Citibank | CMBX.NA.BBB.6 | 3.00% | Monthly | 05/11/2063 | 3 | (1 | ) | — | (1 | ) | ||||||||||||||||||||||
Citibank | CMBX.NA.BBB.6 | 3.00% | Monthly | 05/11/2063 | 9 | (1 | ) | — | (1 | ) | ||||||||||||||||||||||
Citibank | CMBX.NA.BBB.6 | 3.00% | Monthly | 05/11/2063 | 10 | (2 | ) | (1 | ) | (1 | ) | |||||||||||||||||||||
Citibank | CMBX.NA.BBB.6 | 3.00% | Monthly | 05/11/2063 | 29 | (4 | ) | (3 | ) | (1 | ) | |||||||||||||||||||||
Credit Suisse | CMBX.NA.BBB.6 | 3.00% | Monthly | 05/11/2063 | 1 | — | — | — | ||||||||||||||||||||||||
Deutsche Bank | CMBX.NA.BBB.6 | 3.00% | Monthly | 05/11/2063 | 16 | (2 | ) | (1 | ) | (1 | ) | |||||||||||||||||||||
Deutsche Bank | CMBX.NA.BBB.6 | 3.00% | Monthly | 05/11/2063 | 98 | (14 | ) | (11 | ) | (3 | ) | |||||||||||||||||||||
Deutsche Bank | CMBX.NA.BBB.6 | 3.00% | Monthly | 05/11/2063 | 55 | (8 | ) | (5 | ) | (3 | ) | |||||||||||||||||||||
Deutsche Bank | CMBX.NA.BBB.6 | 3.00% | Monthly | 05/11/2063 | 55 | (8 | ) | (6 | ) | (2 | ) | |||||||||||||||||||||
Goldman Sachs | CMBX.NA.BBB.6 | 3.00% | Monthly | 05/11/2063 | 109 | (16 | ) | (10 | ) | (6 | ) | |||||||||||||||||||||
Goldman Sachs | CMBX.NA.BBB.6 | 3.00% | Monthly | 05/11/2063 | 95 | (14 | ) | (7 | ) | (7 | ) | |||||||||||||||||||||
346
SEI Institutional Managed Trust
Counterparty | Reference Entity/ Obligation | Receive Rate | Payment Frequency | Termination Date | Notional Amount | Value | Upfront Payments/ Receipts | Net Unrealized | ||||||||||||||||||||||||
Goldman Sachs | CMBX.NA.BBB.6 | 3.00% | Monthly | 05/11/2063 | $ | 8 | $ | (1 | ) | $ | (1 | ) | $ | — | ||||||||||||||||||
Goldman Sachs | CMBX.NA.BBB.6 | 3.00% | Monthly | 05/11/2063 | 16 | (2 | ) | (1 | ) | (1 | ) | |||||||||||||||||||||
Goldman Sachs | CMBX.NA.BBB.6 | 3.00% | Monthly | 05/11/2063 | 16 | (2 | ) | (1 | ) | (1 | ) | |||||||||||||||||||||
Goldman Sachs | CMBX.NA.BBB.6 | 3.00% | Monthly | 05/11/2063 | 32 | (5 | ) | (3 | ) | (2 | ) | |||||||||||||||||||||
| $ | (100 | ) | $ | (61 | ) | $ | (39 | ) | ||||||||||||||||||||||||
A list of the open centrally cleared swap agreements held by the Fund at September 30, 2023 is as follows:
Credit Default Swaps - Buy Protection | ||||||||||||||||||||||||||||
Reference Entity/ Obligation | Pay Rate | Payment Frequency | Termination Date | Notional Amount | Value | Upfront Payments/ Receipts | Net Unrealized | |||||||||||||||||||||
CDX.NA.HY. S41V1.5Y | 5.00% | Quarterly | 12/20/2028 | $ | 7,820 | $ | (74 | ) | $ | (75 | ) | $ | 1 | |||||||||||||||
Itraxx Australia | 1.00% | Quarterly | 12/20/2028 | 14,530 | (82 | ) | (116 | ) | 34 | |||||||||||||||||||
Malaysia | 1.00% | Quarterly | 12/20/2028 | 18,090 | (409 | ) | (422 | ) | 13 | |||||||||||||||||||
| $ | (565 | ) | $ | (613 | ) | $ | 48 | |||||||||||||||||||||
Credit Default Swap - Sell Protection | ||||||||||||||||||||||||||||
Reference Entity/ Obligation | Receive Rate | Payment Frequency | Termination Date | Notional Amount | Value | Upfront Payments/ Receipts | Net Unrealized | |||||||||||||||||||||
CDX.NA.IG. S41V1.5Y | 1.00% | Quarterly | 12/20/2028 | $ | 14,530 | $ | 178 | $ | 197 | $ | (19 | ) | ||||||||||||||||
Interest Rate Swaps | ||||||||||||||||||||||||||||||||
Fund Pays | Fund Receives | Payment Frequency | Termination Date | Currency | Notional Amount | Value | Upfront Payments/ Receipts | Net Unrealized | ||||||||||||||||||||||||
USD @ 0% | USD CPI% | Annually | 01/15/2027 | USD | 6,000 | $ | 853 | $ | – | $ | 853 | |||||||||||||||||||||
1.4725% | SOFR% | Annually | 11/09/2026 | USD | 1,490 | 129 | 122 | 7 | ||||||||||||||||||||||||
1.455% | SOFR% | Annually | 11/08/2026 | USD | 1,490 | 129 | 123 | 6 | ||||||||||||||||||||||||
1.3945% | SOFR% | Annually | 05/21/2031 | USD | 18,720 | 3,490 | 2,831 | 659 | ||||||||||||||||||||||||
1.98% | SOFR% | Annually | 07/12/2027 | USD | 1,075 | 93 | 68 | 25 | ||||||||||||||||||||||||
2.28% | SOFR% | Annually | 05/18/2025 | USD | 2,820 | 126 | 96 | 30 | ||||||||||||||||||||||||
1.27% | SOFR% | Annually | 09/27/2029 | USD | 2,230 | 356 | 269 | 87 | ||||||||||||||||||||||||
1.965% | SOFR% | Annually | 06/04/2029 | USD | 4,220 | 499 | 344 | 155 | ||||||||||||||||||||||||
0.316% | SOFR% | Annually | 06/05/2027 | USD | 15,800 | 2,224 | 1,869 | 355 | ||||||||||||||||||||||||
2.21% | SOFR% | Annually | 04/04/2027 | USD | 10,400 | 778 | 557 | 221 | ||||||||||||||||||||||||
1.33% | SOFR% | Annually | 10/25/2026 | USD | 6,110 | 570 | 457 | 113 | ||||||||||||||||||||||||
1.92% | SOFR% | Annually | 08/04/2025 | USD | 2,717 | 148 | 115 | 33 | ||||||||||||||||||||||||
2.51% | SOFR% | Annually | 06/09/2025 | USD | 1,710 | 72 | 53 | 19 | ||||||||||||||||||||||||
1.8% | SOFR% | Annually | 04/21/2025 | USD | 2,760 | 139 | 111 | 28 | ||||||||||||||||||||||||
2.4% | SOFR% | Annually | 11/10/2035 | USD | 1,190 | 209 | 112 | 97 | ||||||||||||||||||||||||
| 9,815 | 7,127 | 2,688 | ||||||||||||||||||||||||||||||
SEI Institutional Managed Trust
347
CONSOLIDATED SCHEDULE OF INVESTMENTS
September 30, 2023
Multi-Asset Inflation Managed Fund (Concluded)
A list of the open reverse repurchase agreements held by the Fund at September 30, 2023 is as follows:
Multi-Asset Inflation Managed Fund | ||||||||||||
Principal Amount ($ Thousands) | Counterparty | Rate | Value ($ Thousands) | |||||||||
| $ | (19,080 | ) | Chase Securities | 5.45 | % | $ | (19,080 | ) | ||||
| (107,409 | ) | Chase Securities | 5.46 | % | (107,409 | ) | ||||||
| $ | (126,489 | ) | ||||||||||
| Percentages are based on Net Assets of $679,693 ($ Thousands). |
^ | Security, or a portion thereof, is held by the Accumulation Commodity Strategy Subsidiary, Ltd. as of September 30, 2023. |
* | Non-income producing security. |
‡ | Real Estate Investment Trust. |
‡‡ | Expiration date not available. |
(A) | Interest rate represents the security's effective yield at the time of purchase. |
(B) | Security, or a portion thereof, has been pledged as collateral on reverse repurchase agreements. The total market value of such securities as of September 30, 2023 was $126,623 ($ Thousands). |
(C) | Variable or floating rate security. The rate shown is the effective interest rate as of period end. The rates on certain securities are not based on published reference rates and spreads and are either determined by the issuer or agent based on current market conditions; by using a formula based on the rates of underlying loans; or by adjusting periodically based on prevailing interest rates. |
(D) | Security, or portion thereof, has been pledged as collateral on securities sold short. The total market value of such securities as of September 30, 2023 was $57,471 ($ Thousands). |
(E) | Security exempt from registration under Rule 144A of the Securities Act of 1933. These securities may be resold in transactions exempt from registration normally to qualified institutions. On September 30, 2023, the value of these securities amounted to $76,276 ($ Thousands), representing 11.2% of the Net Assets of the Fund. |
(F) | Security is in default on interest payment. |
(G) | Perpetual security with no stated maturity date. |
(H) | Zero coupon security. |
(I) | Security, or portion thereof, has been pledged as collateral on cleared swaps. The total market value of such securities as of September 30, 2023 was $1,954 ($ Thousands). |
(J) | Security, or portion thereof, has been pledged as collateral on futures contracts. The total market value of such securities as of September 30, 2023 was $7,704 ($ Thousands). |
The following is a summary of the level of inputs used as of September 30, 2023, in valuing the Fund's investments and other financial instruments carried at value ($ Thousands): | ||||||||||||||||
Investments in Securities | Level 1 | Level 2 | Level 3 | Total | ||||||||||||
U.S. Treasury Obligations | – | 453,855 | – | 453,855 | ||||||||||||
Common Stock | 195,047 | – | – | 195,047 | ||||||||||||
Corporate Obligations | – | 49,103 | – | 49,103 | ||||||||||||
Asset-Backed Securities | – | 33,330 | – | 33,330 | ||||||||||||
Mortgage-Backed Securities | – | 28,154 | – | 28,154 | ||||||||||||
U.S. Government Agency Obligations | – | 14,772 | – | 14,772 | ||||||||||||
Sovereign Debt | – | 1,244 | – | 1,244 | ||||||||||||
Foreign Common Stock | 660 | – | – | 660 | ||||||||||||
Rights | – | – | – | – | ||||||||||||
Purchased Options | 17 | – | – | 17 | ||||||||||||
Total Investments in Securities | 195,724 | 580,458 | – | 776,182 | ||||||||||||
Securities Sold Short | ||||||||||||||||
Common Stock | (85,606 | ) | – | – | (85,606 | ) | ||||||||||
Foreign Common Stock | (253 | ) | – | – | (253 | ) | ||||||||||
Total Securities Sold Short | (85,859 | ) | – | – | (85,859 | ) | ||||||||||
Other Financial Instruments | Level 1 | Level 2 | Level 3 | Total | ||||||||||||
Written Options | (7 | ) | – | – | (7 | ) | ||||||||||
Futures Contracts* | ||||||||||||||||
Unrealized Appreciation | 4,905 | – | – | 4,905 | ||||||||||||
Unrealized Depreciation | (4,622 | ) | – | – | (4,622 | ) | ||||||||||
Forward Contracts* | ||||||||||||||||
Unrealized Appreciation | – | 107 | – | 107 | ||||||||||||
OTC Swaps | ||||||||||||||||
Credit Default Swaps* | ||||||||||||||||
Unrealized Depreciation | – | (39 | ) | – | (39 | ) | ||||||||||
Centrally Cleared Swaps | ||||||||||||||||
Credit Default Swaps* | ||||||||||||||||
Unrealized Appreciation | – | 48 | – | 48 | ||||||||||||
Unrealized Depreciation | – | (19 | ) | – | (19 | ) | ||||||||||
Interest Rate Swaps* | ||||||||||||||||
Unrealized Appreciation | – | 2,688 | – | 2,688 | ||||||||||||
Reverse Repurchase Agreements | – | (126,489 | ) | – | (126,489 | ) | ||||||||||
Total Other Financial Instruments | 276 | (123,704 | ) | – | (123,428 | ) | ||||||||||
* | Futures contracts, forward contracts and swap contracts are valued at the unrealized appreciation (depreciation) on the instrument. |
For more information on valuation inputs, see Note 2 – Significant Accounting Policies in Notes to Financial Statements.
Amounts designated as “—” are either $0 or have been rounded to $0.
See “Glossary” for abbreviations.
The accompanying notes are an integral part of the financial statements.
348
SEI Institutional Managed Trust
SCHEDULE OF INVESTMENTS
September 30, 2023
Multi-Asset Capital Stability Fund
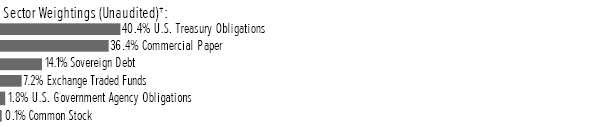
† | Percentages are based on total investments. Total investments do not include derivatives such as options, futures contracts, forward contracts, and swap contracts, if applicable. |
Description | Face Amount | Market Value | ||||||
U.S. TREASURY OBLIGATIONS — 36.8% | ||||||||
U.S. Treasury Bills | ||||||||
15.695%, 10/26/2023 (A)(B) | $ | 114,000 | $ | 113,598 | ||||
10.681%, 11/02/2023 (A) | 78,600 | 78,242 | ||||||
U.S. Treasury Inflation Protected Securities | ||||||||
3.875%, 04/15/2029 | 486 | 523 | ||||||
3.625%, 04/15/2028 | 365 | 384 | ||||||
3.375%, 04/15/2032 | 81 | 87 | ||||||
2.500%, 01/15/2029 | 299 | 301 | ||||||
2.375%, 01/15/2025 | 607 | 600 | ||||||
2.375%, 01/15/2027 | 284 | 282 | ||||||
2.125%, 02/15/2040 | 159 | 154 | ||||||
2.125%, 02/15/2041 | 253 | 245 | ||||||
2.000%, 01/15/2026 | 510 | 500 | ||||||
1.750%, 01/15/2028 | 172 | 167 | ||||||
1.625%, 10/15/2027 | 479 | 465 | ||||||
1.500%, 02/15/2053 | 314 | 259 | ||||||
1.375%, 07/15/2033 | 626 | 579 | ||||||
1.375%, 02/15/2044 | 433 | 362 | ||||||
1.250%, 04/15/2028 | 683 | 649 | ||||||
1.125%, 01/15/2033 | 840 | 759 | ||||||
1.000%, 02/15/2046 | 234 | 177 | ||||||
1.000%, 02/15/2048 | 202 | 150 | ||||||
1.000%, 02/15/2049 | 192 | 141 | ||||||
0.875%, 01/15/2029 | 504 | 467 | ||||||
0.875%, 02/15/2047 | 273 | 199 | ||||||
0.750%, 07/15/2028 | 611 | 568 | ||||||
0.750%, 02/15/2042 | 297 | 225 | ||||||
0.750%, 02/15/2045 | 465 | 338 | ||||||
0.625%, 01/15/2026 | 595 | 566 | ||||||
0.625%, 07/15/2032 | 869 | 758 | ||||||
0.625%, 02/15/2043 | 300 | 218 | ||||||
0.500%, 01/15/2028 | 608 | 560 | ||||||
0.375%, 07/15/2025 | 799 | 765 | ||||||
0.375%, 01/15/2027 | 693 | 645 | ||||||
0.375%, 07/15/2027 | 684 | 634 | ||||||
0.250%, 01/15/2025 | 928 | 892 | ||||||
0.250%, 07/15/2029 | 676 | 602 | ||||||
0.250%, 02/15/2050 | 303 | 178 | ||||||
0.125%, 04/15/2025 | 834 | 795 | ||||||
0.125%, 10/15/2025 | 676 | 640 | ||||||
0.125%, 10/15/2025 | 132 | 125 | ||||||
0.125%, 04/15/2026 | 583 | 545 | ||||||
Description | Face Amount | Market Value | ||||||
U.S. TREASURY OBLIGATIONS (continued) | ||||||||
0.125%, 07/15/2026 | $ | 557 | $ | 521 | ||||
0.125%, 10/15/2026 | 695 | 646 | ||||||
0.125%, 04/15/2027 | 682 | 626 | ||||||
0.125%, 01/15/2030 | 695 | 606 | ||||||
0.125%, 07/15/2030 | 796 | 690 | ||||||
0.125%, 01/15/2031 | 905 | 774 | ||||||
0.125%, 07/15/2031 | 858 | 729 | ||||||
0.125%, 01/15/2032 | 862 | 722 | ||||||
0.125%, 02/15/2051 | 304 | 169 | ||||||
0.125%, 02/15/2052 | 348 | 191 | ||||||
Total U.S. Treasury Obligations | ||||||||
(Cost $215,301) ($ Thousands) | 214,018 | |||||||
COMMERCIAL PAPER — 33.1% | ||||||||
Consumer Discretionary — 5.1% | ||||||||
American Honda Finance | ||||||||
5.711%, 10/23/2023 (A) | 11,250 | 11,209 | ||||||
Hyundai Capital America | ||||||||
5.625%, 11/13/2023 (A)(C) | 7,000 | 6,951 | ||||||
Parker-Hannifin | ||||||||
5.638%, 11/28/2023 (A) | 11,300 | 11,195 | ||||||
| 29,355 | ||||||||
Energy — 6.4% | ||||||||
AES Corporation | ||||||||
12.209%, 11/08/2023 (A) | 11,250 | 11,173 | ||||||
6.240%, 11/07/2023 (A) | 250 | 248 | ||||||
Engie | ||||||||
5.424%, 10/06/2023 (A) | 600 | 599 | ||||||
5.417%, 10/16/2023 (A) | 4,800 | 4,788 | ||||||
Entergy | ||||||||
5.526%, 10/13/2023 (A) | 8,000 | 7,983 | ||||||
National Fuel Gas | ||||||||
6.111%, 10/11/2023 (A) | 1,550 | 1,547 | ||||||
Targa Resources | ||||||||
6.184%, 10/23/2023 (A)(C) | 11,000 | 10,962 | ||||||
| 37,300 | ||||||||
Financials — 14.6% | ||||||||
Brookfield Infrastructure | ||||||||
6.098%, 11/02/2023 (A) | 4,500 | 4,476 | ||||||
6.048%, 11/01/2023 (A) | 6,000 | 5,969 | ||||||
5.578%, 12/20/2023 (A) | 11,000 | 10,864 | ||||||
First Abu Dhabi Bank | ||||||||
5.547%, 10/16/2023 (A) | 7,150 | 7,132 | ||||||
General Motors Financial | ||||||||
5.786%, 01/16/2024 (A) | 7,750 | 7,613 | ||||||
5.741%, 11/21/2023 (A) | 400 | 397 | ||||||
SEI Institutional Managed Trust
349
SCHEDULE OF INVESTMENTS
September 30, 2023
Multi-Asset Capital Stability Fund (Continued)
Description | Face Amount | Market Value | ||||||
COMMERCIAL PAPER (continued) | ||||||||
5.717%, 10/03/2023 (A) | $ | 300 | $ | 300 | ||||
5.682%, 10/25/2023 (A) | 2,500 | 2,490 | ||||||
Harley-Davidson Financial Services | ||||||||
6.060%, 11/09/2023 (A) | 5,500 | 5,464 | ||||||
5.990%, 10/16/2023 (A) | 5,100 | 5,087 | ||||||
Macquarie Bank | ||||||||
5.600%, 11/01/2023 (A)(C) | 5,250 | 5,224 | ||||||
5.419%, 10/23/2023 (A)(C) | 1,500 | 1,494 | ||||||
Mitsubishi HC Finance America | ||||||||
5.712%, 11/20/2023 (A) | 4,050 | 4,017 | ||||||
5.630%, 10/16/2023 (A) | 4,000 | 3,990 | ||||||
5.627%, 10/13/2023 (A) | 2,000 | 1,996 | ||||||
Sumitomo Mitsui | ||||||||
5.605%, 12/15/2023 (A) | 8,900 | 8,796 | ||||||
White Plains Cap | ||||||||
5.785%, 12/27/2023 (A) | 10,000 | 9,858 | ||||||
| 85,167 | ||||||||
Health Care — 1.9% | ||||||||
Humana | ||||||||
5.507%, 10/04/2023 (A) | 11,000 | 10,991 | ||||||
Information Technology — 0.9% | ||||||||
Global Payments | ||||||||
6.062%, 10/16/2023 (A) | 5,000 | 4,986 | ||||||
Materials — 2.6% | ||||||||
Glencore FDG | ||||||||
5.723%, 11/10/2023 (A) | 11,300 | 11,225 | ||||||
Nutrien | ||||||||
5.645%, 11/02/2023 (A) | 4,000 | 3,979 | ||||||
| 15,204 | ||||||||
Utilities — 1.6% | ||||||||
Southern California Edison | ||||||||
6.042%, 01/04/2024 (A) | 9,550 | 9,398 | ||||||
Total Commercial Paper | ||||||||
(Cost $192,452) ($ Thousands) | 192,401 | |||||||
SOVEREIGN DEBT — 12.8% | ||||||||
Japan Treasury Discount Bill | ||||||||
0.000%, 11/13/2023 | JPY | 11,150,000 | 74,737 | |||||
Total Sovereign Debt | ||||||||
(Cost $76,825) ($ Thousands) | 74,737 | |||||||
Description | Shares | Market Value | ||||||
EXCHANGE TRADED FUNDS — 6.5% | ||||||||
iShares Core S&P 500 ETF | 42,126 | $ | 18,090 | |||||
Vanguard Intermediate-Term Corporate Bond ETF | 2,644 | 201 | ||||||
Vanguard Long-Term Corporate Bond ETF | 554 | 40 | ||||||
Vanguard Mortgage-Backed Securities ETF | 35,222 | 1,542 | ||||||
Vanguard S&P 500 ETF | 45,998 | 18,063 | ||||||
Total Exchange Traded Funds | ||||||||
(Cost $24,129) ($ Thousands) | 37,936 | |||||||
| ||||||||
U.S. GOVERNMENT AGENCY OBLIGATIONS — 1.7% | ||||||||
FHLB | ||||||||
4.500%, 03/10/2028 | $ | 7,260 | 7,221 | |||||
FHLB DN | ||||||||
5.202%, 10/02/2023(A)(D) | 2,400 | 2,400 | ||||||
Total U.S. Government Agency Obligations | ||||||||
(Cost $9,849) ($ Thousands) | 9,621 | |||||||
| ||||||||
COMMON STOCK — 0.1% | ||||||||
Information Technology — 0.1% | ||||||||
Microsoft Corp | 1,148 | 363 | ||||||
Total Common Stock | ||||||||
(Cost $402) ($ Thousands) | 363 | |||||||
PURCHASED OPTIONS — 0.0% | ||||||||
Total Purchased Options | ||||||||
(Cost $215) ($ Thousands) | 303 | |||||||
Total Investments in Securities — 91.0% | ||||||||
(Cost $519,173) ($ Thousands) | $ | 529,379 | ||||||
WRITTEN OPTIONS — (0.0)% | ||||||||
Total Written Options | ||||||||
(Premiums Received $144) ($ Thousands) | $ | (123 | ) | |||||
350
SEI Institutional Managed Trust
A list of open exchange traded options held by the Fund at September 30, 2023, is as follows:
Description | Number of Contracts | Notional Amount | Exercise Price | Expiration Date | Value | |||||||||||||||
PURCHASED OPTIONS — 0.0% | ||||||||||||||||||||
Put Options | ||||||||||||||||||||
IWM US 11/17/23 P171 | 317 | $ | 5,421 | $ | 171.00 | 11/18/2023 | $ | 83 | ||||||||||||
QQQ US 10/06/23 P365 | 302 | 11,023 | 365.00 | 10/21/2023 | 220 | |||||||||||||||
Total Purchased Options | $ | 16,444 | $ | 303 | ||||||||||||||||
WRITTEN OPTIONS — (0.0)% | ||||||||||||||||||||
Put Options | �� | |||||||||||||||||||
IWM US 11/17/23 C162 | (317 | ) | $ | (5,135 | ) | 162.00 | 11/18/2023 | $ | (35 | ) | ||||||||||
QQQ US 10/06/23 P355 | (302 | ) | (10,721 | ) | 355.00 | 10/21/2023 | (70 | ) | ||||||||||||
| (15,856 | ) | (105 | ) | |||||||||||||||||
Call Options | ||||||||||||||||||||
IWM US 11/17/23 C192 | (317 | ) | (6,087 | ) | 192.00 | 11/18/2023 | (18 | ) | ||||||||||||
QQQ US 10/06/23 C395 | (302 | ) | (11,929 | ) | 395.00 | 10/21/2023 | – | |||||||||||||
| (18,016 | ) | (18 | ) | |||||||||||||||||
Total Written Options | $ | (33,872 | ) | $ | (123 | ) | ||||||||||||||
A list of the open futures contracts held by the Fund at September 30, 2023, is as follows:
Type of Contract | Number of | Expiration Date | Notional Amount (Thousands) | Value | Unrealized Appreciation/ | |||||||||||||||
Long Contracts | ||||||||||||||||||||
Amsterdam Index | 8 | Oct-2023 | $ | 1,264 | $ | 1,237 | $ | (14 | ) | |||||||||||
Australian 10-Year Bond | 68 | Dec-2023 | 5,025 | 4,914 | (132 | ) | ||||||||||||||
CAC40 10 Euro Index | 27 | Oct-2023 | 2,088 | 2,044 | (24 | ) | ||||||||||||||
Canadian 10-Year Bond | 60 | Dec-2023 | 5,203 | 5,109 | (138 | ) | ||||||||||||||
DAX Index | 3 | Dec-2023 | 1,270 | 1,233 | (24 | ) | ||||||||||||||
Euro-Buxl | 6 | Dec-2023 | 856 | 777 | (61 | ) | ||||||||||||||
FTSE 100 Index | 58 | Dec-2023 | 5,493 | 5,431 | 44 | |||||||||||||||
FTSE MIB Index | 2 | Dec-2023 | 307 | 300 | (4 | ) | ||||||||||||||
IBEX | 18 | Oct-2023 | 1,825 | 1,799 | (6 | ) | ||||||||||||||
Long Gilt 10-Year Bond | 23 | Dec-2023 | 2,723 | 2,643 | (3 | ) | ||||||||||||||
MSCI EAFE Index | 79 | Dec-2023 | 8,324 | 8,064 | (260 | ) | ||||||||||||||
MSCI Emerging Markets | 213 | Dec-2023 | 10,489 | 10,176 | (313 | ) | ||||||||||||||
NASDAQ 100 Index E-MINI | 15 | Dec-2023 | 4,701 | 4,460 | (242 | ) | ||||||||||||||
Nikkei 225 Index | 4 | Dec-2023 | 652 | 637 | (16 | ) | ||||||||||||||
Nikkei 225 Index | 326 | Dec-2023 | 7,252 | 6,960 | (216 | ) | ||||||||||||||
OMX Stockholm 30 | 38 | Oct-2023 | 746 | 756 | (7 | ) | ||||||||||||||
Russell 2000 Index E-MINI | 38 | Dec-2023 | 3,518 | 3,417 | (101 | ) | ||||||||||||||
S&P 500 Index E-MINI | 39 | Dec-2023 | 8,817 | 8,435 | (383 | ) | ||||||||||||||
S&P Mid Cap 400 Index E-MINI | 7 | Dec-2023 | 1,821 | 1,764 | (57 | ) | ||||||||||||||
S&P TSX 60 Index | 12 | Dec-2023 | 2,163 | 2,088 | (69 | ) | ||||||||||||||
SPI 200 Index | 45 | Dec-2023 | 5,271 | 5,145 | (115 | ) | ||||||||||||||
U.S. 5-Year Treasury Note | 242 | Dec-2023 | 25,727 | 25,497 | (230 | ) | ||||||||||||||
U.S. 10-Year Treasury Note | 111 | Dec-2023 | 12,229 | 11,995 | (234 | ) | ||||||||||||||
U.S. Long Treasury Bond | 5 | Dec-2023 | 599 | 569 | (30 | ) | ||||||||||||||
SEI Institutional Managed Trust
351
SCHEDULE OF INVESTMENTS
September 30, 2023
Multi-Asset Capital Stability Fund (Continued)
Type of Contract | Number of | Expiration Date | Notional Amount (Thousands) | Value | Unrealized Appreciation/ | |||||||||||||||
U.S. Ultra Long Treasury Bond | 1 | Dec-2023 | $ | 128 | $ | 119 | $ | (9 | ) | |||||||||||
| 118,491 | 115,569 | (2,644 | ) | |||||||||||||||||
Short Contracts | ||||||||||||||||||||
Euro STOXX 50 | (2 | ) | Dec-2023 | $ | (92 | ) | $ | (89 | ) | $ | 2 | |||||||||
FTSE 100 Index | (1 | ) | Dec-2023 | (93 | ) | (93 | ) | – | ||||||||||||
Japanese 10-Year Bond | (14 | ) | Dec-2023 | (13,867 | ) | (13,600 | ) | 77 | ||||||||||||
S&P 500 Index E-MINI | (91 | ) | Dec-2023 | (20,433 | ) | (19,681 | ) | 752 | ||||||||||||
SPI 200 Index | (11 | ) | Dec-2023 | (1,289 | ) | (1,258 | ) | 27 | ||||||||||||
| (35,774 | ) | (34,721 | ) | 858 | ||||||||||||||||
| $ | 82,717 | $ | 80,848 | $ | (1,786 | ) | ||||||||||||||
A list of the open forward foreign currency contracts held by the Fund at September 30, 2023, is as follows:
Counterparty | Settlement Date | Currency to Deliver | Currency to Receive | Unrealized Appreciation | ||||||||||||||||||||
Bank of America | 10/12/23 | EUR | 795 | USD | 868 | $ | 26 | |||||||||||||||||
Bank of America | 10/26/23 | USD | 648 | KRW | 857,517 | (10 | ) | |||||||||||||||||
Bank of America | 11/08/23 | USD | 896 | AUD | 1,383 | (3 | ) | |||||||||||||||||
Bank of America | 11/15/23 | JPY | 11,153,000 | USD | 77,816 | 2,481 | ||||||||||||||||||
Bank of America | 11/16/23 | USD | 1,960 | CHF | 1,748 | (39 | ) | |||||||||||||||||
Bank of America | 12/07/23 | USD | 2,526 | NOK | 27,208 | 37 | ||||||||||||||||||
Bank of America | 12/07/23 | NOK | 11,035 | USD | 1,024 | (15 | ) | |||||||||||||||||
Bank of America | 12/07/23 | SEK | 19,231 | USD | 1,745 | (31 | ) | |||||||||||||||||
Barclays PLC | 10/12/23 | IDR | 6,126,053 | USD | 406 | 10 | ||||||||||||||||||
Barclays PLC | 11/16/23 | PEN | 446 | USD | 120 | 2 | ||||||||||||||||||
Barclays PLC | 11/16/23 | CHF | 691 | EUR | 718 | 2 | ||||||||||||||||||
Barclays PLC | 11/16/23 | CLP | 109,098 | USD | 123 | 2 | ||||||||||||||||||
Barclays PLC | 01/11/24 | MYR | 3,692 | USD | 793 | (4 | ) | |||||||||||||||||
BNP Paribas | 10/12/23 | USD | 1,040 | IDR | 15,611,539 | (31 | ) | |||||||||||||||||
BNP Paribas | 11/16/23 | USD | 1,002 | COP | 4,086,133 | (5 | ) | |||||||||||||||||
BNP Paribas | 11/16/23 | COP | 1,479,367 | USD | 363 | 2 | ||||||||||||||||||
Brown Brothers Harriman | 10/11/23 | USD | 394 | THB | 14,429 | 3 | ||||||||||||||||||
Brown Brothers Harriman | 10/11/23 | USD | 1,824 | THB | 63,138 | (88 | ) | |||||||||||||||||
Brown Brothers Harriman | 10/11/23 | THB | 107,031 | USD | 3,045 | 103 | ||||||||||||||||||
Brown Brothers Harriman | 10/12/23 | USD | 797 | EUR | 743 | (10 | ) | |||||||||||||||||
Brown Brothers Harriman | 10/12/23 | EUR | 2,032 | USD | 2,236 | 83 | ||||||||||||||||||
Brown Brothers Harriman | 10/19/23 | USD | 1,154 | JPY | 169,352 | (15 | ) | |||||||||||||||||
Brown Brothers Harriman | 10/19/23 | JPY | 335,634 | USD | 2,315 | 57 | ||||||||||||||||||
Brown Brothers Harriman | 10/27/23 | NZD | 153 | USD | 90 | (1 | ) | |||||||||||||||||
Brown Brothers Harriman | 10/27/23 | USD | 402 | NZD | 677 | 5 | ||||||||||||||||||
Brown Brothers Harriman | 10/27/23 | USD | 930 | CAD | 1,263 | 5 | ||||||||||||||||||
Brown Brothers Harriman | 10/27/23 | USD | 347 | CAD | 469 | — | ||||||||||||||||||
Brown Brothers Harriman | 10/27/23 | CAD | 719 | USD | 532 | — | ||||||||||||||||||
Brown Brothers Harriman | 10/27/23 | CAD | 1,738 | USD | 1,284 | (2 | ) | |||||||||||||||||
Brown Brothers Harriman | 11/06/23 | USD | 585 | ZAR | 11,099 | 2 | ||||||||||||||||||
Brown Brothers Harriman | 11/06/23 | USD | 140 | ZAR | 2,643 | — | ||||||||||||||||||
Brown Brothers Harriman | 11/06/23 | ZAR | 3,255 | USD | 173 | 1 | ||||||||||||||||||
Brown Brothers Harriman | 11/06/23 | ZAR | 16,551 | USD | 864 | (12 | ) | |||||||||||||||||
Brown Brothers Harriman | 11/08/23 | AUD | 1,013 | USD | 657 | 3 | ||||||||||||||||||
Brown Brothers Harriman | 11/08/23 | AUD | 919 | USD | 589 | (5 | ) | |||||||||||||||||
352
SEI Institutional Managed Trust
Counterparty | Settlement Date | Currency to Deliver | Currency to Receive | Unrealized Appreciation | ||||||||||||||||||||
Brown Brothers Harriman | 11/08/23 | USD | 869 | AUD | 1,354 | $ | 6 | |||||||||||||||||
Brown Brothers Harriman | 11/08/23 | USD | 1,470 | AUD | 2,264 | (7 | ) | |||||||||||||||||
Brown Brothers Harriman | 11/16/23 | USD | 106 | CHF | 95 | (2 | ) | |||||||||||||||||
Brown Brothers Harriman | 11/17/23 | GBP | 410 | USD | 511 | 11 | ||||||||||||||||||
Brown Brothers Harriman | 11/29/23 | USD | 305 | CZK | 7,039 | — | ||||||||||||||||||
Brown Brothers Harriman | 11/29/23 | USD | 180 | CZK | 4,145 | — | ||||||||||||||||||
Brown Brothers Harriman | 11/29/23 | USD | 760 | PLN | 3,249 | (16 | ) | |||||||||||||||||
Brown Brothers Harriman | 11/29/23 | USD | 899 | HUF | 335,190 | 5 | ||||||||||||||||||
Brown Brothers Harriman | 11/29/23 | PLN | 3,549 | USD | 825 | 13 | ||||||||||||||||||
Brown Brothers Harriman | 11/29/23 | CZK | 11,184 | USD | 491 | 6 | ||||||||||||||||||
Brown Brothers Harriman | 11/29/23 | HUF | 281,739 | USD | 754 | (6 | ) | |||||||||||||||||
Brown Brothers Harriman | 12/07/23 | USD | 424 | NOK | 4,576 | 7 | ||||||||||||||||||
Brown Brothers Harriman | 12/07/23 | USD | 968 | SEK | 10,661 | 17 | ||||||||||||||||||
Brown Brothers Harriman | 12/07/23 | SEK | 3,380 | USD | 308 | (5 | ) | |||||||||||||||||
Brown Brothers Harriman | 12/07/23 | NOK | 10,365 | USD | 962 | (14 | ) | |||||||||||||||||
Brown Brothers Harriman | 01/11/24 | CNY | 195 | USD | 27 | — | ||||||||||||||||||
Brown Brothers Harriman | 01/11/24 | USD | 502 | CNH | 3,648 | 1 | ||||||||||||||||||
Citigroup | 10/12/23 | EUR | 962 | USD | 1,028 | 10 | ||||||||||||||||||
Citigroup | 10/27/23 | USD | 1,066 | CAD | 1,441 | 1 | ||||||||||||||||||
Deutsche Bank | 10/03/23 | BRL | 1,062 | USD | 215 | 3 | ||||||||||||||||||
Deutsche Bank | 10/12/23 | USD | 626 | IDR | 9,391,124 | (19 | ) | |||||||||||||||||
Deutsche Bank | 10/12/23 | IDR | 30,396,099 | USD | 1,980 | 15 | ||||||||||||||||||
Deutsche Bank | 11/17/23 | GBP | 1,015 | EUR | 1,165 | (3 | ) | |||||||||||||||||
Deutsche Bank | 12/07/23 | SEK | 9,751 | NOK | 9,415 | (14 | ) | |||||||||||||||||
Goldman Sachs | 10/03/23 | USD | 697 | BRL | 3,451 | (8 | ) | |||||||||||||||||
Goldman Sachs | 10/12/23 | USD | 380 | IDR | 5,801,338 | (5 | ) | |||||||||||||||||
Goldman Sachs | 10/12/23 | USD | 873 | EUR | 823 | (2 | ) | |||||||||||||||||
Goldman Sachs | 10/12/23 | EUR | 2,762 | USD | 2,982 | 56 | ||||||||||||||||||
Goldman Sachs | 10/12/23 | IDR | 16,253,066 | USD | 1,065 | 14 | ||||||||||||||||||
Goldman Sachs | 10/26/23 | USD | 308 | PHP | 17,479 | 1 | ||||||||||||||||||
Goldman Sachs | 10/26/23 | USD | 604 | KRW | 793,204 | (14 | ) | |||||||||||||||||
Goldman Sachs | 10/26/23 | PHP | 69,062 | USD | 1,213 | (8 | ) | |||||||||||||||||
Goldman Sachs | 10/26/23 | KRW | 327,374 | USD | 252 | 8 | ||||||||||||||||||
Goldman Sachs | 10/27/23 | CAD | 1,131 | USD | 833 | (4 | ) | |||||||||||||||||
Goldman Sachs | 10/27/23 | USD | 1,596 | NZD | 2,701 | 26 | ||||||||||||||||||
Goldman Sachs | 10/27/23 | NZD | 4,718 | USD | 2,804 | (30 | ) | |||||||||||||||||
Goldman Sachs | 11/03/23 | USD | 2,491 | BRL | 12,425 | (20 | ) | |||||||||||||||||
Goldman Sachs | 11/03/23 | BRL | 6,479 | USD | 1,299 | 11 | ||||||||||||||||||
Goldman Sachs | 11/03/23 | BRL | 895 | USD | 176 | (2 | ) | |||||||||||||||||
Goldman Sachs | 11/16/23 | PEN | 551 | USD | 148 | 3 | ||||||||||||||||||
Goldman Sachs | 11/16/23 | USD | 960 | PEN | 3,578 | (17 | ) | |||||||||||||||||
Goldman Sachs | 11/16/23 | COP | 1,220,669 | USD | 305 | 7 | ||||||||||||||||||
Goldman Sachs | 12/14/23 | INR | 12,451 | USD | 149 | — | ||||||||||||||||||
Goldman Sachs | 01/11/24 | USD | 379 | MYR | 1,766 | 2 | ||||||||||||||||||
JPMorgan Chase Bank | 10/12/23 | USD | 877 | IDR | 13,402,894 | (10 | ) | |||||||||||||||||
JPMorgan Chase Bank | 10/26/23 | USD | 456 | PHP | 25,175 | (11 | ) | |||||||||||||||||
JPMorgan Chase Bank | 10/26/23 | PHP | 16,513 | USD | 302 | 10 | ||||||||||||||||||
JPMorgan Chase Bank | 10/26/23 | KRW | 710,182 | USD | 550 | 22 | ||||||||||||||||||
JPMorgan Chase Bank | 10/27/23 | USD | 1,751 | CAD | 2,347 | (14 | ) | |||||||||||||||||
SEI Institutional Managed Trust
353
SCHEDULE OF INVESTMENTS
September 30, 2023
Multi-Asset Capital Stability Fund (Continued)
Counterparty | Settlement Date | Currency to Deliver | Currency to Receive | Unrealized Appreciation | ||||||||||||||||||||
JPMorgan Chase Bank | 11/16/23 | USD | 348 | CLP | 310,283 | $ | (2 | ) | ||||||||||||||||
JPMorgan Chase Bank | 11/29/23 | TWD | 2,922 | USD | 92 | 1 | ||||||||||||||||||
JPMorgan Chase Bank | 12/07/23 | EUR | 1,154 | NOK | 13,206 | 19 | ||||||||||||||||||
JPMorgan Chase Bank | 01/11/24 | CNY | 4,509 | USD | 622 | (5 | ) | |||||||||||||||||
Merrill Lynch | 10/12/23 | USD | 595 | EUR | 541 | (22 | ) | |||||||||||||||||
Merrill Lynch | 10/12/23 | USD | 1,356 | IDR | 20,598,624 | (24 | ) | |||||||||||||||||
Merrill Lynch | 10/26/23 | USD | 253 | PHP | 14,372 | 1 | ||||||||||||||||||
Merrill Lynch | 10/26/23 | USD | 402 | PHP | 22,205 | (10 | ) | |||||||||||||||||
Merrill Lynch | 10/26/23 | USD | 1,118 | KRW | 1,483,583 | (14 | ) | |||||||||||||||||
Merrill Lynch | 10/26/23 | PHP | 10,968 | USD | 198 | 4 | ||||||||||||||||||
Merrill Lynch | 10/26/23 | PHP | 82,763 | USD | 1,451 | (11 | ) | |||||||||||||||||
Merrill Lynch | 10/26/23 | KRW | 326,398 | USD | 257 | 14 | ||||||||||||||||||
Merrill Lynch | 10/27/23 | CAD | 1,424 | USD | 1,053 | (1 | ) | |||||||||||||||||
Merrill Lynch | 11/06/23 | USD | 558 | ZAR | 10,669 | 7 | ||||||||||||||||||
Merrill Lynch | 11/16/23 | CHF | 2,335 | USD | 2,619 | 52 | ||||||||||||||||||
Merrill Lynch | 11/16/23 | COP | 511,226 | USD | 123 | (2 | ) | |||||||||||||||||
Merrill Lynch | 11/17/23 | USD | 1,425 | GBP | 1,149 | (23 | ) | |||||||||||||||||
Merrill Lynch | 11/29/23 | USD | 225 | TWD | 7,131 | (3 | ) | |||||||||||||||||
Merrill Lynch | 12/07/23 | USD | 2,657 | SEK | 29,282 | 48 | ||||||||||||||||||
Merrill Lynch | 12/07/23 | NOK | 19,664 | USD | 1,826 | (27 | ) | |||||||||||||||||
Merrill Lynch | 12/14/23 | INR | 21,513 | USD | 258 | (1 | ) | |||||||||||||||||
Merrill Lynch | 01/25/24 | IDR | 3,122,014 | USD | 200 | (1 | ) | |||||||||||||||||
Montgomery/Bank of America | 10/26/23 | USD | 84 | PHP | 4,753 | — | ||||||||||||||||||
Montgomery/Bank of America | 11/29/23 | TWD | 4,209 | USD | 132 | 1 | ||||||||||||||||||
Morgan Stanley | 10/03/23 | USD | 2,524 | BRL | 12,425 | (42 | ) | |||||||||||||||||
Morgan Stanley | 10/03/23 | BRL | 8,868 | USD | 1,801 | 30 | ||||||||||||||||||
Morgan Stanley | 10/12/23 | USD | 986 | IDR | 15,310,865 | 5 | ||||||||||||||||||
Morgan Stanley | 10/12/23 | EUR | 1,729 | USD | 1,907 | 75 | ||||||||||||||||||
Morgan Stanley | 10/12/23 | USD | 3,720 | EUR | 3,410 | (107 | ) | |||||||||||||||||
Morgan Stanley | 10/12/23 | IDR | 17,855,680 | USD | 1,181 | 27 | ||||||||||||||||||
Morgan Stanley | 10/12/23 | IDR | 9,485,487 | USD | 611 | (3 | ) | |||||||||||||||||
Morgan Stanley | 10/19/23 | USD | 2,691 | JPY | 385,894 | (96 | ) | |||||||||||||||||
Morgan Stanley | 10/19/23 | JPY | 298,071 | USD | 2,046 | 42 | ||||||||||||||||||
Morgan Stanley | 10/26/23 | USD | 384 | KRW | 510,517 | (4 | ) | |||||||||||||||||
Morgan Stanley | 10/27/23 | USD | 2,036 | NZD | 3,427 | 22 | ||||||||||||||||||
Morgan Stanley | 10/27/23 | NZD | 2,086 | USD | 1,239 | (14 | ) | |||||||||||||||||
Morgan Stanley | 11/08/23 | AUD | 886 | USD | 572 | (1 | ) | |||||||||||||||||
Morgan Stanley | 11/16/23 | USD | 163 | CLP | 145,850 | — | ||||||||||||||||||
Morgan Stanley | 11/16/23 | USD | 1,664 | MXN | 28,783 | (21 | ) | |||||||||||||||||
Morgan Stanley | 11/16/23 | MXN | 18,456 | USD | 1,067 | 13 | ||||||||||||||||||
Morgan Stanley | 11/16/23 | CLP | 1,037,145 | USD | 1,156 | (2 | ) | |||||||||||||||||
Morgan Stanley | 11/17/23 | USD | 1,203 | GBP | 964 | (26 | ) | |||||||||||||||||
Morgan Stanley | 11/17/23 | GBP | 1,416 | USD | 1,757 | 29 | ||||||||||||||||||
Morgan Stanley | 12/14/23 | USD | 2,816 | INR | 235,525 | 9 | ||||||||||||||||||
Morgan Stanley | 12/14/23 | INR | 136,080 | USD | 1,627 | (5 | ) | |||||||||||||||||
Morgan Stanley | 01/11/24 | USD | 952 | MYR | 4,422 | 3 | ||||||||||||||||||
Morgan Stanley | 01/11/24 | MYR | 2,496 | USD | 538 | (1 | ) | |||||||||||||||||
Morgan Stanley | 01/11/24 | CNH | 9,384 | USD | 1,292 | (3 | ) | |||||||||||||||||
Morgan Stanley | 01/25/24 | USD | 610 | IDR | 9,485,487 | 2 | ||||||||||||||||||
354
SEI Institutional Managed Trust
Counterparty | Settlement Date | Currency to Deliver | Currency to Receive | Unrealized Appreciation | ||||||||||||||||||||
Morgan Stanley | 01/25/24 | IDR | 15,310,865 | USD | 984 | $ | (4 | ) | ||||||||||||||||
UBS | 10/26/23 | USD | 305 | KRW | 384,525 | (19 | ) | |||||||||||||||||
UBS | 10/26/23 | KRW | 243,084 | USD | 183 | 2 | ||||||||||||||||||
| $ | 2,489 | |||||||||||||||||||||||
A list of the open OTC swap agreements held by the Fund at September 30, 2023 is as follows:
Total Return Swap |
Counterparty | Reference Entity/ Obligation | Fund Pays | Fund Receives | Payment Frequency | Termination Date | Currency | Notional | Value | Upfront Payments/ | Net Unrealized | ||||||||||||||||||||||||||||||
Goldman Sachs | Goldman Sachs TY Weekly Volatility Carry Strategy Index | Negative Index Return | Positive Index Return | Quarterly | 08/22/2024 | USD | 2,134 | $ | 51 | $ | – | $ | 51 | |||||||||||||||||||||||||||
| $ | 51 | $ | – | $ | 51 | |||||||||||||||||||||||||||||||||||
A list of the open centrally cleared swap agreements held by the Fund at September 30, 2023 is as follows:
Credit Default Swaps - Sell Protection |
Reference Entity/ Obligation | Receive Rate | Payment Frequency | Termination Date | Notional Amount | Value | Upfront Payments/ Receipts | Net Unrealized | |||||||||||||||||||||
CDX.NA.HY.S40V1-5Y | 5.00% | Quarterly | 06/20/2028 | $ | 3,830 | $ | 65 | $ | 84 | $ | (19 | ) | ||||||||||||||||
CDX.NA.IG.S39V1-5Y | 1.00% | Quarterly | 12/20/2027 | 330 | 4 | 4 | – | |||||||||||||||||||||
CDX.NA.IG.S40V1-5Y | 1.00% | Quarterly | 06/20/2028 | 2,770 | 37 | 36 | 1 | |||||||||||||||||||||
ITRAXX.XOVER.S38V1-5Y | 5.00% | Quarterly | 12/20/2027 | 414 | 26 | 14 | 12 | |||||||||||||||||||||
ITRAXX.XOVER.S39V1-5Y | 5.00% | Quarterly | 06/20/2028 | 375 | 20 | 19 | 1 | |||||||||||||||||||||
| $ | 152 | $ | 157 | $ | (5 | ) | ||||||||||||||||||||||
Interest Rate Swaps |
| Fund Pays | Fund Receives | Payment Frequency | Termination Date | Currency | Notional Amount (Thousands) | Value (Thousands) | Upfront Payments/Receipts (Thousands) | Net Unrealized Appreciation (Depreciation) (Thousands) | |||||||||||||||||||||||||
| 6-MONTH AUD - BBSW | 4.07% | Semi-Annually | 03/17/2033 | AUD | 1,060 | $ | (34 | ) | $ | – | $ | (34 | ) | ||||||||||||||||||||
| 3-MONTH NZD - BKBM | 4.351% | Quarterly | 03/20/2033 | NZD | 840 | (31 | ) | – | (31 | ) | |||||||||||||||||||||||
| 6-MONTH AUD - BBSW | 3.896% | Semi-Annually | 04/04/2033 | AUD | 1,760 | (83 | ) | – | (83 | ) | |||||||||||||||||||||||
| 3-MONTH NZD - BKBM | 4.1895% | Quarterly | 04/05/2033 | NZD | 1,680 | (75 | ) | – | (75 | ) | |||||||||||||||||||||||
| 6-MONTH AUD - BBSW | 3.7445% | Semi-Annually | 04/12/2033 | AUD | 1,920 | (92 | ) | – | (92 | ) | |||||||||||||||||||||||
| 3-MONTH NZD - BKBM | 4.1215% | Quarterly | 04/13/2033 | NZD | 1,840 | (87 | ) | – | (87 | ) | |||||||||||||||||||||||
| 6-MONTH AUD - BBSW | 4.424% | Semi-Annually | 07/19/2033 | AUD | 640 | (5 | ) | – | (5 | ) | |||||||||||||||||||||||
| 3-MONTH NZD - BKBM | 4.474% | Quarterly | 07/20/2033 | NZD | 630 | (19 | ) | – | (19 | ) | |||||||||||||||||||||||
| 6-MONTH AUD - BBSW | 4.475% | Semi-Annually | 07/31/2033 | AUD | 740 | (3 | ) | – | (3 | ) | |||||||||||||||||||||||
| 3-MONTH NZD - BKBM | 4.6% | Quarterly | 08/01/2033 | NZD | 760 | (18 | ) | – | (18 | ) | |||||||||||||||||||||||
| $ | (447 | ) | $ | – | $ | (447 | ) | ||||||||||||||||||||||||||
SEI Institutional Managed Trust
355
SCHEDULE OF INVESTMENTS
September 30, 2023
Multi-Asset Capital Stability Fund (Concluded)
| Percentages are based on Net Assets of $581,570 ($ Thousands). |
(A) | Interest rate represents the security's effective yield at the time of purchase. |
(B) | Security, or a portion thereof, has been pledged as collateral on open futures contracts. The total market value of such securities as of September 30, 2023 was $2,989 ($ Thousands). |
(C) | Security exempt from registration under Rule 144A of the Securities Act of 1933. These securities may be resold in transactions exempt from registration normally to qualified institutions. On September 30, 2023, the value of these securities amounted to $24,631 ($ Thousands), representing 4.2% of the Net Assets of the Fund. |
(D) | Zero coupon security. |
The following is a summary of the level of inputs used as of September 30, 2023, in valuing the Fund's investments and other financial instruments carried at value ($ Thousands): |
Investments in Securities | Level 1 | Level 2 | Level 3 | Total | ||||||||||||
U.S. Treasury Obligations | – | 214,018 | – | 214,018 | ||||||||||||
Commercial Paper | – | 192,401 | – | 192,401 | ||||||||||||
Sovereign Debt | – | 74,737 | – | 74,737 | ||||||||||||
Exchange Traded Funds | 37,936 | – | – | 37,936 | ||||||||||||
U.S. Government Agency Obligations | – | 9,621 | – | 9,621 | ||||||||||||
Common Stock | 363 | – | – | 363 | ||||||||||||
Purchased Options | 303 | – | – | 303 | ||||||||||||
Total Investments in Securities | 38,602 | 490,777 | – | 529,379 | ||||||||||||
Other Financial Instruments | Level 1 | Level 2 | Level 3 | Total | ||||||||||||
Written Options | (123 | ) | – | – | (123 | ) | ||||||||||
Futures Contracts* | ||||||||||||||||
Unrealized Appreciation | 902 | – | – | 902 | ||||||||||||
Unrealized Depreciation | (2,688 | ) | – | – | (2,688 | ) | ||||||||||
Forward Contracts* | ||||||||||||||||
Unrealized Appreciation | – | 3,485 | – | 3,485 | ||||||||||||
Unrealized Depreciation | – | (996 | ) | – | (996 | ) | ||||||||||
OTC Swap | ||||||||||||||||
Total Return Swap* | ||||||||||||||||
Unrealized Appreciation | – | 51 | – | 51 | ||||||||||||
Centrally Cleared Swaps | ||||||||||||||||
Credit Default Swaps* | ||||||||||||||||
Unrealized Appreciation | – | 14 | – | 14 | ||||||||||||
Unrealized Depreciation | – | (19 | ) | – | (19 | ) | ||||||||||
Interest Rate Swaps* | ||||||||||||||||
Unrealized Depreciation | – | (447 | ) | – | (447 | ) | ||||||||||
Total Other Financial Instruments | (1,909 | ) | 2,088 | – | 179 | |||||||||||
* | Futures contracts, forward contracts and swap contracts are valued at the unrealized appreciation (depreciation) on the instrument. |
For more information on valuation inputs, see Note 2 – Significant Accounting Policies in Notes to Financial Statements.
Amounts designated as “—” are either $0 or have been rounded to $0.
See “Glossary” for abbreviations.
The accompanying notes are an integral part of the financial statements.
356
SEI Institutional Managed Trust
Glossary (abbreviations which may be used in the preceding Schedules of Investments):
Portfolio Abbreviations |
ADR — American Depositary Receipt |
AGC — Assured Guaranty Corporation |
AGM— Assured Guaranty Municipal |
ARM — Adjustable Rate Mortgage |
BAM — Build America Mutual Assurance Corp. |
BBSW — Bank Bill Swap Rate |
BKBM — Bank Bill Market Rate |
BPS — Basis Points |
BZDIOVRA — Overnight Brazil CETIP - Interbank Rate |
CD — Certificate of Deposit |
CDO — Collateralized Debt Obligation |
Cl — Class |
CLO — Collateralized Loan Obligation |
CMO — Collateralized Mortgage Obligation |
CPI — Consumer Price Index |
DAC — Designated Activity Company |
ETF — Exchange-Traded Fund |
EURIBOR — Euro London Interbank Offered Rate |
FEDEF — U.S. Federal Funds Effective Rate |
FFCB — Federal Farm Credit Bank |
FHLB — Federal Home Loan Bank |
FHLMC — Federal Home Loan Mortgage Corporation |
FNMA — Federal National Mortgage Association |
GICS — Global Industry Classification Standard |
GNMA — Government National Mortgage Association |
GO — General Obligation |
H15T7Y — Harmonized Index of Consumer Prices |
IO — Interest Only — face amount represents notional amount |
JSC — Joint-Stock Company |
LIBOR— London Interbank Offered Rate |
LLLP — Limited Liability Limited Partnership |
LP — Limited Partnership |
MTN — Medium Term Note |
MXN-TIIE — Mexican Interbank TIIE 28-Day |
OIS — Overnight Index Swap |
OTC — Over The Counter |
PIK — Payment-in-Kind |
PJSC — Public Joint Stock Company |
PO — Principal Only |
RB — Revenue Bond |
REIT — Real Estate Investment Trust |
REMIC — Real Estate Mortgage Investment Conduit |
Re-REMIC — Resecuritization of Real Estate Mortgage Investment Conduit |
Ser — Series |
SOFR — Secured Overnight Financing Rate |
SOFR30A — Secured Overnight Financing Rate 30-day Average |
SOFRINDX — Custom SOFR Index |
SPDR — Standard & Poor's Depository Receipt |
STACR — Structured Agency Credit Risk |
TBA — To Be Announced |
Currency Abbreviations |
AUD — Australian Dollar |
BRL — Brazilian Real |
CAD — Canadian Dollar |
CHF — Swiss Franc |
CLP — Chilean Peso |
CNH — Chinese Yuan Offshore |
CNY — Chinese Yuan Onshore |
COP — Colombian Peso |
CZK — Czech Koruna |
DKK — Danish Krone |
EUR — Euro |
GBP — British Pound Sterling |
HKD — Hong Kong Dollar |
HUF — Hungarian Forint |
IDR — Indonesian Rupiah |
ILS — Israeli New Sheckels |
INR — Indian Rupee |
JPY — Japanese Yen |
KRW — Korean Won |
MXN — Mexican Peso |
MYR — Malaysian Ringgit |
NOK — Norwegian Krone |
NZD — New Zealand Dollar |
PEN — Peruvian Nuevo Sol |
PHP— Philippine Peso |
PLN — Polish Zloty |
RUB — Russian Ruble |
SEK — Swedish Krona |
SGD — Singapore Dollar |
THB — Thai Baht |
TWD — Taiwan Dollar |
USD — U.S. Dollar |
ZAR — South African Rand |
SEI Institutional Managed Trust
357
STATEMENTS OF ASSETS AND LIABILITIES ($ Thousands)
September 30, 2023
Large Cap Fund | Large Cap Value Fund | |||||||
Assets: | ||||||||
Investments, at value † | $ | 1,596,998 | $ | 1,224,849 | ||||
Affiliated investments, at value †† | 19,610 | 9,579 | ||||||
Cash and cash equivalents | 3 | 6 | ||||||
Cash pledged as collateral on OTC swap contracts | – | – | ||||||
Cash pledged as collateral on futures contracts | 822 | 333 | ||||||
Foreign currency, at value ††† | – | – | ||||||
Receivable for fund shares sold | 612 | 420 | ||||||
Receivable for investment securities sold | 3,140 | 1,144 | ||||||
Dividends and interest receivable | 1,854 | 2,424 | ||||||
Foreign tax reclaim receivable | 64 | 214 | ||||||
Prepaid expenses | 28 | 22 | ||||||
Total Assets | 1,623,131 | 1,238,991 | ||||||
Liabilities: | ||||||||
Payable for investment securities purchased | 3,143 | 1,142 | ||||||
Payable for fund shares redeemed | 779 | 310 | ||||||
Administration fees payable | 343 | 302 | ||||||
Shareholder servicing fees payable Class F | 330 | 233 | ||||||
Shareholder servicing fees payable Class I | – | – | ||||||
Payable for Variation Margin on Futures Contracts | 50 | 22 | ||||||
Payable upon return on securities loaned | – | 41 | ||||||
OTC Swap contracts, at value †††† | – | – | ||||||
Due to custodian | – | – | ||||||
Investment advisory fees payable | 498 | 341 | ||||||
Chief Compliance Officer fees payable | 3 | 2 | ||||||
Trustees fees payable | – | – | ||||||
Administration servicing fees payable Class I | – | – | ||||||
Accrued expense payable | 94 | 71 | ||||||
Total Liabilities | 5,240 | 2,464 | ||||||
Net Assets | $ | 1,617,891 | $ | 1,236,527 | ||||
† Cost of investments and repurchase agreements | $ | 1,071,099 | $ | 933,405 | ||||
†† Cost of affiliated investments | 19,610 | 9,584 | ||||||
††† Cost of foreign currency | – | – | ||||||
†††† Cost (premiums received) | – | – | ||||||
* Includes market value of securities on loan | – | – | ||||||
Amounts designated as "—" are either $0 or have been rounded to $0.
The accompanying notes are an integral part of the financial statements.
358
SEI Institutional Managed Trust
Large Cap Growth Fund | Large Cap Index Fund | Tax-Managed Large Cap Fund | S&P 500 Index Fund | Small Cap Fund | Small Cap Value Fund | Small Cap Growth Fund | Tax-Managed Small/Mid Cap Fund | ||||||||||||||||||||||||
| $ | 1,321,380 | $ | 974,803 | * | $ | 3,760,201 | * | $ | 845,950 | $ | 514,087 | * | $ | 338,913 | * | $ | 304,275 | * | $ | 762,684 | |||||||||||
| 16,819 | 33,217 | 30,044 | 19,012 | 5,695 | 5,395 | 6,290 | 9,783 | ||||||||||||||||||||||||
| – | 2 | 67 | – | 11 | – | 6 | 14 | ||||||||||||||||||||||||
| – | – | – | – | – | – | – | – | ||||||||||||||||||||||||
| 507 | 1,859 | 774 | 1,064 | – | – | – | – | ||||||||||||||||||||||||
| – | – | 125 | – | – | – | – | – | ||||||||||||||||||||||||
| 466 | 196 | 397 | 78 | 179 | 92 | 102 | 96 | ||||||||||||||||||||||||
| 2,965 | – | – | – | 2,009 | 1,756 | 2,725 | 5,066 | ||||||||||||||||||||||||
| 408 | 766 | 3,672 | 652 | 367 | 537 | 134 | 596 | ||||||||||||||||||||||||
| 4 | – | 326 | 10 | – | 1 | 1 | – | ||||||||||||||||||||||||
| 22 | 16 | 64 | 13 | 9 | 6 | 5 | 13 | ||||||||||||||||||||||||
| 1,342,571 | 1,010,859 | 3,795,670 | 866,779 | 522,357 | 346,700 | 313,538 | 778,252 | ||||||||||||||||||||||||
| 3,878 | – | – | – | 1,857 | 1,535 | 2,711 | 4,235 | ||||||||||||||||||||||||
| 335 | 493 | 946 | 481 | 278 | 95 | 84 | 166 | ||||||||||||||||||||||||
| 321 | 123 | 678 | 110 | 126 | 84 | 75 | 187 | ||||||||||||||||||||||||
| 255 | 86 | 689 | 36 | 104 | 62 | 58 | 124 | ||||||||||||||||||||||||
| – | – | – | 2 | – | – | – | – | ||||||||||||||||||||||||
| 29 | 111 | 48 | 57 | – | – | – | – | ||||||||||||||||||||||||
| – | 569 | 3,639 | – | 381 | 1,688 | 2,407 | – | ||||||||||||||||||||||||
| 696 | – | – | – | – | – | – | – | ||||||||||||||||||||||||
| 4 | – | – | – | – | – | – | – | ||||||||||||||||||||||||
| 374 | 17 | 1,287 | 15 | 252 | 165 | 141 | 373 | ||||||||||||||||||||||||
| 2 | 2 | 6 | 1 | 1 | 1 | – | 1 | ||||||||||||||||||||||||
| – | – | 1 | – | – | – | – | – | ||||||||||||||||||||||||
| – | – | – | 2 | – | – | – | – | ||||||||||||||||||||||||
| 77 | 85 | 220 | 70 | 30 | 20 | 20 | 46 | ||||||||||||||||||||||||
| 5,971 | 1,486 | 7,514 | 774 | 3,029 | 3,650 | 5,496 | 5,132 | ||||||||||||||||||||||||
| $ | 1,336,600 | $ | 1,009,373 | $ | 3,788,156 | $ | 866,005 | $ | 519,328 | $ | 343,050 | $ | 308,042 | $ | 773,120 | ||||||||||||||||
| $ | 748,674 | $ | 658,580 | $ | 1,251,306 | $ | 232,948 | $ | 454,140 | $ | 282,792 | $ | 280,056 | $ | 471,544 | ||||||||||||||||
| 16,819 | 33,215 | 30,022 | 19,012 | 5,694 | 5,392 | 6,294 | 9,783 | ||||||||||||||||||||||||
| – | – | 129 | – | – | – | – | – | ||||||||||||||||||||||||
| – | – | – | – | – | – | – | – | ||||||||||||||||||||||||
| – | 549 | 3,399 | – | 377 | 1,651 | 2,342 | – | ||||||||||||||||||||||||
SEI Institutional Managed Trust
359
STATEMENTS OF ASSETS AND LIABILITIES ($ Thousands)
September 30, 2023
Large Cap Fund | Large Cap Value Fund | |||||||
Net Assets: | ||||||||
Paid-in capital — (unlimited authorization — no par value) | $ | 1,025,791 | $ | 905,616 | ||||
Total distributable earnings (accumulated losses) | 592,100 | 330,911 | ||||||
Net Assets | $ | 1,617,891 | $ | 1,236,527 | ||||
Net Asset Value, Offering and Redemption Price Per Share — Class F | $ | 13.55 | $ | 23.86 | ||||
| ($1,565,194,441 ÷ 115,491,870 shares | ) | ($1,110,984,672 ÷ 46,562,142 shares | ) | |||||
Net Asset Value, Offering and Redemption Price Per Share — Class I | N/A | $ | 23.90 | |||||
| ($1,323,058 ÷ 55,353 shares | ) | |||||||
Net Asset Value, Offering and Redemption Price Per Share — Class Y | $ | 13.57 | $ | 23.86 | ||||
| ($52,696,290 ÷ 3,884,413 shares | ) | ($124,218,956 ÷ 5,206,904 shares | ) | |||||
(1) Net assets divided by shares does not calculate to the stated NAV because net assets and shares are shown rounded.
N/A – Not applicable. Share class currently not offered.
The accompanying notes are an integral part of the financial statements.
360
SEI Institutional Managed Trust
Large Cap Growth Fund | Large Cap Index Fund | Tax-Managed Large Cap Fund | S&P 500 Index Fund | Small Cap Fund | Small Cap Value Fund | Small Cap Growth Fund | Tax-Managed Small/Mid Cap Fund | ||||||||||||||||||||||||
| $ | 574,727 | $ | 719,699 | $ | 1,132,712 | $ | 225,941 | $ | 452,091 | $ | 289,094 | $ | 315,707 | $ | 461,210 | ||||||||||||||||
| 761,873 | 289,674 | 2,655,444 | 640,064 | 67,237 | 53,956 | (7,665 | ) | 311,910 | |||||||||||||||||||||||
| $ | 1,336,600 | $ | 1,009,373 | $ | 3,788,156 | $ | 866,005 | $ | 519,328 | $ | 343,050 | $ | 308,042 | $ | 773,120 | ||||||||||||||||
| $ | 40.64 | $ | 15.02 | $ | 31.64 | $ | 79.28 | $ | 11.90 | $ | 22.34 | $ | 28.97 | $ | 22.53 | ||||||||||||||||
| ($1,190,786,062 ÷ 29,299,755 shares | ) | ($1,009,372,784 ÷ 67,216,691 shares | ) | ($3,266,629,736 ÷ 103,248,299 shares | ) | ($860,787,985 ÷ 10,857,947 shares | ) | ($495,148,157 ÷ 41,596,880 shares | ) | ($295,920,130 ÷ 13,243,452 shares | ) | ($275,326,878 ÷ 9,502,366 shares | ) | ($671,322,560 ÷ 29,798,504 shares | ) | ||||||||||||||||
| $ | 38.86 | N/A | N/A | $ | 79.90 | N/A | $ | 22.09 | $ | 26.78 | N/A | ||||||||||||||||||||
| ($1,912,336 ÷ 49,241 shares | )(1) | ($5,217,152 ÷ 65,298 shares | ) | ($480,664 ÷ 21,755 shares | ) | ($346,925 ÷ 12,953 shares | ) | ||||||||||||||||||||||||
| $ | 40.91 | N/A | $ | 31.65 | N/A | $ | 12.06 | $ | 22.36 | $ | 29.66 | $ | 22.58 | ||||||||||||||||||
| ($143,900,526 ÷ 3,517,587 shares | ) | ($521,526,610 ÷ 16,476,299 shares | ) | ($24,179,704 ÷ 2,005,197 shares | ) | ($46,648,984 ÷ 2,086,457 shares | ) | ($32,368,113 ÷ 1,091,389 shares | ) | ($101,797,863 ÷ 4,509,049 shares | ) | ||||||||||||||||||||
SEI Institutional Managed Trust
361
STATEMENTS OF ASSETS AND LIABILITIES ($ Thousands)
September 30, 2023
Mid-Cap Fund | U.S. Managed Volatility Fund | |||||||
Assets: | ||||||||
Investments, at value † | $ | 72,753 | $ | 726,979 | * | |||
Affiliated investments, at value †† | 1,512 | 18,386 | ||||||
Repurchase agreements† | – | – | ||||||
Cash and cash equivalents | 1 | 42 | ||||||
Cash pledged as collateral on centrally cleared swap contracts | – | – | ||||||
Cash pledged as collateral on OTC swap contracts | – | – | ||||||
Cash pledged as collateral on futures contracts | – | 560 | ||||||
Cash pledged as collateral on TBA's | – | – | ||||||
Foreign currency, at value ††† | – | 1,433 | ||||||
Receivable for fund shares sold | 8 | 65 | ||||||
Receivable for investment securities sold | – | – | ||||||
Dividends and interest receivable | 79 | 1,230 | ||||||
Unrealized gain on forward foreign currency contracts | – | – | ||||||
Unrealized gain on foreign spot currency contracts | – | – | ||||||
Receivable for Variation Margin on Futures Contracts | – | – | ||||||
Receivable for Variation Margin on Swap Contracts | – | – | ||||||
Foreign tax reclaim receivable | – | 2 | ||||||
Prepaid expenses | 1 | 14 | ||||||
Total Assets | 74,354 | 748,711 | ||||||
Liabilities: | ||||||||
Payable for fund shares redeemed | 48 | 582 | ||||||
Administration fees payable | 19 | 148 | ||||||
Shareholder servicing fees payable Class F | 15 | 121 | ||||||
Payable upon return on securities loaned | – | 2,814 | ||||||
Payable for investment securities purchased | – | – | ||||||
Income distribution payable | – | – | ||||||
OTC Swap contracts, at value †††† | – | – | ||||||
Options written, at value ^^ | – | – | ||||||
Due to custodian | – | – | ||||||
Payable for Variation Margin on Swap Contracts | – | – | ||||||
Payable for Variation Margin on Futures Contracts | – | 30 | ||||||
Unrealized loss on foreign currency spot contracts | – | – | ||||||
Unrealized loss on forward foreign currency contracts | – | – | ||||||
Investment advisory fees payable | 25 | 245 | ||||||
Trustees fees payable | – | – | ||||||
Chief Compliance Officer fees payable | – | 1 | ||||||
Accrued expense payable | 4 | 45 | ||||||
Total Liabilities | 111 | 3,986 | ||||||
Net Assets | $ | 74,243 | $ | 744,725 | ||||
† Cost of investments and repurchase agreements | $ | 69,494 | $ | 654,985 | ||||
†† Cost of affiliated investments | 1,512 | 18,386 | ||||||
††† Cost of foreign currency | – | 1,429 | ||||||
^^ Premiums received from written options and swaptions | – | – | ||||||
†††† Cost (premiums received) | – | – | ||||||
* Includes market value of securities on loan | – | 2,715 | ||||||
Amounts designated as “—“ are either $0 or have been rounded to $0.
The accompanying notes are an integral part of the financial statements
362
SEI Institutional Managed Trust
Global Managed Volatility Fund | Tax-Managed Managed Volatility Fund | Tax-Managed International Managed Volatility Fund | Real Estate Fund | Core Fixed Income Fund | High Yield Bond Fund | Conservative Income Fund | |||||||||||||||||||||
| $ | 761,326 | * | $ | 785,360 | * | $ | 300,726 | * | $ | 67,139 | $ | 3,606,569 | * | $ | 1,202,957 | $ | 387,259 | ||||||||||
| 13,259 | 21,278 | 3,687 | 977 | 294,729 | 13,032 | 107 | |||||||||||||||||||||
| – | – | – | – | – | – | 90,100 | |||||||||||||||||||||
| 6,253 | 57 | 2,093 | – | 403 | – | – | |||||||||||||||||||||
| – | – | – | – | 8,841 | – | – | |||||||||||||||||||||
| – | – | – | – | – | – | – | |||||||||||||||||||||
| 320 | 594 | 39 | – | 7,189 | – | – | |||||||||||||||||||||
| – | – | – | – | 2,728 | – | – | |||||||||||||||||||||
| 132 | 1,472 | 650 | – | 2,283 | – | – | |||||||||||||||||||||
| 58 | 160 | 47 | 25 | 1,124 | 260 | 1,241 | |||||||||||||||||||||
| – | – | 385 | 601 | 106,958 | 12,026 | – | |||||||||||||||||||||
| 1,607 | 949 | 1,089 | 263 | 20,766 | 19,871 | 1,531 | |||||||||||||||||||||
| 2,137 | – | – | – | 606 | – | – | |||||||||||||||||||||
| – | – | 2 | – | – | – | – | |||||||||||||||||||||
| 15 | – | 5 | – | 925 | – | – | |||||||||||||||||||||
| – | – | – | – | 194 | – | – | |||||||||||||||||||||
| 3,321 | 9 | 2,936 | – | 708 | 83 | – | |||||||||||||||||||||
| 14 | 15 | 5 | 1 | 58 | 21 | 6 | |||||||||||||||||||||
| 788,442 | 809,894 | 311,664 | 69,006 | 4,054,081 | 1,248,250 | 480,244 | |||||||||||||||||||||
| 520 | 729 | 159 | 523 | 1,855 | 876 | 440 | |||||||||||||||||||||
| 172 | 196 | 100 | 18 | 474 | 193 | 38 | |||||||||||||||||||||
| 139 | 147 | 52 | 12 | 613 | 227 | 36 | |||||||||||||||||||||
| 5,169 | 3,175 | 2,585 | 5 | 53,127 | 1 | – | |||||||||||||||||||||
| – | – | 864 | 205 | 635,769 | 15,124 | – | |||||||||||||||||||||
| – | – | – | – | 716 | 1,123 | 376 | |||||||||||||||||||||
| – | – | – | – | 533 | – | – | |||||||||||||||||||||
| – | – | – | – | 2,165 | – | – | |||||||||||||||||||||
| – | – | – | – | – | 1,140 | – | |||||||||||||||||||||
| – | – | – | – | 200 | – | – | |||||||||||||||||||||
| 16 | 32 | 1 | – | 403 | – | – | |||||||||||||||||||||
| – | – | – | – | 13 | – | – | |||||||||||||||||||||
| 289 | – | – | – | 1,838 | 2 | – | |||||||||||||||||||||
| 358 | 298 | 97 | 33 | 563 | 429 | 23 | |||||||||||||||||||||
| – | – | – | – | 1 | – | – | |||||||||||||||||||||
| 1 | 1 | – | – | 5 | 2 | 1 | |||||||||||||||||||||
| 124 | 49 | 75 | 4 | 338 | 130 | 27 | |||||||||||||||||||||
| 6,788 | 4,627 | 3,933 | 800 | 698,613 | 19,247 | 941 | |||||||||||||||||||||
| $ | 781,654 | $ | 805,267 | $ | 307,731 | $ | 68,206 | $ | 3,355,468 | $ | 1,229,003 | $ | 479,303 | ||||||||||||||
| $ | 747,522 | $ | 359,124 | $ | 249,206 | $ | 59,885 | $ | 3,958,865 | $ | 1,277,042 | $ | 477,413 | ||||||||||||||
| 13,260 | 21,283 | 3,684 | 978 | 294,658 | 13,032 | 107 | |||||||||||||||||||||
| 132 | 1,472 | – | – | 2,343 | – | – | |||||||||||||||||||||
| – | – | – | – | (1,240 | ) | – | – | ||||||||||||||||||||
| – | – | – | – | – | – | – | |||||||||||||||||||||
| 4,701 | 2,964 | 2,460 | – | 52,367 | – | – | |||||||||||||||||||||
SEI Institutional Managed Trust
363
STATEMENTS OF ASSETS AND LIABILITIES ($ Thousands)
September 30, 2023
Mid-Cap Fund | U.S. Managed Volatility Fund | |||||||
Net Assets: | ||||||||
Paid-in capital — (unlimited authorization — no par value) | $ | 74,849 | $ | 600,478 | ||||
Total distributable earnings (accumulated losses) | (606 | ) | 144,247 | |||||
Net Assets | $ | 74,243 | $ | 744,725 | ||||
Net Asset Value, Offering and Redemption Price Per Share — Class F | $ | 25.31 | $ | 14.88 | ||||
| ($69,548,566 ÷ 2,748,233 shares | ) | ($577,827,406 ÷ 38,837,809 shares | ) | |||||
Net Asset Value, Offering and Redemption Price Per Share — Class I | $ | 25.23 | $ | 14.87 | ||||
| ($309,029 ÷ 12,247 shares | ) | ($545,856 ÷ 36,702 shares | ) | |||||
Net Asset Value, Offering and Redemption Price Per Share — Class Y | $ | 25.32 | $ | 14.88 | ||||
| ($4,385,072 ÷ 173,175 shares | ) | ($166,352,027 ÷ 11,179,828 shares | ) | |||||
N/A - Not applicable. Share class currently not offered.
The accompanying notes are an integral part of the financial statements.
364
SEI Institutional Managed Trust
Global Managed Volatility Fund | Tax-Managed Managed Volatility Fund | Tax-Managed International Managed Volatility Fund | Real Estate Fund | Core Fixed Income Fund | High Yield Bond Fund | Conservative Income Fund | |||||||||||||||||||||
| $ | 736,774 | $ | 280,533 | $ | 309,313 | $ | 61,989 | $ | 4,247,817 | $ | 1,739,897 | $ | 479,276 | ||||||||||||||
| 44,880 | 524,734 | (1,582 | ) | 6,217 | (892,349 | ) | (510,894 | ) | 27 | ||||||||||||||||||
| $ | 781,654 | $ | 805,267 | $ | 307,731 | $ | 68,206 | $ | 3,355,468 | $ | 1,229,003 | $ | 479,303 | ||||||||||||||
| $ | 9.69 | $ | 19.14 | $ | 10.21 | $ | 13.26 | $ | 9.10 | $ | 5.37 | $ | 10.00 | ||||||||||||||
| ($662,757,738 ÷ 68,375,814 shares | ) | ($699,917,406 ÷ 36,565,897 shares | ) | ($250,047,355 ÷ 24,488,540 shares | ) | ($55,147,828 ÷ 4,157,831 shares | ) | ($2,966,848,561 ÷ 325,932,111 shares | ) | ($1,072,998,940 ÷ 199,787,372 shares | ) | ($464,085,509 ÷ 46,406,996 shares | ) | ||||||||||||||
| $ | 9.40 | N/A | N/A | $ | 13.22 | $ | 9.09 | $ | 5.15 | N/A | |||||||||||||||||
| ($466,699 ÷ 49,672 shares | ) | ($169,286 ÷ 12,806 shares | ) | ($2,715,124 ÷ 298,768 shares | ) | $ | (3,556 ÷ 690 shares | ) | |||||||||||||||||||
| $ | 9.73 | $ | 19.14 | $ | 10.22 | $ | 13.28 | $ | 9.11 | $ | 5.37 | $ | 10.01 | ||||||||||||||
| ($118,429,488 ÷ 12,176,119 shares | ) | ($105,349,825 ÷ 5,502,807 shares | ) | ($57,683,667 ÷ 5,641,471 shares | ) | ($12,888,631 ÷ 970,350 shares | ) | ($385,904,290 ÷ 42,366,595 shares | ) | ($156,000,436 ÷ 29,046,645 shares | ) | ($15,217,395 ÷ 1,520,309 shares | ) | ||||||||||||||
SEI Institutional Managed Trust
365
STATEMENTS OF ASSETS AND LIABILITIES/CONSOLIDATED STATEMENTS OF ASSETS AND LIABILITIES ($ Thousands)
September 30, 2023
Tax-Free Conservative Income Fund | Real Return Fund | |||||||
Assets: | ||||||||
Investments, at value † | $ | 167,190 | $ | 195,881 | ||||
Affiliated investments, at value †† | – | 1,547 | ||||||
Cash and cash equivalents | 50 | – | ||||||
Due from Broker | – | – | ||||||
Cash pledged as collateral on centrally cleared swap contracts | – | – | ||||||
Cash pledged as collateral on OTC swap contracts | – | – | ||||||
Cash pledged as collateral on futures contracts | – | – | ||||||
Cash pledged as collateral on securities sold short | – | – | ||||||
Foreign currency, at value ††† | – | – | ||||||
Receivable for fund shares sold | 21 | 20 | ||||||
Receivable for investment securities sold | – | – | ||||||
Dividends and interest receivable | 872 | 467 | ||||||
Unrealized gain on forward foreign currency contracts | – | – | ||||||
Unrealized gain on foreign spot currency contracts | – | – | ||||||
OTC Swap contracts, at value †††† | – | – | ||||||
Receivable for Variation Margin on Futures Contracts | – | – | ||||||
Receivable for Variation Margin on Swap Contracts | – | – | ||||||
Foreign tax reclaim receivable | – | – | ||||||
Receivable due from Administrator | – | – | ||||||
Deferred offering costs | – | – | ||||||
Prepaid expenses | 3 | 4 | ||||||
Total Assets | 168,136 | 197,919 | ||||||
Liabilities: | ||||||||
Payable for fund shares redeemed | 105 | 159 | ||||||
Income distribution payable | 86 | – | ||||||
Administration fees payable | 15 | 32 | ||||||
Shareholder servicing fees payable Class F | 14 | 15 | ||||||
Payable for securities sold short@ | – | – | ||||||
Payable for investment securities purchased | – | – | ||||||
OTC Swap contracts, at value †††† | – | – | ||||||
Options written, at value ^^ | – | – | ||||||
Due to broker | – | – | ||||||
Reverse repurchase agreements | – | – | ||||||
Payable for Variation Margin on Swap Contracts | – | – | ||||||
Payable for Variation Margin on Futures Contracts | – | – | ||||||
Unrealized loss on foreign currency spot contracts | – | – | ||||||
Unrealized loss on forward foreign currency contracts | – | – | ||||||
Investment advisory fees payable | 8 | 21 | ||||||
Interest payable | – | – | ||||||
Chief Compliance Officer fees payable | – | – | ||||||
Repurchase agreements payable | – | – | ||||||
Other payables | – | – | ||||||
Accrued expense payable | 13 | 12 | ||||||
Total Liabilities | 241 | 239 | ||||||
Net Assets | $ | 167,895 | $ | 197,680 | ||||
† Cost of investments and repurchase agreements | $ | 167,253 | $ | 209,879 | ||||
†† Cost of affiliated investments | – | 1,547 | ||||||
††† Cost of foreign currency | – | – | ||||||
†††† Cost (premiums received) | – | – | ||||||
^^ Premiums received from written options and swaptions | – | – | ||||||
@Proceeds from securities sold short | – | – | ||||||
Amounts designated as "—" are either $0 or have been rounded to $0.
The accompanying notes are an integral part of the financial statements.
366
SEI Institutional Managed Trust
Dynamic Asset Allocation Fund | Multi-Strategy Alternative Fund | Liquid Alternative Fund | Multi-Asset Accumulation Fund | Multi-Asset Income Fund | Multi-Asset Inflation Managed Fund | Multi-Asset Capital Stability Fund | |||||||||||||||||||||
| $ | 553,276 | $ | 262,172 | $ | – | $ | 1,350,754 | $ | 633,239 | $ | 776,182 | $ | 529,379 | ||||||||||||||
| 2,779 | 92,197 | – | – | – | – | – | |||||||||||||||||||||
| 108,961 | 32,216 | 10,875 | 447,740 | 6,495 | 108,236 | 23,720 | |||||||||||||||||||||
| – | 128 | – | – | – | – | – | |||||||||||||||||||||
| 10,076 | 414 | – | 8,990 | 3,923 | 885 | – | |||||||||||||||||||||
| 12,950 | – | – | 94 | 60 | 11 | 56 | |||||||||||||||||||||
| 4,295 | – | 479 | 58,228 | 4,173 | 7,423 | 4,409 | |||||||||||||||||||||
| – | 25,288 | – | – | – | – | – | |||||||||||||||||||||
| – | 2,103 | – | 7,118 | 4,721 | – | 21,774 | |||||||||||||||||||||
| 220 | 135 | – | 538 | 55 | 348 | 50 | |||||||||||||||||||||
| – | 20,167 | – | 248 | 6,657 | 500 | 9,337 | |||||||||||||||||||||
| 783 | 1,856 | 40 | 2,434 | 7,942 | 1,979 | 340 | |||||||||||||||||||||
| – | 13 | – | 8,482 | 1,318 | 107 | 3,485 | |||||||||||||||||||||
| – | – | – | – | – | – | 21 | |||||||||||||||||||||
| – | – | – | 438 | – | – | 2,205 | |||||||||||||||||||||
| – | – | 7 | 7,624 | 775 | 771 | 269 | |||||||||||||||||||||
| 673 | 27 | – | – | 307 | 28 | 7 | |||||||||||||||||||||
| – | 44 | – | 363 | 93 | – | – | |||||||||||||||||||||
| – | – | 17 | – | – | – | – | |||||||||||||||||||||
| – | – | 35 | – | – | – | – | |||||||||||||||||||||
| 11 | 6 | – | 33 | 11 | 15 | 10 | |||||||||||||||||||||
| 694,024 | 436,766 | 11,453 | 1,893,084 | 669,769 | 896,485 | 595,062 | |||||||||||||||||||||
| 303 | 219 | 66 | 782 | 327 | 379 | 423 | |||||||||||||||||||||
| – | – | – | – | 442 | – | – | |||||||||||||||||||||
| 152 | 92 | – | 382 | 118 | 151 | 56 | |||||||||||||||||||||
| 137 | 73 | – | 376 | 45 | 135 | 46 | |||||||||||||||||||||
| – | 34,680 | – | – | – | 85,859 | – | |||||||||||||||||||||
| – | 32,827 | – | – | 7,012 | 1,130 | 9,274 | |||||||||||||||||||||
| 7,491 | – | – | 699 | 177 | 100 | 2,154 | |||||||||||||||||||||
| 1,514 | 13 | – | – | 60 | 7 | 123 | |||||||||||||||||||||
| 815 | – | – | – | 120 | – | – | |||||||||||||||||||||
| – | – | – | – | – | 126,489 | – | |||||||||||||||||||||
| 512 | – | – | 167 | 362 | 140 | 29 | |||||||||||||||||||||
| 191 | – | 23 | 6,244 | 5 | 1,657 | 107 | |||||||||||||||||||||
| – | – | – | – | – | – | 52 | |||||||||||||||||||||
| – | 2 | – | 2,023 | 917 | – | 996 | |||||||||||||||||||||
| 109 | 238 | 4 | 1,017 | 232 | 188 | 174 | |||||||||||||||||||||
| – | – | – | – | – | – | 2 | |||||||||||||||||||||
| 1 | 1 | – | 3 | 1 | 1 | 1 | |||||||||||||||||||||
| – | – | – | – | – | 469 | – | |||||||||||||||||||||
| – | – | – | – | – | – | 1 | |||||||||||||||||||||
| 62 | 38 | 2 | 163 | 119 | 87 | 54 | |||||||||||||||||||||
| 11,287 | 68,183 | 95 | 11,856 | 9,937 | 216,792 | 13,492 | |||||||||||||||||||||
| $ | 682,737 | $ | 368,583 | $ | 11,358 | $ | 1,881,228 | $ | 659,832 | $ | 679,693 | $ | 581,570 | ||||||||||||||
| $ | 257,214 | $ | 270,302 | $ | – | $ | 1,388,115 | $ | 713,660 | $ | 713,022 | $ | 519,173 | ||||||||||||||
| 2,779 | 92,197 | – | – | – | – | – | |||||||||||||||||||||
| – | 2,096 | – | 6,923 | – | – | 21,701 | |||||||||||||||||||||
| – | – | – | – | – | (61 | ) | – | ||||||||||||||||||||
| (1,309 | ) | (17 | ) | – | – | (17 | ) | (19 | ) | (144 | ) | ||||||||||||||||
| – | (35,281 | ) | – | – | – | 94,356 | – | ||||||||||||||||||||
SEI Institutional Managed Trust
367
STATEMENTS OF ASSETS AND LIABILITIES/CONSOLIDATED STATEMENTS OF ASSETS AND LIABILITIES ($ Thousands)
September 30, 2023
Tax-Free Conservative Income Fund | Real Return Fund | |||||||
Net Assets: | ||||||||
Paid-in capital — (unlimited authorization — no par value) | $ | 167,953 | $ | 221,039 | ||||
Total distributable earnings (accumulated losses) | (58 | ) | (23,359 | ) | ||||
Net Assets | $ | 167,895 | $ | 197,680 | ||||
Net Asset Value, Offering and Redemption Price Per Share — Class F | $ | 10.00 | $ | 9.33 | ||||
| ($163,923,602 ÷ 16,398,020 shares | ) | ($183,431,360 ÷ 19,658,386 shares | ) | |||||
Net Asset Value, Offering and Redemption Price Per Share — Class Y | $ | 10.01 | $ | 9.37 | ||||
| ($3,971,291 ÷ 396,563 shares | ) | ($14,248,535 ÷ 1,519,984 shares | ) | |||||
N/A - Not applicable. Share class currently not offered.
The accompanying notes are an integral part of the financial statements.
368
SEI Institutional Managed Trust
Dynamic Asset Allocation Fund | Multi-Strategy Alternative Fund | Liquid Alternative Fund | Multi-Asset Accumulation Fund | Multi-Asset Income Fund | Multi-Asset Inflation Managed Fund | Multi-Asset Capital Stability Fund | |||||||||||||||||||||
| $ | 353,871 | $ | 392,437 | $ | 11,170 | $ | 2,845,506 | $ | 763,492 | $ | 859,899 | $ | 582,540 | ||||||||||||||
| 328,866 | (23,854 | ) | 188 | (964,278 | ) | (103,660 | ) | (180,206 | ) | (970 | ) | ||||||||||||||||
| $ | 682,737 | $ | 368,583 | $ | 11,358 | $ | 1,881,228 | $ | 659,832 | $ | 679,693 | $ | 581,570 | ||||||||||||||
| $ | 14.86 | $ | 9.37 | $ | 10.16 | $ | 6.66 | $ | 9.28 | $ | 7.87 | $ | 10.01 | ||||||||||||||
| ($640,724,890 ÷ 43,130,309 shares | ) | ($354,258,456 ÷ 37,819,107 shares | ) | ($530,759 ÷ 52,216 shares | ) | ($1,781,011,006 ÷ 267,469,546 shares | ) | ($532,158,992 ÷ 57,334,173 shares | ) | ($648,826,948 ÷ 82,422,421 shares | ) | ($552,045,661 ÷ 55,127,721 shares | ) | ||||||||||||||
| $ | 14.88 | $ | 9.37 | $ | 10.17 | $ | 6.73 | $ | 9.28 | $ | 7.88 | $ | 10.03 | ||||||||||||||
| ($42,012,519 ÷ 2,823,335 shares | ) | ($14,324,909 ÷ 1,528,715 shares | ) | ($10,826,971 ÷ 1,064,997 shares | ) | ($100,216,527 ÷ 14,887,567 shares | ) | ($127,673,428 ÷ 13,757,021 shares | ) | ($30,865,956 ÷ 3,917,473 shares | ) | ($29,524,002 ÷ 2,942,306 shares | ) | ||||||||||||||
SEI Institutional Managed Trust
369
STATEMENTS OF OPERATIONS ($ Thousands)
For the year ended September 30, 2023
Large Cap Fund | Large Cap Value Fund | Large Cap Growth Fund | ||||||||||
Investment Income: | ||||||||||||
Dividends | $ | 29,656 | $ | 39,615 | $ | 12,302 | ||||||
Income from affiliated investments(1) | 653 | 543 | 780 | |||||||||
Interest income | – | – | 716 | |||||||||
Security lending income - net(1) (2) | 67 | 89 | 52 | |||||||||
Less: foreign taxes withheld | (82 | ) | (246 | ) | (8 | ) | ||||||
Total Investment Income | 30,294 | 40,001 | 13,842 | |||||||||
Expenses: | ||||||||||||
Investment advisory fees | 6,621 | 4,661 | 5,530 | |||||||||
Administration fees | 5,004 | 3,995 | 4,148 | |||||||||
Shareholder servicing fees Class F | 4,111 | 2,908 | 2,996 | |||||||||
Shareholder servicing fees Class I | – | 4 | 5 | |||||||||
Audit fees | 73 | 55 | 62 | |||||||||
Legal fees | 49 | 38 | 40 | |||||||||
Trustees' fees | 42 | 33 | 34 | |||||||||
Chief compliance officer fees | 10 | 8 | 8 | |||||||||
Administration servicing fees Class I | – | 4 | 5 | |||||||||
Printing fees | 120 | 93 | 97 | |||||||||
Registration fees | 69 | 54 | 55 | |||||||||
Custodian/Wire agent fees | 64 | 50 | 53 | |||||||||
Pricing fees | 40 | 31 | 32 | |||||||||
Other expenses | 56 | 44 | 46 | |||||||||
Total Expenses | 16,259 | 11,978 | 13,111 | |||||||||
Less: | ||||||||||||
Waiver of investment advisory fees | (467 | ) | (318 | ) | (1,016 | ) | ||||||
Waiver of shareholder servicing fees Class F | (33 | ) | (23 | ) | (24 | ) | ||||||
Waiver of shareholder servicing fees Class I | – | (1 | ) | (1 | ) | |||||||
Waiver of administration fees | (740 | ) | (166 | ) | (182 | ) | ||||||
Net Expenses | 15,019 | 11,470 | 11,888 | |||||||||
Net Investment Income (Loss) | 15,275 | 28,531 | 1,954 | |||||||||
Net Realized Gain (Loss) on: | ||||||||||||
Investments | 84,988 | 63,486 | 195,454 | |||||||||
Affiliated investments | (20 | ) | 2 | – | ||||||||
Futures contracts | 432 | 1,428 | 760 | |||||||||
Swap contracts | – | – | 2,876 | |||||||||
Capital gains on Affiliated Investments | – | 2 | 1 | |||||||||
Net Realized Gain (Loss) | 85,400 | 64,918 | 199,091 | |||||||||
Net Change in Unrealized Appreciation (Depreciation) on: | ||||||||||||
Investments | 180,865 | 83,643 | 119,878 | |||||||||
Affiliated investments | (6 | ) | (3 | ) | – | |||||||
Futures contracts | 456 | 599 | 450 | |||||||||
Swap contracts | – | – | (696 | ) | ||||||||
Foreign currency translation of other assets and liabilities denominated in foreign currencies | – | – | – | |||||||||
Net Change in Unrealized Appreciation (Depreciation) | $ | 181,315 | $ | 84,239 | $ | 119,632 | ||||||
Net Increase in Net Assets Resulting from Operations | $ | 281,990 | $ | 177,688 | $ | 320,677 | ||||||
(1) | See Note 6 in Notes to Financial Statements. | ||
(2) | Income is from the investment of collateral in an affiliated security. |
Amounts designated as "—" are either $0 or have been rounded to $0.
The accompanying notes are an integral part of the financial statements.
370
SEI Institutional Managed Trust
Large Cap Index Fund | Tax-Managed Large Cap Fund | S&P 500 Index Fund | Small Cap Fund | Small Cap Value Fund | Small Cap Growth Fund | Tax-Managed Small/Mid Cap Fund | |||||||||||||||||||||
| $ | 15,971 | $ | 72,502 | $ | 13,467 | $ | 7,559 | $ | 8,493 | $ | 2,285 | $ | 12,167 | ||||||||||||||
| 455 | 835 | 332 | 294 | 204 | 173 | 408 | |||||||||||||||||||||
| – | – | – | – | – | – | – | |||||||||||||||||||||
| 106 | 345 | 6 | 31 | 73 | 70 | 26 | |||||||||||||||||||||
| (1 | ) | (358 | ) | (4 | ) | (19 | ) | (16 | ) | (21 | ) | (22 | ) | ||||||||||||||
| 16,531 | 73,324 | 13,801 | 7,865 | 8,754 | 2,507 | 12,579 | |||||||||||||||||||||
| 506 | 15,637 | 249 | 3,560 | 2,393 | 2,113 | 5,311 | |||||||||||||||||||||
| 3,037 | 8,741 | 1,824 | 1,643 | 1,105 | 975 | 2,451 | |||||||||||||||||||||
| 2,531 | 8,532 | 2,058 | 1,311 | 771 | 723 | 1,789 | |||||||||||||||||||||
| – | – | 15 | – | 2 | 1 | – | |||||||||||||||||||||
| 45 | 169 | 37 | 23 | 15 | 14 | 35 | |||||||||||||||||||||
| 29 | 113 | 24 | 16 | 10 | 9 | 24 | |||||||||||||||||||||
| 25 | 97 | 20 | 14 | 9 | 8 | 20 | |||||||||||||||||||||
| 6 | 24 | 5 | 3 | 2 | 2 | 5 | |||||||||||||||||||||
| – | – | 15 | – | 2 | 1 | – | |||||||||||||||||||||
| 74 | 278 | 61 | 39 | 25 | 23 | 57 | |||||||||||||||||||||
| 35 | 146 | 32 | 22 | 15 | 13 | 33 | |||||||||||||||||||||
| 39 | 147 | 31 | 21 | 14 | 12 | 31 | |||||||||||||||||||||
| 31 | 87 | 22 | 18 | 12 | 11 | 23 | |||||||||||||||||||||
| 32 | 130 | 96 | 18 | 12 | 11 | 27 | |||||||||||||||||||||
| 6,390 | 34,101 | 4,489 | 6,688 | 4,387 | 3,916 | 9,806 | |||||||||||||||||||||
| (304 | ) | – | (83 | ) | (412 | ) | (287 | ) | (353 | ) | (628 | ) | |||||||||||||||
| (1,518 | ) | (68 | ) | (1,646 | ) | (10 | ) | (6 | ) | (6 | ) | (215 | ) | ||||||||||||||
| – | – | (3 | ) | – | – | – | – | ||||||||||||||||||||
| (2,012 | ) | (384 | ) | (640 | ) | (65 | ) | (34 | ) | (29 | ) | (97 | ) | ||||||||||||||
| 2,556 | 33,649 | 2,117 | 6,201 | 4,060 | 3,528 | 8,866 | |||||||||||||||||||||
| 13,975 | 39,675 | 11,684 | 1,664 | 4,694 | (1,021 | ) | 3,713 | ||||||||||||||||||||
| (6,623 | ) | 183,398 | 32,296 | 21,028 | 7,681 | (12,594 | ) | 20,785 | |||||||||||||||||||
| (4 | ) | (3 | ) | – | – | – | – | – | |||||||||||||||||||
| 326 | 1,572 | 651 | (21 | ) | (92 | ) | (4 | ) | (25 | ) | |||||||||||||||||
| – | – | – | – | – | – | – | |||||||||||||||||||||
| – | 1 | – | – | – | – | – | |||||||||||||||||||||
| (6,301 | ) | 184,968 | 32,947 | 21,007 | 7,589 | (12,598 | ) | 20,760 | |||||||||||||||||||
| 178,007 | 427,764 | 108,967 | 33,750 | 36,942 | 36,995 | 56,600 | |||||||||||||||||||||
| 35 | 24 | – | – | 1 | 1 | (8 | ) | ||||||||||||||||||||
| 180 | 112 | (418 | ) | – | – | – | – | ||||||||||||||||||||
| – | – | – | – | – | – | – | |||||||||||||||||||||
| – | 2 | – | – | – | – | – | |||||||||||||||||||||
| $ | 178,222 | $ | 427,902 | $ | 108,549 | $ | 33,750 | $ | 36,943 | $ | 36,996 | $ | 56,592 | ||||||||||||||
| $ | 185,896 | $ | 652,545 | $ | 153,180 | $ | 56,421 | $ | 49,226 | $ | 23,377 | $ | 81,065 | ||||||||||||||
SEI Institutional Managed Trust
371
STATEMENTS OF OPERATIONS ($ Thousands)
For the year ended September 30, 2023
Mid-Cap Fund | U.S. Managed Volatility Fund | Global Managed Volatility Fund | ||||||||||
Investment Income: | ||||||||||||
Dividends | $ | 1,133 | $ | 21,009 | $ | 25,014 | ||||||
Income from affiliated investments(1) | 62 | 667 | 489 | |||||||||
Interest income | 1 | – | 166 | |||||||||
Security lending income - net(1) (2) | 1 | 123 | 68 | |||||||||
Less: foreign taxes withheld | (2 | ) | (129 | ) | (1,946 | ) | ||||||
Total Investment Income | 1,195 | 21,670 | 23,791 | |||||||||
Expenses: | ||||||||||||
Investment advisory fees | 302 | 5,312 | 5,498 | |||||||||
Administration fees | 227 | 2,452 | 2,538 | |||||||||
Shareholder servicing fees Class F | 178 | 1,608 | 1,814 | |||||||||
Shareholder servicing fees Class I | 1 | 1 | 1 | |||||||||
Audit fees | 3 | 34 | 36 | |||||||||
Trustees' fees | 2 | 21 | 21 | |||||||||
Legal fees | 2 | 23 | 25 | |||||||||
Administration servicing fees Class I | 1 | 1 | 1 | |||||||||
Chief compliance officer fees | – | 5 | 5 | |||||||||
Printing fees | 6 | 56 | 58 | |||||||||
Pricing fees | 5 | 22 | 28 | |||||||||
Registration fees | 3 | 33 | 34 | |||||||||
Custodian/Wire agent fees | 3 | 31 | 91 | |||||||||
Other expenses | 2 | 27 | 28 | |||||||||
Total Expenses | 735 | 9,626 | 10,178 | |||||||||
Less: | ||||||||||||
Waiver of investment advisory fees | – | (2,130 | ) | (914 | ) | |||||||
Waiver of shareholder servicing fees Class F | (1 | ) | (13 | ) | (15 | ) | ||||||
Waiver of shareholder servicing fees Class I | – | – | – | |||||||||
Waiver of administration fees | (1 | ) | (539 | ) | (137 | ) | ||||||
Net Expenses | 733 | 6,944 | 9,112 | |||||||||
Net Investment Income | 462 | 14,726 | 14,679 | |||||||||
Net Realized Gain (Loss) on: | ||||||||||||
Investments | (2,766 | ) | 71,015 | 25,750 | ||||||||
Affiliated investments | – | (1 | ) | 5 | ||||||||
Futures contracts | 83 | 1,314 | 1,547 | |||||||||
Foreign currency translation | – | (6 | ) | (3,845 | ) | |||||||
Forward foreign currency contracts | – | – | 4,008 | |||||||||
Purchased options and swaptions | – | – | – | |||||||||
Written options and swaptions | – | – | ��� | |||||||||
Swap contracts | – | – | – | |||||||||
Net Realized Gain (Loss) | (2,683 | ) | 72,322 | 27,465 | ||||||||
Net Change in Unrealized Appreciation (Depreciation) on: | ||||||||||||
Investments | 10,279 | (2,700 | ) | 60,154 | ||||||||
Affiliated investments | – | 1 | 3 | |||||||||
Futures contracts | 106 | 207 | 254 | |||||||||
Purchased options and swaptions | – | – | – | |||||||||
Written options and swaptions | – | – | – | |||||||||
Swap contracts | – | – | – | |||||||||
Foreign currency translation of other assets and liabilities denominated in foreign currencies | – | 8 | 314 | |||||||||
Forward foreign currency contracts | – | – | (2,405 | ) | ||||||||
Net Change in Unrealized Appreciation (Depreciation) | $ | 10,385 | $ | (2,484 | ) | $ | 58,320 | |||||
Net Increase in Net Assets Resulting from Operations | $ | 8,164 | $ | 84,564 | $ | 100,464 | ||||||
(1) | See Note 6 in Notes to Financial Statements. | ||
(2) | Income is from the investment of collateral in an affiliated security. | ||
Amounts designated as "—" are either $0 or have been rounded to $0.
The accompanying notes are an integral part of the financial statements.
372
SEI Institutional Managed Trust
Tax-Managed Managed Volatility Fund | Tax-Managed International Managed Volatility Fund | Real Estate Fund | Core Fixed Income Fund | High Yield Bond Fund | Conservative Income Fund | Tax-Free Conservative Income Fund | |||||||||||||||||||||
| $ | 16,533 | $ | 13,502 | $ | 1,977 | $ | – | $ | 1,275 | $ | – | $ | – | ||||||||||||||
| 731 | 159 | 45 | 4,071 | 1,294 | 23 | – | |||||||||||||||||||||
| – | 89 | – | 142,913 | 102,150 | 19,896 | 5,140 | |||||||||||||||||||||
| 26 | 79 | – | 152 | – | – | – | |||||||||||||||||||||
| (75 | ) | (1,388 | ) | (2 | ) | – | (13 | ) | – | – | |||||||||||||||||
| 17,215 | 12,441 | 2,020 | 147,136 | 104,706 | 19,919 | 5,140 | |||||||||||||||||||||
| 5,733 | 2,098 | 482 | 9,733 | 6,228 | 407 | 167 | |||||||||||||||||||||
| 2,646 | 1,412 | 223 | 5,918 | 2,555 | 813 | 335 | |||||||||||||||||||||
| 1,949 | 670 | 150 | 7,812 | 2,784 | 984 | 407 | |||||||||||||||||||||
| – | – | – | 7 | – | – | – | |||||||||||||||||||||
| 37 | 14 | 3 | 151 | 54 | 20 | 7 | |||||||||||||||||||||
| 22 | 8 | 2 | 89 | 32 | 10 | 4 | |||||||||||||||||||||
| 25 | 9 | 2 | 102 | 37 | 12 | 5 | |||||||||||||||||||||
| – | – | – | 7 | – | – | – | |||||||||||||||||||||
| 5 | 2 | – | 22 | 8 | 3 | 1 | |||||||||||||||||||||
| 59 | 23 | 5 | 240 | 87 | 34 | 11 | |||||||||||||||||||||
| 21 | 18 | 2 | 686 | 270 | 19 | 12 | |||||||||||||||||||||
| 36 | 13 | 3 | 144 | 51 | 13 | 7 | |||||||||||||||||||||
| 33 | 71 | 2 | 130 | 53 | 16 | 6 | |||||||||||||||||||||
| 30 | 11 | 3 | 116 | 42 | 14 | 5 | |||||||||||||||||||||
| 10,596 | 4,349 | 877 | 25,157 | 12,201 | 2,345 | 967 | |||||||||||||||||||||
| (1,886 | ) | (870 | ) | (64 | ) | (2,669 | ) | (975 | ) | (163 | ) | (67 | ) | ||||||||||||||
| (16 | ) | (5 | ) | (1 | ) | (62 | ) | (22 | ) | (591 | ) | (244 | ) | ||||||||||||||
| – | – | – | (1 | ) | – | – | – | ||||||||||||||||||||
| (108 | ) | (20 | ) | – | – | (211 | ) | (374 | ) | (154 | ) | ||||||||||||||||
| 8,586 | 3,454 | 812 | 22,425 | 10,993 | 1,217 | 502 | |||||||||||||||||||||
| 8,629 | 8,987 | 1,208 | 124,711 | 93,713 | 18,702 | 4,638 | |||||||||||||||||||||
| 98,959 | (10,113 | ) | 392 | (209,168 | ) | (71,473 | ) | 14 | – | ||||||||||||||||||
| – | 3 | – | 11 | – | – | – | |||||||||||||||||||||
| 1,555 | 602 | – | (37,932 | ) | – | – | – | ||||||||||||||||||||
| 1 | 222 | – | (4,138 | ) | (1 | ) | – | – | |||||||||||||||||||
| – | (211 | ) | – | (2,830 | ) | 24 | – | – | |||||||||||||||||||
| – | – | – | (8,798 | ) | – | – | – | ||||||||||||||||||||
| – | – | – | 10,851 | – | – | – | |||||||||||||||||||||
| – | – | – | 11,409 | (57 | ) | – | – | ||||||||||||||||||||
| 100,515 | (9,497 | ) | 392 | (240,595 | ) | (71,507 | ) | 14 | – | ||||||||||||||||||
| (13,166 | ) | 60,321 | 680 | 130,672 | 93,393 | 11 | 108 | ||||||||||||||||||||
| (5 | ) | 3 | – | 55 | – | – | – | ||||||||||||||||||||
| (1 | ) | 71 | – | 12,029 | – | – | – | ||||||||||||||||||||
| – | – | – | 1,073 | – | – | – | |||||||||||||||||||||
| – | – | – | 1,860 | – | – | – | |||||||||||||||||||||
| – | – | – | (4,951 | ) | (381 | ) | – | – | |||||||||||||||||||
| 3 | 196 | – | (42 | ) | (2 | ) | – | – | |||||||||||||||||||
| – | – | – | 718 | (2 | ) | – | – | ||||||||||||||||||||
| $ | (13,169 | ) | $ | 60,591 | $ | 680 | $ | 141,414 | $ | 93,008 | $ | 11 | $ | 108 | |||||||||||||
| $ | 95,975 | $ | 60,081 | $ | 2,280 | $ | 25,530 | $ | 115,214 | $ | 18,727 | $ | 4,746 | ||||||||||||||
SEI Institutional Managed Trust
373
STATEMENTS OF OPERATIONS/CONSOLIDATED STATEMENTS OF OPERATIONS ($ Thousands)
For the year ended September 30, 2023
Real Return Fund | Dynamic Asset Allocation Fund | |||||||
Investment Income: | ||||||||
Dividends | $ | – | $ | 9,435 | ||||
Income from affiliated investments(1) | 27 | 318 | ||||||
Interest income | 6,273 | 4,032 | ||||||
Less: foreign taxes withheld | – | (2 | ) | |||||
Total Investment Income | 6,300 | 13,783 | ||||||
Expenses: | ||||||||
Shareholder servicing fees Class F | 521 | 1,621 | ||||||
Investment advisory fees | 492 | 4,124 | ||||||
Administration fees | 447 | 2,062 | ||||||
Audit fees | 9 | 30 | ||||||
Trustees' fees | 6 | 17 | ||||||
Legal fees | 6 | 20 | ||||||
Chief compliance officer fees | 1 | 4 | ||||||
Printing fees | 12 | 49 | ||||||
Registration fees | 10 | 27 | ||||||
Custodian/Wire agent fees | 8 | 26 | ||||||
Pricing fees | 6 | 20 | ||||||
Offering cost(2) | – | – | ||||||
Dividend and interest expense on securities sold short | – | – | ||||||
Interest expense | – | – | ||||||
Other expenses | 7 | 24 | ||||||
Total Expenses | 1,525 | 8,024 | ||||||
Less: | ||||||||
Waiver of investment advisory fees | (201 | ) | (2,844 | ) | ||||
Waiver of shareholder servicing fees Class F | (313 | ) | – | |||||
Waiver of administration fees | (15 | ) | (105 | ) | ||||
Reimbursement from Administrator | – | – | ||||||
Net Expenses | 996 | 5,075 | ||||||
Net Investment Income | 5,304 | 8,708 | ||||||
Net Realized Gain (Loss) on: | ||||||||
Investments | (7,801 | ) | 63,435 | |||||
Securities sold short | – | – | ||||||
Futures contracts | – | 3,458 | ||||||
Foreign currency translation | – | (74 | ) | |||||
Forward foreign currency contracts | – | – | ||||||
Purchased options and swaptions | – | (1,515 | ) | |||||
Written options and swaptions | – | 282 | ||||||
Swap contracts | – | (12,905 | ) | |||||
Net Realized Gain (Loss) | (7,801 | ) | 52,681 | |||||
Net Change in Unrealized Appreciation (Depreciation) on: | ||||||||
Investments | 8,424 | 41,994 | ||||||
Securities sold short | – | – | ||||||
Futures contracts | – | 5,297 | ||||||
Purchased options and swaptions | – | 2,115 | ||||||
Written options and swaptions | – | (205 | ) | |||||
Swap contracts | – | (1,666 | ) | |||||
Foreign currency translation of other assets and liabilities denominated in foreign currencies | – | 1 | ||||||
Forward foreign currency contracts | – | – | ||||||
Net Change in Unrealized Appreciation (Depreciation) | $ | 8,424 | $ | 47,536 | ||||
Net Increase in Net Assets Resulting from Operations | $ | 5,927 | $ | 108,925 | ||||
(1) | See Note 6 in Notes to Financial Statements. | ||
(2) | See Note 2 in the Notes to the Financial Statements. | ||
(3) | Commenced operations on June 30, 2023. |
Amounts designated as "—" are either $0 or have been rounded to $0.
The accompanying notes are an integral part of the financial statements.
374
SEI Institutional Managed Trust
Multi-Strategy Alternative Fund | Liquid Alternative Fund(3) | Multi-Asset Accumulation Fund | Multi-Asset Income Fund | Multi-Asset Inflation Managed Fund | Multi-Asset Capital Stability Fund | ||||||||||||||||||
| $ | 3,379 | $ | – | $ | 3,118 | $ | 3,297 | $ | 5,539 | $ | 758 | ||||||||||||
| 4,537 | – | – | – | – | – | ||||||||||||||||||
| 14,510 | 129 | 86,008 | 47,820 | 34,692 | 24,089 | ||||||||||||||||||
| – | – | (259 | ) | (205 | ) | – | (1 | ) | |||||||||||||||
| 22,426 | 129 | 88,867 | 50,912 | 40,231 | 24,846 | ||||||||||||||||||
| 946 | – | 4,755 | 1,401 | 1,808 | 1,491 | ||||||||||||||||||
| 5,866 | 14 | 15,212 | 4,188 | 4,162 | 2,507 | ||||||||||||||||||
| 1,173 | 8 | 5,830 | 2,094 | 2,270 | 1,880 | ||||||||||||||||||
| 16 | – | 86 | 29 | 30 | 26 | ||||||||||||||||||
| 10 | – | 51 | 18 | 19 | 16 | ||||||||||||||||||
| 11 | 15 | 58 | 20 | 21 | 18 | ||||||||||||||||||
| 2 | – | 12 | 4 | 5 | 4 | ||||||||||||||||||
| 27 | – | 135 | 47 | 49 | 42 | ||||||||||||||||||
| 16 | – | 84 | 29 | 31 | 25 | ||||||||||||||||||
| 15 | 1 | 63 | 39 | 38 | 29 | ||||||||||||||||||
| 90 | 1 | 84 | 228 | 103 | 23 | ||||||||||||||||||
| – | 12 | – | – | – | – | ||||||||||||||||||
| 257 | – | – | – | 1,956 | – | ||||||||||||||||||
| 1,607 | – | – | – | 6,077 | – | ||||||||||||||||||
| 13 | – | 68 | 24 | 25 | 21 | ||||||||||||||||||
| 10,049 | 51 | 26,438 | 8,121 | 16,594 | 6,082 | ||||||||||||||||||
| (2,690 | ) | (1 | ) | (2,229 | ) | (1,259 | ) | (1,650 | ) | (251 | ) | ||||||||||||
| (8 | ) | – | – | (841 | ) | – | (894 | ) | |||||||||||||||
| (229 | ) | (8 | ) | (741 | ) | (556 | ) | (164 | ) | (1,065 | ) | ||||||||||||
| – | (21 | ) | – | – | – | – | |||||||||||||||||
| 7,122 | 21 | 23,468 | 5,465 | 14,780 | 3,872 | ||||||||||||||||||
| 15,304 | 108 | 65,399 | 45,447 | 25,451 | 20,974 | ||||||||||||||||||
| (3,736 | ) | – | (23,624 | ) | (4,654 | ) | (15,957 | ) | (12,981 | ) | |||||||||||||
| 678 | – | – | – | (16,216 | ) | – | |||||||||||||||||
| (134 | ) | (52 | ) | (62,315 | ) | (18,385 | ) | (16,060 | ) | (3,719 | ) | ||||||||||||
| (607 | ) | – | (18,983 | ) | (491 | ) | 14 | 5,012 | |||||||||||||||
| (22 | ) | – | (7,679 | ) | (1,362 | ) | (394 | ) | 2,003 | ||||||||||||||
| (663 | ) | – | – | (1,038 | ) | (1,417 | ) | (943 | ) | ||||||||||||||
| 324 | – | – | 1,270 | 1,357 | 640 | ||||||||||||||||||
| (2,075 | ) | – | (1,048 | ) | 1,291 | 6,282 | (880 | ) | |||||||||||||||
| (6,235 | ) | (52 | ) | (113,649 | ) | (23,369 | ) | (42,391 | ) | (10,868 | ) | ||||||||||||
| 17,955 | – | 53,435 | 25,836 | 47,218 | 11,741 | ||||||||||||||||||
| (6,916 | ) | – | – | – | (12,711 | ) | – | ||||||||||||||||
| (93 | ) | 132 | 46,132 | 9,153 | (697 | ) | 978 | ||||||||||||||||
| 88 | – | – | (486 | ) | (32 | ) | 130 | ||||||||||||||||
| 336 | – | – | (1,546 | ) | 32 | 47 | |||||||||||||||||
| 509 | – | 6,901 | 422 | (4,062 | ) | 818 | |||||||||||||||||
| 73 | – | 277 | 126 | (803 | ) | 241 | |||||||||||||||||
| (193 | ) | – | (554 | ) | 48 | 162 | 2,344 | ||||||||||||||||
| $ | 11,759 | $ | 132 | $ | 106,191 | $ | 33,553 | $ | 29,107 | $ | 16,299 | ||||||||||||
| $ | 20,828 | $ | 188 | $ | 57,941 | $ | 55,631 | $ | 12,167 | $ | 26,405 | ||||||||||||
SEI Institutional Managed Trust
375
STATEMENTS OF CHANGES IN NET ASSETS ($ Thousands)
For the years ended September 30,
Large Cap Fund | Large Cap Value Fund | Large Cap Growth Fund | ||||||||||||||||||||||
| 2023 | 2022 | 2023 | 2022 | 2023 | 2022 | |||||||||||||||||||
Operations: | ||||||||||||||||||||||||
Net investment income (loss) | $ | 15,275 | $ | 15,197 | $ | 28,531 | $ | 27,807 | $ | 1,954 | $ | (84 | ) | |||||||||||
Capital gain distribution from investment | — | — | 2 | — | 1 | — | ||||||||||||||||||
Net realized gain (loss) | 85,400 | 170,576 | 64,916 | 98,963 | 199,090 | 116,112 | ||||||||||||||||||
Net change in unrealized appreciation (depreciation) | 181,315 | (513,647 | ) | 84,239 | (260,933 | ) | 119,632 | (503,491 | ) | |||||||||||||||
Net Increase (Decrease) in Net Assets Resulting from Operations | 281,990 | (327,874 | ) | 177,688 | (134,163 | ) | 320,677 | (387,463 | ) | |||||||||||||||
Distributions: | �� | |||||||||||||||||||||||
Class F: | (156,649 | ) | (268,239 | ) | (108,845 | ) | (80,770 | ) | (84,295 | ) | (189,817 | ) | ||||||||||||
Class I: | N/A | N/A | (194 | ) | (193 | ) | (172 | ) | (551 | ) | ||||||||||||||
Class Y: | (5,047 | ) | (13,977 | ) | (17,435 | ) | (13,213 | ) | (14,333 | ) | (28,424 | ) | ||||||||||||
Total Distributions | (161,696 | ) | (282,216 | ) | (126,474 | ) | (94,176 | ) | (98,800 | ) | (218,792 | ) | ||||||||||||
Capital Share Transactions:(1) | ||||||||||||||||||||||||
Class F: | ||||||||||||||||||||||||
Proceeds from shares issued | 143,127 | 208,257 | 144,314 | 218,643 | 119,961 | 271,763 | ||||||||||||||||||
Reinvestment of dividends & distributions | 143,702 | 246,549 | 102,063 | 75,731 | 78,819 | 176,988 | ||||||||||||||||||
Cost of shares redeemed | (358,101 | ) | (401,737 | ) | (245,449 | ) | (352,574 | ) | (309,092 | ) | (330,620 | ) | ||||||||||||
Net increase (decrease) from Class F transactions | (71,272 | ) | 53,069 | 928 | (58,200 | ) | (110,312 | ) | 118,131 | |||||||||||||||
Class I: | ||||||||||||||||||||||||
Proceeds from shares issued | N/A | N/A | 56 | 1,353 | 234 | 434 | ||||||||||||||||||
Reinvestment of dividends & distributions | N/A | N/A | 167 | 173 | 154 | 495 | ||||||||||||||||||
Cost of shares redeemed | N/A | N/A | (1,103 | ) | (2,056 | ) | (878 | ) | (1,819 | ) | ||||||||||||||
Net decrease from Class I transactions | N/A | N/A | (880 | ) | (530 | ) | (490 | ) | (890 | ) | ||||||||||||||
Class Y: | ||||||||||||||||||||||||
Proceeds from shares issued | 8,576 | 11,036 | 16,590 | 29,107 | 16,998 | 49,661 | ||||||||||||||||||
Reinvestment of dividends & distributions | 4,721 | 13,514 | 17,185 | 12,530 | 14,135 | 26,869 | ||||||||||||||||||
Cost of shares redeemed | (14,332 | ) | (58,092 | ) | (92,870 | ) | (39,750 | ) | (105,352 | ) | (31,042 | ) | ||||||||||||
Net increase (decrease) from Class Y transactions | (1,035 | ) | (33,542 | ) | (59,095 | ) | 1,887 | (74,219 | ) | 45,488 | ||||||||||||||
Increase (Decrease) in Net Assets Derived from Capital Share Transactions | (72,307 | ) | 19,527 | (59,047 | ) | (56,843 | ) | (185,021 | ) | 162,729 | ||||||||||||||
Net Increase (Decrease) in Net Assets | 47,987 | (590,563 | ) | (7,833 | ) | (285,182 | ) | 36,856 | (443,526 | ) | ||||||||||||||
Net Assets | ||||||||||||||||||||||||
Beginning of year | 1,569,904 | 2,160,467 | 1,244,360 | 1,529,542 | 1,299,744 | 1,743,270 | ||||||||||||||||||
End of year | $ | 1,617,891 | $ | 1,569,904 | $ | 1,236,527 | $ | 1,244,360 | $ | 1,336,600 | $ | 1,299,744 | ||||||||||||
(1) | See Note 7 in Notes to Financial Statements for additional information. |
|
N/A — Not applicable. Shares currently not offered.
Amounts designated as “—” are either $0 or have been rounded to $0.
The accompanying notes are an integral part of the financial statements.
376
SEI Institutional Managed Trust
Large Cap Index Fund | Tax-Managed Large Cap Fund | S&P 500 Index Fund | Small Cap Fund | ||||||||||||||||||||||||||||
| 2023 | 2022 | 2023 | 2022 | 2023 | 2022 | 2023 | 2022 | ||||||||||||||||||||||||
| $ | 13,975 | $ | 12,917 | $ | 39,675 | $ | 41,770 | $ | 11,684 | $ | 11,587 | $ | 1,664 | $ | 1,792 | ||||||||||||||||
| — | — | 1 | 1 | — | — | — | — | ||||||||||||||||||||||||
| (6,301 | ) | (12,516 | ) | 184,967 | 178,289 | 32,947 | 64,369 | 21,007 | 10,647 | ||||||||||||||||||||||
| 178,222 | (189,168 | ) | 427,902 | (834,376 | ) | 108,549 | (214,430 | ) | 33,750 | (125,890 | ) | ||||||||||||||||||||
| 185,896 | (188,767 | ) | 652,545 | (614,316 | ) | 153,180 | (138,474 | ) | 56,421 | (113,451 | ) | ||||||||||||||||||||
| (14,021 | ) | (15,797 | ) | (216,575 | ) | (209,161 | ) | (77,333 | ) | (75,572 | ) | (4,593 | ) | (123,055 | ) | ||||||||||||||||
| N/A | N/A | N/A | N/A | (501 | ) | (502 | ) | N/A | N/A | ||||||||||||||||||||||
| N/A | N/A | (29,803 | ) | (27,949 | ) | N/A | N/A | (249 | ) | (5,426 | ) | ||||||||||||||||||||
| (14,021 | ) | (15,797 | ) | (246,378 | ) | (237,110 | ) | (77,834 | ) | (76,074 | ) | (4,842 | ) | (128,481 | ) | ||||||||||||||||
| 175,567 | 303,335 | 173,756 | 299,638 | 120,412 | 97,115 | 48,325 | 71,913 | ||||||||||||||||||||||||
| 13,307 | 15,028 | 184,450 | 182,965 | 68,757 | 66,695 | 4,270 | 114,411 | ||||||||||||||||||||||||
| (253,064 | ) | (302,229 | ) | (631,354 | ) | (609,242 | ) | (143,644 | ) | (191,252 | ) | (100,400 | ) | (114,277 | ) | ||||||||||||||||
| (64,190 | ) | 16,134 | (273,148 | ) | (126,639 | ) | 45,525 | (27,442 | ) | (47,805 | ) | 72,047 | |||||||||||||||||||
| N/A | N/A | N/A | N/A | 2,547 | 1,137 | N/A | N/A | ||||||||||||||||||||||||
| N/A | N/A | N/A | N/A | 442 | 441 | N/A | N/A | ||||||||||||||||||||||||
| N/A | N/A | N/A | N/A | (3,222 | ) | (2,208 | ) | N/A | N/A | ||||||||||||||||||||||
| N/A | N/A | N/A | N/A | (233 | ) | (630 | ) | N/A | N/A | ||||||||||||||||||||||
| N/A | N/A | 106,149 | 52,211 | N/A | N/A | 6,683 | 3,654 | ||||||||||||||||||||||||
| N/A | N/A | 27,562 | 26,149 | N/A | N/A | 236 | 5,232 | ||||||||||||||||||||||||
| N/A | N/A | (88,872 | ) | (67,364 | ) | N/A | N/A | (5,879 | ) | (6,836 | ) | ||||||||||||||||||||
| N/A | N/A | 44,839 | 10,996 | N/A | N/A | 1,040 | 2,050 | ||||||||||||||||||||||||
| (64,190 | ) | 16,134 | (228,309 | ) | (115,643 | ) | 45,292 | (28,072 | ) | (46,765 | ) | 74,097 | |||||||||||||||||||
| 107,685 | (188,430 | ) | 177,858 | (967,069 | ) | 120,638 | (242,620 | ) | 4,814 | (167,835 | ) | ||||||||||||||||||||
| 901,688 | 1,090,118 | 3,610,298 | 4,577,367 | 745,367 | 987,987 | 514,514 | 682,349 | ||||||||||||||||||||||||
| $ | 1,009,373 | $ | 901,688 | $ | 3,788,156 | $ | 3,610,298 | $ | 866,005 | $ | 745,367 | $ | 519,328 | $ | 514,514 | ||||||||||||||||
SEI Institutional Managed Trust
377
STATEMENTS OF CHANGES IN NET ASSETS ($ Thousands)
For the years ended September 30,
Small Cap Value Fund | Small Cap Growth Fund | Tax-Managed Small/Mid Cap Fund | ||||||||||||||||||||||
| 2023 | 2022 | 2023 | 2022 | 2023 | 2022 | |||||||||||||||||||
Operations: | ||||||||||||||||||||||||
Net investment income (loss) | $ | 4,694 | $ | 3,602 | $ | (1,021 | ) | $ | (588 | ) | $ | 3,713 | $ | 3,398 | ||||||||||
Net realized gain (loss) | 7,589 | 16,576 | (12,598 | ) | (7,380 | ) | 20,760 | 3,875 | ||||||||||||||||
Net change in unrealized appreciation (depreciation) | 36,943 | (91,145 | ) | 36,996 | (97,016 | ) | 56,592 | (193,182 | ) | |||||||||||||||
Net Increase (Decrease) in Net Assets Resulting from Operations | 49,226 | (70,967 | ) | 23,377 | (104,984 | ) | 81,065 | (185,909 | ) | |||||||||||||||
Distributions: | ||||||||||||||||||||||||
Class F: | (17,913 | ) | (28,963 | ) | (140 | ) | (81,068 | ) | (6,859 | ) | (85,601 | ) | ||||||||||||
Class I: | (49 | ) | (150 | ) | — | (380 | ) | N/A | N/A | |||||||||||||||
Class Y: | (3,645 | ) | (5,667 | ) | (104 | ) | (9,315 | ) | (1,114 | ) | (10,758 | ) | ||||||||||||
Total Distributions | (21,607 | ) | (34,780 | ) | (244 | ) | (90,763 | ) | (7,973 | ) | (96,359 | ) | ||||||||||||
Capital Share Transactions:(1) | ||||||||||||||||||||||||
Class F: | ||||||||||||||||||||||||
Proceeds from shares issued | 33,742 | 66,183 | 31,851 | 45,964 | 55,669 | 80,105 | ||||||||||||||||||
Reinvestment of dividends & distributions | 16,689 | 26,971 | 130 | 74,743 | 5,842 | 74,501 | ||||||||||||||||||
Cost of shares redeemed | (66,384 | ) | (80,336 | ) | (53,753 | ) | (51,627 | ) | (147,076 | ) | (129,864 | ) | ||||||||||||
Net increase (decrease) from Class F transactions | (15,953 | ) | 12,818 | (21,772 | ) | 69,080 | (85,565 | ) | 24,742 | |||||||||||||||
Class I: | ||||||||||||||||||||||||
Proceeds from shares issued | 35 | 80 | 121 | 209 | N/A | N/A | ||||||||||||||||||
Reinvestment of dividends & distributions | 44 | 142 | — | 350 | N/A | N/A | ||||||||||||||||||
Cost of shares redeemed | (470 | ) | (1,000 | ) | (683 | ) | (685 | ) | N/A | N/A | ||||||||||||||
Net increase (decrease) from Class I transactions | (391 | ) | (778 | ) | (562 | ) | (126 | ) | N/A | N/A | ||||||||||||||
Class Y: | ||||||||||||||||||||||||
Proceeds from shares issued | 10,097 | 10,199 | 7,367 | 5,555 | 21,808 | 10,162 | ||||||||||||||||||
Reinvestment of dividends & distributions | 3,519 | 5,281 | 100 | 8,670 | 1,020 | 10,054 | ||||||||||||||||||
Cost of shares redeemed | (29,680 | ) | (7,967 | ) | (10,177 | ) | (5,884 | ) | (17,984 | ) | (12,217 | ) | ||||||||||||
Net increase (decrease) from Class Y transactions | (16,064 | ) | 7,513 | (2,710 | ) | 8,341 | 4,844 | 7,999 | ||||||||||||||||
Increase (Decrease) in Net Assets Derived from Capital Share Transactions | (32,408 | ) | 19,553 | (25,044 | ) | 77,295 | (80,721 | ) | �� | 32,741 | ||||||||||||||
Net Increase (Decrease) in Net Assets | (4,789 | ) | (86,194 | ) | (1,911 | ) | (118,452 | ) | (7,629 | ) | (249,527 | ) | ||||||||||||
Net Assets | ||||||||||||||||||||||||
Beginning of year | 347,839 | 434,033 | 309,953 | 428,405 | 780,749 | 1,030,276 | ||||||||||||||||||
End of year | $ | 343,050 | $ | 347,839 | $ | 308,042 | $ | 309,953 | $ | 773,120 | $ | 780,749 | ||||||||||||
(1) | See Note 7 in Notes to Financial Statements for additional information. |
|
N/A — Not applicable. Shares currently not offered.
Amounts designated as “—” are either $0 or have been rounded to $0.
The accompanying notes are an integral part of the financial statements.
378
SEI Institutional Managed Trust
Mid-Cap Fund | U.S. Managed Volatility Fund | Global Managed Volatility Fund | Tax-Managed Managed Volatility Fund | Tax-Managed International Managed Volatility Fund | |||||||||||||||||||||||||||||||||||
| 2023 | 2022 | 2023 | 2022 | 2023 | 2022 | 2023 | 2022 | 2023 | 2022 | ||||||||||||||||||||||||||||||
| $ | 462 | $ | 554 | $ | 14,726 | $ | 16,905 | $ | 14,679 | $ | 13,451 | $ | 8,629 | $ | 9,962 | $ | 8,987 | $ | 11,095 | ||||||||||||||||||||
| (2,683 | ) | (960 | ) | 72,322 | 76,648 | 27,465 | 74,274 | 100,515 | 49,297 | (9,497 | ) | (7,972 | ) | ||||||||||||||||||||||||||
| 10,385 | (12,428 | ) | (2,484 | ) | (139,047 | ) | 58,320 | (166,756 | ) | (13,169 | ) | (74,192 | ) | 60,591 | (81,538 | ) | |||||||||||||||||||||||
| 8,164 | (12,834 | ) | 84,564 | (45,494 | ) | 100,464 | (79,031 | ) | 95,975 | (14,933 | ) | 60,081 | (78,415 | ) | |||||||||||||||||||||||||
| (499 | ) | (17,821 | ) | (69,027 | ) | (74,613 | ) | (73,644 | ) | (99,371 | ) | (51,719 | ) | (44,793 | ) | (7,560 | ) | (10,683 | ) | ||||||||||||||||||||
| (2 | ) | (119 | ) | (56 | ) | (119 | ) | (46 | ) | (117 | ) | N/A | N/A | N/A | N/A | ||||||||||||||||||||||||
| (38 | ) | (702 | ) | (17,547 | ) | (20,458 | ) | (11,197 | ) | (14,771 | ) | (5,716 | ) | (4,339 | ) | (1,396 | ) | (1,958 | ) | ||||||||||||||||||||
| (539 | ) | (18,642 | ) | (86,630 | ) | (95,190 | ) | (84,887 | ) | (114,259 | ) | (57,435 | ) | (49,132 | ) | (8,956 | ) | (12,641 | ) | ||||||||||||||||||||
| 11,051 | 44,463 | 88,799 | 130,696 | 87,777 | 111,073 | 68,223 | 111,375 | 50,744 | 55,878 | ||||||||||||||||||||||||||||||
| 464 | 16,597 | 58,465 | 63,699 | 62,439 | 84,681 | 42,102 | 37,742 | 6,387 | 9,216 | ||||||||||||||||||||||||||||||
| (14,291 | ) | (44,477 | ) | (211,518 | ) | (189,071 | ) | (211,642 | ) | (198,493 | ) | (233,709 | ) | (223,539 | ) | (101,616 | ) | (74,475 | ) | ||||||||||||||||||||
| (2,776 | ) | 16,583 | (64,254 | ) | 5,324 | (61,426 | ) | (2,739 | ) | (123,384 | ) | (74,422 | ) | (44,485 | ) | (9,381 | ) | ||||||||||||||||||||||
| 10 | 109 | — | 8 | — | 8 | N/A | N/A | N/A | N/A | ||||||||||||||||||||||||||||||
| 2 | 118 | 55 | 119 | 45 | 116 | N/A | N/A | N/A | N/A | ||||||||||||||||||||||||||||||
| (50 | ) | (410 | ) | — | (844 | ) | — | (605 | ) | N/A | N/A | N/A | N/A | ||||||||||||||||||||||||||
| (38 | ) | (183 | ) | 55 | (717 | ) | 45 | (481 | ) | N/A | N/A | N/A | N/A | ||||||||||||||||||||||||||
| 918 | 1,412 | 35,141 | 17,409 | 35,591 | 18,351 | 37,706 | 10,885 | 28,774 | 7,289 | ||||||||||||||||||||||||||||||
| 38 | 696 | 15,492 | 18,535 | 9,232 | 12,865 | 4,945 | 3,848 | 1,292 | 1,685 | ||||||||||||||||||||||||||||||
| (518 | ) | (862 | ) | (37,085 | ) | (54,045 | ) | (33,751 | ) | (28,874 | ) | (18,214 | ) | (14,652 | ) | (21,579 | ) | (11,416 | ) | ||||||||||||||||||||
| 438 | 1,246 | 13,548 | (18,101 | ) | 11,072 | 2,342 | 24,437 | 81 | 8,487 | (2,442 | ) | ||||||||||||||||||||||||||||
| (2,376 | ) | 17,646 | (50,651 | ) | (13,494 | ) | (50,309 | ) | (878 | ) | (98,947 | ) | (74,341 | ) | (35,998 | ) | (11,823 | ) | |||||||||||||||||||||
| 5,249 | (13,830 | ) | (52,717 | ) | (154,178 | ) | (34,732 | ) | (194,168 | ) | (60,407 | ) | (138,406 | ) | 15,127 | (102,879 | ) | ||||||||||||||||||||||
| 68,994 | 82,824 | 797,442 | 951,620 | 816,386 | 1,010,554 | 865,674 | 1,004,080 | 292,604 | 395,483 | ||||||||||||||||||||||||||||||
| $ | 74,243 | $ | 68,994 | $ | 744,725 | $ | 797,442 | $ | 781,654 | $ | 816,386 | $ | 805,267 | $ | 865,674 | $ | 307,731 | $ | 292,604 | ||||||||||||||||||||
SEI Institutional Managed Trust
379
STATEMENTS OF CHANGES IN NET ASSETS/CONSOLIDATED STATEMENTS OF CHANGES IN NET ASSETS ($ Thousands)
For the years ended September 30,
Real Estate Fund | Core Fixed Income Fund | High Yield Bond Fund | ||||||||||||||||||||||
| 2023 | 2022 | 2023 | 2022 | 2023 | 2022 | |||||||||||||||||||
Operations: | ||||||||||||||||||||||||
Net investment income | $ | 1,208 | $ | 1,020 | $ | 124,711 | $ | 79,457 | $ | 93,713 | $ | 73,878 | ||||||||||||
Capital gain distribution from investment | — | — | — | 4 | — | 1 | ||||||||||||||||||
Net realized gain (loss) | 392 | 4,757 | (240,595 | ) | (283,960 | ) | (71,507 | ) | (18,628 | ) | ||||||||||||||
Net change in unrealized appreciation (depreciation) | 680 | (22,939 | ) | 141,414 | (551,107 | ) | 93,008 | (253,960 | ) | |||||||||||||||
Net Increase (Decrease) in Net Assets Resulting from Operations | 2,280 | (17,162 | ) | 25,530 | (755,606 | ) | 115,214 | (198,709 | ) | |||||||||||||||
Distributions: | ||||||||||||||||||||||||
Class F: | (2,988 | ) | (7,139 | ) | (105,097 | ) | (82,466 | ) | (159,073 | ) | (89,328 | ) | ||||||||||||
Class I: | (8 | ) | (30 | ) | (92 | ) | (85 | ) | — | (15 | ) | |||||||||||||
Class Y: | (709 | ) | (1,354 | ) | (14,887 | ) | (11,442 | ) | (22,895 | ) | (13,180 | ) | ||||||||||||
Return of Capital: | ||||||||||||||||||||||||
Class F | — | — | — | — | (15,784 | ) | — | |||||||||||||||||
Class Y | — | — | — | — | (2,423 | ) | — | |||||||||||||||||
Total Distributions | (3,705 | ) | (8,523 | ) | (120,076 | ) | (93,993 | ) | (200,175 | ) | (102,523 | ) | ||||||||||||
Capital Share Transactions:(1) | ||||||||||||||||||||||||
Class F: | ||||||||||||||||||||||||
Proceeds from shares issued | 7,178 | 34,788 | 484,446 | 674,455 | 194,492 | 241,315 | ||||||||||||||||||
Reinvestment of dividends & distributions | 2,675 | 6,464 | 96,494 | 75,249 | 154,550 | 79,075 | ||||||||||||||||||
Cost of shares redeemed | (14,747 | ) | (42,936 | ) | (723,326 | ) | (904,145 | ) | (316,778 | ) | (372,248 | ) | ||||||||||||
Net increase (decrease) from Class F transactions | (4,894 | ) | (1,684 | ) | (142,386 | ) | (154,441 | ) | 32,264 | (51,858 | ) | |||||||||||||
Class I: | ||||||||||||||||||||||||
Proceeds from shares issued | 1 | 4 | 188 | 335 | — | 5 | ||||||||||||||||||
Reinvestment of dividends & distributions | 8 | 30 | 67 | 67 | 1 | 16 | ||||||||||||||||||
Cost of shares redeemed | — | (235 | ) | (907 | ) | (1,234 | ) | — | (576 | ) | ||||||||||||||
Net increase (decrease) from Class I transactions | 9 | (201 | ) | (652 | ) | (832 | ) | 1 | (555 | ) | ||||||||||||||
Class Y: | ||||||||||||||||||||||||
Proceeds from shares issued | 1,450 | 2,448 | 108,262 | 72,075 | 55,587 | 37,252 | ||||||||||||||||||
Reinvestment of dividends & distributions | 691 | 1,298 | 14,522 | 11,112 | 24,773 | 12,850 | ||||||||||||||||||
Cost of shares redeemed | (2,788 | ) | (4,344 | ) | (135,428 | ) | (80,320 | ) | (73,565 | ) | (48,456 | ) | ||||||||||||
Net increase (decrease) from Class Y transactions | (647 | ) | (598 | ) | (12,644 | ) | 2,867 | 6,795 | 1,646 | |||||||||||||||
Increase (Decrease) in Net Assets Derived from Capital Share Transactions | (5,532 | ) | (2,483 | ) | (155,682 | ) | (152,406 | ) | 39,060 | (50,767 | ) | |||||||||||||
Net Increase (Decrease) in Net Assets | (6,957 | ) | (28,168 | ) | (250,228 | ) | (1,002,005 | ) | (45,901 | ) | (351,999 | ) | ||||||||||||
Net Assets | ||||||||||||||||||||||||
Beginning of year | 75,163 | 103,331 | 3,605,696 | 4,607,701 | 1,274,904 | 1,626,903 | ||||||||||||||||||
End of year | $ | 68,206 | $ | 75,163 | $ | 3,355,468 | $ | 3,605,696 | $ | 1,229,003 | $ | 1,274,904 | ||||||||||||
(1) | See Note 7 in Notes to Financial Statements for additional information. |
N/A — Not applicable. Shares currently not offered.
Amounts designated as “—” are either $0 or have been rounded to $0.
The accompanying notes are an integral part of the financial statements.
380
SEI Institutional Managed Trust
Conservative Income Fund | Tax-Free Conservative Income Fund | Real Return Fund | Dynamic Asset Allocation Fund | ||||||||||||||||||||||||||||
| 2023 | 2022 | 2023 | 2022 | 2023 | 2022 | 2023 | 2022 | ||||||||||||||||||||||||
| $ | 18,702 | $ | 2,072 | $ | 4,638 | $ | 748 | $ | 5,304 | $ | 18,918 | $ | 8,708 | $ | 5,060 | ||||||||||||||||
| — | — | — | — | — | — | — | — | ||||||||||||||||||||||||
| 14 | 5 | — | 1 | (7,801 | ) | (183 | ) | 52,681 | 83,108 | ||||||||||||||||||||||
| 11 | (87 | ) | 108 | (168 | ) | 8,424 | (31,793 | ) | 47,536 | (181,567 | ) | ||||||||||||||||||||
| 18,727 | 1,990 | 4,746 | 581 | 5,927 | (13,058 | ) | 108,925 | (93,399 | ) | ||||||||||||||||||||||
| (18,067 | ) | (1,944 | ) | (4,512 | ) | (698 | ) | (10,924 | ) | (15,792 | ) | (79,107 | ) | (84,694 | ) | ||||||||||||||||
| N/A | N/A | N/A | N/A | N/A | N/A | N/A | N/A | ||||||||||||||||||||||||
| (609 | ) | (98 | ) | (126 | ) | (33 | ) | (784 | ) | (1,141 | ) | (4,735 | ) | (4,926 | ) | ||||||||||||||||
| — | — | — | — | — | — | — | — | ||||||||||||||||||||||||
| — | — | — | — | — | — | — | — | ||||||||||||||||||||||||
| (18,676 | ) | (2,042 | ) | (4,638 | ) | (731 | ) | (11,708 | ) | (16,933 | ) | (83,842 | ) | (89,620 | ) | ||||||||||||||||
| 365,408 | 234,776 | 52,126 | 66,380 | 40,950 | 109,238 | 73,864 | 83,921 | ||||||||||||||||||||||||
| 14,691 | 1,495 | 3,680 | 581 | 8,963 | 12,967 | 73,416 | 78,820 | ||||||||||||||||||||||||
| (261,048 | ) | (160,921 | ) | (68,797 | ) | (73,634 | ) | (102,122 | ) | (81,437 | ) | (128,344 | ) | (208,511 | ) | ||||||||||||||||
| 119,051 | 75,350 | (12,991 | ) | (6,673 | ) | (52,209 | ) | 40,768 | 18,936 | (45,770 | ) | ||||||||||||||||||||
| N/A | N/A | N/A | N/A | N/A | N/A | N/A | N/A | ||||||||||||||||||||||||
| N/A | N/A | N/A | N/A | N/A | N/A | N/A | N/A | ||||||||||||||||||||||||
| N/A | N/A | N/A | N/A | N/A | N/A | N/A | N/A | ||||||||||||||||||||||||
| N/A | N/A | N/A | N/A | N/A | N/A | N/A | N/A | ||||||||||||||||||||||||
| 6,694 | 5,123 | 2,221 | 8,200 | 3,939 | 4,179 | 8,790 | 6,378 | ||||||||||||||||||||||||
| 570 | 93 | 117 | 31 | 738 | 1,082 | 4,616 | 4,823 | ||||||||||||||||||||||||
| (7,343 | ) | (6,877 | ) | (3,260 | ) | (12,607 | ) | (6,781 | ) | (4,514 | ) | (8,146 | ) | (12,907 | ) | ||||||||||||||||
| (79 | ) | (1,661 | ) | (922 | ) | (4,376 | ) | (2,104 | ) | 747 | 5,260 | (1,706 | ) | ||||||||||||||||||
| 118,972 | 73,689 | (13,913 | ) | (11,049 | ) | (54,313 | ) | 41,515 | 24,196 | (47,476 | ) | ||||||||||||||||||||
| 119,023 | 73,637 | (13,805 | ) | (11,199 | ) | (60,094 | ) | 11,524 | 49,279 | (230,495 | ) | ||||||||||||||||||||
| 360,280 | 286,643 | 181,700 | 192,899 | 257,774 | 246,250 | 633,458 | 863,953 | ||||||||||||||||||||||||
| $ | 479,303 | $ | 360,280 | $ | 167,895 | $ | 181,700 | $ | 197,680 | $ | 257,774 | $ | 682,737 | $ | 633,458 | ||||||||||||||||
SEI Institutional Managed Trust
381
STATEMENTS OF CHANGES IN NET ASSETS/CONSOLIDATED STATEMENTS OF CHANGES IN NET ASSETS ($ Thousands)
For the years or period ended September 30,
Multi-Strategy Alternative Fund | Liquid Alternative Fund(1) | |||||||||||
| 2023 | 2022 | 2023 | ||||||||||
Operations: | ||||||||||||
Net investment income | $ | 15,304 | $ | 3,636 | $ | 108 | ||||||
Capital gain distribution from investment | — | 2 | — | |||||||||
Net realized gain (loss) | (6,235 | ) | (11,608 | ) | (52 | ) | ||||||
Net change in unrealized appreciation (depreciation) | 11,759 | (24,218 | ) | 132 | ||||||||
Net Increase (Decrease) in Net Assets Resulting from Operations | 20,828 | (32,188 | ) | 188 | ||||||||
Distributions: | ||||||||||||
Class F: | (8,221 | ) | (31,913 | ) | — | |||||||
Class Y: | (190 | ) | (651 | ) | — | |||||||
Total Distributions | (8,411 | ) | (32,564 | ) | — | |||||||
Capital Share Transactions:(2) | ||||||||||||
Class F: | ||||||||||||
Proceeds from shares issued | 36,509 | 56,599 | 527 | |||||||||
Reinvestment of dividends & distributions | 7,370 | 28,632 | — | |||||||||
Cost of shares redeemed | (96,545 | ) | (76,788 | ) | — | |||||||
Net increase (decrease) from Class F transactions | (52,666 | ) | 8,443 | 527 | ||||||||
Class Y: | ||||||||||||
Proceeds from shares issued | 7,604 | 1,611 | 11,651 | |||||||||
Reinvestment of dividends & distributions | 176 | 615 | — | |||||||||
Cost of shares redeemed | (1,893 | ) | (1,491 | ) | (1,008 | ) | ||||||
Net increase (decrease) from Class Y transactions | 5,887 | 735 | 10,643 | |||||||||
Increase (Decrease) in Net Assets Derived from Capital Share Transactions | (46,779 | ) | 9,178 | 11,170 | ||||||||
Net Increase (Decrease) in Net Assets | (34,362 | ) | (55,574 | ) | 11,358 | |||||||
Net Assets | ||||||||||||
Beginning of year | 402,945 | 458,519 | — | |||||||||
End of year | $ | 368,583 | $ | 402,945 | $ | 11,358 | ||||||
(1) | Commenced operations on June 30, 2023. | ||
(2) | See Note 7 in Notes to Financial Statements for additional information. |
Amounts designated as “—” are either $0 or have been rounded to $0.
The accompanying notes are an integral part of the financial statements.
382
SEI Institutional Managed Trust
Multi-Asset Accumulation Fund | Multi-Asset Income Fund | Multi-Asset Inflation Managed Fund | Multi-Asset Capital Stability Fund | |||||||||||||||||||||||||||
| 2023 | 2022 | 2023 | 2022 | 2023 | 2022 | 2023 | 2022 | |||||||||||||||||||||||
| $ | 65,399 | $ | 31,471 | $ | 45,447 | $ | 36,848 | $ | 25,451 | $ | 33,404 | $ | 20,974 | $ | 1,920 | |||||||||||||||
| — | — | — | — | — | — | — | — | |||||||||||||||||||||||
| (113,649 | ) | (346,046 | ) | (23,369 | ) | 3,910 | (42,391 | ) | 49,635 | (10,868 | ) | (6,255 | ) | |||||||||||||||||
| 106,191 | (223,528 | ) | 33,553 | (183,279 | ) | 29,107 | (38,005 | ) | 16,299 | (25,351 | ) | |||||||||||||||||||
| 57,941 | (538,103 | ) | 55,631 | (142,521 | ) | 12,167 | 45,034 | 26,405 | (29,686 | ) | ||||||||||||||||||||
| (179,960 | ) | (319,256 | ) | (39,438 | ) | (29,430 | ) | (84,359 | ) | (58,859 | ) | (11,392 | ) | (18,556 | ) | |||||||||||||||
| (10,363 | ) | (24,540 | ) | (9,773 | ) | (7,046 | ) | (4,142 | ) | (3,253 | ) | (616 | ) | (1,084 | ) | |||||||||||||||
| (190,323 | ) | (343,796 | ) | (49,211 | ) | (36,476 | ) | (88,501 | ) | (62,112 | ) | (12,008 | ) | (19,640 | ) | |||||||||||||||
| 231,510 | 287,707 | 71,594 | 92,813 | 83,175 | 192,810 | 77,998 | 145,926 | |||||||||||||||||||||||
| 162,704 | 291,088 | 33,770 | 25,506 | 76,463 | 53,507 | 8,961 | 14,496 | |||||||||||||||||||||||
| (371,773 | ) | (378,794 | ) | (146,576 | ) | (164,750 | ) | (221,183 | ) | (250,560 | ) | (174,917 | ) | (170,164 | ) | |||||||||||||||
| 22,441 | 200,001 | (41,212 | ) | (46,431 | ) | (61,545 | ) | (4,243 | ) | (87,958 | ) | (9,742 | ) | |||||||||||||||||
| 36,023 | 22,797 | 20,808 | 18,241 | 7,712 | 4,229 | 3,204 | 4,063 | |||||||||||||||||||||||
| 10,041 | 24,167 | 9,191 | 6,305 | 4,022 | 3,181 | 590 | 1,051 | |||||||||||||||||||||||
| (87,982 | ) | (31,818 | ) | (41,539 | ) | (24,915 | ) | (12,289 | ) | (15,746 | ) | (7,469 | ) | (8,043 | ) | |||||||||||||||
| (41,918 | ) | 15,146 | (11,540 | ) | (369 | ) | (555 | ) | (8,336 | ) | (3,675 | ) | (2,929 | ) | ||||||||||||||||
| (19,477 | ) | 215,147 | (52,752 | ) | (46,800 | ) | (62,100 | ) | (12,579 | ) | (91,633 | ) | (12,671 | ) | ||||||||||||||||
| (151,859 | ) | (666,752 | ) | (46,332 | ) | (225,797 | ) | (138,434 | ) | (29,657 | ) | (77,236 | ) | (61,997 | ) | |||||||||||||||
| 2,033,087 | 2,699,839 | 706,164 | 931,961 | 818,127 | 847,784 | 658,806 | 720,803 | |||||||||||||||||||||||
| $ | 1,881,228 | $ | 2,033,087 | $ | 659,832 | $ | 706,164 | $ | 679,693 | $ | 818,127 | $ | 581,570 | $ | 658,806 | |||||||||||||||
SEI Institutional Managed Trust
383
CONSOLIDATED STATEMENT OF CASH FLOWS ($ Thousands)
For the year ended September 30, 2023
Multi-Asset Inflation Managed Fund | ||||
Cash Flows Provided By Operating Activities: | ||||
Net Increase in Net Assets Resulting from Operations | $ | 12,167 | ||
Adjustments to Reconcile Net Increase in Net Assets Resulting from Operations to Net Cash Provided by Operating Activities: | ||||
Purchase of Investment Securities | (1,235,972 | ) | ||
Proceeds from Disposition of Investment Securities | 1,400,793 | |||
Proceeds from Securities Sold Short | 50,825 | |||
Purchases to Cover Securities Sold Short | (97,356 | ) | ||
Amortization (Accretion of Market Discount) | (18,602 | ) | ||
Net Realized (Gain) Loss on: | ||||
Investments, Futures, Options, Swaps, Forward Contracts, Foreign Currency and Securities Sold Short | 42,391 | |||
Net Change in Unrealized (Appreciation) Depreciation on: | ||||
Investments, Futures, Options, Swaps, Forward Contracts, Foreign Currency and Securities Sold Short | (29,107 | ) | ||
Changes in Assets: | ||||
OTC Swap Contracts, at Value | 707 | |||
Cash Collateral on Over The Counter Swaps | 559 | |||
Cash Collateral on Centrally Cleared Swaps | 355 | |||
Cash Collateral on Futures | 3,673 | |||
Receivable for Investment Securities Sold | 3,447 | |||
Dividends and Interest Receivable | 258 | |||
Receivable for Variation Margin on Futures | 271 | |||
Receivable for Variation Margin on Swaps | 270 | |||
Foreign Tax Reclaim receivable | 6 | |||
Unrealized Loss on Forward Foreign Currency Contracts | (103 | ) | ||
Due from Broker | 457 | |||
Prepaid expenses | (2 | ) | ||
Changes in Liabilities: | ||||
OTC Swap Contracts, at Value | (3,913 | ) | ||
Options, Written at Value | (579 | ) | ||
Payable for Investment Securities Purchased | (11,745 | ) | ||
Administration Fees Payable | (49 | ) | ||
Shareholder Servicing Fees Payable | 135 | |||
Payable for Variation Margin on Futures | 198 | |||
Payable for Variation Margin on Swaps | (79 | ) | ||
Repurchase Agreements Payable | 2 | |||
Investment Advisory Fees Payable | (43 | ) | ||
Due to Broker | (2,281 | ) | ||
Unrealized Gain on Forward Foreign Currency Contracts | (59 | ) | ||
Accrued Expense Payable | (184 | ) | ||
Net Cash Provided by Operating Activities | 116,440 | |||
Cash Flows Used In Financing Activities | ||||
Reverse Repurchase Agreements | 5,846 | |||
Dividends and Distributions | (88,501 | ) | ||
Reinvestment of Dividends and Distributions | 80,485 | |||
Proceeds from Shares Issued | 90,715 | |||
Cost of Shares Redeemed | (233,866 | ) | ||
Net Cash Used In Financing Activities | (145,321 | ) | ||
Net Change in Cash, Restricted Cash, and Foreign Currency | (28,881 | ) | ||
Cash, Restricted Cash, and Foreign Currency at Beginning of Period | $ | 137,117 | ||
Cash, Restricted Cash, and Foreign Currency at End of Period | $ | 108,236 | ||
Supplemental Disclosure of Cash Flow Information Interest paid | $ | 10,279 | ||
The accompanying notes are an integral part of the financial statements.
384
SEI Institutional Managed Trust
FINANCIAL HIGHLIGHTS
For the years or periods ended September 30, (unless otherwise indicated)
For a share outstanding throughout each period
Net Asset | Net | Net Realized | Total | Distributions | Distributions | Total | Net Asset | Total | Net Assets | Ratio of Net | Ratio of Expenses | Ratio of Net | Portfolio | |||||||||||||||||||||||||||||||||||||||||||
Large Cap Fund | ||||||||||||||||||||||||||||||||||||||||||||||||||||||||
Class F | ||||||||||||||||||||||||||||||||||||||||||||||||||||||||
2023 | $ | 12.66 | $ | 0.12 | $ | 2.09 | $ | 2.21 | $ | (0.09 | ) | $ | (1.23 | ) | $ | (1.32 | ) | $ | 13.55 | 18.19 | % | $ | 1,565,195 | 0.89 | % | 0.97 | % | 0.89 | % | 26 | % | |||||||||||||||||||||||||
2022 | 17.51 | 0.12 | (2.62 | ) | (2.50 | ) | (0.10 | ) | (2.25 | ) | (2.35 | ) | 12.66 | (17.25 | ) | 1,519,963 | 0.89 | 0.95 | 0.75 | 39 | ||||||||||||||||||||||||||||||||||||
2021 | 13.95 | 0.10 | 4.00 | 4.10 | (0.12 | ) | (0.42 | ) | (0.54 | ) | 17.51 | 29.93 | 2,050,558 | 0.89 | 0.95 | 0.63 | 33 | |||||||||||||||||||||||||||||||||||||||
2020 | 13.94 | 0.16 | 0.89 | 1.05 | (0.18 | ) | (0.86 | ) | (1.04 | ) | 13.95 | 7.67 | 1,944,209 | 0.89 | 0.96 | 1.16 | 63 | |||||||||||||||||||||||||||||||||||||||
2019 | 15.92 | 0.19 | (0.22 | ) | (0.03 | ) | (0.18 | ) | (1.77 | ) | (1.95 | ) | 13.94 | 1.17 | 2,158,883 | 0.89 | 0.95 | 1.37 | 72 | |||||||||||||||||||||||||||||||||||||
Class Y | ||||||||||||||||||||||||||||||||||||||||||||||||||||||||
2023 | $ | 12.66 | $ | 0.15 | $ | 2.11 | $ | 2.26 | $ | (0.12 | ) | $ | (1.23 | ) | $ | (1.35 | ) | $ | 13.57 | 18.59 | % | $ | 52,696 | 0.64 | % | 0.72 | % | 1.14 | % | 26 | % | |||||||||||||||||||||||||
2022 | 17.52 | 0.15 | (2.62 | ) | (2.47 | ) | (0.14 | ) | (2.25 | ) | (2.39 | ) | 12.66 | (17.08 | ) | 49,941 | 0.64 | 0.70 | 0.95 | 39 | ||||||||||||||||||||||||||||||||||||
2021 | 13.95 | 0.15 | 4.00 | 4.15 | (0.16 | ) | (0.42 | ) | (0.58 | ) | 17.52 | 30.33 | 109,909 | 0.64 | 0.70 | 0.88 | 33 | |||||||||||||||||||||||||||||||||||||||
2020 | 13.95 | 0.19 | 0.89 | 1.08 | (0.22 | ) | (0.86 | ) | (1.08 | ) | 13.95 | 7.86 | 103,168 | 0.64 | 0.71 | 1.41 | 63 | |||||||||||||||||||||||||||||||||||||||
2019 | 15.93 | 0.22 | (0.22 | ) | — | (0.21 | ) | (1.77 | ) | (1.98 | ) | 13.95 | 1.44 | 131,736 | 0.64 | 0.70 | 1.62 | 72 | ||||||||||||||||||||||||||||||||||||||
Large Cap Value Fund | ||||||||||||||||||||||||||||||||||||||||||||||||||||||||
Class F | ||||||||||||||||||||||||||||||||||||||||||||||||||||||||
2023 | $ | 23.02 | $ | 0.52 | $ | 2.70 | $ | 3.22 | $ | (0.61 | ) | $ | (1.77 | ) | $ | (2.38 | ) | $ | 23.86 | 14.03 | % | $ | 1,110,985 | 0.89 | % | 0.93 | % | 2.11 | % | 22 | % | |||||||||||||||||||||||||
2022 | 27.27 | 0.49 | (3.07 | ) | (2.58 | ) | (0.48 | ) | (1.19 | ) | (1.67 | ) | 23.02 | (10.30 | ) | 1,068,126 | 0.89 | 0.93 | 1.81 | 24 | ||||||||||||||||||||||||||||||||||||
2021 | 20.11 | 0.46 | 7.16 | 7.62 | (0.46 | ) | — | (0.46 | ) | 27.27 | 38.21 | 1,322,518 | 0.89 | 0.93 | 1.80 | 29 | ||||||||||||||||||||||||||||||||||||||||
2020 | 23.25 | 0.45 | (2.70 | ) | (2.25 | ) | (0.46 | ) | (0.43 | ) | (0.89 | ) | 20.11 | (9.96 | ) | 1,097,338 | 0.89 | 0.93 | 2.15 | 65 | ||||||||||||||||||||||||||||||||||||
2019 | 26.21 | 0.50 | (0.92 | ) | (0.42 | ) | (0.48 | ) | (2.06 | ) | (2.54 | ) | 23.25 | (0.91 | ) | 1,190,700 | 0.89 | 0.93 | 2.17 | 52 | ||||||||||||||||||||||||||||||||||||
Class I | ||||||||||||||||||||||||||||||||||||||||||||||||||||||||
2023 | $ | 23.05 | $ | 0.46 | $ | 2.72 | $ | 3.18 | $ | (0.56 | ) | $ | (1.77 | ) | $ | (2.33 | ) | $ | 23.90 | 13.79 | % | $ | 1,323 | 1.11 | % | 1.18 | % | 1.87 | % | 22 | % | |||||||||||||||||||||||||
2022 | 27.30 | 0.43 | (3.07 | ) | (2.64 | ) | (0.42 | ) | (1.19 | ) | (1.61 | ) | 23.05 | (10.52 | ) | 2,111 | 1.11 | 1.18 | 1.57 | 24 | ||||||||||||||||||||||||||||||||||||
2021 | 20.13 | 0.40 | 7.18 | 7.58 | (0.41 | ) | — | (0.41 | ) | 27.30 | 37.93 | 3,060 | 1.11 | 1.18 | 1.58 | 29 | ||||||||||||||||||||||||||||||||||||||||
2020 | 23.27 | 0.41 | (2.71 | ) | (2.30 | ) | (0.41 | ) | (0.43 | ) | (0.84 | ) | 20.13 | (10.17 | ) | 2,454 | 1.11 | 1.18 | 1.93 | 65 | ||||||||||||||||||||||||||||||||||||
2019 | 26.23 | 0.45 | (0.93 | ) | (0.48 | ) | (0.42 | ) | (2.06 | ) | (2.48 | ) | 23.27 | (1.14 | ) | 3,042 | 1.11 | 1.18 | 1.95 | 52 | ||||||||||||||||||||||||||||||||||||
Class Y | ||||||||||||||||||||||||||||||||||||||||||||||||||||||||
2023 | $ | 23.02 | $ | 0.58 | $ | 2.70 | $ | 3.28 | $ | (0.67 | ) | $ | (1.77 | ) | $ | (2.44 | ) | $ | 23.86 | 14.32 | % | $ | 124,219 | 0.64 | % | 0.68 | % | 2.35 | % | 22 | % | |||||||||||||||||||||||||
2022 | 27.27 | 0.56 | (3.07 | ) | (2.51 | ) | (0.55 | ) | (1.19 | ) | (1.74 | ) | 23.02 | (10.06 | ) | 174,123 | 0.64 | 0.68 | 2.06 | 24 | ||||||||||||||||||||||||||||||||||||
2021 | 20.11 | 0.52 | 7.16 | 7.68 | (0.52 | ) | — | (0.52 | ) | 27.27 | 38.55 | 203,964 | 0.64 | 0.68 | 2.05 | 29 | ||||||||||||||||||||||||||||||||||||||||
2020 | 23.26 | 0.51 | (2.71 | ) | (2.20 | ) | (0.52 | ) | (0.43 | ) | (0.95 | ) | 20.11 | (9.76 | ) | 148,423 | 0.64 | 0.68 | 2.40 | 65 | ||||||||||||||||||||||||||||||||||||
2019 | 26.21 | 0.55 | (0.91 | ) | (0.36 | ) | (0.53 | ) | (2.06 | ) | (2.59 | ) | 23.26 | (0.62 | ) | 150,772 | 0.64 | 0.69 | 2.41 | 52 | ||||||||||||||||||||||||||||||||||||
† | Returns and portfolio turnover rates are for the period indicated and have not been annualized. Returns do not reflect the deduction of taxes the shareholder would pay on fund distributions or redemption of fund shares. |
(1) | Per share calculated using average shares. |
Amounts designated as “—“are either $0 or have been rounded to $0.
The accompanying notes are an integral part of the financial statements.
SEI Institutional Managed Trust
385
FINANCIAL HIGHLIGHTS
For the years or periods ended September 30, (unless otherwise indicated)
For a share outstanding throughout each period
Net Asset | Net | Net Realized | Total | Distributions | Distributions | Total | Net Asset | Total | Net Assets | Ratio of Net | Ratio of Expenses | Ratio of Net | Portfolio | |||||||||||||||||||||||||||||||||||||||||||
Large Cap Growth Fund | ||||||||||||||||||||||||||||||||||||||||||||||||||||||||
Class F | ||||||||||||||||||||||||||||||||||||||||||||||||||||||||
2023 | $ | 34.86 | $ | 0.04 | $ | 8.46 | $ | 8.50 | $ | (0.04 | ) | $ | (2.68 | ) | $ | (2.72 | ) | $ | 40.64 | 25.88 | % | $ | 1,190,786 | 0.89 | % | 0.98 | % | 0.11 | % | 67 | % | |||||||||||||||||||||||||
2022 | 51.97 | (0.02 | ) | (10.34 | ) | (10.36 | ) | (0.01 | ) | (6.74 | ) | (6.75 | ) | 34.86 | (23.91 | ) | 1,110,117 | 0.89 | 0.97 | (0.04 | ) | 61 | ||||||||||||||||||||||||||||||||||
2021 | 45.29 | (0.13 | ) | 11.07 | 10.94 | (0.03 | ) | (4.23 | ) | (4.26 | ) | 51.97 | 25.80 | 1,515,191 | 0.89 | 0.97 | (0.26 | ) | 42 | |||||||||||||||||||||||||||||||||||||
2020 | 35.79 | 0.04 | 11.63 | 11.67 | (0.08 | ) | (2.09 | ) | (2.17 | ) | 45.29 | 34.07 | 1,395,858 | 0.89 | 0.98 | 0.11 | 58 | |||||||||||||||||||||||||||||||||||||||
2019 | 39.89 | 0.13 | 0.22 | 0.35 | (0.12 | ) | (4.33 | ) | (4.45 | ) | 35.79 | 2.43 | 1,314,152 | 0.89 | 0.98 | 0.36 | 88 | |||||||||||||||||||||||||||||||||||||||
Class I | ||||||||||||||||||||||||||||||||||||||||||||||||||||||||
2023 | $ | 33.49 | $ | (0.04 | ) | $ | 8.10 | $ | 8.06 | $ | (0.01 | ) | $ | (2.68 | ) | $ | (2.69 | ) | $ | 38.86 | 25.61 | % | $ | 1,913 | 1.11 | % | 1.23 | % | (0.10 | )% | 67 | % | ||||||||||||||||||||||||
2022 | 50.26 | (0.13 | ) | (9.90 | ) | (10.03 | ) | — | (6.74 | ) | (6.74 | ) | 33.49 | (24.08 | ) | 2,094 | 1.11 | 1.22 | (0.30 | ) | 61 | |||||||||||||||||||||||||||||||||||
2021 | 43.99 | (0.23 | ) | 10.73 | 10.50 | — | (4.23 | ) | (4.23 | ) | 50.26 | 25.53 | 4,178 | 1.11 | 1.22 | (0.49 | ) | 42 | ||||||||||||||||||||||||||||||||||||||
2020 | 34.86 | (0.04 | ) | 11.30 | 11.26 | (0.04 | ) | (2.09 | ) | (2.13 | ) | 43.99 | 33.75 | 3,239 | 1.11 | 1.23 | (0.12 | ) | 58 | |||||||||||||||||||||||||||||||||||||
2019 | 38.96 | 0.05 | 0.21 | 0.26 | (0.03 | ) | (4.33 | ) | (4.36 | ) | 34.86 | 2.22 | 2,643 | 1.11 | 1.16 | 0.14 | 88 | |||||||||||||||||||||||||||||||||||||||
Class Y | ||||||||||||||||||||||||||||||||||||||||||||||||||||||||
2023 | $ | 35.03 | $ | 0.14 | $ | 8.50 | $ | 8.64 | $ | (0.08 | ) | $ | (2.68 | ) | $ | (2.76 | ) | $ | 40.91 | 26.22 | % | $ | 143,901 | 0.64 | % | 0.73 | % | 0.37 | % | 67 | % | |||||||||||||||||||||||||
2022 | 52.11 | 0.10 | (10.41 | ) | (10.31 | ) | (0.03 | ) | (6.74 | ) | (6.77 | ) | 35.03 | (23.73 | ) | 187,533 | 0.64 | 0.72 | 0.22 | 61 | ||||||||||||||||||||||||||||||||||||
2021 | 45.35 | (0.01 | ) | 11.08 | 11.07 | (0.08 | ) | (4.23 | ) | (4.31 | ) | 52.11 | 26.10 | 223,901 | 0.64 | 0.72 | (0.02 | ) | 42 | |||||||||||||||||||||||||||||||||||||
2020 | 35.84 | 0.14 | 11.63 | 11.77 | (0.17 | ) | (2.09 | ) | (2.26 | ) | 45.35 | 34.39 | 170,883 | 0.64 | 0.73 | 0.36 | 58 | |||||||||||||||||||||||||||||||||||||||
2019 | 39.96 | 0.21 | 0.24 | 0.45 | (0.24 | ) | (4.33 | ) | (4.57 | ) | 35.84 | 2.70 | 157,270 | 0.64 | 0.73 | 0.60 | 88 | |||||||||||||||||||||||||||||||||||||||
Large Cap Index Fund | ||||||||||||||||||||||||||||||||||||||||||||||||||||||||
Class F | ||||||||||||||||||||||||||||||||||||||||||||||||||||||||
2023 | $ | 12.60 | $ | 0.20 | $ | 2.42 | $ | 2.62 | $ | (0.20 | ) | $ | — | $ | (0.20 | ) | $ | 15.02 | 20.90 | % | $ | 1,009,373 | 0.25 | % | 0.63 | % | 1.38 | % | 7 | % | ||||||||||||||||||||||||||
2022 | 15.47 | 0.18 | (2.82 | ) | (2.64 | ) | (0.18 | ) | (0.05 | ) | (0.23 | ) | 12.60 | (17.38 | ) | 901,688 | 0.25 | 0.64 | 1.20 | 13 | ||||||||||||||||||||||||||||||||||||
2021 | 11.98 | 0.17 | 3.48 | 3.65 | (0.16 | ) | — | (0.16 | ) | 15.47 | 30.64 | 1,090,118 | 0.25 | 0.64 | 1.18 | 9 | ||||||||||||||||||||||||||||||||||||||||
2020 | 10.54 | 0.17 | 1.46 | 1.63 | (0.17 | ) | (0.02 | ) | (0.19 | ) | 11.98 | 15.67 | 706,457 | 0.25 | 0.64 | 1.52 | 8 | |||||||||||||||||||||||||||||||||||||||
2019 | 10.37 | 0.18 | 0.18 | 0.36 | (0.17 | ) | (0.02 | ) | (0.19 | ) | 10.54 | 3.61 | 455,657 | 0.25 | 0.65 | 1.81 | 6 | |||||||||||||||||||||||||||||||||||||||
Tax-Managed Large Cap Fund | ||||||||||||||||||||||||||||||||||||||||||||||||||||||||
Class F | ||||||||||||||||||||||||||||||||||||||||||||||||||||||||
2023 | $ | 28.50 | $ | 0.31 | $ | 4.84 | $ | 5.15 | $ | (0.32 | ) | $ | (1.69 | ) | $ | (2.01 | ) | $ | 31.64 | 18.44 | % | $ | 3,266,630 | 0.89 | % | 0.90 | % | 0.98 | % | 15 | % | |||||||||||||||||||||||||
2022 | 35.12 | 0.31 | (5.11 | ) | (4.80 | ) | (0.29 | ) | (1.53 | ) | (1.82 | ) | 28.50 | (14.72 | ) | 3,182,189 | 0.89 | 0.89 | 0.91 | 22 | ||||||||||||||||||||||||||||||||||||
2021 | 27.26 | 0.29 | 8.28 | 8.57 | (0.30 | ) | (0.41 | ) | (0.71 | ) | 35.12 | 31.84 | 4,061,063 | 0.89 | 0.89 | 0.90 | 14 | |||||||||||||||||||||||||||||||||||||||
2020 | 27.53 | 0.31 | 1.80 | 2.11 | (0.34 | ) | (2.04 | ) | (2.38 | ) | 27.26 | 7.84 | 3,368,577 | 0.89 | 0.91 | 1.19 | 40 | |||||||||||||||||||||||||||||||||||||||
2019 | 27.66 | 0.31 | 0.04 | 0.35 | (0.30 | ) | (0.18 | ) | (0.48 | ) | 27.53 | 1.42 | 3,543,245 | 0.89 | 0.91 | 1.20 | 54 | |||||||||||||||||||||||||||||||||||||||
Class Y | ||||||||||||||||||||||||||||||||||||||||||||||||||||||||
2023 | $ | 28.52 | $ | 0.39 | $ | 4.83 | $ | 5.22 | $ | (0.40 | ) | $ | (1.69 | ) | $ | (2.09 | ) | $ | 31.65 | 18.69 | % | $ | 521,526 | 0.64 | % | 0.65 | % | 1.23 | % | 15 | % | |||||||||||||||||||||||||
2022 | 35.14 | 0.40 | (5.11 | ) | (4.71 | ) | (0.38 | ) | (1.53 | ) | (1.91 | ) | 28.52 | (14.49 | ) | 428,109 | 0.64 | 0.64 | 1.16 | 22 | ||||||||||||||||||||||||||||||||||||
2021 | 27.27 | 0.37 | 8.28 | 8.65 | (0.37 | ) | (0.41 | ) | (0.78 | ) | 35.14 | 32.18 | 516,304 | 0.64 | 0.64 | 1.14 | 14 | |||||||||||||||||||||||||||||||||||||||
2020 | 27.54 | 0.38 | 1.80 | 2.18 | (0.41 | ) | (2.04 | ) | (2.45 | ) | 27.27 | 8.11 | 408,792 | 0.64 | 0.66 | 1.44 | 40 | |||||||||||||||||||||||||||||||||||||||
2019 | 27.67 | 0.38 | 0.04 | 0.42 | (0.37 | ) | (0.18 | ) | (0.55 | ) | 27.54 | 1.67 | 447,895 | 0.64 | 0.66 | 1.46 | 54 | |||||||||||||||||||||||||||||||||||||||
† | Returns and portfolio turnover rates are for the period indicated and have not been annualized. Returns do not reflect the deduction of taxes the shareholder would pay on fund distributions or redemption of fund shares. |
(1) | Per share calculated using average shares. |
Amounts designated as “—“are either $0 or have been rounded to $0.
The accompanying notes are an integral part of the financial statements.
386
SEI Institutional Managed Trust
FINANCIAL HIGHLIGHTS
For the years or periods ended September 30, (unless otherwise indicated)
For a share outstanding throughout each period
Net Asset | Net | Net Realized | Total | Distributions | Distributions | Total | Net Asset | Total | Net Assets | Ratio of Net | Ratio of Expenses | Ratio of Net | Portfolio | |||||||||||||||||||||||||||||||||||||||||||
S&P 500 Index Fund | ||||||||||||||||||||||||||||||||||||||||||||||||||||||||
Class F | ||||||||||||||||||||||||||||||||||||||||||||||||||||||||
2023 | $ | 72.34 | $ | 1.09 | $ | 13.50 | $ | 14.59 | $ | (1.09 | ) | $ | (6.56 | ) | $ | (7.65 | ) | $ | 79.28 | 21.31 | % | $ | 860,788 | 0.25 | % | 0.54 | % | 1.41 | % | 5 | % | |||||||||||||||||||||||||
2022 | 92.42 | 1.08 | (13.98 | ) | (12.90 | ) | (1.04 | ) | (6.14 | ) | (7.18 | ) | 72.34 | (15.68 | ) | 740,552 | 0.25 | 0.54 | 1.23 | 3 | ||||||||||||||||||||||||||||||||||||
2021 | 75.64 | 1.04 | 20.61 | 21.65 | (1.04 | ) | (3.83 | ) | (4.87 | ) | 92.42 | 29.73 | 981,074 | 0.25 | 0.54 | 1.20 | 5 | |||||||||||||||||||||||||||||||||||||||
2020 | 69.00 | 1.15 | 8.74 | 9.89 | (1.20 | ) | (2.05 | ) | (3.25 | ) | 75.64 | 14.82 | (2) | 844,753 | 0.25 | 0.54 | 1.64 | 19 | ||||||||||||||||||||||||||||||||||||||
2019 | 68.94 | 1.24 | 1.29 | 2.53 | (1.23 | ) | (1.24 | ) | (2.47 | ) | 69.00 | 4.07 | 826,946 | 0.25 | 0.54 | 1.90 | 11 | |||||||||||||||||||||||||||||||||||||||
Class I | ||||||||||||||||||||||||||||||||||||||||||||||||||||||||
2023 | $ | 72.85 | $ | 0.79 | $ | 13.61 | $ | 14.40 | $ | (0.79 | ) | $ | (6.56 | ) | $ | (7.35 | ) | $ | 79.90 | 20.83 | % | $ | 5,217 | 0.65 | % | 0.79 | % | 1.01 | % | 5 | % | |||||||||||||||||||||||||
2022 | 93.01 | 0.73 | (14.09 | ) | (13.36 | ) | (0.66 | ) | (6.14 | ) | (6.80 | ) | 72.85 | (16.02 | ) | 4,815 | 0.65 | 0.79 | 0.83 | 3 | ||||||||||||||||||||||||||||||||||||
2021 | 76.11 | 0.69 | 20.75 | 21.44 | (0.71 | ) | (3.83 | ) | (4.54 | ) | 93.01 | 29.21 | 6,913 | 0.65 | 0.79 | 0.80 | 5 | |||||||||||||||||||||||||||||||||||||||
2020 | 69.39 | 0.87 | 8.82 | 9.69 | (0.92 | ) | (2.05 | ) | (2.97 | ) | 76.11 | 14.37 | (2) | 5,331 | 0.65 | 0.79 | 1.23 | 19 | ||||||||||||||||||||||||||||||||||||||
2019 | 69.31 | 0.98 | 1.30 | 2.28 | (0.96 | ) | (1.24 | ) | (2.20 | ) | 69.39 | 3.66 | 5,322 | 0.65 | 0.79 | 1.49 | 11 | |||||||||||||||||||||||||||||||||||||||
Small Cap Fund | ||||||||||||||||||||||||||||||||||||||||||||||||||||||||
Class F | ||||||||||||||||||||||||||||||||||||||||||||||||||||||||
2023 | $ | 10.83 | $ | 0.04 | $ | 1.14 | $ | 1.18 | $ | (0.04 | ) | $ | (0.07 | ) | $ | (0.11 | ) | $ | 11.90 | 10.86 | % | $ | 495,148 | 1.14 | % | 1.23 | % | 0.29 | % | 106 | % | |||||||||||||||||||||||||
2022 | 16.29 | 0.04 | (2.34 | ) | (2.30 | ) | (0.01 | ) | (3.15 | ) | (3.16 | ) | 10.83 | (17.98 | ) | 493,393 | 1.14 | 1.23 | 0.28 | 111 | ||||||||||||||||||||||||||||||||||||
2021 | 10.74 | 0.01 | 5.56 | 5.57 | (0.02 | ) | — | (0.02 | ) | 16.29 | 51.86 | 653,372 | 1.14 | 1.23 | 0.09 | 139 | ||||||||||||||||||||||||||||||||||||||||
2020 | 11.05 | 0.02 | (0.31 | ) | (0.29 | ) | (0.02 | )(3) | — | (0.02 | ) | 10.74 | (2.60 | ) | 503,795 | 1.14 | 1.23 | 0.16 | 149 | |||||||||||||||||||||||||||||||||||||
2019 | 14.28 | 0.01 | (1.67 | ) | (1.66 | ) | (0.01 | ) | (1.56 | ) | (1.57 | ) | 11.05 | (10.85 | ) | 554,260 | 1.14 | 1.24 | 0.11 | 116 | ||||||||||||||||||||||||||||||||||||
Class Y | ||||||||||||||||||||||||||||||||||||||||||||||||||||||||
2023 | $ | 10.97 | $ | 0.07 | $ | 1.16 | $ | 1.23 | $ | (0.07 | ) | $ | (0.07 | ) | $ | (0.14 | ) | $ | 12.06 | 11.18 | % | $ | 24,180 | 0.89 | % | 0.98 | % | 0.54 | % | 106 | % | |||||||||||||||||||||||||
2022 | 16.46 | 0.07 | (2.36 | ) | (2.29 | ) | (0.05 | ) | (3.15 | ) | (3.20 | ) | 10.97 | (17.78 | ) | 21,121 | 0.89 | 0.98 | 0.52 | 111 | ||||||||||||||||||||||||||||||||||||
2021 | 10.85 | 0.05 | 5.60 | 5.65 | (0.04 | ) | — | (0.04 | ) | 16.46 | 52.15 | 28,977 | 0.89 | 0.98 | 0.34 | 139 | ||||||||||||||||||||||||||||||||||||||||
2020 | 11.15 | 0.04 | (0.29 | ) | (0.25 | ) | (0.05 | )(3) | — | (0.05 | ) | 10.85 | (2.23 | ) | 25,727 | 0.89 | 0.98 | 0.41 | 149 | |||||||||||||||||||||||||||||||||||||
2019 | 14.38 | 0.04 | (1.69 | ) | (1.65 | ) | (0.02 | ) | (1.56 | ) | (1.58 | ) | 11.15 | (10.66 | ) | 33,128 | 0.89 | 0.99 | 0.36 | 116 | ||||||||||||||||||||||||||||||||||||
† | Returns and portfolio turnover rates are for the period indicated and have not been annualized. Returns do not reflect the deduction of taxes the shareholder would pay on fund distributions or redemption of fund shares. |
(1) | Per share calculated using average shares. |
(2) | Includes contribution from SIMC. Without the cash contribution, the Fund's return for Class F and Class I would have been 14.78% and 14.33%, respectively (See Note 6 in the Notes to Financial Statements). |
(3) | Includes return of capital less than $0.005. |
Amounts designated as “—“ are either $0 or have been rounded to $0.
The accompanying notes are an integral part of the financial statements.
SEI Institutional Managed Trust
387
FINANCIAL HIGHLIGHTS
For the years or periods ended September 30, (unless otherwise indicated)
For a share outstanding throughout each period
Net Asset | Net | Net Realized | Total | Distributions | Distributions | Total | Net Asset | Total | Net Assets | Ratio of Net | Ratio of Expenses | Ratio of Net | Portfolio | |||||||||||||||||||||||||||||||||||||||||||
Small Cap Value Fund | ||||||||||||||||||||||||||||||||||||||||||||||||||||||||
Class F | ||||||||||||||||||||||||||||||||||||||||||||||||||||||||
2023 | $ | 20.77 | $ | 0.28 | $ | 2.60 | $ | 2.88 | $ | (0.28 | ) | $ | (1.03 | ) | $ | (1.31 | ) | $ | 22.34 | 13.98 | % | $ | 295,920 | 1.14 | % | 1.23 | % | 1.24 | % | 39 | % | |||||||||||||||||||||||||
2022 | 27.04 | 0.21 | (4.29 | ) | (4.08 | ) | (0.18 | ) | (2.01 | ) | (2.19 | ) | 20.77 | (16.59 | ) | 289,279 | 1.14 | 1.23 | 0.82 | 42 | ||||||||||||||||||||||||||||||||||||
2021 | 17.07 | 0.14 | 9.98 | 10.12 | (0.15 | ) | — | (0.15 | ) | 27.04 | 59.43 | 364,946 | 1.14 | 1.23 | 0.56 | 80 | ||||||||||||||||||||||||||||||||||||||||
2020 | 20.60 | 0.17 | (3.46 | ) | (3.29 | ) | (0.24 | ) | — | (0.24 | ) | 17.07 | (16.03 | ) | 250,718 | 1.14 | 1.24 | 0.91 | 65 | |||||||||||||||||||||||||||||||||||||
2019 | 25.54 | 0.27 | (2.86 | ) | (2.59 | ) | (0.25 | ) | (2.10 | ) | (2.35 | ) | 20.60 | (9.62 | ) | 274,660 | 1.14 | 1.24 | 1.30 | 74 | ||||||||||||||||||||||||||||||||||||
Class I | ||||||||||||||||||||||||||||||||||||||||||||||||||||||||
2023 | $ | 20.55 | $ | 0.23 | $ | 2.56 | $ | 2.79 | $ | (0.22 | ) | $ | (1.03 | ) | $ | (1.25 | ) | $ | 22.09 | 13.70 | % | $ | 481 | 1.36 | % | 1.48 | % | 1.01 | % | 39 | % | |||||||||||||||||||||||||
2022 | 26.76 | 0.13 | (4.21 | ) | (4.08 | ) | (0.12 | ) | (2.01 | ) | (2.13 | ) | 20.55 | (16.77 | ) | 819 | 1.36 | 1.48 | 0.53 | 42 | ||||||||||||||||||||||||||||||||||||
2021 | 16.90 | 0.09 | 9.87 | 9.96 | (0.10 | ) | — | (0.10 | ) | 26.76 | 59.05 | 1,900 | 1.36 | 1.48 | 0.35 | 80 | ||||||||||||||||||||||||||||||||||||||||
2020 | 20.39 | 0.12 | (3.42 | ) | (3.30 | ) | (0.19 | ) | — | (0.19 | ) | 16.90 | (16.20 | ) | 1,204 | 1.36 | 1.49 | 0.67 | 65 | |||||||||||||||||||||||||||||||||||||
2019 | 25.31 | 0.22 | (2.84 | ) | (2.62 | ) | (0.20 | ) | (2.10 | ) | (2.30 | ) | 20.39 | (9.83 | ) | 1,703 | 1.36 | 1.49 | 1.07 | 74 | ||||||||||||||||||||||||||||||||||||
Class Y | ||||||||||||||||||||||||||||||||||||||||||||||||||||||||
2023 | $ | 20.78 | $ | 0.33 | $ | 2.61 | $ | 2.94 | $ | (0.33 | ) | $ | (1.03 | ) | $ | (1.36 | ) | $ | 22.36 | 14.32 | % | $ | 46,649 | 0.89 | % | 0.98 | % | 1.46 | % | 39 | % | |||||||||||||||||||||||||
2022 | 27.06 | 0.27 | (4.29 | ) | (4.02 | ) | (0.25 | ) | (2.01 | ) | (2.26 | ) | 20.78 | (16.40 | ) | 57,741 | 0.89 | 0.98 | 1.07 | 42 | ||||||||||||||||||||||||||||||||||||
2021 | 17.08 | 0.20 | 9.99 | 10.19 | (0.21 | ) | — | (0.21 | ) | 27.06 | 59.84 | 67,188 | 0.89 | 0.98 | 0.82 | 80 | ||||||||||||||||||||||||||||||||||||||||
2020 | 20.61 | 0.21 | (3.46 | ) | (3.25 | ) | (0.28 | ) | — | (0.28 | ) | 17.08 | (15.80 | ) | 45,725 | 0.89 | 0.99 | 1.13 | 65 | |||||||||||||||||||||||||||||||||||||
2019 | 25.56 | 0.33 | (2.87 | ) | (2.54 | ) | (0.31 | ) | (2.10 | ) | (2.41 | ) | 20.61 | (9.42 | ) | 44,255 | 0.89 | 0.99 | 1.55 | 74 | ||||||||||||||||||||||||||||||||||||
Small Cap Growth Fund | ||||||||||||||||||||||||||||||||||||||||||||||||||||||||
Class F | ||||||||||||||||||||||||||||||||||||||||||||||||||||||||
2023 | $ | 27.01 | $ | (0.10 | ) | $ | 2.07 | $ | 1.97 | $ | (0.01 | ) | $ | — | $ | (0.01 | ) | $ | 28.97 | 7.31 | % | $ | 275,327 | 1.11 | % | 1.23 | % | (0.34 | )% | 175 | % | |||||||||||||||||||||||||
2022 | 45.89 | (0.06 | ) | (9.02 | ) | (9.08 | ) | — | (9.80 | ) | (9.80 | ) | 27.01 | (25.22 | ) | 276,600 | 1.11 | 1.23 | (0.18 | ) | 172 | |||||||||||||||||||||||||||||||||||
2021 | 32.60 | (0.20 | ) | 13.49 | 13.29 | — | — | — | 45.89 | 40.77 | 382,281 | 1.11 | 1.23 | (0.45 | ) | 196 | ||||||||||||||||||||||||||||||||||||||||
2020 | 31.88 | (0.12 | ) | 1.96 | 1.84 | — | (1.12 | ) | (1.12 | ) | 32.60 | 5.68 | 290,981 | 1.11 | 1.23 | (0.39 | ) | 173 | ||||||||||||||||||||||||||||||||||||||
2019 | 42.96 | (0.11 | ) | (6.04 | ) | (6.15 | ) | — | (4.93 | ) | (4.93 | ) | 31.88 | (13.89 | ) | 293,814 | 1.11 | 1.24 | (0.33 | ) | 172 | |||||||||||||||||||||||||||||||||||
Class I | ||||||||||||||||||||||||||||||||||||||||||||||||||||||||
2023 | $ | 25.02 | $ | (0.15 | ) | $ | 1.91 | $ | 1.76 | $ | — | $ | — | $ | — | $ | 26.78 | 7.03 | % | $ | 347 | 1.36 | % | 1.48 | % | (0.56 | )% | 175 | % | |||||||||||||||||||||||||||
2022 | 43.32 | (0.15 | ) | (8.35 | ) | (8.50 | ) | — | (9.80 | ) | (9.80 | ) | 25.02 | (25.41 | ) | 850 | 1.36 | 1.48 | (0.45 | ) | 172 | |||||||||||||||||||||||||||||||||||
2021 | 30.85 | (0.29 | ) | 12.76 | 12.47 | — | — | — | 43.32 | 40.42 | 1,717 | 1.36 | 1.48 | (0.70 | ) | 196 | ||||||||||||||||||||||||||||||||||||||||
2020 | 30.29 | (0.19 | ) | 1.87 | 1.68 | — | (1.12 | ) | (1.12 | ) | 30.85 | 5.44 | 1,245 | 1.36 | 1.48 | (0.64 | ) | 173 | ||||||||||||||||||||||||||||||||||||||
2019 | 41.21 | (0.19 | ) | (5.80 | ) | (5.99 | ) | — | (4.93 | ) | (4.93 | ) | 30.29 | (14.13 | ) | 1,408 | 1.36 | 1.49 | (0.59 | ) | 172 | |||||||||||||||||||||||||||||||||||
Class Y | ||||||||||||||||||||||||||||||||||||||||||||||||||||||||
2023 | $ | 27.66 | $ | (0.03 | ) | $ | 2.12 | $ | 2.09 | $ | (0.09 | ) | $ | — | $ | (0.09 | ) | $ | 29.66 | 7.58 | % | $ | 32,368 | 0.86 | % | 0.98 | % | (0.10 | )% | 175 | % | |||||||||||||||||||||||||
2022 | 46.65 | 0.02 | (9.21 | ) | (9.19 | ) | — | (9.80 | ) | (9.80 | ) | 27.66 | (25.01 | ) | 32,503 | 0.86 | 0.98 | 0.07 | 172 | |||||||||||||||||||||||||||||||||||||
2021 | 33.06 | (0.09 | ) | 13.68 | 13.59 | — | — | — | 46.65 | 41.11 | 44,407 | 0.86 | 0.98 | (0.20 | ) | 196 | ||||||||||||||||||||||||||||||||||||||||
2020 | 32.23 | (0.04 | ) | 1.99 | 1.95 | — | (1.12 | ) | (1.12 | ) | 33.06 | 5.97 | 32,593 | 0.86 | 0.98 | (0.14 | ) | 173 | ||||||||||||||||||||||||||||||||||||||
2019 | 43.27 | (0.03 | ) | (6.08 | ) | (6.11 | ) | — | (4.93 | ) | (4.93 | ) | 32.23 | (13.68 | ) | 33,340 | 0.86 | 0.99 | (0.08 | ) | 172 | |||||||||||||||||||||||||||||||||||
† | Returns and portfolio turnover rates are for the period indicated and have not been annualized. Returns do not reflect the deduction of taxes the shareholder would pay on fund distributions or redemption of fund shares. |
(1) | Per share calculated using average shares. |
Amounts designated as “—“ are either $0 or have been rounded to $0.
The accompanying notes are an integral part of the financial statements.
388
SEI Institutional Managed Trust
FINANCIAL HIGHLIGHTS
For the years or periods ended September 30, (unless otherwise indicated)
For a share outstanding throughout each period
Net Asset | Net | Net Realized | Total | Distributions | Distributions | Total | Net Asset | Total | Net Assets | Ratio of Net | Ratio of Expenses | Ratio of Net | Portfolio | |||||||||||||||||||||||||||||||||||||||||||
Tax-Managed Small/Mid Cap Fund | ||||||||||||||||||||||||||||||||||||||||||||||||||||||||
Class F | ||||||||||||||||||||||||||||||||||||||||||||||||||||||||
2023 | $ | 20.64 | $ | 0.10 | $ | 2.00 | $ | 2.10 | $ | (0.12 | ) | $ | (0.09 | ) | $ | (0.21 | ) | $ | 22.53 | 10.21 | % | $ | 671,322 | 1.11 | % | 1.23 | % | 0.43 | % | 62 | % | |||||||||||||||||||||||||
2022 | 28.01 | 0.08 | (4.83 | ) | (4.75 | ) | (0.05 | ) | (2.57 | ) | (2.62 | ) | 20.64 | (18.96 | ) | 691,835 | 1.11 | 1.23 | 0.33 | 58 | ||||||||||||||||||||||||||||||||||||
2021 | 19.41 | 0.03 | 8.61 | 8.64 | (0.04 | ) | — | (0.04 | ) | 28.01 | 44.52 | 917,919 | 1.11 | 1.23 | 0.10 | 71 | ||||||||||||||||||||||||||||||||||||||||
2020 | 21.04 | 0.04 | (1.15 | ) | (1.11 | ) | (0.08 | ) | (0.44 | ) | (0.52 | ) | 19.41 | (5.47 | ) | 664,941 | 1.11 | 1.24 | 0.22 | 90 | ||||||||||||||||||||||||||||||||||||
2019 | 25.02 | 0.11 | (2.32 | ) | (2.21 | ) | (0.10 | ) | (1.67 | ) | (1.77 | ) | 21.04 | (8.27 | ) | 771,375 | 1.11 | 1.23 | 0.54 | 115 | ||||||||||||||||||||||||||||||||||||
Class Y | ||||||||||||||||||||||||||||||||||||||||||||||||||||||||
2023 | $ | 20.68 | $ | 0.15 | $ | 2.01 | $ | 2.16 | $ | (0.17 | ) | $ | (0.09 | ) | $ | (0.26 | ) | $ | 22.58 | 10.49 | % | $ | 101,798 | 0.89 | % | 0.98 | % | 0.65 | % | 62 | % | |||||||||||||||||||||||||
2022 | 28.07 | 0.14 | (4.85 | ) | (4.71 | ) | (0.11 | ) | (2.57 | ) | (2.68 | ) | 20.68 | (18.81 | ) | 88,914 | 0.89 | 0.98 | 0.55 | 58 | ||||||||||||||||||||||||||||||||||||
2021 | 19.45 | 0.08 | 8.63 | 8.71 | (0.09 | ) | — | (0.09 | ) | 28.07 | 44.81 | 112,357 | 0.89 | 0.98 | 0.32 | 71 | ||||||||||||||||||||||||||||||||||||||||
2020 | 21.06 | 0.09 | (1.14 | ) | (1.05 | ) | (0.12 | ) | (0.44 | ) | (0.56 | ) | 19.45 | (5.20 | ) | 84,564 | 0.89 | 0.99 | 0.44 | 90 | ||||||||||||||||||||||||||||||||||||
2019 | 25.07 | 0.16 | (2.34 | ) | (2.18 | ) | (0.16 | ) | (1.67 | ) | (1.83 | ) | 21.06 | (8.12 | ) | 98,434 | 0.89 | 0.99 | 0.77 | 115 | ||||||||||||||||||||||||||||||||||||
Mid-Cap Fund | ||||||||||||||||||||||||||||||||||||||||||||||||||||||||
Class F | ||||||||||||||||||||||||||||||||||||||||||||||||||||||||
2023 | $ | 22.81 | $ | 0.15 | $ | 2.53 | $ | 2.68 | $ | (0.18 | ) | $ | — | $ | (0.18 | ) | $ | 25.31 | 11.77 | % | $ | 69,549 | 0.98 | % | 0.99 | % | 0.60 | % | 67 | % | ||||||||||||||||||||||||||
2022 | 32.65 | 0.18 | (4.20 | ) | (4.02 | ) | (0.14 | ) | (5.68 | ) | (5.82 | ) | 22.81 | (15.67 | ) | 65,124 | 0.98 | 0.98 | 0.64 | 95 | ||||||||||||||||||||||||||||||||||||
2021 | 23.59 | 0.15 | 9.13 | 9.28 | (0.22 | ) | — | (0.22 | ) | 32.65 | 39.49 | 78,488 | 0.98 | 0.98 | 0.49 | 163 | ||||||||||||||||||||||||||||||||||||||||
2020 | 24.94 | 0.28 | (1.00 | ) | (0.72 | ) | (0.29 | ) | (0.34 | ) | (0.63 | ) | 23.59 | (2.87 | ) | 66,828 | 0.98 | 0.98 | 1.17 | 108 | ||||||||||||||||||||||||||||||||||||
2019 | 29.13 | 0.22 | (1.43 | ) | (1.21 | ) | (0.20 | ) | (2.78 | ) | (2.98 | ) | 24.94 | (3.10 | ) | 102,280 | 0.98 | 0.99 | 0.89 | 99 | ||||||||||||||||||||||||||||||||||||
Class I | ||||||||||||||||||||||||||||||||||||||||||||||||||||||||
2023 | $ | 22.75 | $ | 0.09 | $ | 2.52 | $ | 2.61 | $ | (0.13 | ) | $ | — | $ | (0.13 | ) | $ | 25.23 | 11.50 | % | $ | 309 | 1.20 | % | 1.23 | % | 0.37 | % | 67 | % | ||||||||||||||||||||||||||
2022 | 32.59 | 0.10 | (4.18 | ) | (4.08 | ) | (0.08 | ) | (5.68 | ) | (5.76 | ) | 22.75 | (15.88 | ) | 311 | 1.20 | 1.23 | 0.37 | 95 | ||||||||||||||||||||||||||||||||||||
2021 | 23.55 | 0.09 | 9.11 | 9.20 | (0.16 | ) | — | (0.16 | ) | 32.59 | 39.19 | 669 | 1.20 | 1.23 | 0.28 | 163 | ||||||||||||||||||||||||||||||||||||||||
2020 | 24.91 | 0.22 | (0.99 | ) | (0.77 | ) | (0.25 | ) | (0.34 | ) | (0.59 | ) | 23.55 | (3.13 | ) | 583 | 1.20 | 1.23 | 0.96 | 108 | ||||||||||||||||||||||||||||||||||||
2019 | 29.09 | 0.16 | (1.41 | ) | (1.25 | ) | (0.15 | ) | (2.78 | ) | (2.93 | ) | 24.91 | (3.27 | ) | 716 | 1.20 | 1.24 | 0.66 | 99 | ||||||||||||||||||||||||||||||||||||
Class Y | ||||||||||||||||||||||||||||||||||||||||||||||||||||||||
2023 | $ | 22.82 | $ | 0.21 | $ | 2.53 | $ | 2.74 | $ | (0.24 | ) | $ | — | $ | (0.24 | ) | $ | 25.32 | 12.04 | % | $ | 4,385 | 0.73 | % | 0.74 | % | 0.84 | % | 67 | % | ||||||||||||||||||||||||||
2022 | 32.67 | 0.25 | (4.21 | ) | (3.96 | ) | (0.21 | ) | (5.68 | ) | (5.89 | ) | 22.82 | (15.48 | ) | 3,559 | 0.73 | 0.73 | 0.92 | 95 | ||||||||||||||||||||||||||||||||||||
2021 | 23.61 | 0.22 | 9.13 | 9.35 | (0.29 | ) | — | (0.29 | ) | 32.67 | 39.80 | 3,667 | 0.73 | 0.73 | 0.71 | 163 | ||||||||||||||||||||||||||||||||||||||||
2020 | 24.96 | 0.33 | (0.99 | ) | (0.66 | ) | (0.35 | ) | (0.34 | ) | (0.69 | ) | 23.61 | (2.61 | ) | 2,584 | 0.73 | 0.73 | 1.42 | 108 | ||||||||||||||||||||||||||||||||||||
2019 | 29.15 | 0.28 | (1.42 | ) | (1.14 | ) | (0.27 | ) | (2.78 | ) | (3.05 | ) | 24.96 | (2.85 | ) | 2,604 | 0.73 | 0.74 | 1.14 | 99 | ||||||||||||||||||||||||||||||||||||
† | Returns and portfolio turnover rates are for the period indicated and have not been annualized. Returns do not reflect the deduction of taxes the shareholder would pay on fund distributions or redemption of fund shares. |
(1) | Per share calculated using average shares. |
Amounts designated as “—“ are either $0 or have been rounded to $0.
The accompanying notes are an integral part of the financial statements.
SEI Institutional Managed Trust
389
FINANCIAL HIGHLIGHTS
For the years or periods ended September 30, (unless otherwise indicated)
For a share outstanding throughout each period
Net Asset | Net | Net Realized | Total | Distributions | Distributions | Total | Net Asset | Total | Net Assets | Ratio of Net | Ratio of Expenses | Ratio of Net | Portfolio | |||||||||||||||||||||||||||||||||||||||||||
U.S. Managed Volatility Fund | ||||||||||||||||||||||||||||||||||||||||||||||||||||||||
Class F | ||||||||||||||||||||||||||||||||||||||||||||||||||||||||
2023 | $ | 15.00 | $ | 0.27 | $ | 1.30 | $ | 1.57 | $ | (0.26 | ) | $ | (1.43 | ) | $ | (1.69 | ) | $ | 14.88 | 10.23 | % | $ | 577,827 | 0.90 | % | 1.23 | % | 1.75 | % | 49 | % | |||||||||||||||||||||||||
2022 | 17.64 | 0.30 | (1.16 | ) | (0.86 | ) | (0.29 | ) | (1.49 | ) | (1.78 | ) | 15.00 | (5.98 | ) | 642,383 | 0.90 | 1.23 | 1.76 | 48 | ||||||||||||||||||||||||||||||||||||
2021 | 16.14 | 0.25 | 2.91 | 3.16 | (0.26 | ) | (1.40 | ) | (1.66 | ) | 17.64 | 20.39 | 749,637 | 0.90 | 1.23 | 1.43 | 50 | |||||||||||||||||||||||||||||||||||||||
2020 | 17.78 | 0.26 | (1.08 | ) | (0.82 | ) | (0.29 | ) | (0.53 | ) | (0.82 | ) | 16.14 | (4.87 | ) | 764,608 | 0.90 | 1.23 | 1.55 | 77 | ||||||||||||||||||||||||||||||||||||
2019 | 18.69 | 0.32 | 0.91 | 1.23 | (0.31 | ) | (1.83 | ) | (2.14 | ) | 17.78 | 7.89 | 914,612 | 0.93 | 1.23 | 1.89 | 44 | |||||||||||||||||||||||||||||||||||||||
Class I | ||||||||||||||||||||||||||||||||||||||||||||||||||||||||
2023 | $ | 15.00 | $ | 0.23 | $ | 1.29 | $ | 1.52 | $ | (0.22 | ) | $ | (1.43 | ) | $ | (1.65 | ) | $ | 14.87 | 9.89 | % | $ | 546 | 1.15 | % | 1.48 | % | 1.50 | % | 49 | % | |||||||||||||||||||||||||
2022 | 17.64 | 0.28 | (1.19 | ) | (0.91 | ) | (0.24 | ) | (1.49 | ) | (1.73 | ) | 15.00 | (6.26 | ) | 497 | 1.15 | 1.48 | 1.61 | 48 | ||||||||||||||||||||||||||||||||||||
2021 | 16.13 | 0.21 | 2.92 | 3.13 | (0.22 | ) | (1.40 | ) | (1.62 | ) | 17.64 | 20.17 | 1,324 | 1.15 | 1.48 | 1.17 | 50 | |||||||||||||||||||||||||||||||||||||||
2020 | 17.78 | 0.21 | (1.08 | ) | (0.87 | ) | (0.25 | ) | (0.53 | ) | (0.78 | ) | 16.13 | (5.17 | ) | 1,282 | 1.15 | 1.48 | 1.29 | 77 | ||||||||||||||||||||||||||||||||||||
2019 | 18.69 | 0.28 | 0.91 | 1.19 | (0.27 | ) | (1.83 | ) | (2.10 | ) | 17.78 | 7.62 | 1,345 | 1.18 | 1.48 | 1.64 | 44 | |||||||||||||||||||||||||||||||||||||||
Class Y | ||||||||||||||||||||||||||||||||||||||||||||||||||||||||
2023 | $ | 15.01 | $ | 0.31 | $ | 1.29 | $ | 1.60 | $ | (0.30 | ) | $ | (1.43 | ) | $ | (1.73 | ) | $ | 14.88 | 10.44 | % | $ | 166,352 | 0.65 | % | 0.98 | % | 1.99 | % | 49 | % | |||||||||||||||||||||||||
2022 | 17.65 | 0.34 | (1.15 | ) | (0.81 | ) | (0.34 | ) | (1.49 | ) | (1.83 | ) | 15.01 | (5.73 | ) | 154,562 | 0.65 | 0.98 | 2.01 | 48 | ||||||||||||||||||||||||||||||||||||
2021 | 16.15 | 0.29 | 2.92 | 3.21 | (0.31 | ) | (1.40 | ) | (1.71 | ) | 17.65 | 20.68 | 200,659 | 0.65 | 0.98 | 1.69 | 50 | |||||||||||||||||||||||||||||||||||||||
2020 | 17.79 | 0.30 | (1.08 | ) | (0.78 | ) | (0.33 | ) | (0.53 | ) | (0.86 | ) | 16.15 | (4.62 | ) | 870,935 | 0.65 | 0.98 | 1.79 | 77 | ||||||||||||||||||||||||||||||||||||
2019 | 18.70 | 0.37 | 0.91 | 1.28 | (0.36 | ) | (1.83 | ) | (2.19 | ) | 17.79 | 8.16 | 922,175 | 0.68 | 0.98 | 2.15 | 44 | |||||||||||||||||||||||||||||||||||||||
Global Managed Volatility Fund | ||||||||||||||||||||||||||||||||||||||||||||||||||||||||
Class F | ||||||||||||||||||||||||||||||||||||||||||||||||||||||||
2023 | $ | 9.55 | $ | 0.17 | $ | 0.98 | $ | 1.15 | $ | (0.53 | ) | $ | (0.48 | ) | $ | (1.01 | ) | $ | 9.69 | 12.23 | % | $ | 662,758 | 1.11 | % | 1.24 | % | 1.70 | % | 84 | % | |||||||||||||||||||||||||
2022 | 11.78 | 0.15 | (1.03 | ) | (0.88 | ) | (0.13 | ) | (1.22 | ) | (1.35 | ) | 9.55 | (9.19 | ) | 710,669 | 1.11 | 1.23 | 1.35 | 88 | ||||||||||||||||||||||||||||||||||||
2021 | 10.40 | 0.12 | 1.37 | 1.49 | (0.09 | ) | (0.02 | ) | (0.11 | ) | 11.78 | 14.40 | 881,712 | 1.11 | 1.23 | 1.07 | 80 | |||||||||||||||||||||||||||||||||||||||
2020 | 11.46 | 0.12 | (0.57 | ) | (0.45 | ) | (0.28 | ) | (0.33 | ) | (0.61 | ) | 10.40 | (4.33 | ) | 913,791 | 1.11 | 1.25 | 1.12 | 86 | ||||||||||||||||||||||||||||||||||||
2019 | 12.08 | 0.18 | 0.26 | 0.44 | (0.29 | ) | (0.77 | ) | (1.06 | ) | 11.46 | 4.75 | 1,060,614 | 1.11 | 1.24 | 1.61 | 66 | |||||||||||||||||||||||||||||||||||||||
Class I | ||||||||||||||||||||||||||||||||||||||||||||||||||||||||
2023 | $ | 9.28 | $ | 0.14 | $ | 0.96 | $ | 1.10 | $ | (0.50 | ) | $ | (0.48 | ) | $ | (0.98 | ) | $ | 9.40 | 12.07 | % | $ | 467 | 1.36 | % | 1.49 | % | 1.45 | % | 84 | % | |||||||||||||||||||||||||
2022 | 11.48 | 0.10 | (0.98 | ) | (0.88 | ) | (0.10 | ) | (1.22 | ) | (1.32 | ) | 9.28 | (9.37 | ) | 416 | 1.36 | 1.48 | 0.88 | 88 | ||||||||||||||||||||||||||||||||||||
2021 | 10.15 | 0.09 | 1.33 | 1.42 | (0.07 | ) | (0.02 | ) | (0.09 | ) | 11.48 | 14.01 | 1,041 | 1.36 | 1.48 | 0.83 | 80 | |||||||||||||||||||||||||||||||||||||||
2020 | 11.19 | 0.09 | (0.55 | ) | (0.46 | ) | (0.25 | ) | (0.33 | ) | (0.58 | ) | 10.15 | (4.51 | ) | 952 | 1.36 | 1.50 | 0.88 | 86 | ||||||||||||||||||||||||||||||||||||
2019 | 11.82 | 0.15 | 0.25 | 0.40 | (0.26 | ) | (0.77 | ) | (1.03 | ) | 11.19 | 4.45 | 1,067 | 1.36 | 1.49 | 1.36 | 66 | |||||||||||||||||||||||||||||||||||||||
Class Y | ||||||||||||||||||||||||||||||||||||||||||||||||||||||||
2023 | $ | 9.58 | $ | 0.19 | $ | 1.00 | $ | 1.19 | $ | (0.56 | ) | $ | (0.48 | ) | $ | (1.04 | ) | $ | 9.73 | 12.62 | % | $ | 118,429 | 0.86 | % | 0.99 | % | 1.95 | % | 84 | % | |||||||||||||||||||||||||
2022 | 11.81 | 0.18 | (1.04 | ) | (0.86 | ) | (0.15 | ) | (1.22 | ) | (1.37 | ) | 9.58 | (8.95 | ) | 105,301 | 0.86 | 0.98 | 1.60 | 88 | ||||||||||||||||||||||||||||||||||||
2021 | 10.43 | 0.15 | 1.37 | 1.52 | (0.12 | ) | (0.02 | ) | (0.14 | ) | 11.81 | 14.65 | 127,801 | 0.86 | 0.98 | 1.31 | 80 | |||||||||||||||||||||||||||||||||||||||
2020 | 11.49 | 0.15 | (0.58 | ) | (0.43 | ) | (0.30 | ) | (0.33 | ) | (0.63 | ) | 10.43 | (4.08 | ) | 143,066 | 0.86 | 1.00 | 1.39 | 86 | ||||||||||||||||||||||||||||||||||||
2019 | 12.12 | 0.21 | 0.25 | 0.46 | (0.32 | ) | (0.77 | ) | (1.09 | ) | 11.49 | 4.95 | 220,260 | 0.86 | 0.99 | 1.86 | 66 | |||||||||||||||||||||||||||||||||||||||
† | Returns and portfolio turnover rates are for the period indicated and have not been annualized. Returns do not reflect the deduction of taxes the shareholder would pay on fund distributions or redemption of fund shares. |
(1) | Per share calculated using average shares. |
Amounts designated as “—“are either $0 or have been rounded to $0.
The accompanying notes are an integral part of the financial statements.
390
SEI Institutional Managed Trust
FINANCIAL HIGHLIGHTS
For the years or periods ended September 30, (unless otherwise indicated)
For a share outstanding throughout each period
Net Asset | Net | Net Realized | Total | Distributions | Distributions | Total | Net Asset | Total | Net Assets | Ratio of Net | Ratio of Expenses | Ratio of Net | Portfolio | |||||||||||||||||||||||||||||||||||||||||||
Tax-Managed Managed Volatility Fund | ||||||||||||||||||||||||||||||||||||||||||||||||||||||||
Class F | ||||||||||||||||||||||||||||||||||||||||||||||||||||||||
2023 | $ | 18.39 | $ | 0.18 | $ | 1.83 | $ | 2.01 | $ | (0.18 | ) | $ | (1.08 | ) | $ | (1.26 | ) | $ | 19.14 | 10.98 | % | $ | 699,917 | 1.00 | % | 1.23 | % | 0.95 | % | 22 | % | |||||||||||||||||||||||||
2022 | 19.75 | 0.19 | (0.58 | ) | (0.39 | ) | (0.19 | ) | (0.78 | ) | (0.97 | ) | 18.39 | (2.48 | ) | 787,892 | 1.00 | 1.23 | 0.96 | 17 | ||||||||||||||||||||||||||||||||||||
2021 | 16.66 | 0.19 | 3.23 | 3.42 | (0.20 | ) | (0.13 | ) | (0.33 | ) | 19.75 | 20.76 | 920,670 | 1.00 | 1.23 | 1.04 | 17 | |||||||||||||||||||||||||||||||||||||||
2020 | 17.61 | 0.25 | (0.51 | ) | (0.26 | ) | (0.27 | ) | (0.42 | ) | (0.69 | ) | 16.66 | (1.53 | ) | 856,160 | 1.00 | 1.23 | 1.48 | 27 | ||||||||||||||||||||||||||||||||||||
2019 | 17.22 | 0.27 | 0.88 | 1.15 | (0.27 | ) | (0.49 | ) | (0.76 | ) | 17.61 | 7.16 | 1,004,802 | 1.00 | 1.23 | 1.65 | 29 | |||||||||||||||||||||||||||||||||||||||
Class Y | ||||||||||||||||||||||||||||||||||||||||||||||||||||||||
2023 | $ | 18.39 | $ | 0.23 | $ | 1.83 | $ | 2.06 | $ | (0.23 | ) | $ | (1.08 | ) | $ | (1.31 | ) | $ | 19.14 | 11.26 | % | $ | 105,350 | 0.75 | % | 0.98 | % | 1.20 | % | 22 | % | |||||||||||||||||||||||||
2022 | 19.76 | 0.24 | (0.59 | ) | (0.35 | ) | (0.24 | ) | (0.78 | ) | (1.02 | ) | 18.39 | (2.28 | ) | 77,782 | 0.75 | 0.98 | 1.21 | 17 | ||||||||||||||||||||||||||||||||||||
2021 | 16.66 | 0.24 | 3.24 | 3.48 | (0.25 | ) | (0.13 | ) | (0.38 | ) | 19.76 | 21.12 | 83,410 | 0.75 | 0.98 | 1.28 | 17 | |||||||||||||||||||||||||||||||||||||||
2020 | 17.62 | 0.29 | (0.52 | ) | (0.23 | ) | (0.31 | ) | (0.42 | ) | (0.73 | ) | 16.66 | (1.34 | ) | 76,132 | 0.75 | 0.98 | 1.73 | 27 | ||||||||||||||||||||||||||||||||||||
2019 | 17.23 | 0.31 | 0.88 | 1.19 | (0.31 | ) | (0.49 | ) | (0.80 | ) | 17.62 | 7.42 | 87,717 | 0.75 | 0.99 | 1.88 | 29 | |||||||||||||||||||||||||||||||||||||||
Tax-Managed International Managed Volatility Fund | ||||||||||||||||||||||||||||||||||||||||||||||||||||||||
Class F | ||||||||||||||||||||||||||||||||||||||||||||||||||||||||
2023 | $ | 8.69 | $ | 0.27 | $ | 1.53 | $ | 1.80 | $ | (0.28 | ) | $ | — | $ | (0.28 | ) | $ | 10.21 | 20.84 | % | $ | 250,047 | 1.11 | % | 1.39 | % | 2.72 | % | 77 | % | ||||||||||||||||||||||||||
2022 | 11.30 | 0.31 | (2.57 | ) | (2.26 | ) | (0.35 | ) | — | (0.35 | ) | 8.69 | (20.68 | ) | 251,038 | 1.11 | 1.39 | 2.94 | 73 | |||||||||||||||||||||||||||||||||||||
2021 | 10.15 | 0.27 | 1.06 | 1.33 | (0.18 | ) | — | (0.18 | ) | 11.30 | 13.23 | 338,490 | 1.11 | 1.39 | 2.44 | 79 | ||||||||||||||||||||||||||||||||||||||||
2020 | 10.77 | 0.19 | (0.49 | ) | (0.30 | ) | (0.32 | ) | — | (0.32 | ) | 10.15 | (3.08 | ) | 315,250 | 1.11 | 1.41 | 1.84 | 79 | |||||||||||||||||||||||||||||||||||||
2019 | 11.38 | 0.27 | (0.61 | ) | (0.34 | ) | (0.27 | ) | — | (0.27 | ) | 10.77 | (2.76 | ) | 331,996 | 1.11 | 1.40 | 2.54 | 55 | |||||||||||||||||||||||||||||||||||||
Class Y | ||||||||||||||||||||||||||||||||||||||||||||||||||||||||
2023 | $ | 8.71 | $ | 0.31 | $ | 1.50 | $ | 1.81 | $ | (0.30 | ) | $ | — | $ | (0.30 | ) | $ | 10.22 | 21.02 | % | $ | 57,684 | 0.86 | % | 1.14 | % | 3.10 | % | 77 | % | ||||||||||||||||||||||||||
2022 | 11.32 | 0.34 | (2.57 | ) | (2.23 | ) | (0.38 | ) | — | (0.38 | ) | 8.71 | (20.44 | ) | 41,566 | 0.86 | 1.14 | 3.17 | 73 | |||||||||||||||||||||||||||||||||||||
2021 | 10.17 | 0.30 | 1.06 | 1.36 | (0.21 | ) | — | (0.21 | ) | 11.32 | 13.48 | 56,993 | 0.86 | 1.14 | 2.69 | 79 | ||||||||||||||||||||||||||||||||||||||||
2020 | 10.79 | 0.23 | (0.51 | ) | (0.28 | ) | (0.34 | ) | — | (0.34 | ) | 10.17 | (2.84 | ) | 53,255 | 0.86 | 1.16 | 2.27 | 79 | |||||||||||||||||||||||||||||||||||||
2019 | 11.40 | 0.32 | (0.63 | ) | (0.31 | ) | (0.30 | ) | — | (0.30 | ) | 10.79 | (2.47 | ) | 42,782 | 0.86 | 1.15 | 3.05 | 55 | |||||||||||||||||||||||||||||||||||||
Real Estate Fund | ||||||||||||||||||||||||||||||||||||||||||||||||||||||||
Class F | ||||||||||||||||||||||||||||||||||||||||||||||||||||||||
2023 | $ | 13.56 | $ | 0.22 | $ | 0.16 | $ | 0.38 | $ | (0.17 | ) | $ | (0.51 | ) | $ | (0.68 | ) | $ | 13.26 | 2.69 | % | $ | 55,148 | 1.14 | % | 1.23 | % | 1.58 | % | 53 | % | |||||||||||||||||||||||||
2022 | 17.62 | 0.15 | (2.89 | ) | (2.74 | ) | (0.23 | ) | (1.09 | ) | (1.32 | ) | 13.56 | (17.41 | ) | 61,247 | 1.14 | 1.23 | 0.87 | 77 | ||||||||||||||||||||||||||||||||||||
2021 | 13.51 | 0.11 | 4.87 | 4.98 | (0.20 | ) | (0.67 | ) | (0.87 | ) | 17.62 | 38.41 | 84,666 | 1.14 | 1.23 | 0.67 | 78 | |||||||||||||||||||||||||||||||||||||||
2020 | 17.24 | 0.14 | (2.47 | ) | (2.33 | ) | (0.28 | ) | (1.12 | ) | (1.40 | ) | 13.51 | (14.21 | ) | 74,099 | 1.14 | 1.23 | 0.95 | 123 | ||||||||||||||||||||||||||||||||||||
2019 | 16.06 | 0.23 | 2.31 | 2.54 | (0.21 | ) | (1.15 | ) | (1.36 | ) | 17.24 | 17.35 | 104,562 | 1.14 | 1.24 | 1.47 | 71 | |||||||||||||||||||||||||||||||||||||||
Class I | ||||||||||||||||||||||||||||||||||||||||||||||||||||||||
2023 | $ | 13.54 | $ | 0.19 | $ | 0.16 | $ | 0.35 | $ | (0.16 | ) | $ | (0.51 | ) | $ | (0.67 | ) | $ | 13.22 | 2.44 | % | $ | 169 | 1.36 | % | 1.48 | % | 1.36 | % | 53 | % | |||||||||||||||||||||||||
2022 | 17.58 | 0.07 | (2.84 | ) | (2.77 | ) | (0.18 | ) | (1.09 | ) | (1.27 | ) | 13.54 | (17.54 | ) | 164 | 1.36 | 1.48 | 0.38 | 77 | ||||||||||||||||||||||||||||||||||||
2021 | 13.48 | 0.07 | 4.86 | 4.93 | (0.16 | ) | (0.67 | ) | (0.83 | ) | 17.58 | 38.14 | 424 | 1.36 | 1.48 | 0.47 | 78 | |||||||||||||||||||||||||||||||||||||||
2020 | 17.20 | 0.11 | (2.46 | ) | (2.35 | ) | (0.25 | ) | (1.12 | ) | (1.37 | ) | 13.48 | (14.38 | ) | 307 | 1.36 | 1.48 | 0.79 | 123 | ||||||||||||||||||||||||||||||||||||
2019 | 16.03 | 0.21 | 2.29 | 2.50 | (0.18 | ) | (1.15 | ) | (1.33 | ) | 17.20 | 17.06 | 420 | 1.36 | 1.48 | 1.33 | 71 | |||||||||||||||||||||||||||||||||||||||
Class Y | ||||||||||||||||||||||||||||||||||||||||||||||||||||||||
2023 | $ | 13.57 | $ | 0.26 | $ | 0.16 | $ | 0.42 | $ | (0.20 | ) | $ | (0.51 | ) | $ | (0.71 | ) | $ | 13.28 | 2.94 | % | $ | 12,889 | 0.89 | % | 0.98 | % | 1.83 | % | 53 | % | |||||||||||||||||||||||||
2022 | 17.63 | 0.21 | (2.91 | ) | (2.70 | ) | (0.27 | ) | (1.09 | ) | (1.36 | ) | 13.57 | (17.18 | ) | 13,752 | 0.89 | 0.98 | 1.23 | 77 | ||||||||||||||||||||||||||||||||||||
2021 | 13.51 | 0.15 | 4.87 | 5.02 | (0.23 | ) | (0.67 | ) | (0.90 | ) | 17.63 | 38.81 | 18,241 | 0.89 | 0.98 | 0.93 | 78 | |||||||||||||||||||||||||||||||||||||||
2020 | 17.25 | 0.21 | (2.51 | ) | (2.30 | ) | (0.32 | ) | (1.12 | ) | (1.44 | ) | 13.51 | (14.04 | ) | 17,279 | 0.89 | 0.98 | 1.40 | 123 | ||||||||||||||||||||||||||||||||||||
2019 | 16.07 | 0.27 | 2.31 | 2.58 | (0.25 | ) | (1.15 | ) | (1.40 | ) | 17.25 | 17.65 | 36,910 | 0.89 | 0.98 | 1.72 | 71 | |||||||||||||||||||||||||||||||||||||||
† | Returns and portfolio turnover rates are for the period indicated and have not been annualized. Returns do not reflect the deduction of taxes the shareholder would pay on fund distributions or redemption of fund shares. |
(1) | Per share calculated using average shares. |
Amounts designated as “—“are either $0 or have been rounded to $0.
The accompanying notes are an integral part of the financial statements.
SEI Institutional Managed Trust
391
FINANCIAL HIGHLIGHTS
For the years or periods ended September 30, (unless otherwise indicated)
For a share outstanding throughout each period
Net Asset | Net | Net Realized | Total | Distributions | Distributions | Total | Net Asset | Total | Net Assets | Ratio of Net | Ratio of Expenses | Ratio of Net | Portfolio | |||||||||||||||||||||||||||||||||||||||||||
Core Fixed Income Fund | ||||||||||||||||||||||||||||||||||||||||||||||||||||||||
Class F | ||||||||||||||||||||||||||||||||||||||||||||||||||||||||
2023 | $ | 9.37 | $ | 0.33 | $ | (0.28 | ) | $ | 0.05 | $ | (0.32 | ) | $ | — | $ | (0.32 | ) | $ | 9.10 | 0.44 | % | $ | 2,966,849 | 0.66 | % | 0.74 | % | 3.49 | % | 340 | % | |||||||||||||||||||||||||
2022 | 11.50 | 0.20 | (2.09 | ) | (1.89 | ) | (0.21 | ) | (0.03 | ) | (0.24 | ) | 9.37 | (16.70 | ) | 3,192,558 | 0.66 | 0.73 | 1.85 | 362 | ||||||||||||||||||||||||||||||||||||
2021 | 12.15 | 0.15 | (0.16 | ) | (0.01 | ) | (0.18 | ) | (0.46 | ) | (0.64 | ) | 11.50 | (0.08 | ) | 4,101,094 | 0.66 | 0.72 | 1.27 | 375 | ||||||||||||||||||||||||||||||||||||
2020 | 11.65 | 0.23 | 0.65 | 0.88 | (0.27 | ) | (0.11 | ) | (0.38 | ) | 12.15 | 7.75 | 3,859,455 | 0.66 | 0.73 | 1.98 | 357 | |||||||||||||||||||||||||||||||||||||||
2019 | 10.86 | 0.31 | 0.81 | 1.12 | (0.33 | ) | — | (0.33 | ) | 11.65 | 10.45 | 3,755,355 | 0.66 | 0.73 | 2.78 | 387 | ||||||||||||||||||||||||||||||||||||||||
Class I | ||||||||||||||||||||||||||||||||||||||||||||||||||||||||
2023 | $ | 9.35 | $ | 0.31 | $ | (0.27 | ) | $ | 0.04 | $ | (0.30 | ) | $ | — | $ | (0.30 | ) | $ | 9.09 | 0.32 | % | $ | 2,715 | 0.88 | % | 0.99 | % | 3.26 | % | 340 | % | |||||||||||||||||||||||||
2022 | 11.49 | 0.17 | (2.10 | ) | (1.93 | ) | (0.18 | ) | (0.03 | ) | (0.21 | ) | 9.35 | (16.99 | ) | 3,423 | 0.88 | 0.98 | 1.60 | 362 | ||||||||||||||||||||||||||||||||||||
2021 | 12.14 | 0.12 | (0.15 | ) | (0.03 | ) | (0.16 | ) | (0.46 | ) | (0.62 | ) | 11.49 | (0.30 | ) | 5,102 | 0.88 | 0.97 | 1.05 | 375 | ||||||||||||||||||||||||||||||||||||
2020 | 11.64 | 0.21 | 0.66 | 0.87 | (0.26 | ) | (0.11 | ) | (0.37 | ) | 12.14 | 7.59 | 4,698 | 0.88 | 0.98 | 1.76 | 357 | |||||||||||||||||||||||||||||||||||||||
2019 | 10.86 | 0.29 | 0.79 | 1.08 | (0.30 | ) | — | (0.30 | ) | 11.64 | 10.11 | 5,085 | 0.88 | 0.98 | 2.57 | 387 | ||||||||||||||||||||||||||||||||||||||||
Class Y | ||||||||||||||||||||||||||||||||||||||||||||||||||||||||
2023 | $ | 9.37 | $ | 0.36 | $ | (0.28 | ) | $ | 0.08 | $ | (0.34 | ) | $ | — | $ | (0.34 | ) | $ | 9.11 | 0.80 | % | $ | 385,904 | 0.41 | % | 0.49 | % | 3.75 | % | 340 | % | |||||||||||||||||||||||||
2022 | 11.51 | 0.22 | (2.10 | ) | (1.88 | ) | (0.23 | ) | (0.03 | ) | (0.26 | ) | 9.37 | (16.56 | ) | 409,715 | 0.41 | 0.48 | 2.11 | 362 | ||||||||||||||||||||||||||||||||||||
2021 | 12.16 | 0.18 | (0.16 | ) | 0.02 | (0.21 | ) | (0.46 | ) | (0.67 | ) | 11.51 | 0.16 | 501,505 | 0.41 | 0.47 | 1.51 | 375 | ||||||||||||||||||||||||||||||||||||||
2020 | 11.66 | 0.26 | 0.65 | 0.91 | (0.30 | ) | (0.11 | ) | (0.41 | ) | 12.16 | 7.98 | 455,054 | 0.41 | 0.48 | 2.22 | 357 | |||||||||||||||||||||||||||||||||||||||
2019 | 10.87 | 0.34 | 0.80 | 1.14 | (0.35 | ) | — | (0.35 | ) | 11.66 | 10.71 | 439,460 | 0.41 | 0.48 | 3.03 | 387 | ||||||||||||||||||||||||||||||||||||||||
High Yield Bond Fund | ||||||||||||||||||||||||||||||||||||||||||||||||||||||||
Class F | ||||||||||||||||||||||||||||||||||||||||||||||||||||||||
2023 | $ | 5.75 | $ | 0.40 | $ | 0.10 | $ | 0.50 | $ | (0.50 | )(2) | $ | (0.38 | ) | $ | (0.88 | ) | $ | 5.37 | 9.27 | % | $ | 1,072,999 | 0.89 | % | 0.99 | % | 7.30 | % | 48 | % | |||||||||||||||||||||||||
2022 | 7.08 | 0.32 | (1.20 | ) | (0.88 | ) | (0.40 | ) | (0.05 | ) | (0.45 | ) | 5.75 | (12.98 | ) | 1,115,354 | 0.89 | 0.98 | 4.93 | 49 | ||||||||||||||||||||||||||||||||||||
2021 | 6.46 | 0.40 | 0.72 | 1.12 | (0.37 | ) | (0.13 | ) | (0.50 | ) | 7.08 | 17.84 | 1,430,709 | 0.89 | 0.98 | 5.78 | 67 | |||||||||||||||||||||||||||||||||||||||
2020 | 6.91 | 0.36 | (0.39 | ) | (0.03 | ) | (0.38 | ) | (0.04 | ) | (0.42 | ) | 6.46 | (0.33 | ) | 1,257,617 | 0.89 | 0.98 | 5.54 | 88 | ||||||||||||||||||||||||||||||||||||
2019 | 7.13 | 0.39 | (0.11 | ) | 0.28 | (0.39 | ) | (0.11 | ) | (0.50 | ) | 6.91 | 4.24 | 1,444,565 | 0.89 | 0.98 | 5.68 | 69 | ||||||||||||||||||||||||||||||||||||||
Class I | ||||||||||||||||||||||||||||||||||||||||||||||||||||||||
2023 | $ | 5.53 | $ | 0.38 | $ | 0.10 | $ | 0.48 | $ | (0.48 | )(3) | $ | (0.38 | ) | $ | (0.86 | ) | $ | 5.15 | 9.10 | % | $ | 4 | 1.06 | % | 1.16 | % | 7.17 | % | 48 | % | |||||||||||||||||||||||||
2022 | 6.82 | 0.27 | (1.13 | ) | (0.86 | ) | (0.38 | ) | (0.05 | ) | (0.43 | ) | 5.53 | (13.14 | ) | 3 | 1.11 | 1.23 | 4.09 | 49 | ||||||||||||||||||||||||||||||||||||
2021 | 6.22 | 0.37 | 0.70 | 1.07 | (0.34 | ) | (0.13 | ) | (0.47 | ) | 6.82 | 17.72 | 581 | 1.11 | 1.23 | 5.55 | 67 | |||||||||||||||||||||||||||||||||||||||
2020 | 6.65 | 0.33 | (0.37 | ) | (0.04 | ) | (0.35 | ) | (0.04 | ) | (0.39 | ) | 6.22 | (0.46 | ) | 409 | 1.11 | 1.23 | 4.99 | 88 | ||||||||||||||||||||||||||||||||||||
2019 | 6.88 | 0.36 | (0.12 | ) | 0.24 | (0.36 | ) | (0.11 | ) | (0.47 | ) | 6.65 | 3.79 | 11,926 | 1.12 | 1.23 | 5.51 | 69 | ||||||||||||||||||||||||||||||||||||||
Class Y | ||||||||||||||||||||||||||||||||||||||||||||||||||||||||
2023 | $ | 5.75 | $ | 0.42 | $ | 0.10 | $ | 0.52 | $ | (0.52 | )(2) | $ | (0.38 | ) | $ | (0.90 | ) | $ | 5.37 | 9.54 | % | $ | 156,000 | 0.64 | % | 0.74 | % | 7.57 | % | 48 | % | |||||||||||||||||||||||||
2022 | 7.08 | 0.34 | (1.20 | ) | (0.86 | ) | (0.42 | ) | (0.05 | ) | (0.47 | ) | 5.75 | (12.77 | ) | 159,547 | 0.64 | 0.73 | 5.20 | 49 | ||||||||||||||||||||||||||||||||||||
2021 | 6.46 | 0.42 | 0.72 | 1.14 | (0.39 | ) | (0.13 | ) | (0.52 | ) | 7.08 | 18.13 | 195,613 | 0.64 | 0.73 | 6.03 | 67 | |||||||||||||||||||||||||||||||||||||||
2020 | 6.91 | 0.38 | (0.39 | ) | (0.01 | ) | (0.40 | ) | (0.04 | ) | (0.44 | ) | 6.46 | (0.07 | ) | 174,334 | 0.64 | 0.73 | 5.78 | 88 | ||||||||||||||||||||||||||||||||||||
2019 | 7.13 | 0.41 | (0.11 | ) | 0.30 | (0.41 | ) | (0.11 | ) | (0.52 | ) | 6.91 | 4.51 | 185,383 | 0.64 | 0.73 | 5.92 | 69 | ||||||||||||||||||||||||||||||||||||||
† | Returns and portfolio turnover rates are for the period indicated and have not been annualized. Returns do not reflect the deduction of taxes the shareholder would pay on fund distributions or redemption of fund shares. |
(1) | Per share calculated using average shares. |
(2) | Includes return of capital of $0.08 per share. |
(3) | Includes return of capital of $0.07 per share. |
Amounts designated as “—“ are either $0 or have been rounded to $0.
The accompanying notes are an integral part of the financial statements.
392
SEI Institutional Managed Trust
FINANCIAL HIGHLIGHTS/CONSOLIDATED FINANCIAL HIGHLIGHTS
For the years or periods ended September 30, (unless otherwise indicated)
For a share outstanding throughout each period
Net Asset | Net | Net Realized | Total | Distributions | Distributions | Total | Net Asset | Total | Net Assets | Ratio of Net | Ratio of Expenses | Ratio of Net | Portfolio | |||||||||||||||||||||||||||||||||||||||||||
Conservative Income Fund | ||||||||||||||||||||||||||||||||||||||||||||||||||||||||
Class F | ||||||||||||||||||||||||||||||||||||||||||||||||||||||||
2023 | $ | 10.00 | $ | 0.46 | $ | (0.01 | ) | $ | 0.45 | $ | (0.45 | ) | $ | — | $ | (0.45 | ) | $ | 10.00 | 4.61 | % | $ | 464,086 | 0.30 | % | 0.58 | % | 4.60 | % | – | % | |||||||||||||||||||||||||
2022 | 10.00 | 0.07 | (0.01 | ) | 0.06 | (0.06 | ) | — | ^ | (0.06 | ) | 10.00 | 0.65 | 344,975 | 0.25 | 0.58 | 0.67 | – | ||||||||||||||||||||||||||||||||||||||
2021 | 10.00 | — | — | — | — | ^ | — | — | ^ | 10.00 | 0.01 | 269,681 | 0.19 | 0.58 | — | – | ||||||||||||||||||||||||||||||||||||||||
2020 | 10.00 | 0.09 | 0.01 | 0.10 | (0.10 | ) | — | (0.10 | ) | 10.00 | 0.96 | 319,030 | 0.30 | 0.59 | 0.90 | – | ||||||||||||||||||||||||||||||||||||||||
2019 | 10.00 | 0.23 | — | 0.23 | (0.23 | ) | — | (0.23 | ) | 10.00 | 2.32 | 229,166 | 0.30 | 0.59 | 2.29 | – | ||||||||||||||||||||||||||||||||||||||||
Class Y | ||||||||||||||||||||||||||||||||||||||||||||||||||||||||
2023 | $ | 10.01 | $ | 0.46 | $ | 0.01 | $ | 0.47 | $ | (0.47 | ) | $ | — | $ | (0.47 | ) | $ | 10.01 | 4.78 | % | $ | 15,217 | 0.20 | % | 0.33 | % | 4.62 | % | – | % | ||||||||||||||||||||||||||
2022 | 10.01 | 0.07 | — | 0.07 | (0.07 | ) | — | ^ | (0.07 | ) | 10.01 | 0.70 | 15,305 | 0.14 | 0.33 | 0.72 | – | |||||||||||||||||||||||||||||||||||||||
2021 | 10.00 | 0.01 | — | 0.01 | — | ^ | — | — | ^ | 10.01 | 0.11 | 16,962 | 0.09 | 0.33 | 0.10 | – | ||||||||||||||||||||||||||||||||||||||||
2020 | 10.00 | 0.11 | — | 0.11 | (0.11 | ) | — | (0.11 | ) | 10.00 | 1.06 | 22,256 | 0.20 | 0.34 | 1.05 | – | ||||||||||||||||||||||||||||||||||||||||
2019 | 10.00 | 0.24 | — | 0.24 | (0.24 | ) | — | (0.24 | ) | 10.00 | 2.42 | 23,125 | 0.20 | 0.34 | 2.38 | – | ||||||||||||||||||||||||||||||||||||||||
Tax-Free Conservative Income Fund | ||||||||||||||||||||||||||||||||||||||||||||||||||||||||
Class F | ||||||||||||||||||||||||||||||||||||||||||||||||||||||||
2023 | $ | 9.99 | $ | 0.28 | $ | 0.01 | $ | 0.29 | $ | (0.28 | ) | $ | — | $ | (0.28 | ) | $ | 10.00 | 2.92 | % | $ | 163,924 | 0.30 | % | 0.58 | % | 2.77 | % | – | % | ||||||||||||||||||||||||||
2022 | 10.00 | 0.04 | (0.01 | ) | 0.03 | (0.04 | ) | — | (0.04 | ) | 9.99 | 0.29 | 176,810 | 0.22 | 0.58 | 0.39 | – | |||||||||||||||||||||||||||||||||||||||
2021 | 10.00 | — | — | — | — | ^ | — | — | ^ | 10.00 | 0.01 | 183,626 | 0.13 | 0.58 | 0.01 | – | ||||||||||||||||||||||||||||||||||||||||
2020 | 10.00 | 0.06 | — | 0.06 | (0.06 | ) | — | (0.06 | ) | 10.00 | 0.64 | 212,828 | 0.30 | 0.59 | 0.62 | – | ||||||||||||||||||||||||||||||||||||||||
2019 | 10.00 | 0.14 | — | 0.14 | (0.14 | ) | — | (0.14 | ) | 10.00 | 1.37 | 162,368 | 0.30 | 0.59 | 1.36 | – | ||||||||||||||||||||||||||||||||||||||||
Class Y | ||||||||||||||||||||||||||||||||||||||||||||||||||||||||
2023 | $ | 10.01 | $ | 0.29 | $ | — | $ | 0.29 | $ | (0.29 | ) | $ | — | $ | (0.29 | ) | $ | 10.01 | 2.92 | % | $ | 3,971 | 0.20 | % | 0.33 | % | 2.86 | % | – | % | ||||||||||||||||||||||||||
2022 | 10.01 | 0.05 | (0.01 | ) | 0.04 | (0.04 | ) | — | (0.04 | ) | 10.01 | 0.44 | 4,890 | 0.13 | 0.33 | 0.48 | – | |||||||||||||||||||||||||||||||||||||||
2021 | 10.00 | 0.01 | — | 0.01 | — | ^ | — | — | ^ | 10.01 | 0.11 | 9,273 | 0.03 | 0.33 | 0.10 | – | ||||||||||||||||||||||||||||||||||||||||
2020 | 10.00 | 0.09 | (0.02 | ) | 0.07 | (0.07 | ) | — | (0.07 | ) | 10.00 | 0.73 | 5,770 | 0.20 | 0.34 | 0.87 | – | |||||||||||||||||||||||||||||||||||||||
2019 | 10.00 | 0.15 | — | 0.15 | (0.15 | ) | — | (0.15 | ) | 10.00 | 1.47 | 16,727 | 0.20 | 0.34 | 1.45 | – | ||||||||||||||||||||||||||||||||||||||||
† | Returns and portfolio turnover rates are for the period indicated and have not been annualized. Returns do not reflect the deduction of taxes the shareholder would pay on fund distributions or redemption of fund shares. |
(1) | Per share calculated using average shares. |
^ | Amount represents less than $0.005 per share. |
Amounts designated as “—“are either $0 or have been rounded to $0.
The accompanying notes are an integral part of the financial statements.
SEI Institutional Managed Trust
393
FINANCIAL HIGHLIGHTS/CONSOLIDATED FINANCIAL HIGHLIGHTS
For the years or periods ended September 30, (unless otherwise indicated)
For a share outstanding throughout each period
Net Asset | Net | Net Realized | Total | Distributions | Distributions | Total | Net Asset | Total | Net Assets | Ratio of Net | Ratio of Expenses | Ratio of Net | Portfolio | |||||||||||||||||||||||||||||||||||||||||||
Real Return Fund | ||||||||||||||||||||||||||||||||||||||||||||||||||||||||
Class F | ||||||||||||||||||||||||||||||||||||||||||||||||||||||||
2023 | $ | 9.57 | $ | 0.22 | $ | 0.01 | $ | 0.23 | $ | (0.43 | ) | $ | (0.04 | ) | $ | (0.47 | ) | $ | 9.33 | 2.44 | % | $ | 183,431 | 0.45 | % | 0.70 | % | 2.36 | % | 31 | % | |||||||||||||||||||||||||
2022 | 10.68 | 0.71 | (1.17 | ) | (0.46 | ) | (0.65 | ) | — | (0.65 | ) | 9.57 | (4.52 | ) | 241,034 | 0.45 | 0.70 | 6.86 | 50 | |||||||||||||||||||||||||||||||||||||
2021 | 10.40 | 0.44 | 0.10 | 0.54 | (0.26 | ) | — | (0.26 | ) | 10.68 | 5.26 | 228,319 | 0.45 | 0.70 | 4.18 | 31 | ||||||||||||||||||||||||||||||||||||||||
2020 | 9.96 | 0.07 | 0.42 | 0.49 | (0.05 | ) | — | (0.05 | ) | 10.40 | 4.98 | 238,849 | 0.45 | 0.70 | 0.72 | 41 | ||||||||||||||||||||||||||||||||||||||||
2019 | 9.91 | 0.16 | 0.15 | 0.31 | (0.26 | ) | — | (0.26 | ) | 9.96 | 3.14 | 227,413 | 0.45 | 0.70 | 1.59 | 34 | ||||||||||||||||||||||||||||||||||||||||
Class Y | ||||||||||||||||||||||||||||||||||||||||||||||||||||||||
2023 | $ | 9.62 | $ | 0.24 | $ | (0.01 | ) | $ | 0.23 | $ | (0.44 | ) | $ | (0.04 | ) | $ | (0.48 | ) | $ | 9.37 | 2.44 | % | $ | 14,249 | 0.35 | % | 0.45 | % | 2.50 | % | 31 | % | ||||||||||||||||||||||||
2022 | 10.73 | 0.71 | (1.16 | ) | (0.45 | ) | (0.66 | ) | — | (0.66 | ) | 9.62 | (4.40 | ) | 16,740 | 0.35 | 0.45 | 6.85 | 50 | |||||||||||||||||||||||||||||||||||||
2021 | 10.44 | 0.43 | 0.14 | 0.57 | (0.28 | ) | — | (0.28 | ) | 10.73 | 5.47 | 17,931 | 0.35 | 0.45 | 4.11 | 31 | ||||||||||||||||||||||||||||||||||||||||
2020 | 10.00 | 0.08 | 0.42 | 0.50 | (0.06 | ) | — | (0.06 | ) | 10.44 | 5.01 | 21,395 | 0.35 | 0.45 | 0.84 | 41 | ||||||||||||||||||||||||||||||||||||||||
2019 | 9.94 | 0.18 | 0.14 | 0.32 | (0.26 | ) | — | (0.26 | ) | 10.00 | 3.31 | 24,322 | 0.35 | 0.46 | 1.80 | 34 | ||||||||||||||||||||||||||||||||||||||||
Dynamic Asset Allocation Fund | ||||||||||||||||||||||||||||||||||||||||||||||||||||||||
Class F | ||||||||||||||||||||||||||||||||||||||||||||||||||||||||
2023 | $ | 14.41 | $ | 0.18 | $ | 2.19 | $ | 2.37 | $ | (0.40 | ) | $ | (1.52 | ) | $ | (1.92 | ) | $ | 14.86 | 17.64 | % | $ | 640,725 | 0.75 | % | 1.18 | % | 1.24 | % | 22 | % | |||||||||||||||||||||||||
2022 | 18.50 | 0.11 | (2.20 | ) | (2.09 | ) | (0.59 | ) | (1.41 | ) | (2.00 | ) | 14.41 | (13.56 | ) | 597,961 | 0.75 | 1.18 | 0.62 | 5 | ||||||||||||||||||||||||||||||||||||
2021 | 14.98 | 0.10 | 4.58 | 4.68 | (0.89 | ) | (0.27 | ) | (1.16 | ) | 18.50 | 32.72 | 816,977 | 0.75 | 1.18 | 0.56 | 10 | |||||||||||||||||||||||||||||||||||||||
2020 | 13.23 | 0.14 | 1.84 | 1.98 | (0.23 | ) | — | (0.23 | ) | 14.98 | 15.07 | 723,775 | 0.75 | 1.18 | 1.06 | 16 | ||||||||||||||||||||||||||||||||||||||||
2019 | 13.22 | 0.17 | 0.07 | 0.24 | (0.23 | ) | — | (0.23 | ) | 13.23 | 2.14 | 725,857 | 0.75 | 1.18 | 1.31 | 5 | ||||||||||||||||||||||||||||||||||||||||
Class Y | ||||||||||||||||||||||||||||||||||||||||||||||||||||||||
2023 | $ | 14.43 | $ | 0.25 | $ | 2.16 | $ | 2.41 | $ | (0.44 | ) | $ | (1.52 | ) | $ | (1.96 | ) | $ | 14.88 | 17.95 | % | $ | 42,012 | 0.50 | % | 0.93 | % | 1.69 | % | 22 | % | |||||||||||||||||||||||||
2022 | 18.54 | 0.16 | (2.22 | ) | (2.06 | ) | (0.64 | ) | (1.41 | ) | (2.05 | ) | 14.43 | (13.44 | ) | 35,497 | 0.50 | 0.93 | 0.91 | 5 | ||||||||||||||||||||||||||||||||||||
2021 | 15.01 | 0.14 | 4.58 | 4.72 | (0.92 | ) | (0.27 | ) | (1.19 | ) | 18.54 | 33.05 | 46,976 | 0.50 | 0.93 | 0.81 | 10 | |||||||||||||||||||||||||||||||||||||||
2020 | 13.26 | 0.08 | 1.93 | 2.01 | (0.26 | ) | — | (0.26 | ) | 15.01 | 15.31 | 41,757 | 0.50 | 0.93 | 0.59 | 16 | ||||||||||||||||||||||||||||||||||||||||
2019 | 13.25 | 0.19 | 0.08 | 0.27 | (0.26 | ) | — | (0.26 | ) | 13.26 | 2.43 | 70,477 | 0.50 | 0.93 | 1.51 | 5 | ||||||||||||||||||||||||||||||||||||||||
† | Returns and portfolio turnover rates are for the period indicated and have not been annualized. Returns do not reflect the deduction of taxes the shareholder would pay on fund distributions or redemption of fund shares. |
(1) | Per share calculated using average shares. |
Amounts designated as “—“are either $0 or have been rounded to $0.
The accompanying notes are an integral part of the financial statements.
394
SEI Institutional Managed Trust
FINANCIAL HIGHLIGHTS/CONSOLIDATED FINANCIAL HIGHLIGHTS
For the years or periods ended September 30, (unless otherwise indicated)
For a share outstanding throughout each period
Net Asset | Net | Net Realized | Total | Distributions | Distributions | Total | Net Asset | Total | Net Assets | Ratio of Net | Ratio of Expenses | Ratio of Net | Portfolio | |||||||||||||||||||||||||||||||||||||||||||
Multi-Strategy Alternative Fund | ||||||||||||||||||||||||||||||||||||||||||||||||||||||||
Class F | ||||||||||||||||||||||||||||||||||||||||||||||||||||||||
2023 | $ | 9.08 | $ | 0.36 | $ | 0.12 | $ | 0.48 | $ | (0.19 | ) | $ | — | $ | (0.19 | ) | $ | 9.37 | 5.40 | % | $ | 354,258 | 1.83 | %(2) | 2.58 | % | 3.91 | % | 434 | % | ||||||||||||||||||||||||||
2022 | 10.54 | 0.08 | (0.79 | ) | (0.71 | ) | (0.13 | ) | (0.62 | ) | (0.75 | ) | 9.08 | (7.24 | ) | 394,876 | 1.93 | (2) | 2.68 | 0.83 | 369 | |||||||||||||||||||||||||||||||||||
2021 | 9.98 | 0.09 | 0.76 | 0.85 | (0.05 | ) | (0.24 | ) | (0.29 | ) | 10.54 | 8.57 | 449,934 | 1.99 | (2) | 2.75 | 0.87 | 424 | ||||||||||||||||||||||||||||||||||||||
2020 | 9.61 | 0.08 | 0.39 | 0.47 | (0.10 | ) | — | (0.10 | ) | 9.98 | 4.90 | 463,468 | 1.72 | (3) | 2.54 | 0.84 | 527 | |||||||||||||||||||||||||||||||||||||||
2019 | 10.10 | 0.14 | (0.18 | ) | (0.04 | ) | (0.16 | ) | (0.29 | ) | (0.45 | ) | 9.61 | (0.18 | ) | 472,129 | 1.44 | (4) | 2.38 | 1.24 | 315 | |||||||||||||||||||||||||||||||||||
Class Y | ||||||||||||||||||||||||||||||||||||||||||||||||||||||||
2023 | �� | $ | 9.08 | $ | 0.38 | $ | 0.13 | $ | 0.51 | $ | (0.22 | ) | $ | — | $ | (0.22 | ) | $ | 9.37 | 5.68 | % | $ | 14,325 | 1.58 | %(5) | 2.33 | % | 4.12 | % | 434 | % | |||||||||||||||||||||||||
2022 | 10.55 | 0.11 | (0.81 | ) | (0.70 | ) | (0.15 | ) | (0.62 | ) | (0.77 | ) | 9.08 | (7.09 | ) | 8,069 | 1.68 | (5) | 2.43 | 1.09 | 369 | |||||||||||||||||||||||||||||||||||
2021 | 9.98 | 0.12 | 0.77 | 0.89 | (0.08 | ) | (0.24 | ) | (0.32 | ) | 10.55 | 8.94 | 8,585 | 1.74 | (5) | 2.50 | 1.12 | 424 | ||||||||||||||||||||||||||||||||||||||
2020 | 9.61 | 0.11 | 0.38 | 0.49 | (0.12 | ) | — | (0.12 | ) | 9.98 | 5.16 | 8,464 | 1.47 | (6) | 2.29 | 1.12 | 527 | |||||||||||||||||||||||||||||||||||||||
2019 | 10.11 | 0.13 | (0.15 | ) | (0.02 | ) | (0.19 | ) | (0.29 | ) | (0.48 | ) | 9.61 | (0.01 | ) | 9,821 | 1.20 | (7) | 2.15 | 1.11 | 315 | |||||||||||||||||||||||||||||||||||
Liquid Alternative Fund | ||||||||||||||||||||||||||||||||||||||||||||||||||||||||
Class F | ||||||||||||||||||||||||||||||||||||||||||||||||||||||||
2023(8) | $ | 10.00 | $ | 0.15 | $ | 0.01 | $ | 0.16 | $ | — | $ | — | $ | — | $ | 10.16 | 1.60 | % | $ | 531 | 1.04 | % | 4.16 | % | 5.70 | % | – | % | ||||||||||||||||||||||||||||
Class Y | ||||||||||||||||||||||||||||||||||||||||||||||||||||||||
2023(8) | $ | 10.00 | $ | 0.10 | $ | 0.07 | $ | 0.17 | $ | — | $ | — | $ | — | $ | 10.17 | 1.60 | % | $ | 10,827 | 0.80 | % | 1.89 | % | 3.85 | % | – | % | ||||||||||||||||||||||||||||
Multi-Asset Accumulation Fund | ||||||||||||||||||||||||||||||||||||||||||||||||||||||||
Class F | ||||||||||||||||||||||||||||||||||||||||||||||||||||||||
2023 | $ | 7.17 | $ | 0.23 | $ | (0.04 | ) | $ | 0.19 | $ | (0.70 | ) | $ | — | $ | (0.70 | ) | $ | 6.66 | 2.59 | % | $ | 1,781,011 | 1.17 | % | 1.32 | % | 3.26 | % | 72 | % | |||||||||||||||||||||||||
2022 | 10.31 | 0.11 | (1.96 | ) | (1.85 | ) | (0.64 | ) | (0.65 | ) | (1.29 | ) | 7.17 | (20.79 | ) | 1,886,712 | 1.17 | 1.30 | 1.25 | 42 | ||||||||||||||||||||||||||||||||||||
2021 | 9.55 | (0.01 | ) | 1.28 | 1.27 | — | (0.51 | ) | (0.51 | ) | 10.31 | 13.73 | 2,506,500 | 1.17 | 1.29 | (0.12 | ) | 54 | ||||||||||||||||||||||||||||||||||||||
2020 | 10.63 | (0.02 | ) | 0.18 | 0.16 | (0.13 | ) | (1.11 | ) | (1.24 | ) | 9.55 | 1.51 | 2,420,060 | 1.17 | 1.30 | (0.23 | ) | 61 | |||||||||||||||||||||||||||||||||||||
2019 | �� | 9.81 | 0.08 | 1.03 | 1.11 | (0.27 | ) | (0.02 | ) | (0.29 | ) | 10.63 | 11.94 | 2,659,785 | 1.17 | 1.30 | 0.80 | 63 | ||||||||||||||||||||||||||||||||||||||
Class Y | ||||||||||||||||||||||||||||||||||||||||||||||||||||||||
2023 | $ | 7.25 | $ | 0.20 | $ | — | $ | 0.20 | $ | (0.72 | ) | $ | — | $ | (0.72 | ) | $ | 6.73 | 2.73 | % | $ | 100,217 | 0.92 | % | 1.07 | % | 2.75 | % | 72 | % | ||||||||||||||||||||||||||
2022 | 10.41 | 0.12 | (1.97 | ) | (1.85 | ) | (0.66 | ) | (0.65 | ) | (1.31 | ) | 7.25 | (20.57 | ) | 146,375 | 0.92 | 1.05 | 1.36 | 42 | ||||||||||||||||||||||||||||||||||||
2021 | 9.62 | (0.02 | ) | 1.32 | 1.30 | — | (0.51 | ) | (0.51 | ) | 10.41 | 13.95 | 193,339 | 0.92 | 1.04 | (0.15 | ) | 54 | ||||||||||||||||||||||||||||||||||||||
2020 | 10.70 | (0.03 | ) | 0.21 | 0.18 | (0.15 | ) | (1.11 | ) | (1.26 | ) | 9.62 | 1.74 | 190,469 | 0.92 | 1.05 | (0.26 | ) | 61 | |||||||||||||||||||||||||||||||||||||
2019 | 9.88 | 0.07 | 1.06 | 1.13 | (0.29 | ) | (0.02 | ) | (0.31 | ) | 10.70 | 12.16 | 220,654 | 0.92 | 1.05 | 0.66 | 63 | |||||||||||||||||||||||||||||||||||||||
† | Returns and portfolio turnover rates are for the period indicated and have not been annualized. Returns do not reflect the deduction of taxes the shareholder would pay on fund distributions or redemption of fund shares. |
(1) | Per share calculated using average shares. |
(2) | The expense ratio includes dividend and interest expense, and other expenses outside the cap. Had this expense been excluded the ratios would have been 1.35%. |
(3) | The expense ratio includes dividend and interest expense, and other expenses outside the cap. Had this expense been excluded the ratios would have been 1.27%. |
(4) | The expense ratio includes dividend and interest expense, and other expenses outside the cap. Had this expense been excluded the ratios would have been 1.20%. |
(5) | The expense ratio includes dividend and interest expense, and other expenses outside the cap. Had this expense been excluded the ratios would have been 1.10%. |
(6) | The expense ratio includes dividend and interest expense, and other expenses outside the cap. Had this expense been excluded the ratios would have been 1.02%. |
(7) | The expense ratio includes dividend and interest expense, and other expenses outside the cap. Had this expense been excluded the ratios would have been 0.96%. |
(8) | Commenced operations on June 30, 2023. All ratios for the period have been annualized. |
Amounts designated as “—“are either $0 or have been rounded to $0.
The accompanying notes are an integral part of the financial statements.
SEI Institutional Managed Trust
395
FINANCIAL HIGHLIGHTS/CONSOLIDATED FINANCIAL HIGHLIGHTS
For the years or periods ended September 30, (unless otherwise indicated)
For a share outstanding throughout each period
Net Asset | Net | Net Realized | Total | Distributions | Distributions | Total | Net Asset | Total | Net Assets | Ratio of Net | Ratio of Expenses | Ratio of Net | Portfolio | |||||||||||||||||||||||||||||||||||||||||||
Multi-Asset Income Fund | ||||||||||||||||||||||||||||||||||||||||||||||||||||||||
Class F | ||||||||||||||||||||||||||||||||||||||||||||||||||||||||
2023 | $ | 9.22 | $ | 0.62 | $ | 0.11 | $ | 0.73 | $ | (0.67 | ) | $ | — | $ | (0.67 | ) | $ | 9.28 | 8.02 | % | $ | 532,159 | 0.80 | % | 1.21 | % | 6.49 | % | 39 | % | ||||||||||||||||||||||||||
2022 | 11.49 | 0.46 | (2.26 | ) | (1.80 | ) | (0.46 | ) | (0.01 | ) | (0.47 | ) | 9.22 | (16.13 | ) | 568,205 | 0.80 | 1.20 | 4.35 | 24 | ||||||||||||||||||||||||||||||||||||
2021 | 10.85 | 0.42 | 0.61 | 1.03 | (0.39 | ) | — | (0.39 | ) | 11.49 | 9.57 | 759,685 | 0.80 | 1.20 | 3.71 | 59 | ||||||||||||||||||||||||||||||||||||||||
2020 | 11.07 | 0.40 | (0.20 | ) | 0.20 | (0.39 | ) | (0.03 | ) | (0.42 | ) | 10.85 | 1.86 | 770,599 | 0.80 | 1.21 | 3.69 | 137 | ||||||||||||||||||||||||||||||||||||||
2019 | 10.61 | 0.45 | 0.41 | 0.86 | (0.40 | ) | — | (0.40 | ) | 11.07 | 8.29 | 816,056 | 0.80 | 1.20 | 4.15 | 76 | ||||||||||||||||||||||||||||||||||||||||
Class Y | ||||||||||||||||||||||||||||||||||||||||||||||||||||||||
2023 | $ | 9.22 | $ | 0.63 | $ | 0.11 | $ | 0.74 | $ | (0.68 | ) | $ | — | $ | (0.68 | ) | $ | 9.28 | 8.12 | % | $ | 127,673 | 0.70 | % | 0.96 | % | 6.59 | % | 39 | % | ||||||||||||||||||||||||||
2022 | 11.49 | 0.47 | (2.26 | ) | (1.79 | ) | (0.47 | ) | (0.01 | ) | (0.48 | ) | 9.22 | (16.08 | ) | 137,959 | 0.70 | 0.95 | 4.46 | 24 | ||||||||||||||||||||||||||||||||||||
2021 | 10.85 | 0.43 | 0.61 | 1.04 | (0.40 | ) | — | (0.40 | ) | 11.49 | 9.68 | 172,276 | 0.70 | 0.95 | 3.81 | 59 | ||||||||||||||||||||||||||||||||||||||||
2020 | 11.07 | 0.41 | (0.20 | ) | 0.21 | (0.40 | ) | (0.03 | ) | (0.43 | ) | 10.85 | 1.96 | 161,672 | 0.70 | 0.96 | 3.79 | 137 | ||||||||||||||||||||||||||||||||||||||
2019 | 10.61 | 0.46 | 0.41 | 0.87 | (0.41 | ) | — | (0.41 | ) | 11.07 | 8.39 | 161,776 | 0.70 | 0.95 | 4.25 | 76 | ||||||||||||||||||||||||||||||||||||||||
Multi-Asset Inflation Managed Fund | ||||||||||||||||||||||||||||||||||||||||||||||||||||||||
Class F | ||||||||||||||||||||||||||||||||||||||||||||||||||||||||
2023 | $ | 8.68 | $ | 0.27 | $ | (0.12 | ) | $ | 0.15 | $ | (0.96 | ) | $ | — | $ | (0.96 | ) | $ | 7.87 | 1.46 | % | $ | 648,827 | 1.96 | %(2) | 2.20 | % | 3.39 | % | 93 | % | |||||||||||||||||||||||||
2022 | 8.91 | 0.34 | 0.09 | 0.43 | (0.66 | ) | — | (0.66 | ) | 8.68 | 5.10 | 783,196 | 1.24 | (2) | 1.48 | 3.80 | 81 | |||||||||||||||||||||||||||||||||||||||
2021 | 7.88 | 0.24 | 0.91 | 1.15 | (0.12 | ) | — | (0.12 | ) | 8.91 | 14.71 | 803,799 | 1.12 | (2) | 1.36 | 2.84 | 65 | |||||||||||||||||||||||||||||||||||||||
2020 | 8.28 | 0.10 | (0.38 | ) | (0.28 | ) | (0.12 | ) | — | (0.12 | ) | 7.88 | (3.41 | ) | 735,962 | 1.38 | (2) | 1.62 | 1.28 | 63 | ||||||||||||||||||||||||||||||||||||
2019 | 8.49 | 0.14 | (0.20 | ) | (0.06 | ) | (0.15 | ) | — | (0.15 | ) | 8.28 | (0.62 | ) | 798,451 | 1.52 | (2) | 1.76 | 1.68 | 30 | ||||||||||||||||||||||||||||||||||||
Class Y | ||||||||||||||||||||||||||||||||||||||||||||||||||||||||
2023 | $ | 8.69 | $ | 0.23 | $ | (0.06 | ) | $ | 0.17 | $ | (0.98 | ) | $ | — | $ | (0.98 | ) | $ | 7.88 | 1.75 | % | $ | 30,866 | 1.71 | %(3) | 1.96 | % | 2.88 | % | 93 | % | |||||||||||||||||||||||||
2022 | 8.92 | 0.34 | 0.11 | 0.45 | (0.68 | ) | — | (0.68 | ) | 8.69 | 5.36 | 34,931 | 0.98 | (4) | 1.22 | 3.84 | 81 | |||||||||||||||||||||||||||||||||||||||
2021 | 7.89 | 0.22 | 0.95 | 1.17 | (0.14 | ) | — | (0.14 | ) | 8.92 | 14.99 | 43,985 | 0.87 | (3) | 1.11 | 2.62 | 65 | |||||||||||||||||||||||||||||||||||||||
2020 | 8.29 | 0.11 | (0.37 | ) | (0.26 | ) | (0.14 | ) | — | (0.14 | ) | 7.89 | (3.17 | ) | 45,173 | 1.13 | (5) | 1.37 | 1.35 | 63 | ||||||||||||||||||||||||||||||||||||
2019 | 8.50 | 0.13 | (0.17 | ) | (0.04 | ) | (0.17 | ) | — | (0.17 | ) | 8.29 | (0.35 | ) | 55,857 | 1.27 | (3) | 1.51 | 1.56 | 30 | ||||||||||||||||||||||||||||||||||||
† | Returns and portfolio turnover rates are for the period indicated and have not been annualized. Returns do not reflect the deduction of taxes the shareholder would pay on fund distributions or redemption of fund shares. |
(1) | Per share calculated using average shares. |
(2) | The expense ratio includes dividend and interest expense, and other expenses outside the cap. Had this expense been excluded the ratios would have been 0.90%. |
(3) | The expense ratio includes dividend and interest expense, and other expenses outside the cap. Had this expense been excluded the ratios would have been 0.65%. |
(4) | The expense ratio includes dividend and interest expense, and other expenses outside the cap. Had this expense been excluded the ratios would have been 0.64%. |
(5) | The expense ratio includes dividend and interest expense, and other expenses outside the cap. Had this expense been excluded the ratios would have been 0.66%. |
Amounts designated as “—“are either $0 or have been rounded to $0.
The accompanying notes are an integral part of the financial statements.
396
SEI Institutional Managed Trust
FINANCIAL HIGHLIGHTS/CONSOLIDATED FINANCIAL HIGHLIGHTS
For the years or periods ended September 30, (unless otherwise indicated)
For a share outstanding throughout each period
Net Asset | Net | Net Realized | Total | Distributions | Distributions | Total | Net Asset | Total | Net Assets | Ratio of Net | Ratio of Expenses | Ratio of Net | Portfolio | |||||||||||||||||||||||||||||||||||||||||||
Multi-Asset Capital Stability Fund | ||||||||||||||||||||||||||||||||||||||||||||||||||||||||
Class F | ||||||||||||||||||||||||||||||||||||||||||||||||||||||||
2023 | $ | 9.79 | $ | 0.33 | $ | 0.07 | $ | 0.40 | $ | (0.18 | ) | $ | — | $ | (0.18 | ) | $ | 10.01 | 4.19 | % | $ | 552,046 | 0.62 | % | 0.98 | % | 3.34 | % | 103 | % | ||||||||||||||||||||||||||
2022 | 10.51 | 0.03 | (0.46 | ) | (0.43 | ) | (0.07 | ) | (0.22 | ) | (0.29 | ) | 9.79 | (4.24 | ) | 626,296 | 0.62 | 0.98 | 0.27 | 69 | ||||||||||||||||||||||||||||||||||||
2021 | 10.28 | — | 0.34 | 0.34 | (0.02 | ) | (0.09 | ) | (0.11 | ) | 10.51 | 3.27 | 682,772 | 0.62 | 0.98 | — | ^ | 125 | ||||||||||||||||||||||||||||||||||||||
2020 | 10.39 | 0.04 | 0.22 | 0.26 | (0.18 | ) | (0.19 | ) | (0.37 | ) | 10.28 | 2.55 | 732,425 | 0.62 | 0.98 | 0.37 | 124 | |||||||||||||||||||||||||||||||||||||||
2019 | 10.05 | 0.15 | 0.24 | 0.39 | (0.05 | ) | — | (0.05 | ) | 10.39 | 3.94 | 684,753 | 0.62 | 0.98 | 1.45 | 128 | ||||||||||||||||||||||||||||||||||||||||
Class Y | ||||||||||||||||||||||||||||||||||||||||||||||||||||||||
2023 | $ | 9.81 | $ | 0.34 | $ | 0.08 | $ | 0.42 | $ | (0.20 | ) | $ | — | $ | (0.20 | ) | $ | 10.03 | 4.30 | % | $ | 29,524 | 0.52 | % | 0.73 | % | 3.43 | % | 103 | % | ||||||||||||||||||||||||||
2022 | 10.54 | 0.04 | (0.47 | ) | (0.43 | ) | (0.08 | ) | (0.22 | ) | (0.30 | ) | 9.81 | (4.23 | ) | 32,510 | 0.52 | 0.73 | 0.36 | 69 | ||||||||||||||||||||||||||||||||||||
2021 | 10.30 | 0.01 | 0.35 | 0.36 | (0.03 | ) | (0.09 | ) | (0.12 | ) | 10.54 | 3.47 | 38,031 | 0.52 | 0.73 | 0.08 | 125 | |||||||||||||||||||||||||||||||||||||||
2020 | 10.41 | 0.05 | 0.22 | 0.27 | (0.19 | ) | (0.19 | ) | (0.38 | ) | 10.30 | 2.64 | 48,307 | 0.52 | 0.73 | 0.48 | 124 | |||||||||||||||||||||||||||||||||||||||
2019 | 10.07 | 0.16 | 0.24 | 0.40 | (0.06 | ) | — | (0.06 | ) | 10.41 | 4.04 | 47,957 | 0.52 | 0.73 | 1.55 | 128 | ||||||||||||||||||||||||||||||||||||||||
† | Returns and portfolio turnover rates are for the period indicated and have not been annualized. Returns do not reflect the deduction of taxes the shareholder would pay on fund distributions or redemption of fund shares. |
(1) | Per share calculated using average shares. |
^ | Amount represents less than 0.005%. |
Amounts designated as “—“are either $0 or have been rounded to $0.
The accompanying notes are an integral part of the financial statements.
SEI Institutional Managed Trust
397
Notes to Financial Statements/ Notes to Consolidated Financial Statements
September 30, 2023
1. ORGANIZATION
SEI Institutional Managed Trust (the “Trust”) is organized as a Massachusetts business trust under a Declaration of Trust dated October 20, 1986.
The Trust is registered under the Investment Company Act of 1940, as amended, as an open-end investment company with 28 funds: Large Cap, Large Cap Value, Large Cap Growth, Large Cap Index, Tax-Managed Large Cap, S&P 500 Index, Small Cap, Small Cap Value, Small Cap Growth, Tax-Managed Small/Mid Cap, Mid-Cap, U.S. Managed Volatility, Global Managed Volatility, Tax-Managed Managed Volatility, Tax-Managed International Managed Volatility, Real Estate, Core Fixed Income, High Yield Bond, Conservative Income, Tax-Free Conservative Income, Real Return, Dynamic Asset Allocation, Multi-Strategy Alternative, Liquid Alternative, Multi-Asset Accumulation, Multi-Asset Income, Multi-Asset Inflation Managed, and Multi-Asset Capital Stability (each a “Fund,” collectively the “Funds”) each of which are diversified Funds, with the exception of the Multi-Asset Accumulation and Multi-Asset Inflation Managed Funds.
The Dynamic Commodity Strategy Subsidiary, Ltd., the Accumulation Commodity Strategy Subsidiary, Ltd. and the Inflation Commodity Strategy Subsidiary, Ltd. are wholly-owned subsidiaries of the Dynamic Asset Allocation, Multi-Asset Accumulation and Multi-Asset Inflation Managed Funds, respectively, (each a “Subsidiary”, collectively the “Subsidiaries”). Each Subsidiary is organized under the laws of the Cayman Islands as an exempt limited company. Information regarding the Dynamic Asset Allocation, Multi-Asset Accumulation and Multi-Asset Inflation Managed Funds and their respective subsidiaries have been consolidated in the Consolidated Schedules of Investments, Consolidated Statements of Assets and Liabilities, Consolidated Statements of Operations, Consolidated Statements of Changes in Net Assets and Consolidated Statement of Cash Flows.
The Trust is registered to offer: Class F shares of the Funds and Class Y shares of the Funds, except for the Large Cap Index and S&P 500 Index Funds and Class I shares of the Large Cap, Large Cap Value, Large Cap Growth, S&P 500 Index, Small Cap, Small Cap Value, Small Cap Growth, Mid-Cap, U.S. Managed Volatility, Global Managed Volatility, Real Estate, Core Fixed Income, High Yield Bond and Real Return Funds. The assets of each Fund are segregated, and a shareholder’s interest is limited to the Fund in which shares are held. Each Fund’s prospectus provides a description of its investment goal and its principal investment strategies and risks.
2. SIGNIFICANT ACCOUNTING POLICIES
The following are significant accounting policies, which are consistently followed in the preparation of its financial statements by the Funds. The Funds are investment companies that apply the accounting and reporting guidance issued in Topic 946 by the U.S. Financial Accounting Standards Board (“FASB”).
Use of Estimates — The preparation of financial statements, in conformity with accounting principles generally accepted in the United States of America ("U.S. GAAP"), requires management to make estimates and assumptions that affect the reported amounts of assets and liabilities and disclosure of contingent assets and liabilities as of the date of the financial statements and the reported amounts of increases and decreases in net assets from operations during the reporting period. Actual results could differ from those estimates.
Security Valuation —Effective September 8, 2022, and pursuant to the requirements of the 1940 Act and Rule 2a-5, the administrator, as delegated by the Board of Trustees (the “Board”), has the responsibility for the valuation of Fund investments with readily available market quotations in accordance with the Funds’ Valuation and Pricing Policy. The Trust's Board of Trustees has designated SEI Investments Management Corporation (“SIMC”) as the Valuation Designee for the Funds pursuant to Rule 2a-5 (the “Rule”) under the 1940 Act. The Valuation Designee has the responsibility for the fair value determination with respect to all Fund investments that do not have readily available market quotations or quotations that are no longer reliable. SIMC has appointed a Valuation Committee (the “Committee”) and has established a Valuation and Pricing Policy to implement the Rule and the Funds’ Valuation and Pricing Policy (together the “Policy”). Prior to September 8, 2022, fair-value determinations were performed in accordance with the Trust’s Fair Value Procedures established by the Funds’ Board of Trustees and were implemented through a Fair Value Committee designated by the Board.
When valuing portfolio securities, a Fund values securities listed on a securities exchange, market or automated quotation system for which quotations are readily available (other than securities traded on National Association of Securities Dealers Automated Quotations (NASDAQ) or as otherwise noted below) at the last quoted sale price on an exchange or market (foreign or domestic) on which the securities are traded, or, if there is no such reported sale, at the most recent quoted bid price. A Fund values securities traded on NASDAQ at the NASDAQ Official Closing Price. If available, debt securities, swaps (which are not centrally cleared), bank loans or debt tranches of collateralized debt
398
SEI Institutional Managed Trust
obligations (including collateralized loan obligations), such as those held by the Funds, are priced based upon valuations provided by independent, third-party pricing agents. Such values generally reflect the last reported sales price if the security is actively traded. The third-party pricing agents may also value debt securities at an evaluated bid price by employing methodologies that utilize actual market transactions, broker-supplied valuations or other methodologies designed to identify the market value for such securities. Redeemable securities issued by open-end investment companies are valued at the investment company’s applicable NAV per share, with the exception of exchange-traded funds, which are priced as equity securities. These open-end investment companies’ shares are offered in separate prospectuses, each of which describes the process by which the applicable investment company’s NAV is determined. The prices of foreign securities are reported in local currency and converted to U.S. dollars using currency exchange rates. If a security’s price cannot be obtained, as noted above or in the case of an equity tranche of a CDO/CLO, a Fund will value the securities using a bid price from at least one independent broker.
On the first day a new debt security purchase is recorded, if a price is not available from a third-party pricing agent or an independent broker, the security may be valued at its purchase price. Each day thereafter, the debt security will be valued according to the Policy until an independent source can be secured. Debt securities held by a Fund with remaining maturities of 60 days or less will be valued by the amortized cost method, which involves valuing a security at its cost on the date of purchase and thereafter (absent unusual circumstances) assuming a constant amortization to maturity of any discount or premium, regardless of the impact of fluctuations in general market rates of interest on the value of the instrument. While this method provides certainty in valuation, it may result in periods during which value, as determined by this method, is higher or lower than the price a Fund would receive if it sold the instrument, and the value of securities in the Fund can be expected to vary inversely with changes in prevailing interest rates. Should existing credit, liquidity or interest rate conditions in the relevant markets and issuer-specific circumstances suggest that amortized cost does not approximate fair value, then the amortized cost method may not be used.
Options are valued at the last quoted sales price. If there is no such reported sale on the valuation date, long positions are valued at the most recent bid price, and short positions are valued at the most recent ask price.
Futures and swaps cleared through a central clearing house (centrally cleared swaps) are valued at the
settlement price established each day by the board of exchange on which they are traded. The daily settlement prices for financial futures and centrally cleared swaps are provided by an independent source. On days when there is excessive volume, market volatility or the future or centrally cleared swap does not end trading by the time a fund calculates its NAV, the settlement price may not be available at the time at which a fund calculates its NAV. On such days, the best available price (which is typically the last sales price) may be used to value a fund’s futures or centrally cleared swaps position.
Foreign currency forward contracts are valued at the current day’s interpolated foreign exchange rate, as calculated using forward rates provided by an independent source.
Prices for most securities held by a Fund are provided daily by third-party independent pricing agents. SIMC or a Sub-Adviser, as applicable, reasonably believes that prices provided by independent pricing agents are reliable. However, there can be no assurance that such pricing service’s prices will be reliable. SIMC or a Sub-Adviser, as applicable, will continuously monitor the reliability of prices obtained from any pricing service and shall promptly notify the Funds’ administrator if it believes that a particular pricing service is no longer a reliable source of prices. The Funds’ administrator, in turn, will notify SIMC, as Valuation Designee if it receives such notification from a Sub-Adviser, as applicable, or if the Funds’ administrator reasonably believes that a particular pricing service is no longer a reliable source for prices.
The Policy provides that any change in a primary pricing agent or a pricing methodology requires prior approval by the Board. However, when the change would not materially affect the valuation of a Fund’s net assets or involve a material departure in pricing methodology from that of the Fund’s existing pricing agent or pricing methodology, ratification may be obtained at the next regularly scheduled meeting of the Board.
Securities for which market prices are not "readily available" are valued in accordance with Rule 2a-5 and the Policy. The Valuation Designee must monitor for circumstances that may necessitate that a security be valued using Fair Value Procedures which can include: (i) the security's trading has been halted or suspended, (ii) the security has been de-listed from a national exchange, (iii) the security's primary trading market is temporarily closed at a time when under normal conditions it would be open, (iv) the security has not been traded for an extended period of time, (v) the security's primary pricing source is not able or willing to provide a price, (vi) trading of the security is subject to local government-imposed restrictions; or (vii)
SEI Institutional Managed Trust
399
Notes to Financial Statements/ Notes to Consolidated Financial Statements (Continued)
September 30, 2023
a significant event (as defined below). When a security is valued in accordance with the Fair Value Procedures, the Valuation Designee will determine the value after taking into consideration relevant information reasonably available to the Valuation Designee. Examples of factors the Valuation Designee may consider include: (i) the type of security or asset, (ii) the last trade price, (iii) evaluation of the forces that influence the market in which the security is purchased and sold, (iv) the liquidity of the security, (v) the size of the holding in a Fund or (vi) any other appropriate information.
The Valuation Designee is responsible for selecting and applying, in a consistent manner, the appropriate methodologies for determining and calculating the fair value of holdings of the Funds, including specifying the key inputs and assumptions specific to each asset class or holding. The determination of a security’s fair value price often involves the consideration of a number of subjective factors and is therefore subject to the unavoidable risk that the value assigned to a security may be higher or lower than the security’s value would be if a reliable market quotation for the security was readily available.
Certain of the Funds use a third-party fair valuation vendor. The vendor provides a fair value for foreign securities held by the Fund based on certain factors and methodologies (involving, generally, tracking valuation correlations between the U.S. market and each non-U.S. security). Values from the fair value vendor are applied in the event that there is a movement in the U.S. market that exceeds a specific threshold that has been established by the Committee. The Committee has also established a “confidence interval” which is used to determine the level of historical correlation between the value of a specific foreign security and movements in the U.S. market before a particular security will be fair valued when the threshold is exceeded. In the event that the threshold established by the Committee is exceeded on a specific day, the Global Managed Volatility Fund will value the non-U.S. securities in its portfolio that exceed the applicable “confidence interval” based upon the adjusted prices provided by the fair valuation vendor.
For securities that principally trade on a foreign market or exchange, a significant gap in time can exist between the time of a particular security’s last trade and the time at which a Fund calculates its NAV. The closing prices of such securities may no longer reflect their market value at the time a Fund calculates NAV if an event that could materially affect the value of those securities (a Significant Event), including substantial fluctuations in domestic or foreign markets or occurrences not tied directly to the securities markets, such as natural disasters, armed conflicts or significant governmental
actions, has occurred between the time of the security’s last close and the time that the Fund calculates NAV. A Fund may invest in securities that are primarily listed on foreign exchanges that trade on weekends or other days when the Fund does not price its shares. As a result, the NAV of the Fund’s shares may change on days when shareholders will not be able to purchase or redeem Fund shares.
A Significant Event may relate to a single issuer or to an entire market sector. If SIMC or a Sub-Adviser becomes aware of a Significant Event that has occurred with respect to a security or group of securities after the closing of the exchange or market on which the security or securities principally trade, but before the time at which a Fund calculate NAV, it may request that a Committee meeting be called. In addition, with respect to certain securities, the Funds’ administrator performs price comparisons and price movement review (among other processes), to monitor the pricing data supplied by various sources. Any identified discrepancies are researched and subject to the procedures described above.
In accordance with U.S. GAAP, fair value is defined as the price that a Fund would receive upon selling an investment in an orderly transaction to an independent buyer in the principal or most advantageous market of the investment. A three-tier hierarchy has been established to maximize the use of observable and minimize the use of unobservable inputs and to establish classification of fair value measurements for disclosure purposes. Inputs refer broadly to the assumptions that market participants would use in pricing an asset. Inputs may be observable or unobservable. Observable inputs are inputs that reflect the assumptions market participants would use in pricing the asset or liability based on market data obtained from sources independent of the reporting entity. Unobservable inputs are inputs that reflect the reporting entity’s own assumptions about the assumptions market participants would use in pricing the asset or liability based on the best information available in the circumstances.
The three-tier hierarchy of inputs is summarized in the three broad Levels listed below:
Level 1 — quoted prices in active markets for identical investments
Level 2 — other significant observable inputs (including quoted prices for similar investments, interest rates, prepayment speeds, credit risks, etc.)
Level 3 — significant unobservable inputs (including the Fund’s own assumptions in determining the fair value of investments)
400
SEI Institutional Managed Trust
Investments are classified within the level of the lowest significant input considered in determining fair value. Investments classified within Level 3 whose fair value measurement considers several inputs may include Level 1 or Level 2 inputs as components of the overall fair value measurement.
Debt securities are valued in accordance with the evaluated bid price supplied by the pricing service and generally categorized as Level 2 in the hierarchy. Other securities that are categorized as Level 2 in the hierarchy include, but are not limited to, preferred stocks, bank loans, warrants, swaps and forward contracts. The Fund may use a systematic fair valuation model provided by an independent pricing service to value foreign equity securities in order to adjust for stale pricing, which may occur between the close of certain foreign exchanges and the NYSE. These are generally categorized as Level 2 in the hierarchy.
When independent prices are unavailable or unreliable, debt securities and swaps may be valued utilizing pricing matrices which consider similar factors that would be used by independent pricing services. These are generally categorized as Level 2 in the hierarchy but may be Level 3 depending on the circumstances. For certain collateralized debt obligations, corporate obligations, mortgage backed securities, auction rate preferred securities and loan participations where observable inputs are limited, assumptions about market activity and risk are used and are categorized as Level 3 in the hierarchy.
The valuation techniques used by the Funds to measure fair value during the year ended September 30, 2023, maximized the use of observable inputs and minimized the use of unobservable inputs. For details of the investment classification, reference the Schedules of Investments.
For the year ended September 30, 2023, there have been no significant changes to the Trust’s fair valuation methodologies.
The unobservable inputs used to determine fair value of reoccurring Level 3 assets may have similar or diverging impacts on valuation. Significant increases and decreases in these inputs in isolation and interrelationships between those inputs could result in significantly higher or lower fair value measurement.
Security Transactions and Investment Income — Security transactions are recorded on the trade date. Costs used in determining net realized capital gains and losses on the sale of securities are on the basis of specific identification. Dividend income is recognized on the ex-dividend date, and interest income is recognized using the accrual basis of accounting. Income from
payment-in-kind securities is recorded daily based on the effective interest method of accrual.
Distributions received on securities that represent a return of capital or capital gains are recorded as a reduction of cost of investments and/or as a realized gain. The Trust estimates the components of distributions received that may be considered nontaxable distributions or capital gain distributions.
Amortization and accretion is calculated using the scientific interest method, which is not materially different from the effective interest method. Amortization of premiums and discounts is included in interest income.
For Treasury Inflation-Protected Securities, the principal amount is adjusted daily to keep pace with inflation. Interest is accrued based on the adjusted principal amount. The adjustments to principal due to inflation are reflected as increases or decreases to interest in the accompanying Statements of Operations. Such adjustments may have a significant impact on a Fund’s distributions.
Cash and Cash Equivalents — Idle cash and currency balances may be swept into various overnight sweep accounts and are classified as cash and cash equivalents on the Statement of Assets and Liabilities/Consolidated Statement of Assets and Liabilities and Consolidated Statement of Cash Flows. These amounts, at times, may exceed United States federally insured limits. Amounts swept are available on the next business day.
Repurchase Agreements —Securities pledged as collateral for repurchase agreements are held by each Fund’s custodian bank until the repurchase date of the repurchase agreement. The Funds may also invest in tri-party repurchase agreements. Securities held as collateral for tri-party repurchase agreements are maintained by the broker’s custodian bank in a segregated account until the repurchase date of the repurchase agreement. Provisions of the repurchase agreements and the Trust’s policies require that the market value of the collateral, including accrued interest thereon, is sufficient in the event of default by the counterparty. If the counterparty defaults and the value of the collateral declines, or if the counterparty enters into an insolvency proceeding, realization of the collateral by the Funds may be delayed or limited.
Reverse Repurchase Agreements —To the extent consistent with its Investment Objective and Strategies, a Fund may issue reverse repurchase agreements. A reverse repurchase agreement involves the sale of portfolio assets together with an agreement to repurchase the same assets later at a fixed price. The segregated assets may consist of cash, U.S.
SEI Institutional Managed Trust
401
Notes to Financial Statements/ Notes to Consolidated Financial Statements (Continued)
September 30, 2023
Government securities, or other liquid securities at least equal in value to the obligations under the reverse repurchase agreements. In the event the buyer of securities under a reverse repurchase agreement files for bankruptcy or becomes insolvent, a Fund’s use of the proceeds under the agreement may be restricted pending a determination by the other party, or its trustee or receiver, whether to enforce the obligation to repurchase the securities.
Classes — Class-specific expenses are borne by that class of shares. Income, realized and unrealized gains/losses and non class-specific expenses are allocated to the respective class on the basis of relative daily net assets.
Expenses — Expenses that are directly related to a Fund are charged directly to that Fund. Other operating expenses of the Funds are prorated to the Funds on the basis of relative daily net assets.
Commodity-Linked Investments — To the extent consistent with its Investment Objective and Strategies, the Multi-Asset Accumulation Fund, Multi-Asset Inflation Managed and Dynamic Asset Allocation Fund may invest in commodity investments to provide exposure to the investment returns of the commodities markets. Commodity investments include notes with interest payments that are tied to an underlying commodity or commodity index, ETFs or other exchange-traded products that are tied to the performance of a commodity or commodity index or other types of investment vehicles or instruments that provide returns that are tied to commodities or commodity indices. The Multi-Asset Accumulation, Multi-Asset Inflation Managed and Dynamic Asset Allocation Funds may also invest in equity securities of issuers in commodity-related industries.
The Multi-Asset Accumulation, Multi-Asset Inflation Managed and Dynamic Asset Allocation Funds may also seek to gain exposure to the commodity markets, in whole or in part, through investments in a wholly owned Subsidiary. A Subsidiary, unlike the Fund, may invest to a significant extent directly in commodities and in equity-linked securities and commodity-linked derivative instruments, including options, futures contracts, swaps, options on futures contracts and commodity-linked structured notes. A Subsidiary may also invest in other instruments in which the Fund is permitted to invest, either as investments or to serve as margin or collateral for its derivative positions. A Fund may invest up to 25% of its total assets in its Subsidiary.
In order for a Fund to qualify as a regulated investment company under Subchapter M of the Code, the Fund must derive at least 90% of its gross income each taxable year from qualifying income. The status of
certain commodity-linked derivative instruments as qualifying income has been addressed in Revenue Ruling 2006-1 and Revenue Ruling 2006-31 which provide that income from certain commodity-linked derivative instruments in which the Fund invests will not be considered qualifying income. To the extent the Multi-Asset Accumulation, Multi-Asset Inflation Managed, and Dynamic Asset Allocation Funds invest in such instruments directly, each Fund will seek to restrict its income from commodity-linked derivative instruments that do not generate qualifying income, such as commodity-linked swaps, to a maximum of 10% of its gross income (when combined with its other investments that produce non-qualifying income).
Foreign Currency Translation — The books and records of the Funds are maintained in U.S. dollars on the following basis:
(I) market value of investment securities, assets and liabilities at the current rate of exchange; and
(II) purchases and sales of investment securities, income and expenses at the relevant rates of exchange prevailing on the respective dates of such transactions.
The Funds do not isolate that portion of gains and losses on investments in investment securities that is due to changes in the foreign exchange rates from that which is due to changes in market prices of investment securities.
The Funds report certain foreign-currency-related transactions as components of realized gains for financial reporting purposes, whereas such components are treated as ordinary income for Federal income tax purposes.
Forward Foreign Currency Contracts — To the extent consistent with its Investment Objective and Strategies, a Fund may enter into forward foreign currency contracts as hedges against either specific transactions, fund positions or anticipated fund positions. A Fund may also engage in currency transactions to enhance that Fund’s returns. All commitments are “marked-to-market” daily at the applicable foreign exchange rate, and any resulting unrealized gains or losses are recorded currently. The Funds realize gains and losses at the time forward contracts are extinguished. Unrealized gains or losses on outstanding positions in forward foreign currency contracts held at the close of the period are recognized as ordinary income or loss for Federal income tax purposes.
The Funds could be exposed to risk if the counterparties to the contracts are unable to meet the terms of the contract and from unanticipated movements in the value of a foreign currency relative to the U.S. dollar.
402
SEI Institutional Managed Trust
Finally, the risk exists that losses could exceed amounts disclosed on the Statements of Assets and Liabilities or Consolidated Statements of Assets and Liabilities. Refer to each Fund’s Schedule of Investments or Consolidated Schedule of Investments for details regarding open forward foreign currency contracts as of September 30, 2023, if applicable.
Futures Contracts — To the extent consistent with its Investment Objective and Strategies, a Fund may use futures contracts for tactical hedging purposes as well as to enhance the Fund’s returns. In addition, fixed income funds will utilize futures contracts to help manage duration and yield curve exposure. Initial margin deposits of cash or securities are made upon entering into futures contracts. The contracts are marked to market daily and the resulting changes in value are accounted for as unrealized gains and losses. Variation margin payments are paid or received, depending upon whether unrealized gains or losses are incurred. When the contract is closed, the Funds record a realized gain or loss equal to the difference between the proceeds from (or cost of) the closing transaction and the amount invested in the contract.
Risks of entering into futures contracts include the possibility that there will be an imperfect price correlation between the futures and the underlying securities. Second, it is possible that a lack of liquidity for futures contracts could exist in the secondary market, resulting in an inability to close a position prior to its maturity date. Third, the futures contract involves the risk that the Fund could lose more than the original margin deposit required to initiate a futures transaction.
Finally, the risk exists that losses could exceed amounts disclosed on the Statements of Assets and Liabilities or Consolidated Statements of Assets and Liabilities. Refer to each Fund’s Schedule of Investments or Consolidated Schedule of Investments for details regarding open futures contracts as of September 30, 2023, if applicable.
Inflation-Indexed Bonds — Inflation-indexed bonds are fixed income securities whose principal value is periodically adjusted according to the rate of inflation. If the index measuring inflation rises or falls, the principal value of inflation-indexed bonds will be adjusted upward or downward, and consequently the interest payable on these securities calculated with respect to a larger or smaller principal amount) will be increased or reduced, respectively. Any upward or downward adjustment in the principal amount of an inflation-indexed bond will be included in interest income in the Statement of Operations, even though investors do not receive their principal until maturity. Repayment of the original bond principal upon maturity (as adjusted for inflation)
is guaranteed in the case of U.S. Treasury inflation-indexed bonds. For bonds that do not provide a similar guarantee, the adjusted principal value of the bond repaid at maturity may be less than the original principal.
Master Limited Partnerships — Investments in units of master limited partnerships (“MLPs”) involve risks that differ from an investment in common stock. Holders of the units of master limited partnerships have more limited control and limited rights to vote on matters affecting the partnership. There are also certain tax risks associated with an investment in units of master limited partnerships. In addition, conflicts of interest may exist between common unit holders, subordinated unit holders and the general partner of a master limited partnership, including a conflict arising as a result of incentive distribution payments. The benefit a Fund derives from investment in MLP units is largely dependent on the MLPs being treated as partnerships and not as corporations for federal income tax purposes. If an MLP were classified as a corporation for federal income tax purposes, there would be reduction in the after-tax return to a Fund of distributions from the MLP, likely causing a reduction in the value of a Fund's shares. MLP entities are typically focused in the energy, natural resources and real estate sectors of the economy. A downturn in the energy, natural resources or real estate sectors of the economy could have an adverse impact on a Fund. At times, the performance of securities of companies in the energy, natural resources and real estate sectors of the economy may lag the performance of other sectors or the broader market as a whole.
Options/Swaptions Writing/Purchasing —To the extent consistent with its Investment Objective and Strategies, a Fund may invest in financial options/swaptions contracts for the purpose of hedging its existing fund securities or to enhance the Fund’s returns. When a Fund writes or purchases an option/swaption, an amount equal to the premium received or paid by the Fund is recorded as a liability or an asset and is subsequently adjusted to the current market value of the option/swaption written or purchased. Premiums received or paid from writing or purchasing options/swaptions which expire unexercised are treated by the Fund on the expiration date as realized gains or losses. The difference between the premium and the amount paid or received on effecting a closing purchase or sale transaction, including brokerage commissions, is also treated as a realized gain or loss. If an option/swaption is exercised, the premium paid or received is added to the cost of the purchase or proceeds from the sale in determining whether the Fund has realized a gain or a loss on investment transactions.
The risk in writing a call option/swaption is that the Funds give up the opportunity for profit if the market
SEI Institutional Managed Trust
403
Notes to Financial Statements/ Notes to Consolidated Financial Statements (Continued)
September 30, 2023
price of the security increases. The risk in writing a put option/swaption is that the Funds may incur a loss if the market price of the security decreases and the option/swaption is exercised. The risk in purchasing an option/swaption is that the Funds pay a premium whether or not the option/swaption is exercised. The Funds also have the additional risk of being unable to enter into a closing transaction at an acceptable price if a liquid secondary market does not exist. Option/swaption contracts also involve the risk that they may not work as intended due to unanticipated developments in market conditions or other causes.
Finally, the risk exists that losses on written options could exceed amounts disclosed on the Statements of Assets and Liabilities. Refer to each Fund’s Schedule of Investments or Consolidated Schedule of Investments for details regarding open option/swaption contracts as of September 30, 2023, if applicable.
Securities Sold Short —To the extent consistent with its Investment Objective and Strategies, a Fund may engage in short sales. Short sales are transactions under which a Fund sells a security it does not own. To complete such a transaction, the Fund must borrow the security to make delivery to the buyer. A Fund then is obligated to replace the security borrowed by purchasing the security at the market price at the time of the replacement. The price at such time may be more or less than the price at which the security was sold by a Fund. Until the security is replaced, a Fund is required to pay the lender amounts equal to any dividends or interest that accrue during the period of the loan. Dividends and interest are shown as an expense for financial reporting purposes. To borrow the security, a Fund also may be required to pay a premium, which would decrease proceeds of the security sold. The proceeds of the short sale are retained by the broker, to the extent necessary to meet margin requirements, until the short position is closed out. A gain, limited to the price at which a Fund sold the security short, or a loss, potentially unlimited in size, will be recognized upon the close of a short sale.
Refer to each Fund’s Schedule of Investments or Consolidated Schedule of Investments for details regarding securities sold short as of September 30, 2023, if applicable.
Swap Agreements — To the extent consistent with its Investment Objective and Strategies, a Fund may invest in swap contracts as an efficient means to synthetically obtain exposure to securities or baskets of securities and to manage a Fund’s interest rate duration and yield curve exposure. Swap contracts may also be used to mitigate a Fund’s overall level of risk and/or a Fund’s risk to particular types of securities, currencies or market
segments. Interest rate swaps may further be used to manage a Fund’s yield spread sensitivity. A Fund may buy credit default swaps in an attempt to manage credit risk where a Fund has credit exposure to an issuer, and a Fund may sell credit default swaps to more efficiently gain credit exposure to a security or basket of securities. A swap agreement is a two-party contract under which an agreement is made to exchange returns from predetermined investments or instruments, including a particular interest rate, foreign currency, or “basket” of securities representing a particular index. Swap agreements are privately negotiated in the over-the-counter market (“OTC swaps”) or may be executed in a multilateral or other trade facility platform, such as a registered commodities exchange (“Centrally Cleared swaps”). Interest rate swaps involve the exchange by a Fund with another party of their respective commitments to pay or receive interest (e.g., an exchange of floating rate payments for fixed rate payments) with respect to a notional amount of principal. Credit-default swaps involve periodic payments by a Fund or counterparty based on a specified rate multiplied by a notional amount assigned to an underlying debt instrument or group of debt instruments in exchange for the assumption of credit risk on the same instruments. In the event of a credit event, usually in the form of a credit rating downgrade, the party receiving periodic payments (i.e. floating rate payer) must pay the other party (i.e. fixed rate payer) an amount equal to the recovery rate used to settle the contracts. The recovery rate is a function of how many credit default swap investors wish to deliver the security or receive the security. The recovery rate is determined through an auction process. Total return swaps allow an investor to benefit from the cash flow without ever actually owning the underlying security. The receiver must pay any decline in value to the payer at the end of the total return swap. However, the investor does not need to make a payment if there is no decline in price. Payments can be made on various indices, bonds (i.e. mortgage backed securities, bank debt and corporate), loans or commodities. The value of a total return swap is equal to the change in value of the underlying asset versus the accrued income payment based on SOFR, LIBOR or some other form of indices on the notional amount. Payments received or made are recorded as realized gains or loss. A Fund could be exposed to credit or market risk due to unfavorable changes in the fluctuation of interest rates or if the counterparty defaults on its obligation to perform. Risk of loss may exceed amounts recognized on the statement of assets and liabilities. Interest rate swap contracts outstanding at year end, if any, are listed after a Fund’s
404
SEI Institutional Managed Trust
portfolio. In connection with swap agreements securities may be set aside as collateral by a Fund’s custodian.
Swaps are marked-to-market daily based upon quotations from market makers and the resulting changes in market values, if any, are recorded as an unrealized gain or loss in the Statement of Operations or Consolidated Statement of Operations. Centrally cleared swaps are valued at the settlement price established each day by the board of exchange on which they are traded. The daily settlement prices for centrally cleared swaps are provided by an independent source. Net payments of interest are recorded as realized gains or losses. Daily changes in valuation of Centrally Cleared swaps, if any, are recorded as a receivable or payable for the change in value as appropriate (“variation margin”) on the Statements of Assets and Liabilities or Consolidated Statement of Assets and Liabilities.
Entering into swap agreements involves, to varying degrees, elements of credit and market risk in excess of the amounts recognized on the Statement of Assets and Liabilities or Consolidated Statement of Assets and Liabilities. Such risks involve the possibility that there will be no liquid market for these agreements, that the counterparty to the agreement may default on its obligation to perform and that there may be unfavorable changes in the fluctuation of interest rates. Risks also arise from potential losses from adverse market movements.
This risk is mitigated by having a master netting arrangement between a Fund and the counterparty and by having the counterparty post collateral to cover a Fund’s exposure to the counterparty. See Note 3 for further details. Refer to each Fund’s Schedule of Investments or Consolidated Schedule of Investments for details regarding open swap agreements as of September 30, 2023, if applicable.
Delayed Delivery Transactions — To the extent consistent with its Investment Objective and Strategies, a Fund may purchase or sell securities on a when-issued or delayed delivery basis. These transactions involve a commitment by the Fund to purchase or sell securities for a predetermined price or yield, with payment and delivery taking place beyond the customary settlement period. When delayed delivery purchases are outstanding, the Fund will set aside liquid assets in an amount sufficient to meet the purchase price. When purchasing a security on a delayed delivery basis, the Fund assumes the rights and risks of ownership of the security, including the risk of price and yield fluctuations, and takes such fluctuations into account when determining its net asset value. The Fund may dispose of or renegotiate a delayed delivery transaction after it is entered into, and may sell when-issued securities before
they are delivered, which may result in a capital gain or loss. When the Fund has sold a security on delayed delivery basis, the Fund does not participate in future gains and losses with respect to the security.
Participation Notes (P-Notes) — To the extent consistent with its Investment Objective and Strategies, a Fund may acquire P-Notes issued by participating banks or broker-dealers. P-Notes are participation interest notes that are designed to offer a return linked to a particular underlying equity, debt, currency or market. The P-Notes in which the Fund may invest will typically have a maturity of one year. When purchasing a P-Note, the posting of margin is not required because the full cost of the P-Note (plus commission) is paid at the time of purchase. When the P-Note matures, the issuer will pay to, or receive from, the purchaser the difference between the minimal value of the underlying instrument at the time of purchase and that instrument’s value at maturity. Investments in P-Notes involve the same risks associated with a direct investment in the underlying foreign companies of foreign securities markets that they seek to replicate.
In addition, there can be no assurance that the trading price of P-Notes will equal the underlying value of the foreign companies or foreign securities markets that they seek to replicate. The holder of a participation note that is linked to a particular underlying security is entitled to receive any dividends paid in connection with an underlying security or instrument. However, the holder of a participation note does not receive voting rights as it would if it directly owned the underlying security or instrument. P-Notes are generally traded over-the- counter. P-Notes constitute general unsecured contractual obligations of the banks or broker-dealers that issue them and the counterparty. There is also counterparty risk associated with these investments because the Fund is relying on the creditworthiness of such counterparty and has no rights under a participation note against the issuer of the underlying security. In addition, the Fund will incur transaction costs as a result of investments in P-Notes.
Loan Participations and Brady Bonds — To the extent consistent with its Investment Objective and Strategies, a Fund may invest in Loan Participations. Loan Participations include fixed and floating rate loans that are privately negotiated between a corporate borrower and one or more financial institutions, including, but not limited to, term loans, revolvers, and other instruments issued in the bank loan market. Each Fund may acquire interests in loans directly (by way of assignment from the selling institution) or indirectly (by way of the purchase of a participation interest from the selling institution). Under a bank loan assignment, a Fund generally will succeed to all the rights and obligations of an assigning
SEI Institutional Managed Trust
405
Notes to Financial Statements/ Notes to Consolidated Financial Statements (Continued)
September 30, 2023
lending institution and becomes a lender under the loan agreement with the relevant borrower in connection with that loan. Under bank loan participation, the Fund generally will have a contractual relationship only with the lender, not with the relevant borrower. As a result, a Fund generally will have the right to receive payments of principal, interest, and any fees to which it is entitled only from the lender selling the participation and only upon receipt by the lender of the payments from the relevant borrower. The Fund may not directly benefit from the collateral supporting the debt obligation in which it has purchased the participation. As a result, a Fund will assume the credit risk of both the borrower and the institution selling the participation to the Fund. The interest rate indicated in the Fund’s Schedule of Investments is the rate in effect at September 30, 2023. Pursuant to the terms of certain loan agreements, the Funds may hold unfunded commitments in loan participations which are disclosed on the Statement of Assets and Liabilities. Unfunded commitments represent the remaining obligation of the Fund to the borrower. At any point in time, up to the maturity date of the issue, the borrower may demand the unfunded portion. Unfunded amounts, if any, are marked to market and any unrealized gains or losses are recorded in the Statement of Assets and Liabilities. The Funds disclosed consent fees and amendment income in the Statement of Operations as “Interest income”.
Certain debt obligations, customarily referred to as “Brady Bonds,” are created through the exchange of existing commercial bank loans to foreign entities for new obligations in connection with debt restructuring under a plan introduced by former U.S. Secretary of the Treasury Nicholas F. Brady. Brady Bonds have only been issued since 1989, and, accordingly, do not have a long payment history. They are issued by governments that may have previously defaulted on the loans being restructured by the Brady Bonds, so they are subject to the risk of default by the issuer. They may be fully or partially collateralized or uncollateralized and issued in various currencies.
Collateralized Debt Obligations — To the extent consistent with its Investment Objective and Strategies, a Fund may invest in collateralized debt obligations (“CDOs”), which include collateralized loan obligations (“CLOs”) and other similarly structured securities. CLOs are a type of asset-backed securities. A CLO is a trust typically collateralized by a pool of loans, which may include, among others, domestic and foreign senior secured loans, senior unsecured loans, and subordinate corporate loans, including loans that may be rated below investment grade or equivalent unrated loans.
CDOs may charge management fees and administrative expenses.
For CDOs, the cash flows from the trust are split into two or more portions, called tranches, varying in risk and yield. The riskiest portion is the “equity” tranche which bears the bulk of defaults from the bonds or loans in the trust and serves to protect the other, more senior tranches from default in all but the most severe circumstances. Since it is partially protected from defaults, a senior tranche from a CDO trust typically has a higher rating and lower yield than its underlying securities, and can be rated investment grade. Despite the protection from the equity tranche, CDO tranches can experience substantial losses due to actual defaults, increased sensitivity to defaults due to collateral default and disappearance of protecting tranches, market anticipation of defaults, as well as aversion to CDO securities as a class.
The risks of an investment in a CDO depend largely on its Class and its collateral securities. Normally, CLOs and other CDOs are privately offered and sold, and thus, are not registered under the securities laws. As a result, investments in CDOs may be characterized by the Funds as illiquid securities; however, an active dealer market may exist for CDOs, allowing a CDO to qualify for Rule 144A transactions. In addition to the normal risks associated with fixed income securities (e.g., interest rate risk and default risk), CDOs carry additional risks including, but not limited to: (i) the possibility that distributions from collateral securities will not be adequate to make interest or other payments; (ii) the quality of the collateral may decline in value or default; (iii) the Funds may invest in CDOs that are subordinate to other classes; and (iv) the complex structure of the security may not be fully understood at the time of investment and may produce disputes with the issuer or unexpected investment results.
Dividends and Distributions to Shareholders — Dividends from net investment income are declared and paid to shareholders quarterly for the Large Cap, Large Cap Value, Large Cap Growth, Large Cap Index, Tax-Managed Large Cap, S&P 500 Index, Small Cap, Small Cap Value, Small Cap Growth, Tax-Managed Small/Mid Cap, Mid-Cap, U.S. Managed Volatility, Tax-Managed Managed Volatility, Real Estate and Real Return Funds; are declared and paid annually for the Global Managed Volatility, Tax-Managed International Managed Volatility, Multi-Strategy Alternative, Liquid Alternative, Multi-Asset Accumulation, Multi-Asset Inflation Managed, Multi-Asset Capital Stability and Dynamic Asset Allocation; are declared daily and paid monthly for the Core Fixed Income, High Yield Bond, Conservative Income, Tax-Free Conservative Income and Multi-Asset Income.
406
SEI Institutional Managed Trust
Any net realized capital gains on sales of securities are distributed to shareholders at least annually. Dividends and distributions are recorded on the ex-dividend date.
Restricted Securities — The Funds may invest in private placement investments that were purchased through private offerings or acquired through initial public offerings and cannot be sold without prior registration under the Securities Act of 1933 or pursuant to an exemption therefrom. In addition, the Funds have generally agreed to further restrictions on the disposition of certain holdings as set forth in various agreements entered into in connection with the purchase of these investments. These investments are valued at fair value as determined in accordance with the procedures approved by the Board. Please refer to the Schedule of Investments for Funds that held Restricted Securities.
Investments in Real Estate Investment Trust — With respect to the Real Estate Fund, dividend income is recorded based on the income included in distributions received from the Real Estate Investment Trust (“REIT”) investments using published REIT reclassifications including some management estimates when actual amounts are not available. Distributions received in excess of this estimated amount are recorded as a reduction of the cost of investments or reclassified to capital gains. The actual amounts of income, return of capital, and capital gains are only determined by each REIT after its fiscal year end, and may differ from the estimated amounts.
Deferred Offering Costs — Offering costs, including costs of printing initial prospectus, legal and registration fees, are amortized over twelve-months from inception of the Funds.
Investment in Subsidiary — Each of the Multi-Asset Accumulation, Multi-Asset Inflation Managed and Dynamic Asset Allocation Funds may invest in its own Subsidiary. By investing in a Subsidiary, each Fund is indirectly exposed to the risks associated with such Subsidiary’s investments. The commodity-related instruments held by a Subsidiary are generally similar to those that are permitted to be held by the applicable Fund and are subject to the same risks that apply to similar investments if held directly by the Fund. A Subsidiary, however, is not registered under the 1940 Act and will not be subject to all of the investor protections of the 1940 Act. Thus, the Multi-Asset Accumulation, Multi-Asset Inflation Managed and Dynamic Asset Allocation Funds, as investors in their respective Subsidiary, will not have all of the protections offered to investors in registered investment companies.
However, each Fund wholly owns and controls its respective Subsidiary, and the Funds and the Subsidiaries are all managed by SIMC, making it unlikely
that a Subsidiary will take action contrary to the interests of the applicable Fund or its shareholders. While a Subsidiary has its own Board of Directors (“Directors”) that is responsible for overseeing the operations of such Subsidiary, the respective Fund’s Directors have oversight responsibility for the investment activities of the Fund, including its investment in the respective Subsidiary, and the Fund’s role as the sole shareholder of such Subsidiary. It is not currently expected that shares of any Subsidiary will be sold or offered to investors other than the respective Fund.
Changes in the laws of the United States and/or the Cayman Islands or governmental interpretation of such laws, under which the Funds and the Subsidiaries, respectively, are organized, could result in the inability of a Fund and/or its respective Subsidiary to operate as intended and could negatively affect the Funds and their shareholders. For example, Cayman Islands law does not currently impose any income, corporate or capital gains tax, estate duty, inheritance tax, gift tax or withholding tax on the Subsidiaries. If Cayman Islands law changes such that the Subsidiaries must pay Cayman Islands governmental authority taxes, Fund shareholders would likely suffer decreased investment return.
3. CREDIT DERIVATIVES
A Fund may use credit default swaps to reduce risk where a Fund has exposure to the issuer, or to take an active long or short position with respect to the likelihood of an event of default. The reference obligation of the swap can be a single issuer, a “basket” of issuers, or an index. The underlying referenced assets are corporate debt, sovereign debt and asset backed securities.
The buyer of a credit default swap is generally obligated to pay the seller a periodic stream of payments over the term of the contract in return for a contingent payment upon the occurrence of a credit event with respect to an underlying reference obligation. Generally, a credit event for corporate or sovereign reference obligations means bankruptcy, failure to pay, obligation acceleration, repudiation/moratorium or restructuring. For credit default swaps on asset-backed securities, a credit event may be triggered by events such as failure to pay principal, maturity extension, rating downgrade or write-down.
If a Fund is a seller of protection, and a credit event occurs, as defined under the terms of that particular swap agreement, a Fund will generally either (i) pay to the buyer an amount equal to the notional amount of the swap and take delivery of the referenced obligation, other deliverable obligations, or underlying securities comprising a referenced index or (ii) pay a net settlement
SEI Institutional Managed Trust
407
Notes to Financial Statements/ Notes to Consolidated Financial Statements (Continued)
September 30, 2023
amount in the form of cash or securities equal to the notional amount of the swap less the recovery value of the referenced obligation or underlying securities comprising a referenced index.
If a Fund is a buyer of protection and a credit event occurs, as defined under the terms of that particular swap agreement, a Fund will either (i) receive from the seller of protection an amount equal to the notional amount of the swap and deliver the referenced obligation, other deliverable obligations or underlying securities comprising the referenced index or (ii) receive a net settlement amount in the form of cash or securities equal to the notional amount of the swap less the recovery value of the referenced obligation or underlying securities comprising the referenced index. Recovery values are calculated by market makers considering either industry standard recovery rates or entity specific factors and considerations until a credit event occurs. If a credit event has occurred, the recovery value is determined by a facilitated auction whereby a minimum number of allowable broker bids, together with a specified valuation method, are used to calculate the settlement value.
Certain Funds are party to International Swap Dealers Association, Inc. Master Agreements (“ISDA Master Agreements”). These agreements are with select counterparties and they govern transactions, including certain over-the counter derivative and foreign exchange contracts, entered into by the Funds and the counterparty.
The notional amounts of the swaps are not recorded in the financial statements. The notional amounts approximate the maximum potential amount of future payments that the Fund could be required to make if the Fund was the seller of protection and a credit event was to occur.
Those credit default swaps (“CDS”) for which the Fund is providing protection at the balance sheet date are summarized as follows:
MAXIMUM POTENTIAL AMOUNT OF FUTURE PAYMENTS BY CONTRACT TERM | ||||||||||||||||||||||||
CORE FIXED INCOME FUND | 0-6 MONTHS | 6-12 MONTHS | 1-5 YEARS | 5-10 YEARS | > 10 YEARS | Total | ||||||||||||||||||
Current credit spread* on underlying (in basis points) | ||||||||||||||||||||||||
0-100 | $ | - | $ | - | $ | - | $ | 127,394,600 | $ | - | $ | 127,394,600 | ||||||||||||
101-200 | - | - | - | - | - | - | ||||||||||||||||||
> than 200 | - | - | - | - | - | - | ||||||||||||||||||
Total | $ | - | $ | - | $ | - | $ | 127,394,600 | $ | - | $ | 127,394,600 | ||||||||||||
MULTI-ASSET INCOME FUND | 0-6 MONTHS | 6-12 MONTHS | 1-5 YEARS | 5-10 YEARS | > 10 YEARS | Total | ||||||||||||||||||
Current credit spread* on underlying (in basis points) | ||||||||||||||||||||||||
0-100 | $ | - | $ | 525,000 | $ | 31,040,000 | $ | 2,115,600 | $ | - | $ | 33,680,600 | ||||||||||||
101-200 | - | - | 1,450,000 | 1,160,000 | - | 2,610,000 | ||||||||||||||||||
201-300 | - | - | - | - | - | - | ||||||||||||||||||
301-400 | - | - | 6,091,500 | - | - | 6,091,500 | ||||||||||||||||||
> than 400 | - | - | - | - | - | - | ||||||||||||||||||
Total | $ | - | $ | 525,000 | $ | 38,581,500 | $ | 3,275,600 | $ | - | $ | 42,382,100 | ||||||||||||
MULTI-ASSET INFLATION MANAGED FUND | 0-6 MONTHS | 6-12 MONTHS | 1-5 YEARS | 5-10 YEARS | > 10 YEARS | Total | ||||||||||||||||||
Current credit spread* on underlying (in basis points) | ||||||||||||||||||||||||
0-100 | $ | - | $ | - | $ | - | $ | 14,530,000 | $ | - | $ | 14,530,000 | ||||||||||||
101-200 | - | - | - | - | - | - | ||||||||||||||||||
201-400 | - | - | - | - | - | - | ||||||||||||||||||
> than 400 | - | - | 7,817,000 | 669,588 | - | 8,486,588 | ||||||||||||||||||
Total | $ | - | $ | - | $ | 7,817,000 | $ | 15,199,588 | $ | - | $ | 23,016,588 | ||||||||||||
MULTI-ASSET CAPITAL STABILITY FUND | 0-6 MONTHS | 6-12 MONTHS | 1-5 YEARS | 5-10 YEARS | > 10 YEARS | Total | ||||||||||||||||||
Current credit spread* on underlying (in basis points) | ||||||||||||||||||||||||
0-100 | $ | - | $ | - | $ | 3,100,000 | $ | - | $ | - | $ | 3,100,000 | ||||||||||||
301-400 | - | - | 835,701 | - | - | 835,701 | ||||||||||||||||||
> than 400 | - | - | 3,830,000 | - | - | 3,830,000 | ||||||||||||||||||
Total | $ | - | $ | - | $ | 7,765,701 | $ | - | $ | - | $ | 7,765,701 | ||||||||||||
408
SEI Institutional Managed Trust
* | The credit spread on the underlying asset is generally indicative of the current status of the underlying risk of the Fund having to perform. The spread also reflects the cost of buying/selling protection and may include upfront payments required to be made to enter into a contract. Higher credit spreads with a shorter contract term is indicative of a higher likelihood of performance by the Fund. |
The credit spread disclosed above for each reference obligation where the Fund is the seller of protection is a representation of the current payment/performance risk of the swap.
4. DERIVATIVE TRANSACTIONS
The following tables show the derivatives categorized by underlying risk exposure.
The fair value of derivative instruments as of September 30, 2023 was as follows ($ Thousands):
Asset Derivatives | Liability Derivatives | |||||||||
Statement of Assets and Liabilities/ Consolidated | Fair Value | Statement of Assets and Liabilities/ Consolidated | Fair Value | |||||||
Derivatives not accounted for as hedging instruments: | ||||||||||
Large Cap Fund | ||||||||||
Equity contracts | Unrealized appreciation on | $ | — | * | Unrealized depreciation on futures contracts | $ | 240 | * | ||
Total Derivatives not accounted for as hedging instruments | $ | — | $ | 240 | ||||||
Large Cap Value Fund | ||||||||||
Equity contracts | Unrealized appreciation on | $ | — | * | Unrealized depreciation on futures contracts | $ | 71 | * | ||
Total Derivatives not accounted for as hedging instruments | $ | — | $ | 71 | ||||||
Large Cap Growth Fund | ||||||||||
Equity contracts | Unrealized appreciation on | $ | 3 | * | Unrealized depreciation on futures contracts | $ | 69 | * | ||
Unrealized appreciation on | — | † | Unrealized depreciation on | 696 | † | |||||
Total Derivatives not accounted for as hedging instruments | $ | 3 | $ | 765 | ||||||
Large Cap Index Fund | ||||||||||
Equity contracts | Unrealized appreciation on | $ | 1 | * | Unrealized depreciation on futures contracts | $ | 607 | * | ||
Total Derivatives not accounted for as hedging instruments | $ | 1 | $ | 607 | ||||||
Tax-Managed Large Cap Fund | ||||||||||
Equity contracts | Unrealized appreciation on | $ | — | * | Unrealized depreciation on futures contracts | $ | 366 | * | ||
Total Derivatives not accounted for as hedging instruments | $ | — | $ | 366 | ||||||
S&P 500 Index Fund | ||||||||||
Equity contracts | Unrealized appreciation on | $ | — | * | Unrealized depreciation on futures contracts | $ | 953 | * | ||
Total Derivatives not accounted for as hedging instruments | $ | — | $ | 953 | ||||||
U.S. Managed Volatility Fund | ||||||||||
Equity contracts | Unrealized appreciation on | $ | — | * | Unrealized depreciation on futures contracts | $ | 249 | * | ||
Total Derivatives not accounted for as hedging instruments | $ | — | $ | 249 | ||||||
Global Managed Volatility Fund | ||||||||||
Equity contracts | Unrealized appreciation on | $ | 2 | * | Unrealized depreciation on futures contracts | 185 | * | |||
Foreign exchange contracts | Unrealized gain on forward foreign | 2,137 | Unrealized loss on forward foreign | 289 | ||||||
Total Derivatives not accounted for as hedging instruments | $ | 2,139 | $ | 474 | ||||||
SEI Institutional Managed Trust
409
Notes to Financial Statements/ Notes to Consolidated Financial Statements (Continued)
September 30, 2023
Asset Derivatives | Liability Derivatives | |||||||||
Statement of Assets and Liabilities/ Consolidated Statement of Assets and Liabilities Location | Fair Value | Statement of Assets and Liabilities/ Consolidated Statement of Assets and Liabilities Location | Fair Value | |||||||
Tax-Managed Managed Volatility Fund | ||||||||||
Equity contracts | Unrealized appreciation on | $ | — | * | Unrealized depreciation on futures contracts | $ | 201 | * | ||
Total Derivatives not accounted for as hedging instruments | $ | — | $ | 201 | ||||||
Tax-Managed International Managed Volatility Fund | ||||||||||
Equity contracts | Unrealized appreciation on | $ | 5 | * | Unrealized depreciation on futures contracts | $ | 4 | * | ||
Total Derivatives not accounted for as hedging instruments | $ | 5 | $ | 4 | ||||||
Core Fixed Income Fund | ||||||||||
Interest rate contracts | Investments, at value** | $ | 1,378 | Options written, at value | $ | 2,165 | ||||
Unrealized appreciation on | $ | 3,113 | * | Unrealized depreciation on | $ | 9,519 | * | |||
Unrealized appreciation on | 9,387 | † | Unrealized depreciation on | 1,764 | † | |||||
Foreign exchange contracts | Unrealized gain on forward foreign | 606 | Unrealized loss on forward foreign | 1,838 | ||||||
Investments, at value** | 6 | Options written, at value | — | |||||||
Credit contracts | Unrealized appreciation on | — | † | Unrealized depreciation on swap contracts | 120 | † | ||||
Total Derivatives not accounted for as hedging instruments | $ | 14,490 | $ | 15,406 | ||||||
High Yield Bond Fund | ||||||||||
Foreign exchange contracts | Unrealized gain on forward foreign | $ | — | Unrealized loss on forward foreign | $ | 2 | ||||
Total Derivatives not accounted for as hedging instruments | $ | — | $ | 2 | ||||||
Dynamic Asset Allocation Fund | ||||||||||
Equity contracts | Unrealized appreciation on | $ | — | * | Unrealized depreciation on | $ | 2,699 | * | ||
Unrealized appreciation on | — | † | Unrealized depreciation on swap contracts | 6,903 | † | |||||
Investments, at value** | 6,937 | Options and Swaptions written, at value | 1,514 | |||||||
Interest Rate contracts | Unrealized appreciation on | 6,427 | † | Unrealized depreciation on swap contracts | 675 | † | ||||
Commodity contracts | Unrealized appreciation on | — | † | Unrealized depreciation on swap contracts | 588 | † | ||||
Total Derivatives not accounted for as hedging instruments | $ | 13,364 | $ | 12,379 | ||||||
Multi-Strategy Alternative Fund | ||||||||||
Equity contracts | Investments, at value** | $ | 65 | Options and Swaptions written, at value | $ | 13 | ||||
Foreign exchange contracts | Unrealized gain on forward foreign | 13 | Unrealized loss on forward foreign | 2 | ||||||
Credit contracts | Unrealized appreciation on | 14 | † | Unrealized depreciation on | 75 | † | ||||
Total Derivatives not accounted for as hedging instruments | $ | 92 | $ | 90 | ||||||
410
SEI Institutional Managed Trust
Asset Derivatives | Liability Derivatives | |||||||||
Statement of Assets and Liabilities/ Consolidated Statement of Assets and Liabilities Location | Fair Value | Statement of Assets and Liabilities/ Consolidated Statement of Assets and Liabilities Location | Fair Value | |||||||
Liquid Alternative Fund | ||||||||||
Interest rate contracts | Unrealized appreciation on | $ | 194 | * | Unrealized depreciation on futures contracts | $ | 3 | * | ||
Foreign exchange contracts | Unrealized appreciation on | 46 | * | Unrealized depreciation on futures contracts | 5 | * | ||||
Equity contracts | Unrealized appreciation on | 5 | * | Unrealized depreciation on futures contracts | 105 | * | ||||
Total Derivatives not accounted for as hedging instruments | $ | 245 | $ | 113 | ||||||
Multi-Asset Accumulation Fund | ||||||||||
Interest rate contracts | Unrealized appreciation on | $ | 434 | * | Unrealized depreciation on futures contracts | $ | 32,021 | * | ||
Equity contracts | Unrealized appreciation on | 1,006 | * | Unrealized depreciation on | 24,309 | * | ||||
Unrealized appreciation on | 438 | † | Unrealized depreciation on | 699 | † | |||||
Foreign exchange contracts | Unrealized gain on forward foreign | 8,482 | Unrealized loss on forward foreign | 2,023 | ||||||
Commodity contracts | Unrealized appreciation on | 4,778 | * | Unrealized depreciation on future contracts | 8,987 | * | ||||
Total Derivatives not accounted for as hedging instruments | $ | 15,138 | $ | 68,039 | ||||||
Multi-Asset Income Fund | ||||||||||
Interest rate contracts | Unrealized appreciation on | Unrealized depreciation on | ||||||||
futures contracts | $ | 290 | * | futures contracts | $ | 4,254 | * | |||
Unrealized appreciation on | 1,730 | † | Unrealized depreciation on | 1,470 | † | |||||
Equity Contracts | Investments, at value** | 10 | Options and Swaptions written, at value | — | ||||||
Foreign exchange contracts | Unrealized gain on forward foreign | 1,318 | Unrealized loss on forward foreign | 917 | ||||||
Investments, at value** | 186 | Options and Swaptions written, at value | 60 | |||||||
Credit contracts | Unrealized appreciation on | 405 | † | Unrealized depreciation on | 9 | † | ||||
Total Derivatives not accounted for as hedging instruments | $ | 3,939 | $ | 6,710 | ||||||
Multi-Asset Inflation Managed Fund | ||||||||||
Interest rate contracts | Unrealized appreciation on | $ | 87 | * | Unrealized depreciation on futures contracts | $ | 392 | * | ||
Unrealized appreciation on | 2,688 | † | Unrealized depreciation on | — | † | |||||
Equity contracts | Unrealized appreciation on | 1,087 | * | Unrealized depreciation on | — | * | ||||
Investments, at value** | 17 | Options and Swaptions written, at value | 7 | |||||||
Foreign exchange contracts | Unrealized gain on forward foreign | 107 | Unrealized loss on forward foreign | — | ||||||
Commodity contracts | Unrealized appreciation on | 3,731 | * | Unrealized depreciation on future contracts | 4,230 | * | ||||
Credit contracts | Unrealized appreciation on | 48 | † | Unrealized depreciation on swaps contracts | 58 | † | ||||
Total Derivatives not accounted for as hedging instruments | $ | 7,765 | $ | 4,687 | ||||||
SEI Institutional Managed Trust
411
Notes to Financial Statements/ Notes to Consolidated Financial Statements (Continued)
September 30, 2023
Asset Derivatives | Liability Derivatives | |||||||||
Statement of Assets and Liabilities/ Consolidated Statement of Assets and Liabilities Location | Fair Value | Statement of Assets and Liabilities/ Consolidated Statement of Assets and Liabilities Location | Fair Value | |||||||
Multi-Asset Capital Stability Fund | ||||||||||
Interest rate contracts | Unrealized appreciation on | $ | 77 | * | Unrealized depreciation on futures contracts | $ | 838 | * | ||
Unrealized appreciation on | — | † | Unrealized depreciation on | 447 | † | |||||
Equity contracts | Unrealized appreciation on | 825 | * | Unrealized depreciation on | 1,850 | * | ||||
Unrealized appreciation on | 51 | † | Unrealized depreciation on | — | † | |||||
Investments, at value** | 303 | Options written, at value | 123 | |||||||
Foreign exchange contracts | Unrealized gain on forward foreign | 3,485 | Unrealized loss on forward foreign | 996 | ||||||
Credit contracts | Unrealized appreciation on | 14 | † | Unrealized depreciation on swap contracts | 19 | † | ||||
Total Derivatives not accounted for as hedging instruments | $ | 4,755 | $ | 4,273 | ||||||
* | Includes cumulative appreciation/depreciation of futures contracts as reported in the Schedules of Investments. Only current day’s variation margin is reported within the Statements of Assets & Liabilities or Consolidated Statements of Assets & Liabilities. |
† | Includes cumulative appreciation/depreciation of swap contracts as reported in the Schedules of Investments. Market Value is reported within the Statements of Assets & Liabilities or Consolidated Statements of Assets & Liabilities for swap contracts that have paid premiums. |
** Includes purchased options and/or swaptions.
The effect of derivative instruments on the Statements of Operations/Consolidated Statements of Operations for the year or period ended September 30, 2023:
Amount of realized gain or (loss) on derivatives recognized in income ($ Thousands):
Derivatives Not Accounted for as Hedging Instruments | Purchased Options and Swaptions | Written Options and Swaptions | Futures | Forward | Swaps | Total | ||||||||||||||||||
Large Cap Fund | ||||||||||||||||||||||||
Equity contracts | $ | — | $ | — | $ | 432 | $ | — | $ | — | $ | 432 | ||||||||||||
Total | $ | — | $ | — | $ | 432 | $ | — | $ | — | $ | 432 | ||||||||||||
| ||||||||||||||||||||||||
Large Cap Value Fund | ||||||||||||||||||||||||
Equity contracts | $ | — | $ | — | $ | 1,428 | $ | — | $ | — | $ | 1,428 | ||||||||||||
Total | $ | — | $ | — | $ | 1,428 | $ | — | $ | — | $ | 1,428 | ||||||||||||
| ||||||||||||||||||||||||
Large Cap Growth Fund | ||||||||||||||||||||||||
Equity contracts | $ | — | $ | — | $ | 760 | $ | — | $ | 2,876 | $ | 3,636 | ||||||||||||
Total | $ | — | $ | — | $ | 760 | $ | — | $ | 2,876 | $ | 3,636 | ||||||||||||
| ||||||||||||||||||||||||
Large Cap Index Fund | ||||||||||||||||||||||||
Equity contracts | $ | — | $ | — | $ | 326 | $ | — | $ | — | $ | 326 | ||||||||||||
Total | $ | — | $ | — | $ | 326 | $ | — | $ | — | $ | 326 | ||||||||||||
| ||||||||||||||||||||||||
Tax-Managed Large Cap Fund | ||||||||||||||||||||||||
Equity contracts | $ | — | $ | — | $ | 1,572 | $ | — | $ | — | $ | 1,572 | ||||||||||||
Total | $ | — | $ | — | $ | 1,572 | $ | — | $ | — | $ | 1,572 | ||||||||||||
| ||||||||||||||||||||||||
S&P 500 Index Fund | ||||||||||||||||||||||||
Equity contracts | $ | — | $ | — | $ | 651 | $ | — | $ | — | $ | 651 | ||||||||||||
Total | $ | — | $ | — | $ | 651 | $ | — | $ | — | $ | 651 | ||||||||||||
| ||||||||||||||||||||||||
Small Cap Fund | ||||||||||||||||||||||||
Equity contracts | $ | — | $ | — | $ | (21 | ) | $ | — | $ | — | $ | (21 | ) | ||||||||||
Total | $ | — | $ | — | $ | (21 | ) | $ | — | $ | — | $ | (21 | ) | ||||||||||
412
SEI Institutional Managed Trust
Derivatives Not Accounted for as Hedging Instruments | Purchased Options and Swaptions | Written Options and Swaptions | Futures | Forward | Swaps | Total | ||||||||||||||||||
Small Cap Value Fund | $ | $ | $ | $ | $ | $ | ||||||||||||||||||
Equity contracts | — | — | (92 | ) | — | — | (92 | ) | ||||||||||||||||
Total | $ | — | $ | — | $ | (92 | ) | $ | — | $ | — | $ | (92 | ) | ||||||||||
| ||||||||||||||||||||||||
Small Cap Growth Fund | $ | $ | $ | $ | $ | $ | ||||||||||||||||||
Equity contracts | — | — | (4 | ) | — | — | (4 | ) | ||||||||||||||||
Total | $ | — | $ | — | $ | (4 | ) | $ | — | $ | — | $ | (4 | ) | ||||||||||
| ||||||||||||||||||||||||
Tax-Managed Small/Mid Cap Fund | $ | $ | $ | $ | $ | $ | ||||||||||||||||||
Equity contracts | — | — | (25 | ) | — | — | (25 | ) | ||||||||||||||||
Total | $ | — | $ | — | $ | (25 | ) | $ | — | $ | — | $ | (25 | ) | ||||||||||
| ||||||||||||||||||||||||
Mid-Cap Fund | $ | $ | $ | $ | $ | $ | ||||||||||||||||||
Equity contracts | — | — | 83 | — | — | 83 | ||||||||||||||||||
Total | $ | — | $ | — | $ | 83 | $ | — | $ | — | $ | 83 | ||||||||||||
| ||||||||||||||||||||||||
U.S. Managed Volatility Fund | $ | $ | $ | $ | $ | $ | ||||||||||||||||||
Equity contracts | — | — | 1,314 | — | — | 1,314 | ||||||||||||||||||
Total | $ | — | $ | — | $ | 1,314 | $ | — | $ | — | $ | 1,314 | ||||||||||||
| ||||||||||||||||||||||||
Global Managed Volatility Fund | $ | $ | $ | $ | $ | $ | ||||||||||||||||||
Foreign exchange contracts | — | — | — | 4,008 | — | 4,008 | ||||||||||||||||||
Equity contracts | — | — | 1,547 | — | — | 1,547 | ||||||||||||||||||
Total | $ | — | $ | — | $ | 1,547 | $ | 4,008 | $ | — | $ | 5,555 | ||||||||||||
| ||||||||||||||||||||||||
Tax-Managed Managed Volatility Fund | $ | $ | $ | $ | $ | $ | ||||||||||||||||||
Equity contracts | — | — | 1,555 | — | — | 1,555 | ||||||||||||||||||
Total | $ | — | $ | — | $ | 1,555 | $ | — | $ | — | $ | 1,555 | ||||||||||||
| ||||||||||||||||||||||||
Tax-Managed International Managed Volatility Fund | $ | $ | $ | $ | $ | $ | ||||||||||||||||||
Foreign exchange contracts | — | — | — | (211 | ) | — | (211 | ) | ||||||||||||||||
Equity contracts | — | — | 602 | — | — | 602 | ||||||||||||||||||
Total | $ | — | $ | — | $ | 602 | $ | (211 | ) | $ | — | $ | 391 | |||||||||||
| ||||||||||||||||||||||||
Core Fixed Income Fund | $ | $ | $ | $ | $ | $ | ||||||||||||||||||
Interest rate contracts | — | — | (37,932 | ) | — | 7,588 | (30,344 | ) | ||||||||||||||||
Foreign exchange contracts | (231 | ) | 138 | — | (2,830 | ) | — | (2,923 | ) | |||||||||||||||
Credit contracts | — | — | — | — | 3,821 | 3,821 | ||||||||||||||||||
Equity contracts | (8,567 | ) | 10,713 | — | — | — | 2,146 | |||||||||||||||||
Total | $ | (8,798 | ) | $ | 10,851 | $ | (37,932 | ) | $ | (2,830 | ) | $ | 11,409 | $ | (27,300 | ) | ||||||||
| ||||||||||||||||||||||||
High Yield Bond Fund | $ | $ | $ | $ | $ | $ | ||||||||||||||||||
Interest rate contracts | — | — | — | — | (57 | ) | (57 | ) | ||||||||||||||||
Foreign exchange contracts | — | — | — | 24 | — | 24 | ||||||||||||||||||
Total | $ | — | $ | — | $ | — | $ | 24 | $ | (57 | ) | $ | (33 | ) | ||||||||||
| ||||||||||||||||||||||||
Dynamic Asset Allocation Fund | $ | $ | $ | $ | $ | $ | ||||||||||||||||||
Interest rate contracts | — | — | — | — | (1,616 | ) | (1,616 | ) | ||||||||||||||||
Foreign exchange contracts | (760 | ) | — | — | — | — | (760 | ) | ||||||||||||||||
Equity contracts | (755 | ) | 282 | 3,458 | — | (3,399 | ) | (414 | ) | |||||||||||||||
Commodity contracts | — | — | — | — | (7,890 | ) | (7,890 | ) | ||||||||||||||||
Total | $ | (1,515 | ) | $ | 282 | $ | 3,458 | $ | — | $ | (12,905 | ) | $ | (10,680 | ) | |||||||||
| ||||||||||||||||||||||||
Multi-Strategy Alternative Fund | $ | $ | $ | $ | $ | $ | ||||||||||||||||||
Interest rate contracts | — | — | (91 | ) | — | (164 | ) | (255 | ) | |||||||||||||||
Foreign exchange contracts | — | — | — | (22 | ) | — | (22 | ) | ||||||||||||||||
Credit contracts | — | — | — | — | (530 | ) | (530 | ) | ||||||||||||||||
Equity contracts | (663 | ) | �� | 324 | (43 | ) | — | (1,381 | ) | (1,763 | ) | |||||||||||||
Total | $ | (663 | ) | $ | 324 | $ | (134 | ) | $ | (22 | ) | $ | (2,075 | ) | $ | (2,570 | ) | |||||||
| ||||||||||||||||||||||||
SEI Institutional Managed Trust
413
Notes to Financial Statements/ Notes to Consolidated Financial Statements (Continued)
September 30, 2023
Derivatives Not Accounted for as Hedging Instruments | Purchased Options and Swaptions | Written Options and Swaptions | Futures | Forward | Swaps | Total | ||||||||||||||||||
Liquid Alternative Fund | $ | $ | $ | $ | $ | $ | ||||||||||||||||||
Interest rate contracts | — | — | 80 | — | — | 80 | ||||||||||||||||||
Foreign exchange contracts | — | — | (27 | ) | — | — | (27 | ) | ||||||||||||||||
Equity contracts | — | — | (105 | ) | — | — | (105 | ) | ||||||||||||||||
Total | $ | — | $ | — | $ | (52 | ) | $ | — | $ | — | $ | (52 | ) | ||||||||||
| ||||||||||||||||||||||||
Multi-Asset Accumulation Fund | $ | $ | $ | $ | $ | $ | ||||||||||||||||||
Interest rate contracts | — | — | (117,460 | ) | — | (2,718 | ) | (120,178 | ) | |||||||||||||||
Foreign exchange contracts | — | — | — | (7,679 | ) | — | (7,679 | ) | ||||||||||||||||
Equity contracts | — | — | 52,123 | — | 1,670 | 53,793 | ||||||||||||||||||
Commodity contracts | — | — | 3,022 | — | — | 3,022 | ||||||||||||||||||
Total | $ | — | $ | — | $ | (62,315 | ) | $ | (7,679 | ) | $ | (1,048 | ) | $ | (71,042 | ) | ||||||||
| ||||||||||||||||||||||||
Multi-Asset Income Fund | $ | $ | $ | $ | $ | $ | ||||||||||||||||||
Interest rate contracts | — | — | (18,279 | ) | — | 1,540 | (16,739 | ) | ||||||||||||||||
Foreign exchange contracts | (489 | ) | 535 | — | (1,362 | ) | — | (1,316 | ) | |||||||||||||||
Credit contracts | — | — | — | — | (249 | ) | (249 | ) | ||||||||||||||||
Equity contracts | (549 | ) | 735 | (106 | ) | — | — | 80 | ||||||||||||||||
Total | $ | (1,038 | ) | $ | 1,270 | $ | (18,385 | ) | $ | (1,362 | ) | $ | 1,291 | $ | (18,224 | ) | ||||||||
| ||||||||||||||||||||||||
Multi-Asset Inflation Managed Fund | $ | $ | $ | $ | $ | $ | ||||||||||||||||||
Interest rate contracts | — | — | 138 | — | 8,906 | 9,044 | ||||||||||||||||||
Foreign exchange contracts | — | — | — | (394 | ) | — | (394 | ) | ||||||||||||||||
Credit contracts | — | — | — | — | (1,018 | ) | (1,018 | ) | ||||||||||||||||
Equity contracts | (1,417 | ) | 1,357 | (3,548 | ) | — | 159 | (3,449 | ) | |||||||||||||||
Commodity contracts | — | — | (12,650 | ) | — | (1,765 | ) | (14,415 | ) | |||||||||||||||
Total | $ | (1,417 | ) | $ | 1,357 | $ | (16,060 | ) | $ | (394 | ) | $ | 6,282 | $ | (10,232 | ) | ||||||||
| ||||||||||||||||||||||||
Multi-Asset Capital Stability Fund | $ | $ | $ | $ | $ | $ | ||||||||||||||||||
Interest rate contracts | — | — | (5,211 | ) | — | (1,105 | ) | (6,316 | ) | |||||||||||||||
Foreign exchange contracts | — | — | — | 2,003 | — | 2,003 | ||||||||||||||||||
Credit contracts | — | — | — | — | (27 | ) | (27 | ) | ||||||||||||||||
Equity contracts | (943 | ) | 640 | 1,492 | — | 252 | 1,441 | |||||||||||||||||
Total | $ | (943 | ) | $ | 640 | $ | (3,719 | ) | $ | 2,003 | $ | (880 | ) | $ | (2,899 | ) | ||||||||
| ||||||||||||||||||||||||
Change in unrealized appreciation or (depreciation) on derivatives recognized in income ($ Thousands):
Derivatives Not Accounted for as Hedging Instruments | Purchased Options and Swaptions | Written Options and Swaptions | Futures | Forward | Swaps | Total | ||||||||||||||||||
Large Cap Fund | $ | $ | $ | $ | $ | $ | ||||||||||||||||||
Equity contracts | — | — | 456 | — | — | 456 | ||||||||||||||||||
Total | $ | — | $ | — | $ | 456 | $ | — | $ | – | $ | 456 | ||||||||||||
| ||||||||||||||||||||||||
Large Cap Value Fund | $ | $ | $ | $ | $ | $ | ||||||||||||||||||
Equity contracts | — | — | 599 | — | — | 599 | ||||||||||||||||||
Total | $ | — | $ | — | $ | 599 | $ | — | $ | – | $ | 599 | ||||||||||||
| ||||||||||||||||||||||||
Large Cap Growth Fund | $ | $ | $ | $ | $ | $ | ||||||||||||||||||
Equity contracts | — | — | 450 | — | (696 | ) | (246 | ) | ||||||||||||||||
Total | $ | — | $ | — | $ | 450 | $ | — | $ | (696 | ) | $ | (246 | ) | ||||||||||
| ||||||||||||||||||||||||
Large Cap Index Fund | $ | $ | $ | $ | $ | $ | ||||||||||||||||||
Equity contracts | — | — | 180 | — | — | 180 | ||||||||||||||||||
Total | $ | — | $ | — | $ | 180 | $ | — | $ | – | $ | 180 | ||||||||||||
| ||||||||||||||||||||||||
414
SEI Institutional Managed Trust
Derivatives Not Accounted for as Hedging Instruments | Purchased Options and Swaptions | Written Options and Swaptions | Futures | Forward | Swaps | Total | ||||||||||||||||||
Tax-Managed Large Cap Fund | $ | $ | $ | $ | $ | $ | ||||||||||||||||||
Equity contracts | — | — | 112 | — | — | 112 | ||||||||||||||||||
Total | $ | — | $ | — | $ | 112 | $ | — | $ | – | $ | 112 | ||||||||||||
| ||||||||||||||||||||||||
S&P 500 Index Fund | $ | $ | $ | $ | $ | $ | ||||||||||||||||||
Equity contracts | — | — | (418 | ) | — | — | (418 | ) | ||||||||||||||||
Total | $ | — | $ | — | $ | (418 | ) | $ | — | $ | – | $ | (418 | ) | ||||||||||
| ||||||||||||||||||||||||
Mid-Cap Fund | $ | $ | $ | $ | $ | $ | ||||||||||||||||||
Equity contracts | — | — | 106 | — | — | 106 | ||||||||||||||||||
Total | $ | — | $ | — | $ | 106 | $ | — | $ | – | $ | 106 | ||||||||||||
| ||||||||||||||||||||||||
U.S. Managed Volatility Fund | $ | $ | $ | $ | $ | $ | ||||||||||||||||||
Equity contracts | — | — | 207 | — | — | 207 | ||||||||||||||||||
Total | $ | — | $ | — | $ | 207 | $ | — | $ | – | $ | 207 | ||||||||||||
| ||||||||||||||||||||||||
Global Managed Volatility Fund | $ | $ | $ | $ | $ | $ | ||||||||||||||||||
Foreign exchange contracts | — | — | — | (2,405 | ) | — | (2,405 | ) | ||||||||||||||||
Equity contracts | — | — | 254 | — | — | 254 | ||||||||||||||||||
Total | $ | — | $ | — | $ | 254 | $ | (2,405 | ) | $ | – | $ | (2,151 | ) | ||||||||||
| ||||||||||||||||||||||||
Tax-Managed Managed Volatility Fund | $ | $ | $ | $ | $ | $ | ||||||||||||||||||
Equity contracts | — | — | (1 | ) | — | — | (1 | ) | ||||||||||||||||
Total | $ | — | $ | — | $ | (1 | ) | $ | — | $ | – | $ | (1 | ) | ||||||||||
| ||||||||||||||||||||||||
Tax-Managed International Managed Volatility Fund | $ | $ | $ | $ | $ | $ | ||||||||||||||||||
Equity contracts | — | — | 71 | — | — | 71 | ||||||||||||||||||
Total | $ | — | $ | — | $ | 71 | $ | — | $ | – | $ | 71 | ||||||||||||
| ||||||||||||||||||||||||
Core Fixed Income Fund | $ | $ | $ | $ | $ | $ | ||||||||||||||||||
Interest rate contracts | 1,073 | 1,860 | 12,029 | — | (5,347 | ) | 9,615 | |||||||||||||||||
Foreign exchange contracts | — | — | — | 718 | — | 718 | ||||||||||||||||||
Credit contracts | — | — | — | — | 396 | 396 | ||||||||||||||||||
Total | $ | 1,073 | $ | 1,860 | $ | 12,029 | $ | 718 | $ | (4,951 | ) | $ | 10,729 | |||||||||||
| ||||||||||||||||||||||||
High Yield Bond Fund | $ | $ | $ | $ | $ | $ | ||||||||||||||||||
Interest rate contracts | — | — | — | — | (381 | ) | (381 | ) | ||||||||||||||||
Foreign exchange contracts | — | — | — | (2 | ) | — | (2 | ) | ||||||||||||||||
Total | $ | — | $ | — | $ | — | $ | (2 | ) | $ | (381 | ) | $ | (383 | ) | |||||||||
| ||||||||||||||||||||||||
Dynamic Asset Allocation Fund | $ | $ | $ | $ | $ | $ | ||||||||||||||||||
Interest rate contracts | — | — | — | — | 5,752 | 5,752 | ||||||||||||||||||
Equity contracts | 2,115 | (205 | ) | 5,297 | — | (9,768 | ) | (2,561 | ) | |||||||||||||||
Commodity contracts | — | — | — | — | 2,350 | 2,350 | ||||||||||||||||||
Total | $ | 2,115 | $ | (205 | ) | $ | 5,297 | $ | — | $ | (1,666 | ) | $ | 5,541 | ||||||||||
| ||||||||||||||||||||||||
Multi-Strategy Alternative Fund | $ | $ | $ | $ | $ | $ | ||||||||||||||||||
Interest rate contracts | — | — | — | — | (74 | ) | (74 | ) | ||||||||||||||||
Foreign exchange contracts | — | — | — | (193 | ) | — | (193 | ) | ||||||||||||||||
Credit contracts | — | — | — | — | (217 | ) | (217 | ) | ||||||||||||||||
Equity contracts | 88 | 336 | (93 | ) | — | 800 | 1,131 | |||||||||||||||||
Total | $ | 88 | $ | 336 | $ | (93 | ) | $ | (193 | ) | $ | 509 | $ | 647 | ||||||||||
| ||||||||||||||||||||||||
Liquid Alternative Fund | $ | $ | $ | $ | $ | $ | ||||||||||||||||||
Interest rate contracts | — | — | 191 | — | — | 191 | ||||||||||||||||||
Foreign exchange contracts | — | — | 41 | — | — | 41 | ||||||||||||||||||
Equity contracts | — | — | (100 | ) | — | — | (100 | ) | ||||||||||||||||
Total | $ | — | $ | — | $ | 132 | $ | — | $ | – | $ | 132 | ||||||||||||
| ||||||||||||||||||||||||
SEI Institutional Managed Trust
415
Notes to Financial Statements/ Notes to Consolidated Financial Statements (Continued)
September 30, 2023
Derivatives Not Accounted for as Hedging Instruments | Purchased Options and Swaptions | Written Options and Swaptions | Futures | Forward | Swaps | Total | ||||||||||||||||||
Multi-Asset Accumulation Fund | $ | $ | $ | $ | $ | $ | ||||||||||||||||||
Interest rate contracts | — | — | 5,139 | — | 4,616 | 9,755 | ||||||||||||||||||
Foreign exchange contracts | — | — | — | (554 | ) | — | (554 | ) | ||||||||||||||||
Equity contracts | — | — | 27,886 | — | 2,285 | 30,171 | ||||||||||||||||||
Commodity contracts | — | — | 13,107 | — | — | 13,107 | ||||||||||||||||||
Total | $ | — | $ | — | $ | 46,132 | $ | (554 | ) | $ | 6,901 | $ | 52,479 | |||||||||||
| ||||||||||||||||||||||||
Multi-Asset Income Fund | $ | $ | $ | $ | $ | $ | ||||||||||||||||||
Interest rate contracts | — | — | 5,530 | — | (182 | ) | 5,348 | |||||||||||||||||
Foreign exchange contracts | (305 | ) | (1,057 | ) | — | 48 | — | (1,314 | ) | |||||||||||||||
Credit contracts | (181 | ) | (489 | ) | — | — | 604 | (66 | ) | |||||||||||||||
Equity contracts | — | — | 3,623 | — | — | 3,623 | ||||||||||||||||||
Total | $ | (486 | ) | $ | (1,546 | ) | $ | 9,153 | $ | 48 | $ | 422 | $ | 7,591 | ||||||||||
| ||||||||||||||||||||||||
Multi-Asset Inflation Managed Fund | $ | $ | $ | $ | $ | $ | ||||||||||||||||||
Interest rate contracts | — | — | (1,391 | ) | — | (6,459 | ) | (7,850 | ) | |||||||||||||||
Foreign exchange contracts | — | — | — | 162 | — | 162 | ||||||||||||||||||
Credit contracts | — | — | — | — | (192 | ) | (192 | ) | ||||||||||||||||
Equity contracts | (32 | ) | 32 | (3,379 | ) | — | — | (3,379 | ) | |||||||||||||||
Commodity contracts | — | — | 4,073 | — | 2,589 | 6,662 | ||||||||||||||||||
Total | $ | (32 | ) | $ | 32 | $ | (697 | ) | $ | 162 | $ | (4,062 | ) | $ | (4,597 | ) | ||||||||
| ||||||||||||||||||||||||
Multi-Asset Capital Stability Fund | $ | $ | $ | $ | $ | $ | ||||||||||||||||||
Interest rate contracts | — | — | 927 | — | 496 | 1,423 | ||||||||||||||||||
Foreign exchange contracts | — | — | — | 2,344 | — | 2,344 | ||||||||||||||||||
Credit contracts | — | — | — | — | 236 | 236 | ||||||||||||||||||
Equity contracts | 130 | 47 | 51 | — | 86 | 314 | ||||||||||||||||||
Total | $ | 130 | $ | 47 | $ | 978 | $ | 2,344 | $ | 818 | $ | 4,317 | ||||||||||||
The following table discloses the average quarterly balances of the Funds' derivative activity during the year or period ended September 30, 2023 ($ Thousands):
Large Cap Fund | Large Cap Value Fund | Large Cap Growth Fund | Large Cap Index Fund | Tax-Managed Large Cap Fund | ||||||||||||||||
Futures Contracts: | ||||||||||||||||||||
Average Notional Balance Long | $ | 13,151 | $ | 10,856 | $ | 8,710 | $ | 16,319 | $ | 9,487 | ||||||||||
Total Return Swaps | ||||||||||||||||||||
Average Notional Balance Long | – | – | 32,487 | – | – | |||||||||||||||
Average Notional Balance Short | – | – | – | – | – | |||||||||||||||
S&P 500 Index Fund | Small Cap Fund | Small Cap Value Fund | Tax-Managed Small/Mid Cap Fund | |||||||||||||
Futures Contracts: | ||||||||||||||||
Average Notional Balance Long | $ | 9,963 | $ | 95 | $ | 559 | $ | 131 | ||||||||
Mid-Cap Fund | U.S. Managed Volatility Fund | Global Managed Volatility Fund | Tax-Managed Managed Volatility Fund | Tax-Managed International Managed Volatility Fund | ||||||||||||||||
Futures Contracts: | ||||||||||||||||||||
Average Notional Balance Long | $ | 522 | $ | 9,544 | $ | 9,526 | $ | 9,513 | $ | 2,102 | ||||||||||
Forward Foreign Currency Contracts: | ||||||||||||||||||||
Average Notional Balance Long | – | – | 274,557 | – | – | |||||||||||||||
Average Notional Balance Short | – | – | 275,056 | – | – | |||||||||||||||
416
SEI Institutional Managed Trust
Core Fixed Income Fund | High Yield Bond Fund | Dynamic Asset Allocation Fund | Multi-Strategy Alternative Fund | Liquid Alternative Fund | ||||||||||||||||
Futures Contracts: | ||||||||||||||||||||
Average Notional Balance Long | $ | 780,939 | $ | – | $ | 70,341 | $ | 73 | $ | 1,277 | ||||||||||
Average Notional Balance Short | 255,886 | – | – | 5,634 | 2,565 | |||||||||||||||
Forward Foreign Currency Contracts: | ||||||||||||||||||||
Average Notional Balance Long | 83,018 | 100 | – | 16,016 | – | |||||||||||||||
Average Notional Balance Short | 83,579 | 100 | – | 16,054 | – | |||||||||||||||
Credit Default Swaps: | ||||||||||||||||||||
Average Notional Balance Buy Protection | 7,466 | – | – | 9,736 | – | |||||||||||||||
Average Notional Balance Sell Protection | 141,071 | – | – | 2,137 | – | |||||||||||||||
Total Return Swaps | ||||||||||||||||||||
Average Notional Balance Long | – | – | 98,800 | 1,597 | – | |||||||||||||||
Average Notional Balance Short | – | – | – | 2,516 | – | |||||||||||||||
Interest Rate Swaps | ||||||||||||||||||||
Average Notional Balance | 210,511 | – | 953,510 | 1,785 | – | |||||||||||||||
Options/Swaptions: | ||||||||||||||||||||
Average Notional Balance Long† | 960 | – | 1,733 | 388 | – | |||||||||||||||
Average Notional Balance Short† | 1,447 | – | 435 | 20 | – | |||||||||||||||
Multi-Asset Accumulation Fund | Multi-Asset Income Fund | Multi-Asset Inflation Managed Fund | Multi-Asset Capital Stability Fund | |||||||||||||
Futures Contracts: | ||||||||||||||||
Average Notional Balance Long | $ | 2,852,758 | $ | 307,448 | $ | 193,114 | $ | 125,480 | ||||||||
Average Notional Balance Short | 48,479 | 38,008 | 69,923 | 25,562 | ||||||||||||
Forward Foreign Currency Contracts: | ||||||||||||||||
Average Notional Balance Long | 669,745 | 103,068 | 2,889 | 237,977 | ||||||||||||
Average Notional Balance Short | 670,554 | 102,701 | 2,885 | 236,163 | ||||||||||||
Credit Default Swaps: | ||||||||||||||||
Average Notional Balance Buy Protection | – | – | 79,469 | – | ||||||||||||
Average Notional Balance Sell Protection | – | – | 45,136 | 9,268 | ||||||||||||
Total Return Swaps | ||||||||||||||||
Average Notional Balance Long | 49,956 | 6,030 | 1,075 | – | ||||||||||||
Average Notional Balance Short | 14,027 | 50,173 | 4,018 | – | ||||||||||||
Interest Rate Swaps | ||||||||||||||||
Average Notional Balance | 9,268 | 118,051 | 78,732 | 9,199 | ||||||||||||
Options/Swaptions: | ||||||||||||||||
Average Notional Balance Long† | – | 409 | 217 | 177 | ||||||||||||
Average Notional Balance Short† | – | 945 | 196 | 128 | ||||||||||||
† Represents cost.
A Fund is subject to various netting arrangements with select counterparties (“Master Agreements”). Master Agreements govern the terms of certain transactions, and reduce the counterparty risk associated with relevant transactions by specifying credit protection mechanisms and providing standardization that improves legal certainty. Since different types of transactions have different mechanics and are sometimes traded out of different legal entities of a particular counterparty organization, each type of transaction may be covered by a different Master Agreement, resulting in the need for multiple agreements with a single counterparty. As the Master Agreements are specific to unique operations of different asset types, they allow a Fund to close out and net its total exposure to a specific counterparty entity in
the event of a default with respect to all the transactions governed under a single agreement with a specific counterparty entity.
Master Agreements can also help limit counterparty risk by specifying collateral posting arrangements at pre-arranged exposure levels. Under the Master Agreements, collateral is routinely transferred if the total net exposure to certain transactions (net of existing collateral already in place) governed under the relevant Master Agreement with a counterparty in a given account exceeds a specified threshold, which typically ranges from zero to $250,000 depending on the counterparty and the type of Master Agreement. United States Treasury Securities and U.S. dollar cash are generally the preferred forms of collateral. Securities and cash pledged as collateral are reflected as assets on
SEI Institutional Managed Trust
417
Notes to Financial Statements/ Notes to Consolidated Financial Statements (Continued)
September 30, 2023
the Statements of Assets and Liabilities or Consolidated Statements of Assets and Liabilities as either a component of investments at value (securities) or deposits due from counterparties (cash). Cash collateral received is not typically held in a segregated account and as such is reflected as a liability on the Statements of Assets and Liabilities or Consolidated Statements of Assets and Liabilities as deposits due to counterparties. The market value of any securities received as collateral is not reflected as a component of net asset value. A Fund’s overall exposure to counterparty risk can change substantially within a short period, as it is affected by each transaction subject to the relevant Master Agreement.
Customer Account Agreements and related addendums govern exchange traded derivatives transactions such as futures, options on futures, and centrally cleared swaps. Exchange traded derivative transactions require posting of initial margin as determined by each relevant clearing agency which is segregated at a broker account registered with the Commodities Futures Trading Commission (“CFTC”), or the applicable regulator. In the U.S., counterparty risk is reduced as placement due to the Fund assets in the segregated account. Additionally, portability of exposure in the event of default further reduces risk to the Funds. Variation margin, or changes in market value, are exchanged daily, but may not be netted between futures and cleared OTC derivatives. Refer to each Funds Statement of Assets and Liabilities or Consolidated Statement of Assets and Liabilities for market value, variation margin and collateral of exchange-traded or centrally cleared financial derivative instruments.
International Swaps and Derivatives Association, Inc. Master Agreements and Credit Support Annexes (“ISDA Master Agreements”) govern OTC financial derivative transactions entered into by a Fund and select counterparties. ISDA Master Agreements maintain provisions for general obligations, representations, agreements, collateral and events of default or termination. Events of termination include conditions that may entitle counterparties to elect to terminate early and cause settlement of all outstanding transactions under the applicable ISDA Master Agreement. Any election to terminate early could be material to the financial statements. In limited circumstances, the ISDA Master Agreement may contain additional provisions that add additional counterparty protection beyond coverage of existing daily exposure if the counterparty has a decline in credit quality below a predefined level. These amounts, if any, may be segregated with a third party custodian.
418
SEI Institutional Managed Trust
The following is a summary by counterparty of the market value of OTC financial derivative instruments and collateral (received)/pledged as of September 30, 2023 ($ Thousands):
Financial Derivative Assets | Financial Derivative Liabilities | |||||||||||||||||||||||||||||||||||||||||||||||
Global Managed Volatility Fund | Forward | Purchased Options | Swap Agreements | Total Over the | Forward | Written | Swap | Reverse Repurchase Agreements | Total | Net Market Value of OTC | Collateral | Net | ||||||||||||||||||||||||||||||||||||
Barclay Bank PLC | $ | 1,109 | $ | — | $ | — | $ | 1,109 | $ | 154 | $ | — | $ | — | $ | — | $ | 154 | $ | 955 | $ | — | $ | 955 | ||||||||||||||||||||||||
BNP Paribas | — | — | — | — | 35 | — | — | — | 35 | (35 | ) | — | (35 | ) | ||||||||||||||||||||||||||||||||||
Brown Brothers Harriman | 37 | — | — | 37 | 42 | — | — | — | 42 | (5 | ) | — | (5 | ) | ||||||||||||||||||||||||||||||||||
Standard Chartered | 454 | — | — | 454 | 35 | — | — | — | 35 | 419 | — | 419 | ||||||||||||||||||||||||||||||||||||
Westpack Banking | 537 | — | — | 537 | 23 | — | — | — | 23 | 514 | — | 514 | ||||||||||||||||||||||||||||||||||||
Total Over the Counter | $ | 2,137 | $ | — | $ | — | $ | 2,137 | $ | 289 | $ | — | $ | — | $ | — | $ | 289 | ||||||||||||||||||||||||||||||
Financial Derivative Assets | Financial Derivative Liabilities | |||||||||||||||||||||||||||||||||||||||||||||||
Core Fixed Income Fund | Forward | Purchased Options | Swap Agreements | Total Over the | Forward | Written | Swap | Reverse Repurchase Agreements | Total | Net Market Value of OTC | Collateral | Net | ||||||||||||||||||||||||||||||||||||
BNP Paribas | $ | 160 | $ | — | $ | — | $ | 160 | $ | 580 | $ | — | $ | — | $ | — | $ | 580 | $ | (420 | ) | $ | — | $ | (420 | ) | ||||||||||||||||||||||
Citibank | — | — | — | — | — | — | 533 | — | 533 | (533 | ) | — | (533 | ) | ||||||||||||||||||||||||||||||||||
Citigroup | 43 | — | — | 43 | — | — | — | — | — | 43 | — | 43 | ||||||||||||||||||||||||||||||||||||
Goldman Sachs | 1 | — | — | 1 | — | — | — | — | — | 1 | — | 1 | ||||||||||||||||||||||||||||||||||||
Morgan Stanley | 402 | — | — | 402 | 1,258 | — | — | — | 1,258 | (856 | ) | — | (856 | ) | ||||||||||||||||||||||||||||||||||
Total Over the Counter | $ | 606 | $ | — | $ | — | $ | 606 | $ | 1,838 | $ | — | $ | 533 | $ | — | $ | 2,371 | ||||||||||||||||||||||||||||||
Financial Derivative Assets | Financial Derivative Liabilities | |||||||||||||||||||||||||||||||||||||||||||||||
High Yield Bond Fund | Forward | Purchased Options | Swap Agreements | Total Over the | Forward | Written | Swap | Reverse Repurchase Agreements | Total | Net Market Value of OTC | Collateral | Net | ||||||||||||||||||||||||||||||||||||
Barclays PLC | $ | — | $ | — | $ | — | $ | — | $ | 2 | $ | — | $ | — | $ | — | $ | 2 | $ | (2 | ) | $ | — | $ | (2 | ) | ||||||||||||||||||||||
Total Over the Counter | $ | — | $ | — | $ | — | $ | — | $ | 2 | $ | — | $ | — | $ | — | $ | 2 | ||||||||||||||||||||||||||||||
Financial Derivative Assets | Financial Derivative Liabilities | |||||||||||||||||||||||||||||||||||||||||||||||
Dynamic Asset Allocation Fund | Forward | Purchased Options | Swap Agreements | Total Over the | Forward | Written | Swap | Reverse Repurchase Agreements | Total | Net Market Value of OTC | Collateral | Net | ||||||||||||||||||||||||||||||||||||
Goldman Sachs | $ | — | $ | — | $ | — | $ | — | $ | — | $ | — | $ | 7,491 | $ | — | $ | 7,491 | $ | (7,491 | ) | $ | 7,491 | $ | — | |||||||||||||||||||||||
Total Over the Counter | $ | — | $ | — | $ | — | $ | — | $ | — | $ | — | $ | 7,491 | $ | — | $ | 7,491 | ||||||||||||||||||||||||||||||
Financial Derivative Assets | Financial Derivative Liabilities | |||||||||||||||||||||||||||||||||||||||||||||||
Multi-Strategy Alternative Fund | Forward | Purchased Options | Swap Agreements | Total Over the | Forward | Written | Swap | Reverse Repurchase Agreements | Total | Net Market Value of OTC | Collateral | Net | ||||||||||||||||||||||||||||||||||||
Barclays PLC | $ | 10 | $ | — | $ | — | $ | 10 | $ | — | $ | — | $ | — | $ | — | $ | — | $ | 10 | $ | — | $ | 10 | ||||||||||||||||||||||||
BNYMellon | 3 | — | — | 3 | 2 | — | — | — | 2 | 1 | — | 1 | ||||||||||||||||||||||||||||||||||||
Total Over the Counter | $ | 13 | $ | — | $ | — | $ | 13 | $ | 2 | $ | — | $ | — | $ | — | $ | 2 | ||||||||||||||||||||||||||||||
Financial Derivative Assets | Financial Derivative Liabilities | |||||||||||||||||||||||||||||||||||||||||||||||
Multi-Asset Accumulation Fund | Forward | Purchased Options | Swap Agreements | Total Over the | Forward | Written | Swap | Reverse Repurchase Agreements | Total | Net Market Value of OTC | Collateral | Net | ||||||||||||||||||||||||||||||||||||
Bank of America | $ | — | $ | — | $ | 143 | $ | 143 | $ | — | $ | — | $ | 373 | $ | — | $ | 373 | $ | (230 | ) | $ | 230 | $ | — | |||||||||||||||||||||||
Bank of New York | 46 | — | — | 46 | 36 | — | — | — | 36 | 10 | — | 10 | ||||||||||||||||||||||||||||||||||||
Barclays | 1,459 | — | — | 1,459 | — | — | — | — | — | 1,459 | — | 1,459 | ||||||||||||||||||||||||||||||||||||
BNP Paribas | 30 | — | — | 30 | — | — | — | — | — | 30 | — | 30 | ||||||||||||||||||||||||||||||||||||
Citibank | — | — | 180 | 180 | — | — | 24 | — | 24 | 156 | — | 156 | ||||||||||||||||||||||||||||||||||||
SEI Institutional Managed Trust
419
Notes to Financial Statements/ Notes to Consolidated Financial Statements (Continued)
September 30, 2023
Financial Derivative Assets | Financial Derivative Liabilities | |||||||||||||||||||||||||||||||||||||||||||||||
Multi-Asset Accumulation Fund | Forward | Purchased Options | Swap Agreements | Total Over the | Forward | Written | Swap | Reverse Repurchase Agreements | Total | Net Market Value of OTC | Collateral | Net | ||||||||||||||||||||||||||||||||||||
Citigroup | $ | 2,813 | $ | — | $ | — | $ | 2,813 | $ | 1,009 | $ | — | $ | — | $ | — | $ | 1,009 | $ | 1,804 | $ | — | $ | 1,804 | ||||||||||||||||||||||||
JPMorgan Chase Bank | 2,537 | — | 115 | 2,652 | 978 | — | 302 | — | 1,280 | 1,372 | — | 1,372 | ||||||||||||||||||||||||||||||||||||
State Street | 1,597 | — | — | 1,597 | — | — | — | — | — | 1,597 | — | 1,597 | ||||||||||||||||||||||||||||||||||||
Total Over the Counter | $ | 8,482 | $ | — | $ | 438 | $ | 8,920 | $ | 2,023 | $ | — | $ | 699 | $ | — | $ | 2,722 | ||||||||||||||||||||||||||||||
Financial Derivative Assets | Financial Derivative Liabilities | |||||||||||||||||||||||||||||||||||||||||||||||
Multi-Asset Income Fund | Forward | Purchased Options | Swap Agreements | Total Over the | Forward | Written | Swap | Reverse Repurchase Agreements | Total | Net Market Value of OTC | Collateral | Net | ||||||||||||||||||||||||||||||||||||
Barclays | $ | — | $ | — | $ | — | $ | — | $ | 3 | $ | — | $ | — | $ | — | $ | 3 | $ | (3 | ) | $ | — | $ | (3 | ) | ||||||||||||||||||||||
BNP Paribas | 198 | — | — | 198 | 285 | — | — | — | 285 | (87 | ) | 60 | (27 | ) | ||||||||||||||||||||||||||||||||||
Citigroup | 116 | — | — | 116 | 18 | — | — | — | 18 | 98 | (40 | ) | 58 | |||||||||||||||||||||||||||||||||||
Deutsche Bank | 24 | — | — | 24 | 11 | — | — | — | 11 | 13 | — | 13 | ||||||||||||||||||||||||||||||||||||
Goldman Sachs | 26 | — | — | 26 | — | — | — | — | — | 26 | — | 26 | ||||||||||||||||||||||||||||||||||||
JPMorgan Chase | 89 | — | — | 89 | 68 | — | 177 | — | 245 | (156 | ) | — | (156 | ) | ||||||||||||||||||||||||||||||||||
Morgan Stanley | 865 | — | — | 865 | 506 | — | — | — | 506 | 359 | — | 359 | ||||||||||||||||||||||||||||||||||||
State Street | — | — | — | — | 22 | — | — | — | 22 | 22 | — | 22 | ||||||||||||||||||||||||||||||||||||
UBS | — | — | — | — | 4 | — | — | — | 4 | 4 | — | 4 | ||||||||||||||||||||||||||||||||||||
Total Over the Counter | $ | 1,318 | $ | — | $ | — | $ | 1,318 | $ | 917 | $ | — | $ | 177 | $ | — | $ | 1,094 | ||||||||||||||||||||||||||||||
Financial Derivative Assets | Financial Derivative Liabilities | |||||||||||||||||||||||||||||||||||||||||||||||
Multi-Asset Inflation Managed Fund | Forward | Purchased Options | Swap Agreements | Total Over the | Forward | Written | Swap | Reverse Repurchase Agreements | Total | Net Market Value of OTC | Collateral | Net | ||||||||||||||||||||||||||||||||||||
Chase Securities | $ | — | $ | — | $ | — | $ | — | $ | — | $ | — | $ | — | $ | 126,489 | $ | 126,489 | $ | (126,489 | ) | $ | 126,489 | $ | — | |||||||||||||||||||||||
Citibank | — | — | — | — | — | — | 25 | — | 25 | (25 | ) | — | (25 | ) | ||||||||||||||||||||||||||||||||||
Deutsche Bank | — | — | — | — | — | — | 35 | — | 35 | (35 | ) | — | (35 | ) | ||||||||||||||||||||||||||||||||||
Goldman Sachs | — | — | — | — | — | — | 40 | — | 40 | (40 | ) | — | (40 | ) | ||||||||||||||||||||||||||||||||||
Morgan Stanley | 107 | — | — | 107 | — | — | — | — | — | 107 | — | 107 | ||||||||||||||||||||||||||||||||||||
Total Over the Counter | $ | 107 | $ | — | $ | — | $ | 107 | $ | — | $ | — | $ | 100 | $ | 126,489 | $ | 126,589 | ||||||||||||||||||||||||||||||
Financial Derivative Assets | Financial Derivative Liabilities | |||||||||||||||||||||||||||||||||||||||||||||||
Multi-Asset Capital Stability Fund | Forward | Purchased Options | Swap Agreements | Total Over the | Forward | Written | Swap | Reverse Repurchase Agreements | Total | Net Market Value of OTC | Collateral | Net | ||||||||||||||||||||||||||||||||||||
Bank of America | $ | 2,544 | $ | — | $ | — | $ | 2,544 | $ | 98 | $ | — | $ | — | $ | — | $ | 98 | $ | 2,446 | $ | — | $ | 2,446 | ||||||||||||||||||||||||
Barclays PLC | 16 | — | — | 16 | 4 | — | — | — | 4 | 12 | — | 12 | ||||||||||||||||||||||||||||||||||||
BNP Paribas | 2 | — | — | 2 | 36 | — | — | — | 36 | (34 | ) | — | (34 | ) | ||||||||||||||||||||||||||||||||||
Brown Brothers Harriman | 328 | — | — | 328 | 183 | — | — | — | 183 | 145 | — | 145 | ||||||||||||||||||||||||||||||||||||
Citigroup | 11 | — | — | 11 | — | — | — | — | — | 11 | — | 11 | ||||||||||||||||||||||||||||||||||||
Deutsche Bank | 18 | — | — | 18 | 36 | — | — | — | 36 | (18 | ) | — | (18 | ) | ||||||||||||||||||||||||||||||||||
Goldman Sachs | 128 | — | — | 128 | 110 | — | — | — | 110 | 18 | — | 18 | ||||||||||||||||||||||||||||||||||||
JPMorgan Chase Bank | 52 | — | — | 52 | 42 | — | — | — | 42 | 10 | — | 10 | ||||||||||||||||||||||||||||||||||||
Merrill Lynch | 126 | — | — | 126 | 139 | — | — | — | 139 | (13 | ) | — | (13 | ) | ||||||||||||||||||||||||||||||||||
Montgomery | 1 | — | — | 1 | — | — | — | — | — | 1 | — | 1 | ||||||||||||||||||||||||||||||||||||
Morgan Stanley | 257 | — | — | 257 | 329 | — | — | — | 329 | (72 | ) | 6 | (66 | ) | ||||||||||||||||||||||||||||||||||
UBS | 2 | — | — | 2 | 19 | — | — | — | 19 | (17 | ) | 17 | — | |||||||||||||||||||||||||||||||||||
Total Over the Counter | $ | 3,485 | $ | — | $ | — | $ | 3,485 | $ | 996 | $ | — | $ | — | $ | — | $ | 996 | ||||||||||||||||||||||||||||||
(1) Net Exposures represents the net receivable/(payable) that would be due from /to the counterparty in the event of default. Exposure from OTC financial derivative instruments can only be netted across transactions governed under the same master agreement with the same legal entity.
420
SEI Institutional Managed Trust
5. BASIS FOR CONSOLIDATION FOR THE DYNAMIC ASSET ALLOCATION FUND, MULTI-ASSET ACCUMULATION FUND AND MULTI-ASSET INFLATION MANAGED FUND
The Consolidated Schedules of Investments, Consolidated Statements of Assets and Liabilities, Consolidated Statements of Operations, Consolidated Statements of Changes in Net Assets, Consolidated Statement of Cash Flows, and the Consolidated Financial Highlights of the Dynamic Asset Allocation Fund, Multi-Asset Accumulation Fund and Multi-Asset Inflation Managed Fund include the accounts of their respective Subsidiaries. All intercompany accounts and transactions have been eliminated in consolidation for
the Funds. Each of the Subsidiaries has a fiscal year end of September 30th for financial statement consolidation purposes and a nonconforming tax year end of August 31.
The Subsidiaries are classified as controlled foreign corporations under the Internal Revenue Code of 1986 (“IRC”). Each Subsidiary’s taxable income is included in the calculation of the relevant Fund’s taxable income. Net losses of the Subsidiaries are not deductible by the Funds either in the current period or carried forward to future periods.
The Dynamic Asset Allocation Fund, Multi-Asset Accumulation Fund, and Multi-Asset Inflation Managed Fund may each invest up to 25% of their total assets in its respective Subsidiary.
A summary of the Funds’ investments in the Subsidiaries are as follows:
Inception Date of Subsidiary | Subsidiary Net Assets at September 30, 2023 ($ Thousands) | % of Total Net Assets at September 30, 2023 | ||||||||||
Dynamic Commodity Strategy Subsidiary, Ltd. | March 28, 2018 | $ | 99,121 | 14.6 | % | |||||||
Accumulation Commodity Strategy Subsidiary, Ltd. | April 9, 2012 | 284,876 | 15.1 | % | ||||||||
Inflation Commodity Strategy Subsidiary Ltd. | April 9, 2012 | 136,473 | 20.1 | % | ||||||||
Gains and losses attributed to the Funds’ investments in Subsidiaries are as follows:
Dynamic Commodity Strategy Subsidiary, Ltd. ($ Thousands) | Accumulation Commodity Strategy, Ltd. ($ Thousands) | Inflation Commodity Strategy Subsidiary, Ltd. ($ Thousands) | ||||||||||
Net Investment Income: | ||||||||||||
Investment Income | $ | 3,329 | $ | 13,126 | $ | 6,025 | ||||||
Net Realized Gain (Loss) on: | ||||||||||||
Investments | — | 30 | (108 | ) | ||||||||
Futures Contracts | 361 | 246 | (12,650 | ) | ||||||||
Swap Contracts | (12,480 | ) | — | (1,765 | ) | |||||||
Purchased Options and Swaptions | — | — | (1,417 | ) | ||||||||
Written Options and Swaptions | — | — | 1,357 | |||||||||
Net Change in Unrealized Appreciation (Depreciation) on: | ||||||||||||
Investments | — | 271 | 273 | |||||||||
Futures Contracts | 5,880 | 13,109 | 3,983 | |||||||||
Swap Contracts | 4,065 | 306 | 3,121 | |||||||||
Purchased Options and Swaptions | — | — | (32 | ) | ||||||||
Written Options and Swaptions | — | — | 32 | |||||||||
Total gains and losses attributed to the Funds' investment in Subsidiaries | $ | 1,155 | $ | 27,088 | $ | (1,181 | ) | |||||
6. INVESTMENT ADVISORY, ADMINISTRATION AND DISTRIBUTION AGREEMENTS, INVESTMENT SUBADVISORY AGREEMENTS AND OTHER TRANSACTIONS WITH AFFILIATES
Investment Advisory, Administration and Distribution Agreements — SIMC serves as investment adviser (the “Adviser”) to each Fund. In connection with serving as Adviser, SIMC is entitled to a fee, which is calculated daily and paid monthly, based on the average daily net assets of each Fund.
SEI Investments Global Funds Services (the “Administrator”) provides administrative and transfer agency services to the Funds for annual fees, based on the average daily net assets of each Fund.
SEI Investments Distribution Co. (“the Distributor”) is the Distributor of the shares of the Funds. The Funds have adopted a shareholder services plan and agreement (the “Service Plan”) with respect to Class F and Class I Shares that allows such shares to pay service providers a fee, based on average daily net assets of each respective Class of Shares, in connection with the ongoing servicing of shareholder accounts owning such shares. The Funds have also adopted an, administrative services plan and agreement (the “Administrative Service Plan”) with respect to Class I Shares that allows such Shares to pay service providers a fee, based on average daily net
SEI Institutional Managed Trust
421
Notes to Financial Statements/ Notes to Consolidated Financial Statements (Continued)
September 30, 2023
assets of the Class I Shares, in connection with ongoing administrative services for shareholder accounts owning such Shares.
The Service Plan and Administrative Service Plan provide that shareholder service fees and administrative service fees, respectively, on Class F and Class I Shares will be paid to the Distributor, which may then be used by the Distributor to compensate financial intermediaries for providing shareholder services and administrative services, as applicable, with respect to the Shares.
The Adviser, Administrator and/or Distributor have voluntarily agreed to waive a portion of their fees in order to keep total direct operating expenses (exclusive of interest from borrowings, brokerage commissions, taxes, Trustee fees, proxy fees, prime broker fees, interest and dividend expenses related to short sales and extraordinary expenses not incurred in the ordinary course of the Funds’ business) at a specified level. The voluntary waivers by the Funds’ Adviser, Administrator and/or Distributor are limited to the Funds’ direct operating expenses and, therefore, do not apply to indirect expenses incurred by the Funds, such as acquired fund fees and expenses. The waivers are voluntarily and the Funds’ Adviser, Administrator and/or Distributor may discontinue all or part of any of these waivers at any time. In addition, some Funds may participate in a commission recapture program where the Funds’ trades may be executed through the Funds’ distributor, and a portion of the commissions paid on those trades are then used to pay the Funds’ expenses.
The Administrator has voluntarily agreed to waive and reduce their fee and/or reimburse certain expenses of the Conservative Income and Tax Free Conservative Funds in order to limit the one-day net income yield of the Funds to not less than 0.01% of the Funds’ average daily net assets.
422
SEI Institutional Managed Trust
The following is a summary of annual fees payable to the Adviser and Distributor and the voluntary expense limitations for each fund:
Advisory | Shareholder | Administrative | Voluntary | |||||||||||||
Large Cap Fund | ||||||||||||||||
Class F | 0.3900 | % | 0.25 | % | — | 0.89 | % | |||||||||
Class Y | 0.3900 | % | — | — | 0.64 | % | ||||||||||
Large Cap Value Fund | ||||||||||||||||
Class F | 0.3500 | % | 0.25 | % | — | 0.89 | % | |||||||||
Class I | 0.3500 | % | 0.25 | % | 0.25 | % | 1.11 | % | ||||||||
Class Y | 0.3500 | % | — | — | 0.64 | % | ||||||||||
Large Cap Growth Fund | ||||||||||||||||
Class F | 0.4000 | % | 0.25 | % | — | 0.89 | % | |||||||||
Class I | 0.4000 | % | 0.25 | % | 0.25 | % | 1.11 | % | ||||||||
Class Y | 0.4000 | % | — | — | 0.64 | % | ||||||||||
Large Cap Index Fund | ||||||||||||||||
Class F | 0.0500 | % | 0.25 | % | — | 0.25 | % | |||||||||
Tax-Managed Large Cap Fund | ||||||||||||||||
Class F | 0.4000 | % | 0.25 | % | — | 0.89 | % | |||||||||
Class Y | 0.4000 | % | — | — | 0.64 | % | ||||||||||
S&P 500 Index Fund | ||||||||||||||||
Class F | 0.0300 | % | 0.25 | % | — | 0.25 | % | |||||||||
Class I | 0.0300 | % | 0.25 | % | 0.25 | % | 0.65 | % | ||||||||
Small Cap Fund | ||||||||||||||||
Class F | 0.6500 | % | 0.25 | % | — | 1.14 | % | |||||||||
Class Y | 0.6500 | % | — | — | 0.89 | % | ||||||||||
Small Cap Value Fund | ||||||||||||||||
Class F | 0.6500 | % | 0.25 | % | — | 1.14 | % | |||||||||
Class I | 0.6500 | % | 0.25 | % | 0.25 | % | 1.36 | % | ||||||||
Class Y | 0.6500 | % | — | — | 0.89 | % | ||||||||||
Small Cap Growth Fund | ||||||||||||||||
Class F | 0.6500 | % | 0.25 | % | — | 1.11 | % | |||||||||
Class I | 0.6500 | % | 0.25 | % | 0.25 | % | 1.36 | % | ||||||||
Class Y | 0.6500 | % | — | — | 0.86 | % | ||||||||||
Tax-Managed Small/Mid Cap Fund | ||||||||||||||||
Class F | 0.6500 | % | 0.25 | % | — | 1.11 | % | |||||||||
Class Y | 0.6500 | % | — | — | 0.89 | % | ||||||||||
Mid-Cap Fund | ||||||||||||||||
Class F | 0.4000 | % | 0.25 | % | — | 0.98 | % | |||||||||
Class I | 0.4000 | % | 0.25 | % | 0.25 | % | 1.20 | % | ||||||||
Class Y | 0.4000 | % | — | — | 0.73 | % | ||||||||||
U.S. Managed Volatility Fund | ||||||||||||||||
Class F | 0.6500 | % | 0.25 | % | — | 0.90 | % | |||||||||
Class I | 0.6500 | % | 0.25 | % | 0.25 | % | 1.15 | % | ||||||||
Class Y | 0.6500 | % | — | — | 0.65 | % | ||||||||||
Global Managed Volatility Fund | ||||||||||||||||
Class F | 0.6500 | % | 0.25 | % | — | 1.11 | % | |||||||||
Class I | 0.6500 | % | 0.25 | % | 0.25 | % | 1.36 | % | ||||||||
Class Y | 0.6500 | % | — | — | 0.86 | % | ||||||||||
Tax-Managed Managed Volatility Fund | ||||||||||||||||
Class F | 0.6500 | % | 0.25 | % | — | 1.00 | % | |||||||||
Class Y | 0.6500 | % | — | — | 0.75 | % | ||||||||||
SEI Institutional Managed Trust
423
Notes to Financial Statements/ Notes to Consolidated Financial Statements (Continued)
September 30, 2023
Advisory | Shareholder | Administrative | Voluntary | |||||||||||||
Tax-Managed International Managed Volatility Fund | ||||||||||||||||
Class F | 0.6500 | % | 0.25 | % | — | 1.11 | % | |||||||||
Class Y | 0.6500 | % | — | — | 0.86 | % | ||||||||||
Real Estate Fund | ||||||||||||||||
Class F | 0.6500 | % | 0.25 | % | — | 1.14 | % | |||||||||
Class I | 0.6500 | % | 0.25 | % | 0.25 | % | 1.36 | % | ||||||||
Class Y | 0.6500 | % | — | — | 0.89 | % | ||||||||||
Core Fixed Income Fund | ||||||||||||||||
Class F | 0.2750 | % | 0.25 | % | — | 0.66 | % | |||||||||
Class I | 0.2750 | % | 0.25 | % | 0.25 | % | 0.88 | % | ||||||||
Class Y | 0.2750 | % | — | — | 0.41 | % | ||||||||||
High Yield Bond Fund | ||||||||||||||||
Class F | 0.4875 | % | 0.25 | % | — | 0.89 | % | |||||||||
Class I | 0.4875 | % | 0.25 | % | 0.25 | % | 1.11 | % | ||||||||
Class Y | 0.4875 | % | — | — | 0.64 | % | ||||||||||
Conservative Income Fund | ||||||||||||||||
Class F | 0.1000 | % | 0.25 | % | — | 0.30 | % | |||||||||
Class Y | 0.1000 | % | — | — | 0.20 | % | ||||||||||
Tax-Free Conservative Income Fund | ||||||||||||||||
Class F | 0.1000 | % | 0.25 | % | — | 0.30 | % | |||||||||
Class Y | 0.1000 | % | — | — | 0.20 | % | ||||||||||
Real Return Fund | ||||||||||||||||
Class F | 0.2200 | % | 0.25 | % | — | 0.45 | % | |||||||||
Class Y | 0.2200 | % | — | — | 0.35 | % | ||||||||||
Dynamic Asset Allocation Fund | ||||||||||||||||
Class F | 0.6000 | % | 0.25 | % | — | 0.75 | % | |||||||||
Class Y | 0.6000 | % | — | — | 0.50 | % | ||||||||||
Multi-Strategy Alternative Fund | ||||||||||||||||
Class F | 1.5000 | % | 0.25 | % | — | 1.35 | % | |||||||||
Class Y | 1.5000 | % | — | — | 1.10 | % | ||||||||||
Liquid Alternative Fund | ||||||||||||||||
Class F | 0.5000 | % | 0.25 | % | — | 1.05 | % | |||||||||
Class Y | 0.5000 | % | — | — | 0.80 | % | ||||||||||
Multi-Asset Accumulation Fund | ||||||||||||||||
Class F | 0.7500 | % | 0.25 | % | — | 1.17 | % | |||||||||
Class Y | 0.7500 | % | — | — | 0.92 | % | ||||||||||
Multi-Asset Income Fund | ||||||||||||||||
Class F | 0.6000 | % | 0.25 | % | — | 0.80 | % | |||||||||
Class Y | 0.6000 | % | — | — | 0.70 | % | ||||||||||
Multi-Asset Inflation Managed Fund | ||||||||||||||||
Class F | 0.5500 | % | 0.25 | % | — | 1.24 | % | |||||||||
Class Y | 0.5500 | % | — | — | 0.98 | % | ||||||||||
Multi-Asset Capital Stability Fund | ||||||||||||||||
Class F | 0.4000 | % | 0.25 | % | — | 0.62 | % | |||||||||
Class Y | 0.4000 | % | — | — | 0.52 | % | ||||||||||
424
SEI Institutional Managed Trust
The following is a summary of annual fees payable to the Administrator:
| First $1.5 Billion | Next $500 Million | Next $500 Million | Next $500 Million | Over $3 Billion | ||||||||||||||||
Large Cap Fund | 0.300 | % | 0.2550 | % | 0.2100 | % | 0.1650 | % | 0.120 | % | ||||||||||
Large Cap Value Fund | 0.300 | % | 0.2550 | % | 0.2100 | % | 0.1650 | % | 0.120 | % | ||||||||||
Large Cap Growth Fund | 0.300 | % | 0.2550 | % | 0.2100 | % | 0.1650 | % | 0.120 | % | ||||||||||
Large Cap Index Fund | 0.300 | % | 0.2550 | % | 0.2100 | % | 0.1650 | % | 0.120 | % | ||||||||||
Tax-Managed Large Cap Fund | 0.300 | % | 0.2550 | % | 0.2100 | % | 0.1650 | % | 0.120 | % | ||||||||||
Small Cap Fund | 0.300 | % | 0.2550 | % | 0.2100 | % | 0.1650 | % | 0.120 | % | ||||||||||
Small Cap Value Fund | 0.300 | % | 0.2550 | % | 0.2100 | % | 0.1650 | % | 0.120 | % | ||||||||||
Small Cap Growth Fund | 0.300 | % | 0.2550 | % | 0.2100 | % | 0.1650 | % | 0.120 | % | ||||||||||
Tax-Managed Small/Mid Cap Fund | 0.300 | % | 0.2550 | % | 0.2100 | % | 0.1650 | % | 0.120 | % | ||||||||||
Mid-Cap Fund | 0.300 | % | 0.2550 | % | 0.2100 | % | 0.1650 | % | 0.120 | % | ||||||||||
U.S. Managed Volatility Fund | 0.300 | % | 0.2550 | % | 0.2100 | % | 0.1650 | % | 0.120 | % | ||||||||||
Global Managed Volatility Fund | 0.300 | % | 0.2550 | % | 0.2100 | % | 0.1650 | % | 0.120 | % | ||||||||||
Tax-Managed Managed Volatility Fund | 0.300 | % | 0.2550 | % | 0.2100 | % | 0.1650 | % | 0.120 | % | ||||||||||
Tax-Managed International Managed Volatility Fund | 0.450 | % | 0.3700 | % | 0.2900 | % | 0.2100 | % | 0.130 | % | ||||||||||
Real Estate Fund | 0.300 | % | 0.2550 | % | 0.2100 | % | 0.1650 | % | 0.120 | % | ||||||||||
Core Fixed Income Fund | 0.200 | % | 0.1775 | % | 0.1550 | % | 0.1325 | % | 0.110 | % | ||||||||||
High Yield Bond Fund | 0.200 | % | 0.1775 | % | 0.1550 | % | 0.1325 | % | 0.110 | % | ||||||||||
Conservative Income Fund | 0.200 | % | 0.1775 | % | 0.1550 | % | 0.1325 | % | 0.110 | % | ||||||||||
Tax-Free Conservative Income Fund | 0.200 | % | 0.1775 | % | 0.1550 | % | 0.1325 | % | 0.110 | % | ||||||||||
Real Return Fund | 0.200 | % | 0.1775 | % | 0.1550 | % | 0.1325 | % | 0.110 | % | ||||||||||
Dynamic Asset Allocation Fund | 0.300 | % | 0.2550 | % | 0.2100 | % | 0.1650 | % | 0.120 | % | ||||||||||
Multi-Strategy Alternative Fund | 0.300 | % | 0.2550 | % | 0.2100 | % | 0.1650 | % | 0.120 | % | ||||||||||
Liquid Alternative Fund | 0.300 | % | 0.2550 | % | 0.2100 | % | 0.1650 | % | 0.120 | % | ||||||||||
Multi-Asset Accumulation Fund | 0.300 | % | 0.2550 | % | 0.2100 | % | 0.1650 | % | 0.120 | % | ||||||||||
Multi-Asset Income Fund | 0.300 | % | 0.2550 | % | 0.2100 | % | 0.1650 | % | 0.120 | % | ||||||||||
Multi-Asset Inflation Managed Fund | 0.300 | % | 0.2550 | % | 0.2100 | % | 0.1650 | % | 0.120 | % | ||||||||||
Multi-Asset Capital Stability Fund | 0.300 | % | 0.2550 | % | 0.2100 | % | 0.1650 | % | 0.120 | % |
| First $2 Billion | Next $500 Million | Next $500 Million | Over $3 Billion | |||||||||||||
S&P 500 Index Fund | 0.220 | % | 0.2100 | % | 0.1650 | % | 0.120 | % |
As of September 30, 2023, SIMC has entered into investment sub-advisory agreements with the following affiliated and unaffiliated parties:
Investment Sub-Adviser
Large Cap Fund
Brandywine Global Investment Management, LLC
Ceredex Value Advisors, LLC
Coho Partners, Ltd.
Fred Alger Management, LLC
LSV Asset Management*
Mar Vista Investment Partners, LLC
Parametric Portfolio Associates LLC
Large Cap Value Fund
Brandywine Global Investment Management, LLC
Cullen Capital Management, LLC
LSV Asset Management*
Parametric Portfolio Associates LLC
Large Cap Growth Fund
Fred Alger Management, LLC
Mackenzie Investment Corporation
Parametric Portfolio Associates LLC
PineStone Asset Management Inc.
Large Cap Index Fund
SSGA Funds Management, Inc.
Tax-Managed Large Cap Fund
Brandywine Global Investment Management, LLC
Coho Partners, Ltd.
Cullen Capital Management, LLC
LSV Asset Management*
Mar Vista Investment Partners, LLC
Parametric Portfolio Associates LLC
PineStone Asset Management Inc.
S&P 500 Index Fund
SSGA Funds Management, Inc.
Small Cap Fund
Copeland Capital Management, LLC
EAM Investors, LLC
Easterly Investment Partners LLC
Hillsdale Investment Management Inc.
Los Angeles Capital Management, LLC
Leeward Investments, LLC
Parametric Portfolio Associates LLC
Small Cap Value Fund
Cardinal Capital Management, LLC
Easterly Investment Partners LLC
LSV Asset Management*
Parametric Portfolio Associates LLC
SEI Institutional Managed Trust
425
Notes to Financial Statements/ Notes to Consolidated Financial Statements (Continued)
September 30, 2023
Small Cap Growth Fund
ArrowMark Colorado Holdings LLC
EAM Investors LLC
Jackson Creek Investment Advisors, LLC
Parametric Portfolio Associates LLC
Tax-Managed Small/Mid Cap Fund
Cardinal Capital Management, LLC
Easterly Investment Partners LLC
Hillsdale Investment Management Inc.
Martingale Asset Management, LP
Parametric Portfolio Associates LLC
Rice Hall James & Associates LLC
Mid-Cap Fund
Leeward Investments, LLC
Los Angeles Capital Management LLC
U.S. Managed Volatility Fund
Allspring Global Investments, LLC
LSV Asset Management*
Global Managed Volatility Fund
Acadian Asset Management LLC
Allspring Global Investments, LLC
Tax-Managed Managed Volatility Fund
Allspring Global Investments, LLC
LSV Asset Management*
Parametric Portfolio Associates LLC
Tax-Managed International Managed Volatility Fund
Acadian Asset Management LLC
Allspring Global Investments, LLC
LSV Asset Management*
Parametric Portfolio Associates LLC
Real Estate Fund
CenterSquare Investment Management LLC
Core Fixed Income Fund
Allspring Global Investments, LLC
Jennison Associates LLC
MetLife Investment Management, LLC
Metropolitan West Asset Management, LLC
Western Asset Management Company, LLC
Western Asset Management Company Limited
High Yield Bond Fund
Ares Capital Management II LLC
Benefit Street Partners, LLC
Brigade Capital Management, LP
J.P. Morgan Investment Management, Inc.
T. Rowe Price Associates, Inc.
Conservative Income Fund
BlackRock Advisors, LLC
Tax-Free Conservative Income Fund
BlackRock Advisors, LLC
Dynamic Asset Allocation Fund
SSGA Funds Management, Inc.
Multi-Strategy Alternative Fund
Brigade Capital Management, LP
Global Credit Advisers, LLC
Kettle Hill Capital Management LLC
Mountaineer Partners Management, LLC
Liquid Alternative Fund
Dynamic Beta Investments, LLC
Multi-Asset Accumulation Fund
AQR Capital Management, LLC
PanAgora Asset Management Inc.
Multi-Asset Income Fund
Western Asset Management Company PTE Ltd.
Goldman Sachs Asset Management, LP
Western Asset Management Company, LLC
Western Asset Management Company Limited
Western Asset Management Company PTE Ltd.
Multi-Asset Inflation Managed Fund
AllianceBernstein, L.P.
Columbia Management Investments Advisers, LLC
Credit Suisse Asset Management, LLC
Franklin Advisers, Inc.
Multi-Asset Capital Stability Fund
AllianceBernstein, L.P.
Janus Henderson Investors US LLC
* Affiliated
Under the investment sub-advisory agreements, each sub-adviser receives a fee paid by SIMC.
Brokerage Commissions Paid to Affiliates — The Distribution Agreement between the Distributor and the Trust provides that the Distributor may receive compensation on fund transactions effected for the Trust in accordance with the rules of the Securities and Exchange Commission (“SEC”). Accordingly, it is expected that fund transactions may result in brokerage commissions being paid to the Distributor. SEC rules require that such commissions not exceed usual and customary commissions.
Such commissions for the year ended September 30, 2023 were as follows ($ Thousands):
Multi-Asset Income Fund | $ | 17 |
Payments to/from Affiliates — Certain officers and/or trustees of the Trust are also officers and/or Directors of the Administrator, Adviser and/or Distributor. The Trust pays each unaffiliated Trustee an annual fee for attendance at quarterly, interim and committee meetings. Compensation of officers and affiliated Trustees of the Trust is paid by the Administrator or Distributor.
A portion of the services provided by the Chief Compliance Officer (“CCO”) and his staff, whom are employees of the Administrator, are paid for by the Trust as incurred.
LSV Asset Management (a partially owned indirect subsidiary of SEI Investment Co.) serves as the sub-adviser to the Large Cap, Large Cap Value, Tax-Managed
426
SEI Institutional Managed Trust
Large Cap, Small Cap Value, U.S. Managed Volatility, Tax-Managed Managed Volatility and Tax-Managed International Managed Volatility Funds. For this service LSV Asset Management is entitled to receive a fee from SIMC. Such fees for the year ended September 30, 2023 were as follows ($ Thousands):
Large Cap Fund | $ | 287 | ||
Large Cap Value Fund | 443 | |||
Tax-Managed Large Cap Fund | 597 | |||
Small Cap Value Fund | 764 | |||
U.S. Managed Volatility Fund | 1,106 | |||
Tax-Managed Managed Volatility Fund | 1,420 | |||
Tax-Managed International Managed Volatility Fund | 405 | |||
| $ | 5,022 |
Fees Paid Indirectly — The Funds may direct certain fund trades to the Distributor who pays a portion of the Funds’ expenses. Accordingly, the expenses reduced, which were used to pay third party expenses, and the effect on the Funds’ expense ratio, as a percentage of the Funds’ average daily net assets for the year ended September 30, 2023, can be found on the Statements of Operations or Consolidated Statements of Operations and Financial Highlights or Consolidated Financial Highlights, respectively.
Investment in Affiliated Security — The Funds may invest in the SEI Daily Income Trust Government Fund, an affiliated money market fund, to manage excess cash or to serve as margin or collateral for derivative positions. Additionally, the Funds may invest the cash collateral from the securities lending program in the SEI Liquidity Fund, LP.
Each of the Large Cap Index and S&P 500 Index Funds may purchase companies with which it is affiliated
to the extent these companies are represented in its benchmark index.
Interfund Lending — The SEC has granted an exemption that permits the Trust to participate in an interfund lending program (“the Program”) with existing or future investment companies registered under the 1940 Act that are advised by SIMC (the “SEI Funds”). The Program allows the SEI Funds to lend money to and borrow money from each other for temporary or emergency purposes. Participation in the Program is voluntary for both borrowing and lending funds.
Interfund loans may be made only when the rate of interest to be charged is more favorable to the lending fund than an investment in overnight repurchase agreements (“Repo Rate”), and more favorable to the borrowing fund than the rate of interest that would be charged by a bank for short-term borrowings (“Bank Loan Rate”). The Bank Loan Rate will be determined using a formula annually reviewed by the Board. The interest rate imposed on interfund loans is the average of the Repo Rate and the Bank Loan Rate.
For the year ended September 30, 2023, the following Funds borrowed funds from the SEI Multi-Asset Accumulation Fund. The amount borrowed, interest paid on the borrowing and the corresponding interest rate were as follows ($ Thousands):
Borrowing | Maturity | Amount | Interest | Interest | ||||||||||||||||
Tax-Managed Managed Volatility Fund | 2/27/23 | 2/28/23 | 7,400 | 1 | 5.58 | % | ||||||||||||||
7. CAPITAL SHARE TRANSACTIONS
Capital share transactions for the Funds were as follows (Thousands):
For the year or period ended September 30, 2023 and the year ended September 30, 2022.
Large Cap Fund | Large Cap Value Fund | Large Cap Growth Fund | Large Cap Index Fund | |||||||||||||||||||||||||||||
| 2023 | 2022 | 2023 | 2022 | 2023 | 2022 | 2023 | 2022 | |||||||||||||||||||||||||
Class F: | ||||||||||||||||||||||||||||||||
Shares Issued | 10,569 | 13,469 | 5,852 | 8,091 | 3,175 | 6,420 | 12,282 | 19,892 | ||||||||||||||||||||||||
Shares Issued in Lieu of Dividends and Distributions | 11,216 | 15,037 | 4,199 | 2,781 | 2,310 | 3,525 | 953 | 966 | ||||||||||||||||||||||||
Shares Redeemed | (26,399 | ) | (25,530 | ) | (9,890 | ) | (12,968 | ) | (8,031 | ) | (7,254 | ) | (17,602 | ) | (19,731 | ) | ||||||||||||||||
Total Increase (Decrease) in Net Assets Derived from Class F Transactions | (4,614 | ) | 2,976 | 161 | (2,096 | ) | (2,546 | ) | 2,691 | (4,367 | ) | 1,127 | ||||||||||||||||||||
Class I: | ||||||||||||||||||||||||||||||||
Shares Issued | – | – | 2 | 50 | 5 | 11 | – | – | ||||||||||||||||||||||||
Shares Issued in Lieu of Dividends and Distributions | – | – | 7 | 6 | 5 | 10 | – | – | ||||||||||||||||||||||||
Shares Redeemed | – | – | (46 | ) | (76 | ) | (24 | ) | (41 | ) | – | – | ||||||||||||||||||||
Total Decrease in Net Assets Derived from Class I Transactions | – | – | (37 | ) | (20 | ) | (14 | ) | (20 | ) | – | – | ||||||||||||||||||||
Class Y: | ||||||||||||||||||||||||||||||||
Shares Issued | 623 | 739 | 673 | 1,079 | 445 | 1,180 | – | – | ||||||||||||||||||||||||
Shares Issued in Lieu of Dividends and Distributions | 368 | 824 | 708 | 461 | 412 | 534 | – | – | ||||||||||||||||||||||||
SEI Institutional Managed Trust
427
Notes to Financial Statements/ Notes to Consolidated Financial Statements (Continued)
September 30, 2023
Large Cap Fund | Large Cap Value Fund | Large Cap Growth Fund | Large Cap Index Fund | |||||||||||||||||||||||||||||
| 2023 | 2022 | 2023 | 2022 | 2023 | 2022 | 2023 | 2022 | |||||||||||||||||||||||||
Shares Redeemed | (1,052 | ) | (3,893 | ) | (3,739 | ) | (1,454 | ) | (2,692 | ) | (658 | ) | – | – | ||||||||||||||||||
Total Increase (Decrease) in Net Assets Derived from Class Y Transactions | (61 | ) | (2,330 | ) | (2,358 | ) | 86 | (1,835 | ) | 1,056 | – | – | ||||||||||||||||||||
Increase (Decrease) in Capital Shares | (4,675 | ) | 646 | (2,234 | ) | (2,030 | ) | (4,395 | ) | 3,727 | (4,367 | ) | 1,127 | |||||||||||||||||||
Tax-Managed Large Cap Fund | S&P 500 Index Fund | Small Cap Fund | Small Cap Value Fund | |||||||||||||||||||||||||||||
| 2023 | 2022 | 2023 | 2022 | 2023 | 2022 | 2023 | 2022 | |||||||||||||||||||||||||
Class F: | ||||||||||||||||||||||||||||||||
Shares Issued | 5,540 | 8,835 | 1,547 | 1,117 | 4,019 | 5,486 | 1,491 | 2,644 | ||||||||||||||||||||||||
Shares Issued in Lieu of Dividends and Distributions | 6,077 | 5,061 | 949 | 710 | 366 | 8,435 | 754 | 1,051 | ||||||||||||||||||||||||
Shares Redeemed | (20,012 | ) | (17,878 | ) | (1,876 | ) | (2,205 | ) | (8,337 | ) | (8,476 | ) | (2,931 | ) | (3,264 | ) | ||||||||||||||||
Total Increase (Decrease) in Net Assets Derived from Class F Transactions | (8,395 | ) | (3,982 | ) | 620 | (378 | ) | (3,952 | ) | 5,445 | (686 | ) | 431 | |||||||||||||||||||
Class I: | ||||||||||||||||||||||||||||||||
Shares Issued | – | – | 34 | 13 | – | – | 2 | 3 | ||||||||||||||||||||||||
Shares Issued in Lieu of Dividends and Distributions | – | – | 6 | 5 | – | – | 2 | 6 | ||||||||||||||||||||||||
Shares Redeemed | – | – | (41 | ) | (26 | ) | – | – | (22 | ) | (40 | ) | ||||||||||||||||||||
Total Decrease in Net Assets Derived from Class I Transactions | – | – | (1 | ) | (8 | ) | – | – | (18 | ) | (31 | ) | ||||||||||||||||||||
Class Y: | ||||||||||||||||||||||||||||||||
Shares Issued | 3,361 | 1,561 | – | – | 544 | 281 | 443 | 416 | ||||||||||||||||||||||||
Shares Issued in Lieu of Dividends and Distributions | 907 | 725 | – | – | 20 | 381 | 159 | 206 | ||||||||||||||||||||||||
Shares Redeemed | (2,805 | ) | (1,965 | ) | – | – | (484 | ) | (497 | ) | (1,294 | ) | (327 | ) | ||||||||||||||||||
Total Increase (Decrease) in Net Assets Derived from Class Y Transactions | 1,463 | 321 | – | – | 80 | 165 | (692 | ) | 295 | |||||||||||||||||||||||
Increase (Decrease) in Capital Shares | (6,932 | ) | (3,661 | ) | 619 | (386 | ) | (3,872 | ) | 5,610 | (1,396 | ) | 695 | |||||||||||||||||||
Small Cap Growth Fund | Tax-Managed Small/Mid Cap Fund | Mid-Cap Fund | U.S. Managed Volatility Fund | |||||||||||||||||||||||||||||
| 2023 | 2022 | 2023 | 2022 | 2023 | 2022 | 2023 | 2022 | |||||||||||||||||||||||||
Class F: | ||||||||||||||||||||||||||||||||
Shares Issued | 1,074 | 1,361 | 2,439 | 3,213 | 432 | 1,483 | 5,723 | 7,667 | ||||||||||||||||||||||||
Shares Issued in Lieu of Dividends and Distributions | 5 | 2,064 | 263 | 2,832 | 19 | 587 | 3,785 | 3,722 | ||||||||||||||||||||||||
Shares Redeemed | (1,817 | ) | (1,515 | ) | (6,427 | ) | (5,287 | ) | (558 | ) | (1,619 | ) | (13,485 | ) | (11,060 | ) | ||||||||||||||||
Total Increase (Decrease) in Net Assets Derived from Class F Transactions | (738 | ) | 1,910 | (3,725 | ) | 758 | (107 | ) | 451 | (3,977 | ) | 329 | ||||||||||||||||||||
Class I: | ||||||||||||||||||||||||||||||||
Shares Issued | 4 | 7 | – | – | — | 4 | — | — | ||||||||||||||||||||||||
Shares Issued in Lieu of Dividends and Distributions | — | 10 | – | – | — | 4 | 4 | 7 | ||||||||||||||||||||||||
Shares Redeemed | (25 | ) | (23 | ) | – | – | (2 | ) | (15 | ) | — | (49 | ) | |||||||||||||||||||
Total Increase (Decrease) in Net Assets Derived from Class I Transactions | (21 | ) | (6 | ) | – | – | (2 | ) | (7 | ) | 4 | (42 | ) | |||||||||||||||||||
Class Y: | ||||||||||||||||||||||||||||||||
Shares Issued | 245 | 163 | 946 | 416 | 36 | 49 | 2,239 | 1,020 | ||||||||||||||||||||||||
Shares Issued in Lieu of Dividends and Distributions | 3 | 234 | 46 | 381 | 2 | 25 | 1,003 | 1,083 | ||||||||||||||||||||||||
Shares Redeemed | (332 | ) | (174 | ) | (782 | ) | (501 | ) | (20 | ) | (30 | ) | (2,362 | ) | (3,172 | ) | ||||||||||||||||
Total Increase (Decrease) in Net Assets Derived from Class Y Transactions | (84 | ) | 223 | 210 | 296 | 18 | 44 | 880 | (1,069 | ) | ||||||||||||||||||||||
Increase (Decrease) in Capital Shares | (843 | ) | 2,127 | (3,515 | ) | 1,054 | (91 | ) | 488 | (3,093 | ) | (782 | ) | |||||||||||||||||||
Global Managed Volatility Fund | Tax-Managed Managed Volatility Fund | Tax-Managed International Managed Volatility Fund | Real Estate Fund | |||||||||||||||||||||||||||||
| 2023 | 2022 | 2023 | 2022 | 2023 | 2022 | 2023 | 2022 | |||||||||||||||||||||||||
Class F: | ||||||||||||||||||||||||||||||||
Shares Issued | 8,900 | 10,124 | 3,531 | 5,501 | 5,152 | 5,275 | 519 | 1,946 | ||||||||||||||||||||||||
Shares Issued in Lieu of Dividends and Distributions | 6,387 | 7,473 | 2,192 | 1,817 | 663 | 819 | 193 | 354 | ||||||||||||||||||||||||
Shares Redeemed | (21,347 | ) | (18,019 | ) | (12,001 | ) | (11,087 | ) | (10,209 | ) | (7,157 | ) | (1,070 | ) | (2,589 | ) | ||||||||||||||||
Total Decrease in Net Assets Derived from Class F Transactions | (6,060 | ) | (422 | ) | (6,278 | ) | (3,769 | ) | (4,394 | ) | (1,063 | ) | (358 | ) | (289 | ) | ||||||||||||||||
Class I: | ||||||||||||||||||||||||||||||||
428
SEI Institutional Managed Trust
Global Managed Volatility Fund | Tax-Managed Managed Volatility Fund | Tax-Managed International Managed Volatility Fund | Real Estate Fund | |||||||||||||||||||||||||||||
| 2023 | 2022 | 2023 | 2022 | 2023 | 2022 | 2023 | 2022 | |||||||||||||||||||||||||
Shares Issued | — | 1 | – | – | – | – | — | — | ||||||||||||||||||||||||
Shares Issued in Lieu of Dividends and Distributions | 5 | 10 | – | – | – | – | 1 | 2 | ||||||||||||||||||||||||
Shares Redeemed | — | (57 | ) | – | – | – | – | — | (14 | ) | ||||||||||||||||||||||
Total Increase (Decrease) in Net Assets Derived from Class I Transactions | 5 | (46 | ) | – | – | – | – | 1 | (12 | ) | ||||||||||||||||||||||
Class Y: | ||||||||||||||||||||||||||||||||
Shares Issued | 3,619 | 1,682 | 1,953 | 542 | 2,905 | 699 | 105 | 156 | ||||||||||||||||||||||||
Shares Issued in Lieu of Dividends and Distributions | 942 | 1,131 | 257 | 185 | 134 | 150 | 50 | 71 | ||||||||||||||||||||||||
Shares Redeemed | (3,377 | ) | (2,639 | ) | (936 | ) | (721 | ) | (2,172 | ) | (1,109 | ) | (198 | ) | (248 | ) | ||||||||||||||||
Total Increase (Decrease) in Net Assets Derived from Class Y Transactions | 1,184 | 174 | 1,274 | 6 | 867 | (260 | ) | (43 | ) | (21 | ) | |||||||||||||||||||||
(Decrease) in Capital Shares | (4,871 | ) | (294 | ) | (5,004 | ) | (3,763 | ) | (3,527 | ) | (1,323 | ) | (400 | ) | (322 | ) | ||||||||||||||||
Core Fixed Income Fund | High Yield Bond Fund | Conservative Income Fund | Tax-Free Conservative Income Fund | |||||||||||||||||||||||||||||
| 2023 | 2022 | 2023 | 2022 | 2023 | 2022 | 2023 | 2022 | |||||||||||||||||||||||||
Class F: | ||||||||||||||||||||||||||||||||
Shares Issued | 50,948 | 63,452 | 35,058 | 37,354 | 36,541 | 23,483 | 5,213 | 6,639 | ||||||||||||||||||||||||
Shares Issued in Lieu of Dividends and Distributions | 10,150 | 7,145 | 28,036 | 12,143 | 1,469 | 150 | 368 | 58 | ||||||||||||||||||||||||
Shares Redeemed | (76,036 | ) | (86,282 | ) | (57,400 | ) | (57,435 | ) | (26,105 | ) | (16,099 | ) | (6,882 | ) | (7,364 | ) | ||||||||||||||||
Total Increase (Decrease) in Net Assets Derived from Class F Transactions | (14,938 | ) | (15,685 | ) | 5,694 | (7,938 | ) | 11,905 | 7,534 | (1,301 | ) | (667 | ) | |||||||||||||||||||
Class I: | ||||||||||||||||||||||||||||||||
Shares Issued | 20 | 33 | — | 1 | – | – | – | – | ||||||||||||||||||||||||
Shares Issued in Lieu of Dividends and Distributions | 7 | 6 | — | 3 | – | – | – | – | ||||||||||||||||||||||||
Shares Redeemed | (94 | ) | (117 | ) | — | (88 | ) | – | – | – | – | |||||||||||||||||||||
Total Decrease in Net Assets Derived from Class I Transactions | (67 | ) | (78 | ) | — | (84 | ) | – | – | – | – | |||||||||||||||||||||
Class Y: | ||||||||||||||||||||||||||||||||
Shares Issued | 11,305 | 6,784 | 10,081 | 5,793 | 669 | 512 | 221 | 819 | ||||||||||||||||||||||||
Shares Issued in Lieu of Dividends and Distributions | 1,527 | 1,056 | 4,494 | 1,977 | 57 | 9 | 12 | 3 | ||||||||||||||||||||||||
Shares Redeemed | (14,181 | ) | (7,696 | ) | (13,295 | ) | (7,628 | ) | (734 | ) | (687 | ) | (325 | ) | (1,260 | ) | ||||||||||||||||
Total Increase (Decrease) in Net Assets Derived from Class Y Transactions | (1,349 | ) | 144 | 1,280 | 142 | (8 | ) | (166 | ) | (92 | ) | (438 | ) | |||||||||||||||||||
Increase (Decrease) in Capital Shares | (16,354 | ) | (15,619 | ) | 6,974 | (7,880 | ) | 11,897 | 7,368 | (1,393 | ) | (1,105 | ) | |||||||||||||||||||
Real Return Fund | Dynamic Asset Allocation Fund | Multi-Strategy Alternative Fund | Liquid Alternative Fund(1) | |||||||||||||||||||||||||
| 2023 | 2022 | 2023 | 2022 | 2023 | 2022 | 2023 | ||||||||||||||||||||||
Class F: | ||||||||||||||||||||||||||||
Shares Issued | 4,342 | 10,533 | 4,985 | 4,820 | 3,950 | 5,838 | 52 | |||||||||||||||||||||
Shares Issued in Lieu of Dividends and Distributions | 953 | 1,274 | 5,283 | 4,220 | 811 | 2,914 | — | |||||||||||||||||||||
Shares Redeemed | (10,811 | ) | (8,003 | ) | (8,647 | ) | (11,685 | ) | (10,438 | ) | (7,946 | ) | — | |||||||||||||||
Total Increase (Decrease) in Net Assets Derived from Class F Transactions | (5,516 | ) | 3,804 | 1,621 | (2,645 | ) | (5,677 | ) | 806 | 52 | ||||||||||||||||||
Class Y: | ||||||||||||||||||||||||||||
Shares Issued | 415 | 403 | 582 | 387 | 826 | 167 | 1,165 | |||||||||||||||||||||
Shares Issued in Lieu of Dividends and Distributions | 78 | 106 | 332 | 258 | 19 | 62 | — | |||||||||||||||||||||
Shares Redeemed | (714 | ) | (439 | ) | (550 | ) | (719 | ) | (204 | ) | (155 | ) | (100 | ) | ||||||||||||||
Total Increase (Decrease) in Net Assets Derived from Class Y Transactions | (221 | ) | 70 | 364 | (74 | ) | 641 | 74 | 1,065 | |||||||||||||||||||
Increase (Decrease) in Capital Shares | (5,737 | ) | 3,874 | 1,985 | (2,719 | ) | (5,036 | ) | 880 | 1,117 | ||||||||||||||||||
Multi-Asset Accumulation Fund | Multi-Asset Income Fund | Multi-Asset Inflation Managed Fund | Multi-Asset Capital Stability Fund | |||||||||||||||||||||||||||||
| 2023 | 2022 | 2023 | 2022 | 2023 | 2022 | 2023 | 2022 | |||||||||||||||||||||||||
Class F: | ||||||||||||||||||||||||||||||||
Shares Issued | 33,098 | 32,374 | 7,513 | 8,691 | 10,150 | 21,495 | 7,872 | 14,438 | ||||||||||||||||||||||||
SEI Institutional Managed Trust
429
Notes to Financial Statements/ Notes to Consolidated Financial Statements (Continued)
September 30, 2023
| Multi-Asset Accumulation Fund | Multi-Asset Income Fund | Multi-Asset Inflation Managed Fund | Multi-Asset Capital Stability Fund | |||||||||||||||||||||||||||||
| 2023 | 2022 | 2023 | 2022 | 2023 | 2022 | 2023 | 2022 | |||||||||||||||||||||||||
| Shares Issued in Lieu of Dividends and Distributions | 24,357 | 30,363 | 3,561 | 2,441 | 9,499 | 6,439 | 923 | 1,405 | ||||||||||||||||||||||||
| Shares Redeemed | (52,994 | ) | (42,752 | ) | (15,391 | ) | (15,610 | ) | (27,459 | ) | (27,949 | ) | (17,617 | ) | (16,832 | ) | ||||||||||||||||
| Total Increase (Decrease) in Net Assets Derived from Class F Transactions | 4,461 | 19,985 | (4,317 | ) | (4,478 | ) | (7,810 | ) | (15 | ) | (8,822 | ) | (989 | ) | ||||||||||||||||||
| Class Y: | ||||||||||||||||||||||||||||||||
| Shares Issued | 5,190 | 2,568 | 2,179 | 1,715 | 912 | 469 | 320 | 398 | ||||||||||||||||||||||||
| Shares Issued in Lieu of Dividends and Distributions | 1,490 | 2,499 | 969 | 605 | 500 | 383 | 61 | 102 | ||||||||||||||||||||||||
| Shares Redeemed | (11,988 | ) | (3,447 | ) | (4,361 | ) | (2,347 | ) | (1,515 | ) | (1,764 | ) | (752 | ) | (797 | ) | ||||||||||||||||
| Total Increase (Decrease) in Net Assets Derived from Class Y Transactions | (5,308 | ) | 1,620 | (1,213 | ) | (27 | ) | (103 | ) | (912 | ) | (371 | ) | (297 | ) | |||||||||||||||||
| Increase (Decrease) in Capital Shares | (847 | ) | 21,605 | (5,530 | ) | (4,505 | ) | (7,913 | ) | (927 | ) | (9,193 | ) | (1,286 | ) | |||||||||||||||||
(1) Commenced operations on June 30, 2023.
8. INVESTMENT TRANSACTIONS
The cost of security purchases and proceeds from the sale of securities, other than temporary cash investments, during the year ended September 30, 2023, were as follows:
U.S. Gov't | Other | Total | ||||||||||
Large Cap Fund | ||||||||||||
Purchases | $ | — | $ | 442,674 | $ | 442,674 | ||||||
Sales | — | 665,891 | 665,891 | |||||||||
Large Cap Value Fund | ||||||||||||
Purchases | — | 289,370 | 289,370 | |||||||||
Sales | — | 451,454 | 451,454 | |||||||||
Large Cap Growth Fund | ||||||||||||
Purchases | — | 905,895 | 905,895 | |||||||||
Sales | — | 1,217,957 | 1,217,957 | |||||||||
Large Cap Index Fund | ||||||||||||
Purchases | — | 71,196 | 71,196 | |||||||||
Sales | — | 163,604 | 163,604 | |||||||||
Tax-Managed Large Cap Fund | ||||||||||||
Purchases | — | 588,617 | 588,617 | |||||||||
Sales | — | 1,049,430 | 1,049,430 | |||||||||
S&P 500 Index Fund | ||||||||||||
Purchases | — | 43,639 | 43,639 | |||||||||
Sales | — | 81,610 | 81,610 | |||||||||
Small Cap Fund | ||||||||||||
Purchases | — | 573,990 | 573,990 | |||||||||
Sales | — | 622,866 | 622,866 | |||||||||
Small Cap Value Fund | ||||||||||||
Purchases | — | 141,303 | 141,303 | |||||||||
Sales | — | 182,944 | 182,944 | |||||||||
Small Cap Growth Fund | ||||||||||||
Purchases | — | 568,192 | 568,192 | |||||||||
Sales | — | 592,944 | 592,944 | |||||||||
Tax-Managed Small/Mid Cap Fund | ||||||||||||
Purchases | — | 497,963 | 497,963 | |||||||||
Sales | — | 581,805 | 581,805 | |||||||||
Mid-Cap Fund | ||||||||||||
Purchases | — | 49,489 | 49,489 | |||||||||
Sales | — | 50,919 | 50,919 | |||||||||
U.S. Managed Volatility Fund | ||||||||||||
Purchases | — | 393,782 | 393,782 | |||||||||
Sales | — | 516,233 | 516,233 | |||||||||
U.S. Gov't | Other | Total | ||||||||||
Global Managed Volatility Fund | ||||||||||||
Purchases | — | 699,228 | 699,228 | |||||||||
Sales | — | 831,335 | 831,335 | |||||||||
Tax-Managed Managed Volatility Fund | ||||||||||||
Purchases | — | 191,886 | 191,886 | |||||||||
Sales | — | 344,528 | 344,528 | |||||||||
Tax-Managed International Managed Volatility Fund | ||||||||||||
Purchases | — | 244,346 | 244,346 | |||||||||
Sales | — | 290,411 | 290,411 | |||||||||
Real Estate Fund | ||||||||||||
Purchases | — | 39,037 | 39,037 | |||||||||
Sales | — | 45,240 | 45,240 | |||||||||
Core Fixed Income Fund | ||||||||||||
Purchases | 10,668,806 | 2,110,710 | 12,779,516 | |||||||||
Sales | 10,553,396 | 2,592,426 | 13,145,822 | |||||||||
High Yield Bond Fund | ||||||||||||
Purchases | 1,778 | 490,739 | 492,517 | |||||||||
Sales | — | 641,030 | 641,030 | |||||||||
Real Return Fund | ||||||||||||
Purchases | 68,132 | — | 68,132 | |||||||||
Sales | 134,362 | — | 134,362 | |||||||||
Dynamic Asset Allocation Fund | ||||||||||||
Purchases | — | 124,784 | 124,784 | |||||||||
Sales | — | 251,569 | 251,569 | |||||||||
Multi-Strategy Alternative Fund | ||||||||||||
Purchases | 4,626 | 1,107,712 | 1,112,338 | |||||||||
Sales | 4,253 | 1,130,267 | 1,134,520 | |||||||||
Liquid Alternative Fund | ||||||||||||
Purchases | — | — | — | |||||||||
Sales | — | — | — | |||||||||
Multi-Asset Accumulation Fund | ||||||||||||
Purchases | 72,610 | 268,632 | 341,242 | |||||||||
Sales | 78,840 | 395,120 | 473,960 | |||||||||
Multi-Asset Income Fund | ||||||||||||
Purchases | 617 | 227,671 | 228,288 | |||||||||
Sales | 2,164 | 248,376 | 250,540 | |||||||||
Multi-Asset Inflation Managed Fund | ||||||||||||
Purchases | 539,184 | 138,736 | 677,920 | |||||||||
Sales | 613,034 | 240,670 | 853,704 | |||||||||
Multi-Asset Capital Stability Fund | ||||||||||||
Purchases | 66,753 | 27,661 | 94,414 | |||||||||
Sales | 91,309 | 32,549 | 123,858 | |||||||||
430
SEI Institutional Managed Trust
9. FEDERAL TAX INFORMATION
It is each Fund’s intention to continue to qualify as a regulated investment company under Subchapter M of The Internal Revenue Code and distribute all of its taxable income (including net capital gains). Accordingly, no provision for Federal income taxes is required.
The Multi-Asset Accumulation and Multi-Asset Inflation Managed Funds have each requested private letter rulings from the Internal Revenue Service (“IRS”) concluding that the income generated from their investment in their respective Subsidiaries, each of which invests in commodity-linked derivatives, will be “qualifying income” for regulated investment company (“RIC”) qualification purposes, regardless of whether actual distributions are made to the Funds by the respective Subsidiary.
In July 2011, the IRS suspended the issuance of private letter rulings regarding the investment by RICs into controlled foreign corporations which principally invest in commodities, such as the Subsidiaries, indicating that it was reconsidering its policies surrounding the issuance of these rulings. The Dynamic Commodity Strategy, Multi-Asset Accumulation and Multi-Asset Inflation Managed Funds have secured an opinion of counsel based on customary representations that actual distributions made to the Funds should be treated as “qualifying income”. The Treasury released a proposed regulation in October 2016 stating that income inclusion from a controlled foreign corporation is treated as dividends i.e. qualifying income only to the extent that the Funds received cash distributions from the subsidiary. The Treasury released a final regulation in March 2019 reversing its position on the proposed regulation by removing the cash distribution requirement.
The Real Estate Fund has a tax year that ends on December 31. The following tax disclosures are
representative as of September 30, 2023, except for the permanent reclassification and tax character of distributions, which are as of December 31, 2022. Accordingly, the disclosures are for informational use by shareholders and are subject to change attributable to activity through the end of the tax year-ending December 31, 2023.
Dividends from net investment income and distributions from net realized capital gains are determined in accordance with U.S. Federal income tax regulations, which may differ from those amounts determined under U.S. GAAP. These book/tax differences are either temporary or permanent in nature.
The permanent differences are primarily attributable to different treatment for gains and losses on paydowns of mortgage and asset backed securities for tax purposes, defaulted bond basis adjustments, reclassification of long term capital gain distributions on REIT securities, reclassification of income and expense from swap transactions, Treasury Inflation-Protected Securities and net operating losses, basis adjustments for investments in partnerships, and gains and losses on passive foreign investment companies, expiration of capital loss carryforwards, collateralized loan obligation basis adjustments, utilization of earnings and profits on shareholder redemptions, certain foreign currency related transactions, payment of excise tax, and non-taxable in-kind redemptions.
Distributable Earnings (Loss) | Paid-in- | |||||||
Small Cap Fund | $ | (15 | ) | $ | 15 | |||
Small Cap Growth Fund | 703 | (703 | ) | |||||
Tax-Managed Small/Mid Cap Fund | (204 | ) | 204 | |||||
High Yield Bond Fund | 3 | (3 | ) | |||||
The tax character of dividends and distributions paid during the fiscal years or periods ended September 30, 2023 or September 30, 2022 (unless otherwise indicated) was as follows:
Ordinary | Long-term | Return of Capital | Tax Exempt Income | Total | ||||||||||||||||
Large Cap Fund | ||||||||||||||||||||
2023 | $ | 11,904 | $ | 149,792 | $ | — | $ | — | $ | 161,696 | ||||||||||
2022 | 61,429 | 220,787 | — | — | 282,216 | |||||||||||||||
Large Cap Value Fund | ||||||||||||||||||||
2023 | 37,312 | 89,162 | — | — | 126,474 | |||||||||||||||
2022 | 31,326 | 62,850 | — | — | 94,176 | |||||||||||||||
Large Cap Growth Fund | ||||||||||||||||||||
2023 | 11 | 98,789 | — | — | 98,800 | |||||||||||||||
2022 | 21,472 | 197,320 | — | — | 218,792 | |||||||||||||||
SEI Institutional Managed Trust
431
Notes to Financial Statements/ Notes to Consolidated Financial Statements (Continued)
September 30, 2023
Ordinary | Long-term | Return of Capital | Tax Exempt Income | Total | ||||||||||||||||
Large Cap Index Fund | ||||||||||||||||||||
2023 | $ | 14,021 | $ | — | $ | — | $ | — | $ | 14,021 | ||||||||||
2022 | 14,044 | 1,753 | — | — | 15,797 | |||||||||||||||
Tax-Managed Large Cap Fund | ||||||||||||||||||||
2023 | 41,176 | 205,202 | — | — | 246,378 | |||||||||||||||
2022 | 39,532 | 197,578 | — | — | 237,110 | |||||||||||||||
S&P 500 Index Fund | ||||||||||||||||||||
2023 | 11,652 | 66,182 | — | — | 77,834 | |||||||||||||||
2022 | 13,514 | 62,560 | — | — | 76,074 | |||||||||||||||
Small Cap Fund | ||||||||||||||||||||
2023 | 1,733 | 3,109 | — | — | 4,842 | |||||||||||||||
2022 | 66,921 | 61,560 | — | — | 128,481 | |||||||||||||||
Small Cap Value Fund | ||||||||||||||||||||
2023 | 4,727 | 16,880 | — | — | 21,607 | |||||||||||||||
2022 | 11,167 | 23,613 | — | — | 34,780 | |||||||||||||||
Small Cap Growth Fund | ||||||||||||||||||||
2023 | 244 | — | — | — | 244 | |||||||||||||||
2022 | 38,252 | 52,511 | — | — | 90,763 | |||||||||||||||
Tax-Managed Small/Mid Cap Fund | ||||||||||||||||||||
2023 | 4,609 | 3,364 | — | — | 7,973 | |||||||||||||||
2022 | 2,336 | 94,023 | — | — | 96,359 | |||||||||||||||
Mid-Cap Fund | ||||||||||||||||||||
2023 | 539 | — | — | — | 539 | |||||||||||||||
2022 | 8,990 | 9,652 | — | — | 18,642 | |||||||||||||||
U.S. Managed Volatility Fund | ||||||||||||||||||||
2023 | 14,759 | 71,871 | — | — | 86,630 | |||||||||||||||
2022 | 35,245 | 59,945 | — | — | 95,190 | |||||||||||||||
Global Managed Volatility Fund | ||||||||||||||||||||
2023 | 45,317 | 39,570 | — | — | 84,887 | |||||||||||||||
2022 | 18,044 | 96,215 | — | — | 114,259 | |||||||||||||||
Tax-Managed Managed Volatility Fund | ||||||||||||||||||||
2023 | 8,459 | 48,976 | — | — | 57,435 | |||||||||||||||
2022 | 9,958 | 39,174 | — | — | 49,132 | |||||||||||||||
Tax-Managed International Managed Volatility Fund | ||||||||||||||||||||
2023 | 8,956 | — | — | — | 8,956 | |||||||||||||||
2022 | 12,641 | — | — | — | 12,641 | |||||||||||||||
Real Estate Fund | ||||||||||||||||||||
2023 | 1,676 | 2,029 | — | — | 3,705 | |||||||||||||||
2022 | 4,783 | 3,740 | — | — | 8,523 | |||||||||||||||
Core Fixed Income Fund | ||||||||||||||||||||
2023 | 120,076 | — | — | — | 120,076 | |||||||||||||||
2022 | 93,993 | — | — | — | 93,993 | |||||||||||||||
High Yield Bond Fund | ||||||||||||||||||||
2023 | 181,968 | — | 18,207 | — | 200,175 | |||||||||||||||
2022 | 102,523 | — | — | — | 102,523 | |||||||||||||||
Conservative Income Fund | ||||||||||||||||||||
2023 | 18,676 | — | — | — | 18,676 | |||||||||||||||
2022 | 2,042 | — | — | — | 2,042 | |||||||||||||||
Tax-Free Conservative Income Fund | ||||||||||||||||||||
2023 | — | — | — | 4,638 | 4,638 | |||||||||||||||
2022 | 1 | — | — | 730 | 731 | |||||||||||||||
Real Return Fund | ||||||||||||||||||||
2023 | 11,708 | — | — | — | 11,708 | |||||||||||||||
2022 | 16,933 | — | — | — | 16,933 | |||||||||||||||
432
SEI Institutional Managed Trust
Ordinary | Long-term | Return of Capital | Tax Exempt Income | Total | ||||||||||||||||
Dynamic Asset Allocation Fund | ||||||||||||||||||||
2023 | $ | 21,823 | $ | 62,019 | $ | — | $ | — | $ | 83,842 | ||||||||||
2022 | 33,460 | 56,160 | — | — | 89,620 | |||||||||||||||
Multi-Strategy Alternative Fund | ||||||||||||||||||||
2023 | 8,411 | — | — | — | 8,411 | |||||||||||||||
2022 | 32,564 | — | — | — | 32,564 | |||||||||||||||
Liquid Alternative Fund | ||||||||||||||||||||
2023 | — | — | — | — | — | |||||||||||||||
Multi-Asset Accumulation Fund | ||||||||||||||||||||
2023 | 190,323 | — | — | — | 190,323 | |||||||||||||||
2022 | 274,745 | 69,051 | — | — | 343,796 | |||||||||||||||
Multi-Asset Income Fund | ||||||||||||||||||||
2023 | 49,211 | — | — | — | 49,211 | |||||||||||||||
2022 | 36,039 | 437 | — | — | 36,476 | |||||||||||||||
Multi-Asset Inflation Managed Fund | ||||||||||||||||||||
2023 | 88,501 | — | — | — | 88,501 | |||||||||||||||
2022 | 62,112 | — | — | — | 62,112 | |||||||||||||||
Multi-Asset Capital Stability Fund | ||||||||||||||||||||
2023 | 12,008 | — | — | — | 12,008 | |||||||||||||||
2022 | 17,226 | 2,414 | — | — | 19,640 | |||||||||||||||
As of September 30, 2023, the components of Distributable Earnings/(Accumulated Losses) were as follows:
Undistributed | Undistributed | Undistributed | Capital | Post- | Late Year | Unrealized | Other | Total | ||||||||||||||||||||||||||||
Large Cap Fund | $ | 10,385 | $ | 70,687 | $ | — | $ | — | $ | — | $ | — | $ | 511,030 | $ | (2 | ) | $ | 592,100 | |||||||||||||||||
Large Cap Value Fund | 13,487 | 52,088 | — | — | — | — | 265,337 | (1 | ) | 330,911 | ||||||||||||||||||||||||||
Large Cap Growth Fund | — | 196,799 | — | — | — | — | 565,074 | — | 761,873 | |||||||||||||||||||||||||||
Large Cap Index Fund | 3,412 | — | — | (9,044 | ) | — | — | 295,307 | (1 | ) | 289,674 | |||||||||||||||||||||||||
Tax-Managed Large Cap Fund | 9,506 | 154,945 | — | — | — | — | 2,490,988 | 5 | 2,655,444 | |||||||||||||||||||||||||||
S&P 500 Index Fund | 2,958 | 27,750 | — | — | — | — | 609,361 | (5 | ) | 640,064 | ||||||||||||||||||||||||||
Small Cap Fund | 1,150 | 18,293 | — | — | — | — | 47,794 | — | 67,237 | |||||||||||||||||||||||||||
Small Cap Value Fund | 1,557 | 3,605 | — | — | — | — | 48,796 | (2 | ) | 53,956 | ||||||||||||||||||||||||||
Small Cap Growth Fund | — | — | — | (26,652 | ) | — | (748 | ) | 19,732 | 3 | (7,665 | ) | ||||||||||||||||||||||||
Tax-Managed Small/Mid Cap Fund | 968 | 19,944 | — | — | — | — | 290,998 | — | 311,910 | |||||||||||||||||||||||||||
Mid-Cap Fund | 113 | — | — | (1,806 | ) | (1,932 | ) | — | 3,022 | (3 | ) | (606 | ) | |||||||||||||||||||||||
U.S. Managed Volatility Fund | 4,755 | 68,958 | — | — | — | — | 70,531 | 3 | 144,247 | |||||||||||||||||||||||||||
Global Managed Volatility Fund | 5,360 | 28,804 | — | — | — | — | 12,542 | (1,826 | ) | 44,880 | ||||||||||||||||||||||||||
Tax-Managed Managed Volatility Fund | 2,009 | 97,732 | — | — | — | — | 424,993 | — | 524,734 | |||||||||||||||||||||||||||
Tax-Managed International Managed Volatility Fund | 9,859 | — | — | (11,443 | ) | (7,903 | ) | — | 48,939 | (41,034 | ) | (1,582 | ) | |||||||||||||||||||||||
Real Estate Fund | — | 1,115 | — | — | (137 | ) | — | 5,239 | — | 6,217 | ||||||||||||||||||||||||||
Core Fixed Income Fund | 9,783 | — | — | (315,129 | ) | (210,458 | ) | — | (359,608 | ) | (16,937 | ) | (892,349 | ) | ||||||||||||||||||||||
High Yield Bond Fund | — | — | — | (199,722 | ) | — | — | (300,227 | ) | (10,945 | ) | (510,894 | ) | |||||||||||||||||||||||
Conservative Income Fund | 457 | — | — | — | — | — | (54 | ) | (376 | ) | 27 | |||||||||||||||||||||||||
Tax-Free Conservative Income Fund | — | — | 103 | (8 | ) | — | — | (63 | ) | (90 | ) | (58 | ) | |||||||||||||||||||||||
Real Return Fund | 2,095 | — | — | (4,457 | ) | (6,628 | ) | — | (14,375 | ) | 6 | (23,359 | ) | |||||||||||||||||||||||
Dynamic Asset Allocation Fund | — | 59,755 | — | — | (651 | ) | (3,109 | ) | 272,870 | 1 | 328,866 | |||||||||||||||||||||||||
Multi-Strategy Alternative Fund | 10,920 | — | — | (15,599 | ) | (7,863 | ) | — | (11,232 | ) | (80 | ) | (23,854 | ) | ||||||||||||||||||||||
Liquid Alternative Fund | 138 | 50 | — | — | — | — | — | — | 188 | |||||||||||||||||||||||||||
SEI Institutional Managed Trust
433
Notes to Financial Statements/ Notes to Consolidated Financial Statements (Continued)
September 30, 2023
| Undistributed Ordinary Income ($ Thousands) | Undistributed Long-Term Capital Gain ($ Thousands) | Undistributed Tax-Exempt Income ($ Thousands) | Capital Loss Carryforwards ($ Thousands) | Post- October Losses ($ Thousands) | Late Year Ordinary Losses ($ Thousands) | Unrealized Appreciation (Depreciation) ($ Thousands) | Other Temporary Differences ($ Thousands) | Total Distributable Earnings (Accumulated Losses) ($ Thousands) | ||||||||||||||||||||||||||||
| Multi-Asset Accumulation Fund | $ | — | $ | — | $ | — | $ | (531,490 | ) | $ | (52,568 | ) | $ | — | $ | (346,638 | ) | $ | (33,582 | ) | $ | (964,278 | ) | |||||||||||||
| Multi-Asset Income Fund | 6,752 | — | — | (23,172 | ) | (8,570 | ) | — | (75,072 | ) | (3,598 | ) | (103,660 | ) | ||||||||||||||||||||||
| Multi-Asset Inflation Managed Fund | 21,450 | — | — | (74,743 | ) | (28,636 | ) | — | (98,075 | ) | (202 | ) | (180,206 | ) | ||||||||||||||||||||||
| Multi-Asset Capital Stability Fund | 14,905 | — | — | (23,167 | ) | — | — | 7,615 | (323 | ) | (970 | ) | ||||||||||||||||||||||||
Post October losses represent losses realized on investment transactions from November 1, 2022 through September 30, 2023, that, in accordance with Federal income tax regulations, the Funds may defer and treat as having arisen in the following fiscal year. Deferred Late-Year Losses represent ordinary losses realized on investment transactions from January 1, 2023 through September 30, 2023, and specified losses realized on investment transactions from November 1, 2022 through September 30, 2023, that, in accordance with Federal income tax regulations, the Fund defers and treats as having arisen in the following fiscal year.
For Federal income tax purposes, capital loss carryforwards may be carried forward and applied against future capital gains. Losses carried forward are as follows:
Short-Term | Long-Term | Total | ||||||||||
Large Cap Index Fund | $ | 5,093 | $ | 3,951 | $ | 9,044 | ||||||
Small Cap Growth Fund | 26,652 | – | 26,652 | |||||||||
Mid-Cap Fund | 1,806 | – | 1,806 | |||||||||
Tax-Managed International Managed Volatility Fund | 11,443 | – | 11,443 | |||||||||
Core Fixed Income Fund | 173,895 | 141,234 | 315,129 | |||||||||
High Yield Bond Fund | 23,579 | 176,143 | 199,722 | |||||||||
Tax-Free Conservative Income Fund | 8 | – | 8 | |||||||||
Real Return Fund | 2,265 | 2,192 | 4,457 | |||||||||
Multi-Strategy Alternative Fund | 14,019 | 1,580 | 15,599 | |||||||||
Multi-Asset Accumulation Fund | 310,229 | 221,261 | 531,490 | |||||||||
Multi-Asset Income Fund | 17,420 | 5,752 | 23,172 | |||||||||
Multi-Asset Inflation Managed Fund | 67,100 | 7,643 | 74,743 | |||||||||
Multi-Asset Capital Stability Fund | 11,487 | 11,680 | 23,167 | |||||||||
For Federal income tax purposes, the cost of investments owned at September 30, 2023, and the net realized gains or losses on investments sold for the period, were different from amounts reported for financial reporting purposes primarily due to investments in partnerships that captures losses from other securities, and wash sales which cannot be used for Federal income tax purposes in the current year and have been deferred for use in future years.
The Federal tax cost and aggregate gross unrealized appreciation and depreciation on total investments held by the Funds at September 30, 2023, were as follows:
Federal Tax Cost | Appreciated | Depreciated | Net Unrealized | |||||||||||||
Large Cap Fund | $ | 1,105,578 | $ | 579,819 | $ | (68,789 | ) | $ | 511,030 | |||||||
Large Cap Value Fund | 969,091 | 348,613 | (83,276 | ) | 265,337 | |||||||||||
Large Cap Growth Fund | 773,125 | 585,100 | (20,026 | ) | 565,074 | |||||||||||
Large Cap Index Fund | 713,043 | 359,186 | (63,879 | ) | 295,307 | |||||||||||
Tax-Managed Large Cap Fund | 1,299,257 | 2,511,904 | (20,916 | ) | 2,490,988 | |||||||||||
S&P 500 Index Fund | 255,601 | 623,318 | (13,957 | ) | 609,361 | |||||||||||
Small Cap Fund | 471,987 | 82,405 | (34,611 | ) | 47,794 | |||||||||||
Small Cap Value Fund | 295,512 | 82,594 | (33,798 | ) | 48,796 | |||||||||||
Small Cap Growth Fund | 290,833 | 48,182 | (28,450 | ) | 19,732 | |||||||||||
Tax-Managed Small/Mid Cap Fund | 481,843 | 300,215 | (9,217 | ) | 290,998 | |||||||||||
Mid-Cap Fund | 71,243 | 8,254 | (5,232 | ) | 3,022 | |||||||||||
U.S. Managed Volatility Fund | 674,838 | 117,458 | (46,927 | ) | 70,531 | |||||||||||
Global Managed Volatility Fund | 763,884 | 57,584 | (45,042 | ) | 12,542 | |||||||||||
Tax-Managed Managed Volatility Fund | 381,645 | 428,491 | (3,498 | ) | 424,993 | |||||||||||
Tax-Managed International Managed Volatility Fund | 255,445 | 55,235 | (6,296 | ) | 48,939 | |||||||||||
Real Estate Fund | 62,877 | 12,021 | (6,782 | ) | 5,239 | |||||||||||
Core Fixed Income Fund | 4,267,642 | 5,516 | (365,124 | ) | (359,608 | ) | ||||||||||
High Yield Bond Fund | 1,516,211 | 101,824 | (402,051 | ) | (300,227 | ) | ||||||||||
Conservative Income Fund | 477,520 | 51 | (105 | ) | (54 | ) | ||||||||||
Tax-Free Conservative Income Fund | 167,253 | — | (63 | ) | (63 | ) | ||||||||||
Real Return Fund | 211,803 | — | (14,375 | ) | (14,375 | ) | ||||||||||
Dynamic Asset Allocation Fund | 265,981 | 306,307 | (33,437 | ) | 272,870 | |||||||||||
Multi-Strategy Alternative Fund | 366,191 | 7,152 | (18,384 | ) | (11,232 | ) | ||||||||||
Liquid Alternative Fund | — | — | — | — | ||||||||||||
Multi-Asset Accumulation Fund | 1,419,828 | 13,214 | (359,852 | ) | (346,638 | ) | ||||||||||
Multi-Asset Income Fund | 709,039 | 8,755 | (83,827 | ) | (75,072 | ) | ||||||||||
Multi-Asset Inflation Managed Fund | 738,063 | 87,482 | (185,557 | ) | (98,075 | ) | ||||||||||
Multi-Asset Capital Stability Fund | 520,802 | 11,909 | (4,294 | ) | 7,615 | |||||||||||
434
SEI Institutional Managed Trust
Management has analyzed the Funds’ tax positions taken on federal income tax returns for all open tax years and has concluded that as of September 30, 2023, no provision for income tax would be required in the Funds’ financial statements. The Funds’ federal and state income and federal excise tax returns for tax years for which the applicable statutes of limitations have not expired are subject to examination by the Internal Revenue Service and state departments of revenue.
10. CONCENTRATION/RISKS
In the normal course of business, the Trust enters into contracts that provide general indemnifications by the Trust to the counterparty to the contract. The Trust’s maximum exposure under these arrangements is dependent on future claims that may be made against the Trust and, therefore, cannot be estimated; however, Management believes that, based on experience, the risk of loss from such claims is considered remote.
To the extent consistent with its investment strategy a Fund may have one or more of the following principle risks. A more complete description of principal risks is included in each Fund's prospectus under the heading "Principal Risks."
Arbitrage Strategies Risk — Arbitrage strategies involve engaging in transactions that attempt to exploit price differences of identical, related or similar securities on different markets or in different forms. The Fund may realize losses or a reduced rate of return if underlying relationships among securities in which it takes investment positions change in an adverse manner or if a transaction is unexpectedly terminated or delayed. Trading to seek short-term capital appreciation can be expected to cause the Fund’s portfolio turnover rate to be substantially higher than that of the average equity-oriented investment company.
Asset-Backed Securities Risk — Payment of principal and interest on asset-backed securities is dependent largely on the cash flows generated by the assets backing the securities. Securitization trusts generally do not have any assets or sources of funds other than the receivables and related property they own, and asset-backed securities are generally not insured or guaranteed by the related sponsor or any other entity. Asset-backed securities may be more illiquid than more conventional types of fixed income securities that the Fund may acquire.
Bank Loans Risk — With respect to bank loans, the Fund will assume the credit risk of both the borrower and the lender that is selling the participation in the loan. The Fund may also have difficulty disposing of bank
loans because, in certain cases, the market for such instruments is not highly liquid.
Below Investment Grade Securities (Junk Bonds) Risk — Fixed income securities rated below investment grade ( junk bonds) involve greater risks of default or downgrade and are generally more volatile than investment grade securities because the prospect for repayment of principal and interest of many of these securities is speculative. Because these securities typically offer a higher rate of return to compensate investors for these risks, they are sometimes referred to as “high yield bonds,” but there is no guarantee that an investment in these securities will result in a high rate of return.
Call Risk — Issuers of callable bonds may call (redeem) securities with higher coupons or interest rates before their maturity dates. The Fund may be forced to reinvest the unanticipated proceeds at lower interest rates, resulting in a decline in the Fund’s income. Bonds may be called due to falling interest rates or non-economical circumstances.
Collateralized Debt Obligations (CDOs) and Collateralized Loan Obligations (CLOs) Risk — CDOs and CLOs are securities backed by an underlying portfolio of debt and loan obligations, respectively. CDOs and CLOs issue classes or “tranches” that vary in risk and yield and may experience substantial losses due to actual defaults, decrease in market value due to collateral defaults and removal of subordinate tranches, market anticipation of defaults and investor aversion to CDO and CLO securities as a class. The risks of investing in CDOs and CLOs depend largely on the tranche invested in and the type of the underlying debts and loans in the tranche of the CDO or CLO, respectively, in which the Fund invests. CDOs and CLOs also carry risks including, but not limited to, interest rate risk and credit risk, which are described below. For example, a liquidity crisis in the global credit markets could cause substantial fluctuations in prices for leveraged loans and high-yield debt securities and limited liquidity for such instruments. When the Fund invests in CDOs or CLOs, in addition to directly bearing the expenses associated with its ownoperations, it may bear a pro rata portion of the CDO’s or CLO’s expenses.
Commercial Paper Risk — Commercial paper is a short-term obligation with a maturity generally ranging from one to 270 days and is issued by U.S. or foreign companies or other entities in order to finance their current operations. Such investments are unsecured and usually discounted from their value at maturity. The value of commercial paper may be affected by changes in the credit rating or financial condition of the issuing entities and will tend to fall when interest rates rise and
SEI Institutional Managed Trust
435
Notes to Financial Statements/ Notes to Consolidated Financial Statements (Continued)
September 30, 2023
rise when interest rates fall. Asset-backed commercial paper may be issued by structured investment vehicles or other conduits that are organized to issue the commercial paper and to purchase trade receivables or other financial assets. The repayment of asset-backed commercial paper depends primarily on the cash collections received from such issuer’s underlying asset portfolio and the issuer’s ability to issue new asset-backed commercial paper.
Commodity Investments and Derivatives Risk — Commodity investments and derivatives may be more volatile and less liquid than direct investments in the underlying commodities themselves. Commodity related equity returns can also be affected by the issuer’s financial structure or the performance of unrelated businesses. The value of a commodity investment or a derivative investment in commodities is typically based upon the price movements of a physical commodity, a commodity futures contract or commodity index or some other readily measurable economic variable that is dependent upon changes in the value of commodities or the commodities markets. The value of these securities will rise or fall in response to changes in the underlying commodity or related benchmark or investment, changes in interest rates or factors affecting a particular industry or commodity, such as natural disasters, weather and U.S. and international economic, political and regulatory developments.
Commodity-Linked Securities Risk — Investments in commodity-linked securities may be more volatile and less liquid than direct investments in the underlying commodities themselves. Commodity-related equity returns can also be affected by the issuer’s financial structure or the performance of unrelated businesses.
Concentration Risk — A downturn in the financial services industry would impact the Fund more than a portfolio that does not concentrate in securities issued by companies in the financial services industry.
Convertible and Preferred Securities Risk — Convertible and preferred securities have many of the same characteristics as stocks, including many of the same risks. In addition, convertible securities may be more sensitive to changes in interest rates than stocks. Convertible securities may also have credit ratings below investment grade, meaning that they carry a higher risk of failure by the issuer to pay principal and/or interest when due.
Corporate Fixed Income Securities Risk — Corporate fixed income securities respond to economic developments, especially changes in interest rates, as
well as perceptions of the creditworthiness and business prospects of individual issuers.
Credit Risk — The risk that the issuer of a security or the counterparty to a contract will default or otherwise become unable to honor a financial obligation.
Currency Risk — As a result of the Fund’s investments in securities or other investments denominated in, and/or receiving revenues in, foreign currencies, the Fund will be subject to currency risk. Currency risk is the risk that foreign currencies will decline in value relative to the U.S. dollar or, in the case of hedging positions, that the U.S. dollar will decline in value relative to the currency hedged. In either event, the dollar value of an investment in the Fund would be adversely affected. Due to the Fund’s investments in securities denominated in foreign currencies, it will be subject to the risk that currency exchange rates may fluctuate in response to, among other things, changes in interest rates, intervention (or failure to intervene) by U.S. or foreign governments, central banks or supranational entities, or by the imposition of currency controls or other political developments in the United States or abroad.
Depositary Receipts Risk — Depositary receipts, such as ADRs, are certificates evidencing ownership of shares of a foreign issuer that are issued by depositary banks and generally trade on an established market. Depositary receipts are subject to many of the risks associated with investing directly in foreign securities, including, among other things, political, social and economic developments abroad, currency movements and different legal, regulatory, tax, accounting and audit environments.
Derivatives Risk — The Fund’s use of futures contracts, forward contracts, options and swaps is subject to market risk, leverage risk, correlation risk and liquidity risk. Market risk is described above, and leverage risk and liquidity risk are described below. Many over-the-counter (OTC) derivative instruments will not have liquidity beyond the counterparty to the instrument. Correlation risk is the risk that changes in the value of the derivative may not correlate perfectly with the underlying asset, rate or index. The Fund’s use of forward contracts and swap agreements is also subject to credit risk and valuation risk. Credit risk is described above. Valuation risk is the risk that the derivative may be difficult to value and/or valued incorrectly. Each of these risks could cause the Fund to lose more than the principal amount invested in a derivative instrument. Some derivatives have the potential for unlimited loss, regardless of the size of the Fund’s initial investment. The other parties to certain derivative contracts present the same types of credit risk as issuers of fixed income securities. The Fund’s use of derivatives may also
436
SEI Institutional Managed Trust
increase the amount of taxes payable by shareholders. Both U.S. and non-U.S. regulators have adopted and implemented regulations governing derivatives markets, the ultimate impact of which remains unclear.
Directional or Tactical Strategies Risk — Directional or tactical strategies usually use long and short positions, which entail predicting the direction that particular securities or sectors or the overall market might move. Directional or tactical strategies may utilize leverage and hedging. There may be a significant risk of loss if the Fund’s judgment is incorrect as to the direction, timing or extent of expected movements of particular securities or sectors or the market as a whole.
Distressed Securities Risk — Distressed securities frequently do not produce income while they are outstanding and may require the Fund to bear certain extraordinary expenses in order to protect and recover its investment. Distressed securities are at high risk for default.
Duration Risk — The longer-term securities in which the Fund may invest tend to be more volatile than shorter-term securities. A portfolio with a longer average portfolio duration is more sensitive to changes in interest rates than a portfolio with a shorter average portfolio duration.
Economic Risks of Global Health Events — Global health events and pandemics, such as COVID-19, have the ability to affect—quickly, drastically and substantially the economies of many nations, states, individual companies and the markets in general and can cause disruptions that cannot necessarily be foreseen. The spread of COVID-19 around the world in 2020 resulted in a substantial number of nations implementing social distancing measures, quarantines, and the shutdown of non-essential businesses and governmental services. Further, it has caused significant volatility in U.S. and international markets. The impact of the outbreak may be short term or may last for an extended period of time.
Event-Driven Strategies Risk — Event-driven strategies involve making evaluations and predictions about both the likelihood that a particular event in the life of a company will occur and the impact such an event will have on the value of the company’s securities. The transaction in which such a company is involved may be unsuccessful, take considerable time (or longer than anticipated) or may result in a distribution of cash or a new security, the value of which may be less than the purchase price of the company’s security. If an anticipated transaction does not occur, the Fund may be required to sell its securities at a loss.
Exchange-Traded Funds (ETFs) Risk — The risks of owning shares of an ETF generally reflect the risks of owning the underlying securities the ETF is designed
to track, although lack of liquidity in an ETF could result in its value being more volatile than the underlying portfolio securities. When the Fund invests in an ETF, in addition to directly bearing the expenses associated with its own operations, it will bear a pro rata portion of the ETF’s expenses.
Exchange-Traded Notes (ETNs) Risk — The value of an ETN is subject to the credit risk of the issuer.
There may not be an active trading market available for some ETNs. Additionally, trading of ETNs may be halted or the ETN may be delisted by the listing exchange.
Extension Risk — The risk that rising interest rates may extend the duration of a fixed income security, typically reducing the security’s value.
Financial Services Industry Risk — The Conservative Income Fund’s portfolio is concentrated in investments in securities issued by companies in the financial services industry. The financial services industry is subject to extensive government regulation. Profitability is largely dependent on the availability and cost of capital, and can fluctuate significantly when interest rates change. Financial services companies are highly dependent on short-term interest rates and typically will be adversely affected by economic downturns or changes in banking regulations.
Foreign Investment/Emerging Markets Risk — The risk that non-U.S. securities may be subject to additional risks due to, among other things, political, social and economic developments abroad, currency movements and different legal, regulatory, tax, accounting and audit environments. These additional risks may be heightened with respect to emerging market countries because political turmoil and rapid changes in economic conditions are more likely to occur in these countries. Investments in emerging markets are subject to the added risk that information in emerging market investments may be unreliable or outdated due to differences in regulatory, accounting or auditing and financial record keeping standards, or because less information about emerging market investments is publicly available. In addition, the rights and remedies associated with emerging market investments may be different than investments in developed markets. A lack of reliable information, rights and remedies increase the risks of investing in emerging markets in comparison to more developed markets. In addition, periodic U.S. Government restrictions on investments in issuers from certain foreign countries may require the Fund to sell such investments at inopportune times, which could result in losses to the Fund.
Foreign Sovereign Debt Securities Risk — The risks that: (i) the governmental entity that controls the
SEI Institutional Managed Trust
437
Notes to Financial Statements/ Notes to Consolidated Financial Statements (Continued)
September 30, 2023
repayment of sovereign debt may not be willing or able to repay the principal and/or interest when it becomes due because of factors such as debt service burden, political constraints, cash flow problems and other national economic factors; (ii) governments may default on their debt securities, which may require holders of such securities to participate in debt rescheduling or additional lending to defaulting governments; and (iii) there is no bankruptcy proceeding by which defaulted sovereign debt may be collected in whole or in part.
Income Risk — An investment in the Fund is subject to income risk, which is the possibility that the Fund’s yield will decline due to falling interest rates.
Inflation Protected Securities Risk — The value of inflation protected securities, including TIPS, generally will fluctuate in response to changes in “real” interest rates, generally decreasing when real interest rates rise and increasing when real interest rates fall. Real interest rates represent nominal (or stated) interest rates reduced by the expected impact of inflation. In addition, interest payments on inflation indexed securities will generally vary up or down along with the rate of inflation.
Interest Rate Risk — The risk that a change in interest rates will cause a fall in the value of fixed income securities, including U.S. Government securities, in which the Fund invests. Generally, the value of the Fund’s fixed income securities will vary inversely with the direction of prevailing interest rates. Changing interest rates may have unpredictable effects on the markets and may affect the value and liquidity of instruments held by the Fund. Although U.S. Government securities are considered to be among the safest investments, they are not guaranteed against price movements due to changing interest rates.
Investment Company and Exchange-Traded Funds (ETFs) Risk — When the Fund invests in an investment company, in addition to directly bearing the expenses associated with its own operations, it will bear a pro rata portion of the investment company’s expenses. In addition, while the risks of owning shares of an investment company generally reflect the risks of owning the underlying investments of the investment company, the Fund may be subject to additional or different risks than if the Fund had invested directly in the underlying investments. For example, the lack of liquidity in an ETF could result in its value being more volatile than the underlying portfolio securities. Closed-end investment companies issue a fixed number of shares that trade on a stock exchange or over-the-counter at a premium or a discount to their net asset value. As a result, a closed-end fund’s share price fluctuates based on what another
investor is willing to pay rather than on the market value of the securities in the fund.
Investment in the Subsidiary Risk — A Subsidiary is not registered under the Investment Company Act of 1940 (the 1940 Act) and, unless otherwise noted, is not subject to all of the investor protections of the 1940 Act. Thus, the Fund, as an investor in a Subsidiary, will not have all of the protections offered to investors in registered investment companies. In addition, changes in the laws of the United States and/or the Cayman Islands, under which the Fund and a Subsidiary, respectively, are organized, could result in the inability of the Fund and/or a Subsidiary to operate as intended and could negatively affect the Fund and its shareholders.
Investment Style Risk — The risk that large capitalization securities may underperform other segments of the equity markets or the equity markets as a whole.
Large Capitalization Risk — The risk that larger, more established companies may be unable to respond quickly to new competitive challenges such as changes in technology and consumer tastes. Larger companies also may not be able to attain the high growth rates of successful smaller companies.
Leverage Risk — The Fund’s use of derivatives may result in the Fund’s total investment exposure substantially exceeding the value of its portfolio securities and the Fund’s investment returns depending substantially on the performance of securities that the Fund may not directly own. The use of leverage can amplify the effects of market volatility on the Fund’s share price and may also cause the Fund to liquidate portfolio positions when it would not be advantageous to do so in order to satisfy its obligations. The Fund’s use of leverage may result in a heightened risk of investment loss.
Liquidity Risk — The risk that certain securities may be difficult or impossible to sell at the time and the price that the Fund would like. The Fund may have to lower the price of the security, sell other securities instead or forego an investment opportunity, any of which could have a negative effect on Fund management or performance.
Market Risk — The risk that the market value of a security may move up and down, sometimes rapidly and unpredictably. Market risk may affect a single issuer, an industry, a sector or the equity or bond market as a whole. Equity markets may decline significantly in response to adverse issuer, political, regulatory, market, economic or other developments that may cause broad changes in market value, public perceptions concerning these developments, and adverse investor sentiment or publicity. Similarly, environmental and public health
438
SEI Institutional Managed Trust
risks, such as natural disasters, epidemics, pandemics or widespread fear that such events may occur, may impact markets adversely and cause market volatility in both the short- and long-term. The prices of the Fund’s fixed income securities respond to economic developments, particularly interest rate changes, as well as to perceptions about the creditworthiness of individual issuers, including governments and their agencies. Generally, the Fund’s fixed income securities will decrease in value if interest rates rise and vice versa. In a low interest rate environment, risks associated with rising rates are heightened. Declines in dealer market-making capacity as a result of structural or regulatory changes could decrease liquidity and/or increase volatility in the fixed income markets. Markets for fixed income securities may decline significantly in response to adverse issuer, political, regulatory, market, economic or other developments that may cause broad changes in market value, public perceptions concerning these developments, and adverse investor sentiment or publicity. Similarly, environmental and public health risks, such as natural disasters, epidemics, pandemics or widespread fear that such events may occur, may impact markets adversely and cause market volatility in both the short- and long-term. In response to these events, the Fund’s value may fluctuate and/or the Fund may experience increased redemptions from shareholders, which may impact the Fund’s liquidity or force the Fund to sell securities into a declining or illiquid market.
Master Limited Partnership (MLP) Risk — Investments in units of MLPs involve risks that differ from an investment in common stock. Holders of the units of MLPs have more limited control and limited rights to vote on matters affecting the partnership. There are also certain tax risks associated with an investment in units of MLPs. In addition, conflicts of interest may exist between common unit holders, subordinated unit holders and the general partner of an MLP, including a conflict arising as a result of incentive distribution payments. The benefit the Fund derives from investment in MLP units is largely dependent on the MLPs being treated as partnerships and not as corporations for federal income tax purposes. If an MLP were classified as a corporation for federal income tax purposes, there would be a reduction in the after-tax return to the Fund of distributions from the MLP, likely causing a reduction in the value of the Fund’s shares. MLP entities are typically focused in the energy, natural resources and real estate sectors of the economy. A downturn in the energy, natural resources or real estate sectors of the economy could have an adverse impact on the Fund. At times, the performance of securities of companies in the energy, natural resources and real estate sectors of the economy may lag the performance of other sectors or the broader
market as a whole. The Internal Revenue Code of 1986, as amended, provides that the Fund is permitted to invest up to 25% of its assets in one or more qualified publicly traded partnerships (QPTPs), which will include certain MLPs, and treat the income allocated by such QPTPs as qualifying income for purposes of the regulated investment company annual qualifying income requirements described in “Taxes” below.
Mortgage Dollar Rolls Risk — Mortgage dollar rolls are transactions in which the Fund sells securities (usually mortgage-backed securities) and simultaneously contracts to repurchase substantially similar, but not identical, securities on a specified future date. If the broker-dealer to whom the Fund sells the security becomes insolvent, the Fund’s right to repurchase the security may be restricted. Other risks involved in entering into mortgage dollar rolls include the risk that the value of the security may change adversely over the term of the mortgage dollar roll and that the security the Fund is required to repurchase may be worth less than the security that the Fund originally held.
Mortgage-Backed Securities Risk — Mortgage-backed securities are affected significantly by the rate of prepayments and modifications of the mortgage loans backing those securities, as well as by other factors such as borrower defaults, delinquencies, realized or liquidation losses and other shortfalls. Mortgage backed securities are particularly sensitive to prepayment risk, which is described below, given that the term to maturity for mortgage loans is generally substantially longer than the expected lives of those securities; however, the timing and amount of prepayments cannot be accurately predicted. The timing of changes in the rate of prepayments of the mortgage loans may significantly affect the Fund’s actual yield to maturity on any mortgage-backed securities, even if the average rate of principal payments is consistent with the Fund’s expectation. Along with prepayment risk, mortgage-backed securities are significantly affected by interest rate risk, which is described above. In a low interest rate environment, mortgage loan prepayments would generally be expected to increase due to factors such as refinancings and loan modifications at lower interest rates. In contrast, if prevailing interest rates rise, prepayments of mortgage loans would generally be expected to decline and therefore extend the weighted average lives of mortgage-backed securities held or acquired by the Fund.
Municipal Securities Risk — Municipal securities, like other fixed income securities, rise and fall in value in response to economic and market factors, primarily changes in interest rates, and actual or perceived credit quality. Rising interest rates will generally cause municipal securities to decline in value. Longer term
SEI Institutional Managed Trust
439
Notes to Financial Statements/ Notes to Consolidated Financial Statements (Continued)
September 30, 2023
securities usually respond more sharply to interest rate changes than do shorter-term securities. A municipal security will also lose value if, due to rating downgrades or other factors, there are concerns about the issuer’s current or future ability to make principal or interest payments. State and local governments rely on taxes and, to some extent, revenues from private projects financed by municipal securities, to pay interest and principal on municipal debt. Poor statewide or local economic results or changing political sentiments may reduce tax revenues and increase the expenses of municipal issuers, making it more difficult for them to meet their obligations. Actual or perceived erosion of the creditworthiness of municipal issuers may reduce the value of the Fund’s holdings. As a result, the Fund will be more susceptible to factors that adversely affect issuers of municipal obligations than a mutual fund that does not have as great a concentration in municipal obligations. Municipal obligations may be underwritten or guaranteed by a relatively small number of financial services firms, so changes in the municipal securities market that affect those firms may decrease the availability of municipal instruments in the market, thereby making it difficult for the Sub-Adviser to identify and obtain appropriate investments for the Fund’s portfolio. Also, there may be economic or political changes that impact the ability of issuers of municipal securities to repay principal and to make interest payments on securities owned by the Fund. Any changes in the financial condition of municipal issuers may also adversely affect the value of the Fund’s securities.
Non-Diversified Risk — The Multi-Asset Accumulation and Multi-Asset Inflation Managed Funds are non-diversified, which means that they may invest in the securities of relatively few issuers. As a result, these Funds may be more susceptible to a single adverse economic or political occurrence affecting one or more of these issuers and may experience increased volatility due to its investments in those securities. However, the Funds intend to satisfy the asset diversification requirements under the Code for classification as a RIC.
Opportunity Risk — The risk of missing out on an investment opportunity because the assets necessary to take advantage of it are tied up in other investments.
Portfolio Turnover Risk — Due to its investment strategy, the Fund may buy and sell securities frequently. This may result in higher transaction costs and taxes subject to ordinary income tax rates as opposed to more favorable capital gains rates, which may affect the Fund’s performance.
Prepayment Risk — The risk that, in a declining interest rate environment, fixed income securities with stated
interest rates may have the principal paid earlier than expected, requiring the Fund to invest the proceeds at generally lower interest rates.
Private Placements Risk — Investment in privately placed securities may be less liquid than in publicly traded securities. Although these securities may be resold in privately negotiated transactions, the prices realized from these sales could be less than those originally paid by the Fund or less than what may be considered the fair value of such securities. Further, companies whose securities are not publicly traded may not be subject to the disclosure and other investor protection requirements that might be applicable if their securities were publicly traded.
Real Estate Industry Risk — Securities of companies principally engaged in the real estate industry may be subject to the risks associated with the direct ownership of real estate. Risks commonly associated with the direct ownership of real estate include fluctuations in the value of underlying properties, defaults by borrowers or tenants, changes in interest rates and risks related to general or local economic conditions. The Fund’s investments are concentrated in issuers conducting business in the real estate industry, and therefore the Fund is subject to risks associated with legislative or regulatory changes, adverse market conditions and/or increased competition affecting that industry.
Real Estate Investment Trusts (REITs) Risk — REITs are trusts that invest primarily in commercial real estate or real estate-related loans. The Fund’s investments in REITs will be subject to the risks associated with the direct ownership of real estate. Risks commonly associated with the direct ownership of real estate include fluctuations in the value of underlying properties, defaults by borrowers or tenants, changes in interest rates and risks related to general or local economic conditions. Some REITs may have limited diversification and may be subject to risks inherent in financing a limited number of properties.
Repurchase Agreement Risk — Although repurchase agreement transactions must be fully collateralized at all times, they generally create leverage and involve some counterparty risk to the Fund whereby a defaulting counterparty could delay or prevent the Fund’s recovery of collateral.
Short Sales Risk — A short sale involves the sale of a security that the Fund does not own in the expectation of purchasing the same security (or a security exchangeable therefore) at a later date at a lower price. Short sales expose the Fund to the risk that it will be required to buy the security sold short (also known as “covering” the short position) at a time when the security has appreciated in value, thus resulting in a loss to the
440
SEI Institutional Managed Trust
Fund. Investment in short sales may also cause the Fund to incur expenses related to borrowing securities. Reinvesting proceeds received from short selling may create leverage, which can amplify the effects of market volatility on the Fund’s share price. In addition, shorting a future contract may require posting only a margin that may amount to less than the notional exposure of the contract. Such a practice may exacerbate the loss in a case of adverse price action.
Small and Medium Capitalization Companies Risk — The risk that small and medium capitalization companies in which the Fund may invest may be more vulnerable to adverse business or economic events than larger, more established companies. In particular, small and medium capitalization companies may have limited product lines, markets and financial resources and may depend upon a relatively small management group. Therefore, small capitalization and medium capitalization stocks may be more volatile than those of larger companies. Small capitalization and medium capitalization stocks may be traded over-the-counter or listed on an exchange.
Tax Risk — The Fund may gain most of its exposure to the commodities markets through its investment in a Subsidiary, which invests in commodity investments and derivative instruments. To the extent the Fund invests in such instruments directly, it will seek to restrict its income from commodity-linked derivative instruments that do not generate qualifying income, such as commodity-linked swaps, to a maximum of 10% of its gross income (when combined with its other investments that produce non-qualifying income) to comply with certain qualifying income tests necessary for the Fund to qualify as a regulated investment company (RIC) under Subchapter M of the Internal Revenue Code of 1986, as amended. The tax treatment of certain commodity-linked derivative instruments may be affected by future regulatory or legislative changes that could affect the character, timing and/or amount of the Fund’s taxable income or gains and distributions. The Fund intends to hold certain commodity-related investments indirectly through a Subsidiary. The Fund believes that income from the Subsidiary will be qualifying income because it expects that the Subsidiary will make annual distributions of its earnings and profits. The Fund intends to secure an opinion of counsel based on customary representations that actual distributions made to the Fund from its Subsidiary should be treated as “qualifying income.” If the Fund did not qualify as a RIC for any taxable year and certain relief provisions were not available, the Fund’s taxable income would be subject to tax at the Fund level and to a further tax at the shareholder level when such income is distributed. Failure to comply with the requirements for
qualification as a RIC would have significant negative tax consequences to Fund shareholders.
Taxation Risk — The Fund is managed to seek to minimize tax consequences to shareholders, but there is no guarantee that the Fund will be able to operate without incurring taxable income and gains to shareholders.
Tracking Error Risk — The risk that the Fund’s performance may vary substantially from the performance of the benchmark index it tracks as a result of cash flows, Fund expenses, imperfect correlation between the Fund’s investments and the index’s components and other factors.
U.S. Government Securities Risk — Although U.S. Government securities are considered to be among the safest investments, they are still subject to the credit risk of the U.S. Government and are not guaranteed against price movements due to changing interest rates. Obligations issued by some U.S. Government agencies are backed by the U.S. Treasury, while others are backed solely by the ability of the agency to borrow from the U.S. Treasury or by the agency’s own resources. No assurance can be given that the U.S. Government will provide financial support to its agencies and instrumentalities if it is not obligated by law to do so.
Warrants Risk — Warrants are instruments that entitle the holder to buy an equity security at a specific price for a specific period of time. Warrants may be more speculative than other types of investments. The price of a warrant may be more volatile than the price of its underlying security, and a warrant may offer greater potential for capital appreciation as well as capital loss. A warrant ceases to have value if it is not exercised prior to its expiration date.
The foregoing is not intended to be a complete discussion of the risks associated with investing in a Fund. Please review each Fund’s current prospectus for additional disclosures regarding the principal risks associated with investing in a Fund.
11. CONCENTRATION OF SHAREHOLDERS
SEI Private Trust Company (“SPTC”) and SIMC are subsidiaries of SEI Investments Company. As of September 30, 2023, SPTC held of record the following percentage of outstanding shares of each Fund:
Fund | % Held | |||
Large Cap Fund | ||||
Class F | 97 | % | ||
Class Y | 38 | |||
Large Cap Value Fund | ||||
Class F | 92 | % | ||
Class I | – | |||
SEI Institutional Managed Trust
441
Notes to Financial Statements/ Notes to Consolidated Financial Statements (Concluded)
September 30, 2023
Fund | % Held | |||
Class Y | 98 | |||
Large Cap Growth Fund | ||||
Class F | 90 | % | ||
Class I | – | |||
Class Y | 97 | |||
Large Cap Index Fund | ||||
Class F | 99 | % | ||
Tax-Managed Large Cap Fund | ||||
Class F | 82 | % | ||
Class Y | 54 | |||
S&P 500 Index Fund | ||||
Class F | 46 | % | ||
Class I | 17 | |||
Small Cap Fund | ||||
Class F | 98 | % | ||
Class Y | 35 | |||
Small Cap Value Fund | ||||
Class F | 93 | % | ||
Class I | – | |||
Class Y | 98 | |||
Small Cap Growth Fund | ||||
Class F | 92 | % | ||
Class I | – | |||
Class Y | 97 | |||
Tax-Managed Small/Mid Cap Fund | ||||
Class F | 90 | % | ||
Class Y | 57 | |||
Mid-Cap Fund | ||||
Class F | 94 | % | ||
Class I | – | |||
Class Y | 17 | |||
U.S. Managed Volatility Fund | ||||
Class F | 93 | % | ||
Class I | – | |||
Class Y | 52 | |||
Global Managed Volatility Fund | ||||
Class F | 95 | % | ||
Class I | – | |||
Class Y | 54 | |||
Tax-Managed Managed Volatility Fund | ||||
Class F | 85 | % | ||
Class Y | 71 | |||
Tax-Managed International Managed Volatility Fund | ||||
Class F | 96 | % | ||
Class Y | 91 | |||
Real Estate Fund | ||||
Class F | 95 | % | ||
Class I | – | |||
Class Y | 57 | |||
Core Fixed Income Fund | ||||
Class F | 97 | % | ||
Class I | 15 | |||
Fund | % Held | |||
Class Y | 58 | |||
High Yield Bond Fund | ||||
Class F | 97 | % | ||
Class I | – | |||
Class Y | 67 | |||
Conservative Income Fund | ||||
Class F | 99 | % | ||
Class Y | 39 | |||
Tax-Free Conservative Income Fund | ||||
Class F | 98 | % | ||
Class Y | 70 | |||
Real Return Fund | ||||
Class F | 98 | % | ||
Class Y | 41 | |||
Dynamic Asset Allocation Fund | ||||
Class F | 97 | % | ||
Class Y | 19 | |||
Multi-Strategy Alternative Fund | ||||
Class F | 98 | % | ||
Class Y | 85 | |||
Liquid Alternative Fund | ||||
Class F | 100 | % | ||
Class Y | – | |||
Multi-Asset Accumulation Fund | ||||
Class F | 98 | % | ||
Class Y | 53 | |||
Multi-Asset Income Fund | ||||
Class F | 97 | % | ||
Class Y | 65 | |||
Multi-Asset Inflation Managed Fund | ||||
Class F | 98 | % | ||
Class Y | 31 | |||
Multi-Asset Capital Stability Fund | ||||
Class F | 98 | % | ||
Class Y | 28 | |||
SPTC is not a direct service provider to the SEI Funds. However, SPTC performs a role in the comprehensive investment solution that SEI provides to investors. SPTC holds shares in the Funds as custodian for shareholders that are clients of independent registered investment advisers, financial planners, bank trust departments and other financial advisers. SPTC maintains omnibus accounts at the Fund’s transfer agent.
12. SECURITIES LENDING
Each Fund may lend portfolio securities to brokers, dealers and other financial organizations that meet capital and other credit requirements or other criteria established by the Board. These loans may not exceed 33 1/3% of the total asset value of the Fund (including the loan collateral). No Fund will lend portfolio securities to its Adviser, sub-adviser or their affiliates unless it
442
SEI Institutional Managed Trust
has applied for and received specific authority to do so from the SEC. Loans of portfolio securities will be fully collateralized by cash, letters of credit or U.S. Government securities. Collateral will be maintained in an amount equal to at least 100% of the current market value of the loaned securities by marking to market daily, although the borrower will be required to deliver collateral between 102% and 105% of the market value of borrowed securities for domestic and foreign securities, respectively. However, due to market fluctuations during the day, the value of securities loaned on a particular day may, during the course of the day, exceed the value of collateral. On each business day, the amount of collateral is adjusted based on the prior day’s market fluctuations and the current day’s lending activity. Income from lending activity is determined by the amount of interest earned on collateral, less any amounts payable to the borrowers of the securities and the lending agent. Lending securities involves certain risks, including the risk that the Fund may be delayed or restricted from recovering the loomed securities or disposing of the collateral for the loan, which could give rise to loss because at adverse market actions expenses and/ or delays in connection with the disposition of the underlying securities.
Cash collateral received in connection with securities lending is invested in eligible securities by the lending agent. These investments may include the SEI Liquidity Fund LP (“Liquidity Fund”), and the Fund bears its pro rata portion of the Liquidity Fund’s expenses and is subject to the risk of loss in the underlying investments of the Liquidity Fund. There is no guarantee that these investments will not lose value.
The following is a summary of securities lending agreements held by certain Funds which would be subject to offset as of September 30, 2023 ($ Thousands):
Securities | Cash | Net | ||||||||||
Large Cap Index Fund | $ | 549 | $ | 549 | $ | – | ||||||
Tax-Managed Large Cap Fund | 3,399 | 3,399 | – | |||||||||
Small Cap Fund | 377 | 377 | – | |||||||||
Small Cap Value Fund | 1,651 | 1,651 | – | |||||||||
Small Cap Growth Fund | 2,342 | 2,342 | – | |||||||||
U.S. Managed Volatility Fund | 2,715 | 2,715 | – | |||||||||
Global Managed Volatility Fund | 4,701 | 4,701 | – | |||||||||
Tax-Managed Managed Volatility Fund | 2,964 | 2,964 | – | |||||||||
Tax-Managed International Managed Volatility Fund | 2,460 | 2,460 | – | |||||||||
Core Fixed Income Fund | 52,367 | 52,367 | – | |||||||||
(1) Excess collateral received in connection with the above securities lending transactions is not shown for financial reporting purposes. See each Fund’s Schedule of Investments for the total collateral received.
13. REGULATORY MATTERS
The U.K. Financial Conduct Authority stopped compelling or inducing banks to submit certain London Inter-Bank Offered Rate (LIBOR) rates. The publication of LIBOR on a representative basis ceased for the one-week and two-month U.S. dollar LIBOR settings immediately after December 31, 2021, and ceased for the remaining U.S. dollar LIBOR settings immediately after June 30, 2023. Investments impacted by the discontinuation of LIBOR may include bank loans, derivatives, floating rate securities, and other assets or liabilities tied to LIBOR. Actions by regulators have resulted in the establishment of alternative reference rates to LIBOR in most major currencies. The U.S. Federal Reserve, based on the recommendations of the New York Federal Reserve’s Alternative Reference Rate Committee (comprised of major derivative market participants and their regulators), has begun publishing a Secured Overnight Financing Rate (SOFR), which is intended to replace U.S. dollar LIBOR. Alternative reference rates for other currencies have also been announced or have already begun publication. In response to the discontinuation of LIBOR, investors have added fallback provisions to existing contracts for investments whose value is tied to LIBOR, with most fallback provisions requiring the adoption of SOFR as a replacement rate. On March 15, 2022, President Biden signed the Adjustable Interest Rate Act into law (the “LIBOR Act”), which, in conjunction with regulations adopted by the Federal Reserve Board, establishes SOFR as the default fallback rate for any U.S. contract without a fallback provision. In addition, on March 4, 2023, the U.K. Financial Conduct Authority announced that, starting July 1, 2023 and continuing through September 30, 2024, it will permit the publishing of 1-, 3- and 6-month synthetic U.S. dollar LIBOR settings based on SOFR to serve as a fallback for non-U.S. contracts.
14. SUBSEQUENT EVENTS
Management has evaluated the need for disclosures and/or adjustments resulting from subsequent events through the date the financial statements were issued. Based on this evaluation, no disclosures and/or adjustments were required to the financial statements as of September 30, 2023.
SEI Institutional Managed Trust
443
Report of Independent Registered Public Accounting Firm
To the Shareholders of the Funds and Board of Trustees SEI Institutional Managed Trust:
Opinion on the Financial Statements
We have audited the accompanying statements of assets and liabilities of the Large Cap Fund, Large Cap Value Fund, Large Cap Growth Fund, Large Cap Index Fund, Tax-Managed Large Cap Fund, S&P 500 Index Fund, Small Cap Fund, Small Cap Value Fund, Small Cap Growth Fund, Tax- Managed Small/Mid Cap Fund, Mid-Cap Fund, U.S. Managed Volatility Fund, Global Managed Volatility Fund, Tax-Managed Managed Volatility Fund, Tax-Managed International Managed Volatility Fund, Real Estate Fund, Core Fixed Income Fund, High Yield Bond Fund, Conservative Income Fund, Tax-Free Conservative Income Fund, Real Return Fund, Multi-Strategy Alternative Fund, Liquid Alternative Fund (commencement of operations June 30, 2023), Multi-Asset Income Fund, and Multi-Asset Capital Stability Fund (twenty-five of the twenty-eight funds comprising the SEI Institutional Managed Trust (the Trust)), including the schedules of investments, as of September 30, 2023, the related statements of operations for the year then ended, except for the Liquid Alternative Fund for which the date is the period from June 30, 2023 to September 30, 2023, the statements of changes in net assets for each of the years in the two-year period then ended, except for the Liquid Alternative Fund for which the date is the period from June 30, 2023 to September 30, 2023, and the related notes (collectively, the financial statements) and the financial highlights for each of the years or periods in the five-year period then ended. We have also audited the accompanying consolidated statements of assets and liabilities of the Dynamic Asset Allocation Fund, Multi-Asset Accumulation Fund, and Multi-Asset Inflation Managed Fund (three of the twenty-eight funds comprising the Trust) (the twenty-eight funds collectively, the Funds), including the consolidated schedules of investments, as of September 30, 2023, the related consolidated statements of operations for the year then ended, the consolidated statements of changes in net assets for each of the years in the two-year period then ended, the consolidated statement of cash flows for the year then ended for the Multi-Asset Inflation Managed Fund, and the related notes (collectively, the consolidated financial statements) and the consolidated financial highlights for each of the years in the five-year period then ended. In our opinion, the financial statements and consolidated financial statements and financial highlights and consolidated financial highlights present fairly, in all material respects, the financial position of the Funds as of September 30, 2023, the results of their operations for the year or period then ended, the changes in their net assets for each of the years or periods in the two-year period then ended, the consolidated cash flows of the Multi-Asset Inflation Managed Fund for the year then ended, and the financial highlights and consolidated financial highlights for each of the years or periods in the five-year period then ended, in conformity with U.S. generally accepted accounting principles.
Basis for Opinion
These financial statements and consolidated financial statements and financial highlights and consolidated financial highlights are the responsibility of the Funds’ management. Our responsibility is to express an opinion on these financial statements and consolidated financial statements and financial highlights and consolidated financial highlights based on our audits. We are a public accounting firm registered with the Public Company Accounting Oversight Board (United States) (PCAOB) and are required to be independent with respect to the Funds in accordance with the U.S. federal securities laws and the applicable rules and regulations of the Securities and Exchange Commission and the PCAOB.
444
SEI Institutional Managed Trust
We conducted our audits in accordance with the standards of the PCAOB. Those standards require that we plan and perform the audit to obtain reasonable assurance about whether the financial statements and consolidated financial statements and financial highlights and consolidated financial highlights are free of material misstatement, whether due to error or fraud. Our audits included performing procedures to assess the risks of material misstatement of the financial statements and consolidated financial statements and financial highlights and consolidated financial highlights, whether due to error or fraud, and performing procedures that respond to those risks. Such procedures included examining, on a test basis, evidence regarding the amounts and disclosures in the financial statements and consolidated financial statements and financial highlights and consolidated financial highlights. Such procedures also included confirmation of securities owned as of September 30, 2023, by correspondence with the custodians, transfer agent, agent banks, and brokers or by other appropriate auditing procedures when replies were not received. Our audits also included evaluating the accounting principles used and significant estimates made by management, as well as evaluating the overall presentation of the financial statements and consolidated financial statements and financial highlights and consolidated financial highlights. We believe that our audits provide a reasonable basis for our opinion.
/s/ KPMG LLP
We have served as the auditor of one or more SEI Funds investment companies since 2005.
Philadelphia, Pennsylvania
November 28, 2023
SEI Institutional Managed Trust
445
Trustees and Officers of the Trust (Unaudited)
The following chart lists Trustees and Officers as of September 30, 2023.
Set forth below are the names, addresses, ages, position with the Trust, Term of Office and Length of Time Served, the principal occupations for the last five years, number of positions in fund complex overseen by trustee, and other directorships outside the fund complex of each of the persons currently serving as Trustees and Officers of the Trust. The Trust's Statement of Additional Information ("SAI") includes additional information about the Trustees and Officers. The SAI may be obtained without charge by calling 1-800-342-5734.
Name | Position(s) | Term of | Principal Occupation(s) | Number of | Other Directorships |
INTERESTED TRUSTEES | |||||
Robert A. Nesher | Chairman | since 1989 | Currently performs various services on behalf | 97 | President and Director of SEI Structured Credit Fund, LP. Director of SEI Global Master Fund plc, SEI Global Assets Fund plc, SEI Global Investments Fund plc, SEI Investments—Global Funds Services, Limited, SEI Investments Global, Limited, SEI Investments (Europe) Ltd., SEI Multi-Strategy Funds PLC, SEI Global Nominee Ltd and SEI Investments—Unit Trust Management (UK) Limited. President, Director and Chief Executive Officer of SEI Alpha Strategy Portfolios, LP from 2007 to 2013. President, Chief Executive Officer and Trustee of SEI Liquid Asset Trust from 1989 to 2016. President, Chief Executive Officer and Trustee of SEI Insurance Products Trust from 2013 to 2020. Trustee of The KP Funds from 2013 to 2020. Vice Chairman of O'Connor EQUUS (closed-end investment company) from 2014 to 2016. Vice Chairman of Winton Series Trust from 2014 to 2017. Vice Chairman of The Advisors' Inner Circle Fund III and Winton Diversified Opportunities Fund (closed-end investment company) from 2014 to 2018. Vice Chairman of Gallery Trust from 2015 to 2018. Vice Chairman of Schroder Series Trust and Schroder Global Series Trust from 2017 to 2018. Trustee of The Advisors’ Inner Circle Fund, The Advisors’ Inner Circle Fund II, Bishop Street Funds, Frost Family of Funds and Catholic Responsible Investments Funds. President, Chief Executive Officer and Trustee of SEI Asset Allocation Trust, SEI Daily Income Trust, SEI Institutional Managed Trust, SEI Institutional International Trust, SEI Institutional Investments Trust, SEI Tax Exempt Trust, Adviser Managed Trust, New Covenant Funds, SEI Catholic Values Trust and SEI Exchange Traded Funds. |
William M. Doran4 | Trustee* | since 1986 | Self-employed consultant since 2003. Partner, Morgan, Lewis & Bockius LLP (law firm) from 1976 to 2003). Counsel to the Trust, SEI Investments, SIMC, the Administrator and the Distributor. | 97 | Director of SEI Investments since 1985; Secretary of SEI Investments since 1978. Director of SEI Investments Distribution Co. since 2003. Director of SEI Investments—Global Funds Services, Limited, SEI Investments Global, Limited, SEI Investments (Europe), Limited, SEI Investments (Asia) Limited, SEI Global Nominee Ltd. and SEI Investments—Unit Trust Management (UK) Limited. Trustee of SEI Liquid Asset Trust from 1982 to 2016. Trustee of O'Connor EQUUS (closed-end investment company) from 2014 to 2016. Director of SEI Alpha Strategy Portfolios, LP from 2007 to 2013. Trustee of Winton Series Trust from 2014 to 2017. Trustee of The Advisors’ Inner Circle Fund and The Advisors’ Inner Circle Fund II from 1991 to 2018. Trustee of Bishop Street Funds from 2006 to 2018. Trustee of The KP Funds from 2013 to 2018. Trustee of Winton Diversified Opportunities Fund (closed-end investment company) from 2014 to 2018. Trustee of SEI Insurance Products Trust from 2013 to 2020. Trustee of Schroder Series Trust and Schroder Global Series Trust from 2017 to 2021. Trustee of The Advisors’ Inner Circle Fund III, Gallery Trust, Delaware Wilshire Private Markets Fund, Delaware Wilshire Private Markets Master Fund, Delaware Wilshire Private Markets Tender Fund, SEI Asset Allocation Trust, SEI Daily Income Trust, SEI Institutional Managed Trust, SEI Institutional International Trust, SEI Institutional Investments Trust, SEI Tax Exempt Trust, Adviser Managed Trust, New Covenant Funds, SEI Catholic Values Trust and SEI Exchange Traded Funds. |
* | Messrs. Nesher and Doran are Trustees who may be deemed as “interested” persons of the Trust as that term is defined in the 1940 Act by virtue of their affiliation with SIMC and the Trust’s Distributor. |
1 | Each trustee shall hold office during the lifetime of this Trust until the election and qualification of his or her successor, or until he or she sooner dies, resigns or is removed in accordance with the Trust’s Declaration of Trust. |
2 | The Fund Complex includes the following Trusts: SEI Asset Allocation Trust, SEI Daily Income Trust, SEI Institutional Investments Trust, Adviser Managed Trust, SEI Institutional International Trust, SEI Institutional Managed Trust, SEI Tax Exempt Trust, SEI Catholic Values Trust, New Covenant Funds and SEI Exchange Traded Funds. |
446
SEI Institutional Managed Trust
Name | Position(s) | Term of | Principal Occupation(s) | Number of | Other Directorships |
TRUSTEES | |||||
Nina Lesavoy | Trustee | since 2003 | Founder and Managing Director, Avec Capital (strategic fundraising firm) since 2008. Managing Director, Cue Capital (strategic fundraising firm) from March 2002-March 2008. | 97 | Director of SEI Alpha Strategy Portfolios, LP from 2007 to 2013. Trustee of SEI Liquid Asset Trust from 2003 to 2016. Trustee of SEI Insurance Products Trust from 2013 to 2020. Trustee/Director of SEI Structured Credit Fund, L.P., SEI Asset Allocation Trust, SEI Daily Income Trust, SEI Institutional Managed Trust, SEI Institutional International Trust, SEI Institutional Investments Trust, SEI Tax Exempt Trust, New Covenant Funds, Adviser Managed Trust, SEI Catholic Values Trust and SEI Exchange Traded Funds. |
James M. Williams | Trustee | since 2004 | Vice President and Chief Investment Officer, J. Paul Getty Trust, Non-Profit Foundation for Visual Arts, since December 2002. President, Harbor Capital Advisors and Harbor Mutual Funds, 2000-2002. Manager, Pension Asset Management, Ford Motor Company, 1997-1999. | 97 | Director of SEI Alpha Strategy Portfolios, LP from 2007 to 2013. Trustee of SEI Liquid Asset Trust from 2004 to 2016. Trustee of SEI Insurance Products Trust from 2013 to 2020. Trustee/Director of Ariel Mutual Funds, SEI Structured Credit Fund, LP, SEI Asset Allocation Trust, SEI Daily Income Trust, SEI Institutional Managed Trust, SEI Institutional International Trust, SEI Institutional Investments Trust, SEI Tax Exempt Trust, New Covenant Funds, Adviser Managed Trust, SEI Catholic Values Trust and SEI Exchange Traded Funds. |
Hubert L. Harris, Jr. | Trustee | since 2008 | Retired since December 2005. Owner of Harris Plantation, Inc. since 1995. Chief Executive Officer of Harris CAPM, a consulting asset and property management entity. Chief Executive Officer, INVESCO North America, August 2003-December 2005. Chief Executive Officer and Chair of the Board of Directors, AMVESCAP Retirement, Inc., January 1998- August 2005. | 97 | Director of AMVESCAP PLC from 1993-2004. Served as a director of a bank holding company, 2003-2009. Director, Aaron’s Inc., 2012-present. Member of the Board of Councilors of the Carter Center (nonprofit corporation) and served on the boards of other non-profit organizations. Director of SEI Alpha Strategy Portfolios, LP from 2008 to 2013. Trustee of SEI Liquid Asset Trust from 2008 to 2016. Trustee of SEI Insurance Products Trust from 2013 to 2020. Trustee of SEI Asset Allocation Trust, SEI Daily Income Trust, SEI Institutional Managed Trust, SEI Institutional International Trust, SEI Institutional Investments Trust, SEI Tax Exempt Trust, New Covenant Funds, Adviser Managed Trust, SEI Catholic Values Trust and SEI Exchange Traded Funds. |
Susan C. Cote | Trustee | since 2016 | Retired since July 2015. Treasurer and Chair of Finance, Investment and Audit Committee of the New York Women's Foundation from 2012 to 2017. Member of the Ernst & Young LLP Retirement Investment Committee, 2009-2015. Global Asset Management Assurance Leader, Ernst & Young LLP from 2006-2015. Partner, Ernst & Young LLP from 1997-2015. Americas Director of Asset Management, Ernst & Young LLP from 2006-2013. Prudential, 1983-1997. | 97 | Trustee of SEI Insurance Products Trust from 2015 to 2020. Trustee/Director of SEI Structured Credit Fund, LP, SEI Tax Exempt Trust, SEI Daily Income Trust, SEI Institutional International Trust, SEI Institutional Managed Trust, SEI Asset Allocation Trust, SEI Institutional Investments Trust, New Covenant Funds, Adviser Managed Trust, SEI Catholic Values Trust and SEI Exchange Traded Funds. |
James B. Taylor | Trustee | since 2018 | Retired since December 2017. Chief | 97 | Trustee of SEI Insurance Products Trust from 2018 to 2020. Trustee of SEI Daily Income Trust, SEI Tax Exempt Trust, SEI Institutional Managed Trust, SEI Institutional International Trust, SEI Institutional Investments Trust, SEI Asset Allocation Trust, Adviser Managed Trust, New Covenant Funds, SEI Catholic Values Trust and SEI Exchange Traded Funds. |
Christine Reynolds | Trustee | since 2019 | Retired since December 2016. Executive Vice President, Fidelity Investments from 2014-2016. President, Fidelity Pricing and Cash Management Services and Chief Financial Officer of Fidelity Funds from 2008-2014. Chief Operating Officer, Fidelity Pricing and Cash Management Services from 2007-2008. President and Treasurer, Fidelity Funds from 2004-2007. Anti-Money Laundering Officer, Fidelity Funds in 2004. Executive Vice President, Fidelity Funds from 2002-2004. Audit Partner, PricewaterhouseCoopers from 1992-2002. | 97 | Trustee of SEI Insurance Products Trust from 2019 to 2020. Trustee of SEI Daily Income Trust, SEI Tax Exempt Trust, SEI Institutional Managed Trust, SEI Institutional International Trust, SEI Institutional Investments Trust, SEI Asset Allocation Trust, Adviser Managed Trust, New Covenant Funds, SEI Catholic Values Trust and SEI Exchange Traded Funds. |
Thomas Melendez | Trustee | since 2021 | Retired since 2019. Investment Officer and Institutional Equity Portfolio Manager at MFS Investment Management from 2002 to 2019. Director of Emerging Markets Group, General Manager of Operations in Argentina and Portfolio Manager for Latin America at Schroders Investment Management from 1994 to 2002. | 91 | Trustee of Boston Children’s Hospital, The Partnership Inc. and Brae Burn Country Club (non-profit organizations). Trustee of SEI Daily Income Trust, SEI Tax Exempt Trust, SEI Institutional Managed Trust, SEI Institutional International Trust, SEI Institutional Investments Trust, SEI Asset Allocation Trust, SEI Exchange Traded Funds and Adviser Managed Trust. Independent Consultant of New Covenant Funds and SEI Catholic Values Trust. |
1 | Each trustee shall hold office during the lifetime of this Trust until the election and qualification of his or her successor, or until he or she sooner dies, resigns or is removed in accordance with the Trust’s Declaration of Trust. |
2 | The Fund Complex includes the following Trusts: SEI Asset Allocation Trust, SEI Daily Income Trust, SEI Institutional Investments Trust, Adviser Managed Trust, SEI Institutional International Trust, SEI Institutional Managed Trust, SEI Tax Exempt Trust, Catholic Values Trust, New Covenant Funds and SEI Exchange Traded Funds. |
SEI Institutional Managed Trust
447
Trustees and Officers of the Trust (Unaudited) (Concluded)
Name | Position(s) Held with Trusts | Term of Office and Length of Time | Principal Occupation(s) | Number of Portfolios in Fund Complex Overseen by Trustee | Other Directorships |
OFFICERS | |||||
Robert A. Nesher | President | since 2005 | Currently performs various services on behalf of SEI for which Mr. Nesher is compensated. | N/A | N/A |
Glenn R. Kurdziel | Controller and Chief Financial Officer | since 2023 | Controller and Chief Financial Officer of SEI Daily Income Trust, SEI Tax Exempt Trust, SEI Institutional Managed Trust, SEI Institutional International Trust, SEI Asset Allocation Trust, SEI Institutional Investments Trust, Adviser Managed Trust, New Covenant Funds, SEI Catholic Values Trust and SEI Exchange Traded Funds since August 2023. Assistant Controller of SEI Daily Income Trust, SEI Tax Exempt Trust, SEI Institutional Managed Trust, SEI Institutional International Trust, SEI Asset Allocation Trust, SEI Institutional Investments Trust, Adviser Managed Trust, New Covenant Funds and SEI Catholic Values Trust from 2017 to 2023. Assistant Controller of SEI Exchange Traded Funds from 2022 to 2023. Senior Manager, Funds Accounting, SEI Investments Global Funds Services from 2005-2023. | N/A | N/A |
Stephen Panner | Chief Compliance Officer | since 2022 | Chief Compliance Officer of SEI Asset Allocation Trust, SEI Daily Income Trust, SEI Institutional Investments Trust, SEI Institutional International Trust, SEI Institutional Managed Trust, SEI Tax Exempt Trust, Adviser Managed Trust, New Covenant Funds, SEI Catholic Values Trust, SEI Exchange Traded Funds, SEI Structured Credit Fund, L.P., The Advisors' Inner Circle Fund, The Advisors' Inner Circle Fund II, The Advisors' Inner Circle Fund III, Bishop Street Funds, Frost Family of Funds, Gallery Trust, Delaware Wilshire Private Markets Fund, Delaware Wilshire Private Markets Master Fund, Delaware Wilshire Private Markets Tender Fund and Catholic Responsible Investments Funds since September 2022. Fund Compliance Officer of SEI Investments Company from February 2011 to September 2022. Fund Accounting Director and CFO and Controller for the SEI Funds from July 2005 to February 2011. | N/A | N/A |
Timothy D. Barto | Vice | since 2002 | Vice President and Secretary of SEI Institutional Transfer Agent, Inc. since 2009. General Counsel and Secretary of SIMC since 2004. Vice President of SIMC and the Administrator since 1999. Vice President and Assistant Secretary of SEI since 2001. | N/A | N/A |
David F. McCann | Vice President and Assistant Secretary | since 2009 | General Counsel and Secretary of SEI Institutional Transfer Agent, Inc. since 2020. Vice President and Assistant Secretary of SEI Institutional Transfer Agent, Inc. from 2009-2020. Vice President and Assistant Secretary of SIMC since 2008. Attorney, Drinker Biddle & Reath, LLP (law firm), May 2005 - October 2008. | N/A | N/A |
Katherine Mason | Vice President and Assistant Secretary | since 2022 | Consulting Attorney, Hirtle, Callaghan & Co. from October 2021 – June 2022. Attorney, Stradley Ronon Stevens & Young from September 2007 – July 2012. | N/A | N/A |
Stephen G. MacRae | Vice | since 2012 | Director of Global Investment Product Management since January 2004. | N/A | N/A |
Donald Duncan | Anti-Money | since 2023 | Anti-Money Laundering Compliance Officer and Privacy Officer of SEI Asset Allocation Trust, SEI Institutional International Trust, SEI Institutional Investments Trust, SEI Institutional Managed Trust, SEI Tax Exempt Trust, Adviser Managed Trust, New Covenant Funds, SEI Catholic Values Trust, SEI Exchange Traded Funds since 2023. Chief Compliance Officer and Global Head of Anti-Money Laundering Strategy of SEI Investments Company since January 2023. Head of Global Anti-Money Laundering Program for Hamilton Lane Advisors, LLC from August 2021 until December 2022. Senior VP and Supervising Principal of Hamilton Lane Securities, LLC from June 2016 to August 2021. Senior Director at AXA-Equitable from June 2011 until May 2016. Senior Director at PRUCO Securities, a subsidiary of Prudential Financial, Inc. from October 2005 until December 2009. | N/A | N/A |
1 | Each trustee shall hold office during the lifetime of this Trust until the election and qualification of his or her successor, or until he or she sooner dies, resigns or is removed in accordance with the Trust’s Declaration of Trust. |
448
SEI Institutional Managed Trust
2 | The Fund Complex includes the following Trusts: SEI Asset Allocation Trust, SEI Daily Income Trust, SEI Institutional Investments Trust, Adviser Managed Trust, SEI Institutional International Trust, SEI Institutional Managed Trust, SEI Tax Exempt Trust, SEI Catholic Values Trust, New Covenant Funds and SEI Exchange Traded Funds. |
SEI Institutional Managed Trust
449
Disclosure of Fund Expenses (Unaudited)
September 30, 2023
All mutual funds have operating expenses. As a shareholder of a fund, your investment is affected by these ongoing costs, which include (among others) costs for portfolio management, administrative services, and shareholder reports like this one. It is important for you to understand the impact of these costs on your investment returns.
Operating expenses such as these are deducted from the fund’s gross income and directly reduce your final investment return. These expenses are expressed as a percentage of the fund’s average net assets; this percentage is known as the fund’s expense ratio.
The following examples use the expense ratio and are intended to help you understand the ongoing costs (in dollars) of investing in your fund and to compare these costs with those of other mutual funds. The examples are based on an investment of $1,000 made at the beginning of the period shown and held for the entire period.
The table on this page illustrates your fund’s costs in two ways:
● Actual fund return. This section helps you to estimate the actual expenses after fee waivers that your Fund incurred over the period. The “Expenses Paid During Period” column shows the actual dollar expense cost incurred by a $1,000 investment in the Fund, and the “Ending Account Value” number is derived from deducting that expense cost from the Fund’s gross investment return.
You can use this information, together with the actual amount you invested in the Fund, to estimate the expenses you paid over that period. Simply divide your actual account value by $1,000 to arrive at a ratio (for example, an $8,600 account value divided by $1,000 = 8.6), then multiply that ratio by the number shown for your Fund under “Expenses Paid During Period.”
● Hypothetical 5% return. This section helps you compare your Fund’s costs with those of other mutual funds. It assumes that the Fund had an annual 5% return before expenses during the year, but that the expense ratio (Column 3) for the period is unchanged. This example is useful in making comparisons because the Securities and Exchange Commission requires all mutual funds to make this 5% calculation. You can assess your Fund’s comparative cost by comparing the hypothetical result for your Fund in the “Expenses Paid During Period” column with those that appear in the same charts in the shareholder reports for other funds.
NOTE: Because the return is set at 5% for comparison purposes — NOT your Fund’s actual return — the account values shown may not apply to your specific investment.
Beginning | Ending | Annualized | Expenses | |||||||||||||
Large Cap Fund | ||||||||||||||||
Actual Fund Return | ||||||||||||||||
Class F Shares | $ | 1,000.00 | $ | 1,023.30 | 0.89 | % | $ | 4.51 | ||||||||
Class Y Shares | 1,000.00 | 1,025.30 | 0.64 | 3.25 | ||||||||||||
Hypothetical 5% Return | ||||||||||||||||
Class F Shares | $ | 1,000.00 | $ | 1,020.61 | 0.89 | % | $ | 4.51 | ||||||||
Class Y Shares | 1,000.00 | 1,021.85 | 0.64 | 3.25 | ||||||||||||
Large Cap Value Fund | ||||||||||||||||
Actual Fund Return | ||||||||||||||||
Class F Shares | $ | 1,000.00 | $ | 993.20 | 0.89 | % | $ | 4.45 | ||||||||
Class I Shares | 1,000.00 | 991.90 | 1.11 | 5.54 | ||||||||||||
Class Y Shares | 1,000.00 | 994.40 | 0.64 | 3.20 | ||||||||||||
Hypothetical 5% Return | ||||||||||||||||
Class F Shares | $ | 1,000.00 | $ | 1,020.61 | 0.89 | % | $ | 4.51 | ||||||||
Class I Shares | 1,000.00 | 1,019.52 | 1.11 | 5.62 | ||||||||||||
Class Y Shares | 1,000.00 | 1,021.86 | 0.64 | 3.24 | ||||||||||||
Beginning | Ending | Annualized | Expenses | |||||||||||||
Large Cap Growth Fund | ||||||||||||||||
Actual Fund Return | ||||||||||||||||
Class F Shares | $ | 1,000.00 | $ | 1,093.60 | 0.89 | % | $ | 4.67 | ||||||||
Class I Shares | 1,000.00 | 1,092.50 | 1.11 | 5.81 | ||||||||||||
Class Y Shares | 1,000.00 | 1,095.10 | 0.64 | 3.36 | ||||||||||||
Hypothetical 5% Return | ||||||||||||||||
Class F Shares | $ | 1,000.00 | $ | 1,020.61 | 0.89 | % | $ | 4.51 | ||||||||
Class I Shares | 1,000.00 | 1,019.52 | 1.11 | 5.61 | ||||||||||||
Class Y Shares | 1,000.00 | 1,021.86 | 0.64 | 3.25 | ||||||||||||
Large Cap Index Fund | ||||||||||||||||
Actual Fund Return | ||||||||||||||||
Class F Shares | $ | 1,000.00 | $ | 1,050.80 | 0.25 | % | $ | 1.29 | ||||||||
Hypothetical 5% Return | ||||||||||||||||
Class F Shares | $ | 1,000.00 | $ | 1,023.82 | 0.25 | % | $ | 1.27 | ||||||||
450
SEI Institutional Managed Trust
Beginning | Ending | Annualized | Expenses | |||||||||||||
Tax-Managed Large Cap Fund | ||||||||||||||||
Actual Fund Return | ||||||||||||||||
Class F Shares | $ | 1,000.00 | $ | 1,019.10 | 0.89 | % | $ | 4.50 | ||||||||
Class Y Shares | 1,000.00 | 1,020.30 | 0.64 | 3.24 | ||||||||||||
Hypothetical 5% Return | ||||||||||||||||
Class F Shares | $ | 1,000.00 | $ | 1,020.61 | 0.89 | % | $ | 4.51 | ||||||||
Class Y Shares | 1,000.00 | 1,021.86 | 0.64 | 3.24 | ||||||||||||
S&P 500 Index Fund | ||||||||||||||||
Actual Fund Return | ||||||||||||||||
Class F Shares | $ | 1,000.00 | $ | 1,050.60 | 0.25 | % | $ | 1.29 | ||||||||
Class I Shares | 1,000.00 | 1,048.50 | 0.65 | 3.34 | ||||||||||||
Hypothetical 5% Return | ||||||||||||||||
Class F Shares | $ | 1,000.00 | $ | 1,023.81 | 0.25 | % | $ | 1.27 | ||||||||
Class I Shares | 1,000.00 | 1,021.82 | 0.65 | 3.29 | ||||||||||||
Small Cap Fund | ||||||||||||||||
Actual Fund Return | ||||||||||||||||
Class F Shares | $ | 1,000.00 | $ | 1,008.00 | 1.14 | % | $ | 5.74 | ||||||||
Class Y Shares | 1,000.00 | 1,010.00 | 0.89 | 4.48 | ||||||||||||
Hypothetical 5% Return | ||||||||||||||||
Class F Shares | $ | 1,000.00 | $ | 1,019.35 | 1.14 | % | $ | 5.77 | ||||||||
Class Y Shares | 1,000.00 | 1,020.61 | 0.89 | 4.51 | ||||||||||||
Small Cap Value Fund | ||||||||||||||||
Actual Fund Return | ||||||||||||||||
Class F Shares | $ | 1,000.00 | $ | 1,025.20 | 1.14 | % | $ | 5.79 | ||||||||
Class I Shares | 1,000.00 | 1,023.30 | 1.36 | 6.90 | ||||||||||||
Class Y Shares | 1,000.00 | 1,026.00 | 0.89 | 4.52 | ||||||||||||
Hypothetical 5% Return | ||||||||||||||||
Class F Shares | $ | 1,000.00 | $ | 1,019.35 | 1.14 | % | $ | 5.77 | ||||||||
Class I Shares | 1,000.00 | 1,018.25 | 1.36 | 6.88 | ||||||||||||
Class Y Shares | 1,000.00 | 1,020.61 | 0.89 | 4.51 | ||||||||||||
Small Cap Growth Fund | ||||||||||||||||
Actual Fund Return | ||||||||||||||||
Class F Shares | $ | 1,000.00 | $ | 980.40 | 1.11 | % | $ | 5.51 | ||||||||
Class I Shares | 1,000.00 | 979.20 | 1.35 | 6.72 | ||||||||||||
Class Y Shares | 1,000.00 | 981.80 | 0.86 | 4.27 | ||||||||||||
Hypothetical 5% Return | ||||||||||||||||
Class F Shares | $ | 1,000.00 | $ | 1,019.50 | 1.11 | % | $ | 5.62 | ||||||||
Class I Shares | 1,000.00 | 1,018.28 | 1.35 | 6.85 | ||||||||||||
Class Y Shares | 1,000.00 | 1,020.76 | 0.86 | 4.35 | ||||||||||||
Tax-Managed Small/Mid Cap Fund | ||||||||||||||||
Actual Fund Return | ||||||||||||||||
Class F Shares | $ | 1,000.00 | $ | 995.70 | 1.11 | % | $ | 5.55 | ||||||||
Class Y Shares | 1,000.00 | 996.80 | 0.89 | 4.46 | ||||||||||||
Hypothetical 5% Return | ||||||||||||||||
Class F Shares | $ | 1,000.00 | $ | 1,019.50 | 1.11 | % | $ | 5.62 | ||||||||
Class Y Shares | 1,000.00 | 1,020.61 | 0.89 | 4.51 | ||||||||||||
Beginning | Ending | Annualized | Expenses | |||||||||||||
Mid-Cap Fund | ||||||||||||||||
Actual Fund Return | ||||||||||||||||
Class F Shares | $ | 1,000.00 | $ | 1,000.30 | 0.98 | % | $ | 4.91 | ||||||||
Class I Shares | 1,000.00 | 999.10 | 1.20 | 6.01 | ||||||||||||
Class Y Shares | 1,000.00 | 1,001.50 | 0.73 | 3.66 | ||||||||||||
Hypothetical 5% Return | ||||||||||||||||
Class F Shares | $ | 1,000.00 | $ | 1,020.16 | 0.98 | % | $ | 4.96 | ||||||||
Class I Shares | 1,000.00 | 1,019.05 | 1.20 | 6.07 | ||||||||||||
Class Y Shares | 1,000.00 | 1,021.41 | 0.73 | 3.70 | ||||||||||||
U.S. Managed Volatility Fund | ||||||||||||||||
Actual Fund Return | ||||||||||||||||
Class F Shares | $ | 1,000.00 | $ | 977.50 | 0.90 | % | $ | 4.46 | ||||||||
Class I Shares | 1,000.00 | 976.20 | 1.15 | 5.70 | ||||||||||||
Class Y Shares | 1,000.00 | 978.70 | 0.65 | 3.22 | ||||||||||||
Hypothetical 5% Return | ||||||||||||||||
Class F Shares | $ | 1,000.00 | $ | 1,020.56 | 0.90 | % | $ | 4.56 | ||||||||
Class I Shares | 1,000.00 | 1,019.30 | 1.15 | 5.82 | ||||||||||||
Class Y Shares | 1,000.00 | 1,021.81 | 0.65 | 3.29 | ||||||||||||
Global Managed Volatility Fund | ||||||||||||||||
Actual Fund Return | ||||||||||||||||
Class F Shares | $ | 1,000.00 | $ | 993.80 | 1.11 | % | $ | 5.55 | ||||||||
Class I Shares | 1,000.00 | 993.70 | 1.36 | 6.78 | ||||||||||||
Class Y Shares | 1,000.00 | 995.90 | 0.86 | 4.30 | ||||||||||||
Hypothetical 5% Return | ||||||||||||||||
Class F Shares | $ | 1,000.00 | $ | 1,019.50 | 1.11 | % | $ | 5.62 | ||||||||
Class I Shares | 1,000.00 | 1,018.26 | 1.36 | 6.87 | ||||||||||||
Class Y Shares | 1,000.00 | 1,020.76 | 0.86 | 4.36 | ||||||||||||
Tax-Managed Managed Volatility Fund | ||||||||||||||||
Actual Fund Return | ||||||||||||||||
Class F Shares | $ | 1,000.00 | $ | 997.50 | 1.00 | % | $ | 5.01 | ||||||||
Class Y Shares | 1,000.00 | 998.30 | 0.75 | 3.76 | ||||||||||||
Hypothetical 5% Return | ||||||||||||||||
Class F Shares | $ | 1,000.00 | $ | 1,020.06 | 1.00 | % | $ | 5.06 | ||||||||
Class Y Shares | 1,000.00 | 1,021.31 | 0.75 | 3.80 | ||||||||||||
Tax-Managed International Managed Volatility Fund | ||||||||||||||||
Actual Fund Return | ||||||||||||||||
Class F Shares | $ | 1,000.00 | $ | 1,002.90 | 1.11 | % | $ | 5.57 | ||||||||
Class Y Shares | 1,000.00 | 1,003.90 | 0.86 | 4.32 | ||||||||||||
Hypothetical 5% Return | ||||||||||||||||
Class F Shares | $ | 1,000.00 | $ | 1,019.50 | 1.11 | % | $ | 5.62 | ||||||||
Class Y Shares | 1,000.00 | 1,020.76 | 0.86 | 4.36 | ||||||||||||
Real Estate Fund | ||||||||||||||||
Actual Fund Return | ||||||||||||||||
Class F Shares | $ | 1,000.00 | $ | 966.30 | 1.14 | % | $ | 5.62 | ||||||||
Class I Shares | 1,000.00 | 965.70 | 1.36 | 6.70 | ||||||||||||
Class Y Shares | 1,000.00 | 967.70 | 0.89 | 4.39 | ||||||||||||
Hypothetical 5% Return | ||||||||||||||||
Class F Shares | $ | 1,000.00 | $ | 1,019.35 | 1.14 | % | $ | 5.77 | ||||||||
Class I Shares | 1,000.00 | 1,018.25 | 1.36 | 6.88 | ||||||||||||
Class Y Shares | 1,000.00 | 1,020.61 | 0.89 | 4.51 | ||||||||||||
SEI Institutional Managed Trust
451
Disclosure of Fund Expenses (Unaudited) (Concluded)
September 30, 2023
Beginning | Ending | Annualized | Expenses | |||||||||||||
Core Fixed Income Fund | ||||||||||||||||
Actual Fund Return | ||||||||||||||||
Class F Shares | $ | 1,000.00 | $ | 954.70 | 0.66 | % | $ | 3.23 | ||||||||
Class I Shares | 1,000.00 | 953.60 | 0.88 | 4.31 | ||||||||||||
Class Y Shares | 1,000.00 | 956.00 | 0.41 | 2.02 | ||||||||||||
Hypothetical 5% Return | ||||||||||||||||
Class F Shares | $ | 1,000.00 | $ | 1,021.76 | 0.66 | % | $ | 3.35 | ||||||||
Class I Shares | 1,000.00 | 1,020.66 | 0.88 | 4.46 | ||||||||||||
Class Y Shares | 1,000.00 | 1,023.00 | 0.41 | 2.09 | ||||||||||||
High Yield Bond Fund | ||||||||||||||||
Actual Fund Return | ||||||||||||||||
Class F Shares | $ | 1,000.00 | $ | 1,035.00 | 0.89 | % | $ | 4.54 | ||||||||
Class I Shares | 1,000.00 | 1,033.60 | 1.04 | 5.29 | ||||||||||||
Class Y Shares | 1,000.00 | 1,036.30 | 0.64 | 3.27 | ||||||||||||
Hypothetical 5% Return | ||||||||||||||||
Class F Shares | $ | 1,000.00 | $ | 1,020.61 | 0.89 | % | $ | 4.51 | ||||||||
Class I Shares | 1,000.00 | 1,019.86 | 1.04 | 5.26 | ||||||||||||
Class Y Shares | 1,000.00 | 1,021.86 | 0.64 | 3.25 | ||||||||||||
Conservative Income Fund | ||||||||||||||||
Actual Fund Return | ||||||||||||||||
Class F Shares | $ | 1,000.00 | $ | 1,025.50 | 0.30 | % | $ | 1.52 | ||||||||
Class Y Shares | 1,000.00 | 1,026.20 | 0.20 | 1.02 | ||||||||||||
Hypothetical 5% Return | ||||||||||||||||
Class F Shares | $ | 1,000.00 | $ | 1,023.56 | 0.30 | % | $ | 1.52 | ||||||||
Class Y Shares | 1,000.00 | 1,024.07 | 0.20 | 1.01 | ||||||||||||
Tax-Free Conservative Income Fund | ||||||||||||||||
Actual Fund Return | ||||||||||||||||
Class F Shares | $ | 1,000.00 | $ | 1,015.70 | 0.30 | % | $ | 1.52 | ||||||||
Class Y Shares | 1,000.00 | 1,015.20 | 0.20 | 1.01 | ||||||||||||
Hypothetical 5% Return | ||||||||||||||||
Class F Shares | $ | 1,000.00 | $ | 1,023.56 | 0.30 | % | $ | 1.52 | ||||||||
Class Y Shares | 1,000.00 | 1,024.07 | 0.20 | 1.01 | ||||||||||||
Real Return Fund | ||||||||||||||||
Actual Fund Return | ||||||||||||||||
Class F Shares | $ | 1,000.00 | $ | 990.90 | 0.45 | % | $ | 2.25 | ||||||||
Class Y Shares | 1,000.00 | 991.50 | 0.35 | 1.75 | ||||||||||||
Hypothetical 5% Return | ||||||||||||||||
Class F Shares | $ | 1,000.00 | $ | 1,022.81 | 0.45 | % | $ | 2.28 | ||||||||
Class Y Shares | 1,000.00 | 1,023.31 | 0.35 | 1.78 | ||||||||||||
Beginning | Ending | Annualized | Expenses | |||||||||||||
Dynamic Asset Allocation Fund | ||||||||||||||||
Actual Fund Return | ||||||||||||||||
Class F Shares | $ | 1,000.00 | $ | 1,037.70 | 0.75 | % | $ | 3.83 | ||||||||
Class Y Shares | 1,000.00 | 1,038.40 | 0.50 | 2.55 | ||||||||||||
Hypothetical 5% Return | ||||||||||||||||
Class F Shares | $ | 1,000.00 | $ | 1,021.31 | 0.75 | % | $ | 3.80 | ||||||||
Class Y Shares | 1,000.00 | 1,022.56 | 0.50 | 2.54 | ||||||||||||
Multi-Strategy Alternative Fund | ||||||||||||||||
Actual Fund Return | ||||||||||||||||
Class F Shares | $ | 1,000.00 | $ | 1,016.30 | 1.28 | % | $ | 6.47 | ||||||||
Class Y Shares | 1,000.00 | 1,018.50 | 1.04 | 5.26 | ||||||||||||
Hypothetical 5% Return | ||||||||||||||||
Class F Shares | $ | 1,000.00 | $ | 1,018.65 | 1.28 | % | $ | 6.48 | ||||||||
Class Y Shares | 1,000.00 | 1,019.85 | 1.04 | 5.27 | ||||||||||||
Liquid Alternative Fund1 | ||||||||||||||||
Actual Fund Return | ||||||||||||||||
Class F Shares | $ | 1,000.00 | $ | 1,016.00 | 1.04 | % | $ | 2.62 | 1 | |||||||
Class Y Shares | 1,000.00 | 1,016.00 | 0.80 | 2.02 | 1 | |||||||||||
Hypothetical 5% Return | ||||||||||||||||
Class F Shares | $ | 1,000.00 | $ | 1,019.85 | 1.04 | % | $ | 5.27 | ||||||||
Class Y Shares | 1,000.00 | 1,021.05 | 0.80 | 4.06 | ||||||||||||
Multi-Asset Accumulation Fund | ||||||||||||||||
Actual Fund Return | ||||||||||||||||
Class F Shares | $ | 1,000.00 | $ | 954.20 | 1.17 | % | $ | 5.73 | ||||||||
Class Y Shares | 1,000.00 | 954.60 | 0.92 | 4.51 | ||||||||||||
Hypothetical 5% Return | ||||||||||||||||
Class F Shares | $ | 1,000.00 | $ | 1,019.20 | 1.17 | % | $ | 5.92 | ||||||||
Class Y Shares | 1,000.00 | 1,020.46 | 0.92 | 4.66 | ||||||||||||
Multi-Asset Income Fund | ||||||||||||||||
Actual Fund Return | ||||||||||||||||
Class F Shares | $ | 1,000.00 | $ | 999.30 | 0.80 | % | $ | 4.01 | ||||||||
Class Y Shares | 1,000.00 | 999.80 | 0.70 | 3.51 | ||||||||||||
Hypothetical 5% Return | ||||||||||||||||
Class F Shares | $ | 1,000.00 | $ | 1,021.06 | 0.80 | % | $ | 4.05 | ||||||||
Class Y Shares | 1,000.00 | 1,021.56 | 0.70 | 3.55 | ||||||||||||
Multi-Asset Inflation Managed Fund | ||||||||||||||||
Actual Fund Return | ||||||||||||||||
Class F Shares | $ | 1,000.00 | $ | 1,001.30 | 1.96 | % | $ | 9.83 | ||||||||
Class Y Shares | 1,000.00 | 1,002.50 | 1.71 | 8.58 | ||||||||||||
Hypothetical 5% Return | ||||||||||||||||
Class F Shares | $ | 1,000.00 | $ | 1,015.24 | 1.96 | % | $ | 9.90 | ||||||||
Class Y Shares | 1,000.00 | 1,016.50 | 1.71 | 8.64 | ||||||||||||
Multi-Asset Capital Stability Fund | ||||||||||||||||
Actual Fund Return | ||||||||||||||||
Class F Shares | $ | 1,000.00 | $ | 1,012.10 | 0.62 | % | $ | 3.13 | ||||||||
Class Y Shares | 1,000.00 | 1,013.10 | 0.52 | 2.62 | ||||||||||||
Hypothetical 5% Return | ||||||||||||||||
Class F Shares | $ | 1,000.00 | $ | 1,021.96 | 0.62 | % | $ | 3.14 | ||||||||
Class Y Shares | 1,000.00 | 1,022.46 | 0.52 | 2.64 | ||||||||||||
* Expenses are equal to the Fund’s annualized expense ratio multiplied by the average account value over the period, multiplied by 183/365 (to reflect the one-half year period shown). |
(1) Commenced operations on June 30, 2023. Expenses are equal to the Fund’s annualized expense ratio multiplied by the average account value over the period, multiplied by 92/365 (to reflect since inception). |
452
SEI Institutional Managed Trust
Review of the Liquidity Risk Management Program (Unaudited)
September 30, 2023
Pursuant to Rule 22e-4 under the 1940 Act, the Trust, on behalf of the Funds, has adopted a liquidity risk management program (the “Program”) to govern the Trust’s approach to managing liquidity risk. The Program is overseen by the SIMC Liquidity Risk Oversight Committee, and the Program’s principal objectives include assessing, managing and periodically reviewing each Fund’s liquidity risk, based on factors specific to the circumstances of the Fund.
At a meeting of the Board held on March 20-22, 2023, the Trustees received a report from the SIMC Liquidity Risk Oversight Committee addressing the operations of the Program and assessing its adequacy and effectiveness of implementation. The SIMC Liquidity Risk Oversight Committee determined, and reported to the Board, that the Program remains reasonably designed to assess and manage each Fund’s liquidity risk and that the Program adequately and effectively managed each Fund’s liquidity risk during the 2022 calendar year. The SIMC Liquidity Risk Oversight Committee also reported that with respect to the Trust there were no reportable liquidity events during the period. The SIMC Liquidity Risk Oversight Committee noted that additional monitoring processes have been implemented.
There can be no assurance that the Program will achieve its objectives in the future. Please refer to the prospectus for more information regarding a Fund’s exposure to liquidity risk and other principal risks to which an investment in the Funds may be subject.
SEI Institutional Managed Trust
453
Board of Trustees Considerations in Approving the Advisory and Sub-Advisory Agreements (Unaudited)
SEI Institutional Managed Trust (the “Trust”) and SEI Investments Management Corporation (“SIMC”) have entered into an investment advisory agreement (the “Advisory Agreement”), pursuant to which SIMC provides investment advisory services to the series of the Trust (the “Funds”). Pursuant to separate sub-advisory agreements with SIMC (the “Sub-Advisory Agreements” and, together with the Advisory Agreement, the “Investment Advisory Agreements”), and under the supervision of SIMC and the Trust’s Board of Trustees (each member, a “Trustee” and, collectively, the “Trustees” or the “Board”), the sub-advisers (each, a “Sub-Adviser” and collectively, the “Sub-Advisers”) provide security selection and certain other advisory services with respect to all or a discrete portion of the assets of the Funds. The Sub-Advisers are also responsible for managing their employees who provide services to the Funds. The Sub-Advisers are selected based primarily upon the research and recommendations of SIMC, which evaluates quantitatively and qualitatively the Sub-Advisers’ skills and investment results in managing assets for specific asset classes, investment styles and strategies.
The Investment Company Act of 1940, as amended (the “1940 Act”), requires that the initial approval of a Fund’s Investment Advisory Agreements be specifically approved by the vote of a majority of the outstanding shareholders of the Funds and the vote of a majority of the Trustees who are not parties to the Investment Advisory Agreements or “interested persons” of any party (the “Independent Trustees”) cast in person (or otherwise, as consistent with applicable laws, regulations and related guidance and relief) at a meeting called for such purpose. In addition, the 1940 Act requires that the continuation or renewal of any Investment Advisory Agreement be approved at least annually (after an initial period of up to two years), which also requires the vote of a majority of the Board, including a majority of the Independent Trustees. In the case of the initial approval of a Sub-Advisory Agreement, only the approval of a majority of the Board, including a majority of the Independent Trustees, is required, pursuant to an exemptive order that has been granted to the Trust by the Securities and Exchange Commission. In connection with their consideration of such initial approvals and renewals, the Funds’ Trustees must request and evaluate, and SIMC and the Sub-Advisers are required to furnish, such information as may be reasonably necessary to evaluate the terms of the Investment Advisory Agreements. In addition, the Securities and Exchange Commission takes the position that, as part of their fiduciary duties with respect to a mutual fund’s fees, mutual fund boards are required to evaluate the material factors applicable to a decision to approve or renew an Investment Advisory Agreement.
Consistent with these responsibilities, the Board calls and holds meetings each year to consider whether to approve new and/or renew existing Investment Advisory Agreements between the Trust and SIMC and SIMC and the Sub-Advisers with respect to the Funds of the Trust or any proposed new Funds of the Trust. In preparation for these meetings, the Board requests and reviews a wide variety of materials provided by SIMC and the Sub-Advisers, including information about SIMC’s and the Sub-Advisers’ affiliates, personnel and operations and the services provided pursuant to the Investment Advisory Agreements. The Board also receives data from third parties. This information is provided in addition to the detailed information about the Funds that the Board reviews during the course of each year, including information that relates to Fund operations and Fund performance. The Trustees also receive a memorandum from counsel regarding the responsibilities of Trustees in connection with their consideration of whether to approve or renew the Trust’s Investment Advisory Agreements. Finally, the Independent Trustees receive advice from independent counsel to the Independent Trustees, meet in executive sessions outside the presence of Fund management and participate in question and answer sessions with representatives of SIMC and the Sub-Advisers.
At the March 20-22, 2023 meeting of the Board, the Trustees, including a majority of the Independent Trustees, approved the renewal of the Advisory Agreement for the Funds. Also, each Sub-Advisory Agreement was either initially approved or, if the Sub-Advisory Agreement was already in effect (unless operating under an initial two-year term), renewed at meetings of the Board held during the course of the Trust’s fiscal year on December 5-7, 2022, January 25, 2023, March 20-22, 2023, June 12-14, 2023 and September 11-13, 2023. Additionally, at the March 20-22, 2023 meeting, the Board approved an amended fee schedule to the Advisory Agreement and a new Sub-Advisory Agreement for a new series of the Trust, the Liquid Alternative Fund. In each case, the Board’s approval or renewal was based on its consideration and evaluation of the factors described above, as discussed at the meetings and at prior meetings, as applicable.
Specifically, during the course of the Trust’s fiscal year, the Board requested and received written materials from SIMC and the Sub-Advisers regarding: (i) the quality of SIMC’s and the Sub-Advisers’ investment management and other services; (ii) SIMC’s and the Sub-Advisers’ investment management personnel; (iii) SIMC’s and the Sub-Advisers’ operations and financial condition; (iv) SIMC’s and the Sub-Advisers’ brokerage practices (including any soft dollar arrangements) and investment strategies; (v) the level of the advisory fees that SIMC charges or proposes to charge the Funds and the level of the sub-advisory fees that SIMC pays or proposes to pay the Sub-Advisers, compared with fees each charge to comparable accounts; (vi) the advisory fees charged or proposed to be charged by SIMC and the Funds’ overall or estimated fees and
454
SEI Institutional Managed Trust
operating expenses compared with peer groups of mutual funds prepared by Broadridge, an independent provider of investment company data that was engaged to prepare an assessment of the Funds in connection with the renewal or approval of the Investment Advisory Agreements (the “Broadridge Report”); (vii) the level or estimated level of SIMC’s and the Sub-Advisers’ profitability from their Fund-related operations; (viii) SIMC’s and the Sub-Advisers’ compliance program, including a description of material compliance matters and material compliance violations; (ix) SIMC’s potential economies of scale; (x) SIMC’s and the Sub-Advisers’ policies on and compliance procedures for personal securities transactions; (xi) SIMC’s and the Sub-Advisers’ expertise and resources in domestic and/or international financial markets; and (xii) the Funds’ (with the exception of the Liquid Alternative Fund) performance over various periods of time compared with peer groups of mutual funds prepared by Broadridge and the Funds’ benchmark indexes.
The following discusses some, but not all, of the factors that were considered by the Board in connection with its assessment of the Investment Advisory Agreements.
Nature, Extent and Quality of Services. The Board considered the nature, extent and quality of the services provided or proposed to be provided by SIMC and the Sub-Advisers to the Funds and the resources of SIMC and the Sub-Advisers and their affiliates dedicated or proposed to be dedicated to the Funds. In this regard, the Trustees evaluated, among other things, SIMC’s and each Sub-Adviser’s personnel, experience, track record and compliance program. Following evaluation, the Board concluded that, within the context of its full deliberations, the nature, extent and quality of services provided by or proposed to be provided by SIMC and the Sub-Advisers to the Funds and the resources of SIMC and the Sub-Advisers and their affiliates dedicated or proposed to be dedicated to the Funds were sufficient to support the approval or renewal of the Investment Advisory Agreements. In addition to advisory services, the Board considered the nature and quality of certain administrative, transfer agency and other non-investment advisory services provided or proposed to be provided to the Funds by SIMC and/or its affiliates.
Performance. In determining whether to renew SIMC’s Advisory Agreement, the Trustees considered the Funds’ (with the exception of the Liquid Alternative Fund) performance relative to their peer groups and appropriate indexes/benchmarks. The Trustees reviewed performance information for each Fund, noting that they receive performance reports that permit them to monitor each Fund’s performance at board meetings throughout the year. As part of this review, the Trustees considered the composition of each peer group and selection criteria. In assessing Fund performance, the Trustees considered the Broadridge Report. The Broadridge Report included metrics on risk analysis, volatility versus total return, net total return and performance consistency for the Funds and a universe of comparable funds. Based on the materials considered and discussed at the meetings, the Trustees found Fund performance satisfactory, or, where performance was materially below the benchmark and/or peer group, the Trustees were satisfied with the reasons provided to explain such performance. In connection with the approval or renewal of Sub-Advisory Agreements, the Board considered the performance of the Sub-Adviser relative to appropriate indexes/benchmarks. Following evaluation, the Board concluded that, within the context of its full deliberations, the performance of the Funds was sufficient to support renewal of SIMC’s Advisory Agreement, and the performance of each Sub-Adviser was sufficient to support the approval or renewal of the Sub-Advisory Agreement.
With respect to the Liquid Alternative Fund, because the Fund was new and had not commenced operations, it did not yet have an investment performance record to evaluate when approving the Advisory Agreement and Sub-Advisory Agreement, though the Board noted that SIMC has operated a substantially identical public fund in the European and Asian markets since 2015.
Fees. With respect to the Funds’ expenses or estimated expenses under the Investment Advisory Agreements, the Trustees considered the rate of compensation called for by the Investment Advisory Agreements and the Funds’ net operating expense ratios in comparison to those of the Funds’ respective peer groups. In assessing Fund expenses (with the exception of the Liquid Alternative Fund), the Trustees considered the information in the Broadridge Report, which included various metrics related to fund expenses, including, but not limited to, contractual management fees at various asset levels, actual management fees (including transfer agent expenses), and actual total expenses (including, solely with respect to the Multi-Strategy Alternative Fund, underlying fund expenses) for the Funds and a universe of comparable funds. With respect to the Liquid Alternative Fund, the Trustees also considered a Broadridge Report, which included various metrics related to the estimated fund expenses, including, but not limited to the proposed contractual management fee as compared to a universe of comparable funds. Based on the materials considered and discussion at the meetings, the Trustees further determined that the fees or estimated fees were either shown to be below the peer average in the comparative fee analysis, or that there was a reasonable basis for the fee level. The Trustees also considered the effects of SIMC’s and its affiliates’ voluntary waivers of management and other fees to prevent total Fund operating expenses from exceeding any
SEI Institutional Managed Trust
455
Board of Trustees Considerations in Approving the Advisory and Sub-Advisory Agreements (Unaudited) (Concluded)
applicable cap and concluded that SIMC, through waivers, has maintained or would maintain the Funds’ net operating expenses at competitive levels for its distribution channels. In determining the appropriateness of fees, the Board also took into consideration the impact of fees incurred indirectly by the Funds as a result of investments into underlying funds, including funds from which SIMC or its affiliates earn fees. The Board also took into consideration compensation earned or estimated to be earned from the Funds by SIMC or its affiliates for non-advisory services, such as administration, transfer agency, shareholder services or brokerage, and considered whether SIMC and its affiliates may have realized or would realize other benefits from their relationship with the Funds, such as any research and brokerage services received under soft dollar arrangements. When considering fees paid or estimated to be paid to Sub-Advisers, the Board took into account the fact that the Sub-Advisers are compensated or would be compensated by SIMC and not by the Funds directly, and that such compensation with respect to any unaffiliated Sub-Adviser reflects or would reflect an arms-length negotiation between the Sub-Adviser and SIMC. Following evaluation, the Board concluded that, within the context of its full deliberations, the expenses or estimated expenses of the Funds are reasonable and supported the approval or renewal of the Investment Advisory Agreements. The Board also considered whether the Sub-Advisers and their affiliates may have realized or might realize other benefits from their relationship with the Funds, such as any research and brokerage services received under soft dollar arrangements.
Profitability. With regard to profitability, the Trustees considered compensation flowing or estimated to flow to SIMC and the Sub-Advisers and their affiliates, directly or indirectly. The Trustees considered whether the levels or estimated levels of compensation and profitability were reasonable. As with the fee levels, when considering the profitability of the Sub-Advisers, the Board took into account the fact that compensation with respect to any unaffiliated Sub-Adviser reflects or would reflect an arms-length negotiation between the Sub-Adviser and SIMC. In connection with the approval or renewal of each Sub-Advisory Agreement, the Board also took into consideration the impact that the fees paid or proposed to be paid to the Sub-Adviser have or would have on SIMC’s advisory fee margin and profitability. Based on this evaluation, the Board concluded that, within the context of its full deliberations, the profitability or estimated profitability of each of SIMC and the Sub-Advisers is reasonable and supported the approval or renewal of the Investment Advisory Agreements.
Economies of Scale. With respect to the Advisory Agreement, the Trustees considered whether any economies of scale were being realized (or, in the case of the Liquid Alternative Fund, could be realized) by SIMC and its affiliates and, if so, whether the benefits of such economies of scale were passed along (or, in the case of the Liquid Alternative Fund, could be passed along) to the Funds’ shareholders through a graduated investment advisory fee schedule or other means, including any fee waivers by SIMC and its affiliates. The Trustees recognized that economies of scale are difficult to identify and quantify and are rarely identifiable on a fund-by-fund basis. Based on this evaluation, the Board determined that the fees were reasonable in light of the information that was provided by SIMC with respect to economies of scale.
Based on the Trustees’ deliberation and their evaluation of the information described above, the Board, including all of the Independent Trustees, with the assistance of Fund counsel and Independent Trustees’ counsel, unanimously approved the approval or renewal, as applicable, of the Investment Advisory Agreements and concluded that the compensation under the Investment Advisory Agreements is fair and reasonable in light of such services and expenses and such other matters as the Trustees considered to be relevant in the exercise of their reasonable judgment. In the course of its deliberations, the Board did not identify any particular factor (or conclusion with respect thereto) or single piece of information that was all-important, controlling or determinative of its decision, but considered all of the factors together, and each Trustee may have attributed different weights to the various factors (and conclusions with respect thereto) and information.
456
SEI Institutional Managed Trust
Notice to Shareholders (Unaudited)
%For shareholders who do not have a September 30, 2023, taxable year end, this notice is for informational purposes only. For shareholders with a September 30, 2023, taxable year end, please consult your tax adviser as to the pertinence of this notice.
For the fiscal year ended September 30, 2023, the Funds are designating long term and qualifying dividend income with regard to distributions paid during the year as follows:
(A) | (B) | (C) | (D) Income Distribution | Total | (E) | |||||||||||||||||||
Large Cap Fund | 0.00% | 92.64% | 7.36% | 0.00% | 100.00% | 100.00% | ||||||||||||||||||
Large Cap Value Fund | 0.00% | 70.50% | 29.50% | 0.00% | 100.00% | 80.90% | ||||||||||||||||||
Large Cap Growth Fund | 0.00% | 99.99% | 0.01% | 0.00% | 100.00% | 100.00% | ||||||||||||||||||
Large Cap Index Fund | 0.00% | 0.00% | 100.00% | 0.00% | 100.00% | 75.94% | ||||||||||||||||||
Tax-Managed Large Cap Fund | 0.00% | 83.29% | 16.71% | 0.00% | 100.00% | 100.00% | ||||||||||||||||||
S&P 500 Index Fund | 0.00% | 85.03% | 14.97% | 0.00% | 100.00% | 100.00% | ||||||||||||||||||
Small Cap Fund | 0.00% | 64.20% | 35.80% | 0.00% | 100.00% | 100.00% | ||||||||||||||||||
Small Cap Value Fund | 0.00% | 78.12% | 21.88% | 0.00% | 100.00% | 84.37% | ||||||||||||||||||
Small Cap Growth Fund | 0.00% | 0.00% | 100.00% | 0.00% | 100.00% | 100.00% | ||||||||||||||||||
Tax-Managed Small/Mid Cap Fund | 0.00% | 42.19% | 57.81% | 0.00% | 100.00% | 100.00% | ||||||||||||||||||
Mid-Cap Fund | 0.00% | 0.00% | 100.00% | 0.00% | 100.00% | 100.00% | ||||||||||||||||||
U.S. Managed Volatility Fund | 0.00% | 82.96% | 17.04% | 0.00% | 100.00% | 100.00% | ||||||||||||||||||
Global Managed Volatility Fund | 0.00% | 46.61% | 53.39% | 0.00% | 100.00% | 29.76% | ||||||||||||||||||
Tax-Managed Managed Volatility Fund | 0.00% | 85.27% | 14.73% | 0.00% | 100.00% | 100.00% | ||||||||||||||||||
Tax-Managed International Managed Volatility Fund | 0.00% | 0.00% | 100.00% | 0.00% | 100.00% | 0.00% | ||||||||||||||||||
Real Estate Fund * | 0.00% | 55.24% | 44.76% | 0.00% | 100.00% | 0.00% | ||||||||||||||||||
Core Fixed Income Fund | 0.00% | 0.00% | 100.00% | 0.00% | 100.00% | 0.00% | ||||||||||||||||||
High Yield Bond Fund | 10.15% | 0.00% | 89.85% | 0.00% | 100.00% | 0.00% | ||||||||||||||||||
Conservative Income Fund | 0.00% | 0.00% | 100.00% | 0.00% | 100.00% | 0.00% | ||||||||||||||||||
Tax-Free Conservative Income Fund | 0.00% | 0.00% | 0.00% | 100.00% | 100.00% | 0.00% | ||||||||||||||||||
Real Return Fund | 0.00% | 0.00% | 100.00% | 0.00% | 100.00% | 0.00% | ||||||||||||||||||
Dynamic Asset Allocation Fund | 0.00% | 73.97% | 26.03% | 0.00% | 100.00% | 52.58% | ||||||||||||||||||
Multi-Strategy Alternative Fund | 0.00% | 0.00% | 100.00% | 0.00% | 100.00% | 2.60% | ||||||||||||||||||
Liquid Alternative Fund | 0.00% | 0.00% | 0.00% | 0.00% | 0.00% | 0.00% | ||||||||||||||||||
Multi-Asset Accumulation Fund | 0.00% | 0.00% | 100.00% | 0.00% | 100.00% | 0.92% | ||||||||||||||||||
Multi-Asset Income Fund | 0.00% | 0.00% | 100.00% | 0.00% | 100.00% | 1.63% | ||||||||||||||||||
Multi-Asset Inflation Managed Fund | 0.00% | 0.00% | 100.00% | 0.00% | 100.00% | 0.00% | ||||||||||||||||||
Multi-Asset Capital Stability Fund | 0.00% | 0.00% | 100.00% | 0.00% | 100.00% | 4.74% | ||||||||||||||||||
SEI Institutional Managed Trust
457
Notice to Shareholders (Unaudited) (Concluded)
(F) Qualifying |
| Interest | Short-Term | Qualifying Business Income (6) | ||||||||||||||||
Large Cap Fund | 100.00% | 0.00% | 0.00% | 0.00% | 0.00% | |||||||||||||||
Large Cap Value Fund | 100.00% | 0.00% | 0.03% | 100.00% | 0.00% | |||||||||||||||
Large Cap Growth Fund | 100.00% | 0.00% | 0.00% | 0.00% | 0.00% | |||||||||||||||
Large Cap Index Fund | 93.15% | 0.00% | 0.12% | 0.00% | 5.31% | |||||||||||||||
Tax-Managed Large Cap Fund | 73.61% | 0.00% | 0.00% | 0.00% | 2.29% | |||||||||||||||
S&P 500 Index Fund | 75.21% | 0.00% | 0.00% | 0.00% | 4.27% | |||||||||||||||
Small Cap Fund | 40.80% | 0.00% | 0.00% | 0.00% | 5.14% | |||||||||||||||
Small Cap Value Fund | 90.41% | 0.00% | 0.00% | 0.00% | 16.82% | |||||||||||||||
Small Cap Growth Fund | 100.00% | 0.00% | 0.00% | 0.00% | 0.00% | |||||||||||||||
Tax-Managed Small/Mid Cap Fund | 77.78% | 0.00% | 0.00% | 0.00% | 12.49% | |||||||||||||||
Mid-Cap Fund | 100.00% | 0.00% | 0.00% | 0.00% | 0.00% | |||||||||||||||
U.S. Managed Volatility Fund | 100.00% | 0.00% | 0.00% | 100.00% | 0.00% | |||||||||||||||
Global Managed Volatility Fund | 57.52% | 0.00% | 0.00% | 0.00% | 0.00% | |||||||||||||||
Tax-Managed Managed Volatility Fund | 100.00% | 0.00% | 0.00% | 0.00% | 0.00% | |||||||||||||||
Tax-Managed International Managed Volatility Fund | 12.94% | 0.00% | 0.00% | 0.00% | 0.00% | |||||||||||||||
Real Estate Fund * | 0.00% | 0.00% | 0.00% | 100.00% | 63.05% | |||||||||||||||
Core Fixed Income Fund | 0.00% | 21.68% | 0.00% | 0.00% | 0.00% | |||||||||||||||
High Yield Bond Fund | 0.00% | 0.00% | 78.87% | 0.00% | 0.00% | |||||||||||||||
Conservative Income Fund | 0.00% | 1.08% | 99.81% | 100.00% | 0.00% | |||||||||||||||
Tax-Free Conservative Income Fund | 0.00% | 0.00% | 0.00% | 0.00% | 0.00% | |||||||||||||||
Real Return Fund | 0.00% | 0.00% | 0.00% | 100.00% | 0.00% | |||||||||||||||
Dynamic Asset Allocation Fund | 54.35% | 0.00% | 0.00% | 100.00% | 1.40% | |||||||||||||||
Multi-Strategy Alternative Fund | 2.74% | 3.51% | 56.57% | 0.00% | 0.32% | |||||||||||||||
Liquid Alternative Fund | 0.00% | 0.00% | 0.00% | 0.00% | 0.00% | |||||||||||||||
Multi-Asset Accumulation Fund` | 3.20% | 15.42% | 40.14% | 0.00% | 0.02% | |||||||||||||||
Multi-Asset Income Fund | 1.69% | 0.00% | 20.17% | 0.00% | 0.00% | |||||||||||||||
Multi-Asset Inflation Managed Fund | 5.29% | 0.00% | 36.61% | 0.00% | 0.48% | |||||||||||||||
Multi-Asset Capital Stability Fund | 7.16% | 31.20% | 70.82% | 0.00% | 0.16% | |||||||||||||||
The Funds intend to pass through foreign tax credit to shareholders. For the fiscal year ended September 30, 2023, the amount of foreign source income and foreign tax credit are as follows ($ Thousands):
Fund | Foreign | Foreign | ||||||
Tax-Managed International Managed Volatility Fund | 10,219 | 1,149 | ||||||
(1) Qualifying dividends represent dividends which qualify for the corporate dividends received deduction.
(2) The percentage in this column represents the amount of “Qualifying Dividend Income” is reflected as a percentage of “Ordinary Income Distributions.” It is the intention of each of the aforementioned funds to designate the maximum amount permitted by the law. The information reported herein may differ from the information and distributions taxable to the shareholders for the calendar year ending December 31, 2023. Complete information will be computed and reported in conjunction with your 2023 Form 1099-DIV.
(3) “U.S. Government Interest” represents the amount of interest that was derived from direct U.S. Government obligations and distributed during the fiscal year. This amount is reflected as a percentage of total ordinary income distributions (the total of short term capital gain and net investment income distributions). Generally, interest from direct U.S. Government obligations is exempt from state income tax. However, for shareholders of the SEI Institutional Trust, who are residents of California, Connecticut and New York, the statutory threshold requirements were not satisfied to permit exemption of these amounts from state income.
458
SEI Institutional Managed Trust
(4) The percentage in this column represents the amount of “Interest Related Dividend” is reflected as a percentage of ordinary income distribution. Interest related dividends are exempted from U.S. withholding tax when paid to foreign investors.
(5) The percentage in this column represents the amount of “Short Term Capital Gain Dividend” is reflected as a percentage of short term capital gain distribution that is exempted from U.S. withholding tax when paid to foreign investors.
(6) The percentage in this column represents the amount of ordinary dividend income that qualified for 20% Business Income Deduction.
Items (A) and (B) are based on the percentage of each Fund’s total distribution.
Items (C), (D) and (E) are based on the percentage of ordinary income distributions of each Fund.
Item (F) is based on the percentage of gross income of each Fund.
* Data as of December 31, 2022.
Please consult your tax adviser for proper treatment of this information. This notification should be kept with your permanent tax records.
SEI Institutional Managed Trust
459
(This page intentionally left blank)
SEI Institutional Managed Trust / Annual Report / September 30, 2023
Trustees
Robert A. Nesher, Chairman
William M. Doran
Nina Lesavoy
James M. Williams
Hubert L. Harris, Jr.
Susan C. Cote
James B. Taylor
Christine Reynolds
Thomas Melendez
Officers
Robert A. Nesher
President and Chief Executive Officer
Glenn R. Kurdziel
Controller and Chief Financial Officer
Stephen Panner
Chief Compliance Officer
Timothy D. Barto
Vice President, Secretary
David F. McCann
Vice President, Assistant Secretary
Katherine Mason
Vice President, Assistant Secretary
Stephen G. MacRae
Vice President
Donald Duncan
Anti-Money Laundering Compliance Officer
Privacy Officer
Investment Adviser
SEI Investments Management Corporation
Administrator
SEI Investments Global Funds Services
Distributor
SEI Investments Distribution Co.
Legal Counsel
Morgan, Lewis & Bockius LLP
Independent Registered Public Accounting Firm
KPMG LLP
This report and the financial statements contained herein are submitted for the general information of the shareholders of the Trust and must be preceded or accompanied by a current prospectus. Shares of the Funds are not deposits or obligations of, or guaranteed or endorsed by, any bank. The shares are not federally insured by the Federal Deposit Insurance Corporation (FDIC), the Federal Reserve Board, or any other government agency. Investment in the shares involves risk, including the possible loss of principal.
For more information call
1 800 DIAL SEI
(1 800 342 5734)

SEI-F-087 (9/23)
| Item 2. | Code of Ethics. |
The Registrant has adopted a code of ethics that applies to the Registrant’s principal executive officer, principal financial officer, principal accounting officer, or controller, or persons performing similar functions.
| Item 3. | Audit Committee Financial Expert. |
(a) (1) The Registrant’s Board of Trustees has determined that the Registrant has two audit committee financial experts serving on the audit committee.
(a) (2) The audit committee financial experts are Susan C. Cote and Hubert L. Harris, Jr. Ms. Cote and Mr. Harris are independent as defined in Form N-CSR Item 3 (a) (2).
| Item 4. | Principal Accountant Fees and Services. |
Fees billed by KPMG LLP (“KPMG”) related to the Registrant.
KPMG billed the Registrant aggregate fees for services rendered to the Registrant for the fiscal years 2023 and 2022 as follows:
| Fiscal Year 2023 | Fiscal Year 2022 | ||||||
| All fees and services to the Registrant that were pre-approved | All fees and services to service affiliates that were pre-approved | All other fees and services to service affiliates that did not require pre-approval | All fees and services to the Registrant that were pre-approved | All fees and services to service affiliates that were pre-approved | All other fees and services to service affiliates that did not require pre-approval | ||
| (a) | Audit Fees(1) | $1,090,060 | $0 | N/A | $1,035,060 | $0 | N/A |
| (b) | Audit-Related Fees | $0 | $0 | $0 | $0 | $0 | $0 |
| (c) | Tax Fees | $0 | $0 | $0 | $0 | $0 | $0 |
| (d) | All Other Fees(2) | $0 | $354,196 | $0 | $0 | $332,500 | $0 |
Notes:
| (1) | Audit fees include amounts related to the audit of the Registrant’s annual financial statements and services normally provided by the accountant in connection with statutory and regulatory filings. |
| (2) | See Item 4(g) for a description of the services comprising the fees disclosed under this category. |
(e)(1) The Registrant’s Audit Committee has adopted and the Board of Trustees has ratified an Audit and Non-Audit Services Pre-Approval Policy (the “Policy”), which sets forth the procedures and the conditions pursuant to which services proposed to be performed by the independent auditor of the Registrant may be pre-approved. In any instance where services require pre-approval, the Audit Committee will consider whether such services are consistent with SEC’s rules on auditor independence and whether the provision of such services would compromise the auditor’s independence.
The Policy provides that all requests or applications for proposed services to be provided by the independent auditor must be submitted to the Registrant’s Chief Financial Officer (“CFO”) and must include a detailed description of the services proposed to be rendered. The CFO will determine whether such services: (1) require specific pre-approval; (2) are included within the list of services that have received the general pre-approval of the Audit Committee pursuant to the Policy; or (3) have been previously pre-approved in connection with the independent auditor’s annual engagement letter for the applicable year or otherwise.
Requests or applications to provide services that require specific pre-approval by the Audit Committee will be submitted to the Audit Committee by the CFO. The Audit Committee has delegated specific pre-approval authority to either the Audit Committee Chair or financial experts, provided that the estimated fee for any such proposed pre-approved service does not exceed $100,000 and any pre-approval decisions are reported to the Audit Committee at its next regularly scheduled meeting.
Services that have received the general pre-approval of the Audit Committee are identified and described in the Policy. In addition, the Policy sets forth a maximum fee per engagement with respect to each identified service that has received general pre-approval. The Audit Committee will annually review and pre-approve the services that may be provided by the independent auditor during the following twelve months without obtaining specific pre-approval from the Audit Committee.
The Audit Committee will be informed by the CFO on a quarterly basis of all services rendered by the independent auditor.
All services to be provided by the independent auditor shall be provided pursuant to a signed written engagement letter with the Registrant, the investment advisor or applicable control affiliate (except that matters as to which an engagement letter would be impractical because of timing issues or because the matter is small may not be the subject of an engagement letter) that sets forth both the services to be provided by the independent auditor and the total fees (or the manner of their determination) to be paid to the independent auditor for those services.
In addition, the Audit Committee has determined to take additional measures on an annual basis to meet its responsibility to oversee the work of the independent auditor and to assure the auditor's independence from the Registrant, such as reviewing a formal written statement from the independent auditor delineating all relationships between the independent auditor and the Registrant, and discussing with the independent auditor its methods and procedures for ensuring independence.
(e)(2) Percentage of fees billed applicable to non-audit services pursuant to waiver of pre-approval requirement were as follows:
| Fiscal 2023 | Fiscal 2022 | |
Audit-Related Fees | 0% | 0% |
| Tax Fees | 0% | 0% |
All Other Fees | 0% | 0% |
(f) Not Applicable.
(g)(1) The aggregate non-audit fees and services billed by KPMG for the fiscal years 2023 and 2022 were $354,196 and $332,500, respectively. Non-audit fees consist of a SSAE No. 16 review of fund accounting and administration operations and an attestation report in accordance with Rule 17Ad-13.
(h) During the past fiscal year, the Registrant’s principal accountant provided certain non-audit services to the Registrant’s investment adviser or to entities controlling, controlled by, or under common control with the Registrant’s investment adviser that provide ongoing services to the Registrant that were not subject to pre-approval pursuant to paragraph (c)(7)(ii) of Rule 2-01 of Regulation S-X. The Audit Committee of the Registrant’s Board of Trustees reviewed and considered these non-audit services provided by the Registrant’s principal accountant to the Registrant’s affiliates, including whether the provision of these non-audit services is compatible with maintaining the principal accountant’s independence.
(i) Not Applicable.
(j) Not Applicable.
| Item 5. | Audit Committee of Listed Registrants. |
Not applicable.
| Item 6. | Schedule of Investments. |
Included in Item 1.
| Item 7. | Disclosure of Proxy Voting Policies and Procedures for Closed-End Management Investment Companies. |
Not applicable.
| Item 8. | Portfolio Managers of Closed-End Management Investment Companies. |
Not applicable.
| Item 9. | Purchases of Equity Securities by Closed-End Management Company and Affiliated Purchasers. |
Not applicable.
| Item 10. | Submission of Matters to a Vote of Security Holders. |
There have been no material changes to the procedures by which shareholders may recommend nominees to the Registrant’s Board of Trustees (the “Board”). The Registrant has a standing Governance Committee (the "Committee") currently consisting of the Independent Trustees. The Committee is responsible for evaluating and recommending nominees for election to the Board. Pursuant to the Committee's Charter, adopted on June 18, 2004, as amended, the Committee will review all shareholder recommendations for nominations to fill vacancies on the Board if such recommendations are submitted in writing and addressed to the Committee at the Registrant’s office.
| Item 11. | Controls and Procedures. |
(a) The Registrant’s principal executive and principal financial officers, or persons performing similar functions, have concluded that the Registrant’s disclosure controls and procedures (as defined in Rule 30a-3(c) under the Investment Company Act of 1940 (the “1940 Act”)) are effective, based on the evaluation of these controls and procedures required by Rule 30a-3(b) under the 1940 Act and Rules 13a-15(b) or 15d-15(b) under the Securities Exchange Act of 1934 as of a date within 90 days of the filing date of this report.
(b) There were no changes in the Registrant’s internal control over financial reporting (as defined in Rule 30a-3(d) under the 1940 Act) that occurred during the period covered by this report that have materially affected, or are reasonably likely to materially affect, the Registrant’s internal control over financial reporting.
| Item 12. | Disclosure of Securities Lending Activities for Closed-End Management Investment Companies. |
Not applicable.
| Item 13. | Exhibits. |
(a)(1) Code of Ethics attached hereto.
(a)(2) A separate certification for the principal executive officer and the principal financial officer of the Registrant as required by Rule 30a-2(a) under the Investment Company Act of 1940, are filed herewith.
(b) Officer certifications as required by Rule 30a-2(b) under the Investment Company Act of 1940, as amended also accompany this filing as exhibits.
SIGNATURES
Pursuant to the requirements of the Securities Exchange Act of 1934 and the Investment Company Act of 1940, the Registrant has duly caused this report to be signed on its behalf by the undersigned, thereunto duly authorized.
| SEI Institutional Managed Trust | ||
| By | /s/ Robert A. Nesher | |
| Robert A. Nesher | ||
| President & CEO |
Date: December 18, 2023
Pursuant to the requirements of the Securities Exchange Act of 1934 and the Investment Company Act of 1940, this report has been signed below by the following persons on behalf of the Registrant and in the capacities and on the dates indicated.
| By | /s/ Robert A. Nesher | |
| Robert A. Nesher | ||
| President & CEO | ||
| Date: December 18, 2023 | ||
| By | /s/ Glenn Kurdziel | |
| Glenn Kurdziel | ||
| Controller & CFO | ||
| Date: December 18, 2023 |