EXHIBIT 99
The Procter & Gamble Company
Reg G Reconciliation of Non-GAAP measures
In accordance with the SEC’s Regulation G, the following provides definitions of the non-GAAP measures used in the earnings release and the reconciliation to the most closely related GAAP measure.
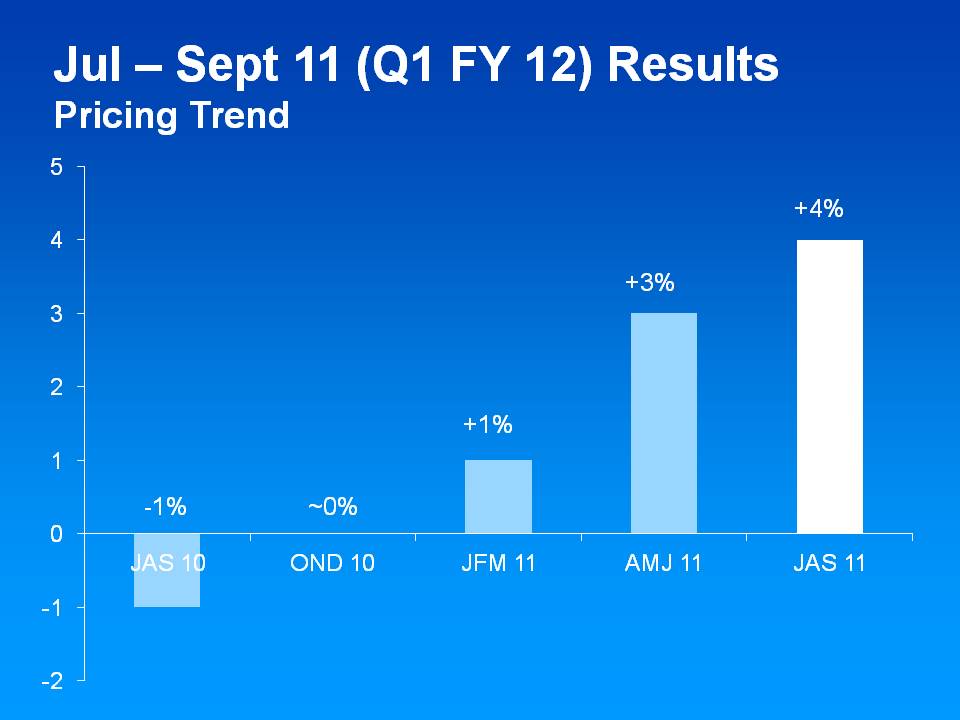
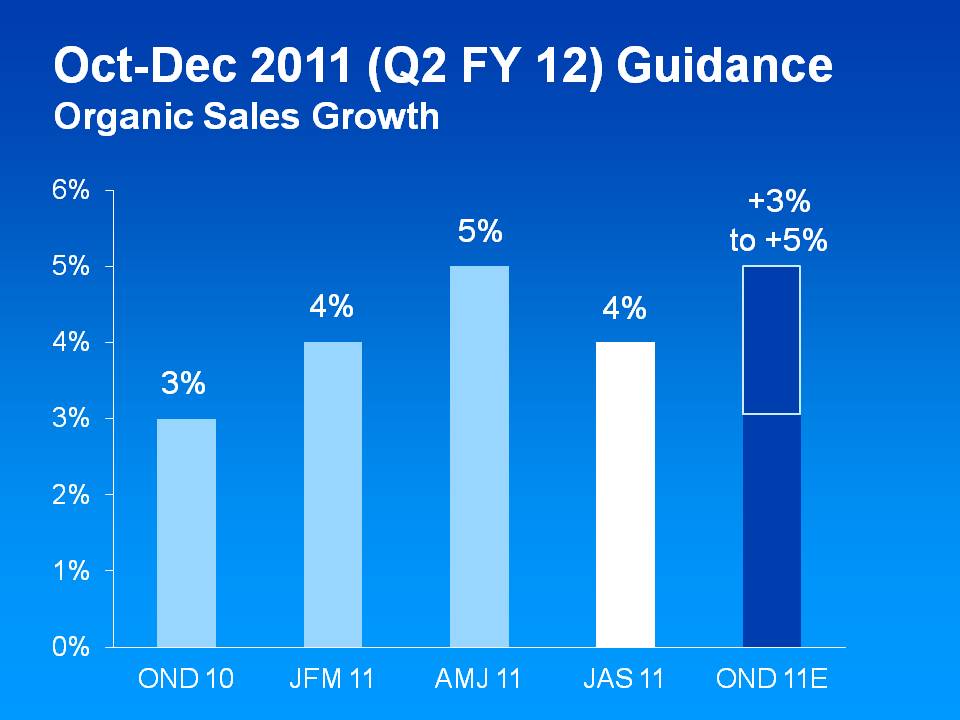
Organic Sales Growth: Organic sales growth is a non-GAAP measure of sales growth excluding the impacts of acquisitions, divestitures and foreign exchange from year-over-year comparisons. We believe this provides investors with a more complete understanding of underlying sales trends by providing sales growth on a consistent basis. Organic sales is also one of the measures used to evaluate senior management and is a factor in determining their at-risk compensation.
The reconciliation of reported sales growth to organic sales is as follows:
| Total P&G | Net Sales Growth | | Foreign Exchange Impact | | Acquisition/ Divestiture Impact* | | Organic Sales Growth |
| JAS ‘10 | 2% | | 3% | | -1% | | 4% |
| OND ’10 | 2% | | 2% | | -1% | | 3% |
| JFM ‘11 | 5% | | -1% | | 0% | | 4% |
| AMJ ’11 | 10% | | -5% | | 0% | | 5% |
| | | | | | | | |
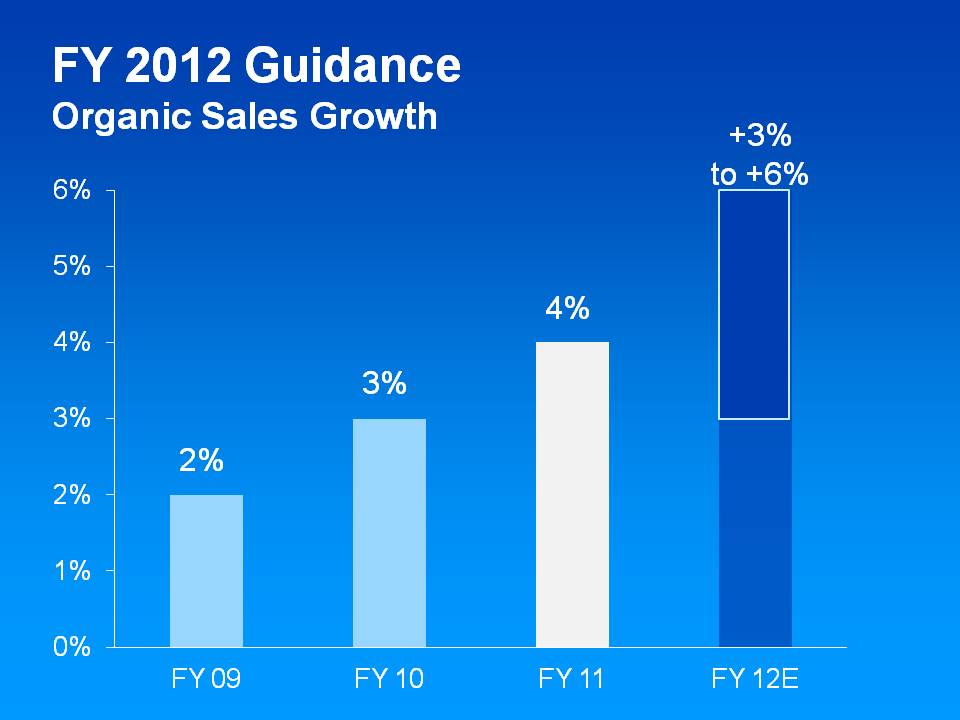
| FY 2009 | -3% | | 4% | | 1% | | 2% |
| FY 2010 | 3% | | 1% | | -1% | | 3% |
| FY 2011 | 5% | | 0% | | -1% | | 4% |
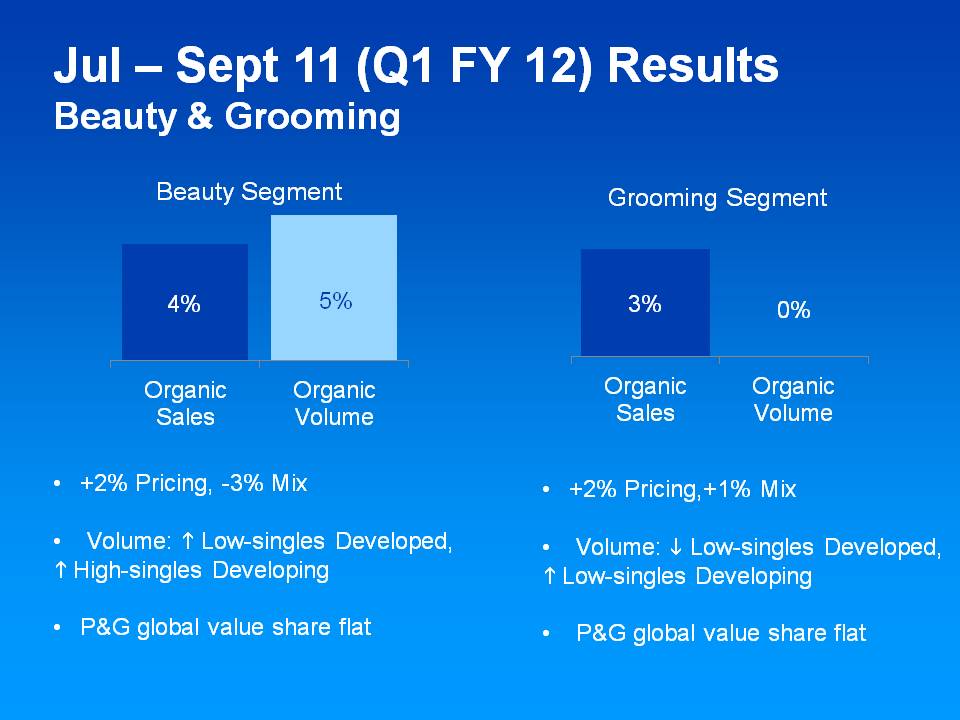
| Jul - Sept | Net Sales Growth | | Foreign Exchange Impact | | Acquisition/ Divestiture Impact* | | Organic Sales Growth |
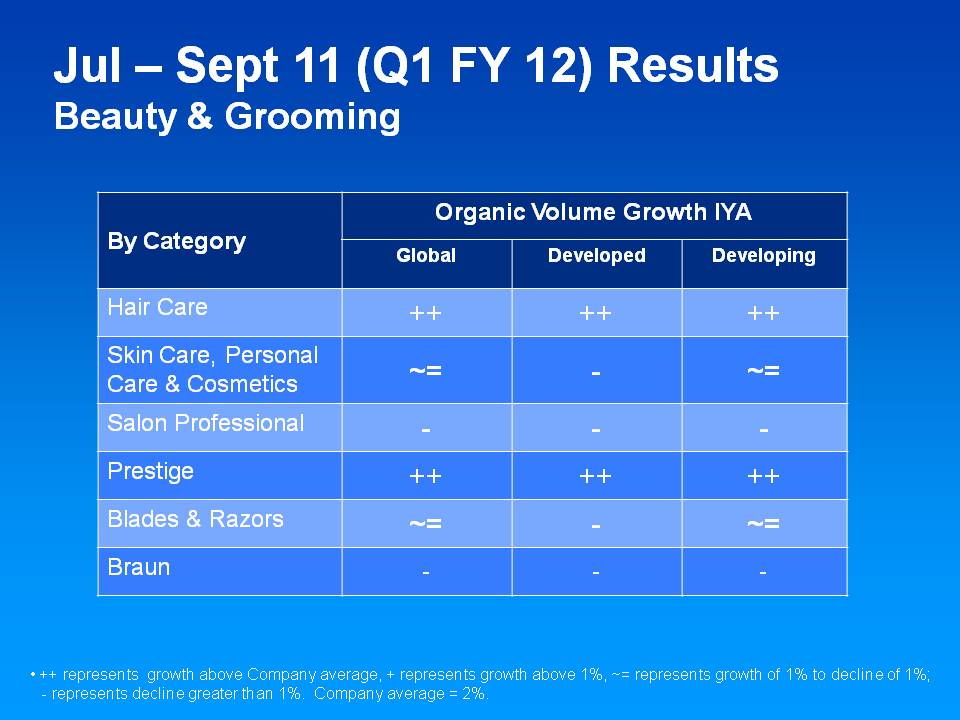
| Beauty | 9% | | -6% | | 1% | | 4% |
| Grooming | 10% | | -7% | | 0% | | 3% |
| Health Care | 10% | | -6% | | 0% | | 4% |
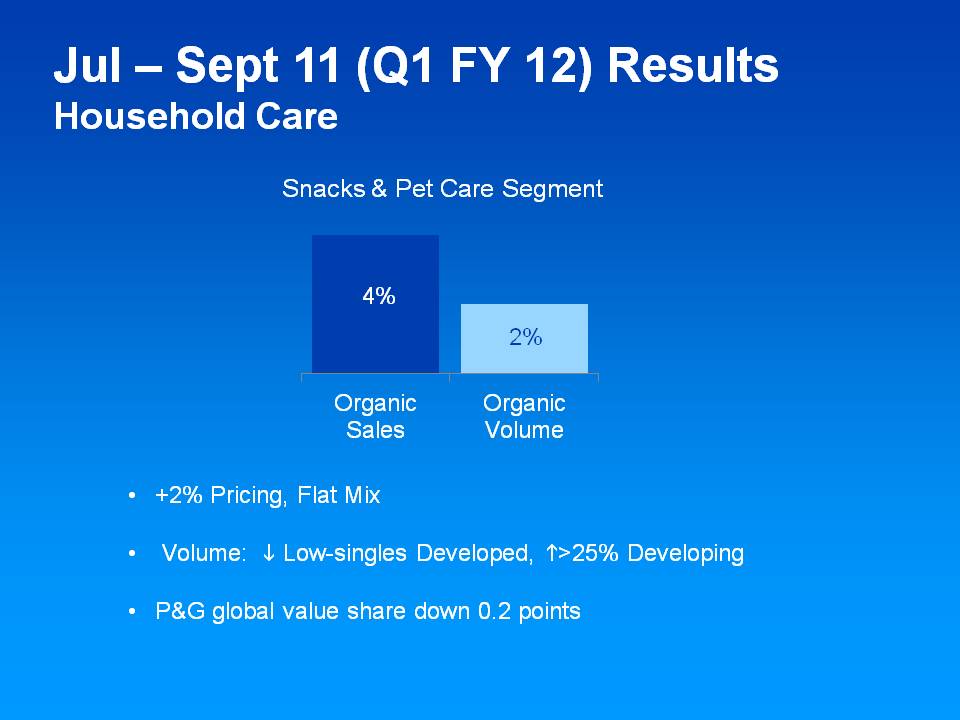
| Snacks and Pet Care | 9% | | -5% | | 0% | | 4% |
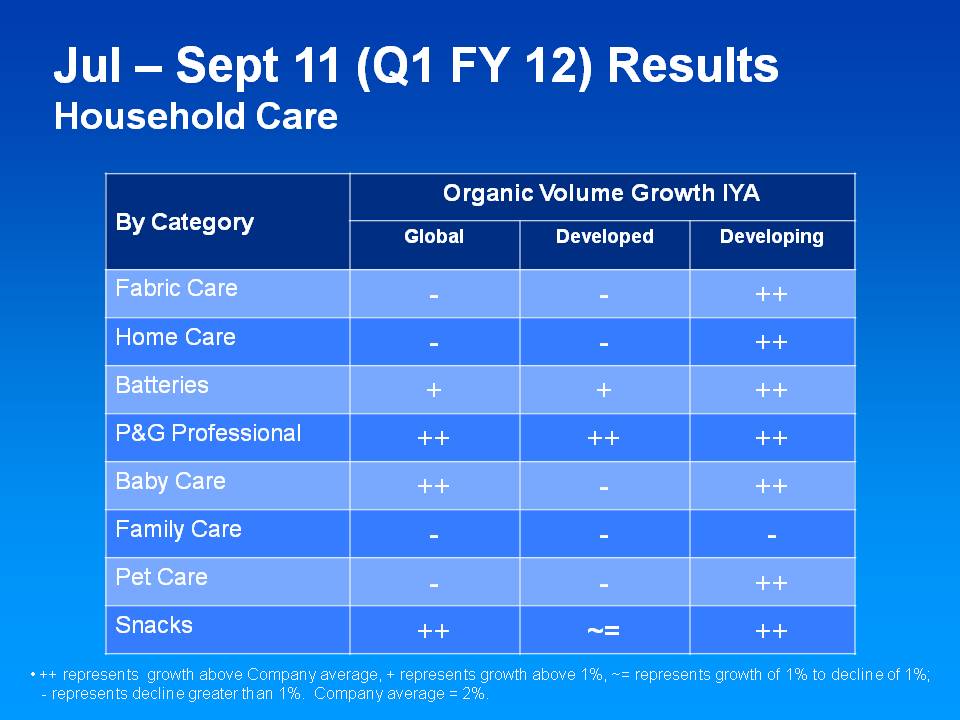
| Fabric Care and Home Care | 6% | | -5% | | 0% | | 1% |
| Baby Care and Family Care | 12% | | -5% | | 0% | | 7% |
| Total P&G | 9% | | -5% | | 0% | | 4% |
| | | | | | | | |
*Acquisition/Divestiture Impact includes rounding impacts necessary to reconcile net sales to organic sales.
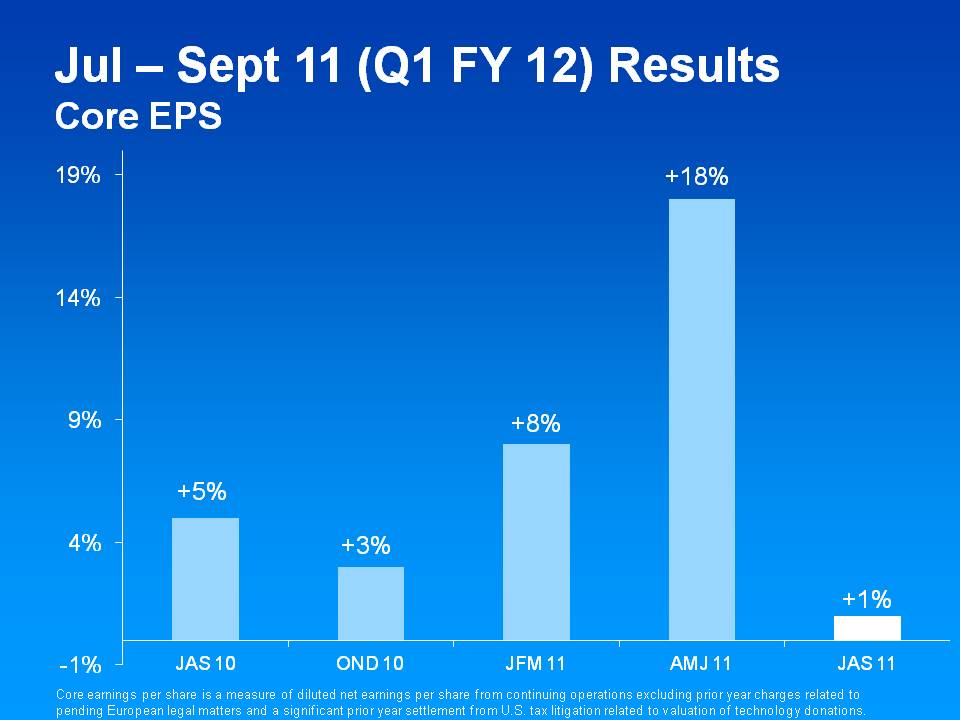
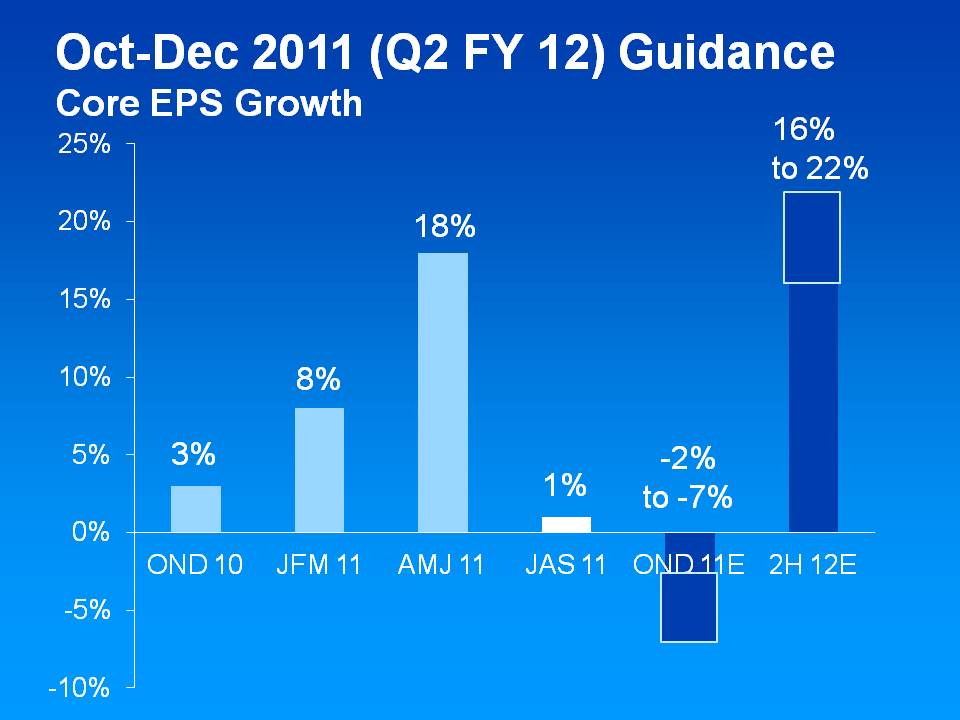
Core EPS: This is a measure of the Company’s diluted net earnings per share from continuing operations excluding certain items that are not judged to be part of the Company’s sustainable results or trends. This includes a significant benefit in 2011 from the settlement of U.S. tax litigation primarily related to the valuation of technology donations, charges in both 2011 and 2010 related to pending European legal matters, a 2010 charge related to a tax provision for retiree healthcare subsidy payments in the U.S. healthcare reform legislation, incremental restructuring charges in 2009 to offset the dilutive impact of the Folgers divestiture, and significant adjustments to tax reserves in 2008. We believe the Core EPS measure provides an important perspective of underlying business trends and results and provides a more comparable measure of year-on-year earnings per share growth. Core EPS is also one of the measures used to evaluate senior management and is a factor in determining their at-risk compensation. The table below provides a reconciliation of diluted net earnings per share from continuing operations to Core EPS:
| | | FY 2012 | | FY 2011 | | FY 2010 | | FY 2009 | | FY 2008 |
| Diluted Net Earnings Per Share - Continuing Operations | | $4.17 to $4.33 | | $3.93 | | $3.53 | | $3.39 | | $3.40 |
| Settlement from U.S. Tax Litigation | | - | | ($0.08) | | - | | - | | - |
| Charges for Pending European Legal Matters | | - | | $0.10 | | $0.09 | | - | | - |
| Charge for Taxation of Retiree Healthcare Subsidy | | - | | - | | $0.05 | | - | | - |
| Incremental Folgers-related Restructuring Charges | | - | | - | | - | | $0.09 | | - |
| Significant Adjustments to Tax Reserves | | - | | - | | - | | - | | ($0.14) |
| Rounding Impacts | | | | | | | | ($0.01) | | - |
| Core EPS | | $4.17 to $4.33 | | $3.95 | | $3.67 | | $3.47 | | $3.26 |
| Core EPS Growth | | 6% to 10% | | 8% | | 6% | | 6% | | |
| | OND 11 (Est.) | | OND 10 | | OND 09 |
Diluted Net Earnings Per Share – Continuing Operations | $1.05 to $1.11 | | $1.11 | | $1.01 |
| Settlement from U.S. Tax Litigation | - | | ($0.08) | | - |
| Charges for Pending European Legal Matters | - | | $0.10 | | $0.09 |
| Core EPS | $1.05 to $1.11 | | $1.13 | | $1.10 |
| Core EPS Growth | -7% to -2% | | 3% | | |
| | JFM 11 | | JFM 10 | |
Diluted Net Earnings Per Share – Continuing Operations | $0.96 | | $0.83 | |
| Charge for Taxation of Retiree Healthcare Subsidy | - | | $0.05 | |
| Rounding Impacts | - | | $0.01 | |
| $0.96 | | $0.89 | |
| Core EPS Growth | 8% | | | |
Note – All reconciling items are presented net of tax. Tax effects are calculated consistent with the nature of the underlying transaction. The charge for taxation of retiree healthcare subsidy, significant settlement from U.S. tax litigation, and significant adjustments to tax reserves are tax expense. There was no tax impact on EPS due to the charges for pending European legal matters. The tax impact on the incremental Folgers-related restructuring charges was ($0.02) for 2009.