The Procter & Gamble Company: Reg G Reconciliation of Non-GAAP measures
In accordance with the SEC’s Regulation G, the following provides definitions of the non-GAAP measures used in Procter & Gamble's February 21, 2013 CAGNY presentation and associated slides with the reconciliation to the most closely related GAAP measure. The measures provided are as follows:
| 1. | Organic Sales Growth – page 1 |
| 2. | Core EPS – pages 2 through 4 |
| 3. | Free Cash Flow – page 4 |
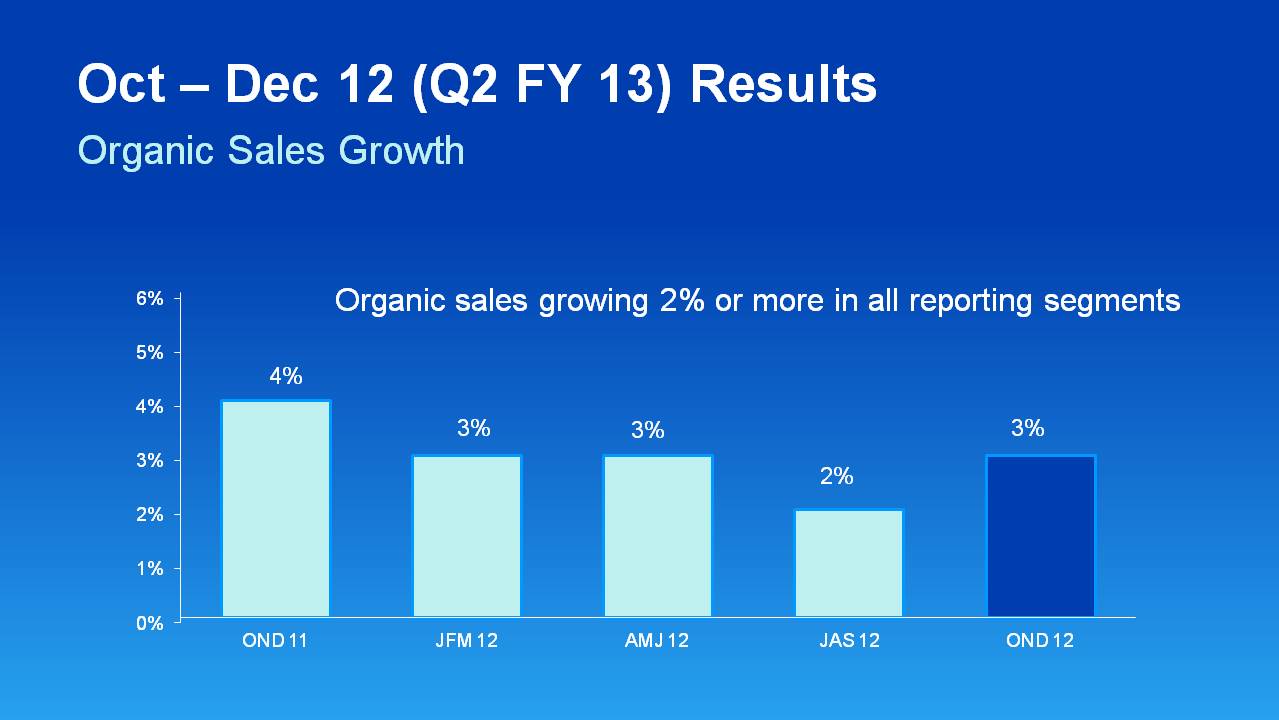
1. Organic Sales Growth:
Organic sales growth is a non-GAAP measure of sales growth excluding the impacts of acquisitions, divestitures and foreign exchange from year-over-year comparisons. We believe this provides investors with a more complete understanding of underlying sales trends by providing sales growth on a consistent basis. Organic sales is also one of the measures used to evaluate senior management and is a factor in determining their at-risk compensation. The reconciliation of reported sales growth to organic sales is as follows:
Total P&G | | Net Sales Growth | | Foreign Exchange Impact | | Acquisition/ Divestiture Impact* | | Organic Sales Growth |
| OND 11 | 4% | | 0% | | 0% | | 4% |
| JFM 12 | 2% | | 1% | | 0% | | 3% |
| AMJ 12 | -1% | | 4% | | 0% | | 3% |
| JAS 12 | -4% | | 6% | | 0% | | 2% |
| OND 12 | 2% | | 1% | | 0% | | 3% |
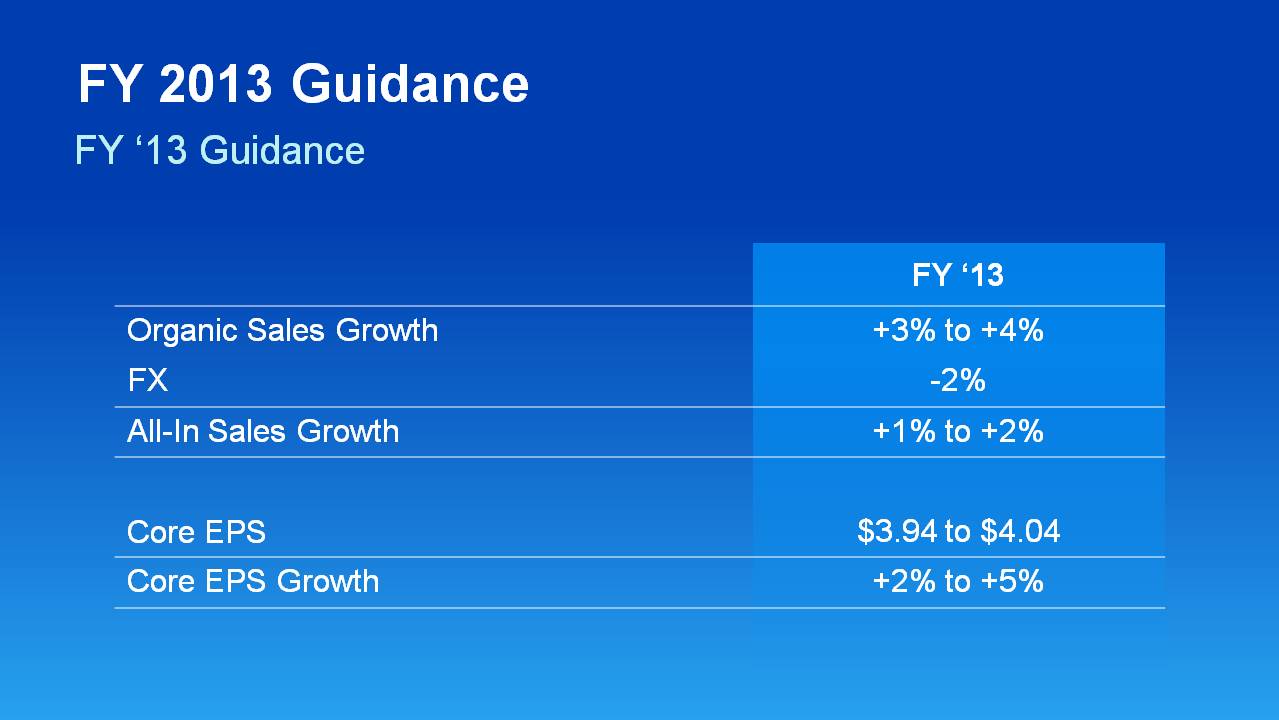
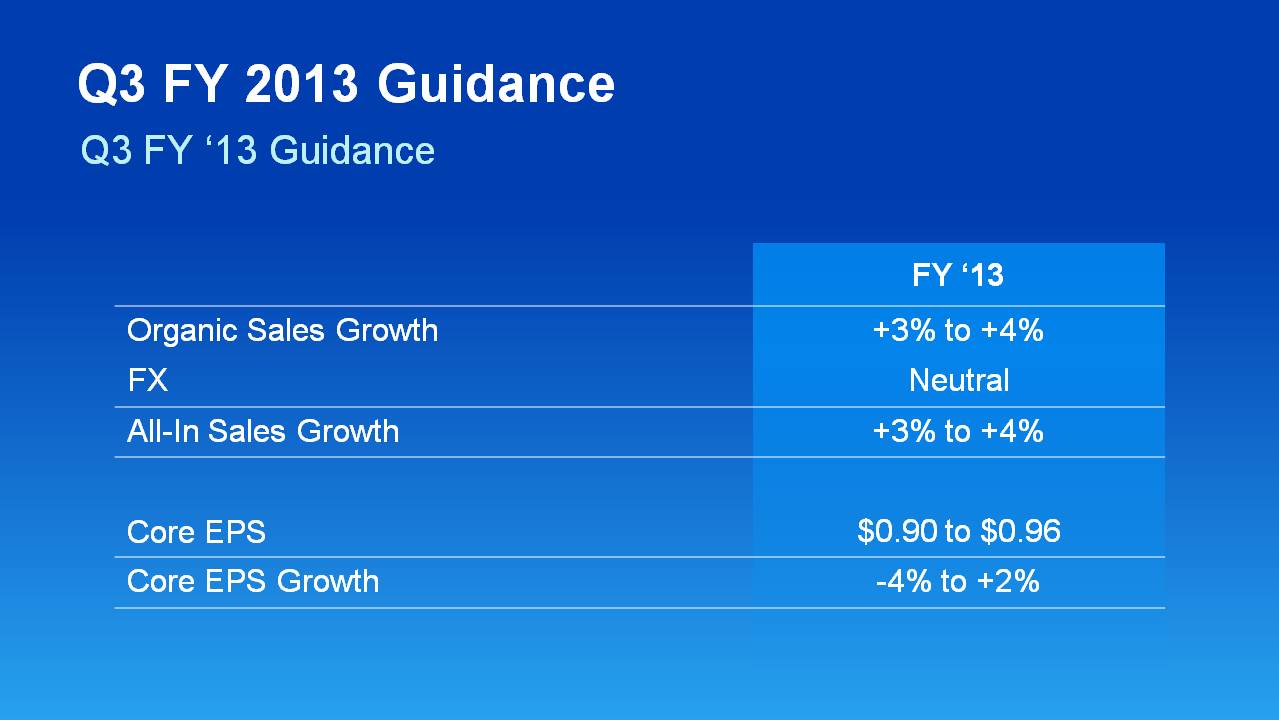
| JFM 13 (Estimate) | 3% to 4% | | 0% | | 0% | | 3% to 4% |
| FY 2013 (Estimate) | 1% to 2% | | 2% | | 0% | | 3% to 4% |
| OND 2012 | Net Sales Growth | | Foreign Exchange Impact | | Acquisition/ Divestiture Impact* | | Organic Sales Growth |
| Beauty | 1% | | 1% | | 1% | | 3% |
| Grooming | -4% | | 3% | | 3% | | 2% |
| Health Care | 3% | | 2% | | -1% | | 4% |
| Fabric Care and Home Care | 3% | | 0% | | 0% | | 3% |
| Baby Care and Family Care | 4% | | 1% | | 0% | | 5% |
*Acquisition/Divestiture Impact includes rounding impacts necessary to reconcile net sales to organic sales.
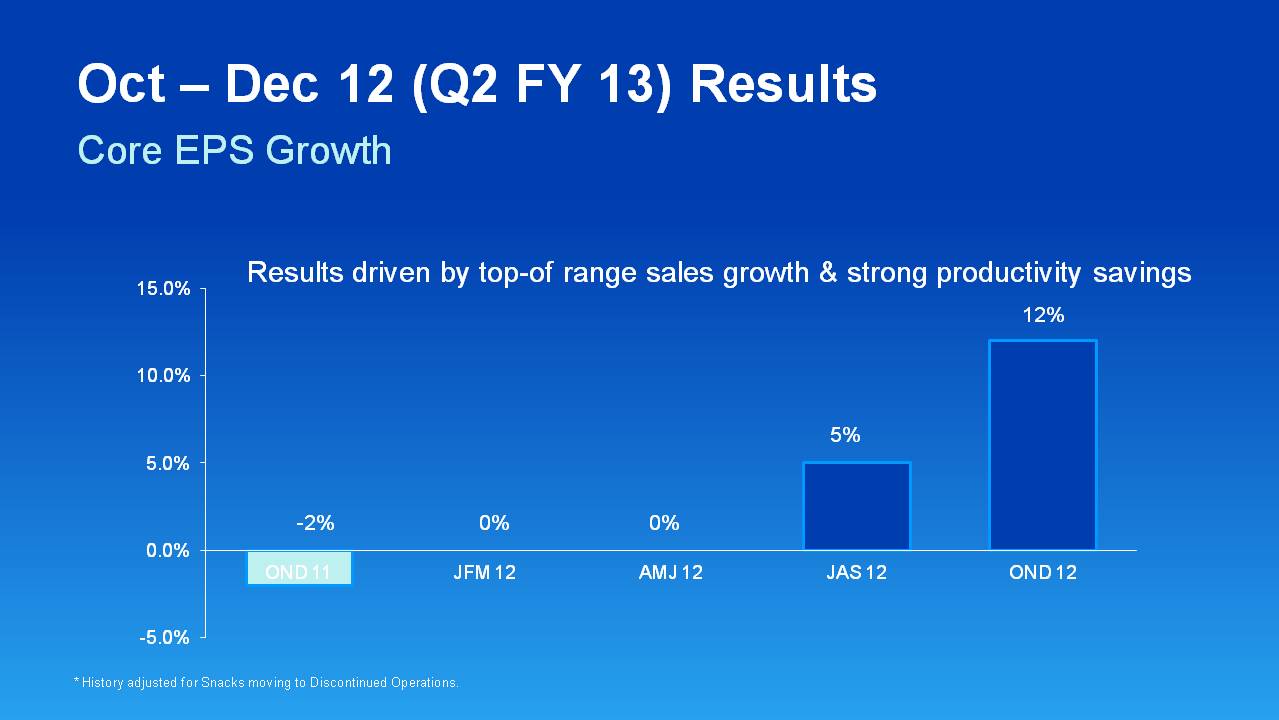
2. Core EPS: This is a measure of the Company’s diluted net earnings per share from continuing operations excluding charges in FY 2013 and 2012 for incremental restructuring charges due to increased focus on productivity and cost savings, charges in FY 2013, 2012, and 2011 related to the European legal matters, the FY 2013 Venezuela balance sheet devaluation, the FY 2013 holding gain on the buyout of our Iberian joint venture partner, and FY 2012 impairment charges for goodwill and indefinite lived intangible assets. We do not view these items to be part of our sustainable results. We believe the Core EPS measure provides an important perspective of underlying business trends and results and provides a more comparable measure of year-on-year earnings per share growth. Core EPS is also one of the measures used to evaluate senior management and is a factor in determining their at-risk compensation. The table below provides a reconciliation of diluted net earnings per share to Core EPS:
Fiscal Year Data: | | FY 2013 (est.) | | FY 2012 | |
| | | | | | |
Diluted Net Earnings Per Share - Continuing Operations | $3.92 to $4.04 | | $3.12 | |
| Impairment Charges | - | | $0.51 | |
| Venezuela Balance Sheet Devaluation Impacts | $0.09 to $0.07 | | - | |
| Charges for European legal matters | - | | $0.03 | |
| Incremental restructuring charges | $0.15 | | $0.20 | |
| Gain on buyout of Iberian JV | ($0.21) | | - | |
| Rounding/Other Impacts | ($0.01) | | ($0.01) | |
| Core EPS | $3.94 to $4.04 | | $3.85 | |
| Core EPS Growth | 2% to 5% | | | |
Quarter / Period Data:
| | JFM 13 (est.) | | JFM 12 |
| Diluted Net Earnings Per Share | $0.80 to $0.88 | | $0.82 |
| Snacks results of operations – Discontinued Operations | - | | ($0.01) |
| Diluted Net Earnings Per Share-Continuing Operations | $0.80 to $0.88 | | $0.81 |
| Venezuela Balance Sheet Devaluation Impacts | $0.09 to $0.07 | | - |
| Impairment charges | - | | $0.01 |
| Incremental restructuring | 0.01 | | $0.12 |
| Core EPS | $0.90 to $0.96 | | $0.94 |
| Core EPS Growth | -4% to +2% | | |
| | OND 12 | | OND 11 |
| Diluted Net Earnings Per Share-Continuing Operations | $1.39 | | $0.56 |
| Impairment charges | - | | $0.50 |
| Charges for European legal matters | - | | $0.02 |
| Gain on buyout of Iberian JV | ($0.21) | | - |
| Incremental restructuring | $0.05 | | $0.01 |
| Rounding | ($0.01) | | - |
| Core EPS | $1.22 | | $1.09 |
| Core EPS Growth | 12% | | |
| | JAS 12 | | JAS 11 |
| Diluted Net Earnings Per Share-Continuing Operations | $0.96 | | $1.01 |
| Incremental restructuring | $0.09 | | - |
| Charges for European Legal Matters | $0.01 | | - |
| Core EPS | $1.06 | | $1.01 |
| Core EPS Growth | 5% | | |
| | AMJ 12 | | AMJ 11 |
| Diluted Net Earnings Per Share | $1.24 | | $0.84 |
| Gain from snacks divestiture | ($0.48) | | - |
| Snacks results of operations – Discontinued Operations | ($0.02) | | ($0.02) |
| Diluted Net EPS - Continuing Operations | $0.74 | | $0.82 |
| Incremental restructuring | $0.08 | | - |
| Core EPS | $0.82 | | $0.82 |
| Core EPS Growth | 0% | | |
| | JFM 12 | | JFM 11 |
| Diluted Net Earnings Per Share | $0.82 | | $0.96 |
| Snacks Results of Operations – Discontinued Operations | ($0.01) | | ($0.02) |
| Diluted Net Earnings Per Share-Continuing Operations | $0.81 | | $0.94 |
| Incremental restructuring | $0.12 | | - |
| Non-cash Impairment charges | $0.01 | | - |
| Core EPS | $0.94 | | $0.94 |
| Core EPS Growth | 0% | | |
| | OND 11 | | OND 10 |
| Diluted Net Earnings Per Share-Continuing Operations | $0.56 | | $1.09 |
| Impairment charges | $0.50 | | - |
| Charges for European legal matters | $0.02 | | $0.10 |
| Settlement from U.S. tax litigation | - | | ($0.08) |
| Incremental restructuring | $0.01 | | - |
| Core EPS | $1.09 | | $1.11 |
| Core EPS Growth | -2% | | |
| | | | |
Note – All reconciling items are presented net of tax. Tax effects are calculated consistent with the nature of the underlying transaction. The charge for the significant settlement from U.S. tax litigation is tax expense.
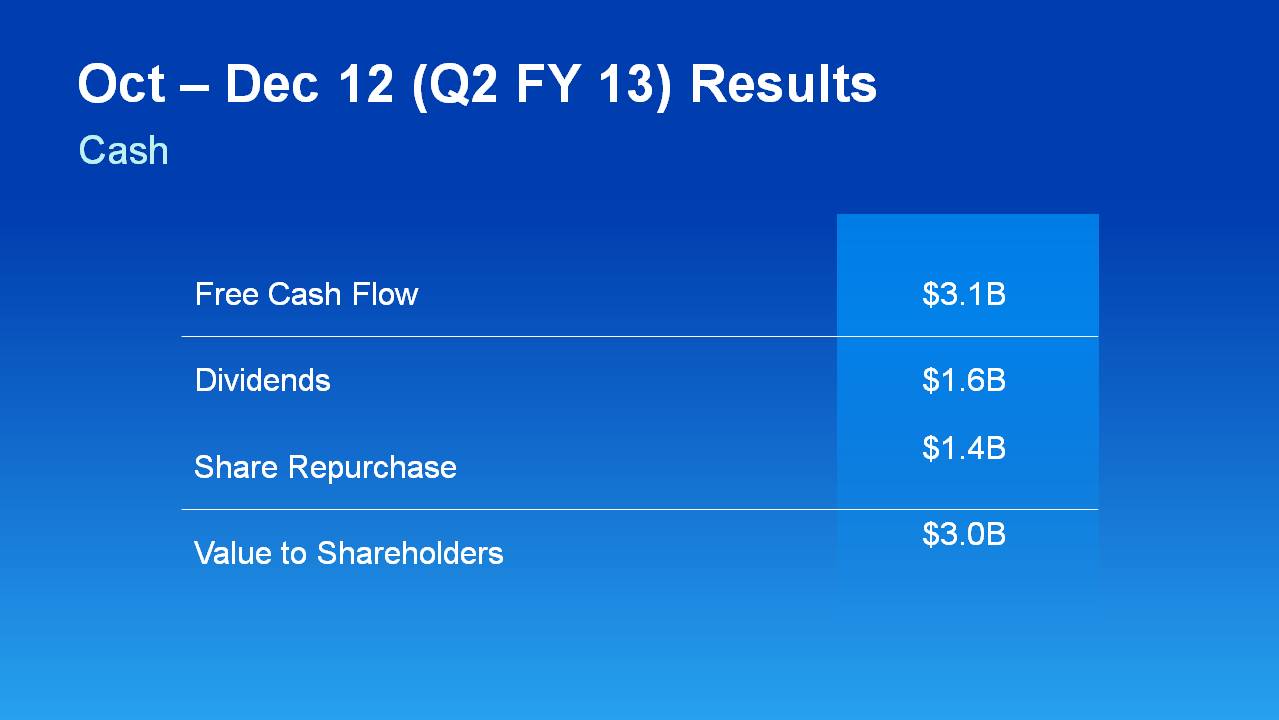
3. Free Cash Flow:
Free cash flow is defined as operating cash flow less capital spending. We view free cash flow as an important measure because it is one factor in determining the amount of cash available for dividends and discretionary investment. Free cash flow is also one of the measures used to evaluate senior management and is a factor in determining their at-risk compensation. The reconciliation of free cash flow is provided below (amounts in millions):
| | Operating Cash Flow | Capital Spending | Free Cash Flow |
| Oct-Dec ‘12 | $3,849 | ($724) | $3,125 |