
* Procter & Gamble Earnings Release:Q4 and Fiscal Year ResultsJuly 27, 2017

* Business ResultsFiscal Year 2017
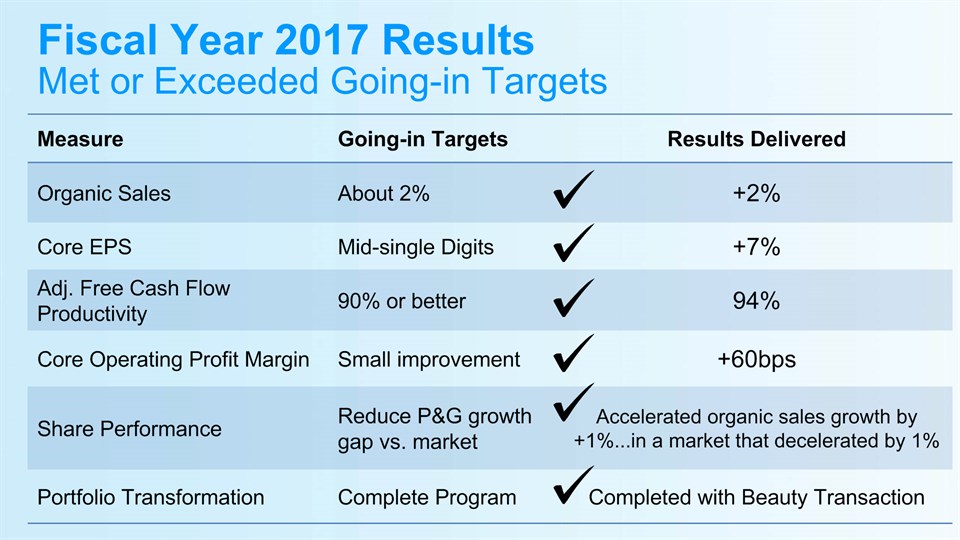
* Fiscal Year 2017 ResultsMet or Exceeded Going-in Targets Measure Going-in Targets Results Delivered Organic Sales About 2% +2% Core EPS Mid-single Digits +7% Adj. Free Cash Flow Productivity 90% or better 94% Core Operating Profit Margin Small improvement +60bps Share Performance Reduce P&G growth gap vs. market Accelerated organic sales growth by +1%...in a market that decelerated by 1% Portfolio Transformation Complete Program Completed with Beauty Transaction

* Fiscal Year 2017 ResultsOrganic Sales Growth FY 2017 sales growth was volume driven, with organic volume growing +2%.
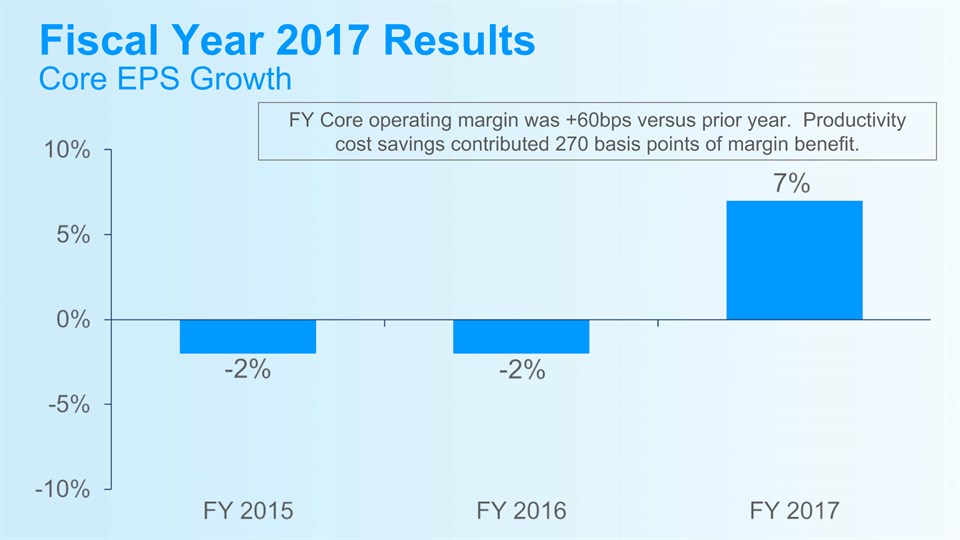
* Fiscal Year 2017 ResultsCore EPS Growth FY Core operating margin was +60bps versus prior year. Productivity cost savings contributed 270 basis points of margin benefit.
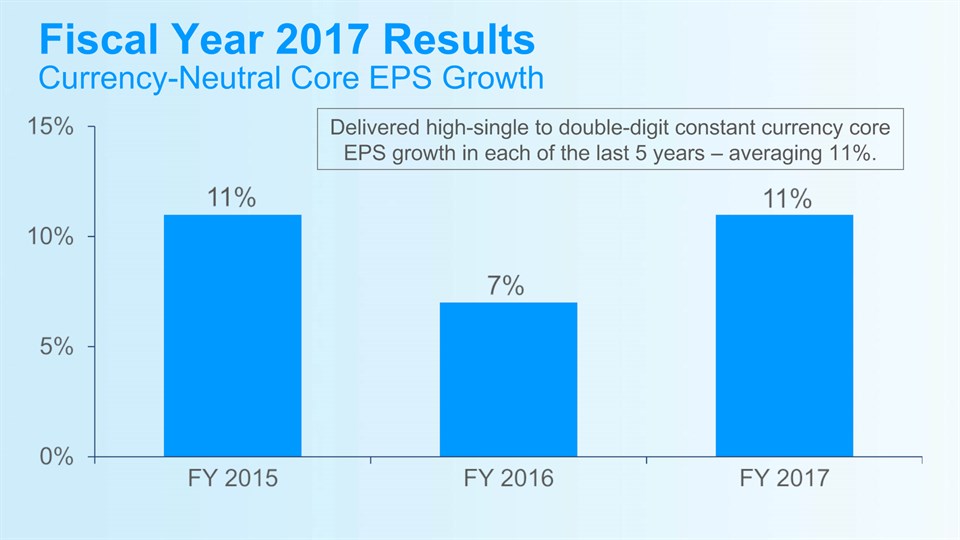
* Fiscal Year 2017 ResultsCurrency-Neutral Core EPS Growth Delivered high-single to double-digit constant currency core EPS growth in each of the last 5 years – averaging 11%.
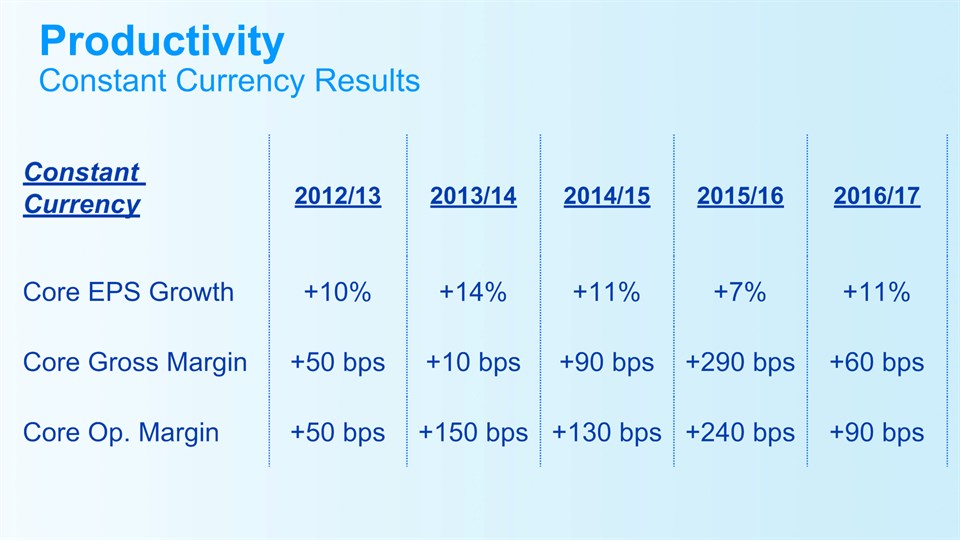
* Productivity Constant Currency Results Constant Currency 2012/13 2013/14 2014/15 2015/16 2016/17 Core EPS Growth +10% +14% +11% +7% +11% Core Gross Margin +50 bps +10 bps +90 bps +290 bps +60 bps Core Op. Margin +50 bps +150 bps +130 bps +240 bps +90 bps
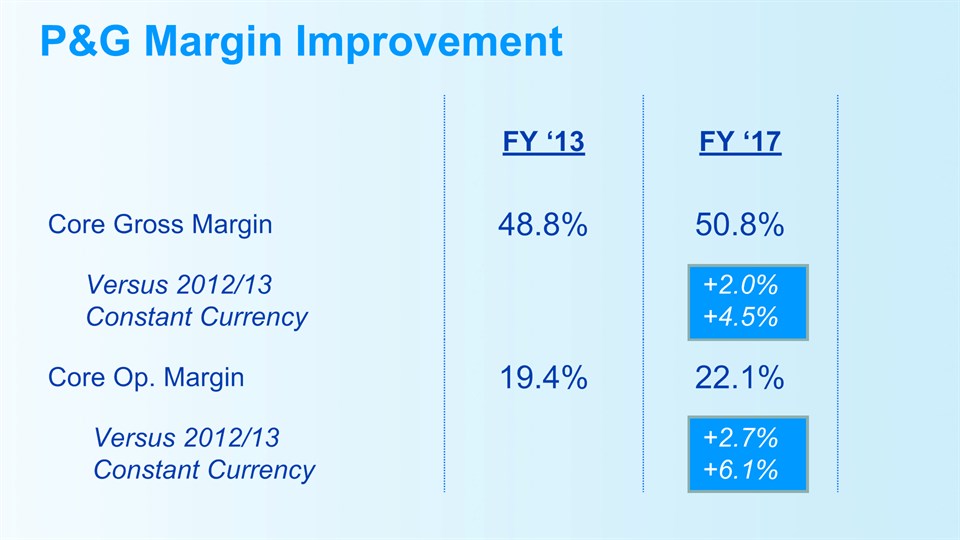
* P&G Margin Improvement FY ‘13 FY ‘17 Core Gross Margin 48.8% 50.8% Versus 2012/13 Constant Currency +2.0%+4.5% Core Op. Margin 19.4% 22.1% Versus 2012/13 Constant Currency +2.7%+6.1%

* Business ResultsQ4 FY 2017
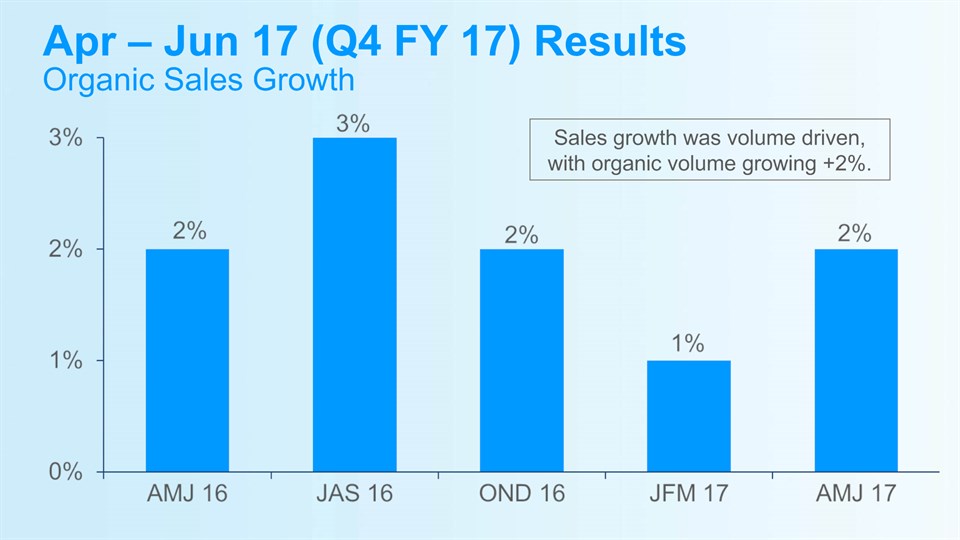
* Apr – Jun 17 (Q4 FY 17) ResultsOrganic Sales Growth Sales growth was volume driven, with organic volume growing +2%.
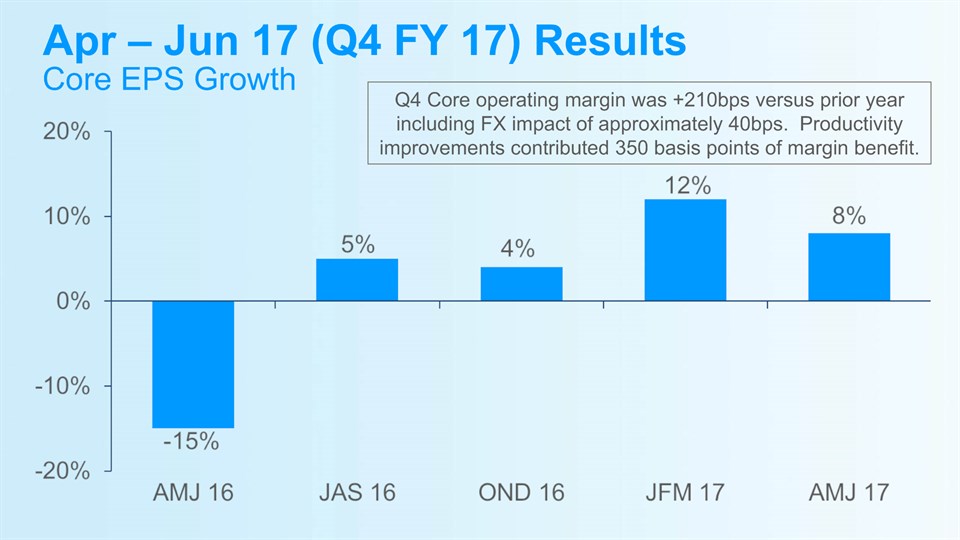
* Apr – Jun 17 (Q4 FY 17) ResultsCore EPS Growth Q4 Core operating margin was +210bps versus prior year including FX impact of approximately 40bps. Productivity improvements contributed 350 basis points of margin benefit.
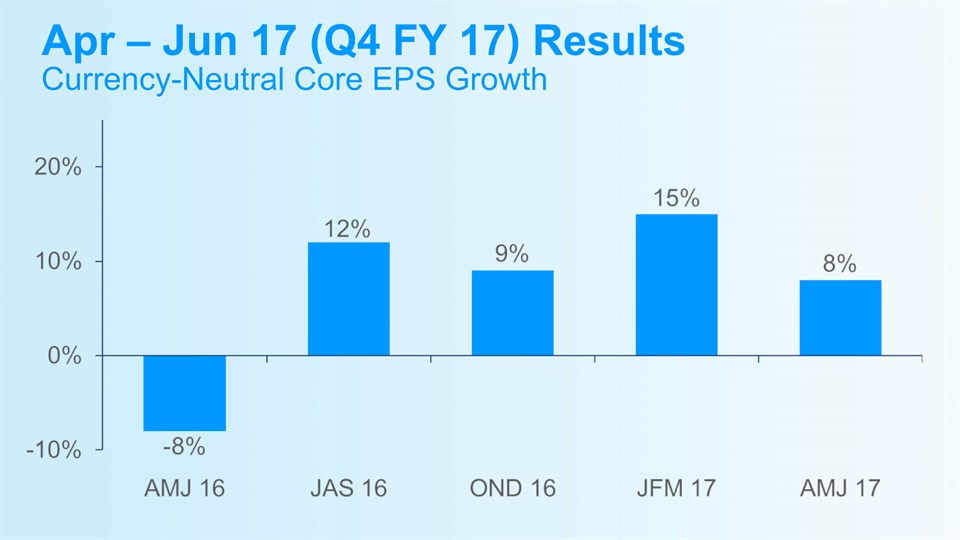
* Apr – Jun 17 (Q4 FY 17) ResultsCurrency-Neutral Core EPS Growth

* Business Segment Results and HighlightsQ4 FY 2017
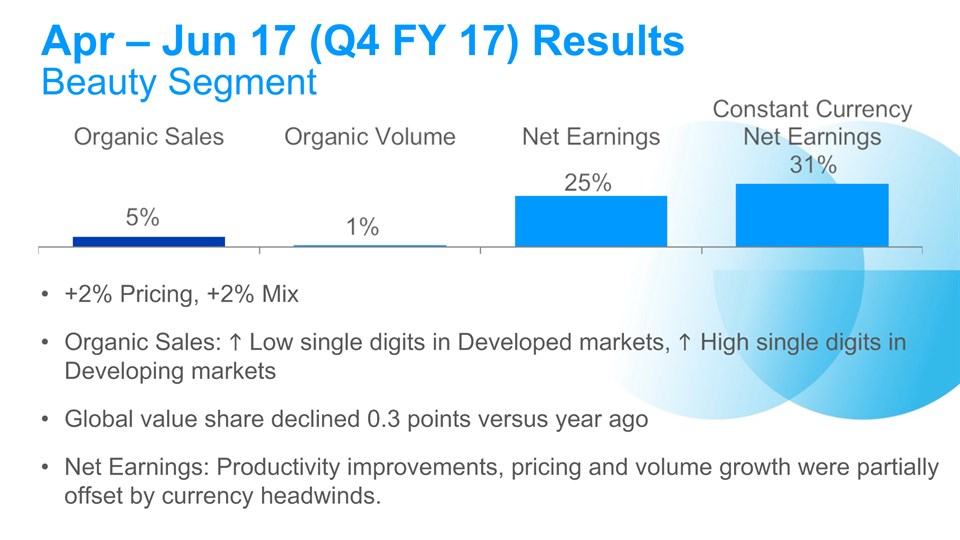
* +2% Pricing, +2% MixOrganic Sales: h Low single digits in Developed markets, h High single digits in Developing marketsGlobal value share declined 0.3 points versus year agoNet Earnings: Productivity improvements, pricing and volume growth were partially offset by currency headwinds. Apr – Jun 17 (Q4 FY 17) ResultsBeauty Segment
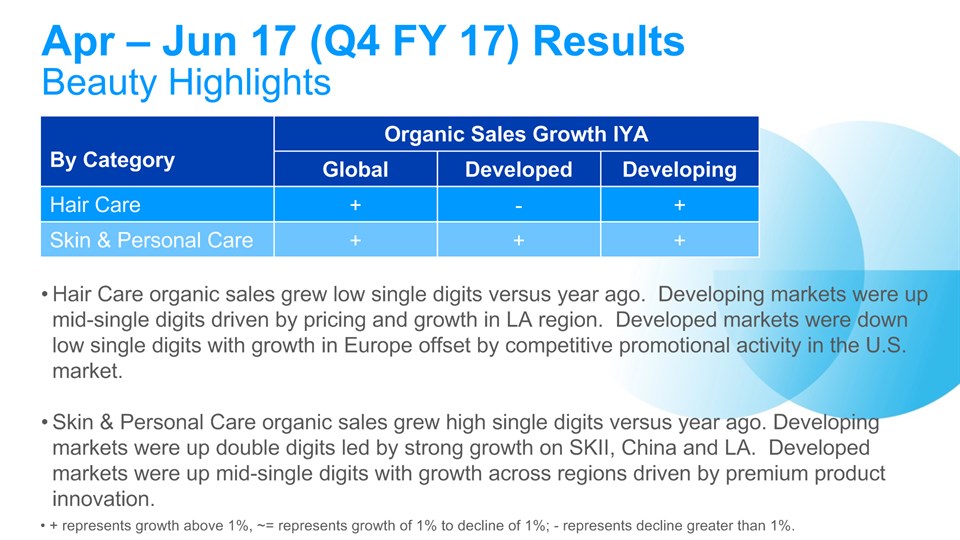
* Hair Care organic sales grew low single digits versus year ago. Developing markets were up mid-single digits driven by pricing and growth in LA region. Developed markets were down low single digits with growth in Europe offset by competitive promotional activity in the U.S. market.Skin & Personal Care organic sales grew high single digits versus year ago. Developing markets were up double digits led by strong growth on SKII, China and LA. Developed markets were up mid-single digits with growth across regions driven by premium product innovation. By Category Organic Sales Growth IYA Organic Sales Growth IYA Organic Sales Growth IYA By Category Global Developed Developing Hair Care + - + Skin & Personal Care + + + + represents growth above 1%, ~= represents growth of 1% to decline of 1%; - represents decline greater than 1%. Apr – Jun 17 (Q4 FY 17) ResultsBeauty Highlights
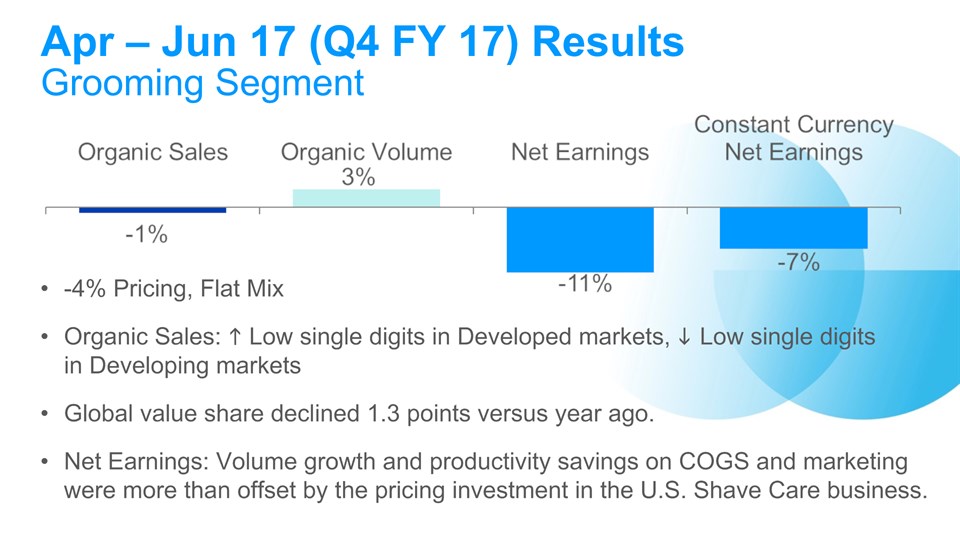
* -4% Pricing, Flat Mix Organic Sales: h Low single digits in Developed markets, i Low single digits in Developing marketsGlobal value share declined 1.3 points versus year ago. Net Earnings: Volume growth and productivity savings on COGS and marketing were more than offset by the pricing investment in the U.S. Shave Care business. Apr – Jun 17 (Q4 FY 17) ResultsGrooming Segment
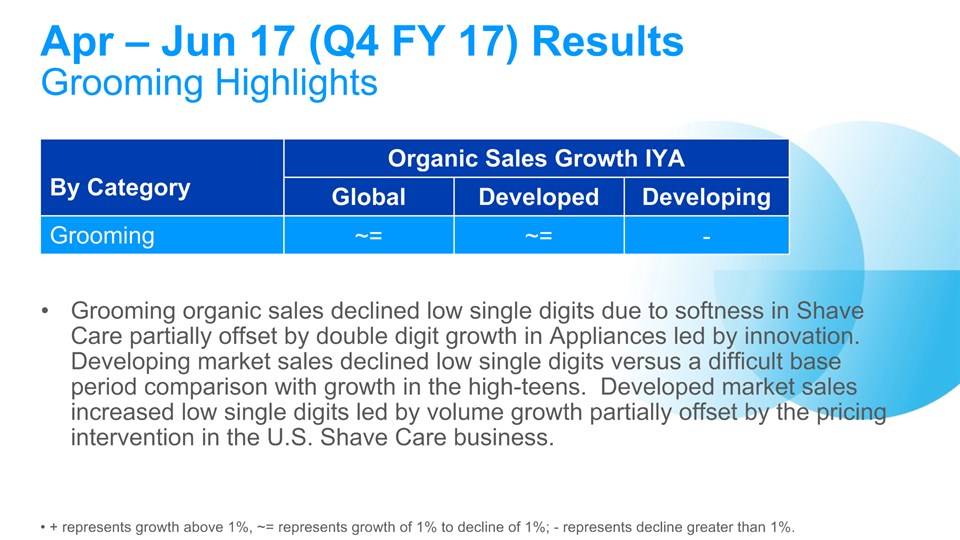
* Grooming organic sales declined low single digits due to softness in Shave Care partially offset by double digit growth in Appliances led by innovation. Developing market sales declined low single digits versus a difficult base period comparison with growth in the high-teens. Developed market sales increased low single digits led by volume growth partially offset by the pricing intervention in the U.S. Shave Care business. By Category Organic Sales Growth IYA Organic Sales Growth IYA Organic Sales Growth IYA By Category Global Developed Developing Grooming ~= ~= - Apr – Jun 17 (Q4 FY 17) ResultsGrooming Highlights + represents growth above 1%, ~= represents growth of 1% to decline of 1%; - represents decline greater than 1%.
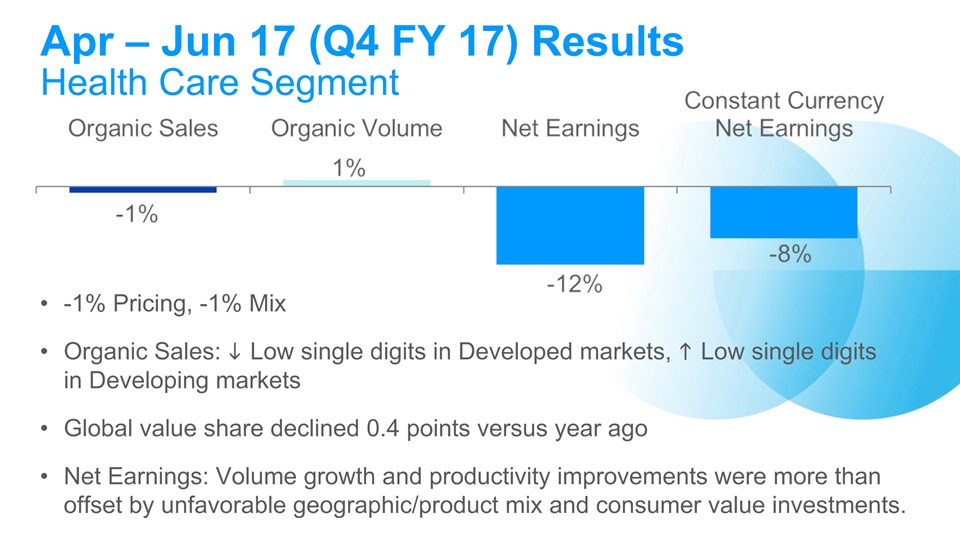
* -1% Pricing, -1% MixOrganic Sales: i Low single digits in Developed markets, h Low single digits in Developing marketsGlobal value share declined 0.4 points versus year agoNet Earnings: Volume growth and productivity improvements were more than offset by unfavorable geographic/product mix and consumer value investments. Apr – Jun 17 (Q4 FY 17) ResultsHealth Care Segment
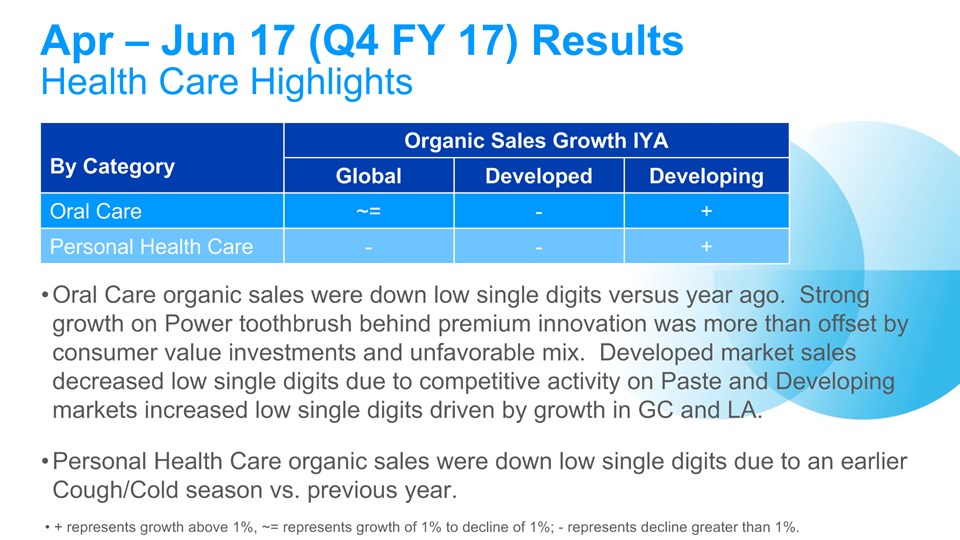
* Oral Care organic sales were down low single digits versus year ago. Strong growth on Power toothbrush behind premium innovation was more than offset by consumer value investments and unfavorable mix. Developed market sales decreased low single digits due to competitive activity on Paste and Developing markets increased low single digits driven by growth in GC and LA. Personal Health Care organic sales were down low single digits due to an earlier Cough/Cold season vs. previous year. By Category Organic Sales Growth IYA Organic Sales Growth IYA Organic Sales Growth IYA By Category Global Developed Developing Oral Care ~= - + Personal Health Care - - + + represents growth above 1%, ~= represents growth of 1% to decline of 1%; - represents decline greater than 1%. Apr – Jun 17 (Q4 FY 17) ResultsHealth Care Highlights
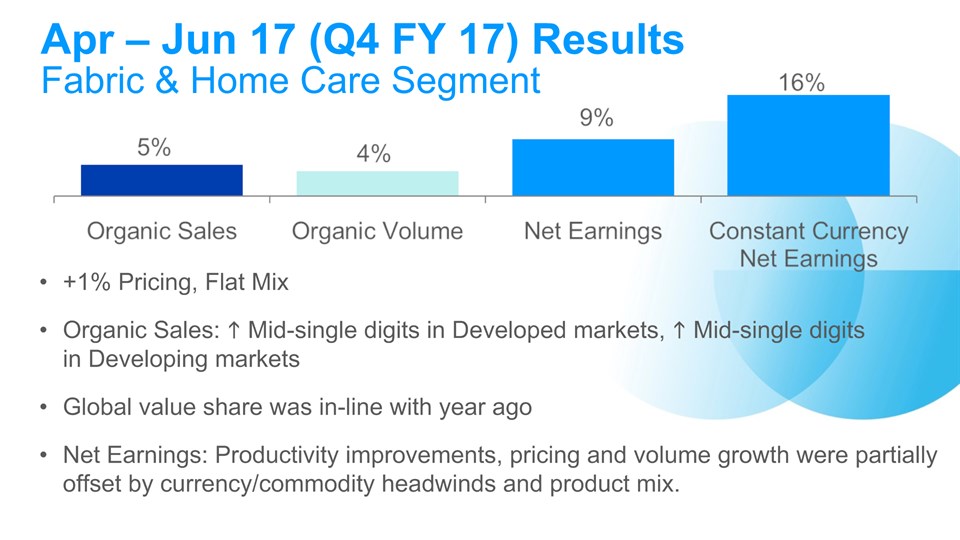
* +1% Pricing, Flat MixOrganic Sales: h Mid-single digits in Developed markets, h Mid-single digits in Developing marketsGlobal value share was in-line with year agoNet Earnings: Productivity improvements, pricing and volume growth were partially offset by currency/commodity headwinds and product mix. Apr – Jun 17 (Q4 FY 17) ResultsFabric & Home Care Segment
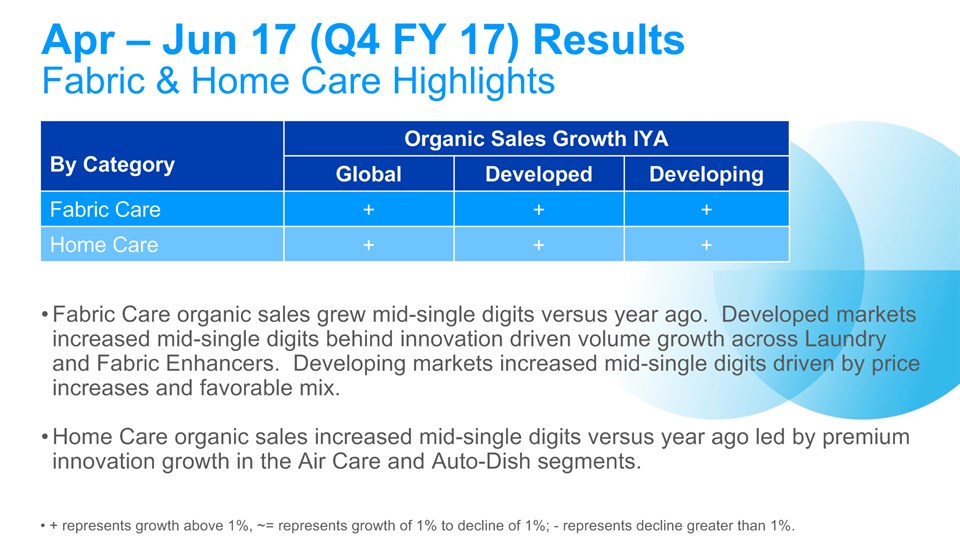
* Fabric Care organic sales grew mid-single digits versus year ago. Developed markets increased mid-single digits behind innovation driven volume growth across Laundry and Fabric Enhancers. Developing markets increased mid-single digits driven by price increases and favorable mix. Home Care organic sales increased mid-single digits versus year ago led by premium innovation growth in the Air Care and Auto-Dish segments. + represents growth above 1%, ~= represents growth of 1% to decline of 1%; - represents decline greater than 1%. By Category Organic Sales Growth IYA Organic Sales Growth IYA Organic Sales Growth IYA By Category Global Developed Developing Fabric Care + + + Home Care + + + Apr – Jun 17 (Q4 FY 17) ResultsFabric & Home Care Highlights
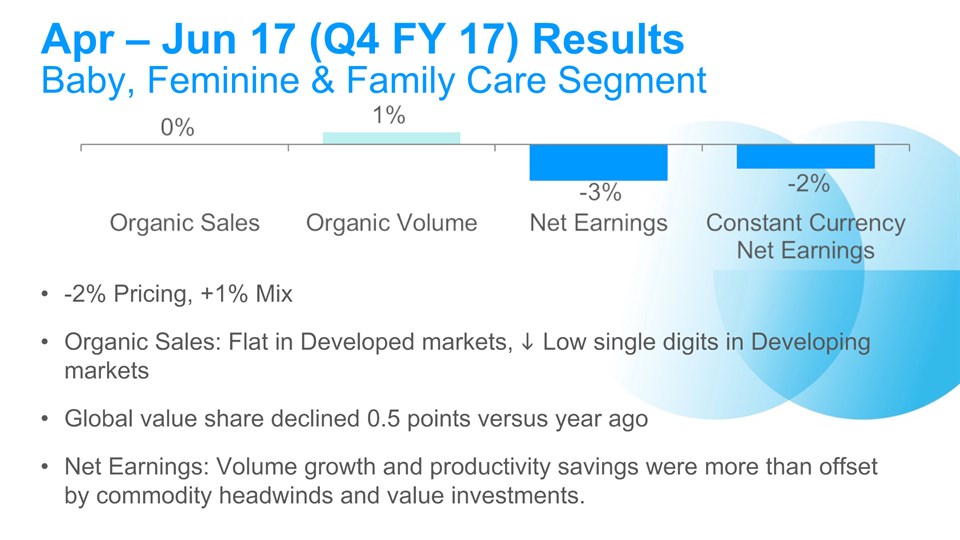
* -2% Pricing, +1% MixOrganic Sales: Flat in Developed markets, i Low single digits in Developing marketsGlobal value share declined 0.5 points versus year agoNet Earnings: Volume growth and productivity savings were more than offset by commodity headwinds and value investments. Apr – Jun 17 (Q4 FY 17) ResultsBaby, Feminine & Family Care Segment
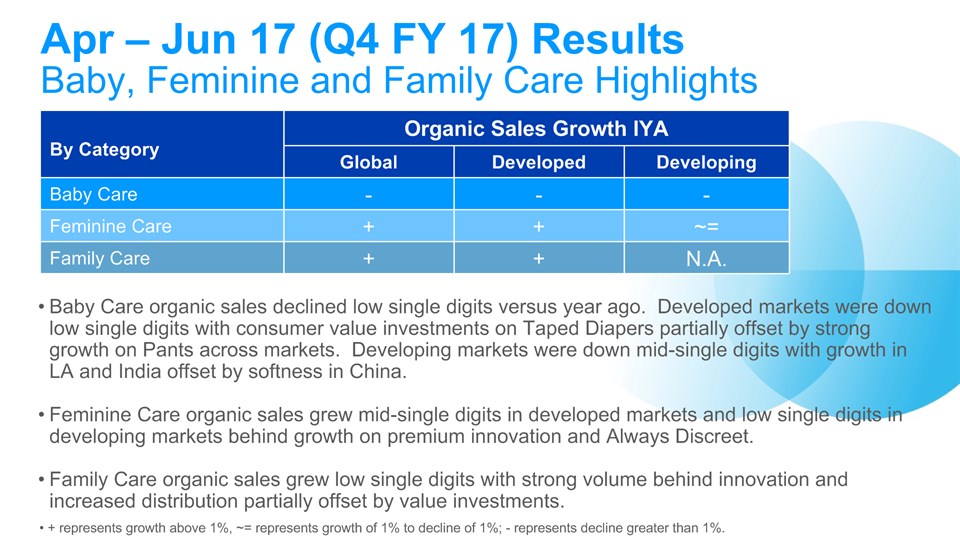
* Baby Care organic sales declined low single digits versus year ago. Developed markets were down low single digits with consumer value investments on Taped Diapers partially offset by strong growth on Pants across markets. Developing markets were down mid-single digits with growth in LA and India offset by softness in China.Feminine Care organic sales grew mid-single digits in developed markets and low single digits in developing markets behind growth on premium innovation and Always Discreet.Family Care organic sales grew low single digits with strong volume behind innovation and increased distribution partially offset by value investments. By Category Organic Sales Growth IYA Organic Sales Growth IYA Organic Sales Growth IYA By Category Global Developed Developing Baby Care - - - Feminine Care + + ~= Family Care + + N.A. + represents growth above 1%, ~= represents growth of 1% to decline of 1%; - represents decline greater than 1%. Apr – Jun 17 (Q4 FY 17) ResultsBaby, Feminine and Family Care Highlights

* FY 2018 Guidance
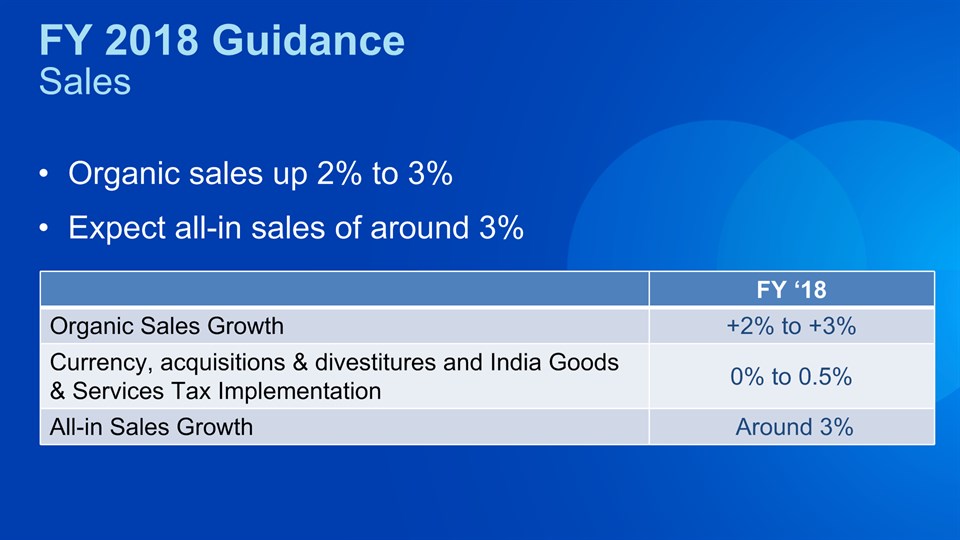
* FY ‘18 Organic Sales Growth +2% to +3% Currency, acquisitions & divestitures and India Goods & Services Tax Implementation 0% to 0.5% All-in Sales Growth Around 3% Organic sales up 2% to 3%Expect all-in sales of around 3% FY 2018 GuidanceSales
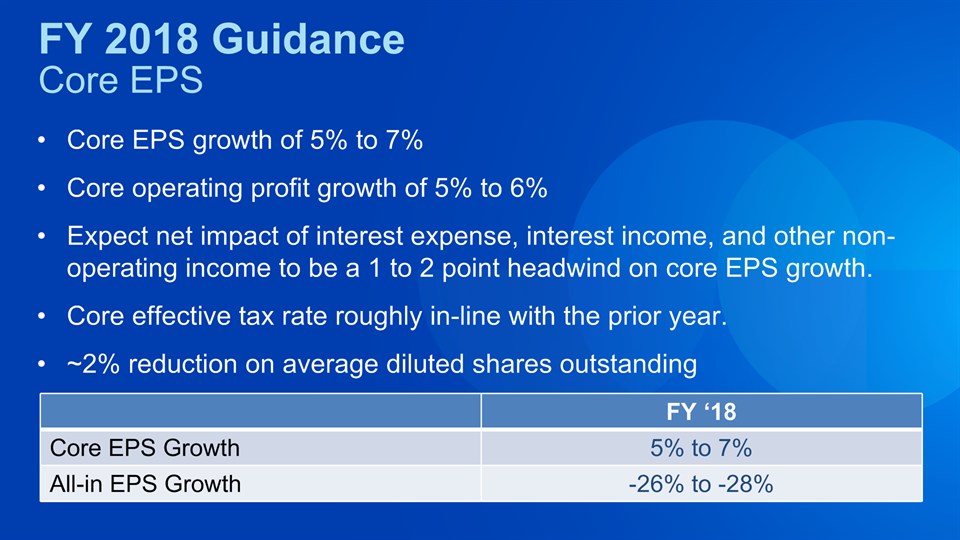
* FY ‘18 Core EPS Growth 5% to 7% All-in EPS Growth -26% to -28% Core EPS growth of 5% to 7%Core operating profit growth of 5% to 6%Expect net impact of interest expense, interest income, and other non-operating income to be a 1 to 2 point headwind on core EPS growth. Core effective tax rate roughly in-line with the prior year. ~2% reduction on average diluted shares outstanding FY 2018 GuidanceCore EPS

* Adjusted Free Cash Flow Productivity: 90%+Capital Spending, % Sales: 5% to 5.5%Dividends: ~$7.5BDirect Share Repurchase: $4 to $7B FY 2018 GuidanceCash Generation & Usage
* Significant deceleration of market growth rates Further political and economic volatilitySignificant foreign currency weaknessFurther commodity cost increases FY 2018 GuidancePotential Headwinds Not Included in Guidance

*
* Forward Looking Statements Certain statements in this release or presentation, other than purely historical information, including estimates, projections, statements relating to our business plans, objectives, and expected operating results, and the assumptions upon which those statements are based, are “forward-looking statements” within the meaning of the Private Securities Litigation Reform Act of 1995, Section 27A of the Securities Act of 1933 and Section 21E of the Securities Exchange Act of 1934. These forward-looking statements generally are identified by the words “believe,” “project,” “expect,” “anticipate,” “estimate,” “intend,” “strategy,” “future,” “opportunity,” “plan,” “may,” “should,” “will,” “would,” “will be,” “will continue,” “will likely result,” and similar expressions. Forward-looking statements are based on current expectations and assumptions, which are subject to risks and uncertainties that may cause results to differ materially from those expressed or implied in the forward-looking statements. We undertake no obligation to update or revise publicly any forward-looking statements, whether because of new information, future events or otherwise. Risks and uncertainties to which our forward-looking statements are subject include, without limitation: (1) the ability to successfully manage global financial risks, including foreign currency fluctuations, currency exchange or pricing controls and localized volatility; (2) the ability to successfully manage local, regional or global economic volatility, including reduced market growth rates, and to generate sufficient income and cash flow to allow the Company to affect the expected share repurchases and dividend payments; (3) the ability to manage disruptions in credit markets or changes to our credit rating; (4) the ability to maintain key manufacturing and supply arrangements (including sole supplier and sole manufacturing plant arrangements) and to manage disruption of business due to factors outside of our control, such as natural disasters and acts of war or terrorism; (5) the ability to successfully manage cost fluctuations and pressures, including commodity prices, raw materials, labor costs, energy costs and pension and health care costs; (6) the ability to stay on the leading edge of innovation, obtain necessary intellectual property protections and successfully respond to technological advances attained by, and patents granted to, competitors; (7) the ability to compete with our local and global competitors in new and existing sales channels, including by successfully responding to competitive factors such as prices, promotional incentives and trade terms for products; (8) the ability to manage and maintain key customer relationships; (9) the ability to protect our reputation and brand equity by successfully managing real or perceived issues, including concerns about safety, quality, ingredients, efficacy or similar matters that may arise; (10) the ability to successfully manage the financial, legal, reputational and operational risk associated with third party relationships, such as our suppliers, contractors and external business partners; (11) the ability to rely on and maintain key information technology systems and networks (including Company and third-party systems and networks) and maintain the security and functionality of such systems and networks and the data contained therein; (12) the ability to successfully manage regulatory and legal requirements and matters (including, without limitation, those laws and regulations involving product liability, intellectual property, antitrust, privacy, tax, accounting standards and environmental) and to resolve pending matters within current estimates; (13) the ability to manage changes in applicable tax laws and regulations; (14) the ability to successfully manage our portfolio optimization strategy, including achieving and maintaining our intended tax treatment of the related transactions, and our ongoing acquisition, divestiture and joint venture activities, in each case to achieve the Company’s overall business strategy and financial objectives, without impacting the delivery of base business objectives; (15) the ability to successfully achieve productivity improvements and cost savings and manage ongoing organizational changes, while successfully identifying, developing and retaining particularly key employees, especially in key growth markets where the availability of skilled or experienced employees may be limited; and (16) the ability to manage the uncertain implications of the United Kingdom’s withdrawal from the European Union. For additional information concerning factors that could cause actual results and events to differ materially from those projected herein, please refer to our most recent 10-K, 10-Q and 8-K reports.
The Procter & Gamble Company Regulation G Reconciliation of Non-GAAP Measures
In accordance with the SEC's Regulation G, the following provides definitions of the non-GAAP measures used in Procter & Gamble's July 27, 2017 earnings call, associated slides, and other materials and the reconciliation to the most closely related GAAP measure. We believe that these measures provide useful perspective on underlying business trends (i.e. trends excluding non-recurring or unusual items) and results and provide a supplemental measure of year-on-year results. The non-GAAP measures described below are used by Management in making operating decisions, allocating financial resources and for business strategy purposes. These measures may be useful to investors as they provide supplemental information about business performance and provide investors a view of our business results through the eyes of Management. These measures are also used to evaluate senior management and are a factor in determining their at-risk compensation. These non-GAAP measures are not intended to be considered by the user in place of the related GAAP measure, but rather as supplemental information to our business results. These non-GAAP measures may not be the same as similar measures used by other companies due to possible differences in method and in the items or events being adjusted.
The measures provided are as follows:
| 1. | Organic sales growth — page 3 |
| 2. | Core EPS and currency-neutral Core EPS — pages 4-5 |
| 3. | Core after tax margin — page 6 |
| 4. | Core operating profit margin and constant currency Core operating profit margin — page 6 |
| 5. | Core gross margin and constant currency Core gross margin — page 6 |
| 6. | Core SG&A margin – page 7 |
| 7. | Core effective tax rate — page 7 |
| 8. | Adjusted free cash flow — page 7 |
| 9. | Adjusted free cash flow productivity – page 7 |
The Core earnings measures included in the following reconciliation tables refer to the equivalent GAAP measures adjusted as applicable for the following items:
| • | Incremental restructuring: The Company has had and continues to have an ongoing level of restructuring activities. Such activities have resulted in ongoing annual restructuring related charges of approximately $250 - $500 million before tax. Beginning in 2012 Procter & Gamble began a $10 billion strategic productivity and cost savings initiative that includes incremental restructuring activities. In 2017, the company announced elements of an additional multi-year productivity and cost savings plan. These plans result in incremental restructuring charges to accelerate productivity efforts and cost savings. The adjustment to Core earnings includes only the restructuring costs above what we believe are the normal recurring level of restructuring costs. |
| • | Early debt extinguishment charges: During the three months ended December 31, 2016, the Company recorded a charge of $345 million after tax due to the early extinguishment of certain long-term debt. This charge represents the difference between the reacquisition price and the par value of the debt extinguished. Management does not view this charge as indicative of the Company's operating performance or underlying business results. |
| • | Venezuela deconsolidation charge: For accounting purposes, evolving conditions resulted in a lack of control over our Venezuelan subsidiaries. Therefore, in accordance with the applicable accounting standards for consolidation, effective June 30, 2015, we deconsolidated our Venezuelan subsidiaries and began accounting for our investment in those subsidiaries using the cost method of accounting. The charge was incurred to write off our net assets related to Venezuela. |
| • | Charges for certain European legal matters: Several countries in Europe issued separate complaints alleging that the Company, along with several other companies, engaged in violations of competition laws in prior periods. The Company established Legal Reserves related to these charges. Management does not view these charges as indicative of underlying business results. |
| • | Venezuela B/S remeasurement & devaluation impacts: Venezuela is a highly inflationary economy under U.S. GAAP. Prior to deconsolidation, the government enacted episodic changes to currency exchange mechanisms and rates, which resulted in currency remeasurement charges for non-dollar denominated monetary assets and liabilities held by our Venezuelan subsidiaries. |
| • | Non-cash impairment charges: During fiscal years 2013 and 2012 the Company incurred impairment charges related to the carrying value of goodwill and indefinite lived intangible assets in our Appliances and Salon Professional businesses. |
| • | Gain on Iberian JV buyout: During fiscal year 2013 we incurred a holding gain on the purchase of the balance of our Iberian joint venture from our joint venture partner. |
We do not view the above items to be part of our sustainable results, and their exclusion from core earnings measures provides a more comparable measure of year-on-year results.
Organic sales growth: Organic sales growth is a non-GAAP measure of sales growth excluding the impacts of acquisitions, divestitures and foreign exchange from year-over-year comparisons. Managements believes this measure provides investors with a supplemental understanding of underlying sales trends by providing sales growth on a consistent basis, and this measure is used in assessing achievement of management goals for at-risk compensation.
Core EPS and currency-neutral Core EPS: Core earnings per share, or Core EPS, is a measure of the Company's diluted net earnings per share from continuing operations adjusted as indicated. Currency-neutral Core EPS is a measure of the Company's Core EPS excluding the incremental current year impact of foreign exchange. Management views these non-GAAP measures as a useful supplemental measure of Company performance over time.
Core operating profit margin and currency-neutral Core operating profit margin: Core operating profit margin is a measure of the Company's operating margin adjusted for items as indicated. Currency-neutral Core operating profit margin is a measure of the Company's Core operating profit margin excluding the incremental current year impact of foreign exchange. Management believes these non-GAAP measures provide a supplemental perspective to the Company's operating efficiency over time.
Core gross margin and currency-neutral Core gross margin: Core gross margin is a measure of the Company's gross margin adjusted for items as indicated. Currency-neutral Core gross margin is a measure of the Company's Core gross margin excluding the incremental current year impact of foreign exchange. Management believes these non-GAAP measures provide a supplemental perspective to the Company's operating efficiency over time.
Core effective tax rate: Core effective tax rate is a measure of the Company's effective tax rate adjusted for items as indicated. Management believes this non-GAAP measure provides a supplemental perspective to the Company's operating efficiency over time.
Adjusted free cash flow: Adjusted free cash flow is defined as operating cash flow less capital spending and excluding tax payments related to the Beauty Brands divestiture, which are non-recurring and not considered indicative of underlying cash flow performance. Adjusted free cash flow represents the cash that the Company is able to generate after taking into account planned maintenance and asset expansion. Management views adjusted free cash flow as an important measure because it is one factor used in determining the amount of cash available for dividends and discretionary investment.
Adjusted free cash flow productivity: Adjusted free cash flow productivity is defined as the ratio of adjusted free cash flow to net earnings excluding the loss on early debt extinguishment and gain on the sale of the Beauty Brands, which are non-recurring and not considered indicative of underlying earnings performance. Management views adjusted free cash flow productivity as a useful measure to help investors understand P&G's ability to generate cash. Adjusted free cash flow productivity is used by management in making operating decisions, allocating financial resources and for budget planning purposes. The Company's long-term target is to generate annual adjusted free cash flow productivity at or above 90 percent.
1. Organic sales growth:
Three Months Ended June 30, 2017 | Net Sales Growth | Foreign Exchange Impact | Acquisition/ Divestiture Impact* | Organic Sales Growth | |||
| Beauty | 2% | 2% | 1% | 5% | |||
| Grooming | (2)% | 2% | (1)% | (1)% | |||
| Health Care | (4)% | 2% | 1% | (1)% | |||
| Fabric Care & Home Care | 2% | 3% | -% | 5% | |||
| Baby, Feminine & Family Care | (2)% | 1% | 1% | -% | |||
| Total P&G | -% | 2% | -% | 2% |
*Acquisition/Divestiture Impact includes mix impacts of acquired and divested businesses and rounding impacts necessary to reconcile net sales to organic sales.
Prior Periods
| Total Company | Net Sales Growth | Foreign Exchange Impact | Acquisition/ Divestiture Impact* | Organic Sales Growth | ||||
| AMJ 2016 | (3)% | 3% | 2% | 2% | ||||
| JAS 2016 | -% | 3% | -% | 3% | ||||
| OND 2016 | -% | 2% | -% | 2% | ||||
| JFM 2017 | (1)% | 2% | -% | 1% | ||||
| FY 2015 | (5)% | 6% | 1% | 2% | ||||
| FY 2016 | (8)% | 6% | 3% | 1% | ||||
| FY 2017 | --% | 2% | -% | 2% | ||||
*Acquisition/Divestiture Impact includes mix impacts of acquired and divested businesses and rounding impacts necessary to reconcile net sales to organic sales.
Guidance
| Total Company | Net Sales Growth | Combined Foreign Exchange & Acquisition/Divestiture Impact | Organic Sales Growth | |||
FY 2018 Estimate | About 3% | (0.5)% to 0% | +2% to +3% |
2. Core EPS and currency-neutral Core EPS:
Three Months Ended June 30 | |||
| 2017 | 2016 | ||
| Diluted Net Earnings Per Share from Continuing Operations | $0.82 | $0.71 | |
| Incremental Restructuring | 0.02 | 0.08 | |
| Rounding | 0.01 | - | |
| Core EPS | $0.85 | $0.79 | |
| Percentage change vs. prior period | 8% | ||
| Currency Impact to Earnings | - | ||
| Currency-Neutral Core EPS | $0.85 | ||
| Percentage change vs. prior period Core EPS | 8% | ||
Twelve Months Ended June 30 | |||
| 2017 | 2016 | ||
| Diluted Net Earnings Per Share from Continuing Operations | $3.69 | $3.49 | |
| Incremental Restructuring | 0.10 | 0.18 | |
| Early Debt Extinguishment Charges | 0.13 | - | |
| Core EPS | $3.92 | $3.67 | |
| Percentage change vs. prior period | 7% | ||
| Currency Impact to Earnings | 0.15 | ||
| Currency-Neutral Core EPS | $4.07 | ||
| Percentage change vs. prior period Core EPS | 11% | ||
Note – All reconciling items are presented net of tax. Tax effects are calculated consistent with the nature of the underlying transaction.
Guidance
| Total Company | Diluted EPS Growth | Impact of Incremental Non-Core Items* | Core EPS Growth | |
| FY 2018 (Estimate) | (26%) to (28%) | Approximately 33% | +5% to +7% |
* Includes change in discontinued operations (includes gain on sale of Beauty Brands)
Prior Quarters
| AMJ 16 | AMJ 15 | JAS 16 | JAS 15 | OND 16 | OND 15 | JFM 17 | JFM 16 | |
| Diluted Net Earnings Per Share from Continuing Operations, attributable to P&G | $ 0.71 | $ 0.17 | $ 1.00 | $ 0.96 | $ 0.93 | $ 1.01 | $ 0.93 | $ 0.81 |
| Incremental Restructuring | 0.08 | 0.06 | 0.03 | 0.02 | 0.03 | 0.03 | 0.03 | 0.04 |
| Early Debt Extinguishment Charges | - | - | - | - | 0.13 | - | - | - |
| Charges for Pending European Legal Matters | - | (0.01) | - | - | - | - | - | - |
| Venezuela Deconsolidation Charge | - | 0.71 | - | - | - | - | - | - |
| Rounding | - | - | - | - | (0.01) | - | - | 0.01 |
| Core EPS | $ 0.79 | $ 0.93 | $ 1.03 | $ 0.98 | $ 1.08 | $ 1.04 | $ 0.96 | $ 0.86 |
| Percentage change vs. prior period | (15)% | 5% | 4% | 12% | ||||
| Currency Impact to Earnings | 0.07 | 0.07 | 0.05 | 0.03 | ||||
| Currency-Neutral Core EPS | $ 0.86 | $ 1.10 | $ 1.13 | $ 0.99 | ||||
| Percentage change vs. prior period Core EPS | (8)% | 12% | 9% | 15% |
Prior Years
| FY 12 | FY 13 | FY 14 | FY 15 | FY 16 | |
| Diluted Net Earnings Per Share from Continuing Operations, attributable to P&G | $2.97 | $3.50 | $3.63 | $2.84 | $3.49 |
| Incremental Restructuring | 0.15 | 0.14 | 0.11 | 0.17 | 0.18 |
| Venezuela B/S Remeasurement & Devaluation Impacts | - | 0.08 | 0.09 | 0.04 | - |
| Charges for Certain European Legal Matters | 0.03 | 0.05 | 0.02 | 0.01 | - |
| Venezuela Deconsolidation Charge | - | - | - | 0.71 | - |
| Non-Cash Impairment Charges | 0.31 | 0.10 | - | - | - |
| Gain on Iberian JV Buyout | - | (0.21) | - | - | - |
| Rounding | (0.01) | (0.01) | (0.01) | - | |
| Core EPS | $3.45 | $3.65 | $3.85 | $3.76 | $3.67 |
Percentage change vs. prior year Core EPS | 6% | 5% | (2)% | (2)% | |
Currency Impact to Earnings | 0.15 | 0.32 | 0.52 | 0.35 | |
| Currency-Neutral Core EPS | $3.80 | $4.17 | $4.28 | $4.02 | |
Percentage change vs. prior year Core EPS | 10% | 14% | 11% | 7% | |
3. Core after tax margin:
| Net Earnings Margin | Discontinued Operations | Incremental Restructuring | Early Debt Extinguishment Charges | Core After Tax Margin | |
| FY 2017 | 23.6% | (8.0%) | 0.4% | 0.5% | 16.5% |
4. Core operating profit margin:
| FY 12 | FY 13 | FY 14 | FY 15 | FY 16 | FY 17 | AMJ 16 | AMJ 17 | |
| Operating Profit Margin | 17.1% | 17.7% | 18.7% | 15.6% | 20.6% | 21.5% | 15.5% | 18.3% |
| Incremental Restructuring | 0.7% | 0.7% | 0.5% | 0.9% | 0.9% | 0.6% | 1.4% | 0.8% |
| Charges for Certain European Legal Matters | 0.1% | 0.2% | 0.1% | - | - | - | - | - |
| Venezuela B/S Remeasurement & Devaluation Impacts | - | 0.5% | 0.4% | 0.2% | - | - | - | - |
| Venezuela Deconsolidation Charge | - | - | - | 2.9% | - | - | - | - |
| Non-Cash Impairment | 1.2% | 0.4% | - | - | - | - | - | - |
| Rounding | 0.1% | (0.1)% | - | - | - | - | 0.1% | - |
| Core Operating Profit Margin | 19.2% | 19.4% | 19.7% | 19.6% | 21.5% | 22.1% | 17.0% | 19.1% |
| Basis point change vs. prior year Core margin | 20 | 30 | (10) | 190 | 60 | 210 | ||
| Currency Impact to Margin | 0.3% | 1.2% | 1.4% | 0.5% | 0.3% | (0.3)% | ||
| Constant Currency Core Operating Profit Margin | 19.7% | 20.9% | 21.0% | 22.0% | 22.4% | 18.8% | ||
| Basis point change vs. prior year Core margin | 50 | 150 | 130 | 240 | 90 | 180 |
5. Core gross margin:
| FY 12 | FY 13 | FY 14 | FY 15 | FY 16 | FY 17 | AMJ16 | AMJ 17 | |
| Gross Margin | 48.2% | 48.5% | 47.5% | 47.6% | 49.6% | 50.0% | 47.9% | 48.4% |
| Incremental Restructuring | 0.2% | 0.3% | 0.4% | 0.7% | 1.0% | 0.8% | 1.5% | 0.9% |
| Rounding | - | - | - | 0.1% | - | - | - | - |
| Core Gross Margin | 48.4% | 48.8% | 47.9% | 48.4% | 50.6% | 50.8% | 49.4% | 49.3% |
| Basis point change vs. prior year Core margin | 40 | (90) | 50 | 220 | 20 | (10) | ||
| Currency Impact to Margin | 0.1% | 1% | 0.4% | 0.7% | 0.4% | 0.2% | ||
| Constant Currency Core Gross Margin | 48.9% | 48.9% | 48.8% | 51.3% | 51.2% | 49.5% | ||
| Basis point change vs. prior year Core margin | 50 | 10 | 90 | 290 | 60 | 10 |
6. Core SG&A margin:
Three Months Ended June 30th | |||
| 2017 | 2016 | ||
| SG&A Margin | 30.0% | 32.4% | |
| Incremental Restructuring | 0.1% | - | |
| Rounding | 0.1% | - | |
| Core SG&A Margin | 30.2% | 32.4% | |
| Basis points change vs. prior period | (220) | ||
7. Core effective tax rate:
Twelve Months Ended June 30th | |||
| 2017 | 2016 | ||
| Effective Tax Rate | 23.1% | 25.0% | |
| Early Debt Extinguishment Charges | 0.5% | - | |
| Incremental Restructuring | 0.2% | (0.4)% | |
| Core Effective Tax Rate | 23.8 | 24.6% | |
| Basis points change vs. prior period | (80) | ||
8. Adjusted free cash flow:
| Three Months Ended June 30, 2017 | |||||
| Operating Cash Flow | Capital Spending | Free Cash Flow | Cash Tax Payment – Beauty Sale | Adjusted Free Cash Flow | |
| $3,688 | $(1,154) | $2,534 | $215 | $2,749 | |
| Twelve Months Ended June 30, 2017 | |||||
| Operating Cash Flow | Capital Spending | Free Cash Flow | Cash Tax Payment – Beauty Sale | Adjusted Free Cash Flow | |
| $12,753 | $(3,384) | $9,369 | $418 | $9,787 | |
9. Adjusted free cash flow productivity:
| Three Months Ended June 30, 2017 | ||||||
Adjusted Free Cash Flow | Net Earnings | Loss on Early Debt Extinguishment | Gain on Sale of Beauty Brands | Adjusted Net Earnings | Adjusted Free Cash Flow Productivity | |
| $2,749 | $2,202 | - | - | $2,202 | 125% | |
| Twelve Months Ended June 30, 2017 | ||||||
Adjusted Free Cash Flow | Net Earnings | Loss on Early Debt Extinguishment | Gain on Sale of Beauty Brands | Adjusted Net Earnings | Adjusted Free Cash Flow Productivity | |
| $9,787 | $15,411 | $345 | (5,335) | $10,421 | 94% | |