The Procter & Gamble Company Regulation G Reconciliation of Non-GAAP Measures
In accordance with the SEC's Regulation G, the following provides definitions of the non-GAAP measures used in Procter & Gamble's July 31, 2018 earnings call, associated slides, and other materials and the reconciliation to the most closely related GAAP measures. We believe that these measures provide useful perspective on underlying business trends (i.e. trends excluding non-recurring or unusual items) and provide a supplemental measure of year-on-year underlying results. The non-GAAP measures described below are used by Management in making operating decisions, allocating financial resources and for business strategy purposes. These measures may be useful to investors as they provide supplemental information about business performance and provide investors a view of our business results through the eyes of Management. Of these, certain measures are also used to evaluate senior management and are a factor in determining their at-risk compensation. These non-GAAP measures are not intended to be considered by the user in place of the related GAAP measure, but rather as supplemental information to our business results. These non-GAAP measures may not be the same as similar measures used by other companies due to possible differences in method and in the items or events being adjusted.
The measures provided are as follows:
| 1. | Organic sales growth — page 3 |
| 2. | Core EPS and currency-neutral Core EPS — pages 4-6 |
| 3. | Core after-tax profit margin – page 6 |
| 4. | Core operating profit margin and currency-neutral Core operating profit margin — page 7 |
| 5. | Core gross margin— page 7 |
| 6. | Core SG&A margin – page 7 |
| 7. | Free cash flow — page 8 |
| 8. | Adjusted free cash flow productivity – page 8 |
The Core earnings measures included in the following reconciliation tables refer to the equivalent GAAP measures adjusted as applicable for the following items:
| • | Incremental Restructuring: The Company has had and continues to have an ongoing level of restructuring activities. Such activities have resulted in ongoing annual restructuring related charges of approximately $250 - $500 million before tax. In 2012, the Company began a $10 billion strategic productivity and cost savings initiative that includes incremental restructuring activities. In 2017, we communicated details of an additional multi-year productivity and cost savings plan. This results in incremental restructuring charges to accelerate productivity efforts and cost savings. The adjustment to Core earnings includes only the restructuring costs above what we believe are the normal recurring level of restructuring costs. |
| • | Transitional Impact of U.S. Tax Reform: In December 2017, the U.S. government enacted comprehensive tax legislation commonly referred to as the Tax Cuts and Jobs Act (the "U.S. Tax Act"). This resulted in a net charge of $602 million for the fiscal year 2018. The adjustment to Core earnings only includes this transitional impact. It does not include the ongoing impacts of the lower U.S. statutory rate on current year earnings. |
| • | Early debt extinguishment charges: In fiscal 2018 and 2017, the Company recorded after-tax charges of $243 million and $345 million, respectively, due to the early extinguishment of certain long-term debt. These charges represent the difference between the reacquisition price and the par value of the debt extinguished. Management does not view this charge as indicative of the Company's operating performance or underlying business results. |
| • | Charges for Certain European legal matters: Several countries in Europe issued separate complaints alleging that the Company, along with several other companies, engaged in violations of competition laws in prior periods. In 2016, the Company incurred after-tax charges of $11 million to adjust legal reserves related to these matters. |
| • | Venezuela deconsolidation charges: For accounting purposes, evolving conditions resulted in a lack of control over our Venezuelan subsidiaries. Therefore, in accordance with the applicable accounting standards for consolidation, effective June 30, 2015, we deconsolidated our Venezuelan subsidiaries and began accounting for our investment in those subsidiaries using the cost method of accounting. The charge was incurred to write off our net assets related to Venezuela. |
| • | Venezuela B/S remeasurement & devaluation impacts: Venezuela is a highly inflationary economy under U.S. GAAP. Prior to deconsolidation, the government enacted episodic changes to currency exchange mechanisms and rates, which resulted in currency remeasurement charges for non-dollar denominated monetary assets and liabilities held by our Venezuelan subsidiaries. |
| • | Non-cash impairment charges: During fiscal year 2013 the Company incurred impairment charges related to the carrying value goodwill and indefinite lived intangible assets in our Appliances business. |
We do not view these items to be part of our sustainable results and their exclusion from Core earnings measures provides a more comparable measure of year-on-year results. These items are also excluded when evaluating senior management in determining their at-risk compensation.
Organic sales growth*: Organic sales growth is a non-GAAP measure of sales growth excluding the impacts of acquisitions, divestitures, the impact from India Goods and Services Tax implementation (which were effective on July 1, 2017) and foreign exchange from year-over-year comparisons. Management believes this measure provides investors with a supplemental understanding of underlying sales trends by providing sales growth on a consistent basis.
Organic sales growth excluding Grooming and Baby Care impact to organic sales: Organic sales growth excluding Grooming and Baby Care impact to organic sales is a measure of the company's organic sales growth excluding the organic sales impact of the Grooming and Baby Care businesses. Management believes this measure provides investors with a supplemental understanding of underlying sales trends excluding the Grooming and Baby Care businesses, which are facing unique business challenges.
Core EPS and currency-neutral Core EPS*: Core earnings per share, or Core EPS, is a measure of the Company's diluted net earnings per share from continuing operations adjusted as indicated. Currency-neutral Core EPS is a measure of the Company's Core EPS excluding the incremental current year impact of foreign exchange.
Core operating profit margin and currency-neutral Core operating profit margin: Core operating profit margin is a measure of the Company's operating margin adjusted for items as indicated. Currency-neutral Core operating profit margin is a measure of the Company's Core operating profit margin excluding the incremental current year impact of foreign exchange.
Core gross margin: Core gross margin is a measure of the Company's gross margin adjusted for items as indicated.
Core selling, general and administrative (SG&A) expense as a percentage of net sales: Core SG&A expense as a percentage of net sales is a measure of the Company's selling, general and administrative expenses adjusted for items as indicated.
Core after tax profit margin: Core after tax profit margin is a measure of the Company's net earnings margin attributable to Procter & Gamble adjusted for items as indicated.
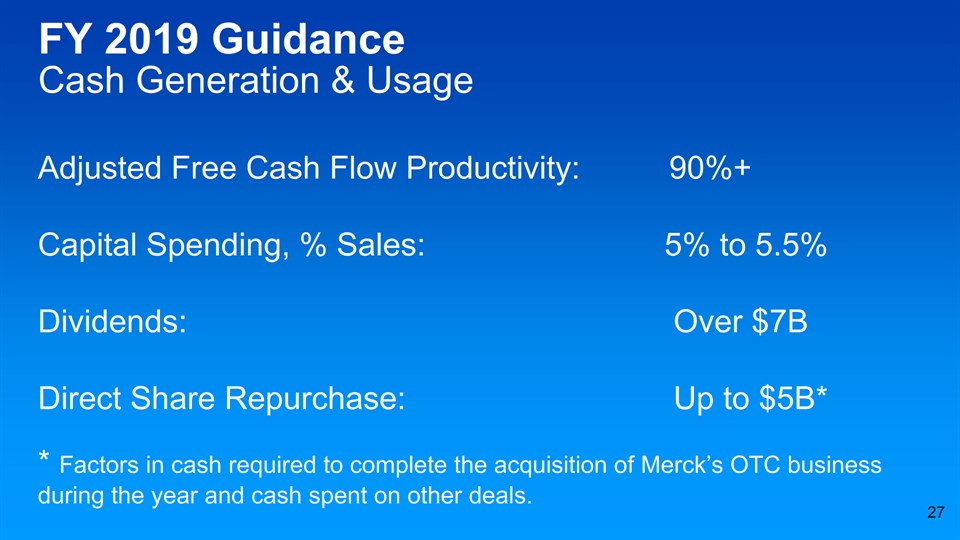
Free cash flow: Free cash flow is defined as operating cash flow less capital spending. Free cash flow represents the cash that the Company is able to generate after taking into account planned maintenance and asset expansion. Management views free cash flow as an important measure because it is one factor used in determining the amount of cash available for dividends and discretionary investment.
Adjusted free cash flow productivity*: Adjusted free cash flow productivity is defined as the ratio of free cash flow to net earnings excluding the transitional impact of U.S. Tax Reform and the loss on early debt extinguishment. The underlying charges are non-recurring and not considered indicative of underlying earnings performance. The subsequent payments of the U.S Tax Reform charge in future periods will also be excluded as they are not to be considered indicative of the underlying cash flow performance. Management views adjusted free cash flow productivity as a useful measure to help investors understand P&G's ability to generate cash. Adjusted free cash flow productivity is used by management in making operating decisions, allocating financial resources and for budget planning purposes. The Company's long-term target is to generate annual adjusted free cash flow productivity at or above 90 percent.
* Measure is used to evaluate senior management and is a factor in determining their at-risk compensation.
1. Organic sales growth:
Three Months Ended
June 30, 2018 | Net Sales Growth | | Foreign Exchange Impact | | Acquisition &
Divestiture Impact/Other (1) | | Organic Sales Growth |
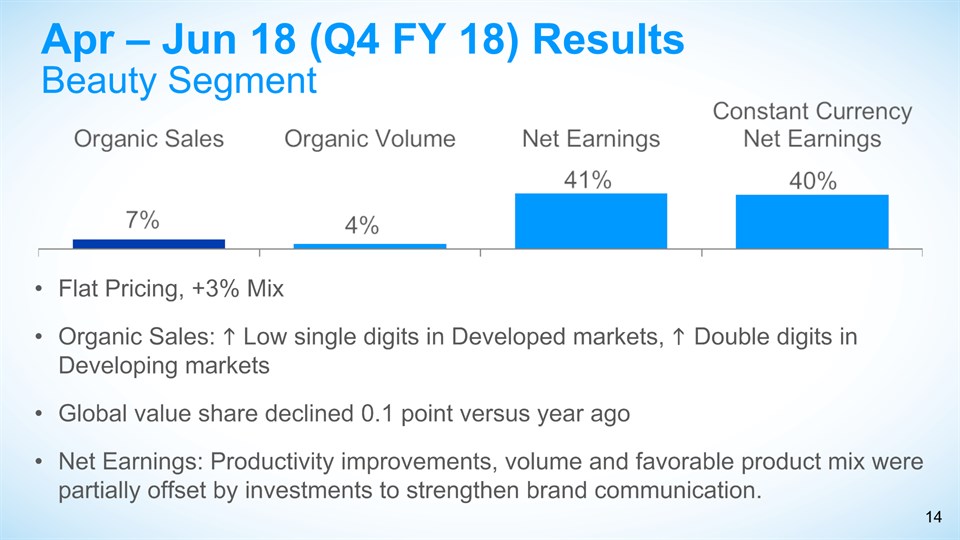
| Beauty | 10% | | (3)% | | -% | | 7% |
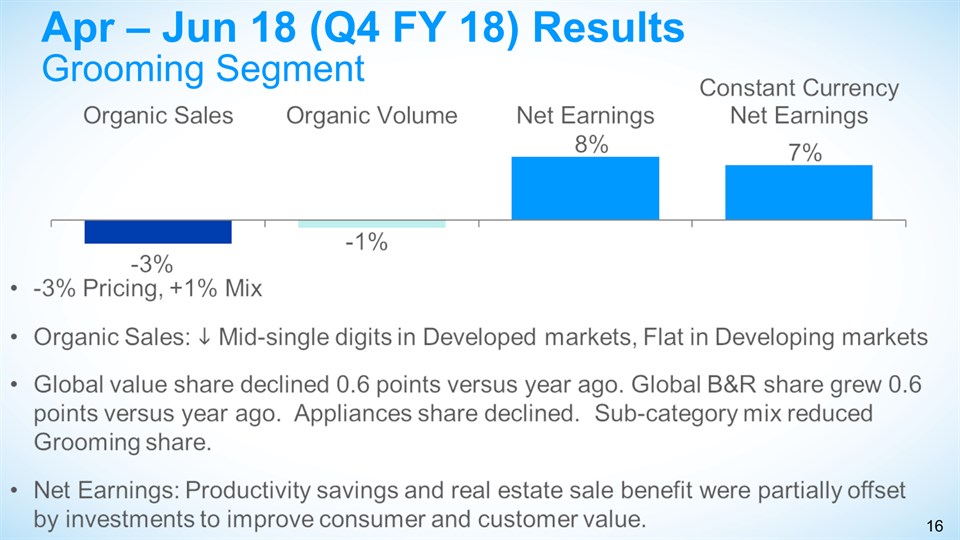
| Grooming | (1)% | | (2)% | | -% | | (3)% |
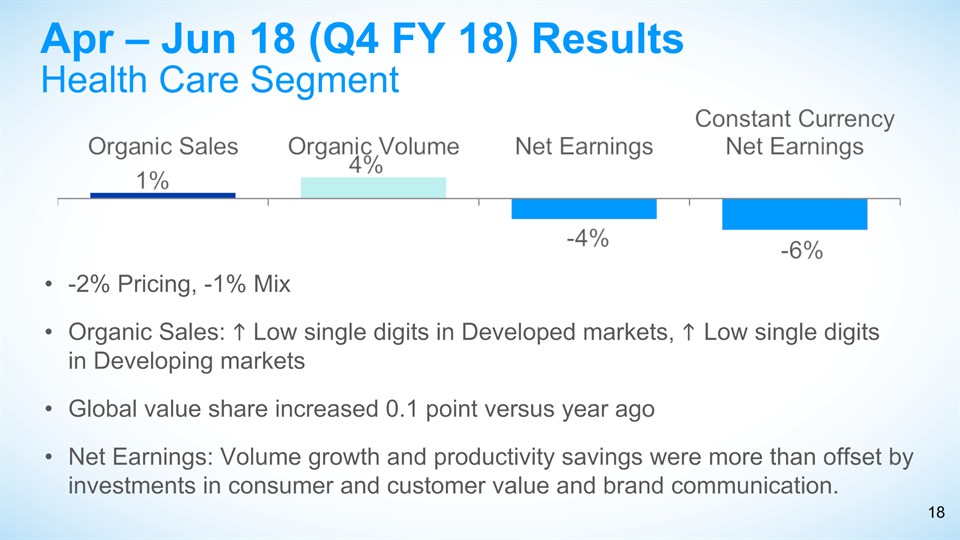
| Health Care | 4% | | (3)% | | -% | | 1% |
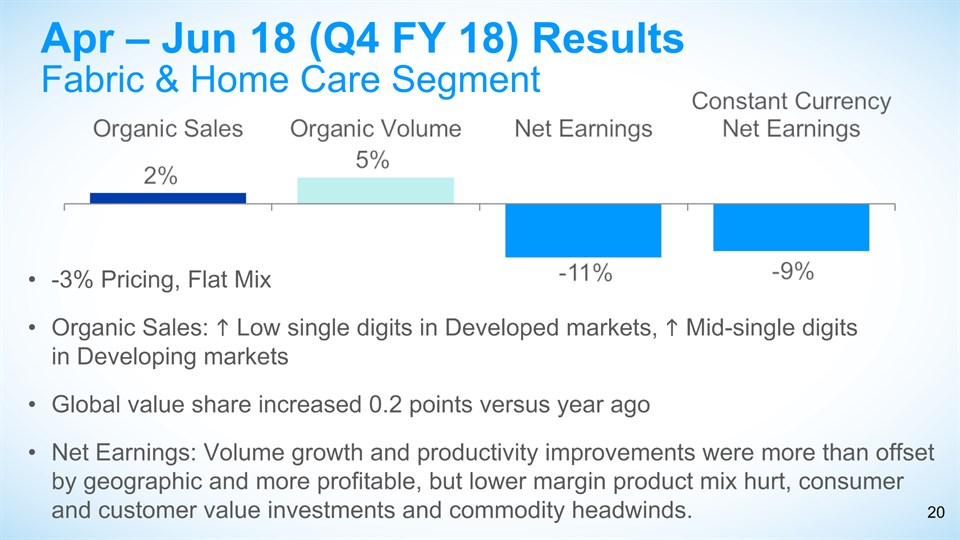
| Fabric Care & Home Care | 3% | | (2)% | | 1% | | 2% |
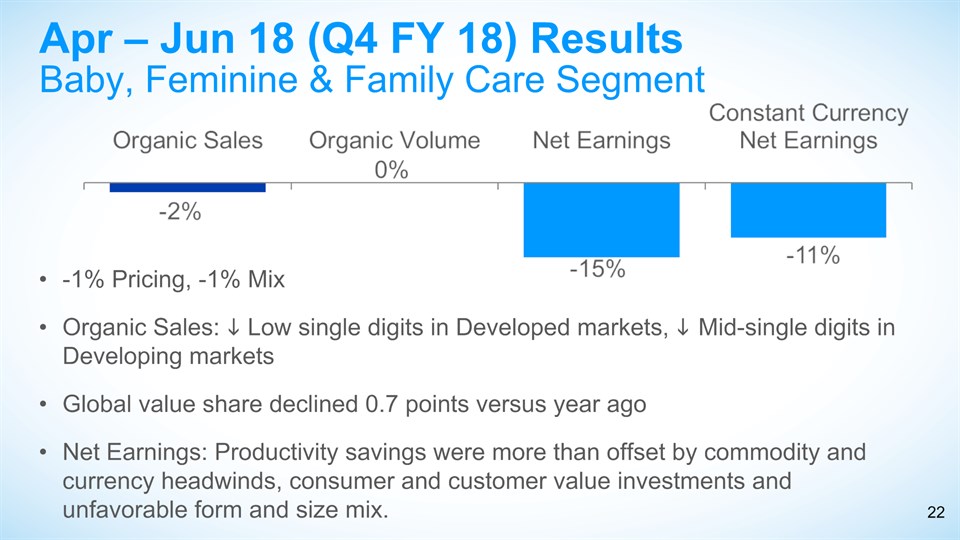
| Baby, Feminine & Family Care | (2)% | | (1)% | | 1% | | (2)% |
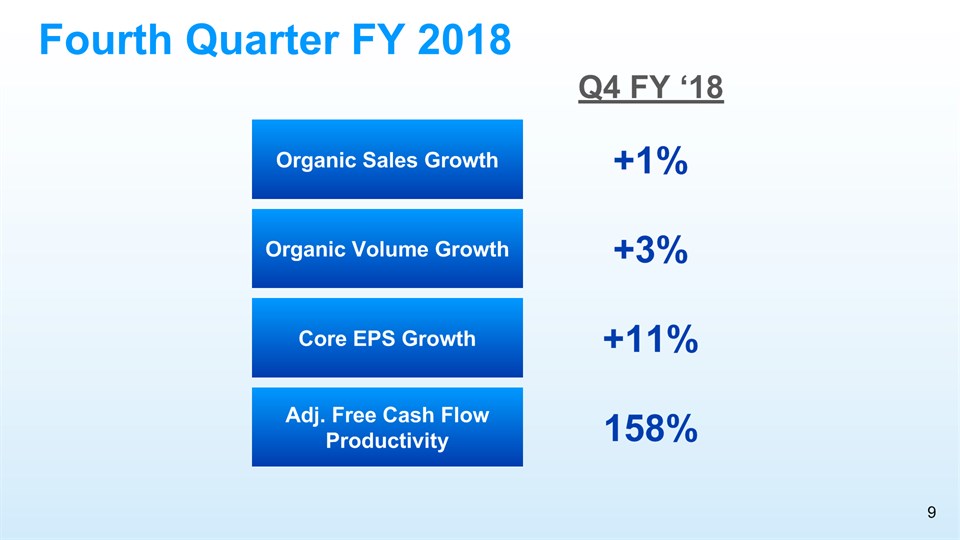
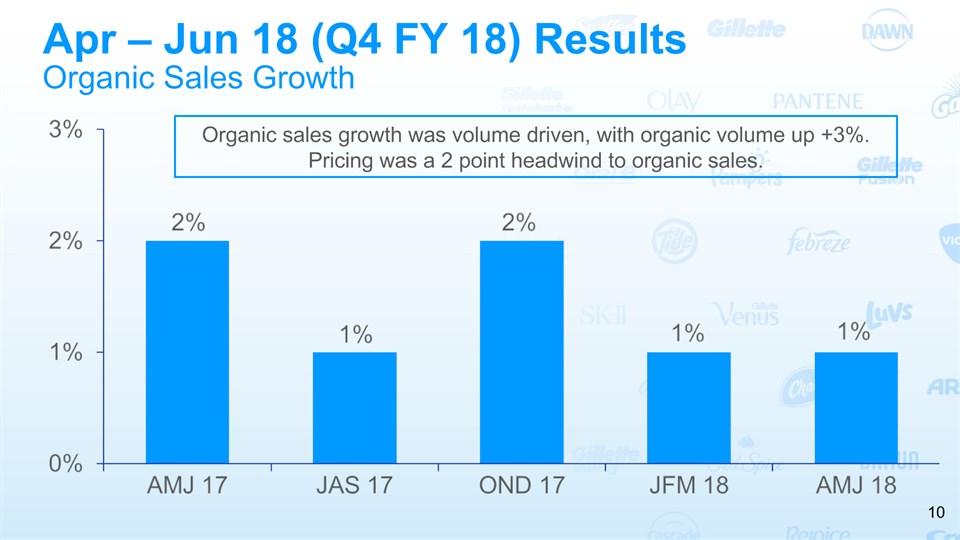
| Total P&G | 3% | | (2)% | | -% | | 1% |
(1) Acquisition & Divestiture Impact/Other includes the volume and mix impact of acquisitions and divestitures, the impact of India Goods and Services Tax implementation and rounding impacts necessary to reconcile net sales to organic sales.
| FY 2018 | Net Sales Growth | | Foreign Exchange Impact | | Acquisition &
Divestiture Impact/Other (1) | | Organic Sales Growth |
| Total P&G | 3% | | (2)% | | -% | | 1% |
(1) Acquisition & Divestiture Impact/Other includes the volume and mix impact of acquisitions and divestitures, the impact of India Goods and Services Tax implementation and rounding impacts necessary to reconcile net sales to organic sales.
Organic Sales Growth Excluding Grooming and Baby Care Impact to Organic Sales
| | Net Sales Growth | | Foreign Exchange Impact | | Acquisition &
Divestiture Impact/Other (1) | | Grooming and Baby Care Impact to Organic Sales | | Organic Sales Growth Excluding Grooming and Baby Care |
| FY 2018 | 3% | | (2)% | | -% | | 2% | | 3% |
(1) Acquisition & Divestiture Impact/Other includes the volume and mix impact of acquisitions and divestitures, the impact of India Goods and Services Tax implementation and rounding impacts necessary to reconcile net sales to organic sales.
Organic Sales
Prior Periods
Total Company | Net Sales Growth | | Foreign Exchange Impact | | Acquisition &
Divestiture Impact/Other (1) | | Organic Sales Growth |
| AMJ 2017 | -% | | 2% | | -% | | 2% |
| JAS 2017 | 1% | | -% | | -% | | 1% |
| OND 2017 | 3% | | (1)% | | -% | | 2% |
| JFM 2018 | 4% | | (4)% | | 1% | | 1% |
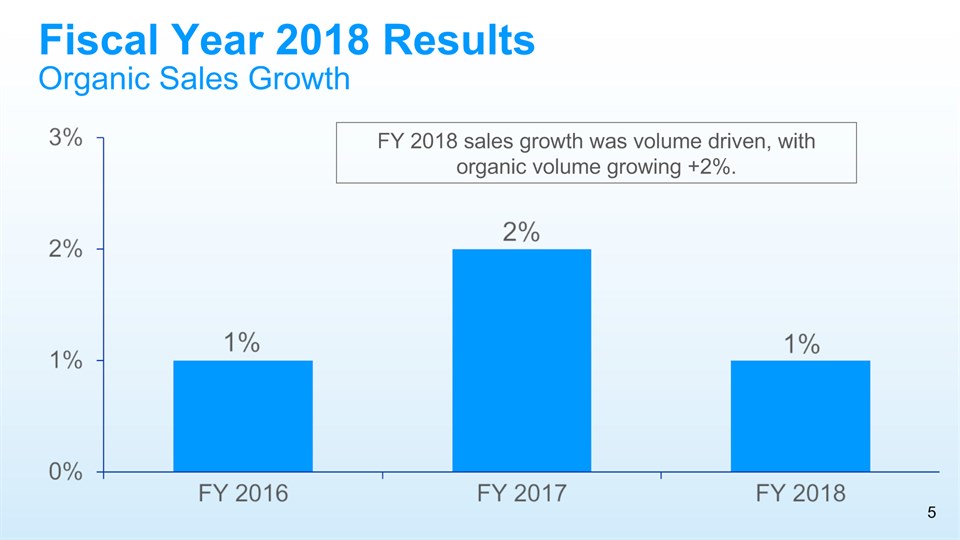
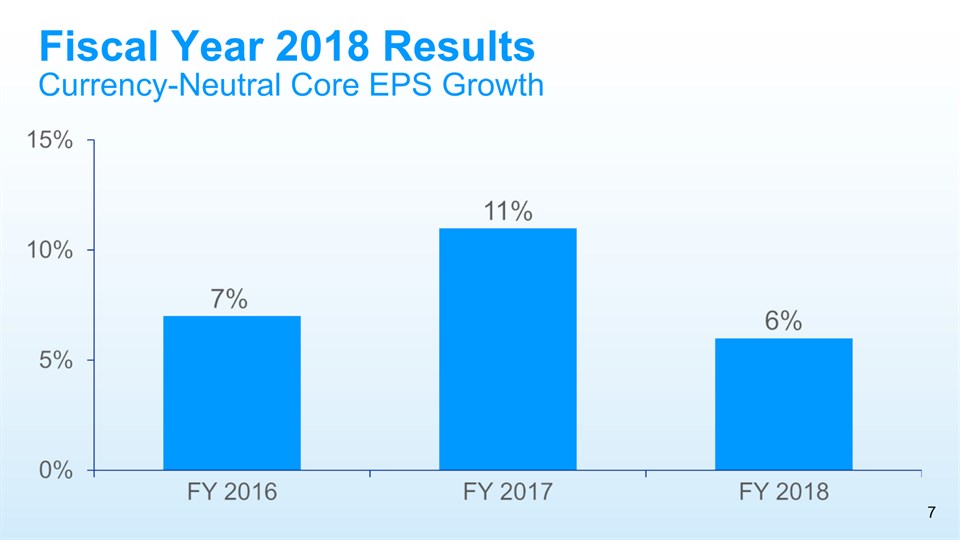
| FY 2016 | (8)% | | 6% | | 3% | | 1% |
| FY 2017 | -% | | 2% | | -% | | 2% |
| FY 2018 | 3% | | (2)% | | -% | | 1% |
(1) Acquisition & Divestiture Impact/Other includes the volume and mix impact of acquisitions and divestitures for all periods, the impact of India Goods and Services Tax implementation in FY 2018, the impact of Venezuela deconsolidation in FY 2016 and rounding impacts necessary to reconcile net sales to organic sales.
Organic Sales
Guidance
| Total Company | | Net Sales Growth | | Combined Foreign Exchange & Acquisition &
Divestiture Impact/Other (1) | | Organic Sales Growth |
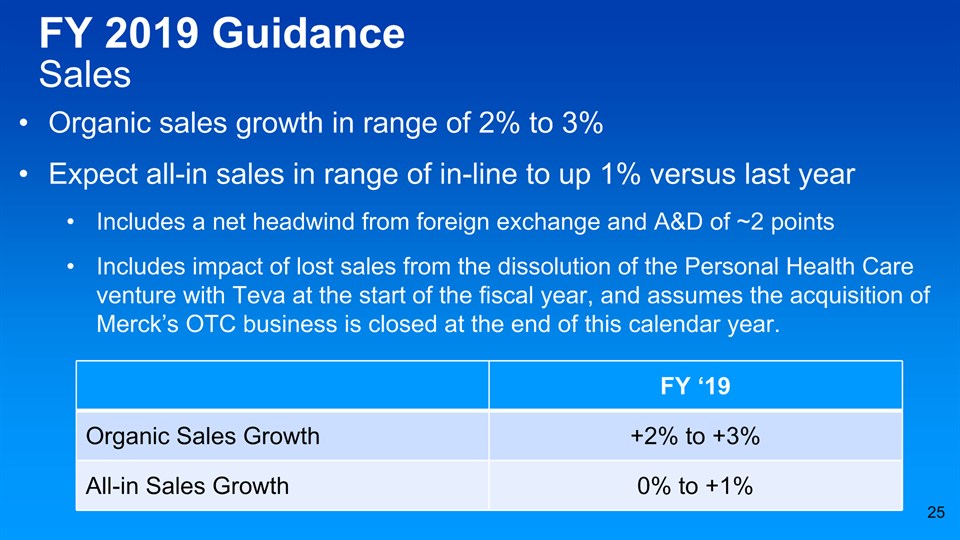
| FY 2019 (Estimate) | | -% to 1% | | About (2)% | | +2% to +3% |
(1) Acquisition & Divestiture Impact/Other includes the volume and mix impact of acquisitions and divestitures and rounding impacts necessary to reconcile net sales to organic sales.
2. Core EPS and currency-neutral Core EPS:
| | Three Months Ended
June 30 |
| | 2018 | | 2017 |
| Diluted Net Earnings Per Common Share | $0.72 | | $0.82 |
| Incremental Restructuring | 0.14 | | 0.02 |
| Early Debt Extinguishment | 0.09 | | - |
| Transitional Impact of U.S. Tax Reform | (0.02) | | - |
| Rounding | 0.01 | | 0.01 |
| Core EPS | $0.94 | | $0.85 |
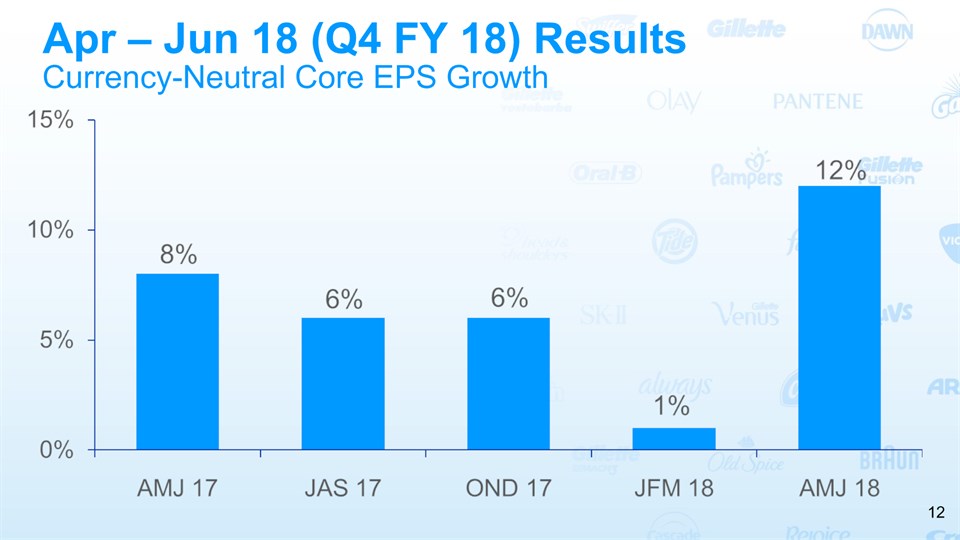
| Percentage change vs. prior period | 11% | | |
| Currency Impact to Earnings | 0.01 | | |
| Currency-Neutral Core EPS | $0.95 | | |
| Percentage change vs. prior period Core EPS | 12% | | |
| | | | |
| | | | |
| | Twelve Months Ended
June 30 |
| | 2018 | | 2017 |
| Diluted Net Earnings Per Common Share | $3.67 | | $5.59 |
| Discontinued Operations | - | | (1.90) |
| Incremental Restructuring | 0.23 | | 0.10 |
| Transitional Impact of U.S. Tax Reform | 0.23 | | - |
| Early Debt Extinguishment Charges | 0.09 | | 0.13 |
| Core EPS | $4.22 | | $3.92 |
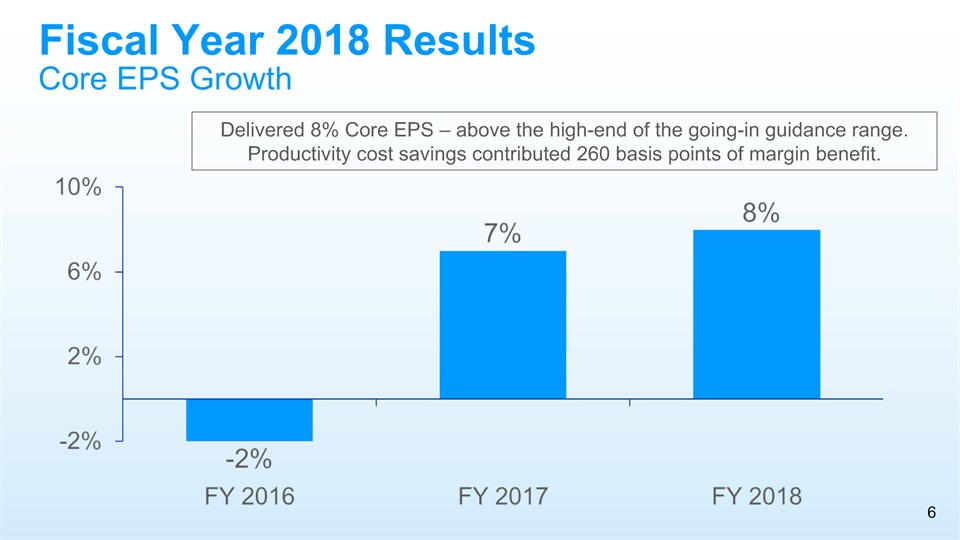
| Percentage change vs. prior period | 8% | | |
| Currency Impact to Earnings | (0.05) | | |
| Currency-Neutral Core EPS | $4.17 | | |
| Percentage change vs. prior period Core EPS | 6% | | |
| | | | |
Note – All reconciling items are presented net of tax. Tax effects are calculated consistent with the nature of the underlying transaction.
Guidance
| Total Company | Diluted EPS Growth | Impact of Incremental Non-Core Items* | Core EPS Growth |
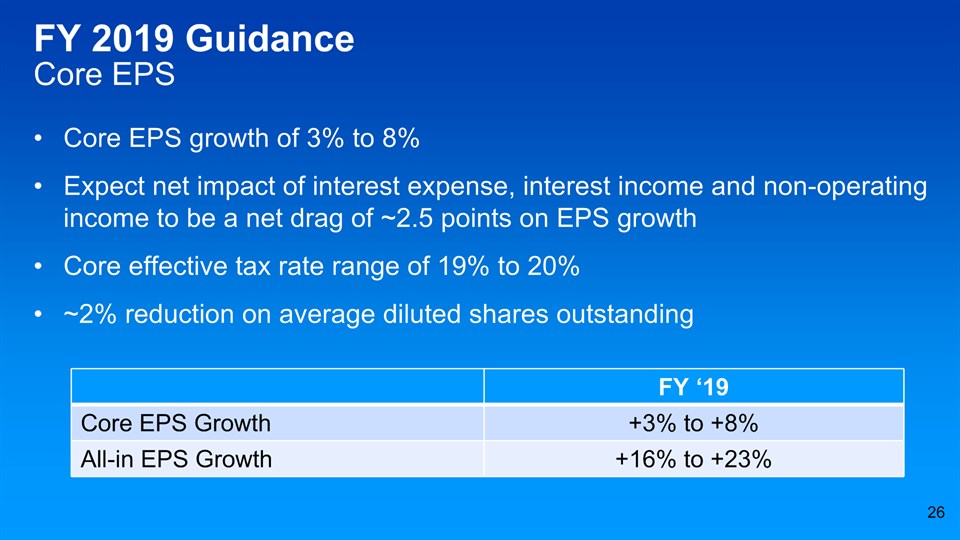
| FY 2019 (Estimate) | 16% to 23% | (13)% to (15)% | +3% to +8% |
* Includes impact of loss on early extinguishment of debt and impact of U.S. Tax Act in 2018, year over year changes in incremental non-core restructuring charges and gain on PGT Health Care joint venture dissolution in 2019.
| Total Company | Diluted EPS | Impact of Non-Core Items* | Core EPS |
| FY 2019 (Mid-point Estimate) | $4.38 | $0.07 | $4.45 |
*Includes impact of loss on early extinguishment of debt and impact of U.S. Tax Act in 2018, year over year changes in incremental non-core restructuring charges and gain on PGT Health Care joint venture dissolution in 2019.
Prior Quarters
| | AMJ 17 | AMJ 16 | JAS 17 | JAS 16 | OND 17 | OND 16 | JFM 18 | JFM 17 |
| Diluted Net Earnings Per Common Share | $0.82 | $0.69 | $1.06 | $0.96 | $0.93 | $2.88 | $0.95 | $0.93 |
| Discontinued Operations | - | 0.02 | - | 0.04 | - | (1.95) | - | - |
| Incremental Restructuring | 0.02 | 0.08 | 0.03 | 0.03 | 0.02 | 0.03 | 0.04 | 0.03 |
| Transitional Impact of U.S. Tax Reform | - | - | - | - | 0.24 | - | 0.01 | - |
| Early Debt Extinguishment Charges | - | - | - | - | - | 0.13 | - | - |
| Rounding | 0.01 | - | - | - | - | (0.01) | - | - |
Core EPS | $0.85 | $0.79 | $1.09 | $1.03 | $1.19 | $1.08 | $1.00 | $0.96 |
Percentage change vs. prior period | 8% | | 6% | | 10% | | 4% | |
| Currency Impact to Earnings | - | | - | | (0.04) | | (0.03) | |
Currency-Neutral Core EPS | $0.85 | | $1.09 | | $1.15 | | $0.97 | |
| Percentage change vs. prior period Core EPS | 8% | | 6% | | 6% | | 1% | |
Prior Years
| | | FY 15 | FY 16 | FY 17 |
| Diluted Net Earnings Per Common Share | | $2.44 | $3.69 | $5.59 |
| Discontinued Operations | | 0.40 | (0.20) | (1.90) |
| Incremental Restructuring | | 0.17 | 0.18 | 0.10 |
| Venezuela B/S Remeasurement & Devaluation Impacts | | 0.04 | - | - |
| Charges for Certain European Legal Matters | | 0.01 | | |
| Venezuela Deconsolidation Charge | | 0.71 | | |
| Early Debt Extinguishment Charges | | - | - | 0.13 |
| Rounding | | (0.01) | - | - |
Core EPS | | $3.76 | $3.67 | $3.92 |
Percentage change vs. prior period | | | (2)% | 7% |
| Currency Impact to Earnings | | | 0.35 | 0.15 |
Currency-Neutral Core EPS | | | $4.02 | $4.07 |
| Percentage change vs. prior period Core EPS | | | 7% | 11% |
3. Core After-Tax Profit Margin
| | FY 2018 |
| Net Earnings Margin attributable to Procter & Gamble | 14.6% |
| Incremental Restructuring | 0.9% |
| Transitional Impact of U.S. Tax Reform | 0.9% |
| Early Debt Extinguishment Charges | 0.4% |
| Core After Tax Profit Margin | 16.8% |
4. Core operating profit margin and currency-neutral Core operating profit margin:
| | Twelve Months Ended
June 30 |
| | 2018 | 2017 |
| Operating Profit Margin | 20.5% | 21.5% |
| Incremental Restructuring | 1.1% | 0.6% |
| Core Operating Profit Margin | 21.6% | 22.1% |
| Basis point change vs. prior year Core margin | (50) | |
| | | |
Prior Years
| | | | | FY 13 | FY 14 | FY 15 | FY 16 | FY 17 | 4 Year BPS Total |
| Operating Profit Margin | | | | 17.7% | 18.7% | 15.6% | 20.6% | 21.5% | |
| Incremental Restructuring | | | | 0.7% | 0.5% | 0.9% | 0.9% | 0.6% | |
| Venezuela B/S Remeasurement & Devaluation Impacts | | | | 0.5% | 0.4% | 0.2% | - | - | |
| Charges for Certain European Legal Matters | | | | 0.2% | 0.1% | - | - | - | |
| Venezuela Deconsolidation Charge | | | | - | - | 2.9% | - | - | |
| Non-Cash Impairment Charges | | | | 0.4% | - | - | - | - | |
| Rounding | | | | (0.1)% | - | - | - | - | |
Core Operating Profit Margin | | | | 19.4% | 19.7% | 19.6% | 21.5% | 22.1% | |
BPS Change | | | | | 30 | (10) | 190 | 60 | 270 |
| Currency Impact to Margin | | | | | 1.2% | 1.4% | 0.5% | 0.3% | |
Currency-Neutral Core Operating Profit Margin | | | | | 20.9% | 21.0% | 22.0% | 22.4% | |
| BPS Change | | | | | 150 | 130 | 240 | 90 | 610 |
5. Core gross margin:
| | Three Months Ended
June 30 |
| | 2018 | 2017 |
| Gross Margin | 45.3% | 48.4% |
| Incremental Restructuring | 2.6% | 0.9% |
| Core Gross Margin | 47.9% | 49.3% |
| Basis point change vs. prior year Core margin | (140) | |
| | | |
6. Core SG&A margin:
| | Three Months Ended
June 30 |
| | 2018 | 2017 |
| SG&A Margin | 29.1% | 30.0% |
| Incremental Restructuring | -% | 0.1% |
| Rounding | (0.1)% | 0.1% |
| Core SG&A Margin | 29.0% | 30.2% |
| Basis points change vs. prior period | (120) | |
7. Free cash flow:
| Three Months Ended June 30, 2018 |
| Operating Cash Flow | Capital Spending | Free Cash Flow |
| $4,199 | $(907) | $3,292 |
| Twelve Months Ended June 30, 2018 |
| Operating Cash Flow | Capital Spending | Free Cash Flow |
| $14,867 | $(3,717) | $11,150 |
8. Adjusted free cash flow productivity:
| Three Months Ended June 30, 2018 |
| Net Earnings | Adjustments to Net Earnings (1) | Adjusted Net Earnings | Free Cash Flow | Adjusted Free Cash Flow Productivity |
| $1,890 | $195 | $ 2,085 | $3,292 | 158% |
| Twelve Months Ended June 30, 2018 |
| Net Earnings | Adjustments to Net Earnings (1) | Adjusted Net Earnings | Free Cash Flow | Adjusted Free Cash Flow Productivity |
| $9,861 | $845 | $ 10,706 | $11,150 | 104% |
(1) Adjustments to Net Earnings relate to the transitional impact of the U.S.