The Procter & Gamble Company Regulation G Reconciliation of Non-GAAP Measures
In accordance with the SEC's Regulation G, the following provides definitions of the non-GAAP measures used in Procter & Gamble's April 23, 2019 earnings call, associated slides, and other materials and the reconciliation to the most closely related GAAP measure. We believe that these measures provide useful perspective on underlying business trends (i.e. trends excluding non-recurring or unusual items) and results and provide a supplemental measure of year-on-year results. The non-GAAP measures described below are used by Management in making operating decisions, allocating financial resources and for business strategy purposes. These measures may be useful to investors as they provide supplemental information about business performance and provide investors a view of our business results through the eyes of Management. Certain of these measures are also used to evaluate senior management and are a factor in determining their at-risk compensation. These non-GAAP measures are not intended to be considered by the user in place of the related GAAP measure, but rather as supplemental information to our business results. These non-GAAP measures may not be the same as similar measures used by other companies due to possible differences in method and in the items or events being adjusted. The Company is not able to reconcile its forward-looking non-GAAP cash flow and effective tax rate measures because the Company cannot predict the timing and amounts of discrete items such as acquisition and divestitures, which could significantly impact GAAP results.
The measures provided are as follows:
| 1. | Organic sales growth — page 3 |
| 2. | Core EPS and currency-neutral Core EPS — pages 4 |
| 3. | Constant currency Core operating profit growth – page 6 |
| 4. | Core operating profit margin, constant currency Core operating profit margin, and Core operating profit margin excluding currency and commodities — page 6 |
| 5. | Core gross margin and currency neutral Core gross margin — page 6 |
| 6. | Free cash flow — page 6 |
| 7. | Free cash flow productivity — page 7 |
| 8. | Adjusted free cash flow productivity – page 7 |
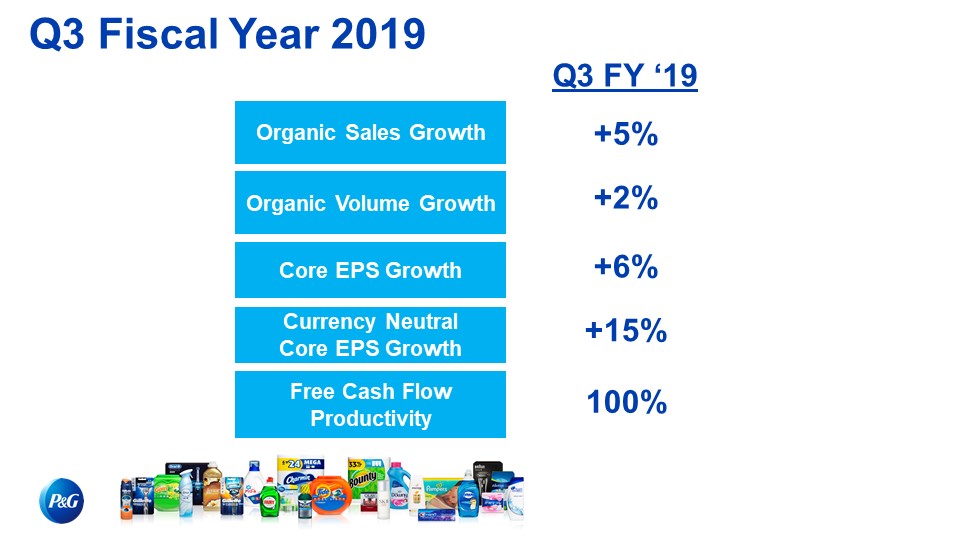
Organic sales growth*: Organic sales growth is a non-GAAP measure of sales growth excluding the impacts of acquisitions and divestitures, the impact from the July 1, 2018 adoption of new accounting standards for “Revenue from Contracts with Customers”, the impact from India Goods and Services Tax changes (which were effective on July 1, 2017) and foreign exchange from year-over-year comparisons. Management believes this measure provides investors with a supplemental understanding of underlying sales trends by providing sales growth on a consistent basis.
The Core earnings measures included in the following reconciliation tables refer to the equivalent GAAP measures adjusted as applicable for the following items:
| • | Incremental restructuring: The Company has had and continues to have an ongoing level of restructuring activities. Such activities have resulted in ongoing annual restructuring related charges of approximately $250 - $500 million before tax. In 2012 the Company began a $10 billion strategic productivity and cost savings initiative that included incremental restructuring activities. In 2017, the Company communicated details of an additional multi-year productivity and cost savings plan. This results in incremental restructuring charges to accelerate productivity efforts and cost savings. The adjustment to Core earnings includes only the restructuring costs above what we believe are the normal recurring level of restructuring costs. |
| • | Gain on Dissolution of the PGT Healthcare Partnership: The Company finalized the dissolution of our PGT Healthcare partnership, a venture between the Company and Teva Pharmaceuticals Industries, Ltd (Teva) in the OTC consumer healthcare business, in the quarter ended September 30, 2018. The transaction was accounted for as a sale of the Teva portion of the PGT business; the Company recognized an after-tax gain on the dissolution of $353 million. |
| • | Transitional Impact of U.S. Tax Reform: In December 2017, the U.S. government enacted comprehensive tax legislation commonly referred to as the Tax Cuts and Jobs Act (the "U.S. Tax Act"). This resulted in a net charge of $650 million for the nine months ended March 31, 2018, comprised of an estimated repatriation tax charge of $3.9 billion and a net deferred tax benefit of $3.2 billion. The adjustment to Core earnings only includes this transitional impact. It does not include the ongoing impacts of the lower U.S. statutory rate on current year earnings. |
| • | Early debt extinguishment charges: In fiscal 2018 and 2017, the Company recorded after-tax charges of $243 million and $345 million, respectively, due to the early extinguishment of certain long-term debt. These charges represent the difference between the reacquisition price and the par value of the debt extinguished. Management does not view this charge as indicative of the Company’s operating performance or underlying business results. |
We do not view the above items to be part of our sustainable results, and their exclusion from core earnings measures provides a more comparable measure of year-on-year results. These items are also excluded when evaluating senior management in determining their at-risk compensation. Management views the following non-GAAP measures as useful supplemental measures of Company performance and operating efficiency over time.
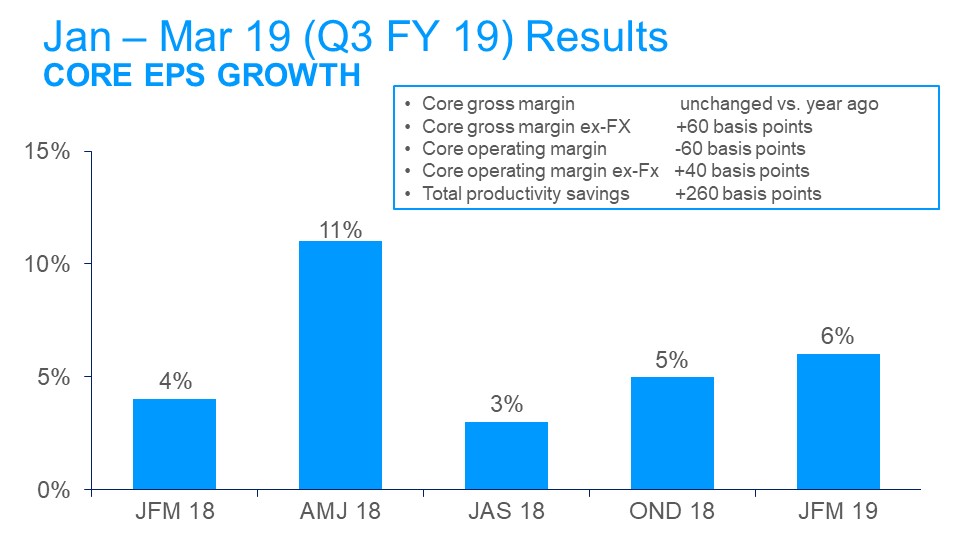
Core EPS and currency-neutral Core EPS*: Core earnings per share, or Core EPS, is a measure of the Company's diluted net earnings per share from continuing operations adjusted as indicated. Currency-neutral Core EPS is a measure of the Company's Core EPS excluding the incremental current year impact of foreign exchange.
Core operating profit growth*: Core operating profit growth is a measure of the Company's operating profit adjusted for items as indicated.
Core operating profit margin*: Core operating profit margin is a measure of the Company's operating margin adjusted for items as indicated.
Currency-neutral Core operating profit margin*: Currency-neutral Core operating profit margin is a measure of the Company's Core operating profit margin excluding the incremental current year impact of foreign exchange.
Core operating profit margin excluding currency and commodities: Core operating profit margin excluding currency and commodities is a measure of the Company's Core operating profit margin excluding the incremental current year impact of foreign exchange and commodities cost increases.
Core gross margin: Core gross margin is a measure of the Company's gross margin adjusted for items as indicated.
Currency-neutral Core gross margin: Currency-neutral Core gross margin is a measure of the Company's Core gross margin excluding the incremental current year impact of foreign exchange.
Free cash flow: Free cash flow is defined as operating cash flow less capital spending. Free cash flow represents the cash that the Company is able to generate after taking into account planned maintenance and asset expansion. Management views free cash flow as an important measure because it is one factor used in determining the amount of cash available for dividends, share repurchases, acquisitions and other discretionary investment.
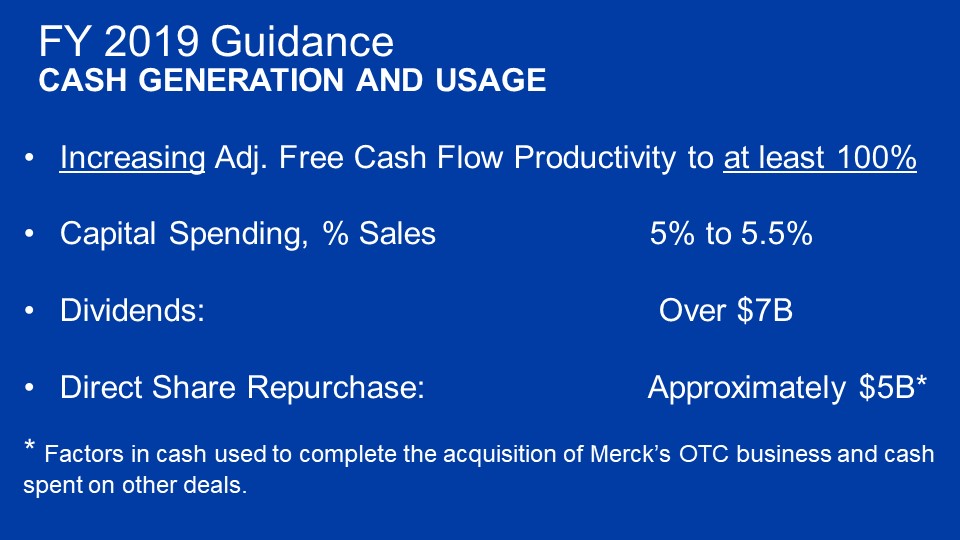
Free cash flow productivity*: Free cash flow productivity is defined as the ratio of free cash flow to net earnings. Management views free cash flow productivity as a useful measure to help investors understand P&G’s ability to generate cash. Free cash flow productivity is used by management in making operating decisions, allocating financial resources and for budget planning purposes. The Company's long-term target is to generate annual free cash flow productivity at or above 90 percent.
Adjusted free cash flow productivity*: Adjusted free cash flow productivity is defined as the ratio of adjusted free cash flow to net earnings adjusted for items as indicated. Management views adjusted free cash flow productivity as a useful measure to help investors understand P&G’s ability to generate cash. Adjusted free cash flow productivity is used by management in making operating decisions, allocating financial resources and for budget planning purposes. The Company's long-term target is to generate annual free cash flow productivity at or above 90 percent.
* Measure is used to evaluate senior management and is a factor in determining their at-risk compensation.
1. Organic sales growth:
Three Months Ended
March 31, 2019 | Net Sales Growth | | Foreign Exchange Impact | | Acquisition &
Divestiture Impact/Other* | | Organic Sales Growth |
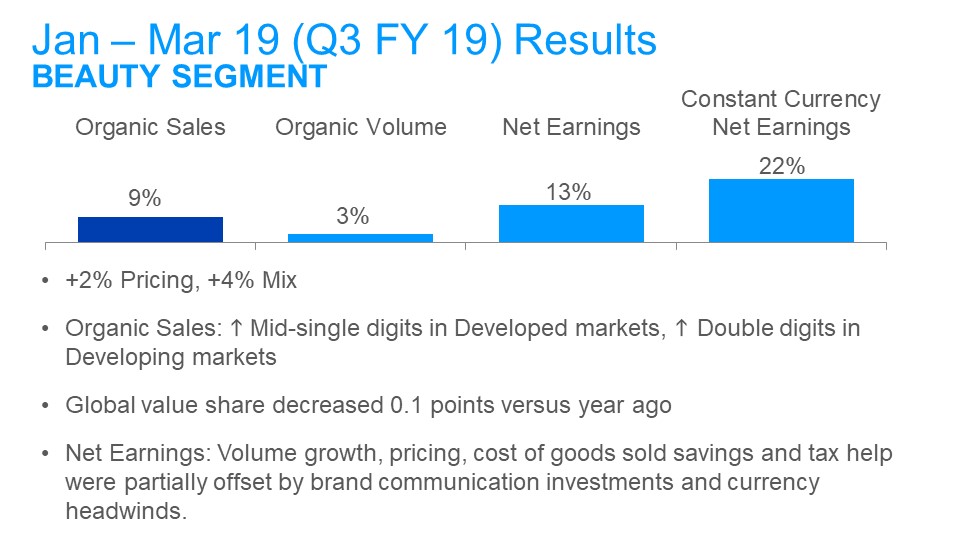
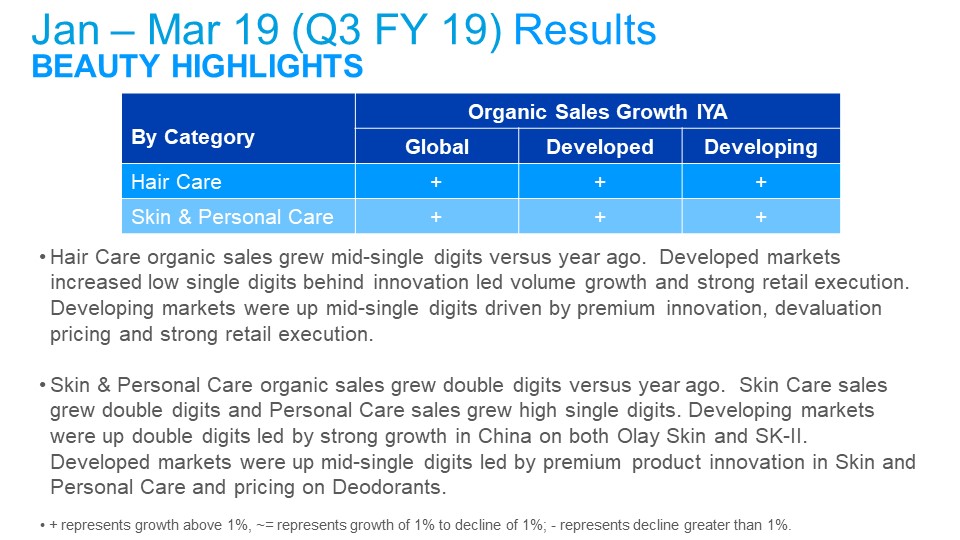
| Beauty | 4% | | 5% | | -% | | 9% |
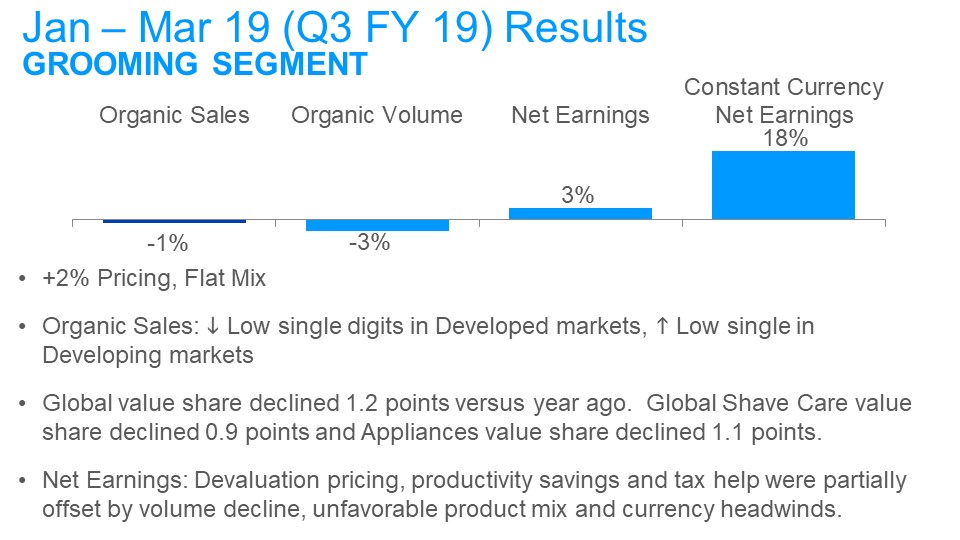
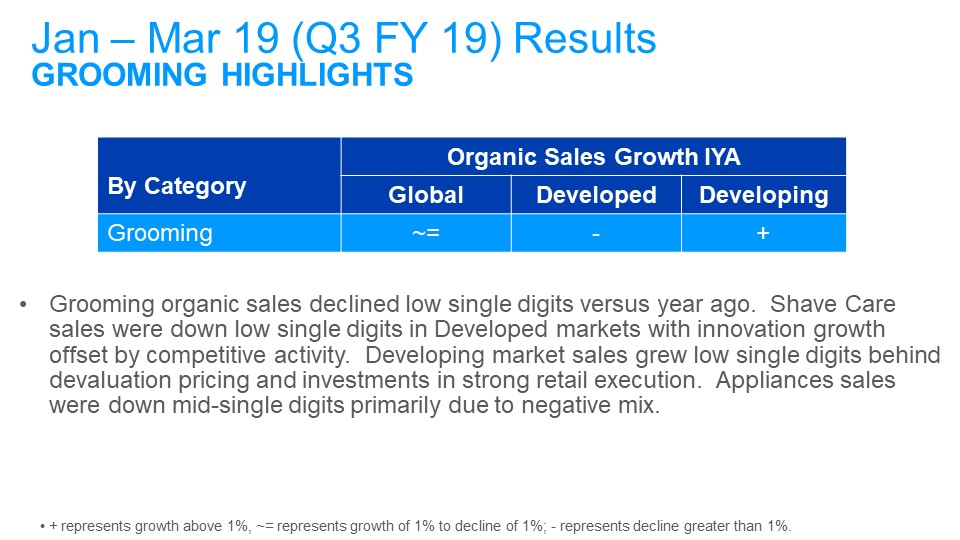
| Grooming | (8)% | | 7% | | -% | | -1% |
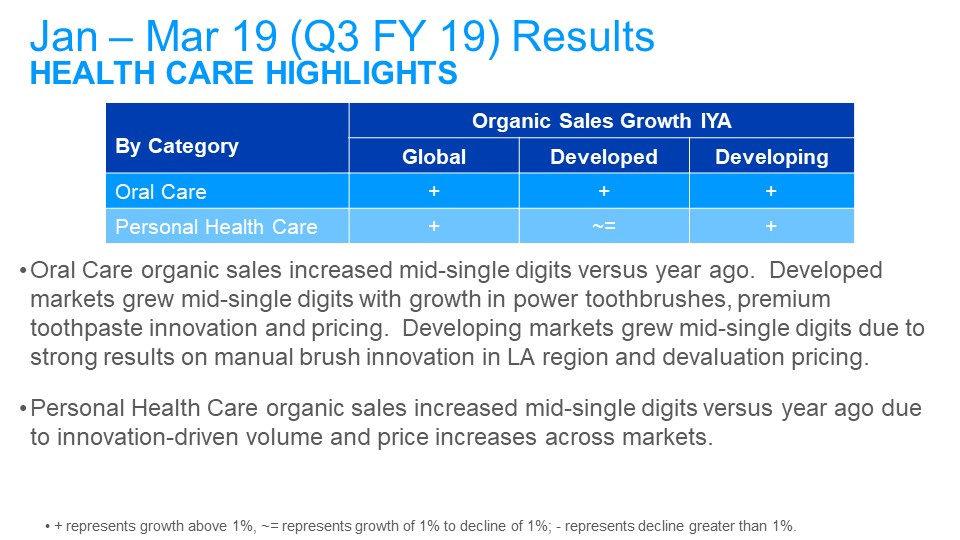
| Health Care | 9% | | 4% | | (8)% | | 5% |
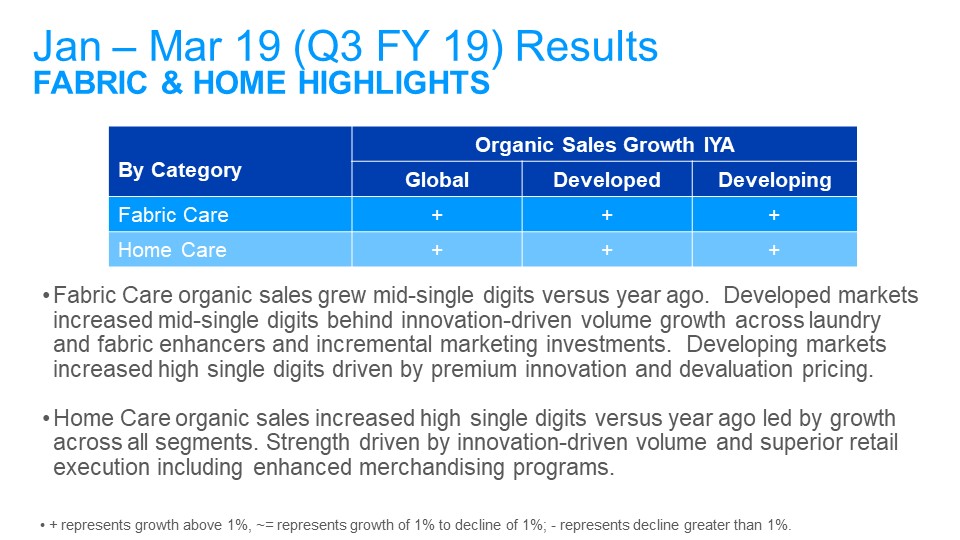
| Fabric Care & Home Care | 2% | | 4% | | 1% | | 7% |
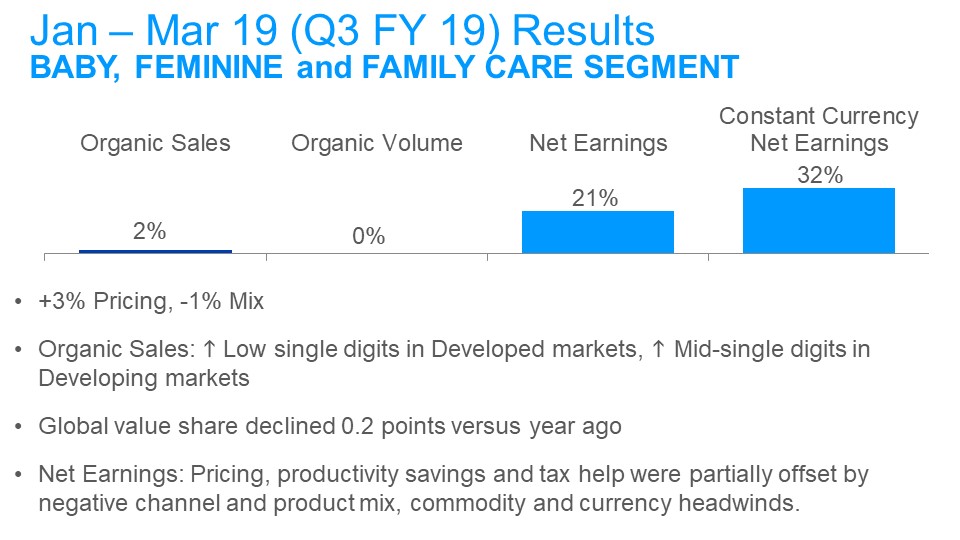
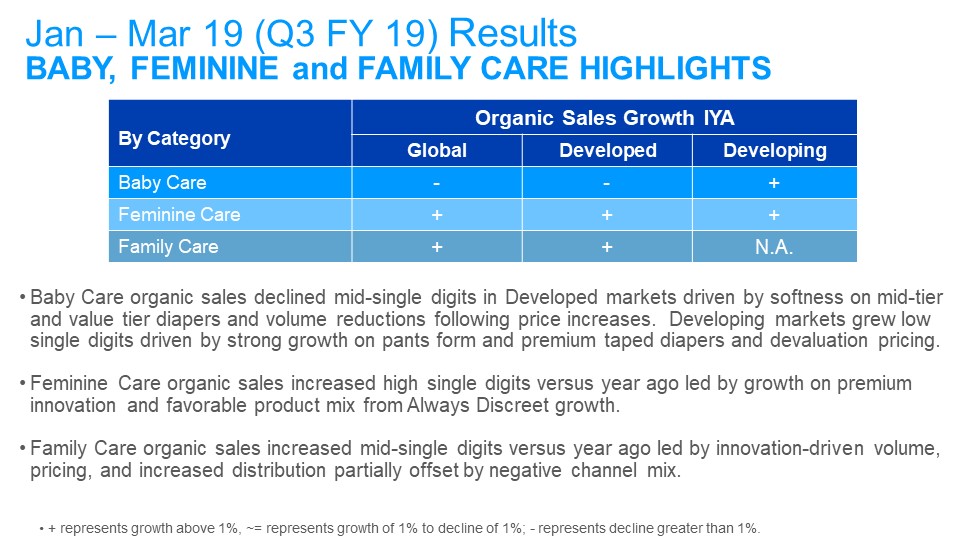
| Baby, Feminine & Family Care | (2)% | | 4% | | -% | | 2% |
| Total P&G | 1% | | 5% | | (1)% | | 5% |
* Acquisition & Divestiture Impact/Other includes the volume and mix impact of acquisitions and divestitures, the impact from the July 1, 2018 adoption of new accounting standards for "Revenue from Contracts with Customers" and rounding impacts necessary to reconcile net sales to organic sales.
Total Company | Net Sales Growth | | Foreign Exchange Impact | | Acquisition/ Divestiture Impact* | | Organic Sales Growth |
| FYTD 2019 | 1% | | 3% | | -% | | 4% |
* Acquisition & Divestiture Impact/Other includes the volume and mix impact of acquisitions and divestitures for all periods, the impact from the July 1, 2018 adoption of new accounting standards for "Revenue from Contracts with Customers" and rounding impacts necessary to reconcile net sales to organic sales.
Organic Sales
Prior Periods
Total Company | Net Sales Growth | | Foreign Exchange Impact | | Acquisition/ Divestiture Impact* | | Organic Sales Growth |
| JFM 2018 | 4% | | (4)% | | 1% | | 1% |
| AMJ 2018 | 3% | | (2)% | | -% | | 1% |
| JAS 2018 | -% | | 3% | | 1% | | 4% |
| OND 2018 | -% | | 4% | | -% | | 4% |
* Acquisition & Divestiture Impact/Other includes the volume and mix impact of acquisitions and divestitures for all periods, the impact of India Goods and Services Tax implementation in FY 2018, the impact from the July 1, 2018 adoption of new accounting standards for "Revenue from Contracts with Customers" and rounding impacts necessary to reconcile net sales to organic sales.
Organic Sales
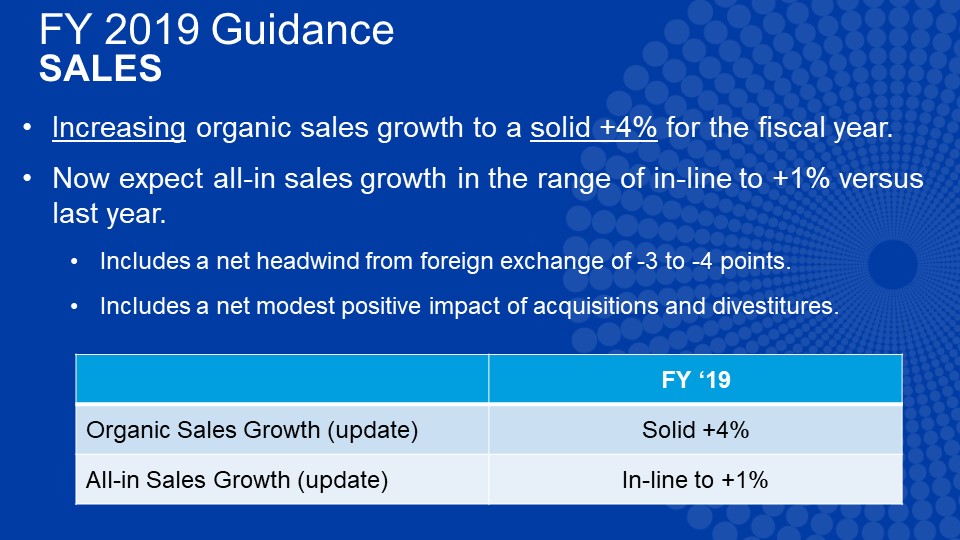
Guidance
| Total Company | | Net Sales Growth | | Combined Foreign Exchange & Acquisition/Divestiture Impact* | | Organic Sales Growth |
| FY 2019 (Estimate) | | -% to 1% | | 3% to 4% | | +4% |
* Acquisition & Divestiture Impact/Other includes the volume and mix impact of acquisitions and divestitures, the impact from the July 1, 2018 adoption of new accounting standards for "Revenue from Contracts with Customers" and rounding impacts necessary to reconcile net sales to organic sales.
2. Core EPS and currency-neutral Core EPS:
| | Three Months Ended
March 31 |
| | 2019 | | 2018 |
| Diluted Net Earnings Per Share from Continuing Operations | $1.04 | | $0.95 |
| Incremental Restructuring | 0.02 | | 0.04 |
| Transitional Impacts of the US Tax Act | | | 0.01 |
| Core EPS | $1.06 | | $1.00 |
| Percentage change vs. prior period | 6% | | |
| Currency Impact to Earnings | 0.09 | | |
| Currency-Neutral Core EPS | $1.15 | | |
| Percentage change vs. prior period Core EPS | 15% | | |
Note – All reconciling items are presented net of tax. Tax effects are calculated consistent with the nature of the underlying transaction.
| | Nine Months Ended
March 31 |
| | 2019 | | 2018 |
| Diluted Net Earnings Per Share from Continuing Operations | $3.48 | | $2.94 |
| Incremental Restructuring | 0.07 | | 0.09 |
| Transitional Impacts of the US Tax Act | - | | 0.24 |
| Gain on Dissolution of PGT Partnership | (0.13) | | |
| Rounding | | | 0.01 |
| Core EPS | $3.42 | | $3.28 |
| Percentage change vs. prior period | 4.3% | | |
Note – All reconciling items are presented net of tax. Tax effects are calculated consistent with the nature of the underlying transaction.
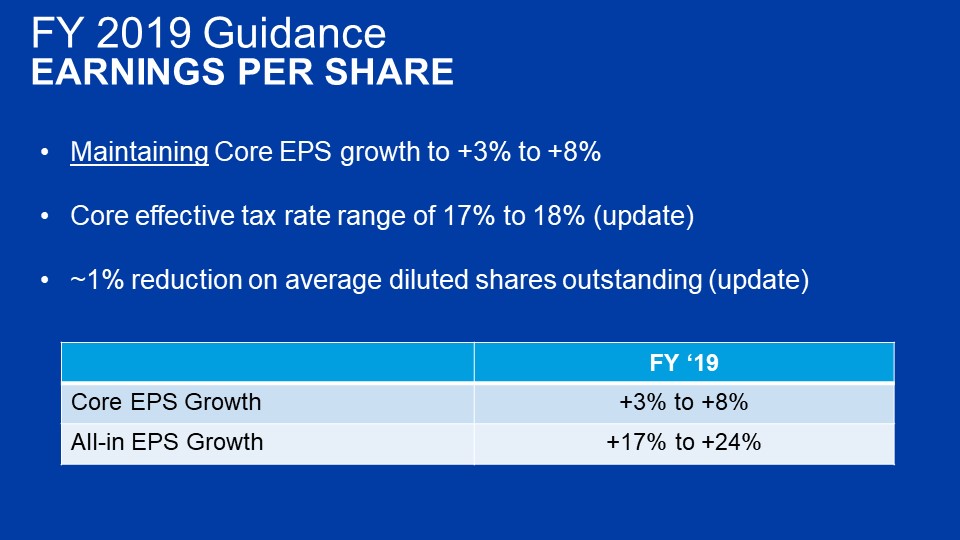
Core EPS
Guidance
| Total Company | Diluted EPS Growth | Impact of Incremental Non-Core Items* | Core EPS Growth |
| FY 2019 (Estimate) | +17% to +24% | (14)% to (16)% | +3% to +8% |
* Includes the gain on the dissolution of the PGT Healthcare partnership in FY 2019 and the impact of U.S. Tax Act and loss on early extinguishment of debt in FY 2018 and year-over-year changes in incremental non-core restructuring charges.
Currency-Neutral Core EPS
Guidance
| Total Company | Core EPS Growth | Foreign Exchange Impact | Currency-Neutral Core EPS Growth |
| FY 2019 (Estimate) | +3% to +8% | 8% | +11% to +16% |
Core EPS
Prior Quarters
| | JFM 18 | JFM 17 | AMJ 18 | AMJ 17 | JAS 18 | JAS 17 | OND 18 | OND 17 |
| Diluted Net Earnings Per Share from Continuing Operations, attributable to P&G | $ 0.95 | $ 0.93 | $ 0.72 | $ 0.82 | $ 1.22 | $ 1.06 | $ 1.22 | $ 0.93 |
| Incremental Restructuring | 0.04 | 0.03 | 0.14 | 0.02 | 0.03 | 0.03 | 0.03 | 0.02 |
| Early Debt Extinguishment Charges | - | - | 0.09 | - | - | - | - | - |
| Transitional Impact of U.S. Tax Act | 0.01 | | (0.02) | | - | - | - | 0.24 |
| Gain on Dissolution of PGT Partnership | - | - | - | - | (0.14) | - | - | - |
| Rounding | - | - | 0.01 | 0.01 | 0.01 | - | - | - |
| Core EPS | $ 1.00 | $ 0.96 | $ 0.94 | $ 0.85 | $ 1.12 | $ 1.09 | $ 1.25 | $ 1.19 |
| Percentage change vs. prior period | 4% | | 11% | | 3% | | 5% | |
| Currency Impact to Earnings | (0.03) | | 0.01 | | 0.09 | | 0.09 | |
| Currency-Neutral Core EPS | $ 0.97 | | $ 0.95 | | $ 1.21 | | $ 1.34 | |
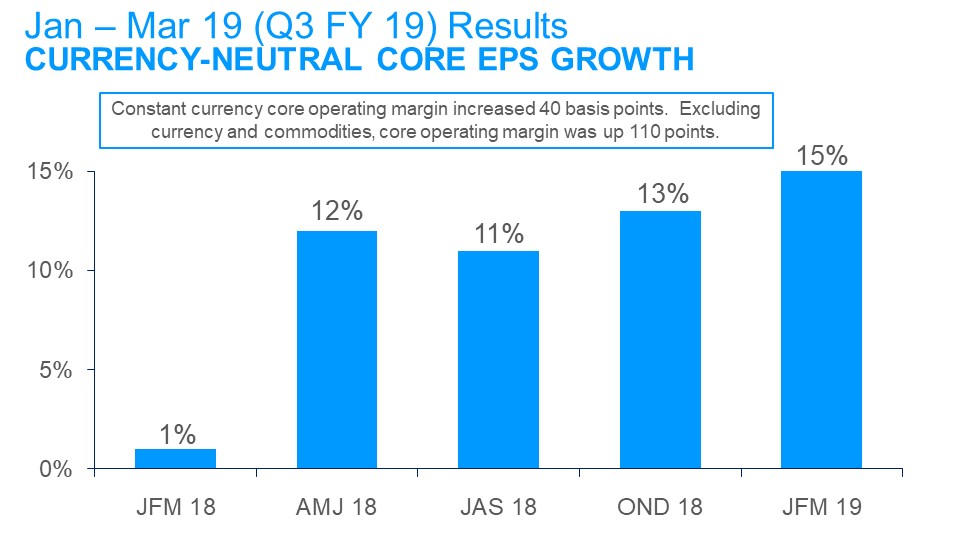
| Percentage change vs. prior period Core EPS | 1% | | 12% | | 11% | | 13% | |
3. Constant currency Core operating profit growth:
| | Three Months Ended
March 31 |
| | 2019 | 2018 |
| Operating Profit | $3,229 | $3,209 |
| Incremental Restructuring | $47 | $134 |
| Rounding | $1 | $1 |
| Core Operating Profit | $3,277 | $3,344 |
| Percent change vs. prior year Core profit | (2)% | |
| Currency Impact to Profit | $314 | |
| Constant Currency Core Operating Profit | $3,591 | |
| Percent change vs. prior year Core profit | 7% | |
4. Core operating profit margin, constant currency core operating profit margin, and core operating profit margin excluding currency and commodities:
| | Three Months Ended
March 31 |
| | 2019 | 2018 |
| Operating Profit Margin | 19.6% | 19.7% |
| Incremental Restructuring | 0.3% | 0.8% |
| Core Operating Profit Margin | 19.9% | 20.5% |
| Basis point change vs. prior year Core margin | (60) | |
| Currency Impact to Margin | 1.00% | |
| Constant Currency Core Operating Profit Margin | 20.9% | |
| Basis point change vs. prior year Core margin | 40 | |
| Commodity Impact to Margin | 0.7% | |
| Core Operating Profit Margin Excluding Currency and Commodities | 21.6% | |
| Basis point change vs prior year Core margin | 110 | |
5. Core gross margin
| | Three Months Ended
March 31 |
| | 2019 | 2018 |
| Gross Margin | 48.8% | 48.5% |
| Incremental Restructuring | 0.4% | 0.7% |
| Core Gross Margin | 49.2% | 49.2% |
| Basis point change vs. prior year Core margin | - | |
| Currency Impact to Margin | 0.6% | |
| Constant Currency Core Gross Margin | 49.8% | |
| Basis point change vs prior year Core margin | 60 | |
6. Free cash flow (dollar amounts in millions):
| | Three Months Ended March 31, 2019 | |
| | Operating Cash Flow | Capital Spending | Free Cash Flow | |
| | $3,517 | $(752) | $2,765 | |
7. Free cash flow productivity (dollar amounts in millions):
| | Three Months Ended March 31, 2019 | |
| | Free Cash Flow | Net Earnings
| Free Cash Flow Productivity
| |
| | $2,765 | $2,776 | 100%
| |
8. Adjusted free cash flow productivity (dollar amounts in millions):
Adjusted Free Cash Flow Productivity
Prior Periods
| FY | Operating Cash Flow | Capital Spending | Adjustments* | Adjusted Free Cash Flow | Net Earnings | Adjustments** | Adjusted Net Earnings | Adjusted Free Cash Flow Productivity |
| 2012 | $13,284 | $(3,964) | $519 | $9,839 | $10,904 | $85 | $10,989 | 90% |
| 2013 | $14,873 | $(4,008) | - | $10,865 | $11,402 | $(333) | $11,069 | 98% |
| 2014 | $13,958 | $(3,848) | - | $10,110 | $11,785 | - | $11,785 | 86% |
| 2015 | $14,608 | $(3,736) | $729 | $11,601 | $7,144 | $4,187 | $11,331 | 102% |
| 2016 | $15,435 | $(3,314) | - | $12,121 | $10,604 | $(72) | $10,532 | 115% |
| 2017 | $12,753 | $(3,384) | $418 | $9,787 | $15,411 | $(4,990) | $10,421 | 94% |
| 2018 | $14,867 | $(3,717) | - | $11,150 | $9,861 | $845 | $10,706 | 104% |
P7 Yrs
| $99,778
| $(25,971)
| $1,666
| $75,473 | $77,111 | $(278)
| $76,833
| 98%
|
* Adjustments for each year are as follows: 2012- tax payment for Snacks divestiture, 2015-tax payment for Pet Care divestiture, 2017- tax payment for Beauty Brands divestiture.
** Adjustments for each year are as follows: 2012- net of gain on Snacks divestiture and after-tax Braun impairment charge, 2013- net of gain on buyout of Iberian joint venture and Salon impairment charges, 2015- Batteries impairment and Venezuela deconsolidation charges , 2016- net of gain on Battery business divestiture and Batteries impairment charge, 2017- net of loss on early debt extinguishment and gain on Beauty brands divesture, 2018- transitional impact of the U.S Tax Act and loss on early debt extinguishment.