
Earnings Release Q1 FY 2022 ResultsOctober 19, 2021

StrategicPriorities
IMMEDIATE PRIORITIES Ensuring the health and safety of our P&G colleagues around the world.Maximizing the availability of products we produce to help people and their families with their cleaning, health and hygiene needs.Supporting communities, relief agencies and people who are on the front lines of this global pandemic.
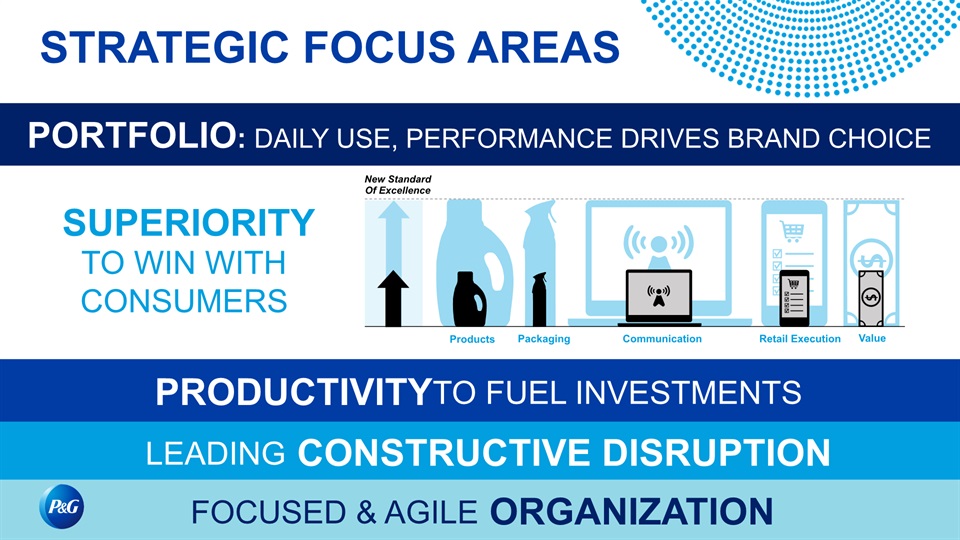
SUPERIORITYTO WIN WITH CONSUMERS LEADING CONSTRUCTIVE DISRUPTION FOCUSED & AGILE ORGANIZATION STRATEGIC FOCUS AREAS PORTFOLIO: DAILY USE, PERFORMANCE DRIVES BRAND CHOICE PRODUCTIVITY TO FUEL INVESTMENTS Products Packaging Value New StandardOf Excellence Communication Retail Execution

Business ResultsQ1 FY 2022
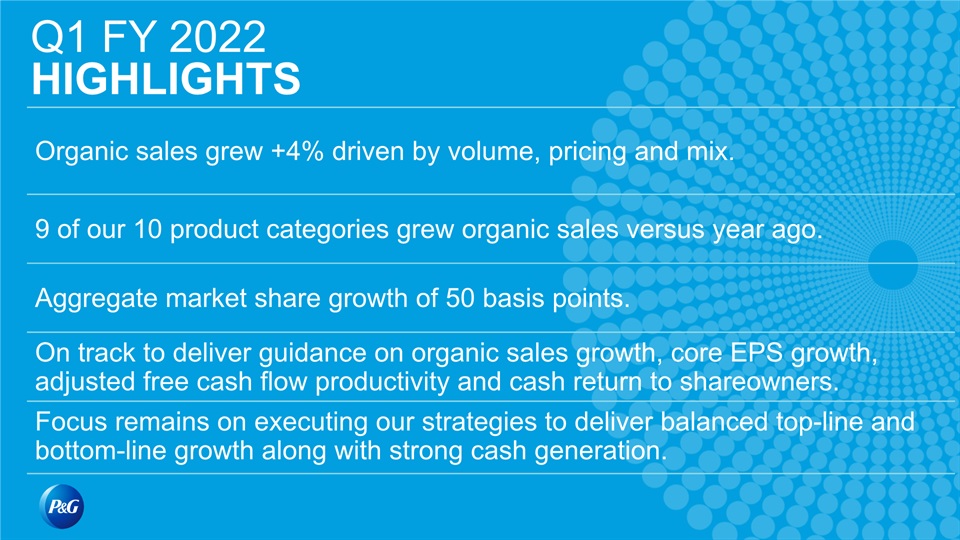
Q1 FY 2022HIGHLIGHTS
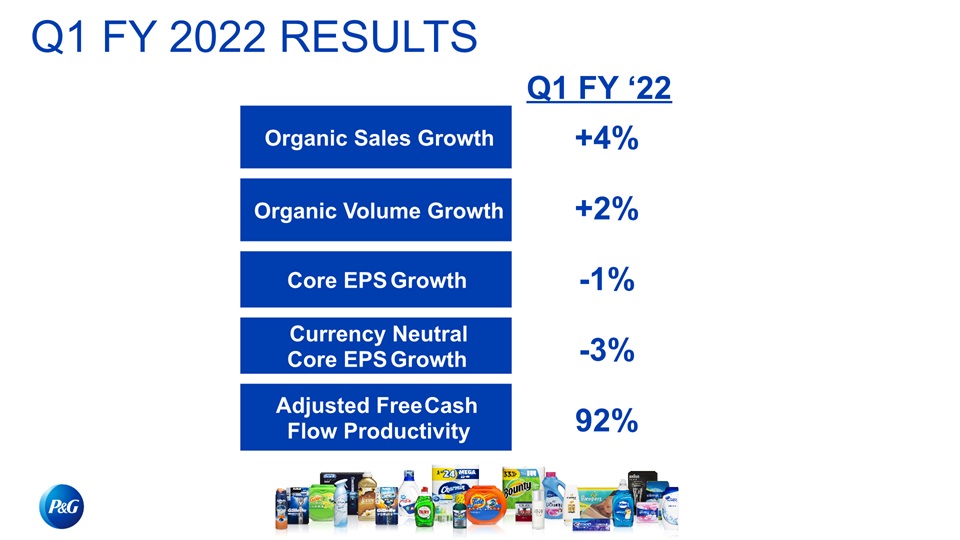
Organic Sales Growth Organic Volume Growth Core EPS Growth Adjusted Free CashFlow Productivity Q1 FY ‘22 +4% +2% -1% 92% Currency Neutral Core EPS Growth -3% Q1 FY 2022 RESULTS
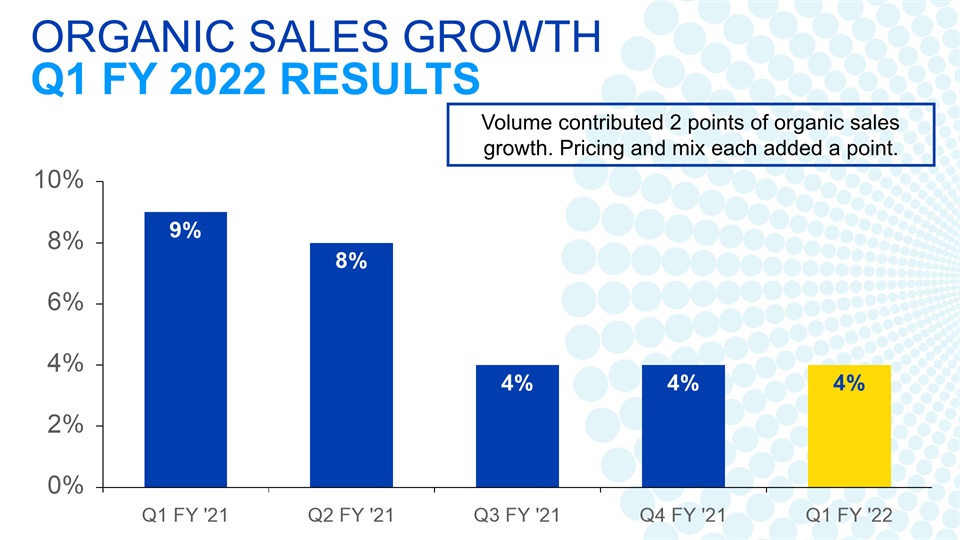
Volume contributed 2 points of organic sales growth. Pricing and mix each added a point. ORGANIC SALES GROWTHQ1 FY 2022 RESULTS
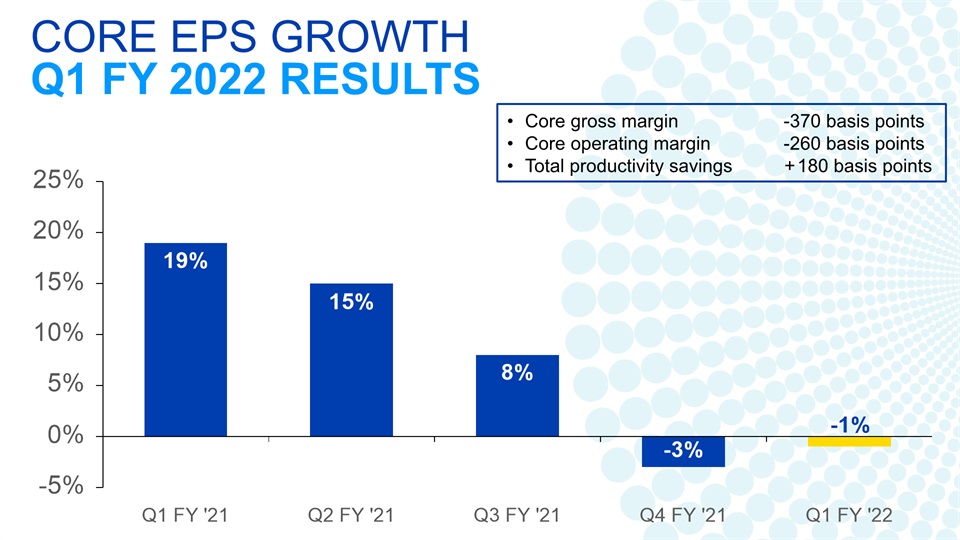
Core gross margin -370 basis pointsCore operating margin -260 basis pointsTotal productivity savings +180 basis points CORE EPS GROWTHQ1 FY 2022 RESULTS
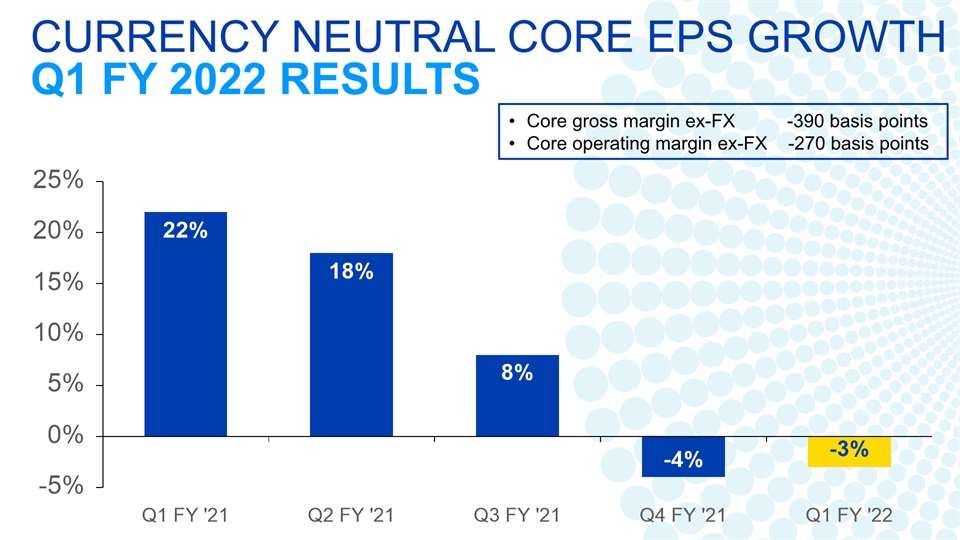
Core gross margin ex-FX -390 basis pointsCore operating margin ex-FX -270 basis points CURRENCY NEUTRAL CORE EPS GROWTHQ1 FY 2022 RESULTS
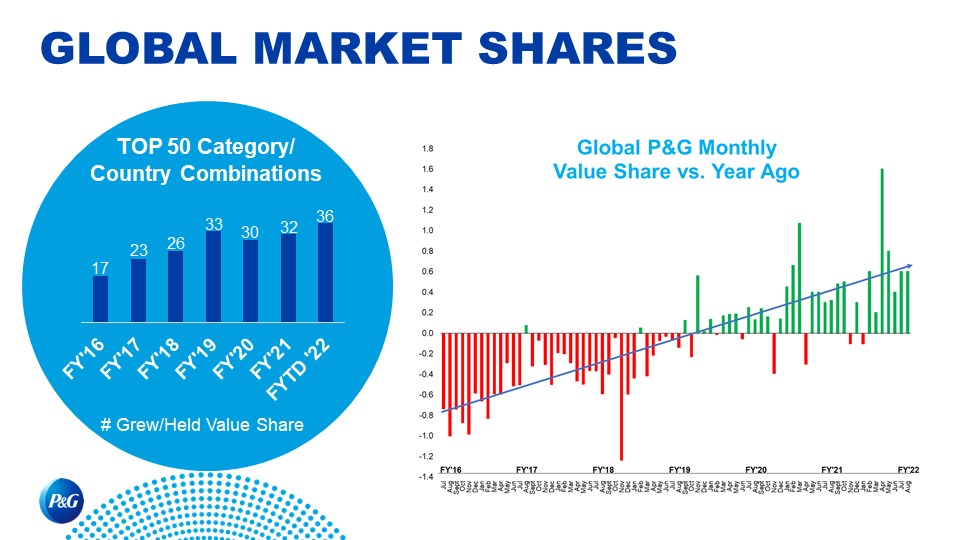
GLOBAL MARKET SHARES Top 50 Category/Country Combinations # Grew/Held Value Share

Business Segment Results and HighlightsQ1 FY 2022
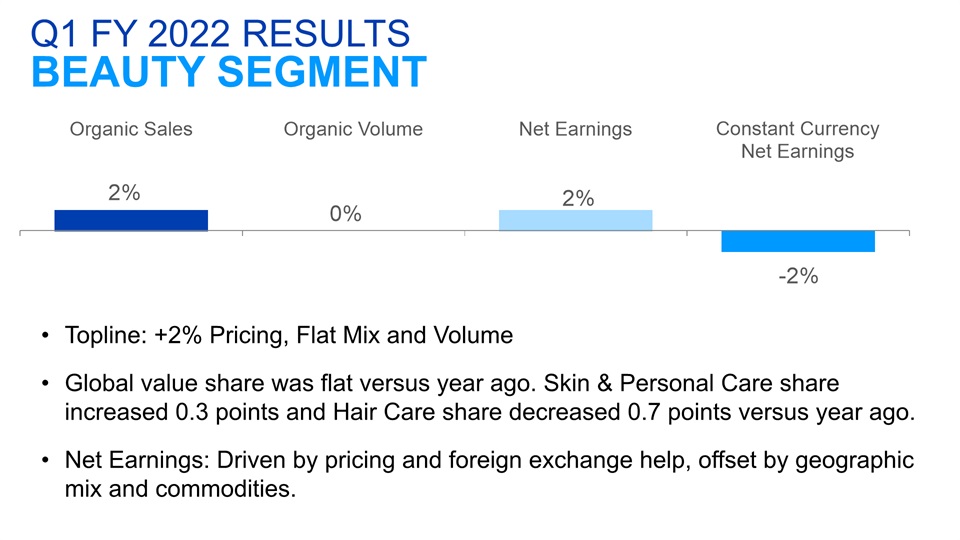
Topline: +2% Pricing, Flat Mix and VolumeGlobal value share was flat versus year ago. Skin & Personal Care share increased 0.3 points and Hair Care share decreased 0.7 points versus year ago.Net Earnings: Driven by pricing and foreign exchange help, offset by geographic mix and commodities. Q1 FY 2022 RESULTSBEAUTY SEGMENT
Beauty Segment has delivered 24 consecutive quarters of organic sales growth through Q1.Hair Care organic sales increased low single digits versus year ago. Europe and North America growth was driven by premium innovation and pricing. This was partially offset by Greater China, where organic sales were in-line with year ago, given strong double-digit growth in the base period.Skin & Personal Care organic sales increased low single digits versus year ago. Greater China grew low single digits behind innovation and continued strength in Hainan, partially offset by COVID related closures in July and August. North America declined low single digits versus year ago, primarily driven by category softness (share growing > 2 points) and a COVID related consumption surge in the base period. Q1 FY 2022 RESULTSBEAUTY HIGHLIGHTS
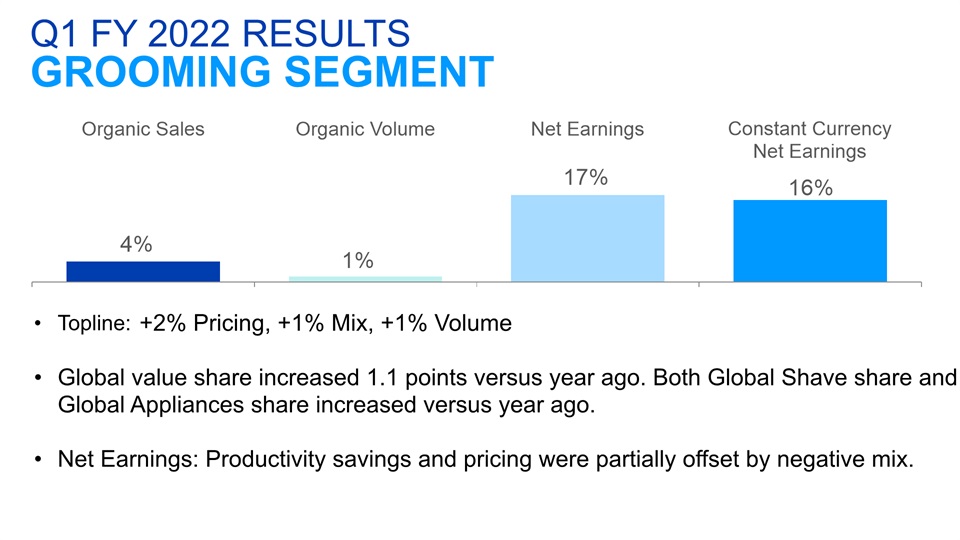
Q1 FY 2022 RESULTSGROOMING SEGMENT Topline: +2% Pricing, +1% Mix, +1% VolumeGlobal value share increased 1.1 points versus year ago. Both Global Shave share and Global Appliances share increased versus year ago.Net Earnings: Productivity savings and pricing were partially offset by negative mix.
Shave Care organic sales grew mid-single digits, with growth across all sub-segments: Male, Female and Pre/Post Shave. Female Blades & Razors grew double digits in every region behind premium innovation.Appliances organic sales decreased mid-single digits, primarily driven by a strong base period with nearly 40% growth.The P&G Grooming category has been naturally hedged during COVID. At the beginning of the pandemic, the wet shave category size declined while the appliances category size increased. This trend is starting to reverse and has provided consistent market value growth of 1-2% for total grooming. Q1 FY 2022 RESULTSGROOMING HIGHLIGHTS
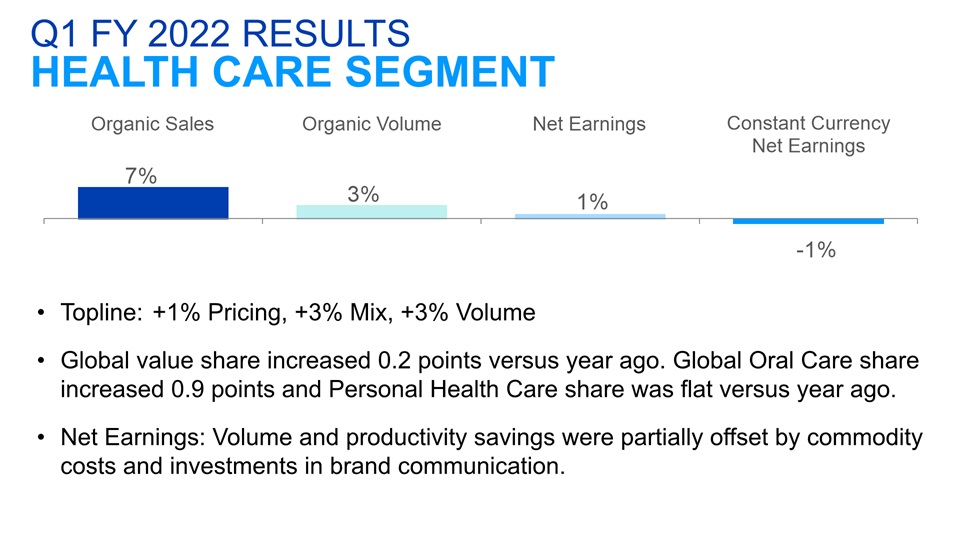
Topline: +1% Pricing, +3% Mix, +3% VolumeGlobal value share increased 0.2 points versus year ago. Global Oral Care share increased 0.9 points and Personal Health Care share was flat versus year ago.Net Earnings: Volume and productivity savings were partially offset by commodity costs and investments in brand communication. Q1 FY 2022 RESULTSHEALTH CARE SEGMENT
Oral Care organic sales increased low single digits versus year ago. North America and Europe grew organic sales mid-single digits, led by premium innovation.Personal Health Care organic sales grew double digits versus year ago. North America grew mid-teens and Latin America grew double digits with growth in both regions across all business segments, including a recovery of the respiratory business following a historically low cough cold flu season last year. Q1 FY 2022 RESULTSHEALTH CARE HIGHLIGHTS
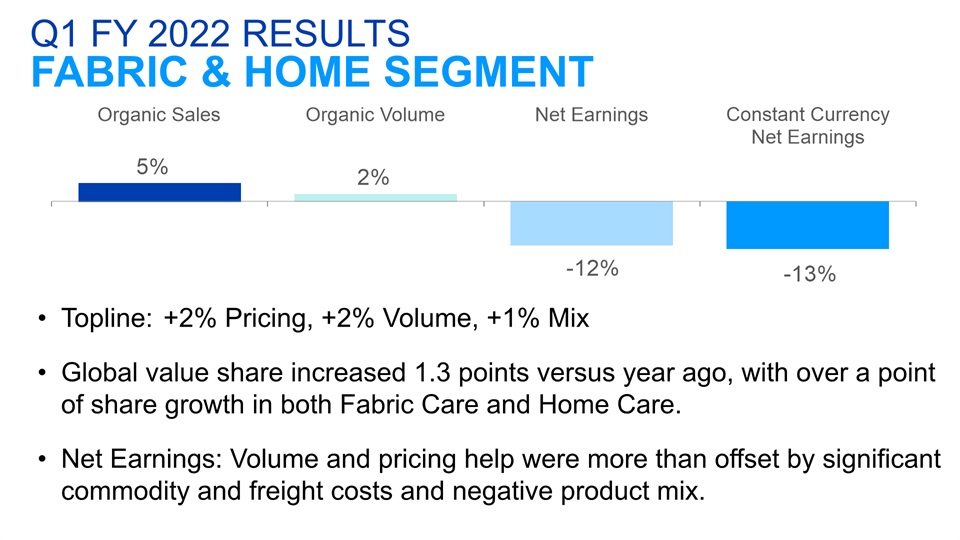
Topline: +2% Pricing, +2% Volume, +1% MixGlobal value share increased 1.3 points versus year ago, with over a point of share growth in both Fabric Care and Home Care.Net Earnings: Volume and pricing help were more than offset by significant commodity and freight costs and negative product mix. Q1 FY 2022 RESULTSFABRIC & HOME SEGMENT
Fabric Care organic sales grew high single digits versus year ago. Growth continues to be driven by premium innovation, with global Laundry Unit-Dose growing double digits and Fabric Enhancer Beads growing 30%. Home Care organic sales increased low single digits primarily driven by a COVID related consumption surge in the base period. Two-year stacked, Home Care grew more than 30% and continues to benefit from premium innovation resulting in share growth across Dish Care, Air Care and Surface Care. Q1 FY 2022 RESULTSFABRIC & HOME HIGHLIGHTS
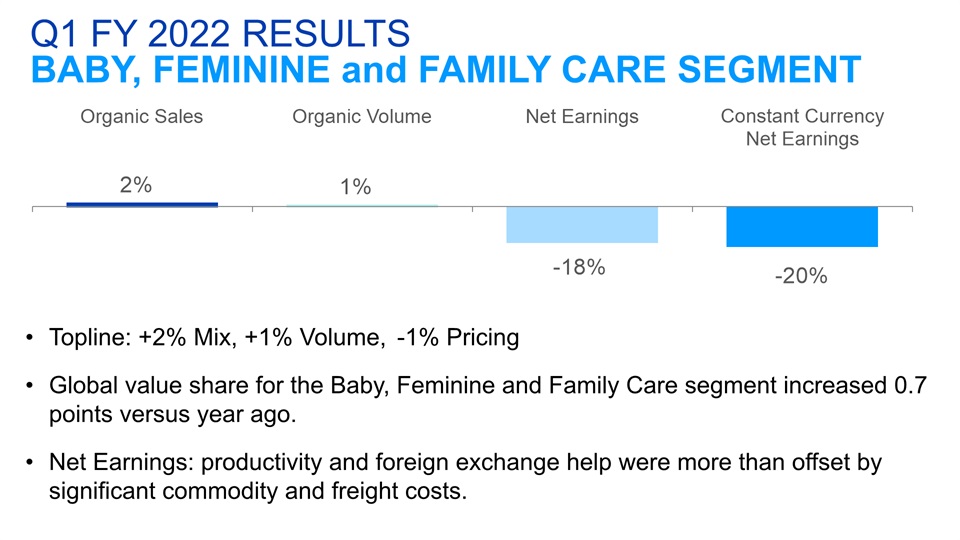
Topline: +2% Mix, +1% Volume, -1% PricingGlobal value share for the Baby, Feminine and Family Care segment increased 0.7 points versus year ago.Net Earnings: productivity and foreign exchange help were more than offset by significant commodity and freight costs. Q1 FY 2022 RESULTSBABY, FEMININE and FAMILY CARE SEGMENT
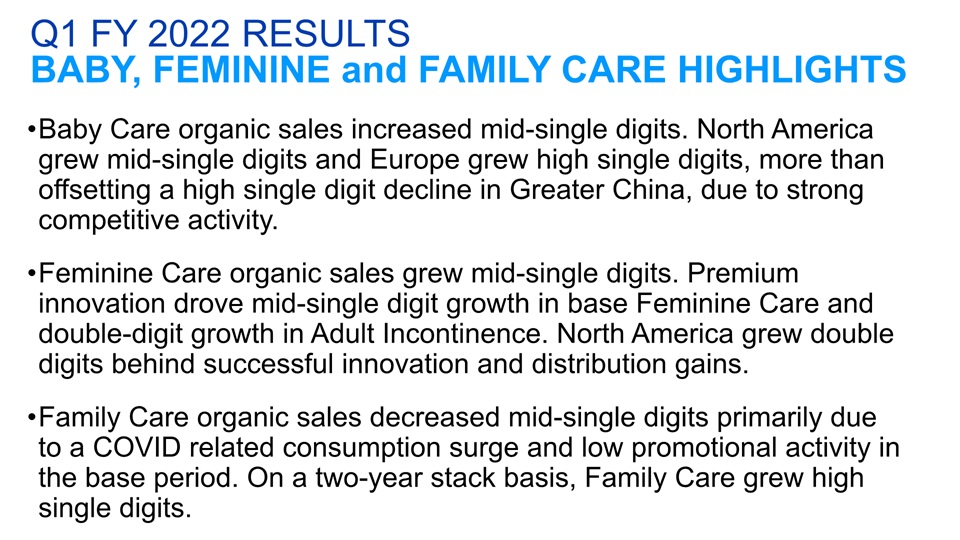
Baby Care organic sales increased mid-single digits. North America grew mid-single digits and Europe grew high single digits, more than offsetting a high single digit decline in Greater China, due to strong competitive activity.Feminine Care organic sales grew mid-single digits. Premium innovation drove mid-single digit growth in base Feminine Care and double-digit growth in Adult Incontinence. North America grew double digits behind successful innovation and distribution gains.Family Care organic sales decreased mid-single digits primarily due to a COVID related consumption surge and low promotional activity in the base period. On a two-year stack basis, Family Care grew high single digits. Q1 FY 2022 RESULTSBABY, FEMININE and FAMILY CARE HIGHLIGHTS

FY 2022 Guidance
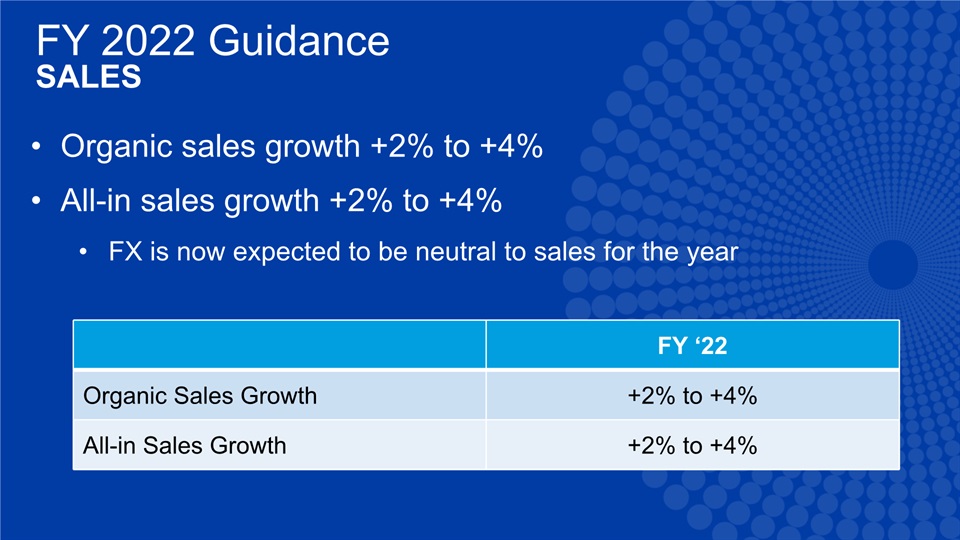
FY ‘22 Organic Sales Growth +2% to +4% All-in Sales Growth +2% to +4% FY 2022 GuidanceSALES Organic sales growth +2% to +4%All-in sales growth +2% to +4%FX is now expected to be neutral to sales for the year
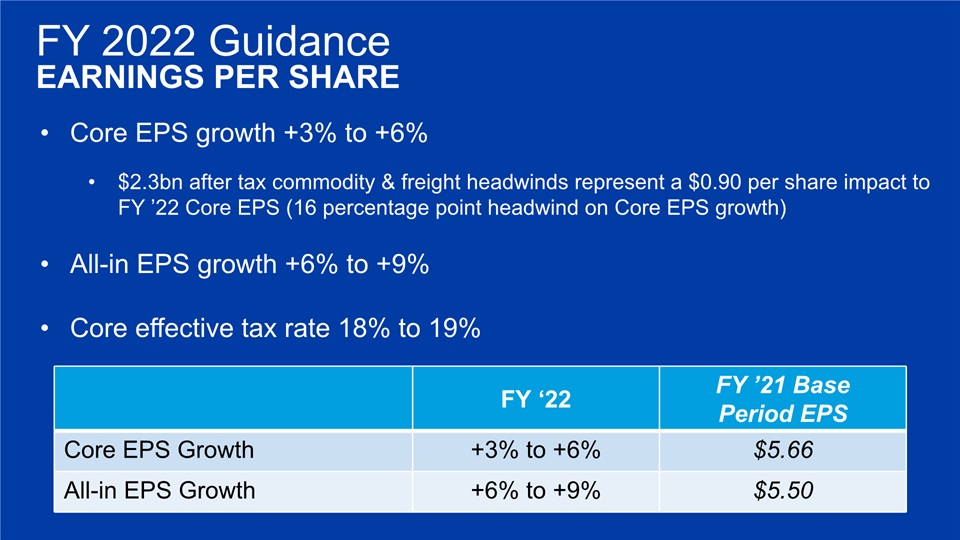
FY ‘22 FY ’21 BasePeriod EPS Core EPS Growth +3% to +6% $5.66 All-in EPS Growth +6% to +9% $5.50 FY 2022 GuidanceEARNINGS PER SHARE Core EPS growth +3% to +6%$2.3bn after tax commodity & freight headwinds represent a $0.90 per share impact to FY ’22 Core EPS (16 percentage point headwind on Core EPS growth)All-in EPS growth +6% to +9%Core effective tax rate 18% to 19%
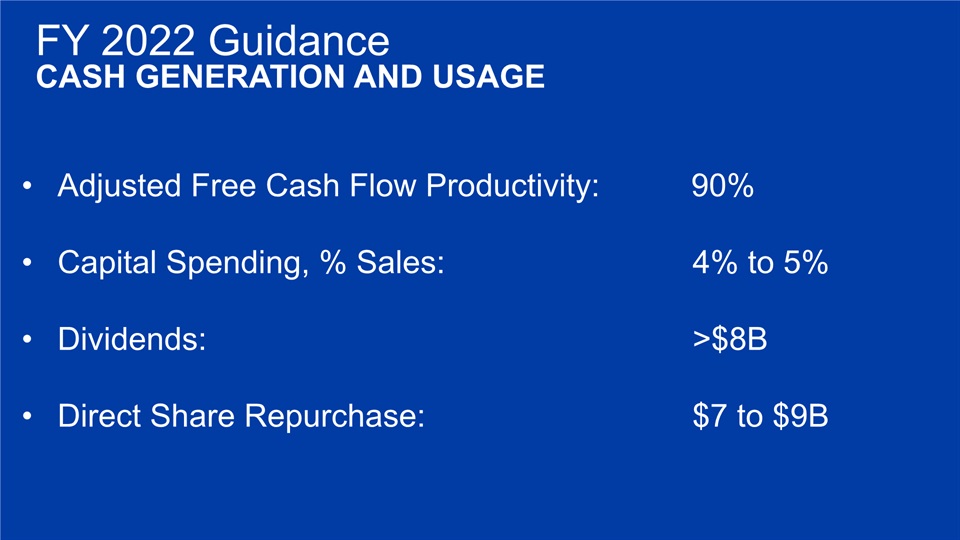
FY 2022 GuidanceCASH GENERATION AND USAGE Adjusted Free Cash Flow Productivity: 90% Capital Spending, % Sales: 4% to 5%Dividends: >$8BDirect Share Repurchase: $7 to $9B
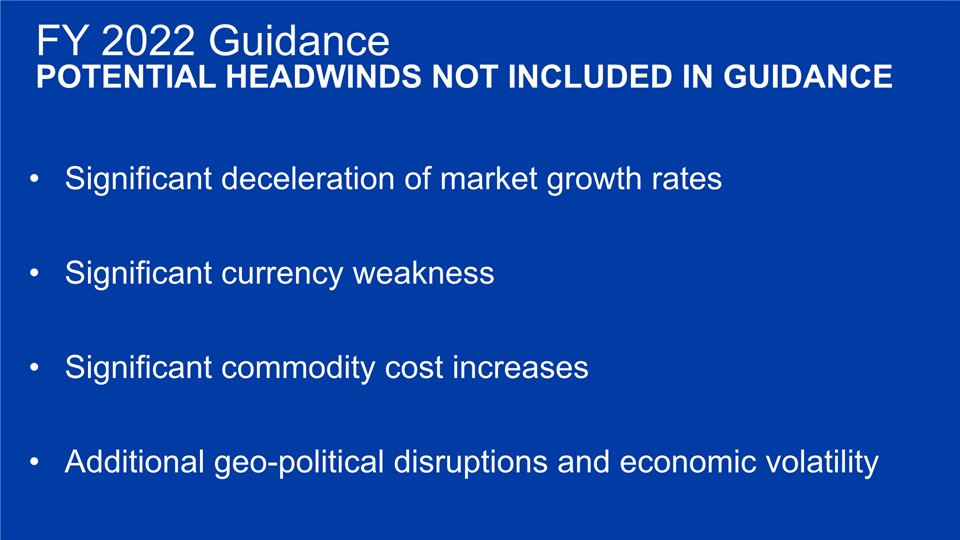
Significant deceleration of market growth ratesSignificant currency weaknessSignificant commodity cost increasesAdditional geo-political disruptions and economic volatility FY 2022 GuidancePOTENTIAL HEADWINDS NOT INCLUDED IN GUIDANCE
Forward Looking Statements Certain statements in this release or presentation, other than purely historical information, including estimates, projections, statements relating to our business plans, objectives, and expected operating results, and the assumptions upon which those statements are based, are “forward-looking statements” within the meaning of the Private Securities Litigation Reform Act of 1995, Section 27A of the Securities Act of 1933 and Section 21E of the Securities Exchange Act of 1934. These forward-looking statements generally are identified by the words “believe,” “project,” “expect,” “anticipate,” “estimate,” “intend,” “strategy,” “future,” “opportunity,” “plan,” “may,” “should,” “will,” “would,” “will be,” “will continue,” “will likely result,” and similar expressions. Forward-looking statements are based on current expectations and assumptions, which are subject to risks and uncertainties that may cause results to differ materially from those expressed or implied in the forward-looking statements. We undertake no obligation to update or revise publicly any forward-looking statements, whether because of new information, future events or otherwise, except to the extent required by law.Risks and uncertainties to which our forward-looking statements are subject include, without limitation: (1) the ability to successfully manage global financial risks, including foreign currency fluctuations, currency exchange or pricing controls and localized volatility; (2) the ability to successfully manage local, regional or global economic volatility, including reduced market growth rates, and to generate sufficient income and cash flow to allow the Company to affect the expected share repurchases and dividend payments; (3) the ability to manage disruptions in credit markets or to our banking partners or changes to our credit rating; (4) the ability to maintain key manufacturing and supply arrangements (including execution of supply chain optimizations and sole supplier and sole manufacturing plant arrangements) and to manage disruption of business due to various factors, including ones outside of our control, such as natural disasters, acts of war or terrorism, or disease outbreaks; (5) the ability to successfully manage cost fluctuations and pressures, including prices of commodities and raw materials, and costs of labor, transportation, energy, pension and healthcare; (6) the ability to stay on the leading edge of innovation, obtain necessary intellectual property protections and successfully respond to changing consumer habits, evolving digital marketing and selling platform requirements, and technological advances attained by, and patents granted to, competitors; (7) the ability to compete with our local and global competitors in new and existing sales channels, including by successfully responding to competitive factors such as prices, promotional incentives and trade terms for products; (8) the ability to manage and maintain key customer relationships; (9) the ability to protect our reputation and brand equity by successfully managing real or perceived issues, including concerns about safety, quality, ingredients, efficacy, packaging content, supply chain practices, or similar matters that may arise; (10) the ability to successfully manage the financial, legal, reputational and operational risk associated with third-party relationships, such as our suppliers, contract manufacturers, distributors, contractors and external business partners; (11) the ability to rely on and maintain key company and third party information and operational technology systems, networks and services, and maintain the security and functionality of such systems, networks and services and the data contained therein; (12) the ability to successfully manage uncertainties related to changing political conditions and potential implications such as exchange rate fluctuations and market contraction; (13) the ability to successfully manage current and expanding regulatory and legal requirements and matters (including, without limitation, those laws and regulations involving product liability, product and packaging composition, intellectual property, labor and employment, antitrust, privacy and data protection, tax, environmental, due diligence, risk oversight, and accounting and financial reporting) and to resolve new and pending matters within current estimates; (14) the ability to manage changes in applicable tax laws and regulations including maintaining our intended tax treatment of divestiture transactions; (15) the ability to successfully manage our ongoing acquisition, divestiture and joint venture activities, in each case to achieve the Company’s overall business strategy and financial objectives, without impacting the delivery of base business objectives; (16) the ability to successfully achieve productivity improvements and cost savings and manage ongoing organizational changes, while successfully identifying, developing and retaining key employees, including in key growth markets where the availability of skilled or experienced employees may be limited; and (17) the ability to successfully manage the demand, supply, and operational challenges associated with a disease outbreak, including epidemics, pandemics, or similar widespread public health concerns (including the COVID-19 outbreak). For additional information concerning factors that could cause actual results and events to differ materially from those projected herein, please refer to our most recent 10-K, 10-Q and 8-K reports.
The Procter & Gamble Company Regulation G Reconciliation of Non-GAAP Measures
In accordance with the SEC's Regulation G, the following provides definitions of the non-GAAP measures used in Procter & Gamble's October 19, 2021 earnings call, associated slides, and other materials and the reconciliation to the most closely related GAAP measure. Management believes that these non-GAAP measures provide useful perspective on underlying business trends and provide a supplemental measure of period-to-period financial results. Disclosing these non-GAAP financial measures allows investors and management to view our operating results excluding the impact of items that are not reflective of the underlying operating performance. Management uses these non-GAAP measures in making operating decisions, allocating financial resources and for business strategy purposes. Certain of these measures are also used to evaluate senior management and are a factor in determining their at-risk compensation. Non-GAAP financial measures should be viewed in addition to, and not as an alternative for, the company’s reported results prepared in accordance with GAAP results. Our non-GAAP financial measures do not represent a comprehensive basis of accounting. Therefore, our non-GAAP financial measures may not be comparable to similarly titled measures reported by other companies. The Company is not able to reconcile its forward-looking non-GAAP cash flow and tax rate measures because the Company cannot predict the timing and amounts of discrete items such as acquisition and divestitures, which could significantly impact GAAP results.
The measures provided are as follows:
| 1. | Organic sales growth — page 3 |
| 2. | Core EPS and currency-neutral Core EPS — page 5 |
| 3. | Core gross margin and currency-neutral Core gross margin – page 6 |
| 4. | Core operating profit margin and currency-neutral Core operating profit margin — page 6 |
| 5. | Adjusted free cash flow productivity — page 6 |
The Core earnings measures included in the following reconciliation tables refer to the equivalent GAAP measures adjusted as applicable for the following items:
| ◾ | Incremental restructuring: The Company has historically had an ongoing level of restructuring activities. Such activities have resulted in ongoing annual restructuring related charges of approximately $250 - $500 million before tax. Beginning in 2012, the Company had a strategic productivity and cost savings initiative that resulted in incremental restructuring charges. The adjustment to Core earnings includes only the restructuring costs above what we believe are the normal recurring level of restructuring costs. In fiscal 2021 and onwards, the Company incurred restructuring costs within our historical ongoing level. |
| ◾ | Transitional Impact of U.S. Tax Act: In December 2017, the U.S. government enacted comprehensive tax legislation commonly referred to as the Tax Cuts and Jobs Act (the "U.S. Tax Act"). This resulted in a net charge of $602 million for the fiscal year 2018. The adjustment to Core earnings only includes this transitional impact. It does not include the ongoing impacts of the lower U.S. statutory rate on the respective years’ earnings. |
| ◾ | Early debt extinguishment charges: In the three months ended December 31, 2020, the company recorded after tax charges of $427 million ($512 million before tax), due to early extinguishment of certain long-term debt. These charges represent the difference between the reacquisition price and the par value of the debt extinguished. |
We do not view the above items to be part of our sustainable results, and their exclusion from core earnings measures provides a more comparable measure of year-on-year results. These items are also excluded when evaluating senior management in determining their at-risk compensation.
Organic sales growth: Organic sales growth is a non-GAAP measure of sales growth excluding the impacts of acquisitions and divestitures, the impact from the July 1, 2018 adoption of new accounting standards for “Revenue from Contracts with Customers”, the impact from India Goods and Services Tax changes (which were effective on July 1, 2017), the impact of Venezuela deconsolidation in 2016 and foreign exchange from year-over-year comparisons. Management believes this measure provides investors with a supplemental understanding of underlying sales trends by providing sales growth on a consistent basis. This measure is used in assessing achievement of management goals for at-risk compensation.
Core EPS and currency-neutral Core EPS*: Core earnings per share, or Core EPS, is a measure of the Company's diluted net earnings per share from continuing operations adjusted as indicated. Currency-neutral Core EPS is a measure of the Company's Core EPS excluding the incremental current year impact of foreign exchange.
Core gross margin: Core gross margin is a measure of the Company's gross margin adjusted for items as indicated. For the three months ended September 30, 2021 compared with the three months ended September 30, 2020, there are no adjustments to or reconciling items for gross margin.
Currency-neutral Core gross margin: Currency-neutral Core gross margin is a measure of the Company's Core gross margin excluding the incremental current year impact of foreign exchange.
Core operating profit margin*: Core operating profit margin is a measure of the Company's operating margin adjusted for items as indicated. For the three months ended September 30, 2021 compared with the three months ended September 30, 2020, there are no adjustments to or reconciling items for operating profit margin.
Currency-neutral Core operating profit margin*: Currency-neutral Core operating profit margin is a measure of the Company's Core operating profit margin excluding the incremental current year impact of foreign exchange.
Adjusted free cash flow: Adjusted free cash flow is defined as operating cash flow less capital spending and adjustments for items as indicated. Adjusted free cash flow represents the cash that the Company is able to generate after taking into account planned maintenance and asset expansion. Management views adjusted free cash flow as an important measure because it is one factor used in determining the amount of cash available for dividends, share repurchases, acquisitions and other discretionary investment.
Adjusted free cash flow productivity*: Adjusted free cash flow productivity is defined as the ratio of adjusted free cash flow to net earnings. Management views adjusted free cash flow productivity as a useful measure to help investors understand P&G’s ability to generate cash. This measure is used by management in making operating decisions, allocating financial resources and for budget planning purposes. The Company's long-term target is to generate annual free cash flow productivity at or above 90 percent.
* Measure is used to evaluate senior management and is a factor in determining their at-risk compensation.
1. Organic sales growth:
| Three Months Ended September 30, 2021 | Net Sales Growth | Foreign Exchange Impact | Acquisition & Divestiture Impact/Other* | Organic Sales Growth | |||
| Beauty | 5% | (3)% | -% | 2% | |||
| Grooming | 5% | (1)% | -% | 4% | |||
| Health Care | 8% | (1)% | -% | 7% | |||
| Fabric Care & Home Care | 5% | (1)% | 1% | 5% | |||
| Baby, Feminine & Family Care | 3% | (1)% | -% | 2% | |||
| Total P&G | 5% | (1)% | -% | 4% |
* Acquisition & Divestiture Impact/Other includes the volume and mix impact of acquisitions and divestitures and rounding impacts necessary to reconcile net sales to organic sales.
Organic Sales
Prior Quarters
Total Company | Net Sales Growth | Foreign Exchange Impact | Acquisition/ Divestiture Impact/Other* | Organic Sales Growth | |||
| JAS 2020 | 9% | 1% | (1)% | 9% | |||
| OND 2020 | 8% | -% | -% | 8% | |||
| JFM 2021 | 5% | (1)% | -% | 4% | |||
| AMJ 2021 | 7% | (3)% | -% | 4% |
* Acquisition & Divestiture Impact/Other includes the volume and mix impact of acquisitions and divestitures and rounding impacts necessary to reconcile net sales to organic sales.
Organic Sales
Prior Quarters Beauty
Total Beauty | Net Sales Growth | Foreign Exchange Impact | Acquisition/ Divestiture Impact/Other* | Organic Sales Growth | |||
| OND 2015 | (10)% | 7% | 4% | 1% | |||
| JFM 2016 | (8)% | 5% | 4% | 1% | |||
| AMJ 2016 | (5)% | 3% | 3% | 1% | |||
| JAS 2016 | (1)% | 2% | 2% | 3% | |||
| OND 2016 | (1)% | 2% | 2% | 3% | |||
| JFM 2017 | (2)% | 1% | 2% | 1% | |||
| AMJ 2017 | 2% | 2% | 1% | 5% | |||
| JAS 2017 | 5% | -% | -% | 5% | |||
| OND 2017 | 10% | (1)% | -% | 9% | |||
| JFM 2018 | 10% | (5)% | -% | 5% | |||
| AMJ 2018 | 10% | (3)% | -% | 7% | |||
| JAS 2018 | 5% | 3% | (1)% | 7% | |||
| OND 2018 | 4% | 4% | -% | 8% | |||
| JFM 2019 | 4% | 5% | -% | 9% | |||
| AMJ 2019 | 3% | 5% | -% | 8% | |||
| JAS 2019 | 8% | 2% | -% | 10% | |||
| OND 2019 | 7% | 1% | -% | 8% | |||
| JFM 2020 | (1)% | 2% | -% | 1% | |||
| AMJ 2020 | -% | 4% | (1)% | 3% | |||
| JAS 2020 | 7% | 1% | (1)% | 7% | |||
| OND 2020 | 6% | (1)% | -% | 5% | |||
| JFM 2021 | 9% | (2)% | -% | 7% | |||
| AMJ 2021 | 11% | (5)% | -% | 6% |
* Acquisition & Divestiture Impact/Other includes the volume and mix impact of acquisitions and divestitures for all periods, the impact from the July 1, 2018 adoption of new accounting standards for "Revenue from Contracts with Customers", the impact of India Goods and Services Tax implementation in FY 2018, the impact of Venezuela deconsolidation in 2016 and rounding impacts necessary to reconcile net sales to organic sales.
Organic Sales
Guidance
| Total Company | Net Sales Growth | Combined Foreign Exchange & Acquisition/Divestiture Impact/Other* | Organic Sales Growth | |||
| FY 2022 (Estimate) | +2% to +4% | - | +2% to +4% |
* Acquisition & Divestiture Impact/Other includes the volume and mix impact of acquisitions and divestitures and rounding impacts necessary to reconcile net sales to organic sales.
2. Core EPS and currency-neutral Core EPS:
| Three Months Ended September 30 | |||
| 2021 | 2020 | ||
| Diluted Net EPS | $1.61 | $1.63 | |
| Percentage change vs. prior period | (1)% | ||
| Adjustments* | - | - | |
| Core EPS | $1.61 | $1.63 | |
| Percentage change vs. prior period Core EPS | (1)% | ||
| Currency Impact to Earnings | (0.03) | ||
| Currency-Neutral Core EPS | $1.58 | ||
| Percentage change vs. prior period Core EPS | (3)% | ||
*For the three months ended September 30, 2021 compared with the three months ended September 30, 2020, there are no adjustments to or reconciling items for diluted net earnings per share.
Core EPS
Prior Quarters
| JAS 20 | JAS 19 | OND 20 | OND 19 | JFM 21 | JFM 20 | AMJ 21 | AMJ 20 | |
| Diluted Net Earnings Per Share attributable to P&G | $1.63 | $1.36 | $1.47 | $1.41 | $1.26 | $1.12 | $1.13 | $1.07 |
| Incremental Restructuring | - | 0.01 | - | 0.01 | - | 0.05 | - | 0.09 |
| Early Debt Extinguishment | - | - | 0.16 | - | - | - | - | - |
| Rounding | - | - | 0.01 | - | - | - | - | - |
| Core EPS | $1.63 | $1.37 | $1.64 | $1.42 | $1.26 | $1.17 | $1.13 | $1.16 |
| Percentage change vs. prior period | 19% | 15% | 8% | (3)% | ||||
| Currency Impact to Earnings | 0.04 | 0.03 | - | (0.02) | ||||
| Currency-Neutral Core EPS | $1.67 | $1.67 | $1.26 | $1.11 | ||||
| Percentage change vs. prior period Core EPS | 22% | 18% | 8% | (4)% |
Note – All reconciling items are presented net of tax. Tax effects are calculated consistent with the nature of the underlying transaction
Core EPS
Guidance
| Total Company | Diluted EPS Growth | Impact of Incremental Non-Core Items* | Core EPS Growth |
| FY 2022 (Estimate) | +6% to +9% | (3)% | +3% to +6% |
* Includes impact of charges for early debt extinguishment in fiscal 2021.
3. Core gross margin:
| Three Months Ended September 30 | ||
| 2021 | 2020 | |
| Gross Margin | 49.0% | 52.7% |
| Basis point change vs. prior year gross margin | (370) | |
| Adjustments* | - | - |
| Core Gross Margin | 49.0% | 52.7% |
| Basis point change vs. prior year Core gross margin | (370) | |
| Currency Impact to Margin | (0.2)% | |
| Currency-Neutral Core Gross Margin | 48.8% | |
| Basis point change vs prior year Core gross margin | (390) | |
*For the three months ended September 30, 2021 compared with the three months ended September 30, 2020, there are no adjustments to or reconciling items for gross margin.
4. Core operating profit margin:
| Three Months Ended September 30 | ||
| 2021 | 2020 | |
| Operating Profit Margin | 24.7% | 27.3% |
| Basis point change vs. prior year operating profit margin | (260) | |
| Adjustments* | - | - |
| Core Operating Profit Margin | 24.7% | 27.3% |
| Basis point change vs. prior year Core operating profit margin | (260) | |
| Currency Impact Margin | (0.1)% | |
| Currency-Neutral Core Operating Profit Margin | 24.6% | |
| Basis point change vs. prior year operating profit margin | (270) | |
*For the three months ended September 30, 2021 compared with the three months ended September 30, 2020, there are no adjustments to or reconciling items for operating profit margin.
5. Adjusted free cash flow productivity (dollar amounts in millions):
| Operating Cash Flow | Capital Spending | U.S. Tax Act Payment | Adjusted Free Cash Flow | Net Earnings | Adjusted Free Cash Flow Productivity |
| $4,643 | $(1,091) | $225 | $3,777 | $4,126 | 92% |