


The Procter & Gamble Company Regulation G Reconciliation of Non-GAAP Measures
The following provides definitions of the non-GAAP measures used in Procter & Gamble's October 18, 2023, earnings call, associated slides and other materials and the reconciliation to the most closely related GAAP measure. We believe that these non-GAAP measures provide useful perspective on underlying business trends (i.e., trends excluding non-recurring or unusual items) and results and provide a supplemental measure of year-on-year results.
The non-GAAP measures described below are used by Management in making operating decisions, allocating financial resources and for business strategy purposes. These measures may be useful to investors, as they provide supplemental information about business performance and provide investors a view of our business results through the eyes of Management. Certain of these measures are also used to evaluate senior management and are a factor in determining their at-risk compensation.
These non-GAAP measures are not intended to be considered by the user in place of the related GAAP measure, but rather as supplemental information to our business results. These non-GAAP measures may not be the same as similar measures used by other companies due to possible differences in method and in the items or events being adjusted.
The Company is not able to reconcile its forward-looking non-GAAP cash flow and effective tax rate measures because the Company cannot predict the timing and amounts of discrete items such as acquisition and divestitures, which could significantly impact GAAP results.
The following measures are provided:
| 1. | Organic sales growth — page 2 |
| 2. | Core EPS and currency-neutral Core EPS — page 2 |
| 3. | Core gross margin and currency-neutral Core gross margin — page 3 |
| 4. | Core operating margin and currency-neutral Core operating margin — page 3 |
| 5. | Adjusted free cash flow and adjusted free cash flow productivity — page 4 |
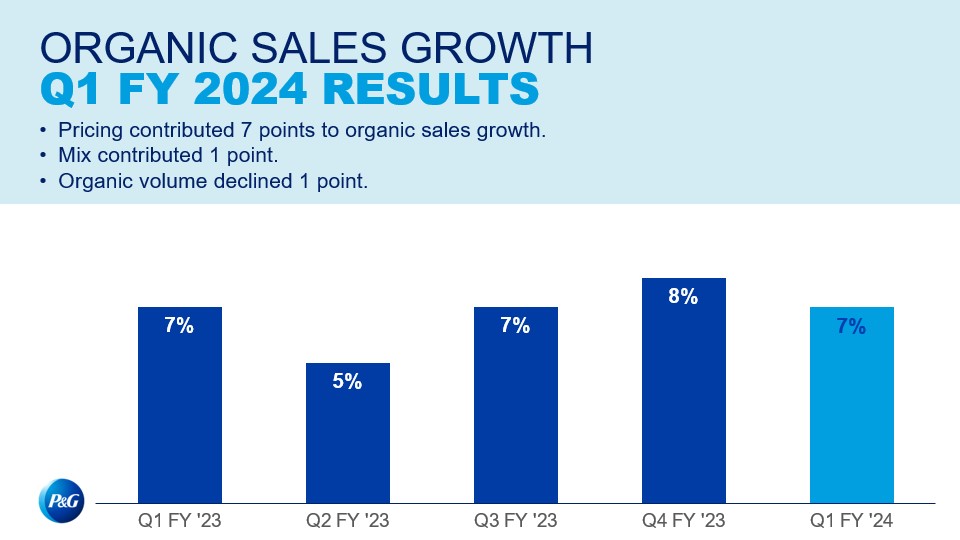
Organic sales growth: Organic sales growth is a non-GAAP measure of sales growth excluding the impacts of acquisitions and divestitures and foreign exchange from year-over-year comparisons. We believe this measure provides investors with a supplemental understanding of underlying sales trends by providing sales growth on a consistent basis. This measure is also used in assessing the achievement of management goals for at-risk compensation.
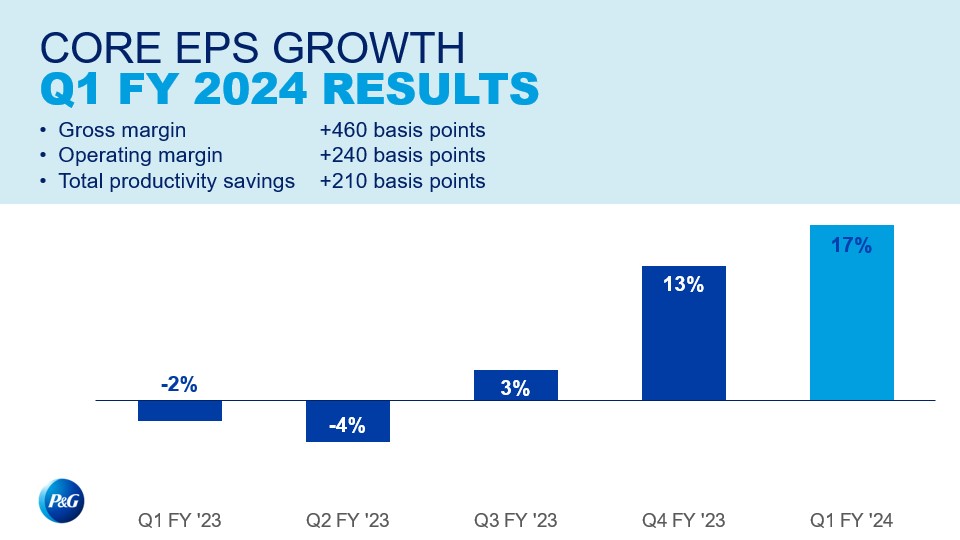
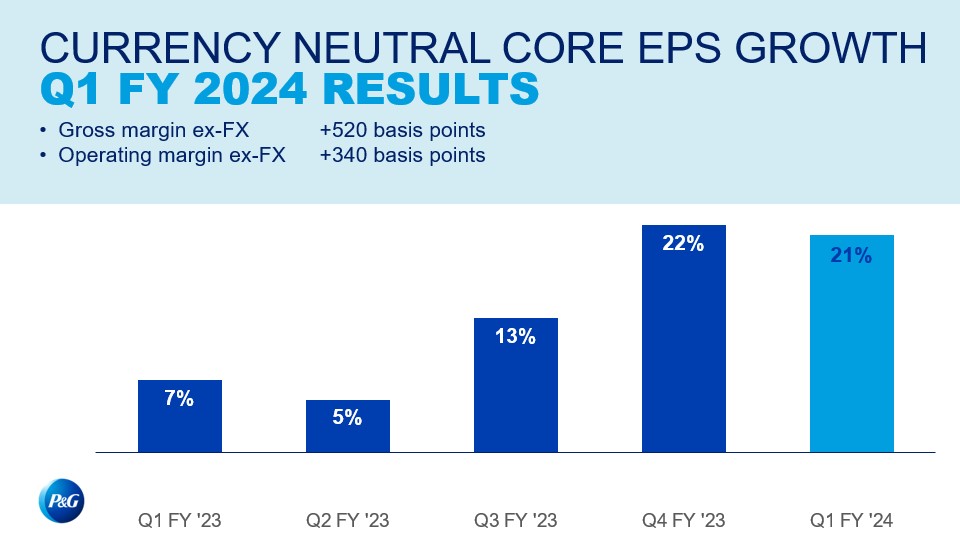
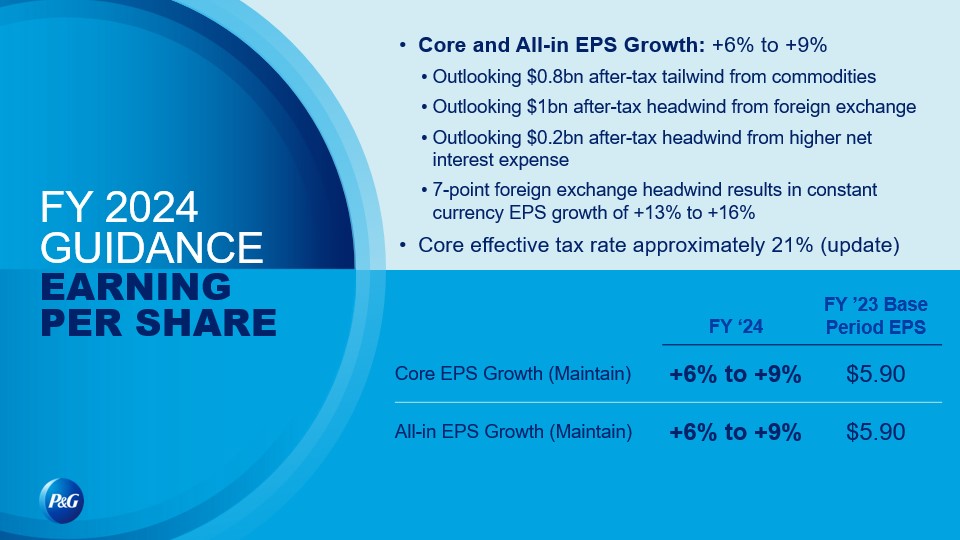
Core EPS and currency-neutral Core EPS: Core earnings per share, or Core EPS, is a measure of the Company's diluted net earnings per common share from continuing operations excluding items that are not judged by management to be part of the Company’s sustainable results or trends. Management views this non-GAAP measure as a useful supplemental measure of Company performance over time. This measure is also used in assessing the achievement of management goals for at-risk compensation. Currency-neutral Core EPS is a measure of the Company's Core EPS excluding the incremental current year impact of foreign exchange. For the period covered in the following reconciliation tables, there are no reconciling items for Core EPS.
Core gross margin and currency-neutral Core gross margin: Core gross margin is a measure of the Company's gross margin adjusted for items as indicated. Currency-neutral Core gross margin is a measure of the Company's Core gross margin excluding the incremental current year impact of foreign exchange.
Core operating margin and currency-neutral Core operating margin: Core operating margin is a measure of the Company's operating margin adjusted for items as indicated. Currency-neutral Core operating margin is a measure of the Company’s Core operating margin excluding the incremental current year impact of foreign exchange.
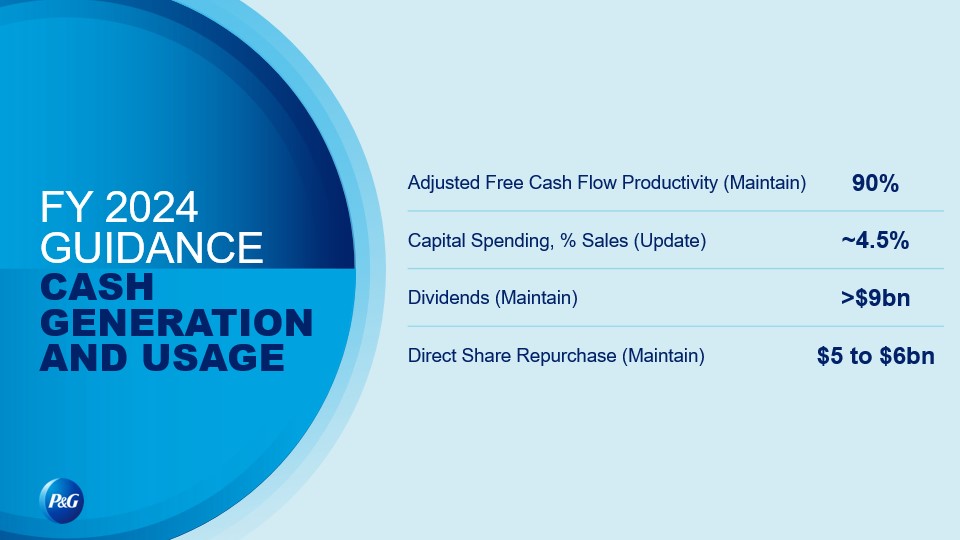
Adjusted free cash flow: Adjusted free cash flow is defined as operating cash flow less capital spending and adjusted for transitional tax payments resulting from the U.S. Tax Act. Adjusted free cash flow represents the cash that the Company is able to generate after taking into account planned maintenance and asset expansion. Management views adjusted free cash flow as an important measure because it is one factor used in determining the amount of cash available for dividends, share repurchases, acquisitions and other discretionary investment.
Adjusted free cash flow productivity: Adjusted free cash flow productivity is defined as the ratio of adjusted free cash flow to net earnings adjusted as indicated. Management views adjusted free cash flow productivity as a useful measure to help investors understand P&G’s ability to generate cash. This measure is used by management in making operating decisions, allocating financial resources and for budget planning purposes.
1. Organic sales growth:
Three Months Ended September 30, 2023 | Net Sales Growth | Foreign Exchange Impact | Acquisition & Divestiture Impact/Other* | Organic Sales Growth | |||
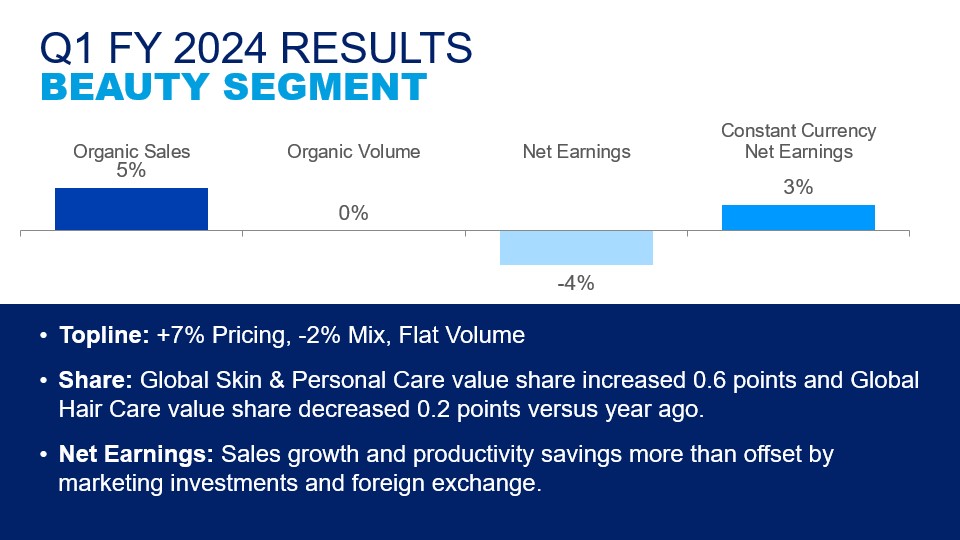
| Beauty | 3% | 3% | (1)% | 5% | |||
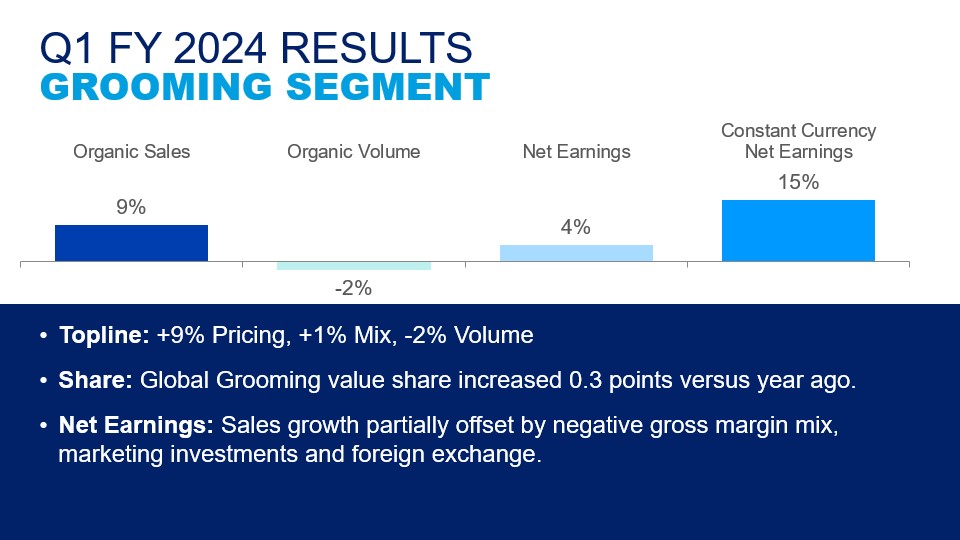
| Grooming | 6% | 3% | —% | 9% | |||
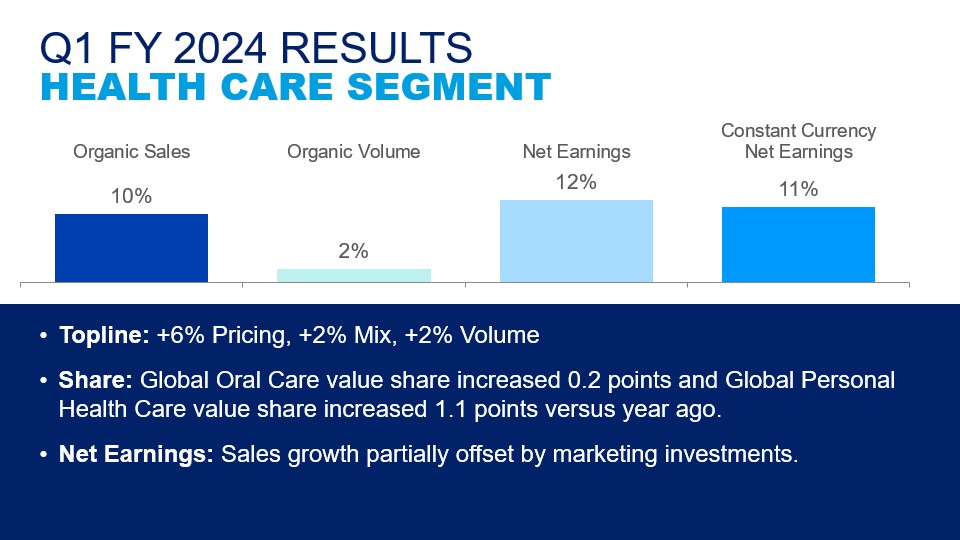
| Health Care | 11% | (1)% | —% | 10% | |||
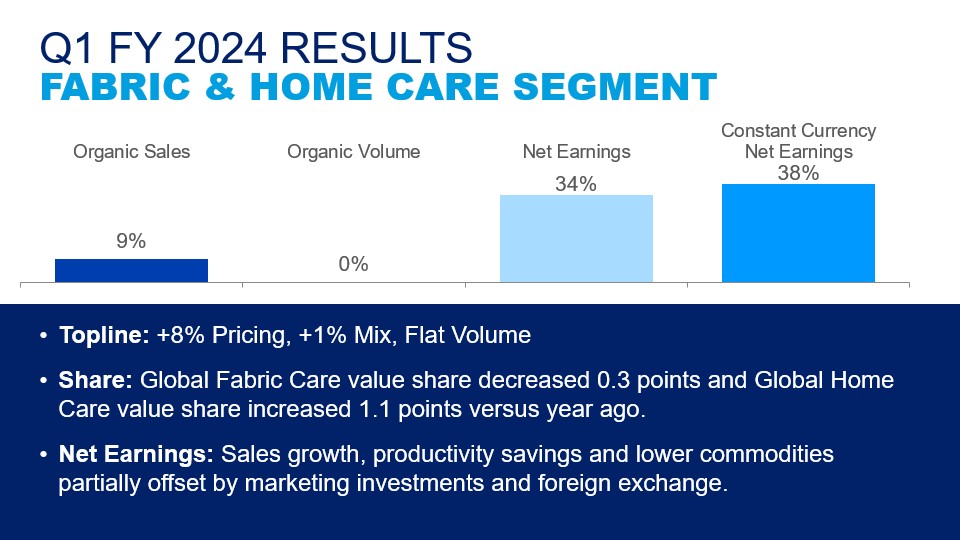
| Fabric Care & Home Care | 8% | 1% | —% | 9% | |||
| Baby, Feminine & Family Care | 5% | 2% | —% | 7% | |||
| Total Company | 6% | 1% | —% | 7% |
* Acquisition & Divestiture Impact/Other includes the volume and mix impact of acquisitions and divestitures and rounding impacts necessary to reconcile net sales to organic sales.
Organic Sales
Prior Quarters
Total Company | Net Sales Growth | Foreign Exchange Impact | Acquisition/ Divestiture Impact/Other* | Organic Sales Growth | |||
| Q1 FY 2023 | 1% | 6% | —% | 7% | |||
| Q2 FY 2023 | (1)% | 6% | —% | 5% | |||
| Q3 FY 2023 | 4% | 4% | (1)% | 7% | |||
| Q4 FY 2023 | 5% | 4% | (1)% | 8% |
* Acquisition & Divestiture Impact/Other includes the volume and mix impact of acquisitions and divestitures and rounding impacts necessary to reconcile net sales to organic sales.
Organic Sales
Guidance
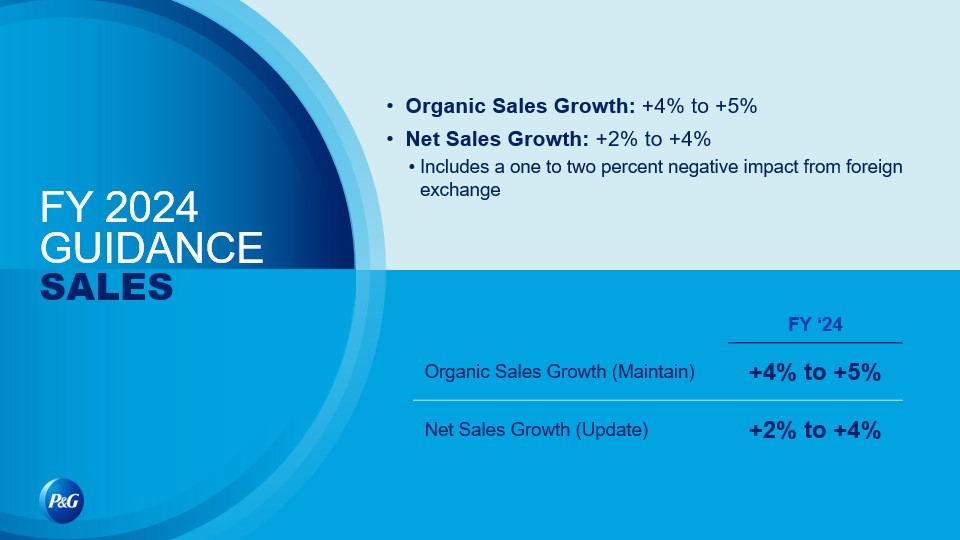
| Total Company | Net Sales Growth | Combined Foreign Exchange & Acquisition/Divestiture Impact/Other* | Organic Sales Growth | |||
| FY 2024 (Estimate) | +2% to +4% | +1% to +2% | +4% to +5% |
* Acquisition & Divestiture Impact/Other includes the volume and mix impact of acquisitions and divestitures and rounding impacts necessary to reconcile net sales to organic sales.
2. Core EPS and currency-neutral Core EPS:
| Three Months Ended September 30 | ||
| 2023 | 2022 | |
| Diluted Net EPS | $1.83 | $1.57 |
| Adjustments* | — | — |
| Core EPS | $1.83 | $1.57 |
| Percentage change vs. prior period Core EPS | 17% | |
| Currency Impact to Earnings | 0.07 | |
| Currency-Neutral Core EPS | $1.90 | |
| Percentage change vs. prior period Core EPS | 21% | |
* For the three months ended September 30, 2023, compared with the three months ended September 30, 2022, there were no adjustments to or reconciling items for diluted EPS.
Core EPS and Currency-Neutral Core EPS
Prior Quarters
Q1 FY23 | Q1 FY22 | Q2 FY23 | Q2 FY22 | Q3 FY23 | Q3 FY22 | Q4 FY23 | Q4 FY22 | |
| Diluted Net EPS | $1.57 | $1.61 | $1.59 | $1.66 | $1.37 | $1.33 | $1.37 | $1.21 |
| Adjustments | — | — | — | — | — | — | — | — |
| Core EPS | $1.57 | $1.61 | $1.59 | $1.66 | $1.37 | $1.33 | $1.37 | $1.21 |
| Percentage change vs. prior period | (2)% | (4)% | 3% | 13% | ||||
| Currency Impact to Earnings | 0.16 | 0.16 | 0.13 | 0.11 | ||||
| Currency-Neutral Core EPS | $1.73 | $1.75 | $1.50 | $1.48 | ||||
| Percentage change vs. prior period Core EPS | 7% | 5% | 13% | 22% |
Note – All reconciling items are presented net of tax. Tax effects are calculated consistent with the nature of the underlying transaction.
Currency-neutral EPS
Guidance
| Total Company | Diluted EPS Growth | Impact of FX | Currency-neutral EPS Growth |
| FY 2024 (Estimate) | +6% to +9% | +7% | +13% to +16% |
3. Core gross margin and currency-neutral Core gross margin:
| Three Months Ended September 30 | ||
| 2023 | 2022 | |
| Gross Margin | 52.0% | 47.4% |
| Adjustments* | — | — |
| Core Gross Margin | 52.0% | 47.4% |
| Basis point change vs. prior year Core gross margin | 460 | |
| Currency Impact to Margin | 0.6% | |
| Currency-Neutral Core Gross Margin | 52.6% | |
| Basis point change vs prior year Core gross margin | 520 | |
* For the three months ended September 30, 2023, compared with the three months ended September 30, 2022, there were no adjustments to or reconciling items for gross margin.
4. Core operating margin and currency-neutral Core operating margin:
| Three Months Ended September 30 | ||
| 2023 | 2022 | |
| Operating Margin | 26.4% | 24.0% |
| Adjustments* | — | |
| Core Operating Margin | 26.4% | 24.0% |
| Basis point change vs. prior year Core operating margin | 240 | |
| Currency Impact Margin | 1.0% | |
| Currency-Neutral Core Operating Margin | 27.4% | |
| Basis point change vs. prior year Core operating margin | 340 | |
* For the three months ended September 30, 2023, compared with the three months ended September 30, 2022, there were no adjustments to or reconciling items for operating margin.
5. Adjusted free cash flow and adjusted free cash flow productivity (dollar amounts in millions):
| Three Months Ended September 30, 2023 | |||||
| Operating Cash Flow | Capital Spending | U.S. Tax Act Payments | Adjusted Free Cash Flow | Net Earnings | Adjusted Free Cash Flow Productivity |
| $4,904 | $(925) | $422 | $4,401 | $4,556 | 97% |