EARNINGSRELEASE Q1 FY 2025 RESULTS October 18, 2024
STRATEGY & FOCUS AREAS INTEGRATED GROWTH STRATEGY AREAS OF FOCUS ENVIRONMENTAL SUSTAINABILITY DIGITAL ACUMEN EMPLOYEE VALUE EQUATION SUPPLY CHAIN SUPERIORITY TO WIN WITH CONSUMERS PRODUCTIVITY TO FUEL INVESTMENTS ORGANIZATION EMPOWERED • AGILE ACCOUNTABLE PORTFOLIO PERFORMANCE DRIVES BRAND CHOICE CONSTRUCTIVE DISRUPTION ACROSS OUR BUSINESS
BUSINESS RESULTS Q1 FY 2025
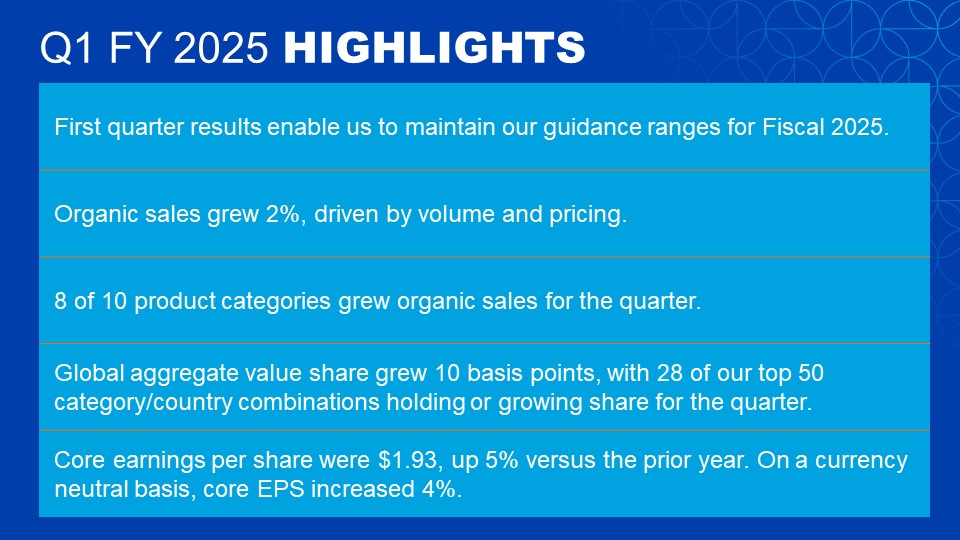
Q1 FY 2025 HIGHLIGHTS First quarter results enable us to maintain our guidance ranges for Fiscal 2025. Organic sales grew 2%, driven by volume and pricing. 8 of 10 product categories grew organic sales for the quarter. Global aggregate value share grew 10 basis points, with 28 of our top 50 category/country combinations holding or growing share for the quarter. Core earnings per share were $1.93, up 5% versus the prior year. On a currency neutral basis, core EPS increased 4%.
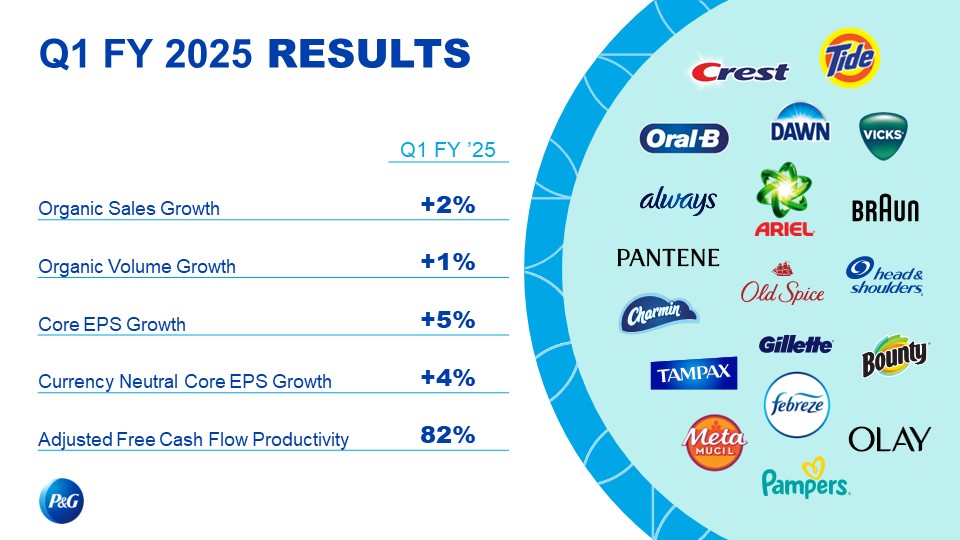
Q1 FY 2025 RESULTS Q1 FY ’25 Organic Sales Growth +2% Organic Volume Growth +1% Core EPS Growth +5% Currency Neutral Core EPS Growth +4% Adjusted Free Cash Flow Productivity 82%
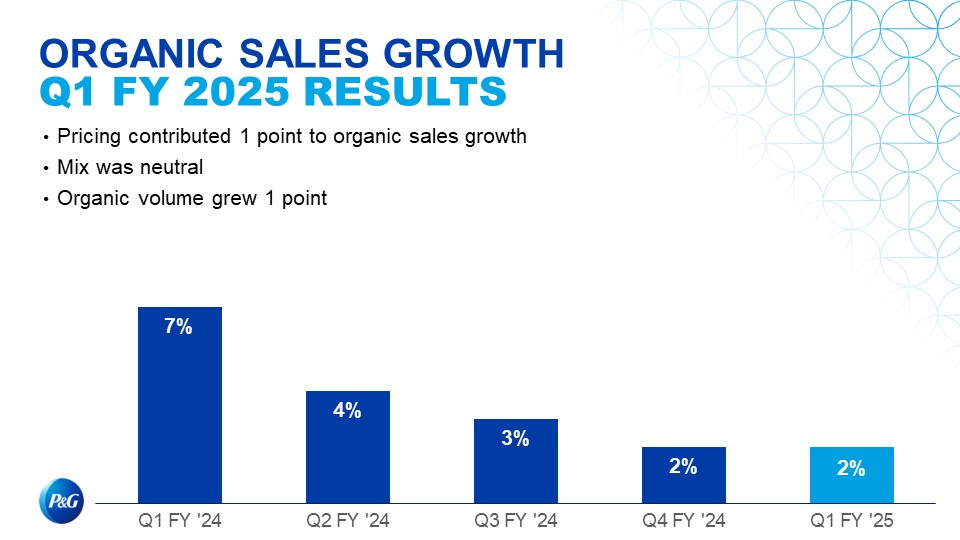
ORGANIC SALES GROWTHQ1 FY 2025 RESULTS Pricing contributed 1 point to organic sales growth Mix was neutral Organic volume grew 1 point
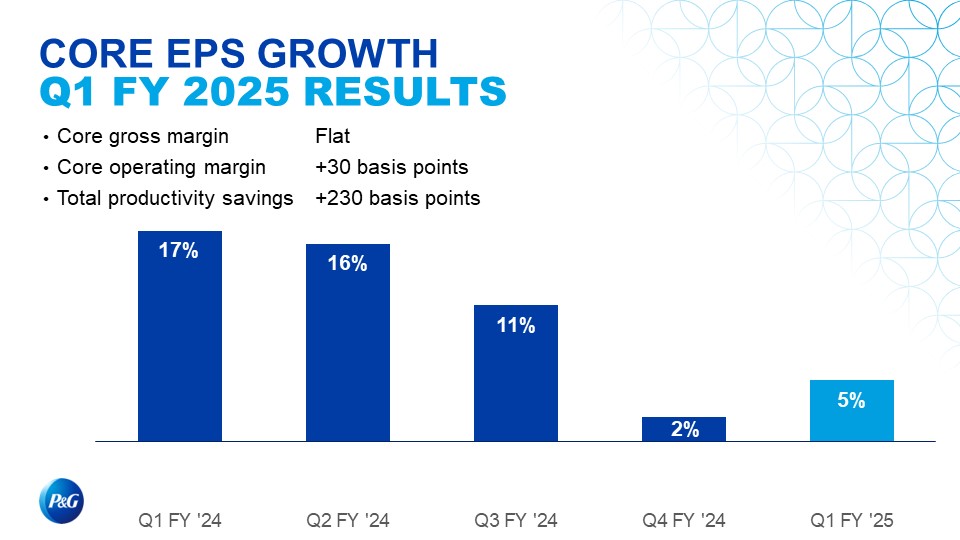
CORE EPS GROWTHQ1 FY 2025 RESULTS Core gross margin Core operating margin Total productivity savings Flat +30 basis points +230 basis points
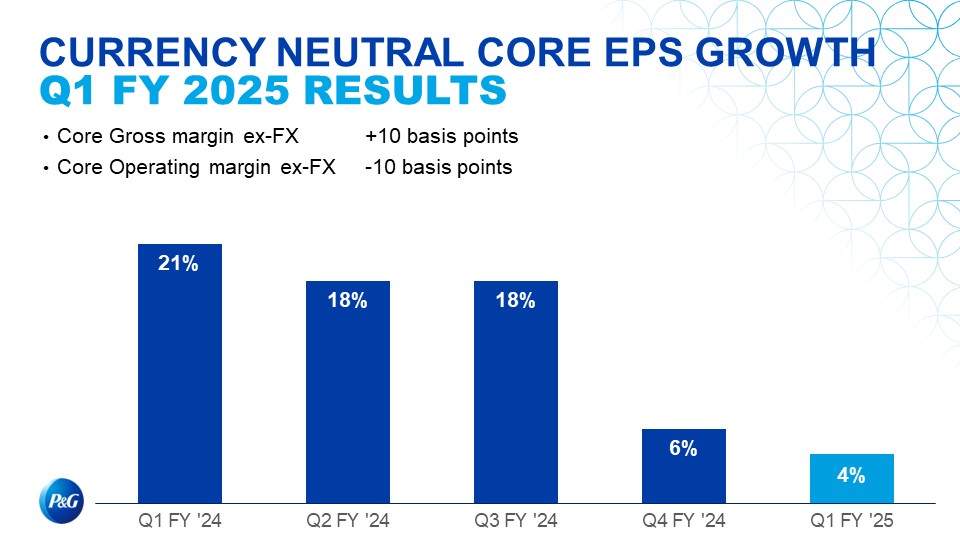
CURRENCY NEUTRAL CORE EPS GROWTHQ1 FY 2025 RESULTS Core Gross margin ex-FX Core Operating margin ex-FX +10 basis points -10 basis points
GLOBAL MARKET SHARES Top 50 Category/ Country Combinations # Grew/Held Value Share Share data through August 2024
SEGMENT RESULTS Q1 FY 2025
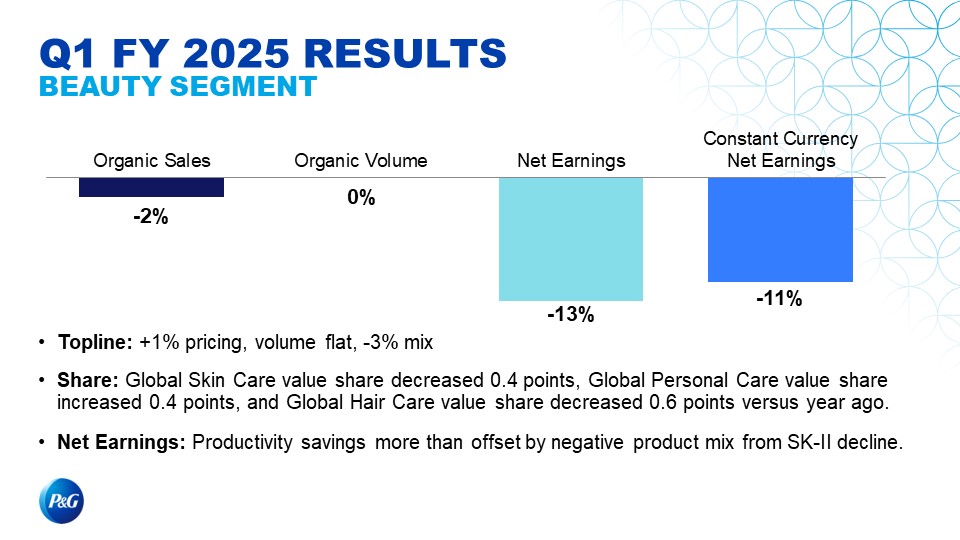
Q1 FY 2025 RESULTSBEAUTY SEGMENT Topline: +1% pricing, volume flat, -3% mix Share: Global Skin Care value share decreased 0.4 points, Global Personal Care value share increased 0.4 points, and Global Hair Care value share decreased 0.6 points versus year ago. Net Earnings: Productivity savings more than offset by negative product mix from SK-II decline.
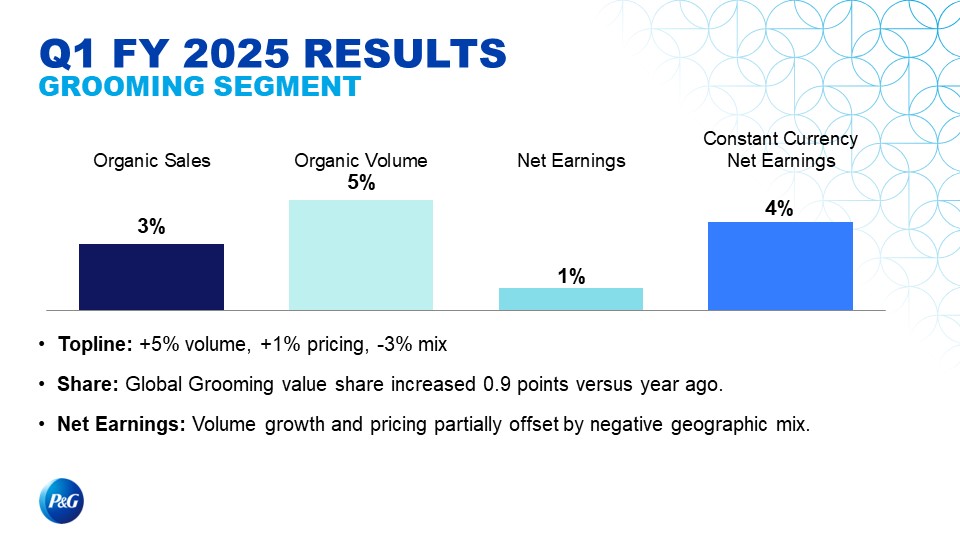
Q1 FY 2025 RESULTSGROOMING SEGMENT Topline: +5% volume, +1% pricing, -3% mix Share: Global Grooming value share increased 0.9 points versus year ago. Net Earnings: Volume growth and pricing partially offset by negative geographic mix.
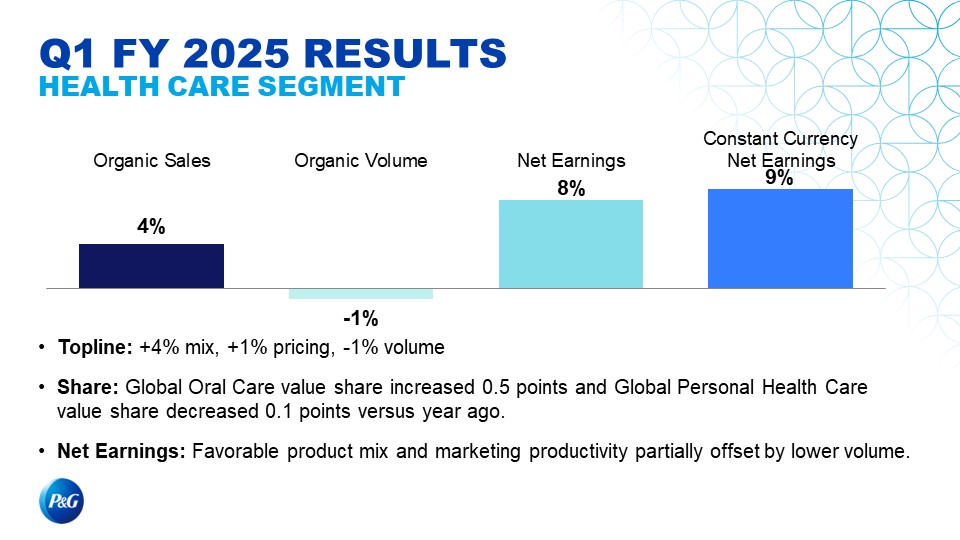
Q1 FY 2025 RESULTSHEALTH CARE SEGMENT Topline: +4% mix, +1% pricing, -1% volume Share: Global Oral Care value share increased 0.5 points and Global Personal Health Care value share decreased 0.1 points versus year ago. Net Earnings: Favorable product mix and marketing productivity partially offset by lower volume.
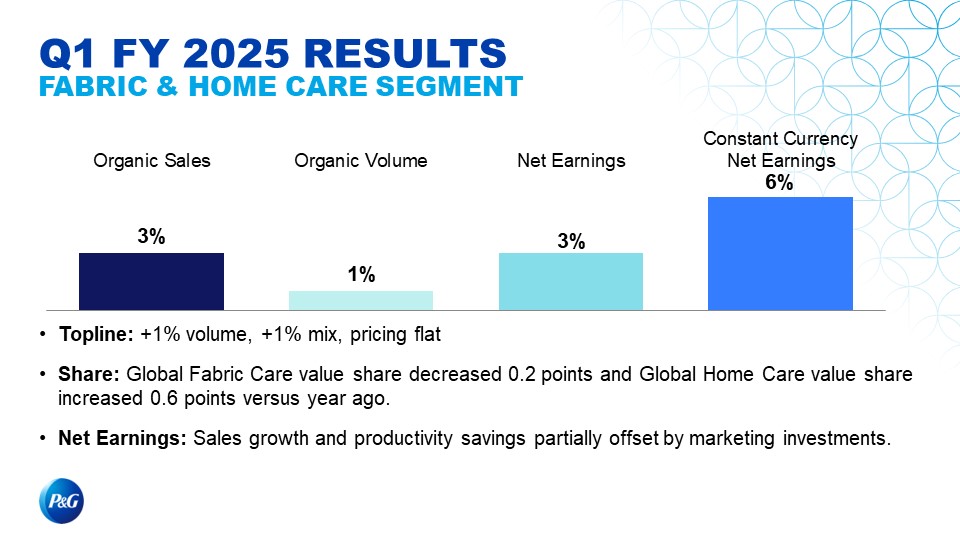
Q1 FY 2025 RESULTSFABRIC & HOME CARE SEGMENT Topline: +1% volume, +1% mix, pricing flat Share: Global Fabric Care value share decreased 0.2 points and Global Home Care value share increased 0.6 points versus year ago. Net Earnings: Sales growth and productivity savings partially offset by marketing investments.
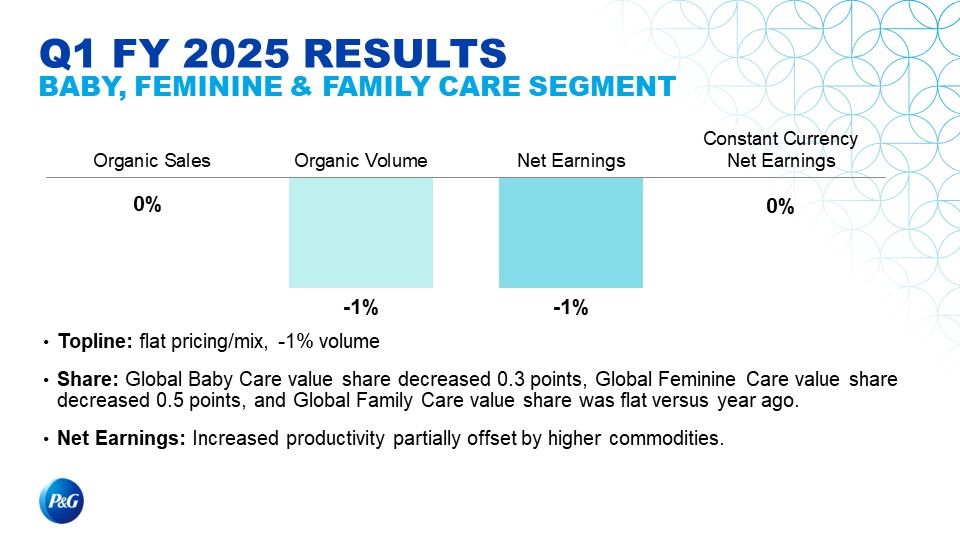
Q1 FY 2025 RESULTSBABY, FEMININE & FAMILY CARE SEGMENT Topline: flat pricing/mix, -1% volume Share: Global Baby Care value share decreased 0.3 points, Global Feminine Care value share decreased 0.5 points, and Global Family Care value share was flat versus year ago. Net Earnings: Increased productivity partially offset by higher commodities.
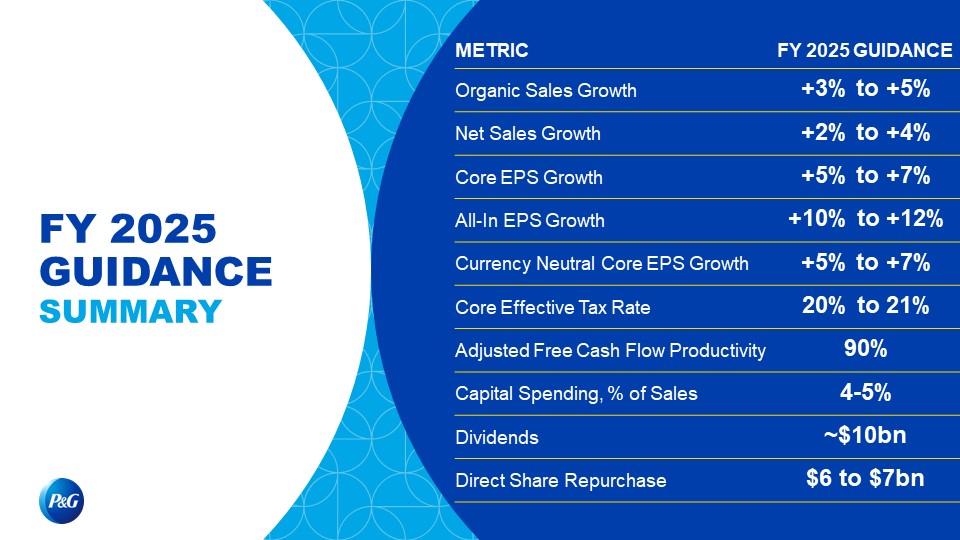
FY 2025 GUIDANCESALES Organic Sales Growth: +3% to +5% Net Sales Growth: +2% to +4% Includes a 1% negative impact from foreign exchange and acquisitions and divestitures FY ‘25 Organic Sales Growth (Maintain) +3% to +5% Net Sales Growth (Maintain) +2% to +4%
FY 2025 GUIDANCEEARNINGS PER SHARE Core EPS Growth: +5% to +7% Outlooking $0.2bn after-tax headwind from commodities Currency neutral core EPS growth of +5% to +7% (expect foreign exchange to be neutral) Prior fiscal year benefits from minor divestitures and tax that won’t repeat represents an additional $0.10 to $0.12 headwind to EPS All-in EPS Growth: 10% to 12% Core effective tax rate approximately 20% to 21% FY ‘25 FY ’24 Base Period EPS Core EPS Growth (Maintain) +5% to +7% $6.59 All-in EPS Growth (Maintain) +10% to +12% $6.02
FY 2025 GUIDANCECASH GENERATION AND USAGE Adjusted Free Cash Flow Productivity (Maintain) 90% Capital Spending, % Sales (Maintain) 4-5% Dividends (Maintain) ~$10bn Direct Share Repurchase (Maintain) $6 to $7bn
METRIC FY 2025 GUIDANCE Organic Sales Growth +3% to +5% Net Sales Growth +2% to +4% Core EPS Growth +5% to +7% All-In EPS Growth +10% to +12% Currency Neutral Core EPS Growth +5% to +7% Core Effective Tax Rate 20% to 21% Adjusted Free Cash Flow Productivity 90% Capital Spending, % of Sales 4-5% Dividends ~$10bn Direct Share Repurchase $6 to $7bn FY 2025 GUIDANCESUMMARY
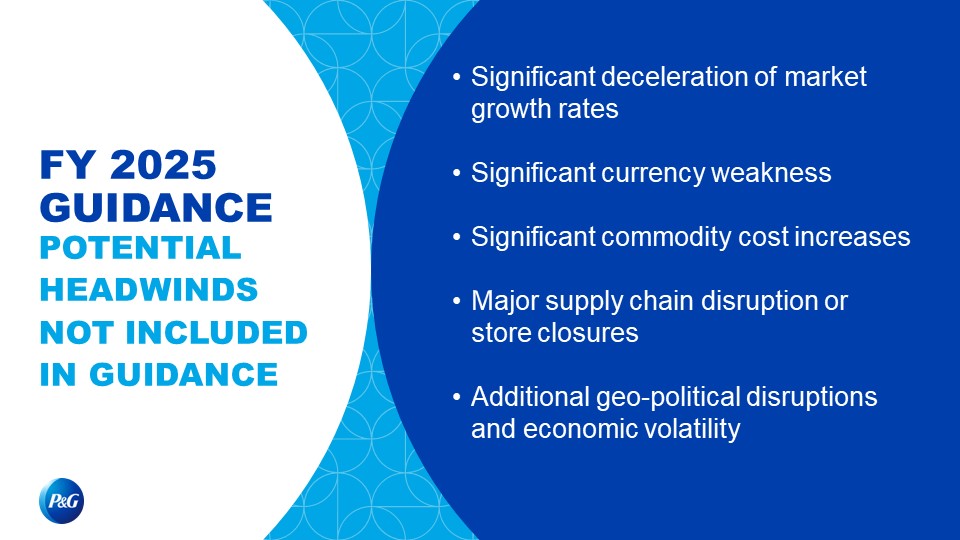
FY 2025 GUIDANCEPOTENTIAL HEADWINDS NOT INCLUDED IN GUIDANCE Significant deceleration of market growth rates Significant currency weakness Significant commodity cost increases Major supply chain disruption or store closures Additional geo-political disruptions and economic volatility
ESG RESOURCESESG FOR INVESTORS WEBSITE – pginvestor.com/esg Climate Waste Water Nature TCFD SASB CDP GRI 102 Equality & Inclusion Policies & Practices Community Impact Employee Representation Board Representation EEO-1 Commitment to Governance Risk Oversight & Committee Structure Proxy Statement Governance Policies Our Approach to Tax Corporate Structure
FORWARD LOOKING STATEMENTS Certain statements in this presentation, other than purely historical information, including estimates, projections, statements relating to our business plans, objectives and expected operating results, and the assumptions upon which those statements are based, are "forward-looking statements" within the meaning of the Private Securities Litigation Reform Act of 1995, Section 27A of the Securities Act of 1933 and Section 21E of the Securities Exchange Act of 1934. These forward-looking statements generally are identified by the words "believe," "project," "expect," "anticipate," "estimate," "intend," "strategy," "future," "opportunity," "plan," "may," "should," "will," "would," "will be," "will continue," "will likely result" and similar expressions. Forward-looking statements are based on current expectations and assumptions, which are subject to risks and uncertainties that may cause results to differ materially from those expressed or implied in the forward-looking statements. We undertake no obligation to update or revise publicly any forward-looking statements, whether because of new information, future events or otherwise, except to the extent required by law. Risks and uncertainties to which our forward-looking statements are subject include, without limitation: (1) the ability to successfully manage global financial risks, including foreign currency fluctuations, currency exchange or pricing controls; (2) the ability to successfully manage local, regional or global economic volatility, including reduced market growth rates, and to generate sufficient income and cash flow to allow the Company to effect the expected share repurchases and dividend payments; (3) the ability to successfully manage uncertainties related to changing political and geopolitical conditions and potential implications such as exchange rate fluctuations, market contraction, boycotts, sanctions, or other trade controls; (4) the ability to manage disruptions in credit markets or to our banking partners or changes to our credit rating; (5) the ability to maintain key manufacturing and supply arrangements (including execution of supply chain optimizations and sole supplier and sole manufacturing plant arrangements) and to manage disruption of business due to various factors, including ones outside of our control, such as natural disasters, acts of war or terrorism or disease outbreaks; (6) the ability to successfully manage cost fluctuations and pressures, including prices of commodities and raw materials and costs of labor, transportation, energy, pension and healthcare; (7) the ability to compete with our local and global competitors in new and existing sales channels, including by successfully responding to competitive factors such as prices, promotional incentives and trade terms for products; (8) the ability to manage and maintain key customer relationships; (9) the ability to protect our reputation and brand equity by successfully managing real or perceived issues, including concerns about safety, quality, ingredients, efficacy, packaging content, supply chain practices or similar matters that may arise; (10) the ability to successfully manage the financial, legal, reputational and operational risk associated with third-party relationships, such as our suppliers, contract manufacturers, distributors, contractors and external business partners; (11) the ability to rely on and maintain key company and third- party information and operational technology systems, networks and services and maintain the security and functionality of such systems, networks and services and the data contained therein; (12) the ability to successfully manage the demand, supply and operational challenges, as well as governmental responses or mandates, associated with a disease outbreak, including epidemics, pandemics or similar widespread public health concerns; (13) the ability to stay on the leading edge of innovation, obtain necessary intellectual property protections and successfully respond to changing consumer habits, evolving digital marketing and selling platform requirements and technological advances attained by, and patents granted to, competitors; (14) the ability to successfully manage our ongoing acquisition, divestiture and joint venture activities, in each case to achieve the Company’s overall business strategy and financial objectives, without impacting the delivery of base business objectives; (15) the ability to successfully achieve productivity improvements and cost savings and manage ongoing organizational changes while successfully identifying, developing and retaining key employees, including in key growth markets where the availability of skilled or experienced employees may be limited; (16) the ability to successfully manage current and expanding regulatory and legal requirements and matters (including, without limitation, those laws and regulations involving product liability, product and packaging composition, manufacturing processes, intellectual property, labor and employment, antitrust, privacy, cybersecurity and data protection, artificial intelligence, tax, the environment, due diligence, risk oversight, accounting and financial reporting) and to resolve new and pending matters within current estimates; (17) the ability to manage changes in applicable tax laws and regulations; and (18) the ability to successfully achieve our ambition of reducing our greenhouse gas emissions and delivering progress towards our environmental sustainability priorities. For additional information concerning factors that could cause actual results and events to differ materially from those projected herein, please refer to our most recent 10-K, 10-Q and 8-K reports.
FORWARD LOOKING STATEMENTS Certain statements in this presentation, other than purely historical information, including estimates, projections, statements relating to our business plans, objectives and expected operating results, and the assumptions upon which those statements are based, are "forward-looking statements" within the meaning of the Private Securities Litigation Reform Act of 1995, Section 27A of the Securities Act of 1933 and Section 21E of the Securities Exchange Act of 1934. These forward-looking statements generally are identified by the words "believe," "project," "expect," "anticipate," "estimate," "intend," "strategy," "future," "opportunity," "plan," "may," "should," "will," "would," "will be," "will continue," "will likely result" and similar expressions. Forward-looking statements are based on current expectations and assumptions, which are subject to risks and uncertainties that may cause results to differ materially from those expressed or implied in the forward-looking statements. We undertake no obligation to update or revise publicly any forward-looking statements, whether because of new information, future events or otherwise, except to the extent required by law. Risks and uncertainties to which our forward-looking statements are subject include, without limitation: (1) the ability to successfully manage global financial risks, including foreign currency fluctuations, currency exchange or pricing controls; (2) the ability to successfully manage local, regional or global economic volatility, including reduced market growth rates, and to generate sufficient income and cash flow to allow the Company to effect the expected share repurchases and dividend payments; (3) the ability to successfully manage uncertainties related to changing political and geopolitical conditions and potential implications such as exchange rate fluctuations, market contraction, boycotts, sanctions, or other trade controls; (4) the ability to manage disruptions in credit markets or to our banking partners or changes to our credit rating; (5) the ability to maintain key manufacturing and supply arrangements (including execution of supply chain optimizations and sole supplier and sole manufacturing plant arrangements) and to manage disruption of business due to various factors, including ones outside of our control, such as natural disasters, acts of war or terrorism or disease outbreaks; (6) the ability to successfully manage cost fluctuations and pressures, including prices of commodities and raw materials and costs of labor, transportation, energy, pension and healthcare; (7) the ability to compete with our local and global competitors in new and existing sales channels, including by successfully responding to competitive factors such as prices, promotional incentives and trade terms for products; (8) the ability to manage and maintain key customer relationships; (9) the ability to protect our reputation and brand equity by successfully managing real or perceived issues, including concerns about safety, quality, ingredients, efficacy, packaging content, supply chain practices or similar matters that may arise; (10) the ability to successfully manage the financial, legal, reputational and operational risk associated with third-party relationships, such as our suppliers, contract manufacturers, distributors, contractors and external business partners; (11) the ability to rely on and maintain key company and third- party information and operational technology systems, networks and services and maintain the security and functionality of such systems, networks and services and the data contained therein; (12) the ability to successfully manage the demand, supply and operational challenges, as well as governmental responses or mandates, associated with a disease outbreak, including epidemics, pandemics or similar widespread public health concerns; (13) the ability to stay on the leading edge of innovation, obtain necessary intellectual property protections and successfully respond to changing consumer habits, evolving digital marketing and selling platform requirements and technological advances attained by, and patents granted to, competitors; (14) the ability to successfully manage our ongoing acquisition, divestiture and joint venture activities, in each case to achieve the Company’s overall business strategy and financial objectives, without impacting the delivery of base business objectives; (15) the ability to successfully achieve productivity improvements and cost savings and manage ongoing organizational changes while successfully identifying, developing and retaining key employees, including in key growth markets where the availability of skilled or experienced employees may be limited; (16) the ability to successfully manage current and expanding regulatory and legal requirements and matters (including, without limitation, those laws and regulations involving product liability, product and packaging composition, manufacturing processes, intellectual property, labor and employment, antitrust, privacy, cybersecurity and data protection, artificial intelligence, tax, the environment, due diligence, risk oversight, accounting and financial reporting) and to resolve new and pending matters within current estimates; (17) the ability to manage changes in applicable tax laws and regulations; and (18) the ability to successfully achieve our ambition of reducing our greenhouse gas emissions and delivering progress towards our environmental sustainability priorities. For additional information concerning factors that could cause actual results and events to differ materially from those projected herein, please refer to our most recent 10-K, 10-Q and 8-K reports.
The Procter & Gamble Company Regulation G Reconciliation of Non-GAAP Measures
The following provides definitions of the non-GAAP measures used in Procter & Gamble's October 18, 2024 earnings call, associated slides and other materials and the reconciliation to the most closely related GAAP measure. We believe that these non-GAAP measures provide useful perspective on underlying business trends (i.e., trends excluding non-recurring or unusual items) and results and provide a supplemental measure of year-on-year results.
The non-GAAP measures described below are used by Management in making operating decisions, allocating financial resources and for business strategy purposes. These measures may be useful to investors, as they provide supplemental information about business performance and provide investors a view of our business results through the eyes of Management. Certain of these measures are also used to evaluate senior management and are a factor in determining their at-risk compensation.
These non-GAAP measures are not intended to be considered by the user in place of the related GAAP measure, but rather as supplemental information to our business results. These non-GAAP measures may not be the same as similar measures used by other companies due to possible differences in method and in the items or events being adjusted.
The Company is not able to reconcile its forward-looking non-GAAP cash flow and effective tax rate measures because the Company cannot predict the timing and amounts of discrete items such as acquisition and divestitures, which could significantly impact GAAP results. Note that certain columns and rows may not add due to rounding.
The following measures are provided:
| 1. | Organic sales growth — page 2 |
| 2. | Core EPS and Currency-neutral Core EPS — page 3 |
| 3. | Core gross margin and Currency-neutral Core gross margin — page 3 |
| 4. | Core operating margin and Currency-neutral Core operating margin — page 4 |
| 5. | Adjusted free cash flow and Adjusted free cash flow productivity — page 4 |
The Core earnings measures included in the following reconciliation tables refer to the equivalent GAAP measures adjusted as applicable for the following items:
| • | Incremental restructuring: The Company has historically had an ongoing level of restructuring activities of approximately $250 - $500 million before tax. In the fiscal year ended June 30, 2024, the Company started a limited market portfolio restructuring of its business operations, primarily in certain Enterprise Markets, including Argentina and Nigeria, to address challenging macroeconomic and fiscal conditions. During the period ended September 30, 2024, the Company completed this limited market portfolio restructuring with the substantial liquidation of its operations in Argentina. The adjustment to Core earnings includes the restructuring charges that exceed the normal, recurring level of restructuring charges. |
| • | Intangible asset impairment: In the fiscal year ended June 30, 2024, the Company recognized a non-cash, after-tax impairment charge of $1.0 billion ($1.3 billion before tax) to adjust the carrying value of the Gillette intangible asset acquired as part of the Company's 2005 acquisition of The Gillette Company. |
We do not view the above items to be part of our sustainable results, and their exclusion from core earnings measures provides a more comparable measure of year-on-year results. These items are also excluded when evaluating senior management in determining their at-risk compensation.
Organic sales growth: Organic sales growth is a non-GAAP measure of sales growth excluding the impacts of acquisitions and divestitures and foreign exchange from year-over-year comparisons. We believe this measure provides investors with a supplemental understanding of underlying sales trends by providing sales growth on a consistent basis. This measure is also used in assessing the achievement of management goals for at-risk compensation.
Core EPS and currency-neutral Core EPS: Core net earnings per share, or Core EPS, is a measure of diluted net earnings per common share (diluted EPS) adjusted for items as indicated. Currency-neutral EPS is a measure of the Company's Core EPS excluding the incremental current year impact of foreign exchange. We view these non-GAAP measures as useful supplemental measures of Company performance over time.
Core gross margin and currency-neutral Core gross margin: Core gross margin is a measure of the Company's gross margin adjusted for items as indicated. Currency-neutral Core gross margin is a measure of the Company's Core gross margin excluding the incremental current year impact of foreign exchange. We believe these non-GAAP measures provide a supplemental perspective to the Company’s operating efficiency over time.
Core operating margin and currency-neutral Core operating margin: Core operating margin is a measure of the Company's operating margin adjusted for items as indicated. Currency-neutral Core operating margin is a measure of the Company’s Core operating margin excluding the incremental current year impact of foreign exchange. We believe these non-GAAP measures provide a supplemental perspective to the Company’s operating efficiency over time.
Adjusted free cash flow: Adjusted free cash flow is defined as operating cash flow less capital spending and excluding payments for the transitional tax resulting from the U.S. Tax Act. Adjusted free cash flow represents the cash that the Company is able to generate after taking into account planned maintenance and asset expansion. We view adjusted free cash flow as an important measure because it is one factor used in determining the amount of cash available for dividends, share repurchases, acquisitions and other discretionary investments.
Adjusted free cash flow productivity: Adjusted free cash flow productivity is defined as the ratio of adjusted free cash flow to net earnings excluding a non-cash charge for accumulated foreign currency translation losses related to the substantial liquidation of operations in Argentina. We view adjusted free cash flow productivity as a useful measure to help investors understand P&G’s ability to generate cash. This measure is used by management in making operating decisions, allocating financial resources and for budget planning purposes. This measure is also used in assessing the achievement of management goals for at-risk compensation.
1. Organic sales growth:
Three Months Ended
September 30, 2024 | Net Sales Growth | | Foreign Exchange Impact | | Acquisition &
Divestiture Impact/Other* | | Organic Sales Growth |
| Beauty | (5)% | | 1% | | 2% | | (2)% |
| Grooming | —% | | 2% | | 1% | | 3% |
| Health Care | 2% | | 1% | | 1% | | 4% |
| Fabric Care & Home Care | 1% | | 1% | | 1% | | 3% |
| Baby, Feminine & Family Care | (2)% | | 1% | | 1% | | —% |
| Total Company | (1)% | | 1% | | 2% | | 2% |
* Acquisition & Divestiture Impact/Other includes the volume and mix impact of acquisitions and divestitures and rounding impacts necessary to reconcile net sales to organic sales.
Organic Sales Growth
Prior Quarters
Total Company | Net Sales Growth | | Foreign Exchange Impact | | Acquisition/ Divestiture Impact/Other* | | Organic Sales Growth |
| Q1 FY 2024 | 6% | | 1% | | —% | | 7% |
| Q2 FY 2024 | 3% | | 1% | | —% | | 4% |
| Q3 FY 2024 | 1% | | 2% | | —% | | 3% |
| Q4 FY 2024 | —% | | 2% | | —% | | 2% |
* Acquisition & Divestiture Impact/Other includes the volume and mix impact of acquisitions and divestitures and rounding impacts necessary to reconcile net sales to organic sales.
Organic Sales Growth
Guidance
| Total Company | | Net Sales Growth | | Combined Foreign Exchange & Acquisition/Divestiture Impact/Other* | | Organic Sales Growth |
| FY 2025 (Estimate) | | +2% to +4% | | +1% | | +3% to +5% |
* Combined Foreign Exchange & Acquisition/Divestiture Impact/Other includes foreign exchange impacts, the volume and mix impact of acquisitions and divestitures and rounding impacts necessary to reconcile net sales to organic sales.
2. Core EPS and Currency-neutral Core EPS:
| | Three Months Ended September 30 |
| | 2024 | 2023 |
| Diluted EPS | $1.61 | $1.83 |
| Incremental restructuring | 0.32 | — |
| Core EPS | $1.93 | $1.83 |
| Percentage change vs. prior period Core EPS | 5% | |
| Currency impact to earnings | (0.02) | |
| Currency-Neutral Core EPS | $1.91 | |
| Percentage change vs. prior period Core EPS | 4% | |
Prior Quarters
| | Q1 FY24 | Q1 FY23 | Q2 FY24 | Q2 FY23 | Q3 FY24 | Q3 FY23 | Q4 FY24 | Q4 FY23 |
| Diluted EPS | $1.83 | $1.57 | $1.40 | $1.59 | $1.52 | $1.37 | $1.27 | $1.37 |
| Incremental restructuring | — | — | 0.02 | — | — | — | 0.13 | — |
| Intangible asset impairment | — | — | 0.42 | — | — | — | — | — |
| Core EPS | $1.83 | $1.57 | $1.84 | $1.59 | $1.52 | $1.37 | $1.40 | $1.37 |
| Percentage change vs. prior period Core EPS | 17% | | 16% | | 11% | | 2% | |
| Currency Impact to Earnings | 0.07 | | 0.03 | | 0.09 | | 0.05 | |
| Currency-Neutral Core EPS | $1.90 | | $1.87 | | $1.61 | | $1.45 | |
| Percentage change vs. prior period Core EPS | 21% | | 18% | | 18% | | 6% | |
Note – All reconciling items are presented net of tax. Tax effects are calculated consistent with the nature of the underlying transaction.
Core EPS Growth and Currency-neutral EPS
Guidance
| Total Company | Diluted EPS Growth | Impact of Incremental Non-Core Items | Core EPS Growth | Impact of FX | Currency-neutral EPS Growth |
FY 2025 (Estimate) | +10% to +12% | (5)% | +5% to +7% | (1)% | +4% to +6% |
3. Core gross margin and Currency-neutral Core gross margin:
| | Three Months Ended September 30 |
| | 2024 | 2023 |
| Gross Margin | 52.1% | 52.0% |
| Incremental restructuring | (0.1)% | — |
| Core Gross Margin | 52.0% | 52.0% |
| Basis point change vs. prior year Core gross margin | — | |
| Currency Impact to Margin | 0.2% | |
| Currency-Neutral Core Gross Margin | 52.1% | |
| Basis point change vs prior year Core gross margin | 10 | |
4. Core operating margin and Currency-neutral Core operating margin:
| | Three Months Ended September 30 |
| | 2024 | 2023 |
| Operating Margin | 26.7% | 26.4% |
| Incremental restructuring | — | — |
| Core Operating Margin | 26.7% | 26.4% |
| Basis point change vs. prior year Core operating margin | 30 | |
| Currency Impact to Margin | (0.4)% | |
| Currency-Neutral Core Operating Margin | 26.3% | |
| Basis point change vs. prior year Core operating margin | (10) | |
5. Adjusted free cash flow and Adjusted free cash flow productivity (dollar amounts in millions):
| Three Months Ended September 30, 2024 |
| Operating Cash Flow | Capital Spending | U.S. Tax Act Payments | Adjusted Free Cash Flow | Net Earnings | Adjustments to Net Earnings(1) | Net Earnings as Adjusted | Adjusted Free Cash Flow Productivity |
| $4,302 | $(993) | $562 | $3,871 | $3,987 | $752 | $4,739 | 82% |
(1) Adjustments to Net earnings relate to a non-cash charge for accumulated foreign currency translation losses due to the substantial liquidation of operations in Argentina.