Exhibit 99.1
| UBS MLP One-on-One Conference January 14-15, 2014 © Copyright 2014 Buckeye Partners, L.P. |
| LEGAL NOTICE/FORWARD-LOOKING STATEMENTS This presentation contains “forward-looking statements” that we believe to be reasonable as of the date of this presentation. These statements, which include any statement that does not relate strictly to historical facts, use terms such as “anticipate,” “assume,” “believe,” “estimate,” “expect,” “forecast,” “intend,” “plan,” “position,” “predict,” “project,” or “strategy” or the negative connotation or other variations of such terms or other similar terminology. In particular, statements, express or implied, regarding future results of operations or ability to generate sales, income or cash flow, to make acquisitions, or to make distributions to unitholders are forward-looking statements. These forward-looking statements are based on management’s current plans, expectations, estimates, assumptions and beliefs concerning future events impacting Buckeye Partners, L.P. (the “Partnership” or “BPL”) and therefore involve a number of risks and uncertainties, many of which are beyond management’s control. Although the Partnership believes that its expectations stated in this presentation are based on reasonable assumptions, actual results may differ materially from those expressed or implied in the forward-looking statements. The factors listed in the “Risk Factors” sections of, as well as any other cautionary language in, the Partnership’s public filings with the Securities and Exchange Commission, provide examples of risks, uncertainties and events that may cause the Partnership’s actual results to differ materially from the expectations it describes in its forward-looking statements. Each forward-looking statement speaks only as of the date of this presentation, and the Partnership undertakes no obligation to update or revise any forward-looking statement. © Copyright 2014 Buckeye Partners, L.P. 2 |

| INVESTMENT HIGHLIGHTS Over 125 years of continuous operations, with a 27-year track record as a publicly traded MLP on the NYSE Market capitalization of approximately $8.0 billion Lower cost of capital realized from elimination of GP IDRs; differentiation from many MLP peers Investment grade credit rating with a conservative approach toward financing growth Increased geographic and product diversity resulting from recent acquisitions Attractive organic growth investment opportunities across our domestic and international asset platform; including crude diversification projects utilizing existing asset footprint Paid cash distributions each quarter since formation in 1986 Petroleum storage tanks at our Macungie terminal in Pennsylvania Aerial view of BORCO’s six offshore jetties with tank farm in the distance 3 © Copyright 2014 Buckeye Partners, L.P. |

| BUCKEYE’S STRATEGY 4 Generate Exceptional Financial Returns to Unitholders Our Vision: Buckeye - the logistical solutions partner of choice for the global energy business Our Mission: To deliver superior returns to our investors through our talented, valued employees and our core strengths of An unwavering commitment to safety, environmental responsibility, regulatory compliance, and personal integrity Best-in-class customer service and sophisticated commercial operations Operational excellence that provides consistent, reliable performance at the lowest reasonable cost An entrepreneurial approach toward logistical solutions to profitably expand and optimize Buckeye’s portfolio of global energy assets A commitment to consistent execution and the continuous improvement of our operations, projects and people © Copyright 2014 Buckeye Partners, L.P. Key Component Guiding Principle Strengthen Financial Position Execute On Existing Base Business Diversify Portfolio of Assets Create Growth Platforms Diversify Portfolio of Assets Execute On Existing Base Business Diversify Portfolio of Assets Execute On Existing Base Business Current Future |

| BEST PRACTICES INITIATIVE Key Differentiator of Buckeye 5 Multi-Skilled Teams Decentralized Structure Empower our Employees Gain Sharing Initiative Staff for the Trough Best-In-Class Asset Manager © Copyright 2014 Buckeye Partners, L.P. |

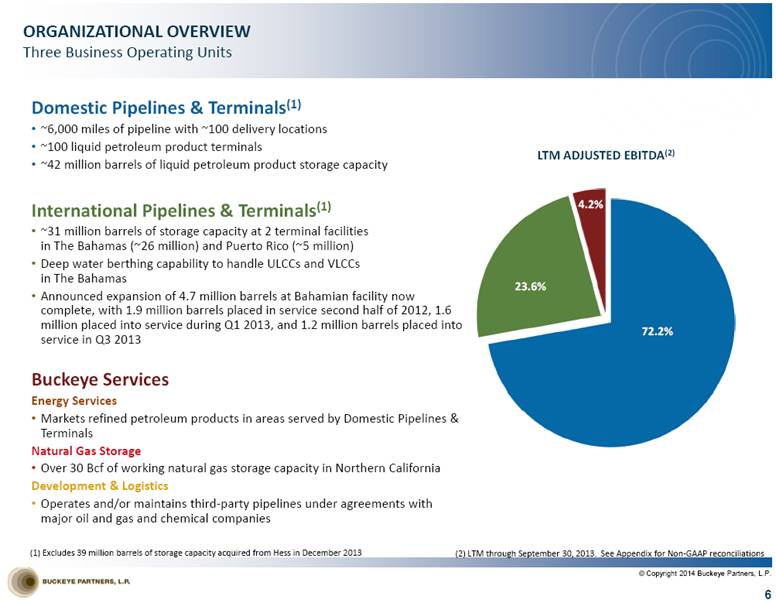
| ORGANIZATIONAL OVERVIEW Three Business Operating Units Domestic Pipelines & Terminals(1) ~6,000 miles of pipeline with ~100 delivery locations ~100 liquid petroleum product terminals ~42 million barrels of liquid petroleum product storage capacity International Pipelines & Terminals(1) ~31 million barrels of storage capacity at 2 terminal facilities in The Bahamas (~26 million) and Puerto Rico (~5 million) Deep water berthing capability to handle ULCCs and VLCCs in The Bahamas Announced expansion of 4.7 million barrels at Bahamian facility now complete, with 1.9 million barrels placed in service second half of 2012, 1.6 million placed into service during Q1 2013, and 1.2 million barrels placed into service in Q3 2013 Buckeye Services Energy Services Markets refined petroleum products in areas served by Domestic Pipelines & Terminals Natural Gas Storage Over 30 Bcf of working natural gas storage capacity in Northern California Development & Logistics Operates and/or maintains third-party pipelines under agreements with major oil and gas and chemical companies (2) LTM through September 30, 2013. See Appendix for Non-GAAP reconciliations 6 (1) Excludes 39 million barrels of storage capacity acquired from Hess in December 2013 © Copyright 2014 Buckeye Partners, L.P. 72.2% 23.6% 4.2% LTM ADJUSTED EBITDA (2) |
| BUCKEYE SYSTEM MAP 7 © Copyright 2014 Buckeye Partners, L.P. |

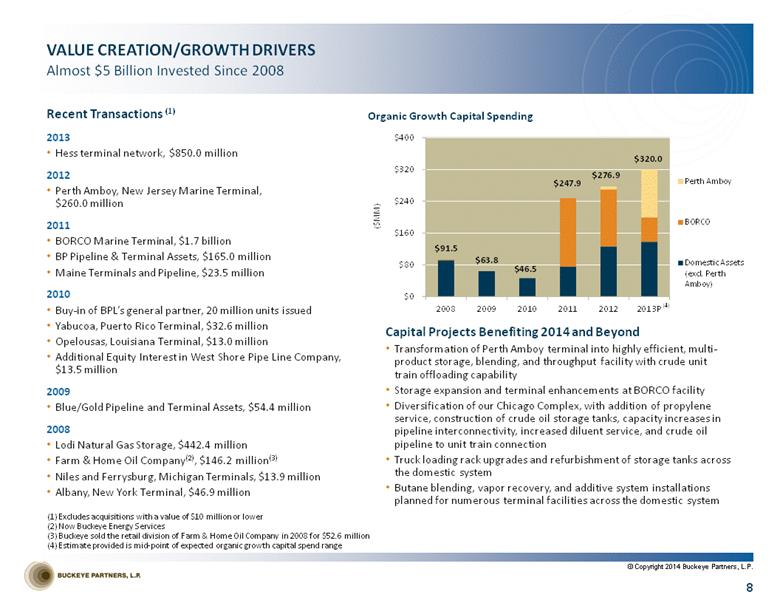
| VALUE CREATION/GROWTH DRIVERS Almost $5 Billion Invested Since 2008 Recent Transactions (1) 2013 Hess terminal network, $850.0 million 2012 Perth Amboy, New Jersey Marine Terminal, $260.0 million 2011 BORCO Marine Terminal, $1.7 billion BP Pipeline & Terminal Assets, $165.0 million Maine Terminals and Pipeline, $23.5 million 2010 Buy-in of BPL’s general partner, 20 million units issued Yabucoa, Puerto Rico Terminal, $32.6 million Opelousas, Louisiana Terminal, $13.0 million Additional Equity Interest in West Shore Pipe Line Company, $13.5 million 2009 Blue/Gold Pipeline and Terminal Assets, $54.4 million 2008 Lodi Natural Gas Storage, $442.4 million Farm & Home Oil Company(2), $146.2 million(3) Niles and Ferrysburg, Michigan Terminals, $13.9 million Albany, New York Terminal, $46.9 million Excludes acquisitions with a value of $10 million or lower Now Buckeye Energy Services Buckeye sold the retail division of Farm & Home Oil Company in 2008 for $52.6 million Estimate provided is mid-point of expected organic growth capital spend range Capital Projects Benefiting 2014 and Beyond Transformation of Perth Amboy terminal into highly efficient, multi-product storage, blending, and throughput facility with crude unit train offloading capability Storage expansion and terminal enhancements at BORCO facility Diversification of our Chicago Complex, with addition of propylene service, construction of crude oil storage tanks, capacity increases in pipeline interconnectivity, increased diluent service, and crude oil pipeline to unit train connection Truck loading rack upgrades and refurbishment of storage tanks across the domestic system Butane blending, vapor recovery, and additive system installations planned for numerous terminal facilities across the domestic system Organic Growth Capital Spending 8 © Copyright 2014 Buckeye Partners, L.P. $0 $80 $160 $240 $320 $400 2008 2009 2010 2011 2012 2013P ($MM) Perth Amboy BORCO Domestic Assets (excl. Perth Amboy) $91.5 $247.9 $63.8 $46.5 $276.9 $320.0 (4) |
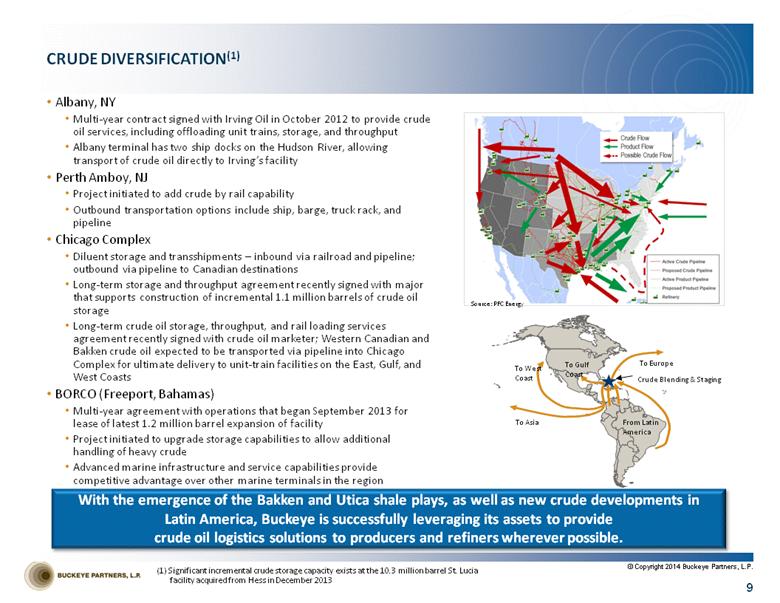
| CRUDE DIVERSIFICATION(1) 9 Albany, NY Multi-year contract signed with Irving Oil in October 2012 to provide crude oil services, including offloading unit trains, storage, and throughput Albany terminal has two ship docks on the Hudson River, allowing transport of crude oil directly to Irving’s facility Perth Amboy, NJ Project initiated to add crude by rail capability Outbound transportation options include ship, barge, truck rack, and pipeline Chicago Complex Diluent storage and transshipments – inbound via railroad and pipeline; outbound via pipeline to Canadian destinations Long-term storage and throughput agreement recently signed with major that supports construction of incremental 1.1 million barrels of crude oil storage Long-term crude oil storage, throughput, and rail loading services agreement recently signed with crude oil marketer; Western Canadian and Bakken crude oil expected to be transported via pipeline into Chicago Complex for ultimate delivery to unit-train facilities on the East, Gulf, and West Coasts BORCO (Freeport, Bahamas) Multi-year agreement with operations that began September 2013 for lease of latest 1.2 million barrel expansion of facility Project initiated to upgrade storage capabilities to allow additional handling of heavy crude Advanced marine infrastructure and service capabilities provide competitive advantage over other marine terminals in the region With the emergence of the Bakken and Utica shale plays, as well as new crude developments in Latin America, Buckeye is successfully leveraging its assets to provide crude oil logistics solutions to producers and refiners wherever possible. Crude Blending & Staging To West Coast To Asia To Gulf Coast To Europe From Latin America Source: PFC Energy © Copyright 2014 Buckeye Partners, L.P. (1) Significant incremental crude storage capacity exists at the 10.3 million barrel St. Lucia facility acquired from Hess in December 2013 |
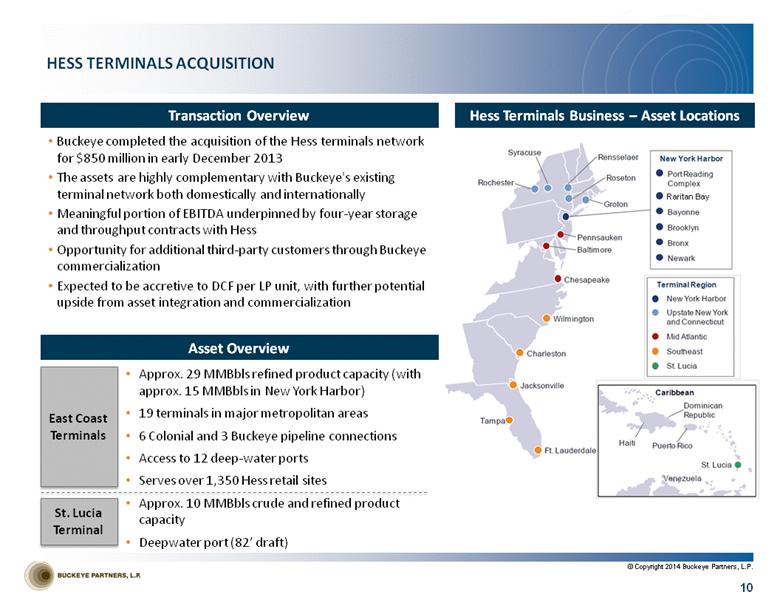
| HESS TERMINALS ACQUISITION Hess Terminals Business – Asset Locations Transaction Overview Buckeye completed the acquisition of the Hess terminals network for $850 million in early December 2013 The assets are highly complementary with Buckeye's existing terminal network both domestically and internationally Meaningful portion of EBITDA underpinned by four-year storage and throughput contracts with Hess Opportunity for additional third-party customers through Buckeye commercialization Expected to be accretive to DCF per LP unit, with further potential upside from asset integration and commercialization Asset Overview Approx. 29 MMBbls refined product capacity (with approx. 15 MMBbls in New York Harbor) 19 terminals in major metropolitan areas 6 Colonial and 3 Buckeye pipeline connections Access to 12 deep-water ports Serves over 1,350 Hess retail sites Approx. 10 MMBbls crude and refined product capacity Deepwater port (82’ draft) East Coast Terminals St. Lucia Terminal Raritan Bay 10 © Copyright 2014 Buckeye Partners, L.P. |
| STRATEGIC RATIONALE AND INVESTMENT HIGHLIGHTS Large scale acquisition that is expected to be accretive to DCF per LP unit 20 terminals with aggregate capacity of 39 MMBbls; Buckeye's capacity increases >50% to approx. 110 MMBBls Run-rate EBITDA investment multiple of approximately 8.0x Attractive upside exists around commercial opportunities on the East Coast; opportunity to increase third party utilization Hess is an attractive anchor tenant with four-year storage and throughput contracts with minimum revenue commitment Bolsters Buckeye's presence and service capabilities in New York Harbor with 14.8 MMBbls of aggregate terminal capacity across six terminals Enhances Buckeye's position in the Mid-Atlantic, while also providing further penetration into the attractive Southeastern / Florida markets Potential for future growth through tank conversion opportunities, blending activities, rail opportunities, and other expansion projects Addition of St. Lucia enhances Buckeye’s ability to provide multiple solutions for customers across the entire Caribbean Hess assets have been well-maintained and have an excellent safety record Unique opportunity to acquire a collection of terminals that are highly complementary with Buckeye's existing operations and enhances Buckeye's vision of creating a world-class, integrated terminal network Hess Bayonne Hess St. Lucia 11 © Copyright 2014 Buckeye Partners, L.P. |

| Domestic Pipelines & Terminals 12 © Copyright 2014 Buckeye Partners, L.P. |

| DOMESTIC PIPELINES & TERMINALS OVERVIEW 13 Petroleum storage tanks at our Macungie terminal in Pennsylvania Pipelines & Terminals segment represents Buckeye’s largest segment contribution to Adjusted EBITDA Over 6,000 miles of pipeline located primarily in the Northeast and Midwest United States moving approximately 1.4 million barrels of liquid petroleum products per day with more than 100 delivery points Approximately 100(2) liquid petroleum product storage terminals located throughout the United States Approximately 42 million(2) barrels of storage capacity Terminal Throughput Volumes Pipeline Throughput Volumes Through September 30, 2013 Excludes assets acquired from Hess in December 2013 © Copyright 2014 Buckeye Partners, L.P. 1,395.4 1,323.1 1,316.4 1,358.1 1,385.6 1,414.2 0 500 1,000 1,500 2,000 2008 2009 2010 2011 2012 YTD (1) (b / d - 000's) 464.4 471.9 562.5 730.9 897.3 980.6 0 200 400 600 800 1000 1200 2008 2009 2010 2011 2012 YTD (1) (b/d - 000's) |

| PERTH AMBOY OVERVIEW Facility Overview BPL purchased facility from Chevron (closed in July 2012) Located at the southwest end of New York Harbor on the Arthur Kill Only ~ 6 miles from Buckeye Linden complex Pipeline, water, rail, and truck access planned Strategically situated on New York Harbor as a NYMEX delivery point Approximately 4.4 million barrels total storage capacity 2.7 million barrels of active refined product storage 1.3 million barrels of refurbishable refined product storage 0.4 million barrels of heavy oil refurbishable storage 4 docks (1 ship, 3 barge(1)) with water draft up to 37' ~250 acre site with significant undeveloped acreage for expansion potential Capital investment period supported by multi-year storage, blending, and throughput commitments from Chevron 14 Note: Facility located in Perth Amboy, NJ. Green line indicates approximate property boundaries One of the barge docks is currently out of service Growth Opportunities Projects underway to transform the terminal into a highly efficient, multi-product storage, blending, and throughput facility Potential for crude, gasoline, distillate, ethanol, asphalt, or 6 oil service that can be optimized as market needs evolve Direct pipeline interconnect to Buckeye Linden complex expected to be complete 1Q 2014 Project expected to be complete 2Q 2014 to allow handling of Bakken-sourced crude oil via rail and ship Long-term storage contract recently signed with New York Harbor gasoline blender for approximately 1 million barrels of refined petroleum products Strategic Rationale Improves connectivity and service capabilities for customers to increase Buckeye system utilization Provides for security and diversity of product supply for Buckeye’s customers by connecting waterborne product supply with end destination markets across the Buckeye system Provides customers with storage at New York Harbor, a highly liquid NYMEX settlement point © Copyright 2014 Buckeye Partners, L.P. |

| Chicago Complex Crude Oil and Other Opportunities: Construction of additional 1.1 million barrels of crude oil storage capacity to leverage asset footprint in Chicago; project is underwritten by long-term contract with major Project completed in November 2013 to re-purpose rail facilities and enhance pipeline interconnectivity in connection with long-term crude oil storage, throughput, and rail loading services agreement with a marketer Project underway to increase available storage capacity by incorporating additional Buckeye terminal into Chicago Complex by completion of bi-directional pipeline connection Propylene storage and rail services agreement at facility provides further product diversity © Copyright 2014 Buckeye Partners, L.P. 15 Butane Blending: Significant growth driven by strong blending margins Improved blending efficiencies and oversight Opportunities for further locational deployment of blending capabilities PROJECTS Other Projects: Storage expansions, truck rack upgrades, and addition of other service capabilities at existing domestic terminals Buckeye Chicago Complex Buckeye’s ability to leverage and repurpose our existing domestic asset footprint has allowed us to successfully deliver high-return growth capital projects with low single digit multiples Crude Diversification: Multi-year contract at the Albany marine terminal to provide crude oil services, including offloading unit trains, storage, throughput, and loading of marine vessels Project underway to add crude by rail capability at Perth Amboy that is expected to be completed 2Q 2014 DOMESTIC PIPELINES & TERMINALS GROWTH POTENTIAL Project Pipeline |

| International Pipelines & Terminals 16 © Copyright 2014 Buckeye Partners, L.P. |

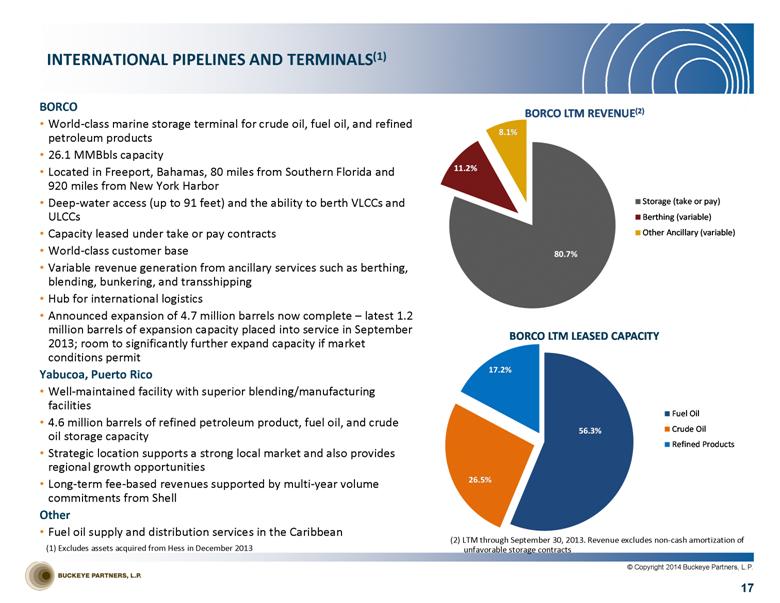
| BORCO World-class marine storage terminal for crude oil, fuel oil, and refined petroleum products 26.1 MMBbls capacity Located in Freeport, Bahamas, 80 miles from Southern Florida and 920 miles from New York Harbor Deep-water access (up to 91 feet) and the ability to berth VLCCs and ULCCs Capacity leased under take or pay contracts World-class customer base Variable revenue generation from ancillary services such as berthing, blending, bunkering, and transshipping Hub for international logistics Announced expansion of 4.7 million barrels now complete – latest 1.2 million barrels of expansion capacity placed into service in September 2013; room to significantly further expand capacity if market conditions permit Yabucoa, Puerto Rico Well-maintained facility with superior blending/manufacturing facilities 4.6 million barrels of refined petroleum product, fuel oil, and crude oil storage capacity Strategic location supports a strong local market and also provides regional growth opportunities Long-term fee-based revenues supported by multi-year volume commitments from Shell Other Fuel oil supply and distribution services in the Caribbean 17 INTERNATIONAL PIPELINES AND TERMINALS(1) (2) LTM through September 30, 2013. Revenue excludes non-cash amortization of unfavorable storage contracts © Copyright 2014 Buckeye Partners, L.P. (1) Excludes assets acquired from Hess in December 2013 56.3% 26.5% 17.2% BORCO LTM LEASED CAPACITY Fuel Oil Crude Oil Refined Products 80.7% 11.2% 8.1% BORCO LTM REVENUE (2) Storage (take or pay) Berthing (variable) Other Ancillary (variable) |
| Capex INTERNATIONAL INTERNAL GROWTH PROJECTS EXPANSION AND OTHER GROWTH OPPORTUNITIES 18 Expanded storage capacity by 4.7 million barrels since acquisition Constructed ample berthing capacity to allow future expansion without incremental marine infrastructure spend Designed facility to accommodate multiple product segregations to enable blending and maximum flexibility for changes in facility requirements Improved simultaneous operations to move product in and out of the facility at the same time Provided critical infrastructure redundancy to ensure business continuity Improved loading and unloading rates to allow for reduced berthing time Laid ground work for future expansion by optimizing facility configuration Project initiated to upgrade the facilities tankage to allow storage of heavy crude that requires additional heating and blending capabilities Other Internal Growth Opportunities Significant land available for further expansion Additional interest for staging of crude oil resulting from Latin American production expected to come online over the next decade Provides optionality to multiple end-market destinations Bunkering Opportunities – Blended Fuel Oil BORCO is a logical geographical location spot for a new “Bunker filling station” 2014 Panama Canal expansion to allow passage of Suezmax vessels expected to lead to 20-30% increase in traffic; BORCO location ideal to service the incremental vessels Yabucoa, Puerto Rico facility provides opportunities for jet fuel and crude storage, as well as fuel oil supply and bunkering BORCO Expansion Capacity(1) –millions of barrels Graph reflects expected midpoint of capital spend range. Dates represent expected date that capacity is placed in service. BORCO Capital Investment Since Acquisition (~$350 million): Bluefield Future Expansion Area Yellowfield © Copyright 2014 Buckeye Partners, L.P. |

| Buckeye Services 19 © Copyright 2014 Buckeye Partners, L.P. |
| BUCKEYE SERVICES OVERVIEW 20 Energy Services Buckeye Energy Services (“BES”) markets a wide range of refined petroleum products and other ancillary products in areas served by Buckeye’s pipelines and terminals Strategy for mitigating basis risk included focusing on fewer, more strategic locations for transacting business Contributed approximately $22.1 million in revenues to Domestic Pipelines & Terminals during the twelve months ended September 30, 2013, while also providing valuable insight on demand and pricing support for our terminalling and storage business Development & Logistics Buckeye Development & Logistics (“BDL”) operates and/or maintains third-party pipelines under agreements with major oil and gas and chemical companies BDL services offered to customers Contract operations Project origination Asset development Engineering design Project management Natural Gas Storage Buckeye’s Lodi Gas Storage facility is a high performance natural gas storage facility with over 30 Bcf of working gas capacity in Northern California serving the greater San Francisco Bay Area Potential repurposing of the facility for renewable energy compressed air storage is being assessed The facilities collectively have a maximum injection and withdrawal capability of approximately 550 million cubic feet per day (MMcf/day) and 750 MMcf/day, respectively Lodi’s facilities are designed to provide high deliverability natural gas storage service and have a proven track record of safe and reliable operations © Copyright 2014 Buckeye Partners, L.P. |
| Financial Overview 21 © Copyright 2014 Buckeye Partners, L.P. |

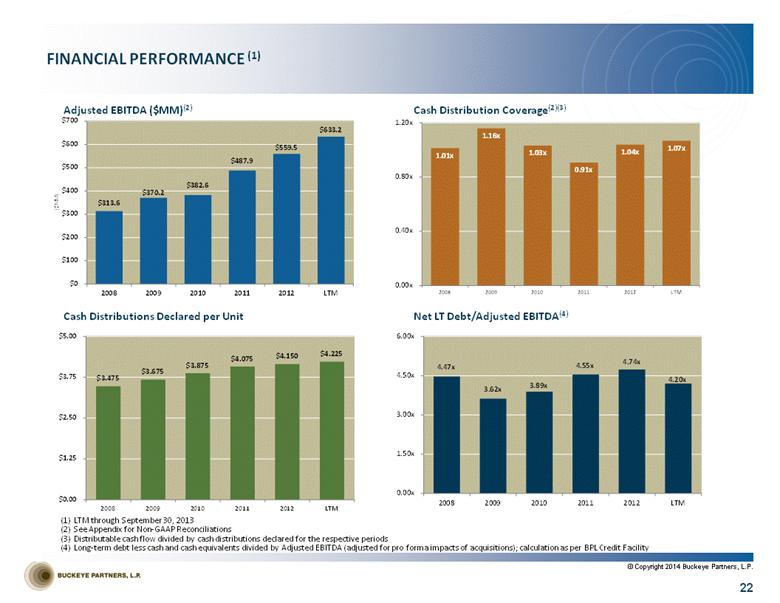
| FINANCIAL PERFORMANCE (1) 22 Adjusted EBITDA ($MM)(2) Cash Distributions Declared per Unit Cash Distribution Coverage(2)(3) LTM through September 30, 2013 See Appendix for Non-GAAP Reconciliations Distributable cash flow divided by cash distributions declared for the respective periods Long-term debt less cash and cash equivalents divided by Adjusted EBITDA (adjusted for pro forma impacts of acquisitions); calculation as per BPL Credit Facility Net LT Debt/Adjusted EBITDA(4) © Copyright 2014 Buckeye Partners, L.P. $3.475 $3.675 $3.875 $4.075 $4.150 $4.225 $0.00 $1.25 $2.50 $3.75 $5.00 2008 2009 2010 2011 2012 LTM 1.01x 1.16x 1.03x 0.91x 1.04x 1.07x 0.00x 0.40x 0.80x 1.20x 2008 2009 2010 2011 2012 LTM 4.47x 3.62x 3.89x 4.55x 4.74x 4.20x 0.00x 1.50x 3.00x 4.50x 6.00x 2008 2009 2010 2011 2012 LTM |
| INVESTMENT SUMMARY Stability and Growth Proven 27-year track record as a publicly traded partnership through varying economic and commodity price cycles Management continues to drive operational excellence through its best practices initiative Recent acquisitions provide Buckeye with increased geographic and product diversity, including access to international logistics opportunities, and provide significant near-term growth projects December 2013 acquisition of Hess terminal network provides a strong opportunity for Buckeye to create value by overlaying our commercial operating model on a premier platform of complementary assets Acquisition in 2012 of marine terminal facility in Perth Amboy, NJ from Chevron furthers Buckeye’s strategy to create a fully integrated and flexible system that offers unparalleled connectivity and service capabilities; provides significant near-term growth opportunities at attractive multiple World-class BORCO marine storage terminal with 26.1 million barrels of storage capacity for crude oil and liquid petroleum products in Freeport, Bahamas, with opportunity for significant additional capacity expansion; serves as important logistics hub for international petroleum product flows Diversified portfolio of assets provides balanced mix of stability and growth and is well positioned to take advantage of changing supply and demand fundamentals for crude and refined petroleum products to drive improved returns to unitholders 23 © Copyright 2014 Buckeye Partners, L.P. |

| Non-GAAP Reconciliations 24 © Copyright 2014 Buckeye Partners, L.P. |

| BASIS OF REPRESENTATION; EXPLANATION OF NON-GAAP MEASURES Buckeye’s equity-funded merger with Buckeye GP Holdings, L.P. (“BGH”) in the fourth quarter of 2010 has been treated as a reverse merger for accounting purposes. As a result, the historical results presented herein for periods prior to the completion of the merger are those of BGH, and the diluted weighted average number of LP units outstanding increase from 20.0 million in the fourth quarter of 2009 to 44.3 million in the fourth quarter of 2010. Additionally, Buckeye incurred a non-cash charge to compensation expense of $21.1 million in the fourth quarter of 2010 as a result of a distribution of LP units owned by BGH GP Holdings, LLC to certain officers of Buckeye, which triggered a revaluation of an equity incentive plan that had been instituted in 2007. Adjusted EBITDA and distributable cash flow are measures not defined by GAAP. Adjusted EBITDA is the primary measure used by our senior management, including our Chief Executive Officer, to (i) evaluate our consolidated operating performance and the operating performance of our business segments, (ii) allocate resources and capital to business segments, (iii) evaluate the viability of proposed projects, and (iv) determine overall rates of return on alternative investment opportunities. Distributable cash flow is another measure used by our senior management to provide a clearer picture of Buckeye’s cash available for distribution to its unitholders. Adjusted EBITDA and distributable cash flow eliminate (i) non-cash expenses, including, but not limited to, depreciation and amortization expense resulting from the significant capital investments we make in our businesses and from intangible assets recognized in business combinations, (ii) charges for obligations expected to be settled with the issuance of equity instruments, and (iii) items that are not indicative of our core operating performance results and business outlook. Buckeye believes that investors benefit from having access to the same financial measures used by senior management and that these measures are useful to investors because they aid in comparing Buckeye’s operating performance with that of other companies with similar operations. The Adjusted EBITDA and distributable cash flow data presented by Buckeye may not be comparable to similarly titled measures at other companies because these items may be defined differently by other companies. Please see the attached reconciliations of each of Adjusted EBITDA and distributable cash flow to net income. This presentation references forward-looking estimates of Adjusted EBITDA investment multiples projected to be generated by the Hess terminals. A reconciliation of estimated Adjusted EBITDA to GAAP net income is not provided because GAAP net income generated by the Hess terminals for the applicable periods is not accessible. Buckeye has not yet completed the necessary valuation of the various assets to be acquired, a determination of the useful lives of these assets for accounting purposes, or an allocation of the purchase price among the various types of assets. In addition, interest and debt expense is a corporate-level expense that is not allocated among Buckeye’s segments and could not be allocated to the Hess terminal operations without unreasonable effort. Accordingly, the amount of depreciation and amortization and interest and debt expense that will be included in the additional net income generated as a result of the acquisition of the Hess terminals is not accessible or estimable at this time. The amount of such additional resulting depreciation and amortization and applicable interest and debt expense could be significant, such that the amount of additional net income would vary substantially from the amount of projected Adjusted EBITDA. 25 © Copyright 2014 Buckeye Partners, L.P. |

| NON-GAAP RECONCILIATIONS 26 Net Income to Adjusted EBITDA and Distributable Cash Flow ($000) LTM through September 30, 2013 On November 19, 2010, Buckeye merged with Buckeye GP Holdings L.P. Represents cash distributions declared for limited partner units (LP units) outstanding as of each respective period. © Copyright 2014 Buckeye Partners, L.P. 2008 2009 2010 2011 2012 LTM (1) Net income attributable to BPL 26,477 49,594 43,080 108,501 226,417 277,988 Interest and debt expense 75,410 75,147 89,169 119,561 114,980 124,648 Income tax expense (benefit) 801 (343) (919) (192) (675) (1,331) Depreciation and amortization 50,834 54,699 59,590 119,534 146,424 157,736 EBITDA 153,522 179,097 190,920 347,404 487,146 559,041 Net income attributable to noncontrolling interests affected by merger (2) 153,546 90,381 157,467 - - - Amortization of unfavorable storage contracts - - - (7,562) (10,994) (11,004) Gain on sale of equity investment - - - (34,727) - - Non-cash deferred lease expense 4,598 4,500 4,235 4,122 3,901 3,804 Non-cash unit-based compensation expense 1,909 4,408 8,960 9,150 19,520 21,424 Equity plan modification expense - - 21,058 - - - Asset impairment expense - 59,724 - - 59,950 59,950 Goodwill impairment expense - - - 169,560 - - Reorganization expense - 32,057 - - - - Adjusted EBITDA 313,575 370,167 382,640 487,947 559,523 633,215 Less: Interest and debt expense, excluding amortization of deferred financing costs, debt discounts, and other (73,573) (71,863) (84,758) (111,941) (111,511) (118,113) Maintenance capital expenditures (28,936) (23,496) (31,244) (57,467) (54,425) (62,965) Income taxes, excluding non-cash taxes and other 1,210 325 - (6) (1,095) (439) Distributable Cash Flow 212,276 275,133 266,638 318,533 392,492 451,698 Distributions for Coverage ratio (3) 209,412 237,687 259,315 351,245 376,193 423,233 Coverage Ratio 1.01x 1.16x 1.03x 0.91x 1.04x 1.07x Adjusted Segment EBITDA Pipelines & Terminals 253,790 302,164 346,447 361,018 409,055 457,387 International Operations - - (4,655) 112,996 132,104 149,220 Natural Gas Storage 41,814 41,950 29,794 4,204 6,118 (3,926) Energy Services 9,443 19,335 5,861 1,797 524 18,027 Development & Logistics 8,528 6,718 5,193 7,932 11,722 12,507 Total Adjusted EBITDA 313,575 370,167 382,640 487,947 559,523 633,215 |
