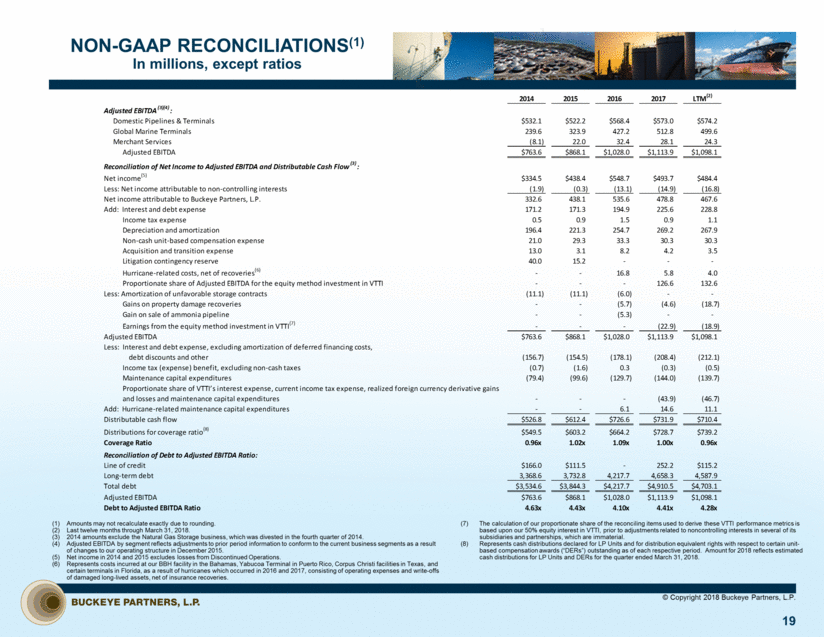
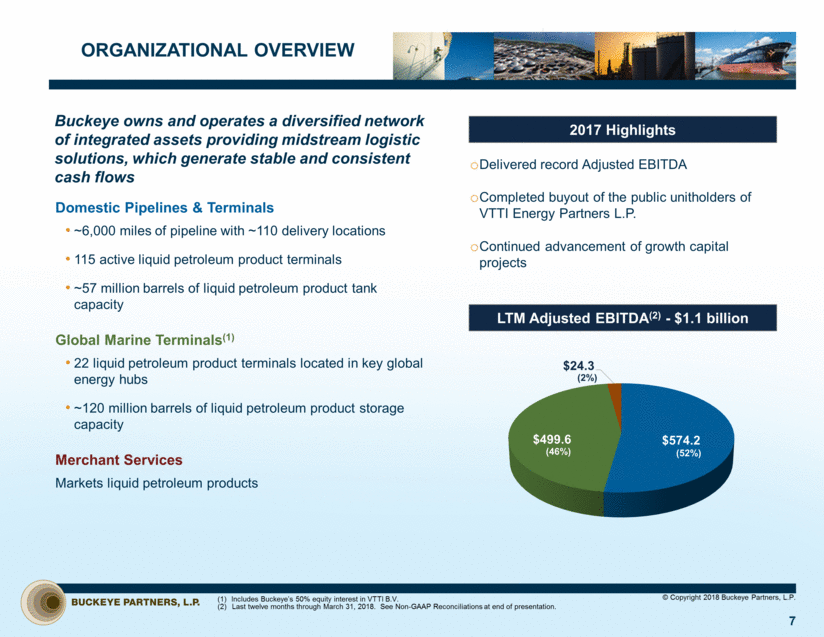
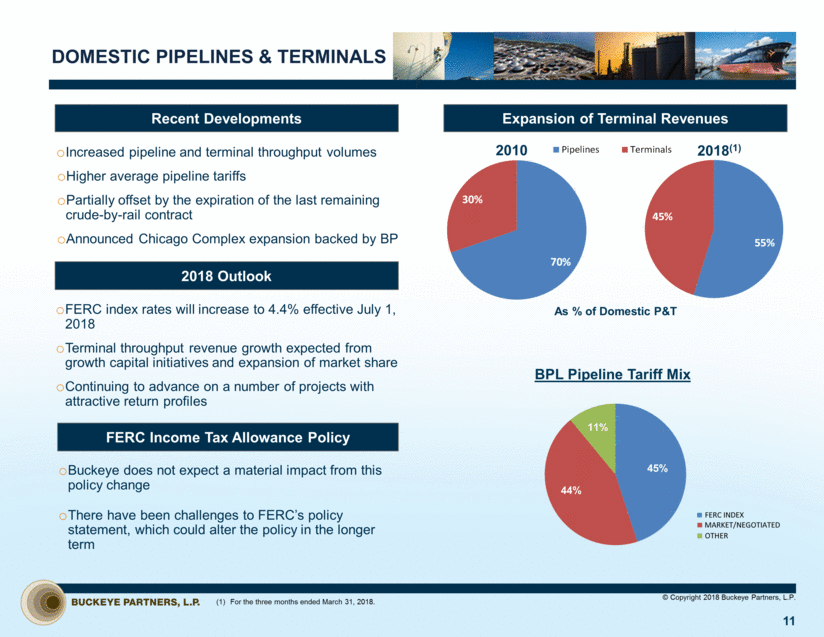
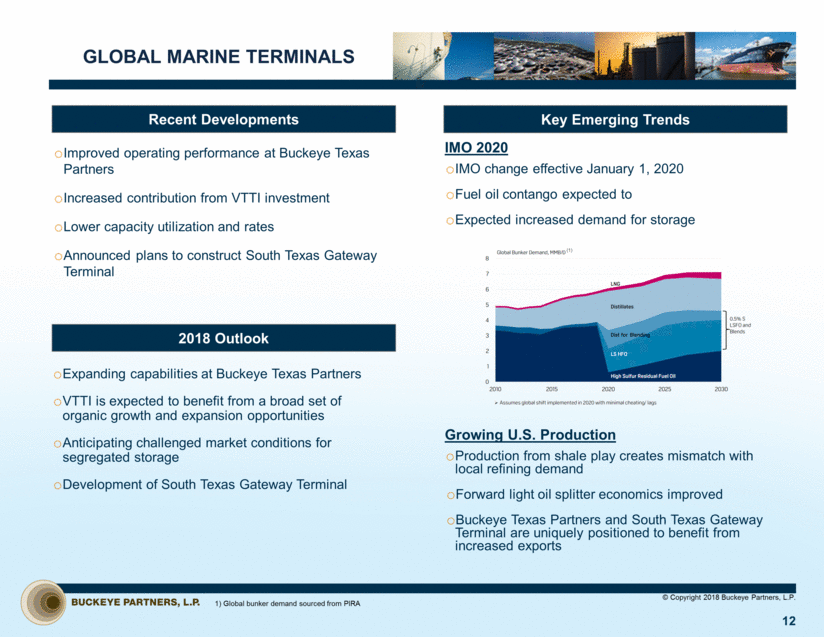
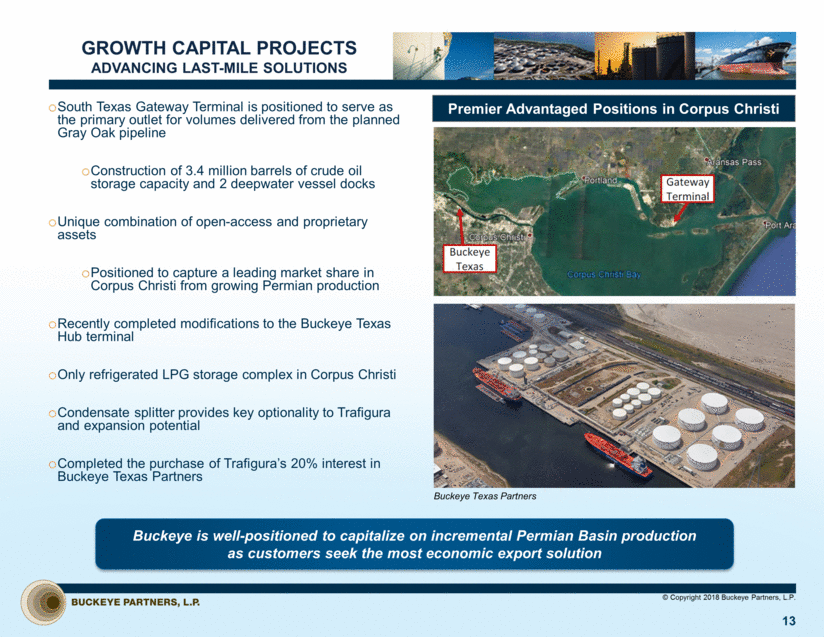
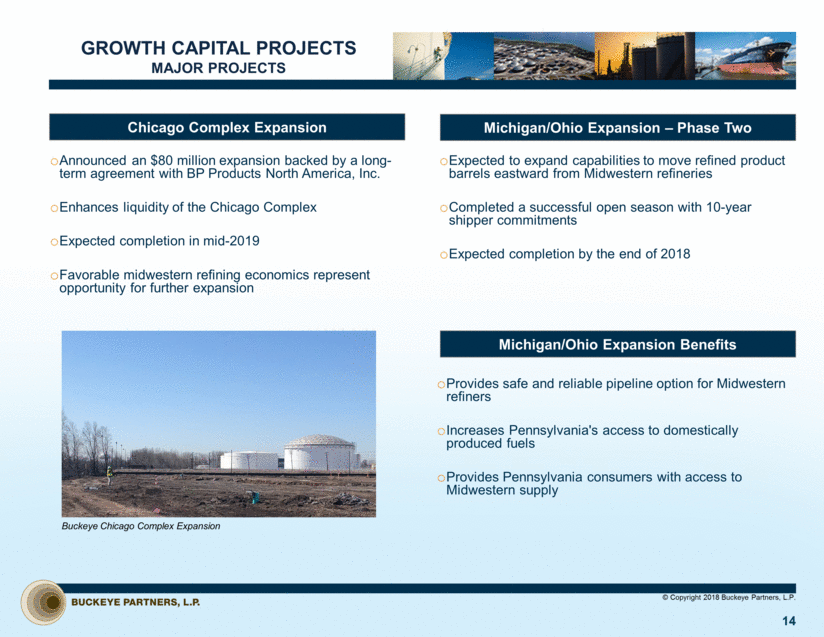
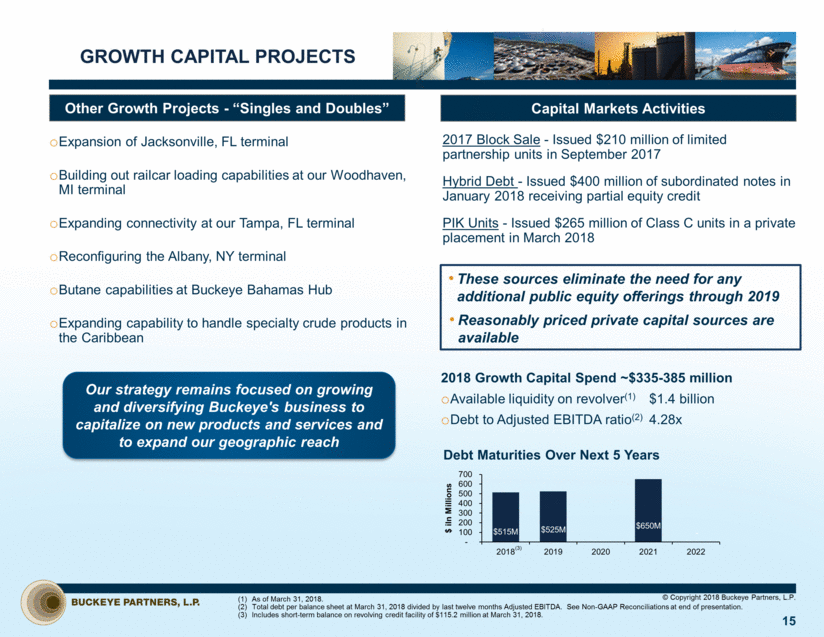
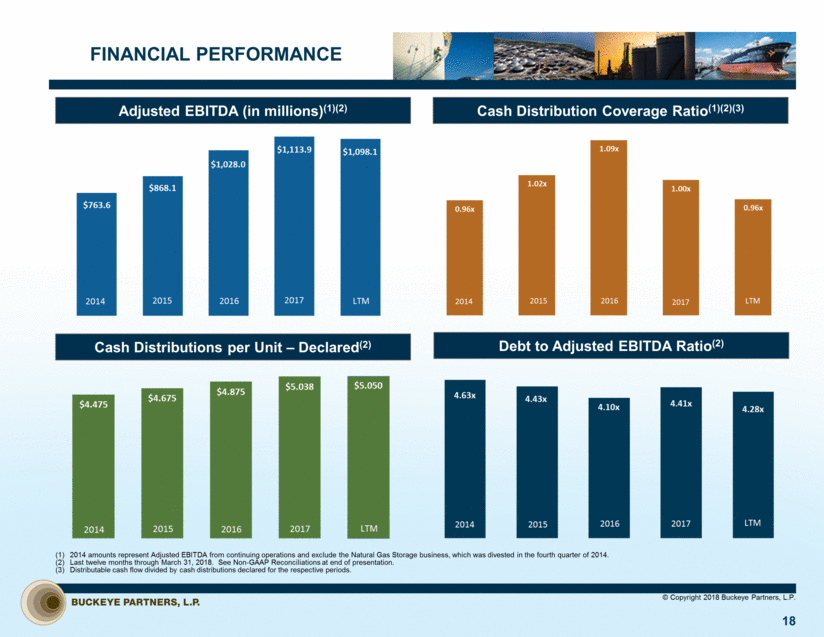
NON-GAAP RECONCILIATIONS(1) In millions, except ratios Amounts may not recalculate exactly due to rounding. Last twelve months through March 31, 2018. 2014 amounts exclude the Natural Gas Storage business, which was divested in the fourth quarter of 2014. Adjusted EBITDA by segment reflects adjustments to prior period information to conform to the current business segments as a result of changes to our operating structure in December 2015. Net income in 2014 and 2015 excludes losses from Discontinued Operations. Represents costs incurred at our BBH facility in the Bahamas, Yabucoa Terminal in Puerto Rico, Corpus Christi facilities in Texas, and certain terminals in Florida, as a result of hurricanes which occurred in 2016 and 2017, consisting of operating expenses and write-offs of damaged long-lived assets, net of insurance recoveries. © Copyright 2018 Buckeye Partners, L.P. The calculation of our proportionate share of the reconciling items used to derive these VTTI performance metrics is based upon our 50% equity interest in VTTI, prior to adjustments related to noncontrolling interests in several of its subsidiaries and partnerships, which are immaterial. Represents cash distributions declared for LP Units and for distribution equivalent rights with respect to certain unit-based compensation awards (“DERs”) outstanding as of each respective period. Amount for 2018 reflects estimated cash distributions for LP Units and DERs for the quarter ended March 31, 2018. 19 2014 2015 2016 2017 LTM (2) Adjusted EBITDA (3)(4) : Domestic Pipelines & Terminals $532.1 $522.2 $568.4 $573.0 $574.2 Global Marine Terminals 239.6 323.9 427.2 512.8 499.6 Merchant Services (8.1) 22.0 32.4 28.1 24.3 Adjusted EBITDA $763.6 $868.1 $1,028.0 $1,113.9 $1,098.1 Reconciliation of Net Income to Adjusted EBITDA and Distributable Cash Flow (3) : Net income (5) $334.5 $438.4 $548.7 $493.7 $484.4 Less: Net income attributable to non-controlling interests (1.9) (0.3) (13.1) (14.9) (16.8) Net income attributable to Buckeye Partners, L.P. 332.6 438.1 535.6 478.8 467.6 Add: Interest and debt expense 171.2 171.3 194.9 225.6 228.8 Income tax expense 0.5 0.9 1.5 0.9 1.1 Depreciation and amortization 196.4 221.3 254.7 269.2 267.9 Non-cash unit-based compensation expense 21.0 29.3 33.3 30.3 30.3 Acquisition and transition expense 13.0 3.1 8.2 4.2 3.5 Litigation contingency reserve 40.0 15.2 - - - Hurricane-related costs, net of recoveries (6) - - 16.8 5.8 4.0 Proportionate share of Adjusted EBITDA for the equity method investment in VTTI - - - 126.6 132.6 Less: Amortization of unfavorable storage contracts (11.1) (11.1) (6.0) - - Gains on property damage recoveries - - (5.7) (4.6) (18.7) Gain on sale of ammonia pipeline - - (5.3) - - Earnings from the equity method investment in VTTI (7) - - - (22.9) (18.9) Adjusted EBITDA $763.6 $868.1 $1,028.0 $1,113.9 $1,098.1 Less: Interest and debt expense, excluding amortization of deferred financing costs, debt discounts and other (156.7) (154.5) (178.1) (208.4) (212.1) Income tax (expense) benefit, excluding non-cash taxes (0.7) (1.6) 0.3 (0.3) (0.5) Maintenance capital expenditures (79.4) (99.6) (129.7) (144.0) (139.7) Proportionate share of VTTI’s interest expense, current income tax expense, realized foreign currency derivative gains and losses and maintenance capital expenditures - - - (43.9) (46.7) Add: Hurricane-related maintenance capital expenditures - - 6.1 14.6 11.1 Distributable cash flow $526.8 $612.4 $726.6 $731.9 $710.4 Distributions for coverage ratio (8) $549.5 $603.2 $664.2 $728.7 $739.2 Coverage Ratio 0.96x 1.02x 1.09x 1.00x 0.96x Reconciliation of Debt to Adjusted EBITDA Ratio: Line of credit $166.0 $111.5 - 252.2 $115.2 Long-term debt 3,368.6 3,732.8 4,217.7 4,658.3 4,587.9 Total debt $3,534.6 $3,844.3 $4,217.7 $4,910.5 $4,703.1 Adjusted EBITDA $763.6 $868.1 $1,028.0 $1,113.9 $1,098.1 Debt to Adjusted EBITDA Ratio 4.63x 4.43x 4.10x 4.41x 4.28x
