Exhibit 99.1
Company Overview
May 2013
Safe Harbor Language
This presentation includes forward-looking statements. Quiksilver, Inc. (“Quiksilver” or the “Company”) cautions that these statements are qualified by important factors that could cause actual results to differ materially from those presented or implied in the forward-looking statements. These statements are based on Quiksilver’s current plans and expectations and involve risks and uncertainties that could cause future activities and results of operations to be materially different from those set forth in or implied by the forward-looking statements. For the factors that could cause actual results to differ materially from expectations, please refer to the Company’s filings with the Securities and Exchange Commission (“SEC”) and specifically the sections titled “Risk Factors,” “Management’s Discussion and Analysis of Financial Condition and Results of Operations” and “Forward-Looking Statements” in the Company’s Forms 10-K and 10-Q. The Company cautions that any forward-looking statements included in this presentation are made as of the date of this presentation, and the Company does not undertake to update any forward-looking statements. This presentation also includes certain non-GAAP financial measures including Pro Forma Adjusted EBITDA (“EBITDA”). The reconciliation of such non-GAAP financial measures to the nearest GAAP equivalent can be found in the Company’s earnings press releases and Forms 10-K and 10-Q, which are filed with the SEC and can also be found on the Company’s website at www.quiksilverinc.com.
2

Agenda
Company
Inflection Point
Profit Improvement Plan
Financial Performance
3
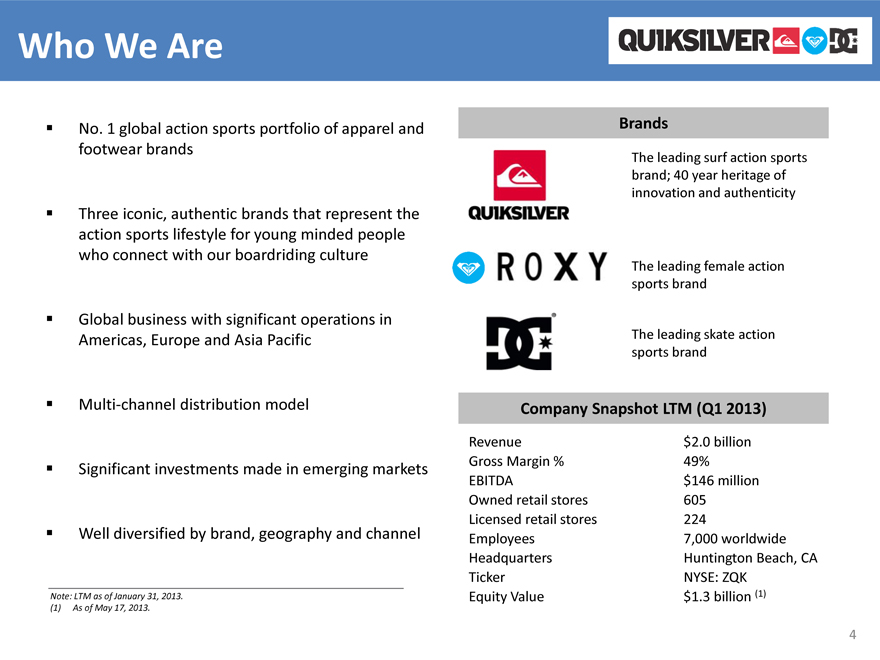
Who We Are
No. 1 global action sports portfolio of apparel and footwear brands
Three iconic, authentic brands that represent the action sports lifestyle for young minded people who connect with our boardriding culture
Global business with significant operations in Americas, Europe and Asia Pacific
Multi-channel distribution model
Significant investments made in emerging markets
Well diversified by brand, geography and channel
Brands
The leading surf action sports brand; 40 year heritage of innovation and authenticity
The leading female action sports brand
The leading skate action sports brand
Company Snapshot LTM (Q1 2013)
Revenue $2.0 billion
Gross Margin % 49%
EBITDA $146 million
Owned retail stores 605
Licensed retail stores 224
Employees 7,000 worldwide
Headquarters Huntington Beach, CA
Ticker NYSE: ZQK
Equity Value $1.3 billion (1)
Note: LTM as of January 31, 2013.
(1) As of May 17, 2013.
4
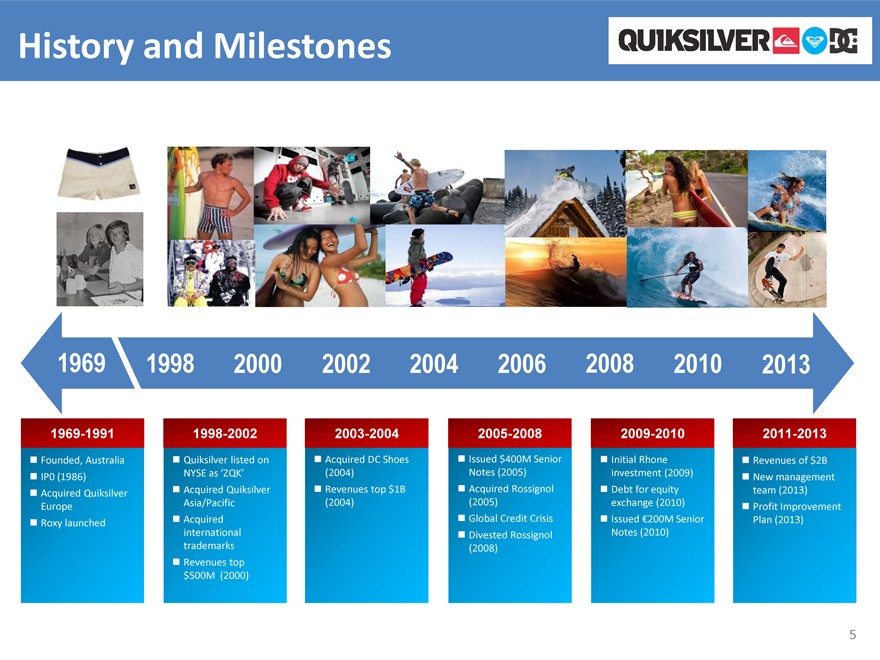
History and Milestones
1969 1998 2000 2002 2004 2006 2008 2010 2013
1969-1991
Founded, Australia
IP0 (1986)
Acquired Quiksilver Europe
Roxy launched
1998-2002
Quiksilver listed on NYSE as ‘ZQK’
Acquired Quiksilver Asia/Pacific
Acquired international trademarks
Revenues top $500M (2000)
2003-2004
Acquired DC Shoes (2004)
Revenues top $1B (2004)
2005-2008
Issued $400M Senior Notes (2005)
Acquired Rossignol (2005)
Global Credit Crisis
Divested Rossignol (2008)
2009-2010
Initial Rhone investment (2009)
Debt for equity exchange (2010)
Issued €200M Senior Notes (2010)
2011-2013
Revenues of $2B
New management team (2013)
Profit Improvement Plan (2013)
5
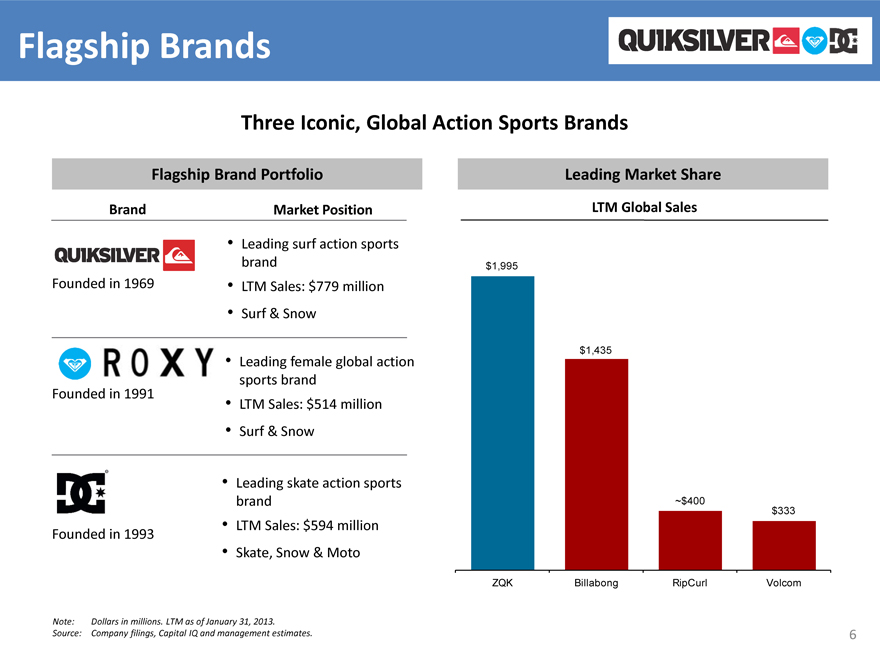
Flagship Brands
Three Iconic, Global Action Sports Brands
Flagship Brand Portfolio
Brand
Market Position
Founded in 1969
Leading surf action sports brand
LTM Sales: $779 million
Surf & Snow
Founded in 1991
Leading female global action sports brand
LTM Sales: $514 million
Surf & Snow
Founded in 1993
Leading skate action sports brand
LTM Sales: $594 million
Skate, Snow & Moto
Leading Market Share
LTM Global Sales
$1,995
$1,435
~$400
$333
ZQK Billabong RipCurl Volcom
Note: Dollars in millions. LTM as of January 31, 2013.
Source: Company filings, Capital IQ and management estimates.
6
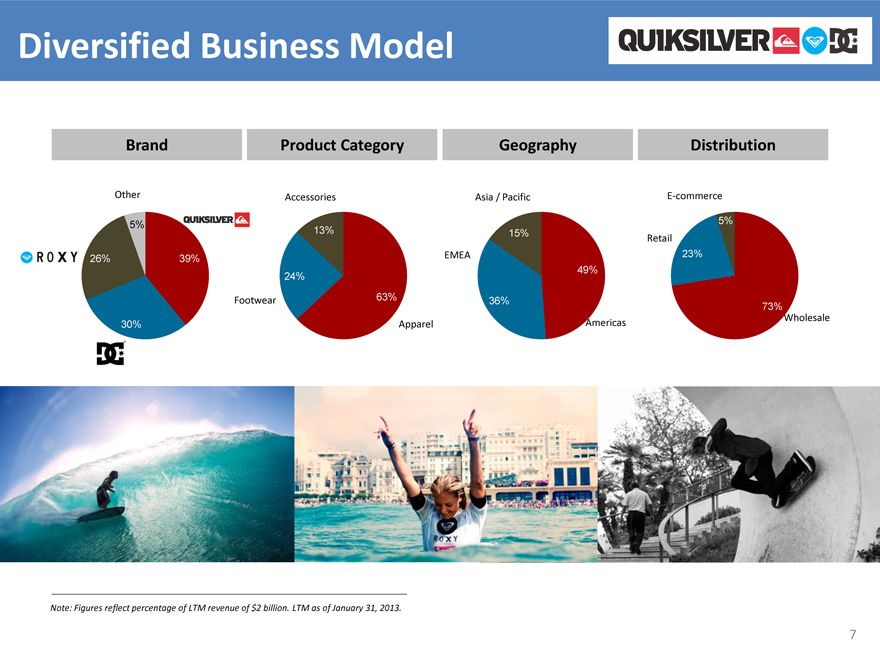
Diversified Business Model
Brand
Product Category
Geography
Distribution
Other
5%
26%
39%
30%
Accessories
13%
24%
63%
Footwear
Apparel
Asia / Pacific
EMEA
15%
36%
49%
Americas
E-commerce
Retail
5%
23%
73%
Wholesale
Note: Figures reflect percentage of LTM revenue of $2 billion. LTM as of January 31, 2013.
7
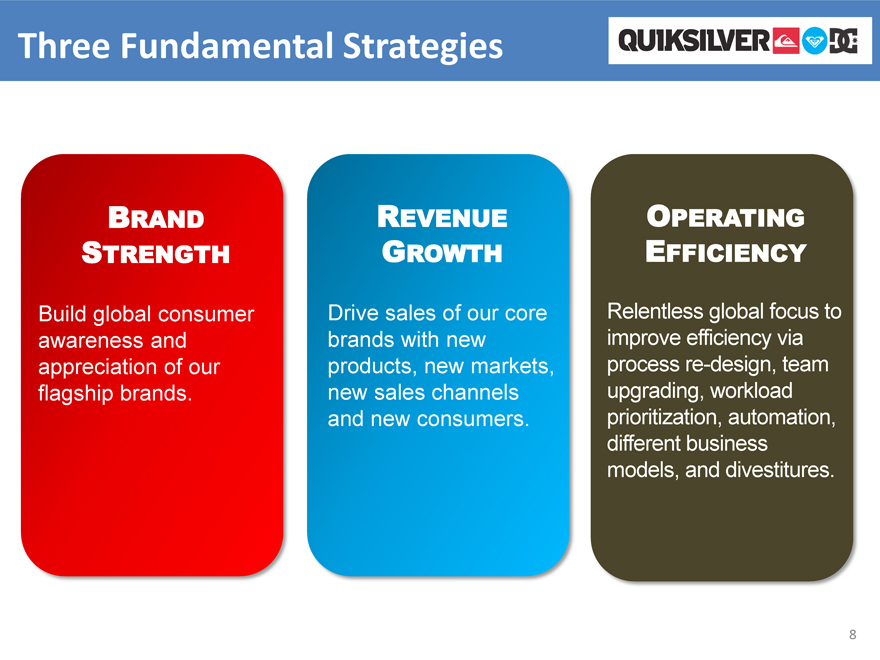
Three Fundamental Strategies
BRAND STRENGTH
Build global consumer awareness and appreciation of our flagship brands.
REVENUE GROWTH
Drive sales of our core brands with new products, new markets, new sales channels and new consumers.
OPERATING EFFICIENCY
Relentless global focus to improve efficiency via process re-design, team upgrading, workload prioritization, automation, different business models, and divestitures.
8
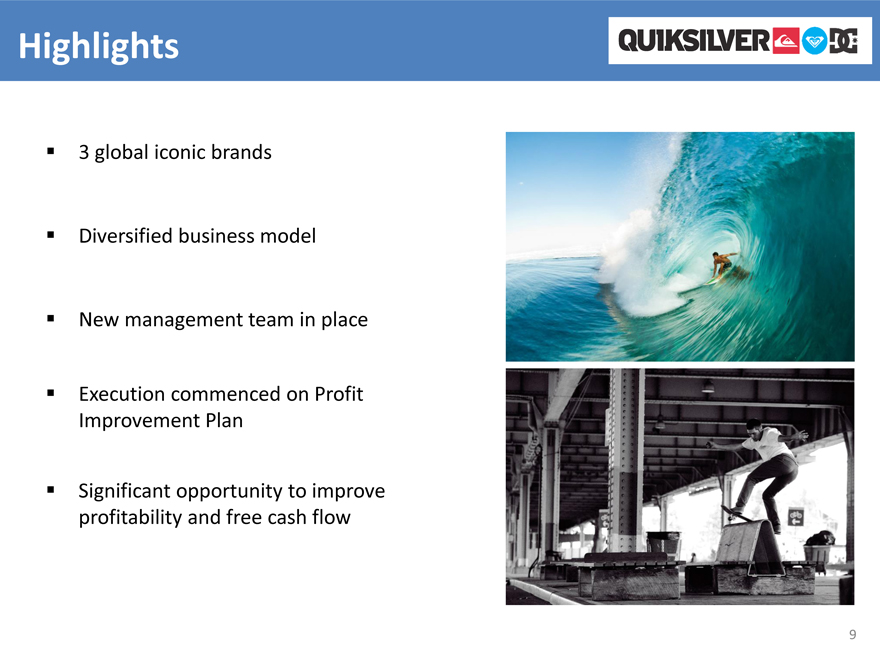
Highlights
3 global iconic brands Diversified business model New management team in place
Execution commenced on Profit Improvement Plan
Significant opportunity to improve profitability and free cash flow
9

Agenda
Company
Inflection Point
Profit Improvement Plan
Financial Performance
10
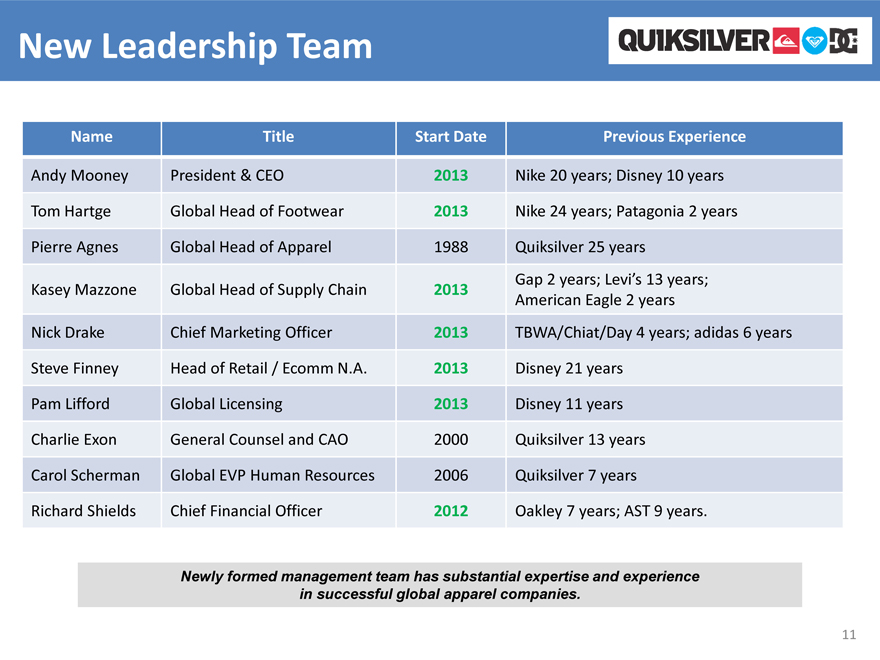
New Leadership Team
Name Title Start Date Previous Experience
Andy Mooney President & CEO 2013 Nike 20 years; Disney 10 years
Tom Hartge Global Head of Footwear 2013 Nike 24 years; Patagonia 2 years
Pierre Agnes Global Head of Apparel 1988 Quiksilver 25 years
Gap 2 years; Levi’s 13 years;
Kasey Mazzone Global Head of Supply Chain 2013
American Eagle 2 years
Nick Drake Chief Marketing Officer 2013 TBWA/Chiat/Day 4 years; adidas 6 years
Steve Finney Head of Retail / Ecomm N.A. 2013 Disney 21 years
Pam Lifford Global Licensing 2013 Disney 11 years
Charlie Exon General Counsel and CAO 2000 Quiksilver 13 years
Carol Scherman Global EVP Human Resources 2006 Quiksilver 7 years
Richard Shields Chief Financial Officer 2012 Oakley 7 years; AST 9 years.
Newly formed management team has substantial expertise and experience in successful global apparel companies.
11
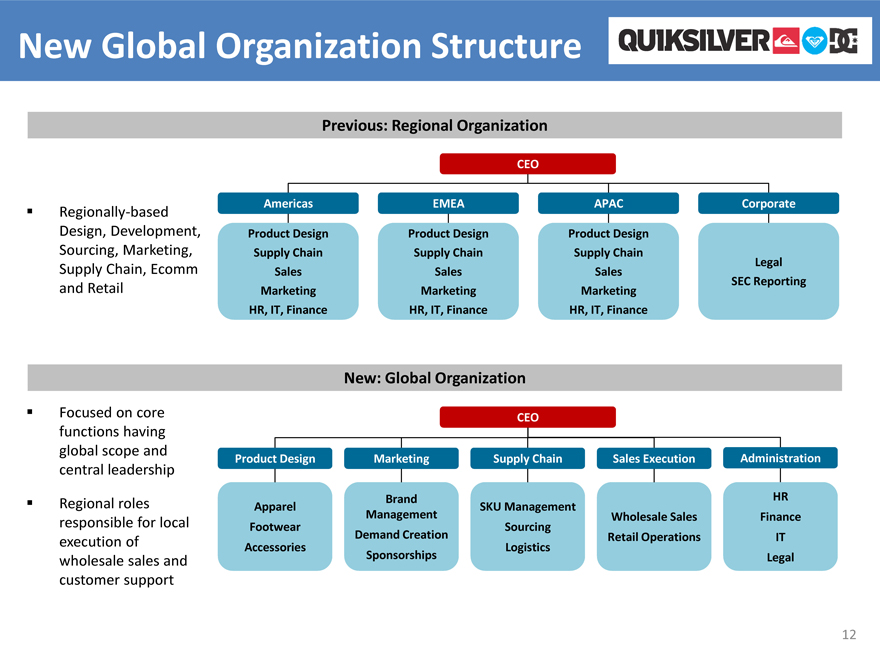
New Global Organization Structure
Previous: Regional Organization
Regionally-based Design, Development, Sourcing, Marketing, Supply Chain, Ecomm and Retail
CEO
Americas EMEA APAC Corporate
Product Design Supply Chain Sales Marketing HR, IT, Finance
Product Design Supply Chain Sales Marketing HR, IT, Finance
Product Design Supply Chain Sales Marketing HR, IT, Finance
Legal SEC Reporting
New: Global Organization
Focused on core functions having global scope and central leadership
Regional roles responsible for local execution of wholesale sales and customer support
Product Design Marketing Supply Chain Sales Execution Administration
Apparel Footwear Accessories
Brand Management Demand Creation Sponsorships
SKU Management Sourcing Logistics
Wholesale Sales Retail Operations
HR Finance IT Legal
12

Agenda
Company
Inflection Point
Profit Improvement Plan
Financial Performance
13
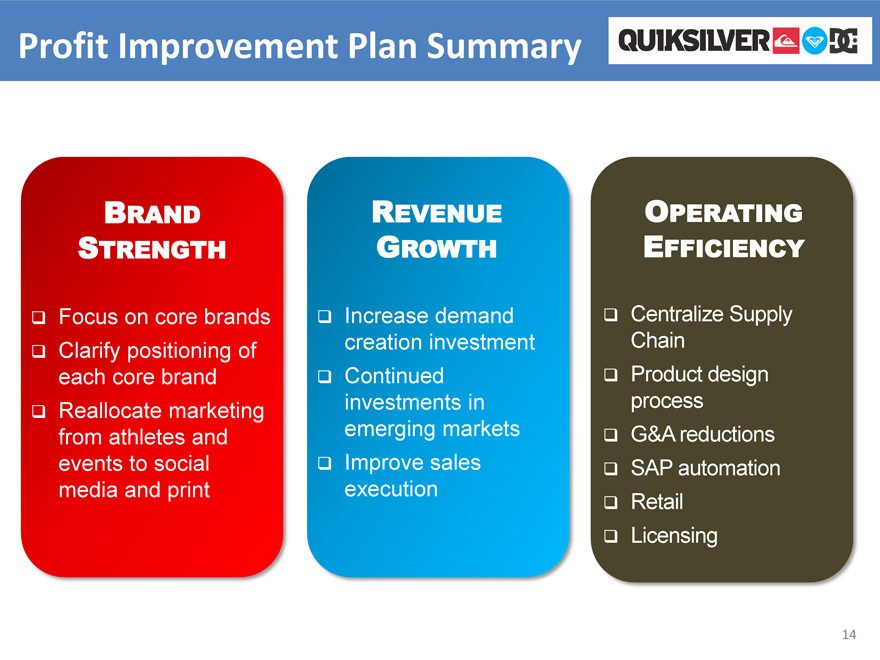
Profit Improvement Plan Summary
BRAND STRENGTH
Focus on core brands Clarify positioning of each core brand Reallocate marketing from athletes and events to social media and print
REVENUE GROWTH
Increase demand creation investment Continued investments in emerging markets Improve sales execution
OPERATING EFFICIENCY
Centralize Supply Chain Product design process
G&A reductions SAP automation Retail
Licensing
14
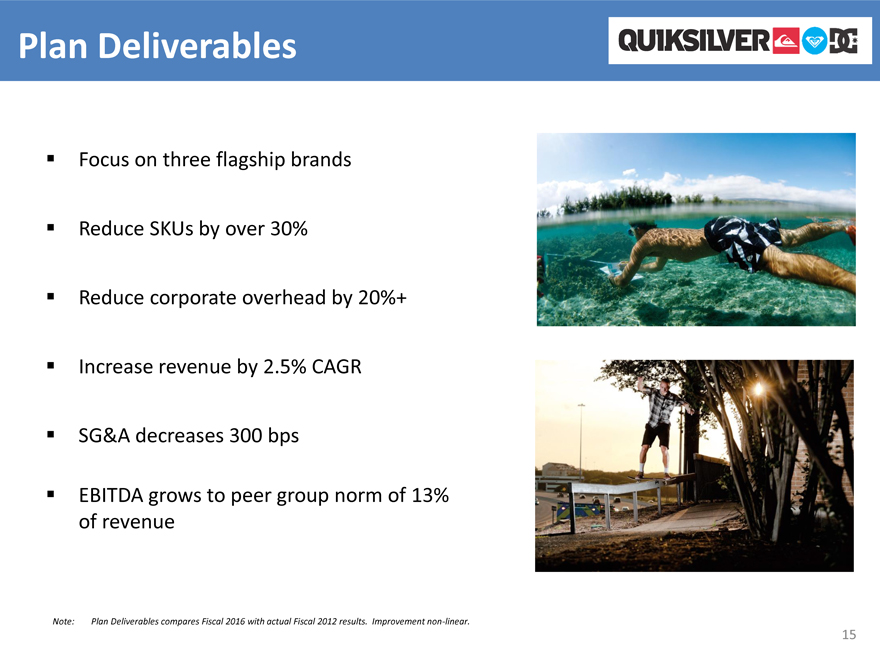
Plan Deliverables
Focus on three flagship brands Reduce SKUs by over 30% Reduce corporate overhead by 20%+ Increase revenue by 2.5% CAGR SG&A decreases 300 bps
EBITDA grows to peer group norm of 13% of revenue
Note: Plan Deliverables compares Fiscal 2016 with actual Fiscal 2012 results. Improvement non-linear.
15
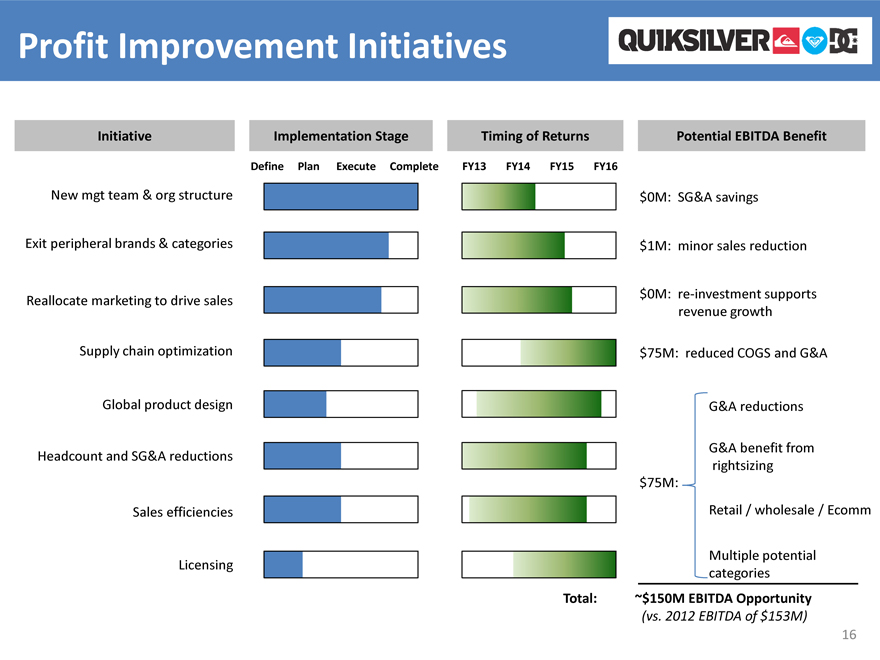
Profit Improvement Initiatives
Initiative Implementation Stage Timing of Returns Potential EBITDA Benefit
Define Plan Execute Complete FY13 FY14 FY15 FY16
New mgt team & org structure
Exit peripheral brands & categories
Reallocate marketing to drive sales
Supply chain optimization
Global product design
Headcount and SG&A reductions
Sales efficiencies
Licensing
$0M: SG&A savings
$1M: minor sales reduction
$0M: re-investment supports revenue growth
$75M: reduced COGS and G&A
$75M:
G&A reductions
G&A benefit from rightsizing
Retail / wholesale / Ecomm
Multiple potential categories
Total:
~$150M EBITDA Opportunity
(vs. 2012 EBITDA of $153M)
16
Mission Statement
Build Authentic, Active brands into
Significant Sustainable successes.
17
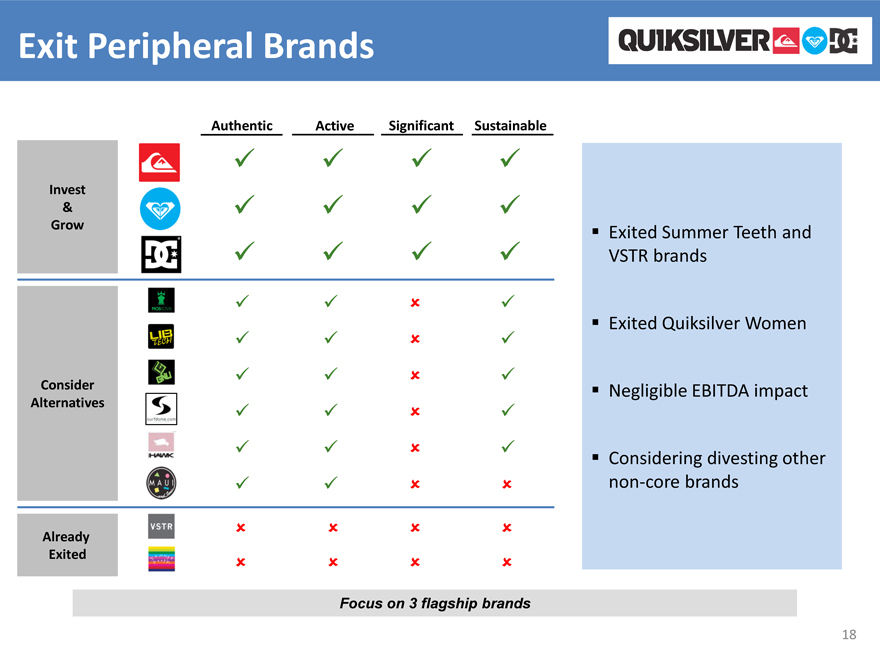
Exit Peripheral Brands
Authentic Active Significant Sustainable
Invest & Grow
Consider Alternatives
Already Exited
Exited Summer Teeth and VSTR brands
Exited Quiksilver Women
Negligible EBITDA impact
Considering divesting other non-core brands
Focus on 3 flagship brands
18
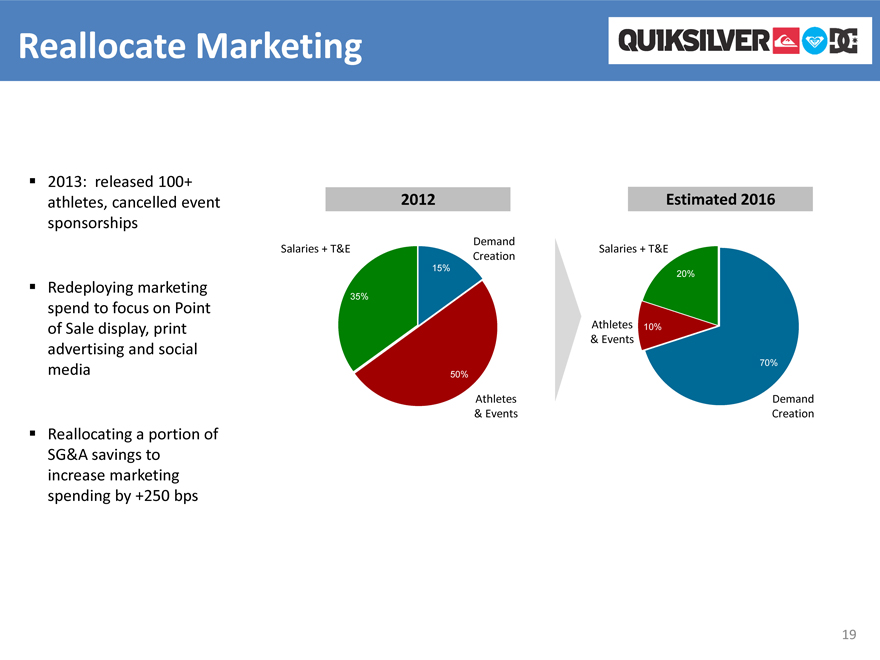
Reallocate Marketing
2013: released 100+ athletes, cancelled event sponsorships
Redeploying marketing spend to focus on Point of Sale display, print advertising and social media
Reallocating a portion of SG&A savings to increase marketing spending by +250 bps
2012
Salaries + T&E
35%
15%
50%
Athletes & Events
Demand Creation
Estimated 2016
Salaries + T&E
Athletes
& Events
20%
10%
70%
Demand Creation
19
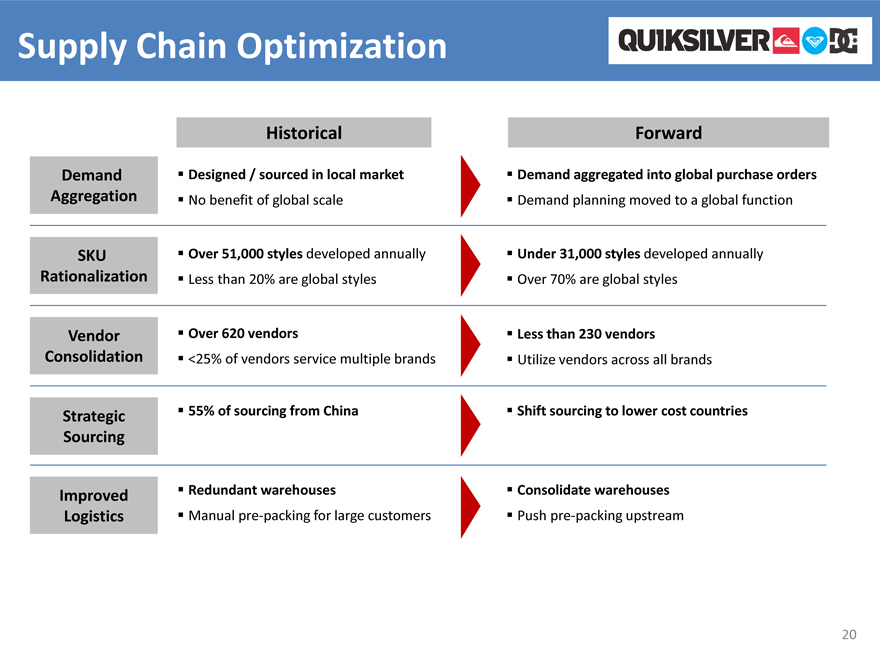
Supply Chain Optimization
Historical
Demand Aggregation
SKU Rationalization
Vendor Consolidation
Strategic Sourcing
Improved Logistics
Designed / sourced in local market
No benefit of global scale
Over 51,000 styles developed annually
Less than 20% are global styles
Over 620 vendors
<25% of vendors service multiple brands
55% of sourcing from China
Redundant warehouses
Manual pre-packing for large customers
Forward
Demand aggregated into global purchase orders
Demand planning moved to a global function
Under 31,000 styles developed annually
Over 70% are global styles
Less than 230 vendors
Utilize vendors across all brands
Shift sourcing to lower cost countries
Consolidate warehouses
Push pre-packing upstream
20
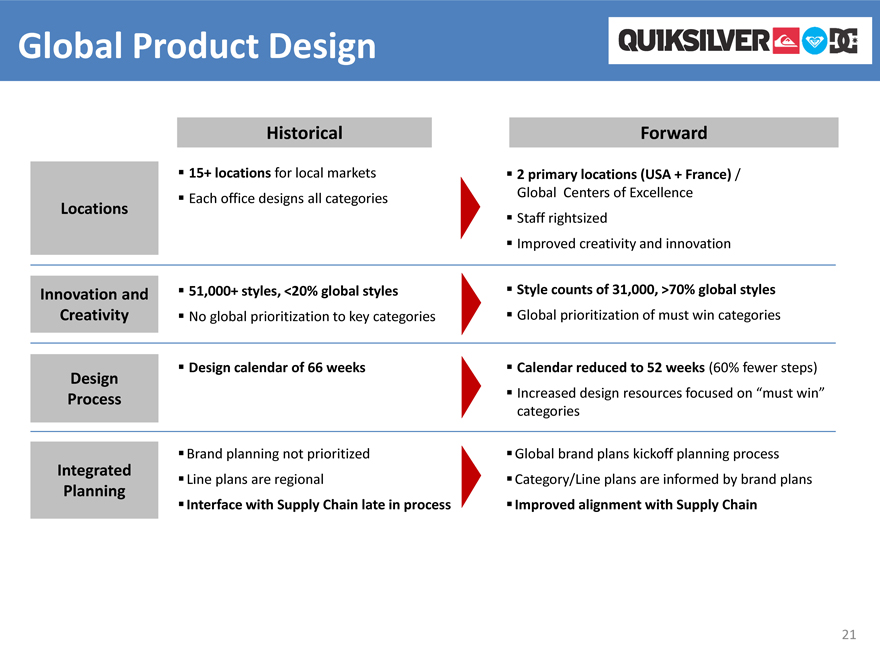
Global Product Design
Historical
Locations
Innovation and Creativity
Design Process
Integrated Planning
15+ locations for local markets
Each office designs all categories
51,000+ styles, <20% global styles
No global prioritization to key categories
Design calendar of 66 weeks
Brand planning not prioritized
Line plans are regional
Interface with Supply Chain late in process
Forward
2 primary locations (USA + France) /
Global Centers of Excellence Staff rightsized
Improved creativity and innovation
Style counts of 31,000, >70% global styles
Global prioritization of must win categories
Calendar reduced to 52 weeks (60% fewer steps)
Increased design resources focused on “must win” categories
Global brand plans kickoff planning process
Category/Line plans are informed by brand plans
Improved alignment with Supply Chain
21
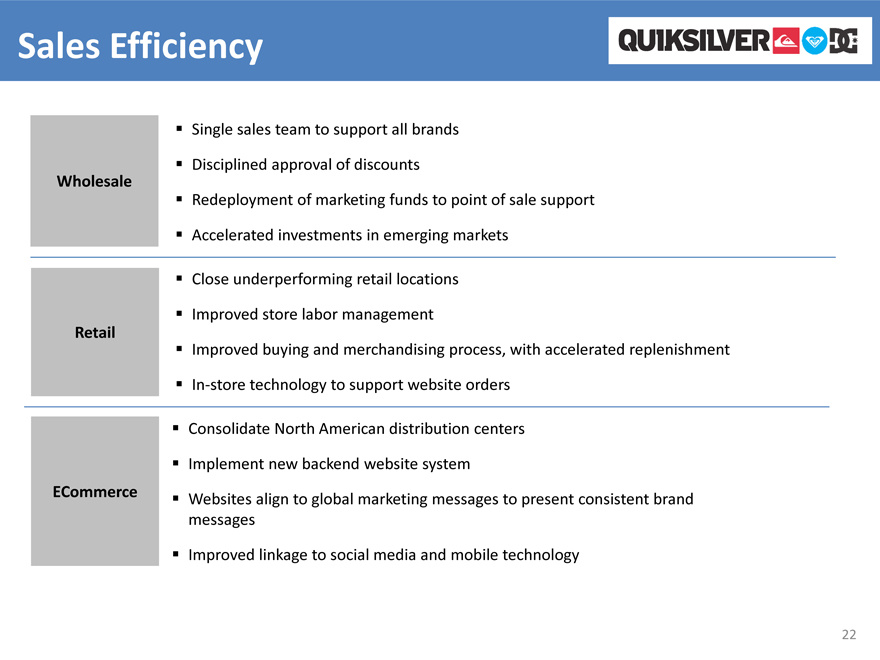
Sales Efficiency
Wholesale
Single sales team to support all brands
Disciplined approval of discounts
Redeployment of marketing funds to point of sale support
Accelerated investments in emerging markets
Retail
Close underperforming retail locations
Improved store labor management
Improved buying and merchandising process, with accelerated replenishment
In-store technology to support website orders
ECommerce
Consolidate North American distribution centers
Implement new backend website system
Websites align to global marketing messages to present consistent brand messages
Improved linkage to social media and mobile technology
22
Agenda
Company
Inflection Point
Profit Improvement Plan
Financial Performance
23
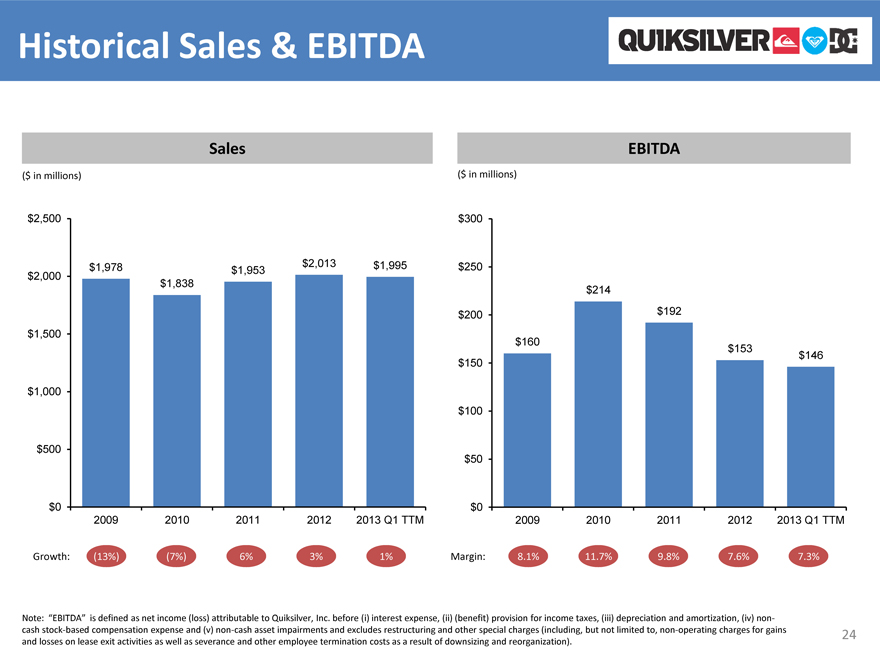
Historical Sales & EBITDA
Sales
($ in millions)
$2,500
$2,000
$1,500
$1,000
$500
$0
$1,978
$1,838
$1,953
$2,013
$1,995
2009 2010 2011 2012 2013 Q1 TTM
EBITDA
($ in millions)
$300
$250
$200
$150
$100
$50
$0
$160
$214
$192
$153
$146
2009 2010 2011 2012 2013 Q1 TTM
Growth: (13%) (7%) 6% 3% 1%
Margin: 8.1% 11.7% 9.8% 7.6% 7.3%
Note: “EBITDA” is defined as net income (loss) attributable to Quiksilver, Inc. before (i) interest expense, (ii) (benefit) provision for income taxes, (iii) depreciation and amortization, (iv) non-cash stock-based compensation expense and (v) non-cash asset impairments and excludes restructuring and other special charges (including, but not limited to, non-operating charges for gains and losses on lease exit activities as well as severance and other employee termination costs as a result of downsizing and reorganization).
24
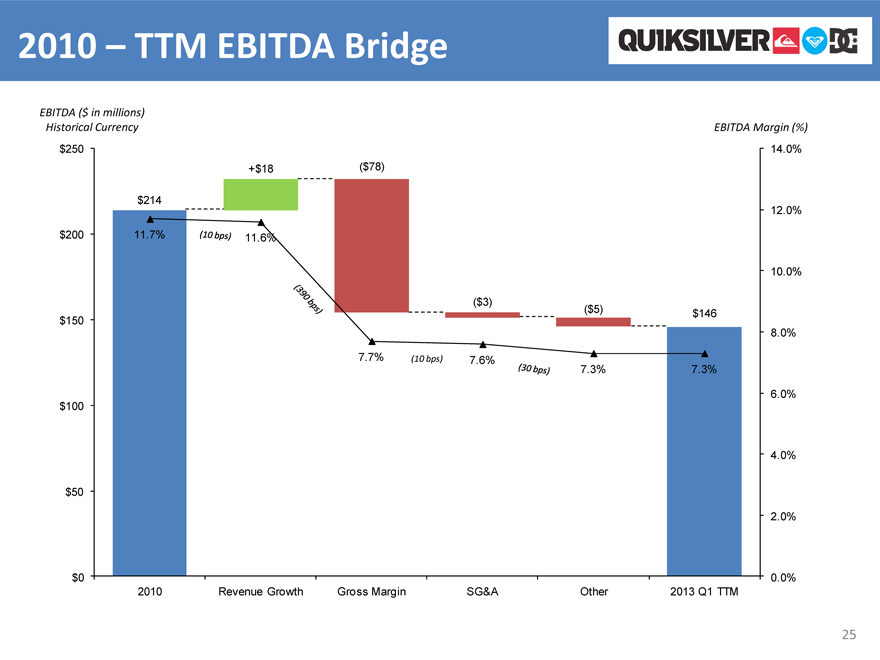
2010 – TTM EBITDA Bridge
EBITDA ($ in millions) Historical Currency
$250
$200
$150
$100
$50
$0
$214
+$18
($78)
($3)
($5)
$146
11.7%
(10bps)
11.6%
(390 bps)
7.7%
(10 bps)
7.6%
(30bps)
7.3%
7.3%
EBITDA Margin (%)
14.0%
12.0%
10.0%
8.0%
6.0%
4.0%
2.0%
0.0%
2010 Revenue Growth Gross Margin SG&A Other 2013 Q1 TTM
25
www.quiksilverinc.com