Exhibit 99.1
Investor Presentation
Sizeler Property Investors, Inc.
August 2005
Safe Harbor Statement
This Investor Presentation speaks as of August 22, 2005 and contains certain forward-looking statements that are subject to risk and uncertainty including forecasts of future operating results based on certain assumptions contained herein. Investors and potential investors in our securities are cautioned that a number of factors could adversely affect our Company and cause actual results to differ materially from those in the forward-looking statements and forecasts, including, but not limited to (a) the inability to lease current or future vacant space in our properties; (b) decisions by tenants and anchor tenants who own their space to close stores at our properties, as the result of individual operating decisions, internal reorganization, or other factors; (c) the inability of tenants to pay rent and other expenses or other tenant financial difficulties; (d) disruption of tenant operations or uninsured repair costs as the result of hurricanes in the southeastern U.S. or other adverse weather conditions or forces of nature; (e) general economic and world conditions, including threats to the United States homeland from unfriendly factions; (f) decreases in rental rates available from tenants; (g) increases in operating costs at our properties; (h) increases in corporate operating costs associated with new regulatory requirements; (i) lack of availability of financing for acquisition, development and rehabilitation of properties by us; (j) force majeure as it relates to construction and renovation projects; (k) possible dispositions of mature properties because we are continuously engaged in the examination of our various lines of business; (l) increases in interest rates; (m) a general economic downturn resulting in lower retail sales and causing downward pressure on occupancies and rents at retail properties; (n) the adverse tax consequences if we were to fail to qualify as a REIT in any taxable year; and (o) inability to purchase or sell properties in the amount and at the times expected or forecast by management; (p) increases in market prices for properties such that the Company would be required to purchase properties at lower cap rates or at lower revenue run rates; (q) inability of our Company to implement its strategic initiatives for foregoing or other reasons. Although management believes that the assumptions on which the forecasts were made are reasonable, management cannot provide any assurance that the results contained in these forecasts will be attained, whether on account of the foregoing factors or other uncertainties outside of management’s control. Except as required under federal securities laws and the rules and regulations of the SEC, we do not have any intention or obligation to update or revise any forward-looking statements made in this Investor Presentation, whether as a result of new information, future events, changes in assumptions or otherwise.
- 1 -

Company Overview
- 2 -
Company Overview
Fully integrated, self-administered, self-managed equity REIT
Owner, operator, developer, and redeveloper of retail and multi-family apartment properties in Southeastern U.S.
Portfolio of high quality properties consisting of:
14 apartment communities (3,063 units) 13 shopping centers (1,542,000 s.f.) 3 regional malls (1,185,000 s.f.)
Highly experienced, value-added management team with extensive development and acquisition expertise
Successful on-going implementation of strategic plan
Strengthening operating results from portfolio repositioning Significantly de-leveraged balance sheet Strategically positioned to execute growth
- 3 -

Portfolio Overview
- 4 -
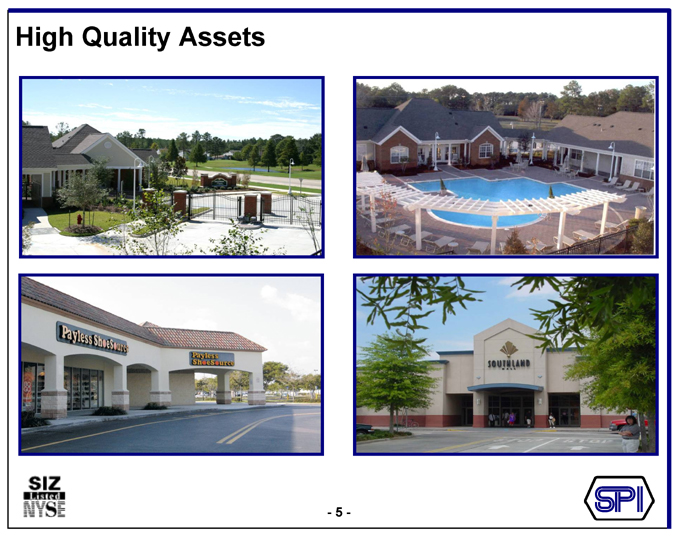
High Quality Assets
- 5 -
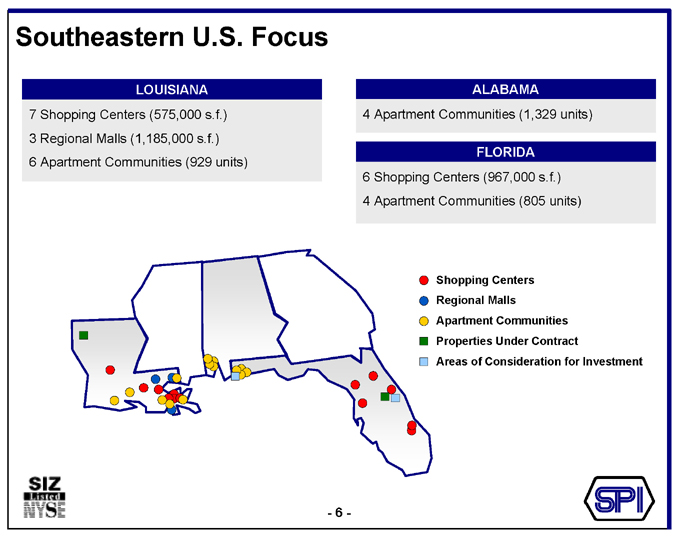
Southeastern U.S. Focus
LOUISIANA
7 Shopping Centers (575,000 s.f.) 3 Regional Malls (1,185,000 s.f.) 6 Apartment Communities (929 units)
ALABAMA
4 Apartment Communities (1,329 units)
FLORIDA
6 Shopping Centers (967,000 s.f.) 4 Apartment Communities (805 units)
Shopping Centers Regional Malls Apartment Communities Properties Under Contract
Areas of Consideration for Investment
- 6 -
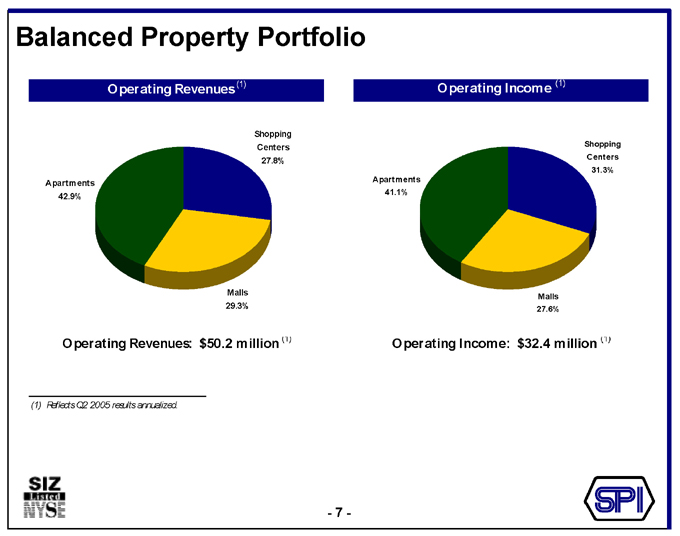
Balanced Property Portfolio
Operating Revenues(1)
Shopping Centers 27.8%
Apartments 42.9%
Malls 29.3%
Operating Revenues: $50.2 million (1)
Operating Income (1)
Shopping Centers 31.3%
Apartments 41.1%
Malls 27.6%
Operating Income: $32.4 million (1)
(1) Reflects Q2 2005 results annualized.
- 7 -
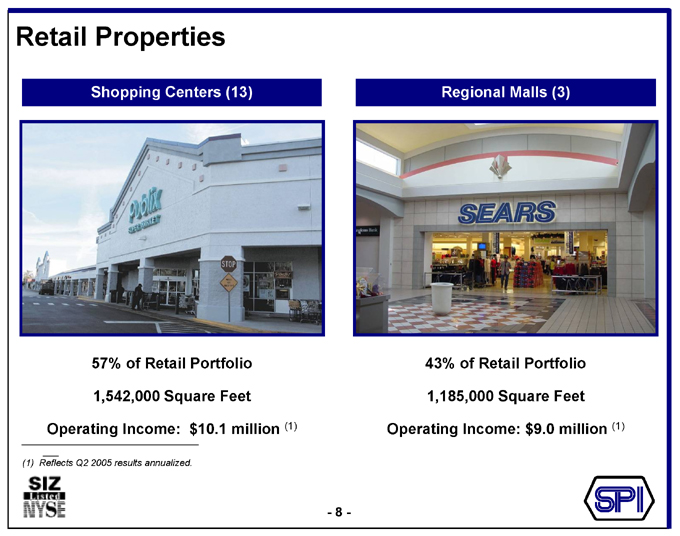
Retail Properties
Shopping Centers (13)
57% of Retail Portfolio 1,542,000 Square Feet Operating Income: $10.1 million (1)
Regional Malls (3)
43% of Retail Portfolio 1,185,000 Square Feet Operating Income: $9.0 million (1)
(1) Reflects Q2 2005 results annualized.
- 8 -

Retail Portfolio
Property Name City State Year(s) Completed Year(s) Renovated GLA (sq. feet) % Leased 6/30/05
Shopping Centers (13)
Lantana Plaza (1) Palm Beach County FL 1992 1999 274,000 60%
Westward W. Palm Beach FL 1961, 1990 1995, 2000, 2003 222,000 100%
Town & Country Palatka FL 1989 2000, 2001, 2002 193,000 97%
Rainbow Square Dunnellon FL 1986 2001, 2003 116,000 84%
Weeki Wachee Village Weeki Wachee FL 1987 2000, 2002 82,000 92%
Florida Shores Plaza Edgewater FL 1983 - 80,000 100%
Florida Total 967,000
Westgate Alexandria LA 1964 1987, 2001 208,000 95%
Westland (2) Kenner LA 1966 1990, 1999 110,000 100%
Gonzales Plaza Gonzales LA 1989 2001, 2002, 2003 73,000 100%
Airline Park Metairie LA 1973 1986, 2001, 2003 54,000 100%
Azalea Gardens Jefferson LA 1950 1986, 2002, 2003 45,000 100%
Colonial Harahan LA 1967 1987, 1999 45,000 100%
Southwood (2) Gretna LA 1986 2001 40,000 100%
Lousiana Total 575,000
Shopping Center Total 1,542,000
Regional Malls (3)
Southland Mall Houma LA 1970, 1981 1994, 2003 471,000 95%
Hammond Square Mall (1) Hammond LA 1978 1992, 1995 361,000 68%
North Shore Square Mall Slidell LA 1986 1995, 2001, 2002, 2003 353,000 94%
Regional Mall Total 1,185,000
Retail Total 2,727,000 89%
(1) Redevelopment projects. (2) Subject to ground lease.
- 9 -
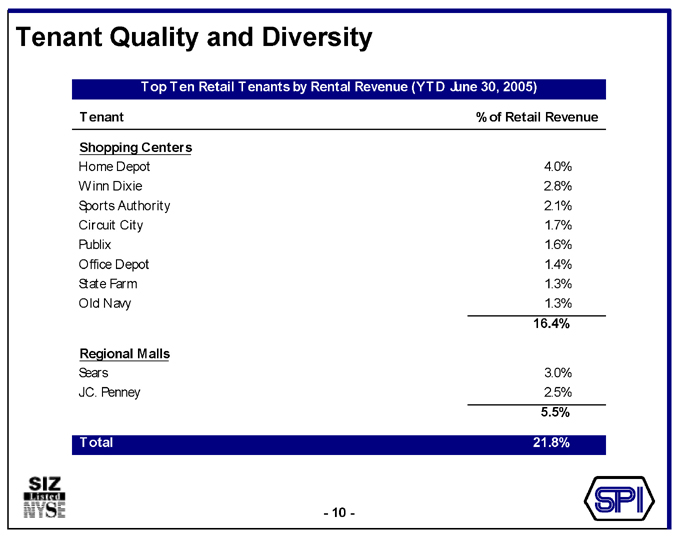
Tenant Quality and Diversity
Top Ten Retail Tenants by Rental Revenue (YTD June 30, 2005)
Tenant % of Retail Revenue
Shopping Centers
Home Depot 4.0%
Winn Dixie 2.8%
Sports Authority 2.1%
Circuit City 1.7%
Publix 1.6%
Office Depot 1.4%
State Farm 1.3%
Old Navy 1.3%
16.4%
Regional Malls
Sears 3.0%
J.C. Penney 2.5%
5.5%
Total 21.8%
- 10 -
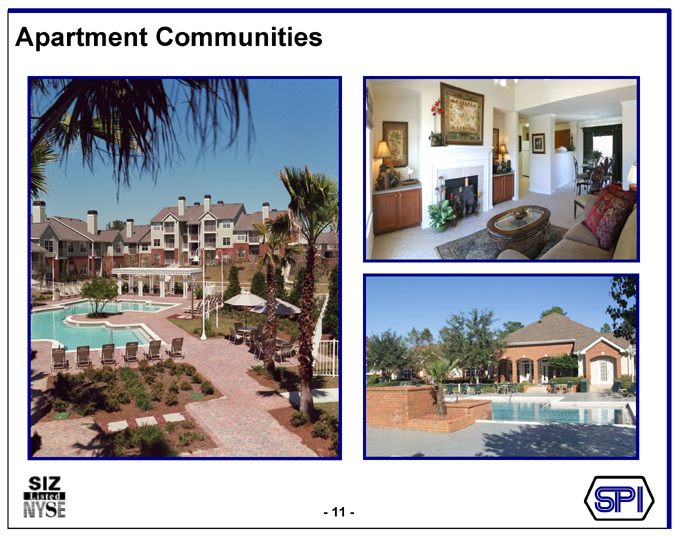
Apartment Communities
- 11 -
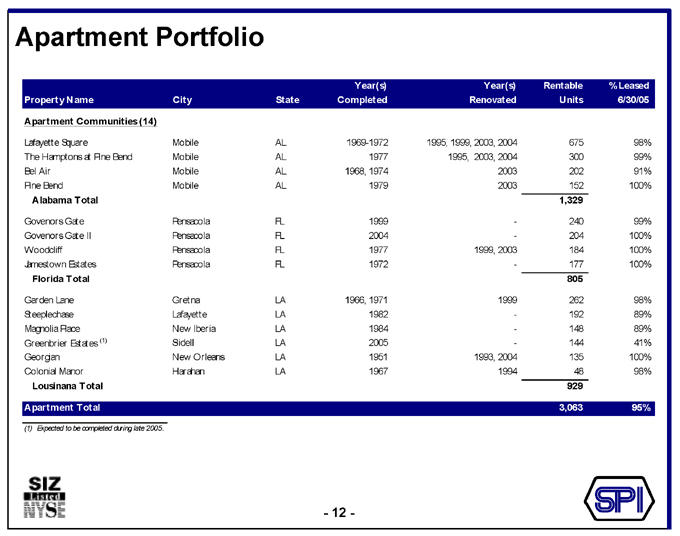
Apartment Portfolio
Property Name City State Year(s) Completed Year(s) Renovated Rentable Units % Leased 6/30/05
Apartment Communities (14)
Lafayette Square Mobile AL 1969-1972 1995, 1999, 2003, 2004 675 98%
The Hamptons at Pine Bend Mobile AL 1977 1995, 2003, 2004 300 99%
Bel Air Mobile AL 1968, 1974 2003 202 91%
Pine Bend Mobile AL 1979 2003 152 100%
Alabama Total 1,329
Govenors Gate Pensacola FL 1999 - 240 99%
Govenors Gate II Pensacola FL 2004 - 204 100%
Woodcliff Pensacola FL 1977 1999, 2003 184 100%
Jamestown Estates Pensacola FL 1972 - 177 100%
Florida Total 805
Garden Lane Gretna LA 1966, 1971 1999 262 98%
Steeplechase Lafayette LA 1982 - 192 89%
Magnolia Place New Iberia LA 1984 - 148 89%
Greenbrier Estates (1) Slidell LA 2005 - 144 41%
Georgian New Orleans LA 1951 1993, 2004 135 100%
Colonial Manor Harahan LA 1967 1994 48 98%
Lousinana Total 929
Apartment Total 3,063 95%
(1) Expected to be completed during late 2005.
- 12 -
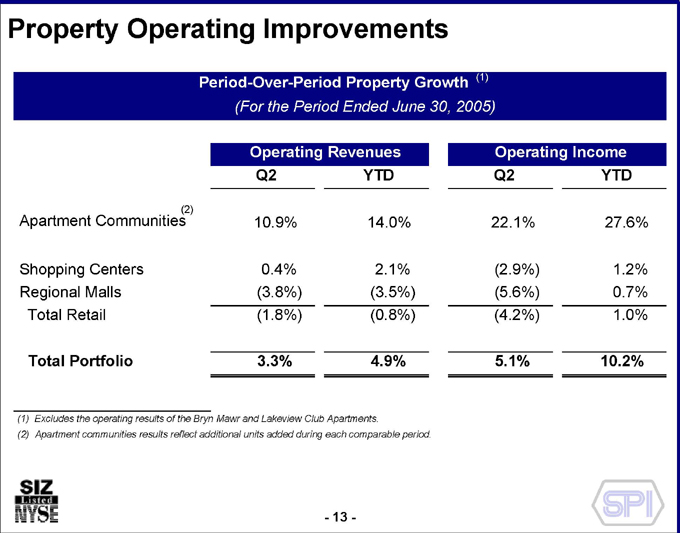
Property Operating Improvements
Period-Over-Period Property Growth (1)
(For the Period Ended June 30, 2005)
Operating Revenues Operating Income
Q2 YTD Q2 YTD
Apartment Communities (2) 10.9% 14.0% 22.1% 27.6%
Shopping Centers 0.4% 2.1% (2.9%) 1.2%
Regional Malls (3.8%) (3.5%) (5.6%) 0.7%
Total Retail (1.8%) (0.8%) (4.2%) 1.0%
Total Portfolio 3.3% 4.9% 5.1% 10.2%
(1) Excludes the operating results of the Bryn Mawr and Lakeview Club Apartments.
(2) Apartment communities results reflect additional units added during each comparable period.
- 13 -

Strategic Plan Update
- 14 -
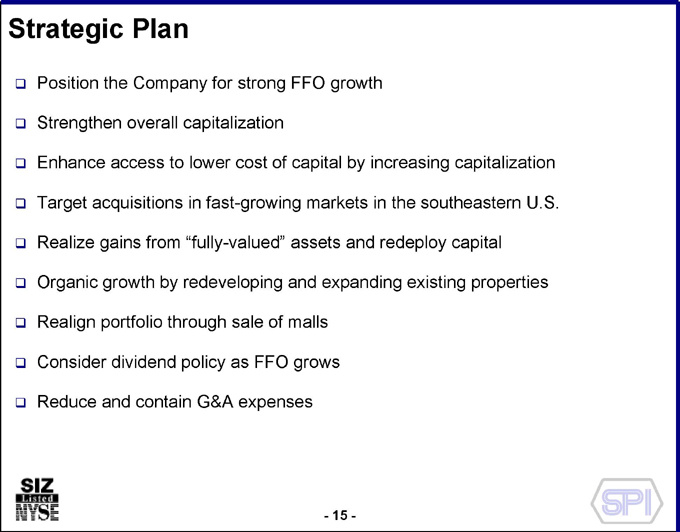
Strategic Plan
Position the Company for strong FFO growth
Strengthen overall capitalization
Enhance access to lower cost of capital by increasing capitalization Target acquisitions in fast-growing markets in the southeastern U.S. Realize gains from “fully-valued” assets Organic growth by redeveloping and expanding existing properties Realign portfolio through sale of malls Consider dividend policy as FFO grows Reduce and contain G&A expenses
- 15 -
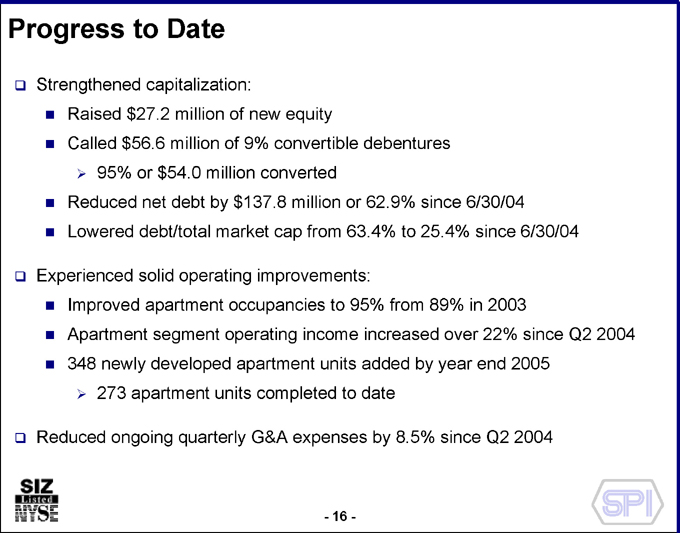
Progress to Date
Strengthened capitalization:
Raised $27.2 million of equity
Called $56.6 million of 9% convertible debentures
95% or $54.0 million converted
Reduced net debt by $137.8 million or 62.9% since 6/30/04 Lowered debt/total market cap from 63.4% to 25.4% since 6/30/04
Experienced solid operating improvements:
Improved apartment occupancies to 95% from 89% in 2003
Apartment segment operating income increased over 22% since Q2 2004 348 newly developed apartment units added by year end 2005
273 apartment units completed to date
Reduced ongoing quarterly G&A expenses by 8.5% since Q2 2004
- 16 -
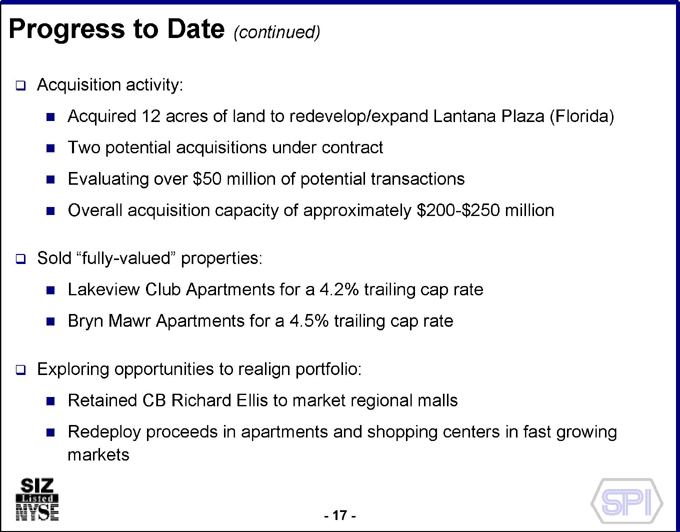
Progress to Date (continued)
Acquisition activity:
Acquired 12 acres of land to redevelop/expand Lantana Plaza (Florida) Two potential acquisitions under contract Evaluating over $50 million of potential transactions Overall acquisition capacity of approximately $200-$250 million
Sold “fully-valued” properties:
Lakeview Club Apartments for a 4.2% trailing cap rate Bryn Mawr Apartments for a 4.5% trailing cap rate
Exploring opportunities to realign portfolio:
Retained CB Richard Ellis to market regional malls Redeploy proceeds in apartments and shopping centers in fast growing markets
- 17 -

Corporate Governance
- 18 -
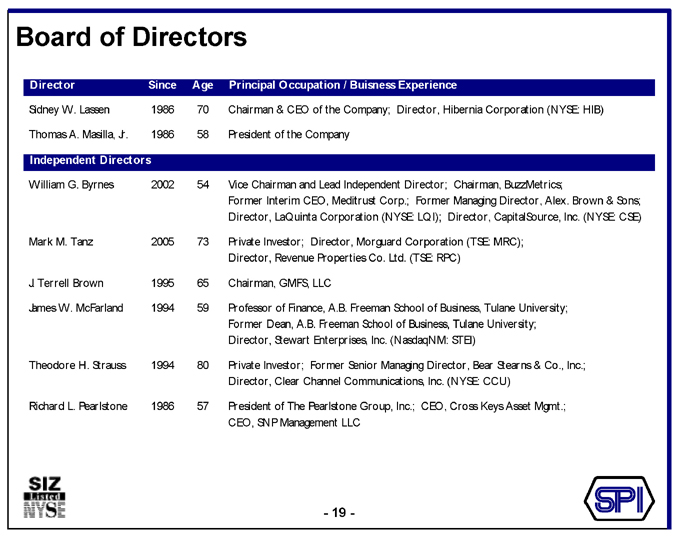
Board of Directors
Director Since Age Principal Occupation / Buisness Experience
Sidney W. Lassen 1986 70 Chairman & CEO of the Company; Director, Hibernia Corporation (NYSE: HIB)
Thomas A. Masilla, Jr. 1986 58 President of the Company
Independent Directors
William G. Byrnes 2002 54 Vice Chairman and Lead Independent Director; Chairman, BuzzMetrics;
Former Interim CEO, Meditrust Corp.; Former Managing Director, Alex. Brown & Sons;
Director, LaQuinta Corporation (NYSE: LQI); Director, CapitalSource, Inc. (NYSE: CSE)
Mark M. Tanz 2005 73 Private Investor; Director, Morguard Corporation (TSE: MRC);
Director, Revenue Properties Co. Ltd. (TSE: RPC)
J. Terrell Brown 1995 65 Chairman, GMFS, LLC
James W. McFarland 1994 59 Professor of Finance, A.B. Freeman School of Business, Tulane University;
Former Dean, A.B. Freeman School of Business, Tulane University;
Director, Stewart Enterprises, Inc. (NasdaqNM: STEI)
Theodore H. Strauss 1994 80 Private Investor; Former Senior Managing Director, Bear Stearns & Co., Inc.;
Director, Clear Channel Communications, Inc. (NYSE: CCU)
Richard L. Pearlstone 1986 57 President of The Pearlstone Group, Inc.; CEO, Cross Keys Asset Mgmt.;
CEO, SNP Management LLC
- 19 -
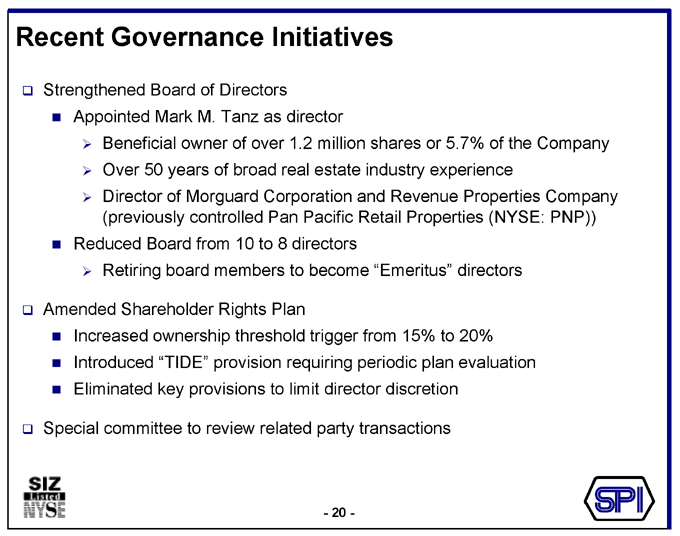
Recent Governance Initiatives
Strengthened Board of Directors
Appointed Mark M. Tanz as director
Beneficial owner of over 1.2 million shares or 5.7% of the Company Over 50 years of broad real estate industry experience Director of Morguard Corporation and Revenue Properties Company (previously controlled Pan Pacific Retail Properties (NYSE: PNP))
Reduced Board from 10 to 8 directors
Retiring board members to become “Emeritus” directors
Amended Shareholder Rights Plan
Increased ownership threshold trigger from 15% to 20% Introduced “TIDE” provision requiring periodic plan evaluation Eliminated key provisions to limit director discretion
Special committee to review related party transactions
- 20 -

Financial Overview
- 21 -
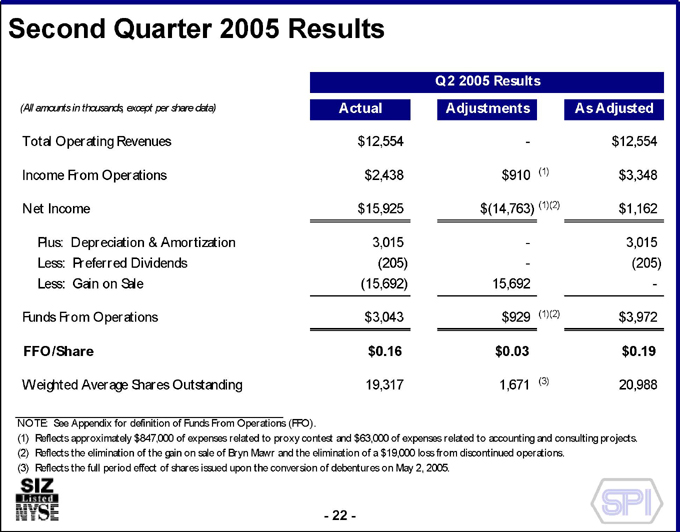
Second Quarter 2005 Results
Q2 2005 Results
(All amounts in thousands, except per share data) Actual Adjustments As Adjusted
Total Operating Revenues $12,554 - $12,554
Income From Operations $2,438 $910 (1) $3,348
Net Income $15,925 $(14,763) (1)(2) $1,162
Plus: Depreciation & Amortization 3,015 - 3,015
Less: Preferred Dividends (205) - (205)
Less: Gain on Sale (15,692) 15,692 -
Funds From Operations $3,043 $929 (1)(2) $3,972
FFO/Share $0.16 $0.03 $0.19
Weighted Average Shares Outstanding 19,317 1,671 (3) 20,988
NOTE: See Appendix for definition of Funds From Operations (FFO).
(1) Reflects approximately $847,000 of proxy related expenses and $63,000 of other non-ordinary items.
(2) Reflects the elimination of the gain on sale of Bryn Mawr and the elimination of a $19,000 loss from discontinued operations. (3) Reflects the full period effect of shares issued upon the conversion of debentures on May 2, 2005.
- 22 -
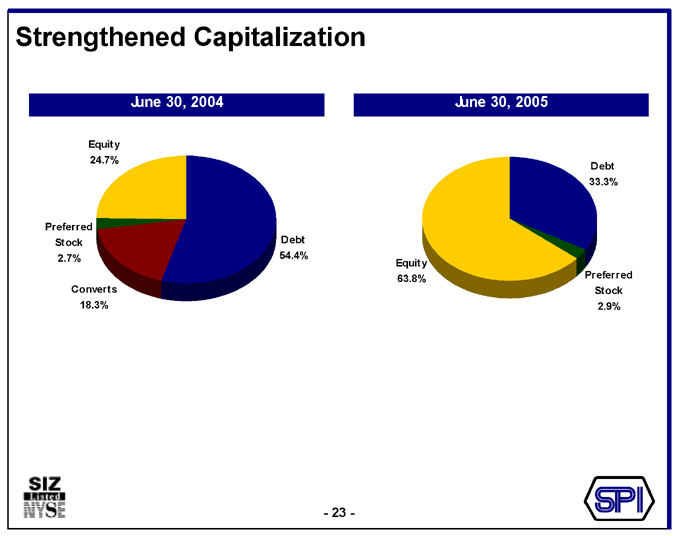
Strengthened Capitalization
June 30, 2004
Equity 24.7%
Preferred Stock 2.7%
Converts 18.3%
Debt 54.4%
June 30, 2005
Debt 33.3%
Equity 63.8%
Preferred Stock 2.9%
- 23 -
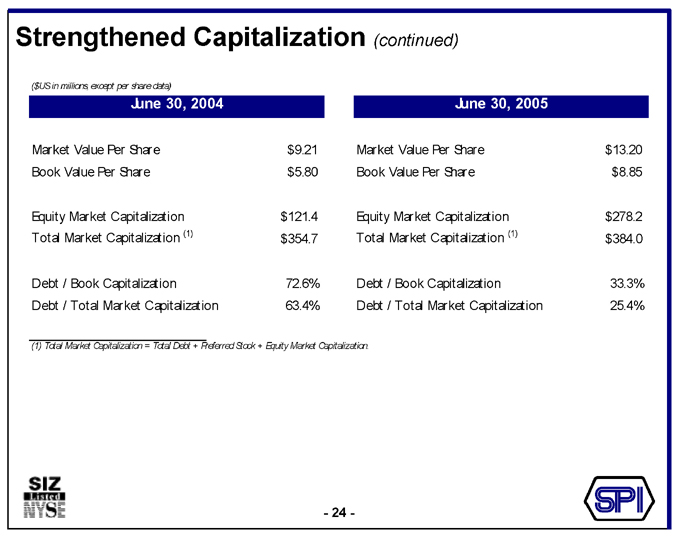
Strengthened Capitalization (continued)
($US in millions, except per share data)
June 30, 2004
Market Value Per Share $9.21
Book Value Per Share $5.80
Equity Market Capitalization $121.4
Total Market Capitalization (1) $354.7
Debt / Book Capitalization 72.6%
Debt / Total Market Capitalization 63.4%
June 30, 2005
Market Value Per Share $13.20
Book Value Per Share $8.85
Equity Market Capitalization $278.2
Total Market Capitalization (1) $384.0
Debt / Book Capitalization 33.3%
Debt / Total Market Capitalization 25.4%
(1) Total Market Capitalization = Total Debt + Preferred Stock + Equity Market Capitalization.
- 24 -
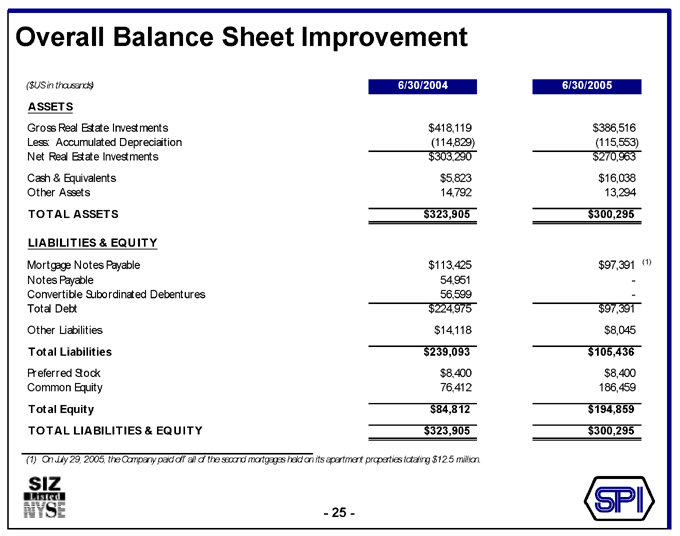
Overall Balance Sheet Improvement
($US in thousands) 6/30/2004 6/30/2005
ASSETS
Gross Real Estate Investments $418,119 $386,516
Less: Accumulated Depreciaition (114,829) (115,553)
Net Real Estate Investments $303,290 $270,963
Cash & Equivalents $5,823 $16,038
Other Assets 14,792 13,294
TOTAL ASSETS $323,905 $300,295
LIABILITIES & EQUITY
Mortgage Notes Payable $113,425 $97,391 (1)
Notes Payable 54,951 -
Convertible Subordinated Debentures 56,599 -
Total Debt $224,975 $97,391
Other Liabilities $14,118 $8,045
Total Liabilities $239,093 $105,436
Preferred Stock $8,400 $8,400
Common Equity 76,412 186,459
Total Equity $84,812 $194,859
TOTAL LIABILITIES & EQUITY $323,905 $300,295
(1) On July 29, 2005, the Company paid off all of the second mortgages held on its apartment properties totaling $12.5 million.
- 25 -
Financial Forecast Assumptions
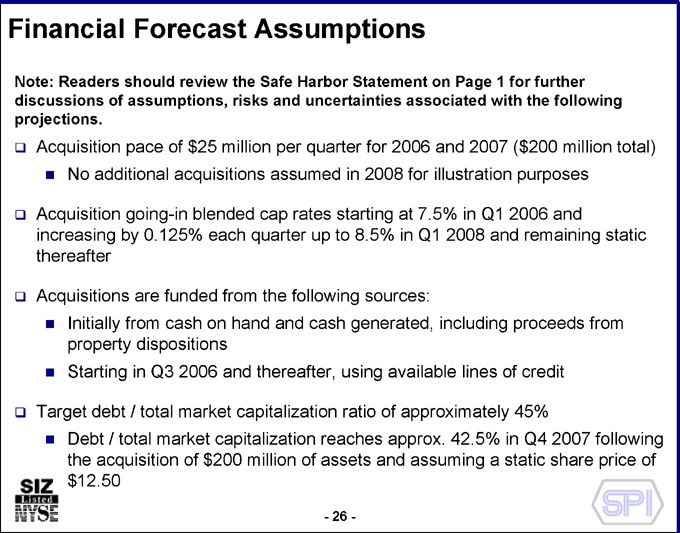
Note: Readers should review the Safe Harbor Statement on Page 1 for further discussions of assumptions, risks and uncertainties associated with the following projections.
Acquisition pace of $25 million per quarter for 2006 and 2007 ($200 million total)
No additional acquisitions assumed in 2008 for illustration purposes
Acquisition going-in blended cap rates starting at 7.5% in Q1 2006 and increasing by 0.125% each quarter up to 8.5% in Q1 2008 and remaining static thereafter
Acquisitions are funded from the following sources:
Initially from cash on hand and cash generated, including proceeds from property dispositions
Starting in Q3 2006 and thereafter, using available lines of credit
Target debt / total market capitalization ratio of approximately 45%
Debt / total market capitalization reaches approx. 42.5% in Q4 2007 following the acquisition of $200 million of assets and assuming a static share price of $12.50
- 26 -
Financial Forecast Assumptions (continued)
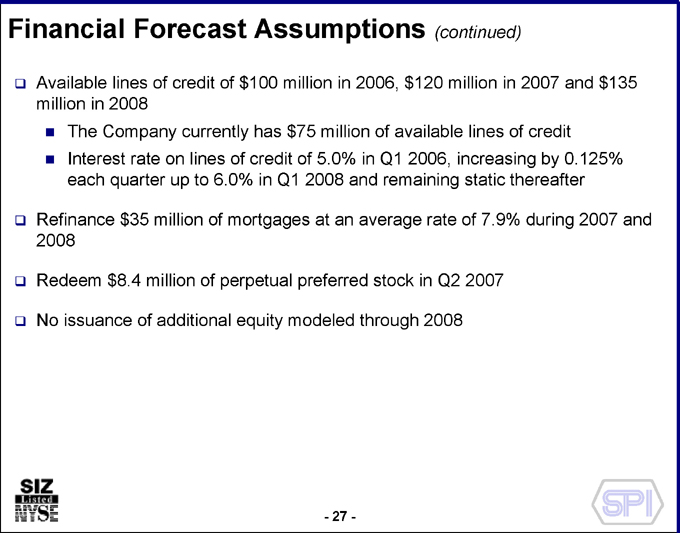
Available lines of credit of $100 million in 2006, $120 million in 2007 and $135 million in 2008
The Company currently has $75 million of available lines of credit
Interest rate on lines of credit of 5.0% in Q1 2006, increasing by 0.125% each quarter up to 6.0% in Q1 2008 and remaining static thereafter
Refinance $35 million of mortgages at an average rate of 7.9% during 2007 and 2008
Redeem $8.4 million of perpetual preferred stock in Q2 2007
No issuance of additional equity modeled through 2008
- 27 -
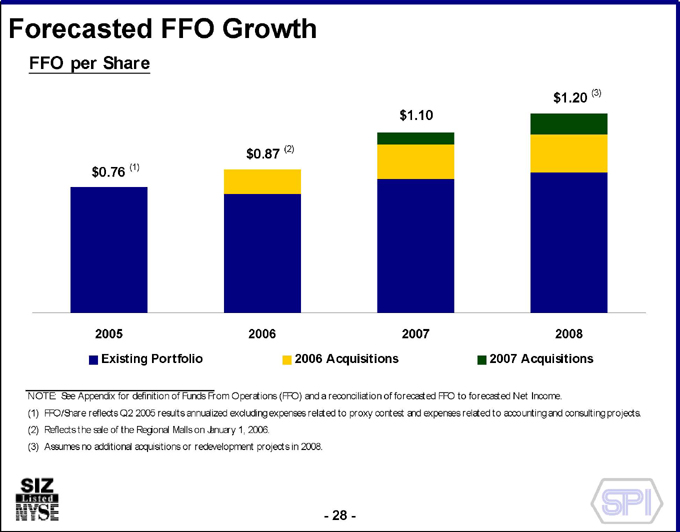
Forecasted FFO Growth
FFO per Share $0.76 (1)
2005 $0.87 (2)
2006 $1.10
2007 $1.20 (3)
2008
Existing Portfolio
2006 Acquisitions
2007 Acquisitions
NOTE: See Appendix for definition of Funds From Operations (FFO) and a reconciliation of forecasted FFO to forecasted Net Income.
(1) FFO/Share reflects Q2 2005 results annualized excluding expenses related to proxy contest and expenses related to accounting and consulting projects..
(2) Reflects the sale of the Regional Malls on January 1, 2006.
(3) Assumes no additional acquisitions or redevelopment projects in 2008.
- 28 -
Summary Highlights
Balance sheet offers financial flexibility for growth Forecasted double digit FFO growth over the next 3 years Re-focus property portfolio $200-$250 million of potential acquisitions Successful implementation of strategic plan to date Strengthened Board and enhanced corporate governance Highly experienced management team
- 29 -

Appendix
- 30 -

Funds From Operations
We define Funds from Operations (FFO) as net income, computed in accordance with GAAP, excluding: gains or losses from sales of property; those items defined as extraordinary under GAAP; plus depreciation on real estate assets and after similar adjustments for unconsolidated partnerships (and joint ventures). Adjustments for unconsolidated partnerships and joint ventures are calculated to reflect funds from operations on the same basis.
FFO is a key operating measure used by our management in evaluating current operating performance as well as trends in operating performance. Management also uses FFO to compare the Company’s operating performance with other equity REITs, particularly those who own retail and apartment properties. We also consider FFO, as well as other criteria, in evaluating and granting incentive compensation to our management. We believe that FFO is helpful to investors as a measure of the performance of an equity REIT.
In computing FFO, we exclude the effect of depreciation, amortization and gains and losses from sales of real estate. In our view, these excluded amounts, which are derived from historical cost, are of limited relevance in evaluating current performance. Our experience, and the experience of other owners of shopping centers and apartment communities, is that depreciation and amortization have no correlation with changes in the value of the properties. Real estate assets can also appreciate, rather than depreciate in value over time. Management believes that FFO, by excluding such items (which can vary among owners of similar assets in similar condition based on historical cost accounting and useful life estimates) can help compare the operating performance of a company’s real estate between periods or as compared to different companies. We believe that use of FFO may also facilitate comparisons of operating performance between operating periods and among us and other equity REITs. Our FFO may not be comparable to FFO reported by other REITs. These other REITs may not define the term in a comparable manner or may use different interpretations in the calculation. Investors should review FFO, along with GAAP net income and other appropriate operating measures and cash flows from operating activities, investing activities and financing activities when trying to understand an equity REIT’s operating performance. FFO is not a GAAP measure or a disclosure required by the Securities and Exchange Commission.
- 31 -
Funds From Operations (continued)
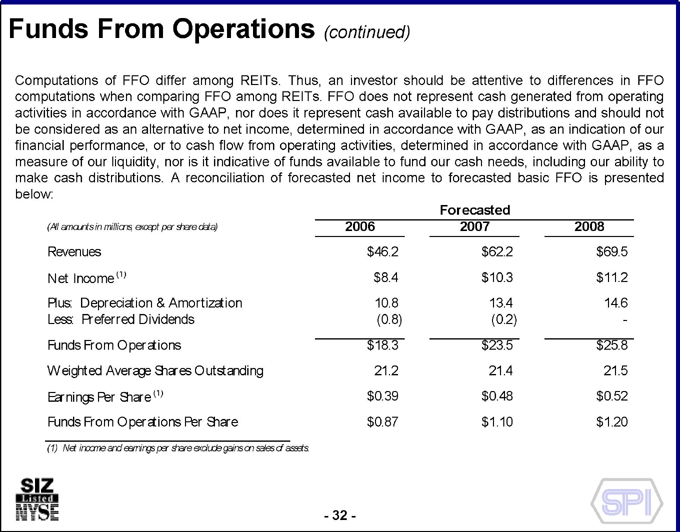
Computations of FFO differ among REITs. Thus, an investor should be attentive to differences in FFO computations when comparing FFO among REITs. FFO does not represent cash generated from operating activities in accordance with GAAP, nor does it represent cash available to pay distributions and should not be considered as an alternative to net income, determined in accordance with GAAP, as an indication of our financial performance, or to cash flow from operating activities, determined in accordance with GAAP, as a measure of our liquidity, nor is it indicative of funds available to fund our cash needs, including our ability to make cash distributions. A reconciliation of forecasted net income to forecasted basic FFO is presented below:
Forecasted
(All amounts in millions, except per share data) 2006 2007 2008
Revenues $46.2 $62.2 $69.5
Net Income (1) $8.4 $10.3 $11.2
Plus: Depreciation & Amortization 10.8 13.4 14.6
Less: Preferred Dividends (0.8) (0.2) -
Funds From Operations $18.3 $23.5 $25.8
Weighted Average Shares Outstanding 21.2 21.4 21.5
Earnings per Share (1) $0.39 $0.48 $0.52
Funds From Operations Per Share $0.87 $1.10 $1.20
(1) Net income excludes gains on sales of assets.
- 32 -

Proxy Solicitation
Because Sizeler is currently in a proxy contest, it is required to make the following disclosures to its shareholders:
SIZELER PROPERTY INVESTORS, INC. AND ITS DIRECTORS, INCLUDING THOSE DIRECTORS WHO ARE ALSO EXECUTIVE OFFICERS, MAY BE DEEMED TO BE PARTICIPANTS IN THE SOLICITATION OF PROXIES FOR THE 2005 ANNUAL MEETING OF SHAREHOLDERS TO BE HELD ON OCTOBER 27, 2005. A LISTING OF THE SIZELER DIRECTORS AND CERTAIN OTHER INFORMATION REGARDING THEIR DIRECT AND INDIRECT INTERESTS IN THE SOLICITATION IS INCLUDED IN EXHIBIT A TO THE COMPANY’S PRELIMINARY PROXY STATEMENT ON SCHEDULE 14A FILED ON AUGUST 22, 2005.
SIZELER WILL ALSO BE FILING A DEFINITIVE PROXY STATEMENT, FORM OF PROXY SOLICITED BY SIZELER’S BOARD OF DIRECTORS AND OTHER RELEVANT DOCUMENTS WITH THE SECURITIES AND EXCHANGE COMMISSION IN CONNECTION WITH ITS 2005 ANNUAL MEETING. SHAREHOLDERS OF SIZELER ARE ADVISED TO READ, WHEN AVAILABLE, SIZELER’S DEFINITIVE PROXY STATEMENT AND ANY OTHER RELEVANT DOCUMENTS FILED BY SIZELER WITH THE SECURITIES AND EXCHANGE COMMISSION IN CONNECTION WITH SIZELER’S SOLICITATION OF PROXIES FOR THE 2005 ANNUAL MEETING TO BE HELD ON OCTOBER 27, 2005 BECAUSE THESE DOCUMENTS WILL CONTAIN IMPORTANT INFORMATION. SHAREHOLDERS OF SIZELER AND OTHER INTERESTED PARTIES MAY OBTAIN FREE OF CHARGE, WHEN AVAILABLE, COPIES OF THE DEFINITIVE PROXY STATEMENT AND ANY OTHER DOCUMENTS FILED BY SIZELER WITH THE SECURITIES AND EXCHANGE COMMISSION (INCLUDING THE PRELIMINARY PROXY STATEMENT ON SCHEDULE 14A FILED ON AUGUST 22, 2005), AT THE SEC’S INTERNET WEBSITE HTTP://WWW.SEC.GOV AND ALSO ON SIZELER’S INTERNET WEBSITE HTTP://WWW.SIZELER.NET. THE PRELIMINARY PROXY STATEMENT ON SCHEDULE 14A FILED ON AUGUST 22, 2005, AND, WHEN AVAILABLE, THE DEFINITIVE PROXY STATEMENT AND FORM OF PROXY SOLICITED BY SIZELER’S BOARD OF DIRECTORS FOR THE 2005 ANNUAL MEETING TO BE HELD ON OCTOBER 27, 2005 ALSO MAY BE OBTAINED FREE OF CHARGE BY CONTACTING MORROW & CO., INC., WHICH IS ASSISTING SIZELER IN THE SOLICITATION OF PROXIES, AT (800) 654-2468 OR (212) 754-8000 (COLLECT).
- 33 -