UNITED STATES
SECURITIES AND EXCHANGE COMMISSION
Washington, D.C. 20549
FORM N-CSR
CERTIFIED SHAREHOLDER REPORT OF REGISTERED
MANAGEMENT INVESTMENT COMPANIES
Investment Company Act file number 811-04894
Franklin Managed Trust
(Exact name of registrant as specified in charter)
One Franklin Parkway, San Mateo, CA 94403-1906
(Address of principal executive offices)(Zip code)
Alison Baur, One Franklin Parkway, San Mateo, CA 94403-1906
(Name and address of agent for service)
Registrant’s telephone number, including area code: 650 312-2000
Date of fiscal year end: 9/30
Date of reporting period: 9/30/24
Item 1. Reports to Stockholders.
| a.) | The following is a copy of the report transmitted to shareholders pursuant to Rule 30e-1 under the Investment Company Act of 1940, as amended (the “1940 Act”) (17 CFR 270.30e-1).
|
| b.) | Include a copy of each notice transmitted to stockholders in reliance on Rule 30e-3 under the Act (17 CFR 270.30e-3) that contains disclosures specified by paragraph (c)(3) of that rule. |
Not Applicable.
| | |
Franklin Rising Dividends Fund | |
| Class A [FRDPX] |
| Annual Shareholder Report | September 30, 2024 |
|
This annual shareholder report contains important information about Franklin Rising Dividends Fund for the period October 1, 2023, to September 30, 2024.
You can find additional information about the Fund at https://www.franklintempleton.com/regulatory-fund-documents. You can also request this information by contacting us at (800) DIAL BEN/342-5236.
This report describes changes to the Fund that occurred during the reporting period.
WHAT WERE THE FUND COSTS FOR THE LAST YEAR? (based on a hypothetical $10,000 investment)
| | |
Class Name | Costs of a $10,000 investment | Costs paid as a percentage of a $10,000 investment* |
| Class A | $92 | 0.82% |
| * | Reflects fee waivers and/or expense reimbursements, without which expenses would have been higher. |
HOW DID THE FUND PERFORM LAST YEAR AND WHAT AFFECTED ITS PERFORMANCE?
For the twelve months ended September 30, 2024, Class A shares of Franklin Rising Dividends Fund returned 24.27%. The Fund compares its performance to the S&P 500 Index, which returned 36.35% for the same period.
| |
Top contributors to performance: |
| ↑ | Cintas, a uniform rental/sales and business services provider, was the strongest contributor to relative returns. The company reported better-than-expected top and bottom-line earnings and raised future guidance, with a strong margin expansion, and a four-for-one stock split by period-end. |
| ↑ | Shares of RTX, an aerospace and defense manufacturer, advanced sharply driven by robust sales growth and improving profitability across all three of its segments. Shares rallied In July amid RTX’s report of a significant backlog and unprecedented demand across its portfolio. |
| ↑ | Shares of Carlisle Companies, an engineered products manufacturer, benefited from earnings that consistently exceeded investors’ expectations. Increasing demand for the company’s roofing products, improvements in operational efficiencies and growing synergies linked to recent acquisitions were key drivers of earnings growth. |
| |
Top detractors from performance: |
| ↓ | Key driver of relative underperformance was lack of exposure to several technology-related stocks that sharply advanced due to optimism around artificial intelligence (AI), especially chipmaker NVIDIA. The stock, a top performer due to its surging growth and AI exposure, does not meet the portfolio’s dividend growth criteria. |
| ↓ | West Pharmaceutical Services, a drug packaging and delivery company, among Fund holdings, was the largest detractor. The company’s profitability was negatively impacted by declining sales across multiple divisions, due to continued high levels of customer destocking. |
| ↓ | Shares of Becton, Dickinson & Co., medical device and product company, declined sharply early in the period amid concerns about weakness in the Chinese market, labor- and inflation-related issues and disappointing guidance. |
| ↓ | Overweight to Roper Technologies, a diversified software company, detracted on a relative basis, although its shares posted a double-digit advance during the period. The stock was pressured by disappointing guidance and concerns surrounding weak demand from the company’s large customer base in application software. |
| Franklin Rising Dividends Fund | PAGE 1 | 158-ATSR-1124 |
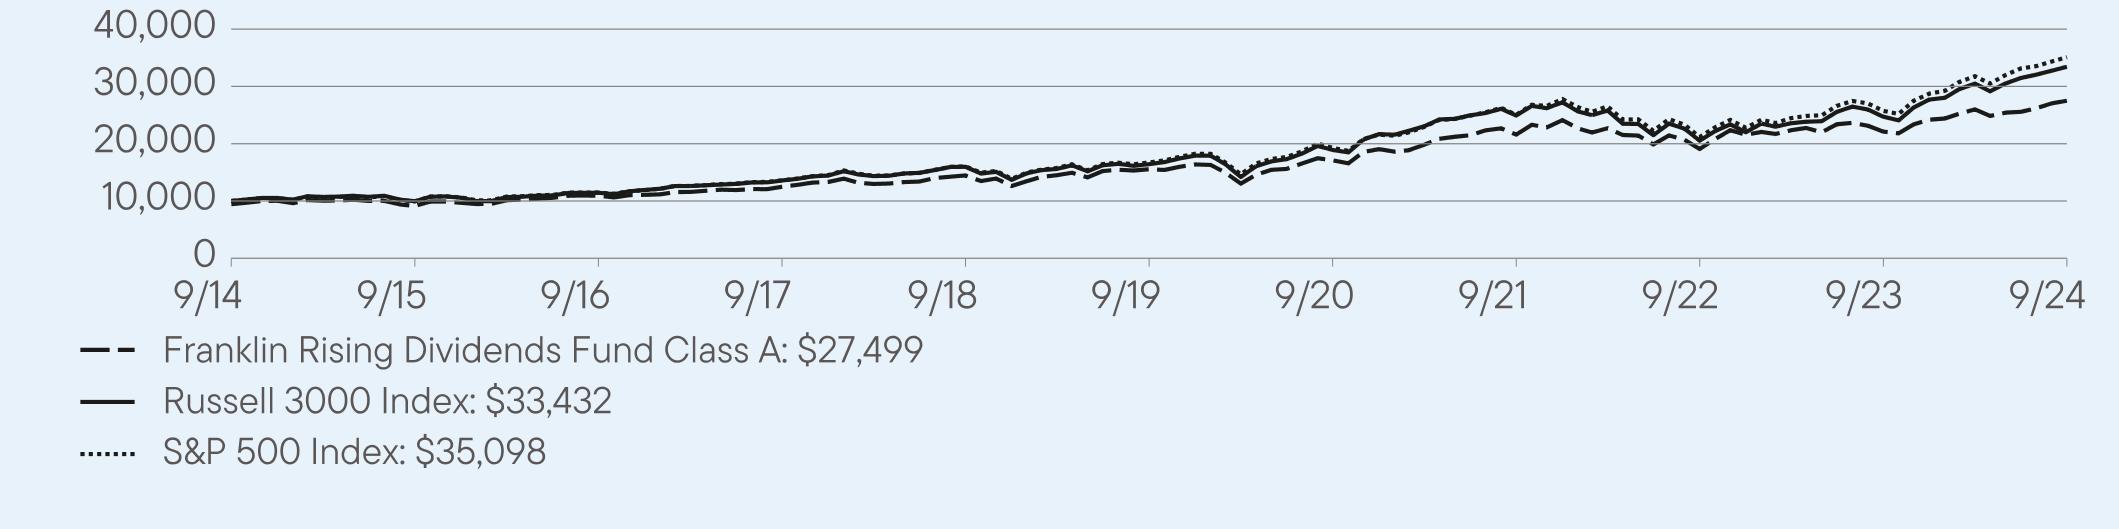
HOW DID THE FUND PERFORM OVER THE LAST 10 YEARS?
The Fund’s past performance is not necessarily an indication of how the Fund will perform in the future. The graph and table do not reflect the deduction of taxes that a shareholder would pay on Fund distributions or redemption of Fund shares.
VALUE OF A $10,000 INVESTMENT ($9,450 AFTER MAXIMUM APPLICABLE SALES CHARGE) –
Class A 9/30/2014 — 9/30/2024
AVERAGE ANNUAL TOTAL RETURNS (%) Period Ended September 30, 2024
| | | |
| | 1 Year | 5 Year | 10 Year |
Class A | 24.27 | 12.09 | 11.27 |
Class A (with sales charge) | 17.43 | 10.82 | 10.65 |
Russell 3000 Index | 35.19 | 15.26 | 12.83 |
S&P 500 Index | 36.35 | 15.97 | 13.38 |
Fund performance figures may reflect fee waivers and/or expense reimbursements, without which the performance would have been lower.
Performance for periods prior to September 10, 2018, has been restated to reflect the current maximum sales charge, which is lower than the maximum sales charge prior to that date.
For current month-end performance, please call Franklin Templeton at (800) DIAL BEN/342-5236 or visit https://www.franklintempleton.com/investments/options/mutual-funds.
Important data provider notices and terms available at www.franklintempletondatasources.com.
KEY FUND STATISTICS (as of September 30, 2024)
| |
Total Net Assets | $28,879,258,828 |
Total Number of Portfolio Holdings* | 56 |
Total Management Fee Paid | $130,397,169 |
Portfolio Turnover Rate | 12.32% |
| * | Does not include derivatives, except purchased options, if any. |
| Franklin Rising Dividends Fund | PAGE 2 | 158-ATSR-1124 |
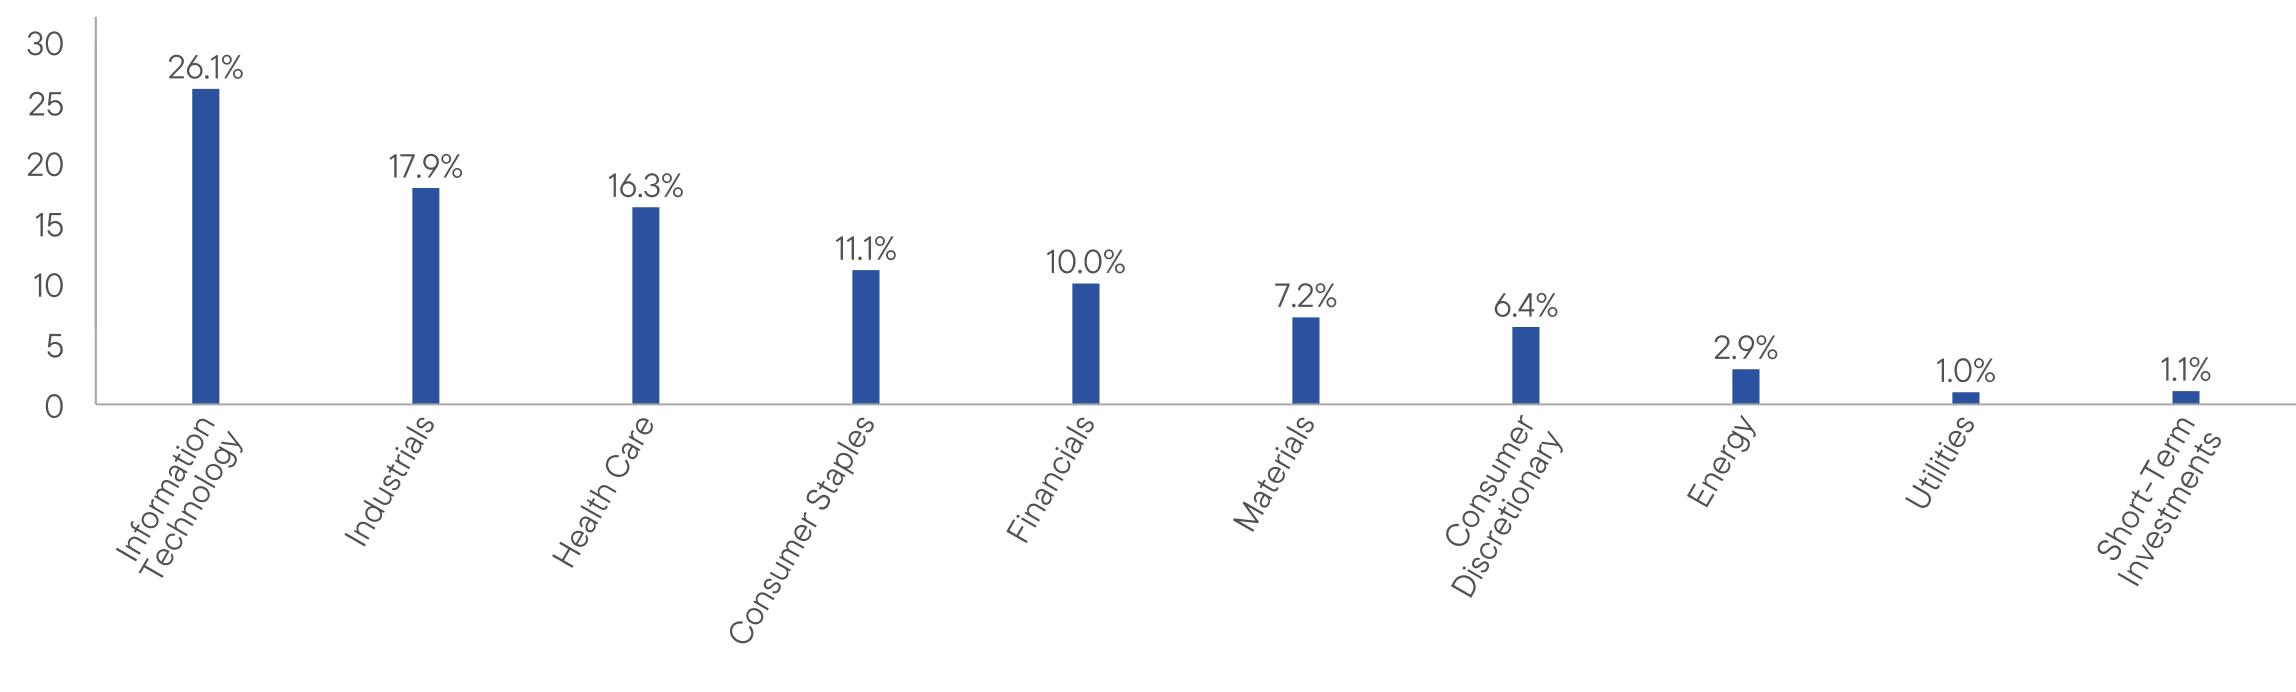
WHAT DID THE FUND INVEST IN? (as of September 30, 2024)
Portfolio Composition* (% of Total Investments)
| * | Does not include derivatives, except purchased options, if any. |
HOW HAS THE FUND CHANGED?
Effective September 30, 2024, Nicholas P. B. Getaz stepped down as a portfolio manager of the Fund.
This is a summary of a change to the Fund since October 1, 2023. For more complete information, you may review the Fund’s current prospectus and any applicable supplements and the Fund’s next prospectus, which we expect to be available by February 1, 2025
at https://www.franklintempleton.com/regulatory-fund-documents or upon request at (800) DIAL BEN/342-5236 or
prospectus@franklintempleton.com.
| |
| WHERE CAN I FIND ADDITIONAL INFORMATION ABOUT THE FUND? |
Additional information is available on https://www.franklintempleton.com/regulatory-fund-documents, including its: |
| • prospectus • proxy voting information • financial information • holdings • tax information |
HOUSEHOLDING
You will receive the Fund’s shareholder reports every six months. In addition, you will receive an annual updated summary prospectus (detail prospectus available upon request). To reduce Fund expenses, we try to identify related shareholders in a household and send only one copy of the shareholder reports and summary prospectus. This process, called “householding,” will continue indefinitely unless you instruct us otherwise. If you prefer not to have these documents householded, please call us at (800) DIAL BEN/342-5236. At any time, you may view current prospectuses/summary prospectuses and shareholder reports on our website. If you choose, you may receive these documents through electronic delivery.
| Franklin Rising Dividends Fund | PAGE 3 | 158-ATSR-1124 |
9450913310915124831445115542170922158819077221282749910000995011439135791596716433188982492120528247293343210000993911472136071604416727192602504021165257413509826.117.916.311.110.07.26.42.91.01.1
| | |
Franklin Rising Dividends Fund | |
| Class C [FRDTX] |
| Annual Shareholder Report | September 30, 2024 |
|
This annual shareholder report contains important information about Franklin Rising Dividends Fund for the period October 1, 2023, to September 30, 2024.
You can find additional information about the Fund at https://www.franklintempleton.com/regulatory-fund-documents. You can also request this information by contacting us at (800) DIAL BEN/342-5236.
This report describes changes to the Fund that occurred during the reporting period.
WHAT WERE THE FUND COSTS FOR THE LAST YEAR? (based on a hypothetical $10,000 investment)
| | |
Class Name | Costs of a $10,000 investment | Costs paid as a percentage of a $10,000 investment* |
| Class C | $175 | 1.57% |
| * | Reflects fee waivers and/or expense reimbursements, without which expenses would have been higher. |
HOW DID THE FUND PERFORM LAST YEAR AND WHAT AFFECTED ITS PERFORMANCE?
For the twelve months ended September 30, 2024, Class C shares of Franklin Rising Dividends Fund returned 23.33%. The Fund compares its performance to the S&P 500 Index, which returned 36.35% for the same period.
| |
Top contributors to performance: |
| ↑ | Cintas, a uniform rental/sales and business services provider, was the strongest contributor to relative returns. The company reported better-than-expected top and bottom-line earnings and raised future guidance, with a strong margin expansion, and a four-for-one stock split by period-end. |
| ↑ | Shares of RTX, an aerospace and defense manufacturer, advanced sharply driven by robust sales growth and improving profitability across all three of its segments. Shares rallied In July amid RTX’s report of a significant backlog and unprecedented demand across its portfolio. |
| ↑ | Shares of Carlisle Companies, an engineered products manufacturer, benefited from earnings that consistently exceeded investors’ expectations. Increasing demand for the company’s roofing products, improvements in operational efficiencies and growing synergies linked to recent acquisitions were key drivers of earnings growth. |
| |
Top detractors from performance: |
| ↓ | Key driver of relative underperformance was lack of exposure to several technology-related stocks that sharply advanced due to optimism around artificial intelligence (AI), especially chipmaker NVIDIA. The stock, a top performer due to its surging growth and AI exposure, does not meet the portfolio’s dividend growth criteria. |
| ↓ | West Pharmaceutical Services, a drug packaging and delivery company, among Fund holdings, was the largest detractor. The company’s profitability was negatively impacted by declining sales across multiple divisions, due to continued high levels of customer destocking. |
| ↓ | Shares of Becton, Dickinson & Co., medical device and product company, declined sharply early in the period amid concerns about weakness in the Chinese market, labor- and inflation-related issues and disappointing guidance. |
| ↓ | Overweight to Roper Technologies, a diversified software company, detracted on a relative basis, although its shares posted a double-digit advance during the period. The stock was pressured by disappointing guidance and concerns surrounding weak demand from the company’s large customer base in application software. |
| Franklin Rising Dividends Fund | PAGE 1 | 258-ATSR-1124 |
HOW DID THE FUND PERFORM OVER THE LAST 10 YEARS?
The Fund’s past performance is not necessarily an indication of how the Fund will perform in the future. The graph and table do not reflect the deduction of taxes that a shareholder would pay on Fund distributions or redemption of Fund shares.
VALUE OF A $10,000 INVESTMENT – Class C 9/30/2014 — 9/30/2024
AVERAGE ANNUAL TOTAL RETURNS (%) Period Ended September 30, 2024
| | | |
| | 1 Year | 5 Year | 10 Year |
Class C | 23.33 | 11.25 | 10.44 |
Class C (with sales charge) | 22.33 | 11.25 | 10.44 |
Russell 3000 Index | 35.19 | 15.26 | 12.83 |
S&P 500 Index | 36.35 | 15.97 | 13.38 |
Fund performance figures may reflect fee waivers and/or expense reimbursements, without which the performance would have been lower.
For current month-end performance, please call Franklin Templeton at (800) DIAL BEN/342-5236 or visit https://www.franklintempleton.com/investments/options/mutual-funds.
Important data provider notices and terms available at www.franklintempletondatasources.com.
KEY FUND STATISTICS (as of September 30, 2024)
| |
Total Net Assets | $28,879,258,828 |
Total Number of Portfolio Holdings* | 56 |
Total Management Fee Paid | $130,397,169 |
Portfolio Turnover Rate | 12.32% |
| * | Does not include derivatives, except purchased options, if any. |
| Franklin Rising Dividends Fund | PAGE 2 | 258-ATSR-1124 |
WHAT DID THE FUND INVEST IN? (as of September 30, 2024)
Portfolio Composition* (% of Total Investments)
| * | Does not include derivatives, except purchased options, if any. |
HOW HAS THE FUND CHANGED?
Effective September 30, 2024, Nicholas P. B. Getaz stepped down as a portfolio manager of the Fund.
This is a summary of a change to the Fund since October 1, 2023. For more complete information, you may review the Fund’s current prospectus and any applicable supplements and the Fund’s next prospectus, which we expect to be available by February 1, 2025
at https://www.franklintempleton.com/regulatory-fund-documents or upon request at (800) DIAL BEN/342-5236 or
prospectus@franklintempleton.com.
| |
| WHERE CAN I FIND ADDITIONAL INFORMATION ABOUT THE FUND? |
Additional information is available on https://www.franklintempleton.com/regulatory-fund-documents, including its: |
| • prospectus • proxy voting information • financial information • holdings • tax information |
HOUSEHOLDING
You will receive the Fund’s shareholder reports every six months. In addition, you will receive an annual updated summary prospectus (detail prospectus available upon request). To reduce Fund expenses, we try to identify related shareholders in a household and send only one copy of the shareholder reports and summary prospectus. This process, called “householding,” will continue indefinitely unless you instruct us otherwise. If you prefer not to have these documents householded, please call us at (800) DIAL BEN/342-5236. At any time, you may view current prospectuses/summary prospectuses and shareholder reports on our website. If you choose, you may receive these documents through electronic delivery.
| Franklin Rising Dividends Fund | PAGE 3 | 258-ATSR-1124 |
10000959311380129151484215843172902167719009218882699510000995011439135791596716433188982492120528247293343210000993911472136071604416727192602504021165257413509826.117.916.311.110.07.26.42.91.01.1
| | |
Franklin Rising Dividends Fund | |
| Class R [FRDRX] |
| Annual Shareholder Report | September 30, 2024 |
|
This annual shareholder report contains important information about Franklin Rising Dividends Fund for the period October 1, 2023, to September 30, 2024.
You can find additional information about the Fund at https://www.franklintempleton.com/regulatory-fund-documents. You can also request this information by contacting us at (800) DIAL BEN/342-5236.
This report describes changes to the Fund that occurred during the reporting period.
WHAT WERE THE FUND COSTS FOR THE LAST YEAR? (based on a hypothetical $10,000 investment)
| | |
Class Name | Costs of a $10,000 investment | Costs paid as a percentage of a $10,000 investment* |
| Class R | $120 | 1.07% |
| * | Reflects fee waivers and/or expense reimbursements, without which expenses would have been higher. |
HOW DID THE FUND PERFORM LAST YEAR AND WHAT AFFECTED ITS PERFORMANCE?
For the twelve months ended September 30, 2024, Class R shares of Franklin Rising Dividends Fund returned 23.95%. The Fund compares its performance to the S&P 500 Index, which returned 36.35% for the same period.
| |
Top contributors to performance: |
| ↑ | Cintas, a uniform rental/sales and business services provider, was the strongest contributor to relative returns. The company reported better-than-expected top and bottom-line earnings and raised future guidance, with a strong margin expansion, and a four-for-one stock split by period-end. |
| ↑ | Shares of RTX, an aerospace and defense manufacturer, advanced sharply driven by robust sales growth and improving profitability across all three of its segments. Shares rallied In July amid RTX’s report of a significant backlog and unprecedented demand across its portfolio. |
| ↑ | Shares of Carlisle Companies, an engineered products manufacturer, benefited from earnings that consistently exceeded investors’ expectations. Increasing demand for the company’s roofing products, improvements in operational efficiencies and growing synergies linked to recent acquisitions were key drivers of earnings growth. |
| |
Top detractors from performance: |
| ↓ | Key driver of relative underperformance was lack of exposure to several technology-related stocks that sharply advanced due to optimism around artificial intelligence (AI), especially chipmaker NVIDIA. The stock, a top performer due to its surging growth and AI exposure, does not meet the portfolio’s dividend growth criteria. |
| ↓ | West Pharmaceutical Services, a drug packaging and delivery company, among Fund holdings, was the largest detractor. The company’s profitability was negatively impacted by declining sales across multiple divisions, due to continued high levels of customer destocking. |
| ↓ | Shares of Becton, Dickinson & Co., medical device and product company, declined sharply early in the period amid concerns about weakness in the Chinese market, labor- and inflation-related issues and disappointing guidance. |
| ↓ | Overweight to Roper Technologies, a diversified software company, detracted on a relative basis, although its shares posted a double-digit advance during the period. The stock was pressured by disappointing guidance and concerns surrounding weak demand from the company’s large customer base in application software. |
| Franklin Rising Dividends Fund | PAGE 1 | 858-ATSR-1124 |
HOW DID THE FUND PERFORM OVER THE LAST 10 YEARS?
The Fund’s past performance is not necessarily an indication of how the Fund will perform in the future. The graph and table do not reflect the deduction of taxes that a shareholder would pay on Fund distributions or redemption of Fund shares.
VALUE OF A $10,000 INVESTMENT – Class R 9/30/2014 — 9/30/2024
AVERAGE ANNUAL TOTAL RETURNS (%) Period Ended September 30, 2024
| | | |
| | 1 Year | 5 Year | 10 Year |
Class R | 23.95 | 11.80 | 10.99 |
Russell 3000 Index | 35.19 | 15.26 | 12.83 |
S&P 500 Index | 36.35 | 15.97 | 13.38 |
Fund performance figures may reflect fee waivers and/or expense reimbursements, without which the performance would have been lower.
For current month-end performance, please call Franklin Templeton at (800) DIAL BEN/342-5236 or visit https://www.franklintempleton.com/investments/options/mutual-funds.
Important data provider notices and terms available at www.franklintempletondatasources.com.
KEY FUND STATISTICS (as of September 30, 2024)
| |
Total Net Assets | $28,879,258,828 |
Total Number of Portfolio Holdings* | 56 |
Total Management Fee Paid | $130,397,169 |
Portfolio Turnover Rate | 12.32% |
| * | Does not include derivatives, except purchased options, if any. |
WHAT DID THE FUND INVEST IN? (as of September 30, 2024)
Portfolio Composition* (% of Total Investments)
| * | Does not include derivatives, except purchased options, if any. |
| Franklin Rising Dividends Fund | PAGE 2 | 858-ATSR-1124 |
HOW HAS THE FUND CHANGED?
Effective September 30, 2024, Nicholas P. B. Getaz stepped down as a portfolio manager of the Fund.
This is a summary of a change to the Fund since October 1, 2023. For more complete information, you may review the Fund’s current prospectus and any applicable supplements and the Fund’s next prospectus, which we expect to be available by February 1, 2025
at https://www.franklintempleton.com/regulatory-fund-documents or upon request at (800) DIAL BEN/342-5236 or
prospectus@franklintempleton.com.
| |
| WHERE CAN I FIND ADDITIONAL INFORMATION ABOUT THE FUND? |
Additional information is available on https://www.franklintempleton.com/regulatory-fund-documents, including its: |
| • prospectus • proxy voting information • financial information • holdings • tax information |
HOUSEHOLDING
You will receive the Fund’s shareholder reports every six months. In addition, you will receive an annual updated summary prospectus (detail prospectus available upon request). To reduce Fund expenses, we try to identify related shareholders in a household and send only one copy of the shareholder reports and summary prospectus. This process, called “householding,” will continue indefinitely unless you instruct us otherwise. If you prefer not to have these documents householded, please call us at (800) DIAL BEN/342-5236. At any time, you may view current prospectuses/summary prospectuses and shareholder reports on our website. If you choose, you may receive these documents through electronic delivery.
| Franklin Rising Dividends Fund | PAGE 3 | 858-ATSR-1124 |
10000964211493131111514316246178182245019786228952837910000995011439135791596716433188982492120528247293343210000993911472136071604416727192602504021165257413509826.117.916.311.110.07.26.42.91.01.1
| | |
Franklin Rising Dividends Fund | |
| Class R6 [FRISX] |
| Annual Shareholder Report | September 30, 2024 |
|
This annual shareholder report contains important information about Franklin Rising Dividends Fund for the period October 1, 2023, to September 30, 2024.
You can find additional information about the Fund at https://www.franklintempleton.com/regulatory-fund-documents. You can also request this information by contacting us at (800) DIAL BEN/342-5236.
This report describes changes to the Fund that occurred during the reporting period.
WHAT WERE THE FUND COSTS FOR THE LAST YEAR? (based on a hypothetical $10,000 investment)
| | |
Class Name | Costs of a $10,000 investment | Costs paid as a percentage of a $10,000 investment* |
| Class R6 | $57 | 0.51% |
| * | Reflects fee waivers and/or expense reimbursements, without which expenses would have been higher. |
HOW DID THE FUND PERFORM LAST YEAR AND WHAT AFFECTED ITS PERFORMANCE?
For the twelve months ended September 30, 2024, Class R6 shares of Franklin Rising Dividends Fund returned 24.66%. The Fund compares its performance to the S&P 500 Index, which returned 36.35% for the same period.
| |
Top contributors to performance: |
| ↑ | Cintas, a uniform rental/sales and business services provider, was the strongest contributor to relative returns. The company reported better-than-expected top and bottom-line earnings and raised future guidance, with a strong margin expansion, and a four-for-one stock split by period-end. |
| ↑ | Shares of RTX, an aerospace and defense manufacturer, advanced sharply driven by robust sales growth and improving profitability across all three of its segments. Shares rallied In July amid RTX’s report of a significant backlog and unprecedented demand across its portfolio. |
| ↑ | Shares of Carlisle Companies, an engineered products manufacturer, benefited from earnings that consistently exceeded investors’ expectations. Increasing demand for the company’s roofing products, improvements in operational efficiencies and growing synergies linked to recent acquisitions were key drivers of earnings growth. |
| |
Top detractors from performance: |
| ↓ | Key driver of relative underperformance was lack of exposure to several technology-related stocks that sharply advanced due to optimism around artificial intelligence (AI), especially chipmaker NVIDIA. The stock, a top performer due to its surging growth and AI exposure, does not meet the portfolio’s dividend growth criteria. |
| ↓ | West Pharmaceutical Services, a drug packaging and delivery company, among Fund holdings, was the largest detractor. The company’s profitability was negatively impacted by declining sales across multiple divisions, due to continued high levels of customer destocking. |
| ↓ | Shares of Becton, Dickinson & Co., medical device and product company, declined sharply early in the period amid concerns about weakness in the Chinese market, labor- and inflation-related issues and disappointing guidance. |
| ↓ | Overweight to Roper Technologies, a diversified software company, detracted on a relative basis, although its shares posted a double-digit advance during the period. The stock was pressured by disappointing guidance and concerns surrounding weak demand from the company’s large customer base in application software. |
| Franklin Rising Dividends Fund | PAGE 1 | 348-ATSR-1124 |
HOW DID THE FUND PERFORM OVER THE LAST 10 YEARS?
The Fund’s past performance is not necessarily an indication of how the Fund will perform in the future. The graph and table do not reflect the deduction of taxes that a shareholder would pay on Fund distributions or redemption of Fund shares.
VALUE OF A $10,000 INVESTMENT – Class R6 9/30/2014 — 9/30/2024
AVERAGE ANNUAL TOTAL RETURNS (%) Period Ended September 30, 2024
| | | |
| | 1 Year | 5 Year | 10 Year |
Class R6 | 24.66 | 12.45 | 11.66 |
Russell 3000 Index | 35.19 | 15.26 | 12.83 |
S&P 500 Index | 36.35 | 15.97 | 13.38 |
Fund performance figures may reflect fee waivers and/or expense reimbursements, without which the performance would have been lower.
For current month-end performance, please call Franklin Templeton at (800) DIAL BEN/342-5236 or visit https://www.franklintempleton.com/investments/options/mutual-funds.
Important data provider notices and terms available at www.franklintempletondatasources.com.
KEY FUND STATISTICS (as of September 30, 2024)
| |
Total Net Assets | $28,879,258,828 |
Total Number of Portfolio Holdings* | 56 |
Total Management Fee Paid | $130,397,169 |
Portfolio Turnover Rate | 12.32% |
| * | Does not include derivatives, except purchased options, if any. |
WHAT DID THE FUND INVEST IN? (as of September 30, 2024)
Portfolio Composition* (% of Total Investments)
| * | Does not include derivatives, except purchased options, if any. |
| Franklin Rising Dividends Fund | PAGE 2 | 348-ATSR-1124 |
HOW HAS THE FUND CHANGED?
Effective September 30, 2024, Nicholas P. B. Getaz stepped down as a portfolio manager of the Fund.
This is a summary of a change to the Fund since October 1, 2023. For more complete information, you may review the Fund’s current prospectus and any applicable supplements and the Fund’s next prospectus, which we expect to be available by February 1, 2025
at https://www.franklintempleton.com/regulatory-fund-documents or upon request at (800) DIAL BEN/342-5236 or
prospectus@franklintempleton.com.
| |
| WHERE CAN I FIND ADDITIONAL INFORMATION ABOUT THE FUND? |
Additional information is available on https://www.franklintempleton.com/regulatory-fund-documents, including its: |
| • prospectus • proxy voting information • financial information • holdings • tax information |
HOUSEHOLDING
You will receive the Fund’s shareholder reports every six months. In addition, you will receive an annual updated summary prospectus (detail prospectus available upon request). To reduce Fund expenses, we try to identify related shareholders in a household and send only one copy of the shareholder reports and summary prospectus. This process, called “householding,” will continue indefinitely unless you instruct us otherwise. If you prefer not to have these documents householded, please call us at (800) DIAL BEN/342-5236. At any time, you may view current prospectuses/summary prospectuses and shareholder reports on our website. If you choose, you may receive these documents through electronic delivery.
| Franklin Rising Dividends Fund | PAGE 3 | 348-ATSR-1124 |
10000970711645133691553316761184932343520774241733013410000995011439135791596716433188982492120528247293343210000993911472136071604416727192602504021165257413509826.117.916.311.110.07.26.42.91.01.1
| | |
Franklin Rising Dividends Fund | |
| Advisor Class [FRDAX] |
| Annual Shareholder Report | September 30, 2024 |
|
This annual shareholder report contains important information about Franklin Rising Dividends Fund for the period October 1, 2023, to September 30, 2024.
You can find additional information about the Fund at https://www.franklintempleton.com/regulatory-fund-documents. You can also request this information by contacting us at (800) DIAL BEN/342-5236.
This report describes changes to the Fund that occurred during the reporting period.
WHAT WERE THE FUND COSTS FOR THE LAST YEAR? (based on a hypothetical $10,000 investment)
| | |
Class Name | Costs of a $10,000 investment | Costs paid as a percentage of a $10,000 investment* |
| Advisor Class | $64 | 0.57% |
| * | Reflects fee waivers and/or expense reimbursements, without which expenses would have been higher. |
HOW DID THE FUND PERFORM LAST YEAR AND WHAT AFFECTED ITS PERFORMANCE?
For the twelve months ended September 30, 2024, Advisor Class shares of Franklin Rising Dividends Fund returned 24.58%. The Fund compares its performance to the S&P 500 Index, which returned 36.35% for the same period.
| |
Top contributors to performance: |
| ↑ | Cintas, a uniform rental/sales and business services provider, was the strongest contributor to relative returns. The company reported better-than-expected top and bottom-line earnings and raised future guidance, with a strong margin expansion, and a four-for-one stock split by period-end. |
| ↑ | Shares of RTX, an aerospace and defense manufacturer, advanced sharply driven by robust sales growth and improving profitability across all three of its segments. Shares rallied In July amid RTX’s report of a significant backlog and unprecedented demand across its portfolio. |
| ↑ | Shares of Carlisle Companies, an engineered products manufacturer, benefited from earnings that consistently exceeded investors’ expectations. Increasing demand for the company’s roofing products, improvements in operational efficiencies and growing synergies linked to recent acquisitions were key drivers of earnings growth. |
| |
Top detractors from performance: |
| ↓ | Key driver of relative underperformance was lack of exposure to several technology-related stocks that sharply advanced due to optimism around artificial intelligence (AI), especially chipmaker NVIDIA. The stock, a top performer due to its surging growth and AI exposure, does not meet the portfolio’s dividend growth criteria. |
| ↓ | West Pharmaceutical Services, a drug packaging and delivery company, among Fund holdings, was the largest detractor. The company’s profitability was negatively impacted by declining sales across multiple divisions, due to continued high levels of customer destocking. |
| ↓ | Shares of Becton, Dickinson & Co., medical device and product company, declined sharply early in the period amid concerns about weakness in the Chinese market, labor- and inflation-related issues and disappointing guidance. |
| ↓ | Overweight to Roper Technologies, a diversified software company, detracted on a relative basis, although its shares posted a double-digit advance during the period. The stock was pressured by disappointing guidance and concerns surrounding weak demand from the company’s large customer base in application software. |
| Franklin Rising Dividends Fund | PAGE 1 | 658-ATSR-1124 |
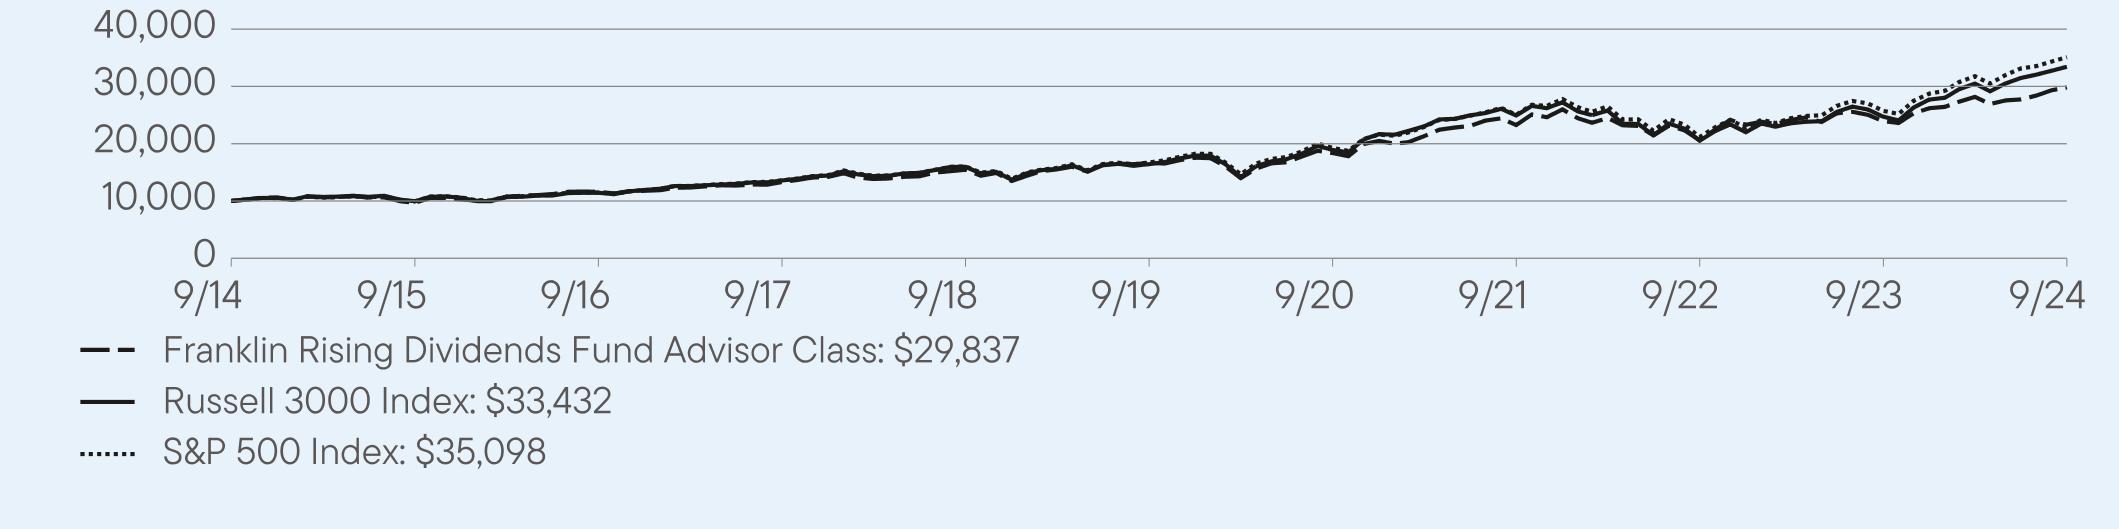
HOW DID THE FUND PERFORM OVER THE LAST 10 YEARS?
The Fund’s past performance is not necessarily an indication of how the Fund will perform in the future. The graph and table do not reflect the deduction of taxes that a shareholder would pay on Fund distributions or redemption of Fund shares.
VALUE OF A $10,000 INVESTMENT – Advisor Class 9/30/2014 — 9/30/2024
AVERAGE ANNUAL TOTAL RETURNS (%) Period Ended September 30, 2024
| | | |
| | 1 Year | 5 Year | 10 Year |
Advisor Class | 24.58 | 12.37 | 11.55 |
Russell 3000 Index | 35.19 | 15.26 | 12.83 |
S&P 500 Index | 36.35 | 15.97 | 13.38 |
Fund performance figures may reflect fee waivers and/or expense reimbursements, without which the performance would have been lower.
For current month-end performance, please call Franklin Templeton at (800) DIAL BEN/342-5236 or visit https://www.franklintempleton.com/investments/options/mutual-funds.
Important data provider notices and terms available at www.franklintempletondatasources.com.
KEY FUND STATISTICS (as of September 30, 2024)
| |
Total Net Assets | $28,879,258,828 |
Total Number of Portfolio Holdings* | 56 |
Total Management Fee Paid | $130,397,169 |
Portfolio Turnover Rate | 12.32% |
| * | Does not include derivatives, except purchased options, if any. |
WHAT DID THE FUND INVEST IN? (as of September 30, 2024)
Portfolio Composition* (% of Total Investments)
| * | Does not include derivatives, except purchased options, if any. |
| Franklin Rising Dividends Fund | PAGE 2 | 658-ATSR-1124 |
HOW HAS THE FUND CHANGED?
Effective September 30, 2024, Nicholas P. B. Getaz stepped down as a portfolio manager of the Fund.
This is a summary of a change to the Fund since October 1, 2023. For more complete information, you may review the Fund’s current prospectus and any applicable supplements and the Fund’s next prospectus, which we expect to be available by February 1, 2025
at https://www.franklintempleton.com/regulatory-fund-documents or upon request at (800) DIAL BEN/342-5236 or
prospectus@franklintempleton.com.
| |
| WHERE CAN I FIND ADDITIONAL INFORMATION ABOUT THE FUND? |
Additional information is available on https://www.franklintempleton.com/regulatory-fund-documents, including its: |
| • prospectus • proxy voting information • financial information • holdings • tax information |
HOUSEHOLDING
You will receive the Fund’s shareholder reports every six months. In addition, you will receive an annual updated summary prospectus (detail prospectus available upon request). To reduce Fund expenses, we try to identify related shareholders in a household and send only one copy of the shareholder reports and summary prospectus. This process, called “householding,” will continue indefinitely unless you instruct us otherwise. If you prefer not to have these documents householded, please call us at (800) DIAL BEN/342-5236. At any time, you may view current prospectuses/summary prospectuses and shareholder reports on our website. If you choose, you may receive these documents through electronic delivery.
| Franklin Rising Dividends Fund | PAGE 3 | 658-ATSR-1124 |
10000968911608133091544816656183632325120598239512983710000995011439135791596716433188982492120528247293343210000993911472136071604416727192602504021165257413509826.117.916.311.110.07.26.42.91.01.1
Item 2. Code of Ethics.
(a) The Registrant has adopted a code of ethics that applies to its principal executive officers and principal financial and accounting officer.
(c) N/A
(d) N/A
(f) Pursuant to Item 19(a)(1), the Registrant is attaching as an exhibit a copy of its code of ethics that applies to its principal executive officers and principal financial and accounting officer.
Item 3. Audit Committee Financial Expert.
(a) (1) The Registrant has an audit committee financial expert serving on its audit committee.
(2) The audit committee financial expert is Mary C. Choksi and she is "independent" as defined under the relevant Securities and Exchange Commission Rules and Releases.
Item 4. Principal Accountant Fees and Services.
(a) Audit Fees
The aggregate fees paid to the principal accountant for professional services rendered by the principal accountant for the audit of the registrant’s annual financial statements or for services that are normally provided by the principal accountant in connection with statutory and regulatory filings or engagements were $90,206 for the fiscal year ended September 30, 2024 and $89,414 for the fiscal year ended September 30, 2023.
(b) Audit-Related Fees
The aggregate fees paid to the principal accountant for assurance and related services rendered by the principal accountant to the registrant that are reasonably related to the performance of the audit of the registrant’s financial statements and are not reported under paragraph (a) of Item 4 were $3,000 for the fiscal year ended September 30, 2024 and $3,000 for the fiscal year ended September 30, 2023. The services for which these fees were paid included attestation services.
There were no fees paid to the principal accountant for assurance and related services rendered by the principal accountant to the registrant’s investment adviser and any entity controlling, controlled by or under common control with the investment adviser that provides ongoing services to the registrant that are reasonably related to the performance of the audit of their financial statements.
(c) Tax Fees
The aggregate fees paid to the principal accountant for professional services rendered by the principal accountant to the registrant for tax compliance, tax advice and tax planning were $0 for the fiscal year ended September 30, 2024 and $5,000 for the fiscal year ended September 30, 2023. The services for which these fees were paid included fees for tax compliance matters.
The aggregate fees paid to the principal accountant for professional services rendered by the principal accountant to the registrant’s investment adviser and any entity controlling, controlled by or under common control with the investment adviser that provides ongoing services to the registrant for tax compliance, tax advice and tax planning were $70,000 for the fiscal year ended September 30, 2024 and $140,000 for the fiscal year ended September 30, 2023. The services for which these fees were paid included global access to tax platform International Tax View.
(d) All Other Fees
The aggregate fees paid to the principal accountant for products and services rendered by the principal accountant to the registrant not reported in paragraphs (a)-(c) of Item 4 were $0 for the fiscal year ended September 30, 2024 and $12,594 for the fiscal year ended September 30, 2023. The services for which these fees were paid included review of materials provided to the fund Board in connection with the investment management contract renewal process.
The aggregate fees paid to the principal accountant for products and services rendered by the principal accountant to the registrant’s investment adviser and any entity controlling, controlled by or under common control with the investment adviser that provides ongoing services to the registrant not reported in paragraphs (a)-(c) of Item 4 were $163,638 for the fiscal year ended September 30, 2024 and $75,699 for the fiscal year ended September 30, 2023. The services for which these fees were paid included professional fees in connection with SOC 1 Reports, professional services relating to the readiness assessment over Greenhouse Gas Emissions and Energy, fees in connection with a license for accounting and business knowledge platform Viewpoint and professional fees relating to security counts.
(e) (1) The registrant’s audit committee is directly responsible for approving the services to be provided by the auditors, including:
(i) pre-approval of all audit and audit related services;
(ii) pre-approval of all non-audit related services to be provided to the Fund by the auditors;
(iii) pre-approval of all non-audit related services to be provided to the registrant by the auditors to the registrant’s investment adviser or to any entity that controls, is controlled by or is under common control with the registrant’s investment adviser and that provides ongoing services to the registrant where the non-audit services relate directly to the operations or financial reporting of the registrant; and
(iv) establishment by the audit committee, if deemed necessary or appropriate, as an alternative to committee pre-approval of services to be provided by the auditors, as required by paragraphs (ii) and (iii) above, of policies and procedures to permit such services to be pre-approved by other means, such as through establishment of guidelines or by action of a designated member or members of the committee; provided the policies and procedures are detailed as to the particular service and the committee is informed of each service and such policies and procedures do not include delegation of audit committee responsibilities, as contemplated under the Securities Exchange Act of 1934, to management; subject, in the case of (ii) through (iv), to any waivers, exceptions or exemptions that may be available under applicable law or rules.
(e) (2) None of the services provided to the registrant described in paragraphs (b)-(d) of Item 4 were approved by the audit committee pursuant to paragraph (c)(7)(i)(C) of Rule 2-01 of regulation S-X.
(f) No disclosures are required by this Item 4(f).
(g) The aggregate non-audit fees paid to the principal accountant for services rendered by the principal accountant to the registrant and the registrant’s investment adviser and any entity controlling, controlled by or under common control with the investment adviser that provides ongoing services to the registrant were $236,638 for the fiscal year ended September 30, 2024 and $236,293 for the fiscal year ended September 30, 2023.
(h) The registrant’s audit committee of the board has considered whether the provision of non-audit services that were rendered to the registrant’s investment adviser (not including any sub-adviser whose role is primarily portfolio management and is subcontracted with or overseen by another investment adviser), and any entity controlling, controlled by, or under common control with the investment adviser that provides ongoing services to the registrant that were not pre-approved pursuant to paragraph (c)(7)(ii) of Rule 2-01 of Regulation S-X is compatible with maintaining the principal accountant’s independence.
(i) N/A
(j) N/A
Item 5. Audit Committee of Listed Registrants. N/A
Item 6. Schedule of Investments.
(a) Please see schedule of investments contained in the Financial Statements and Financial Highlights included under Item 7 of this Form N-CSR.
(b) N/A
Item 7. Financial Statements and Financial Highlights for Open-End Management Investment Companies.
Franklin
Rising
Dividends
Fund
Financial
Statements
and
Other
Important
Information
Annual
|
September
30,
2024
Financial
Statements
and
Other
Important
Information—Annual
Financial
Highlights
and
Schedule
of
Investments
2
Financial
Statements
10
Notes
to
Financial
Statements
14
Report
of
Independent
Registered
Public
Accounting
Firm
21
Tax
Information
22
Changes
In
and
Disagreements
with
Accountants
23
Results
of
Meeting(s)
of
Shareholders
23
Remuneration
Paid
to
Directors,
Officers
and
Others
23
Board
Approval
of
Management
and
Subadvisory
Agreements
23
Financial
Highlights
Franklin
Rising
Dividends
Fund
Annual
Report
The
accompanying
notes
are
an
integral
part
of
these
financial
statements.
a
Year
Ended
September
30,
2024
2023
2022
2021
2020
Class
A
Per
share
operating
performance
(for
a
share
outstanding
throughout
the
year)
Net
asset
value,
beginning
of
year
...................
$84.29
$76.32
$90.55
$72.25
$67.81
Income
from
investment
operations
a
:
Net
investment
income
b
.........................
0.90
0.94
0.76
0.63
0.69
Net
realized
and
unrealized
gains
(losses)
...........
18.92
11.20
(10.61)
18.30
5.84
Total
from
investment
operations
....................
19.82
12.14
(9.85)
18.93
6.53
Less
distributions
from:
Net
investment
income
..........................
(0.84)
(0.83)
(0.64)
(0.63)
(0.71)
Net
realized
gains
.............................
(3.19)
(3.34)
(3.74)
—
(1.38)
Total
distributions
...............................
(4.03)
(4.17)
(4.38)
(0.63)
(2.09)
Net
asset
value,
end
of
year
.......................
$100.08
$84.29
$76.32
$90.55
$72.25
Total
return
c
...................................
24.27%
15.99%
(11.63)%
26.31%
9.97%
Ratios
to
average
net
assets
Expenses
before
waiver
and
payments
by
affiliates
......
0.83%
0.84%
0.84%
0.85%
0.86%
Expenses
net
of
waiver
and
payments
by
affiliates
.......
0.82%
0.83%
d
0.84%
d,e
0.85%
d,e
0.86%
d,e
Net
investment
income
...........................
0.98%
1.11%
0.86%
0.74%
1.02%
Supplemental
data
Net
assets,
end
of
year
(000’s)
.....................
$19,760,586
$17,081,636
$15,339,642
$17,819,162
$14,152,903
Portfolio
turnover
rate
............................
12.32%
1.88%
3.02%
f
5.04%
9.11%
a
The
amount
shown
for
a
share
outstanding
throughout
the
period
may
not
correlate
with
the
Statement
of
Operations
for
the
period
due
to
the
timing
of
sales
and
repurchases
of
the
Fund’s
shares
in
relation
to
income
earned
and/or
fluctuating
fair
value
of
the
investments
of
the
Fund.
b
Based
on
average
daily
shares
outstanding.
c
Total
return
does
not
reflect
sales
commissions
or
contingent
deferred
sales
charges,
if
applicable.
d
Benefit
of
expense
reduction
rounds
to
less
than
0.01%.
e
Benefit
of
waiver
and
payments
by
affiliates
rounds
to
less
than
0.01%.
f
Excludes
the
value
of
portfolio
activity
as
a
result
of
in-kind
transactions.
Franklin
Managed
Trust
Financial
Highlights
Franklin
Rising
Dividends
Fund
(continued)
The
accompanying
notes
are
an
integral
part
of
these
financial
statements.
Annual
Report
a
Year
Ended
September
30,
2024
2023
2022
2021
2020
Class
C
Per
share
operating
performance
(for
a
share
outstanding
throughout
the
year)
Net
asset
value,
beginning
of
year
...................
$82.31
$74.58
$88.67
$70.77
$66.43
Income
from
investment
operations
a
:
Net
investment
income
(loss)
b
....................
0.21
0.29
0.09
(—)
c
0.18
Net
realized
and
unrealized
gains
(losses)
...........
18.49
10.97
(10.38)
17.95
5.75
Total
from
investment
operations
....................
18.70
11.26
(10.29)
17.95
5.93
Less
distributions
from:
Net
investment
income
..........................
(0.14)
(0.19)
(0.06)
(0.05)
(0.21)
Net
realized
gains
.............................
(3.19)
(3.34)
(3.74)
—
(1.38)
Total
distributions
...............................
(3.33)
(3.53)
(3.80)
(0.05)
(1.59)
Net
asset
value,
end
of
year
.......................
$97.68
$82.31
$74.58
$88.67
$70.77
Total
return
d
...................................
23.33%
15.15%
(12.31)%
25.37%
9.13%
Ratios
to
average
net
assets
Expenses
before
waiver
and
payments
by
affiliates
......
1.58%
1.59%
1.59%
1.60%
1.61%
Expenses
net
of
waiver
and
payments
by
affiliates
.......
1.57%
1.58%
e
1.59%
e,f
1.60%
e,f
1.61%
e,f
Net
investment
income
(loss)
......................
0.24%
0.35%
0.10%
(—)%
g
0.28%
Supplemental
data
Net
assets,
end
of
year
(000’s)
.....................
$900,965
$925,650
$1,101,919
$1,572,738
$1,963,672
Portfolio
turnover
rate
............................
12.32%
1.88%
3.02%
h
5.04%
9.11%
a
The
amount
shown
for
a
share
outstanding
throughout
the
period
may
not
correlate
with
the
Statement
of
Operations
for
the
period
due
to
the
timing
of
sales
and
repurchases
of
the
Fund’s
shares
in
relation
to
income
earned
and/or
fluctuating
fair
value
of
the
investments
of
the
Fund.
b
Based
on
average
daily
shares
outstanding.
c
Amount
rounds
to
less
than
$0.01
per
share.
d
Total
return
does
not
reflect
sales
commissions
or
contingent
deferred
sales
charges,
if
applicable.
e
Benefit
of
expense
reduction
rounds
to
less
than
0.01%.
f
Benefit
of
waiver
and
payments
by
affiliates
rounds
to
less
than
0.01%.
g
Rounds
to
less
than
0.01%.
h
Excludes
the
value
of
portfolio
activity
as
a
result
of
in-kind
transactions.
Franklin
Managed
Trust
Financial
Highlights
Franklin
Rising
Dividends
Fund
(continued)
Annual
Report
The
accompanying
notes
are
an
integral
part
of
these
financial
statements.
a
Year
Ended
September
30,
2024
2023
2022
2021
2020
Class
R
Per
share
operating
performance
(for
a
share
outstanding
throughout
the
year)
Net
asset
value,
beginning
of
year
...................
$83.95
$76.02
$90.21
$71.98
$67.56
Income
from
investment
operations
a
:
Net
investment
income
b
.........................
0.67
0.73
0.54
0.42
0.52
Net
realized
and
unrealized
gains
(losses)
...........
18.85
11.16
(10.59)
18.24
5.82
Total
from
investment
operations
....................
19.52
11.89
(10.05)
18.66
6.34
Less
distributions
from:
Net
investment
income
..........................
(0.62)
(0.62)
(0.40)
(0.43)
(0.54)
Net
realized
gains
.............................
(3.19)
(3.34)
(3.74)
—
(1.38)
Total
distributions
...............................
(3.81)
(3.96)
(4.14)
(0.43)
(1.92)
Net
asset
value,
end
of
year
.......................
$99.66
$83.95
$76.02
$90.21
$71.98
Total
return
....................................
23.95%
15.72%
(11.87)%
26.00%
9.67%
Ratios
to
average
net
assets
Expenses
before
waiver
and
payments
by
affiliates
......
1.08%
1.09%
1.09%
1.10%
1.11%
Expenses
net
of
waiver
and
payments
by
affiliates
.......
1.07%
1.08%
c
1.09%
c,d
1.10%
c,d
1.11%
c,d
Net
investment
income
...........................
0.73%
0.85%
0.61%
0.49%
0.78%
Supplemental
data
Net
assets,
end
of
year
(000’s)
.....................
$189,852
$168,492
$159,396
$192,325
$176,413
Portfolio
turnover
rate
............................
12.32%
1.88%
3.02%
e
5.04%
9.11%
a
The
amount
shown
for
a
share
outstanding
throughout
the
period
may
not
correlate
with
the
Statement
of
Operations
for
the
period
due
to
the
timing
of
sales
and
repurchases
of
the
Fund’s
shares
in
relation
to
income
earned
and/or
fluctuating
fair
value
of
the
investments
of
the
Fund.
b
Based
on
average
daily
shares
outstanding.
c
Benefit
of
expense
reduction
rounds
to
less
than
0.01%.
d
Benefit
of
waiver
and
payments
by
affiliates
rounds
to
less
than
0.01%.
e
Excludes
the
value
of
portfolio
activity
as
a
result
of
in-kind
transactions.
Franklin
Managed
Trust
Financial
Highlights
Franklin
Rising
Dividends
Fund
(continued)
The
accompanying
notes
are
an
integral
part
of
these
financial
statements.
Annual
Report
a
Year
Ended
September
30,
2024
2023
2022
2021
2020
Class
R6
Per
share
operating
performance
(for
a
share
outstanding
throughout
the
year)
Net
asset
value,
beginning
of
year
...................
$84.22
$76.27
$90.51
$72.21
$67.79
Income
from
investment
operations
a
:
Net
investment
income
b
.........................
1.19
1.21
1.05
0.90
0.90
Net
realized
and
unrealized
gains
(losses)
...........
18.90
11.18
(10.62)
18.29
5.83
Total
from
investment
operations
....................
20.09
12.39
(9.57)
19.19
6.73
Less
distributions
from:
Net
investment
income
..........................
(1.13)
(1.10)
(0.93)
(0.89)
(0.93)
Net
realized
gains
.............................
(3.19)
(3.34)
(3.74)
—
(1.38)
Total
distributions
...............................
(4.32)
(4.44)
(4.67)
(0.89)
(2.31)
Net
asset
value,
end
of
year
.......................
$99.99
$84.22
$76.27
$90.51
$72.21
Total
return
....................................
24.66%
16.36%
(11.35)%
26.72%
10.33%
Ratios
to
average
net
assets
Expenses
before
waiver
and
payments
by
affiliates
......
0.52%
0.52%
0.52%
0.53%
0.53%
Expenses
net
of
waiver
and
payments
by
affiliates
.......
0.51%
0.51%
c
0.52%
c,d
0.53%
c,d
0.53%
c,d
Net
investment
income
...........................
1.30%
1.42%
1.19%
1.06%
1.35%
Supplemental
data
Net
assets,
end
of
year
(000’s)
.....................
$3,551,789
$2,923,672
$2,331,423
$2,510,987
$2,187,987
Portfolio
turnover
rate
............................
12.32%
1.88%
3.02%
e
5.04%
9.11%
a
The
amount
shown
for
a
share
outstanding
throughout
the
period
may
not
correlate
with
the
Statement
of
Operations
for
the
period
due
to
the
timing
of
sales
and
repurchases
of
the
Fund’s
shares
in
relation
to
income
earned
and/or
fluctuating
fair
value
of
the
investments
of
the
Fund.
b
Based
on
average
daily
shares
outstanding.
c
Benefit
of
expense
reduction
rounds
to
less
than
0.01%.
d
Benefit
of
waiver
and
payments
by
affiliates
rounds
to
less
than
0.01%.
e
Excludes
the
value
of
portfolio
activity
as
a
result
of
in-kind
transactions.
Franklin
Managed
Trust
Financial
Highlights
Franklin
Rising
Dividends
Fund
(continued)
Annual
Report
The
accompanying
notes
are
an
integral
part
of
these
financial
statements.
a
Year
Ended
September
30,
2024
2023
2022
2021
2020
Advisor
Class
Per
share
operating
performance
(for
a
share
outstanding
throughout
the
year)
Net
asset
value,
beginning
of
year
...................
$84.23
$76.27
$90.50
$72.21
$67.78
Income
from
investment
operations
a
:
Net
investment
income
b
.........................
1.13
1.15
0.98
0.84
0.85
Net
realized
and
unrealized
gains
(losses)
...........
18.90
11.19
(10.61)
18.28
5.84
Total
from
investment
operations
....................
20.03
12.34
(9.63)
19.12
6.69
Less
distributions
from:
Net
investment
income
..........................
(1.07)
(1.04)
(0.86)
(0.83)
(0.88)
Net
realized
gains
.............................
(3.19)
(3.34)
(3.74)
—
(1.38)
Total
distributions
...............................
(4.26)
(4.38)
(4.60)
(0.83)
(2.26)
Net
asset
value,
end
of
year
.......................
$100.00
$84.23
$76.27
$90.50
$72.21
Total
return
....................................
24.58%
16.28%
(11.41)%
26.62%
10.25%
Ratios
to
average
net
assets
Expenses
before
waiver
and
payments
by
affiliates
......
0.58%
0.59%
0.59%
0.60%
0.61%
Expenses
net
of
waiver
and
payments
by
affiliates
.......
0.57%
0.58%
c
0.59%
c,d
0.60%
c,d
0.61%
c,d
Net
investment
income
...........................
1.23%
1.36%
1.11%
0.99%
1.28%
Supplemental
data
Net
assets,
end
of
year
(000’s)
.....................
$4,476,068
$3,878,570
$3,430,804
$4,295,258
$3,421,716
Portfolio
turnover
rate
............................
12.32%
1.88%
3.02%
e
5.04%
9.11%
a
The
amount
shown
for
a
share
outstanding
throughout
the
period
may
not
correlate
with
the
Statement
of
Operations
for
the
period
due
to
the
timing
of
sales
and
repurchases
of
the
Fund’s
shares
in
relation
to
income
earned
and/or
fluctuating
fair
value
of
the
investments
of
the
Fund.
b
Based
on
average
daily
shares
outstanding.
c
Benefit
of
expense
reduction
rounds
to
less
than
0.01%.
d
Benefit
of
waiver
and
payments
by
affiliates
rounds
to
less
than
0.01%.
e
Excludes
the
value
of
portfolio
activity
as
a
result
of
in-kind
transactions.
Schedule
of
Investments,
September
30,
2024
The
accompanying
notes
are
an
integral
part
of
these
financial
statements.
Annual
Report
a
a
Shares
a
Value
a
Common
Stocks
98.9%
Aerospace
&
Defense
3.5%
General
Dynamics
Corp.
..............................................
1,530,000
$
462,366,000
RTX
Corp.
........................................................
4,530,000
548,854,800
1,011,220,800
Air
Freight
&
Logistics
1.2%
United
Parcel
Service,
Inc.
,
B
..........................................
2,640,000
359,937,600
Banks
2.0%
JPMorgan
Chase
&
Co.
...............................................
2,785,000
587,245,100
Beverages
1.8%
PepsiCo,
Inc.
......................................................
3,100,000
527,155,000
Biotechnology
1.5%
AbbVie,
Inc.
.......................................................
2,135,000
421,619,800
Building
Products
3.3%
Carlisle
Cos.,
Inc.
...................................................
1,017,000
457,395,750
Johnson
Controls
International
plc
.......................................
6,320,000
490,495,200
947,890,950
Capital
Markets
4.1%
Charles
Schwab
Corp.
(The)
...........................................
4,660,000
302,014,600
Morgan
Stanley
.....................................................
3,160,000
329,398,400
Nasdaq,
Inc.
.......................................................
7,466,028
545,094,704
1,176,507,704
Chemicals
7.2%
Air
Products
and
Chemicals,
Inc.
........................................
1,285,000
382,595,900
Ecolab,
Inc.
........................................................
1,795,000
458,317,350
Linde
plc
..........................................................
2,065,000
984,715,900
Sherwin-Williams
Co.
(The)
............................................
641,874
244,984,049
2,070,613,199
Commercial
Services
&
Supplies
1.8%
Cintas
Corp.
.......................................................
2,590,000
533,229,200
Consumer
Staples
Distribution
&
Retail
3.8%
Casey's
General
Stores,
Inc.
...........................................
352,500
132,437,775
Target
Corp.
.......................................................
2,175,000
338,995,500
Walmart,
Inc.
......................................................
7,600,000
613,700,000
1,085,133,275
Electric
Utilities
1.0%
NextEra
Energy,
Inc.
.................................................
3,275,000
276,835,750
Electrical
Equipment
1.5%
nVent
Electric
plc
...................................................
6,170,000
433,504,200
Financial
Services
2.7%
Visa,
Inc.
,
A
........................................................
2,872,121
789,689,669
Food
Products
2.4%
McCormick
&
Co.,
Inc.
...............................................
3,315,000
272,824,500
Mondelez
International,
Inc.
,
A
..........................................
5,885,125
433,557,159
706,381,659
Ground
Transportation
0.8%
JB
Hunt
Transport
Services,
Inc.
........................................
1,290,000
222,305,700
Health
Care
Equipment
&
Supplies
7.5%
Abbott
Laboratories
..................................................
4,559,477
519,825,973
Franklin
Managed
Trust
Schedule
of
Investments
Annual
Report
The
accompanying
notes
are
an
integral
part
of
these
financial
statements.
a
a
Shares
a
Value
a
Common
Stocks
98.9%
(continued)
Health
Care
Equipment
&
Supplies
(continued)
Becton
Dickinson
&
Co.
...............................................
2,225,000
$
536,447,500
STERIS
plc
........................................................
735,000
178,266,900
Stryker
Corp.
......................................................
2,572,500
929,341,350
2,163,881,723
Health
Care
Providers
&
Services
3.2%
UnitedHealth
Group,
Inc.
..............................................
1,556,732
910,190,066
Hotels,
Restaurants
&
Leisure
2.0%
McDonald's
Corp.
...................................................
1,927,500
586,943,025
Household
Products
3.1%
Colgate-Palmolive
Co.
...............................................
2,970,000
308,315,700
Procter
&
Gamble
Co.
(The)
...........................................
3,365,000
582,818,000
891,133,700
Industrial
Conglomerates
1.9%
Honeywell
International,
Inc.
...........................................
2,700,000
558,117,000
Insurance
1.1%
Erie
Indemnity
Co.
,
A
.................................................
607,500
327,940,650
IT
Services
2.7%
Accenture
plc
,
A
....................................................
2,170,000
767,051,600
Life
Sciences
Tools
&
Services
2.6%
Danaher
Corp.
.....................................................
1,309,155
363,971,273
West
Pharmaceutical
Services,
Inc.
......................................
1,322,781
397,045,945
761,017,218
Machinery
2.0%
Donaldson
Co.,
Inc.
.................................................
2,464,317
181,620,163
Dover
Corp.
.......................................................
2,090,000
400,736,600
582,356,763
Oil,
Gas
&
Consumable
Fuels
2.9%
Chevron
Corp.
.....................................................
2,201,898
324,273,519
EOG
Resources,
Inc.
................................................
2,066,712
254,060,906
Exxon
Mobil
Corp.
...................................................
2,173,138
254,735,236
833,069,661
Pharmaceuticals
1.6%
Johnson
&
Johnson
.................................................
2,845,857
461,199,585
Semiconductors
&
Semiconductor
Equipment
7.7%
Analog
Devices,
Inc.
.................................................
3,280,400
755,049,668
Broadcom,
Inc.
.....................................................
4,075,000
702,937,500
Texas
Instruments,
Inc.
...............................................
3,750,000
774,637,500
2,232,624,668
Software
13.5%
Microsoft
Corp.
.....................................................
5,735,000
2,467,770,500
Oracle
Corp.
.......................................................
2,190,000
373,176,000
Roper
Technologies,
Inc.
..............................................
1,885,000
1,048,889,400
3,889,835,900
Specialty
Retail
3.7%
Lowe's
Cos.,
Inc.
....................................................
2,035,000
551,179,750
Ross
Stores,
Inc.
...................................................
3,365,000
506,466,150
1,057,645,900
Franklin
Managed
Trust
Schedule
of
Investments
The
accompanying
notes
are
an
integral
part
of
these
financial
statements.
Annual
Report
a
a
Shares
a
Value
a
Common
Stocks
98.9%
(continued)
Technology
Hardware,
Storage
&
Peripherals
2.3%
Apple,
Inc.
........................................................
2,870,000
$
668,710,000
Textiles,
Apparel
&
Luxury
Goods
0.7%
NIKE,
Inc.
,
B
.......................................................
2,435,000
215,254,000
Trading
Companies
&
Distributors
1.8%
WW
Grainger,
Inc.
...................................................
495,000
514,210,950
Total
Common
Stocks
(Cost
$
11,063,148,062
)
...................................
28,570,452,015
a
a
a
a
Short
Term
Investments
1.1%
a
Money
Market
Funds
1.1%
a,b
Institutional
Fiduciary
Trust
-
Money
Market
Portfolio
,
4.74
%
...................
312,631,626
312,631,626
Total
Money
Market
Funds
(Cost
$
312,631,626
)
.................................
312,631,626
Total
Short
Term
Investments
(Cost
$
312,631,626
)
...............................
312,631,626
a
Total
Investments
(Cost
$
11,375,779,688
)
100.0
%
................................
$28,883,083,641
Other
Assets,
less
Liabilities
(0.0)
%
†
...........................................
(3,824,813)
Net
Assets
100.0%
...........................................................
$28,879,258,828
†
Rounds
to
less
than
0.1%
of
net
assets.
a
See
Note
3(f)
regarding
investments
in
affiliated
management
investment
companies.
b
The
rate
shown
is
the
annualized
seven-day
effective
yield
at
period
end.
Franklin
Managed
Trust
Financial
Statements
Statement
of
Assets
and
Liabilities
September
30,
2024
Annual
Report
The
accompanying
notes
are
an
integral
part
of
these
financial
statements.
Franklin
Rising
Dividends
Fund
Assets:
Investments
in
securities:
Cost
-
Unaffiliated
issuers
...................................................................
$11,063,148,062
Cost
-
Non-controlled
affiliates
(Note
3
f
)
........................................................
312,631,626
Value
-
Unaffiliated
issuers
..................................................................
$28,570,452,015
Value
-
Non-controlled
affiliates
(Note
3
f
)
........................................................
312,631,626
Cash
....................................................................................
985,974
Receivables:
Investment
securities
sold
...................................................................
11,525,116
Capital
shares
sold
........................................................................
8,836,354
Dividends
...............................................................................
10,527,669
Total
assets
..........................................................................
28,914,958,754
Liabilities:
Payables:
Capital
shares
redeemed
...................................................................
14,307,168
Management
fees
.........................................................................
11,331,274
Distribution
fees
..........................................................................
4,801,963
Transfer
agent
fees
........................................................................
4,338,758
Trustees'
fees
and
expenses
.................................................................
24,045
Accrued
expenses
and
other
liabilities
...........................................................
896,718
Total
liabilities
.........................................................................
35,699,926
Net
assets,
at
value
.................................................................
$28,879,258,828
Net
assets
consist
of:
Paid-in
capital
.............................................................................
$9,367,772,414
Total
distributable
earnings
(losses)
.............................................................
19,511,486,414
Net
assets,
at
value
.................................................................
$28,879,258,828
Franklin
Managed
Trust
Financial
Statements
Statement
of
Assets
and
Liabilities
(continued)
September
30,
2024
The
accompanying
notes
are
an
integral
part
of
these
financial
statements.
Annual
Report
Franklin
Rising
Dividends
Fund
Class
A:
Net
assets,
at
value
.......................................................................
$19,760,585,723
Shares
outstanding
........................................................................
197,445,354
Net
asset
value
per
share
a
,b
..................................................................
$100.08
Maximum
offering
price
per
share
(net
asset
value
per
share
÷
94
.50
%
)
b
................................
$105.90
Class
C:
Net
assets,
at
value
.......................................................................
$900,965,181
Shares
outstanding
........................................................................
9,223,375
Net
asset
value
and
maximum
offering
price
per
share
a
,b
............................................
$97.68
Class
R:
Net
assets,
at
value
.......................................................................
$189,851,549
Shares
outstanding
........................................................................
1,905,009
Net
asset
value
and
maximum
offering
price
per
share
b
.............................................
$99.66
Class
R6:
Net
assets,
at
value
.......................................................................
$3,551,788,633
Shares
outstanding
........................................................................
35,520,383
Net
asset
value
and
maximum
offering
price
per
share
b
.............................................
$99.99
Advisor
Class:
Net
assets,
at
value
.......................................................................
$4,476,067,742
Shares
outstanding
........................................................................
44,760,084
Net
asset
value
and
maximum
offering
price
per
share
b
.............................................
$100.00
a
Redemption
price
is
equal
to
net
asset
value
less
contingent
deferred
sales
charges,
if
applicable.
b
Net
asset
value
per
share
may
not
recalculate
due
to
rounding.
Franklin
Managed
Trust
Financial
Statements
Statement
of
Operations
for
the
year
ended
September
30,
2024
Annual
Report
The
accompanying
notes
are
an
integral
part
of
these
financial
statements.
Franklin
Rising
Dividends
Fund
Investment
income:
Dividends:
(net
of
foreign
taxes
of
$832,272)
Unaffiliated
issuers
........................................................................
$457,700,649
Non-controlled
affiliates
(Note
3
f
)
.............................................................
31,465,148
Total
investment
income
...................................................................
489,165,797
Expenses:
Management
fees
(Note
3
a
)
...................................................................
132,602,191
Distribution
fees:
(Note
3c
)
Class
A
................................................................................
46,224,572
Class
C
................................................................................
9,202,860
Class
R
................................................................................
890,135
Transfer
agent
fees:
(Note
3e
)
Class
A
................................................................................
14,967,208
Class
C
................................................................................
744,619
Class
R
................................................................................
144,127
Class
R6
...............................................................................
528,582
Advisor
Class
............................................................................
3,414,835
Custodian
fees
............................................................................
153,822
Reports
to
shareholders
fees
..................................................................
988,988
Registration
and
filing
fees
....................................................................
388,380
Professional
fees
...........................................................................
126,473
Trustees'
fees
and
expenses
..................................................................
328,397
Other
....................................................................................
631,854
Total
expenses
.........................................................................
211,337,043
Expenses
waived/paid
by
affiliates
(Note
3
f
and
3
g
)
..............................................
(2,205,022)
Net
expenses
.........................................................................
209,132,021
Net
investment
income
................................................................
280,033,776
Realized
and
unrealized
gains
(losses):
Net
realized
gain
(loss)
from:
Investments:
Unaffiliated
issuers
......................................................................
2,134,493,076
Net
change
in
unrealized
appreciation
(depreciation)
on:
Investments:
Unaffiliated
issuers
......................................................................
3,454,935,395
Net
realized
and
unrealized
gain
(loss)
............................................................
5,589,428,471
Net
increase
(decrease)
in
net
assets
resulting
from
operations
..........................................
$5,869,462,247
Franklin
Managed
Trust
Financial
Statements
Statements
of
Changes
in
Net
Assets
The
accompanying
notes
are
an
integral
part
of
these
financial
statements.
Annual
Report
Franklin
Rising
Dividends
Fund
Year
Ended
September
30,
2024
Year
Ended
September
30,
2023
Increase
(decrease)
in
net
assets:
Operations:
Net
investment
income
.................................................
$280,033,776
$290,391,076
Net
realized
gain
(loss)
.................................................
2,134,493,076
941,362,608
Net
change
in
unrealized
appreciation
(depreciation)
...........................
3,454,935,395
2,349,565,860
Net
increase
(decrease)
in
net
assets
resulting
from
operations
................
5,869,462,247
3,581,319,544
Distributions
to
shareholders:
Class
A
.............................................................
(808,580,564)
(835,720,058)
Class
C
.............................................................
(35,395,857)
(49,374,445)
Class
R
.............................................................
(7,368,877)
(8,195,796)
Class
R6
............................................................
(150,994,973)
(139,145,312)
Advisor
Class
........................................................
(195,026,871)
(197,448,806)
Total
distributions
to
shareholders
..........................................
(1,197,367,142)
(1,229,884,417)
Capital
share
transactions:
(Note
2
)
Class
A
.............................................................
(512,779,624)
128,492,798
Class
C
.............................................................
(182,005,004)
(296,513,962)
Class
R
.............................................................
(9,326,006)
(7,873,271)
Class
R6
............................................................
64,029,364
349,236,590
Advisor
Class
........................................................
(130,774,839)
90,058,355
Total
capital
share
transactions
............................................
(770,856,109)
263,400,510
Net
increase
(decrease)
in
net
assets
...................................
3,901,238,996
2,614,835,637
Net
assets:
Beginning
of
year
.......................................................
24,978,019,832
22,363,184,195
End
of
year
...........................................................
$28,879,258,828
$24,978,019,832
Notes
to
Financial
Statements
Franklin
Rising
Dividends
Fund
1.
Organization
and
Significant
Accounting
Policies
Franklin
Managed
Trust (Trust)
is
registered
under
the
Investment
Company
Act
of
1940
(1940
Act)
as
an
open-end
management
investment
company,
consisting
of one fund,
Franklin
Rising
Dividends
Fund (Fund).
The Fund
follows
the
accounting
and
reporting
guidance
in
Financial
Accounting
Standards
Board
(FASB)
Accounting
Standards
Codification
Topic
946,
Financial
Services
–
Investment
Companies
(ASC
946)
and applies
the
specialized
accounting
and
reporting
guidance
in
U.S.
Generally
Accepted
Accounting
Principles
(U.S.
GAAP),
including,
but
not
limited
to,
ASC
946.
The
Fund
offers five
classes
of
shares:
Class
A,
Class
C,
Class
R,
Class
R6
and
Advisor
Class. Class
C
shares
automatically
convert
to
Class
A
shares
on
a
monthly
basis,
after
they
have
been
held
for
8
years.
Each
class
of
shares
may
differ
by
its
initial
sales
load,
contingent
deferred
sales
charges,
voting
rights
on
matters
affecting
a
single
class,
its
exchange
privilege
and
fees
due
to
differing
arrangements
for
distribution
and
transfer
agent
fees.
The
following
summarizes
the Fund's
significant
accounting
policies.
a.
Financial
Instrument
Valuation
The
Fund's
investments
in
financial
instruments
are
carried
at
fair
value
daily.
Fair
value
is
the
price
that
would
be
received
to
sell
an
asset
or
paid
to
transfer
a
liability
in
an
orderly
transaction
between
market
participants
on
the
measurement
date.
The
Fund
calculates
the
net
asset
value
(NAV)
per
share
each business
day as
of
4
p.m.
Eastern
time
or
the
regularly
scheduled
close
of
the
New
York
Stock
Exchange
(NYSE),
whichever
is
earlier.
Under
compliance
policies
and
procedures
approved
by
the Fund's
Board
of
Trustees
(the
Board),
the
Board
has
designated
the
Fund’s
investment
manager
as
the
valuation
designee
and
has
responsibility
for
oversight
of
valuation.
The
investment
manager
is
assisted
by
the
Fund’s
administrator
in
performing
this
responsibility,
including
leading
the
cross-
functional
Valuation
Committee
(VC).
The
Fund
may
utilize
independent
pricing
services,
quotations
from
securities
and
financial
instrument
dealers,
and
other
market
sources
to
determine
fair
value.
Equity
securities
listed
on
an
exchange
or
on
the
NASDAQ
National
Market
System
are
valued
at
the
last
quoted
sale
price
or
the
official
closing
price of
the
day,
respectively.
Foreign
equity
securities
are
valued
as
of
the
close
of
trading
on
the
foreign
stock
exchange
on
which
the
security
is
primarily
traded,
or
as
of
4
p.m.
Eastern
time.
The
value
is
then
converted
into
its
U.S.
dollar
equivalent
at
the
foreign
exchange
rate
in
effect
at
4
p.m.
Eastern
time
on
the
day
that
the
value
of
the
security
is
determined.
Over-the-counter
(OTC)
securities
are
valued
within
the
range
of
the
most
recent
quoted
bid
and
ask
prices.
Securities
that
trade
in
multiple
markets
or
on
multiple
exchanges
are
valued
according
to
the
broadest
and
most
representative
market.
Certain
equity
securities
are
valued
based
upon
fundamental
characteristics
or
relationships
to
similar
securities.
Investments
in open-end mutual
funds
are
valued
at
the
closing
NAV.
The
Fund
has
procedures
to
determine
the
fair
value
of
financial
instruments
for
which
market
prices
are
not
reliable
or
readily
available.
Under
these
procedures,
the Fund
primarily
employs
a
market-based
approach
which
may
use
related
or
comparable
assets
or
liabilities,
recent
transactions,
market
multiples,
and
other
relevant
information
for
the
investment
to
determine
the
fair
value
of
the
investment.
An
income-based
valuation
approach
may
also
be
used
in
which
the
anticipated
future
cash
flows
of
the
investment
are
discounted
to
calculate
fair
value.
Discounts
may
also
be
applied
due
to
the
nature
or
duration
of
any
restrictions
on
the
disposition
of
the
investments.
Due
to
the
inherent
uncertainty
of
valuations
of
such
investments,
the
fair
values
may
differ
significantly
from
the
values
that
would
have
been
used
had
an
active
market
existed.
Trading
in
securities
on
foreign
securities
stock
exchanges
and
OTC
markets
may
be
completed
before
4
p.m.
Eastern
time.
In
addition,
trading
in
certain
foreign
markets
may
not
take
place
on
every
Fund's
business
day. Events
can occur
between
the
time
at
which
trading
in
a
foreign
security
is
completed
and
4
p.m.
Eastern
time
that
might
call
into
question
the
reliability
of
the
value
of
a
portfolio
security
held
by
the
Fund.
As
a
result,
differences
may
arise
between
the
value
of
the
Fund's
portfolio
securities
as
determined
at
the
foreign
market
close
and
the
latest
indications
of
value
at
4
p.m.
Eastern
time. In
order
to
minimize
the
potential
for
these
differences,
an
independent
pricing
service
may
be
used
to
adjust
the
value
of
the
Fund's
portfolio
securities
to
the
latest
indications
of
fair
value
at
4
p.m.
Eastern
time.
When
the
last
day
of
the
reporting
period
is
a
non-business
day,
certain
foreign
markets
may
be
open
on
those
days
that
the
Fund's
NAV
is
not
calculated,
which
could
result
in
differences
between
the
value
of
the
Fund's
portfolio
securities
on
the
last
business
day
and
the
last
calendar
day
Franklin
Managed
Trust
Notes
to
Financial
Statements
Franklin
Rising
Dividends
Fund
(continued)
of
the
reporting
period.
Any
security
valuation
changes
due
to
an
open
foreign
market
are
adjusted
and
reflected
by
the
Fund
for
financial
reporting
purposes.
b.
Foreign
Currency
Translation
Portfolio
securities
and
other
assets
and
liabilities
denominated
in
foreign
currencies
are
translated
into
U.S.
dollars
based
on
the
exchange
rate
of
such
currencies
against
U.S.
dollars
on
the
date
of
valuation.
The
Fund
may
enter
into
foreign
currency
exchange
contracts
to
facilitate
transactions
denominated
in
a
foreign
currency.
Purchases
and
sales
of
securities,
income
and
expense
items
denominated
in
foreign
currencies
are
translated
into
U.S.
dollars
at
the
exchange
rate
in
effect
on
the
transaction
date.
Portfolio
securities
and
assets
and
liabilities
denominated
in
foreign
currencies
contain
risks
that
those
currencies
will
decline
in
value
relative
to
the
U.S.
dollar.
Occasionally,
events
may
impact
the
availability
or
reliability
of
foreign
exchange
rates
used
to
convert
the
U.S.
dollar
equivalent
value.
If
such
an
event
occurs,
the
foreign
exchange
rate
will
be
valued
at
fair
value
using
procedures
established
and
approved
by
the
Board.
The
Fund
does
not
separately
report
the
effect
of
changes
in
foreign
exchange
rates
from
changes
in
market
prices
on
securities
held.
Such
changes
are
included
in
net
realized
and
unrealized
gain
or
loss
from
investments
in
the
Statement of
Operations.
Realized
foreign
exchange
gains
or
losses
arise
from
sales
of
foreign
currencies,
currency
gains
or
losses
realized
between
the
trade
and
settlement
dates
on
securities
transactions
and
the
difference
between
the
recorded
amounts
of
dividends,
interest,
and
foreign
withholding
taxes
and
the
U.S.
dollar
equivalent
of
the
amounts
actually
received
or
paid.
Net
unrealized
foreign
exchange
gains
and
losses
arise
from
changes
in
foreign
exchange
rates
on
foreign
denominated
assets
and
liabilities
other
than
investments
in
securities
held
at
the
end
of
the
reporting
period.
c.
Income
and
Deferred
Taxes
It
is the Fund's
policy
to
qualify
as
a
regulated
investment
company
under
the
Internal
Revenue
Code. The Fund
intends
to
distribute
to
shareholders
substantially
all
of
its
taxable
income
and
net
realized
gains
to
relieve
it
from
federal
income
and
excise
taxes.
As
a
result,
no
provision
for
U.S.
federal
income
taxes
is
required.
The Fund
may
be
subject
to
foreign
taxation
related
to
income
received,
capital
gains
on
the
sale
of
securities
and
certain
foreign
currency
transactions
in
the
foreign
jurisdictions
in
which
it
invests.
Foreign
taxes,
if
any,
are
recorded
based
on
the
tax
regulations
and
rates
that
exist
in
the
foreign
markets
in
which
the
Fund
invests.
When
a
capital
gain
tax
is
determined
to
apply,
the
Fund
records
an
estimated
deferred
tax
liability
in
an
amount
that
would
be
payable
if
the
securities
were
disposed
of
on
the
valuation
date.
The Fund
may
recognize
an
income
tax
liability
related
to
its
uncertain
tax
positions
under
U.S.
GAAP
when
the
uncertain
tax
position
has
a
less
than
50%
probability
that
it
will
be
sustained
upon
examination
by
the
tax
authorities
based
on
its
technical
merits.
As
of
September
30,
2024, the Fund
has
determined
that
no
tax
liability
is
required
in
its
financial
statements
related
to
uncertain
tax
positions
for
any
open
tax
years
(or
expected
to
be
taken
in
future
tax
years).
Open
tax
years
are
those
that
remain
subject
to
examination
and
are
based
on
the
statute
of
limitations
in
each
jurisdiction
in
which
the Fund
invests.
d.
Security
Transactions,
Investment
Income,
Expenses
and
Distributions
Security
transactions
are
accounted
for
on
trade
date.
Realized
gains
and
losses
on
security
transactions
are
determined
on
a
specific
identification
basis. Estimated
expenses
are
accrued
daily.
Dividend
income
is
recorded
on
the
ex-dividend
date
except
for
certain
dividends
from
securities
where
the
dividend
rate
is
not
available.
In
such cases,
the
dividend
is
recorded
as
soon
as
the
information
is
received
by
the
Fund. Distributions
to
shareholders
are recorded
on
the
ex-dividend
date.
Distributable
earnings
are
determined
according
to
income
tax
regulations
(tax
basis)
and
may
differ
from
earnings
recorded
in
accordance
with
U.S.
GAAP.
These
differences
may
be
permanent
or
temporary.
Permanent
differences
are
reclassified
among
capital
accounts
to
reflect
their
tax
character.
These
reclassifications
have
no
impact
on
net
1.
Organization
and
Significant
Accounting
Policies
(continued)
a.
Financial
Instrument
Valuation
(continued)
Franklin
Managed
Trust
Notes
to
Financial
Statements
Franklin
Rising
Dividends
Fund
(continued)
assets
or
the
results
of
operations.
Temporary
differences
are
not
reclassified,
as
they
may
reverse
in
subsequent
periods.
Realized
and
unrealized
gains
and
losses
and
net
investment
income,
excluding
class
specific
expenses,
are
allocated
daily
to
each
class
of
shares
based
upon
the
relative
proportion
of
net
assets
of
each
class.
Differences
in
per
share
distributions
by
class
are
generally
due
to
differences
in
class
specific
expenses.
e.
Accounting
Estimates
The
preparation
of
financial
statements
in
accordance
with
U.S.
GAAP
requires
management
to
make
estimates
and
assumptions
that
affect
the
reported
amounts
of
assets
and
liabilities
at
the
date
of
the
financial
statements
and
the
amounts
of
income
and
expenses
during
the
reporting
period.
Actual
results
could
differ
from
those
estimates.
f.
Guarantees
and
Indemnifications
Under
the Fund's
organizational
documents,
its
officers
and trustees
are
indemnified
by
the
Fund against
certain
liabilities
arising
out
of
the
performance
of
their
duties
to
the
Fund.
Additionally,
in
the
normal
course
of
business,
the
Fund
enters
into
contracts
with
service
providers
that
contain
general
indemnification
clauses.
The Fund's
maximum
exposure
under
these
arrangements
is
unknown
as
this
would
involve
future
claims
that
may
be
made
against
the Fund
that
have
not
yet
occurred.
Currently,
the Fund
expects
the
risk
of
loss
to
be
remote.
2.
Shares
of
Beneficial
Interest
At
September
30,
2024,
there
were
an
unlimited
number
of
shares
authorized
(without
par
value).
Transactions
in
the
Fund's
shares
were
as
follows:
Year
Ended
September
30,
2024
Year
Ended
September
30,
2023
Shares
Amount
Shares
Amount
Class
A
Shares:
Shares
sold
a
...................................
12,507,205
$1,139,633,011
18,899,790
$1,609,470,737
Shares
issued
in
reinvestment
of
distributions
..........
8,981,141
782,204,298
9,646,027
806,233,833
Shares
redeemed
...............................
(26,694,187)
(2,434,616,933)
(26,892,166)
(2,287,211,772)
Net
increase
(decrease)
..........................
(5,205,841)
$(512,779,624)
1,653,651
$128,492,798
Class
C
Shares:
Shares
sold
...................................
1,067,320
$94,906,106
1,785,428
$148,390,420
Shares
issued
in
reinvestment
of
distributions
..........
408,901
34,699,244
594,062
48,458,491
Shares
redeemed
a
..............................
(3,499,148)
(311,610,354)
(5,907,261)
(493,362,873)
Net
increase
(decrease)
..........................
(2,022,927)
$(182,005,004)
(3,527,771)
$(296,513,962)
Class
R
Shares:
Shares
sold
...................................
243,299
$22,187,822
340,798
$28,864,636
Shares
issued
in
reinvestment
of
distributions
..........
84,779
7,350,216
98,130
8,166,754
Shares
redeemed
...............................
(430,231)
(38,864,044)
(528,521)
(44,904,661)
Net
increase
(decrease)
..........................
(102,153)
$(9,326,006)
(89,593)
$(7,873,271)
1.
Organization
and
Significant
Accounting
Policies
(continued)
d.
Security
Transactions,
Investment
Income,
Expenses
and
Distributions
(continued)
Franklin
Managed
Trust
Notes
to
Financial
Statements
Franklin
Rising
Dividends
Fund
(continued)
3
.
Transactions
with
Affiliates
Franklin
Resources,
Inc.
is
the
holding
company
for
various
subsidiaries
that
together
are
referred
to
as
Franklin
Templeton.
Certain
officers
and trustees
of
the Fund are
also
officers
and/or
directors
of
the
following
subsidiaries:
a.
Management
Fees
The
Fund
pays
an
investment
management fee,
calculated daily and
paid
monthly,
to
Advisers based
on the
average
daily net
assets
of
the
Fund
as
follows:
For
the
year
ended
September
30,
2024,
the
gross
effective
investment
management
fee
rate
was 0.490%
of
the
Fund’s
average daily
net
assets.
b.
Administrative
Fees
Under
an
agreement
with
Advisers,
FT
Services
provides
administrative
services
to
the
Fund.
The
fee
is
paid
by
Advisers
based
on
the Fund's
average
daily
net
assets,
and
is
not
an
additional
expense
of
the
Fund.
Year
Ended
September
30,
2024
Year
Ended
September
30,
2023
Shares
Amount
Shares
Amount
Class
R6
Shares:
Shares
sold
...................................
6,067,761
$551,820,455
8,433,112
$717,033,472
Shares
issued
in
reinvestment
of
distributions
..........
1,654,109
144,050,422
1,582,127
132,203,049
Shares
redeemed
...............................
(6,914,320)
(631,841,513)
(5,871,115)
(499,999,931)
Net
increase
(decrease)
..........................
807,550
$64,029,364
4,144,124
$349,236,590
Advisor
Class
Shares:
Shares
sold
...................................
5,673,949
$515,625,220
7,492,690
$638,398,268
Shares
issued
in
reinvestment
of
distributions
..........
2,090,254
181,984,055
2,199,756
183,736,871
Shares
redeemed
...............................
(9,050,935)
(828,384,114)
(8,629,579)
(732,076,784)
Net
increase
(decrease)
..........................
(1,286,732)
$(130,774,839)
1,062,867
$90,058,355
a
May
include
a
portion
of
Class
C
shares
that
were
automatically
converted
to
Class
A.
Subsidiary
Affiliation
Franklin
Advisers,
Inc.
(Advisers)
Investment
manager
Franklin
Templeton
Services,
LLC
(FT
Services)
Administrative
manager
Franklin
Distributors,
LLC
(Distributors)
Principal
underwriter
Franklin
Templeton
Investor
Services,
LLC
(Investor
Services)
Transfer
agent
Annualized
Fee
Rate
Net
Assets
0.750%
Up
to
and
including
$500
million
0.625%
Over
$500
million,
up
to
and
including
$1
billion
0.500%
Over
$1
billion,
up
to
and
including
$5
billion
0.490%
Over
$5
billion,
up
to
and
including
$10
billion
0.480%
Over
$10
billion,
up
to
and
including
$20
billion
0.470%
In
excess
of
$20
billion
2.
Shares
of
Beneficial
Interest
(continued)
Franklin
Managed
Trust
Notes
to
Financial
Statements
Franklin
Rising
Dividends
Fund
(continued)
c.
Distribution
Fees
The
Board
has
adopted
distribution
plans
for
each
share
class,
with
the
exception
of
Class
R6
and
Advisor
Class
shares,
pursuant
to
Rule
12b-1
under
the
1940
Act.
Under
the
Fund's
Class
A
reimbursement
distribution
plan,
the
Fund
reimburses
Distributors
for
costs
incurred
in
connection
with
the
servicing,
sale
and
distribution
of the
Fund's
shares
up
to
the
maximum
annual
plan
rate.
Under
the
Class
A
reimbursement
distribution
plan,
costs
exceeding
the
maximum
for
the
current
plan
year
cannot
be
reimbursed
in
subsequent
periods.
In
addition,
under
the
Fund's
Class
C
and
R compensation
distribution
plans,
the
Fund
pays
Distributors
for
costs
incurred
in
connection
with
the
servicing,
sale
and
distribution
of
the
Fund's
shares
up
to
the
maximum
annual
plan
rate
for
each
class.
The
plan
year,
for
purposes
of
monitoring
compliance
with
the
maximum
annual
plan
rates,
is
February
1
through
January
31.
The
maximum
annual
plan
rates,
based
on
the
average
daily
net
assets,
for
each
class,
are
as
follows:
d.
Sales
Charges/Underwriting
Agreements
Front-end
sales
charges
and
contingent
deferred
sales
charges
(CDSC)
do
not
represent
expenses
of
the
Fund.
These
charges
are
deducted
from
the
proceeds
of
sales
of
fund
shares
prior
to
investment
or
from
redemption
proceeds
prior
to
remittance,
as
applicable.
Distributors
has
advised
the
Fund
of
the
following
commission
transactions
related
to
the
sales
and
redemptions
of
the
Fund's
shares
for
the
year:
e.
Transfer
Agent
Fees
Each
class
of
shares pays
transfer
agent
fees,
calculated
monthly
and
paid
monthly, to
Investor
Services
for
its
performance
of
shareholder
servicing
obligations. Effective
October
1,
2023,
the
fees
are based
on
a
fixed
margin
earned
by
Investor
Services
and
are allocated
to
the Fund
based
upon
relative
assets
and
relative
transactions.
Prior
to
October
1,
2023,
the
fees
were
based
on
an
annualized
asset
based
fee
of
0.016%
plus
a
transaction
based
fee. In
addition,
each
class reimburses
Investor
Services
for
out
of
pocket
expenses
incurred
and,
except
for
Class
R6, reimburses
shareholder
servicing
fees
paid
to
third
parties.
These
fees
paid
to
third
parties
are
accrued
and
allocated
daily
based
upon
their
relative
proportion
of
such
classes'
aggregate
net
assets.
Class
R6
pays
Investor
Services
transfer
agent
fees
allocated
specifically
to
that
class
based
upon
its
relative
assets
and
relative
transactions.
For
the
year
ended
September
30,
2024,
the Fund
paid
transfer
agent
fees
as
noted
in
the
Statement of
Operations,
of
which
$5,655,603
was
retained
by
Investor
Services.
f.
Investments
in
Affiliated
Management
Investment
Companies
The
Fund
invests
in
one
or
more
affiliated
management
investment
companies.
As
defined
in
the
1940
Act,
an
investment
is
deemed
to
be
a
“Controlled
Affiliate”
of
a
fund
when
a
fund
owns,
either
directly
or
indirectly,
25%
or
more
of
the
affiliated
fund’s
outstanding
shares
or
has
the
power
to
exercise
control
over
management
or
policies
of
such
fund.
The
Fund
does
not
invest
for
purposes
of
exercising
a
controlling
influence
over
the
management
or
policies.
Management
fees
paid
by
the
Fund
are
waived
on
assets
invested
in
the
affiliated
management
investment
companies,
as
noted
in
the
Statement
of
Operations,
in
an
amount
not
to
exceed
the
management
and
administrative
fees
paid
directly
or
indirectly
by
each
affiliate.
During
the
year
ended
September
30,
2024,
the
Fund
held
investments
in
affiliated
management
investment
companies
as
follows:
Class
A
....................................................................................
0.25%
Class
C
....................................................................................
1.00%
Class
R
....................................................................................
0.50%
Sales
charges
retained
net
of
commissions
paid
to
unaffiliated
brokers/dealers
..............................
$1,601,370
CDSC
retained
..............................................................................
$133,225
3
.
Transactions
with
Affiliates
(continued)
Franklin
Managed
Trust
Notes
to
Financial
Statements
Franklin
Rising
Dividends
Fund
(continued)
g.
Waiver
and
Expense
Reimbursements
Transfer
agent
fees
on
Class
R6
shares
of
the
Fund have
been
capped
so
that
transfer
agent
fees
for
that
class
do
not
exceed
0.03%
based
on
the
average
net
assets
of
the
class
until January 31,
2025.
4.
Income
Taxes
The
tax
character
of
distributions
paid
during
the
years
ended
September
30,
2024
and
2023,
was
as
follows:
At
September
30,
2024,
the
cost
of
investments,
net
unrealized
appreciation
(depreciation),
undistributed
ordinary
income
and
undistributed
long
term
capital
gains for
income
tax
purposes
were
as
follows:
Differences
between
income
and/or
capital
gains
as
determined
on
a
book
basis
and
a
tax
basis
are
primarily
due
to
differing
treatments
of
corporate
actions.
5.
Investment
Transactions
Purchases
and
sales
of
investments (excluding
short
term
securities) for
the
year
ended
September
30,
2024,
aggregated
$3,260,403,313 and
$4,317,845,287,
respectively.
aa
Value
at
Beginning
of
Year
Purchases
Sales
Realized
Gain
(Loss)
Net
Change
in
Unrealized
Appreciation
(Depreciation)
Value
at
End
of
Year
Number
of
Shares
Held
at
End
of
Year
Investment
Income
a
a
a
a
a
a
a
a
Franklin
Rising
Dividends
Fund
Non-Controlled
Affiliates
Dividends
Institutional
Fiduciary
Trust
-
Money
Market
Portfolio,
4.74%
.
$927,810,935
$2,291,676,649
$(2,906,855,958)
$—
$—
$312,631,626
312,631,626
$31,465,148
Total
Affiliated
Securities
...
$927,810,935
$2,291,676,649
$(2,906,855,958)
$—
$—
$312,631,626
$31,465,148
2024
2023
Distributions
paid
from:
Ordinary
income
..........................................................
$261,755,657
$256,497,090
Long
term
capital
gain
......................................................
935,611,485
973,387,327
$1,197,367,142
$1,229,884,417
Cost
of
investments
..........................................................................
$11,408,087,839
Unrealized
appreciation
........................................................................
$17,518,583,402
Unrealized
depreciation
........................................................................
(43,587,600)
Net
unrealized
appreciation
(depreciation)
..........................................................
$17,474,995,802
Distributable
earnings:
Undistributed
ordinary
income
...................................................................
$35,505,295
Undistributed
long
term
capital
gains
..............................................................
2,000,985,317
Total
distributable
earnings
.....................................................................
$2,036,490,612
3
.
Transactions
with
Affiliates
(continued)
f.
Investments
in
Affiliated
Management
Investment
Companies
(continued)
Franklin
Managed
Trust
Notes
to
Financial
Statements
Franklin
Rising
Dividends
Fund
(continued)
6.
Credit
Facility
The
Fund,
together
with
other
U.S.
registered
and
foreign
investment
funds
(collectively,
Borrowers),
managed
by
Franklin
Templeton,
are
borrowers
in
a
joint
syndicated
senior
unsecured
credit
facility
totaling
$2.675
billion
(Global
Credit
Facility)
which
matures
on
January
31,
2025.
This
Global
Credit
Facility
provides
a
source
of
funds
to
the
Borrowers
for
temporary
and
emergency
purposes,
including
the
ability
to
meet
future
unanticipated
or
unusually
large
redemption
requests.
Under
the
terms
of
the
Global
Credit
Facility,
the
Fund
shall,
in
addition
to
interest
charged
on
any
borrowings
made
by
the
Fund
and
other
costs
incurred
by
the
Fund,
pay
its
share
of
fees
and
expenses
incurred
in
connection
with
the
implementation
and
maintenance
of
the
Global
Credit
Facility,
based
upon
its
relative
share
of
the
aggregate
net
assets
of
all
of
the
Borrowers,
including
an
annual
commitment
fee
of
0.15%
based
upon
the
unused
portion
of
the
Global
Credit
Facility.
These
fees
are
reflected
in
other
expenses
in
the
Statement
of
Operations.
During
the
year
ended
September
30,
2024,
the Fund
did
not
use
the
Global
Credit
Facility.
7.
Fair
Value
Measurements
The
Fund
follows
a
fair
value
hierarchy
that
distinguishes
between
market
data
obtained
from
independent
sources
(observable
inputs)
and
the Fund's
own
market
assumptions
(unobservable
inputs).
These
inputs
are
used
in
determining
the
value
of
the
Fund's financial
instruments
and
are
summarized
in
the
following
fair
value
hierarchy:
Level
1
–
quoted
prices
in
active
markets
for
identical
financial
instruments
Level
2
–
other
significant
observable
inputs
(including
quoted
prices
for
similar
financial
instruments,
interest
rates,
prepayment
speed,
credit
risk,
etc.)
Level
3
–
significant
unobservable
inputs
(including
the
Fund's
own
assumptions
in
determining
the
fair
value
of
financial
instruments)
The
input
levels
are
not
necessarily
an
indication
of
the
risk
or
liquidity
associated
with
financial
instruments
at
that
level.
At
September
30,
2024,
all
of
the Fund's
investments
in
financial
instruments
carried
at
fair
value
were
valued
using
Level 1
inputs.
For
detailed
categories,
see
the
accompanying
Schedule
of
Investments.
8.
Subsequent
Events
The
Fund
has
evaluated
subsequent
events
through
the
issuance
of
the
financial
statements
and
determined
that
no
events
have
occurred
that
require
disclosure.
Report
of
Independent
Registered
Public
Accounting
Firm
To
the
Board
of
Trustees
of
Franklin
Managed
Trust
and
Shareholders
of
Franklin
Rising
Dividends
Fund
Opinion
on
the
Financial
Statements
We
have
audited
the
accompanying
statement
of
assets
and
liabilities,
including
the
schedule
of
investments,
of
Franklin
Rising
Dividends
Fund
(the
"Fund")
as
of
September
30,
2024,
the
related
statement
of
operations
for
the
year
ended
September
30,
2024,
the
statement
of
changes
in
net
assets
for
each
of
the
two
years
in
the
period
ended
September
30,
2024,
including
the
related
notes,
and
the
financial
highlights
for
each
of
the
five
years
in
the
period
ended
September
30,
2024
(collectively
referred
to
as
the
“financial
statements”).
In
our
opinion,
the
financial
statements
present
fairly,
in
all
material
respects,
the
financial
position
of
the
Fund
as
of
September
30,
2024,
the
results
of
its
operations
for
the
year
then
ended,
the
changes
in
its
net
assets
for
each
of
the
two
years
in
the
period
ended
September
30,
2024
and
the
financial
highlights
for
each
of
the
five
years
in
the
period
ended
September
30,
2024
in
conformity
with
accounting
principles
generally
accepted
in
the
United
States
of
America.
Basis
for
Opinion
These
financial
statements
are
the
responsibility
of
the
Fund’s
management.
Our
responsibility
is
to
express
an
opinion
on
the
Fund’s
financial
statements
based
on
our
audits.
We
are
a
public
accounting
firm
registered
with
the
Public
Company
Accounting
Oversight
Board
(United
States)
(PCAOB)
and
are
required
to
be
independent
with
respect
to
the
Fund
in
accordance
with
the
U.S.
federal
securities
laws
and
the
applicable
rules
and
regulations
of
the
Securities
and
Exchange
Commission
and
the
PCAOB.
We
conducted
our
audits
of
these
financial
statements
in
accordance
with
the
standards
of
the
PCAOB.
Those
standards
require
that
we
plan
and
perform
the
audit
to
obtain
reasonable
assurance
about
whether
the
financial
statements
are
free
of
material
misstatement,
whether
due
to
error
or
fraud.
Our
audits
included
performing
procedures
to
assess
the
risks
of
material
misstatement
of
the
financial
statements,
whether
due
to
error
or
fraud,
and
performing
procedures
that
respond
to
those
risks.
Such
procedures
included
examining,
on
a
test
basis,
evidence
regarding
the
amounts
and
disclosures
in
the
financial
statements.
Our
audits
also
included
evaluating
the
accounting
principles
used
and
significant
estimates
made
by
management,
as
well
as
evaluating
the
overall
presentation
of
the
financial
statements.
Our
procedures
included
confirmation
of
securities
owned
as
of
September
30,
2024
by
correspondence
with
the
custodian
and
transfer
agent.
We
believe
that
our
audits
provide
a
reasonable
basis
for
our
opinion.
/s/PricewaterhouseCoopers
LLP
San
Francisco,
California
November
18,
2024
We
have
served
as
the
auditor
of
one
or
more
investment
companies
in
the
Franklin
Templeton
Group
of
Funds
since
1948.
Tax
Information
(unaudited)
By
mid-February,
tax
information
related
to
a
shareholder's
proportionate
share
of
distributions
paid
during
the
preceding
calendar
year
will
be
received,
if
applicable.
Please
also
refer
to
www.franklintempleton.com
for
per
share
tax
information
related
to
any
distributions
paid
during
the
preceding
calendar
year.
Shareholders
are
advised
to
consult
with
their
tax
advisors
for
further
information
on
the
treatment
of
these
amounts
on
their
tax
returns.
The
following
tax
information
for
the
Fund
is
required
to
be
furnished
to
shareholders
with
respect
to
income
earned
and
distributions
paid
during
its
fiscal
year.
The
Fund
hereby
reports
the
following
amounts,
or
if
subsequently
determined
to
be
different,
the
maximum
allowable
amounts,
for
the
fiscal
year
ended
September
30,
2024:
Pursuant
to:
Amount
Reported
Long-Term
Capital
Gain
Dividends
Distributed
§852(b)(3)(C)
$1,000,526,912
Income
Eligible
for
Dividends
Received
Deduction
(DRD)
§854(b)(1)(A)
$411,849,878
Qualified
Dividend
Income
Earned
(QDI)
§854(b)(1)(B)
$458,476,051
FRANKLIN
MANAGED
TRUST
Franklin
Rising
Dividends
Fund
(Fund)
At
an
in-person
meeting
held
on
April
16,
2024
(Meeting),
the
Board
of
Trustees
(Board)
of
Franklin
Managed
Trust
(Trust),
including
a
majority
of
the
trustees
who
are
not
“interested
persons”
as
defined
in
the
Investment
Company
Act
of
1940
(Independent
Trustees),
reviewed
and
approved
the
continuance
of
the
investment
management
agreement
between
Franklin
Advisers,
Inc.
(Manager)
and
the
Trust,
on
behalf
of
the
Fund
(Management
Agreement)
for
an
additional
one-year
period.
The
Independent
Trustees
received
advice
from
and
met
separately
with
Independent
Trustee
counsel
in
considering
whether
to
approve
the
continuation
of
the
Management
Agreement.
In
considering
the
continuation
of
the
Management
Agreement,
the
Board
reviewed
and
considered
information
provided
by
the
Manager
at
the
Meeting
and
throughout
the
year
at
meetings
of
the
Board
and
its
committees.
The
Board
also
reviewed
and
considered
information
provided
in
response
to
a
detailed
set
of
requests
for
information
submitted
to
the
Manager
by
Independent
Trustee
counsel
on
behalf
of
the
Independent
Trustees
in
connection
with
the
annual
contract
renewal
process.
In
addition,
prior
to
the
Meeting,
the
Independent
Trustees
held
a
virtual
contract
renewal
meeting
at
which
the
Independent
Trustees
first
conferred
amongst
themselves
and
Independent
Trustee
counsel
about
contract
renewal
matters,
and
then
met
with
management
to
request
additional
information
that
the
Independent
Trustees
reviewed
and
considered
prior
to
and
at
the
Meeting.
The
Board
reviewed
and
considered
all
of
the
factors
it
deemed
relevant
in
approving
the
continuance
of
the
Management
Agreement,
including,
but
not
limited
to:
(i)
the
nature,
extent
and
quality
of
the
services
provided
by
the
Manager;
(ii)
the
investment
performance
of
the
Fund;
(iii)
the
costs
of
the
services
provided
and
profits
realized
by
the
Manager
and
its
affiliates
from
the
relationship
with
the
Fund;
(iv)
the
extent
to
which
economies
of
scale
are
realized
as
the
Fund
grows;
and
(v)
whether
fee
levels
reflect
these
economies
of
scale
for
the
benefit
of
Fund
investors.
In
approving
the
continuance
of
the
Management
Agreement,
the
Board,
including
a
majority
of
the
Independent
Trustees,
determined,
through
the
exercise
of
its
business
judgment,
that
the
terms
of
the
Management
Agreement
are
fair
and
reasonable
and
that
the
continuance
of
the
Management
Agreement
is
in
the
best
interests
of
the
Fund
and
its
shareholders.
Changes
In
and
Disagreements
with
Accountants
For
the
period
covered
by
this
report
Not
applicable.
Results
of
Meeting(s)
of
Shareholders
For
the
period
covered
by
this
report
Not
applicable.
Remuneration
Paid
to
Directors,
Officers
and
Others
For
the
period
covered
by
this
report
Refer
to
the
financial
statements
included
herein.
Board
Approval
of
Management
and
Subadvisory
Agreements
For
the
period
covered
by
this
report
While
attention
was
given
to
all
information
furnished,
the
following
discusses
some
primary
factors
relevant
to
the
Board’s
determination.
Nature,
Extent
and
Quality
of
Services
The
Board
reviewed
and
considered
information
regarding
the
nature,
extent
and
quality
of
investment
management
services
provided
by
the
Manager
and
its
affiliates
to
the
Fund
and
its
shareholders.
This
information
included,
among
other
things,
the
qualifications,
background
and
experience
of
the
senior
management
and
investment
personnel
of
the
Manager,
as
well
as
information
on
succession
planning
where
appropriate;
the
structure
of
investment
personnel
compensation;
oversight
of
third-
party
service
providers;
investment
performance
reports
and
related
financial
information
for
the
Fund;
reports
on
expenses
and
shareholder
services;
legal
and
compliance
matters;
risk
controls;
pricing
and
other
services
provided
by
the
Manager
and
its
affiliates;
and
management
fees
charged
by
the
Manager
and
its
affiliates
to
US
funds
and
other
accounts,
including
management’s
explanation
of
differences
among
accounts
where
relevant.
The
Board
also
reviewed
and
considered
an
annual
report
on
payments
made
by
Franklin
Templeton
(FT)
or
the
Fund
to
financial
intermediaries,
as
well
as
a
memorandum
relating
to
third-party
servicing
arrangements.
The
Board
acknowledged
the
ongoing
integration
of
the
Putnam
family
of
funds
into
the
FT
family
of
funds
and
management’s
continued
development
of
strategies
to
address
areas
of
heightened
concern
in
the
mutual
fund
industry,
including
various
regulatory
initiatives
and
continuing
geopolitical
concerns.
The
Board
also
reviewed
and
considered
the
benefits
provided
to
Fund
shareholders
of
investing
in
a
fund
that
is
part
of
the
FT
family
of
funds.
The
Board
noted
the
financial
position
of
Franklin
Resources,
Inc.
(FRI),
the
Manager’s
parent,
and
its
commitment
to
the
mutual
fund
business
as
evidenced
by
its
continued
reassessment
of
the
fund
offerings
in
response
to
FT
acquisitions
and
the
market
environment,
as
well
as
project
initiatives
and
capital
investments
relating
to
the
services
provided
to
the
Fund
by
the
FT
organization.
The
Board
specifically
noted
FT’s
commitment
to
technological
innovation
and
advancement,
including
its
initiative
to
create
a
new
enterprise-wide
artificial
intelligence
platform.
Following
consideration
of
such
information,
the
Board
was
satisfied
with
the
nature,
extent
and
quality
of
services
provided
by
the
Manager
and
its
affiliates
to
the
Fund
and
its
shareholders.
Fund
Performance
The
Board
reviewed
and
considered
the
performance
results
of
the
Fund
over
various
time
periods
ended
December
31,
2023.
The
Board
considered
the
performance
returns
for
the
Fund
in
comparison
to
the
performance
returns
of
mutual
funds
deemed
comparable
to
the
Fund
included
in
a
universe
(Performance
Universe)
selected
by
Broadridge
Financial
Solutions,
Inc.
(Broadridge),
an
independent
provider
of
investment
company
data.
The
Board
received
a
description
of
the
methodology
used
by
Broadridge
to
select
the
mutual
funds
included
in
a
Performance
Universe.
The
Board
also
reviewed
and
considered
Fund
performance
reports
provided
and
discussions
that
occurred
with
portfolio
managers
at
Board
meetings
throughout
the
year.
A
summary
of
the
Fund’s
performance
results
is
below.
The
Performance
Universe
for
the
Fund
included
the
Fund
and
all
retail
and
institutional
large-cap
core
funds.
The
Board
noted
that
the
Fund’s
annualized
total
return
for
the
one-,
three-,
five-
and
10-year
periods
was
below
the
median
of
its
Performance
Universe.
The
Board
discussed
the
Fund’s
performance
with
management
and
management
explained
that
the
Fund’s
underperformance
for
the
one-year
period
was
largely
due
to
the
strong
outperformance
of
a
number
of
technology-
oriented
companies,
collectively
known
as
the
“Magnificent
Seven.”
Management
also
explained
that,
while
the
Fund’s
performance
was
positively
impacted
by
an
underweight
to
the
“Magnificent
Seven”
in
2022,
the
cumulative
two-year
impact
on
Fund
performance
given
the
strong
performance
of
the
“Magnificent
Seven”
in
2023
adversely
impacted
the
Fund’s
three-
and
five-year
performance.
Management
further
explained
that
the
Fund
seeks
to
invest
at
least
80%
of
its
assets
in
companies
that
have
paid
consistently
rising
dividends
and
that
the
Fund
was
underweight
the
“Magnificent
Seven”
as
most
were
non-dividend
paying
companies.
Management
discussed
with
the
Board
the
actions
that
are
being
taken/have
been
taken
in
an
effort
to
improve
the
overall
performance
of
the
Fund,
including
enhancements
to
its
investment
process.
The
Board
noted
that,
although
below
the
median,
the
Fund’s
annualized
total
return
was
above
8.00%
for
each
period.
The
Board
concluded
that
the
Fund’s
Management
Agreement
should
be
continued
for
an
additional
one-year
period,
while
management’s
efforts
continue
to
be
closely
monitored.
Comparative
Fees
and
Expenses
The
Board
reviewed
and
considered
information
regarding
the
Fund’s
actual
total
expense
ratio
and
its
various
components,
including,
as
applicable,
management
fees;
transfer
agent
expenses;
underlying
fund
expenses;
Rule
12b-1
and
non-Rule
12b-1
service
fees;
and
other
non-management
fees.
The
Board
also
noted
the
quarterly
and
annual
reports
it
receives
on
all
marketing
support
payments
made
by
FT
to
financial
intermediaries.
The
Board
considered
the
actual
total
expense
ratio
and,
separately,
the
contractual
management
fee
rate,
without
the
effect
of
fee
waivers,
if
any
(Management
Rate)
of
the
Fund
in
comparison
to
the
median
expense
ratio
and
median
Management
Rate,
respectively,
of
other
mutual
funds
deemed
comparable
to
and
with
a
similar
expense
structure
to
the
Fund
selected
by
Broadridge
(Expense
Group).
Broadridge
fee
and
expense
data
is
based
upon
information
taken
from
each
fund’s
most
recent
annual
or
semi-annual
report,
which
reflects
historical
asset
levels
that
may
be
quite
different
from
those
currently
existing,
particularly
in
a
period
of
market
volatility.
While
recognizing
such
inherent
limitation
and
the
fact
that
expense
ratios
and
Management
Rates
generally
increase
as
assets
decline
and
decrease
as
assets
grow,
the
Board
believed
the
independent
analysis
conducted
by
Broadridge
to
be
an
appropriate
measure
of
comparative
fees
and
expenses.
The
Broadridge
Management
Rate
includes
administrative
charges,
and
the
actual
total
expense
ratio,
for
comparative
consistency,
was
shown
for
Class
A
shares
for
the
Fund
and
for
the
other
funds
in
the
Expense
Group.
The
Board
received
a
description
of
the
methodology
used
by
Broadridge
to
select
the
mutual
funds
included
in
an
Expense
Group.
The
Expense
Group
for
the
Fund
included
the
Fund
and
11
other
large-cap
core
funds.
The
Board
noted
that
the
Management
Rate
and
actual
total
expense
ratio
for
the
Fund
were
below
the
medians
of
its
Expense
Group.
The
Board
concluded
that
the
Management
Rate
charged
to
the
Fund
is
reasonable.
Profitability
The
Board
reviewed
and
considered
information
regarding
the
profits
realized
by
the
Manager
and
its
affiliates
in
connection
with
the
operation
of
the
Fund.
In
this
respect,
the
Board
considered
the
Fund
profitability
analysis
provided
by
the
Manager
that
addresses
the
overall
profitability
of
FT’s
US
fund
business,
as
well
as
its
profits
in
providing
investment
management
and
other
services
to
each
of
the
individual
funds
during
the
12-month
period
ended
September
30,
2023,
being
the
most
recent
fiscal
year-end
for
FRI.
The
Board
noted
that
although
management
continually
makes
refinements
to
its
methodologies
used
in
calculating
profitability
in
response
to
organizational
and
product-related
changes,
the
overall
methodology
has
remained
consistent
with
that
used
in
the
Fund’s
profitability
report
presentations
from
prior
years.
The
Board
also
noted
that
an
independent
registered
public
accounting
firm
has
been
engaged
by
the
Manager
to
periodically
review
and
assess
the
allocation
methodologies
to
be
used
solely
by
the
Fund’s
Board
with
respect
to
the
profitability
analysis.
The
Board
noted
management’s
belief
that
costs
incurred
in
establishing
the
infrastructure
necessary
for
the
type
of
mutual
fund
operations
conducted
by
the
Manager
and
its
affiliates
may
not
be
fully
reflected
in
the
expenses
allocated
to
the
Fund
in
determining
its
profitability,
as
well
as
the
fact
that
the
level
of
profits,
to
a
certain
extent,
reflected
operational
cost
savings
and
efficiencies
initiated
by
management.
As
part
of
this
evaluation,
the
Board
considered
management’s
outsourcing
of
certain
operations,
which
effort
has
required
considerable
up-front
expenditures
by
the
Manager
but,
over
the
long
run
is
expected
to
result
in
greater
efficiencies.
The
Board
also
noted
management’s
expenditures
in
improving
shareholder
services
provided
to
the
Fund,
as
well
as
the
need
to
implement
systems
and
meet
additional
regulatory
and
compliance
requirements
resulting
from
recent
US
Securities
and
Exchange
Commission
and
other
regulatory
requirements.
The
Board
also
considered
the
extent
to
which
the
Manager
and
its
affiliates
might
derive
ancillary
benefits
from
fund
operations,
including
revenues
generated
from
transfer
agent
services,
potential
benefits
resulting
from
personnel
and
systems
enhancements
necessitated
by
fund
growth,
as
well
as
increased
leverage
with
service
providers
and
counterparties.
Based
upon
its
consideration
of
all
these
factors,
the
Board
concluded
that
the
level
of
profits
realized
by
the
Manager
and
its
affiliates
from
providing
services
to
the
Fund
was
not
excessive
in
view
of
the
nature,
extent
and
quality
of
services
provided
to
the
Fund.
Economies
of
Scale
The
Board
reviewed
and
considered
the
extent
to
which
the
Manager
may
realize
economies
of
scale,
if
any,
as
the
Fund
grows
larger
and
whether
the
Fund’s
management
fee
structure
reflects
any
economies
of
scale
for
the
benefit
of
shareholders.
With
respect
to
possible
economies
of
scale,
the
Board
noted
the
existence
of
management
fee
breakpoints,
which
operate
generally
to
share
any
economies
of
scale
with
the
Fund’s
shareholders
by
reducing
the
Fund’s
effective
management
fees
as
the
Fund
grows
in
size.
The
Board
considered
the
Manager’s
view
that
any
analyses
of
potential
economies
of
scale
in
managing
a
particular
fund
are
inherently
limited
in
light
of
the
joint
and
common
costs
and
investments
the
Manager
incurs
across
the
FT
family
of
funds
as
a
whole.
The
Board
concluded
that
to
the
extent
economies
of
scale
may
be
realized
by
the
Manager
and
its
affiliates,
the
Fund’s
management
fee
structure
provided
a
sharing
of
benefits
with
the
Fund
and
its
shareholders
as
the
Fund
grows.
Conclusion
Based
on
its
review,
consideration
and
evaluation
of
all
factors
it
believed
relevant,
including
the
above-described
factors
and
conclusions,
the
Board
unanimously
approved
the
continuation
of
the
Management
Agreement
for
an
additional
one-year
period.
©
2024
Franklin
Templeton.
All
rights
reserved.
Item 8. Changes in and Disagreements with Accountants for Open-End Management Investment Companies.
The information is disclosed as part of the Financial Statements included in Item 7 of this Form N-CSR.
Item 9. Proxy Disclosures for Open-End Management Investment Companies.
The information is disclosed as part of the Financial Statements included in Item 7 of this Form N-CSR.
Item 10. Remuneration Paid to Directors, Officers, and Others of Open-End Management Investment Companies.
The information is disclosed as part of the Financial Statements included in Item 7 of this Form N-CSR.
Item 11. Statement Regarding Basis for Approval of Investment Advisory Contract.
The information is disclosed as part of the Financial Statements included in Item 7 of this Form N-CSR.
Item 12. Disclosure of Proxy Voting Policies and Procedures for Closed-End Management Investment Companies. N/A
Item 13. Portfolio Managers of Closed-End Management Investment Companies. N/A
Item 14. Purchases of Equity Securities by Closed-End Management Investment Company and Affiliated Purchasers. N/A
Item 15. Submission of Matters to a Vote of Security Holders.
There have been no changes to the procedures by which shareholders may recommend nominees to the Registrant's Board of Trustees that would require disclosure herein.
Item 16. Controls and Procedures.
(a) Evaluation of Disclosure Controls and Procedures. The Registrant maintains disclosure controls and procedures that are designed to provide reasonable assurance that information required to be disclosed in the Registrant’s filings under the Securities Exchange Act of 1934, as amended, and the Investment Company Act of 1940 is recorded, processed, summarized and reported within the periods specified in the rules and forms of the Securities and Exchange Commission. Such information is accumulated and communicated to the Registrant’s management, including its principal executive officer and principal financial officer, as appropriate, to allow timely decisions regarding required disclosure. The Registrant’s management, including the principal executive officer and the principal financial officer, recognizes that any set of controls and procedures, no matter how well designed and operated, can provide only reasonable assurance of achieving the desired control objectives.
Within 90 days prior to the filing date of this Shareholder Report on Form N-CSR, the Registrant had carried out an evaluation, under the supervision and with the participation of the Registrant’s management, including the Registrant’s principal executive officer and the Registrant’s principal financial officer, of the effectiveness of the design and operation of the Registrant’s disclosure controls and procedures. Based on such evaluation, the Registrant’s principal executive officer and principal financial officer concluded that the Registrant’s disclosure controls and procedures are effective.
(b) Changes in Internal Controls. There have been no changes in the Registrant’s internal control over financial reporting that occurred during the period covered by this report that has materially affected, or is reasonably likely to materially affect the internal control over financial reporting.
Item 17. Disclosure of Securities Lending Activities for Closed-End Management Investment Company. N/A
Item 18. Recovery of Erroneously Awarded Compensation.
(a) N/A
(b) N/A
Item 19. Exhibits.
(a)(1) Code of Ethics
(a)(2) Certifications pursuant to Section 302 of the Sarbanes-Oxley Act of 2002 of Christopher Kings, Chief Executive Officer - Finance and Administration, and Jeffrey White, Chief Financial Officer, Chief Accounting Officer and Treasurer
(b) Certifications pursuant to Section 906 of the Sarbanes-Oxley Act of 2002 of Christopher Kings, Chief Executive Officer - Finance and Administration, and Jeffrey White, Chief Financial Officer, Chief Accounting Officer and Treasurer
SIGNATURES
Pursuant to the requirements of the Securities Exchange Act of 1934 and the Investment Company Act of 1940, the registrant has duly caused this report to be signed on its behalf by the undersigned, thereunto duly authorized.
FRANKLIN MANAGED TRUST
| By | /s/ CHRISTOPHER KINGS | |
| | Christopher Kings | |
| | Chief Executive Officer - Finance and Administration | |
| | | |
| Date | November 27, 2024 | |
Pursuant to the requirements of the Securities Exchange Act of 1934 and the Investment Company Act of 1940, this report has been signed below by the following persons on behalf of the registrant and in the capacities and on the dates indicated.
| By | /s/ CHRISTOPHER KINGS | |
| | Christopher Kings | |
| | Chief Executive Officer - Finance and Administration | |
| | | |
| Date | November 27, 2024 | |
| By | /s/ JEFFREY WHITE | |
| | Jeffrey White | |
| | Chief Financial Officer, Chief Accounting Officer and Treasurer | |
| | | |
| Date | November 27, 2024 | |