Exhibit 13.01
2003
FINANCIAL REPORT
32
MANAGEMENT’S DISCUSSION AND ANALYSIS
OF FINANCIAL CONDITION AND RESULTS OF OPERATIONS
Lehman Brothers Holdings Inc. (“Holdings”) and subsidiaries (collectively, the “Company” or “Lehman Brothers”) is a leading financial services firm that provides investment banking and capital markets facilitation to a global client base. The Company’s business activities are divided into three segments: Investment Banking, Capital Markets and Client Services. The investment banking industry is significantly influenced by worldwide economic conditions as well as other factors inherent in the global financial markets. As a result, revenues and earnings may vary from quarter to quarter and from year to year.
Forward-Looking Statements
Some of the statements contained in this Management’s Discussion and Analysis of Financial Condition and Results of Operations, including those relating to the Company’s strategy and other statements that are predictive in nature, that depend upon or refer to future events or conditions or that include words such as “expects,” “anticipates,” “intends,” “plans,” “believes,” “estimates” and similar expressions, are forward-looking statements within the meaning of Section 21E of the Securities Exchange Act of 1934, as amended. These statements are not historical facts but instead represent only the Company’s expectations, estimates and projections regarding future events. These statements are not guarantees of future performance and involve uncertainties that are difficult to predict, which may include, but are not limited to, the factors listed below. As a global investment bank, the Company’s results of operations have varied significantly in response to global economic and market trends and geopolitical events. The nature of the Company’s business makes predicting the future trends of revenues difficult. Caution should be used when extrapolating historical results to future periods.
The Company’s actual results and financial condition may differ, perhaps materially, from the anticipated results and financial condition in any such forward-looking statements and, accordingly, readers are cautioned not to place undue reliance on such statements. The Company undertakes no obligation to update any forward-looking statements, whether as a result of new information, future events or otherwise.
The Company’s results of operations may be affected by uncertain or unfavorable economic, market, legal and other conditions. These conditions include but are not limited to:
Market Fluctuations and Volatility
Changes in interest and foreign exchange rates, securities, commodities and real estate valuations and increases in volatility can increase credit and market risks and may also impact customer-flow-related revenues and proprietary trading revenues as well as impact the volume of debt and equity underwritings and merger and acquisition transactions. The Company uses derivatives and other financial contracts to hedge many of these market risks.
Industry Competition and Changes in Competitive Environment
Increased competition from banking institutions, asset managers and non-traditional financial services providers and industry consolidation could impact fees earned from the Company’s Investment Banking, Client Services and Capital Markets businesses.
Investor Sentiment
Recent accounting and corporate governance scandals have had a significant impact on investor confidence. In addition, geopolitical concerns about terrorist activities can affect the global financial markets.
Liquidity
Liquidity and liquidity management are of critical importance to the Company. Liquidity could be impacted by the inability to access the long-term or short-term debt markets or the repurchase and securities-lending markets. However, the Company’s liquidity and funding policies have been designed with the goal of providing sufficient
33
liquidity resources to continually fund its balance sheet and to meet its obligations in all market environments.
Credit Ratings
The Company’s access to the unsecured funding markets is dependent upon the Company’s credit ratings. A reduction in the Company’s credit ratings could adversely affect the Company’s access to liquidity alternatives and its competitive position, and could increase the cost of funding or trigger additional collateral requirements.
Credit Exposure
Credit risk represents the possibility that a counterparty will be unable to honor its contractual obligations to the Company. Although the Company actively manages credit risk exposure daily as part of its risk management framework, counterparty default risk may arise from unforeseen events or circumstances.
Legal/Regulatory
Legal and regulatory changes in the U.S. and other jurisdictions could have unfavorable effects on the Company’s businesses and results of operations. In particular, there have been a number of legislative, legal and regulatory developments related to research analyst conflicts of interest and mutual fund trading issues in the financial services industry that may affect future results of operations. In 2002, the U.S. Congress enacted the Sarbanes-Oxley Act, which significantly affected corporate governance and securities laws. In addition, various Federal and state securities regulators, self-regulatory organizations (including the New York Stock Exchange) and industry participants reviewed and, in many cases, adopted significant changes to their established rules including rules in the areas of corporate governance, potential research analyst conflicts of interest and auditor independence.
Neuberger Berman Integration
The Company acquired Neuberger Berman Inc. and its subsidiaries (“Neuberger”), an asset management company, in October 2003. The Company’s ability to achieve the anticipated benefits of the merger, including revenue and cost synergies, is dependent upon a number of factors, certain of which may be beyond the Company’s control. These synergies may not be realized in the anticipated amounts or time frame. For additional information about this acquisition see the Client Services business segment discussion on page 45 and Note 6 to the Consolidated Financial Statements.
Business Environment
The principal business activities of the Company are investment banking, capital markets facilitation and asset management, which by their nature are subject to volatility, primarily due to changes in interest and foreign exchange rates, security and real estate valuations, global economic and political trends and industry competition. Through the Company’s investment banking, trading, research, structuring and distribution capabilities in equity and fixed income products, the Company continues to build on its client/customer business model. This model focuses on customer flow activities. The customer flow model is based on the Company’s principal focus of facilitating customer transactions in all major global capital markets products and services. The Company generates customer flow revenues from institutional and high-net-worth clients/customers by (i) advising on and structuring transactions specifically suited to meet client needs; (ii) serving as a market-maker and/or intermediary in the global marketplace, including having securities and other financial instrument products available to allow clients to rebalance their portfolios and diversify risks across different market cycles; (iii) providing asset management services; and (iv) acting as an underwriter to clients. In addition to its customer flow activities, the Company also takes proprietary positions.
During 2003, the global market environment began to emerge from a prolonged slump. Gross domestic product (“GDP”) growth rates began to improve, worldwide capacity indicated core inflation would remain low, labor markets began showing signs of stabilization, and corporate governance issues and geopolitical concerns eased their grip on investor sentiment—all serving to increase the sense of stability. While expectations improved as 2003 progressed, a global economic recovery was not yet fully in evidence.
The fixed income markets performed extremely well in 2003, benefiting from a historically low interest rate environment, improved investor confidence as economic indicators became increasingly positive, and significantly lower levels of corporate downgrades and defaults. During 2003, the U.S. Treasury rate reached a 45-year low, and credit spreads tightened significantly. During the second half of 2003, the fixed income markets saw significant steepening of treasury curves in the U.S. and Japan on the prospects of stronger economic growth. Bond market volatility soared during the second half of 2003, resulting in record fixed income related volumes as customers reallocated investment portfolios and engaged in more dynamic hedging.
The U.S. equity markets reached an 18-month high late in the year, as GDP growth, corporate profitability, manufacturing indices and capital spending all improved. The S&P 500 and NASDAQ indices rose 13% and 33%, respectively, in the year ended November 30, 2003. Monetary and fiscal policy provided an additional stimulus in the form
34
of a 25 basis-point rate cut by the Federal Reserve in June and tax policy changes enacted earlier in the year, both of which had the objective of encouraging more rapid growth.
Global fixed income origination volumes reached a record high in 2003. Investment grade spreads tightened compared with 2002 and, together with low absolute interest rates, led to a favorable environment for new issues, which increased 25% from 2002. The high yield market also benefited as low rates and significantly tighter credit spreads resulted in more than a doubling of the 2002 volume levels. Throughout 2003, issuers took advantage of interest rates that remained low even though rates began an upward climb in the second half of 2003 from the historical lows reached earlier in the year. Equity origination market volume in 2003 declined 2% from the already depressed levels of 2002; however origination activity improved in the second half of 2003, as economic indicators showed more consistent signs of recovery. Equity issuance was concentrated in secondaries, follow-ons and convertibles, while IPO volume declined a further 42% compared with already depressed 2002 levels.
Europe followed the U.S. lead in terms of monetary policy as both the European Central Bank and the Bank of England reduced interest rates. Even with such stimulus, European economic growth continued to trail U.S. levels with three of Europe’s major economies—Germany, Italy and the Netherlands—all in recession. However, anticipation of stronger U.S. growth prompted the major European equity indices to rally on the prospect of an export driven recovery. The FTSE 100 and DAX composite rose 4% and 13%, respectively, during 2003. Asian equity markets also exhibited gains during the year, with the Hang Seng index rising 22% during 2003. In Japan, stronger GDP growth, increased corporate profitability, central bank focus on deflation, and progress in bank reform caused the Nikkei to rise 10% in 2003.
Mergers and acquisitions (“M&A”) completions in fiscal 2003 were the lowest in over five years, with corporate executives awaiting definitive signs of an economic and market recovery before initiating transactions. Volumes were down 17% from fiscal 2002. However, M&A activity showed some signs of improving in late 2003, and the dollar value of overall announced M&A transactions rose 8% in 2003 from 2002.
Economic Outlook
The financial services industry remains highly linked to global economic growth both in banking and capital markets. The Company expects U.S. GDP to increase by 4.4% in 2004 as the recovery solidifies. The Company anticipates more moderate growth rates of 1.5% in Europe and 2.3% in Japan, with robust growth of 6.8% in Asia excluding Japan. The Company expects fiscal and monetary policy to remain supportive during 2004 and expects that the low interest rate environment will continue to persist for some time.
The Company anticipates that the equities markets will continue strengthening, supported by expansive monetary policy, equity valuations that are attractive relative to bonds, increasing corporate cash flows, and growing investor confidence. The corporate profit recovery has been a key element supporting a stronger equity market. With market appreciation and diminished volatility, the equity origination markets have become more active, and equity origination volume in the last half of 2003 represented the most active issuance period since 2000. Given these economic factors, the Company expects equity origination to continue to improve throughout 2004.
While the Company does not expect fixed income origination levels to reach the record volume of $9.6 trillion issued in 2003, the outlook for fixed income origination is still quite positive. The Company expects a drop in 2004 originations by approximately 15%—still representing the second highest level of annual fixed income origination volume. Weaker mortgage and high grade issuance in 2004 are expected to be partly offset by stronger levels of public finance, sovereign, high yield, emerging market and asset-backed offerings.
The Company believes the favorable economic fundamentals that existed in 2003 will remain in place throughout 2004, resulting in continued strength in fixed income customer flow-related activity. Globally, the fixed income market has grown over 50% since 1999 to a market size of over $19 trillion in par value of securities outstanding, the market is significantly more diverse. Given the sheer size and diversity of this market and the natural flow of principal and coupon inherent to these securities, the Company believes the baseline level of fixed income flow and activity has increased well beyond that experienced in the past. As the market has become far more global, the Company anticipates continued growth of securitization products in both Europe and Asia.
The outlook for Client Services is also positive, given favorable demographics and the trends toward pension reform, higher savings rates globally, and intergenerational wealth transfer. The high-net-worth client increasingly seeks multiple providers and greater asset diversification along with a high service component. The Company believes the significant expansion of its asset management business, including the October 2003 Neuberger acquisition, was well-timed, and integration is progressing well.
With the Company’s diversified business model, the scale of the Company’s businesses, the increased market share the Company now enjoys, the productivity of the Company’s people, the prudent manner in which the Company’s businesses are managed day to day, and management’s outlook for the global economy and for the Company’s individual businesses, the Company believes it is well-positioned to continue to perform at the upper end of its peer group throughout the various stages of the business and economic cycle.
35
The Company provides a full array of capital markets products, investment banking services and investment management and advisory services worldwide. Through the Company’s banking, trading, research, structuring and distribution capabilities in equity and fixed income products, the Company continues to effectively build its client/customer business model. This model focuses on customer flow activities, which represent a preponderance of the Company’s revenues. In addition to its customer flow activities, the Company also takes proprietary positions, the success of which is dependent upon its ability to anticipate economic and market trends. The Company believes its customer flow orientation helps to mitigate its overall revenue volatility.
The Company, through its subsidiaries, is a market maker in all major equity and fixed income products in both the U.S. and international markets. To facilitate its market-making activities, the Company is a member of all principal securities and commodities exchanges in the U.S. and holds memberships or associate memberships on several principal international securities and commodities exchanges including the London, Tokyo, Hong Kong, Frankfurt, Milan and Paris stock exchanges. As part of its customer flow activities, the Company maintains inventory positions of varying amounts across a broad range of financial instruments that are marked-to-market daily and, along with proprietary trading positions, give rise to Principal transactions and net interest revenue.
Net income totaled $1,699 million or $6.35 per diluted share in 2003, up 74% and 83%, respectively, from net income of $975 million and diluted earnings per share of $3.47 in 2002. Net revenues rose 40% to $8,647 million in 2003 from $6,155 million in 2002. The improvements reflect strong performance in Capital Markets, complemented by modest improvements in debt underwriting and Client Services activities. Equity underwriting and M&A advisory declined moderately compared with already depressed 2002 levels, as global market volumes declined further. The effect of the global equity underwriting volume decline was somewhat offset by the Company’s improved market share. Overall revenue growth is primarily attributable to a more favorable economic climate in 2003, and the continued growth in the depth and breadth of the Capital Markets customer franchise. Net income and diluted earnings per share in 2002 declined 22% and 21%, respectively, from $1,255 million and $4.38 in 2001. Net revenues in 2002 declined $581 million or 9% from $6,736 in 2001.
The Company continues to maintain a strict discipline in its core competencies around managing expenses, risk and capital. Compensation and benefits expense as a percentage of net revenues was 49.9% in 2003 and 51.0% in both 2002 and 2001. Non-personnel expenses in 2003, 2002 and 2001 include a number of special items described on page 38 (the “Special Items”).
Non-personnel expenses rose 11% (13% excluding the Special Items) in 2003 compared with 2002 and rose 4% (7% excluding the Special Items) in 2002 compared with 2001. Non-personnel expenses as a percentage of net revenue were 21%, 26% and 23%, respectively, in 2003, 2002 and 2001 (20%, 25% and 21% in 2003, 2002 and 2001, respectively, excluding the Special Items).
Return on average common stockholders’ equity was 18.2%, 11.2% and 15.9% in 2003, 2002 and 2001, respectively (18.7%, 12.2% and 16.9%, respectively, excluding the Special Items). The Special Items reduced diluted earnings per share by $0.17, $0.30 and $0.26 in 2003, 2002 and 2001, respectively. Average common stockholders’ equity was appropriately weighted for the effect of the equity issued in connection with the Neuberger acquisition on October 31, 2003.
(1) Market share, volume and ranking statistics in this Management’s Discussion and Analysis were obtained from Thomson Financial.
NET REVENUES
IN MILLIONS | | | | | | | | Percent Change | |
YEAR ENDED NOVEMBER 30 | | 2003 | | 2002 | | 2001 | | 2003/2002 | | 2002/2001 | |
| | | | | | | | | | | |
Principal transactions | | $ | 4,280 | | $ | 1,951 | | $ | 2,779 | | 119 | % | (30 | )% |
Investment banking | | 1,747 | | 1,771 | | 2,000 | | (1 | ) | (11 | ) |
Commissions | | 1,210 | | 1,286 | | 1,091 | | (6 | ) | 18 | |
Interest and dividends | | 9,942 | | 11,728 | | 16,470 | | (15 | ) | (29 | ) |
Other | | 108 | | 45 | | 52 | | 140 | | (13 | ) |
Total revenues | | 17,287 | | 16,781 | | 22,392 | | 3 | | (25 | ) |
Interest expense | | 8,640 | | 10,626 | | 15,656 | | (19 | ) | (32 | ) |
Net revenues | | $ | 8,647 | | $ | 6,155 | | $ | 6,736 | | 40 | % | (9 | )% |
36
Net revenues totaled $8,647 million, $6,155 million and $6,736 million in 2003, 2002 and 2001, respectively. Net revenues in 2003 were a record for the Company, representing a 12% increase over the prior peak in 2000. Net revenues grew 40% compared with 2002, primarily attributable to improved Fixed Income and Equities Capital Markets results, which rose $2,398 million or 66% from 2002. Client Services net revenues rose $103 million or 13% from 2002, while Investment Banking net revenues were essentially unchanged from 2002. The Company’s net revenues declined 9% in 2002 compared with 2001 as difficult global market conditions resulted in lower M&A, equity origination and Equity Capital Markets revenues, partially offset by an increase in Fixed Income Capital Markets revenues. Client Services revenues and debt origination revenues remained relatively unchanged in 2002 compared with 2001. See pages 40-46 for a detailed discussion of revenues by segment.
Investment Banking continued to gain market share in key products (specifically, in announced M&A transactions, global equities, convertibles and asset-backed securities), while maintaining a significant share in debt origination. In Fixed Income Capital Markets, the Company continued to grow its client base and significantly improved market share in interest rate derivatives, foreign exchange, corporate and government debt and mortgage-backed securities. In Equity Capital Markets the Company made considerable progress in terms of sales and trading share. In Client Services, the Company continued to introduce new products and services to an expanding client base and completed the acquisition of Neuberger in October 2003.
Principal Transactions, Commissions and Net Interest Revenues
In each of its Capital Markets and Client Services businesses, the Company evaluates revenue performance in the aggregate, including Principal transactions, Commissions and net interest. Management of these activities is based on aggregate revenues, which includes an assessment of the potential gain or loss associated with a transaction, including associated commissions, and the interest and dividend revenue or expense associated with financing or hedging positions. Caution should be used when analyzing these revenue categories individually because they may not be indicative of the overall performance of the Capital Markets and Client Services activities.
Principal transactions, Commissions and net interest revenues totaled $6,792 million, $4,339 million and $4,684 million in 2003, 2002 and 2001, respectively. The 57% improvement in 2003 compared with 2002 reflected record revenues from fixed income products and improved equity product revenues. Fixed income products reached record levels in 2003, as historically low interest rates, increased interest rate volatility and narrowing credit spreads drove record customer flow activities. The improved equity product revenues were driven by improvements in the global economy, with stronger corporate earnings and a steady rise in global equity indices. The 7% decline in 2002 from 2001 principally reflects the negative conditions within the global equity markets, which resulted in a decline in Equity Capital Markets revenues, most notably in equity derivatives, as investor concerns regarding corporate governance and geopolitical risks resulted in reduced demand for these products. Equity Capital Markets revenues also were reduced by losses on the Company’s private equity investments in 2002. Despite these negative conditions, the Company improved its market share in both listed and NASDAQ trading volumes. Partially offsetting these revenue declines in 2002 was an increase in Fixed Income Capital Markets revenues, particularly in mortgage products, which benefited from their less credit-sensitive nature and low interest rate levels.
Principal transactions revenue increased $2,329 million or 119% in 2003 compared with 2002, principally reflecting record revenues from fixed income products. Revenues from equity products also improved in 2003 as a result of rising global equity indices and improved performance in private equity. Principal transactions revenue declined $828 million or 30% in 2002 compared with 2001, principally reflecting reduced equity product revenues resulting from poor global market conditions. In addition, Principal transactions revenue declined in 2002 as a result of the transition to a commission-based revenue structure on NASDAQ trades, whereby these revenues are classified as Commissions in 2002 and 2003. In prior years, NASDAQ trades for substantially all institutional customers were transacted on a spread basis, with related revenues classified within Principal transactions.
Commission revenue declined $76 million or 6% in 2003 compared with 2002, primarily reflecting lower trading volumes. Commission revenue grew $195 million or 18% in 2002 compared with 2001 due to the transition to institutional commission-based pricing in the NASDAQ market, growth in market trading volumes and an increase in the Company’s market share of listed and NASDAQ trading volumes.
Interest and dividends revenue and Interest expense are a function of the level and mix of total assets and liabilities (principally financial instruments owned and secured financing activities), the prevailing level of interest rates, and the term structure of the Company’s financings. Interest and dividends revenue and Interest expense are integral components of the overall customer flow activities. The decrease in Interest and dividends revenue and in Interest expense in 2003 and 2002 is principally due to the substantial declines in interest rates during these periods. The 18% increase in net interest revenue to $1,302 million in 2003 from $1,102 million in 2002 was primarily due to an increase in total assets, including higher levels of secured financing activities, and a steeper yield curve in 2003 that reduced interest expense on secured short-term funding. The 35% increase in net interest revenue to $1,102 million
37
in 2002 from $814 million in 2001 was primarily due to a change in inventory mix to higher levels of interest-bearing assets in response to shifts in customer asset preferences.
Investment Banking
Investment banking revenues totaled $1,747 million, $1,771 million and $2,000 million in 2003, 2002 and 2001, respectively. Investment banking revenues result primarily from fees and related revenues earned for underwriting public and private offerings of fixed income and equity securities, advising clients on M&A activities and corporate financing activities. Investment banking revenues of $1,747 million in 2003 were essentially unchanged compared with $1,771 million in 2002, as lower equity underwriting and M&A market volumes were mostly offset by record fixed income underwriting volumes. Industry-wide, global equity market volume declined 2%, while completed M&A advisory market volume was down 17% compared with the already depressed levels of 2002. Fixed income market volume was up 25% compared with 2002. Investment banking revenues declined 11% in 2002 compared with 2001, reflecting significant market weakness in equity underwriting and M&A advisory activities partially offset by improvements in the Company’s market share for completed M&A transactions and underwriting of certain fixed income and equity products (see page 41 for a discussion of the Company’s Investment Banking segment).
NON-INTEREST EXPENSES
IN MILLIONS | | | | | | | | Percent Change | |
YEAR ENDED NOVEMBER 30 | | 2003 | | 2002 | | 2001 | | 2003/2002 | | 2002/2001 | |
| | | | | | | | | | | |
Compensation and benefits | | $ | 4,318 | | $ | 3,139 | | $ | 3,437 | | 38 | % | (9 | )% |
Non-personnel expenses (excluding the Special Items described below) | | 1,716 | | 1,517 | | 1,424 | | 13 | | 7 | |
Other real estate reconfiguration charge | | 77 | | 128 | | — | | (40 | ) | — | |
September 11th related (recoveries)/expenses, net | | — | | (108 | ) | 127 | | — | | — | |
Regulatory settlement | | — | | 80 | | — | | — | | — | |
Total non-interest expenses | | $ | 6,111 | | $ | 4,756 | | $ | 4,988 | | 28 | % | (5 | )% |
Compensation and benefits/ Net revenues | | 49.9 | % | 51.0 | % | 51.0 | % | | | | |
A significant portion of the Company’s expense base is variable, including compensation and benefits, brokerage and clearing, and business development. The Company expects its variable expenses as a percentage of net revenues to remain in approximately the same proportions in future periods.
Non-interest expenses were $6,111 million in 2003, $4,756 million in 2002 and $4,988 million in 2001 and include a number of Special Items. Non-interest expenses in 2003 include a pre-tax real estate charge of $77 million ($45 million after-tax) associated with the Company’s previous decision to dispose of certain excess real estate. Non-interest expenses in 2002 include a pre-tax net gain of $108 million associated with September 11th related costs and insurance settlement proceeds, a $128 million pre-tax charge associated with decisions to reconfigure certain global real estate facilities and an $80 million pre-tax charge related to the settlement of allegations of research analyst conflicts of interest. The 2003 and 2002 real estate-related charges were recognized in accordance with Emerging Issues Task Force (“EITF”) Issue No. 94-3, “Liability Recognition for Certain Employee Termination Benefits and Other Costs to Exit an Activity (including Certain Costs Incurred in a Restructuring).” These charges represent estimated sublease losses expected to be incurred upon exiting certain of the Company’s facilities, prinicipally in London and New York. The Company expects that substantially all of such facilities will be subleased by the end of 2004. The net pre-tax effect of these 2002 items is a charge of $100 million ($78 million after-tax). Non-interest expenses in 2001 include a $127 million pre-tax charge ($71 million after-tax) stemming from the events of September 11th, which resulted in the displacement and relocation of substantially all of the Company’s New York based employees. Additional information about these Special Items can be found in Notes 20 and 21 to the Consolidated Financial Statements.
Compensation and benefits expense was $4,318 million, $3,139 million and $3,437 million in 2003, 2002 and 2001, respectively. Compensation and benefits expense as a percentage of net revenues was 49.9% in 2003 and 51.0% in 2002 and 2001. Compensation and benefits expense includes the cost of salaries, bonuses, the amortization of deferred stock compensation awards and employee benefit plans. Variable compensation, consisting primarily of bonuses, increased to $2,283 million in 2003 up from $1,198 million in 2002,
38
while fixed compensation, consisting primarily of salaries and benefits, increased to $2,035 million in 2003 from $1,941 million in 2002. The increase in fixed compensation primarily resulted from increased salary costs associated with several business acquisitions completed during the year (see “Business Acquisitions”) as well as increases in pension expense. Compensation and benefits expense declined 9% in 2002 compared with 2001 commensurate with the 9% decline in Net revenues. Included in compensation and benefits expense is net pension expense/(income) of $45 million, $26 million and $(32) million in 2003, 2002 and 2001, respectively. Amortization of deferred stock compensation awards totaled $625 million, $570 million and $544 million in 2003, 2002 and 2001, respectively.
Non-personnel expenses (excluding the Special Items) were $1,716 million in 2003, up $199 million or 13% compared with $1,517 million in 2002. The increase in non-personnel expenses is principally attributable to increases in occupancy, technology and communications, and brokerage and clearance expenses, as well as the effect of business acquisitions during 2003 (for additional information see Note 6 to the Consolidated Financial Statements). Occupancy expenses increased 11% to $319 million in 2003 from $287 million in 2002 principally attributable to the increased cost of the Company’s new corporate headquarters and additional space needed to accommodate the growth in headcount. Technology and communications expenses were $598 million in 2003 compared with $552 million in 2002, an increase of 8%. The growth reflects amortization of technology assets at new facilities and higher spending associated with the enhancement of capital markets trading platforms and technology infrastructure. Brokerage and clearance expenses rose 12% in 2003 primarily attributable to increased volumes in fixed income products, in addition to the Company’s expansion in equities-related businesses in 2003. Professional fees increased by 22% in 2003 compared with 2002, principally due to higher legal, accounting and audit fees incurred in the current industry environment. In the aggregate, $53 million of non-personnel expenses in 2003 are attributable to business acquisitions. Non-personnel expenses (excluding the Special Items) increased 7% in 2002 from 2001 primarily due to investments in technology and communications, higher occupancy expenses to accommodate headcount growth and the increased cost of the new corporate headquarters, and increased brokerage and clearance expenses due to higher volumes in certain fixed income structured products.
Income Taxes
The provision for income taxes totaled $765 million, $368 million and $437 million in 2003, 2002 and 2001, respectively. These provisions resulted in effective tax rates of 30.2%, 26.3% and 25.0%, respectively. The increase in the effective tax rate in 2003 compared with 2002 was primarily due to a higher level of pre-tax income, which reduced the impact of permanent differences, including a decrease in tax-exempt income, partially offset by an increase in tax benefits from foreign operations. The increase in the effective tax rate in 2002 compared with 2001 was primarily due to a less favorable mix of geographic earnings, partially offset by a greater impact of permanent differences, including tax-exempt income. For additional information see Note 19 to the Consolidated Financial Statements.
Business Acquisitions
On October 31, 2003, the Company purchased Neuberger as part of the Company’s strategic plan to build out its Client Services segment. This acquisition positions the Company as one of the industry’s leading providers of services to high-net-worth investors, bringing the Company’s assets under management to over $116 billion at November 30, 2003. The Company, with this acquisition, significantly strengthened its Client Services segment and further diversified its revenue base. The Neuberger acquisition strengthened the Company’s revenues from fee-based activities, allowing for improved cross-cycle performance and reduced earnings volatility. The Company believes this acquisition will provide revenue synergies by (a) making Neuberger products available to the Lehman Brothers network of institutional and high-net worth individual clients in all three geographic regions and (b) offering Neuberger clients an expanded range of investment and risk management products, including structured capital markets products, private equity, and other alternative asset management products. The Company’s estimated $100 million of revenue and cost synergies of the combined businesses leads the Company to believe that the Neuberger acquisition will be slightly dilutive to earnings per share in 2004 and approximately break even by 2005.
The Company purchased Neuberger for a net purchase price of approximately $2,788 million, including cash consideration and incidental costs of $690 million, equity consideration of $2,374 million (including 32.3 million shares of common stock, 0.3 million shares of restricted common stock and 3.5 million vested stock options) and excluding net cash and short-term investments acquired of $276 million. The Company also issued approximately 0.5 million shares of restricted common stock valued at $42 million, which is subject to future service requirements and will be amortized over the applicable service periods (for additional information see Note 15 to the Consolidated Financial Statements). The Company intends for the Neuberger brand to remain intact. The Neuberger acquisition resulted in an increase of approximately 1,200 employees.
During the second quarter of 2003, the Company acquired a controlling interest in Aurora Loan Services (“ALS”), a residential mortgage loan originator and servicer. The Company believes this acquisition adds long-term value to its mortgage franchise by allowing further vertical integration of the business platform. Mortgage loans originated by ALS are intended to provide a more cost efficient source of loan product for the Company’s securitization pipeline. The Company also made three
39
other small acquisitions during 2003. In July 2003, the Company acquired a controlling interest in another residential mortgage loan originator. The strategic objective of this acquisition mirrors that of ALS–to increase the vertical integration of the Company’s mortgage business by expanding the pipeline of loan product for securitization. In October 2003, the Company acquired substantially all of the operating assets of The Crossroads Group (“Crossroads”), a diversified private equity fund manager with approximately $2 billion of assets under management. The Crossroads acquisition expanded the Company’s global private equity franchise to approximately $7 billion under management. In January 2003, the Company acquired the fixed income asset management business of Lincoln Capital Management as part of the Company’s strategic objective to build out its Client Services segment. The Company’s headcount increased by approximately 2,200 as a result of these acquisitions. The aggregate total cost of these four acquisitions was approximately $172 million, which was paid in cash and notes. For additional information about these acquisitions, see the Capital Markets and Client Services business segment discussions below and Note 6 to the Consolidated Financial Statements.
The Company operates in three business segments (each of which is described below): Investment Banking, Capital Markets and Client Services. These business activities result in revenues from both institutional and high-net-worth individual clients, which are recognized in all revenue categories in the Consolidated Statement of Income. (Net revenues also contain certain internal allocations, including funding costs, which are centrally managed.) Net revenues from the Company’s customer flow activities are recorded as either Principal transactions, Commissions or net interest revenues in the Consolidated Statement of Income, depending on the method of execution, financing and/or hedging related to specific inventory positions. In each of its Capital Markets and Client Services businesses, the Company evaluates revenue performance in the aggregate, including Principal transactions, Commissions and net interest. Management of these activities is based on aggregate revenues, which includes an assessment of the potential gain or loss associated with a transaction, including associated commissions, and the interest and dividends revenue and interest expense associated with financing or hedging the Company’s positions. Caution should be used when analyzing these revenue categories individually because they may not be indicative of the performance of the overall Capital Markets and Client Services activities. The following table summarizes the net revenues of the Company’s business segments:
BUSINESS SEGMENTS
IN MILLIONS | | | | | | | | Percent Change | |
YEAR ENDED NOVEMBER 30 | | 2003 | | 2002 | | 2001 | | 2003/2002 | | 2002/2001 | |
| | | | | | | | | | | |
Net revenues: | | | | | | | | | | | |
Investment Banking | | $ | 1,722 | | $ | 1,731 | | $ | 1,925 | | (1 | )% | (10 | )% |
Capital Markets | | 6,018 | | 3,620 | | 4,024 | | 66 | | (10 | ) |
Client Services | | 907 | | 804 | | 787 | | 13 | | 2 | |
Total net revenues | | 8,647 | | 6,155 | | 6,736 | | 40 | | (9 | ) |
Compensation and benefits | | 4,318 | | 3,139 | | 3,437 | | 38 | | (9 | ) |
Non-personnel expenses (1) | | 1,793 | | 1,617 | | 1,551 | | 11 | | 4 | |
Earnings before taxes | | $ | 2,536 | | $ | 1,399 | | $ | 1,748 | | 81 | % | (20 | )% |
(1) Non-personnel expenses include special items (the “Special Items”) totaling $77 million, $100 million and $127 million in 2003, 2002 and 2001, respectively. Additional information about these Special Items can be found in “Management’s Discussion and Analysis—Results of Operations—Non-Interest Expenses” and in Notes 20, 21 and 22 to the Consolidated Financial Statements. The following business segment discussions do not include the Special Items.
40
INVESTMENT BANKING
IN MILLIONS | | | | | | | | Percent Change | |
YEAR ENDED NOVEMBER 30 | | 2003 | | 2002 | | 2001 | | 2003/2002 | | 2002/2001 | |
| | | | | | | | | | | |
Investment banking net revenues | | $ | 1,722 | | $ | 1,731 | | $ | 1,925 | | (1 | )% | (10 | )% |
Non-interest expenses (1) | | 1,321 | | 1,321 | | 1,552 | | — | | (15 | ) |
Earnings before taxes (1) | | $ | 401 | | $ | 410 | | $ | 373 | | (2 | )% | 10 | % |
(1) Excludes the effect of Special Items.
The Investment Banking segment provides advice to corporate, institutional and government clients throughout the world on mergers, acquisitions and other financial matters. The segment also raises capital for clients by underwriting public and private offerings of debt and equity securities. The segment is composed of global industry groups—Communications and Media, Consumer/Retailing, Financial Institutions, Financial Sponsors, Healthcare, Industrial, Natural Resources, Power, Real Estate and Technology—that include bankers who deliver industry knowledge to meet clients’ objectives. Specialized product groups within Mergers and Acquisitions and Global Finance—which includes Equity Capital Markets, Debt Capital Markets, Leveraged Finance and Private Placements—are partnered with global relationship managers in the global industry groups to provide comprehensive solutions for clients. Specialists in product development and derivatives also are engaged to tailor specific structures for clients.
INVESTMENT BANKING NET REVENUES
IN MILLIONS | | | | | | | | Percent Change | |
YEAR ENDED NOVEMBER 30 | | 2003 | | 2002 | | 2001 | | 2003/2002 | | 2002/2001 | |
| | | | | | | | | | | |
Debt Underwriting | | $ | 980 | | $ | 886 | | $ | 893 | | 11 | % | (1 | )% |
Equity Underwriting | | 363 | | 420 | | 440 | | (14 | ) | (5 | ) |
Merger and Acquisition Advisory | | 379 | | 425 | | 592 | | (11 | ) | (28 | ) |
| | $ | 1,722 | | $ | 1,731 | | $ | 1,925 | | (1 | )% | (10 | )% |
Net revenues of $1,722 million in 2003 were essentially unchanged from $1,731 million in 2002 as lower equity underwriting and M&A advisory revenues were substantially offset by growth in debt underwriting. Net revenues declined 10% in 2002 to $1,731 million from $1,925 million in 2001 primarily due to lower M&A advisory and equity underwriting revenues.
Debt underwriting revenues increased 11% in 2003 to a record $980 million from $886 million in 2002, as the tightening of credit spreads and a full year of historically low interest rates resulted in record debt underwriting volumes. Industry-wide fixed income origination volume rose 25% from 2002, while the Company’s fixed income origination volume was up 26%. Investment grade and high yield market underwriting volumes were particularly strong as credit spreads tightened 89 basis points and 452 basis points, respectively, from fiscal 2002 levels. The market volume growth in 2003 was largely in high grade debt which generally has lower fee spreads. The Company ranked fourth in market share of worldwide debt underwriting volumes in calendar 2003, up from fifth in calendar 2002 and 2001, with the Company recording market share of 6.9%, 6.9% and 6.4% for the calendar years ended 2003, 2002 and 2001, respectively. Debt underwriting revenues of $886 million in 2002 were essentially unchanged compared with the Company’s 2001 results of $893 million, as issuers continued to take advantage of low interest rates.
41
Equity underwriting revenues declined 14% in 2003 to $363 million from $420 million in 2002 as industry-wide global equity market volumes declined 2% in fiscal 2003 compared with fiscal 2002. The decline in revenues also is attributable to a change in the mix of equity underwriting, with initial public offerings, which generally are the most lucrative, contributing only 14% of market volume in fiscal 2003, down from 23% in fiscal 2002. The Company increased its global equity-related market share to 3.7% in calendar 2003 from 3.5% in calendar 2002, primarily due to the strong performance in secondary, follow-ons, and convertible offerings globally. Equity origination revenues of $420 million in 2002 declined 5% compared with $440 million in 2001. The Company’s global equity-related market share declined to 3.5% in 2002 from 4.4% in 2001.
M&A advisory fees declined 11% in 2003 to $379 million from $425 million in 2002, as M&A activity remained extremely weak with the market volume for completed transactions in fiscal 2003 reaching its lowest level since 1996. M&A activities continued to be negatively affected by lackluster global growth rates in the first half of 2003, continued weak investor confidence amid geopolitical concerns and uncertainty regarding the global economic recovery. M&A market volume for completed transactions was down 17% compared with fiscal 2002 while the Company’s completed transaction volume was down only 5%. Despite the low volume of activity in fiscal 2003 for completed transactions, M&A activity began to improve in the second half of fiscal 2003, leading to an 8% increase in announced market volume in fiscal 2003 compared with fiscal 2002. The Company’s M&A fee backlog at November 30, 2003 more than doubled from November 30, 2002 indicating an upturn in potential future M&A fee revenue. The Company’s market share for announced transactions was essentially unchanged at 11.0% in calendar 2003 from 10.9% in calendar 2002. M&A advisory fees declined 28% to $425 million in 2002 from $592 million 2001. This decline reflected difficult global market conditions and weak demand for strategic transactions, as corporations remained conservative amid an uncertain business climate. Despite the low volume of activity in the advisory markets, the Company’s market share for completed transactions in calendar 2002 improved to 10.5% compared with 7.4% in calendar 2001.
Non-interest expenses of $1,321 million in 2003 were unchanged from 2002, attributable to a modest increase in compensation and benefits expense reflecting the improved environment at the end of the year, offset by lower business development expense as spending was curtailed in early 2003 when the market environment was subdued. Non-interest expenses in 2002 declined $231 million or 15% compared with 2001, reflecting lower compensation expenses and headcount levels associated with lower revenue and reduced non-personnel-related expenses, particularly business development and professional fees, as the Company focused on minimizing discretionary spending.
Earnings before taxes of $401 million in 2003 declined from $410 million in 2002 driven by the decline in net revenues. Earnings before taxes of $410 million in 2002 increased 10% from 2001 as the 10% decline in net revenues was more than offset by lower expenses.
CAPITAL MARKETS
IN MILLIONS | | | | | | | | Percent Change | |
YEAR ENDED NOVEMBER 30 | | 2003 | | 2002 | | 2001 | | 2003/2002 | | 2002/2001 | |
| | | | | | | | | | | |
Principal transactions | | $ | 3,800 | | $ | 1,474 | | $ | 2,342 | | 158 | % | (37 | )% |
Interest and dividends | | 9,903 | | 11,691 | | 16,371 | | (15 | ) | (29 | ) |
Commissions | | 911 | | 1,059 | | 879 | | (14 | ) | 20 | |
Other | | 14 | | 1 | | 13 | | — | | (92 | ) |
Total revenues | | 14,628 | | 14,225 | | 19,605 | | 3 | | (27 | ) |
Interest expense | | 8,610 | | 10,605 | | 15,581 | | (19 | ) | (32 | ) |
Net revenues | | 6,018 | | 3,620 | | 4,024 | | 66 | | (10 | ) |
Non-interest expenses (1) | | 4,011 | | 2,722 | | 2,702 | | 47 | | 1 | |
Earnings before taxes (1) | | $ | 2,007 | | $ | 898 | | $ | 1,322 | | 123 | % | (32 | )% |
(1) Excludes the effect of Special Items.
42
The Capital Markets segment includes institutional customer flow activities, research, and secondary-trading and financing activities in fixed income and equity products. These products include a wide range of cash, derivative, secured financing and structured instruments and investments. The Company is a leading global market-maker in numerous equity and fixed income products including U.S., European and Asian equities, government and agency securities, money market products, corporate high grade, high yield and emerging market securities, mortgage- and asset-backed securities and real estate, preferred stock, municipal securities, bank loans, foreign exchange, financing and derivative products. The Company is one of the largest investment banks in terms of U.S., and pan-European listed equities trading volume and maintains a major presence in over-the-counter U.S. stocks, major Asian large capitalization stocks, warrants, convertible debentures and preferred issues. The segment also includes the risk arbitrage and secured financing businesses as well as realized and unrealized gains and losses related to private equity investments. The secured financing business manages the Company’s equity and fixed income matched book activities, supplies secured financing to institutional clients and customers, and provides secured funding for the Company’s inventory of equity and fixed income products.
CAPITAL MARKETS NET REVENUES
| | 2003 | | 2002 | | 2001 | |
IN MILLIONS
YEAR ENDED NOVEMBER 30 | | Gross
Revenues | | Interest
Expense | | Net
Revenues | | Gross
Revenues | | Interest
Expense | | Net
Revenues | | Gross
Revenues | | Interest
Expense | | Net
Revenues | |
| | | | | | | | | | | | | | | | | | | |
Fixed Income | | $ | 10,963 | | $ | (6,572 | ) | $ | 4,391 | | $ | 10,674 | | $ | (8,055 | ) | $ | 2,619 | | $ | 13,984 | | $ | (11,757 | ) | $ | 2,227 | |
Equities | | 3,665 | | (2,038 | ) | 1,627 | | 3,551 | | (2,550 | ) | 1,001 | | 5,621 | | (3,824 | ) | 1,797 | |
| | $ | 14,628 | | $ | (8,610 | ) | $ | 6,018 | | $ | 14,225 | | $ | (10,605 | ) | $ | 3,620 | | $ | 19,605 | | $ | (15,581 | ) | $ | 4,024 | |
Net revenues of $6,018 million in 2003 rose 66% from 2002, reflecting record fixed income net revenues and a 63% increase in equities net revenues. Net revenues declined $404 million or 10% in 2002 compared with 2001, as a 44% decline in equities net revenues was only partially offset by an 18% improvement in fixed income net revenues.
Fixed income net revenues increased 68% to a record $4,391 million in 2003 from $2,619 million in 2002. Historically low interest rates, significant credit spread tightening, and volatile currency markets all contributed to an extremely favorable environment for fixed income products and record customer flow activities. The Company’s diverse set of fixed income asset classes experienced increased trading volumes that resulted in improved results across a broad range of asset classes including high yield, mortgage, interest rate, and municipal products. High yield products produced record results driven by a combination of strong customer flow activities and improved proprietary position revenues. High yield revenues benefited from the significant tightening of credit spreads, which saw a 452 basis-point tightening during 2003, and improved trading volumes as corporate downgrades were at the lowest level in five years. Record revenues from mortgage-related products were bolstered by robust refinancings and heavy investor demand for newly securitized products, slightly offset by a softening of certain sectors within the commercial real estate market. Refinancings were fueled by historically low interest rates in the U.S. and Europe, with residential refinancings reaching a record high in May 2003. Interest rate products, including derivatives and governments, improved driven by record customer flow activities as issuers and investors sought to diversify and hedge risks. Fixed income net revenues increased $392 million or 18% to $2,619 million in 2002 from $2,227 million in 2001. The increase was principally driven by strong institutional customer flow activity, particularly in mortgage-related products, as secondary flow was aided by strong origination activity and investors sought to minimize risk by moving to more diversified and defensive asset categories. The low interest rate environment throughout 2002 contributed to strong results in the mortgage businesses, principally from increases in securitization transactions and the distribution of various mortgage loan products, which were bolstered by the active refinancing environment. Strong results also were posted in structured credit-related products, particularly in collateralized debt obligations, as clients migrated to products offering diversification and hedging capabilities.
43
Equities net revenues totaled $1,627 million in 2003, up 63% from 2002 as improvements in the global economy and stronger corporate earnings fueled a steady improvement in global equity indices that began in March and continued through year end. The rise in global equity indices contributed to improved performance in a number of asset classes including derivatives, convertibles, and private equity investments. While U.S. equity trading volumes declined slightly, European and Asian markets experienced a rise in trading volumes contributing to improved performance in these regions. The Company’s share of NASDAQ market volumes continued to increase to 3.8% in fiscal 2003 from 3.6% in fiscal 2002 and 3.2% in fiscal 2001; however, the Company’s share of listed NYSE market volumes decreased to 7.0% in fiscal 2003 from 7.2% in fiscal 2002, but remained well above the Company’s 5.7% share in 2001. The derivative business benefited from improved customer flow activity, particularly in Europe, as customers increasingly used customized derivative products to hedge risk and reduce concentrations. Convertibles revenues were bolstered by improved credit markets and strong customer activity on the heels of increased new issuance activity. The Company recorded net gains on its private equity investments in 2003 compared with losses in 2002. Equities net revenues declined 44% in 2002 to $1,001 million from $1,797 million in 2001 attributable to difficult market conditions that resulted in revenue declines across most equity products including equity derivatives, equity financing and private equity. Equity derivative revenues declined primarily as a result of lower demand for structured equity derivative products. The decline in equity finance revenues was primarily attributable to a decline in customer balances in the prime brokerage business, while private equity investments reported losses on both private and public investments in 2002. These declines were partially offset by improvements in the Company’s market share in both listed and NASDAQ securities during 2002.
Interest and dividends revenue declined 15% compared with 2002, while Interest expense declined by 19%, primarily reflecting a decline in U.S. interest rates from 2002. Net interest revenue rose 19% to $1,293 million in 2003 principally due to increased total assets, including higher levels of secured financing activities and a steeper yield curve. In 2002 interest and dividends revenue declined 29% while Interest expense declined 32% from 2001, reflecting the significant decline in interest rates during the year. Net interest revenue increased 37% in 2002 compared with 2001 reflecting a steeper yield curve environment and higher interest earning asset levels in 2002 compared with 2001.
Non-interest expenses increased to $4,011 million in 2003 from $2,722 million in 2002, primarily due to an increase in compensation and benefits expense commensurate with the increase in net revenues. Non-personnel expenses increased principally due to higher brokerage and clearance costs associated with higher volumes in certain fixed income products, increased technology and communications expenses associated with the enhancement of capital markets trading platforms, and higher professional fees associated with increased legal, accounting and audit costs. Non-interest expenses were essentially unchanged in 2002 compared with 2001, as lower compensation and benefits expense was offset by higher non-personnel expenses, including increased occupancy costs associated with increased headcount levels and higher technology spending to enhance trading platforms and technology infrastructure.
Earnings before taxes increased to $2,007 million in 2003 from $898 million in 2002 as a 66% increase in net revenues was partially offset by a 47% increase in non-interest expenses. Earnings before taxes of $898 million in 2002 declined 32% from $1,322 million in 2001 primarily due to a 10% decline in net revenues.
In February 2003, the Company acquired a controlling interest in ALS, a residential mortgage loan originator and servicer, and in July 2003 the Company acquired a controlling interest in another residential mortgage loan originator. The Company believes the acquisitions add long-term value to its mortgage franchise by allowing further integration of the business platform. Mortgage loans originated are expected to provide a more cost efficient source of loan product for the Company’s securitization pipeline. (See “Management’s Discussion and Analysis–Business Acquisitions” on page 39). These acquisitions contributed approximately $238 million of net revenues, $36 million of non-personnel expenses and $59 million of net income in 2003. For additional information see Note 6 to the Consolidated Financial Statements.
44
CLIENT SERVICES
IN MILLIONS | | | | | | | | Percent Change | |
YEAR ENDED NOVEMBER 30 | | 2003 | | 2002 | | 2001 | | 2003/2002 | | 2002/2001 | |
| | | | | | | | | | | |
Principal transactions | | $ | 480 | | $ | 477 | | $ | 437 | | 1 | % | 9 | % |
Interest and dividends | | 39 | | 37 | | 99 | | 5 | | (63 | ) |
Investment banking | | 25 | | 40 | | 75 | | (38 | ) | (47 | ) |
Commissions | | 299 | | 227 | | 212 | | 32 | | 7 | |
Other | | 94 | | 44 | | 39 | | 114 | | 13 | |
Total revenues | | 937 | | 825 | | 862 | | 14 | | (4 | ) |
Interest expense | | 30 | | 21 | | 75 | | 43 | | (72 | ) |
Net revenues | | 907 | | 804 | | 787 | | 13 | | 2 | |
Non-interest expenses (1) | | 702 | | 613 | | 607 | | 15 | | 1 | |
Earnings before taxes (1) | | $ | 205 | | $ | 191 | | $ | 180 | | 7 | % | 6 | % |
(1) Excludes the effect of Special Items.
The Client Services segment consists of the Private Client and Asset Management business lines. Private Client generates customer-flow transactional revenues from high-net-worth clients, and Asset Management generates fee-based revenues from customized investment management services for high-net-worth clients as well as asset management fees from mutual fund and other institutional investors. Asset Management also generates management and incentive fees from the Company’s role as general partner for private equity and alternative investment partnerships. The Company’s Private Equity business operates in five major asset classes: Merchant Banking, Real Estate, Venture Capital, Fixed Income-related and Third Party Funds.
The Company significantly enhanced its market position in providing asset management services to high-net-worth clients in 2003 through the acquisition of Neuberger. (See “Management’s Discussion and Analysis—Business Acquisitions” on page 39). The Company acquired Neuberger on October 31, 2003, and therefore the Company’s 2003 results reflect only one month of Neuberger’s activity contributing approximately $50 million in net revenues (solely from asset management activities).
CLIENT SERVICES NET REVENUES
AND ASSETS UNDER MANAGEMENT
IN MILLIONS | | | | | | | | Percent Change | |
YEAR ENDED NOVEMBER 30 | | 2003 | | 2002(1) | | 2001(1) | | 2003/2002 | | 2002/2001 | |
| | | | | | | | | | | |
Private Client | | $ | 766 | | $ | 714 | | $ | 667 | | 7 | % | 7 | % |
Asset Management | | 141 | | 90 | | 120 | | 57 | | (25 | ) |
| | $ | 907 | | $ | 804 | | $ | 787 | | 13 | % | 2 | % |
(1) Reclassified to conform to the 2003 presentation.
IN BILLIONS | | | | | | | | Percent Change | |
NOVEMBER 30 | | 2003 | | 2002 | | 2001 | | 2003/2002 | | 2002/2001 | |
| | | | | | | | | | | |
Assets under management | | $ | 116.2 | | $ | 8.6 | | $ | 11.7 | | — | | (26 | )% |
| | | | | | | | | | | | | | |
45
Client Services net revenues increased $103 million or 13% in 2003 compared with 2002, primarily due to increased revenues associated with the acquisitions of Neuberger, Lincoln Capital Management and Crossroads which contributed $71 million of net revenues in 2003, as well as increased distribution of products to high-net-worth clients. Client Services net revenues rose $17 million or 2% in 2002 compared with 2001 principally due to strong fixed income distribution activity.
Private Client net revenues increased $52 million or 7% in 2003 compared with 2002 reflecting strong fixed income product distribution activities partially offset by lower equity sales, as investors were cautious in the first half of the year before gradually beginning to shift asset allocations in the latter half of the year. Despite the weak equity markets in 2002, Private Client net revenues increased $47 million or 7% in 2002 compared with 2001 driven by strong fixed income activity as high-net-worth clients repositioned their portfolios to more defensive asset classes.
Asset management net revenues increased $51 million or 57% in 2003 compared with 2002 as a result of the acquisitions, partially offset by a decline in Private Equity management fees attributable to the expiration of commitment periods on two of the Company’s funds. Net revenues declined $30 million or 25% in 2002 compared with 2001 primarily as a result of lower Private Equity incentive fees.
Assets under management increased by $108 billion in 2003 compared with 2002 primarily attributable to the acquisitions.
Client Services non-interest expenses of $702 million in 2003 rose $89 million or 15% compared with 2002 primarily due to the acquisitions, coupled with higher compensation and benefits expense related to organic revenue growth. Client Services non-interest expenses of $613 million in 2002 were essentially unchanged from 2001. The acquisitions added approximately 1,400 personnel to the Client Services segment headcount as of November 30, 2003.
Earnings before taxes increased to $205 million in 2003 from $191 million in 2002 as revenue growth outpaced expense growth. Earnings before taxes of $191 million in 2002 improved from $180 million in 2001 as a result of higher revenues.
NET REVENUES BY GEOGRAPHIC REGION
IN MILLIONS | | | | | | | | Percent Change | |
YEAR ENDED NOVEMBER 30 | | 2003 | | 2002 | | 2001 | | 2003/2002 | | 2002/2001 | |
| | | | | | | | | | | |
Europe | | $ | 1,864 | | $ | 1,674 | | $ | 1,955 | | 11 | % | (14 | )% |
Asia Pacific | | 875 | | 612 | | 540 | | 43 | | 13 | |
Total International | | 2,739 | | 2,286 | | 2,495 | | 20 | | (8 | ) |
U.S. | | 5,908 | | 3,869 | | 4,241 | | 53 | | (9 | ) |
Total | | $ | 8,647 | | $ | 6,155 | | $ | 6,736 | | 40 | % | (9 | )% |
International net revenues were $2,739 million, $2,286 million and $2,495 million in 2003, 2002 and 2001, respectively, representing approximately 32% of total net revenues in 2003 and 37% in both 2002 and 2001. International net revenues grew 20% in 2003 compared with 2002 and declined 8% in 2002 compared with 2001.
Net revenues in Europe increased 11% to $1,864 million in 2003 from $1,674 million in 2002 attributable to improvements in the capital markets environment, primarily equities, driven by increased customer flow activity in derivative and convertible products. Investment banking revenue grew, driven by increased activity in debt and equity origination. These improvements were partially offset by declines in fixed income capital markets revenues due to a softening of certain sectors within the commercial real estate markets and in M&A. Net revenues declined 14% in 2002 compared with 2001 attributable to a significant decline in equity capital markets and investment banking net revenues due to low corporate demand for equity derivative products and a decline in the European equity origination markets. These declines were partially offset by growth in the fixed income capital markets business, which experienced a record year driven by growth in structured transactions as well as strong performance in interest rate and mortgage-related products.
Net revenues in Asia Pacific of $875 million in 2003 increased 43% from $612 million in 2002 attributable to improved performance in fixed income and equities capital markets and investment banking results. Fixed income capital markets revenue increased primarily due to
46
a higher level of activity in interest rate products. Equities capital markets revenue growth was driven by strength in derivatives corresponding with the increase in the Nikkei. Investment banking revenue also grew, driven by the Company’s improved position in advisory activity, where completed M&A market share improved to 12.3% in calendar 2003 compared with 4.7% in calendar 2002. Asia Capital Markets and Investment Banking partnered together to deliver solutions to regional clients that included the resolution of non-performing loan portfolios, innovative capital raising and price hedging of a portfolio of cross shareholdings, consistent with the Company’s primary strategic theme for the Asia region of delivering the restructuring capabilities of the Company to regional clients. Net revenues increased $72 million or 13% in 2002 compared with 2001. Growth in the fixed income capital markets business in 2002 was driven by strength in derivatives, high yield and mortgage-related products as a result of strong customer flow activities and new transactions, particularly in the distressed asset securitization business. This performance was partially offset by a decline in equity capital markets and investment banking net revenues due to a lack of corporate demand for equity derivatives, depressed equity markets and poor market conditions in the investment banking environment.
LIQUIDITY, FUNDING AND CAPITAL RESOURCES
The Company’s Finance Committee is responsible for developing, implementing and enforcing its liquidity, funding and capital policies. These policies include recommendations for capital and balance sheet size as well as the allocation of capital and balance sheet to the business units. Through the establishment and enforcement of capital and funding limits, the Finance Committee oversees compliance with policies and limits throughout the Company with the goal of ensuring the Company is not exposed to undue funding or liquidity risk.
Liquidity Risk Management
Liquidity and liquidity management are of critical importance to the Company. The Company’s funding strategy seeks to ensure the Company maintains sufficient liquid financial resources to continually fund its balance sheet and meet all of its funding obligations in all market environments. The strategy is based on the following principles:
• Liquidity providers are credit and market sensitive and quick to react to any perceived market or firm-specific risks. Consequently, the Company remains in a state of constant liquidity readiness.
• During a liquidity event, certain secured lenders will require higher quality collateral, resulting in a lower availability of secured funding for “hard-to-fund” asset classes. Consequently, the Company only relies on secured funding to the extent it believes it would be available in all market environments.
• A firm’s legal entity structure may constrain liquidity. Some regulators or rating agency considerations may prevent the free flow of funds between the subsidiaries they supervise (“Restricted Subsidiaries”) and Holdings and its other subsidiaries (“Unrestricted Subsidiaries”). Consequently, the Company seeks to ensure that the Restricted Subsidiaries on the one hand, and Holdings and its Unrestricted Subsidiaries collectively on the other, have sufficient “stand alone” liquidity and that there is no “cross subsidization” of liquidity from these Restricted Subsidiaries to Holdings and its Unrestricted Subsidiaries.
• For planning purposes, the Company does not assume that, in a liquidity crisis, assets can be sold to generate cash, unsecured debt can be issued or any cash and unencumbered liquid collateral outside of the liquidity pool can be used to support the liquidity of Holdings and the Unrestricted Subsidiaries.
When managing liquidity, the Company pays particularly close attention to the size of its liquidity pool, its long-term funding sources and requirements and its reliable secured funding capacity. Each of these metrics is explained in more detail below.
Liquidity Pool The Firm’s policy is to maintain a sizable liquidity pool for Holdings and its Unrestricted Subsidiaries that covers all expected cash outflows in a stressed liquidity environment for one year without being able to access the unsecured debt market. This liquidity pool is invested in cash and unencumbered liquid collateral such as U.S. government and agency obligations, investment grade securities and index equities that can be monetized at short notice in all market environments to provide liquidity to Holdings, which issues most of the unsecured debt. At November 30, 2003 the estimated pledge value of this portfolio, along with the undrawn portion of Holdings’ committed credit facility (see “Credit Facilities” on page 51), totaled approximately $16.3 billion. Cash and unencumbered liquid assets that are presumed to be “trapped” in a Restricted Subsidiary or required for operational purposes are not counted as available liquidity to Holdings and the Unrestricted Subsidiaries.
The Company’s liquidity pool is expected to be available to cover expected cash outflows in a stressed liquidity environment including:
• The repayment of all unsecured debt of Holdings and the Unrestricted Subsidiaries maturing within twelve months.
• The drawdown of commitments to extend credit made by Holdings and the Unrestricted Subsidiaries based on an analysis of the probability of such drawdown (see “Summary of Contractual Obligations and Commitments—Lending-Related Commitments” on page 53).
• Additional collateralization of derivative contracts and other secured funding arrangements by Holdings and the Unrestricted Subsidiaries to counterparties that would be required in the event of a lowering of debt ratings (see “Credit Ratings” on page 52).
47
• Continuing equity repurchases to offset the dilutive effect of the Company’s employee incentive plans (see “Stock Repurchase Plan” on page 52) and anticipated debt repurchases.
These projected outflows are re-assessed weekly and as they change, management adjusts the size requirement for the liquidity pool.
The liquidity of the Restricted Subsidiaries is separately managed to comply with their applicable liquidity and capital requirements and to minimize dependence on Holdings and the Unrestricted Subsidiaries.
Long-Term Funding Sources and Requirements Cash capital is the metric used by management to assess the long-term funding sources and requirements of the Company as a whole. The Company’s policy is to operate with an excess of long-term funding sources over its consolidated long-term funding requirements.
In 2003, the Company added materially to its cash capital sources (i.e., total stockholders’ equity, preferred securities subject to mandatory redemption and long-term debt excluding current portion, other liabilities with remaining terms greater than one year and deposit liabilities at the Company’s banking institutions, Lehman Brothers Bank, FSB (“LBB”) and Lehman Brothers Bank AG (“LBBAG”), which are considered to be core in nature). The Company also considers the undrawn portion of its committed facilities at Holdings and LBBAG as a source of cash capital (see “Credit Facilities” on page 51).
At November 30, 2003, the Company had raised more than $64 billion of cash capital across all its legal entities—the majority of it through long-term debt. Sources of cash capital at November 30 were as follows:
CASH CAPITAL SOURCES
IN BILLIONS
NOVEMBER 30 | | 2003 | | 2002 | |
| | | | | |
Total stockholders’ equity and preferred securities subject to mandatory redemption | | $ | 14 | | $ | 10 | |
Long-term debt, excluding current portion | | 36 | | 31 | |
Deposit liabilities at LBB and LBBAG | | 8 | | 3 | |
Other long-term secured obligations | | 4 | | 4 | |
Undrawn portion of unsecured committed facilities at Holdings and LBBAG | | 2 | | 1 | |
Total cash capital sources | | $ | 64 | | $ | 49 | |
Cash capital is used to fund the following long-term funding requirements:
• Less liquid assets, such as fixed assets and goodwill.
• Less liquid inventory, such as high yield loans, private equity investments, commercial mortgages and certain real estate positions.
• Unencumbered inventory irrespective of collateral quality.
• Secured funding “haircuts” (i.e., the difference between the market value of the available inventory and the value of cash advanced to the Company by counterparties against that inventory).
• Operational cash deposited by the Company at banks.
• Liquid investments held to fund certain projected cash outflow as described in “Liquidity Pool” on page 47. These investments are managed as part of the Liquidity Pool.
The Company also utilizes LBB and LBBAG to fund certain asset classes such as mortgage products and selected loan assets. These entities operate in a deposit-protected environment and are able to source low-cost unsecured funds that generally are insulated from a Company or market-specific event, thereby providing a reliable funding source for these asset classes.
48
At November 30, 2003, the Company had an $11 billion cash capital surplus across all legal entities. Cash capital sources and uses at November 30 are as follows:
CASH CAPITAL SURPLUS
IN BILLIONS
NOVEMBER 30 | | 2003 | | 2002 | |
| | | | | |
Cash capital sources | | $ | 64 | | $ | 49 | |
Cash capital uses: | | | | | |
Trading and trading-related assets | | 42 | | 35 | |
Non-trading assets | | 11 | | 8 | |
Total cash capital uses | | 53 | | 43 | |
Cash capital surplus | | $ | 11 | | $ | 6 | |
Cash capital surplus, which is part of the various liquidity pools of the Company, increased $5 billion in 2003 from $6 billion to $11 billion. Of the $11 billion in cash capital surplus, $6 billion is available to Holdings and its Unrestricted Subsidiaries. The Company targets maintaining a cash capital surplus available to Holdings and its Unrestricted Subsidiaries of not less than $2 billion.
Reliable Secured Funding Capacity The Company takes what management believes is a conservative approach to secured funding by depending on it only to the extent it is reliable in all market environments. The Company regularly performs a detailed assessment of its secured funding capacity by asset class and by counterparty to determine how much is reliable in a stressed liquidity environment. Reliable secured funding capacity is usually set at a significant discount to normal funding capacity. In particular, less liquid inventory such as high yield loans and commercial mortgages are funded entirely with cash capital—any short-term secured funding that might exist for these asset classes in a normal market environment is not considered to be reliable.
The Company has developed and regularly updates its Contingency Funding Plan, which represents a detailed action plan to manage a stressed liquidity event, including a communication plan for creditors, investors and clients during a funding crisis.
The liquidity policies and funding strategy discussed above have enabled the Company to build a strong liquidity position, which has played an important role in the narrowing of its credit spreads relative to its major competitors and in its credit ratings being raised by rating agencies. (See “Credit Ratings” on page 52).
Funding and Capital Resources
TOTAL CAPITAL
IN MILLIONS
NOVEMBER 30 | | 2003 | | 2002 | |
| | | | | |
Long-term debt: | | | | | |
Senior notes | | $ | 41,303 | | $ | 36,283 | |
Subordinated indebtedness | | 2,226 | | 2,395 | |
Subtotal | | 43,529 | | 38,678 | |
Preferred securities subject to mandatory redemption | | 1,310 | | 710 | |
Stockholders’ equity: | | | | | |
Preferred stockholders’ equity | | 1,045 | | 700 | |
Common stockholders’ equity | | 12,129 | | 8,242 | |
Subtotal | | 13,174 | | 8,942 | |
Total Capital | | $ | 58,013 | | $ | 48,330 | |
The Company’s Total Capital (defined as long-term debt, preferred securities subject to mandatory redemption and total stockholders’ equity) increased 20% to $58.0 billion at November 30, 2003 compared with $48.3 billion at November 30, 2002. The Company believes Total Capital is useful to investors as a measure of the Company’s financial strength because it aggregates the Company’s long-term funding sources. The increase in Total Capital principally resulted from a net increase in long-term debt and increased equity from the retention of earnings and the issuance of common stock to acquire Neuberger.
The Company actively manages long-term debt to minimize refinancing risk and investor concentration. The Company sets limits for the amount maturing over any three, six and twelve month horizon at 10%, 15% and 25% of outstanding long-term debt, respectively—that is, $4.4 billion, $6.5 billion and $10.9 billion, respectively, at November 30, 2003. The Company seeks to diversify its creditor base when issuing unsecured debt. The quarterly long-term debt maturity schedule over the next five years at November 30, 2003 is as follows:
49
LONG-TERM DEBT MATURITY PROFILE
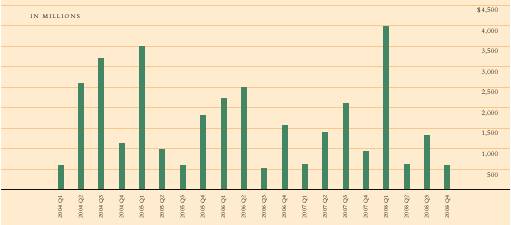
During 2003, the Company issued $13,193 million in senior long-term debt securities and $190 million of subordinated long-term debt, which was $3,246 million in excess of maturing debt securities consisting of $9,815 million of senior notes and $322 million of subordinated notes. Long-term debt increased to $43.5 billion at November 30, 2003 from $38.7 billion at November 30, 2002 with a weighted-average maturity of 3.9 years at November 30, 2003 and 4.0 years at November 30, 2002.
In addition, the Company issued $345 million of 6.50% Cumulative Preferred Stock in 2003. Holdings may redeem the preferred stock on or after August 31, 2008. For additional information see Note 13 to the Consolidated Financial Statements. Also in 2003, the Company formed two trusts to issue $600 million of 6.38% preferred securities subject to mandatory redemption, maturing in 2052 and redeemable beginning in 2008. See Note 12 to the Consolidated Financial Statements for additional information about Preferred securities subject to mandatory redemption.
TOTAL CAPITAL
50
Credit Facilities
Holdings maintains a revolving credit agreement (the “Credit Agreement”) with a syndicate of banks. Under the Credit Agreement, the banks have committed to provide up to $1 billion through April 2005. The Credit Agreement contains covenants that require, among other things, that the Company maintain a specified level of tangible net worth. The Company also maintains a $750 million multi-currency revolving credit facility for LBBAG (the “Facility”). The Facility has a term of 364 days expiring in October 2004, with an option to extend payment for an additional 364 days. There were no borrowings outstanding under either the Credit Agreement or the Facility at November 30, 2003, although drawings have been made under both and repaid from time to time during the year. The Company has maintained compliance with the applicable covenants for both the Credit Agreement and the Facility at all times.
Cash Flows
The Company generated cash from operating activities of $2,547 million in 2003, as cash from earnings and operating assets and liabilities exceed cash utilized in secured financing activities. During 2003 the Company increased cash by $4,223 million overall as cash flows from operating and financing activities of $5,331 million, exceed cash utilized in investing activities of $1,108 million.
During 2002 the Company increased cash by $1,138 million as cash flows from operating activities of $6,017 million exceed cash utilized in financing and investing activities of $4,344 million and $535 million, respectively. During 2001 the Company utilized cash of $2,599 million as cash utilized in financing activities and investing activities of $1,559 million and $1,341 million, respectively, exceed cash provided by operating activities of $301 million.
Balance Sheet and Financial Leverage
Assets The Company’s balance sheet consists primarily of cash and cash equivalents, securities and other inventory positions owned, and collateralized financing agreements. The liquid nature of these assets provides the Company with flexibility in financing and managing its business. The majority of these assets are funded on a secured basis through collateralized financing agreements.
The Company’s total assets increased to $312 billion at November 30, 2003 from $260 billion at November 30, 2002. However, the Company believes net assets is a more meaningful measure when comparing companies in the securities industry because it excludes certain assets considered to have a low risk profile (securities purchased under agreements to resell, securities borrowed, and the collateral received recognized in inventory pursuant to Statement of Financial Accounting Standards No. 140, “Accounting for Transfers and Servicing of Financial Assets and Extinguishments of Liabilities—a replacement of SFAS No. 125” (“SFAS 140”), as well as goodwill and other identifiable intangible assets). This definition of net assets is used by many of the Company’s creditors and a leading rating agency to evaluate companies in the securities industry. Under this definition, net assets were $166 billion and $143 billion at November 30, 2003 and 2002, respectively, as follows:
NET ASSETS
IN MILLIONS | | | | | |
NOVEMBER 30 | | 2003 | | 2002 | |
| | | | | |
Total assets | | $ | 312,061 | | $ | 260,336 | |
Securities purchased under agreements to resell | | (87,416 | ) | (94,341 | ) |
Securities borrowed | | (51,396 | ) | (20,497 | ) |
Collateral received recognized in inventory pursuant to SFAS 140 | | (3,406 | ) | (1,994 | ) |
Identifiable intangible assets and goodwill | | (3,561 | ) | (213 | ) |
Net assets | | $ | 166,282 | | $ | 143,291 | |
The Company’s net assets consist primarily of inventory necessary to facilitate customer flow activities. As such, the Company’s mix of net assets is subject to change depending principally on customer demand. In addition, due to the nature of the Company’s customer flow activities and based on the Company’s business outlook, the overall size of the Company’s balance sheet will fluctuate from time to time and, at specific points in time, may be higher than the year-end or quarter-end amounts.
The $51.7 billion increase in gross assets at November 30, 2003 was primarily due to an increase in secured financing activities. Net assets at November 30, 2003 increased $23.0 billion compared with 2002, primarily due to the increase in the level of government and agency securities, mortgages and mortgage-backed securities, corporate debt and cash and cash equivalents.
51
Leverage Ratios Balance sheet leverage ratios are one measure used to evaluate the capital adequacy of a company. Gross leverage ratios are calculated as total assets divided by total stockholders’ equity. The Company’s gross leverage ratios were 23.7x and 29.1x at November 30, 2003 and 2002, respectively. However, the Company believes net leverage based on net assets as defined above (which excludes certain assets considered to have a low risk profile) divided by tangible equity capital, to be a more meaningful measure of leverage in evaluating companies in the securities industry. The Company believes tangible equity capital to be a more representative measure of the Company’s equity for purposes of calculating net leverage because the Company does not view the amount of equity used to support goodwill and other identifiable intangible assets as available to support the Company’s net assets. This definition of net leverage is used by many of the Company’s creditors and a leading rating agency. Tangible equity capital and net leverage are computed as follows at November 30, 2003 and 2002:
IN MILLIONS | | | | | |
NOVEMBER 30 | | 2003 | | 2002 | |
| | | | | |
Total stockholders’ equity | | $ | 13,174 | | $ | 8,942 | |
Preferred securities subject to mandatory redemption (subject to limitation)(1) | | 1,068 | | 710 | |
Identifiable intangible assets and goodwill | | (3,561 | ) | (213 | ) |
Tangible equity capital | | $ | 10,681 | | $ | 9,439 | |
Net leverage | | 15.6 | x | 15.2 | x |
(1) Under the definition of tangible equity capital used by a leading rating agency, the maximum equity credit given to preferred securities subject to mandatory redemption is 10% of tangible equity capital (preferred securities are included in calculation to determine the limit). In October 2003, in view of the favorable market conditions, the Company issued $300 million of preferred securities subject to mandatory redemption at 6.375% in anticipation of calling $325 million of preferred securities subject to mandatory redemption at 8% in March 2004, thereby lowering interest expense for the Company over the long run.
Net assets, tangible equity capital and net leverage are not necessarily comparable to similarly titled measures provided by other companies because of different methods of calculation.
Stock Repurchase Plan
The management of equity is a critical aspect of capital management in any business. The determination of the appropriate amount of equity is affected by a wide number of factors. The primary factor is the amount of “risk equity” that the businesses require, although other factors, such as rating agency considerations and balance sheet leverage, will also affect the determination. Equity requirements are constantly changing and the Company’s Risk Management Group monitors the Firm’s risk requirements on an active basis.
The principal purpose of the Firm’s stock repurchase program is to substantially offset the dilutive effect of employee equity-based compensation. In addition, the Firm may repurchase shares representing “surplus equity” (equity not being utilized by the businesses or required by the Firm for risk equity or other strategic purposes). The repurchase program is effected through regular open-market purchases.
During 2003, the Company repurchased approximately 23.1 million shares of Holdings common stock at an aggregate cost of approximately $1,508 million. The Company repurchased approximately 5.0 million, 4.5 million, 4.3 million and 9.3 million shares in the first, second, third and fourth quarters of 2003, respectively. The average price paid per share for repurchased shares in the first, second, third and fourth quarters was $54.74, $61.10, $67.26 and $71.81, respectively. For 2004, the Board of Directors has authorized the repurchase of approximately 26.7 million shares of common stock to offset projected 2004 dilution and, subject to market conditions, up to an additional 35.1 million shares, primarily for the possible acceleration of projected 2005 requirements to offset dilution, as well as to manage the Company’s common equity position.
Credit Ratings
The Company, like other companies in the securities industry, relies on external sources to finance a significant portion of its day-to-day operations. The cost and availability of unsecured financing generally are dependent on the Company’s short-term and long-term credit ratings. Factors that may be significant to the determination of the Company’s credit ratings or otherwise affect the ability of the Company to raise short-term and long-term financing include its profit margin, its earnings trend and volatility, its cash liquidity and liquidity management, its capital structure, its risk level and risk management, its geographic and business diversification, and its relative positions in the markets in which it operates. A deterioration in any of the previously mentioned factors or combination of these factors may lead rating agencies to downgrade the credit ratings of the Company, thereby increasing the cost to the Company of, or possibly limiting the access of the Company
52
to, certain types of unsecured financings and triggering additional collateral requirements in derivative contracts and other secured funding arrangements. In addition, the Company’s debt ratings can impact certain capital markets revenues, particularly in those businesses where longer-term counterparty performance is critical, such as over-the-counter (“OTC”) derivative transactions, including credit derivatives and interest rate swaps.
At November 30, 2003, the Company would be required to post additional collateral pursuant to derivative contracts and other secured funding arrangements of approximately $658 million in the event the Company were to experience a downgrade of its senior debt rating of one notch.
At November 30, 2003, the short- and long-term debt ratings of Holdings and Lehman Brothers Inc. (“LBI”) were as follows:
CREDIT RATINGS
| | Holdings | | LBI | |
| | Short-
term | | Long-
term | | Short-
term | | Long-
term** | |
| | | | | | | | | |
Fitch Ratings | | F-1 | | A+ | | F-1 | | A+/A | |
Moody’s Investors Service(1) | | P-1 | | A1 | | P-1 | | Aa3*/A1 | |
Standard & Poor’s Ratings Services | | A-1 | | A | | A-1 | | A+*/A | |
* Provisional ratings on shelf registration.
** Senior/subordinated.
(1) On October 22, 2003, Moody’s raised the long-term rating of Holdings and LBI from A2 to A1 and from A1 to Aa3, respectively. Since 1999, Moody’s has raised the long-term ratings of Holdings and LBI three times; from Baa1 to A1 and from A3 to Aa3, respectively.
In the normal course of business, the Company enters into various commitments and guarantees, including lending commitments to high grade and high yield borrowers, private equity investment commitments, liquidity commitments and other guarantees. In all instances, the Company marks-to-market these commitments and guarantees, with changes in fair value recognized in Principal transactions revenue.
Lending-Related Commitments In connection with its financing activities, the Company had outstanding commitments under certain collateralized lending arrangements of approximately $5.0 billion and $1.5 billion at November 30, 2003 and 2002, respectively. These commitments require borrowers to provide acceptable collateral, as defined in the agreements, when amounts are drawn under the lending facilities. Advances made under these lending arrangements are typically at variable interest rates and generally provide for over-collateralization based on the borrowers’ creditworthiness. In addition, at November 30, 2003, the Company had commitments to enter into forward starting secured resale and repurchase agreements, principally secured by government and government agency collateral, of $78.4 billion and $46.2 billion, respectively, compared with $89.9 billion and $50.3 billion, respectively, at November 30, 2002.
The Company, through its high grade and high yield sales, trading and underwriting activities, makes commitments to extend credit in loan syndication transactions. The Company uses various hedging and funding strategies to actively manage its market, credit and liquidity exposures on these commitments. In addition, total commitments are not indicative of actual risk or funding requirements, as the commitments may not be drawn or fully used. These commitments and any related draw downs of these facilities, typically have fixed maturity dates and are contingent upon certain representations, warranties and contractual conditions applicable to the borrower.
The Company had credit risk associated with lending commitments to investment grade borrowers (after consideration of credit risk hedges) of $3.0 billion and $3.2 billion at November 30, 2003 and 2002, respectively. In addition, the Company had credit risk associated with lending commitments to non-investment grade borrowers (after consideration of credit risk hedges) of $2.6 billion and $1.7 billion at November 30, 2003 and 2002, respectively. Before consideration of credit risk hedges, the Company had commitments to investment and non-investment grade borrowers of $8.1 billion and $2.9 billion at November 30, 2003, respectively, compared with $7.1 billion and $1.8 billion at November 30, 2002, respectively. The Company had available undrawn borrowing facilities with third parties of approximately $5.1 billion and $5.2 billion at November 30, 2003 and 2002, respectively, which can be drawn upon to provide funding for these commitments. These funding facilities contain limits for certain concentrations of counterparty, industry or credit ratings of the underlying loans.
In addition, the Company provided high yield contingent commitments related to acquisition financing of approximately $2.5 billion and $2.8 billion at November 30, 2003 and 2002, respectively. The Company’s intent is, and its past practice has been, to sell down significantly all the credit risk associated with these loans, if closed, through loan syndications consistent with the Company’s credit facilitation framework. These commitments are not indicative of the Company’s actual risk because the borrower often will raise funds in the capital markets instead of drawing on the Company’s commitment. Additionally, the borrower’s ability to draw is subject to there being no material adverse change in either market conditions or the borrower’s financial condition, among other factors. These commitments contain certain flexible pricing features to adjust for changing market conditions prior to closing.
53
At November 30, 2003 the Company had outstanding mortgage loan commitments of approximately $3.1 billion, including $2.6 billion of residential mortgages and $0.5 billion of commercial mortgages. These commitments require the Company to transact mortgage loans generally within 90 days at fixed and variable interest rates. The Company intends to sell such loans, once originated, through securitization.
Aggregate lending related commitments at November 30, 2003, before consideration of hedges, by maturity are as follows:
LENDING - - RELATED COMMITMENTS
| | Total | | Amount of Commitment Expiration Per Period | |
IN MILLIONS
NOVEMBER 30, 2003 | | Contractual
Amount | | Less than
1 Year | | 1-3
Years | | 4-5
Years | | After 5
Years | |
| | | | | | | | | | | |
Lending commitments: | | | | | | | | | | | |
High grade | | $ | 8,137 | (1) | $ | 4,615 | | $ | 2,911 | | $ | 611 | | $ | — | |
High yield | | 2,857 | (2) | 889 | | 938 | | 566 | | 464 | |
Mortgage commitments | | 3,121 | | 3,121 | | — | | — | | — | |
Contingent acquisition facilities | | 2,549 | | 2,549 | | — | | — | | — | |
Secured lending transactions, including forward starting resale and repurchase agreements | | 129,625 | | 119,445 | | 9,256 | | 140 | | 784 | |
| | | | | | | | | | | | | | | | |
(1) The Company views its net credit exposure for high grade commitments, after consideration of hedges, to be $3.0 billion.
(2) The Company views its net credit exposure for high yield commitments, after consideration of hedges, to be $2.6 billion.
For additional information see Note 11 to the Consolidated Financial Statements.
Other Commitments and Guarantees In accordance with Financial Accounting Standards Board (“FASB”) Interpretation (“FIN”) No. 45, “Guarantor’s Accounting and Disclosure Requirements for Guarantees Including Indirect Guarantees of Indebtedness of Others” (“FIN 45”) the Company is required to recognize certain guarantee contracts at the inception of such guarantee contract at fair value. The Company has followed a long-standing policy of recording guarantees, including derivative guarantees, at fair value and, accordingly, the adoption of FIN 45 did not affect the Company’s financial position or results of operations. In accordance with FIN 45, the Company also is required to disclose certain guarantees, including derivative contracts that require the Company to make payments to a counterparty based on changes on an underlying instrument or index (e.g., security prices, interest rates, and currency rates). Derivatives that meet the FIN 45 definition of a guarantee include credit default swaps, written put options, written foreign exchange options and written interest rate caps and floors. Under FIN 45, derivatives are not considered guarantees if such contracts are cash settled and the Company has no basis to determine whether it is probable the derivative counterparty held the related underlying instrument. Accordingly, if these conditions are met, the Company has not included such derivative contracts in the table on page 55.
At November 30, 2003, the maximum payout value of derivative contracts deemed to meet the FIN 45 definition of a guarantee was approximately $322 billion. For purposes of determining maximum payout, notional values were used; however, the Company believes the fair value of these contracts is a more relevant measure of these obligations. At November 30, 2003, the fair value of such derivative contracts approximated $9 billion. The Company believes the notional amounts greatly overstate the Company’s expected payout. For a discussion of the valuation of derivative contracts, see “Critical Accounting Policies and Estimates—Derivatives” on page 62. In addition, all amounts included above are before consideration of hedging transactions. These derivative contracts are generally highly liquid and the Company has substantially mitigated its risk on these contracts through hedges, such as other derivative contracts and/or cash instruments. The Company manages risk associated with derivative guarantees consistent with the Company’s global risk management policies. The Company records derivative contracts, including those considered to be guarantees under FIN 45, at fair value with related gains/losses recognized in Principal transactions revenue. See “Risk Management—Market Risk” and “Critical Accounting Policies and Estimates—Fair Value” on page 59 and 61, respectively.
54
At November 30, 2003, the Company had liquidity commitments of approximately $5.1 billion related to trust certificates backed by investment grade municipal securities compared with $4.4 billion at November 30, 2002. The Company’s obligations under such liquidity commitments generally are less than one year and are further limited because the Company’s obligations cease if the underlying assets are downgraded below investment grade or default.
At November 30, 2003 and 2002 the Company was contingently liable for $913 million and $835 million, respectively, of letters of credit, primarily used to provide collateral for securities and commodities borrowed and to satisfy margin deposits at option and commodity exchanges.
At November 30, 2003 and 2002 the Company had private equity commitments of approximately $382 million and $672 million, respectively. The Company’s private equity commitment of $382 million at November 30, 2003 will be funded as required through the end of the respective investment periods. In addition, the Company was committed to invest up to $170 million in an energy-related principal investment at November 30, 2003.
In the normal course of business, the Company provides guarantees to securities clearinghouses and exchanges. These guarantees are generally required under the standard membership agreements, such that members are required to guarantee the performance of other members. To mitigate these performance risks, the exchanges and clearinghouses often require members to post collateral. The Company’s obligation under such guarantees could exceed the collateral amounts posted; however, the potential for the Company to be required to make payments under such guarantees is deemed remote.
In connection with certain asset sales and securitization transactions, the Company often makes representations and warranties about the assets conforming to specified guidelines. If it is later determined the underlying assets fail to conform to the specified guidelines, the Company may have an obligation to repurchase the assets or indemnify the purchaser against any losses. To mitigate these risks, to the extent the assets being securitized may have been originated by third parties, the Company seeks to obtain appropriate representations and warranties from these third parties upon acquisition of such assets.
Other commitments and guarantees at November 30, 2003 are as follows:
COMMITMENTS AND GUARANTEES
| | Notional/ | | Amount of Commitment Expiration Per Period | |
IN MILLIONS
NOVEMBER 30, 2003 | | Maximum
Payout | | Less than
1 Year | | 1–3
Years | | 4–5
Years | | After 5
Years | |
| | | | | | | | | | | |
Derivative contracts | | $ | 321,550 | | $ | 66,013 | | $ | 76,639 | | $ | 38,400 | | $ | 140,498 | |
Municipal-securities-related liquidity commitments | | 5,130 | | 3,186 | | 42 | | 94 | | 1,808 | |
Other commitments and guarantees associated with other special purpose entities | | 2,510 | | 750 | | 346 | | 603 | | 811 | |
Standby letters of credit | | 913 | | 906 | | 7 | | — | | — | |
Private equity and other principal investment commitments | | 552 | | 212 | | 340 | | — | | — | |
| | | | | | | | | | | | | | | | |
Contractual obligations at November 30, 2003 are as follows:
| | | | Amount of Obligation Expiration per Period | |
IN MILLIONS
NOVEMBER 30, 2003 | | Total | | Less than
1 Year | | 1–3
Years | | 4–5
Years | | After 5
Years | |
| | | | | | | | | | | |
Operating lease obligations | | $ | 2,166 | | $ | 185 | | $ | 509 | | $ | 312 | | $ | 1,160 | |
Capital lease obligations | | 2,661 | | — | | 161 | | 134 | | 2,366 | |
Long-term debt maturities | | 43,529 | | 7,644 | | 18,787 | | 8,810 | | 8,288 | |
| | | | | | | | | | | | | | | | |
55
In the normal course of business, the Company enters into derivative transactions both in a trading capacity and as an end-user.
As an end-user, the Company uses derivative products to adjust the interest rate nature of its funding sources from fixed to floating interest rates and to change the index upon which floating interest rates are based (e.g., Prime to LIBOR) (collectively, “End-User Derivative Activities”). For additional information see Note 3 to the Consolidated Financial Statements.
The Company uses derivative products in a trading capacity as a dealer to satisfy the financial needs of clients and in each of its trading businesses (collectively, “Trading-Related Derivative Activities”). In this capacity the Company transacts extensively in derivatives including interest rate, credit (both single name and portfolio), foreign exchange and equity derivatives. The Company’s use of derivative products in its trading businesses is combined with transactions in cash instruments to allow for the execution of various trading strategies.
The Company conducts its derivative activities through a number of wholly-owned subsidiaries. The Company’s fixed income derivative products business is conducted through its subsidiary, Lehman Brothers Special Financing Inc., and separately capitalized “AAA” rated subsidiaries, Lehman Brothers Financial Products Inc. and Lehman Brothers Derivative Products Inc. The Company’s equity derivative product business is conducted through Lehman Brothers Finance S.A. In addition, as a global investment bank, the Company also is a market maker in a number of foreign currencies and actively trades in the global commodity markets. Counterparties to the Company’s derivative product transactions are primarily financial intermediaries (U.S. and foreign banks), securities firms, corporations, governments and their agencies, finance companies, insurance companies, investment companies and pension funds. The Company manages the risks associated with derivatives on an aggregate basis, along with the risks associated with its non-derivative trading and market-making activities in cash instruments, as part of its firmwide risk management policies. The Company uses industry standard derivative contracts whenever appropriate.
See Notes 1 and 3 to the Consolidated Financial Statements for a description of the Company’s accounting policies and further discussion of the Company’s Trading-Related Derivative Activities.
Other Off-Balance Sheet Arrangements
Operating Companies FASB Interpretation No. 46, Consolidation of Variable Interest Entities — an interpretation of ARB No. 51, (“FIN 46”), which was issued in January 2003, defines the criteria necessary to be considered an operating company for which the consolidation accounting guidance of SFAS 94, Consolidation of All Majority-Owned Subsidiaries (“SFAS 94”), should be applied. SFAS 94 is a control-based model and requires consolidation for those entities in which the Company has a controlling financial interest. The usual condition for a controlling financial interest is ownership of a majority of the voting interest in an entity. FIN 46 prohibits an entity from being considered an operating company and applying the provisions of SFAS 94 if such entity does not have the characteristics of a controlling financial interest or does not have sufficient legal equity at risk for the entity to finance its activities without additional subordinated financial support from other parties. Accordingly, the Company consolidates operating companies in which it has a controlling financial interest. Operating companies in which the Company holds a non-controlling interest are accounted for under the equity method when the Company is able to exercise significant influence over the business activities of such entities. Significant influence is generally deemed to exist when the Company owns 20% to 50% of the voting equity of a corporation or when the Company holds at least 3% of a limited partnership interest. The cost method is applied when the ability to exercise significant influence is not present.
Special Purpose Entities Special purpose entities (“SPEs”) are corporations, trusts or partnerships that are established for a limited purpose. SPEs by their nature generally do not provide equity owners with significant voting powers because the SPE documents govern all material decisions. The Company’s primary involvement with SPEs relates to securitization transactions in which transferred assets, including mortgages, loans, receivables and other assets, are sold to an SPE and repackaged into securities (i.e., securitized). SPEs also may be used by the Company to create securities with a unique risk profile desired by investors and as a means of intermediating financial risk. In the normal course of business, the Company establishes SPEs, sells assets to SPEs, underwrites, distributes, and makes a market in securities issued by SPEs, transacts derivatives with SPEs, owns securities or residual interests in SPEs, and provides liquidity or other guarantees for SPEs.
The Company accounts for the transfers of financial assets, including transfers to SPEs, in accordance with SFAS 140. In accordance with this guidance, the Company recognizes transfers of financial assets as sales provided control has been relinquished. Control is deemed to be relinquished only when all of the following conditions have been met: (i) the assets have been isolated from the transferor, even in bankruptcy or other receivership (true sale opinions are required); (ii) the transferee has the right to pledge or exchange the assets received and (iii) the transferor has not maintained effective control over the transferred assets (e.g., a unilateral ability to repurchase a unique or specific asset). Therefore, in accordance with this guidance, the Company derecognizes financial assets transferred in securitizations provided the Company has relinquished control over such assets.
56
There are two types of SPE’s including qualifying special purpose entities (“QSPEs”) or variable interest entities (“VIEs”). The majority of the Company’s involvement with SPEs relates to securitization transactions meeting the SFAS 140 definition of a QSPE. A QSPE can generally be described as an entity with significantly limited powers that are intended to limit it to passively holding financial assets and distributing cash flows based on pre-set terms. Under SFAS 140 the Company is not required to, and does not, consolidate QSPEs. Rather, the Company accounts for its involvement with QSPEs under a financial components approach in which the Company recognizes only its retained involvement with the QSPE. The Company accounts for such retained interests at fair value with changes in fair value reported in earnings. FIN 46 does not alter the accounting for involvement with QSPEs.
The Company is a market leader in mortgage (both residential and commercial), municipal and other asset-backed securitizations that are principally transacted through QSPEs. The Company securitized approximately $173 billion of financial assets during 2003, including $138 billion of residential mortgages, $10 billion of commercial mortgages and $25 billion of other asset-backed financial instruments. At November 30, 2003, the Company had approximately $1.0 billion of non-investment grade retained interests from its securitization activities. Retained interests are recorded in Securities and other inventory positions owned on the Consolidated Statement of Financial Condition and primarily represent junior interests in commercial and residential securitization transactions. The Company records its trading assets, including retained interests, at fair value with related gains or losses recognized in Principal transactions in the Consolidated Statement of Income. For additional information see Note 4 to the Consolidated Financial Statements.
Certain SPEs do not meet the QSPE criteria due to their permitted activities not being sufficiently limited, or because the assets are not deemed qualifying financial instruments (e.g., real estate). Under FIN 46, the Company is required to consolidate a VIE if it is deemed to be the primary beneficiary of such entity. A VIE is an entity which lacks sufficient legal equity to absorb the entity’s expected losses (presumed to require minimum 10% equity), or for which the equity holders do not have substantive voting rights or do not participate substantively in the gains and losses of such entities. The primary beneficiary is the party that has either a majority of the expected losses or a majority of the expected residual returns of such entity, as defined. FIN 46 is effective for the Company’s involvement with VIEs created after January 31, 2003. With respect to the Company’s involvement with SPEs established prior to February 1, 2003, the Company follows the accounting guidance provided by EITF Topic D-14, Transactions involving Special-Purpose Entities, to determine whether consolidation is required. Under this guidance, the Company is not required to, and does not consolidate such SPE if a third party investor made a substantive equity investment in the SPE (minimum of 3%), was subject to first dollar risk of loss of such SPE, and had a controlling financial interest. Examples of the Company’s involvement with such VIEs include: collateralized debt obligations (“CDOs”), synthetic credit transactions, and other structured financing transactions.
With respect to CDO transactions in which a diversified portfolio of securities and/or loans is owned by a SPE and managed by an independent asset manager, the Company’s role is principally limited to acting as structuring and placement agent, warehouse provider, underwriter and market maker in the related CDO securities. In a typical CDO, at the direction of a third-party asset manager, the Company will warehouse securities or loans on its balance sheet, pending the transfer to the SPE once the permanent financing is completed in the capital markets. During 2003, the Company acted as warehouse provider and underwriter for approximately $601 million of CDO transactions. At November 30, 2003, the Company did not have any significant continuing involvement in the CDOs arranged by the Company other than acting as market maker (i.e., holding minority amounts of investment grade securities purchased in the secondary markets for short time periods) and, as such, the Company is not required to consolidate these transactions. At November 30, 2003 the Company’s holdings of subordinated classes in such CDO transactions was not material.
The Company is a dealer in credit default swaps and, as such, makes a market in buying and selling credit protection on single issuers as well as on portfolios of credit exposures. One of the mechanisms used by the Company to mitigate credit risk is synthetic credit transactions entered into with SPEs. In these transactions, the Company purchases credit protection in the form of a credit default swap from the SPE on referenced obligations (single issuer or portfolio). The Company pays a premium to the SPE for this protection and is secured by high quality collateral purchased by the SPE. Third-party investors in these SPEs are subject to default risk associated with the referenced obligations under the default swap as well as credit risk to the assets held by the SPE. The Company’s maximum loss associated with its involvement with such synthetic credit transactions is the fair value of the Company’s credit default swaps with such SPEs, which approximated $229 million at November 30, 2003. While this amount represents the maximum amount the Company could potentially lose on such agreements the maximum loss is highly unlikely because the value of the underlying collateral held by the SPEs was $6.6 billion and was investment grade quality. Because the results of the Company’s expected loss calculations demonstrate that the investors in the SPEs bear a majority of the entity’s expected losses (because the investors assume default risk associated with both the reference portfolio
57
and the SPEs’ assets), the Company is not deemed to be the primary beneficiary of these transactions and as such does not consolidate such SPEs under FIN 46.
The Company also enters into certain structured financing transactions with SPEs to facilitate customers’ investment and/or funding needs. The Company’s involvement in these transactions is generally limited to providing liquidity or other limited downside protection to investors. In this regard, the Company provided liquidity protection to SPEs of approximately $0.7 billion and $3.3 billion as of November 30, 2003 and 2002, respectively. The Company’s maximum loss associated with such commitments is $0.7 billion at November 30, 2003, however the Company believes its actual risk to be significantly less as these liquidity commitments are generally over-collateralized with investment grade collateral. The Company anticipates consolidating such entities in the first quarter of 2004 upon adoption of FIN 46. In addition, the Company also provides certain limited downside protection to investors in SPEs. The Company’s maximum loss under such commitments was approximately $1.8 billion and $1.6 billion at November 30, 2003 and 2002, respectively. As the investor in such SPE bears all upside potential and significant downside variability, the Company is not deemed to be the primary beneficiary of these entities and as such does not expect to consolidate upon adoption of FIN 46 in the first quarter of 2004. The Company believes its actual exposure to be significantly less than the maximum exposure disclosed above, as the Company’s obligations are collateralized by the SPEs’ assets and contain significant constraints under which such downside protection will be available.
In December 2003, the FASB issued a revised interpretation of FIN 46 that clarifies certain of the original interpretation’s provisions. While the Company has not yet completed its analysis of FIN 46 as revised, the Company does not anticipate that the adoption of the interpretation will have a material impact on the Company’s financial condition or its results of operations.
As a leading global investment banking company, risk is an inherent part of the Company’s businesses. Global markets, by their nature, are prone to uncertainty and subject participants to a variety of risks. The Company has developed policies and procedures to identify, measure and monitor each of the risks involved in its trading, brokerage and investment banking activities on a global basis. The principal risks to the Company are market, credit, liquidity, legal and operational risks. Risk management is considered to be of paramount importance in the Company’s day-to-day operations. Consequently, the Company devotes significant resources (including investments in personnel and technology) across all of its worldwide trading operations to the measurement, analysis and management of risk.
The Company seeks to reduce risk through the diversification of its businesses, counterparties and activities in geographic regions. The Company accomplishes this objective by allocating the usage of capital to each of its businesses, establishing trading limits and setting credit limits for individual counterparties, including regional concentrations. The Company seeks to achieve adequate returns from each of its businesses commensurate with the risks they assume. Nonetheless, the effectiveness of the Company’s policies and procedures for managing risk exposure can never be completely or accurately predicted or fully assured. For example, unexpectedly large or rapid movements or disruptions in one or more markets or other unforeseen developments can have an adverse effect on the Company’s results of operations and financial condition. The consequences of these developments can include losses due to adverse changes in inventory values, decreases in the liquidity of trading positions, higher volatility in the Company’s earnings, increases in the Company’s credit exposure to customers and counterparties and increases in general systemic risk.
Overall risk management policy is established at the Office of the Chairman level and begins with the Capital Markets Committee, which consists of the Chief Executive Officer, other members of the Company’s Executive Committee, the Global Head of Risk, the Chief Economist and Strategist as well as various other business heads. The Capital Markets Committee serves to frame the Company’s risk opinion in the context of the global market environment. The Company’s Risk Committee, which consists of the Chief Executive Officer, other members of the Executive Committee and the Global Head of Risk, meets weekly and reviews all risk exposures, position concentrations and risk taking activities.
The Global Risk Management Group (the “Group”) is independent of the trading areas and reports directly to the Office of the Chairman. The Group includes credit risk management, market risk management and operational risk management. Combining these disciplines facilitates the analysis of risk exposures, while leveraging personnel and information technology resources in a cost-efficient manner. The Group maintains staff in each of the Company’s regional trading centers and has daily contact with trading staff and senior management at all levels within the Company. These discussions include a review of trading positions and risk exposures.
Credit Risk
Credit risk represents the possibility a counterparty will be unable to honor its contractual obligations to the Company. Credit risk management is therefore an integral component of the Company’s overall risk management framework. The Credit Risk Management Department (“CRM Department”) has global responsibility for implementing the Company’s overall credit risk management framework.
The CRM Department manages the credit exposure related to trading activities by giving initial credit approval for counterparties,
58
establishing credit limits by counterparty, country and industry group, and by requiring collateral in appropriate circumstances. In addition, the CRM Department strives to ensure that master netting agreements are obtained whenever possible. The CRM Department also considers the duration of transactions in making its credit decisions, along with the potential credit exposure for complex derivative transactions. The CRM Department is responsible for the continuous monitoring and review of counterparty credit exposure and creditworthiness and recommending valuation adjustments, when appropriate. Credit limits are reviewed periodically to ensure they remain appropriate in light of market events or the counterparty’s financial condition. For additional information see Note 3 to the Consolidated Financial Statements.
Market Risk
Market risk represents the potential change in value of a portfolio of financial instruments due to changes in market rates, prices and volatilities. Market risk management also is an essential component of the Company’s overall risk management framework. The Market Risk Management Department (“MRM Department”) has global responsibility for implementing the Company’s overall market risk management framework. It is responsible for the preparation and dissemination of risk reports, developing and implementing the firm-wide Risk Management Guidelines, and evaluating adherence to these guidelines. These guidelines provide a clear framework for risk management decision making. To that end, the MRM Department identifies and quantifies risk exposures, develops limits and reports and monitors these risks with respect to the approved limits. The identification of material market risks inherent in positions includes, but is not limited to, interest rate, equity and foreign exchange risk exposures. In addition to these risks, the MRM Department also evaluates liquidity risks, credit and sovereign concentrations.
The MRM Department uses qualitative as well as quantitative information in managing trading risk, believing a combination of the two approaches results in a more robust and complete approach to the management of trading risk. Quantitative information is developed from a variety of risk methodologies based on established statistical principles. To ensure high standards of analysis, the MRM Department has retained seasoned risk managers with the requisite experience and academic and professional credentials.
Market risk is present in cash products, derivatives and contingent claim structures that exhibit linear as well as non-linear profit and loss sensitivity. The Company’s exposure to market risk varies in accordance with the volume of client-driven market-making transactions, the size of the Company’s proprietary positions, and the volatility of financial instruments traded. The Company seeks to mitigate, whenever possible, excess market risk exposures through the use of futures and option contracts and offsetting cash market instruments.
The Company participates globally in interest rate, equity and foreign exchange markets. The Company’s Fixed Income division has a broadly diversified market presence in U.S. and foreign government bond trading, emerging market securities, corporate debt (investment and non-investment grade), money market instruments, mortgages and mortgage- and asset-backed securities, real estate, municipal bonds and interest rate derivatives. The Company’s Equities division facilitates domestic and foreign trading in equity instruments, indices and related derivatives. The Company’s foreign exchange businesses are involved in trading currencies on a spot and forward basis as well as through derivative products and contracts.
The Company incurs short-term interest rate risk in the course of facilitating the orderly flow of customer transactions through the maintenance of government and high grade corporate bond inventories. Market making in high yield instruments exposes the Company to additional risk due to potential variations in credit spreads. Trading in international markets exposes the Company to spread risk between the term structure of interest rates in different countries. Mortgages and mortgage-related securities are subject to prepayment risk and changes in the level of interest rates. Trading in derivatives and structured products exposes the Company to changes in the level and volatility of interest rates. The Company actively manages interest rate risk through the use of interest rate futures, options, swaps, forwards and offsetting cash-market instruments. Inventory holdings, concentrations and agings are monitored closely and used by management to selectively hedge or liquidate undesirable exposures.
The Company is a significant intermediary in the global equity markets through its market making in U.S. and non-U.S. equity securities, including common stock, convertible debt, exchange-traded and OTC equity options, equity swaps and warrants. These activities expose the Company to market risk as a result of price and volatility changes in its equity inventory. Inventory holdings are also subject to market risk resulting from concentrations and changes in liquidity conditions that may adversely impact market valuation. Equity market risk is actively managed through the use of index futures, exchange-traded and OTC options, swaps and cash instruments.
The Company enters into foreign exchange transactions to facilitate the purchase and sale of non-dollar instruments, including equity and interest rate securities. The Company is exposed to foreign exchange risk on its holdings of non-dollar assets and liabilities. The Company is active in many foreign exchange markets and has exposure to the Euro, Japanese yen, British pound, Swiss franc and Canadian dollar, as well as a variety of developed and emerging market currencies. The Company hedges its risk exposures primarily through the use of currency forwards, swaps, futures and options.
If any of the strategies used to hedge or otherwise mitigate exposures to the various types of risks described above are not effective, the Company could incur losses. See Notes 1 and 3 to the Consolidated Financial Statements for further information regarding the Company’s use of derivative financial instruments to hedge interest rate, currency, security and commodity price and other market risks.
59
Operational Risk
Operational Risk is the risk of loss resulting from inadequate or failed internal processes, people and systems, or from external events. Operational Risk Management is responsible for implementing and maintaining the Company’s overall global operational risk management framework, which seeks to minimize these risks through assessing, reporting, monitoring and tracking operational risks.
The Company recognizes that maintaining its reputation among clients, investors, regulators and the general public is one important aspect of minimizing legal and operational risks. Maintaining the Company’s reputation depends on a large number of factors, including the selection of the Company’s clients and the conduct of its business activities. The Company seeks to maintain its reputation by screening potential investment banking clients and by conducting its business activities in accordance with high ethical standards.
Potential investment banking clients are screened through a multi-step process that begins with the individual business units and product groups. In screening clients, these groups undertake a comprehensive review of the client and its background and the potential transaction to determine, among other things, whether they pose any risks to the Company’s reputation. Following this initial review, potential clients and transactions are screened by the Lehman Brothers Investment Banking Commitment Committee, which is composed of senior members from various corporate and operating divisions of the Company. The Commitment Committee reviews the nature of the client and its business, the due diligence conducted by the business units and product groups, and the proposed terms of the transaction, in order to determine overall acceptability of the proposed transaction. In doing so, the Commitment Committee evaluates the appropriateness of the transaction for the Company, including a consideration of ethical and social responsibility issues and the potential effect of the transaction on the Company’s reputation.
Value-At-Risk
For purposes of Securities and Exchange Commission (“SEC”) risk disclosure requirements, the Company discloses an entity-wide value-at-risk for virtually all of its trading activities. In general, the Company’s value-at-risk measures potential loss of trading revenues at a given confidence level over a specified time horizon. Value-at-risk over a one-day holding period measured at a 95% confidence level implies the potential loss of daily trading revenue will be at least as large as the value-at-risk amount on one out of every 20 trading days.
The Company’s methodology estimates a reporting day value-at-risk using actual daily trading revenues over the previous 250 trading days. This estimate is measured as the loss, relative to the median daily trading revenue. The Company also estimates an average of daily value-at-risk measures over the reporting period.
Value-at-risk is one measurement of potential loss in trading revenues that may result from adverse market movements over a specified period of time with a selected likelihood of occurrence. As with all measures of value-at-risk, the Company’s estimate has substantial limitations due to its reliance on historical performance, which is not necessarily a predictor of the future. Consequently, this value-at-risk estimate is only one of a number of tools the Company uses in its daily risk management activities. The following table sets forth the daily value-at-risk for each component of market risk as well as total value-at-risk.
VALUE-AT-RISK
| | | | | | Year Ended November 30, 2003 | |
IN MILLIONS | | November 30, 2003 | | November 30, 2002 | | Average | | High | | Low | |
| | | | | | | | | | | |
Interest rate risk | | $ | 18.2 | | $ | 15.8 | | $ | 17.6 | | $ | 19.9 | | $ | 15.5 | |
Equity price risk | | 7.0 | | 8.0 | | 7.2 | | 8.7 | | 6.4 | |
Foreign exchange risk | | 3.7 | | 2.2 | | 2.9 | | 3.7 | | 2.2 | |
Diversification
benefit | | (7.2 | ) | (5.2 | ) | (5.8 | ) | | | | |
Total | | $ | 21.7 | | $ | 20.8 | | $ | 21.9 | | $ | 25.4 | | $ | 20.5 | |
The average, high and low values-at-risk for the year ended November 30, 2002 were $21.0 million, $23.4 million and $17.5 million, respectively. The increase in interest rate and foreign exchange risk at November 30, 2003 from November 30, 2002 reflects higher volatility in fixed income securities and foreign exchange markets, while the decrease in equity risk is primarily related to lower equity positions held for customer flow purposes.
Distribution of Daily Net Revenues
Substantially all of the Company’s inventory positions are marked-to-market daily with changes recorded in net revenues. The following chart sets forth the frequency distribution for daily net revenues for the Company’s Capital Markets and Client Services segments (excluding asset management fees) for the years ended November 30, 2003 and 2002.
As discussed throughout Management’s Discussion and Analysis, the Company seeks to reduce risk through the diversification of its businesses and a focus on customer flow activities. This diversification and focus, combined with the Company’s risk management controls and processes, helps mitigate the net revenue volatility inherent in the Company’s trading activities. Although historical performance is not necessarily indicative of future performance, the Company believes its focus on business diversification and customer flow activities should continue to reduce the volatility of future net trading revenues.
60
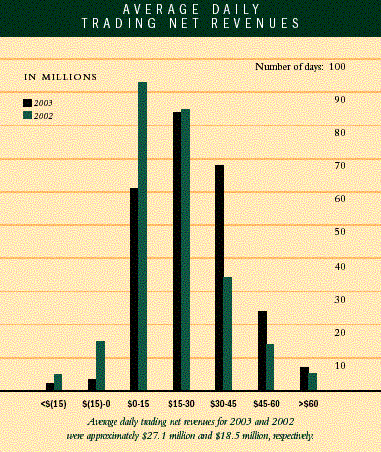
The following is a summary of the Company’s critical accounting policies and estimates. For a full description of these and other accounting policies, see Note 1 to the Consolidated Financial Statements.
Use of Estimates
The Company’s financial statements are prepared in conformity with generally accepted accounting principles, many of which require the use of estimates and assumptions. Management believes the estimates used in preparing its financial statements are reasonable and prudent. Actual results could differ from these estimates particularly in light of the industry in which the Company operates.
Fair Value
The determination of fair value is a critical accounting policy that is fundamental to the Company’s financial condition and results of operations. The Company records its inventory positions including Securities and other inventory positions owned and Securities and other inventory positions sold but not yet purchased at market or fair value, with unrealized gains and losses reflected in Principal transactions in the Consolidated Statement of Income. In all instances, the Company believes it has established rigorous internal control processes to ensure the Company uses reasonable and prudent measurements of fair value on a consistent basis.
When evaluating the extent to which management estimates may be required in preparing the Company’s financial statements, the Company believes it is useful to analyze the balance sheet as shown in the following table:
SUMMARY BALANCE SHEET
IN MILLIONS
NOVEMBER 30, 2003 | | | | | |
ASSETS | | | | | |
Securities and other inventory positions owned | | $ | 137,040 | | 44 | % |
Secured financings | | 138,812 | | 45 | % |
Receivables and other assets | | 32,648 | | 10 | % |
Identifiable intangible assets and goodwill | | 3,561 | | 1 | % |
Total assets | | $ | 312,061 | | 100 | % |
| | | | | |
LIABILITIES AND EQUITY | | | | | |
Securities and other inventory positions sold but not yet purchased | | $ | 75,882 | | 24 | % |
Secured financings | | 135,836 | | 43 | % |
Payables and other accrued liabilities | | 42,330 | | 14 | % |
Total capital | | 58,013 | | 19 | % |
Total liabilities and equity | | $ | 312,061 | | 100 | % |
A significant majority of the Company’s assets and liabilities are recorded at amounts for which significant management estimates are not used. The following balance sheet categories, comprising 55% of total assets and 76% of liabilities and equity are valued at either historical cost or at contract value (including accrued interest) which, by their nature, do not require the use of significant estimates: Secured financings, Receivables and other assets, and Payables and other accrued liabilities and Total capital. Securities and other inventory positions owned and Securities, and other inventory positions sold but not yet purchased (long and short inventory positions, respectively), are recorded at market or fair value, the components of which may require, to varying degrees, the use of estimates in determining fair value. Also, determining the initial estimated fair values of acquired identifiable intangible assets and goodwill requires significant judgments and involves the use of significant estimates and assumptions.
When evaluating the extent to which management estimates may be used in determining the fair value for long and short inventory, the Company believes it is useful to consider separately derivatives and cash instruments.
61
Derivatives
The fair values of derivative assets and liabilities at November 30, 2003 were $15,766 million and $11,440 million, respectively. Included within these amounts were exchange-traded derivatives assets and liabilities of $2,199 million and $1,621 million for which fair value is determined based on quoted market prices. The fair values of the Company’s OTC derivative assets and liabilities at November 30, 2003 were $13.6 billion and $9.8 billion, respectively. OTC derivative assets represent the Company’s unrealized gains, net of unrealized losses, for situations in which the Company has a master netting agreement. Similarly, liabilities represent net amounts owed to counterparties.
OTC DERIVATIVES
| | Fair Value of OTC Derivative Contracts by Maturity | |
IN MILLIONS
NOVEMBER 30, 2003 | | Less than
1 year | | 2-5 years | | 5-10 years | | Greater than
10 years | | Total | |
| | | | | | | | | | | |
ASSETS | | | | | | | | | | | |
Interest rate, currency and credit default swaps and options | | $ | 491 | | $ | 2,376 | | $ | 2,638 | | $ | 2,097 | | $ | 7,602 | |
Foreign exchange forward contracts and options | | 1,586 | | 165 | | 52 | | 4 | | 1,807 | |
Other fixed income securities contracts | | 1,264 | | — | | — | | — | | 1,264 | |
Equity contracts (including swaps, warrants and
options) | | 1,806 | | 919 | | 167 | | 2 | | 2,894 | |
Total | | $ | 5,147 | | $ | 3,460 | | $ | 2,857 | | $ | 2,103 | | $ | 13,567 | |
| | 38 | % | 26 | % | 21 | % | 15 | % | 100 | % |
LIABILITIES | | | | | | | | | | | |
Interest rate, currency and credit default swaps and options | | $ | 2,006 | | $ | 384 | | $ | 2,650 | | $ | 574 | | $ | 5,614 | |
Foreign exchange forward contracts and options | | 1,855 | | 113 | | 13 | | 1 | | 1,982 | |
Other fixed income securities contracts | | 750 | | — | | — | | — | | 750 | |
Equity contracts (including swaps, warrants and
options) | | 648 | | 780 | | 32 | | 13 | | 1,473 | |
Total | | $ | 5,259 | | $ | 1,277 | | $ | 2,695 | | $ | 588 | | $ | 9,819 | |
| | 54 | % | 13 | % | 27 | % | 6 | % | 100 | % |
The majority of the Company’s OTC derivatives are transacted in liquid trading markets for which fair value is determined using pricing models with readily observable market inputs. Examples of such derivatives include interest rate swap contracts, TBAs (classified in the above table as Other fixed income securities contracts), foreign exchange forward and option contracts in G-7 currencies and equity swap and option contracts on listed securities. However, the determination of fair value for certain less liquid derivatives requires the use of significant estimates. Such derivatives include certain credit derivatives, equity option contracts greater than five years, and certain other complex derivatives used by the Company in providing clients with hedging alternatives to unique exposures. The Company strives to limit the use of significant judgment by using consistent pricing assumptions between reporting periods and using observed market data for model inputs whenever possible. As the market for complex products develops, the Company refines its pricing models based on market experience to use the most current indicators of fair value.
Cash Instruments
The majority of the Company’s non-derivative long and short inventory (i.e., cash instruments) is recorded at market value based on listed market prices or using third-party broker quotes, and therefore does not incorporate significant estimates. Examples of inventory valued in this manner include government securities, agency mortgage-backed securities, listed equities, money markets, municipal securities, corporate bonds and listed futures. However, in certain instances the Company may deem such quotations to be unrealizable (e.g., when the instruments are thinly traded or when the Company holds a substantial block of a particular security such that the listed price is not deemed to be readily realizable). In such instances, the Company
62
determines fair value based on management’s best estimate giving appropriate consideration to reported prices and the extent of public trading in similar securities, the discount from the listed price associated with the cost at date of acquisition and the size of the position held in relation to the liquidity in the market, among other factors. When the size of the Company’s holding of a listed security is likely to impair the Company’s ability to realize the quoted market price, the Company records the position at a discount to the quoted price reflecting the Company’s best estimate of fair value.
When quoted prices are not available, fair value is determined based on pricing models or other valuation techniques, including the use of implied pricing from similar instruments. Pricing models are typically used to derive fair value based on the net present value of estimated future cash flows including adjustments, when appropriate, for liquidity, credit and/or other factors. For the vast majority of instruments valued through pricing models, significant estimates are not required because the market inputs to such models are readily observable and liquid trading markets provide clear evidence to support the valuations derived from such pricing models. Examples of inventory valued using pricing models or other valuation techniques for which the use of management estimates are deemed necessary include private equity investments, certain high yield positions, certain mortgages, mortgage-backed and real estate inventory and non-investment grade retained interests.
Private Equity and Other Principal Investments
The Company’s Private Equity business operates in five major asset classes: Merchant Banking, Real Estate, Venture Capital, Fixed Income-related and Third Party Funds. The Company has raised privately placed funds in all of these classes, for which the Company acts as general partner and in which it has general and in some cases limited partner interests. In addition, the Company generally co-invests directly in the investments made by the funds and may make other non-fund-related direct investments. The Company carries its private equity investments, including its general and limited partnership interests, at fair value. At November 30, 2003 and 2002, the Company’s private equity related investments were $1,303 million and $965 million, respectively. At November 30, 2003 the largest industry concentration was 26% and the largest single-investment exposure was $106 million. In addition, the Company held approximately $80 million in an energy-related principal investment at November 30, 2003.
The determination of fair value for these investments often requires the use of estimates and assumptions because these investments are generally less liquid and often contain trading restrictions. The Company estimates that approximately $113 million of these investments have readily determinable fair values because they are publicly-traded securities with no remaining trading restrictions. For the remainder of these positions, fair value is based on the Company’s assessment of the underlying investments incorporating valuations that consider expected cash flows, earnings multiples and/or comparisons to similar market transactions. Valuation adjustments, which may involve the use of significant management estimates, are an integral part of pricing these instruments, reflecting consideration of credit quality, concentration risk, sale restrictions and other liquidity factors. Additional information about the Company’s private equity and other principal investment activities, including related commitments, can be found in Note 11 to the Consolidated Financial Statements.
High Yield
The Company underwrites, invests and makes markets in high yield corporate debt securities. The Company also syndicates, trades and invests in loans to below investment grade-rated companies. For purposes of this discussion, high yield debt instruments are defined as securities of or loans to companies rated BB+ or lower, or equivalent ratings by recognized credit rating agencies, as well as non-rated securities or loans that, in the opinion of management, are non-investment grade. Non-investment grade securities generally involve greater risks than investment grade securities due to the issuer’s creditworthiness and the lower liquidity of the market for such securities. In addition, these issuers generally have relatively higher levels of indebtedness resulting in an increased sensitivity to adverse economic conditions. The Company recognizes these risks and seeks to reduce market and credit risk through the diversification of its products and counterparties. High yield debt instruments are carried at fair value, with unrealized gains or losses recognized in the Consolidated Statement of Income. Such instruments at November 30, 2003 and November 30, 2002 included long positions with an aggregate market value of approximately $4.0 billion and short positions with an aggregate market value of approximately $0.3 billion and $1.1 billion, respectively. At November 30, 2003, the largest industry concentration was 10%. The majority of these positions are valued using broker quotes or listed market prices. However, at November 30, 2003, approximately $800 million of these positions were valued utilizing other valuation techniques because there was little or no trading activity. In such instances, the Company uses prudent judgment in determining fair value, which may involve using analyses of credit spreads associated with pricing of similar instruments, or other valuation techniques. The Company mitigates its aggregate and single-issuer net exposure through the use of derivatives, non-recourse securitization financing and other financial instruments.
Mortgages, Mortgage-backed and Real Estate Inventory
The Company is a market leader in mortgage-backed securities trading and loan securitizations (both residential and commercial). The Company’s mortgage related inventory includes loans held prior to securitization, securities and real estate owned. In this activity, the Company generally purchases mortgage loans from loan
63
originators or in the secondary market and aggregates pools of loans for securitization. The Company also originates mortgage loans. From time-to-time, the Company may utilize non-recourse financings to fund these positions. The Company records mortgage loans and direct real estate investments at fair value, with related mark-to-market gains and losses recognized in Principal transactions revenue. Management estimates are generally required in determining the fair value of certain residential and commercial mortgage loans and direct real estate, as they are based upon analyses of both cash flow projections and underlying property values. The Company uses independent appraisals to support management’s assessment of the property in determining fair value for these positions. Approximately $13 billion of the Company’s total $39 billion of mortgage, mortgage-backed and real estate inventory utilize the above valuation methodologies. This includes commercial real estate and commercial mortgage loan risk of $6.1 billion.
Non-Investment Grade Retained Interests
In addition, the Company held approximately $1.0 billion of non-investment grade retained interests at November 30, 2003, down from $1.1 billion at November 30, 2002. Because these interests primarily represent the junior interests in commercial and residential mortgage securitizations for which there are not active trading markets, estimates generally are required in determining fair value. The Company values these instruments using prudent estimates of expected cash flows, and considers the valuation of similar transactions in the market. (See Note 4 to the Consolidated Financial Statements for additional information on the impact of adverse changes in assumptions on the fair value of these interests.)
Real Estate Charges
As a result of the Company’s decision to exit its downtown New York area facilities after the events of September 11, 2001 and the Company’s decision in 2002 to reconfigure certain of its global real estate facilities, the Company recognized real estate charges in both 2003 and 2002. The recognition of these charges required significant management estimates including the Company’s estimation of the vacancy periods prior to subleasing, the anticipated rate of subleases, and the amount of incentives (e.g., free rent periods) that may be required to induce sub-lessees.
Identifiable Intangible Assets and Goodwill
The Company acquired Neuberger in October 2003 for a net purchase price of approximately $2.8 billion, excluding net cash and short-term investments acquired of approximately $276 million. The cost was allocated to the underlying net assets based on preliminary estimates of their estimated fair values. The excess of the purchase price over the estimated fair values of the net assets acquired of $2,254 million was recorded as goodwill. The judgments made in determining the estimated fair values and expected useful lives assigned to each class of assets and liabilities acquired can significantly affect net income. Determining the fair values and useful lives of certain assets acquired and liabilities assumed—intangible assets in particular—requires significant judgment and involves the use of significant estimates and assumptions. The Company is obtaining third-party valuations of certain intangible assets preliminarily carried at $951 million in the Consolidated Statement of Financial Condition at November 30, 2003 and the allocation of the purchase price therefore is subject to refinement.
The Company is required to assess for impairment of goodwill and other intangible assets with indefinite lives at least annually using fair value measurement techniques. If the estimated fair value of a reporting unit (an operating segment or one organizational level below an operating segment) exceeds its carrying value, goodwill of the reporting unit is considered not to be impaired. If the carrying value of a reporting unit exceeds its estimated fair value, the implied fair value of the reporting unit’s goodwill is compared with the carrying amount of that goodwill. The implied fair value of goodwill is determined in the same manner as the amount of goodwill recognized in a business combination. If the carrying amount of the goodwill exceeds the implied fair value of the goodwill, an impairment loss is recognized equal to that excess. The impairment test for other intangible assets with indefinite lives is performed by comparing the estimated fair value of the intangible asset, with its carrying value. If the carrying value of the intangible asset exceeds its estimated fair value an impairment loss is recognized equal to that excess. Periodically estimating the fair value of a reporting unit and intangible assets with indefinite lives involves significant judgment and often involves the use of significant estimates and assumptions. These estimates and assumptions could have a significant effect on whether or not an impairment charge is recognized and the magnitude of such charge.
64
During the first quarter of 2003, the Company adopted EITF Issue No. 02-03, “Issues Involved in Accounting for Derivative Contracts Held for Trading Purposes and Contracts Involved In Energy Trading and Risk Management Activities” (“EITF 02-03”). EITF 02-03 clarified that profit should not be recognized at the inception of a derivative contract, if the contract does not have observable pricing. In such instances, the transaction price is deemed to be the best indicator of fair value and is required to be utilized. The effect upon adoption of EITF 02-03 was not material to the Company’s financial condition or results of operations.
In May 2003, the FASB issued SFAS No. 150, “Accounting for Certain Financial Instruments with Characteristics of both Liabilities and Equity.” The statement specifies how an issuer classifies and measures certain financial instruments with characteristics of both liabilities and equity. However, in November 2003 the FASB indefinitely deferred the effective date of the statement’s provisions for certain preferred securities subject to mandatory redemption. The remaining provisions of this statement are generally effective for financial instruments entered into after May 31, 2003. The Company was required to adopt the statement for all pre-existing transactions as of the Company’s fourth quarter of 2003. The effect of adopting SFAS No. 150 was not material to the Company’s financial condition or results of operations.
In January 2003, the FASB issued FIN 46. This interpretation provides new consolidation accounting guidance for entities involved with VIEs. Under FIN 46 the Company is required to consolidate a VIE when it is deemed to be the primary beneficiary of such entity. The primary beneficiary is the party which has either a majority of the expected losses or a majority of the expected residual returns of the entity. FIN 46 is effective for all VIEs created after January 31, 2003. In December 2003, the FASB in an effort to clarify the application of FIN 46 issued a revised interpretation and delayed the initial implementation date as it relates to entities established prior to January 31, 2003. The Company is required to adopt the revised interpretation as of February 28, 2004 as it relates to the Company’s involvement with SPEs established prior to January 31, 2003. In addition, the Company is required to adopt as of May 31, 2004 the revised interpretation to the extent it may apply to operating companies established prior to January 31, 2003.
The Company has adopted the provisions of FIN 46 for those entities established after January 31, 2003 and therefore the Company has consolidated such VIEs for which the Company was deemed to be the primary beneficiary. The impact of applying FIN 46 to such transactions in 2003 was not material to the Company’s results of operations or statement of financial condition. While the Company is continuing its analysis of the revised interpretation, the Company does not anticipate that the adoption of the revised interpretation in 2004 will have a material impact on the Company’s financial condition or its results of operations.
However, the Company does expect that the adoption of FIN 46 as revised will result in the de-consolidation of its trusts that issue preferred securities subject to mandatory redemption effective as of February 28, 2004. The de-consolidation will have the effect of reclassifying such preferred securities subject to mandatory redemption out of the mezzanine classification of the Company’s Consolidated Statement of Financial Condition and into Long-Term Debt. Likewise the Company will reclassify, on a prospective basis, the pretax amount of dividends on trust preferred securities to Interest expense in the Company’s results of operations.
Because the Company’s assets are, to a large extent, liquid in nature, they are not significantly affected by inflation. However, the rate of inflation affects the Company’s expenses such as employee compensation, office space leasing costs and communications charges, which may not be readily recoverable in the prices of services offered by the Company. To the extent inflation results in rising interest rates and has other adverse effects on the securities markets, it may adversely affect the Company’s financial position and results of operations in certain businesses.
65
The Board of Directors and Stockholders of Lehman Brothers Holdings Inc.
We have audited the accompanying consolidated statement of financial condition of Lehman Brothers Holdings Inc. and Subsidiaries (the “Company”) as of November 30, 2003 and 2002, and the related consolidated statements of income, changes in stockholders’ equity and cash flows for each of the three years in the period ended November 30, 2003. These financial statements are the responsibility of the Company’s management. Our responsibility is to express an opinion on these financial statements based on our audits.
We conducted our audits in accordance with auditing standards generally accepted in the United States. Those standards require that we plan and perform the audit to obtain reasonable assurance about whether the financial statements are free of material misstatement. An audit includes examining, on a test basis, evidence supporting the amounts and disclosures in the financial statements. An audit also includes assessing the accounting principles used and significant estimates made by management, as well as evaluating the overall financial statement presentation. We believe that our audits provide a reasonable basis for our opinion.
In our opinion, the financial statements referred to above present fairly, in all material respects, the consolidated financial position of Lehman Brothers Holdings Inc. and Subsidiaries at November 30, 2003 and 2002, and the consolidated results of its operations and its cash flows for each of the three years in the period ended November 30, 2003, in conformity with accounting principles generally accepted in the United States.
/s/ Ernst & Young LLP | |
|
New York, New York |
January 29, 2004 |
66
IN MILLIONS, EXCEPT PER SHARE DATA
YEAR ENDED NOVEMBER 30 | | 2003 | | 2002 | | 2001 | |
| | | | | | | |
REVENUES | | | | | | | |
Principal transactions | | $ | 4,280 | | $ | 1,951 | | $ | 2,779 | |
Investment banking | | 1,747 | | 1,771 | | 2,000 | |
Commissions | | 1,210 | | 1,286 | | 1,091 | |
Interest and dividends | | 9,942 | | 11,728 | | 16,470 | |
Other | | 108 | | 45 | | 52 | |
Total revenues | | 17,287 | | 16,781 | | 22,392 | |
Interest expense | | 8,640 | | 10,626 | | 15,656 | |
Net revenues | | 8,647 | | 6,155 | | 6,736 | |
| | | | | | | |
NON-INTEREST EXPENSES | | | | | | | |
Compensation and benefits | | 4,318 | | 3,139 | | 3,437 | |
Technology and communications | | 598 | | 552 | | 501 | |
Brokerage and clearance fees | | 367 | | 329 | | 308 | |
Occupancy | | 319 | | 287 | | 198 | |
Professional fees | | 158 | | 129 | | 152 | |
Business development | | 149 | | 146 | | 183 | |
Other | | 125 | | 74 | | 82 | |
Other real estate reconfiguration charge | | 77 | | 128 | | — | |
September 11th related (recoveries)/expenses, net | | — | | (108 | ) | 127 | |
Regulatory settlement | | — | | 80 | | — | |
Total non-interest expenses | | 6,111 | | 4,756 | | 4,988 | |
Income before taxes and dividends on trust preferred securities | | 2,536 | | 1,399 | | 1,748 | |
Provision for income taxes | | 765 | | 368 | | 437 | |
Dividends on trust preferred securities | | 72 | | 56 | | 56 | |
Net income | | $ | 1,699 | | $ | 975 | | $ | 1,255 | |
Net income applicable to common stock | | $ | 1,649 | | $ | 906 | | $ | 1,161 | |
Earnings per common share | | | | | | | |
Basic | | $ | 6.71 | | $ | 3.69 | | $ | 4.77 | |
Diluted | | $ | 6.35 | | $ | 3.47 | | $ | 4.38 | |
See Notes to Consolidated Financial Statements.
67
CONSOLIDATED STATEMENT OF FINANCIAL CONDITION
IN MILLIONS
NOVEMBER 30 | | 2003 | | 2002 | |
| | | | | |
ASSETS | | | | | |
Cash and cash equivalents | | $ | 7,922 | | $ | 3,699 | |
Cash and securities segregated and on deposit for regulatory and other purposes | | 3,100 | | 2,803 | |
Securities and other inventory positions owned:
(includes $35,679 in 2003 and $22,211 in 2002 pledged as collateral) | | 137,040 | | 119,278 | |
Collateralized agreements: | | | | | |
Securities purchased under agreements to resell | | 87,416 | | 94,341 | |
Securities borrowed | | 51,396 | | 20,497 | |
Receivables: | | | | | |
Brokers, dealers and clearing organizations | | 4,875 | | 3,775 | |
Customers | | 8,809 | | 8,279 | |
Others | | 1,626 | | 1,910 | |
Property, equipment and leasehold improvements (net of accumulated depreciation and amortization of $921 in 2003 and $590 in 2002) | | 2,806 | | 2,075 | |
Other assets | | 3,510 | | 3,466 | |
Identifiable intangible assets and goodwill (net of accumulated amortization of $166 in 2003 and $155 in 2002) | | 3,561 | | 213 | |
Total assets | | $ | 312,061 | | $ | 260,336 | |
See Notes to Consolidated Financial Statements.
68
CONSOLIDATED STATEMENT OF FINANCIAL CONDITION (Continued)
IN MILLIONS, EXCEPT PER SHARE DATA
NOVEMBER 30 | | 2003 | | 2002 | |
| | | | | |
LIABILITIES AND STOCKHOLDERS’ EQUITY | | | | | |
Commercial paper and short-term debt | | $ | 2,331 | | $ | 2,369 | |
Securities and other inventory positions sold but not yet purchased | | 75,882 | | 69,034 | |
Collateralized financing: | | | | | |
Securities sold under agreements to repurchase | | 107,304 | | 94,725 | |
Securities loaned | | 13,988 | | 8,137 | |
Other secured borrowings | | 14,544 | | 11,844 | |
Payables: | | | | | |
Brokers, dealers and clearing organizations | | 3,067 | | 1,787 | |
Customers | | 27,666 | | 17,477 | |
Accrued liabilities and other payables | | 9,266 | | 6,633 | |
Long-term debt: | | | | | |
Senior notes | | 41,303 | | 36,283 | |
Subordinated indebtedness | | 2,226 | | 2,395 | |
Total liabilities | | 297,577 | | 250,684 | |
Commitments and contingencies | | | | | |
Preferred securities subject to mandatory redemption | | 1,310 | | 710 | |
| | | | | |
STOCKHOLDERS’ EQUITY | | | | | |
Preferred stock | | 1,045 | | 700 | |
Common stock, $0.10 par value; Shares authorized: 600,000,000 in 2003 and 2002; Shares issued: 294,575,285 in 2003 and 258,791,416 in 2002; Shares outstanding: 266,679,056 in 2003 and 231,131,043 in 2002 | | 29 | | 25 | |
Additional paid-in capital | | 6,164 | | 3,628 | |
Accumulated other comprehensive income (net of tax) | | (16 | ) | (13 | ) |
Retained earnings | | 7,129 | | 5,608 | |
Other stockholders’ equity, net | | 1,031 | | 949 | |
Common stock in treasury, at cost: 27,896,229 shares in 2003 and 27,660,373 shares in 2002 | | (2,208 | ) | (1,955 | ) |
Total stockholders’ equity | | 13,174 | | 8,942 | |
Total liabilities and stockholders’ equity | | $ | 312,061 | | $ | 260,336 | |
See Notes to Consolidated Financial Statements.
69
CONSOLIDATED STATEMENT OF CHANGES IN STOCKHOLDERS’ EQUITY
IN MILLIONS
YEAR ENDED NOVEMBER 30 | | 2003 | | 2002 | | 2001 | |
| | | | | | | |
PREFERRED STOCK | | | | | | | |
5.94% Cumulative, Series C: | | | | | | | |
Beginning and ending balance | | $ | 250 | | $ | 250 | | $ | 250 | |
5.67% Cumulative, Series D: | | | | | | | |
Beginning and ending balance | | 200 | | 200 | | 200 | |
7.115% Fixed/Adjustable Rate Cumulative, Series E: | | | | | | | |
Beginning and ending balance | | 250 | | 250 | | 250 | |
6.50% Cumulative, Series F: | | | | | | | |
Beginning balance | | — | | — | | — | |
Shares issued | | 345 | | — | | — | |
Ending balance | | 345 | | — | | — | |
Redeemable Voting: | | | | | | | |
Beginning and ending balance | | — | | — | | — | |
Total Preferred Stock, ending balance | | 1,045 | | 700 | | 700 | |
| | | | | | | |
COMMON STOCK, PAR VALUE $0.10 PER SHARE | | | | | | | |
Beginning balance | | 25 | | 25 | | 25 | |
Shares issued in connection with Neuberger acquisition | | 3 | | — | | — | |
Issued | | 1 | | — | | — | |
Ending balance | | 29 | | 25 | | 25 | |
| | | | | | | |
ADDITIONAL PAID-IN CAPITAL | | | | | | | |
Beginning balance | | 3,628 | | 3,562 | | 3,589 | |
RSUs exchanged for Common Stock | | (36 | ) | 63 | | (13 | ) |
Employee stock-based awards | | 107 | | 53 | | 53 | |
Shares issued to RSU Trust | | (459 | ) | (401 | ) | (628 | ) |
Tax benefits from the issuance of stock-based awards | | 543 | | 347 | | 549 | |
Shares issued in connection with Neuberger acquisition | | 2,371 | | — | | — | |
Other, net | | 10 | | 4 | | 12 | |
Ending balance | | $ | 6,164 | | $ | 3,628 | | $ | 3,562 | |
See Notes to Consolidated Financial Statements.
70
CONSOLIDATED STATEMENT OF CHANGES IN STOCKHOLDERS’ EQUITY (Continued)
IN MILLIONS
YEAR ENDED NOVEMBER 30 | | 2003 | | 2002 | | 2001 | |
| | | | | | | |
ACCUMULATED OTHER COMPREHENSIVE INCOME | | | | | | | |
Beginning balance | | $ | (13 | ) | $ | (10 | ) | $ | (8 | ) |
Translation adjustment, net (1) | | (3 | ) | (3 | ) | (2 | ) |
Ending balance | | (16 | ) | (13 | ) | (10 | ) |
RETAINED EARNINGS | | | | | | | |
Beginning balance | | 5,608 | | 4,798 | | 3,713 | |
Net income | | 1,699 | | 975 | | 1,255 | |
Dividends declared: | | | | | | | |
5.00% Cumulative Convertible Voting Series A and B Preferred Stock | | — | | — | | (1 | ) |
5.94% Cumulative, Series C Preferred Stock | | (15 | ) | (15 | ) | (15 | ) |
5.67% Cumulative, Series D Preferred Stock | | (11 | ) | (11 | ) | (11 | ) |
7.115% Fixed/Adjustable Rate Cumulative, Series E Preferred Stock | | (18 | ) | (18 | ) | (18 | ) |
6.50% Cumulative, Series F Preferred Stock | | (6 | ) | — | | — | |
Redeemable Voting Preferred Stock | | — | | (25 | ) | (50 | ) |
Common Stock | | (128 | ) | (96 | ) | (75 | ) |
Ending balance | | 7,129 | | 5,608 | | 4,798 | |
COMMON STOCK ISSUABLE | | | | | | | |
Beginning balance | | 2,822 | | 2,933 | | 2,524 | |
RSUs exchanged for Common Stock | | (425 | ) | (463 | ) | (215 | ) |
Deferred stock awards granted | | 957 | | 407 | | 624 | |
Other, net | | (1 | ) | (55 | ) | — | |
Ending balance | | 3,353 | | 2,822 | | 2,933 | |
COMMON STOCK HELD IN RSU TRUST | | | | | | | |
Beginning balance | | (754 | ) | (827 | ) | (647 | ) |
Shares issued to RSU Trust | | (518 | ) | (297 | ) | (403 | ) |
RSUs exchanged for Common Stock | | 444 | | 387 | | 223 | |
Other, net | | (24 | ) | (17 | ) | — | |
Ending balance | | (852 | ) | (754 | ) | (827 | ) |
DEFERRED STOCK COMPENSATION | | | | | | | |
Beginning balance | | (1,119 | ) | (1,360 | ) | (1,280 | ) |
Deferred stock awards granted | | (999 | ) | (407 | ) | (624 | ) |
Amortization of deferred compensation, net | | 625 | | 570 | | 544 | |
Other, net | | 23 | | 78 | | — | |
Ending balance | | (1,470 | ) | (1,119 | ) | (1,360 | ) |
COMMON STOCK IN TREASURY, AT COST | | | | | | | |
Beginning balance | | (1,955 | ) | (1,362 | ) | (835 | ) |
Treasury stock purchased | | (1,508 | ) | (1,510 | ) | (1,676 | ) |
RSUs exchanged for Common Stock | | 18 | | — | | 5 | |
Shares issued for preferred stock conversion | | — | | — | | 44 | |
Employee stock-based awards | | 260 | | 219 | | 69 | |
Shares issued to RSU Trust | | 977 | | 698 | | 1,031 | |
Ending balance | | (2,208 | ) | (1,955 | ) | (1,362 | ) |
Total stockholders’ equity | | $ | 13,174 | | $ | 8,942 | | $ | 8,459 | |
(1) Net of income taxes of $(1) in 2003, $(1) in 2002 and $(1) in 2001.
See Notes to Consolidated Financial Statements.
71
CONSOLIDATED STATEMENT OF CASH FLOWS
IN MILLIONS
YEAR ENDED NOVEMBER 30 | | 2003 | | 2002 | | 2001 | |
| | | | | | | |
CASH FLOWS FROM OPERATING ACTIVITIES | | | | | | | |
Net income | | $ | 1,699 | | $ | 975 | | $ | 1,255 | |
Adjustments to reconcile net income to net cash provided by operating activities: | | | | | | | |
Depreciation and amortization | | 315 | | 258 | | 174 | |
Deferred tax provision (benefit) | | (166 | ) | (670 | ) | (643 | ) |
Tax benefit from issuance of stock-based awards | | 543 | | 347 | | 549 | |
Amortization of deferred stock compensation | | 625 | | 570 | | 544 | |
September 11th (recoveries) expenses | | — | | (108 | ) | 356 | |
Other real estate reconfiguration charge | | 77 | | 128 | | — | |
Regulatory settlement | | — | | 80 | | — | |
Other adjustments | | (26 | ) | 92 | | (1 | ) |
Net change in: | | | | | | | |
Cash and securities segregated and on deposit for regulatory and other purposes | | (297 | ) | 486 | | (855 | ) |
Securities and other inventory positions owned | | (16,148 | ) | 1,708 | | (13,219 | ) |
Securities borrowed, net of securities loaned | | (25,048 | ) | (6,907 | ) | 4,923 | |
Other secured borrowings | | 2,700 | | 4,060 | | 3,805 | |
Resale agreements, net of repurchase agreements | | 19,504 | | (18,442 | ) | (8,957 | ) |
Receivables from brokers, dealers and clearing organizations | | (1,100 | ) | (320 | ) | (1,793 | ) |
Receivables from customers | | (530 | ) | 3,844 | | (4,538 | ) |
Securities and other inventory positions sold but not yet purchased | | 6,848 | | 17,704 | | 16,045 | |
Payables to brokers, dealers and clearing organizations | | 1,280 | | (1,018 | ) | 883 | |
Payables to customers | | 10,189 | | 3,646 | | 2,194 | |
Accrued liabilities and other payables | | 1,736 | | 277 | | (27 | ) |
Other operating assets and liabilities, net | | 346 | | (693 | ) | (394 | ) |
Net cash provided by operating activities | | 2,547 | | 6,017 | | 301 | |
CASH FLOWS FROM FINANCING ACTIVITIES | | | | | | | |
Proceeds from issuance of senior notes | | 13,193 | | 8,415 | | 9,915 | |
Principal payments of senior notes | | (9,815 | ) | (9,014 | ) | (7,646 | ) |
Proceeds from issuance of subordinated indebtedness | | 190 | | — | | — | |
Principal payments of subordinated indebtedness | | (322 | ) | (715 | ) | (204 | ) |
Issuances of common stock | | 57 | | 61 | | 54 | |
Issuance of preferred securities subject to mandatory redemption | | 600 | | — | | — | |
Issuance of preferred stock, net of issuance costs | | 345 | | — | | — | |
Net payments for commercial paper and short-term debt | | (38 | ) | (1,623 | ) | (1,808 | ) |
Repurchases of preferred stock | | — | | — | | (100 | ) |
Payments for treasury stock purchases | | (1,508 | ) | (1,510 | ) | (1,676 | ) |
Issuance of treasury stock | | 260 | | 207 | | 69 | |
Dividends paid | | (178 | ) | (165 | ) | (163 | ) |
Net cash provided by (used in) financing activities | | 2,784 | | (4,344 | ) | (1,559 | ) |
CASH FLOWS FROM INVESTING ACTIVITIES | | | | | | | |
Purchases of property, equipment and leasehold improvements, net | | (451 | ) | (656 | ) | (1,341 | ) |
Proceeds from the sale of 3 World Financial Center, net | | — | | 152 | | — | |
Business acquisitions, net of cash acquired | | (657 | ) | (31 | ) | — | |
Net cash used in investing activities | | (1,108 | ) | (535 | ) | (1,341 | ) |
Net change in cash and cash equivalents | | 4,223 | | 1,138 | | (2,599 | ) |
Cash and cash equivalents, beginning of period | | 3,699 | | 2,561 | | 5,160 | |
Cash and cash equivalents, end of period | | $ | 7,922 | | $ | 3,699 | | $ | 2,561 | |
SUPPLEMENTAL DISCLOSURE OF CASH FLOW INFORMATION (in millions):
Interest paid totaled $8,654 in 2003, $10,686 in 2002 and $15,588 in 2001.
Income taxes paid totaled $717 in 2003, $436 in 2002 and $654 in 2001.
See Notes to Consolidated Financial Statements.
72
NOTES TO CONSOLIDATED FINANCIAL STATEMENTS
NOTE 1 SUMMARY OF SIGNIFICANT ACCOUNTING POLICIES
Basis Of Presentation
The consolidated financial statements include the accounts of Lehman Brothers Holdings Inc. (“Holdings”) and subsidiaries (collectively, the “Company” or “Lehman Brothers”). Lehman Brothers is one of the leading global investment banks serving institutional, corporate, government and high-net-worth individual clients and customers. The Company’s worldwide headquarters in New York and regional headquarters in London and Tokyo are complemented by offices in additional locations in North America, Europe, the Middle East, Latin America and the Asia Pacific region. The Company is engaged primarily in providing financial services. The principal U.S. subsidiary of Holdings is Lehman Brothers Inc. (“LBI”), a registered broker-dealer. All material intercompany accounts and transactions have been eliminated in consolidation.
The consolidated financial statements are prepared in conformity with generally accepted accounting principles, which require management to make estimates and assumptions that affect the amounts reported in the financial statements and accompanying notes. Management estimates are required in determining the valuation of trading inventory, particularly Over-the-Counter (“OTC”) derivatives, certain high yield positions, private equity and other principal investments and certain mortgage, mortgage-backed and real estate positions. Additionally, management estimates are required in assessing the realizability of deferred tax assets, the outcome of litigation, determining the allocation of goodwill and intangible assets acquired, and determining the components of the September 11th related (recoveries)/expenses, net and the real estate reconfiguration charges. Management believes the estimates used in preparing its financial statements are reasonable and prudent. Actual results could differ from these estimates.
Certain prior period amounts reflect reclassifications to conform to the current year’s presentation.
73
Consolidation Accounting Policies
Operating Companies Financial Accounting Standards Board (“FASB”) Interpretation No. 46, “Consolidation of Variable Interest Entities—an interpretation of ARB No. 51,” (“FIN 46”), which was issued in January 2003, defines the criteria necessary to be considered an operating company for which the consolidation accounting guidance of Statement of Financial Accounting Standards (“SFAS”) No. 94, “Consolidation of All Majority-Owned Subsidiaries,” (“SFAS 94”) should be applied. SFAS 94 is a control-based model and requires consolidation for those entities in which the Company has a controlling financial interest. The usual condition for a controlling financial interest is ownership of a majority of the voting interest in an entity. FIN 46 defined operating companies to include only those entities that have sufficient legal equity to absorb the entities’ expected losses (presumed to require minimum 10% equity), and for which the equity holders have substantive voting rights and participate substantively in the gains and losses of such entities. Accordingly, the Company consolidates operating companies in which it has a controlling financial interest. Operating companies in which the Company holds a non-controlling interest are accounted for under the equity method when the Company is able to exercise significant influence over the business activities of such entities. Significant influence is generally deemed to exist when the Company owns 20% to 50% of the voting equity of a corporation or when the Company holds at least 3% of a limited partnership interest. The cost method is applied when the ability to exercise significant influence is not present.
Special Purpose Entities Special purpose entities (“SPEs”) are corporations, trusts or partnerships that are established for a limited purpose. SPEs by their nature generally do not provide equity owners with significant voting powers because the SPE documents govern all material decisions. The Company’s primary involvement with SPEs relates to securitization transactions in which transferred assets, including mortgages, loans, receivables and other assets, are sold to an SPE and repackaged into securities (i.e., securitized). SPEs also may be used by the Company to create securities with a unique risk profile desired by investors and as a means of intermediating financial risk. In the normal course of business, the Company may establish SPEs, sell assets to SPEs, underwrite, distribute, and make a market in securities issued by SPEs, transact derivatives with SPEs, own securities or residual interests in SPEs, and provide liquidity or other guarantees for SPEs.
The Company accounts for the transfers of financial assets, including transfers to SPEs, in accordance with SFAS No. 140, “Accounting for Transfers and Servicing of Financial Assets and Extinguishments of Liabilities,” (“SFAS 140”). In accordance with this guidance, the Company recognizes transfers of financial assets as sales provided control has been relinquished. Control is deemed to be relinquished only when all of the following conditions have been met: (i) the assets have been isolated from the transferor, even in bankruptcy or other receivership (true sale opinions are required); (ii) the transferee has the right to pledge or exchange the assets received and (iii) the transferor has not maintained effective control over the transferred assets (e.g., a unilateral ability to repurchase a unique or specific asset). Therefore, in accordance with this guidance, the Company derecognizes financial assets transferred in securitizations provided the Company has relinquished control over such assets.
There are two types of SPEs: qualifying special purpose entities (“QSPEs”) and variable interest entities (“VIEs”). The majority of the Company’s involvement with SPEs relates to securitization transactions meeting the SFAS 140 definition of a QSPE. A QSPE can generally be described as an entity with significantly limited powers that are intended to limit it to passively holding financial assets and distributing cash flows based on pre-set terms. Under SFAS 140, the Company is not required to, and does not, consolidate QSPEs. Rather, the Company accounts for its involvement with QSPEs under a financial components approach in which the Company recognizes only its retained involvement with the QSPE. The Company accounts for such retained interests at fair value with changes in fair value reported in earnings. FIN 46 does not alter the accounting for involvement with QSPEs.
The Company is a market leader in mortgage (both residential and commercial), municipal and other asset-backed securitizations that are principally transacted through QSPEs. The Company securitized approximately $173 billion of financial assets during 2003, including $138 billion of residential mortgages, $10 billion of commercial mortgages and $25 billion of municipal and other asset-backed financial assets. At November 30, 2003, the Company had approximately $1.0 billion of non-investment grade retained interests from its securitization activities. Retained interests are recorded in Securities and other inventory positions owned on the Consolidated Statement of Financial Condition and primarily represent junior interests in commercial and residential securitization transactions. The Company records its trading assets, including retained interests at fair value with related gains or losses recognized in Principal transactions in the Consolidated Statement of Income. (For additional information see Note 4 to the Consolidated Financial Statements.)
Certain SPEs do not meet the QSPE criteria due to their permitted activities not being sufficiently limited, or because the assets are not deemed qualifying financial instruments (e.g., real estate). FIN 46 defines entities that are not operating companies and that do not meet the QSPE criteria as VIEs. Under FIN 46, the Company is required to consolidate a VIE if it is deemed to be the primary beneficiary of such entity. The primary beneficiary is the party that has either a majority of the expected losses or a majority of the expected residual returns of such entity, as defined. FIN 46 is effective for the Company’s involvement with VIEs created after January 31, 2003. With respect to the Company’s involvement with SPEs established prior to February 1, 2003, the Company follows the accounting guidance
74
provided by Emerging Issues Task Force (“EITF”) Topic D-14, “Transactions involving Special-Purpose Entities,” to determine whether consolidation is required. Under this guidance, the Company is not required to, and does not, consolidate such SPE if a third party investor made a substantive equity investment in the SPE (minimum of 3%), was subject to first-dollar risk of loss of such SPE, and had a controlling financial interest.
Revenue Recognition Policies
Principal Transactions Securities and other inventory positions owned and Securities and other inventory positions sold but not yet purchased (both of which are recorded on a trade-date basis) are valued at market or fair value, as appropriate, with unrealized gains and losses reflected in Principal transactions in the Consolidated Statement of Income. The Company follows the American Institute of Certified Public Accountants (“AICPA”) Audit and Accounting Guide, “Brokers and Dealers in Securities,” (the “Guide”) when determining market or fair value for financial instruments. Market value is generally determined based on listed prices or broker quotes. In certain instances, such price quotations may be deemed unreliable when the instruments are thinly traded or when the Company holds a substantial block of a particular security and the listed price is not deemed to be readily realizable. In accordance with the Guide, in these instances the Company determines fair value based on management’s best estimate giving appropriate consideration to reported prices and the extent of public trading in similar securities, the discount from the listed price associated with the cost at the date of acquisition, and the size of the position held in relation to the liquidity in the market, among other factors. When the size of the Company’s holding of a listed security is likely to impair the Company’s ability to realize the quoted market price, the Company records the position at a discount to the quoted price reflecting the Company’s best estimate of fair value. In such instances, fair value is generally determined with reference to the discount associated with the acquisition price of the security. When listed prices or broker quotes are not available, fair value is determined based on pricing models or other valuation techniques including the use of implied pricing from similar instruments. Pricing models are typically used to derive fair value based on the net present value of estimated future cash flows including adjustments, when appropriate, for liquidity, credit and/or other factors.
During the first quarter of 2003, the Company adopted EITF Issue No. 02-03, “Issues Involved in Accounting for Derivative Contracts Held for Trading Purposes and Contracts Involved In Energy Trading and Risk Management Activities” (“EITF 02-03”). Under EITF 02-03, recognition of a trading profit at inception of a derivative transaction is prohibited unless the fair value of that derivative is obtained from a quoted market price, supported by comparison to other observable market transactions, or based on a valuation technique incorporating observable market data. The initial effect of adopting EITF 02-03 was not material to the Company’s financial condition or results of operations.
Investment Banking Underwriting revenues fees and related revenues for merger, acquisition advisory and related services are recognized when services for the transactions are determined to be completed. Underwriting expenses are deferred and recognized when the related revenues are recognized.
Commissions Commissions primarily include fees from executing and clearing client transactions on stock, options and futures markets worldwide. These fees are recognized on a trade-date basis.
Investment Advisory Fees Investment advisory fees are recorded as earned. Generally, high-net-worth and institutional clients are charged or billed quarterly based on the account’s net asset value at the beginning of a quarter. Investment advisory and administrative fees earned from the Company’s mutual fund business (the “Funds”) are charged monthly to the Funds based on average daily net assets under management.
Interest Revenue/Expense The Company recognizes contractual interest on Securities and other inventory positions owned and Securities and other inventory positions sold but not yet purchased on an accrual basis as a component of Interest and dividends revenue and Interest expense, respectively. Interest flows on derivative transactions are included as part of the mark-to-market valuation of these contracts in Principal transactions and are not recognized as a component of interest revenue or expense. The Company accounts for its secured financing activities and short- and long-term borrowings on an accrual basis with related interest recorded as interest revenue or interest expense, as applicable.
Securities and Other Inventory Positions
Securities and other inventory positions owned and Securities and other inventory positions sold but not yet purchased are valued at market or fair value, as appropriate, with unrealized gains and losses reflected in Principal transactions in the Consolidated Statement of Income. At November 30, 2003 and 2002 all firm-owned securities pledged to counterparties that have the right, by contract or custom, to sell or repledge the securities are classified as Securities owned (pledged as collateral) as required by SFAS 140.
Derivative Financial Instruments
Derivatives are financial instruments whose value is based on an underlying asset (e.g., Treasury bond), index (e.g., S&P 500) or reference rate (e.g., LIBOR), such as futures, forwards, swaps, option contracts, or other financial instruments with similar characteristics. A derivative contract generally represents a future commitment to exchange interest payment streams or currencies based on the contract or notional amount or to purchase or sell other financial instruments at specified terms on a specified date. OTC derivative products are privately-negotiated contractual agreements that can be tailored to meet individual client needs and
75
include forwards, swaps and certain options including caps, collars and floors. Exchange-traded derivative products are standardized contracts transacted through regulated exchanges and include futures and certain option contracts listed on an exchange.
Derivatives are recorded at market or fair value in the Consolidated Statement of Financial Condition on a net-by-counterparty basis when a legal right of set-off exists and are netted across products when such provisions are stated in the master netting agreement. Derivatives are often referred to as off-balance sheet instruments because neither their notional amounts nor the underlying instruments are reflected as assets or liabilities of the Company. Instead, the market or fair values related to the derivative transactions are reported in the Consolidated Statement of Financial Condition as assets or liabilities in Derivatives and other contractual agreements, as applicable. Margin on futures contracts is included in receivables and payables from/to brokers, dealers and clearing organizations, as applicable. Changes in fair values of derivatives are recorded as Principal transactions revenue. Market or fair value is generally determined by either quoted market prices (for exchange-traded futures and options) or pricing models (for swaps, forwards and options). Pricing models use a series of market inputs to determine the present value of future cash flows with adjustments, as required, for credit risk and liquidity risk. Further valuation adjustments may be recorded, as deemed appropriate, for new or complex products or for positions with significant concentrations. These adjustments are integral components of the mark-to-market process. Credit-related valuation adjustments incorporate business and economic conditions, historical experience, concentrations, estimates of expected losses and the character, quality and performance of credit sensitive financial instruments.
As an end user, the Company primarily uses derivatives to modify the interest rate characteristics of its long-term debt and secured financing activities. The Company also uses equity derivatives to hedge its exposure to equity price risk embedded in certain of its debt obligations and foreign exchange forwards to manage the currency exposure related to its net investment in non-U.S. dollar functional currency operations (collectively, “End-User Derivative Activities”). The accounting for End-User Derivative Activities is dependent upon the nature of the hedging relationship. In certain hedging relationships both the derivative and the hedged item are marked to market through earnings (“fair value hedge”). In many instances, the hedge relationship is fully effective and the mark-to-market on the derivative and the hedged item offset. In other hedging relationships, the derivative is marked to market with the offsetting gains or losses recorded in Accumulated other comprehensive income, a component of Stockholders’ Equity, until the related hedged item is recognized in earnings (“cash flow hedge”). Certain derivatives embedded in long-term debt are bifurcated from the debt and marked to market through earnings.
The Company principally uses fair value hedges to convert a substantial portion of the Company’s fixed-rate debt and certain long-term secured financing activities to floating interest rates. Any hedge ineffectiveness in these relationships is recorded in Interest expense in the Consolidated Statement of Income. Gains or losses from revaluing foreign exchange contracts associated with hedging the Company’s net investments in non-U.S. dollar functional currency operations are reported within Accumulated other comprehensive income in Stockholders’ Equity. Unrealized receivables/payables resulting from the mark-to-market of end-user derivatives are included in Securities and other inventory positions owned or sold but not yet purchased.
In April 2003, the FASB issued SFAS No. 149, “Amendment of Statement 133 on Derivative Instruments and Hedging Activities.” The statement amended and clarified the financial accounting and reporting for derivative instruments and for hedging activities under SFAS No. 133, “Accounting for Derivative Instruments and Hedging Activities,” (“SFAS 133”). The adoption of the statement did not have a material effect on the Company’s financial condition or its results of operations.
Secured Financing Activities
Repurchase and Resale Agreements Securities purchased under agreements to resell and Securities sold under agreements to repurchase, which are treated as financing transactions for financial reporting purposes, are collateralized primarily by government and government agency securities and are carried net by counterparty, when permitted, at the amounts at which the securities will be subsequently resold or repurchased plus accrued interest. It is the Company’s policy to take possession of securities purchased under agreements to resell. The Company monitors the market value of the underlying positions on a daily basis compared with the related receivable or payable balances, including accrued interest. The Company requires counterparties to deposit additional collateral or return collateral pledged, as necessary, to ensure the market value of the underlying collateral remains sufficient. Securities and other inventory positions owned that are financed under repurchase agreements are carried at market value with changes in market value recorded in the Consolidated Statement of Income.
The Company uses interest rate swaps as an end user to modify the interest rate exposure associated with certain fixed-rate resale and repurchase agreements. The Company adjusts the carrying value of these secured financing transactions that have been designated as the hedged item.
Securities Borrowed and Loaned Securities borrowed and securities loaned are carried at the amount of cash collateral advanced or received plus accrued interest. It is the Company’s policy to value the securities borrowed and loaned on a daily basis and to obtain additional cash as necessary to ensure such transactions are adequately collateralized.
Other Secured Borrowings Other secured borrowings are recorded at contractual amounts plus accrued interest.
76
Private Equity Investments
The Company carries its private equity investments, including its partnership interests, at fair value based on the Company’s assessment of each underlying investment.
Long-Lived Assets
Property, equipment and leasehold improvements are recorded at historical cost, net of accumulated depreciation and amortization. Depreciation is recognized using the straight-line method over the estimated useful lives of the assets. Buildings are depreciated up to a maximum of 40 years. Leasehold improvements are amortized over the lesser of their useful lives or the terms of the underlying leases, ranging up to 30 years. Equipment, furniture and fixtures are depreciated over periods of up to 15 years. Internal use software that qualifies for capitalization under AICPA Statement of Position 98-1, “Accounting for the Costs of Computer Software Developed or Obtained for Internal Use,” is capitalized and subsequently amortized over the estimated useful life of the software, generally three years, with a maximum of seven years. The Company reviews long-lived assets for impairment whenever events or changes in circumstances indicate the carrying amount of the assets may not be recoverable. If the expected future undiscounted cash flows are less than the carrying amount of the asset, an impairment loss would be recognized to the extent the carrying value of such asset exceeded its fair value.
Identifiable Intangible Assets and Goodwill
On December 1, 2001, the Company adopted SFAS No. 141, “Business Combinations,” (“SFAS 141”) and SFAS No. 142, “Goodwill and Other Intangible Assets” (“SFAS 142”). SFAS 141 requires all business combinations initiated after June 30, 2001 to be accounted for using the purchase method. Under SFAS 142, intangible assets with indefinite lives and goodwill are not permitted to be amortized. Instead, these assets are evaluated at least annually for impairment. Prior to December 1, 2001 the Company amortized goodwill using the straight-line method over periods not exceeding 35 years. Goodwill is reduced upon the recognition of certain acquired net operating loss carryforward benefits.
Equity-Based Compensation
SFAS No. 123, “Accounting for Stock-Based Compensation,” (“SFAS 123”) established financial accounting and reporting standards for equity-based employee and non-employee compensation. SFAS 123 permits companies to account for equity-based employee compensation using the intrinsic-value method prescribed by Accounting Principles Board (“APB”) Opinion No. 25, “Accounting for Stock Issued to Employees,” (“APB 25”), or using the fair-value method prescribed by SFAS 123. Through November 30, 2003 the Company followed APB 25 and its related interpretations to account for equity-based employee compensation. Accordingly, no compensation expense was recognized for stock option awards because the exercise price equaled or exceeded the market value of the Company’s common stock on the grant date. Compensation expense was recognized for restricted stock units with future service requirements over the relevant service periods.
Beginning in 2004, the Company will adopt the fair-value method of accounting for equity-based employee awards using the prospective transition method permitted by SFAS No. 148, “Accounting for Stock-Based Compensation—Transition and Disclosure” (“SFAS 148”). Under this method of transition, compensation expense will be recognized based on the fair value of stock options and restricted stock units granted for 2004 and future years over the related service period. Stock options granted for the years ended November 30, 2003 and before will continue to be accounted for under APB 25. The following table illustrates the effect on net income and earnings per share for the years ended November 30, 2003, 2002 and 2001 if the fair-value-based method prescribed by SFAS 123 had been applied to all outstanding and unvested awards:
EQUITY BASED COMPENSATION–PRO FORMA NET INCOME AND EARNINGS PER SHARE
IN MILLIONS EXCEPT PER SHARE DATA
YEAR ENDED NOVEMBER 30 | | 2003 | | 2002 | | 2001 | |
| | | | | | | |
Net income, as reported | | $ | 1,699 | | $ | 975 | | $ | 1,255 | |
Add: stock-based employee compensation expense included in reported net income, net of related tax effect | | 362 | | 330 | | 303 | |
Deduct: stock-based employee compensation expense determined under the fair-value-based method for all awards, net of related tax effect | | (534 | ) | (475 | ) | (375 | ) |
Pro forma net income | | $ | 1,527 | | $ | 830 | | $ | 1,183 | |
Earnings per share: | | | | | | | |
Basic, as reported | | $ | 6.71 | | $ | 3.69 | | $ | 4.77 | |
Basic, pro forma | | $ | 6.01 | | $ | 3.10 | | $ | 4.48 | |
Diluted, as reported | | $ | 6.35 | | $ | 3.47 | | $ | 4.38 | |
Diluted, pro forma | | $ | 5.77 | | $ | 2.95 | | $ | 4.20 | |
77
The Company used the Black-Scholes option-pricing model to quantify the pro forma effects on net income and earnings per common share of the fair value of the stock options granted and outstanding during 2003, 2002 and 2001. Based on the results of the model, the weighted-average fair values of the stock options granted were $22.02, $19.07 and $13.54 for 2003, 2002 and 2001, respectively. The weighted-average assumptions used for 2003, 2002 and 2001 included risk-free interest rates of 3.10%, 3.26% and 4.16%, expected lives of 4.6 years, 5.3 years and 4.5 years, and expected volatilities of 35%, 35% and 30%, respectively. In addition, annual dividends per share of $0.48, $0.36 and $0.28 were used for the 2003, 2002 and 2001 options, respectively. The pro forma amounts reflect the effects of the Company’s stock option grants and the 15% purchase discount from market value offered to the Company’s employees who participate in the Employee Stock Purchase Plan. Had the Company elected to expense its stock options in 2003 under the prospective alternative of SFAS 148, net income and earnings per share would have decreased by $40 million and $0.15 per share, respectively. The Company’s stock-based employee compensation plans are described more fully in Note 15 to the Consolidated Financial Statements.
Earnings per Common Share
The Company computes earnings per common share (“EPS”) in accordance with SFAS No. 128, “Earnings per Share.” Basic EPS is computed by dividing income available to common stockholders by the weighted-average number of common shares outstanding for the period. Diluted EPS reflects the assumed conversion of all dilutive securities. For additional information see Notes 14 and 16 to the Consolidated Financial Statements.
Income Taxes
The Company accounts for income taxes in accordance with SFAS No. 109, “Accounting for Income Taxes,” (“SFAS 109”). The Company recognizes the current and deferred tax consequences of all transactions that have been recognized in the financial statements using the provisions of the enacted tax laws. Deferred tax assets are recognized for temporary differences that will result in deductible amounts in future years and for tax loss carry-forwards. The Company records a valuation allowance to reduce deferred tax assets to an amount that more likely than not will be realized. Deferred tax liabilities are recognized for temporary differences that will result in taxable income in future years.
Statement of Cash Flows
The Company defines cash equivalents as highly liquid investments with original maturities of three months or less, other than those held for sale in the ordinary course of business.
Translation of Foreign Currencies
Assets and liabilities of foreign subsidiaries having non-U.S. dollar functional currencies are translated at exchange rates at the Consolidated Statement of Financial Condition date. Revenues and expenses are translated at average exchange rates during the period. The gains or losses resulting from translating foreign currency financial statements into U.S. dollars, net of hedging gains or losses and taxes, are included in Accumulated other comprehensive income, a component of Stockholders’ equity. Gains or losses resulting from foreign currency transactions are included in the Consolidated Statement of Income.
NOTE 2 SECURITIES AND OTHER INVENTORY POSITIONS
Securities and other inventory positions owned and Securities and other inventory positions sold but not yet purchased are recorded at fair value and were comprised of the following:
SECURITIES AND OTHER INVENTORY POSITIONS
IN MILLIONS
NOVEMBER 30 | | 2003 | | 2002 | |
| | | | | |
Securities and other inventory positions owned: | | | | | |
Mortgages, mortgage-backed and real estate inventory positions | | $ | 38,957 | | $ | 34,431 | |
Government and agencies | | 35,072 | | 28,543 | |
Derivatives and other contractual agreements | | 15,766 | | 13,862 | |
Corporate debt and other | | 20,069 | | 15,620 | |
Corporate equities | | 22,889 | | 21,252 | |
Certificates of deposit and other money market instruments | | 4,287 | | 5,570 | |
| | $ | 137,040 | | $ | 119,278 | |
| | | | | |
Securities and other inventory positions sold but not yet purchased: | | | | | |
Government and agencies | | $ | 47,556 | | $ | 40,852 | |
Derivatives and other contractual agreements | | 11,440 | | 10,126 | |
Corporate debt and other | | 5,951 | | 8,927 | |
Corporate equities | | 10,935 | | 9,129 | |
| | $ | 75,882 | | $ | 69,034 | |
78
NOTE 3 DERIVATIVE FINANCIAL INSTRUMENTS
In the normal course of business, the Company enters into derivative transactions both in a trading capacity and as an end-user. The Company’s derivative activities (both trading and end-user) are recorded at fair value in the Consolidated Statement of Financial Condition. Acting in a trading capacity, the Company enters into derivative transactions to satisfy the needs of its clients and to manage its own exposure to market and credit risks resulting from its trading activities (collectively, “Trading-Related Derivative Activities”). As an end-user, the Company primarily enters into interest rate swap and option contracts to adjust the interest rate nature of its funding sources from fixed to floating rates and to change the index upon which floating interest rates are based (e.g., Prime to LIBOR).
Derivatives are subject to various risks similar to other financial instruments, including market, credit and operational risk. In addition, the Company may be exposed to legal risks related to its derivative activities, including the possibility a transaction may be unenforceable under applicable law. The risks of derivatives should not be viewed in isolation, but rather should be considered on an aggregate basis along with the Company’s other trading-related activities. The Company manages the risks associated with derivatives on an aggregate basis along with the risks associated with its proprietary trading and market-making activities in cash instruments, as part of its firmwide risk management policies.
The Company records its Trading-Related Derivative Activities at fair value with realized and unrealized gains and losses recognized in Principal transactions in the Consolidated Statement of Income. Unrealized gains and losses on derivative contracts are recorded on a net basis in the Consolidated Statement of Financial Condition for those transactions with counterparties executed under a legally enforceable master netting agreement and are netted across products when such provisions are stated in the master netting agreement. The Company offers equity, fixed income and foreign exchange products to its customers. Because of the integrated nature of the market for such products, each product area trades cash instruments as well as derivative products.
The following table presents the fair value of the Company’s derivatives at November 30, 2003 and 2002. Assets included in the table represent unrealized gains, net of unrealized losses for situations in which the Company has a master netting agreement. Similarly, liabilities represent net amounts owed to counterparties. The fair value of assets/liabilities related to derivative contracts at November 30, 2003 and 2002 represents the Company’s net receivable/payable for derivative financial instruments before consideration of collateral. Included within the $15,766 million fair value of assets at November 30, 2003 was $13,567 million related to swaps and other OTC contracts and $2,199 million related to exchange-traded option and warrant contracts. Included within the $13,862 million fair value of assets at November 30, 2002 was $12,846 million related to swaps and other OTC contracts and $1,016 million related to exchange-traded option and warrant contracts.
FAIR VALUE OF DERIVATIVES AND OTHER CONTRACTUAL AGREEMENTS
| | Fair Value (1)
November 30, 2003 | | Fair Value (1)
November 30, 2002 | |
IN MILLIONS | | Assets | | Liabilities | | Assets | | Liabilities | |
| | | | | | | | | |
Interest rate, currency and credit default swaps and options (including caps, collars and floors) | | $ | 7,602 | | $ | 5,614 | | $ | 9,046 | | $ | 7,087 | |
Foreign exchange forward contracts and options | | 1,807 | | 1,982 | | 814 | | 1,157 | |
Other fixed income securities contracts
(including futures contracts, options and TBAs) | | 1,264 | | 750 | | 602 | | 215 | |
Equity contracts (including equity swaps, warrants and options) | | 5,093 | | 3,094 | | 3,400 | | 1,667 | |
| | $ | 15,766 | | $ | 11,440 | | $ | 13,862 | | $ | 10,126 | |
(1) Amounts represent carrying value (exclusive of collateral) and do not include receivables or payables related to exchange-traded futures contracts.
79
The primary difference in risks between OTC and exchange-traded contracts is credit risk. OTC contracts contain credit risk for unrealized gains, net of collateral, from various counterparties for the duration of the contract. With respect to OTC contracts, including swaps, the Company views its net credit exposure to third parties to be $9,457 million and $8,223 million at November 30, 2003 and 2002, respectively, representing the fair value of the Company’s OTC contracts in an unrealized gain position, after consideration of collateral.
Presented below is an analysis of the Company’s net credit exposure at November 30, 2003 for OTC contracts based on actual ratings made by external rating agencies or by equivalent ratings established and used by the Company’s Credit Risk Management Department.
NET CREDIT EXPOSURE
Counterparty
Risk Rating | | S&P/Moody’s
Equivalent | | Less
than
1 Year | | 1-5
Years | | 5-10
Years | | Greater
than
10 Years | | Total
2003 | | Total
2002 | |
| | | | | | | | | | | | | | | |
1 | | AAA/Aaa | | 6 | % | 3 | % | 3 | % | 3 | % | 15 | % | 15 | % |
| | | | | | | | | | | | | | | |
2 | | AA-/Aa3 or higher | | 12 | % | 5 | % | 6 | % | 7 | % | 30 | % | 30 | % |
| | | | | | | | | | | | | | | |
3 | | A-/A3 or higher | | 11 | % | 9 | % | 5 | % | 9 | % | 34 | % | 33 | % |
| | | | | | | | | | | | | | | |
4 | | BBB-/Baa3 or higher | | 5 | % | 5 | % | 2 | % | 6 | % | 18 | % | 17 | % |
| | | | | | | | | | | | | | | |
5 | | BB-/Ba3 or higher | | 1 | % | — | | 1 | % | — | | 2 | % | 4 | % |
| | | | | | | | | | | | | | | |
6 | | B+/B1 or lower | | 1 | % | — | | — | | — | | 1 | % | 1 | % |
Total | | | | 36 | % | 22 | % | 17 | % | 25 | % | 100 | % | 100 | % |
Counterparties to the Company’s OTC derivative products are primarily financial intermediaries (U.S. and foreign banks), securities firms, corporations, governments and their agencies, finance companies, insurance companies, investment companies and pension funds. Collateral held related to OTC contracts generally includes cash and U.S. government and federal agency securities.
The Company is also subject to credit risk related to its exchange-traded derivative contracts. Exchange-traded contracts, including futures and certain options, are transacted directly on exchanges. To protect against the potential for a default, all exchange clearinghouses impose net capital requirements for their membership. Additionally, exchange clearinghouses require counterparties to futures contracts to post margin upon the origination of the contracts and for any changes in the market value of the contracts on a daily basis (certain foreign exchanges provide for settlement within three days). Therefore, the potential for credit losses from exchange-traded products is limited.
End-User Derivative Activities
The Company uses a variety of derivative products for non-trading purposes as an end user to modify the interest rate characteristics of its long-term debt portfolio and certain secured financing activities. In this regard, the Company primarily enters into fair value hedges using interest rate swaps to convert a substantial portion of its fixed rate long-term debt and certain term fixed-rate secured financing activities to floating interest rates. The ineffective portion of the fair value hedges was included in Interest expense in the Consolidated Statement of Income and was not material to the Company’s results for the years ended November 30, 2003, 2002 and 2001. At November 30, 2003 and 2002, the notional amounts of the Company’s End-User Derivative Activities related to its long-term debt obligations were approximately $57.6 billion and $49.1 billion, respectively. (For additional information about Company’s long-term-debt-related End-User Derivative Activities see Note 9 to the Consolidated Financial Statements.)
The Company also uses derivative products as an end-user to modify its interest rate exposure associated with its secured financing activities, including Securities purchased under agreements to resell, Securities borrowed, Securities sold under agreements to repurchase, Securities loaned and Other secured borrowings. As with the Company’s long-term debt, its secured financing activities expose the Company to interest rate risk. The Company, as an end-user, manages the interest rate risk related to these activities by using derivative financial instruments, including interest rate swaps and purchased options. The Company designates certain specific derivative transactions as hedges of specific assets and liabilities with matching maturities. At November 30, 2003 and 2002, the Company, as an end-user, used derivative financial instruments with an aggregate notional amount of $8.1 billion and $6.9 billion, respectively, to modify the interest rate characteristics of its secured financing activities. The total notional amount of these agreements had a weighted-average maturity of 4.5 years and 5.3 years at November 30, 2003 and 2002, respectively.
80
NOTE 4 SECURITIZATIONS AND OTHER OFF-BALANCE SHEET ARRANGEMENTS
The Company is a market leader in mortgage- and asset-backed securitizations and other structured financing arrangements. In connection with these activities, the Company uses SPEs principally for (but not limited to) the securitization of commercial and residential mortgages, home equity loans, government and corporate bonds, and lease and trade receivables. The majority of the Company’s involvement with SPEs relates to securitization transactions meeting the SFAS 140 definition of a QSPE. Based on the guidance in SFAS 140, the Company does not consolidate such QSPEs. The Company derecognizes financial assets transferred in securitizations, provided it has relinquished control over such assets. The Company may retain an interest in the financial assets it securitizes (“retained interests”), which may include assets in the form of residual interests in the SPEs established to facilitate the securitization. Any retained interests are included in Securities and other inventory positions owned (principally Mortgages and mortgage-backed) in the Consolidated Statement of Financial Condition. For further information regarding the accounting for securitization transactions, refer to Note 1, Summary of Significant Accounting Policies—Consolidation Accounting Policies. During 2003, 2002 and 2001, the Company securitized approximately $173 billion, $155 billion and $110 billion of financial assets, including $138 billion, $108 billion and $50 billion of residential mortgages, $10 billion, $15 billion and $11 billion of commercial mortgages and $25 billion, $32 billion and $49 billion of municipal and other asset-backed financial instruments, respectively.
At November 30, 2003 and 2002, the Company had approximately $1.0 billion and $1.1 billion, respectively, of non-investment grade retained interests from its securitization activities (principally junior security interests in securitizations) including $0.2 billion and $0.5 billion of commercial mortgages, $0.6 billion and $0.4 billion of residential mortgages, and $0.2 billion and $0.2 billion of other asset-backed financial instruments, respectively. The Company records its trading assets at fair value, including those assets held prior to securitization, as well as any retained interests post-securitization. Mark-to-market gains or losses are recorded in Principal transactions in the Consolidated Statement of Income. Fair value is determined based on listed market prices, if available. When market prices are not available, fair value is determined based on valuation pricing models that take into account relevant factors such as discount, credit and prepayment assumptions, and also considers comparisons to similar market transactions.
The tables below outline the key economic assumptions used in measuring the fair value of retained interests:
November 30, 2003 | | Residential
Mortgages | | Commercial
Mortgages | | Other
Asset-Backed | |
| | | | | | | |
Weighted-average life | | 4 years | | 1 year | | 7 years | |
Annual prepayment rate | | 5 - 90 CPR | | 0 - 15 CPR | | 0 - 12 CPR | |
Credit loss assumption | | 0.5 - 7 | % | 2 - 27 | % | 3 - 12 | % |
Weighted-average discount rate | | 21 | % | 17 | % | 3 | % |
November 30, 2002 | | Residential
Mortgages | | Commercial
Mortgages | | Other
Asset-Backed | |
| | | | | | | |
Weighted-average life | | 3 years | | 1 year | | 5 years | |
Annual prepayment rate | | 4 - 65 CPR | | 0 - 15 CPR | | 8 - 15 CPR | |
Credit loss assumption | | 0.5 - 6 | % | 2 - 17 | % | 3 - 10 | % |
Weighted-average discount rate | | 17 | % | 20 | % | 5 | % |
81
The table below outlines the sensitivity of the fair value of the retained interests to immediate 10% and 20% adverse changes in the preceding assumptions:
| | November 30, 2003 | | November 30, 2002 | |
IN MILLIONS | | Residential
Mortgages | | Commercial
Mortgages | | Other
Asset-Backed | | Residential
Mortgages | | Commercial
Mortgages | | Other
Asset-Backed | |
| | | | | | | | | | | | | |
Prepayment speed: | | | | | | | | | | | | | |
Impact of 10% adverse change | | $ | 2 | | $ | — | | $ | — | | $ | 4 | | $ | — | | $ | 1 | |
Impact of 20% adverse change | | $ | 5 | | $ | — | | $ | — | | $ | 8 | | $ | — | | $ | 2 | |
Assumed credit losses: | | | | | | | | | | | | | |
Impact of 10% adverse change | | $ | 21 | | $ | 6 | | $ | 9 | | $ | 17 | | $ | — | | $ | 12 | |
Impact of 20% adverse change | | $ | 40 | | $ | 6 | | $ | 18 | | $ | 33 | | $ | 12 | | $ | 24 | |
Discount rate: | | | | | | | | | | | | | |
Impact of 10% adverse change | | $ | 25 | | $ | — | | $ | 23 | | $ | 17 | | $ | — | | $ | 12 | |
Impact of 20% adverse change | | $ | 49 | | $ | — | | $ | 45 | | $ | 34 | | $ | — | | $ | 24 | |
The sensitivity analysis in the preceding table is hypothetical and should be used with caution because the above stresses are performed without considering the effect of hedges, which serve to reduce the Company’s actual risk. In addition, these results are calculated by stressing a particular economic assumption independent of changes in any other assumption (as required by U.S. GAAP); in reality, changes in one factor often result in changes in another factor (for example, changes in discount rates will often impact expected prepayment speeds). Further, changes in the fair value based on a 10% or 20% variation in an assumption should not be extrapolated because the relationship of the change in the assumption to the change in fair value may not be linear.
The following table summarizes cash flows between the Company and securitization trusts:
IN MILLIONS
YEAR ENDED NOVEMBER 30, 2003 | | Residential
Mortgages | | Commercial
Mortgages | | Other
Asset-Backed | |
| | | | | | | |
Purchases of delinquent loans | | $ | 155 | | $ | — | | $ | — | |
Cash flows received on retained interests | | $ | 214 | | $ | 11 | | $ | 111 | |
Substantially all of the Company’s residential and commercial securitization activities are transacted through QSPEs. The Company also securitizes municipal bonds through QSPEs in which the Company sells municipal bonds to an SPE and generally purchases a junior interest in such securitization. At November 30, 2003, the Company also had liquidity commitments of approximately $5.1 billion related to trust certificates in such SPEs backed by investment grade municipal securities. The Company’s obligations under such liquidity commitments are generally less than one year and are further limited because the Company’s obligations cease if the underlying assets are downgraded below investment grade or default.
However, certain SPEs do not meet the QSPE criteria due to their permitted activities not being sufficiently limited, or because the assets are not deemed qualifying financial instruments (e.g., real estate). FIN 46 defines entities in which equity investors do not have the characteristics of a controlling financial interest or entities which do not have sufficient legal equity at risk for the entity to finance its activities without additional subordinated financial support from other parties as VIEs. Under FIN 46, the Company is required to consolidate a VIE if it is deemed to be the primary beneficiary of such entity. The primary beneficiary is the party that has either a majority of the expected losses or a majority of the expected residual returns
82
of such entity, as defined. FIN 46 is effective for the Company’s involvement with VIEs created after January 31, 2003. With respect to the Company’s involvement with SPEs established prior to February 1, 2003, the Company follows the accounting guidance provided by EITF Topic D-14, “Transactions involving Special-Purpose Entities,” to determine whether consolidation is required. Under this guidance, the Company is not required to, and does not consolidate such SPE if a third party investor made a substantive equity investment in the SPE (minimum of 3%), was subject to first dollar risk of loss of such SPE, and had a controlling financial interest. Examples of the Company’s involvement with such VIEs include: collateralized debt obligations (“CDOs”), synthetic credit transactions, and other structured financing transactions.
With respect to CDO transactions in which a diversified portfolio of securities and/or loans is owned by an SPE and managed by an independent asset manager, the Company’s role is principally limited to acting as structuring and placement agent, warehouse provider, underwriter and market maker in the related CDO securities. In a typical CDO, at the direction of a third party asset manager, the Company will warehouse securities or loans on its balance sheet, pending the transfer to the SPE once the permanent financing is completed in the capital markets. During 2003, the Company acted as warehouse provider and underwriter for approximately $601 million of CDO transactions. At November 30, 2003, the Company did not have any significant continuing involvement in the CDOs arranged by the Company other than acting as market maker (i.e., holding minority amounts of investment grade securities purchased in the secondary markets for short time periods) and, as such, the Company is not required to consolidate these transactions. At November 30, 2003, the Company’s holdings of subordinated classes in such CDO transactions was not material.
The Company is a dealer in credit default swaps and, as such, makes a market in buying and selling credit protection on single issuers as well as on portfolios of credit exposures. One of the mechanisms used by the Company to mitigate credit risk is synthetic credit transactions entered into with SPEs. In these transactions, the Company purchases credit protection in the form of a credit default swap from the SPE on referenced obligations (single issuer or portfolio). The Company pays a premium to the SPE for this protection and is secured by high quality collateral purchased by the SPE. Third party investors in these SPEs are subject to default risk associated with the referenced obligations under the default swap as well as credit risk to the assets held by the SPE. The Company’s maximum loss associated with its involvement with such synthetic credit transactions is the fair value of the Company’s credit default swaps with such SPEs, which approximated $229 million at November 30, 2003. While this amount represents the maximum amount the Company could potentially lose on such agreements, the maximum loss is highly unlikely because the value of the underlying collateral held by the SPEs was $6.6 billion and was investment grade quality. Since the results of our expected loss calculations generally demonstrate that the investors in the SPE bear a majority of the entity’s expected losses (as the investors assume default risk associated with both the reference portfolio and the SPE’s assets), the Company is not deemed to be the primary beneficiary of these transactions and as such does not consolidate under FIN 46.
The Company also enters into certain structured financing transactions with SPEs to facilitate customers’ investment and/or funding needs. The Company’s involvement in these transactions is generally limited to providing liquidity or other limited default protection to investors. In this regard, the Company provided liquidity protection to SPEs of approximately $0.7 billion and $3.3 billion as of November 30, 2003 and 2002, respectively. The Company’s maximum loss associated with such commitments is $0.7 billion at November 30, 2003, however the Company believes its actual risk to be significantly less as these liquidity commitments are generally overcollateralized with investment grade collateral. The Company anticipates consolidating such entities upon adoption of FIN 46 in the first quarter of 2004. In addition, the Company also provides certain limited downside default protection to investors in SPEs. The Company’s maximum loss under such commitments was approximately $1.8 billion and $1.6 billion, at November 30, 2003 and 2002, respectively. As the investor in such SPE bears all upside potential and significant downside variability, the Company is not deemed to be the primary beneficiary of these entities and as such does not expect to consolidate upon adoption of FIN 46 in the first quarter of 2004. The Company believes its actual exposure to be significantly less than the maximum exposure disclosed above, as the Company’s obligations are collateralized by the SPEs’ assets and contain significant constraints under which such downside protection will be available.
In December 2003, the FASB issued a revised interpretation of FIN 46 that clarifies certain of the original interpretation’s provisions. While the Company has not yet completed its analysis of FIN 46 as revised, the Company does not anticipate that the adoption of the interpretation will have a material impact on the Company’s financial condition or its results of operations.
83
NOTE 5 SECURITIES PLEDGED AS COLLATERAL
The Company enters into secured borrowing and lending transactions to finance trading inventory positions, obtain securities for settlement and meet customers’ needs. The Company receives collateral in connection with resale agreements, securities borrowed transactions, customer margin loans and certain other loans. The Company is generally permitted to sell or repledge these securities held as collateral and use the securities to secure repurchase agreements, enter into securities lending transactions or deliver to counterparties to cover short positions. The Company carries secured financing agreements for financial reporting purposes on a net basis when permitted under the provisions of Financial Accounting Standards Board Interpretation No. 41, “Offsetting of Amounts Related to Certain Repurchase and Reverse Repurchase Agreements” (“FIN 41”).
At November 30, 2003 and 2002, the fair value of securities received as collateral and securities owned that have not been sold, repledged or otherwise encumbered totaled approximately $67 billion and $51 billion, respectively. At November 30, 2003 and 2002, the gross fair value of securities received as collateral that the Company was permitted to sell or repledge was approximately $413 billion and $345 billion, respectively. Of this collateral, approximately $385 billion and $328 billion at November 30, 2003 and 2002, respectively, has been sold or repledged, generally as collateral under repurchase agreements or to cover Securities and other inventory positions sold but not yet purchased. Included in the $385 billion and $328 billion at November 30, 2003 and 2002, respectively, the Company had pledged securities, primarily fixed income, having a market value of approximately $55.5 billion and $41.6 billion, respectively, as collateral for securities borrowed having a market value of approximately $54.7 billion and $40.6 billion, respectively.
The Company also pledges its own assets, principally to collateralize certain financing arrangements. These pledged securities, where the counterparty has the right, by contract or custom, to rehypothecate the financial instruments are classified as Securities and other inventory positions owned, pledged as collateral, in the Consolidated Statement of Financial Condition as required by SFAS 140.
The carrying value of Securities and other inventory positions owned that have been pledged or otherwise encumbered to counterparties where those counterparties do not have the right to sell or repledge was approximately $47 billion and $49 billion at November 30, 2003 and November 30, 2002, respectively.
NOTE 6 BUSINESS COMBINATIONS
On October 31, 2003, the Company acquired Neuberger Berman Inc. and its subsidiaries (“Neuberger”) by means of a merger into a wholly-owned subsidiary of Holdings. The results of Neuberger’s operations are included in the consolidated financial statements since that date. Neuberger is an investment advisory company that engages in wealth management services including private asset management, tax and financial planning, and personal and institutional trust services, mutual funds, institutional management and alternative investments, and professional securities services.
The Company purchased Neuberger for a net purchase price of approximately $2,788 million, including cash consideration and incidental costs of $690 million, equity consideration of $2,374 million (including 32.3 million shares of common stock, 0.3 million shares of restricted common stock and 3.5 million vested stock options) and excluding net cash and short-term investments acquired of $276 million. The Company also issued approximately 0.5 million shares of restricted common stock valued at $42 million, which is subject to future service requirements and will be amortized over the applicable service periods (for additional information see Note 15 to the Consolidated Financial Statements). The value of the common shares issued that was used to record the transaction was determined based on the average closing market price of the Company’s common shares from October 27, 2003 through October 31, 2003. The vested stock options issued were valued using the Black-Scholes option-pricing model and had a weighted-average life of approximately seven years and a weighted-average exercise price of $60.10. At November 30, 2003 approximately 3.1 million options with a weighted-average remaining life of approximately seven years and a weighted-average exercise price of $62.61 remain outstanding.
84
The following table summarizes the estimated fair values of the assets acquired and liabilities assumed at October 31, 2003, the date of acquisition. The Company is obtaining third party valuations of certain intangible assets and the allocation of the purchase price therefore is subject to refinement.
IN MILLIONS | | | | |
| | | | |
Cash, receivables and financial instruments | | $ | 2,717 | |
Fixed and other assets | | 212 | |
Amortizable intangible assets | | 431 | |
Indefinite-life intangible assets | | 520 | |
Goodwill | | 2,254 | |
Total assets acquired | | $ | 6,134 | |
| | | |
Liabilities and financial instruments | | $ | (2,469 | ) |
Deferred tax liability | | (420 | ) |
Long-term debt | | (181 | ) |
Total liabilities assumed | | $ | (3,070 | ) |
The $431 million of acquired amortizable intangible assets have a weighted-average useful life of approximately 20 years. The amortizable intangible assets include computer software of $29 million (five-year weighted-average useful life) and customer lists of $402 million (21 year weighted-average useful life). Indefinite-life intangible assets consist of the Neuberger Berman trade name and mutual fund customer-related intangibles. The $2,254 million of goodwill was assigned to the Client Services business segment. Of that amount approximately $125 million is expected to be deductible for tax purposes.
During 2003, the Company also acquired two originators and servicers of residential loans, The Crossroads Group, a diversified private equity fund investment manager, and the fixed income asset management business of Lincoln Asset Management, for an aggregate total cost of $172 million, which was paid in cash and notes.
Goodwill recognized in those transactions amounted to $113 million, substantially all of which is related to The Crossroads Group, and is expected to be deductible for tax purposes. Goodwill was assigned to the Capital Markets and Client Services business segments in the amounts of $19 million and $94 million, respectively.
The following table sets forth the unaudited pro forma combined operating results of the Company for the years ended November 30, 2003 and 2002 as if the acquisitions discussed above had been completed at the beginning of 2003 and 2002. These pro forma amounts do not consider any anticipated revenue or expense saving synergies. In addition, the Neuberger acquisition occurred at October 31, 2003 when Neuberger assets under management totaled approximately $68 billion while assets under management at the beginning of the year totaled only $56 billion.
IN MILLIONS, EXCEPT PER
SHARE AMOUNTS | | 2003 | | 2002 | |
| | | | | |
Net revenues | | $ | 9,383 | | $ | 6,981 | |
Net income | | 1,722 | | 1,014 | |
Basic earnings per share | | 6.24 | | 3.64 | |
Diluted earnings per share | | 5.93 | | 3.44 | |
| | | | | | | |
NOTE 7 IDENTIFIABLE INTANGIBLE ASSETS AND GOODWILL
The table below presents information about the Company’s acquired intangible assets at November 30, 2003.
Aggregate amortization expense for the years ended November 30, 2003, 2002 and 2001 was $11 million, $5 million and $13 million, respectively. Estimated amortization expense for the years ending November 30, 2004, 2005, 2006, 2007 and 2008 is $36 million, $36 million, $36 million, $35 million and $28 million, respectively.
IN MILLIONS
NOVEMBER 30, 2003 | | Gross Carrying
Amount | | Accumulated
Amortization | |
| | | | | |
Amortizable intangible assets: | | | | | |
Customer lists | | $ | 448 | | $ | 11 | |
Other | | 100 | | 23 | |
Total | | $ | 548 | | $ | 34 | |
| | | | | | |
Unamortizable intangible assets: | | | | | | |
Mutual fund customer-related intangibles | | $ | 395 | | | | |
Trade name | | 125 | | | | |
Total | | $ | 520 | | | | |
85
The changes in the carrying amount of goodwill for the year ended November 30, 2003, are as follows:
GOODWILL
IN MILLIONS | | Capital
Markets | | Client
Services | | Total | |
| | | | | | | |
Balance (net) at November 30, 2002 | | $ | 135 | | $ | 25 | | $ | 160 | |
Goodwill acquired during the year | | 19 | | 2,348 | | 2,367 | |
Balance (net) at November 30, 2003 | | $ | 154 | | $ | 2,373 | | $ | 2,527 | |
NOTE 8 SHORT-TERM FINANCINGS
The Company obtains short-term financing on both a secured and unsecured basis. Secured financing is obtained through the use of repurchase agreements and securities loaned agreements, which are primarily collateralized by government, government agency and equity securities. The unsecured financing is generally obtained through short-term debt and the issuance of commercial paper.
The Company’s commercial paper and short-term debt financing is comprised of the following:
SHORT-TERM DEBT
IN MILLIONS
NOVEMBER 30 | | 2003 | | 2002 | |
| | | | | |
Commercial paper | | $ | 1,559 | | $ | 1,622 | |
Short-term debt: | | | | | |
Secured bank loans | | 16 | | 457 | |
Payables to banks | | 149 | | 95 | |
Other short-term debt (1) | | 607 | | 195 | |
Commercial paper and short-term debt | | $ | 2,331 | | $ | 2,369 | |
(1) Includes master notes, corporate loans and other short-term financings.
At November 30, 2003 and 2002, the weighted-average interest rates for short-term borrowings, including commercial paper, were 1.2% and 1.7%, respectively. The Company’s short-term financing includes $324 million and $116 million of short-term debt at November 30, 2003 and 2002, respectively, related to non-U.S. dollar obligations.
Credit Facilities
Holdings maintains a revolving credit agreement (the “Credit Agreement”) with a syndicate of banks. Under the Credit Agreement, the banks have committed to provide up to $1 billion through April 2005. The Credit Agreement contains covenants that require, among other things, that the Company maintain a specified level of tangible net worth. The Company views the Credit Agreement as one of its many sources of liquidity available through its funding framework, and, as such, the Company uses this liquidity for general business purposes from time to time. The Company also maintains a $750 million multi-currency revolving credit facility for Lehman Brothers Bank AG (LBBAG) (the “Facility”). The Facility has a term of 364 days expiring on October 27, 2004, with an option to extend payment for an additional 364 days. There were no borrowings outstanding under either the Credit Agreement or the Facility at November 30, 2003, although drawings have been made under both and repaid from time to time during the year. The Company has maintained compliance with the applicable covenants for both the Credit Agreement and the Facility at all times.
86
NOTE 9 LONG-TERM DEBT
LONG-TERM DEBT
| | U.S. Dollar | | Non-U.S. Dollar | | | | | |
IN MILLIONS
NOVEMBER 30 | | Fixed
Rate | | Floating
Rate | | Fixed
Rate | | Floating
Rate | | 2003 | | 2002 | |
| | | | | | | | | | | | | |
SENIOR NOTE | | | | | | | | | | | | | |
Maturing in fiscal 2003 | | $ | — | | $ | — | | $ | — | | $ | — | | $ | — | | $ | 7,484 | |
Maturing in fiscal 2004 | | 1,719 | | 3,081 | | 1,465 | | 1,153 | | 7,418 | | 7,246 | |
Maturing in fiscal 2005 | | 2,010 | | 2,723 | | 340 | | 1,695 | | 6,768 | | 4,180 | |
Maturing in fiscal 2006 | | 2,871 | | 1,584 | | 854 | | 1,275 | | 6,584 | | 4,791 | |
Maturing in fiscal 2007 | | 1,560 | | 418 | | 1,649 | | 1,028 | | 4,655 | | 4,206 | |
Maturing in fiscal 2008 | | 3,579 | | 1,159 | | 104 | | 1,283 | | 6,125 | | 2,017 | |
December 1, 2008 and thereafter | | 5,361 | | 708 | | 1,273 | | 2,411 | | 9,753 | | 6,359 | |
Senior Notes | | $ | 17,100 | | $ | 9,673 | | $ | 5,685 | | $ | 8,845 | | $ | 41,303 | | $ | 36,283 | |
| | | | | | | | | | | | | |
SUBORDINATED INDEBTEDNESS | | | | | | | | | | | | | |
Maturing in fiscal 2003 | | $ | — | | $ | — | | $ | — | | $ | — | | $ | — | | $ | 487 | |
Maturing in fiscal 2004 | | 191 | | 35 | | — | | — | | 226 | | 444 | |
Maturing in fiscal 2005 | | 102 | | — | | 3 | | — | | 105 | | 115 | |
Maturing in fiscal 2006 | | 331 | | — | | — | | — | | 331 | | 337 | |
Maturing in fiscal 2007 | | 334 | | — | | 10 | | — | | 344 | | 347 | |
Maturing in fiscal 2008 | | 661 | | 111 | | — | | — | | 772 | | 665 | |
December 1, 2008 and thereafter | | 333 | | 115 | | — | | — | | 448 | | — | |
Subordinated Indebtedness | | 1,952 | | 261 | | 13 | | — | | 2,226 | | 2,395 | |
Long-Term Debt | | $ | 19,052 | | $ | 9,934 | | $ | 5,698 | | $ | 8,845 | | $ | 43,529 | | $ | 38,678 | |
Of the Company’s long-term debt outstanding at November 30, 2003, $771 million is repayable prior to maturity, at the option of the holder, at par value. These obligations are reflected in the above table as maturing at their put dates, in fiscal 2004, rather than at their contractual maturities, which range from fiscal 2004 to fiscal 2026. In addition, $3,164 million of the Company’s long-term debt is redeemable prior to maturity at the option of the Company under various terms and conditions. These obligations are reflected in the above table at their contractual maturity dates.
At November 30, 2003, the Company’s U.S. dollar and non-U.S. dollar debt portfolios included approximately $3,631 million and $4,855 million, respectively, of debt for which the interest rates and/or redemption values have been linked to the performance of various indices, including industry baskets of stocks, commodities or events. Generally, such notes are issued as floating rate notes or the interest rates on such index notes are effectively converted to floating rates based primarily on LIBOR through the use of interest rate, currency and equity swaps.
End-User Derivative Activities
The Company uses a variety of derivative products including interest rate, currency and equity swaps as an end user to modify the interest rate characteristics of its long-term debt portfolio. The Company uses interest rate swaps to convert a substantial portion of the Company’s fixed rate debt to floating interest rates to more closely match the terms of assets being funded and to minimize interest rate risk. In addition, the Company uses cross-currency swaps to hedge its exposure to foreign currency risk as a result of its non-U.S. dollar debt obligations, after consideration of non-U.S. dollar assets that are funded with long-term debt obligations in the same currency. In certain instances, two or more derivative contracts may be used by the Company to manage the interest rate nature and/or currency exposure of an individual long-term debt issuance.
At November 30, 2003 and 2002, the notional amounts of interest rate, currency and equity swaps related to long-term debt obligations were approximately $57.6 billion and $49.1 billion, respectively. In addition, End-User Derivative Activities resulted in the following changes to the mix of fixed and floating rate debt and effective weighted-average rates of interest:
87
EFFECTIVE WEIGHTED-AVERAGE INTEREST RATES OF LONG-TERM DEBT
| | Long-Term Debt | | Weighted-Average (1) | |
IN MILLIONS
NOVEMBER 30, 2003 | | Before
End-User
Activities | | After
End-User
Activities | | Contractual
Interest
Rate | | Effective Rate
After End-User
Activities | |
| | | | | | | | | |
U.S. dollar obligations | | | | | | | | | |
Fixed rate | | $ | 19,052 | | $ | 305 | | | | | |
Floating rate | | 9,934 | | 34,600 | | | | | |
Total U.S. dollar | | 28,986 | | 34,905 | | 4.73 | % | 1.71 | % |
Non-U.S. dollar obligations | | 14,543 | | 8,624 | | | | | |
Total | | $ | 43,529 | | $ | 43,529 | | 4.20 | % | 1.86 | % |
| | Long-Term Debt | | Weighted-Average (1) | |
IN MILLIONS
NOVEMBER 30, 2002 | | Before
End-User
Activities | | After
End-User
Activities | | Contractual
Interest
Rate | | Effective Rate
After End-User
Activities | |
| | | | | | | | | |
U.S. dollar obligations | | | | | | | | | |
Fixed rate | | $ | 18,330 | | $ | 170 | | | | | |
Floating rate | | 9,031 | | 31,729 | | | | | |
Total U.S. dollar | | 27,361 | | 31,899 | | 5.25 | % | 2.14 | % |
Non-U.S. dollar obligations | | 11,317 | | 6,779 | | | | | |
Total | | $ | 38,678 | | $ | 38,678 | | 4.73 | % | 2.29 | % |
(1) Weighted-average interest rates were calculated using non-U.S. dollar interest rates, where applicable.
In March 2002, Holdings issued $575 million of floating rate convertible notes. These notes bear an interest rate at a variable rate of three month LIBOR minus 90 basis points per annum (subject to adjustment in certain events) and mature on April 1, 2022. The notes will also bear a specified additional amount of contingent interest during any quarterly interest period following a quarterly interest period in which the average trading price of the notes is above specified levels. The notes are convertible at $96.10 per share (resulting in approximately 6 million shares), in certain circumstances, including (i) Holdings’ common stock trading above $120.125 for a specified number of trading days, (ii) the trading price of the notes declining to certain levels, (iii) a significant downgrade in the ratings of the notes below a specified level, (iv) the notes being called for redemption and (v) certain other events. Holdings has the option to redeem the notes for cash on or after April 1, 2004. The holders of the notes may cause the Company to repurchase the notes at par on April 1, 2004, 2007, 2012 or 2017. The Company may elect to pay the repurchase price in cash, common stock or a combination of cash and common stock. The holders of the notes may also cause the Company to repurchase the notes for cash upon a change of control of Holdings.
As a result of the Neuberger merger, on October 31, 2003 the Company assumed all obligations under an aggregate of $166 million of zero-coupon convertible notes due May 4, 2021 issued by Neuberger in May 2001. These notes were issued at an aggregate price of $143 million, representing a yield to maturity of 0.75% per year, which is accounted for using the effective interest rate method. In November 2002, the notes were amended to add cash interest payments of 3.047% per annum of the principal amount at maturity paid semi-annually until May 4, 2004. Each $1,000 principal amount at maturity of the notes is convertible into 6.5843 shares of Holdings’ common stock (approximately 1.1 million shares in total) and $131.80 in cash (approximately $21.9 million in total) (based on the merger consideration paid to holders of Neuberger common stock in the merger) in certain circumstances, including (i) Holdings’ common stock trading for a specified number of trading days in any calendar quarter above a specified percentage (beginning at 120% on June 30, 2001 and declining 0.12658% each quarter thereafter) of the accreted value of the notes divided by 8.47717, (ii) a significant downgrade in the ratings of the notes below a specified level, (iii) the notes being called for redemption and (iv) certain other events. The Company may redeem the notes for cash on or after May 4, 2006, at their accreted value. The holders of the notes may cause the Company to repurchase the notes at their accreted value on May 4 of 2004, 2006, 2011 and 2016. The Company may elect to pay the repurchase price in cash, common stock or a combination of cash and common stock. The holders of the notes may also cause Holdings to repurchase the notes for cash upon a change of control of Holdings occurring on or before May 4, 2006.
88
NOTE 10 FAIR VALUE OF FINANCIAL INSTRUMENTS
SFAS No. 107 “Disclosures about Fair Value of Financial Instruments” requires the Company to report the fair value of financial instruments, as defined. Assets and liabilities that are carried at fair value include all of the Company’s trading assets and liabilities, including derivative financial instruments used for trading purposes as described in Note 1, which are recorded as Securities and other inventory positions owned and Securities and other inventory positions sold but not yet purchased.
Assets and liabilities, recorded at contractual amounts, that approximate market or fair value include Cash and cash equivalents, Cash and securities segregated and on deposit for regulatory and other purposes, receivables, certain other assets, Commercial paper and short-term debt and payables. The market values of such items are not materially sensitive to shifts in market interest rates because of the limited term to maturity of these instruments and their variable interest rates.
The Company’s long-term debt is recorded at historical amounts, unless designated as the hedged item in a fair value hedge under SFAS 133. The Company carries such hedged debt on a modified mark-to-market basis, which amount could differ from fair value as a result of changes in the Company’s credit worthiness.
The following table provides a summary of the fair value of the Company’s long-term debt and related End-User Derivative Activities. The fair value of the Company’s long-term debt was estimated using either quoted market prices or discounted cash flow analyses based on the Company’s current borrowing rates for similar types of borrowing arrangements.
FAIR VALUE OF LONG-TERM DEBT
IN MILLIONS
NOVEMBER 30 | | 2003 | | 2002 | |
| | | | | |
Carrying value of long-term debt | | $ | 43,529 | | $ | 38,678 | |
Fair value of long-term debt | | 43,961 | | 38,968 | |
Unrecognized net loss on long-term debt | | $ | (432 | ) | $ | (290 | ) |
The Company carries its secured financing activities, including Securities purchased under agreements to resell, Securities borrowed, Securities sold under agreements to repurchase, Securities loaned and Other secured borrowings, at their original contract amount plus accrued interest. Because the majority of such financing activities are short-term in nature, carrying value approximates fair value. At November 30, 2003 and 2002 the Company had $275 billion and $230 billion, respectively, of such secured financing activities. As with the Company’s long-term debt, its secured financing activities expose the Company to interest rate risk.
At November 30, 2003 and 2002 the Company, as an end user, used derivative financial instruments with an aggregate notional amount of $8.1 billion and $6.9 billion, respectively, to modify the interest rate characteristics of its secured financing activities. At November 30, 2003 and 2002 the carrying values of these secured financing activities designated as fair value hedges approximated their fair values. Additionally, at November 30, 2003 and 2002, the Company had approximately $31 million and $30 million, respectively, of unrecognized losses related to approximately $1.1 billion and $3.9 billion, respectively, of long-term fixed rate repurchase agreements.
NOTE 11 COMMITMENTS AND CONTINGENCIES
In the normal course of business, the Company enters into various commitments and guarantees, including lending commitments to high grade and high yield borrowers, private equity investment commitments, liquidity committments and other guarantees. In all instances, the Company marks-to-market these commitments and guarantees with changes in fair value recognized in Principal transactions revenue.
Lending Related Commitments
In connection with its financing activities, the Company had outstanding commitments under certain collateralized lending arrangements of approximately $5.0 billion and $1.5 billion at November 30, 2003 and 2002, respectively. These commitments require borrowers to provide acceptable collateral, as defined in the agreements, when amounts are drawn under the lending facilities. Advances made under these lending arrangements are typically at variable interest rates and generally provide for over-collateralization based on the borrowers’ creditworthiness. In addition, at November 30, 2003, the Company had commitments to enter into forward starting, secured resale and reverse repurchase agreements, principally secured by government and government agency collateral, of $78.4 billion and $46.2 billion, respectively, compared with $89.9 billion and $50.3 billion, respectively, at November 30, 2002.
The Company, through its high grade and high yield sales, trading and underwriting activities, makes commitments to extend credit in loan syndication transactions. The Company uses various hedging and funding strategies to actively manage its market, credit and liquidity exposures on these commitments. In addition, total commitments are not indicative of actual risk or funding requirements, as the commitments may not be drawn or fully used. These commitments and any related draw downs of these facilities typically have fixed
89
maturity dates and are contingent upon certain representations, warranties and contractual conditions applicable to the borrower.
The Company had credit risk associated with lending commitments to investment grade borrowers (after consideration of credit risk hedges) of $3.0 billion and $3.2 billion at November 30, 2003 and 2002, respectively. In addition, the Company had credit risk associated with lending commitments to non-investment grade borrowers (after consideration of credit risk hedges) of $2.6 billion and $1.7 billion at November 30, 2003 and 2002, respectively. Before consideration of credit risk hedges, the Company had commitments to investment and non-investment grade borrowers of $8.1 billion and $2.9 billion at November 30, 2003, respectively, compared with $7.1 billion and $1.8 billion at November 30, 2002, respectively. The Company had available undrawn borrowing facilities with third parties of approximately $5.1 billion and $5.2 billion at November 30, 2003 and 2002, respectively, which can be drawn upon to provide funding for these commitments. These funding facilities contain limits for certain concentrations of counterparty, industry or credit ratings of the underlying loans.
In addition, the Company provided high yield contingent commitments related to acquisition financing of approximately $2.5 billion and $2.8 billion at November 30, 2003 and 2002, respectively. The Company’s intent is, and its past practice has been, to sell down significantly all the credit risk associated with these loans, if closed, through loan syndications consistent with the Company’s credit facilitation framework. These commitments are not indicative of the Company’s actual risk because the borrower often will raise funds in the capital markets instead of drawing on the Company’s commitment. Additionally, the borrower’s ability to draw is subject to there being no material adverse change in either market conditions or the borrower’s financial condition, among other factors. These commitments contain certain flexible pricing features to adjust for changing market conditions prior to closing.
The Company defines high yield (non-investment grade) exposures as securities of or loans to companies rated BB+ or lower or equivalent ratings by recognized credit rating agencies, as well as non-rated securities or loans that, in the opinion of management, are non-investment grade. See “Critical Accounting Policies and Estimates—High Yield” on page 63 for a discussion of the valuation of non-investment grade exposures.
At November 30, 2003 the Company had outstanding mortgage loan commitments of approximately $3.1 billion, including $2.6 billion of residential mortgages and $0.5 billion of commercial mortgages. These commitments require the Company to transact mortgage loans generally within 90 days at fixed and variable interest rates. The Company intends to sell such loans, once originated, through securitization.
Securities and other inventory positions sold but not yet purchased represent obligations of the Company to purchase the securities at prevailing market prices. Therefore, the future satisfaction of such obligations may be for an amount greater or less than the amount recorded. The ultimate gain or loss is dependent upon the price at which the underlying financial instrument is purchased to settle the Company’s obligation under the sale commitment.
In the normal course of business, the Company is exposed to credit and market risk as a result of executing, financing and settling various customer security and commodity transactions. These risks arise from the potential that customers or counterparties fail to satisfy their obligations and that the collateral obtained is insufficient. In such instances, the Company may be required to purchase or sell financial instruments at unfavorable market prices. The Company seeks to control these risks by obtaining margin balances and other collateral in accordance with regulatory and internal guidelines.
Subsidiaries of the Company, as general partner, are contingently liable for the obligations of certain public and private limited partnerships organized as pooled investment funds or engaged primarily in real estate activities. In the opinion of the Company, contingent liabilities, if any, for the obligations of such partnerships will not, in the aggregate, have a material adverse effect on the Company’s consolidated financial position or results of operations.
Other Commitments and Guarantees
In accordance with FASB Interpretation No. 45, “Guarantor’s Accounting and Disclosure Requirements for Guarantees, Including Indirect Guarantees of Indebtedness of Others,” (“FIN 45”), the Company is required to recognize certain guarantee contracts at the inception of such guarantee contract at fair value. The Company has followed a long-standing policy of recording guarantees, including derivative guarantees, at fair value and, accordingly, the adoption of FIN 45 did not affect the Company’s financial position or results of operations. In accordance with FIN 45 the Company also is required to disclose certain guarantees, including derivative contracts, that require the Company to make payments to a counterparty based on changes on an underlying instrument or index (e.g., security prices, interest rates, and currency rates). Derivatives that meet the FIN 45 definition of a guarantee include credit default swaps, written put options, written foreign exchange options and written interest rate caps and floors. Under FIN 45, derivatives are not considered guarantees if such contracts are cash settled and the Company has no basis to determine whether it is probable the derivative counterparty held the related underlying instrument. Accordingly, if these conditions are met, the Company has not included such derivative contracts in the disclosure.
At November 30, 2003, the maximum payout value of derivative contracts deemed to meet the FIN 45 definition of a guarantee was approximately $322 billion. For purposes of determining maximum
90
payout, notional values were used; however, the Company believes the fair value of these contracts is a more relevant measure of these obligations. At November 30, 2003, the fair value of such derivative contracts approximated $9 billion. The Company believes the notional amounts greatly overstate the Company’s expected payout. For a discussion of the valuation of derivative contracts, see “Critical Accounting Policies and Estimates—Fair Value” on page 61. In addition, all amounts included above are before consideration of hedging transactions. These derivative contracts are generally highly liquid, and the Company has substantially mitigated its risk on these contracts through hedges, such as other derivative contracts and/or cash instruments. The Company manages risk associated with derivative guarantees consistent with the Company’s global risk management policies. The Company records derivative contracts, including those considered to be guarantees under FIN 45, at fair value with related gains/losses recognized in Principal transactions revenue.
At November 30, 2003, the Company had liquidity commitments of approximately $5.1 billion related to trust certificates backed by investment grade municipal securities compared with $4.4 billion at November 30, 2002. The Company’s obligations under such liquidity commitments generally are less than one year and are further limited because the Company’s obligations cease if the underlying assets are downgraded below investment grade or default.
At November 30, 2003 and 2002, the Company was contingently liable for $913 million and $835 million, respectively, of letters of credit primarily used to provide collateral for securities and commodities borrowed and to satisfy margin deposits at option and commodity exchanges.
At November 30, 2003 and 2002, the Company had private equity commitments of approximately $382 million and $672 million, respectively. The Company’s private equity commitment of $382 million at November 30, 2003 will be funded as required through the end of the respective investment periods. In addition, the Company was committed to invest up to $170 million in an energy-related principal investment at November 30, 2003.
In the normal course of business, the Company provides guarantees to securities clearinghouses and exchanges. These guarantees are generally required under the standard membership agreements, such that members are required to guarantee the performance of other members. To mitigate these performance risks, the exchanges and clearinghouses often require members to post collateral. The Company’s obligation under such guarantees could exceed the collateral amounts posted; however, the potential for the Company to be required to make payments under such guarantees is deemed remote.
In connection with certain asset sales and securitization transactions, the Company often makes representations and warranties about the assets conforming to specified guidelines. If it is later determined the underlying assets fail to conform to the specified guidelines, the Company may have an obligation to repurchase the assets or indemnify the purchaser against any losses. To mitigate these risks, to the extent the assets being securitized may have been originated by other third parties, the Company seeks to obtain appropriate representations and warranties from these third parties upon acquisition of such assets.
Litigation
In the normal course of business the Company has been named a defendant in a number of lawsuits and other legal and regulatory proceedings. Such proceedings include actions brought against the Company and others with respect to transactions in which the Company acted as an underwriter or financial advisor, actions arising out of the Company’s activities as a broker or dealer in securities and commodities and actions brought on behalf of various classes of claimants against many securities firms, including the Company. Although there can be no assurance as to the ultimate outcome, the Company generally has denied, or believes it has a meritorious defense and will deny, liability in all significant cases pending against it, and it intends to defend vigorously each such case. After considering all relevant facts and established reserves, in the opinion of the Company, such litigation will not, in the aggregate, have a material adverse effect on the Company’s consolidated financial position or cash flows, but may be material to the Company’s operating results for any particular period, depending on the level of income for such period.
Concentrations of Credit Risk
As a leading global investment bank, the Company is actively involved in securities underwriting, brokerage, distribution and trading. These and other related services are provided on a worldwide basis to a large and diversified group of clients and customers, including multi-national corporations, governments, emerging growth companies, financial institutions and individual investors.
A substantial portion of the Company’s securities and commodities transactions are collateralized and are executed with, and on behalf of, commercial banks and other institutional investors, including other brokers and dealers. The Company’s exposure to credit risk associated with the non-performance of these customers and counterparties in fulfilling their contractual obligations pursuant to securities transactions can be directly impacted by volatile or illiquid trading markets, which may impair the ability of customers and counterparties to satisfy their obligations to the Company.
Securities and other inventory positions owned by the Company include U.S. government and agency securities, and securities issued by non-U.S. governments, which in the aggregate, represented 11% of the Company’s total assets at November 30, 2003. In addition, collateral held by the Company for resale agreements represented approximately 28% of total assets at November 30, 2003, and primarily consisted of securities issued by the U.S. government, federal agencies or non-U.S.
91
governments. The Company’s most significant industry concentration is financial institutions, which includes other brokers and dealers, commercial banks and institutional clients. This concentration arises in the normal course of the Company’s business.
Lease Commitments
The Company leases office space and equipment throughout the world. Total rent expense for 2003, 2002 and 2001 was $136 million, $148 million and $98 million, respectively. Certain leases on office space contain escalation clauses providing for additional payments based on maintenance, utility and tax increases.
Minimum future rental commitments under non-cancelable operating leases (net of subleases of $99 million) are as follows:
MINIMUM FUTURE RENTAL COMMITMENTS UNDER OPERATING LEASE AGREEMENTS
IN MILLIONS | | | |
| | | |
Fiscal 2004 | | $ | 185 | |
Fiscal 2005 | | 179 | |
Fiscal 2006 | | 169 | |
Fiscal 2007 | | 161 | |
Fiscal 2008 | | 158 | |
December 1, 2008 and thereafter | | 1,314 | |
Total | | $ | 2,166 | |
Included in the previous table are rental commitments of approximately $652 million associated with properties that have been or will be vacated resulting from the Company’s decision to exit certain of its New York City facilities (resulting from occupancy actions taken after the events of September 11th), and the consolidation of certain U.S. and foreign branches (See Note 21 for additional information regarding the September 11th and Real Estate Related Charges).
The Company entered into a lease for its new European headquarters at Canary Wharf in London. This lease qualifies for capital lease treatment under SFAS No. 13 “Accounting for Leases.” The Company’s lease at Canary Wharf expires in September 2033.
MINIMUM FUTURE COMMITMENTS UNDER THE CAPITAL LEASE AGREEMENT
IN MILLIONS | | | |
| | | |
Fiscal 2004 | | $ | — | |
Fiscal 2005 | | 53 | |
Fiscal 2006 | | 54 | |
Fiscal 2007 | | 54 | |
Fiscal 2008 | | 54 | |
December 1, 2008 and thereafter | | 2,446 | |
Total minimum lease payments | | 2,661 | |
Less: Amounts of these payments that represent interest | | 1,681 | |
Present value of future minimum capital lease payments | | $ | 980 | |
NOTE 12 PREFERRED SECURITIES SUBJECT TO MANDATORY REDEMPTION
At November 30, 2003, the Company owned the residual equity of four Delaware business trusts that had issued an aggregate liquidation value of $1,310 million of capital securities. The trusts were formed for the purpose of: (a) issuing trust securities representing ownership interests in the assets of the trust; (b) investing the gross proceeds of the trust securities in junior subordinated debentures of the Company; and (c) engaging in activities necessary or incidental thereto. Loans from the trusts to the Company represented by the junior subordinated debentures are eliminated in consolidation. Dividends on the trust preferred securities are presented on a basis consistent with minority interest in the income of subsidiaries and are shown as a reduction to the Company’s income from continuing operations, net of tax. Preferred securities subject to mandatory redemption are comprised of the following issues:
IN MILLIONS
NOVEMBER 30 | | 2003 | | 2002 | |
| | | | | |
Lehman Brothers Holdings
Capital Trust I | | $ | 325 | | $ | 325 | |
Lehman Brothers Holdings
Capital Trust II | | 385 | | 385 | |
Lehman Brothers Holdings
Capital Trust III | | 300 | | — | |
Lehman Brothers Holdings
Capital Trust IV | | 300 | | — | |
Total | | $ | 1,310 | | $ | 710 | |
92
The following table summarizes the financial structure of each such trust at November 30, 2003:
| | Holdings
Capital Trust I | | Holdings
Capital Trust II | | Holdings
Capital Trust III | | Holdings
Capital Trust IV | |
| | | | | | | | | |
TRUST SECURITIES | | | | | | | | | |
Issuance date | | January 1999 | | April 1999 | | March 2003 | | October 2003 | |
Preferred securities issued | | 13,000,000 Series I | | 15,400,000 Series J | | 12,000,000 Series K | | 12,000,000 Series L | |
Liquidation preference per security | | $ | 25 | | $ | 25 | | $ | 25 | | $ | 25 | |
Liquidation value (in millions) | | $ | 325 | | $ | 385 | | $ | 300 | | $ | 300 | |
Coupon rate | | 8 | % | 7.88 | % | 6.38 | % | 6.38 | % |
Distributions payable | | Quarterly | | Quarterly | | Quarterly | | Quarterly | |
Distributions guaranteed by | | Holdings | | Holdings | | Holdings | | Holdings | |
Mandatory redemption date | | March 31, 2048 | | June 30, 2048 | | March 15, 2052 | | October 31, 2052 | |
Redeemable by issuer on or after | | March 31, 2004 | | June 30, 2004 | | March 15, 2008 | | October 31, 2008 | |
| | | | | | | | | |
JUNIOR SUBORDINATED DEBENTURES | | | | | | | | | |
Principal amount outstanding (in millions) | | $ | 325 | | $ | 385 | | $ | 300 | | $ | 300 | |
Coupon rate | | 8 | % | 7.88 | % | 6.38 | % | 6.38 | % |
Interest payable | | Quarterly | | Quarterly | | Quarterly | | Quarterly | |
Maturity date | | March 31, 2048 | | June 30, 2048 | | March 15, 2052 | | October 31, 2052 | |
Redeemable by issuer on or after | | March 31, 2004 | | June 30, 2004 | | March 15, 2008 | | October 31, 2008 | |
The Company anticipates de-consolidating the trusts that issue Preferred securities subject to mandatory redemption upon adoption of FIN 46, effective as of February 29, 2004. The de-consolidation will have the effect of reclassifying such preferred securities subject to mandatory redemption out of the mezzanine classification of the Company’s Consolidated Statement of Financial Condition and into Long-Term Debt. Likewise, the Company will reclassify, on a prospective basis, the pretax amount of dividends on such preferred securities to Interest expense in the Company’s results of operations.
NOTE 13 PREFERRED STOCK
Holdings is authorized to issue a total of 38,000,000 shares of preferred stock. At November 30, 2003, Holdings had 728,000 shares issued and outstanding under various series as described below. All preferred stock has a dividend preference over Holdings’ common stock in the paying of dividends and a preference in the liquidation of assets.
Series C
On May 11, 1998, Holdings issued 5,000,000 Depositary Shares, each representing 1/10th of a share of 5.94% Cumulative Preferred Stock, Series C (“Series C Preferred Stock”), $1.00 par value. The shares of Series C Preferred Stock have a redemption price of $500 per share, together with accrued and unpaid dividends. Holdings may redeem any or all of the outstanding shares of Series C Preferred Stock beginning on May 31, 2008. The $250 million redemption value of the shares outstanding at November 30, 2003 is classified in the Consolidated Statement of Financial Condition as a component of Preferred stock.
Series D
On July 21, 1998, Holdings issued 4,000,000 Depositary Shares, each representing 1/100th of a share of 5.67% Cumulative Preferred Stock, Series D (“Series D Preferred Stock”), $1.00 par value. The shares of Series D Preferred Stock have a redemption price of $5,000 per share, together with accrued and unpaid dividends. Holdings may redeem any or all of the outstanding shares of Series D Preferred Stock beginning on August 31, 2008. The $200 million redemption value of the shares outstanding at November 30, 2003 is classified in the Consolidated Statement of Financial Condition as a component of Preferred stock.
Series E
On March 28, 2000, Holdings issued 5,000,000 Depositary Shares, each representing 1/100th of a share of Fixed/Adjustable Rate Cumulative Preferred Stock, Series E (“Series E Preferred Stock”), $1.00 par value. The initial cumulative dividend rate on the Series E Preferred Stock is
93
7.115% per annum through May 31, 2005; thereafter the rate will be the higher of either the three-month U.S. Treasury Bill rate, the 10-year Treasury constant maturity rate or the 30-year U.S. Treasury constant maturity rate, in each case plus 1.15%, but in any event not less than 7.615% nor greater than 13.615%. The shares of Series E Preferred Stock have a redemption price of $5,000 per share, together with accrued and unpaid dividends. Holdings may redeem any or all of the outstanding shares of Series E Preferred Stock beginning on May 31, 2005. The $250 million redemption value of the shares outstanding at November 30, 2003 is classified in the Consolidated Statement of Financial Condition as a component of Preferred stock.
Series F
On August 20, 2003, Holdings issued 13,800,000 Depositary Shares, each representing 1/100th of a share of 6.50% Cumulative Preferred Stock, Series F (“Series F Preferred Stock”), $1.00 par value. The shares of Series F Preferred Stock have a redemption price of $2,500 per share, together with accrued and unpaid dividends. Holdings may redeem any or all of the outstanding shares of Series F Preferred Stock beginning on August 31, 2008. The $345 million redemption value of the shares outstanding at November 30, 2003 is classified in the Consolidated Statement of Financial Condition as a component of Preferred stock.
The Series C, D, E and F Preferred Stock has no voting rights except as provided below or as otherwise from time to time required by law. If dividends payable on any of the Series C, D, E or F Preferred Stock or on any other equally-ranked series of preferred stock have not been paid for six or more quarters, whether or not consecutive, the authorized number of directors of the Company will automatically be increased by two. The holders of the Series C, D, E or F Preferred Stock will have the right, with holders of any other equally-ranked series of preferred stock that have similar voting rights and on which dividends likewise have not been paid, voting together as a class, to elect two directors to fill such newly-created directorships until the dividends in arrears are paid.
Redeemable Voting
In 1994, Holdings issued the Redeemable Voting Preferred Stock to American Express and Nippon Life for $1,000. The holders of the Redeemable Voting Preferred Stock were entitled to receive annual dividends through May 31, 2002, in an amount equal to 50% of the amount, if any, by which the Company’s net income for each year exceeded $400 million, up to a maximum of $50 million per year ($25 million on a pro-rated basis, for the last dividend period, which ran from December 1, 2001 to May 31, 2002). For the years ended November 30, 2002 and 2001, the Company’s net income resulted in the recognition of dividends in those years in the amounts of $25 million and $50 million respectively, on the Redeemable Voting Preferred Stock. On the final dividend payment date, July 15, 2002, Holdings redeemed all of the Redeemable Preferred Stock, for a total of $1,000.
In April 2001, the Company’s shareholders approved the adoption of an amendment of the Company’s Restated Certificate of Incorporation to increase the aggregate number of authorized shares of common stock from 300 million to 600 million.
During the years ended November 30, 2003, 2002 and 2001, the Company repurchased or acquired shares of its common stock at an aggregate cost of approximately $1,508 million, $1,510 million and $1,676 million, respectively. These shares were acquired in the open market and from employees who tendered mature shares to pay for the exercise cost of stock options or for statutory tax withholding obligations on RSU issuances or option exercises.
Changes in the number of shares of Holdings’ common stock outstanding are as follows:
COMMON STOCK
NOVEMBER 30 | | 2003 | | 2002 | | 2001 | |
| | | | | | | |
Shares outstanding, beginning of period | | 231,131,043 | | 237,534,091 | | 236,395,332 | |
Exercise of stock options and other share issuances | | 11,538,125 | | 10,455,954 | | 8,369,721 | |
Issuances of shares to the RSU Trust | | 14,000,000 | | 9,300,000 | | 16,000,000 | |
Shares issued in connection with the Neuberger acquisition | | 33,130,804 | | — | | — | |
Treasury stock purchases | | (23,120,916 | ) | (26,159,002 | ) | (23,230,962 | ) |
Shares outstanding, end of period | | 266,679,056 | | 231,131,043 | | 237,534,091 | |
94
In 1997, the Company established an irrevocable grantor trust (the “RSU Trust”) to provide common stock voting rights to employees who hold outstanding restricted stock units (“RSUs”) and to encourage employees to think and act like owners. In 2003, 2002 and 2001, 14.0 million, 9.3 million and 16.0 million treasury shares, respectively, were transferred into the RSU Trust. At November 30, 2003, approximately 33.4 million shares were held in the RSU Trust with a total value of approximately $851 million. For accounting purposes, these shares are valued at weighted-average grant prices. Shares transferred to the RSU Trust do not affect the total number of shares used in the computation of earnings per common share because the Company considers the RSUs to be common stock equivalents for purposes of this computation. Accordingly, the RSU Trust has no effect on the total equity, net income or earnings per share of the Company.
In connection with the Neuberger acquisition, the Company issued 32,326,000 shares of common stock to acquire Neuberger and 804,804 shares of restricted common stock, a portion of which is subject to future service requirements.
NOTE 15 INCENTIVE PLANS
Employee Stock Purchase Plan
The Employee Stock Purchase Plan (the “ESPP”) allows employees to purchase Common Stock at a 15% discount from market value, with a maximum of $25,000 in annual aggregate purchases by any one individual. The number of shares of Common Stock authorized for purchase by eligible employees is 12.0 million. At November 30, 2003 and 2002, 6.1 million shares and 5.8 million shares, respectively, of Common Stock had cumulatively been purchased by eligible employees through the ESPP.
1994 Management Ownership Plan
The Lehman Brothers Holdings Inc. 1994 Management Ownership Plan (the “1994 Plan”) provides for the issuance of RSUs, performance stock units (“PSUs”), stock options and other equity awards for a period of up to ten years to eligible employees. A total of 33.3 million shares of Common Stock may be granted under the 1994 Plan. At November 30, 2003, RSU, PSU and stock option awards with respect to 31.2 million shares of Common Stock have been made under the 1994 Plan, of which 1.5 million are outstanding and 29.7 million have been converted to freely transferable Common Stock.
1996 Management Ownership Plan
During 1996, the Company’s stockholders approved the 1996 Management Ownership Plan (the “1996 Plan”) under which awards similar to those of the 1994 Plan may be granted, and under which up to 42.0 million shares of Common Stock may be subject to awards. At November 30, 2003, RSU, PSU and stock option awards with respect to 38.1 million shares of Common Stock have been made under the 1996 Plan of which 18.7 million are outstanding and 19.4 million have been converted to freely transferable Common Stock.
Employee Incentive Plan
The Employee Incentive Plan (“EIP”) has provisions similar to the 1994 Plan and the 1996 Plan, and authorization from the Board of Directors for the issuance of up to 246.0 million shares of Common Stock that may be subject to awards. At November 30, 2003 awards with respect to 204.5 million shares of Common Stock have been made under the EIP of which 125.3 million are outstanding and 79.2 million have been converted to freely transferable Common Stock.
The following is a summary of RSUs outstanding under Holdings’ stock-based incentive plans:
RESTRICTED STOCK UNITS
| | Total | |
BALANCE, NOVEMBER 30, 2000 | | 82,622,541 | |
Granted | | 15,292,447 | |
Canceled | | (3,268,825 | ) |
Exchanged for stock without restrictions | | (18,189,092 | ) |
BALANCE, NOVEMBER 30, 2001 | | 76,457,071 | |
Granted | | 9,178,667 | |
Canceled | | (1,750,479 | ) |
Exchanged for stock without restrictions | | (14,547,191 | ) |
BALANCE, NOVEMBER 30, 2002 | | 69,338,068 | |
Granted | | 13,071,646 | |
Canceled | | (1,447,319 | ) |
Exchanged for stock without restrictions | | (18,344,208 | ) |
BALANCE, NOVEMBER 30, 2003 (1) | | 62,618,187 | |
(1) Excludes RSUs issued in connection with the Company’s acquisition of Neuberger. See Neuberger Acquisition on page 97 and Note 6 to the Consolidated Financial Statements.
Eligible employees receive RSUs as a portion of their total compensation in lieu of cash. There is no further cost to employees associated with the RSU awards. The Company measures compensation cost for RSUs based on the market value of its Common Stock at the grant date and amortizes this amount to expense over the applicable vesting periods. RSU awards made to employees have various vesting provisions and generally convert to unrestricted freely transferable Common Stock five years from the grant date. Holdings accrues a dividend equivalent on each RSU outstanding (in the form of additional RSUs), based on dividends declared on its Common Stock.
95
The Company has repurchased approximately 41.3 million shares to offset the future delivery requirements associated with the above RSUs. These shares have either been transferred to the RSU Trust or are held as Treasury stock. (For additional information see Note 14 to the Consolidated Financial Statements.)
In 2003, the Company delivered 14.3 million shares of its Common Stock to current and former employees in satisfaction of RSUs awarded in 1998. Substantially all of the shares delivered were funded from the RSU Trust. The Company also received 4.9 million shares from current and former employees in satisfaction of applicable tax withholding requirements. Shares received were recorded as Treasury stock at an aggregate value of $354 million.
Of the RSUs outstanding at November 30, 2003, approximately 40.9 million RSUs were amortized, approximately 8.7 million RSUs will be amortized during 2004, and the remaining RSUs will be amortized subsequent to November 30, 2004.
Included in the previous table are PSUs the Company has awarded to certain senior officers. The number of PSUs that may be earned is dependent upon the achievement of certain performance levels within predetermined performance periods. During the performance period, these PSUs are accounted for as variable awards. At the end of a performance period, any PSUs earned will convert one-for-one to RSUs that then vest in three or more years. At November 30, 2003, approximately 11.1 million PSUs had been awarded, of which 6.3 million remained outstanding, subject to vesting and transfer restrictions. The compensation cost for the RSUs payable in satisfaction of PSUs is accrued over the combined performance and vesting periods.
Total compensation cost recognized during 2003, 2002 and 2001 for the Company’s stock-based awards was approximately $625 million, $570 million and $544 million, respectively.
STOCK OPTIONS
| | Total | | Weighted-Average
Exercise Price | | Expiration
Dates | |
| | | | | | | |
BALANCE, NOVEMBER 30, 2000 | | 54,567,639 | | $ | 28.62 | | 2/01 - 11/10 | |
Granted | | 21,529,844 | | $ | 53.28 | | | |
Exercised | | (6,261,030 | ) | $ | 16.49 | | | |
Canceled | | (1,442,239 | ) | $ | 27.01 | | | |
BALANCE, NOVEMBER 30, 2001 | | 68,394,214 | | $ | 37.53 | | 1/02 - 11/11 | |
Granted | | 26,211,500 | | $ | 54.94 | | | |
Exercised | | (9,652,041 | ) | $ | 25.02 | | | |
Canceled | | (1,413,181 | ) | $ | 43.20 | | | |
BALANCE, NOVEMBER 30, 2002 | | 83,540,492 | | $ | 44.21 | | 11/03 - 11/12 | |
Granted | | 11,262,532 | | $ | 68.74 | | | |
Exercised | | (10,252,890 | ) | $ | 27.85 | | | |
Canceled | | (1,673,376 | ) | $ | 45.57 | | | |
BALANCE, NOVEMBER 30, 2003 (1) | | 82,876,758 | | $ | 49.54 | | 12/03 - 11/13 | |
(1) Excludes stock options issued in connection with the Company’s acquisition of Neuberger (see Neuberger Acquisition on page 97 and Note 6 to the Consolidated Financial Statements).
At November 30, 2003 and 2002, approximately 18.4 million and 13.0 million stock options, respectively, were exercisable at weighted-average prices of $36.32 and $29.95, respectively. The weighted-average remaining contractual life of the stock options outstanding at November 30, 2003 is 6.3 years. The exercise price for all stock options awarded has been equal to the market price of Common Stock on the day of grant.
The above table provides further details relating to Holdings’ stock options outstanding at November 30, 2003.
96
STOCK OPTIONS (1)
| | Options Outstanding | | Options Exercisable | | |
Range of
Exercise Prices | | Number
Outstanding | | Weighted-
Average
Exercise Price | | Weighted-
Average
Remaining
Contractual
Life (in years) | | Number
Exercisable | | Weighted-
Average
Exercise Price | | Weighted-
Average
Remaining
Contractual
Life (in years) | | |
| | | | | | | | | | | | | | |
$ 9.00 – $ 9.99 | | 280,000 | | $ | 9.00 | | 0.50 | | 280,000 | | $ | 9.00 | | 0.50 | |
$ 10.00 – $19.99 | | 27,308 | | $ | 19.88 | | 1.00 | | 27,308 | | $ | 19.88 | | 1.00 | |
$ 20.00 – $29.99 | | 8,834,257 | | $ | 22.91 | | 3.22 | | 5,867,574 | | $ | 21.43 | | 4.31 | |
$ 30.00 – $39.99 | | 12,412,560 | | $ | 33.67 | | 2.58 | | 6,041,505 | | $ | 33.19 | | 1.77 | |
$ 40.00 – $49.99 | | 13,101,707 | | $ | 47.86 | | 6.72 | | 3,066,008 | | $ | 48.85 | | 5.54 | |
$ 50.00 – $59.99 | | 28,832,600 | | $ | 53.79 | | 7.43 | | 821,168 | | $ | 54.58 | | 4.99 | |
$ 60.00 – $69.99 | | 9,917,236 | | $ | 63.39 | | 6.48 | | 2,250,785 | | $ | 63.40 | | 6.32 | |
$ 70.00 – $79.99 | | 9,471,090 | | $ | 71.39 | | 10.00 | | — | | — | | — | |
BALANCE, NOVEMBER 30, 2003 | | 82,876,758 | | $ | 49.54 | | 6.29 | | 18,354,348 | | $ | 36.32 | | 3.89 | |
| | | | | | | | | | | | | | | | | | | | | | | | | | | | | |
(1) Excludes stock options issued in connection with the Company’s acquisition of Neuberger (see Neuberger Acquisition below and Note 6 to the Consolidated Financial Statements).
Neuberger Acquisition
In connection with the Company’s acquisition of Neuberger, the Company assumed the obligations of Neuberger under the following plans:
1999 Long Term Incentive Plan
The Neuberger 1999 Long Term Incentive Plan (the “LTIP”) provides for the grant of restricted stock, restricted units, incentive stock, incentive units, deferred shares, supplemental units and stock options. Upon the Company’s acquisition of Neuberger, the Company issued approximately 648,000 shares of restricted common stock to replace existing restricted stock awards, of which 225,000 shares with an approximate value of $14 million were vested and included in the acquisition price and 423,000 shares with an approximate value of $35 million were subject to future service and will be amortized over the applicable service periods. In addition, all outstanding stock option awards under the LTIP became 100% vested and non-forfeitable and were converted into 3.4 million stock option awards relating to the Company’s Common Stock.
The Company also issued 800,000 stock options under the plan with an exercise price of $72 that vest ratably over five years and expire in October 2008. The Company also issued approximately 1.7 million RSUs valued at approximately $118.7 million that vest ratably over five years.
The total number of shares of Common Stock that may be issued under the LTIP may not exceed approximately 7.7 million. At November 30, 2003 restricted stock, RSUs and stock options relating to 6.6 million shares of Common Stock were outstanding under the LTIP, and 1.1 million shares of Common Stock were available for issuance.
1999 Directors Stock Incentive Plan
The Neuberger 1999 Directors Stock Incentive Plan (the “DSIP”) provided for the grant of stock options or restricted stock to non-employee members of Neuberger’s board of directors. Non-employee directors could elect to exchange a portion of their annual cash retainer paid by Neuberger for services rendered as a director for restricted stock. Upon the Company’s acquisition of Neuberger, all outstanding stock option awards under the DSIP became 100% vested and non-forfeitable and were converted into approximately 62,000 stock option awards on shares of the Company’s Common Stock, all of which were outstanding at November 30, 2003. The Company does not intend to grant additional awards from the DSIP.
Wealth Accumulation Plan
The Neuberger Wealth Accumulation Plan (the “WAP”) provides that on an annual basis, employees who are eligible for a bonus may elect to defer all or a portion of their bonus, and employees who receive commissions and other direct pay may elect to defer a portion of such compensation. In each case, up to 20% of total compensation may be deferred with a maximum deferral of up to $500,000, provided that employees who receive an annual bonus may, in any event, defer no more than the full amount of the bonus. Amounts deferred by employees are used to acquire, on a pretax basis, the stock at a 25% discount from market value. Any stock so acquired is restricted with respect to transfer or sale and vests three years after the grant date.
97
Certain benefits of ownership, including the payment of any dividends declared during the restricted period, belong to the employees. Upon the Company’s acquisition of Neuberger, all shares of Neuberger stock previously acquired under the WAP were converted into approximately 157,000 shares of the Company’s Common Stock, of which 90,000 shares with an approximate value of $6 million were vested and included in the acquisition price and 67,000 shares with an approximate value of $7 million were subject to future service and will be amortized over the applicable service periods. The Company does not intend to allow any further deferrals under the WAP and has provided that the WAP will terminate on the last day on which any restricted stock outstanding under the WAP becomes vested.
NOTE 16 EARNINGS PER COMMON SHARE
Earnings per share was calculated as follows:
EARNINGS PER COMMON SHARE
IN MILLIONS, EXCEPT FOR PER SHARE DATA
YEAR ENDED NOVEMBER 30 | | 2003 | | 2002 | | 2001 | |
| | | | | | | |
NUMERATOR: | | | | | | | |
Net income | | $ | 1,699 | | $ | 975 | | $ | 1,255 | |
Preferred stock dividends | | 50 | | 69 | | 94 | |
Numerator for basic earnings per share—net income applicable to common stock | | $ | 1,649 | | $ | 906 | | $ | 1,161 | |
DENOMINATOR: | | | | | | | |
Denominator for basic earnings per share—
weighted-average common shares | | | | | | | |
Effect of dilutive securities: | | | | | | | |
Employee stock options | | 12.2 | | 12.4 | | 16.2 | |
Restricted stock units | | 2.0 | | 3.4 | | 6.0 | |
Dilutive potential common shares | | 14.2 | | 15.8 | | 22.2 | |
Denominator for diluted earnings per share—weighted-average common and dilutive potential common shares | | 259.9 | | 261.2 | | 265.3 | |
BASIC EARNINGS PER SHARE | | $ | 6.71 | | $ | 3.69 | | $ | 4.77 | |
DILUTED EARNINGS PER SHARE | | $ | 6.35 | | $ | 3.47 | | $ | 4.38 | |
NOTE 17 CAPITAL REQUIREMENTS
The Company operates globally through a network of subsidiaries, with several subject to regulatory requirements. In the United States, LBI and Neuberger Berman, LLC (“NBLLC”), as registered broker-dealers, are subject to the Securities and Exchange Commission (“SEC”) Rule 15c3-1, the Net Capital Rule, which requires these companies to maintain net capital of not less than the greater of 2% of aggregate debit items arising from customer transactions, as defined, or 4% of funds required to be segregated for customers’ regulated commodity accounts, as defined. At November 30, 2003, LBI and NBLLC had regulatory net capital, as defined, of $2,033 million and $320 million, respectively, which exceeded the minimum requirement by $1,853 million and $301 million, respectively.
Lehman Brothers International (Europe) (“LBIE”), a United Kingdom registered broker-dealer and subsidiary of Holdings, is subject to the capital requirements of the Financial Services Authority (“FSA”) of the United Kingdom. Financial resources, as defined, must exceed
98
the total financial resources requirement of the FSA. At November 30, 2003, LBIE’s financial resources of approximately $2,950 million exceeded the minimum requirement by approximately $907 million. Lehman Brothers Japan Inc.’s Tokyo branch, a regulated broker-dealer, is subject to the capital requirements of the Financial Services Agency and, at November 30, 2003, had net capital of approximately $534 million, which was approximately $247 million in excess of the specified levels required. Lehman Brothers Bank, FSB (the “Bank”), the Company’s thrift subsidiary, is regulated by the Office of Thrift Supervision (“OTS”). The Bank exceeds all regulatory capital requirements and is considered well capitalized by the OTS. Certain other non-U.S. subsidiaries are subject to various securities, commodities and banking regulations and capital adequacy requirements promulgated by the regulatory and exchange authorities of the countries in which they operate. At November 30, 2003, these other subsidiaries were in compliance with their applicable local capital adequacy requirements. In addition, the Company’s “AAA” rated derivatives subsidiaries, Lehman Brothers Financial Products Inc. (“LBFP”) and Lehman Brothers Derivative Products Inc. (“LBDP”), have established certain capital and operating restrictions that are reviewed by various rating agencies. At November 30, 2003, LBFP and LBDP each had capital that exceeded the requirements of the rating agencies.
The regulatory rules referred to above, and certain covenants contained in various debt agreements, may restrict Holdings’ ability to withdraw capital from its regulated subsidiaries, which in turn could limit its ability to pay dividends to shareholders. At November 30, 2003, approximately $5.8 billion of net assets of subsidiaries were restricted as to the payment of dividends to Holdings.
NOTE 18 EMPLOYEE BENEFIT PLANS
The Company provides various pension plans for the majority of its employees worldwide. In addition, the Company provides certain other postretirement benefits, primarily health care and life insurance, to eligible employees. The following summarizes these plans:
DEFINED BENEFIT PLANS
| | Pension Benefits | | | | | |
IN MILLIONS | | U.S. | | Non-U.S. | | Postretirement Benefits | |
NOVEMBER 30 | | 2003 | | 2002 | | 2003 | | 2002 | | 2003 | | 2002 | |
| | | | | | | | | | | | | |
CHANGE IN BENEFIT OBLIGATION | | | | | | | | | | | | | |
Benefit obligation at beginning of year | | $ | 669 | | $ | 575 | | $ | 248 | | $ | 201 | | $ | 68 | | $ | 53 | |
Service cost | | 20 | | 16 | | 7 | | 7 | | 2 | | 1 | |
Interest cost | | 44 | | 42 | | 15 | | 12 | | 5 | | 4 | |
Plan amendment | | 5 | | — | | — | | — | | — | | — | |
Actuarial (gain)/loss | | 104 | | 58 | | (13 | ) | 14 | | 8 | | 15 | |
Benefits paid | | (23 | ) | (22 | ) | (5 | ) | (5 | ) | (6 | ) | (5 | ) |
Foreign currency exchange rate changes | | — | | — | | 26 | | 19 | | — | | — | |
Projected benefit obligation at end of year | | $ | 819 | | $ | 669 | | $ | 278 | | $ | 248 | | $ | 77 | | $ | 68 | |
CHANGE IN PLAN ASSETS | | | | | | | | | | | | | |
Fair value of plan assets at beginning of year | | $ | 629 | | $ | 653 | | $ | 238 | | $ | 150 | | | | | |
Actual return (loss) on plan assets, net of expenses | | 70 | | (82 | ) | 31 | | (18 | ) | | | | |
Employer contribution | | 150 | | 80 | | 4 | | 97 | | | | | |
Benefits paid | | (24 | ) | (22 | ) | (5 | ) | (5 | ) | | | | |
Foreign currency exchange rate changes | | — | | — | | 26 | | 14 | | | | | |
Fair value of plan assets at end of year | | $ | 825 | | $ | 629 | | $ | 294 | | $ | 238 | | | | | |
FUNDED (UNDERFUNDED) STATUS | | $ | 6 | | $ | (40 | ) | $ | 16 | | $ | (10 | ) | $ | (77 | ) | $ | (68 | ) |
Unrecognized net actuarial loss (gain) | | 450 | | 392 | | 98 | | 120 | | 5 | | (3 | ) |
Unrecognized prior service cost (credit) | | 20 | | 16 | | 2 | | 2 | | (3 | ) | (4 | ) |
Prepaid (accrued) benefit cost | | $ | 476 | | $ | 368 | | $ | 116 | | $ | 112 | | $ | (75 | ) | $ | (75 | ) |
WEIGHTED-AVERAGE ASSUMPTIONS USED TO DETERMINE BENEFIT OBLIGATION ON NOVEMBER 30 | | | | | | | | | | | | | |
Discount rate | | 6.15 | % | 6.75 | % | 5.57 | % | 5.60 | % | 6.15 | % | 6.75 | % |
Rate of compensation increase | | 4.90 | % | 4.90 | % | 4.31 | % | 3.82 | % | 5.00 | % | 5.00 | % |
Accumulated benefit obligation | | $ | 782 | | $ | 637 | | | | | | | | | |
99
COMPONENTS OF NET PERIODIC COST/(BENEFIT)
U.S. PENSIONS
IN MILLIONS | | Pension Benefits | | Postretirement Benefits | |
YEAR ENDED NOVEMBER 30 | | 2003 | | 2002 | | 2001 | | 2003 | | 2002 | | 2001 | |
| | | | | | | | | | | | | |
Service cost | | $ | 21 | | $ | 17 | | $ | 12 | | $ | 2 | | $ | 1 | | $ | 1 | |
Interest cost | | 44 | | 42 | | 38 | | 5 | | 4 | | 3 | |
Expected return on plan assets | | (52 | ) | (58 | ) | (82 | ) | — | | — | | — | |
Recognized net actuarial loss (gain) | | 27 | | 12 | | — | | (1 | ) | (1 | ) | (1 | ) |
Recognized prior service cost | | 2 | | 1 | | — | | — | | — | | — | |
Net periodic cost (benefit) | | $ | 42 | | $ | 14 | | $ | (32 | ) | $ | 6 | | $ | 4 | | $ | 3 | |
WEIGHTED-AVERAGE ASSUMPTIONS | | | | | | | | | | | | | |
Discount rate | | 6.75 | % | 7.25 | % | 7.75 | % | 6.75 | % | 7.25 | % | 7.75 | % |
Expected return on plan assets | | 8.50 | % | 9.00 | % | 11.25 | % | — | | — | | — | |
Rate of compensation increase | | 4.90 | % | 5.00 | % | 5.00 | % | — | | — | | — | |
NON-U.S. PENSIONS | | | | | | | |
IN MILLIONS | | Pension Benefits | |
YEAR ENDED NOVEMBER 30 | | 2003 | | 2002 | | 2001 | |
| | | | | | | |
Service cost | | $ | 7 | | $ | 7 | | $ | 3 | |
Interest cost | | 15 | | 12 | | 11 | |
Expected long-term return on plan assets | | (21 | ) | (14 | ) | (15 | ) |
Recognized net actuarial loss | | — | | 6 | | — | |
Recognized prior service cost | | 2 | | 1 | | 1 | |
Net periodic cost | | $ | 3 | | $ | 12 | | $ | — | |
Return on U.S. Plan Assets
Establishing the expected rate of return on pension assets requires judgment. The Company considers the following factors in determining this assumption:
• The types of investment classes in which pension plan assets are invested and the expected compounded return the Company can reasonably expect the portfolio to earn over appropriate time periods. The expected return reflects forward-looking economic assumptions.
• The investment returns the Company can reasonably expect its active investment management program to achieve in excess of the returns expected if investments were made strictly in indexed funds.
• Investment related expenses.
The Company reviews the expected long-term rate of return annually and revises it as appropriate. Also, the Company periodically commissions detailed asset/liability studies to be performed by third party professional investment advisors and actuaries. These studies project stated future returns on Plan assets. The studies performed in the past support the reasonableness of the Company’s 8.50% assumption based on the target allocation investment classes and market conditions at the time the assumptions were established.
U.S. Plan Assets
The U.S. pension plan’s assets are invested with the objective of meeting current and future benefit payment needs, while minimizing future contributions. Plan assets are invested with several investment managers. Assets are diversified among U.S. equities securities, U.S. fixed income securities, real estate and cash. The plan employs a mix of active and passive investment management programs. The strategic target of Plan asset allocation is approximately 65% U.S. equities and 35% U.S. fixed income. The allocation of Plan assets is moving toward the strategic target allocation on an orderly and gradual basis. The investment sub-committee of the Company’s pension committee reviews the asset allocation quarterly and, with the approval of the pension committee determines when and how to rebalance the portfolio. The cash positions at November 30, 2003 and 2002 are higher than normal due to significant contributions near year end that were subsequently invested in both equity and fixed income categories in December 2003 and 2002, respectively. The Plan does not have a dedicated allocation to Lehman Brothers common stock, although the Plan may hold a minimal investment in Lehman Brothers common stock as a result of investment decisions made by various investment managers.
100
Weighted-average plan asset allocations at year end were as follows:
| | U.S. Plan Assets | |
NOVEMBER 30 | | 2003 | | 2002 | |
| | | | | |
U.S. PENSION | | | | | |
Equity securities | | 53 | % | 61 | % |
Fixed income securities | | 23 | | 21 | |
Real estate | | 2 | | 3 | |
Cash | | 22 | | 15 | |
Totals | | 100 | % | 100 | % |
The Company does not expect it to be necessary to contribute to its pension plans in 2004.
Estimated Future U.S. Benefit Payments
The following benefit payments, which reflect expected future service, as appropriate, are expected to be paid:
BENEFIT PAYMENTS
IN MILLIONS
NOVEMBER 30 | | Pension Benefit | | Postretirement | |
| | | | | |
2004 | | $ | 24 | | $ | 4 | |
2005 | | 26 | | 4 | |
2006 | | 29 | | 5 | |
2007 | | 31 | | 5 | |
2008 | | 34 | | 5 | |
2009 – 2013 | | 217 | | 22 | |
| | | | | | | |
Post Retirement Benefits
For measurement purposes, the annual health care cost trend rate was assumed to be 11% for the year ending November 30, 2004. The rate was assumed to decrease 1% per year, until it reaches 5%, and remain at that level thereafter.
Assumed health care cost trend rates have an effect on the amount reported for postretirement benefits. A one-percentage-point change in assumed health care cost trend rates would have the following effects:
IN MILLIONS | | 1% Point
Increase | | 1% Point
Decrease | |
| | | | | |
Effect on total service and interest cost components in 2003 | | $ | 0.3 | | $ | (0.3 | ) |
Effect on postretirement benefit obligation at November 30, 2003 | | $ | 4.1 | | $ | (3.9 | ) |
The Company files a consolidated U.S. federal income tax return reflecting the income of Holdings and its subsidiaries. The provision for income taxes consists of the following:
INCOME TAX PROVISION
IN MILLIONS
YEAR ENDED NOVEMBER 30 | | 2003 | | 2002 | | 2001 | |
| | | | | | | |
CURRENT | | | | | | | |
Federal | | $ | 410 | | $ | 371 | | $ | 491 | |
State | | 153 | | 208 | | 148 | |
Foreign | | 368 | | 459 | | 441 | |
| | 931 | | 1,038 | | 1,080 | |
DEFERRED | | | | | | | |
Federal | | 64 | | (462 | ) | (406 | ) |
State | | (44 | ) | (166 | ) | (65 | ) |
Foreign | | (186 | ) | (42 | ) | (172 | ) |
| | (166 | ) | (670 | ) | (643 | ) |
Provision for income taxes | | $ | 765 | | $ | 368 | | $ | 437 | |
Income before taxes included $652 million, $406 million and $(50) million that also was subject to income taxes of foreign jurisdictions for 2003, 2002 and 2001, respectively.
The income tax provision differs from that computed by using the statutory federal income tax rate for the reasons shown below:
IN MILLIONS
YEAR ENDED NOVEMBER 30 | | 2003 | | 2002 | | 2001 | |
| | | | | | | |
Federal income taxes at statutory rate | | $ | 888 | | $ | 490 | | $ | 612 | |
State and local taxes | | 71 | | 27 | | 54 | |
Tax-exempt income | | (122 | ) | (180 | ) | (176 | ) |
Amortization of goodwill | | — | | — | | 2 | |
Foreign operations | | (50 | ) | — | | (55 | ) |
Other, net | | (22 | ) | 31 | | — | |
Provision for income taxes | | $ | 765 | | $ | 368 | | $ | 437 | |
The provision for income taxes resulted in effective tax rates of 30.2%, 26.3%, and 25.0% for 2003, 2002, and 2001, respectively. The increase in the Company’s effective tax rate in 2003 from 2002 was primarily due to a higher level of pre-tax income, which reduced the impact of permanent differences, including a decrease in tax-exempt income, partially offset by an increase in tax benefits from foreign operations. The increase in the effective tax rate in 2002 from 2001 was primarily due to a less favorable mix of geographic earnings, which is partially offset by a greater impact of permanent differences, including tax-exempt income.
101
Income tax benefits of approximately $543 million, $347 million and $549 million were allocated to Additional paid-in capital related to various employee compensation plans for 2003, 2002 and 2001. In addition, the Company recorded $(1) million of tax (benefits)/provisions from the translation of foreign currencies, which was recorded directly in Accumulated other comprehensive income, for the years 2003, 2002 and 2001, respectively.
The Company permanently reinvested its earnings in certain foreign subsidiaries. At November 30, 2003, $367 million of the Company’s accumulated earnings were permanently reinvested. At current tax rates, additional federal income taxes (net of available tax credits) of $120 million would become payable if such income were to be repatriated.
Deferred income taxes are provided for the differences between the tax bases of assets and liabilities and their reported amounts in the Consolidated Financial Statements. These temporary differences will result in future income or deductions for income tax purposes and are measured using the enacted tax rates that will be in effect when such items are expected to reverse. The Company provides for deferred income taxes on undistributed earnings of foreign subsidiaries that are not permanently reinvested.
The net deferred tax assets are included in Other assets in the accompanying Consolidated Statement of Financial Condition.
At November 30, 2003 and 2002 the deferred tax assets and liabilities consisted of the following:
Deferred Tax Assets and Liabilities
IN MILLIONS
NOVEMBER 30 | | 2003 | | 2002 | |
| | | | | |
Deferred Tax Assets: | | | | | |
Liabilities/accruals not currently deductible | | $ | 838 | | $ | 698 | |
Deferred compensation | | 1,032 | | 898 | |
Unrealized trading activity | | 463 | | 336 | |
Foreign tax credits including carryforwards | | 212 | | 284 | |
Net operating loss carryforwards | | 88 | | 53 | |
Other | | 204 | | 214 | |
Total deferred tax assets | | 2,837 | | 2,483 | |
Less: Valuation allowance | | (25 | ) | (25 | ) |
Total deferred tax assets, net of valuation allowance | | $ | 2,812 | | $ | 2,458 | |
| | | | | |
Deferred Tax Liabilities: | | | | | |
Excess tax over financial depreciation, net | | $ | (18 | ) | $ | 2 | |
Acquired intangibles | | (420 | ) | — | |
Pension and retirement costs | | (172 | ) | (128 | ) |
Other | | (32 | ) | (7 | ) |
Total deferred tax liabilities | | (642 | ) | (133 | ) |
Net deferred tax assets | | $ | 2,170 | | $ | 2,325 | |
The Company has approximately $211 million of net operating loss (NOL) carryforwards associated with foreign subsidiaries, all of which have no expiration date. The carryforwards limitation period for the foreign tax credits has not begun. In addition, the Company has approximately $40 million of federal NOL carryforwards, which are subject to separate company limitations. These NOL carryforwards are scheduled to expire in 2023.
At November 30, 2003, $18 million of the valuation allowance relates to temporary differences resulting from the 1988 acquisition of E.F. Hutton Group, Inc. (now known as LB I Group Inc.) that are subject to separate company limitations. If future circumstances permit the recognition of the acquired tax benefit, then goodwill will be reduced.
NOTE 20
REGULATORY SETTLEMENT
In the fourth quarter of 2002, the Company recorded a pre-tax charge of $80 million ($56 million after-tax) associated with an agreement with various Federal and State regulatory authorities to settle inquiries related to alleged conflicts of interest involving equity research analysts. The agreement included certain organizational structural reforms, including providing independent research to clients in the future, as well as the payment of $80 million, including $50 million in retrospective relief, $5 million for investor education and $25 million (over the course of five years) to purchase independent research.
NOTE 21 SEPTEMBER 11TH AND
REAL ESTATE RECONFIGURATION COSTS
As a result of the September 11th, 2001 terrorist attack, the Company’s leased facilities in the World Trade Center (“WTC”) were destroyed, and its leased and owned facilities in the World Financial Center (“WFC”) complex (including the 3 WFC building owned jointly with American Express) were significantly damaged. All employees and operations in the downtown New York area were displaced. Key business activities and necessary support functions were quickly relocated to the Company’s back-up facilities in New Jersey and to various other temporary sites.
102
The Company had insurance in place to cover the losses resulting from the terrorist attack, including a policy covering damage to the core and shell of the 3 WFC building and a separate policy covering the property damage at the WTC and WFC facilities, losses resulting from business interruption and extra expenses associated with the Company’s relocation to, and occupancy of, the temporary facilities.
During 2001, the Company recognized a pre-tax charge of $127 million ($71 million after-tax) associated with the net losses stemming from the events of September 11, 2001. These losses and costs included the write-off of property damaged, destroyed or abandoned at the Company’s downtown facilities (approximately $340 million); compensation paid to employees in lieu of using external consultants for business recovery efforts and to employees for the time they were idled (approximately $100 million); costs incurred to maintain the facilities while they were unusable (approximately $16 million); and other costs associated with redeployment of the Company’s workforce to the temporary facilities (approximately $31 million). The losses and costs in 2001 were offset by estimated insurance recoveries of $360 million. All expenses associated with the Company’s use of temporary facilities during this period were reflected as part of Occupancy (approximately $18 million) or Technology and communications expenses (approximately $4 million) in the Consolidated Statement of Income. The insurance recovery recorded through November 30, 2001 was limited to the net historical book value of assets believed damaged, destroyed or abandoned and the out-of-pocket costs for certain extra expenses incurred during the period.
During the fourth quarter of 2001, the Company purchased a new building in midtown Manhattan located at 745 Seventh Avenue and entered into long-term leases in Jersey City, New Jersey and midtown Manhattan, as uncertainties continued to persist associated with the Company’s ability to use its previous downtown headquarters at 3 WFC. During the fourth quarter of 2002, after further consideration of maintaining real estate in both downtown and midtown New York City locations, the Company decided to completely exit its downtown area facilities and dispose of certain other excess New York City area space acquired as a result of the events of September 11th, resulting in a charge of approximately $189 million. This charge is comprised of the estimated costs to dispose of facilities at the WFC, Jersey City, New Jersey and midtown Manhattan.
During the fourth quarter of 2002, the Company settled its insurance claim for $700 million, the policy limit, with its insurance carriers. The net gain of $108 million ($60 million after tax) included insurance recoveries of approximately $340 million, costs associated with exiting certain of the Company’s New York area facilities of $189 million, and $43 million of other costs resulting from the events of September 11th (primarily technology restoration and other costs associated with unusable facilities). Insurance recoveries represent the Company’s settlement of $700 million offset by insurance recoveries previously recognized of approximately $360 million during 2001.
During the fourth quarter of 2002, the Company recorded a $128 million pre-tax charge ($82 million after tax) for costs associated with reconfiguring certain global real estate facilities used by the Company to conduct its business activities. The charge resulted from management’s analysis of the Company’s global real estate needs and subsequent decisions made by management to no longer use certain facilities in Europe, Asia and the U.S. Approximately $115 million of the charge related to estimated sublease losses associated with the Company’s decision to exit its primary London office facilities at Broadgate and move its European headquarters to a new facility just outside the city of London, beginning in the fourth quarter of 2003. The remaining portion of the charge related to the Company’s decision to consolidate certain branch locations. These charges were recognized in accordance with EITF Issue No. 94-3, “Liability Recognition for Certain Employee Termination Benefits and Other Costs to Exit an Activity (including Certain Costs Incurred in a Restructuring).” The 2002 real estate reconfiguration charge is in addition to a $189 million charge (before consideration of insurance-related recoveries) recognized in 2002 associated with exiting facilities related to the events of September 11, 2001. During the second quarter of 2003, the Company recorded a $77 million pre-tax real estate charge ($45 million after tax). This charge represented an adjustment of the real estate charges recognized in 2002 and reflected a continued softening in the London and New York metropolitan area sublease markets since the fourth quarter of 2002.
The Company expects substantially all of such facilities will be subleased by the end of 2004. During the years ended November 30, 2003, 2002, and 2001 changes in the liability, which is included in Accrued liabilities and other payables in the Consolidated Statement of Financial Condition, related to these charges were as follows:
IN MILLIONS | | Beginning
Balance | | September 11th
Charge Before Insurance
Recoveries (2) | | Real Estate
Reconfiguration | | Utilized (1) | | Ending
Balance | |
| | | | | | | | | | | |
YEAR ENDED NOVEMBER 30, 2001 | | $ | — | | $ | 487 | | $ | — | | $ | (423 | ) | $ | 64 | |
YEAR ENDED NOVEMBER 30, 2002 | | 64 | | 232 | | 128 | | (78 | ) | 346 | |
YEAR ENDED NOVEMBER 30, 2003 | | 346 | | — | | 77 | | (27 | ) | 396 | |
| | | | | | | | | | | | | | | | |
(1) Net of interest accretions of $17 million in 2003.
(2) The Company recognized insurance recoveries of $360 million and $340 million in 2001 and 2002, respectively.
103
The Company operates in three segments: Investment Banking, Capital Markets and Client Services.
The Investment Banking segment provides advice to corporate, institutional and government clients throughout the world on mergers, acquisitions and other financial matters. The segment also raises capital for clients by underwriting public and private offerings of debt and equity securities. The segment is composed of global industry groups—Communications and Media, Consumer/Retailing, Financial Institutions, Financial Sponsors, Healthcare, Industrial, Natural Resources, Power, Real Estate and Technology—that include bankers who deliver industry knowledge to meet clients’ objectives. Specialized product groups within Mergers and Acquisitions and Global Finance, including Equity Capital Markets, Debt Capital Markets, Leveraged Finance and Private Placements, are partnered with global relationship managers in the global industry groups to provide comprehensive solutions for clients. Specialists in product development and derivatives also are engaged to tailor specific structures for clients.
The Capital Markets segment includes institutional customer flow activities, research, and secondary trading and financing activities in fixed income and equity products. These products include a wide range of cash, derivative, secured financing and structured instruments. The Company is a leading global market-maker in numerous equity and fixed income products including U.S., European and Asian equities, government and agency securities, money market products, corporate high grade, high yield and emerging market securities, mortgage- and asset-backed securities and real estate, preferred stock, municipal securities, bank loans, foreign exchange, financing and derivative products. The Company is one of the largest market-makers in terms of U.S. and pan-European listed equities trading volume and maintains a major presence in over-the-counter U.S. stocks, major Asian large capitalization stocks, warrants, convertible debentures and preferred issues. The segment also includes the risk arbitrage and secured financing businesses, as well as realized and unrealized gains and losses related to private equity investments. The secured financing business manages the Company’s equity and fixed income matched book activities, supplies secured financing to institutional clients and customers, and provides secured funding for the Company’s inventory of equity and fixed income products.
The Client Services segment consists of the Private Client and Asset Management business lines. Private Client generates customer-flow transactional fee revenues from high-net-worth clients and Asset Management generates fee-based revenues from customized investment management services for high-net-worth clients, as well as asset management fees from mutual fund and other institutional investors. Asset Management also generates management and incentive fees from the Company’s role as general partner for private equity and alternative investment partnerships. The Company’ Private Equity business operates in five major asset classes: Merchant Banking, Real Estate, Venture Capital, Fixed Income-related and Third Party Funds.
The Company’s segment information for the years ended November 30, 2003, 2002 and 2001 is prepared using the following methodologies:
• Revenues and expenses directly associated with each segment are included in determining earnings before taxes.
• Expenses not directly associated with specific segments are allocated based on the most relevant measures applicable, including each segment’s revenues, headcount and other factors.
• Net revenues include allocations of interest revenue and interest expense to securities and other positions in relation to the cash generated by, or funding requirements of, the underlying positions.
• Segment assets include an allocation of indirect corporate assets that have been fully allocated to the Company’s business segments, generally based on each segment’s respective headcount figures.
104
SEGMENTS
IN MILLIONS | | Investment
Banking | | Capital
Markets | | Client
Services | | Total | |
| | | | | | | | | |
NOVEMBER 30, 2003 | | | | | | | | | |
Gross revenues | | $ | 1,722 | | $ | 14,628 | | $ | 937 | | $ | 17,287 | |
Interest expense | | — | | 8,610 | | 30 | | 8,640 | |
Net revenues | | 1,722 | | 6,018 | | 907 | | 8,647 | |
Depreciation and amortization expense | | 55 | | 219 | | 41 | | 315 | |
Other expenses | | 1,266 | | 3,792 | | 661 | | 5,719 | |
Earnings before taxes (1) (2) | | $ | 401 | | $ | 2,007 | | $ | 205 | | $ | 2,613 | |
Segment assets (billions) | | $ | 1.4 | | $ | 301.7 | | $ | 9.0 | | $ | 312.1 | |
| | | | | | | | | |
NOVEMBER 30, 2002 | | | | | | | | | |
Gross revenues | | $ | 1,731 | | $ | 14,225 | | $ | 825 | | $ | 16,781 | |
Interest expense | | — | | 10,605 | | 21 | | 10,626 | |
Net revenues | | 1,731 | | 3,620 | | 804 | | 6,155 | |
Depreciation and amortization expense | | 45 | | 188 | | 25 | | 258 | |
Other expenses | | 1,276 | | 2,534 | | 588 | | 4,398 | |
Earnings before taxes (1) (3) | | $ | 410 | | $ | 898 | | $ | 191 | | $ | 1,499 | |
Segment assets (billions) | | $ | 1.6 | | $ | 253.7 | | $ | 5.0 | | $ | 260.3 | |
| | | | | | | | | |
NOVEMBER 30, 2001 | | | | | | | | | |
Gross revenues | | $ | 1,925 | | $ | 19,605 | | $ | 862 | | $ | 22,392 | |
Interest expense | | — | | 15,581 | | 75 | | 15,656 | |
Net revenues | | 1,925 | | 4,024 | | 787 | | 6,736 | |
Depreciation and amortization expense | | 25 | | 134 | | 15 | | 174 | |
Other expenses | | 1,527 | | 2,568 | | 592 | | 4,687 | |
Earnings before taxes (1) (4) | | $ | 373 | | $ | 1,322 | | $ | 180 | | $ | 1,875 | |
Segment assets (billions) | | $ | 1.7 | | $ | 240.3 | | $ | 5.8 | | $ | 247.8 | |
(1) Before dividends on preferred securities.
(2) Excludes the real estate reconfiguration charge of $77 million.
(3) Excludes the real estate reconfiguration charge of $128 million, September 11th related (recoveries)/expenses, net gain of ($108) million and regulatory settlement charge of $80 million.
(4) Excludes the September 11th related expenses, net of $127 million.
105
Net revenues, if origination or trading-related, are allocated to geographic regions based on the location where the primary or secondary position was fundamentally risk managed; if fee-related, by the location of the senior coverage banker; if commission-related, by the location of the salespeople. In addition, certain revenues associated with domestic products and services that resulted from relationships with international clients and customers have been reclassified as international revenues using an allocation consistent with the Company’s internal reporting.
NET REVENUES BY GEOGRAPHIC REGION
IN MILLIONS
YEAR ENDED NOVEMBER 30 | | 2003 | | 2002 | | 2001 | |
| | | | | | | |
Europe | | $ | 1,864 | | $ | 1,674 | | $ | 1,955 | |
Asia Pacific | | 875 | | 612 | | 540 | |
Total International | | 2,739 | | 2,286 | | 2,495 | |
U.S. | | 5,908 | | 3,869 | | 4,241 | |
Total | | $ | 8,647 | | $ | 6,155 | | $ | 6,736 | |
NOTE 23 QUARTERLY INFORMATION (UNAUDITED)
The following table presents the Company’s unaudited quarterly results of operations for 2003 and 2002. Certain amounts reflect reclassifications to conform to the current period’s presentation. These quarterly results reflect all normal recurring adjustments that are, in the opinion of management, necessary for a fair presentation of the results. Revenues and earnings of the Company can vary significantly from quarter to quarter due to the nature of the Company’s business activities.
IN MILLIONS
EXCEPT PER SHARE AMOUNTS | | 2003 | | 2002 | |
| Nov. 30 | | Aug. 31 | | May 31 | | Feb. 28 | | Nov. 30 | | Aug. 31 | | May 31 | | Feb. 28 | |
| | | | | | | | | | | | | | | | | |
Total revenues | | $ | 4,254 | | $ | 4,463 | | $ | 4,470 | | $ | 4,100 | | $ | 4,133 | | $ | 4,075 | | $ | 4,347 | | $ | 4,226 | |
Interest expense | | 1,956 | | 2,116 | | 2,179 | | 2,389 | | 2,594 | | 2,728 | | 2,684 | | 2,620 | |
Net revenues | | 2,298 | | 2,347 | | 2,291 | | 1,711 | | 1,539 | | 1,347 | | 1,663 | | 1,606 | |
Non-interest expenses: | | | | | | | | | | | | | | | | | |
Compensation and benefits | | 1,103 | | 1,174 | | 1,168 | | 873 | | 785 | | 687 | | 848 | | 819 | |
Nonpersonnel expenses | | 473 | | 424 | | 418 | | 401 | | 400 | | 391 | | 379 | | 347 | |
September 11th related recoveries, net | | — | | — | | — | | — | | (108 | ) | — | | — | | — | |
Other real estate reconfiguration charge | | — | | — | | 77 | | — | | 128 | | — | | — | | — | |
Regulatory settlement | | — | | — | | — | | — | | 80 | | — | | — | | — | |
Total non-interest expenses | | 1,576 | | 1,598 | | 1,663 | | 1,274 | | 1,285 | | 1,078 | | 1,227 | | 1,166 | |
Income before taxes and dividends on trust preferred securities | | 722 | | 749 | | 628 | | 437 | | 254 | | 269 | | 436 | | 440 | |
Provision for income taxes | | 220 | | 250 | | 173 | | 122 | | 53 | | 61 | | 126 | | 128 | |
Dividends on trust preferred securities | | 21 | | 19 | | 18 | | 14 | | 14 | | 14 | | 14 | | 14 | |
Net income | | $ | 481 | | $ | 480 | | $ | 437 | | $ | 301 | | $ | 187 | | $ | 194 | | $ | 296 | | $ | 298 | |
Net income applicable to common stock | | $ | 464 | | $ | 469 | | $ | 426 | | $ | 290 | | $ | 176 | | $ | 183 | | $ | 285 | | $ | 262 | |
Weighted-average shares | | | | | | | | | | | | | | | | | |
Basic | | 254.7 | | 243.8 | | 242.3 | | 241.8 | | 243.9 | | 246.7 | | 245.8 | | 245.3 | |
Diluted | | 271.2 | | 259.5 | | 255.8 | | 253.0 | | 255.1 | | 261.0 | | 263.5 | | 265.2 | |
Earnings per common share | | | | | | | | | | | | | | | | | |
Basic | | $ | 1.82 | | $ | 1.92 | | $ | 1.76 | | $ | 1.20 | | $ | 0.72 | | $ | 0.74 | | $ | 1.16 | | $ | 1.07 | |
Diluted | | $ | 1.71 | | $ | 1.81 | | $ | 1.67 | | $ | 1.15 | | $ | 0.69 | | $ | 0.70 | | $ | 1.08 | | $ | 0.99 | |
Dividends per common share | | $ | 0.12 | | $ | 0.12 | | $ | 0.12 | | $ | 0.12 | | $ | 0.09 | | $ | 0.09 | | $ | 0.09 | | $ | 0.09 | |
Book value per common share (at period end) | | $ | 44.17 | | $ | 37.95 | | $ | 36.77 | | $ | 35.03 | | $ | 34.15 | | $ | 33.49 | | $ | 33.22 | | $ | 32.47 | |
| | | | | | | | | | | | | | | | | | | | | | | | | | |
106
The following table summarizes certain consolidated financial information included in the audited Consolidated Financial Statements.
IN MILLIONS, EXCEPT PER SHARE DATA, OTHER DATA AND FINANCIAL RATIOS
YEAR ENDED NOVEMBER 30 | | 2003 | | 2002 | | 2001 | | 2000 | | 1999 | |
| | | | | | | | | | | |
CONSOLIDATED STATEMENT OF INCOME | | | | | | | | | | | |
Revenues: | | | | | | | | | | | |
Principal transactions | | $ | 4,280 | | $ | 1,951 | | $ | 2,779 | | $ | 3,713 | | $ | 2,341 | |
Investment banking | | 1,747 | | 1,771 | | 2,000 | | 2,216 | | 1,682 | |
Commissions | | 1,210 | | 1,286 | | 1,091 | | 944 | | 651 | |
Interest and dividends | | 9,942 | | 11,728 | | 16,470 | | 19,440 | | 14,251 | |
Other | | 108 | | 45 | | 52 | | 134 | | 64 | |
Total revenues | | 17,287 | | 16,781 | | 22,392 | | 26,447 | | 18,989 | |
Interest expense | | 8,640 | | 10,626 | | 15,656 | | 18,740 | | 13,649 | |
Net revenues | | 8,647 | | 6,155 | | 6,736 | | 7,707 | | 5,340 | |
Non-interest expenses: | | | | | | | | | | | |
Compensation and benefits | | 4,318 | | 3,139 | | 3,437 | | 3,931 | | 2,707 | |
Nonpersonnel expenses | | 1,716 | | 1,517 | | 1,424 | | 1,197 | | 1,002 | |
Other real estate reconfiguration charge | | 77 | | 128 | | — | | — | | — | |
September 11th related (recoveries)/expenses, net | | — | | (108 | ) | 127 | | — | | — | |
Regulatory settlement | | — | | 80 | | — | | — | | — | |
Total non-interest expenses | | 6,111 | | 4,756 | | 4,988 | | 5,128 | | 3,709 | |
Income before taxes and dividends on trust preferred securities | | 2,536 | | 1,399 | | 1,748 | | 2,579 | | 1,631 | |
Provision for income taxes | | 765 | | 368 | | 437 | | 748 | | 457 | |
Dividends on trust preferred securities | | 72 | | 56 | | 56 | | 56 | | 42 | |
Net income | | $ | 1,699 | | $ | 975 | | $ | 1,255 | | $ | 1,775 | | $ | 1,132 | |
Net income applicable to common stock | | $ | 1,649 | | $ | 906 | | $ | 1,161 | | $ | 1,679 | | $ | 1,037 | |
CONSOLIDATED STATEMENT OF FINANCIAL CONDITION (AT PERIOD END) | | | | | | | | | | | |
Total assets | | $ | 312,061 | | $ | 260,336 | | $ | 247,816 | | $ | 224,720 | | $ | 192,244 | |
Net assets (a) | | 166,282 | | 143,291 | | 144,643 | | 125,680 | | 110,487 | |
Long-term debt (b) | | 43,529 | | 38,678 | | 38,301 | | 35,233 | | 30,691 | |
Preferred securities subject to mandatory redemption | | 1,310 | | 710 | | 710 | | 860 | | 710 | |
Total stockholders’ equity | | 13,174 | | 8,942 | | 8,459 | | 7,781 | | 6,283 | |
Total capital (c) | | 58,013 | | 48,330 | | 47,470 | | 43,874 | | 37,684 | |
PER SHARE DATA (d) | | | | | | | | | | | |
Net income (diluted) (e) | | $ | 6.35 | | $ | 3.47 | | $ | 4.38 | | $ | 6.38 | | $ | 4.08 | |
Dividends declared per common share | | $ | 0.48 | | $ | 0.36 | | $ | 0.28 | | $ | 0.22 | | $ | 0.18 | |
Book value per common share (at period end) (f) | | $ | 44.17 | | $ | 34.15 | | $ | 31.81 | | $ | 28.78 | | $ | 22.75 | |
OTHER DATA (AT PERIOD END) | | | | | | | | | | | |
Gross leverage (g) | | 23.7 | x | 29.1 | x | 29.3 | x | 28.9 | x | 30.6 | x |
Net leverage (h) | | 15.6 | x | 15.2 | x | 16.1 | x | 14.9 | x | 16.1 | x |
Employees | | 16,188 | | 12,343 | | 13,090 | | 11,326 | | 8,893 | |
FINANCIAL RATIOS (%) | | | | | | | | | | | |
Compensation and benefits/net revenues | | 49.9 | | 51.0 | | 51.0 | | 51.0 | | 50.7 | |
Pretax operating margin (i) | | 29.3 | | 22.7 | | 26.0 | | 33.5 | | 30.5 | |
Effective tax rate (j) | | 30.2 | | 26.3 | | 25.0 | | 29.0 | | 28.0 | |
Return on average common stockholders’ equity (k) | | 18.2 | | 11.2 | | 15.9 | | 26.6 | | 20.8 | |
Return on average tangible common stockholders’ equity (l) | | 19.2 | | 11.5 | | 16.3 | | 27.2 | | 21.4 | |
(a) Net assets represents total assets excluding secured financing arrangements, collateral received recognized in inventory pursuant to SFAS 140, goodwill and other identifiable intangibles. The Company believes net assets is useful to investors when comparing companies in the securities industry because it excludes certain assets considered to have a low risk profile. Net assets as presented by the Company is not necessarily comparable to similarly-titled measures presented by other companies in the securities industry because of different methods of calculation.
(b) Long-term debt includes senior notes and subordinated indebtedness.
(c) Total capital includes long-term debt, preferred securities subject to mandatory redemption and total stockholders’ equity. The Company believes total capital is useful to investors as a measure of the Company’s financial strength.
(d) All 1999 share and per share data have been restated for the two-for-one common stock split effective October 2000.
(e) Diluted EPS was reduced by $0.17 as a result of the 2003 real estate charge, $0.30 in 2002 as a result of the real estate reconfiguration charge, September 11th related (recoveries)/expenses, net and regulatory settlement charge and $0.26 in 2001 as a result of September 11th related expenses, net. For the years ended November 30, 2000 and 1999, the assumed conversion of Series A and B Convertible Preferred Stock into 2,438,375 and 5,559,474 common shares had the effect of decreasing diluted earnings per share by $0.03 and $0.02, respectively.
(f) The book value per common share calculation includes restricted stock units granted under Lehman Brothers Stock Award Programs that have been included in total stockholders’ equity.
(g) Gross leverage ratio is defined as total assets divided by total stockholders’ equity.
(h) Net leverage ratio is defined as net assets (total assets excluding secured financing arrangements, collateral received recognized in inventory pursuant to SFAS 140, goodwill and other identifiable intangible assets) divided by tangible equity capital (stockholders’ equity and preferred securities subject to mandatory redemption less goodwill and other identifiable intangible assets). See pages 51 and 52 for the calculations of net assets and tangible equity capital. The Company believes net assets to be a useful measure as this is used by certain rating agencies when evaluating leverage as it excludes assets of a low-risk nature. The Company believes net leverage, based on net assets as defined above, divided by tangible equity capital, to be a more meaningful measure of leverage in evaluating companies in the securities industry and is used by many of the Company’s creditors and a leading rating agency. The Company believes tangible equity capital to be a more representative measure of the Company’s equity for purposes of calculating net leverage because the Company does not view the amount of equity used to support goodwill and other identifiable intangible assets as available to support the Company’s net assets. These measures are not necessarily comparable to similarly-titled measures provided by other companies because of different methods of calculation.
(i) Pre-tax margin was reduced by approximately 0.9% in 2003 as a result of the real estate charge, approximately 1.7% in 2002 as a result of the real estate reconfiguration charge, September 11th related (recoveries)/expenses, net and regulatory settlement charge and reduced by approximately 1.8% in 2001 as a result of September 11th related expenses, net.
(j) The effective tax rate declined by approximately 0.3% in 2003, as a result of the real estate charge. The effective tax rate increased by approximately 0.3% in 2002, as a result of the real estate reconfiguration charge, September 11th related (recoveries)/expenses, net and regulatory settlement charge. The effective tax rate declined by approximately 1.3% in 2001, as a result of September 11th related expenses, net.
(k) In this calculation, average common stockholders’ equity was appropriately weighted for the effect of equity issued in connection with the Neuberger acquisition on October 31, 2003. Return on average common stockholders’ equity is computed by dividing net income applicable to common stock for the period by average common stockholders’ equity. Average common stockholder’s equity for the years ended November 2003, 2002, 2001, 2000, and 1999 were $9,061 million, $8,066 million, $7,286 million, $6,319 million and $4,987 million, respectively. Return on average common stockholders’ equity was reduced by 0.5% in 2003 as a result of the real estate charge, 1.0% in 2002, as a result of the real estate reconfiguration charge, September 11th related (recoveries)/expenses, net and regulatory settlement charge and 1.0% in 2001, as a result of September 11th related expenses, net.
(l) Average tangible common stockholders’ equity equals total common stockholders’ equity less goodwill and identifiable intangible assets. Average identifiable intagible assets and goodwill for the years ended November 2003, 2002, 2001, 2000 and 1999 were $471 million, $191 million, $174 million, $142 million, $149 million, respectively. Management believes tangible common stockholders’ equity is a meaningful measure because it reflects the common stockholders’ equity deployed in the Company’s businesses. In this calculation, average tangible common stockholders’ equity was appropriately weighted for the effect of equity issued in connection with the Neuberger acquisition on October 31, 2003. Return on average tangible common stockholders’ equity is computed by dividing net income applicable to common stock for the period by average tangible common stockholders’ equity. Return on average tangible common stockholders’ equity was reduced by 0.5% in 2003, as a result of the real estate charge, 1.0% in 2002 as a result of the real estate reconfiguration charge, September 11th related (recoveries)/expenses, net and the regulatory settlement and 0.9% in 2001 as a result of September 11th related expenses, net.
107
COMMON STOCK TICKER SYMBOL: LEH The common stock of Lehman Brothers Holdings Inc., par value $0.10 per share, is listed on the New York Stock Exchange and on the Pacific Exchange. As of January 31, 2004, there were approximately 266,247,589 shares of the Company’s common stock outstanding and 22,630 holders of record. On January 31, 2004, the last reported sales price of Lehman Brothers’ common stock was $82.10.
Lehman Brothers Holdings currently is authorized to issue up to 600,000,000 shares of common stock. Each holder of common stock is entitled to one vote per share for the election of directors and all other matters to be voted on by stockholders. Holders of common stock may not cumulate their votes in the election of directors. They are entitled to share equally in the dividends that may be declared by the Board of Directors, after payment of dividends on preferred stock. Upon voluntary or involuntary liquidation, dissolution or winding up of the Company, holders of common stock will share ratably in the assets remaining after payments to creditors and provision for the preference of any preferred stock. There are no preemptive or other subscription rights, “poison pills”, conversion rights or redemption or scheduled installment payment provisions relating to common stock.
PREFERRED STOCK Lehman Brothers Holdings currently is authorized to issue up to 38,000,000 shares of preferred stock, par value $1.00 per share. Lehman Brothers’ Board of Directors may authorize the issuance of classes or series of preferred stock from time to time, each with the voting rights, preferences and other special rights and qualifications, limitations or restrictions specified by the Board. A series of preferred stock may rank as senior, equal or subordinate to another series of preferred stock. Each series of preferred stock will rank prior to the common stock as to dividends and distributions of assets.
As of January 31, 2004, Lehman Brothers has issued and outstanding 780,000 shares of preferred stock in five series (each represented by depositary shares) with differing rights and privileges. The outstanding preferred stock does not have voting rights, except in certain very limited circumstances involving the Company’s failure to pay dividends thereon and certain matters affecting the specific rights of the preferred stockholders.
ANNUAL MEETING Lehman Brothers’ annual meeting of stockholders will be held on Friday, April 2, 2004 at 10:30 a.m. at its global headquarters at 745 Seventh Avenue, New York, New York 10019 in the Allan S. Kaplan Auditorium on the Concourse Level.
DIVIDENDS Effective January 2004, Lehman Brothers’ Board of Directors increased the fiscal 2004 dividend rate to $0.64 per common share from an annual dividend rate of $0.48 per share in fiscal 2003. Dividends on the Company’s common stock are generally payable, following declaration by the Board of Directors, in February, May, August and November.
REGISTRAR AND TRANSFER AGENT FOR COMMON STOCK Questions regarding dividends, transfer requirements, lost certificates, changes of address, direct deposit of dividends, the Direct Purchase and Dividend Reinvestment Plan, or other inquiries should be directed to:
The Bank of New York | | Telephone: (800) 824-5707 (U.S.) |
Shareholders Services Department | | (610) 382-7833 (non-U.S.) |
P.O. Box 11258 | | E-mail: shareowner-svcs@bankofny.com |
Church Street Station | | Website: http://www.stockbny.com |
New York, New York 10286-1258 | | |
DIRECT PURCHASE AND DIVIDEND REINVESTMENT PLAN Lehman Brothers’ Direct Purchase and Dividend Reinvestment Plan provides both existing stockholders and first-time investors with an alternative means of purchasing the Company’s stock. The plan has no minimum stock ownership requirements for eligibility and enrollment. Plan participants may reinvest all or a portion of cash dividends and/or make optional cash purchases up to a maximum of $175,000 per year without incurring commissions or service charges. Additional information and enrollment forms can be obtained from the Company’s Transfer Agent listed above.
ANNUAL REPORT AND FORM 10-K Lehman Brothers will make available upon request, without charge, copies of this Annual Report and the 2003 Annual Report on Form 10-K as filed with the Securities and Exchange Commission. Requests may be directed to:
Jeffrey A. Welikson, Corporate Secretary
Lehman Brothers Holdings Inc.
399 Park Avenue, New York, New York 10022
Telephone: (212) 526-0858
INDEPENDENT AUDITORS | | INVESTOR RELATIONS |
Ernst & Young LLP | | (212) 526-3267 |
5 Times Square | | |
New York, New York 10036 | | MEDIA RELATIONS |
Telephone: (212) 773-3000 | | (212) 526-4382 |
WEBSITE ADDRESS
http://www.lehman.com
PRICE RANGE OF COMMON STOCK
THREE MONTHS ENDED 2003 | | Nov. 30 | | Aug. 31 | | May 31 | | Feb. 28 | |
HIGH | | $ | 74.58 | | $ | 75.80 | | $ | 72.01 | | $ | 60.46 | |
LOW | | $ | 66.46 | | $ | 60.80 | | $ | 51.80 | | $ | 50.37 | |
| | | | | | | | | |
THREE MONTHS ENDED 2002 | | Nov. 30 | | Aug. 31 | | May 31 | | Feb. 28 | |
HIGH | | $ | 63.20 | | $ | 62.65 | | $ | 66.52 | | $ | 69.52 | |
LOW | | $ | 42.59 | | $ | 50.61 | | $ | 57.22 | | $ | 55.43 | |
108