Lehman Brothers Holdings Inc Plan Trust (LEHMQ)
Filed: 20 Jul 17, 12:00am
Exhibit 99.1
UNITED STATES BANKRUPTCY COURT
SOUTHERN DISTRICT OF NEW YORK
In re:
| Chapter 11 Case No. | |
| Lehman Brothers Holdings Inc., et al., | 08-13555 | |
| Jointly Administered | ||
Debtors. | ||
QUARTERLY FINANCIAL REPORT
AS OF APRIL 6, 2017
BALANCE SHEETS AND
POST-TWELFTH DISTRIBUTION CASH FLOW ESTIMATES
| DEBTORS’ ADDRESS: | LEHMAN BROTHERS HOLDINGS INC. | |
| c/o KRISTINE DICKSON – CHIEF FINANCIAL OFFICER | ||
| 1271 AVENUE OF THE AMERICAS | ||
| 40th FLOOR | ||
| NEW YORK, NY 10020 | ||
| DEBTORS’ ATTORNEYS: | WEIL, GOTSHAL & MANGES LLP | |
| c/o JACQUELINE MARCUS, GARRETT A. FAIL | ||
| 767 FIFTH AVENUE | ||
| NEW YORK, NY 10153 | ||
| REPORT PREPARER: | LEHMAN BROTHERS HOLDINGS INC., AS PLAN ADMINISTRATOR | |
| Date: July 20, 2017 |
Quarterly Financial Report as of April 6, 2017 (Unaudited)
Table of Contents
I. | Schedule of Debtors | 3 | ||||||||
II. | Notes to the Balance Sheets and Management’s Discussion & Analysis | 4 | ||||||||
| Note 1 – Basis of Presentation | 4 | |||||||||
| Note 2 – Use of Estimates | 5 | |||||||||
| Note 3 – Cash and Short-Term Investments | 5 | |||||||||
| Note 4 – Cash and Short-Term Investments Pledged or Restricted | 6 | |||||||||
| Note 5 – Financial Instruments and Other Inventory Positions | 7 | |||||||||
| Note 6 – Receivables from Debtors and Debtor-Controlled Entities and Other Assets | 10 | |||||||||
| Note 7 – Investments in Affiliates | 12 | |||||||||
| Note 8 – Due from/to Affiliates | 13 | |||||||||
| Note 9 – Payables to Debtors and Debtor-Controlled Entities and Other Liabilities | 22 | |||||||||
| Note 10 – Taxes Payable | 23 | |||||||||
| Note 11 – Liabilities Subject to Compromise | 24 | |||||||||
| Note 12 – Legal Proceedings | 26 | |||||||||
| Note 13 – Currency Translation | 28 | |||||||||
| Note 14 – Financial Systems and Control Environment | 28 | |||||||||
III. | Balance Sheets | 29 | ||||||||
IV. | Post-Twelfth Distribution Cash Flow Estimates | 32 | ||||||||
QUESTIONS
The Company has established an email address to receive questions from readers regarding this presentation and its other financial disclosures. The Company plans to review questions received, and for those subjects which the Company determines a response would not (i) violate a confidentiality provision, (ii) place the Company in a competitive or negotiation disadvantage, or (iii) be unduly burdensome relative to the value of information requested, the Company shall endeavor to post a response (maintaining the anonymity of the originators of the questions). The Company assumes no obligation to respond to email inquiries.
Please email questions, with document references as relevant, to:
QUESTIONS@lehmanholdings.com
The Company’s previously posted responses can be found on the Epiq website maintained for the Company:
www.lehman-docket.com under the Key Documents tab and the Responses to Questions Submitted category
Page 2
Quarterly Financial Report as of April 6, 2017 (Unaudited)
I. Schedule of Debtors
The twenty three entities listed below (the “Debtors”) filed for bankruptcy in the United States Bankruptcy Court for the Southern District of New York (the “Bankruptcy Court”) on the dates indicated below. On December 6, 2011, the Bankruptcy Court confirmed the Modified Third Amended Joint Chapter 11 Plan of Lehman Brothers Holdings Inc. and its Affiliated Debtors (the “Plan”). On March 6, 2012, the “Effective Date” (as defined in the Plan) occurred. As of the date hereof, the following Debtors’ chapter 11 cases remain open:
| Case No. | Date Filed (“Commencement Date”) | |||||||
Lehman Brothers Holdings Inc. (“LBHI”) | 08-13555 | 9/15/2008 | ||||||
Lehman Brothers Commodity Services Inc. (“LBCS”) | 08-13885 | 10/3/2008 | ||||||
Lehman Brothers Special Financing Inc. (“LBSF”) | 08-13888 | 10/3/2008 | ||||||
Lehman Brothers OTC Derivatives Inc. (“LOTC”) | 08-13893 | 10/3/2008 | ||||||
Lehman Brothers Derivative Products Inc. (“LBDP”) | 08-13899 | 10/5/2008 | ||||||
Lehman Commercial Paper Inc. (“LCPI”) | 08-13900 | 10/5/2008 | ||||||
Lehman Brothers Commercial Corporation (“LBCC”) | 08-13901 | 10/5/2008 | ||||||
Lehman Brothers Financial Products Inc.(“LBFP”) | 08-13902 | 10/5/2008 | ||||||
Lehman Scottish Finance L.P. | 08-13904 | 10/5/2008 | ||||||
BNC Mortgage LLC | 09-10137 | 1/9/2009 | ||||||
LB Rose Ranch LLC | 09-10560 | 2/9/2009 | ||||||
Structured Asset Securities Corporation | 09-10558 | 2/9/2009 | ||||||
The following Debtors’ chapter 11 cases were closed in 2016, pursuant to final decrees entered by the Bankruptcy Court (Docket No. 51920 and No. 54163):
| Case No. | Date Filed | Date Closed | ||||||||||
LB 745 LLC | 08-13600 | 9/16/2008 | 1/28/2016 | |||||||||
PAMI Statler Arms LLC | 08-13664 | 9/23/2008 | 1/28/2016 | |||||||||
CES Aviation LLC | 08-13905 | 10/5/2008 | 1/28/2016 | |||||||||
CES Aviation V LLC | 08-13906 | 10/5/2008 | 1/28/2016 | |||||||||
CES Aviation IX LLC | 08-13907 | 10/5/2008 | 1/28/2016 | |||||||||
LB 2080 Kalakaua Owners LLC | 09-12516 | 4/23/2009 | 1/28/2016 | |||||||||
LB Somerset LLC | 09-17503 | 12/22/2009 | 1/28/2016 | |||||||||
LB Preferred Somerset LLC | 09-17505 | 12/22/2009 | 1/28/2016 | |||||||||
East Dover Limited | 08-13908 | 10/5/2008 | 12/15/2016 | |||||||||
Luxembourg Residential Properties Loan Finance S.a.r.l | 09-10108 | 1/7/2009 | 12/15/2016 | |||||||||
Merit LLC | 09-17331 | 12/14/2009 | 12/15/2016 | |||||||||
Page 3
Quarterly Financial Report as of April 6, 2017 (Unaudited)
II. Notes to the Balance Sheets and Management’s Discussion & Analysis
Note 1 – Basis of Presentation
Objectives
On the Effective Date, the Plan became effective and the Debtors emerged from bankruptcy with a new Board of Directors (LBHI’s Board of Directors hereinafter referred to as the “Board”). The Company continues to pursue the objectives of asset value maximization and timely distributions to creditors of available cash through the optimal execution of an orderly wind down process and the judicious and timely resolution of claims. Pursuant to the Plan, the Plan Administrator has made and expects to continue to make semi-annual distributions to creditors of Debtors, with each entity subject to review at each distribution date.
Basis of Presentation
The information and data included in the Quarterly Financial Report, including the Balance Sheets, Notes to the Balance Sheets, and Post-Twelfth Distribution Cash Flow Estimates (collectively, the “Quarterly Financial Report”) are derived from sources available to the Debtors and Debtor-Controlled Entities (collectively, the “Company” or “Controlled Affiliates”). The term “Debtor-Controlled Entities” refers to those entities that are directly or indirectly controlled by LBHI and have not filed for protection under Chapter 11 of the Bankruptcy Code. Debtor-Controlled Entities excludes, among others, certain entities (such as Lehman Brothers Inc. (“LBI”), Lehman Brothers International (Europe) (in administration) (“LBIE”) and Lehman Brothers Japan (“LBJ”)) that were not managed or controlled by a Debtor as of the Effective Date and are under separate administrations in the U.S. or abroad, including proceedings under the Securities Investor Protection Act (collectively, “Non-Controlled Affiliates”).
The Company has prepared the Quarterly Financial Report based on the information available to the Company at the date of filing; however, such information may be incomplete and may be materially deficient. Material uncertainties continue to exist regarding the ultimate value realizable from the Company’s assets, the timing of asset recoveries, future costs, and the eventual level of allowed creditors’ claims. Accordingly, the Quarterly Financial Report is not meant to be relied upon as a complete description of the Company, its business, condition (financial or otherwise), results of operations, prospects, assets or liabilities. The Company reserves all rights to revise this report.
In preparing the Quarterly Financial Report, the Company made various estimates and assumptions based on information available to the Company. As such, this report contains forward-looking statements that involve known and unknown risks, uncertainties and other factors which may cause the Company’s actual results, performance or achievements to be materially different from any future results, performance or achievements expressed or implied by these forward-looking statements. All statements other than statements of historical fact are statements that could be deemed forward-looking statements, including all statements containing information regarding the intent, belief or current expectation of the Company and members of its management. Accordingly, the financial information herein is subject to change and any such change may be material.
The Quarterly Financial Report should be read in conjunction with the Company’s previous filings, including Form 8-K reports as filed with the United States Securities and Exchange Commission (“SEC”), the Plan and related Disclosure Statement (the “Disclosure Statement”) dated August 31, 2011, and other documents filed after the Commencement Dates with various regulatory agencies or the Bankruptcy Court by LBHI, other Debtors and Debtor-Controlled Entities.
Page 4
Quarterly Financial Report as of April 6, 2017 (Unaudited)
Note 1 – Basis of Presentation(continued)
The Quarterly Financial Report:
| • | Reflects activities through April 6, 2017, including the twelfth Plan Distribution (“D12”) |
| • | Is not audited nor prepared in accordance with U.S. Generally Accepted Accounting Principles (“GAAP”); |
| • | Does not reflect period-end adjustments, including accruals; and |
| • | Includes certain items that remain under continuing review by the Company and may be accounted for differently in future Quarterly Financial Reports. |
Trends and Uncertainties
The Company owns real estate, private equity investments, loans, derivative contracts, and other assets in a wide variety of local, domestic and global markets, and as such, in future periods the values of these assets are subject to trends, events and factors beyond the Company’s control, including but not limited to: the local, domestic and global economic environment; changes in budget, tax and fiscal policies in the U.S. and other countries; fluctuations in debt and equity markets, interest rates, and currency exchange rates; litigation risk; and changes in regulatory requirements.
Note 2 – Use of Estimates
In preparing the Quarterly Financial Report, the Company utilizes various estimates that affect reported amounts and disclosures. For example, estimates are used to determine expected recoverable amounts from certain financial instruments and other assets, and to establish claims amounts and various reserves.
Estimates are based on available information and judgment. As more information becomes available to the Company, including the outcome of various negotiations and litigations, the Company may revise estimates accordingly.
Note 3 – Cash and Short-Term Investments
Cash and short-term investments include:
| • | demand deposits; |
| • | interest-bearing deposits with banks; |
| • | U.S. and foreign money-market funds; |
| • | U.S. government obligations; |
| • | U.S. government guaranteed securities; |
| • | investment grade corporate bonds and commercial paper; and |
| • | AAA-rated asset-backed securities secured by auto loans and credit card receivables. |
As of April 6, 2017, the Company’s short-term investments were scheduled to mature by September 30, 2017.
Page 5
Quarterly Financial Report as of April 6, 2017 (Unaudited)
Note 4 – Cash and Short-Term Investments Pledged or Restricted
The following table summarizes the components of restricted cash as of April 6, 2017:
| Debtors | Debtor- Controlled | Total Debtors and Debtor- Controlled Entities | ||||||||||||||||||||||||||
| ($ in millions) | LBHI | LBSF | LCPI | Other | Total | |||||||||||||||||||||||
Reserves for Claims: | ||||||||||||||||||||||||||||
Disputed unsecured claims(1) | $ | 1,028 | $ | 792 | $ | — | $ | 146 | $ | 1,966 | $ | — | $ | 1,966 | ||||||||||||||
Distributions on Allowed Claims (not remitted) | 10 | 0 | 0 | 1 | 11 | — | 11 | |||||||||||||||||||||
Secured, Admin, Priority Claims and Other | 58 | 39 | 7 | 12 | 115 | — | 115 | |||||||||||||||||||||
|
|
|
|
|
| |||||||||||||||||||||||
Subtotal, Claims Reserves | 1,096 | 831 | 7 | 159 | 2,092 | — | 2,092 | |||||||||||||||||||||
Citigroup (2) | 2,008 | — | — | — | 2,008 | — | 2,008 | |||||||||||||||||||||
Other(3) | 175 | 1 | 0 | 23 | 199 | 26 | 225 | |||||||||||||||||||||
|
|
|
|
|
| |||||||||||||||||||||||
Total | $ | 3,278 | $ | 833 | $ | 7 | $ | 182 | $ | 4,300 | $ | 26 | $ | 4,325 | ||||||||||||||
|
|
|
|
|
| |||||||||||||||||||||||
| Totals may not foot due to rounding. | ||||||||||||||||||||||||||||
| (1) | Represents the cash reserve for the principal amount of disputed unsecured claims subsequent to the twelfth Plan Distribution on April 6, 2017. Amounts of claim reserves at LBSF exclude amounts invested in a loan to LBHI in the amount of $349 million (refer toNote 6 – Receivables from Controlled Affiliates and Other Assets). |
| (2) | Represents cash deposited prior to the Commencement Date by the Company in connection with certain requests and/or documents executed by the Company and Citigroup Inc. (“Citigroup”). The Company has recorded reserves against this cash in Secured Claims Payable to Third Parties because Citigroup has asserted claims. The Company commenced litigation against Citigroup regarding these deposits (refer toNote 12 – Legal Proceedings). |
| (3) | Includes: (i) $85 million related to various pre-petition balances on administrative hold by Citigroup, (ii) $54 million related to misdirected wires and other cash received by LBHI for the benefit of third parties and Non-Controlled Affiliates (reported as a payable), and (iii) $86 million of various miscellaneous items. |
Page 6
Quarterly Financial Report as of April 6, 2017 (Unaudited)
Note 5 – Financial Instruments and Other Inventory Positions
Financial instruments and other inventory positions are reported at estimated “recovery values,” which are determined by utilizing market prices, certain assumptions, estimates and/or pricing models to estimate future undiscounted cash flows.
The table below presents recovery values as of April 6, 2017 by asset portfolio, and the changes in recovery values since the previously filed Quarterly Financial Report as of December 31, 2016:
| Activity 01/01/17—04/06/17 | ||||||||||||||||||||
| Inventory as of | Transfers and | Recovery | Inventory as of | |||||||||||||||||
$ in millions | December 31, 2016 | Reclassifications | Value Change (1) | Cash Activities (2) | April 6, 2017 | |||||||||||||||
Commercial Real Estate | ||||||||||||||||||||
Debtors: | ||||||||||||||||||||
Lehman Brothers Holdings Inc. | $ | — | $ | — | $ | 0 | $ | (0 | ) | $ | 0 | |||||||||
Lehman Commercial Paper Inc. | 93 | — | 10 | (13 | ) | 91 | ||||||||||||||
|
|
|
|
|
|
|
|
|
| |||||||||||
Subtotal Debtors | 93 | — | 10 | (13 | ) | 91 | ||||||||||||||
Debtor-Controlled | 40 | — | 5 | (2 | ) | 42 | ||||||||||||||
|
|
|
|
|
|
|
|
|
| |||||||||||
Total Commercial Real Estate | 134 | — | 15 | (15 | ) | 133 | ||||||||||||||
|
|
|
|
|
|
|
|
|
| |||||||||||
Loans and Residential Real Estate | ||||||||||||||||||||
Debtors: | ||||||||||||||||||||
Lehman Brothers Holdings Inc.(3) | 51 | — | 6 | (6 | ) | 51 | ||||||||||||||
Lehman Commercial Paper Inc. | 31 | — | 20 | (41 | ) | 11 | ||||||||||||||
|
|
|
|
|
|
|
|
|
| |||||||||||
Subtotal Debtors | 82 | — | 26 | (46 | ) | 62 | ||||||||||||||
Debtor-Controlled | 11 | — | 3 | (1 | ) | 13 | ||||||||||||||
|
|
|
|
|
|
|
|
|
| |||||||||||
Total Loans and Residential Real Estate | 93 | — | 29 | (47 | ) | 75 | ||||||||||||||
|
|
|
|
|
|
|
|
|
| |||||||||||
Private Equity / Principal Investments (PEPI) | ||||||||||||||||||||
Debtors: | ||||||||||||||||||||
Lehman Brothers Holdings Inc. | 2 | — | 0 | — | 3 | |||||||||||||||
Lehman Commercial Paper Inc. | 3 | — | — | — | 3 | |||||||||||||||
|
|
|
|
|
|
|
|
|
| |||||||||||
Subtotal Debtors | 5 | — | 0 | — | 6 | |||||||||||||||
Debtor-Controlled(3) | 948 | — | 80 | (265 | ) | 763 | ||||||||||||||
|
|
|
|
|
|
|
|
|
| |||||||||||
Total Private Equity / Principal Investments | 953 | — | 80 | (265 | ) | 769 | ||||||||||||||
|
|
|
|
|
|
|
|
|
| |||||||||||
Derivative Receivables and Related Assets | ||||||||||||||||||||
Debtors: | ||||||||||||||||||||
Lehman Brothers Special Financing Inc. | 107 | — | 77 | (26 | ) | 159 | ||||||||||||||
Lehman Brothers OTC Derivatives Inc. | 0 | — | 0 | (0 | ) | 0 | ||||||||||||||
|
|
|
|
|
|
|
|
|
| |||||||||||
Subtotal Debtors | 107 | — | 78 | (26 | ) | 159 | ||||||||||||||
Debtor-Controlled | 0 | — | (0 | ) | (0 | ) | 0 | |||||||||||||
|
|
|
|
|
|
|
|
|
| |||||||||||
Total Derivative Receivables and Related Assets | 107 | — | 78 | (26 | ) | 159 | ||||||||||||||
|
|
|
|
|
|
|
|
|
| |||||||||||
Totals | $ | 1,287 | $ | — | $ | 202 | $ | (353 | ) | $ | 1,136 | |||||||||
|
|
|
|
|
|
|
|
|
| |||||||||||
|
|
|
| |||||||||||||||||
| (1) | Represents adjustments to recovery values based on changes in market prices, realized gains or losses from assets sales above or below previously recorded recovery values, assumptions and/or estimates which, in the Company’s judgment, impact the Company’s recoverable value on the underlying assets. |
| (2) | Cash activities are presented net of disbursements. Amounts may differ from previously filed Schedules of Cash Receipts and Disbursements mainly due to timing and classification differences. Cash activities related to Derivative Receivables and Related Assets include collections on open and terminated trades, net of hedging activities. |
| (3) | Inventory balances as of April 6, 2017 include (i) an investment in Formula One of $251 million in PEPI that is encumbered by LB I Group Inc. for the benefit of LCPI, (ii) an investment in First Data Corporation of $291 million in PEPI that is encumbered by LB I Group Inc. for the benefit of LB UK Holdings (Delaware) Inc., and (iii) residential mortgage backed securities of $14 million in Loans and Residential Real Estate that are encumbered by LBHI for the benefit of Lehman Brothers Pass-Through Securities Inc. (“LPTSI”). |
Page 7
Quarterly Financial Report as of April 6, 2017 (Unaudited)
Note 5 – Financial Instruments and Other Inventory Positions(continued)
Commercial Real Estate
Commercial Real Estate includes real estate owned properties, joint venture equity interests in commercial properties, and other real estate-related investments.
The Company utilizes various pricing models to determine the recovery values of assets within the Commercial Real Estate portfolio. These pricing models often incorporate current market prices, estimated future cash flows net of obligations to third parties, brokers’ opinions of value, and third party analyses.
As of April 6, 2017, the Company estimated the aggregate remaining recovery value for the Commercial Real Estate portfolio at $133 million. Between December 31, 2016 and April 6, 2017, the Company (i) monetized $17 million of inventory, and (ii) increased the estimated recovery value for the portfolio by $15 million.
Loans and Residential Real Estate
The Loans and Residential Real Estate portfolio includes commercial term loans with fixed maturity dates, corporate equity securities, and residential mortgage-backed securities.
The Company utilizes internal pricing models, which incorporate current market prices and historical and estimated future cash flows to determine the recovery values of loans. Recovery values for mortgage-backed securities are based primarily on third-party valuation analyses, which generally include market prices for similar assets and various pricing assumptions.
Potential future recoveries related to indemnity claims against third parties transferred to LBHI pursuant to the Fannie Mae and Freddie Mac Agreements (refer to the Mortgage Sellers litigation inNote 12 – Legal Proceedings, for additional information) are excluded from estimated recovery values, as the outcomes, many of which are subject to litigation, are uncertain and contingent upon various legal factors outside of the Company’s control.
As of April 6, 2017, the Company estimated the aggregate remaining recovery value for the Loans and Residential Real Estate portfolio at $75 million. Between December 31, 2016 and April 6, 2017, the Company (i) monetized $47 million of inventory, and
(ii) increased the estimated recovery value for the portfolio by $29 million.
Private Equity / Principal Investments
Private Equity / Principal Investments include equity and fixed-income direct investments in companies, and general partner and limited partner interests in investment fund vehicles (including private equity) and related funds.
Recovery values for private equity / principal investments and general partner interests are based on comparable trading and transaction multiples, period end publicly quoted prices, and estimated future cash flows. Limited partner interests in private equity and hedge funds are valued at the net asset value unless an impairment is assessed. Recovery value may be impacted for those positions that are subject to confidentiality restrictions and transfer restrictions for which the Company may need consent from sponsors, general partners and/or portfolio companies in order to (i) share information regarding such positions with prospective buyers and/or (ii) transfer such positions to a buyer.
As of April 6, 2017, the Company estimated the aggregate remaining recovery value for the Private Equity / Principal Investments portfolio at $769 million. Between December 31, 2016 and April 6, 2017, the Company:
| • | monetized $265 million of inventory, primarily driven by the partial sale of the Company’s interest in Formula One for $257 million, and |
| • | increased the estimated recovery value for the portfolio by $80 million, primarily driven by (i) the increased estimated recovery value of the Company’s interest in Formula One of $42 million, and (ii) mark-to-market changes of $25 million on the First Data Corporation investment. |
Page 8
Quarterly Financial Report as of April 6, 2017 (Unaudited)
Note 5 – Financial Instruments and Other Inventory Positions(continued)
Derivative Assets and Derivative Liabilities
Derivative assets and Derivative liabilities represent amounts due from/to counterparties related to matured, terminated and open trades, and are recorded at expected recovery/claim amounts, net of cash and securities collateral.
The Company’s estimated recovery values for Derivative assets and claim amounts are determined using internal and third party valuation models and data sources, internal assessments, valuation assumptions asserted by counterparties, certain assumptions regarding contract provisions, and management judgment.
For derivative litigation actions which may result in a potential recovery to the Company (“Affirmative Litigations”), the largest of which are listed and described inNote 12 – Legal Proceedings, estimated recoveries are recorded at zero unless one of the following conditions are met:
| (i) | The Company has reached agreements in principle with the corresponding counterparties, in which case the recovery value is recorded at the agreed amounts; or |
| (ii) | The Company has locked in value by purchasing notes of various special purpose vehicles, in which case the Balance Sheets reflect estimated recovery values at the value locked in. |
Derivative claims are recorded in Liabilities Subject to Compromise as follows:
| (i) | Resolved claims are recorded at values agreed by the Company; and |
| (ii) | Unresolved claims are recorded at amounts estimated to be allowed by the Company. |
Derivative claims recorded by LBSF include LBSF’s obligations under the RACERS swaps (refer to Section IV.I.b of the Disclosure Statement).
As of April 6, 2017, the Company estimated the aggregate remaining recovery value for the Derivatives portfolio at $159 million. Between December 31, 2016 and April 6, 2017, the Company:
| • | increased the estimated recovery value for the portfolio by $78 million, primarily related to a litigation settlement agreement with Federal Home Loan Bank of New York (“FHLB-NY”) that was finalized in April 2017; and |
| • | collected $26 million from settlements related to special purpose vehicles and various other counterparties. |
As of April 6, 2017, the Company estimated aggregate Derivative liabilities, before any distributions, at $24.1 billion.
Hedging Programs
The Company terminated its currency hedging programs in the week beginning March 13, 2017.
Page 9
Quarterly Financial Report as of April 6, 2017 (Unaudited)
Note 6 – Receivables from Debtors and Debtor-Controlled Entities and Other Assets
Receivables from Debtors and Debtor-Controlled Entities and Other Assets includes: (i) $1.9 billion related to certain post-petition activities between and among Debtors and Debtor-Controlled Entities, with the corresponding liabilities reflected in Payables to Debtors and Debtor-Controlled Entities and Other Liabilities, and (ii) $461 million of other assets.
The following table summarizes the main components of Receivables from Debtors and Debtor-Controlled Entities and Other Assets as of April 6, 2017:
| Debtors | Debtor- | Total Debtors and Debtor- | ||||||||||||||||||||||||||
| $ in millions | LBHI | LCPI | LBSF | Other Debtors | Total | Controlled Entities | Controlled Entities | |||||||||||||||||||||
Encumbered Financial Inventory(1) | $ | — | $ | 251 | $ | — | $ | — | $ | 251 | $ | 14 | $ | 264 | ||||||||||||||
Secured Notes (2) | — | — | 349 | 873 | 1,221 | 69 | 1,290 | |||||||||||||||||||||
Fundings and other activites(3) | 160 | 0 | 0 | 4 | 164 | 160 | 324 | |||||||||||||||||||||
|
|
|
|
|
| |||||||||||||||||||||||
Receivables from Debtors and Debtor-Controlled Entities | 160 | 251 | 349 | 876 | 1,636 | 242 | 1,878 | |||||||||||||||||||||
Receivable related to Fenway(4) | 85 | — | — | — | 85 | — | 85 | |||||||||||||||||||||
Affiliate Claims (5) | 247 | — | 14 | 1 | 261 | 0 | 261 | |||||||||||||||||||||
Subrogated Receivable | 40 | — | — | — | 40 | — | 40 | |||||||||||||||||||||
Other | 27 | 0 | (0 | ) | 0 | 27 | 47 | 74 | ||||||||||||||||||||
|
|
|
|
|
| |||||||||||||||||||||||
Total Other Assets | 399 | 0 | 14 | 1 | 413 | 47 | 461 | |||||||||||||||||||||
|
|
|
|
|
| |||||||||||||||||||||||
Total Receivables from Debtors and Debtor-Controlled Entities and Other Assets | $ | 559 | $ | 251 | $ | 362 | $ | 877 | $ | 2,049 | $ | 290 | $ | 2,339 | ||||||||||||||
|
|
|
|
|
| |||||||||||||||||||||||
| (1) | Includes (i) $251 million of Private Equity/Principal Investment assets encumbered by LB I Group Inc. for the benefit of LCPI, and (ii) $14 million of Residential Real Estate assets encumbered by LBHI for the benefit of LPTSI. |
| (2) | Includes (i) loans to LBHI from LOTC of $500 million, LBCC of $237 million, LBDP of $20 million and a Debtor-Controlled Entity of $69 million, secured by LBHI assets; (ii) loans from LBFP to LCPI and LBSF of $73 million and $42 million, respectively, secured by LCPI and LBSF assets; and (iii) an investment of $349 million of LBSF’s cash reserves for disputed claims in secured notes issued by LBHI. |
| (3) | Includes (i) $160 million primarily related to fundings (e.g. capital calls) by LBHI and cost allocations; and (ii) $99 million related to a promissory note issued by LBHI to a Debtor-Controlled Entity, LBHK Funding (Cayman) No.1 Ltd, of which LBHI is the ultimate economic beneficiary. |
| (4) | Represents unsecured claims asserted by LBHI against LCPI based on the Fenway transactions, as disclosed in Section 6.5(h) of the Plan, net of $145 million of payments received by LBHI as a result of Plan Distributions. |
| (5) | Represents $261 million of affiliate claims acquired through settlements with third parties valued at estimated recoveries, net of distributions. |
Page 10
Quarterly Financial Report as of April 6, 2017 (Unaudited)
Note 6 – Receivables from Debtors and Debtor-Controlled Entities and Other Assets(continued)
Cost Allocations
Expenses related to obligations for certain administrative services and bankruptcy related costs are generally paid by LBHI then allocated on a quarterly basis to Debtor and Debtor-Controlled Entities with material remaining inventory and/or unresolved claims. A revised methodology for allocating expenses was implemented for expenses disbursed beginning April 1, 2012 (the “Post-Effective Methodology”). The Post-Effective Methodology categorizes and allocates administrative expenses as follows:
| (i) | Costs directly attributable to specific legal entities, such as dedicated staff costs and professional fees associated with assets or legal matters which benefit specific legal entities, are directly assigned to the corresponding legal entities; |
| (ii) | Costs attributable to the support and management of specific asset and claim portfolios, such as asset management and claim staff, professional fees and technology costs to support the asset and claim portfolios, are allocated among legal entities based on the (a) pro rata ownership of inventory within each asset portfolio, and (b) pro rata claims for certain claim categories; |
| (iii) | Costs associated with general claims mitigation, distributions, and other bankruptcy-related activities are allocated among Debtors based on outstanding unresolved claims and cumulative distributions; and |
| (iv) | All remaining administrative costs are allocated among Debtors based on outstanding unresolved claims and estimated future distributions. |
The Company continually reviews the methodology for allocating costs, and adjustments are reflected in the Balance Sheets.
Page 11
Quarterly Financial Report as of April 6, 2017 (Unaudited)
Note 7 – Investments in Affiliates
Investments in Debtor-Controlled Entities are recorded in the Balance Sheets at book values. Investments in Debtor-Controlled Entities that have incurred cumulative net operating losses in excess of capital contributions are shown as negative amounts.
The earnings or losses of (i) Debtors owned by other Debtors (e.g. LBCS is a direct subsidiary of LBSF) or Debtor-Controlled Entities (e.g. LCPI is a direct subsidiary of Lehman ALI Inc. (“ALI”)), and (ii) Debtor-Controlled Entities owned by Debtors (e.g. ALI is a direct subsidiary of LBHI) are not eliminated in the Balance Sheets, and as a result, Investments in Affiliates reflect the earnings or losses of Debtors and certain Debtor-Controlled Entities more than once.
Adjustments to Investments in Affiliates may be required in future Balance Sheets (including write-downs and write-offs), as amounts ultimately realized may vary materially from amounts reflected on the Balance Sheets herein.
Debtor-Controlled Entities – Aurora Commercial Corp.
The investment in Aurora Commercial Corp. (formerly known as Aurora Bank FSB) (“Aurora”), a wholly-owned subsidiary of Lehman Brothers Bancorp Inc. (“LBB”), which is a wholly owned subsidiary of LBHI, is reflected in LBB’s Balance Sheets on a consolidated basis.
Aurora is a party to various litigation matters, primarily matters in which various counterparties have asserted claims against Aurora arising out of Aurora’s mortgage servicing operations. Aurora establishes accruals for loss contingencies as it becomes probable that a loss will be incurred and the amount of that loss can be estimated.
In connection with various Aurora asset sales, LBB entered into certain guarantee agreements with the respective purchasers of the Aurora assets. In accordance with the terms of those agreements, LBB is potentially liable for an aggregate amount up to a maximum of $100 million, if Aurora fails to perform under its indemnity obligations to the purchasers of its assets.
The ultimate recovery value for Aurora, which may vary materially from the amount reflected on the Balance Sheets due to significant costs related to litigation, wind down and other potential liabilities, may be adjusted (including write-downs and write-offs) in future Balance Sheets.
Non-Controlled Affiliates
All investments in Non-Controlled Affiliates were written off in 2011 as the Company deemed recovery on these equity investments unlikely to occur due to the bankruptcy proceedings of these entities in their local jurisdictions.
Page 12
Quarterly Financial Report as of April 6, 2017 (Unaudited)
Note 8 – Due from/to Affiliates
Due from/to Affiliates represents (i) receivables related to transactions among Debtors, Debtor-Controlled Entities and Non-Controlled Affiliates (separately or collectively, “Affiliates”), and (ii) payables by Debtor-Controlled Entities to Debtors and Non-Controlled Affiliates. Certain balances are reflected in “Due from” and “Due to” as a result of the assignments of claims against the Debtor and therefore are not netted.
Due from/to Affiliates are recorded in the Balance Sheets at book values, and where applicable, these balances are recorded net of cash distributions. The Balance Sheets do not reflect potential realization or collectability reserves for Due from Affiliates balances nor estimates of potential additional payables to Affiliates. As a result, adjustments (including write-downs and write-offs) to Due from/to Affiliates, which are material, will be recorded in future Balance Sheets.
Page 13
Quarterly Financial Report as of April 6, 2017 (Unaudited)
Note 8 – Due from/to Affiliates(continued)
(a)Intercompany Balances Among Debtors and Debtor-Controlled Entities
The table below presents the Due from/to Debtors and Debtor-Controlled Entities balances as of April 6, 2017, and the related activity since the previously filed Quarterly Financial Report as of December 31, 2016:
| Activity 1/1/17 - 4/6/17 | ||||||||||||||||||||||||||||||||
| $ in millions | As of December 31, 2016 | Cash Receipts | Cash Distributions | Claim Assignments | Plan Related Adjustments | Post-Petition Interest | Withdrawal / Debt Forgiveness | As of April 6, 2017 | ||||||||||||||||||||||||
Due From Controlled | ||||||||||||||||||||||||||||||||
Debtors: | ||||||||||||||||||||||||||||||||
Lehman Brothers Holdings Inc. | $ | 21,691 | $ | (410 | ) | $ | — | $ | 14 | $ | (2 | ) | $ | 40 | $ | (49 | ) | $ | 21,284 | |||||||||||||
Lehman Commercial Paper Inc. | 5,161 | (60 | ) | — | — | (0 | ) | 6 | 0 | 5,107 | ||||||||||||||||||||||
Lehman Brothers Special Financing Inc. | 486 | (16 | ) | — | — | (2 | ) | 3 | (0 | ) | 471 | |||||||||||||||||||||
Other Debtors | 516 | (9 | ) | — | (5 | ) | (0 | ) | (0 | ) | (1 | ) | 502 | |||||||||||||||||||
|
|
|
|
|
|
|
|
|
|
|
|
|
|
|
| |||||||||||||||||
Subtotal Debtors | 27,855 | (496 | ) | — | 9 | (4 | ) | 50 | (50 | ) | 27,364 | |||||||||||||||||||||
Debtor-Controlled | 3,819 | (62 | ) | — | (54 | ) | (0 | ) | 1 | (4 | ) | 3,700 | ||||||||||||||||||||
|
|
|
|
|
|
|
|
|
|
|
|
|
|
|
| |||||||||||||||||
Total | $ | 31,673 | $ | (558 | ) | $ | — | $ | (45 | ) | $ | (4 | ) | $ | 51 | $ | (54 | ) | $ | 31,064 | ||||||||||||
|
|
|
|
|
|
|
|
|
|
|
|
|
|
|
| |||||||||||||||||
Due To Controlled(1) | ||||||||||||||||||||||||||||||||
Debtors: | ||||||||||||||||||||||||||||||||
Lehman Brothers Holdings Inc. | $ | 4,606 | $ | — | $ | (74 | ) | $ | (48 | ) | $ | — | $ | — | $ | (4 | ) | $ | 4,481 | |||||||||||||
Lehman Commercial Paper Inc. | 3,772 | — | (228 | ) | — | (5 | ) | — | — | 3,539 | ||||||||||||||||||||||
Lehman Brothers Special Financing Inc. | 10,291 | — | (33 | ) | 3 | (0 | ) | — | — | 10,260 | ||||||||||||||||||||||
Other Debtors | 366 | — | (53 | ) | 0 | (0 | ) | 51 | 0 | 364 | ||||||||||||||||||||||
|
|
|
|
|
|
|
|
|
|
|
|
|
|
|
| |||||||||||||||||
Subtotal Debtors | 19,034 | — | (388 | ) | (45 | ) | (5 | ) | 51 | (4 | ) | 18,644 | ||||||||||||||||||||
Debtor-Controlled | 11,820 | — | (101 | ) | — | — | — | (49 | ) | 11,670 | ||||||||||||||||||||||
|
|
|
|
|
|
|
|
|
|
|
|
|
|
|
| |||||||||||||||||
Total | $ | 30,854 | $ | — | $ | (489 | ) | $ | (45 | ) | $ | (5 | ) | $ | 51 | $ | (53 | ) | $ | 30,314 | ||||||||||||
|
|
|
|
|
|
|
|
|
|
|
|
|
|
|
| |||||||||||||||||
| (1) | “Due to Debtors and Debtor-Controlled Entities” balances are reflected in Liabilities Subject to Compromise on the April 6, 2017 Balance Sheets. |
Page 14
Quarterly Financial Report as of April 6, 2017 (Unaudited)
Note 8 – Due from/to Affiliates(continued)
(a) Intercompany Balances Among Debtors and Debtor-Controlled Entities (continued)
The following table presents a summary of Due from/to Debtors and Debtor-Controlled Entities for Debtors as of April 6, 2017:
| LBHI | LBSF | LCPI | Other Debtors | Total Debtors | ||||||||||||||||||||||||||||||||||||
| $ in millions | Due from | Due to | Due from | Due to | Due from | Due to | Due from | Due to | Due from | Due to | ||||||||||||||||||||||||||||||
Lehman Brothers Holdings Inc | $ | — | $ | — | $ | 177 | $ | (9,895 | ) | $ | 611 | $ | (3,170 | ) | $ | 28 | $ | (205 | ) | $ | 816 | $ | (13,270 | ) | ||||||||||||||||
LB Special Financing Inc | 9,895 | (177 | ) | — | — | 96 | (218 | ) | 268 | (39 | ) | 10,260 | (434 | ) | ||||||||||||||||||||||||||
Lehman Commercial Paper Inc | 3,170 | (611 | ) | 218 | (96 | ) | — | — | 132 | (105 | ) | 3,520 | (812 | ) | ||||||||||||||||||||||||||
Structured Asset Securities Corp | 80 | — | — | — | — | (132 | ) | — | — | 80 | (132 | ) | ||||||||||||||||||||||||||||
LB Commodity Services Inc | 67 | (0 | ) | — | (268 | ) | — | (0 | ) | — | (0 | ) | 67 | (268 | ) | |||||||||||||||||||||||||
LB Commercial Corporation | 58 | (21 | ) | 39 | — | 105 | — | 0 | — | 201 | (21 | ) | ||||||||||||||||||||||||||||
LB OTC Derivatives Inc | 0 | — | 0 | — | — | — | — | — | 0 | — | ||||||||||||||||||||||||||||||
Other Debtors | 0 | (8 | ) | 0 | — | — | — | 0 | (0 | ) | 0 | (8 | ) | |||||||||||||||||||||||||||
RACERS Claims(1) | 750 | — | — | — | — | — | — | — | 750 | — | ||||||||||||||||||||||||||||||
|
|
|
|
|
|
|
|
|
| |||||||||||||||||||||||||||||||
Total Debtors | $ | 14,020 | $ | (816 | ) | $ | 434 | $ | (10,260 | ) | $ | 812 | $ | (3,520 | ) | $ | 428 | $ | (348 | ) | $ | 15,694 | $ | (14,944 | ) | |||||||||||||||
Lehman Ali Inc: | ||||||||||||||||||||||||||||||||||||||||
Lehman Ali Inc (PCO) | — | (2,401 | ) | — | — | 2,458 | — | 0 | — | 2,458 | (2,401 | ) | ||||||||||||||||||||||||||||
LB I Group Inc: | ||||||||||||||||||||||||||||||||||||||||
LB I Group Inc (PCO) | 1,573 | (27 | ) | 7 | — | 44 | — | 0 | — | 1,624 | (27 | ) | ||||||||||||||||||||||||||||
LB Offshore Partners Ltd | 363 | — | — | — | 1 | — | — | — | 364 | — | ||||||||||||||||||||||||||||||
DL Mortgage Corp | — | (180 | ) | 0 | — | 761 | — | (0 | ) | — | 761 | (180 | ) | |||||||||||||||||||||||||||
314 Commonwealth Ave Inc: | ||||||||||||||||||||||||||||||||||||||||
314 Commonwealth Ave Inc (PCO) | 792 | (85 | ) | — | — | — | — | — | 0 | 792 | (85 | ) | ||||||||||||||||||||||||||||
LB U.K. Holdings (Delaware) Inc: | ||||||||||||||||||||||||||||||||||||||||
LB U.K. Holdings (Delaware) Inc (PCO) | 178 | (462 | ) | — | — | — | — | — | (15 | ) | 178 | (477 | ) | |||||||||||||||||||||||||||
Other: | ||||||||||||||||||||||||||||||||||||||||
Pami Ali LLC | 1,788 | (62 | ) | 1 | — | 999 | — | (0 | ) | — | 2,788 | (62 | ) | |||||||||||||||||||||||||||
Luxembourg Finance Sarl | 1,051 | — | 28 | — | — | — | 74 | — | 1,152 | — | ||||||||||||||||||||||||||||||
Real Estate Private Equity Inc | 594 | — | — | — | — | — | — | — | 594 | — | ||||||||||||||||||||||||||||||
SMF No. 1 Limited | 180 | — | — | — | — | — | — | — | 180 | — | ||||||||||||||||||||||||||||||
Repe LBREP II Holdings, L.P. | 185 | — | — | — | — | — | — | — | 185 | — | ||||||||||||||||||||||||||||||
Lehman Brothers Global Services Inc. | 54 | — | — | (0 | ) | — | (0 | ) | — | (0 | ) | 54 | (0 | ) | ||||||||||||||||||||||||||
LB Pass-Through Securities Inc | 45 | — | — | — | — | — | — | — | 45 | — | ||||||||||||||||||||||||||||||
LB Private Equity Advisers LLC | — | (84 | ) | — | — | — | — | — | — | — | (84 | ) | ||||||||||||||||||||||||||||
Other | 459 | (363 | ) | 1 | — | 32 | (19 | ) | — | (1 | ) | 493 | (384 | ) | ||||||||||||||||||||||||||
|
| |||||||||||||||||||||||||||||||||||||||
Total Debtor-Controlled Entities | $ | 7,264 | $ | (3,664 | ) | $ | 37 | $ | (0 | ) | $ | 4,295 | $ | (19 | ) | $ | 74 | $ | (16 | ) | $ | 11,669 | $ | (3,700 | ) | |||||||||||||||
|
| |||||||||||||||||||||||||||||||||||||||
Total | $ | 21,284 | $ | (4,481 | ) | $ | 471 | $ | (10,260 | ) | $ | 5,107 | $ | (3,539 | ) | $ | 502 | $ | (364 | ) | $ | 27,364 | $ | (18,644 | ) | |||||||||||||||
|
| |||||||||||||||||||||||||||||||||||||||
“PCO” – parent company only
| (1) | Refer to Section IV.I.b of the Disclosure Statement for further information on the RACERS Claims. |
Page 15
Quarterly Financial Report as of April 6, 2017 (Unaudited)
Note 8 – Due from/to Affiliates(continued)
(a) Intercompany Balances Among Debtors and Debtor-Controlled Entities (continued)
The following table presents a summary of Due from/to Affiliates balances for Debtor-Controlled Entities as of April 6, 2017:
| Lehman ALI Inc. | LB I Group Inc. | 314 Commonwealth Ave. Inc. | LB UK Holdings Delaware Inc. | Other Debtor- Controlled Entities | ||||||||||||||||||||||||||||||||||||
| $ in millions | Due from | Due to | Due from | Due to | Due from | Due to | Due from | Due to | Due from | Due to | ||||||||||||||||||||||||||||||
|
| |||||||||||||||||||||||||||||||||||||||
Debtors: | ||||||||||||||||||||||||||||||||||||||||
Lehman Brothers Holdings Inc. | $ | 2,401 | $ | (0 | ) | $ | 207 | $ | (1,937 | ) | $ | 85 | $ | (792 | ) | $ | 462 | $ | (178 | ) | $ | 508 | $ | (4,274 | ) | |||||||||||||||
Lehman Commercial Paper Inc. | — | (2,458 | ) | — | (806 | ) | — | — | — | — | 0 | (1,031 | ) | |||||||||||||||||||||||||||
Lehman Brothers Special Financing Inc. | — | — | — | (7 | ) | — | — | — | — | 0 | (29 | ) | ||||||||||||||||||||||||||||
Lehman Brothers Commercial Corporation | — | — | — | — | — | — | 15 | — | — | — | ||||||||||||||||||||||||||||||
|
|
|
|
|
|
|
|
|
| |||||||||||||||||||||||||||||||
Total Debtors | $ | 2,401 | $ | (2,458 | ) | $ | 207 | $ | (2,750 | ) | $ | 85 | $ | (792 | ) | $ | 477 | $ | (178 | ) | $ | 508 | $ | (5,334 | ) | |||||||||||||||
Debtor-Controlled: | ||||||||||||||||||||||||||||||||||||||||
314 Commonwealth Ave Inc | $ | 45 | $ | — | $ | — | $ | — | $ | — | $ | — | $ | — | $ | — | $ | — | $ | — | ||||||||||||||||||||
Lehman Ali Inc(1) | — | — | 0 | — | — | (45 | ) | — | — | 221 | — | |||||||||||||||||||||||||||||
Repe LBREP III LLC(1) | — | — | — | — | — | — | — | — | 118 | — | ||||||||||||||||||||||||||||||
Real Estate Private Equity Inc(1) | — | — | — | — | — | — | — | — | 233 | (23 | ) | |||||||||||||||||||||||||||||
LB I Group Inc. | — | — | — | — | — | — | — | — | 4 | (325 | ) | |||||||||||||||||||||||||||||
Pami ALI LLC | — | (221 | ) | 298 | — | — | — | — | — | 1 | (336 | ) | ||||||||||||||||||||||||||||
Other | 20 | (0 | ) | 28 | (28 | ) | 0 | 0 | (0 | ) | (2 | ) | 24 | (148 | ) | |||||||||||||||||||||||||
|
|
|
|
|
|
|
|
|
| |||||||||||||||||||||||||||||||
Total Debtor-Controlled Entities | $ | 65 | $ | (221 | ) | $ | 325 | $ | (28 | ) | $ | 0 | $ | (45 | ) | $ | (0 | ) | $ | (2 | ) | $ | 602 | $ | (832 | ) | ||||||||||||||
|
|
|
|
|
|
|
|
|
| |||||||||||||||||||||||||||||||
Total | $ | 2,466 | $ | (2,679 | ) | $ | 533 | $ | (2,778 | ) | $ | 85 | $ | (838 | ) | 477 | $ | (180 | ) | $ | 1,110 | $ | (6,166 | ) | ||||||||||||||||
|
|
|
|
|
|
|
|
|
| |||||||||||||||||||||||||||||||
Non-Controlled Affiliates:(2) | ||||||||||||||||||||||||||||||||||||||||
Lehman Brothers Holdings Intermediate 2 Ltd | $ | — | $ | — | $ | — | $ | — | $ | — | $ | — | $ | 77 | $ | — | $ | 749 | $ | — | ||||||||||||||||||||
Lehman Brothers Holdings PLC | — | — | — | — | — | — | 227 | — | 2 | — | ||||||||||||||||||||||||||||||
LB Commercial Corp Asia Limited | — | — | — | — | — | — | — | — | 967 | (0 | ) | |||||||||||||||||||||||||||||
LB UK RE Holdings Limited | — | — | — | — | 6 | — | — | — | — | — | ||||||||||||||||||||||||||||||
Other | 0 | — | 0 | (1 | ) | — | — | 96 | — | 47 | (29 | ) | ||||||||||||||||||||||||||||
|
|
|
|
|
|
|
|
|
| |||||||||||||||||||||||||||||||
Total | $ | 0 | $ | — | $ | 0 | $ | (1 | ) | $ | 6 | $ | — | $ | 399 | $ | — | $ | 1,764 | $ | (29 | ) | ||||||||||||||||||
|
|
|
|
|
|
|
|
|
| |||||||||||||||||||||||||||||||
| (1) | “Due from” balances at Other Debtor-Controlled Entities are related to receivables recorded by Pami ALI LLC. |
| (2) | Certain “Due from” balances are recorded in the local currency of the respective Non-Controlled Affiliates and as a result, balances may fluctuate as a result of changes in foreign exchange rates. Due from/to Affiliates balances include both settled and unresolved balances with Non-Controlled Affiliates. |
Page 16
Quarterly Financial Report as of April 6, 2017 (Unaudited)
Note 8 – Due from/to Affiliates(continued)
(b) Intercompany balances among Debtors and Debtor-Controlled Entities and Non-Controlled Affiliates
The table below presents the Due from/to Non-Controlled Affiliates balances as of April 6, 2017, and the related activity since the previously filed Quarterly Financial Report as of December 31, 2016:
| Activity 1/1/17 - 4/6/17 | ||||||||||||||||||||||||||||
| $ in millions | As of December 31, 2016 | Cash Receipts(1) | Cash Distributions | Claim Assignments | Plan Related Adjustments | Other (2) | As of April 6, 2017 | |||||||||||||||||||||
Due From Non-Controlled | ||||||||||||||||||||||||||||
Debtors: | ||||||||||||||||||||||||||||
Lehman Brothers Holdings Inc. | $ | 17,504 | $ | (728 | ) | $ | — | $ | 2 | $ | — | $ | 309 | $ | 17,087 | |||||||||||||
Lehman Commercial Paper Inc. | 136 | (0 | ) | — | (0 | ) | — | (0 | ) | 135 | ||||||||||||||||||
Lehman Brothers Special Financing Inc. | 712 | (10 | ) | — | — | — | 0 | 702 | ||||||||||||||||||||
Other Debtors | 275 | (6 | ) | — | — | — | 1 | 270 | ||||||||||||||||||||
|
|
|
|
|
|
|
|
|
|
|
|
|
| |||||||||||||||
Subtotal Debtors | 18,627 | (744 | ) | — | 2 | — | 310 | 18,195 | ||||||||||||||||||||
Debtor-Controlled | 2,169 | (1 | ) | — | (3 | ) | — | 4 | 2,169 | |||||||||||||||||||
|
|
|
|
|
|
|
|
|
|
|
|
|
| |||||||||||||||
Total | $ | 20,796 | $ | (745 | ) | $ | — | $ | (0 | ) | $ | — | $ | 314 | $ | 20,364 | ||||||||||||
|
|
|
|
|
|
|
|
|
|
|
|
|
| |||||||||||||||
Due To Non-Controlled(3) | ||||||||||||||||||||||||||||
Debtors: | ||||||||||||||||||||||||||||
Lehman Brothers Holdings Inc. | $ | 33,586 | $ | — | $ | (538 | ) | $ | — | $ | — | $ | (1 | ) | $ | 33,046 | ||||||||||||
Lehman Commercial Paper Inc. | 615 | — | (32 | ) | — | (7 | ) | — | 576 | |||||||||||||||||||
Lehman Brothers Special Financing Inc. | 966 | — | (3 | ) | (3 | ) | (0 | ) | 0 | 960 | ||||||||||||||||||
Other Debtors | 25 | — | — | (24 | ) | (0 | ) | (0 | ) | 1 | ||||||||||||||||||
|
|
|
|
|
|
|
|
|
|
|
|
|
| |||||||||||||||
Subtotal Debtors | 35,192 | — | (573 | ) | (26 | ) | (7 | ) | (1 | ) | 34,584 | |||||||||||||||||
Debtor-Controlled | 34 | — | — | — | — | (3 | ) | 31 | ||||||||||||||||||||
|
|
|
|
|
|
|
|
|
|
|
|
|
| |||||||||||||||
Total | $ | 35,225 | $ | — | $ | (573 | ) | $ | (26 | ) | $ | (7 | ) | $ | (4 | ) | $ | 34,615 | ||||||||||
|
|
|
|
|
|
|
|
|
|
|
|
|
| |||||||||||||||
| (1) | Between January 1, 2017 and April 6, 2017, the Company collected approximately $745 million from: |
($ in millions) | LBHI | LBSF | LCPI | Other Debtors | Debtor- Controlled Entities | Total | ||||||||||||||||||
Lehman Brothers Bankhaus A.G. (“Bankhaus”)(i) | $ | 255 | $ | — | $ | — | $ | 6 | $ | 0 | $ | 261 | ||||||||||||
Lehman Brothers Asia Pacific (Singapore) PTE | 228 | — | — | — | — | 228 | ||||||||||||||||||
Lehman Brothers Securities Asia Limited | 86 | — | — | 0 | — | 86 | ||||||||||||||||||
Lehman Brothers Treasury Co. B.V. (“LBT”)(ii) | 32 | 10 | — | 0 | — | 43 | ||||||||||||||||||
Lehman Brothers Finance S.A. | 34 | — | — | — | — | 34 | ||||||||||||||||||
Lehman Brothers Holdings Japan Inc. | 21 | — | — | — | — | 21 | ||||||||||||||||||
Lehman Brothers Futures Asia Limited | 17 | — | — | — | — | 17 | ||||||||||||||||||
Lehman Brothers Real Estate Australia Pty Limited | 10 | — | — | — | — | 10 | ||||||||||||||||||
LB RE Financing No.3 Limited | 9 | — | — | — | — | 9 | ||||||||||||||||||
Lehman Commercial Mortgage Conduit Limited | 8 | — | — | — | — | 8 | ||||||||||||||||||
LB Investments PTE Ltd(iii) | 8 | — | — | — | — | 8 | ||||||||||||||||||
Lehman Brothers (PTG) Limited | 7 | — | 0 | — | — | 7 | ||||||||||||||||||
Lehman Brothers Australia Holdings Pty | 7 | — | — | — | — | 7 | ||||||||||||||||||
Thayer Properties Ltd | 3 | — | — | — | — | 3 | ||||||||||||||||||
Other | 4 | 0 | 0 | 0 | 0 | 4 | ||||||||||||||||||
|
|
|
|
|
|
|
|
|
|
|
| |||||||||||||
| $ | 728 | $ | 10 | $ | 0 | $ | 6 | $ | 1 | $ | 745 | |||||||||||||
|
|
|
|
|
|
|
|
|
|
|
| |||||||||||||
| (i) | Receipts at LBHI primarily relate to direct claims against Bankhaus that were previously assigned to LBHI as a result of the Bankhaus Creditors’ Settlement (refer to Note 8(c) – Settlements with Non-Controlled Affiliates in the December 31, 2016 Balance Sheets, Docket No. 55127, for further information). |
| (ii) | Pursuant to agreements with LBT, LBSF and LBCS, LBHI deducted and withheld approximately $43 million from its twelfth Plan Distribution (“Withheld Distributions”) due from LBHI to LBT to offset amounts due to LBHI, LBSF and LBCS from LBT. The Withheld Distributions were then distributed to LBSF, LBCS and LBHI for inclusion in their respective twelfth Plan Distributions. |
| (iii) | The receipt of $8 million represents a distribution in kind. |
Page 17
Quarterly Financial Report as of April 6, 2017 (Unaudited)
Note 8 – Due from/to Affiliates (continued)
(b) Intercompany balances among Debtors and Debtor-Controlled Entities and Non-Controlled Affiliates (continued)
| (2) | “Due From Non-Controlled” balances are recorded in the local currency of the Non-Controlled Affiliate and as a result, balances fluctuate due to changes in foreign exchange rates. Other includes the impact of movements in foreign exchange rates of approximately $277 million. |
| (3) | “Due to Non-Controlled” balances are included in Liabilities Subject to Compromise herein. |
The following table presents a summary of Due from/to Non-Controlled Affiliates for Debtors as of April 6, 2017:
| LBHI | LBSF | LCPI | Other Debtors | Total Debtors | ||||||||||||||||||||||||||||||||||||
| $ in millions | Due from | Due to | Due from | Due to | Due from | Due to | Due from | Due to | Due from | Due to | ||||||||||||||||||||||||||||||
Europe | ||||||||||||||||||||||||||||||||||||||||
Lehman Brothers Treasury Co B.V.(1) | $ | 2,157 | $ | (22,891 | ) | $ | 673 | $ | — | $ | — | $ | — | $ | 106 | $ | — | $ | 2,936 | $ | (22,891 | ) | ||||||||||||||||||
Lehman Brothers Finance S.A. | 8,419 | (691 | ) | — | — | — | — | — | — | 8,419 | (691 | ) | ||||||||||||||||||||||||||||
Lehman Brothers Bankhaus A.G. | 41 | �� | — | — | (109 | ) | — | — | 1 | — | 42 | (109 | ) | |||||||||||||||||||||||||||
LB UK RE Holdings Limited | 602 | — | — | — | — | — | — | — | 602 | — | ||||||||||||||||||||||||||||||
Lehman Brothers (Luxembourg) S.A. | 309 | — | — | — | — | — | — | — | 309 | — | ||||||||||||||||||||||||||||||
Thayer Properties Limited | 177 | — | — | — | — | (0 | ) | — | — | 177 | (0 | ) | ||||||||||||||||||||||||||||
LB (PTG) Ltd | 130 | — | — | — | — | — | — | — | 130 | — | ||||||||||||||||||||||||||||||
LB Lease & Finance No.1 Ltd | 0 | — | — | — | — | — | — | — | 0 | — | ||||||||||||||||||||||||||||||
LB (Luxembourg) Equity Finance S.A | 31 | (55 | ) | — | — | — | — | — | — | 31 | (55 | ) | ||||||||||||||||||||||||||||
Longmeade Limited | 8 | — | — | — | — | (55 | ) | — | — | 8 | (55 | ) | ||||||||||||||||||||||||||||
LB RE Financing No.2 Limited | 0 | — | — | — | — | — | — | — | 0 | — | ||||||||||||||||||||||||||||||
Lehman Brothers Limited | 29 | (242 | ) | — | (2 | ) | — | (1 | ) | — | (0 | ) | 29 | (245 | ) | |||||||||||||||||||||||||
Lehman Brothers International (Europe) (2) | — | (749 | ) | — | (548 | ) | — | — | — | 0 | — | (1,297 | ) | |||||||||||||||||||||||||||
Eldon Street Holdings Limited | — | (426 | ) | — | — | — | (0 | ) | — | (0 | ) | — | (426 | ) | ||||||||||||||||||||||||||
LB RE Financing No.3 Limited | 407 | — | — | — | — | — | — | — | 407 | — | ||||||||||||||||||||||||||||||
LB Holdings Intermediate 2 Ltd | — | (204 | ) | — | — | — | — | — | — | — | (204 | ) | ||||||||||||||||||||||||||||
Wood Street Investments Ltd | — | (183 | ) | — | — | — | — | — | — | — | (183 | ) | ||||||||||||||||||||||||||||
Storm Funding Ltd | — | (99 | ) | — | (3 | ) | — | (39 | ) | — | — | — | (142 | ) | ||||||||||||||||||||||||||
Asia | ||||||||||||||||||||||||||||||||||||||||
Sunrise Finance Co. Ltd | 1,027 | (19 | ) | — | (14 | ) | — | (0 | ) | — | (0 | ) | 1,027 | (33 | ) | |||||||||||||||||||||||||
LB Commercial Corp. Asia Limited | 772 | — | — | — | — | (1 | ) | — | — | 772 | (1 | ) | ||||||||||||||||||||||||||||
Lehman Brothers Holdings Japan Inc. | 849 | (31 | ) | — | — | — | — | — | — | 849 | (31 | ) | ||||||||||||||||||||||||||||
LB Asia Pacific (Singapore) PTE | 650 | — | — | — | — | — | — | — | 650 | — | ||||||||||||||||||||||||||||||
Lehman Brothers Japan Inc. | 375 | (77 | ) | — | (131 | ) | — | — | 15 | — | 390 | (208 | ) | |||||||||||||||||||||||||||
LB Asia Capital Company | 344 | — | 29 | — | 133 | — | 148 | — | 654 | — | ||||||||||||||||||||||||||||||
LB Investments PTE Ltd | 259 | — | — | — | — | — | — | — | 259 | — | ||||||||||||||||||||||||||||||
LB Securities Asia Limited | — | (5 | ) | — | — | — | — | — | — | — | (5 | ) | ||||||||||||||||||||||||||||
Other | ||||||||||||||||||||||||||||||||||||||||
Claims held by third parties(3) | — | (7,183 | ) | — | (83 | ) | — | (455 | ) | — | — | — | (7,721 | ) | ||||||||||||||||||||||||||
Other | 503 | (191 | ) | 0 | (71 | ) | 2 | (25 | ) | — | (1 | ) | 505 | (287 | ) | |||||||||||||||||||||||||
|
|
|
|
|
|
|
|
|
| |||||||||||||||||||||||||||||||
Total | $ | 17,087 | $ | (33,046 | ) | $ | 702 | $ | (960 | ) | $ | 135 | $ | (576 | ) | $ | 270 | $ | (1 | ) | $ | 18,195 | $ | (34,584 | ) | |||||||||||||||
|
|
|
|
|
|
|
|
|
| |||||||||||||||||||||||||||||||
| (1) | LBT is included in the defined term “Non-Controlled Affiliates,” but LBHI has no direct or indirect equity interest in LBT. |
| (2) | LBHI owns allowed claims against LBIE in the aggregate face amount of £356 million. |
Page 18
Quarterly Financial Report as of April 6, 2017 (Unaudited)
Note 8 – Due from/to Affiliates(continued)
(b) Intercompany balances among Debtors and Debtor-Controlled Entities and Non-Controlled Affiliates (continued)
| (3) | “Claims held by third parties” represent claims, net of distributions, originally held by Non-Controlled Affiliates, according to their respective settlement agreements with the Company, that are currently held by third parties, including: |
| ($ in millions) | ||||||||||||||||
Original creditor | LBHI | LBSF | LCPI | Total | ||||||||||||
Lehman Brothers Bankhaus A.G. | $ | (4,957 | ) | $ | — | $ | (301 | ) | $ | (5,259 | ) | |||||
Lehman Brothers Securities NV | (510 | ) | (46 | ) | — | (555 | ) | |||||||||
Storm Funding Ltd | (527 | ) | — | — | (527 | ) | ||||||||||
LB Asia Capital Company | (411 | ) | — | — | (411 | ) | ||||||||||
Lehman Re Limited | (286 | ) | (16 | ) | (105 | ) | (407 | ) | ||||||||
LB Securities Asia Limited | (132 | ) | — | — | (132 | ) | ||||||||||
Lehman Brothers Asia Limited | (126 | ) | — | — | (126 | ) | ||||||||||
Lehman Brothers Futures Asia Limited | (60 | ) | — | — | (60 | ) | ||||||||||
Lehman Brothers Asia Holdings Limited | — | (21 | ) | (49 | ) | (71 | ) | |||||||||
Other | (174 | ) | 0 | 0 | (174 | ) | ||||||||||
|
|
|
|
|
|
|
| |||||||||
Total Claims held by third parties | $ | (7,183 | ) | $ | (83 | ) | $ | (455 | ) | $ | (7,721 | ) | ||||
|
|
|
|
|
|
|
| |||||||||
The following table presents, on an aggregate basis for Debtors and Debtor-Controlled Entities, admitted claims, receivables, and collections to date from Non-Controlled Affiliates:
$ in millions | Local Currency | Admitted Claims in Local Currency | Collections To Date in Local Currency (5) | Admitted and Unsettled Filed Claims in USD | Collections To Date in USD(5) | Net Receivables in USD | ||||||||||||||||||
Europe | ||||||||||||||||||||||||
Lehman Brothers Finance S.A. | CHF | 9,582 | (1,141 | ) | 9,553 | (1,135 | ) | 8,419 | ||||||||||||||||
Lehman Brothers Treasury Co B.V. | USD | 4,342 | (1,484 | ) | 4,342 | (1,484 | ) | 2,858 | ||||||||||||||||
Lehman Brothers Treasury Co B.V.(1) | Various | — | — | 113 | (35 | ) | 78 | |||||||||||||||||
Lehman Brothers Bankhaus A.G. | EUR | 203 | (202 | ) | 216 | (215 | ) | 1 | ||||||||||||||||
Lehman Brothers Bankhaus A.G. - Assigned(2) | EUR | 9,383 | (9,344 | ) | 9,988 | (9,947 | ) | 41 | ||||||||||||||||
LB UK RE Holdings Limited | GBP | 1,188 | (701 | ) | 1,482 | (874 | ) | 608 | ||||||||||||||||
Lehman Brothers (Luxembourg) S.A. | EUR | 759 | (468 | ) | 808 | (499 | ) | 309 | ||||||||||||||||
LB Holdings Intermediate 2 Ltd(3) (4) | — | — | — | 826 | — | 826 | ||||||||||||||||||
Lehman Brothers International (Europe) | GBP | 359 | (359 | ) | 450 | (450 | ) | — | ||||||||||||||||
LB RE Financing No.3 Limited | GBP | 353 | (27 | ) | 441 | (33 | ) | 407 | ||||||||||||||||
LB Commercial Mortgage Conduit Ltd | GBP | 240 | (212 | ) | 299 | (264 | ) | 35 | ||||||||||||||||
Thayer Properties Limited | GBP | 172 | (30 | ) | 214 | (38 | ) | 177 | ||||||||||||||||
LB (PTG) Ltd | GBP | 170 | (66 | ) | 212 | (82 | ) | 130 | ||||||||||||||||
Lehman Brothers Holdings Plc | GBP | 231 | (14 | ) | 289 | (17 | ) | 271 | ||||||||||||||||
LB (Luxembourg) Equity Finance S.A | EUR | 96 | (67 | ) | 102 | (71 | ) | 31 | ||||||||||||||||
Longmeade Limited | GBP | 43 | (17 | ) | 54 | (22 | ) | 32 | ||||||||||||||||
Asia | ||||||||||||||||||||||||
Sunrise Finance Co. Ltd | JPY | 234,022 | (119,785 | ) | 2,113 | (1,081 | ) | 1,031 | ||||||||||||||||
Lehman Brothers Holdings Japan Inc. | JPY | 178,617 | (84,635 | ) | 1,613 | (764 | ) | 849 | ||||||||||||||||
LB Asia Capital Company | HKD | 6,398 | (1,312 | ) | 823 | (169 | ) | 655 | ||||||||||||||||
LB Asia Pacific (Singapore) PTE(4) | USD | 987 | (337 | ) | 987 | (337 | ) | 650 | ||||||||||||||||
LB Asia Pacific (Singapore) PTE(4) | SGD | 1 | — | 0 | — | 0 | ||||||||||||||||||
LB Commercial Corp. Asia Limited | HKD | 32,615 | (19,103 | ) | 4,198 | (2,459 | ) | 1,739 | ||||||||||||||||
LB Investments PTE Ltd (4) | USD | 543 | (284 | ) | 543 | (284 | ) | 259 | ||||||||||||||||
LB Securities Asia Limited | HKD | 3,176 | (3,176 | ) | 409 | (409 | ) | 0 | ||||||||||||||||
Lehman Brothers Japan Inc. | JPY | 316,198 | (272,906 | ) | 2,855 | (2,464 | ) | 391 | ||||||||||||||||
GKI Development Inc. | KRW | 103,363 | (91,427 | ) | 91 | (81 | ) | 11 | ||||||||||||||||
Lehman Brothers Australia Ltd | AUD | 111 | (66 | ) | 84 | (50 | ) | 34 | ||||||||||||||||
Sail Investor PTE Ltd | USD | 63 | (60 | ) | 63 | (60 | ) | 3 | ||||||||||||||||
Other(6) | 11,576 | (11,055 | ) | 521 | ||||||||||||||||||||
|
|
|
| |||||||||||||||||||||
Total | $ | 54,743 | $ | (34,379 | ) | $ | 20,364 | |||||||||||||||||
|
|
|
| |||||||||||||||||||||
Page 19
Quarterly Financial Report as of April 6, 2017 (Unaudited)
Note 8 – Due from/to Affiliates(continued)
(b) Intercompany balances among Debtors and Debtor-Controlled Entities and Non-Controlled Affiliates (continued)
| (1) | Represents claims against LBT that were admitted in eight different currencies. |
| (2) | Includes gross claims against Lehman Brothers Bankhaus A.G. (“Bankhaus”) of €9.314 billion that were assigned as a result of the Harmonizing Resolution (refer toNote 8(c) – Settlements with Non-Controlled Affiliates, in the December 31, 2016 Balance Sheets, Docket No. 55127, for further information), net of €7.823 billion of distributions received by owners of the claims prior to the assignment of the claims to LBHI. |
| (3) | “Admitted and Unsettled Filed Claims in USD” includes the unsettled historical receivable balances for filed claims which have not yet been admitted. |
| (4) | Includes allowed claims that are deemed subordinated against LB Asia Pacific (Singapore) PTE of $366 million and LB Investments PTE Ltd of $6 million. A filed subordinated claim by LB Holdings Scottish LP 3 of $6.139 billion against LB Holdings Intermediate 2 Ltd is fully reserved in the Balance Sheets. |
| (5) | “Collections to Date in Local Currency” and “Collections to Date in USD” include distributions received on the claims prior to the assignments of the claims to LBHI and Debtor-Controlled Entities. |
| (6) | LB Lease & Finance No.1 Ltd made a final distribution, which included a distribution in kind of a £22.8 million claim against Lehman Brothers Limited that is included in “Other”. |
| (7) | Other claims against Lehman Brothers Finance S.A., Bankhaus, LBT and LBIE, acquired through settlements with third parties are included in Affiliate Claims receivables in the Balance Sheets (refer toNote 6 – Receivables from Controlled Affiliates and Other Assets for additional information). |
Page 20
Quarterly Financial Report as of April 6, 2017 (Unaudited)
Note 8 – Due from/to Affiliates(continued)
(c) Settlements with Non-Controlled Affiliates
Joint Venture to Facilitate Resolution of LBIE Claims
On January 31, 2014, Lehman Brothers Holdings Intermediate 2 Ltd. (“LBHI2”), a Non-Controlled Affiliate, LBHI, and Elliott Management Corporation and King Street Capital Management, L.P. (together, the “Funds”) entered into definitive documentation and consummated a joint venture to facilitate the resolution of LBIE claims (the “Joint Venture”):
| • | LBHI2 contributed to the Joint Venture its senior claim of GBP 38 million (“Senior Claim”), subordinated claims of GBP 1.25 billion (“Sub Debt”), and a portion of the economic interest in its preferred equity (“Preferred Equity”) in LBIE. |
| • | The Funds paid approximately GBP 650 million to LBHI2 and contributed to the Joint Venture the distributions on their claims against LBIE (approximately GBP 2.6 billion as of January 31, 2014) in excess of the principal amount plus post-administration interest at 8% per year. LBHI2’s final recoveries and distributions will be determined following the resolution of various outstanding legal issues currently in litigation. |
The Joint Venture includes a joint recovery pool governed by a specific sharing formula. Subject to certain adjustments, which could be material, all recoveries from the Sub Debt, Senior Claim and the Funds’ contribution are split as follows:
| (a) | 100% to the Funds up to GBP 650 million; |
| (b) | then 70% to the Funds and 30% to LBHI2 up to GBP 1.3 billion (plus interest); |
| (c) | then 50% to the Funds and 50% to LBHI2 up to GBP 2.2 billion (plus interest); and |
| (d) | 25% to the Funds and 75% to LBHI2 over GBP 2.2 billion (plus interest). |
A detailed summary of the terms of the parties’ commitments and the Joint Venture is available atwww.lehman-docket.comin the Key Documents section.
If LBIE makes distributions on the Preferred Equity before aggregate distributions from the Joint Venture to the Funds and LBHI2 have reached GBP 2.2 billion (plus interest), then, in certain circumstances, LBHI2, Lux Finance and LBHI shall be obligated to make payments to preserve the economic terms of the transaction as if 100% of the Preferred Equity proceeds had been transferred by LBHI2 to the Joint Venture.
Receivables from LBHI2:
| • | Luxembourg Finance Sarl (“Lux Finance”) and LB Scottish Holdings LP3 (“SLP3”) have receivables from LBHI2 of $749 million (including $19 million of accrued interest) and $77 million (consisting of exclusively accrued interest), respectively. Accrued interest was computed through the date LBHI2 entered administration. |
| • | As recoveries on these receivables are contingent on the resolution of a number of complex legal disputes surrounding distributions from LBIE, the Company has not recorded an estimate of future recoveries on the subordinated receivables from LBHI2 of $6.139 billion (“SLP3 Sub Rec”), nor any additional accrued interest that may accrue subsequent to LBHI2’s administration date at Lux Finance and/or SLP3. The Company has reserved in full for the SLP3 Sub Rec. |
| • | LB UK Holdings Delaware is the indirect parent and the beneficiary of any proceeds paid pursuant to the SLP3 Sub Rec. |
| • | In addition, the Company has receivables from certain Non-Controlled Affiliates that have claims against LBHI2. |
Page 21
Quarterly Financial Report as of April 6, 2017 (Unaudited)
Note 9 – Payables to Debtors and Debtor-Controlled Entities and Other Liabilities
Payables to Debtors and Debtor-Controlled Entities and Other Liabilities includes: (i) $1.9 billion related to certain post-petition activities between and among Debtors and Debtor-Controlled Entities, with the corresponding assets reflected in Receivables from Debtors and Debtor-Controlled Entities and Other Assets and (ii) $301 million of other liabilities.
The following table summarizes the main components of Payables to Debtors and Debtor-Controlled Entities and Other Liabilities as of April 6, 2017:
| Debtors | Debtor- | Total Debtors and Debtor- | ||||||||||||||||||||||||||
| $ in millions | LBHI | LCPI | LBSF | Other Debtors | Total | Controlled Entities | Controlled Entities | |||||||||||||||||||||
Encumbered Financial Inventory(1) | $ | 14 | $ | — | $ | — | $ | — | $ | 14 | $ | 251 | $ | 264 | ||||||||||||||
Secured Notes (2) | 1,175 | 73 | 42 | — | 1,290 | — | 1,290 | |||||||||||||||||||||
Fundings and other activites(3) | 160 | 3 | 20 | 10 | 193 | 131 | 324 | |||||||||||||||||||||
|
|
|
|
|
| |||||||||||||||||||||||
Payables to Controlled Affiliates | 1,348 | 77 | 62 | 10 | 1,497 | 382 | 1,878 | |||||||||||||||||||||
Distributions on Allowed Claims (not remitted) | 10 | 0 | 0 | 0 | 10 | — | 10 | |||||||||||||||||||||
Misdirected wires | 54 | — | — | — | 54 | — | 54 | |||||||||||||||||||||
LBHI2 Loan(4) | 103 | — | — | — | 103 | — | 103 | |||||||||||||||||||||
Other | 22 | 11 | 1 | 1 | 35 | 98 | 133 | |||||||||||||||||||||
|
|
|
|
|
| |||||||||||||||||||||||
Total Other Liabilities | 189 | 12 | 1 | 1 | 203 | 98 | 301 | |||||||||||||||||||||
|
|
|
|
|
| |||||||||||||||||||||||
Total Payables to Controlled Affiliates and other liabilities | $ | 1,538 | $ | 88 | $ | 62 | $ | 11 | $ | 1,699 | $ | 480 | $ | 2,179 | ||||||||||||||
|
|
|
|
|
| |||||||||||||||||||||||
Refer toNote 6 - Receivables from Debtors and Debtor-Controlled Entities and Other Assets for footnote 1 through 3 explanations.
| (4) | Represents a loan from LBHI2 to LBHI of £82.6 million, collateralized by LBHI’s claims against LBIE. |
Page 22
Quarterly Financial Report as of April 6, 2017 (Unaudited)
Note 10 – Taxes Payable
Taxes payable is an estimate of tax liabilities, net of the estimated impact of any refund claims, deposits and net operating losses (“NOL”). Taxes payable have been allocated among the members of the LBHI Tax Group pursuant to the Debtor Allocation Agreement (the “DAA”) (see below for further information).
As of December 31, 2016, the Company has recorded an estimate of $140 million for potential pre- and post-petition amounts owed to federal, state, local and international taxing authorities.
Debtor Allocation Agreement
The Debtor Allocation Agreement, which became effective on the Effective Date, addresses the relationship among the Debtors and certain Affiliates with respect to consolidated federal/combined state/local income taxes for pre-petition and post-petition years. Pursuant to the DAA, any tax receivables or payables related to pre-petition, consolidated group taxes, including the IRS refund, are treated as allowed pre-petition claims between LBHI and other Debtors and Debtor-Controlled Entities and subject to set-off or recoupment.
Page 23
Quarterly Financial Report as of April 6, 2017 (Unaudited)
Note 11 – Liabilities Subject to Compromise
The table below presents the Company’s estimates of claim values as of April 6, 2017 by claim category, and the changes in estimates since the previously filed Quarterly Financial Report as of December 31, 2016:
| ($ billions) | Period Ending April 6, 2017 | April 6, 2017 Claims Balance | ||||||||||||||||||||||||||||||||||
Claim Category | December 31, 2016 Claims Balance | Allowed Claims | Change in Estimated Active Claims | April 6, 2017 Claims Balance | LBHI | LCPI | LBSF | Other Debtors | ||||||||||||||||||||||||||||
Direct Claims: | ||||||||||||||||||||||||||||||||||||
Debt | $ | 99.2 | $ | — | $ | — | $ | 99.2 | $ | 98.5 | $ | — | $ | — | $ | 0.7 | ||||||||||||||||||||
Derivatives | 24.1 | 0.2 | (0.2 | ) | 24.1 | 0.0 | 0.0 | 21.6 | 2.4 | |||||||||||||||||||||||||||
Other | 13.4 | 0.0 | (0.0 | ) | 13.4 | 6.2 | 6.7 | 0.1 | 0.3 | |||||||||||||||||||||||||||
|
|
|
|
|
|
|
|
|
|
|
|
|
|
|
| |||||||||||||||||||||
Total Direct Claims | 136.7 | 0.2 | (0.2 | ) | 136.8 | 104.8 | 6.8 | 21.7 | 3.5 | |||||||||||||||||||||||||||
|
|
|
|
|
|
|
|
|
|
|
|
|
|
|
| |||||||||||||||||||||
Affiliate Claims Direct | 108.3 | (0.2 | ) | 0.2 | 108.3 | 58.8 | 23.1 | 21.0 | 5.4 | |||||||||||||||||||||||||||
Affiliate Guarantee Claims | 12.7 | 0.0 | (0.0 | ) | 12.7 | 12.7 | — | — | — | |||||||||||||||||||||||||||
Third Party Guarantee Claims | 68.5 | 0.4 | (0.3 | ) | 68.5 | 68.5 | — | — | — | |||||||||||||||||||||||||||
|
|
|
|
|
|
|
|
|
|
|
|
|
|
|
| |||||||||||||||||||||
Total Liabilities Subject to Compromise | 326.2 | 0.4 | (0.3 | ) | 326.3 | 244.9 | 29.9 | 42.7 | 8.9 | |||||||||||||||||||||||||||
|
|
|
|
|
|
|
|
|
|
|
|
|
|
|
| |||||||||||||||||||||
Taxes Payable | 0.1 | — | — | 0.1 | 0.1 | 0.0 | — | 0.0 | ||||||||||||||||||||||||||||
Secured Claims Payable to Third parties | 2.0 | — | — | 2.0 | 2.0 | — | — | — | ||||||||||||||||||||||||||||
|
|
|
|
|
|
|
|
|
|
|
|
|
|
|
| |||||||||||||||||||||
Total Claims | $ | 328.3 | $ | 0.4 | $ | (0.3 | ) | $ | 328.4 | $ | 247.0 | $ | 29.9 | $ | 42.7 | $ | 8.9 | |||||||||||||||||||
|
|
|
|
|
|
|
|
|
|
|
|
|
|
|
| |||||||||||||||||||||
Allowed Claims | 320.5 | 0.4 | — | 320.9 | 241.0 | 29.9 | 41.6 | 8.3 | ||||||||||||||||||||||||||||
Estimated Unresolved Claims to be Allowed | 7.9 | — | (0.3 | ) | 7.6 | 6.0 | — | 1.0 | 0.6 | |||||||||||||||||||||||||||
|
|
|
|
|
|
|
|
|
|
|
|
|
|
|
| |||||||||||||||||||||
Total Claims | $ | 328.3 | $ | 0.4 | $ | (0.3 | ) | $ | 328.4 | $ | 247.0 | $ | 29.9 | $ | 42.7 | $ | 8.9 | |||||||||||||||||||
|
|
|
|
|
|
|
|
|
|
|
|
|
|
|
| |||||||||||||||||||||
Less : Claims Distributions and other reductions(1)(2) |
| (146.5 | ) | (96.1 | ) | (24.4 | ) | (18.1 | ) | (7.9 | ) | |||||||||||||||||||||||||
Post Petition Interest paid(2) |
| (0.3 | ) | — | — | — | (0.3 | ) | ||||||||||||||||||||||||||||
|
|
|
|
|
|
|
|
|
| |||||||||||||||||||||||||||
Net Claim Liability at April 6, 2017 |
| $ | 181.6 | $ | 150.9 | $ | 5.4 | $ | 24.6 | $ | 0.7 | |||||||||||||||||||||||||
|
|
|
|
|
|
|
|
|
| |||||||||||||||||||||||||||
|
| |||||||||||||||||||||||||||||||||||
All values that are exactly zero are shown as “-”. Values between zero and $0.5 million appear as “0”. Totals may not foot due to rounding.
| (1) | Claim Distributions and other reductions include (i) distributions on allowed claims, (ii) reductions of the liabilities related to certain satisfied claims, (iii) the assignment of claims to their respective parents, and (iv) certain netting agreements between Debtors and Non-Controlled Affiliates. |
| (2) | Claims Distributions and other reductions and Post-Petition Interest paid include: |
| ($ in billions) | Total Debtors | LBHI | LCPI | LBSF | Other Debtors | |||||||||||||||
|
|
| ||||||||||||||||||
Claims Distributions and Post Petition Interest paid | $ | 116.6 | $ | 76.5 | $ | 19.2 | $ | 14.2 | $ | 6.8 | ||||||||||
Other Reductions | ||||||||||||||||||||
Intercompany Funding Adjustments | 7.8 | — | 4.1 | 2.9 | 0.8 | |||||||||||||||
Plan Adjustments | (0.6 | ) | (2.8 | ) | 1.0 | 0.9 | 0.3 | |||||||||||||
Assignment of Claims (a) | 10.2 | 10.1 | 0.1 | — | — | |||||||||||||||
Third Party Guarantees Satisfied(b) | 11.1 | 11.1 | — | — | — | |||||||||||||||
Freddie Mac Settlement | 1.1 | 1.1 | — | — | — | |||||||||||||||
Convenience Claims and other | 0.6 | 0.1 | 0.0 | 0.0 | 0.4 | |||||||||||||||
|
|
|
|
|
|
|
|
|
| |||||||||||
Total Claims Distributions and other reductions and Post Petition Interest paid | $ | 146.8 | $ | 96.1 | $ | 24.4 | $ | 18.1 | $ | 8.2 | ||||||||||
|
|
|
|
|
|
|
|
|
| |||||||||||
| (a) | Claims assigned by Non-Controlled Affiliates (primarily LB RE Financing No. 1 Limited of $4.6 billion, LBSN of $3.2 billion and LB UK Financing Limited of $2.1 billion), net of distributions, to LBHI in connection with settlement agreements with Non-Controlled Affiliates. |
| (b) | Allowed Guarantee claims (primarily Bankhaus $7.4 billion, LBCS $1.5 billion, LCPI $0.9 billion, LBF $0.4 billion, LOTC $0.2 billion and LBCC $0.2 billion), net of distributions, deemed satisfied as a result of distributions to creditors from the combination of the primary obligor and LBHI as the guarantor. |
Page 24
Quarterly Financial Report as of April 6, 2017 (Unaudited)
Note 11 – Liabilities Subject to Compromise(continued)
As of April 6, 2017, Liabilities Subject to Compromise were estimated at approximately $179.5 billion, net of distributions and other reductions.
Through April 6, 2017, the Debtors have allowed approximately $320.9 billion in claims, and have remaining approximately $46.3 billion of unresolved filed claims, which are estimated to be allowed at $7.6 billion (including $579 million of post-petition interest recorded at certain Debtors). The Estimated Unresolved Claims to be Allowed decreased $0.3 billion as compared to December 31, 2016.
Unliquidated Claims
There are two significant unliquidated claims against BNC (Claim No. 31036 and 33107) which, if liquidated and allowed, would have a material impact on the recoveries to BNC claimants and would result in creditors receiving significantly less than a 100% recovery on their claims.
Distributions Pursuant to Plan
Twelfth Plan Distribution
On April 6, 2017, the Debtors made their twelfth Plan Distribution to creditors. The Company distributed to creditors approximately $3.0 billion, of which approximately $2.5 billion was distributed on account of claims owned or formerly owned by third party creditors. The $2.5 billion includes approximately $218 million of distributions to LBHI on account of claims against LBHI, which were previously owned by third party creditors, but held by LBHI on the D12 record date.
Distributions through April 6, 2017
Through D12, the Debtors have made distributions to creditors totaling $116.6 billion, of which $86.1 billion were payments on account of claims owned or formerly owned by third party creditors.
Post-Petition Interest
In accordance with section 8.13(c) of the Plan, to the extent that any Debtor has Available Cash, as defined in section 1.5 of the Plan, after all Allowed Claims against that Debtor have been satisfied in full, each holder of each such Allowed Claim entitled to receive post-petition interest shall receive post-petition interest on the Allowed amount of such Claim.
As of April 6, 2017, LOTC has recorded an estimate of approximately $14 million for post-petition interest, net of distributions to (i) LBHI of approximately $155 million on claims that were purchased by LBHI from third party creditors for post-petition interest, (ii) certain Debtors and Non-Controlled Affiliates of approximately $25 million related to affiliate claims, and (iii) $13 million for Plan Adjustments. The $14 million excludes estimates for post-petition interest on affiliate claims and claims assigned to LBHI through the Lehman Brothers Finance S.A. (“LBF”) Settlement in March 2013 (refer to the December 31, 2013 Balance Sheets, Docket No. 43916, for additional information). Substantially all remaining cash at LOTC (after all Allowed Claims have been satisfied in full) will flow to LBHI in the form of payment on post-petition interest and/or an equity distribution.
LBCC has recorded an estimate of $270 million for post-petition interest for both third party and affiliate claims (after all Allowed Claims have been satisfied in full), net of the D12 distribution to (i) LBHI of approximately $27 million on claims that were purchased by LBHI from third party creditors for post-petition interest, (ii) certain Debtors and Non-Controlled Affiliates of approximately $8 million related to affiliate claims, and (iii) $5 million for Plan Adjustments. This amount is based on the Post-D12 Cash Flow Estimates.
Page 25
Quarterly Financial Report as of April 6, 2017 (Unaudited)
Note 12 – Legal Proceedings
The Company is involved in a number of judicial, regulatory and mediation proceedings concerning matters arising in connection with the bankruptcy proceedings and various other matters. The Company is unable at this time to determine the financial impact of such proceedings and the impact that any potential recoveries or liabilities may have upon the Balance Sheets. As more information becomes available, the Company may record revisions, which may be material, in future Balance Sheets.
Affirmative litigations:
| Counterparty | Debtor(s) | Commenced | Court | Court Reference | Most Recent Disclosure | |||||
| Bank of America National Association et al. (“SPV Avoidance Actions”) | LBSF | September 2010 | Bankruptcy Court | 10-03547 (SCC) | (a) | |||||
| Federal Home Loan Bank of New York | LBSF | May 2015 | Bankruptcy Court | 15-01110 (SCC) | (b) | |||||
| Citibank (“Citigroup litigation”) | LBHI | June 2014 | Bankruptcy Court | 12-010044 (SCC) | (c) | |||||
| Mortgage Sellers | LBHI | Various | Various | Various | October 6, 2016 Balance Sheets - Docket No. 54684 | |||||
| Credit Suisse Group AG | LBHI, LBSF LBCS, LBCC | November 2013 | Bankruptcy Court | 13-01676 (SCC) | September 30, 2013 Balance Sheets - Docket No. 42236 | |||||
| Ballyrock ABS CDO 2007-1 Limited Wells Fargo Bank N.A. (“Ballyrock litigation”) | LBSF | February 2009 | Bankruptcy Court | 09-01032 (SCC) | March 31, 2012 Balance Sheets - Docket No. 29731 | |||||
Other litigations:
| ||||||||||
| Counterparty | Debtor(s) | Commenced | Court | Court Reference | Most Recent Disclosure | |||||
| Lehman Brothers International (Europe) (in administration) (“LBIE Waterfall Applications”) | LBHI | Not applicable | Not applicable | Not applicable | (d) | |||||
| RMBS Trustee | LBHI SASCO | September 2009 | Bankruptcy Court | 08-13555 (SCC) | (e) | |||||
Page 26
Quarterly Financial Report as of April 6, 2017 (Unaudited)
Note 12 – Legal Proceedings(continued)
| (a) | SPV Avoidance Actions |
On January 24, 2017, the Bankruptcy Court ordered that its June 28, 2016 decision dismissing substantially all of LBSF’s claims be considered a Final Order for purposes of appeal. On February 6, 2017, LBSF filed its Notice of Appeal of the June 28, 2016 decision to the US District Court for the Southern District of New York, and on February 21, 2017, LBSF filed its designation of the appellate record and statement of issues on appeal. On February 27, 2017, the appeal was assigned to District Court Judge Lorna G. Schofield. On April 10, 2017, LBSF filed its Appellate Brief. Appellees filed their Opposing Brief on June 10 and LBSF’s Reply Brief is due on or before July 10, 2017.
Refer to the filed Balance Sheets as of March 31, 2016 for previous disclosure.
| (b) | Federal Home Loan Bank of New York |
On April 18, 2017, FHLB-NY and LBHI, in its capacity as Plan Administrator on behalf of LBSF, finalized a settlement agreement to resolve all the claims between the parties. As a result of the settlement agreement, FHLB-NY paid LBSF $70 million in April 2017.
Refer to the filed Balance Sheets as of June 30, 2015 for previous disclosure.
| (c) | Citigroup litigation |
On April 24, 2017, trial commenced between the Company and Citibank in the Bankruptcy Court, and is expected to continue over the following months.
Refer to the filed Balance Sheets as of October 6, 2016 for previous disclosure.
| (d) | LBIE Waterfall Applications |
On May 17, 2017, the UK Supreme Court released the Waterfall I decision, holding that currency claims do not exist, sub-debt is junior to statutory interest and non-provable claims, LBIE cannot prove for a contribution claim while in administration, and a contribution claim cannot include a shortfall for statutory interest.
Refer to the filed Balance Sheets as of December 31, 2016 for previous disclosure.
| (e) | RMBS Trustee |
On June 27, 2016 the Bankruptcy Court entered an order to expunge certain claims against LBHI and SASCO, for which claims were not submitted under the loan-by-loan claim resolution process prior to the deadline. The RMBS Trustees (as defined below) appealed the order on July 11, 2016. On February 22, 2017, the U.S. District Court for the Southern District of New York upheld the Bankruptcy Court order to expunge certain claims against LBHI and SASCO.
As to claims submitted under the loan-by-loan claim resolution protocol, the Company has proposed a modified process for the liquidation of those claims. Specifically, on March 17, 2017, the Company entered into an RMBS Trust Settlement Agreement (the “Proposed Settlement Agreement”) with a group of fourteen (14) institutional investors holding significant amounts of Lehman issued residential mortgage-backed securities (the “Institutional Investors”). The Proposed Settlement Agreement has been presented to the Trustees for the applicable residential mortgage-backed securitization trusts, U.S. Bank, Law Debenture, Wilmington Trust and Deutsche Bank (collectively, the “RMBS Trustees”). The RMBS Trustees accepted the Proposed Settlement Agreement on behalf of 229 trusts. On July 6, 2017, the Bankruptcy Court approved the Proposed Settlement Agreement. Under the Proposed Settlement Agreement, the Company will request the estimation and allowance of the claims related to the accepting covered RMBS trusts at $2.38 billion. In addition, if the Bankruptcy Court determines that the RMBS trusts are entitled to an allowed claim in an amount between $2.0 billion and $2.38 billion, the Company will agree to allow the claim in the amount of $2.38 billion. If the claim is allowed in an amount greater than $2.38 billion, the allowed claim will be set at such greater amount. If the claim is estimated in an amount greater than $2 billion, all parties have agreed to waive their right to appeal the Bankruptcy Court’s determination of the amount of the claim. If the amount of the claim is estimated below $2 billion, the RMBS Trustees have the right to appeal.
Refer to the filed Balance Sheets as of December 31, 2016 for previous disclosure.
Page 27
Quarterly Financial Report as of April 6, 2017 (Unaudited)
Note 13 – Currency Translation
The Company’s general ledger systems automatically translate assets and liabilities recorded in non-U.S. dollar functional currencies using exchange rates as of the date of the Balance Sheets. The gains or losses resulting from translating non-US dollar functional currency into U.S. dollars are reflected in Stockholders’ Equity.
Note 14 – Financial Systems and Control Environment
Procedures, controls and resources used to create the Balance Sheets were modified, including a significant reduction in resources, in comparison to what was available to the Company prior to the Chapter 11 cases. The Company is continuously reviewing its accounts, and as a result, modifications, errors and potential misstatements might be identified. Consequently, the Company may record adjustments, which may be material, in future Balance Sheets.
Page 28
Quarterly Financial Report as of April 6, 2017 (Unaudited)
III. Balance Sheets
LEHMAN BROTHERS HOLDINGS INC. and Other Debtors and Debtor-Controlled Entities
Balance Sheets As of April 6, 2017
(Unaudited)
| ($ in millions) | Lehman Brothers Holdings Inc. 08-13555 | Lehman Brothers Special Financing Inc. 08-13888 | Lehman Brothers Commodity Services Inc. 08-13885 | Lehman Brothers Commercial Corporation 08-13901 | Lehman Brothers OTC Derivatives Inc. 08-13893 | Lehman Brothers Financial Products Inc. 08-13902 | Lehman Brothers Derivative Products Inc. 08-13899 | Lehman Commercial Paper Inc. 08-13900 | Luxembourg Residential Properties Loan Finance S.a.r.l. 09-10108 | Other Debtors (2) | Total Debtor Entities (1) | Total Debtor- Controlled Entities (3) | Total Company | |||||||||||||||||||||||||||||||||||||||
| �� | ||||||||||||||||||||||||||||||||||||||||||||||||||||
Assets | ||||||||||||||||||||||||||||||||||||||||||||||||||||
Cash and short-term investments | $ | 34 | $ | 18 | $ | 0 | $ | 2 | $ | 2 | $ | 126 | $ | 148 | $ | 17 | $ | — | $ | 10 | $ | 357 | $ | 162 | $ | 519 | ||||||||||||||||||||||||||
Cash and short-term investments pledged or restricted | 3,278 | 833 | 103 | 60 | 1 | 0 | 0 | 7 | — | 16 | 4,298 | 26 | 4,324 | |||||||||||||||||||||||||||||||||||||||
Financial instruments and other inventory positions: | ||||||||||||||||||||||||||||||||||||||||||||||||||||
Commercial Real Estate | — | — | — | — | — | — | — | 91 | — | — | 91 | 43 | 133 | |||||||||||||||||||||||||||||||||||||||
Loans and Residential Real Estate | 51 | — | — | — | — | — | — | 11 | — | — | 62 | 13 | 75 | |||||||||||||||||||||||||||||||||||||||
Principal investments | 3 | — | — | — | — | — | — | 3 | — | — | 6 | 763 | 769 | |||||||||||||||||||||||||||||||||||||||
Derivative Receivables and Related Assets | — | 159 | — | — | 0 | — | — | — | — | — | 159 | 0 | 159 | |||||||||||||||||||||||||||||||||||||||
|
|
|
|
|
|
|
|
|
|
|
|
|
|
|
|
|
|
|
|
|
|
|
|
|
| |||||||||||||||||||||||||||
Total Financial instruments and other inventory positions | 54 | 159 | — | — | 0 | — | — | 105 | — | — | 317 | 819 | 1,136 | |||||||||||||||||||||||||||||||||||||||
Receivables from Debtors and Debtor-Controlled Entities and other assets | 559 | 362 | 0 | 237 | 501 | 115 | 20 | 251 | 0 | 4 | 2,049 | 290 | 2,339 | |||||||||||||||||||||||||||||||||||||||
Investments in Affiliates | (25,608 | ) | 224 | — | — | — | — | — | 117 | — | (402 | ) | (25,669 | ) | (21,630 | ) | (47,299 | ) | ||||||||||||||||||||||||||||||||||
Due from Affiliates: | ||||||||||||||||||||||||||||||||||||||||||||||||||||
Debtors and Debtor- Controlled Entities | 21,284 | 471 | 268 | 21 | — | 8 | — | 5,107 | — | 205 | 27,364 | 3,700 | 31,064 | |||||||||||||||||||||||||||||||||||||||
Non-Controlled Affiliates | 17,087 | 702 | 106 | 164 | — | — | — | 135 | — | — | 18,195 | 2,169 | 20,364 | |||||||||||||||||||||||||||||||||||||||
|
|
|
|
|
|
|
|
|
|
|
|
|
|
|
|
|
|
|
|
|
|
|
|
|
| |||||||||||||||||||||||||||
Total Due from Affiliates | 38,371 | 1,173 | 374 | 184 | — | 8 | — | 5,243 | — | 205 | 45,558 | 5,870 | 51,428 | |||||||||||||||||||||||||||||||||||||||
|
|
|
|
|
|
|
|
|
|
|
|
|
|
|
|
|
|
|
|
|
|
|
|
|
| |||||||||||||||||||||||||||
Total Assets | $ | 16,688 | $ | 2,768 | $ | 477 | $ | 484 | $ | 504 | $ | 249 | $ | 168 | $ | 5,739 | $ | 0 | $ | (167 | ) | $ | 26,911 | $ | (14,464 | ) | $ | 12,447 | ||||||||||||||||||||||||
|
|
|
|
|
|
|
|
|
|
|
|
|
|
|
|
|
|
|
|
|
|
|
|
|
| |||||||||||||||||||||||||||
Liabilities and Stockholders’ Equity Liabilities | ||||||||||||||||||||||||||||||||||||||||||||||||||||
Payables to Debtors and Debtor-Controlled Entities and other liabilities | $ | 1,538 | $ | 62 | $ | 1 | $ | 0 | $ | 0 | $ | 0 | $ | 0 | $ | 88 | $ | — | $ | 10 | $ | 1,699 | $ | 480 | $ | 2,179 | ||||||||||||||||||||||||||
Due to Affiliates: | ||||||||||||||||||||||||||||||||||||||||||||||||||||
Debtor-Controlled Entities | — | — | — | — | — | — | — | — | — | — | — | 11,670 | 11,670 | |||||||||||||||||||||||||||||||||||||||
Non-Controlled Affiliates | — | — | — | — | — | — | — | — | — | — | — | 31 | 31 | |||||||||||||||||||||||||||||||||||||||
|
|
|
|
|
|
|
|
|
|
|
|
|
|
|
|
|
|
|
|
|
|
|
|
|
| |||||||||||||||||||||||||||
Total Due to Affiliates | — | — | — | — | — | — | — | — | — | — | — | 11,701 | 11,701 | |||||||||||||||||||||||||||||||||||||||
Secured Claims Payable to Third Parties | 2,008 | — | — | — | — | — | — | — | — | — | 2,008 | — | 2,008 | |||||||||||||||||||||||||||||||||||||||
Taxes Payable | 127 | — | 1 | 0 | — | — | 0 | 10 | — | — | 138 | 2 | 140 | |||||||||||||||||||||||||||||||||||||||
Liabilities Subject to Compromise | 148,725 | 24,634 | 252 | 296 | 17 | 0 | 1 | 5,438 | — | 97 | 179,459 | 0 | 179,459 | |||||||||||||||||||||||||||||||||||||||
|
|
|
|
|
|
|
|
|
|
|
|
|
|
|
|
|
|
|
|
|
|
|
|
|
| |||||||||||||||||||||||||||
Total Liabilities | 152,398 | 24,696 | 253 | 297 | 17 | 0 | 1 | 5,536 | — | 107 | 183,304 | 12,182 | 195,486 | |||||||||||||||||||||||||||||||||||||||
Stockholders’ Equity | (135,709 | ) | (21,928 | ) | 224 | 187 | 486 | 249 | 167 | 203 | 0 | (274 | ) | (156,393 | ) | (26,646 | ) | (183,040 | ) | |||||||||||||||||||||||||||||||||
|
|
|
|
|
|
|
|
|
|
|
|
|
|
|
|
|
|
|
|
|
|
|
|
|
| |||||||||||||||||||||||||||
Total Liabilities and Stockholders’ Equity | $ | 16,688 | $ | 2,768 | $ | 477 | $ | 484 | $ | 504 | $ | 249 | $ | 168 | $ | 5,739 | $ | 0 | $ | (167 | ) | $ | 26,911 | $ | (14,464 | ) | $ | 12,447 | ||||||||||||||||||||||||
|
|
|
|
|
|
|
|
|
|
|
|
|
|
|
|
|
|
|
|
|
|
|
|
|
| |||||||||||||||||||||||||||
See accompanying Notes to Balance Sheets
Note: All values that are exactly zero are shown as “—”. Values between zero and $500,000 appear as “0”.
| (1) | Balances for Debtors do not reflect the impact of eliminations of intercompany balances and investments in subsidiaries. |
| (2) | Certain Other Debtor’s Balance Sheets are presented on page 30. |
| (3) | Certain Debtor-Controlled Entities’ Balance Sheets are presented on page 31. |
Page 29
Quarterly Financial Report as of April 6, 2017 (Unaudited)
LEHMAN BROTHERS HOLDINGS INC. and Other Debtors and Debtor-Controlled Entities
Balance Sheets As of April 6, 2017 (Certain Other Debtors)
(Unaudited)
| ($ in millions) | Structured Asset Securities Corporation 09-10558 | East Dover Ltd 08-13908 | Lehman Scottish Finance LP 08-13904 | LB Rose Ranch LLC 09-10560 | BNC Mortgage LLC 09-10137 | MERIT LLC 09-17331 | Other Debtors (1) | |||||||||||||||||||||
Assets | ||||||||||||||||||||||||||||
Cash and short-term investments | $ | 0 | $ | — | $ | 0 | $ | (0 | ) | $ | 10 | $ | — | $ | 10 | |||||||||||||
Cash and short-term investments pledged or restricted | 13 | — | — | 0 | 4 | — | 16 | |||||||||||||||||||||
Financial instruments and other inventory positions: | ||||||||||||||||||||||||||||
Commercial Real Estate | — | — | — | — | — | — | — | |||||||||||||||||||||
Loans and Residential Real Estate | — | — | — | — | — | — | — | |||||||||||||||||||||
Principal investments | — | — | — | — | — | — | — | |||||||||||||||||||||
Derivative Receivables and Related Assets | — | — | — | — | — | — | — | |||||||||||||||||||||
|
|
|
|
|
|
|
|
|
|
|
|
|
| |||||||||||||||
Total Financial instruments and other inventory positions | — | — | — | — | — | — | — | |||||||||||||||||||||
Receivables from Debtors and Debtor-Controlled Entities and other assets | 0 | 0 | 2 | 2 | — | — | 4 | |||||||||||||||||||||
Investments in Affiliates | — | — | (402 | ) | — | — | — | (402 | ) | |||||||||||||||||||
Due from Affiliates: | ||||||||||||||||||||||||||||
Debtors and Debtor- Controlled Entities | 132 | — | 74 | — | — | — | 205 | |||||||||||||||||||||
Non-Controlled Affiliates | — | — | — | — | — | — | 0 | |||||||||||||||||||||
|
|
|
|
|
|
|
|
|
|
|
|
|
| |||||||||||||||
Total Due from Affiliates | 132 | — | 74 | — | — | — | 205 | |||||||||||||||||||||
|
|
|
|
|
|
|
|
|
|
|
|
|
| |||||||||||||||
Total Assets | $ | 144 | $ | 0 | $ | (327 | ) | $ | 2 | $ | 13 | $ | — | $ | (167 | ) | ||||||||||||
|
|
|
|
|
|
|
|
|
|
|
|
|
| |||||||||||||||
Liabilities and Stockholders’ Equity Liabilities | ||||||||||||||||||||||||||||
Payables to Debtors and Debtor-Controlled Entities and other liabilities | $ | 4 | $ | 0 | $ | 2 | $ | 0 | $ | 4 | $ | — | $ | 10 | ||||||||||||||
Due to Affiliates: | ||||||||||||||||||||||||||||
Debtor-Controlled Entities | — | — | — | — | — | — | — | |||||||||||||||||||||
Non-Controlled Affiliates | — | — | — | — | — | — | — | |||||||||||||||||||||
|
|
|
|
|
|
|
|
|
|
|
|
|
| |||||||||||||||
Total Due to Affiliates | — | — | — | — | — | — | — | |||||||||||||||||||||
Secured Claims Payable to Third Parties | — | — | — | — | — | — | — | |||||||||||||||||||||
Taxes Payable | — | — | — | — | — | — | — | |||||||||||||||||||||
Liabilities Subject to Compromise | 93 | — | — | — | 4 | — | 97 | |||||||||||||||||||||
|
|
|
|
|
|
|
|
|
|
|
|
|
| |||||||||||||||
Total Liabilities | 97 | 0 | 2 | 0 | 8 | — | 107 | |||||||||||||||||||||
Stockholders’ Equity | 48 | 0 | (329 | ) | 2 | 5 | (0 | ) | (274 | ) | ||||||||||||||||||
|
|
|
|
|
|
|
|
|
|
|
|
|
| |||||||||||||||
Total Liabilities and Stockholders’ Equity | $ | 144 | $ | 0 | $ | (327 | ) | $ | 2 | $ | 13 | $ | (0 | ) | $ | (167 | ) | |||||||||||
|
|
|
|
|
|
|
|
|
|
|
|
|
| |||||||||||||||
See accompanying Notes to Balance Sheets | ||||||||||||||||||||||||||||
Note: All values that are exactly zero are shown as “—”. Values between zero and $500,000 appear as “0”.
(1) Balances for Debtors do not reflect the impact of eliminations of intercompany balances and investments in subsidiaries.
Page 30
Quarterly Financial Report as of April 6, 2017 (Unaudited)
LEHMAN BROTHERS HOLDINGS INC. and Other Debtors and Debtor-Controlled Entities
Balance Sheets As of April 6, 2017 (Debtor-Controlled Entities)
(Unaudited)
| ($ in millions) | Lehman ALI Inc. (2) | Property Asset Management Inc. (3) | LB I Group Inc. (3) | Lehman Brothers Bancorp Inc. (3) | PAMI Holdings LLC | 314 Common- wealth Ave Inc. (3) | LB U.K. Holdings (Delaware) Inc. | PAMI ALI LLC | Lux Finance Sarl | Other Debtor- Controlled Entities | Debtor - Controlled Group Elims (1) | Total Debtor- Controlled Entities | ||||||||||||||||||||||||||||||||||||
Assets | ||||||||||||||||||||||||||||||||||||||||||||||||
Cash and short-term investments | $ | 2 | $ | 1 | $ | 6 | $ | 72 | $ | 0 | $ | 0 | $ | 0 | $ | 2 | $ | 1 | $ | 78 | $ | — | $ | 162 | ||||||||||||||||||||||||
Cash and short-term investments pledged or restricted | (0 | ) | 3 | 4 | 2 | — | — | — | 0 | — | 17 | — | 26 | |||||||||||||||||||||||||||||||||||
Financial instruments and other inventory positions: | ||||||||||||||||||||||||||||||||||||||||||||||||
Commercial Real Estate | (1 | ) | 10 | 0 | — | 25 | (0 | ) | (0 | ) | 6 | — | 2 | — | 43 | |||||||||||||||||||||||||||||||||
Loans and Residential Real Estate | — | 0 | 0 | — | — | — | — | — | — | 13 | — | 13 | ||||||||||||||||||||||||||||||||||||
Principal investments | 0 | — | 587 | — | — | — | (0 | ) | 0 | — | 176 | — | 763 | |||||||||||||||||||||||||||||||||||
Derivative Receivables and Related Assets | — | — | — | — | — | — | — | — | — | 0 | — | 0 | ||||||||||||||||||||||||||||||||||||
|
|
|
|
|
|
|
|
|
|
|
|
|
|
|
|
|
|
|
|
|
|
|
| |||||||||||||||||||||||||
Total Financial instruments and other inventory positions | (1 | ) | 10 | 587 | — | 25 | (0 | ) | (0 | ) | 6 | — | 190 | — | 819 | |||||||||||||||||||||||||||||||||
Receivables from Debtors and Debtor-Controlled Entities and other assets | 2 | 0 | 25 | 69 | 0 | 1 | 349 | 0 | — | 207 | (363 | ) | 290 | |||||||||||||||||||||||||||||||||||
Investments in Affiliates | (27,013 | ) | 2 | 0 | 5 | — | 0 | 46 | (375 | ) | — | (219 | ) | 5,924 | (21,630 | ) | ||||||||||||||||||||||||||||||||
Due from Affiliates: | ||||||||||||||||||||||||||||||||||||||||||||||||
Debtors and Debtor- Controlled Entities | 2,466 | — | 533 | — | — | 85 | 477 | 619 | — | 492 | (971 | ) | 3,700 | |||||||||||||||||||||||||||||||||||
Non-Controlled Affiliates | 0 | — | 0 | — | — | 6 | 399 | 24 | 749 | 991 | — | 2,169 | ||||||||||||||||||||||||||||||||||||
|
|
|
|
|
|
|
|
|
|
|
|
|
|
|
|
|
|
|
|
|
|
|
| |||||||||||||||||||||||||
Total Due from Affiliates | 2,466 | — | 533 | — | — | 91 | 876 | 643 | 749 | 1,483 | (971 | ) | 5,870 | |||||||||||||||||||||||||||||||||||
|
|
|
|
|
|
|
|
|
|
|
|
|
|
|
|
|
|
|
|
|
|
|
| |||||||||||||||||||||||||
Total Assets | $ | (24,544 | ) | $ | 16 | $ | 1,154 | $ | 148 | $ | 26 | $ | 92 | $ | 1,271 | $ | 277 | $ | 750 | $ | 1,756 | $ | 4,591 | $ | (14,464 | ) | ||||||||||||||||||||||
|
|
|
|
|
|
|
|
|
|
|
|
|
|
|
|
|
|
|
|
|
|
|
| |||||||||||||||||||||||||
Liabilities and Stockholders’ Equity Liabilities | ||||||||||||||||||||||||||||||||||||||||||||||||
Payables to Debtors and Debtor-Controlled Entities and other liabilities | $ | 1 | $ | 2 | $ | 546 | $ | 61 | $ | 0 | $ | 0 | $ | 0 | $ | 47 | $ | 0 | $ | 185 | $ | (363 | ) | $ | 480 | |||||||||||||||||||||||
Due to Affiliates: | ||||||||||||||||||||||||||||||||||||||||||||||||
Debtor-Controlled Entities | 2,679 | — | 2,778 | 57 | — | 838 | 180 | 3,087 | 1,152 | 1,870 | (971 | ) | 11,670 | |||||||||||||||||||||||||||||||||||
Non-Controlled Affiliates | — | — | 1 | — | — | — | — | 0 | — | 29 | — | 31 | ||||||||||||||||||||||||||||||||||||
|
|
|
|
|
|
|
|
|
|
|
|
|
|
|
|
|
|
|
|
|
|
|
| |||||||||||||||||||||||||
Total Due to Affiliates | 2,679 | — | 2,780 | 57 | — | 838 | 180 | 3,087 | 1,152 | 1,899 | (971 | ) | 11,701 | |||||||||||||||||||||||||||||||||||
Secured Claims Payable to Third Parties | — | — | — | — | — | — | — | — | — | — | — | — | ||||||||||||||||||||||||||||||||||||
Taxes Payable | — | — | 2 | — | — | — | — | — | — | — | — | 2 | ||||||||||||||||||||||||||||||||||||
Liabilities Subject to Compromise | — | — | — | — | — | — | — | — | — | 0 | — | 0 | ||||||||||||||||||||||||||||||||||||
|
|
|
|
|
|
|
|
|
|
|
|
|
|
|
|
|
|
|
|
|
|
|
| |||||||||||||||||||||||||
Total Liabilities | 2,681 | 2 | 3,327 | 118 | 0 | 838 | 181 | 3,134 | 1,152 | 2,084 | (1,334 | ) | 12,182 | |||||||||||||||||||||||||||||||||||
Stockholders’ Equity | (27,225 | ) | 14 | (2,173 | ) | 30 | 26 | (746 | ) | 1,090 | (2,857 | ) | (402 | ) | (329 | ) | 5,925 | (26,646 | ) | |||||||||||||||||||||||||||||
|
|
|
|
|
|
|
|
|
|
|
|
|
|
|
|
|
|
|
|
|
|
|
| |||||||||||||||||||||||||
Total Liabilities and Stockholders’ Equity | $ | (24,544 | ) | $ | 16 | $ | 1,154 | $ | 148 | $ | 26 | $ | 92 | $ | 1,271 | $ | 277 | $ | 750 | $ | 1,756 | $ | 4,591 | $ | (14,464 | ) | ||||||||||||||||||||||
|
|
|
|
|
|
|
|
|
|
|
|
|
|
|
|
|
|
|
|
|
|
|
| |||||||||||||||||||||||||
See accompanying Notes to Balance Sheets
| Note: | All values that are exactly zero are shown as “—”. Values between zero and $500,000 appear as “0”. |
| (1) | Balances reflect the impact of eliminations of (i) intercompany balances only between Debtor-Controlled Entities and (ii) investments in subsidiaries only between Debtor-Controlled Entities. |
| (2) | Lehman Ali Inc. is reflected on a consolidated basis: |
- excluding (i) separately reported wholly-owned subsidiaries that are Debtor entities (e.g. LCPI, LBSF and East Dover Ltd) and (ii) separately reported Debtor-Controlled Entities and their
- including wholly owned subsidiaries of LCPI (e.g. LCPI Properties Inc.).
| (3) | Entities are reflected on a consolidated basis, e.g. Property Asset Management Inc. includes its wholly owned subsidiary, Orbit RE LLC. |
Page 31
Quarterly Financial Report as of April 6, 2017 (Unaudited)
IV. Post-Twelfth Distribution Cash Flow Estimates
Table of Contents
A. | Basis of Presentation | 33 | ||||
B. | Highlights | 36 | ||||
C. | Summary | 37 | ||||
D. | Recoveries from Non-Controlled Affiliates | 38 | ||||
E. | Operating Expenses | 40 | ||||
F. | Debtors and Debtor-Controlled Entities Schedules | 42 | ||||
Page 32
Quarterly Financial Report as of April 6, 2017 (Unaudited)
A. Basis of Presentation
The information and data included in these cash flow estimates and notes thereto (the “Post-D12 Cash Flow Estimates”) were prepared to update the Post-Eleventh Distribution Cash Flow Estimates filed February 1, 2017 (the “Post-D11 CFE”), and are based on estimated cash flows from assets managed in an orderly wind down and/or sale (and related costs of operations) over the period from April 7, 2017 through December 31, 2019 (the “Estimate Period” or “Post-D12”).
As the Company cannot definitively specify a date for the final termination of its activities, these Post-D12 Cash Flow Estimates include an estimate for expenses for potential residual activities (remaining asset dispositions, disputed claims resolutions, outstanding litigations, and administrative wind-down) that may extend beyond 2019.
All cash flows in the Estimate Period are presented on an undiscounted basis.
Key Assumptions
Recoveries from Non-Controlled Affiliates
Estimates of recoveries from Non-Controlled Affiliates are based on internal valuation models utilizing information obtained from both Non-Controlled Affiliates’ fiduciaries, as well as information obtained by the Company through settlement negotiations, involvement on creditors’ committees and ongoing cooperative exchanges.
Certain receivables from Non-Controlled Affiliates are held in foreign currencies, and as such, estimated recoveries related to these receivables are subject to movements in foreign exchange rates.
The majority of estimated remaining recoveries from Non-Controlled Affiliates are contingent upon (i) the resolution of matters in dispute and/or active litigation, (ii) the receipt of non-U.S. government and/or Court approvals, and/or (iii) the final wind down of estates not controlled by the Plan Administrator. As such, the timing and amount of future recoveries from Non-Controlled Affiliates is uncertain.
For further discussion of assumptions related to estimates of Recoveries from Non-Controlled Affiliates, refer to Section D herein.
Litigation
For litigation actions which may result in a potential recovery to the Company (“Affirmative Litigations”), the largest of which are listed and described in Note 12 in the Notes to the Balance Sheets, the Post-D12 Cash Flow Estimatesexcludeestimated recoveries unless one of the following conditions is met:
| (i) | The Company has reached agreements in principle with the corresponding counterparties, in which case the Post-D12 Cash Flow Estimates reflect estimated recoveries at the agreed amounts, or |
| (ii) | The Company has locked in value by purchasing notes of various special purpose vehicles, in which case the Post-D12 Cash Flow Estimates reflect estimated recoveries from the value locked in. |
The Company expects that the actual amounts of future recoveries related to Affirmative Litigations will be material; however, final litigation outcomes are contingent on a number of factors outside of the Company’s direct control and are thus uncertain.
Page 33
Quarterly Financial Report as of April 6, 2017 (Unaudited)
Key Assumptions(continued)
Litigation (continued)
Although potential litigation receipts are excluded herein, the Post-D12 Cash Flow Estimatesdo include the estimated costs (i.e.professional legal and advisory fees) of supporting such litigations. As the Company continues to monetize its remaining financial inventory and wind down its operations, the estimated costs of supporting the Company’s ongoing litigation activities has become an increasingly larger portion of the Company’s total estimated expenses.
Timing of Estimates
Estimates of recoveries from Non-Controlled Affiliates and the final resolution of litigation matters are subject to substantial timing uncertainties.
As estimated recoveries and expenses related to the above constitute the majority of the Post-D12 Cash Flow Estimates, the estimates herein do not reflect the Company’s views with respect to timing.
Intercompany Recoveries Among Controlled Entities
The Post-D12 Cash Flow Estimates include estimated intercompany recoveries between and among Debtors and Debtor-Controlled Entities, including:
| (i) | receipts on pre-petition intercompany claims, |
| (ii) | equity distributions, and |
| (iii) | receipts and payments related to post-petition activity. |
The Post-D12 Cash Flow Estimates reflect the following assumptions in the calculation of intercompany recoveries between and among Debtors and Debtor-Controlled Entities:
| • | Allowed Claims as of April 6, 2017, and estimated unresolved third party claims to be allowed; |
| • | An estimate of the allocation of taxes between and among Controlled Entities in accordance with the Debtor Allocation Agreement (Refer toNote 10 – Taxes Payable in the Notes to the Balance Sheets); |
| • | Estimates for post-petition interest (refer to Note 11 in the Notes to the Balance Sheets), and equity distributions from Debtors and Debtor-Controlled Entities. |
Foreign Exchange Rates
A significant portion of the Company’s remaining estimated recoveries are denominated in currencies other than the U.S. Dollar. The estimates herein reflect estimated recoveries on non-U.S. Dollar denominated assets using foreign exchange rates as of April 6, 2017.
Page 34
Quarterly Financial Report as of April 6, 2017 (Unaudited)
Presentation Differences
Post-D11 CFE
The Post-D12 Cash Flow Estimates differ from the Post-D11 CFE generally as follows:
| (i) | as a result of changes to estimates, or |
| (ii) | as a matter of presentation whereby certain estimates are classified differently from the Post-D11 CFE, but there is no resulting economic effect on the overall recoveries to the applicable legal entity. |
As part of the Company’s planned operational wind-down and legal entity dissolution process, the Company has assigned and will continue to assign claims among Controlled Entities, typically from a subsidiary entity to a parent entity, with no resulting economic effect on overall recoveries. These assignments are reflected in the “Transfers, Reclassifications, Adjustments” column in the tables herein. For claim assignments in which Debtor entities are assigned claims against themselves (i.e., when LBHI is assigned a claim against LBHI), the receivables and payables are netted in the Balance Sheets and similarly offset herein.
Operating Report—Schedule of Cash Receipts and Disbursements
Amounts presented in the Post-D12 Cash Flow Estimates, including actual results in the Prior Period, may differ from the presentation of cash flows in the Company’s Post-Effective Operating Report – Schedule of Cash Receipts and Disbursements (“Cash Operating Report”), primarily as a matter of presentation, whereby certain amounts are classified differently from the presentation herein.
For example, LBHI collects cash on behalf of other Debtors and Debtor-Controlled Entities which do not maintain separate bank accounts. In such cases, the Cash Operating Reports reflect these cash collections at LBHI, whereas the Post-D12 Cash Flow Estimates reflect these cash collections at the entity on whose books the related assets are reported in the Balance Sheets.
Expenses related to incentive fees for the Board are recognized in accordance with the schedule of payments provided in the LBHI Director Incentive Compensation Plan (see Docket No. 44924 for further details).
Disclosure Statement
The presentation of the Post-D12 Cash Flow Estimates differs from the presentation of the “Cash Flow Estimates Through 2014” as reported in Exhibit 7 to the Disclosure Statement of the Plan (“DS Exhibit 7”). Refer to the 2012+ Cash Flow Estimates filed July 25, 2012 (the “2012+ CFE”) for further discussion of these presentation differences.
Page 35
Quarterly Financial Report as of April 6, 2017 (Unaudited)
B. Highlights
Estimated Recoveries
Total estimates of aggregate gross recoveries, before operating disbursements and payments in satisfaction of secured, priority, administrative and unsecured claims of Debtors and liabilities of Debtor-Controlled Entities, increased by $1.1 billion to $99.9 billion in the Post-D12 Cash Flow Estimates as compared to $98.8 billion in the Post-D11 CFE. Net of operating disbursements, total estimated net recoveries increased by $1.1 billion to $96.2 billion. This increase in the Company’s estimated recoveries was primarily driven by (i) the February 2017 receipt of $797.5 million related to the settlement agreement with JP Morgan Chase Bank N.A. (“JPM Settlement Agreement”), which had been excluded from prior estimates as a potential litigation recovery (refer to the Quarterly Financial Report as of December 31, 2016, Docket No. 55127, for additional information) , and (ii) an increase in the estimates for the Derivatives and Private Equity/Principal Investments portfolios.
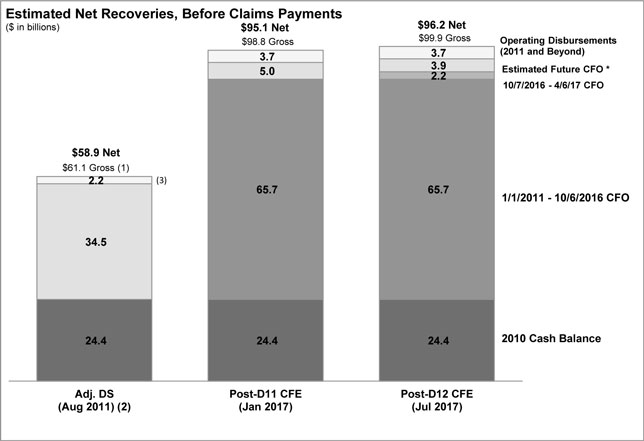
| (*) | CFO refers to Cash From Operations |
| (1) | Refer to the “Responses to Questions Received From Creditors” posted towww.lehman-docket.com on October 30, 2014, for a reconciliation of these figures. |
| (2) | Estimates included in DS Exhibit 7, adjusted for certain Presentation Adjustments (refer to the 2012+ CFE for further information). |
| (3) | The Operating Expense estimates in DS Exhibit 7 reflected the estimated costs for expected personnel and infrastructure requirements to support the workforce for each year from 2011 to 2014. These Operating Expense estimates did not include estimates for costs beyond 2014. |
Page 36
Quarterly Financial Report as of April 6, 2017 (Unaudited)
C. Summary
The Company estimates that Total Post-D12 CFE Cash From Operations will be $3.9 billion, an increase in estimates of $1.1 billion compared to estimates presented in the Post-D11 CFE. This increase is primarily driven by (i) a receipt of $797.5 million in Other related to the JPM Settlement Agreement (these litigation recoveries were excluded (see Key Assumptions) from prior estimates), (ii) a $118 million increase in estimated recoveries in the Derivatives portfolio primarily related to the FHLB-NY settlement of $70 million that was finalized in April 2017 (these recoveries were excluded from prior estimates), and (iii) a $108 million increase in estimated recoveries in the Private Equity/Principal Investments portfolio primarily related to the First Data Corporation and Formula One investments.
These increases were partially offset by a (i) $58 million increase in Operating Expenses, largely driven by increased estimates for Compensation & Benefits, formula-driven Incentive Fees and Professional Fees, and (ii) $26 million reduction in estimated Recoveries from Non-Controlled Affiliates.
Cash activities between October 7, 2016 and April 6, 2017 included (i) the monetization of inventory of $1.5 billion, primarily in the Private Equity/Principal Investments and Derivatives portfolios, (ii) the receipt of $797.5 million from the JPM Settlement Agreement in Other, (iii) the collection of $0.8 billion of recoveries from Non-Controlled Affiliates, primarily driven by recoveries from Bankhaus, Lehman Brothers Asia Pacific (Singapore) PTE, and Lehman Brothers Securities Asia Limited, and (iv) operating expenses of $122 million, including professional fees related to the Company’s claims mitigation and litigation activities.
Of the $1.5 billion of remaining Estimated Net Receipts shown in the Post-D12 CFE, the Company anticipates that approximately 55% will be collected by the end of 2017.
| ($ in millions) | Post-D11 Cash Flow Estimates | Less: Cash Activity 10/7/16-4/6/17 | Recovery Value Change | Transfers, Reclassifications, Adjustments (a) | Post-D12 Cash Flow Estimates (b) | |||||||||||||||
| Net Receipts | ||||||||||||||||||||
Commercial Real Estate | $ | 213 | $ | (78 | ) | $ | (2 | ) | $ | — | $ | 133 | ||||||||
Loans (Corporate & Residential) | 121 | (82 | ) | 36 | — | 75 | ||||||||||||||
Private Equity / Principal Investments | 965 | (303 | ) | 108 | — | 769 | ||||||||||||||
Derivatives | 133 | (93 | ) | 118 | — | 159 | ||||||||||||||
Other | 312 | (938 | ) | 915 | 55 | 344 | ||||||||||||||
|
|
|
|
|
|
|
|
|
| |||||||||||
Sub-Total - Net Receipts | $ | 1,744 | $ | (1,494 | ) | $ | 1,174 | $ | 55 | $ | 1,479 | |||||||||
Recoveries From Non-Controlled Affiliates | ||||||||||||||||||||
Europe | $ | 2,796 | $ | (423 | ) | $ | 16 | $ | (81 | ) | $ | 2,308 | ||||||||
Asia | 1,058 | (384 | ) | (42 | ) | (8 | ) | 623 | ||||||||||||
|
|
|
|
|
|
|
|
|
| |||||||||||
Sub-Total - Recoveries From Non-Controlled Affiliates | $ | 3,853 | $ | (807 | ) | $ | (26 | ) | $ | (89 | ) | $ | 2,932 | |||||||
Operating Expenses | ||||||||||||||||||||
Professional Fees | $ | (204 | ) | $ | 48 | $ | (16 | ) | $ | — | $ | (172 | ) | |||||||
Compensation & Benefits | (153 | ) | 53 | (27 | ) | — | (127 | ) | ||||||||||||
Incentive Fees | (191 | ) | 7 | (17 | ) | — | (200 | ) | ||||||||||||
Other Administrative Expenses | (62 | ) | 14 | 1 | — | (46 | ) | |||||||||||||
|
|
|
|
|
|
|
|
|
| |||||||||||
Sub-Total - Operating Expenses | $ | (610 | ) | $ | 122 | $ | (58 | ) | $ | — | $ | (546 | ) | |||||||
Total Cash From Operations (CFO) | $ | 4,987 | $ | (2,179 | ) | $ | 1,091 | $ | (34 | ) | $ | 3,865 | ||||||||
|
|
|
|
|
|
|
|
|
| |||||||||||
|
|
|
| |||||||||||||||||
| (a) | Transfers, Reclassifications and Adjustments primarily include: |
| • | a transfer of $55 million from “Recoveries From Non-Controlled Affiliates” in Europe to “Net Receipts – Other” primarily related to claims against Non-Controlled Affiliates that were assigned by Bankhaus to LBHI as payment-in-kind, and |
| • | a transfer of $26 million from “Recoveries From Non-Controlled Affiliates” in Europe to “Pre-Petition Intercompany Receipts from Controlled Entities” related to claims against LBHI that were assigned by Lehman Brothers Luxembourg Investments S.a.r.l., a Non-Controlled Affiliate, to a Debtor-Controlled Entity. |
| (b) | Recoveries from Non-Controlled Affiliates in Europe include recoveries on claims against LBIE that were collateralized by LBHI as a result of a loan of £82.6 million from LBHI2 to LBHI, the proceeds of which were received in September 2016. LBHI has recorded a liability related to this loan in Payables to Debtors and Debtor-Controlled Entities and Other Liabilities (seeNote 9 in the Notes to the Balance Sheets). |
Page 37
Quarterly Financial Report as of April 6, 2017 (Unaudited)
D. Recoveries from Non-Controlled Affiliates
The Company estimates that Post-D12 CFE Recoveries from Non-Controlled Affiliates will be $2.9 billion, which reflects a decrease in estimates of $26 million compared to Total Recoveries from Non-Controlled Affiliates presented in the Post-D11 CFE.
Basis of Presentation
Recoveries from Non-Controlled Affiliates represent estimated recoveries on intercompany claims against affiliates of the Company that were not managed or controlled by a Debtor as of the Effective Date, including all affiliates that are subject to separate proceedings in Europe and Asia. (Further information on these intercompany claims against Non-Controlled Affiliates can be found inNote 8 – Due from/to Affiliates in the Notes to the Balance Sheets)
Estimates of recoveries from Non-Controlled Affiliates are based on information obtained from both Non-Controlled Affiliates’ fiduciaries, as well as information obtained by the Company through settlement negotiations, involvement on creditors’ committees and ongoing cooperative exchanges. Actual recoveries from Non-Controlled Affiliates may vary materially from estimates included herein.
In some cases, the Company’s payments of obligations to Non-Controlled Affiliates are part of the resources used by such Non-Controlled Affiliates to pay their own obligations, including obligations payable to the Company. An example of a Non-Controlled Affiliate with both substantial claims into the Company and payables to the Company is LBT.
For cases in which the Company has offsetting or partially offsetting payables to and receivables from certain Non-Controlled Affiliates, the Company has pursued and will continue to pursue offsetting arrangements with such Non-Controlled Affiliates to accelerate the distribution of cash to third party creditors. For consistency and comparability of reporting, the Post-D12 CFE reflects the full estimated recoveries from such Non-Controlled Affiliates prior to any offsetting arrangements.
Certain Non-Controlled Affiliates are in various stages of their respective wind-down processes, including final distributions and entity dissolutions.
The majority of estimated remaining recoveries from Non-Controlled Affiliates are contingent upon (i) the resolution of matters in dispute and/or active litigation, (ii) the receipt of non-U.S. government and/or Court approvals, and/or (iii) the final wind down of estates not controlled by the Plan Administrator. As such, the timing and amount of receipts of future estimated recoveries from Non-Controlled Affiliates is uncertain.
| ($ in millions) | Post-D11 Cash Flow Estimates | Less: Prior Period Activity | Estimate Changes | Transfers, Reclassifications, Adjustments | Post-D12 Cash Flow Estimates (a) | |||||||||||||||
Recoveries from Non-Controlled Affiliates | ||||||||||||||||||||
Europe | $ | 2,796 | $ | (423 | ) | $ | 16 | $ | (81 | ) | $ | 2,308 | ||||||||
Asia | 1,058 | (384 | ) | (42 | ) | (8 | ) | 623 | ||||||||||||
|
|
|
|
|
|
|
|
|
| |||||||||||
Total - Recoveries from Non-Controlled Affiliates | $ | 3,853 | $ | (807 | ) | $ | (26 | ) | $ | (89 | ) | $ | 2,932 | |||||||
| (a) | Recoveries from Non-Controlled Affiliates in Europe include recoveries on claims against LBIE that were collateralized by LBHI as a result of a loan of £82.6 million from LBHI2 to LBHI, the proceeds of which were received in September 2016. LBHI has recorded a liability related to this loan in Payables to Debtors and Debtor-Controlled Entities and Other Liabilities (seeNote 9 in the Notes to the Balance Sheets. |
Page 38
Quarterly Financial Report as of April 6, 2017 (Unaudited)
Recoveries from Non-Controlled Affiliates(continued)
For a breakdown of Non-Controlled Affiliates included within the Europe and Asia categories, including net receivables balances, refer to Note 8 in the Notes to the Balance Sheets.
For information on cash collections for the period between D11 and D12, refer to Note 8 in the Notes to the Balance Sheets and Cash Operating Reports.
LBHI2
The Company’s estimates of recoveries from LBHI2 reflect the inclusion of the Company’s interest in GBP 650 million related to the Joint Venture among LBHI2 and the Funds to facilitate the resolution of LBIE claims (refer to Note 8 in the Notes to the Balance Sheets for additional information).
The Company’s estimates of recoveries from LBHI2 do not reflect contingent receivables in excess of the Joint Venture’s initial capitalization, nor do the estimates reflect potential contingent claims by LBIE against LBHI2. The Company’s ultimate recoveries from the Joint Venture are conditioned upon the resolution of a number of complex legal disputes surrounding distributions from LBIE, including (i) the interpretation of LBIE’s pre-administration contracts, and (ii) various other legal issues. The final outcomes are contingent on a number of factors outside of the Company’s direct control and are thus uncertain.
Page 39
Quarterly Financial Report as of April 6, 2017 (Unaudited)
E. Operating Expenses
The Company estimates that Post-D12 CFE Operating Expenses will be $0.5 billion, which reflects an increase in estimates of $58 million compared to Total Operating Expenses presented in the Post-D11 CFE.
| ($ in millions) | Post-D11 Cash Flow Estimates | Less: Prior Period Activity | Estimate Changes | Reclasses / Transfers | Post-D12 Cash Flow Estimates | |||||||||||||||
Operating Expenses | ||||||||||||||||||||
Professional Fees | $ | (204 | ) | $ | 48 | $ | (16 | ) | $ | — | $ | (172 | ) | |||||||
Compensation and Benefits | (153 | ) | 53 | (27 | ) | — | (127 | ) | ||||||||||||
Incentive Fees | (191 | ) | 7 | (17 | ) | — | (200 | ) | ||||||||||||
Other Administrative Expenses | (62 | ) | 14 | 1 | — | (46 | ) | |||||||||||||
|
|
|
|
|
|
|
|
|
| |||||||||||
Total - Operating Expenses
| $
| (610
| )
| $
| 122
|
| $
| (58
| )
| $
| —
|
| $
| (546
| )
| |||||
Professional Fees
Professional Fees include fees paid to third party professional services firms, including legal counsel and other consulting and advisory fees supporting litigation activities, claims mitigation activities, bankruptcy and Plan-related activities, audit and financial-related services, and other administrative activities.
Professional Fees increased by $16 million, primarily driven by an anticipated increase in professional resources required for the Company’s claims mitigation and litigation activities, the potential recoveries from which are excluded herein.
Compensation and Benefits
Compensation and Benefits include compensation, incentives, benefits, severance, and payroll taxes for employees of the Company as well as fees and expenses paid to Alvarez & Marsal North America, LLC (“A&M”) for certain staff resources. Annual bonus and severance payments are typically paid in the beginning of the following calendar year, thus a significant portion of compensation and benefits expenses generally lags one year for cash reporting.
Estimated remaining Compensation & Benefits increased $27 million, driven by an anticipated increase in the duration of specialized staff required to manage and execute ongoing and pending litigation activities, the timelines and final resolutions of which are uncertain.
Incentive Fees
Incentive Fees include estimated formula-based incentive fees for the LBHI Board of Directors and third party professional services firms, including A&M and Houlihan Lokey Howard & Zukin Capital, Inc.
Estimated Incentive Fees increased by $17 million due to formula-based increases in the calculation of incentive fees related to estimates for claims resolutions and increases in estimated total net recoveries.
Other Administrative Expenses
Other Administrative Expenses include asset management and infrastructure-related expenses, including but not limited to information technology, communications, outsourced asset management service providers, market data and analytics, and administrative expenses, such as insurance premiums, occupancy costs, taxes and filing fees, and employee expense reimbursements.
Page 40
Quarterly Financial Report as of April 6, 2017 (Unaudited)
Operating Expenses(continued)
Wind Down Expenses
The estimates herein assume that costs will continue to be incurred to monetize remaining financial assets, resolve outstanding litigations and disputed claims, and to execute the wind-down of operations. As the inventory of remaining assets is reduced, the Company expects that it will continue to focus on the management and resolution of claims, pursuit of outstanding litigations, and administrative wind-down activities. This continued focus is reflected in these Post-D12 Cash Flow Estimates for Compensation & Benefits and Professional Fees for litigation, claims resolution, and wind-down activities.
The estimates herein reflect the assumption that although the preponderance of final asset dispositions, resolution of remaining disputed claims, pursuit of outstanding litigations, remaining collections from Non-Controlled Affiliates, corporate entity dissolutions, and financial and tax reporting requirements will be completed by the end of 2019, these Post-D12 Cash Flow Estimates include an estimate for residual activities that may extend beyond 2019.
Page 41
Quarterly Financial Report as of April 6, 2017 (Unaudited)
F. Debtors and Debtor-Controlled Entities Schedules
LBHI
The Company estimates that Total Post-D12 CFE Cash From Operations, including Intercompany Receipts, at LBHI will be $4.1 billion, which reflects an increase in estimates of $1.0 billion compared to estimates presented in the Post-D11 CFE.
| ($ in millions) | Post-D11 Cash Flow Estimates | Less: Cash Activity 10/7/16-4/6/17 | Recovery Value Change | Transfers, Reclassifications, Adjustments(a) | Post-D12 Cash Flow Estimates | |||||||||||||||
Net Receipts | ||||||||||||||||||||
Commercial Real Estate | $ | 34 | $ | (34 | ) | $ | 1 | $ | — | $ | 0 | |||||||||
Loans (Corporate & Residential) | 56 | (11 | ) | 6 | — | 51 | ||||||||||||||
Private Equity / Principal Investments | 0 | (0 | ) | 2 | — | 3 | ||||||||||||||
Derivatives | — | — | — | — | — | |||||||||||||||
Other | 238 | (913 | ) | 898 | 55 | 278 | ||||||||||||||
|
|
|
|
|
|
|
|
|
| |||||||||||
Sub-Total - Net Receipts | $ | 328 | $ | (958 | ) | $ | 907 | $ | 55 | $ | 332 | |||||||||
Recoveries From Non-Controlled Affiliates | ||||||||||||||||||||
Europe | $ | 1,498 | $ | (394 | ) | $ | (3 | ) | $ | (44 | ) | $ | 1,057 | |||||||
Asia | 970 | (383 | ) | (41 | ) | (8 | ) | 539 | ||||||||||||
|
|
|
|
|
|
|
|
|
| |||||||||||
Sub-Total - Recoveries FromNon-Controlled Affiliates | $ | 2,469 | $ | (778 | ) | $ | (43 | ) | $ | (51 | ) | $ | 1,597 | |||||||
Operating Expenses | ||||||||||||||||||||
Professional Fees | $ | (139 | ) | $ | 30 | $ | (7 | ) | $ | — | $ | (116 | ) | |||||||
Compensation & Benefits | (93 | ) | 34 | (34 | ) | — | (93 | ) | ||||||||||||
Incentive Fees | (125 | ) | 5 | (12 | ) | — | (133 | ) | ||||||||||||
Other Administrative Expenses | (38 | ) | 8 | (3 | ) | — | (33 | ) | ||||||||||||
|
|
|
|
|
|
|
|
|
| |||||||||||
Sub-Total - Operating Expenses | $ | (395 | ) | $ | 77 | $ | (57 | ) | $ | — | $ | (375 | ) | |||||||
Total Cash From Operations (CFO) | $ | 2,402 | $ | (1,659 | ) | $ | 807 | $ | 4 | $ | 1,554 | |||||||||
|
|
|
|
|
|
|
|
|
| |||||||||||
Pre-Petition Intercompany Receipts from Controlled Entities | 2,948 | (392 | ) | 99 | (161 | ) | 2,493 | |||||||||||||
Net Post-Petition Intercompany Receipts from / (Payables to) Controlled Entities | (1,333 | ) | 67 | 16 | — | (1,250 | ) | |||||||||||||
Investments in Affiliates | 1,258 | (49 | ) | 60 | — | 1,269 | ||||||||||||||
Total CFO + Intercompany Receipts | $ | 5,275 | $ | (2,032 | ) | $ | 982 | $ | (158 | ) | $ | 4,067 | ||||||||
|
|
|
|
|
|
|
|
|
| |||||||||||
| (a) | Transfers, Reclassifications and Adjustments primarily include: |
| • | a transfer of $55 million from “Recoveries From Non-Controlled Affiliates” in Europe to “Net Receipts – Other” primarily related to claims against Non-Controlled Affiliates that were assigned by Bankhaus to LBHI as payment-in-kind, and |
| • | a transfer of approximately $161 million in “Pre-Petition Intercompany Receipts from Controlled Entities” related to claims against LBHI that were assigned from LB RE Financing No.2 Limited to LB RE Financing No.1 Limited, and subsequently assigned to LBHI (refer to Note 8 – Due from/to Affiliates of the December 31, 2016 for additional information). |
Page 42
Quarterly Financial Report as of April 6, 2017 (Unaudited)
LBHI(continued)
Recoveries from Non-Controlled Affiliates
The Company estimates that LBHI will collect approximately $1.6 billion from Non-Controlled Affiliates, of which the Company estimates that approximately 45% will be collected from LBF, LBJ, and Thayer Properties Limited.
Pre-Petition Intercompany Receipts from Controlled Entities
Pre-Petition intercompany receipts include recoveries from distributions on Allowed Claims against Debtors (per the Plan), pre-petition intercompany receivables from Debtor-Controlled Entities, and Post-Petition Interest on allowed claims against LBCC. The Company estimates that LBHI will receive approximately $2.5 billion, including (i) $0.7 billion and $0.4 billion from LCPI and LBSF, respectively, and (ii) $1.3 billion from Debtor-Controlled Entities, primarily Luxembourg Finance Sarl, Lehman Brothers UK Holding (Delaware) Inc., and LB I Group, which collectively represent approximately 85% of the aggregate receipts from Debtor-Controlled Entities.
Net Post-Petition Intercompany Receipts from / (Payables to) Controlled Entities
Net Post-Petition intercompany include the net settlement of Post-Petition intercompany receivables and payables between and among Debtors and Debtor-Controlled Entities, as described in the April 6, 2017 Balance Sheets and adjusted for (i) net receipts related to the allocation of estimated taxes payable in accordance with the Debtor Allocation Agreement, and (ii) various other items.
Investments in Affiliates
Investments in Affiliates include recoveries from wholly-owned subsidiaries in cases in which the subsidiary’s net recoverable assets exceed or are expected to exceed its liabilities. The Company estimates that LBHI will receive approximately $1.3 billion, primarily from (i) LOTC of $0.5 billion, (ii) Lehman Brothers UK Holdings (Delaware) Inc. of $0.5 billion, and (iii) LBHK Funding (Cayman) No.1 Limited of $0.1 billion.
Page 43
Quarterly Financial Report as of April 6, 2017 (Unaudited)
LCPI
The Company estimates that Total Post-D12 CFE Cash From Operations, including Intercompany Receipts, at LCPI will be $0.9 billion, which reflects an increase in estimates of $81 million compared to estimates presented in the Post-D11 CFE.
| ($ in millions) | Post-D11 Cash Flow Estimates | Less: Cash Activity 10/7/16-4/6/17 | Recovery Value Change | Transfers, Reclassifications, Adjustments | Post-D12 Cash Flow Estimates | |||||||||||||||
Net Receipts | ||||||||||||||||||||
Commercial Real Estate | $ | 107 | $ | (24 | ) | $ | 8 | $ | — | $ | 91 | |||||||||
Loans (Corporate & Residential) | 33 | (67 | ) | 45 | — | 11 | ||||||||||||||
Private Equity / Principal Investments | 3 | — | — | — | 3 | |||||||||||||||
Derivatives | — | — | — | — | — | |||||||||||||||
Other | 1 | (8 | ) | 7 | — | — | ||||||||||||||
|
|
|
|
|
|
|
|
|
| |||||||||||
Sub-Total - Net Receipts | $ | 144 | $ | (99 | ) | $ | 60 | $ | — | $ | 105 | |||||||||
Recoveries From Non-Controlled Affiliates | ||||||||||||||||||||
Europe | $ | 1 | $ | (0 | ) | $ | (0 | ) | $ | (0 | ) | $ | 1 | |||||||
Asia | — | — | — | — | — | |||||||||||||||
|
|
|
|
|
|
|
|
|
| |||||||||||
Sub-Total - Recoveries From Non-Controlled Affiliates | $ | 1 | $ | (0 | ) | $ | (0 | ) | $ | (0 | ) | $ | 1 | |||||||
Operating Expenses | ||||||||||||||||||||
Professional Fees | $ | (4 | ) | $ | 1 | $ | 0 | $ | — | $ | (3 | ) | ||||||||
Compensation & Benefits | (11 | ) | 4 | 1 | — | (6 | ) | |||||||||||||
Incentive Fees | (32 | ) | 1 | (3 | ) | — | (33 | ) | ||||||||||||
Other Administrative Expenses | (6 | ) | 1 | (0 | ) | — | (4 | ) | ||||||||||||
|
|
|
|
|
|
|
|
|
| |||||||||||
Sub-Total - Operating Expenses | $ | (53 | ) | $ | 8 | $ | (2 | ) | $ | — | $ | (47 | ) | |||||||
Total Cash From Operations (CFO) | $ | 93 | $ | (91 | ) | $ | 58 | $ | (0 | ) | $ | 59 | ||||||||
|
|
|
|
|
|
|
|
|
| |||||||||||
Pre-Petition Intercompany Receipts from Controlled Entities | 609 | (73 | ) | 58 | 21 | 614 | ||||||||||||||
Net Post-Petition Intercompany Receipts from / (Payables to) Controlled Entities | 112 | 84 | (30 | ) | — | 166 | ||||||||||||||
Investments in Affiliates | 318 | (300 | ) | (4 | ) | — | 14 | |||||||||||||
Total CFO + Intercompany Receipts | $ | 1,131 | $ | (380 | ) | $ | 81 | $ | 21 | $ | 853 | |||||||||
|
|
|
|
|
|
|
|
|
| |||||||||||
Pre-Petition Intercompany Receipts from Controlled Entities
Pre-Petition intercompany receipts include recoveries from distributions on pre-petition intercompany receivables from Debtor-Controlled Entities, Post-Petition Interest on Allowed Claims against LBCC, and Allowed Claims against Debtors (per the Plan). The Company estimates that LCPI will receive approximately $0.5 billion, primarily from Lehman ALI Inc.
Net Post-Petition Intercompany Receipts from / (Payables to) Controlled Entities
Estimated net Post-Petition intercompany receipts at LCPI primarily includes receivables of $251 million from LB I Group for financial inventory encumbered to LCPI, partially offset by a loan of $73 million from LBFP.
Investments in Affiliates
Investments in Affiliates include recoveries from wholly-owned subsidiaries in cases in which the subsidiary’s net recoverable assets exceed or are expected to exceed its liabilities. Cash activity of $300 million primarily includes the distribution of $226 million from LCPI Properties Inc., a wholly owned subsidiary of LCPI, to LCPI in connection with the dissolution of LCPI Properties Inc.
Page 44
Quarterly Financial Report as of April 6, 2017 (Unaudited)
LBSF
The Company estimates that Total Post-D12 CFE Cash From Operations, including Intercompany Receipts, at LBSF will be $0.5 billion, which reflects an increase in estimates of $0.1 billion compared to estimates presented in the Post-D11 CFE.
| ($ in millions) | Post-D11 Cash Flow Estimates | Less: Cash Activity 10/7/16-4/6/17 | Recovery Value Change | Transfers, Reclassifications, Adjustments | Post-D12 Cash Flow Estimates | |||||||||||||||
Net Receipts | ||||||||||||||||||||
Commercial Real Estate | $ | — | $ | — | $ | — | $ | — | $ | — | ||||||||||
Loans (Corporate & Residential) | — | — | — | — | — | |||||||||||||||
Private Equity / Principal Investments | — | — | — | — | — | |||||||||||||||
Derivatives | 133 | (93 | ) | 118 | — | 159 | ||||||||||||||
Other | 23 | (8 | ) | 2 | — | 17 | ||||||||||||||
|
|
|
|
|
|
|
|
|
| |||||||||||
Sub-Total - Net Receipts | $ | 156 | $ | (101 | ) | $ | 121 | $ | — | $ | 176 | |||||||||
Recoveries From Non-Controlled Affiliates | ||||||||||||||||||||
Europe | $ | 28 | $ | (12 | ) | $ | 5 | $ | (0 | ) | $ | 22 | ||||||||
Asia | 0 | (0 | ) | (0 | ) | — | — | |||||||||||||
|
|
|
|
|
|
|
|
|
| |||||||||||
Sub-Total - Recoveries From Non-Controlled Affiliates | $ | 28 | $ | (12 | ) | $ | 5 | $ | (0 | ) | $ | 22 | ||||||||
Operating Expenses | ||||||||||||||||||||
Professional Fees | $ | (54 | ) | $ | 14 | $ | (6 | ) | $ | — | $ | (46 | ) | |||||||
Compensation & Benefits | (32 | ) | 11 | 3 | — | (18 | ) | |||||||||||||
Incentive Fees | (23 | ) | 1 | (2 | ) | — | (24 | ) | ||||||||||||
Other Administrative Expenses | (14 | ) | 3 | 5 | — | (5 | ) | |||||||||||||
|
|
|
|
|
|
|
|
|
| |||||||||||
Sub-Total - Operating Expenses | $ | (123 | ) | $ | 29 | $ | 0 | $ | — | $ | (93 | ) | ||||||||
Total Cash From Operations (CFO) | $ | 62 | $ | (84 | ) | $ | 126 | $ | (0 | ) | $ | 104 | ||||||||
|
|
|
|
|
|
|
|
|
| |||||||||||
Pre-Petition Intercompany Receipts from Controlled Entities | 109 | (16 | ) | 8 | — | 101 | ||||||||||||||
Net Post-Petition Intercompany Receipts from / (Payables to) Controlled Entities | 333 | (25 | ) | (21 | ) | — | 287 | |||||||||||||
Investments in Affiliates | 0 | — | (0 | ) | — | — | ||||||||||||||
Total CFO + Intercompany Receipts | $ | 504 | $ | (124 | ) | $ | 113 | $ | (0 | ) | $ | 492 | ||||||||
|
|
|
|
|
|
|
|
|
| |||||||||||
Recoveries from Non-Controlled Affiliates
LBSF collected $12 million during the period between October 7, 2016 and April 6, 2017, and the Company estimates that LBSF will collect an additional $22 million from LBT.
Pre-Petition Intercompany Receipts from Controlled Entities
Pre-Petition intercompany receipts include recoveries from distributions on Allowed Claims against Debtors (per the Plan), pre-petition intercompany receivables from Debtor-Controlled Entities, and Post-Petition Interest on allowed claims against LBCC. The Company estimates that LBSF will receive approximately $0.1 billion, primarily from Debtors and Luxembourg Finance SARL.
Net Post-Petition Intercompany Receipts from / (Payables to) Controlled Entities
Net Post-Petition intercompany receipts primarily include (i) a receivable of $349 million related to LBSF’s cash reserves for disputed claims that were invested in secured notes issued by LBHI, and (ii) a payable of $42 million to LBFP, related to a loan secured by LBSF assets. Net Post-Petition intercompany receipts also include the net settlement of Post-Petition intercompany receivables and payables between and among Debtors and Debtor-Controlled Entities.
Page 45
Quarterly Financial Report as of April 6, 2017 (Unaudited)
Other Debtors
| ($ in millions) | LOTC | LBCC | LBCS | LBFP | Merit | LBDP | Other Debtors | Total Other Debtors | ||||||||||||||||||||||||
POST-D12 CASH FLOW ESTIMATES | ||||||||||||||||||||||||||||||||
Net Receipts | ||||||||||||||||||||||||||||||||
Commercial Real Estate | $ | — | $ | — | $ | — | $ | — | $ | — | $ | — | $ | — | $ | — | ||||||||||||||||
Loans (Corporate & Residential) | — | — | — | — | — | — | — | — | ||||||||||||||||||||||||
Private Equity / Principal Investments | — | — | — | — | — | — | — | — | ||||||||||||||||||||||||
Derivatives | — | — | — | — | — | — | — | — | ||||||||||||||||||||||||
Other | 1 | 0 | 0 | 0 | 0 | 0 | — | 1 | ||||||||||||||||||||||||
|
|
|
|
|
|
|
|
|
|
|
|
|
|
|
| |||||||||||||||||
Sub-Total - Net Receipts | $ | 1 | $ | 0 | $ | 0 | $ | 0 | $ | 0 | $ | 0 | $ | — | $ | 1 | ||||||||||||||||
Recoveries From Non-Controlled Affiliates | ||||||||||||||||||||||||||||||||
Europe | $ | — | $ | 0 | $ | 6 | $ | — | $ | — | $ | — | $ | — | $ | 6 | ||||||||||||||||
Asia | — | 12 | — | — | — | — | — | 12 | ||||||||||||||||||||||||
Sub-Total - Recoveries From Non-Controlled Affiliates | $ | — | $ | 12 | $ | 6 | $ | — | $ | — | $ | — | $ | — | $ | 18 | ||||||||||||||||
Operating Expenses | ||||||||||||||||||||||||||||||||
Professional Fees | $ | (0 | ) | $ | (1 | ) | $ | (2 | ) | $ | (0 | ) | $ | (0 | ) | $ | (0 | ) | $ | (1 | ) | $ | (5 | ) | ||||||||
Compensation & Benefits | (1 | ) | (1 | ) | (1 | ) | (0 | ) | — | (0 | ) | (3 | ) | (5 | ) | |||||||||||||||||
Incentive Fees | (2 | ) | (2 | ) | (5 | ) | (1 | ) | — | (0 | ) | (1 | ) | (10 | ) | |||||||||||||||||
Other Administrative Expenses | (1 | ) | (1 | ) | (0 | ) | (0 | ) | — | (0 | ) | (2 | ) | (3 | ) | |||||||||||||||||
|
|
|
|
|
|
|
|
|
|
|
|
|
|
|
| |||||||||||||||||
Sub-Total - Operating Expenses | $ | (4 | ) | $ | (5 | ) | $ | (7 | ) | $ | (1 | ) | $ | (0 | ) | $ | (0 | ) | $ | (7 | ) | $ | (24 | ) | ||||||||
Total Cash From Operations (CFO) | $ | (3 | ) | $ | 7 | $ | (1 | ) | $ | (1 | ) | $ | (0 | ) | $ | (0 | ) | $ | (7 | ) | $ | (5 | ) | |||||||||
|
|
|
|
|
|
|
|
|
|
|
|
|
|
|
| |||||||||||||||||
Pre-Petition Intercompany Receipts from Controlled Entities | $ | — | $ | 1 | $ | 8 | $ | 0 | $ | — | $ | — | $ | 80 | $ | 89 | ||||||||||||||||
Net Post-Petition Intercompany Receipts from / (Payables to) Controlled Entities | 500 | 237 | (1 | ) | 115 | — | 20 | (7 | ) | 864 | ||||||||||||||||||||||
Investments in Affiliates | — | — | — | — | — | — | — | — | ||||||||||||||||||||||||
Total Post-D12 CFO + Intercompany Receipts | $ | 497 | $ | 244 | $ | 6 | $ | 115 | $ | (0 | ) | $ | 20 | $ | 66 | $ | 948 | |||||||||||||||
|
|
|
|
|
|
|
|
|
|
|
|
|
|
|
| |||||||||||||||||
|
|
|
|
|
|
|
|
|
|
|
|
|
|
|
| |||||||||||||||||
Cash Activity, 10/7/16-4/6/17 | $ | 16 | $ | 26 | $ | 42 | $ | 23 | $ | 17 | $ | (21 | ) | $ | 6 | $ | 109 | |||||||||||||||
Transfers, Reclassifications, Adjustments | — | — | 0 | — | 1 | 0 | 0 | 1 | ||||||||||||||||||||||||
|
|
|
|
|
|
|
|
|
|
|
|
|
|
|
| |||||||||||||||||
Total Post-D12 CFE, including Prior Period Activity | $ | 513 | $ | 270 | $ | 48 | $ | 138 | $ | 18 | $ | (1 | ) | $ | 72 | $ | 1,058 | |||||||||||||||
Total Post-D11 CFE | 513 | 273 | 47 | 136 | 18 | (2 | ) | 73 | 1,058 | |||||||||||||||||||||||
Variance, Post-D12 CFE (including Prior Period) vs. Post-D11 CFE | 0 | (3 | ) | 1 | 2 | 0 | 1 | (1 | ) | (0 | ) | |||||||||||||||||||||
Net Post-Petition Intercompany Receipts from / (Payables to) Controlled Entities
Net Post-Petition Intercompany Receipts from/Payables to Controlled Entities primarily include the following outstanding loans:
| • | $500 million, $237 million, and $20 million from LOTC, LBCC and LBDP, respectively, to LBHI |
| • | $73 million and $42 million from LBFP to LCPI and LBSF, respectively. |
Page 46
Quarterly Financial Report as of April 6, 2017 (Unaudited)
Debtor-Controlled Entities
| ($ in millions) | Post-D11 Cash Flow Estimates | Less: Cash Activity 10/7/16-4/6/17 | Recovery Value Change | Transfers, Reclassifications, Adjustments(a) | Post-D12 Cash Flow Estimates | |||||||||||||||
Net Receipts | ||||||||||||||||||||
Commercial Real Estate | $ | 71 | $ | (18 | ) | $ | (11 | ) | $ | — | $ | 42 | ||||||||
Loans (Corporate & Residential) | 31 | (4 | ) | (15 | ) | — | 13 | |||||||||||||
Private Equity / Principal Investments | 961 | (303 | ) | 105 | — | 763 | ||||||||||||||
Derivatives | 1 | (0 | ) | (0 | ) | — | 0 | |||||||||||||
Other | 49 | (8 | ) | 6 | — | 47 | ||||||||||||||
|
|
|
|
|
|
|
|
|
| |||||||||||
Sub-Total - Net Receipts | $ | 1,113 | $ | (334 | ) | $ | 86 | $ | — | $ | 866 | |||||||||
Recoveries From Non-Controlled Affiliates | ||||||||||||||||||||
Europe | $ | 1,253 | $ | (7 | ) | $ | 13 | $ | (37 | ) | $ | 1,222 | ||||||||
Asia | 73 | (0 | ) | (0 | ) | (0 | ) | 72 | ||||||||||||
|
|
|
|
|
|
|
|
|
| |||||||||||
Sub-Total - Recoveries From Non-Controlled Affiliates | $ | 1,325 | $ | (7 | ) | $ | 13 | $ | (37) | $ | 1,294 | |||||||||
Operating Expenses | ||||||||||||||||||||
Professional Fees | $ | (2 | ) | $ | 2 | $ | (2 | ) | $ | — | $ | (2 | ) | |||||||
Compensation & Benefits | (11 | ) | 2 | 4 | — | (5 | ) | |||||||||||||
Incentive Fees | — | — | — | — | — | |||||||||||||||
Other Administrative Expenses | (1 | ) | 0 | (0 | ) | — | (1 | ) | ||||||||||||
|
|
|
|
|
|
|
|
|
| |||||||||||
Sub-Total - Operating Expenses | $ | (14 | ) | $ | 5 | $ | 2 | $ | — | $ | (7 | ) | ||||||||
Total Cash From Operations (CFO) | $ | 2,424 | $ | (336 | ) | $ | 101 | $ | (37) | $ | 2,153 | |||||||||
|
|
|
|
|
|
|
|
|
| |||||||||||
Pre-Petition Intercompany Receipts from Controlled Entities | 300 | (54 | ) | 29 | (155 | ) | 120 | |||||||||||||
Net Post-Petition Intercompany Receipts from / (Payables to) Controlled Entities | (70 | ) | (29 | ) | 32 | — | (67 | ) | ||||||||||||
Investments in Affiliates | 472 | — | (1 | ) | — | 471 | ||||||||||||||
Total CFO + Intercompany Receipts | $ | 3,126 | $ | (419 | ) | $ | 161 | $ | (192) | $ | 2,676 | |||||||||
|
|
|
|
|
|
|
|
|
| |||||||||||
|
|
|
| |||||||||||||||||
| (a) | Transfers, Reclassifications and Adjustments primarily include: |
| • | a transfer of $26 million from “Recoveries From Non-Controlled Affiliates” in Europe to “Pre-Petition Intercompany Receipts from Controlled Entities” related to claims against LBHI that were assigned by Lehman Brothers Luxembourg Investments S.a.r.l., a Non-Controlled Affiliate, to a Debtor-Controlled Entity, and |
| • | a transfer of approximately $160 million in “Pre-Petition Intercompany Receipts from Controlled Entities” related to claims against LBHI that were assigned from LB RE Financing No.2 Limited to LB RE Financing No.1 Limited, and subsequently assigned to LBHI (refer to Note 8 – Due from/to Affiliates of the December 31, 2016 for additional information, |
Recoveries from Non-Controlled Affiliates
The Company estimates that Debtor-Controlled Entities will collect approximately $1.3 billion, of which over 90% is estimated to be collected from various Non-Controlled Affiliates in the UK.
Pre-Petition Intercompany Receipts from Controlled Entities
Pre-Petition intercompany receipts include recoveries from distributions on Allowed Claims against Debtors (per the Plan). The Company estimates that Debtor-Controlled Entities will receive approximately $0.1 billion, primarily driven by Lehman Ali and LB U.K. Holdings (Delaware) Inc.‘s Allowed Claims against LBHI.
Net Post-Petition Intercompany Receipts from / (Payables to) Controlled Entities
Net Post-Petition intercompany payables include the net settlement of Post-Petition intercompany receivables
and payables between Debtors and Debtor-Controlled Entities adjusted for net receipts related to the allocation of taxes in accordance with the Debtor Allocation Agreement and other items.
The Company estimates that Debtor-Controlled Entities will make net payments to LCPI of approximately $250 million and will collect approximately $183 million from LBHI.
Investments in Affiliates
Investments in Affiliates include recoveries from wholly-owned subsidiaries in cases in which the subsidiary’s net recoverable assets exceed its liabilities.
The Company estimates that Debtor-Controlled Entities will recover approximately $0.5 billion through Investments in Affiliates, primarily driven by LBFP and LBDP.
Page 47