UNITED STATES
SECURITIES AND EXCHANGE COMMISSION
Washington, D.C. 20549
FORM N-CSR
CERTIFIED SHAREHOLDER REPORT OF REGISTERED MANAGEMENT
INVESTMENT COMPANIES
Investment Company Act file number | 811-04906 | |||||
|
| |||||
| BNY Mellon State Municipal Bond Funds |
| ||||
| (Exact name of Registrant as specified in charter) |
| ||||
|
|
| ||||
|
c/o BNY Mellon Investment Adviser, Inc. 240 Greenwich Street New York, New York 10286 |
| ||||
| (Address of principal executive offices) (Zip code) |
| ||||
|
|
| ||||
| Bennett A. MacDougall, Esq. 240 Greenwich Street New York, New York 10286 |
| ||||
| (Name and address of agent for service) |
| ||||
| ||||||
Registrant's telephone number, including area code: | (212) 922-6400 | |||||
|
| |||||
Date of fiscal year end:
| 04/30 |
| ||||
Date of reporting period: | 04/30/19
|
| ||||
FORM N-CSR
Item 1. Reports to Stockholders.
BNY Mellon State Municipal Bond Funds, BNY Mellon Connecticut Fund
ANNUAL REPORT April 30, 2019 |
Save time. Save paper. View your next shareholder report online as soon as it’s available. Log into www.bnymellonim.com/us and sign up for eCommunications. It’s simple and only takes a few minutes. |
The views expressed in this report reflect those of the portfolio manager(s) only through the end of the period covered and do not necessarily represent the views of BNY Mellon Investment Adviser, Inc. or any other person in the BNY Mellon Investment Adviser, Inc. organization. Any such views are subject to change at any time based upon market or other conditions and BNY Mellon Investment Adviser, Inc. disclaims any responsibility to update such views. These views may not be relied on as investment advice and, because investment decisions for a fund in the BNY Mellon Family of Funds are based on numerous factors, may not be relied on as an indication of trading intent on behalf of any fund in the BNY Mellon Family of Funds. |
Not FDIC-Insured • Not Bank-Guaranteed • May Lose Value |
Contents
THE FUND
BNY Mellon Investment Adviser, Inc. | |
With Those of Other Funds | |
Public Accounting Firm | |
FOR MORE INFORMATION
Back Cover
| The Fund |
A LETTER FROM THE PRESIDENT OF BNY MELLON INVESTMENT ADVISER, INC.
Dear Shareholder:
We are pleased to present this annual report for BNY Mellon Connecticut Fund (formerly the Dreyfus Connecticut Fund), covering the 12-month period from May 1, 2018 through April 30, 2019. For information about how the fund performed during the reporting period, as well as general market perspectives, we provide a Discussion of Fund Performance on the pages that follow.
At the beginning of the reporting period, developed economies outside of the U.S. continued to weaken, while the U.S. economy sustained its relatively healthy growth rate. Calm markets prevailed throughout the summer, as robust growth and strong corporate earnings supported U.S. stock returns, while other developed markets continued to decline.
The fourth quarter of 2018 saw broad market weakness, due in part to heightened concerns about interest-rate increases, trade tensions and slowing global growth. The slump largely erased prior gains on U.S. indices, while losses deepened in international markets. December experienced a sharp sell-off, as it appeared that the U.S. Federal Reserve (the “Fed”) would maintain its hawkish stance on monetary policy. However, comments made in January by the Fed indicated that it would slow the pace of interest-rate increases, and this helped stimulate a rebound across equity markets that continued through the end of the reporting period.
Fixed-income markets declined early in the period, as interest rates and inflation rose, pressuring most bond prices. Comparatively strong U.S. equity markets fed investor risk appetites, reducing the demand for Treasuries and increasing yields. But a return of stock-market volatility in October triggered a flight to quality, boosting Treasury prices and flattening the yield curve. Corporate bonds, however, were hindered somewhat by concerns about economic growth, resulting in widening spreads and lower prices through November. In January, when the Fed’s comments indicated that rate increases would be less likely in 2019, bond markets rallied, and most U.S. indices continued to post positive returns through the end of April.
We remain positive on the near-term economic outlook for the U.S. but will monitor relevant data for any signs of a change. As always, we encourage you to discuss the risks and opportunities in today’s investment environment with your financial advisor.
Thank you for your continued confidence and support.
Sincerely,

Renee LaRoche-Morris
President
BNY Mellon Investment Adviser, Inc.
June 3, 2019
2
DISCUSSION OF FUND PERFORMANCE(Unaudited)
For the period from May 1, 2018 through April 30, 2019, as provided by Daniel Barton and Jeffrey Burger, Portfolio Managers
Market and Fund Performance Overview
For the 12-month period ended April 30, 2019, Class A shares of BNY Mellon Connecticut Fund (formerly, Dreyfus Connecticut Fund), a series of BNY Mellon State Municipal Bond Funds (formerly, Dreyfus State Municipal Bond Funds), produced a total return of 4.98%, Class C shares returned 4.23%, Class I shares returned 5.22%, Class Y shares returned 5.26%, and Class Z shares returned 5.21%.1 In comparison, the Bloomberg Barclays U.S. Municipal Bond Index (the “Index”), the fund’s benchmark index, which is comprised of bonds issued nationally and not solely within Connecticut, achieved a total return of 6.16% for the same period.2
Municipal bonds during the reporting period encountered bouts of volatility stemming from rising interest rates and shifting supply-and-demand dynamics in the municipal securities market. The fund underperformed the Index, mainly due to an overweight to shorter maturities, which lagged the Index.
The Fund’s Investment Approach
The fund seeks to maximize current income exempt from federal income tax and from Connecticut state income tax, without undue risk. To pursue its goal, the fund normally invests at least 80% of its net assets, plus any borrowings for investment purposes, in municipal bonds that provide income exempt from federal and Connecticut state income taxes. The fund invests at least 70% of its assets in municipal bonds rated, at the time of purchase, investment grade (Baa/BBB or higher) or the unrated equivalent as determined by BNY Mellon Investment Adviser, Inc. (formerly, The Dreyfus Corporation). For additional yield, the fund may invest up to 30% of its assets in municipal bonds rated below investment grade (“high yield” or “junk” bonds) or the unrated equivalent as determined by BNY Mellon Investment Adviser, Inc. The dollar-weighted average maturity of the fund’s portfolio normally exceeds 10 years, but the fund may invest without regard to maturity.
The portfolio managers focus on identifying undervalued sectors and securities and minimize the use of interest-rate forecasting. The portfolio managers select municipal bonds for the fund’s portfolio by using fundamental credit analysis to estimate the relative value and attractiveness of various sectors and securities and to exploit pricing inefficiencies in the municipal bond market, and actively trading among various sectors, such as the pre-refunded, general obligation and revenue, based on their apparent relative values. The fund seeks to invest in several of these sectors.
A Shift in Federal Reserve Policy Drove Municipal Bonds
Municipal bonds struggled during the first two-thirds of the reporting period as the economy continued to perform well, and the Federal Reserve (the “Fed”) continued on a path of raising short-term interest rates. The Fed hiked the federal funds policy rate three times during the reporting period, bringing the target to 2.25%-2.50%. Flows into municipal bond funds were fairly steady and supply also was manageable as new issuance for 2018 came in approximately 24% below that of 2017.
3
DISCUSSION OF FUND PERFORMANCE(Unaudited) (continued)
From a macroeconomic perspective, data became more mixed towards the end of 2018, and investors became increasingly concerned about the effect of the Fed’s hawkish stance on interest rates. This resulted in some volatility in capital markets that resulted in a “flight to quality” in which higher-quality securities, including municipal bonds, rallied strongly. The Fed’s shift to a more dovish stance also fed demand as it confirmed investor concerns about a possible weakening of the economy.
As 2019 progressed, supply through the first four months of the year continued to be manageable, while demand rallied significantly and fund flows surged, hitting record levels. Investors, especially those in high-tax states, reacted to the impact on their tax bills from the Tax Cuts and Jobs Act of 2017 and the new cap on the deductibility of state and local taxes. In response, these investors sought tax-exempt municipal bonds as a tax shelter. In addition, the relative stability of the municipal bond market compared to that of the equity markets also attracted investors.
The flight to quality caused rates to fall, and investors then began to reach for yield. As a result, longer-term municipals, especially those 10 years and longer, experienced a greater compression of yields than did shorter maturities, resulting in a flatter municipal bond yield curve. The ratio of municipal bond yields to Treasury yields fell significantly, especially for longer bonds, reflecting the outperformance of municipal bonds versus Treasuries. Investors also began to reach for the yield available from lower-quality issues, resulting in a tightening of quality spreads.
Although long-term obligations, including pension and health care liabilities, remain a concern, credit quality remained stable to strong during the period. Driven by continued economic strength, tax revenues were healthy, allowing many issuers to increase their “rainy day” funds. Tobacco bonds, those backed by certain states’ settlement of litigation with U.S. tobacco companies, were hurt by a proposal by the Food and Drug Administration to ban menthol cigarettes.
Connecticut continued to enjoy the effects of a strong economy, taking in robust tax revenues that allowed it to boost its “rainy day” fund. Political developments also bode well for the state’s fiscal future. With one party now controlling all three branches of the government, the enactment of necessary reforms regarding pension and health care obligations is now more likely. Connecticut municipal bonds benefited from strong demand from higher income earners as the cap on the federal deductibility of state and local taxes made tax-free income more attractive.
Yield Curve Positioning Hindered Fund Results
The fund’s relative performance was undermined by its relatively short duration versus the Index. In the municipal bond market as a whole, the long end of the municipal bond curve outperformed, and the short end underperformed. The relative lack of longer-term securities issued by Connecticut, therefore, constrained the fund’s performance. An underweight to the 10-year portion of the curve also constrained performance as these issues outperformed. Underweights to transportation and airports hurt performance, as these segments performed well, but this underweight was a function of the relative lack of issuance in these segments in Connecticut. The fund was also hindered by its lack of exposure to uninsured Puerto Rico bonds, which posted strong gains.
4
On the other hand, the fund gained from a reach for yield that occurred especially late in the reporting period, which benefited Connecticut and other higher-yielding states, such as Illinois and New Jersey. In addition, an overweight to revenue bonds added to the fund’s results as this sector outperformed. Health care, special tax, and education in particular were additive to performance. The underweight to pre-refunded and general obligation bonds also contributed positively. An overweight to A rated bonds contributed positively to results.
A Constructive Investment Posture
The domestic economy remains strong, fueled by the 2017 tax cuts. Employment continues to be robust, with unemployment at near-record-low levels, and wage growth is picking up, further raising the prospect of an increase in inflation. One risk to this outlook is a deterioration in trade relations, which could derail the economy’s momentum. While market participants are concerned over the impact of trade tensions on economic growth, we believe the Fed will be focusing on economic data and, for the near term, will be on hold in adjusting short-term rates.
Nevertheless, even if rates eventually rise moderately over the coming year, demand for municipal bonds should remain strong and supply manageable. The municipal bond market should perform relatively well. In addition, the cap on federal deductibility of state and local taxes will continue to help drive demand for municipal securities, encouraging the reinvestment of the proceeds of a large number of bonds that are due to mature in the coming months. We expect to manage the fund’s duration to remain neutral to modestly long relative to the benchmark, and we will continue to focus on security selection, emphasizing undervalued issues and relying on our credit research capabilities.
June 3, 2019
1 Total return includes reinvestment of dividends and any capital gains paid and does not take into consideration the maximum initial sales charge in the case of Class A shares, or the applicable contingent deferred sales charge imposed on redemptions in the case of Class C shares. Had these charges been reflected, returns would have been lower. Class I, Class Y, and Class Z shares are not subject to any initial or deferred sales charge. Past performance is no guarantee of future results. Share price, yield, and investment return fluctuate such that upon redemption, fund shares may be worth more or less than their original cost. Income may be subject to state and local taxes and some income may be subject to the federal alternative minimum tax (AMT) for certain investors. Capital gains, if any, are taxable.
2 Source: Lipper Inc. — The Bloomberg Barclays U.S. Municipal Bond Index covers the U.S.-dollar-denominated, long-term, tax-exempt bond market. Investors cannot invest directly in any index.
Bonds are subject generally to interest-rate, credit, liquidity, and market risks, to varying degrees, all of which are more fully described in the fund’s prospectus. Generally, all other factors being equal, bond prices are inversely related to interest-rate changes, and rate increases can cause price declines.
The amount of public information available about municipal bonds is generally less than that for corporate equities or bonds. Special factors, such as legislative changes, and state and local economic and business developments, may adversely affect the yield and/or value of the fund’s investments in municipal bonds. Other factors include the general conditions of the municipal bond market, the size of the particular offering, the maturity of the obligation, and the rating of the issue. Changes in economic, business, or political conditions relating to a particular municipal project, municipality, or state in which the fund invests may have an impact on the fund’s share price.
5
FUND PERFORMANCE(Unaudited)

Comparison of change in value of a $10,000 investment in Class A shares, Class C shares, Class I shares and Class Z shares of BNY Mellon State Municipal Bond Funds, BNY Mellon Connecticut Fund with a hypothetical investment of $10,000 in the Bloomberg Barclays U.S. Municipal Bond Index (the “Index”).
† Source: Lipper Inc.
Past performance is not predictive of future performance.
The above graph compares a hypothetical $10,000 investment made in Class A, Class C, Class I and Class Z shares of BNY Mellon State Municipal Bond Funds, BNY Mellon Connecticut Fund on 4/30/09 to a hypothetical investment of $10,000 made in the Index on that date. All dividends and capital gain distributions are reinvested.
The fund’s performance shown in the line graph above takes into account the maximum initial sales charge on Class A shares and all other applicable fees and expenses on all classes. The Index is not limited to investments principally in Connecticut municipal obligations. The Index, unlike the fund, covers the U.S. dollar-denominated long-term tax-exempt bond market. These factors can contribute to the Index potentially outperforming or underperforming the fund. Unlike a mutual fund, the Index is not subject to charges, fees and other expenses. Investors cannot invest directly in any index. Further information relating to fund performance, including expense reimbursements, if applicable, is contained in the Financial Highlights section of the prospectus and elsewhere in this report.
6

Comparison of change in value of a $1,000,000 investment in Class Y shares of BNY Mellon State Municipal Bond Funds, BNY Mellon Connecticut Fund with a hypothetical investment of $1,000,000 in the Bloomberg Barclays U.S. Municipal Bond Index (the “Index”).
† Source: Lipper Inc.
†† The total return figures presented for Class Y shares of the fund reflect the performance of the fund’s Class A shares for the period prior to 9/3/13 (the inception date for Class Y shares), not reflecting the applicable sales load for Class A shares.
Past performance is not predictive of future performance.
The above graph compares a hypothetical $1,000,000 investment made in Class Y of BNY Mellon State Municipal Bond Funds, BNY Mellon Connecticut Fund on 4/30/09 to a hypothetical investment of $1,000,000 made in the Index on that date. All dividends and capital gain distributions are reinvested.
The fund’s performance shown in the line graph above takes into account all applicable fees and expenses of the fund’s Class Y shares. The Index is not limited to investments principally in Connecticut municipal obligations. The Index, unlike the fund, covers the U.S. dollar-denominated long-term tax-exempt bond market. These factors can contribute to the Index potentially outperforming or underperforming the fund. Unlike a mutual fund, the Index is not subject to charges, fees and other expenses. Investors cannot invest directly in any index. Further information relating to fund performance, including expense reimbursements, if applicable, is contained in the Financial Highlights section of the prospectus and elsewhere in this report.
7
FUND PERFORMANCE(Unaudited) (continued)
Average Annual Total Returns as of 4/30/19 | |||||
| Inception | 1 Year | 5 Years | 10 Years | |
Class A shares | |||||
with maximum sales charge (4.5%) | 5/28/87 | 0.30% | 1.69% | 3.15% | |
without sales charge | 5/28/87 | 4.98% | 2.63% | 3.63% | |
Class C shares | |||||
with applicable redemption charge† | 8/15/95 | 3.23% | 1.84% | 2.85% | |
without redemption | 8/15/95 | 4.23% | 1.84% | 2.85% | |
Class I shares | 12/15/08 | 5.22% | 2.88% | 3.88% | |
Class Y shares | 9/3/13 | 5.26% | 2.89% | 3.78%†† | |
Class Z shares | 5/30/07 | 5.21% | 2.85% | 3.85% | |
Bloomberg Barclays U.S. | 6.16% | 3.56% | 4.55% | ||
† The maximum contingent deferred sales charge for Class C shares is 1% for shares redeemed within one year of the date of purchase.
†† The total return performance figures presented for Class Y shares of the fund reflect the performance of the fund’s Class A shares for the period prior to 9/3/13 (the inception date for Class Y shares), not reflecting the applicable sales load for Class A shares.
The performance data quoted represents past performance, which is no guarantee of future results. Share price and investment return fluctuate and an investor’s shares may be worth more or less than original cost upon redemption. Current performance may be lower or higher than the performance quoted. Go to bnymellonim.com/us for the fund’s most recent month-end returns.
The fund’s performance shown in the graphs and table do not reflect the deduction of taxes that a shareholder would pay on fund distributions or the redemption of fund shares. In addition to the performance of Class A shares shown with and without a maximum sales charge, the fund's performance shown in the table takes into account all other applicable fees and expenses on all classes.
8
UNDERSTANDING YOUR FUND’S EXPENSES(Unaudited)
As a mutual fund investor, you pay ongoing expenses, such as management fees and other expenses. Using the information below, you can estimate how these expenses affect your investment and compare them with the expenses of other funds. You also may pay one-time transaction expenses, including sales charges (loads) and redemption fees, which are not shown in this section and would have resulted in higher total expenses. For more information, see your fund’s prospectus or talk to your financial adviser.
Review your fund’s expenses
The table below shows the expenses you would have paid on a $1,000 investment in BNY Mellon State Municipal Bond Funds, BNY Mellon Connecticut Fund from November 1, 2018 to April 30, 2019. It also shows how much a $1,000 investment would be worth at the close of the period, assuming actual returns and expenses.
Expenses and Value of a $1,000 Investment | ||||||||||||
assuming actual returns for the six months ended April 30, 2019 | ||||||||||||
|
|
| Class A | Class C | Class I | Class Y | Class Z | |||||
Expenses paid per $1,000† |
| $4.82 |
| $8.81 |
| $3.60 |
| $3.40 |
| $3.76 | ||
Ending value (after expenses) |
| $1,045.70 |
| $1,041.50 |
| $1,046.90 |
| $1,047.10 |
| $1,046.80 | ||
COMPARING YOUR FUND’S EXPENSES
WITH THOSE OF OTHER FUNDS(Unaudited)
Using the SEC’s method to compare expenses
The Securities and Exchange Commission (“SEC”) has established guidelines to help investors assess fund expenses. Per these guidelines, the table below shows your fund’s expenses based on a $1,000 investment, assuming a hypothetical 5% annualized return. You can use this information to compare the ongoing expenses (but not transaction expenses or total cost) of investing in the fund with those of other funds. All mutual fund shareholder reports will provide this information to help you make this comparison. Please note that you cannot use this information to estimate your actual ending account balance and expenses paid during the period.
Expenses and Value of a $1,000 Investment | |||||||||||||
assuming a hypothetical 5% annualized return for the six months ended April 30, 2019 | |||||||||||||
|
|
| Class A | Class C | Class I | Class Y | Class Z | ||||||
Expenses paid per $1,000† |
| $4.76 |
| $8.70 |
| $3.56 |
| $3.36 |
| $3.71 | |||
Ending value (after expenses) |
| $1,020.08 |
| $1,016.17 |
| $1,021.27 |
| $1,021.47 |
| $1,021.12 | |||
† Expenses are equal to the fund’s annualized expense ratio of .95% for Class A, 1.74% for Class C, .71% for Class I, .67% for Class Y and .74% for Class Z, multiplied by the average account value over the period, multiplied by 181/365 (to reflect the one-half year period).
9
STATEMENT OF INVESTMENTS
April 30, 2019
Description | Coupon | Maturity | Principal | Value ($) | |||||
Long-Term Municipal Investments - 98.1% | |||||||||
Connecticut - 95.7% | |||||||||
Connecticut, | 5.00 | 3/1/2026 | 5,000,000 | 5,653,600 | |||||
Connecticut, | 5.00 | 10/15/2025 | 1,645,000 | 1,845,723 | |||||
Connecticut, | 5.00 | 11/1/2031 | 2,500,000 | 2,663,625 | |||||
Connecticut, | 5.00 | 11/1/2027 | 5,000,000 | 5,344,250 | |||||
Connecticut, | 5.00 | 11/1/2028 | 5,000,000 | 5,339,400 | |||||
Connecticut, | 4.00 | 9/1/2035 | 5,000,000 | 5,277,700 | |||||
Connecticut, | 5.00 | 8/1/2034 | 3,000,000 | 3,368,160 | |||||
Connecticut, | 5.00 | 12/1/2021 | 1,500,000 | 1,620,945 | |||||
Connecticut Bradley International Airport CFC, | 5.00 | 7/1/2049 | 2,500,000 | 2,904,800 | |||||
Connecticut Development Authority, | 4.38 | 9/1/2028 | 3,900,000 | 4,099,056 | |||||
Connecticut Health & Educational Facilities Authority, | 5.00 | 11/15/2040 | 10,000,000 | 10,157,500 | |||||
Connecticut Health & Educational Facilities Authority, | 5.00 | 12/1/2040 | 2,010,000 | 2,251,602 | |||||
Connecticut Health & Educational Facilities Authority, | 5.00 | 7/1/2046 | 1,000,000 | 1,123,600 | |||||
10
Description | Coupon | Maturity | Principal | Value ($) | |||||
Long-Term Municipal Investments - 98.1% (continued) | |||||||||
Connecticut - 95.7% (continued) | |||||||||
Connecticut Health & Educational Facilities Authority, | 5.00 | 7/1/2027 | 3,265,000 | 3,684,030 | |||||
Connecticut Health & Educational Facilities Authority, | 5.00 | 7/1/2045 | 2,500,000 | 2,705,575 | |||||
Connecticut Health & Educational Facilities Authority, | 5.00 | 9/1/2046 | 1,000,000 | a | 1,042,920 | ||||
Connecticut Health & Educational Facilities Authority, | 5.00 | 9/1/2053 | 1,500,000 | a | 1,557,690 | ||||
Connecticut Health & Educational Facilities Authority, | 4.00 | 7/1/2046 | 2,000,000 | 2,054,560 | |||||
Connecticut Health & Educational Facilities Authority, | 5.38 | 7/1/2041 | 1,000,000 | 1,057,450 | |||||
Connecticut Health & Educational Facilities Authority, | 5.00 | 7/1/2025 | 3,625,000 | 3,966,801 | |||||
Connecticut Health & Educational Facilities Authority, | 4.00 | 7/1/2046 | 2,000,000 | 2,075,080 | |||||
Connecticut Health & Educational Facilities Authority, | 5.00 | 7/1/2032 | 1,000,000 | 1,173,000 | |||||
Connecticut Health & Educational Facilities Authority, | 5.25 | 3/1/2032 | 6,880,000 | 8,690,816 | |||||
Connecticut Health & Educational Facilities Authority, | 5.00 | 7/1/2032 | 1,000,000 | 1,053,930 | |||||
11
STATEMENT OF INVESTMENTS (continued)
Description | Coupon | Maturity | Principal | Value ($) | |||||
Long-Term Municipal Investments - 98.1% (continued) | |||||||||
Connecticut - 95.7% (continued) | |||||||||
Connecticut Health & Educational Facilities Authority, | 5.00 | 7/1/2041 | 2,000,000 | 2,095,340 | |||||
Connecticut Health & Educational Facilities Authority, | 5.25 | 7/1/2028 | 1,760,000 | 2,212,566 | |||||
Connecticut Health & Educational Facilities Authority, | 5.00 | 7/1/2036 | 5,000,000 | 5,644,500 | |||||
Connecticut Health & Educational Facilities Authority, | 5.00 | 7/1/2045 | 3,000,000 | 3,341,640 | |||||
Connecticut Health & Educational Facilities Authority, | 5.00 | 7/1/2036 | 200,000 | 228,476 | |||||
Connecticut Health & Educational Facilities Authority, | 5.00 | 7/1/2042 | 2,000,000 | 2,275,320 | |||||
Connecticut Health & Educational Facilities Authority, | 5.00 | 7/1/2030 | 6,750,000 | 6,950,475 | |||||
Connecticut Health & Educational Facilities Authority, | 5.00 | 7/1/2025 | 1,490,000 | 1,579,787 | |||||
Connecticut Health & Educational Facilities Authority, | 5.00 | 12/1/2045 | 7,500,000 | 8,548,425 | |||||
Connecticut Health & Educational Facilities Authority, | 5.00 | 7/1/2036 | 1,000,000 | 1,132,370 | |||||
Connecticut Health & Educational Facilities Authority, | 5.00 | 7/1/2027 | 3,960,000 | 4,559,782 | |||||
Connecticut Higher Education Supplemental Loan Authority, | 5.00 | 11/15/2021 | 1,450,000 | 1,548,557 | |||||
12
Description | Coupon | Maturity | Principal | Value ($) | |||||
Long-Term Municipal Investments - 98.1% (continued) | |||||||||
Connecticut - 95.7% (continued) | |||||||||
Connecticut Higher Education Supplemental Loan Authority, | 5.00 | 11/15/2022 | 1,400,000 | 1,528,296 | |||||
Connecticut Higher Education Supplemental Loan Authority, | 5.00 | 11/15/2023 | 1,400,000 | 1,558,228 | |||||
Connecticut Municipal Electric Energy Cooperative, | 5.00 | 1/1/2038 | 3,000,000 | 3,288,660 | |||||
Connecticut Municipal Electric Energy Cooperative, | 5.00 | 1/1/2022 | 1,505,000 | 1,632,594 | |||||
Connecticut Revolving Fund, | 5.00 | 3/1/2029 | 2,500,000 | 2,940,275 | |||||
Connecticut State Development Authority, | 5.50 | 4/1/2021 | 4,500,000 | 4,760,055 | |||||
Connecticut Transmission Municipal Electric Energy Cooperative, | 5.00 | 1/1/2042 | 3,000,000 | 3,222,450 | |||||
Eastern Connecticut Resource Recovery Authority, | 5.50 | 1/1/2020 | 1,670,000 | 1,696,854 | |||||
Greater New Haven Water Pollution Control Authority, | 5.00 | 8/15/2035 | 25,000 | 25,072 | |||||
Greater New Haven Water Pollution Control Authority, | 5.00 | 8/15/2029 | 1,500,000 | 1,712,430 | |||||
Greater New Haven Water Pollution Control Authority, | 5.00 | 8/15/2026 | 700,000 | 806,372 | |||||
Greater New Haven Water Pollution Control Authority, | 5.00 | 8/15/2027 | 1,250,000 | 1,432,513 | |||||
13
STATEMENT OF INVESTMENTS (continued)
Description | Coupon | Maturity | Principal | Value ($) | |||||
Long-Term Municipal Investments - 98.1% (continued) | |||||||||
Connecticut - 95.7% (continued) | |||||||||
Harbor Point Infrastructure Improvement District, | 5.00 | 4/1/2039 | 4,000,000 | a | 4,285,760 | ||||
Hartford County Metropolitan District, | 5.00 | 11/1/2042 | 2,000,000 | 2,228,940 | |||||
Hartford County Metropolitan District, | 5.00 | 4/1/2031 | 3,510,000 | 3,800,768 | |||||
Metropolitan District, | 5.00 | 7/15/2034 | 2,065,000 | 2,453,406 | |||||
New Britain, | 5.00 | 4/1/2024 | 3,600,000 | 3,978,612 | |||||
New Haven, | 5.00 | 8/15/2026 | 610,000 | 702,732 | |||||
New Haven, | 5.00 | 8/15/2027 | 750,000 | 860,205 | |||||
South Central Connecticut Regional Water Authority, | 5.00 | 8/1/2032 | 1,370,000 | 1,494,738 | |||||
South Central Connecticut Regional Water Authority, | 5.00 | 8/1/2033 | 1,500,000 | 1,634,430 | |||||
South Central Connecticut Regional Water Authority, | 5.00 | 8/1/2027 | 3,000,000 | 3,371,220 | |||||
South Central Connecticut Regional Water Authority, | 5.00 | 8/1/2039 | 1,500,000 | 1,682,250 | |||||
South Central Connecticut Regional Water Authority, | 5.00 | 8/1/2037 | 3,430,000 | 3,964,703 | |||||
South Central Connecticut Regional Water Authority, | 5.00 | 8/1/2038 | 3,500,000 | 4,036,620 | |||||
South Central Connecticut Regional Water Authority, | 5.00 | 8/1/2041 | 2,445,000 | 2,890,699 | |||||
University of Connecticut, | 5.00 | 11/15/2024 | 5,000,000 | 5,513,700 | |||||
14
Description | Coupon | Maturity | Principal | Value ($) | |||||
Long-Term Municipal Investments - 98.1% (continued) | |||||||||
Connecticut - 95.7% (continued) | |||||||||
University of Connecticut, | 5.25 | 11/15/2047 | 4,000,000 | 4,664,120 | |||||
Waterbury, | 5.00 | 11/15/2038 | 2,500,000 | 2,876,225 | |||||
195,871,978 | |||||||||
U.S. Related - 2.4% | |||||||||
Children's Trust Fund, | 0.00 | 5/15/2050 | 12,000,000 | b | 1,628,400 | ||||
Puerto Rico Highway & Transportation Authority, | 5.25 | 7/1/2034 | 1,500,000 | 1,630,530 | |||||
Virgin Islands Port Authority, | 5.00 | 9/1/2044 | 2,000,000 | 1,768,880 | |||||
5,027,810 | |||||||||
Total Investments(cost $195,357,809) | 98.1% | 200,899,788 | |||||||
Cash and Receivables (Net) | 1.9% | 3,848,015 | |||||||
Net Assets | 100.0% | 204,747,803 | |||||||
a Security exempt from registration pursuant to Rule 144A under the Securities Act of 1933. These securities may be resold in transactions exempt from registration, normally to qualified institutional buyers. At April 30, 2019, these securities were valued at $6,886,370 or 3.36% of net assets.
b Security issued with a zero coupon. Income is recognized through the accretion of discount.
15
STATEMENT OF INVESTMENTS (continued)
Portfolio Summary (Unaudited)† | Value (%) |
Education | 22.0 |
Medical | 19.5 |
Water | 17.9 |
General Obligation | 15.5 |
Special Tax | 7.1 |
Utilities | 2.4 |
Nursing Homes | 2.4 |
Student Loan | 2.3 |
Development | 2.0 |
Transportation | 1.6 |
Power | 1.6 |
Airport | 1.4 |
Pollution | .8 |
Tobacco Settlement | .8 |
Health Care | .8 |
98.1 |
† Based on net assets.
See notes to financial statements.
16
Summary of Abbreviations(Unaudited) | |||
ABAG | Association of Bay Area Governments | ACA | American Capital Access |
AGC | ACE Guaranty Corporation | AGIC | Asset Guaranty Insurance Company |
AMBAC | American Municipal Bond Assurance Corporation | ARRN | Adjustable Rate Receipt Notes |
BAN | Bond Anticipation Notes | BPA | Bond Purchase Agreement |
CIFG | CDC Ixis Financial Guaranty | COP | Certificate of Participation |
CP | Commercial Paper | DRIVERS | Derivative Inverse Tax-Exempt Receipts |
EDR | Economic Development Revenue | EIR | Environmental Improvement Revenue |
EURIBOR | Euro Interbank Offered Rate | FGIC | Financial Guaranty Insurance Company |
FHA | Federal Housing Administration | FHLB | Federal Home Loan Bank |
FHLMC | Federal Home Loan Mortgage Corporation | FNMA | Federal National Mortgage Association |
GAN | Grant Anticipation Notes | GIC | Guaranteed Investment Contract |
GNMA | Government National Mortgage Association | GO | General Obligation |
HR | Hospital Revenue | IDB | Industrial Development Board |
IDC | Industrial Development Corporation | IDR | Industrial Development Revenue |
LIBOR | London Interbank Offered Rate | LIFERS | Long Inverse Floating Exempt Receipts |
LOC | Letter of Credit | LOR | Limited Obligation Revenue |
LR | Lease Revenue | MERLOTS | Municipal Exempt Receipts Liquidity Option Tender |
MFHR | Multi-Family Housing Revenue | MFMR | Multi-Family Mortgage Revenue |
MUNIPSA | Securities Industry and Financial Markets Association Municipal Swap Index Yield | PCR | Pollution Control Revenue |
PILOT | Payment in Lieu of Taxes | P-FLOATS | Puttable Floating Option Tax-Exempt Receipts |
PUTTERS | Puttable Tax-Exempt Receipts | RAC | Revenue Anticipation Certificates |
RAN | Revenue Anticipation Notes | RAW | Revenue Anticipation Warrants |
RIB | Residual Interest Bonds | ROCS | Reset Options Certificates |
RRR | Resources Recovery Revenue | SAAN | State Aid Anticipation Notes |
SBPA | Standby Bond Purchase Agreement | SFHR | Single Family Housing Revenue |
SFMR | Single Family Mortgage Revenue | SOFRRATE | Secured Overnight Financing Rate |
SONYMA | State of New York Mortgage Agency | SPEARS | Short Puttable Exempt Adjustable Receipts |
SWDR | Solid Waste Disposal Revenue | TAN | Tax Anticipation Notes |
TAW | Tax Anticipation Warrants | TRAN | Tax and Revenue Anticipation Notes |
XLCA | XL Capital Assurance | ||
See notes to financial statements.
17
STATEMENT OF ASSETS AND LIABILITIES
April 30, 2019
|
|
|
|
|
|
|
|
|
| Cost |
| Value |
|
Assets ($): |
|
|
|
| ||
Investments in securities—See Statement of Investments | 195,357,809 |
| 200,899,788 |
| ||
Cash |
|
|
|
| 1,470,373 |
|
Interest receivable |
| 2,732,128 |
| |||
Receivable for shares of Beneficial Interest subscribed |
| 94,479 |
| |||
Prepaid expenses |
|
|
|
| 37,145 |
|
|
|
|
|
| 205,233,913 |
|
Liabilities ($): |
|
|
|
| ||
Due to BNY Mellon Investment Adviser, Inc. and affiliates—Note 3(c) |
| 136,028 |
| |||
Payable for shares of Beneficial Interest redeemed |
| 266,394 |
| |||
Trustees fees and expenses payable |
| 4,443 |
| |||
Accrued expenses |
|
|
|
| 79,245 |
|
|
|
|
|
| 486,110 |
|
Net Assets ($) |
|
| 204,747,803 |
| ||
Composition of Net Assets ($): |
|
|
|
| ||
Paid-in capital |
|
|
|
| 201,688,940 |
|
Total distributable earnings (loss) |
|
|
|
| 3,058,863 |
|
Net Assets ($) |
|
| 204,747,803 |
| ||
Net Asset Value Per Share | Class A | Class C | Class I | Class Y | Class Z |
|
Net Assets ($) | 118,061,703 | 3,711,814 | 9,869,051 | 380,006 | 72,725,229 |
|
Shares Outstanding | 10,156,686 | 319,788 | 848,998 | 32,702 | 6,257,634 |
|
Net Asset Value Per Share ($) | 11.62 | 11.61 | 11.62 | 11.62 | 11.62 |
|
|
|
|
|
|
|
|
See notes to financial statements. |
|
|
|
|
|
|
18
STATEMENT OF OPERATIONS
Year Ended April 30, 2019
|
|
|
|
|
|
|
|
|
|
|
|
|
|
Investment Income ($): |
|
|
|
| ||
Interest Income |
|
| 7,338,910 |
| ||
Expenses: |
|
|
|
| ||
Management fee—Note 3(a) |
|
| 1,159,551 |
| ||
Shareholder servicing costs—Note 3(c) |
|
| 437,927 |
| ||
Professional fees |
|
| 86,639 |
| ||
Registration fees |
|
| 59,466 |
| ||
Distribution fees—Note 3(b) |
|
| 29,620 |
| ||
Trustees’ fees and expenses—Note 3(d) |
|
| 18,238 |
| ||
Prospectus and shareholders’ reports |
|
| 13,579 |
| ||
Custodian fees—Note 3(c) |
|
| 5,121 |
| ||
Loan commitment fees—Note 2 |
|
| 4,356 |
| ||
Miscellaneous |
|
| 50,110 |
| ||
Total Expenses |
|
| 1,864,607 |
| ||
Less—reduction in fees due to earnings credits—Note 3(c) |
|
| (4,125) |
| ||
Net Expenses |
|
| 1,860,482 |
| ||
Investment Income—Net |
|
| 5,478,428 |
| ||
Realized and Unrealized Gain (Loss) on Investments—Note 4 ($): |
|
| ||||
Net realized gain (loss) on investments | 1,161,877 |
| ||||
Net unrealized appreciation (depreciation) on investments |
|
| 3,783,541 |
| ||
Net Realized and Unrealized Gain (Loss) on Investments |
|
| 4,945,418 |
| ||
Net Increase in Net Assets Resulting from Operations |
| 10,423,846 |
| |||
|
|
|
|
|
|
|
See notes to financial statements. | ||||||
19
STATEMENT OF CHANGES IN NET ASSETS
|
|
|
| Year Ended April 30, | |||||
|
|
|
| 2019 |
| 2018a |
| ||
Operations ($): |
|
|
|
|
|
|
|
| |
Investment income—net |
|
| 5,478,428 |
|
|
| 6,419,273 |
| |
Net realized gain (loss) on investments |
| 1,161,877 |
|
|
| 1,126,179 |
| ||
Net unrealized appreciation (depreciation) |
| 3,783,541 |
|
|
| (7,543,854) |
| ||
Net Increase (Decrease) in Net Assets | 10,423,846 |
|
|
| 1,598 |
| |||
Distributions ($): |
| ||||||||
Distributions to shareholders: |
|
|
|
|
|
|
|
| |
Class A |
|
| (3,085,817) |
|
|
| (3,607,700) |
| |
Class C |
|
| (67,603) |
|
|
| (146,628) |
| |
Class I |
|
| (247,675) |
|
|
| (335,706) |
| |
Class Y |
|
| (11,396) |
|
|
| (19,811) |
| |
Class Z |
|
| (2,044,220) |
|
|
| (2,347,352) |
| |
Total Distributions |
|
| (5,456,711) |
|
|
| (6,457,197) |
| |
Beneficial Interest Transactions ($): |
| ||||||||
Net proceeds from shares sold: |
|
|
|
|
|
|
|
| |
Class A |
|
| 2,740,550 |
|
|
| 6,803,165 |
| |
Class C |
|
| 275,112 |
|
|
| 100,729 |
| |
Class I |
|
| 3,921,751 |
|
|
| 3,338,821 |
| |
Class Z |
|
| 547,915 |
|
|
| 917,766 |
| |
Distributions reinvested: |
|
|
|
|
|
|
|
| |
Class A |
|
| 2,406,924 |
|
|
| 2,790,138 |
| |
Class C |
|
| 53,061 |
|
|
| 118,550 |
| |
Class I |
|
| 239,282 |
|
|
| 297,977 |
| |
Class Z |
|
| 1,520,955 |
|
|
| 1,778,386 |
| |
Cost of shares redeemed: |
|
|
|
|
|
|
|
| |
Class A |
|
| (17,893,779) |
|
|
| (23,445,474) |
| |
Class C |
|
| (1,215,169) |
|
|
| (6,216,701) |
| |
Class I |
|
| (4,137,326) |
|
|
| (6,264,066) |
| |
Class Y |
|
| (66,457) |
|
|
| (361,970) |
| |
Class Z |
|
| (9,379,082) |
|
|
| (8,874,952) |
| |
Increase (Decrease) in Net Assets | (20,986,263) |
|
|
| (29,017,631) |
| |||
Total Increase (Decrease) in Net Assets | (16,019,128) |
|
|
| (35,473,230) |
| |||
Net Assets ($): |
| ||||||||
Beginning of Period |
|
| 220,766,931 |
|
|
| 256,240,161 |
| |
End of Period |
|
| 204,747,803 |
|
|
| 220,766,931 |
| |
20
|
|
|
| Year Ended April 30, | |||||
|
|
|
| 2019 |
| 2018a |
| ||
Capital Share Transactions (Shares): |
| ||||||||
Class Ab,c |
|
|
|
|
|
|
|
| |
Shares sold |
|
| 239,501 |
|
|
| 583,553 |
| |
Shares issued for distributions reinvested |
|
| 210,206 |
|
|
| 240,055 |
| |
Shares redeemed |
|
| (1,563,580) |
|
|
| (2,014,460) |
| |
Net Increase (Decrease) in Shares Outstanding | (1,113,873) |
|
|
| (1,190,852) |
| |||
Class Cb |
|
|
|
|
|
|
|
| |
Shares sold |
|
| 23,906 |
|
|
| 8,640 |
| |
Shares issued for distributions reinvested |
|
| 4,642 |
|
|
| 10,183 |
| |
Shares redeemed |
|
| (106,440) |
|
|
| (534,836) |
| |
Net Increase (Decrease) in Shares Outstanding | (77,892) |
|
|
| (516,013) |
| |||
Class Ic |
|
|
|
|
|
|
|
| |
Shares sold |
|
| 342,579 |
|
|
| 287,868 |
| |
Shares issued for distributions reinvested |
|
| 20,893 |
|
|
| 25,621 |
| |
Shares redeemed |
|
| (362,847) |
|
|
| (540,176) |
| |
Net Increase (Decrease) in Shares Outstanding | 625 |
|
|
| (226,687) |
| |||
Class Yc |
|
|
|
|
|
|
|
| |
Shares redeemed |
|
| (5,776) |
|
|
| (31,185) |
| |
Net Increase (Decrease) in Shares Outstanding | (5,776) |
|
|
| (31,185) |
| |||
Class Z |
|
|
|
|
|
|
|
| |
Shares sold |
|
| 47,964 |
|
|
| 79,288 |
| |
Shares issued for distributions reinvested |
|
| 132,846 |
|
|
| 153,038 |
| |
Shares redeemed |
|
| (820,863) |
|
|
| (759,908) |
| |
Net Increase (Decrease) in Shares Outstanding | (640,053) |
|
|
| (527,582) |
| |||
|
|
|
|
|
|
|
|
|
|
aDistributions to shareholders include only distributions from investment income—net. | |||||||||
bDuring the period ended April 30, 2019, 766 Class C shares representing $8,703 were automatically converted to 766 Class A shares. During the period ended April 30, 2018, 57,810 Class C shares representing $673,904 were automatically converted to 57,747 Class A shares. | |||||||||
cDuring the period ended April 30, 2018, 14,609 Class A shares representing $171,072 were exchanged for 14,609 Class I shares, 7,671 Class C shares representing $90,633 were exchanged for 7,661 Class A shares and 22,564 Class Y shares representing $261,971 were exchanged for 22,564 Class I shares. | |||||||||
See notes to financial statements. | |||||||||
21
FINANCIAL HIGHLIGHTS
The following tables describe the performance for each share class for the fiscal periods indicated. All information (except portfolio turnover rate) reflects financial results for a single fund share. Total return shows how much your investment in the fund would have increased (or decreased) during each period, assuming you had reinvested all dividends and distributions. These figures have been derived from the fund’s financial statements.
Year Ended April 30, | ||||||||||
Class A Shares | 2019 | 2018 | 2017 | 2016 | 2015 | |||||
Per Share Data ($): | ||||||||||
Net asset value, beginning of period | 11.35 | 11.68 | 12.10 | 11.88 | 11.67 | |||||
Investment Operations: | ||||||||||
Investment income—neta | .29 | .30 | .32 | .34 | .34 | |||||
Net realized and unrealized | .27 | (.32) | (.42) | .21 | .21 | |||||
Total from Investment Operations | .56 | (.02) | (.10) | .55 | .55 | |||||
Distributions: | ||||||||||
Dividends from investment | (.29) | (.31) | (.32) | (.33) | (.34) | |||||
Net asset value, end of period | 11.62 | 11.35 | 11.68 | 12.10 | 11.88 | |||||
Total Return (%)b | 4.98 | (.24) | (.87) | 4.75 | 4.72 | |||||
Ratios/Supplemental Data (%): | ||||||||||
Ratio of total expenses | .95 | .94 | .93 | .91 | .92 | |||||
Ratio of net expenses | .95 | .94 | .93 | .91 | .92 | |||||
Ratio of net investment income | 2.53 | 2.61 | 2.66 | 2.82 | 2.83 | |||||
Portfolio Turnover Rate | 4.84 | 10.71 | 9.93 | 9.75 | 8.44 | |||||
Net Assets, end of period ($ x 1,000) | 118,062 | 127,921 | 145,523 | 167,984 | 173,909 | |||||
a Based on average shares outstanding.
b Exclusive of sales charge.
See notes to financial statements.
22
Year Ended April 30, | ||||||||||||||
Class C Shares | 2019 | 2018 | 2017 | 2016 | 2015 | |||||||||
Per Share Data ($): | ||||||||||||||
Net asset value, beginning of period | 11.33 | 11.66 | 12.08 | 11.86 | 11.66 | |||||||||
Investment Operations: | ||||||||||||||
Investment income—neta | .20 | .21 | .23 | .24 | .25 | |||||||||
Net realized and unrealized | .28 | (.33) | (.43) | .22 | .20 | |||||||||
Total from Investment Operations | .48 | (.12) | (.20) | .46 | .45 | |||||||||
Distributions: | ||||||||||||||
Dividends from investment | (.20) | (.21) | (.22) | (.24) | (.25) | |||||||||
Net asset value, end of period | 11.61 | 11.33 | 11.66 | 12.08 | 11.86 | |||||||||
Total Return (%)b | 4.23 | (1.02) | (1.63) | 3.96 | 3.84 | |||||||||
Ratios/Supplemental Data (%): | ||||||||||||||
Ratio of total expenses | 1.75 | 1.71 | 1.69 | 1.68 | 1.68 | |||||||||
Ratio of net expenses | 1.75 | 1.70 | 1.69 | 1.68 | 1.68 | |||||||||
Ratio of net investment income | 1.72 | 1.82 | 1.89 | 2.06 | 2.07 | |||||||||
Portfolio Turnover Rate | 4.84 | 10.71 | 9.93 | 9.75 | 8.44 | |||||||||
Net Assets, end of period ($ x 1,000) | 3,712 | 4,507 | 10,653 | 11,919 | 11,361 | |||||||||
a Based on average shares outstanding.
b Exclusive of sales charge.
See notes to financial statements.
23
FINANCIAL HIGHLIGHTS (continued)
Year Ended April 30, | |||||||||
Class I Shares | 2019 | 2018 | 2017 | 2016 | 2015 | ||||
Per Share Data ($): | |||||||||
Net asset value, beginning of period | 11.35 | 11.68 | 12.10 | 11.88 | 11.67 | ||||
Investment Operations: | |||||||||
Investment income—neta | .31 | .33 | .34 | .36 | .36 | ||||
Net realized and unrealized | .27 | (.33) | (.42) | .22 | .22 | ||||
Total from Investment Operations | .58 | .00b | (.08) | .58 | .58 | ||||
Distributions: | |||||||||
Dividends from investment | (.31) | (.33) | (.34) | (.36) | (.37) | ||||
Net asset value, end of period | 11.62 | 11.35 | 11.68 | 12.10 | 11.88 | ||||
Total Return (%) | 5.22 | .00c | (.64) | 5.01 | 4.97 | ||||
Ratios/Supplemental Data (%): | |||||||||
Ratio of total expenses | .72 | .70 | .69 | .67 | .67 | ||||
Ratio of net expenses | .72 | .70 | .69 | .67 | .67 | ||||
Ratio of net investment income | 2.76 | 2.84 | 2.90 | 3.06 | 3.08 | ||||
Portfolio Turnover Rate | 4.84 | 10.71 | 9.93 | 9.75 | 8.44 | ||||
Net Assets, end of period ($ x 1,000) | 9,869 | 9,629 | 12,555 | 9,794 | 7,408 | ||||
a Based on average shares outstanding.
b Amount represents less than $.01 per share.
c Amount represents less than .01% per share.
See notes to financial statements.
24
Year Ended April 30, | ||||||||||||||||||
Class Y Shares | 2019 | 2018 | 2017 | 2016 | 2015 | |||||||||||||
Per Share Data ($): | ||||||||||||||||||
Net asset value, beginning of period | 11.35 | 11.68 | 12.10 | 11.88 | 11.68 | |||||||||||||
Investment Operations: | ||||||||||||||||||
Investment income—neta | .32 | .34 | .34 | .37 | .39 | |||||||||||||
Net realized and unrealized | .27 | (.33) | (.41) | .22 | .18 | |||||||||||||
Total from Investment Operations | .59 | .01 | (.07) | .59 | .57 | |||||||||||||
Distributions: | ||||||||||||||||||
Dividends from investment | (.32) | (.34) | (.35) | (.37) | (.37) | |||||||||||||
Net asset value, end of period | 11.62 | 11.35 | 11.68 | 12.10 | 11.88 | |||||||||||||
Total Return (%) | 5.26 | .03 | (.60) | 5.04 | 4.89 | |||||||||||||
Ratios/Supplemental Data (%): | ||||||||||||||||||
Ratio of total expenses | .68 | .66 | .65 | .64 | .65 | |||||||||||||
Ratio of net expenses | .68 | .66 | .65 | .64 | .65 | |||||||||||||
Ratio of net investment income | 2.79 | 2.87 | 2.93 | 3.11 | 3.07 | |||||||||||||
Portfolio Turnover Rate | 4.84 | 10.71 | 9.93 | 9.75 | 8.44 | |||||||||||||
Net Assets, end of period ($ x 1,000) | 380 | 437 | 813 | 1,614 | 2,506 | |||||||||||||
a Based on average shares outstanding.
See notes to financial statements.
25
FINANCIAL HIGHLIGHTS (continued)
Year Ended April 30, | ||||||||
Class Z Shares | 2019 | 2018 | 2017 | 2016 | 2015 | |||
Per Share Data ($): | ||||||||
Net asset value, beginning of period | 11.35 | 11.68 | 12.10 | 11.87 | 11.67 | |||
Investment Operations: | ||||||||
Investment income—neta | .31 | .33 | .34 | .36 | .36 | |||
Net realized and unrealized | .27 | (.33) | (.42) | .23 | .20 | |||
Total from Investment Operations | .58 | .00 | (.08) | .59 | .56 | |||
Distributions: | ||||||||
Dividends from investment | (.31) | (.33) | (.34) | (.36) | (.36) | |||
Net asset value, end of period | 11.62 | 11.35 | 11.68 | 12.10 | 11.87 | |||
Total Return (%) | 5.21 | .07 | (.74) | 5.05 | 4.85 | |||
Ratios/Supplemental Data (%): | ||||||||
Ratio of total expenses | .75 | .70 | .71 | .71 | .70 | |||
Ratio of net expenses | .75 | .70 | .71 | .71 | .70 | |||
Ratio of net investment income | 2.74 | 2.83 | 2.88 | 3.03 | 3.04 | |||
Portfolio Turnover Rate | 4.84 | 10.71 | 9.93 | 9.75 | 8.44 | |||
Net Assets, end of period ($ x 1,000) | 72,725 | 78,274 | 86,696 | 94,240 | 99,626 | |||
a Based on average shares outstanding.
See notes to financial statements.
26
NOTES TO FINANCIAL STATEMENTS
NOTE 1—Significant Accounting Policies:
BNY Mellon Connecticut Fund (the “fund”) is a separate non-diversified series of BNY Mellon State Municipal Bond Funds (the “Company”), which is registered under the Investment Company Act of 1940, as amended (the “Act”), as an open-end management investment company and operates as a series company currently offering three series, including the fund. The fund’s investment objective is to seek to maximize current income exempt from federal income tax and from Connecticut state income tax, without undue risk. BNY Mellon Investment Adviser, Inc. (the “Adviser”), a wholly-owned subsidiary of The Bank of New York Mellon Corporation (“BNY Mellon”), serves as the fund’s investment adviser.
Effective June 3, 2019, the fund changed its name from Dreyfus Connecticut Fund to BNY Mellon Connecticut Fund and the Company changed its name from Dreyfus State Municipal Bond Funds to BNY Mellon State Municipal Bond Funds. In addition, The Dreyfus Corporation, the fund’s investment adviser and administrator, changed its name to “BNY Mellon Investment Adviser, Inc.”, MBSC Securities Corporation, the fund’s distributor, changed its name to “BNY Mellon Securities Corporation” and Dreyfus Transfer, Inc., the fund’s transfer agent, changed its name to “BNY Mellon Transfer, Inc.”
BNY Mellon Securities Corporation (the “Distributor”), a wholly-owned subsidiary of the Adviser, is the distributor of the fund’s shares. The fund is authorized to issue an unlimited number of $.001 par value shares of Beneficial Interest in each of the following classes of shares: Class A, Class C, Class I, Class T, Class Y and Class Z. Class A and Class T shares generally are subject to a sales charge imposed at the time of purchase. Class C shares are subject to a contingent deferred sales charge (“CDSC”) imposed on Class C shares redeemed within one year of purchase. Class C shares automatically convert to Class A shares ten years after the date of purchase, without the imposition of a sales charge. Class I and Class Y shares are sold at net asset value per share generally to institutional investors. Class Z shares are sold at net asset value per share to certain shareholders of the fund. Class Z shares generally are not available for new accounts. As of the date of this report, the fund did not offer Class T shares for purchase. Other differences between the classes include the services offered to and the expenses borne by each class, the allocation of certain transfer agency costs, and certain voting rights. Income, expenses (other than expenses attributable to a specific class), and realized and unrealized gains or losses on investments are allocated to each class of shares based on its relative net assets.
27
NOTES TO FINANCIAL STATEMENTS(continued)
The Company accounts separately for the assets, liabilities and operations of each series. Expenses directly attributable to each series are charged to that series’ operations; expenses which are applicable to all series are allocated among them on a pro rata basis.
The Financial Accounting Standards Board (“FASB”) Accounting Standards Codification is the exclusive reference of authoritative U.S. generally accepted accounting principles (“GAAP”) recognized by the FASB to be applied by nongovernmental entities. Rules and interpretive releases of the Securities and Exchange Commission (“SEC”) under authority of federal laws are also sources of authoritative GAAP for SEC registrants. The fund’s financial statements are prepared in accordance with GAAP, which may require the use of management estimates and assumptions. Actual results could differ from those estimates.
The Companyenters into contracts that contain a variety of indemnifications. The fund’s maximum exposure under these arrangements is unknown. The fund does not anticipate recognizing any loss related to these arrangements.
(a) Portfolio valuation: The fair value of a financial instrument is the amount that would be received to sell an asset or paid to transfer a liability in an orderly transaction between market participants at the measurement date (i.e., the exit price). GAAP establishes a fair value hierarchy that prioritizes the inputs of valuation techniques used to measure fair value. This hierarchy gives the highest priority to unadjusted quoted prices in active markets for identical assets or liabilities (Level 1 measurements) and the lowest priority to unobservable inputs (Level 3 measurements).
Additionally, GAAP provides guidance on determining whether the volume and activity in a market has decreased significantly and whether such a decrease in activity results in transactions that are not orderly. GAAP requires enhanced disclosures around valuation inputs and techniques used during annual and interim periods.
Various inputs are used in determining the value of the fund’s investments relating to fair value measurements. These inputs are summarized in the three broad levels listed below:
Level 1—unadjusted quoted prices in active markets for identical investments.
Level 2—other significant observable inputs (including quoted prices for similar investments, interest rates, prepayment speeds, credit risk, etc.).
Level 3—significant unobservable inputs (including the fund’s own assumptions in determining the fair value of investments).
28
The inputs or methodology used for valuing securities are not necessarily an indication of the risk associated with investing in those securities.
Changes in valuation techniques may result in transfers in or out of an assigned level within the disclosure hierarchy. Valuation techniques used to value the fund’s investments are as follows:
Investments in securities are valued each business day by an independent pricing service (the “Service”) approved by the Company’s Board of Trustees (the “Board”). Investments for which quoted bid prices are readily available and are representative of the bid side of the market in the judgment of the Service are valued at the mean between the quoted bid prices (as obtained by the Service from dealers in such securities) and asked prices (as calculated by the Service based upon its evaluation of the market for such securities). Other investments (which constitute a majority of the portfolio securities) are carried at fair value as determined by the Service, based on methods which include consideration of the following: yields or prices of municipal securities of comparable quality, coupon, maturity and type; indications as to values from dealers; and general market conditions. All of the preceding securities are generally categorized within Level 2 of the fair value hierarchy.
The Service is engaged under the general oversight of the Board.
When market quotations or official closing prices are not readily available, or are determined not to accurately reflect fair value, such as when the value of a security has been significantly affected by events after the close of the exchange or market on which the security is principally traded, but before the fund calculates its net asset value, the fund may value these investments at fair value as determined in accordance with the procedures approved by the Board. Certain factors may be considered when fair valuing investments such as: fundamental analytical data, the nature and duration of restrictions on disposition, an evaluation of the forces that influence the market in which the securities are purchased and sold, and public trading in similar securities of the issuer or comparable issuers. These securities are either categorized within Level 2 or 3 of the fair value hierarchy depending on the relevant inputs used.
For restricted securities where observable inputs are limited, assumptions about market activity and risk are used and such securities are generally categorized within Level 3 of the fair value hierarchy.
29
NOTES TO FINANCIAL STATEMENTS(continued)
The following is a summary of the inputs used as of April 30, 2019in valuing the fund’s investments:
Level 1 - Unadjusted Quoted Prices | Level 2 - Other Significant Observable Inputs | Level 3 -Significant Unobservable Inputs | Total | |
Assets ($) |
|
|
|
|
Investments in Securities: | ||||
Municipal Bonds† | - | 200,899,788 | - | 200,899,788 |
† See Statement of Investments for additional detailed categorizations.
At April 30, 2019, there were no transfers between levels of the fair value hierarchy. It is the fund’s policy to recognize transfers between levels at the end of the reporting period.
(b) Securities transactions and investment income: Securities transactions are recorded on a trade date basis. Realized gains and losses from securities transactions are recorded on the identified cost basis. Interest income, adjusted for accretion of discount and amortization of premium on investments, is earned from settlement date and recognized on the accrual basis. Securities purchased or sold on a when issued or delayed delivery basis may be settled a month or more after the trade date.
The fund follows an investment policy of investing primarily in municipal obligations of one state. Economic changes affecting the state and certain of its public bodies and municipalities may affect the ability of issuers within the state to pay interest on, or repay principal of, municipal obligations held by the fund.
(c) Dividends and distributions to shareholders:It is the policy of the fund to declare dividends daily from investment income-net. Such dividends are paid monthly. Dividends from net realized capital gains, if any, are normally declared and paid annually, but the fund may make distributions on a more frequent basis to comply with the distribution requirements of the Internal Revenue Code of 1986, as amended (the “Code”). To the extent that net realized capital gains can be offset by capital loss carryovers, it is the policy of the fund not to distribute such gains. Income and capital gain distributions are determined in accordance with income tax regulations, which may differ from GAAP.
(d) Federal income taxes: It is the policy of the fund to continue to qualify as a regulated investment company, which can distribute tax-exempt dividends, by complying with the applicable provisions of the Code, and to make distributions of income and net realized capital gain sufficient to relieve it from substantially all federal income and excise taxes.
30
As of and during the period ended April 30, 2019, the fund did not have any liabilities for any uncertain tax positions. The fund recognizes interest and penalties, if any, related to uncertain tax positions as income tax expense in the Statement of Operations. During the period ended April 30, 2019, the fund did not incur any interest or penalties.
Each tax year in the four-year period ended April 30, 2019 remains subject to examination by the Internal Revenue Service and state taxing authorities.
At April 30, 2019, the components of accumulated earnings on a tax basis were as follows: undistributed tax-exempt income $386,321, accumulated capital losses $2,497,595 and unrealized appreciation $5,556,458.
The fund is permitted to carry forward capital losses for an unlimited period. Furthermore, capital loss carryovers retain their character as either short-term or long-term capital losses.
The accumulated capital loss carryover is available for federal income tax purposes to be applied against future netrealized capital gains, if any, realized subsequent to April 30, 2019. The fund has $2,359,815 of short-term capital losses and $137,780 of long-term capital losses which can be carried forward for an unlimited period.
The tax character of distributions paid to shareholders during the fiscal periods ended April 30, 2019 and April 30, 2018 were as follows: tax-exempt income $5,456,711 and $6,453,277 and ordinary income $0 and $3,920, respectively.
(e) New Accounting Pronouncements: In March 2017, the FASB issued Accounting Standards Update 2017-08, Receivables—Nonrefundable Fees and Other Costs (Subtopic 310-20): Premium Amortization On Purchased Callable Debt Securities (“ASU 2017-08”). The update shortens the amortization period for the premium on certain purchased callable debt securities to the earliest call date. ASU 2017-08 will be effective for fiscal years beginning after December 15, 2018.
Also in August 2018, the FASB issued Accounting Standards Update 2018-13, Fair Value Measurement (Topic 820): Disclosure Framework—Changes to the Disclosure Requirements for Fair Value Measurement (“ASU 2018-13”). The update provides guidance that modifies certain disclosure requirements for fair value measurements. ASU 2018-13 will be effective for fiscal years beginning after December 15, 2019. Management is currently assessing the potential impact of these changes to future financial statements.
31
NOTES TO FINANCIAL STATEMENTS(continued)
NOTE 2—Bank Lines of Credit:
The fund participates with other long-term open-end funds managed by the Adviser in a $1.030 billion unsecured credit facility led by Citibank, N.A. (the “Citibank Credit Facility”) and a $300 million unsecured credit facility provided by The Bank of New York Mellon (the “BNYM Credit Facility”), a subsidiary of BNY Mellon and an affiliate of the Adviser, each to be utilized primarily for temporary or emergency purposes, including the financing of redemptions (each, a “Facility”). The Citibank Credit Facility is available in two tranches: (i) Tranche A is in an amount equal to $830 million and is available to all long-term open-ended funds, including the fund, and (ii) Tranche B is in amount equal to $200 million and is available only to BNY Mellon Floating Rate Income Fund, a series of BNY Mellon Investment Funds IV, Inc. Prior to October 3, 2018, the unsecured credit facility with Citibank, N.A. was $830 million. In connection therewith, the fund has agreed to pay its pro rata portion of commitment fees for Tranche A of the Citibank Credit Facility and the BNYM Credit Facility. Interest is charged to the fund based on rates determined pursuant to the terms of the respective Facility at the time of borrowing. During the period ended April 30, 2019, the fund did not borrow under the Facilities.
NOTE 3—Management Fee and Other Transactions with Affiliates:
(a)Pursuant to a management agreement with the Adviser, the management fee is computed at the annual rate of .55% of the value of the fund’s average daily net assets and is payable monthly.
During the period ended April 30, 2019, the Distributor retained $1,504 from commissions earned on sales of the fund’s Class A shares.
(b) Under the Distribution Plan adopted pursuant to Rule 12b-1 under the Act, Class C shares pay the Distributor for distributing its shares at an annual rate of .75% of the value of its average daily net assets. During the period ended April 30, 2019, Class C shares were charged $29,620 pursuant to the Distribution Plan.
(c)Under the Shareholder Services Plan, Class A and Class C shares pay the Distributor at an annual rate of .25% of the value of their average daily net assets for the provision of certain services. The services provided may include personal services relating to shareholder accounts, such as answering shareholder inquiries regarding the fund and providing reports and other information, and services related to the maintenance of shareholder accounts. The Distributor may make payments to Service Agents (securities dealers, financial institutions or other industry professionals) with respect to these services. The Distributor determines
32
the amounts to be paid to Service Agents. During the period ended April 30, 2019, Class A and Class C shares were charged $306,677and $9,873, respectively, pursuant to the Shareholder Services Plan.
Under the Shareholder Services Plan, Class Z shares reimburse the Distributor at an amount not to exceed an annual rate of .25% of the value of Class Z shares’ average daily net assets for the provision of certain services. The services provided may include personal services relating to shareholder accounts, such as answering shareholder inquiries regarding Class Z shares and providing reports and other information, and services related to the maintenance of shareholder accounts. During the period ended April 30, 2019,Class Z shares were charged $38,007 pursuant to the Shareholder Services Plan.
The fund has arrangements with the transfer agent and the custodian whereby the fund may receive earnings credits when positive cash balances are maintained, which are used to offset transfer agency and custody fees. For financial reporting purposes, the fund includes net earnings credits, if any, as an expense offset in the Statement of Operations.
The fund compensates BNY Mellon Transfer, Inc., a wholly-owned subsidiary of the Adviser, under a transfer agency agreement for providing transfer agency and cash management services for the fund. The majority of transfer agency fees are comprised of amounts paid on a per account basis, while cash management fees are related to fund subscriptions and redemptions. During the period ended April 30, 2019, the fund was charged $45,641 for transfer agency services. These fees are included in Shareholder servicing costs in the Statement of Operations.
The fund compensates The Bank of New York Mellon under a custody agreement for providing custodial services for the fund. These fees are determined based on net assets, geographic region and transaction activity. During the period ended April 30, 2019, the fund was charged $5,121 pursuant to the custody agreement. These fees were partially offset by earnings credits of $4,109.
The fund compensates The Bank of New York Mellon under a shareholder redemption draft processing agreement for providing certain services related to the fund’s check writing privilege. During the period ended April 30, 2019, the fund was charged $1,980 pursuant to the agreement, which is included in Shareholder servicing costs in the Statement of Operations. These fees were partially offset by earnings credit of $16.
33
NOTES TO FINANCIAL STATEMENTS(continued)
During the period ended April 30, 2019, the fund was charged $12,173 for services performed by the Chief Compliance Officer and his staff. These fees are included in Miscellaneous in the Statement of Operations.
The components of “Due to BNY Mellon Investment Adviser, Inc. and affiliates” in the Statement of Assets and Liabilities consist of: management fees $92,527, Distribution Plan fees $2,242, Shareholder Services Plan fees $25,066, custodian fees $944, Chief Compliance Officer fees $6,790 and transfer agency fees $8,459.
(d) Each Board member also serves as a Board member of other funds in the BNY Mellon Family of Funds complex. Annual retainer fees and attendance fees are allocated to each fund based on net assets.
NOTE 4—Securities Transactions:
The aggregate amount of purchases and sales of investment securities, excluding short-term securities, during the period ended April 30, 2019, amounted to $10,077,328 and $30,540,169, respectively.
At April 30, 2019, the cost of investments for federal income tax purposes was $195,343,330; accordingly, accumulated net unrealized appreciation on investments was $5,556,458, consisting of $6,494,544 gross unrealized appreciation and $938,086 gross unrealized depreciation.
34
REPORT OF INDEPENDENT REGISTERED PUBLIC ACCOUNTING FIRM
To the Shareholders and the Board of Trustees of BNY Mellon Connecticut Fund (formerly, Dreyfus Connecticut Fund)
Opinion on the Financial Statements
We have audited the accompanying statement of assets and liabilities of BNY Mellon Connecticut Fund (the “Fund”) (formerly, Dreyfus Connecticut Fund) (one of the funds constituting BNY Mellon State Municipal Bond Funds), including the statement of investments, as of April 30, 2019, and the related statement of operations for the year then ended, the statements of changes in net assets for each of the two years in the period then ended, the financial highlights for each of the five years in the period then ended and the related notes (collectively referred to as the “financial statements”). In our opinion, the financial statements present fairly, in all material respects, the financial position of the Fund (one of the funds constituting BNY Mellon State Municipal Bond Funds) at April 30, 2019, the results of its operations for the year then ended, the changes in its net assets for each of the two years in the period then ended and its financial highlights for each of the five years in the period then ended, in conformity with U.S. generally accepted accounting principles.
Basis for Opinion
These financial statements are the responsibility of the Fund’s management. Our responsibility is to express an opinion on the Fund’s financial statements based on our audits. We are a public accounting firm registered with the Public Company Accounting Oversight Board (United States) (“PCAOB”) and are required to be independent with respect to the Fund in accordance with the U.S. federal securities laws and the applicable rules and regulations of the Securities and Exchange Commission and the PCAOB.
We conducted our audits in accordance with the standards of the PCAOB. Those standards require that we plan and perform the audit to obtain reasonable assurance about whether the financial statements are free of material misstatement, whether due to error or fraud. The Fund is not required to have, nor were we engaged to perform, an audit of the Fund’s internal control over financial reporting. As part of our audits, we are required to obtain an understanding of internal control over financial reporting, but not for the purpose of expressing an opinion on the effectiveness of the Fund’s internal control over financial reporting. Accordingly, we express no such opinion.
Our audits included performing procedures to assess the risks of material misstatement of the financial statements, whether due to error or fraud, and performing procedures that respond to those risks. Such procedures included examining, on a test basis, evidence regarding the amounts and disclosures in the financial statements. Our procedures included confirmation of securities owned as of April 30, 2019, by correspondence with the custodian and others or by other appropriate auditing procedures where replies from others were not received. Our audits also included evaluating the accounting principles used and significant estimates made by management, as well as evaluating the overall presentation of the financial statements. We believe that our audits provide a reasonable basis for our opinion.

We have served as the auditor of one or more investment companies in the BNY Mellon Family of Funds since at least 1957, but we are unable to determine the specific year.
New York, New York
June 26, 2019
35
IMPORTANT TAX INFORMATION(Unaudited)
In accordance with federal tax law, the fund hereby reports all the dividends paid from investment income-net during its fiscal year ended April 30, 2019 as “exempt-interest dividends” (not subject to regular federal income tax, and for individuals who are Connecticut residents, Connecticut personal income taxes). Where required by federal tax law rules, shareholders will receive notification of their portion of the fund’s taxable ordinary dividends (if any), capital gains distributions (if any) and tax-exempt dividends paid for the 2019 calendar year on Form 1099-DIV which will be mailed in early 2020.
36
BOARD MEMBERS INFORMATION(Unaudited)
INDEPENDENT BOARD MEMBERS
Chairman of the Board (1995)
Principal Occupation During Past 5 Years:
· Corporate Director and Trustee (1995-present)
Other Public Company Board Memberships During Past 5 Years:
· CBIZ (formerly, Century Business Services, Inc.), a provider of outsourcing functions for small and medium size companies, Director (1997-present)
No. of Portfolios for which Board Member Serves:120
———————
Francine J. Bovich (67)
Board Member (2012)
Principal Occupation During Past 5 Years:
· Trustee, The Bradley Trusts, private trust funds (2011-present)
Other Public Company Board Memberships During Past 5 Years:
· Annaly Capital Management, Inc., a real estate investment trust, Director (2014-present)
No. of Portfolios for which Board Member Serves:69
———————
Peggy C. Davis (76)
Board Member (1990)
Principal Occupation During Past 5 Years:
· Shad Professor of Law, New York University School of Law (1983-present)
No. of Portfolios for which Board Member Serves:44
———————
Diane Dunst (79)
Board Member (2007)
Principal Occupation During Past 5 Years:
· President of Huntting House Antiques (1999-present)
No. of Portfolios for which Board Member Serves:14
———————
37
BOARD MEMBERS INFORMATION (Unaudited) (continued)
INDEPENDENT BOARD MEMBERS (continued)
Nathan Leventhal (76)
Board Member (1989)
Principal Occupation During Past 5 Years:
· President Emeritus of Lincoln Center for the Performing Arts (2001-present)
· Chairman of the Avery Fisher Artist Program (1997-2014)
Other Public Company Board Memberships During Past 5 Years:
· Movado Group, Inc., Director (2003-present)
No. of Portfolios for which Board Member Serves:47
———————
Robin A. Melvin (55)
Board Member (2012)
Principal Occupation During Past 5 Years:
· Co-chairman, Illinois Mentoring Partnership, non-profit organization dedicated to increasing the quantity and quality of mentoring services in Illinois (2014-present; board member since 2013)
No. of Portfolios for which Board Member Serves:98
———————
Once elected, all Board Members serve for an indefinite term, but achieve Emeritus status upon reaching age 80. The address of the Board Members and Officers is c/o BNY Mellon Investment Adviser, Inc. 240 Greenwich Street, New York, New York 10166. Additional information about the Board Member is available in the fund’s Statement of Additional Information which can be obtained from the Adviser free of charge by calling this toll free number: 1-800-373-9387.
Clifford L. Alexander, Jr., Emeritus Board Member
Ernest Kafka, Emeritus Board Member
Daniel Rose, Emeritus Board Member
38
OFFICERS OF THE FUND(Unaudited)
RENEE LAROCHE-MORRIS, President since January 2018.
President and a director of BNY Mellon Investment Adviser, Inc. since January 2018. She is an officer of 62 investment companies (comprised of 120 portfolios) managed by the Adviser. She is 48 years old and has been an employee of BNY Mellon since 2003.
JAMES WINDELS, Treasurer since November 2001.
Director- BNY Mellon Fund Administration, and an officer of 63 investment companies (comprised of 143 portfolios) managed by the Adviser. He is 60 years old and has been an employee of the Adviser since April 1985.
BENNETT A. MACDOUGALL, Chief Legal Officer since October 2015.
Chief Legal Officer of the Adviser and Associate General Counsel and Managing Director of BNY Mellon since June 2015; Director and Associate General Counsel of Deutsche Bank – Asset & Wealth Management Division from June 2005 to June 2015, and as Chief Legal Officer of Deutsche Investment Management Americas Inc. from June 2012 to May 2015. He is an officer of 63 investment companies (comprised of 143 portfolios) managed by the Adviser. He is 47 years old and has been an employee of the Adviser since June 2015.
DAVID DIPETRILLO, Vice President since January 2018.
Head of North America Product, BNY Mellon Investment Management since January 2018, Director of Product Strategy, BNY Mellon Investment Management from January 2016 to December 2017; Head of US Retail Product and Channel Marketing, BNY Mellon Investment Management from January 2014 to December 2015. He is an officer of 62 investment companies (comprised of 120 portfolios) managed by the Adviser. He is 41 years old and has been an employee of BNY Mellon since 2005.
JAMES BITETTO, Vice President since August 2005 and Secretary since February 2018.
Managing Counsel of BNY Mellon and Secretary of the Adviser, and an officer of 63 investment companies (comprised of 143 portfolios) managed by the Adviser. He is 52 years old and has been an employee of the Adviser since December 1996.
SONALEE CROSS, Vice President and Assistant Secretary since March 2018.
Counsel of BNY Mellon since October 2016; Associate at Proskauer Rose LLP from April 2016 to September 2016; Attorney at EnTrust Capital from August 2015 to February 2016; Associate at Sidley Austin LLP from September 2013 to August 2015. She is an officer of 63 investment companies (comprised of 143 portfolios) managed by the Adviser. She is 31 years old and has been an employee of the Adviser since October 2016.
DEIRDRE CUNNANE, Vice President and Assistant Secretary since March 2019.
Counsel of BNY Mellon since August 2018; Senior Regulatory Specialist at BNY Mellon Investment Management Services from February 2016 to August 2018; Trustee Associate at BNY Mellon Trust Company (Ireland) Limited from August 2013 to February 2016. She is an officer of 63 investment companies (comprised of 143 portfolios) managed by the Adviser. She is 28 years old and has been an employee of the Adviser since August 2018.
SARAH S. KELLEHER, Vice President and Assistant Secretary since April 2014.
Managing Counsel of BNY Mellon since December 2017, Senior Counsel of BNY Mellon from March 2013 to December 2017. She is an officer of 63 investment companies (comprised of 143 portfolios) managed by the Adviser. She is 43 years old and has been an employee of the Adviser since March 2013.
JEFF PRUSNOFSKY, Vice President and Assistant Secretary since August 2005.
Senior Managing Counsel of BNY Mellon, and an officer of 63 investment companies (comprised of 143 portfolios) managed by the Adviser. He is 54 years old and has been an employee of the Adviser since October 1990.
PETER M. SULLIVAN, Vice President and Assistant Secretary since March 2019.
Managing Counsel of BNY Mellon, and an officer of 63 investment companies (comprised of 143 portfolios) managed by the Adviser. He is 51 years old and has been an employee of the Adviser since April 2004.
39
OFFICERS OF THE FUND (Unaudited)(continued)
NATALYA ZELENSKY, Vice President and Assistant Secretary since March 2017.
Counsel of BNY Mellon since May 2016; Attorney at Wildermuth Endowment Strategy Fund/Wildermuth Advisory, LLC from November 2015 to May 2016 and Assistant General Counsel at RCS Advisory Services from July 2014 to November 2015. She is an officer of 63 investment companies (comprised of 143 portfolios) managed by the Adviser. She is 34 years old and has been an employee of the Adviser since May 2016.
GAVIN C. REILLY, Assistant Treasurer since December 2005.
Tax Manager of BNY Mellon Fund Administration, and an officer of 63 investment companies (comprised of 143 portfolios) managed by the Adviser. He is 50 years old and has been an employee of the Adviser since April 1991.
ROBERT S. ROBOL, Assistant Treasurer since August 2005.
Senior Accounting Manager- BNY Mellon Fund Administration, and an officer of 63 investment companies (comprised of 143 portfolios) managed by the Adviser. He is 55 years old and has been an employee of the Adviser since October 1988.
ROBERT SALVIOLO, Assistant Treasurer since July 2007.
Senior Accounting Manager – BNY Mellon Fund Administration, and an officer of 63 investment companies (comprised of 143 portfolios) managed by the Adviser. He is 52 years old and has been an employee of the Adviser since June 1989.
ROBERT SVAGNA, Assistant Treasurer since August 2005.
Senior Accounting Manager – BNY Mellon Fund Administration, and an officer of 63 investment companies (comprised of 143 portfolios) managed by the Adviser. He is 52 years old and has been an employee of the Adviser since November 1990.
JOSEPH W. CONNOLLY, Chief Compliance Officer since October 2004.
Chief Compliance Officer of the Adviser, the BNY Mellon Family of Funds and BNY Mellon Funds Trust (63 investment companies, comprised of 143 portfolios). He is 62 years old and has served in various capacities with the Adviser since 1980, including manager of the firm’s Fund Accounting Department from 1997 through October 2001.
CARIDAD M. CAROSELLA, Anti-Money Laundering Compliance Officer since January 2016.
Anti-Money Laundering Compliance Officer of the BNY Mellon Family of Funds and BNY Mellon Funds Trust since January 2016; from May 2015 to December 2015, Interim Anti-Money Laundering Compliance Officer of the BNY Mellon Family of Funds and BNY Mellon Funds Trust and the Distributor; from January 2012 to May 2015, AML Surveillance Officer of the Distributor. She is an officer of 57 investment companies (comprised of 137 portfolios) managed by the Adviser. She is 50 years old and has been an employee of the Distributor since 1997.
40
NOTES
41
BNY Mellon State Municipal Bond Funds, BNY Mellon Connecticut Fund
240 Greenwich Street
New York, NY 10286
Adviser
BNY Mellon Investment Adviser, Inc.
240 Greenwich Street
New York, NY 10286
Custodian
The Bank of New York Mellon
240 Greenwich Street
New York, NY 10286
Transfer Agent &
Dividend Disbursing Agent
BNY Mellon Transfer, Inc.
240 Greenwich Street
New York, NY 10286
Distributor
BNY Mellon Securities Corporation
240 Greenwich Street
New York, NY 10286
Ticker Symbols: | Class A: PSCTX Class C: PMCCX Class I: DTCIX Class Y: DPMYX Class Z: DPMZX |
Telephone Call your financial representative or 1-800-373-9387
Mail The BNY Mellon Family of Funds, 144 Glenn Curtiss Boulevard, Uniondale, NY 11556-0144
E-mailSend your request toinfo@bnymellon.com
InternetInformation can be viewed online or downloaded atwww.bnymellonim.com/us
The fund files its complete schedule of portfolio holdings with the Securities and Exchange Commission (“SEC”) for the first and third quarters of each fiscal year on Form N-PORT. The fund’s Forms N-PORT are available on the SEC’s website atwww.sec.gov.
A description of the policies and procedures that the fund uses to determine how to vote proxies relating to portfolio securities and information regarding how the fund voted these proxies for the most recent 12-month period ended June 30 is available atwww.bnymellonim.com/us and on the SEC’s website atwww.sec.gov and without charge, upon request, by calling 1-800-373-9387.
© 2019 BNY Mellon Securities Corporation |
|

BNY Mellon State Municipal Bond Funds, BNY Mellon Massachusetts Fund
ANNUAL REPORT April 30, 2019 |
Save time. Save paper. View your next shareholder report online as soon as it’s available. Log into www.bnymellonim.com/us and sign up for eCommunications. It’s simple and only takes a few minutes. |
The views expressed in this report reflect those of the portfolio manager(s) only through the end of the period covered and do not necessarily represent the views of BNY Mellon Investment Adviser, Inc. or any other person in the BNY Mellon Investment Adviser, Inc. organization. Any such views are subject to change at any time based upon market or other conditions and BNY Mellon Investment Adviser, Inc. disclaims any responsibility to update such views. These views may not be relied on as investment advice and, because investment decisions for a fund in the BNY Mellon Family of Funds are based on numerous factors, may not be relied on as an indication of trading intent on behalf of any fund in the BNY Mellon Family of Funds. |
Not FDIC-Insured • Not Bank-Guaranteed • May Lose Value |
Contents
THE FUND
BNY Mellon Investment Adviser, Inc. | |
With Those of Other Funds | |
Public Accounting Firm | |
FOR MORE INFORMATION
Back Cover
| The Fund |
A LETTER FROM THE PRESIDENT OF BNY MELLON INVESTMENT ADVISER, INC.
Dear Shareholder:
We are pleased to present this annual report for BNY Mellon Massachusetts Fund (formerly the Dreyfus Massachusetts Fund), covering the 12-month period from May 1, 2018 through April 30, 2019. For information about how the fund performed during the reporting period, as well as general market perspectives, we provide a Discussion of Fund Performance on the pages that follow.
At the beginning of the reporting period, developed economies outside of the U.S. continued to weaken, while the U.S. economy sustained its relatively healthy growth rate. Calm markets prevailed throughout the summer, as robust growth and strong corporate earnings supported U.S. stock returns, while other developed markets continued to decline.
The fourth quarter of 2018 saw broad market weakness, due in part to heightened concerns about interest-rate increases, trade tensions and slowing global growth. The slump largely erased prior gains on U.S. indices, while losses deepened in international markets. December experienced a sharp sell-off, as it appeared that the U.S. Federal Reserve (the “Fed”) would maintain its hawkish stance on monetary policy. However, comments made in January by the Fed indicated that it would slow the pace of interest-rate increases, and this helped stimulate a rebound across equity markets that continued through the end of the reporting period.
Fixed-income markets declined early in the period, as interest rates and inflation rose, pressuring most bond prices. Comparatively strong U.S. equity markets fed investor risk appetites, reducing the demand for Treasuries and increasing yields. But a return of stock-market volatility in October triggered a flight to quality, boosting Treasury prices and flattening the yield curve. Corporate bonds, however, were hindered somewhat by concerns about economic growth, resulting in widening spreads and lower prices through November. In January, when the Fed’s comments indicated that rate increases would be less likely in 2019, bond markets rallied, and most U.S. indices continued to post positive returns through the end of April.
We remain positive on the near-term economic outlook for the U.S. but will monitor relevant data for any signs of a change. As always, we encourage you to discuss the risks and opportunities in today’s investment environment with your financial advisor.
Thank you for your continued confidence and support.
Sincerely,

Renee LaRoche-Morris
President
BNY Mellon Investment Adviser, Inc.
June 3, 2019
2
DISCUSSION OF FUND PERFORMANCE(Unaudited)
For the period from May 1, 2018 through April 30, 2019, as provided by Daniel Rabasco and Thomas Casey, Portfolio Managers
Market and Fund Performance Overview
For the 12-month period ended April 30, 2019, Class A shares of BNY Mellon Massachusetts Fund (formerly, Dreyfus Massachusetts Fund), a series of BNY Mellon State Municipal Bond Funds (formerly, Dreyfus State Municipal Bond Funds), produced a total return of 4.72%, Class C shares returned 3.83%, and Class Z shares returned 4.96%.1 In comparison, the Bloomberg Barclays U.S. Municipal Bond Index (the “Index”), the fund’s benchmark index, which is comprised of bonds issued nationally and not solely within Massachusetts, achieved a total return of 6.16% for the same period.2
Municipal bonds during the reporting period encountered bouts of volatility stemming from rising interest rates and shifting supply-and-demand dynamics in the municipal securities market. The fund underperformed the Index, in part due to sector allocations.
The Fund’s Investment Approach
The fund seeks to maximize current income exempt from federal income tax and from Massachusetts state income tax, without undue risk. To pursue its goal, the fund normally invests at least 80% of its net assets, plus any borrowings for investment purposes, in municipal bonds that provide income exempt from federal and Massachusetts state income taxes. The fund invests at least 70% of its assets in municipal bonds rated, at the time of purchase, investment grade (Baa/BBB or higher) or the unrated equivalent as determined by BNY Mellon Investment Adviser, Inc. (formerly, The Dreyfus Corporation). For additional yield, the fund may invest up to 30% of its assets in municipal bonds rated below investment grade (“high yield” or “junk” bonds) or the unrated equivalent as determined by BNY Mellon Investment Adviser, Inc. The dollar-weighted average maturity of the fund’s portfolio normally exceeds 10 years, but the fund may invest without regard to maturity.
The portfolio managers focus on identifying undervalued sectors and securities and minimize the use of interest-rate forecasting. The portfolio managers select municipal bonds for the fund’s portfolio by using fundamental credit analysis to estimate the relative value and attractiveness of various sectors and securities and to exploit pricing inefficiencies in the municipal bond market, and actively trading among various sectors, such as pre-refunded, general obligation and revenue, based on their apparent relative values. The fund seeks to invest in several of these sectors.
A Shift in Federal Reserve Policy Drove Municipal Bonds
Municipal bonds struggled during the first two-thirds of the reporting period as the economy continued to perform well, and the Federal Reserve (the “Fed”) continued on a path of raising short-term interest rates. The Fed hiked the federal funds policy rate three times during the reporting period, bringing the target rate to 2.25%-2.50%. Flows into municipal bond funds were fairly steady and supply also was manageable as new issuance for 2018 came in approximately 24% below that of 2017.
From a macroeconomic perspective, data became more mixed towards the end of 2018, and investors became increasingly concerned about the effect of the Fed’s hawkish stance on
3
DISCUSSION OF FUND PERFORMANCE(Unaudited) (continued)
interest rates. This resulted in some volatility in capital markets that resulted in a “flight to quality” in which higher-quality securities, including municipal bonds, rallied strongly. The Fed’s shift to a more dovish stance also fed demand as it confirmed investor concerns about a possible weakening of the economy.
As 2019 progressed, supply through the first four months of the year continued to be manageable, while demand rallied significantly and fund flows surged, hitting record levels. Investors, especially those in high-tax states, reacted to the impact on their tax bills from the Tax Cuts and Jobs Act of 2017 and the new cap on the deductibility of state and local taxes. In response, these investors sought tax-exempt municipal bonds as a tax shelter. Also, the relative stability of the municipal bond market compared to that of the equity markets also attracted investors.
The flight to quality caused rates to fall, and investors then began to reach for yield. As a result, longer-term municipals, especially those 10 years and longer, experienced a greater compression of yields than did shorter maturities, resulting in a flatter municipal bond yield curve. The ratio of municipal bond yields to Treasury yields fell significantly, especially for longer-dated bonds, reflecting the outperformance of municipal bonds versus Treasuries. Investors also began to reach for the yield available from lower-quality issues, resulting in a tightening of quality spreads.
Although long-term obligations, including pension and health care liabilities, remain a concern, credit quality remained stable to strong during the period. Driven by continued economic strength, tax revenues were healthy, allowing many issuers to increase their “rainy day” funds. Tobacco bonds, those backed by certain states’ settlement of litigation with U.S. tobacco companies, were hurt by a proposal by the Food and Drug Administration to ban menthol cigarettes.
The economy of Massachusetts continues to be strong, fueled by education, health care, and technology, and unemployment continues to be below the national average. Its state pension plans continue to be underfunded, however, with the funding level below 60%, and its other post-employment benefit obligations are also significant.
Sector Allocation Dampened Fund Results
The fund’s performance versus the Index was hampered during the reporting period by the sector allocation strategy. Both the overweight to revenue bonds and the underweight to general obligation bonds constrained performance during the period. In particular, index exposure to Illinois general obligation bonds, which performed well while the fund maintained no exposure to this out-of-state credit, was a major reason for the fund’s underperformance. Also detracting were tobacco-backed bonds, which were hampered by the menthol ban proposal noted above.
On a more positive note, the fund’s yield-curve positioning contributed positively to its results; both the overweight to 10-year maturities and the underweight to shorter maturities were additive to returns. The fund’s allocation to special tax bonds and an overweight to BBB rated bonds also contributed positively.
4
A Constructive Investment Posture
The domestic economy remains strong, fueled by the 2017 tax cuts. Employment continues to be robust, with unemployment at near-record-low levels, and wage growth is picking up, further raising the prospect of an increase in inflation. One risk to this outlook is a deterioration in trade relations, which could derail the economy’s momentum. While market participants are concerned over the impact of trade tensions on economic growth, we believe the Fed is looking forward, focusing on economic data and, for the near term, will be on hold in adjusting short-term interest rates.
Nevertheless, even if rates eventually rise moderately over the coming year, demand for municipal bonds should remain strong and supply manageable. The municipal bond market should perform relatively well. In addition, the cap on federal deductibility of state and local taxes will continue to help drive demand for municipal securities, encouraging the reinvestment of the proceeds of a large number of bonds that are due to mature in the coming months. We expect to keep the fund’s duration neutral to modestly long relative to the benchmark, and we will continue to focus on security selection, emphasizing undervalued issues and relying on our credit research capabilities.
June 3, 2019
1 Total return includes reinvestment of dividends and any capital gains paid and does not take into consideration the maximum initial sales charge in the case of Class A shares or the applicable contingent deferred sales charge imposed on redemptions in the case of Class C shares. Had these charges been reflected, returns would have been lower. Class Z is not subject to any initial or deferred sales charge. Past performance is no guarantee of future results. Share price, yield, and investment return fluctuate such that upon redemption, fund shares may be worth more or less than their original cost. Income may be subject to state and local taxes, and some income may be subject to the federal alternative minimum tax (AMT) for certain investors. Capital gains, if any, are taxable.
2 Source: Lipper Inc. — The Bloomberg Barclays U.S. Municipal Bond Index covers the U.S. dollar-denominated long-term tax-exempt bond market. Investors cannot invest directly in any index.
Bonds are subject generally to interest-rate, credit, liquidity, and market risks, to varying degrees, all of which are more fully described in the fund’s prospectus. Generally, all other factors being equal, bond prices are inversely related to interest-rate changes, and rate increases can cause price declines.
The amount of public information available about municipal bonds is generally less than that for corporate equities or bonds. Special factors, such as legislative changes, and state and local economic and business developments, may adversely affect the yield and/or value of the fund’s investments in municipal bonds. Other factors include the general conditions of the municipal bond market, the size of the particular offering, the maturity of the obligation, and the rating of the issue. Changes in economic, business, or political conditions relating to a particular municipal project, municipality, or state in which the fund invests may have an impact on the fund’s share price.
5
FUND PERFORMANCE(Unaudited)

Comparison of change in value of $10,000 investment in BNY Mellon State Municipal Bond Funds, BNY Mellon Massachusetts Fund, Class A shares, Class C shares, Class Z shares and the Bloomberg Barclays U.S. Municipal Bond Index (the “Index”).
† Source: Lipper Inc.
Past performance is not predictive of future performance.
The above graph compares a hypothetical $10,000 investment made in each of the Class A, Class C and Class Z shares of BNY Mellon State Municipal Bond Funds, BNY Mellon Massachusetts Fund on 4/30/09 to a hypothetical investment of $10,000 made in the Index on that date. All dividends and capital gain distributions are reinvested.
The fund’s performance shown in the line graph above takes into account the maximum initial sales charge on Class A shares and all other applicable fees and expenses on all classes. The Index is not limited to investments principally in Massachusetts municipal obligations. The Index, unlike the fund, covers the U.S. dollar-denominated long-term tax-exempt bond market. These factors can contribute to the Index potentially outperforming or underperforming the fund. Unlike a mutual fund, the Index is not subject to charges, fees and other expenses. Investors cannot invest directly in any index. Further information relating to fund performance, including expense reimbursements, if applicable, is contained in the Financial Highlights section of the prospectus and elsewhere in this report.
6
Average Annual Total Returns as of 4/30/19 | |||||
| 1 Year | 5 Years | 10 Years | ||
Class A shares | |||||
with maximum sales charge (4.5%) | 0.02% | 1.69% | 3.28% | ||
without sales charge | 4.72% | 2.63% | 3.75% | ||
Class C shares | |||||
with applicable redemption charge† | 2.83% | 1.78% | 2.93% | ||
without redemption | 3.83% | 1.78% | 2.93% | ||
Class Z shares | 4.96% | 2.86% | 3.97% | ||
Bloomberg Barclays U.S. | 6.16% | 3.56% | 4.55% | ||
† The maximum contingent deferred sales charge for Class C shares is 1% for shares redeemed within one year of the date of purchase.
The performance data quoted represents past performance, which is no guarantee of future results. Share price and investment return fluctuate and an investor’s shares may be worth more or less than original cost upon redemption. Current performance may be lower or higher than the performance quoted. Go to bnymellonim.com/us for the fund’s most recent month-end returns.
The fund’s performance shown in the graph and table does not reflect the deduction of taxes that a shareholder would pay on fund distributions or the redemption of fund shares. In addition to the performance of Class A shares shown with and without a maximum sales charge, the fund's performance shown in the table takes into account all other applicable fees and expenses on all classes.
7
UNDERSTANDING YOUR FUND’S EXPENSES(Unaudited)
As a mutual fund investor, you pay ongoing expenses, such as management fees and other expenses. Using the information below, you can estimate how these expenses affect your investment and compare them with the expenses of other funds. You also may pay one-time transaction expenses, including sales charges (loads) and redemption fees, which are not shown in this section and would have resulted in higher total expenses. For more information, see your fund’s prospectus or talk to your financial adviser.
Review your fund’s expenses
The table below shows the expenses you would have paid on a $1,000 investment in BNY Mellon State Municipal Bond Funds, BNY Mellon Massachusetts Fund from November 1, 2018 to April 30, 2019. It also shows how much a $1,000 investment would be worth at the close of the period, assuming actual returns and expenses.
Expenses and Value of a $1,000 Investment | ||||||||||||||
assuming actual returns for the six months ended April 30, 2019 | ||||||||||||||
|
|
| Class A | Class C | Class Z | |||||||||
Expenses paid per $1,000† |
| $4.98 |
| $9.88 |
| $4.06 | ||||||||
Ending value (after expenses) |
| $1,048.10 |
| $1,044.10 |
| $1,049.20 | ||||||||
COMPARING YOUR FUND’S EXPENSES
WITH THOSE OF OTHER FUNDS(Unaudited)
Using the SEC’s method to compare expenses
The Securities and Exchange Commission (“SEC”) has established guidelines to help investors assess fund expenses. Per these guidelines, the table below shows your fund’s expenses based on a $1,000 investment, assuming a hypothetical 5% annualized return. You can use this information to compare the ongoing expenses (but not transaction expenses or total cost) of investing in the fund with those of other funds. All mutual fund shareholder reports will provide this information to help you make this comparison. Please note that you cannot use this information to estimate your actual ending account balance and expenses paid during the period.
Expenses and Value of a $1,000 Investment | |||||||||||||||
assuming a hypothetical 5% annualized return for the six months ended April 30, 2019 | |||||||||||||||
|
|
|
| Class A | Class C | Class Z | |||||||||
Expenses paid per $1,000† |
| $4.91 |
| $9.74 |
| $4.01 | |||||||||
Ending value (after expenses) |
| $1,019.93 |
| $1,015.12 |
| $1,020.83 | |||||||||
†Expenses are equal to the fund’s annualized expense ratio of .98% for Class A, 1.95% for Class C and .80% for Class Z, multiplied by the average account value over the period, multiplied by 181/365 (to reflect the one-half year period).
8
STATEMENT OF INVESTMENTS
April 30, 2019
Description | Coupon | Maturity | Principal | Value ($) | |||||
Long-Term Municipal Investments - 98.8% | |||||||||
Massachusetts - 96.6% | |||||||||
Boston Housing Authority, | 5.00 | 4/1/2024 | 1,885,000 | 1,890,335 | |||||
Commonwealth of Massachusetts, | 5.50 | 8/1/2030 | 1,750,000 | 2,308,915 | |||||
Commonwealth of Massachusetts, | 5.25 | 9/1/2023 | 1,000,000 | 1,151,120 | |||||
Commonwealth of Massachusetts, | 2.38 | 11/1/2025 | 5,000,000 | a | 4,993,400 | ||||
Commonwealth of Massachusetts, | 5.00 | 4/1/2047 | 3,250,000 | 3,770,422 | |||||
Commonwealth of Massachusetts, | 5.50 | 1/1/2023 | 3,000,000 | 3,405,660 | |||||
Commonwealth of Massachusetts, | 5.00 | 6/1/2041 | 1,500,000 | 1,736,685 | |||||
Commonwealth of Massachusetts Federal Highway, | 5.00 | 6/15/2023 | 1,325,000 | 1,460,972 | |||||
Martha's Vineyard Land Bank, | 5.00 | 5/1/2033 | 500,000 | 593,025 | |||||
Massachusetts Bay Transportation Authority, | 7.00 | 3/1/2021 | 275,000 | 294,671 | |||||
Massachusetts Bay Transportation Authority, | 5.50 | 7/1/2027 | 3,000,000 | 3,848,280 | |||||
Massachusetts Bay Transportation Authority, | 5.00 | 7/1/2040 | 2,000,000 | 2,292,440 | |||||
9
STATEMENT OF INVESTMENTS (continued)
Description | Coupon | Maturity | Principal | Value ($) | |||||
Long-Term Municipal Investments - 98.8% (continued) | |||||||||
Massachusetts - 96.6% (continued) | |||||||||
Massachusetts Clean Energy Cooperative Corporation, | 5.00 | 7/1/2024 | 2,580,000 | 2,914,600 | |||||
Massachusetts Development Finance Agency, | 5.00 | 7/1/2034 | 1,475,000 | 1,642,280 | |||||
Massachusetts Development Finance Agency, | 5.00 | 10/1/2031 | 1,000,000 | 1,068,700 | |||||
Massachusetts Development Finance Agency, | 4.00 | 10/1/2046 | 2,000,000 | 2,110,460 | |||||
Massachusetts Development Finance Agency, | 5.00 | 7/1/2043 | 1,295,000 | 1,478,994 | |||||
Massachusetts Development Finance Agency, | 5.00 | 10/1/2033 | 4,000,000 | 4,590,040 | |||||
Massachusetts Development Finance Agency, | 5.00 | 12/1/2046 | 2,000,000 | 2,280,920 | |||||
Massachusetts Development Finance Agency, | 5.00 | 12/1/2041 | 1,000,000 | 1,142,720 | |||||
Massachusetts Development Finance Agency, | 5.13 | 11/15/2046 | 1,500,000 | b | 1,566,105 | ||||
Massachusetts Development Finance Agency, | 6.50 | 11/15/2023 | 2,000,000 | b,c | 2,394,160 | ||||
Massachusetts Development Finance Agency, | 5.00 | 7/1/2039 | 2,000,000 | 2,204,260 | |||||
Massachusetts Development Finance Agency, | 5.00 | 10/1/2048 | 1,000,000 | 1,083,570 | |||||
10
Description | Coupon | Maturity | Principal | Value ($) | |||||
Long-Term Municipal Investments - 98.8% (continued) | |||||||||
Massachusetts - 96.6% (continued) | |||||||||
Massachusetts Development Finance Agency, | 5.00 | 9/1/2045 | 1,500,000 | 1,571,115 | |||||
Massachusetts Development Finance Agency, | 5.00 | 7/1/2030 | 1,000,000 | 1,035,480 | |||||
Massachusetts Development Finance Agency, | 5.00 | 10/1/2046 | 750,000 | 860,940 | |||||
Massachusetts Development Finance Agency, | 5.00 | 7/1/2042 | 1,000,000 | 1,172,310 | |||||
Massachusetts Development Finance Agency, | 5.00 | 7/1/2037 | 1,000,000 | 1,117,750 | |||||
Massachusetts Development Finance Agency, | 5.00 | 10/1/2029 | 1,475,000 | 1,495,827 | |||||
Massachusetts Development Finance Agency, | 5.00 | 10/1/2026 | 1,250,000 | 1,267,650 | |||||
Massachusetts Development Finance Agency, | 5.00 | 7/1/2033 | 500,000 | 562,940 | |||||
Massachusetts Development Finance Agency, | 5.00 | 7/1/2037 | 1,500,000 | 1,693,050 | |||||
Massachusetts Development Finance Agency, | 5.00 | 9/1/2041 | 800,000 | 928,248 | |||||
Massachusetts Development Finance Agency, | 5.00 | 8/15/2040 | 2,000,000 | 2,219,240 | |||||
Massachusetts Development Finance Agency, | 5.00 | 10/1/2047 | 1,000,000 | b | 1,059,810 | ||||
11
STATEMENT OF INVESTMENTS (continued)
Description | Coupon | Maturity | Principal | Value ($) | |||||
Long-Term Municipal Investments - 98.8% (continued) | |||||||||
Massachusetts - 96.6% (continued) | |||||||||
Massachusetts Development Finance Agency, | 5.00 | 10/1/2057 | 1,500,000 | b | 1,578,825 | ||||
Massachusetts Development Finance Agency, | 5.00 | 10/1/2049 | 700,000 | 774,480 | |||||
Massachusetts Development Finance Agency, | 5.00 | 7/1/2047 | 1,500,000 | 1,705,590 | |||||
Massachusetts Development Finance Agency, | 5.00 | 7/1/2032 | 5,070,000 | 5,844,747 | |||||
Massachusetts Development Finance Agency, | 5.00 | 7/1/2041 | 1,000,000 | 1,119,040 | |||||
Massachusetts Development Finance Agency, | 5.00 | 7/1/2036 | 450,000 | 525,632 | |||||
Massachusetts Development Finance Agency, | 5.00 | 7/1/2035 | 1,000,000 | 1,143,210 | |||||
Massachusetts Development Finance Agency, | 5.00 | 7/1/2036 | 755,000 | 859,915 | |||||
Massachusetts Development Finance Agency, | 5.00 | 4/1/2037 | 1,000,000 | 1,192,800 | |||||
Massachusetts Development Finance Agency, | 5.00 | 7/1/2046 | 1,000,000 | 1,113,400 | |||||
Massachusetts Development Finance Agency, | 5.00 | 7/1/2031 | 1,000,000 | 1,164,170 | |||||
12
Description | Coupon | Maturity | Principal | Value ($) | |||||
Long-Term Municipal Investments - 98.8% (continued) | |||||||||
Massachusetts - 96.6% (continued) | |||||||||
Massachusetts Development Finance Agency, | 5.50 | 7/1/2031 | 25,000 | 26,760 | |||||
Massachusetts Development Finance Agency, | 5.00 | 1/1/2040 | 1,000,000 | 1,151,920 | |||||
Massachusetts Development Finance Agency, | 5.00 | 6/1/2023 | 1,350,000 | 1,442,556 | |||||
Massachusetts Development Finance Agency, | 5.00 | 7/1/2044 | 1,000,000 | 1,144,360 | |||||
Massachusetts Educational Financing Authority, | 5.00 | 1/1/2025 | 1,500,000 | 1,718,220 | |||||
Massachusetts Educational Financing Authority, | 5.25 | 7/1/2029 | 1,035,000 | 1,110,607 | |||||
Massachusetts Port Authority, | 5.00 | 7/1/2042 | 1,000,000 | 1,155,620 | |||||
Massachusetts Port Authority, | 5.00 | 7/1/2035 | 2,055,000 | 2,415,344 | |||||
Massachusetts Port Authority, | 5.00 | 7/1/2025 | 1,500,000 | 1,652,610 | |||||
Massachusetts Port Authority, | 5.00 | 7/1/2027 | 5,475,000 | 5,687,156 | |||||
Massachusetts Port Authority, | 5.00 | 7/1/2025 | 1,500,000 | 1,745,775 | |||||
Massachusetts Port Authority, | 4.00 | 7/1/2046 | 2,500,000 | 2,621,400 | |||||
Massachusetts Port Authority, | 5.00 | 7/1/2045 | 1,000,000 | 1,120,990 | |||||
Massachusetts School Building Authority, | 5.00 | 8/15/2037 | 3,000,000 | 3,468,630 | |||||
Massachusetts School Building Authority, | 5.00 | 10/15/2035 | 4,000,000 | 4,285,080 | |||||
13
STATEMENT OF INVESTMENTS (continued)
Description | Coupon | Maturity | Principal | Value ($) | |||||
Long-Term Municipal Investments - 98.8% (continued) | |||||||||
Massachusetts - 96.6% (continued) | |||||||||
Massachusetts State College Building Authority, | 0.00 | 5/1/2026 | 5,385,000 | d | 4,643,001 | ||||
Massachusetts State College Building Authority, | 5.50 | 5/1/2028 | 1,450,000 | 1,783,485 | |||||
Massachusetts State College Building Authority, | 5.00 | 5/1/2027 | 980,000 | 1,071,042 | |||||
Massachusetts State College Building Authority, | 5.00 | 5/1/2022 | 1,020,000 | c | 1,118,583 | ||||
Massachusetts Transportation Trust Fund, | 5.00 | 1/1/2027 | 4,000,000 | 4,086,680 | |||||
Massachusetts Water Resources Authority, | 5.00 | 8/1/2025 | 2,000,000 | 2,145,520 | |||||
Metropolitan Boston Transit Parking Corporation, | 5.00 | 7/1/2024 | 1,320,000 | 1,410,829 | |||||
Springfield Water and Sewer Commission, | 5.00 | 4/15/2037 | 650,000 | 768,475 | |||||
132,003,546 | |||||||||
U.S. Related - 2.2% | |||||||||
Children's Trust Fund, | 0.00 | 5/15/2050 | 5,000,000 | d | 678,500 | ||||
14
Description | Coupon | Maturity | Principal | Value ($) | |||||
Long-Term Municipal Investments - 98.8% (continued) | |||||||||
U.S. Related - 2.2% (continued) | |||||||||
Puerto Rico Highway & Transportation Authority, | 5.25 | 7/1/2033 | 1,000,000 | 1,091,050 | |||||
Virgin Islands Port Authority, | 5.00 | 9/1/2044 | 1,500,000 | 1,326,660 | |||||
3,096,210 | |||||||||
Total Investments(cost $129,487,800) | 98.8% | 135,099,756 | |||||||
Cash and Receivables (Net) | 1.2% | 1,583,564 | |||||||
Net Assets | 100.0% | 136,683,320 | |||||||
a Variable rate security—rate shown is the interest rate in effect at period end.
b Security exempt from registration pursuant to Rule 144A under the Securities Act of 1933. These securities may be resold in transactions exempt from registration, normally to qualified institutional buyers. At April 30, 2019, these securities were valued at $6,598,900 or 4.83% of net assets.
c These securities are prerefunded; the date shown represents the prerefunded date. Bonds which are prerefunded are collateralized by U.S. Government securities which are held in escrow and are used to pay principal and interest on the municipal issue and to retire the bonds in full at the earliest refunding date.
d Security issued with a zero coupon. Income is recognized through the accretion of discount.
Portfolio Summary (Unaudited)† | Value (%) |
Medical | 23.8 |
Transportation | 18.2 |
Education | 15.2 |
Special Tax | 9.0 |
General Obligation | 7.3 |
Development | 4.8 |
Transportation Services | 3.9 |
Nursing Homes | 3.6 |
Power | 2.1 |
Water | 2.1 |
Student Loan | 2.1 |
Prerefunded | 1.8 |
Multifamily Housing | 1.4 |
Facilities | 1.0 |
Education | .8 |
Housing | .8 |
Tobacco Settlement | .5 |
Other | .4 |
98.8 |
† Based on net assets.
See notes to financial statements.
15
STATEMENT OF INVESTMENTS
Summary of Abbreviations(Unaudited) | |||
ABAG | Association of Bay Area Governments | ACA | American Capital Access |
AGC | ACE Guaranty Corporation | AGIC | Asset Guaranty Insurance Company |
AMBAC | American Municipal Bond Assurance Corporation | ARRN | Adjustable Rate Receipt Notes |
BAN | Bond Anticipation Notes | BPA | Bond Purchase Agreement |
CIFG | CDC Ixis Financial Guaranty | COP | Certificate of Participation |
CP | Commercial Paper | DRIVERS | Derivative Inverse Tax-Exempt Receipts |
EDR | Economic Development Revenue | EIR | Environmental Improvement Revenue |
EURIBOR | Euro Interbank Offered Rate | FGIC | Financial Guaranty Insurance Company |
FHA | Federal Housing Administration | FHLB | Federal Home Loan Bank |
FHLMC | Federal Home Loan Mortgage Corporation | FNMA | Federal National Mortgage Association |
GAN | Grant Anticipation Notes | GIC | Guaranteed Investment Contract |
GNMA | Government National Mortgage Association | GO | General Obligation |
HR | Hospital Revenue | IDB | Industrial Development Board |
IDC | Industrial Development Corporation | IDR | Industrial Development Revenue |
LIBOR | London Interbank Offered Rate | LIFERS | Long Inverse Floating Exempt Receipts |
LOC | Letter of Credit | LOR | Limited Obligation Revenue |
LR | Lease Revenue | MERLOTS | Municipal Exempt Receipts Liquidity Option Tender |
MFHR | Multi-Family Housing Revenue | MFMR | Multi-Family Mortgage Revenue |
MUNIPSA | Securities Industry and Financial Markets Association Municipal Swap Index Yield | PCR | Pollution Control Revenue |
PILOT | Payment in Lieu of Taxes | P-FLOATS | Puttable Floating Option Tax-Exempt Receipts |
PUTTERS | Puttable Tax-Exempt Receipts | RAC | Revenue Anticipation Certificates |
RAN | Revenue Anticipation Notes | RAW | Revenue Anticipation Warrants |
RIB | Residual Interest Bonds | ROCS | Reset Options Certificates |
RRR | Resources Recovery Revenue | SAAN | State Aid Anticipation Notes |
SBPA | Standby Bond Purchase Agreement | SFHR | Single Family Housing Revenue |
SFMR | Single Family Mortgage Revenue | SOFRRATE | Secured Overnight Financing Rate |
SONYMA | State of New York Mortgage Agency | SPEARS | Short Puttable Exempt Adjustable Receipts |
SWDR | Solid Waste Disposal Revenue | TAN | Tax Anticipation Notes |
TAW | Tax Anticipation Warrants | TRAN | Tax and Revenue Anticipation Notes |
XLCA | XL Capital Assurance | ||
See notes to financial statements.
16
STATEMENT OF ASSETS AND LIABILITIES
April 30, 2019
|
|
|
|
|
|
|
|
|
| Cost |
| Value |
|
Assets ($): |
|
|
|
| ||
Investments in securities—See Statement of Investments | 129,487,800 |
| 135,099,756 |
| ||
Cash |
|
|
|
| 153,998 |
|
Interest receivable |
| 1,586,644 |
| |||
Receivable for shares of Beneficial Interest subscribed |
| 7,055 |
| |||
Prepaid expenses |
|
|
|
| 26,942 |
|
|
|
|
|
| 136,874,395 |
|
Liabilities ($): |
|
|
|
| ||
Due to BNY Mellon Investment Adviser, Inc. and affiliates—Note 3(c) |
| 81,028 |
| |||
Payable for shares of Beneficial Interest redeemed |
| 36,625 |
| |||
Trustees fees and expenses payable |
| 2,061 |
| |||
Accrued expenses |
|
|
|
| 71,361 |
|
|
|
|
|
| 191,075 |
|
Net Assets ($) |
|
| 136,683,320 |
| ||
Composition of Net Assets ($): |
|
|
|
| ||
Paid-in capital |
|
|
|
| 131,695,366 |
|
Total distributable earnings (loss) |
|
|
|
| 4,987,954 |
|
Net Assets ($) |
|
| 136,683,320 |
| ||
Net Asset Value Per Share | Class A | Class C | Class Z |
|
Net Assets ($) | 23,395,831 | 329,785 | 112,957,704 |
|
Shares Outstanding | 2,032,415 | 28,635 | 9,813,592 |
|
Net Asset Value Per Share ($) | 11.51 | 11.52 | 11.51 |
|
|
|
|
|
|
See notes to financial statements. |
|
|
|
|
17
STATEMENT OF OPERATIONS
Year Ended April 30, 2019
|
|
|
|
|
|
|
|
|
|
|
|
|
|
Investment Income ($): |
|
|
|
| ||
Interest Income |
|
| 4,868,194 |
| ||
Expenses: |
|
|
|
| ||
Management fee—Note 3(a) |
|
| 764,166 |
| ||
Shareholder servicing costs—Note 3(c) |
|
| 163,759 |
| ||
Professional fees |
|
| 82,902 |
| ||
Registration fees |
|
| 43,471 |
| ||
Prospectus and shareholders’ reports |
|
| 10,029 |
| ||
Trustees’ fees and expenses—Note 3(d) |
|
| 8,107 |
| ||
Loan commitment fees—Note 2 |
|
| 3,201 |
| ||
Distribution fees—Note 3(b) |
|
| 2,600 |
| ||
Custodian fees—Note 3(c) |
|
| 711 |
| ||
Miscellaneous |
|
| 40,106 |
| ||
Total Expenses |
|
| 1,119,052 |
| ||
Less—reduction in fees due to earnings credits—Note 3(c) |
|
| (723) |
| ||
Net Expenses |
|
| 1,118,329 |
| ||
Investment Income—Net |
|
| 3,749,865 |
| ||
Realized and Unrealized Gain (Loss) on Investments—Note 4 ($): |
|
| ||||
Net realized gain (loss) on investments | 518,380 |
| ||||
Net unrealized appreciation (depreciation) on investments |
|
| 2,386,712 |
| ||
Net Realized and Unrealized Gain (Loss) on Investments |
|
| 2,905,092 |
| ||
Net Increase in Net Assets Resulting from Operations |
| 6,654,957 |
| |||
|
|
|
|
|
|
|
See notes to financial statements. | ||||||
18
STATEMENT OF CHANGES IN NET ASSETS
|
|
|
| Year Ended April 30, | |||||
|
|
|
| 2019 |
| 2018a |
| ||
Operations ($): |
|
|
|
|
|
|
|
| |
Investment income—net |
|
| 3,749,865 |
|
|
| 3,989,978 |
| |
Net realized gain (loss) on investments |
| 518,380 |
|
|
| 564,086 |
| ||
Net unrealized appreciation (depreciation) |
| 2,386,712 |
|
|
| (3,185,480) |
| ||
Net Increase (Decrease) in Net Assets | 6,654,957 |
|
|
| 1,368,584 |
| |||
Distributions ($): |
| ||||||||
Distributions to shareholders: |
|
|
|
|
|
|
|
| |
Class A |
|
| (601,610) |
|
|
| (653,323) |
| |
Class C |
|
| (5,456) |
|
|
| (15,026) |
| |
Class Z |
|
| (3,141,509) |
|
|
| (3,345,040) |
| |
Total Distributions |
|
| (3,748,575) |
|
|
| (4,013,389) |
| |
Beneficial Interest Transactions ($): |
| ||||||||
Net proceeds from shares sold: |
|
|
|
|
|
|
|
| |
Class A |
|
| 1,379,916 |
|
|
| 1,822,430 |
| |
Class C |
|
| 10,947 |
|
|
| 1,944 |
| |
Class Z |
|
| 3,034,223 |
|
|
| 2,995,270 |
| |
Distributions reinvested: |
|
|
|
|
|
|
|
| |
Class A |
|
| 470,957 |
|
|
| 504,045 |
| |
Class C |
|
| 3,944 |
|
|
| 9,440 |
| |
Class Z |
|
| 2,351,421 |
|
|
| 2,471,385 |
| |
Cost of shares redeemed: |
|
|
|
|
|
|
|
| |
Class A |
|
| (3,527,970) |
|
|
| (3,786,061) |
| |
Class C |
|
| (58,468) |
|
|
| (1,113,673) |
| |
Class Z |
|
| (12,944,439) |
|
|
| (10,543,472) |
| |
Increase (Decrease) in Net Assets | (9,279,469) |
|
|
| (7,638,692) |
| |||
Total Increase (Decrease) in Net Assets | (6,373,087) |
|
|
| (10,283,497) |
| |||
Net Assets ($): |
| ||||||||
Beginning of Period |
|
| 143,056,407 |
|
|
| 153,339,904 |
| |
End of Period |
|
| 136,683,320 |
|
|
| 143,056,407 |
| |
19
STATEMENT OF CHANGES IN NET ASSETS (continued)
|
|
|
| Year Ended April 30, | |||||
|
|
|
| 2019 |
| 2018a |
| ||
Capital Share Transactions (Shares): |
| ||||||||
Class Ab |
|
|
|
|
|
|
|
| |
Shares sold |
|
| 121,701 |
|
|
| 157,624 |
| |
Shares issued for distributions reinvested |
|
| 41,589 |
|
|
| 43,800 |
| |
Shares redeemed |
|
| (311,084) |
|
|
| (328,888) |
| |
Net Increase (Decrease) in Shares Outstanding | (147,794) |
|
|
| (127,464) |
| |||
Class Cb |
|
|
|
|
|
|
|
| |
Shares sold |
|
| 965 |
|
|
| 168 |
| |
Shares issued for distributions reinvested |
|
| 348 |
|
|
| 817 |
| |
Shares redeemed |
|
| (5,251) |
|
|
| (96,550) |
| |
Net Increase (Decrease) in Shares Outstanding | (3,938) |
|
|
| (95,565) |
| |||
Class Z |
|
|
|
|
|
|
|
| |
Shares sold |
|
| 268,045 |
|
|
| 259,136 |
| |
Shares issued for distributions reinvested |
|
| 207,655 |
|
|
| 214,798 |
| |
Shares redeemed |
|
| (1,144,565) |
|
|
| (915,949) |
| |
Net Increase (Decrease) in Shares Outstanding | (668,865) |
|
|
| (442,015) |
| |||
|
|
|
|
|
|
|
|
|
|
aDistributions to shareholders include only distributions from investment income—net. | |||||||||
bDuring the period ended April 30, 2018, 853 Class C shares representing $9,878 were automatically converted to 854 Class A shares. | |||||||||
See notes to financial statements. | |||||||||
20
FINANCIAL HIGHLIGHTS
The following tables describe the performance for each share class for the fiscal periods indicated. All information (except portfolio turnover rate) reflects financial results for a single fund share. Total return shows how much your investment in the fund would have increased (or decreased) during each period, assuming you had reinvested all dividends and distributions. These figures have been derived from the fund’s financial statements.
Year Ended April 30, | ||||||||||||
Class A Shares | 2019 | 2018 | 2017 | 2016 | 2015 | |||||||
Per Share Data ($): | ||||||||||||
Net asset value, beginning of period | 11.27 | 11.48 | 11.94 | 11.69 | 11.49 | |||||||
Investment Operations: | ||||||||||||
Investment income—neta | .28 | .29 | .29 | .31 | .31 | |||||||
Net realized and unrealized | .24 | (.21) | (.46) | .25 | .20 | |||||||
Total from Investment Operations | .52 | .08 | (.17) | .56 | .51 | |||||||
Distributions: | ||||||||||||
Dividends from investment | (.28) | (.29) | (.29) | (.31) | (.31) | |||||||
Dividends from net realized | — | — | (.00)b | — | — | |||||||
Total Distributions | (.28) | (.29) | (.29) | (.31) | (.31) | |||||||
Net asset value, end of period | 11.51 | 11.27 | 11.48 | 11.94 | 11.69 | |||||||
Total Return (%)c | 4.72 | .65 | (1.40) | 4.84 | 4.50 | |||||||
Ratios/Supplemental Data (%): | ||||||||||||
Ratio of total expenses to | .99 | 1.00 | .96 | .95 | .95 | |||||||
Ratio of net expenses to | .99 | .99 | .96 | .95 | .95 | |||||||
Ratio of net investment income to | 2.51 | 2.47 | 2.48 | 2.64 | 2.69 | |||||||
Portfolio Turnover Rate | 4.67 | 10.68 | 11.70 | 12.60 | 8.90 | |||||||
Net Assets, end of period ($ x 1,000) | 23,396 | 24,569 | 26,487 | 34,121 | 35,090 | |||||||
a Based on average shares outstanding.
b Amount represents less than $.01 per share.
c Exclusive of sales charge.
See notes to financial statements.
21
FINANCIAL HIGHLIGHTS (continued)
Year Ended April 30, | ||||||||||||
Class C Shares | 2019 | 2018 | 2017 | 2016 | 2015 | |||||||
Per Share Data ($): | ||||||||||||
Net asset value, beginning of period | 11.27 | 11.49 | 11.95 | 11.70 | 11.50 | |||||||
Investment Operations: | ||||||||||||
Investment income—neta | .18 | .19 | .20 | .22 | .24 | |||||||
Net realized and unrealized | .25 | (.22) | (.46) | .24 | .18 | |||||||
Total from Investment Operations | .43 | (.03) | (.26) | .46 | .42 | |||||||
Distributions: | ||||||||||||
Dividends from investment | (.18) | (.19) | (.20) | (.21) | (.22) | |||||||
Dividends from net realized | — | — | (.00)b | — | — | |||||||
Total Distributions | (.18) | (.19) | (.20) | (.21) | (.22) | |||||||
Net asset value, end of period | 11.52 | 11.27 | 11.49 | 11.95 | 11.70 | |||||||
Total Return (%)c | 3.83 | (.22) | (2.27) | 4.01 | 3.70 | |||||||
Ratios/Supplemental Data (%): | ||||||||||||
Ratio of total expenses to | 1.93 | 1.81 | 1.76 | 1.75 | 1.71 | |||||||
Ratio of net expenses to | 1.93 | 1.80 | 1.76 | 1.75 | 1.71 | |||||||
Ratio of net investment income to average net assets | 1.57 | 1.63 | 1.69 | 1.84 | 2.00 | |||||||
Portfolio Turnover Rate | 4.67 | 10.68 | 11.70 | 12.60 | 8.90 | |||||||
Net Assets, end of period ($ x 1,000) | 330 | 367 | 1,472 | 1,478 | 1,752 | |||||||
a Based on average shares outstanding.
b Amount represents less than $.01 per share.
c Exclusive of sales charge.
See notes to financial statements.
22
Year Ended April 30, | ||||||||||||
Class Z Shares | 2019 | 2018 | 2017 | 2016 | 2015 | |||||||
Per Share Data ($): | ||||||||||||
Net asset value, beginning of period | 11.27 | 11.48 | 11.94 | 11.69 | 11.49 | |||||||
Investment Operations: | ||||||||||||
Investment income—neta | .31 | .31 | .32 | .33 | .34 | |||||||
Net realized and unrealized | .24 | (.21) | (.46) | .25 | .20 | |||||||
Total from Investment Operations | .55 | .10 | (.14) | .58 | .54 | |||||||
Distributions: | ||||||||||||
Dividends from investment | (.31) | (.31) | (.32) | (.33) | (.34) | |||||||
Dividends from net realized | — | — | (.00)b | — | — | |||||||
Total Distributions | (.31) | (.31) | (.32) | (.33) | (.34) | |||||||
Net asset value, end of period | 11.51 | 11.27 | 11.48 | 11.94 | 11.69 | |||||||
Total Return (%) | 4.96 | .95 | (1.26) | 5.07 | 4.74 | |||||||
Ratios/Supplemental Data (%): | ||||||||||||
Ratio of total expenses to | .76 | .78 | .73 | .73 | .72 | |||||||
Ratio of net expenses to | .76 | .77 | .72 | .73 | .72 | |||||||
Ratio of net investment income to | 2.74 | 2.69 | 2.72 | 2.85 | 2.92 | |||||||
Portfolio Turnover Rate | 4.67 | 10.68 | 11.70 | 12.60 | 8.90 | |||||||
Net Assets, end of period ($ x 1,000) | 112,958 | 118,120 | 125,381 | 143,453 | 144,065 | |||||||
a Based on average shares outstanding.
b Amount represents less than $.01 per share.
See notes to financial statements.
23
NOTES TO FINANCIAL STATEMENTS
NOTE 1—Significant Accounting Policies:
BNY Mellon Massachusetts Fund (the “fund”) is a separate non-diversified series of BNY Mellon State Municipal Bond Funds (the “Company”), which is registered under the Investment Company Act of 1940, as amended (the “Act”), as an open-end management investment company and operates as a series company currently offering three series, including the fund. The fund’s investment objective is to seek to maximize current income exempt from federal income tax and from Massachusetts state income tax, without undue risk. BNY Mellon Investment Adviser, Inc. (the “Adviser”), a wholly-owned subsidiary of The Bank of New York Mellon Corporation (“BNY Mellon”), serves as the fund’s investment adviser.
Effective June 3, 2019, the fund changed its name from Dreyfus Massachusetts Fund to BNY Mellon Massachusetts Fund and the Company changed its name from Dreyfus State Municipal Bond Funds to BNY Mellon State Municipal Bond Funds. In addition, The Dreyfus Corporation, the fund’s investment adviser and administrator, changed its name to “BNY Mellon Investment Adviser, Inc.”, MBSC Securities Corporation, the fund’s distributor, changed its name to “BNY Mellon Securities Corporation” and Dreyfus Transfer, Inc., the fund’s transfer agent, changed its name to “BNY Mellon Transfer, Inc.”
BNY Mellon Securities Corporation (the “Distributor”), a wholly-owned subsidiary of the Adviser, is the distributor of the fund’s shares. The fund is authorized to issue an unlimited number of $.001 par value shares of Beneficial Interest in each of the following classes of shares: Class A, Class C, Class T and Class Z. Class A and Class T shares generally are subject to a sales charge imposed at the time of purchase. Class C shares are subject to a contingent deferred sales charge (“CDSC”) imposed on Class C shares redeemed within one year of purchase. Class C shares automatically convert to Class A shares ten years after the date of purchase, without the imposition of a sales charge. Class Z shares are sold at net asset value per share to certain shareholders of the fund. Class Z shares generally are not available for new accounts. As of the date of this report, the fund did not offer Class T shares for purchase. Other differences between the classes include the services offered to and the expenses borne by each class, the allocation of certain transfer agency costs, and certain voting rights. Income, expenses (other than expenses attributable to a specific class), and realized and unrealized gains or losses on investments are allocated to each class of shares based on its relative net assets.
24
The Company accounts separately for the assets, liabilities and operations of each series. Expenses directly attributable to each series are charged to that series’ operations; expenses which are applicable to all series are allocated among them on a pro rata basis.
The Financial Accounting Standards Board (“FASB”) Accounting Standards Codification is the exclusive reference of authoritative U.S. generally accepted accounting principles (“GAAP”) recognized by the FASB to be applied by nongovernmental entities. Rules and interpretive releases of the Securities and Exchange Commission (“SEC”) under authority of federal laws are also sources of authoritative GAAP for SEC registrants. The fund’s financial statements are prepared in accordance with GAAP, which may require the use of management estimates and assumptions. Actual results could differ from those estimates.
The Companyenters into contracts that contain a variety of indemnifications. The fund’s maximum exposure under these arrangements is unknown. The fund does not anticipate recognizing any loss related to these arrangements.
(a) Portfolio valuation: The fair value of a financial instrument is the amount that would be received to sell an asset or paid to transfer a liability in an orderly transaction between market participants at the measurement date (i.e., the exit price). GAAP establishes a fair value hierarchy that prioritizes the inputs of valuation techniques used to measure fair value. This hierarchy gives the highest priority to unadjusted quoted prices in active markets for identical assets or liabilities (Level 1 measurements) and the lowest priority to unobservable inputs (Level 3 measurements).
Additionally, GAAP provides guidance on determining whether the volume and activity in a market has decreased significantly and whether such a decrease in activity results in transactions that are not orderly. GAAP requires enhanced disclosures around valuation inputs and techniques used during annual and interim periods.
Various inputs are used in determining the value of the fund’s investments relating to fair value measurements. These inputs are summarized in the three broad levels listed below:
Level 1—unadjusted quoted prices in active markets for identical investments.
Level 2—other significant observable inputs (including quoted prices for similar investments, interest rates, prepayment speeds, credit risk, etc.).
Level 3—significant unobservable inputs (including the fund’s own assumptions in determining the fair value of investments).
25
NOTES TO FINANCIAL STATEMENTS(continued)
The inputs or methodology used for valuing securities are not necessarily an indication of the risk associated with investing in those securities.
Changes in valuation techniques may result in transfers in or out of an assigned level within the disclosure hierarchy. Valuation techniques used to value the fund’s investments are as follows:
Investments in securities are valued each business day by an independent pricing service (the “Service”) approved by the Company's Board of Trustees (the “Board”). Investments for which quoted bid prices are readily available and are representative of the bid side of the market in the judgment of the Service are valued at the mean between the quoted bid prices (as obtained by the Service from dealers in such securities) and asked prices (as calculated by the Service based upon its evaluation of the market for such securities). Other investments (which constitute a majority of the portfolio securities) are carried at fair value as determined by the Service, based on methods which include consideration of the following: yields or prices of municipal securities of comparable quality, coupon, maturity and type; indications as to values from dealers; and general market conditions. All of the preceding securities are generally categorized within Level 2 of the fair value hierarchy.
The Service is engaged under the general oversight of the Board.
When market quotations or official closing prices are not readily available, or are determined not to accurately reflect fair value, such as when the value of a security has been significantly affected by events after the close of the exchange or market on which the security is principally traded, but before the fund calculates its net asset value, the fund may value these investments at fair value as determined in accordance with the procedures approved by the Board. Certain factors may be considered when fair valuing investments such as: fundamental analytical data, the nature and duration of restrictions on disposition, an evaluation of the forces that influence the market in which the securities are purchased and sold, and public trading in similar securities of the issuer or comparable issuers. These securities are either categorized within Level 2 or 3 of the fair value hierarchy depending on the relevant inputs used.
For restricted securities where observable inputs are limited, assumptions about market activity and risk are used and such securities are generally categorized within Level 3 of the fair value hierarchy.
26
The following is a summary of the inputs used as of April 30, 2019in valuing the fund’s investments:
Assets ($) | Level 1 - Unadjusted Quoted Prices | Level 2 - Other Significant Observable Inputs | Level 3 -Significant Unobservable Inputs | Total | |
Investments in Securities: | |||||
Municipal Bonds† | - | 135,099,756 | - | 135,099,756 | |
† See Statement of Investments for additional detailed categorizations.
At April 30, 2019, there were no transfers between levels of the fair value hierarchy. It is the fund’s policy to recognize transfers between levels at the end of the reporting period.
(b) Securities transactions and investment income: Securities transactions are recorded on a trade date basis. Realized gains and losses from securities transactions are recorded on the identified cost basis. Interest income, adjusted for accretion of discount and amortization of premium on investments, is earned from settlement date and recognized on the accrual basis. Securities purchased or sold on a when issued or delayed delivery basis may be settled a month or more after the trade date.
The fund follows an investment policy of investing primarily in municipal obligations of one state. Economic changes affecting the state and certain of its public bodies and municipalities may affect the ability of issuers within the state to pay interest on, or repay principal of, municipal obligations held by the fund.
(c) Dividends and distributions to shareholders:It is the policy of the fund to declare dividends daily from investment income-net. Such dividends are paid monthly. Dividends from net realized capital gains, if any, are normally declared and paid annually, but the fund may make distributions on a more frequent basis to comply with the distribution requirements of the Internal Revenue Code of 1986, as amended (the “Code”). To the extent that net realized capital gains can be offset by capital loss carryovers, it is the policy of the fund not to distribute such gains. Income and capital gain distributions are determined in accordance with income tax regulations, which may differ from GAAP.
(d) Federal income taxes: It is the policy of the fund to continue to qualify as a regulated investment company, which can distribute tax-exempt dividends, by complying with the applicable provisions of the Code, and to make distributions of income and net realized capital gain sufficient to relieve it from substantially all federal income and excise taxes.
27
NOTES TO FINANCIAL STATEMENTS(continued)
As of and during the period ended April 30, 2019, the fund did not have any liabilities for any uncertain tax positions. The fund recognizes interest and penalties, if any, related to uncertain tax positions as income tax expense in the Statement of Operations. During the period ended April 30, 2019, the fund did not incur any interest or penalties.
Each tax year in the four-year period ended April 30, 2019 remains subject to examination by the Internal Revenue Service and state taxing authorities.
At April 30, 2019, the components of accumulated earnings on a tax basis were as follows: undistributed tax-exempt income $135,016, accumulated capital losses $625,290 and unrealized appreciation $5,613,244.
The fund is permitted to carry forward capital losses for an unlimited period. Furthermore, capital loss carryovers retain their character as either short-term or long-term capital losses.
The accumulated capital loss carryover is available for federal income tax purposes to be applied against future netrealized capital gains, if any, realized subsequent to April 30, 2019. The fund has $625,290 of short-term capital losses which can be carried forward for an unlimited period.
The tax character of distributions paid to shareholders during the fiscal periods ended April 30, 2019 and April 30, 2018 were as follows: tax-exempt income $3,748,575 and $4,013,389 respectively.
(e) New Accounting Pronouncements: In March 2017, the FASB issued Accounting Standards Update 2017-08, Receivables—Nonrefundable Fees and Other Costs (Subtopic 310-20): Premium Amortization On Purchased Callable Debt Securities (“ASU 2017-08”). The update shortens the amortization period for the premium on certain purchased callable debt securities to the earliest call date. ASU 2017-08 will be effective for fiscal years beginning after December 15, 2018.
Also in August 2018, the FASB issued Accounting Standards Update 2018-13, Fair Value Measurement (Topic 820): Disclosure Framework—Changes to the Disclosure Requirements for Fair Value Measurement (“ASU 2018-13”). The update provides guidance that modifies certain disclosure requirements for fair value measurements. ASU 2018-13 will be effective for fiscal years beginning after December 15, 2019. Management is currently assessing the potential impact of these changes to future financial statements.
28
NOTE 2—Bank Lines of Credit:
The fund participates with other long-term open-end funds managed by the Adviser in a $1.030 billion unsecured credit facility led by Citibank, N.A. (the “Citibank Credit Facility”) and a $300 million unsecured credit facility provided by The Bank of New York Mellon (the “BNYM Credit Facility”), a subsidiary of BNY Mellon and an affiliate of the Adviser, each to be utilized primarily for temporary or emergency purposes, including the financing of redemptions (each, a “Facility”). The Citibank Credit Facility is available in two tranches: (i) Tranche A is in an amount equal to $830 million and is available to all long-term open-ended funds, including the fund, and (ii) Tranche B is in amount equal to $200 million and is available only to BNY Mellon Floating Rate Income Fund, a series of BNY Mellon Investment Funds IV, Inc. Prior to October 3, 2018, the unsecured credit facility with Citibank, N.A. was $830 million. In connection therewith, the fund has agreed to pay its pro rata portion of commitment fees for Tranche A of the Citibank Credit Facility and the BNYM Credit Facility. Interest is charged to the fund based on rates determined pursuant to the terms of the respective Facility at the time of borrowing. During the period ended April 30, 2019, the fund did not borrow under the Facilities.
NOTE 3—Management Fee and Other Transactions with Affiliates:
(a)Pursuant to a management agreement with the Adviser, the management fee is computed at the annual rate of .55% of the value of the fund’s average daily net assets and is payable monthly.
During the period ended April 30, 2019, the Distributor retained $149 from commissions earned on sales of the fund’s Class A shares.
(b) Under the Distribution Plan adopted pursuant to Rule 12b-1 under the Act, Class C shares pay the Distributor for distributing its shares at an annual rate of .75% of the value of its average daily net assets. During the period ended April 30, 2019, Class C shares were charged $2,600 pursuant to the Distribution Plan.
(c)Under the Shareholder Services Plan, Class A and Class C shares pay the Distributor at an annual rate of .25% of the value of their average daily net assets for the provision of certain services. The services provided may include personal services relating to shareholder accounts, such as answering shareholder inquiries regarding the fund and providing reports and other information, and services related to the maintenance of shareholder accounts. The Distributor may make payments to Service Agents (securities dealers, financial institutions or other industry professionals) with respect to these services. The Distributor determines
29
NOTES TO FINANCIAL STATEMENTS(continued)
the amounts to be paid to Service Agents. During the period ended April 30, 2019, Class A and Class C shares were charged $59,936and $867, respectively, pursuant to the Shareholder Services Plan.
Under the Shareholder Services Plan, Class Z shares reimburse the Distributor at an amount not to exceed an annual rate of .25% of the value of Class Z shares’ average daily net assets for the provision of certain services. The services provided may include personal services relating to shareholder accounts, such as answering shareholder inquiries regarding Class Z shares and providing reports and other information, and services related to the maintenance of shareholder accounts. During the period ended April 30, 2019,Class Z shares were charged $49,164 pursuant to the Shareholder Services Plan.
The fund has arrangements with the transfer agent and the custodian whereby the fund may receive earnings credits when positive cash balances are maintained, which are used to offset transfer agency and custody fees. For financial reporting purposes, the fund includes net earnings credits, if any, as an expense offset in the Statement of Operations.
The fund compensates BNY Mellon Transfer, Inc., a wholly-owned subsidiary of the Adviser, under a transfer agency agreement for providing transfer agency and cash management services for the fund. The majority of transfer agency fees are comprised of amounts paid on a per account basis, while cash management fees are related to fund subscriptions and redemptions. During the period ended April 30, 2019, the fund was charged $34,219 for transfer agency services. These fees are included in Shareholder servicing costs in the Statement of Operations.
The fund compensates The Bank of New York Mellon under a custody agreement for providing custodial services for the fund. These fees are determined based on net assets, geographic region and transaction activity. During the period ended April 30, 2019, the fund was charged $711 pursuant to the custody agreement. These fees were offset by earnings credits of $711.
The fund compensates The Bank of New York Mellon under a shareholder redemption draft processing agreement for providing certain services related to the fund’s check writing privilege. During the period ended April 30, 2019, the fund was charged $1,551 pursuant to the agreement, which is included in Shareholder servicing costs in the Statement of Operations. These fees were partially offset by earnings credits of $12.
30
During the period ended April 30, 2019, the fund was charged $12,173 for services performed by the Chief Compliance Officer and his staff. These fees are included in Miscellaneous in the Statement of Operations.
The components of “Due to BNY Mellon Investment Adviser, Inc. and affiliates” in the Statement of Assets and Liabilities consist of: management fees $61,778, Distribution Plan fees $203, Shareholder Services Plan fees $4,768, custodian fees $1,051, Chief Compliance Officer fees $6,790 and transfer agency fees $6,438.
(d) Each Board member also serves as a Board member of other funds in the BNY Mellon Family of Funds complex. Annual retainer fees and attendance fees are allocated to each fund based on net assets.
NOTE 4—Securities Transactions:
The aggregate amount of purchases and sales of investment securities, excluding short-term securities, during the period ended April 30, 2019, amounted to $6,411,175 and $14,617,048, respectively.
At April 30, 2019, the cost of investments for federal income tax purposes was $129,486,512; accordingly, accumulated net unrealized appreciation on investments was $5,613,244, consisting of $6,154,780 gross unrealized appreciation and $541,536 gross unrealized depreciation.
31
REPORT OF INDEPENDENT REGISTERED PUBLIC ACCOUNTING FIRM
To the Shareholders and the Board of Trustees of BNY Mellon Massachusetts Fund (formerly, Dreyfus Massachusetts Fund)
Opinion on the Financial Statements
We have audited the accompanying statement of assets and liabilities of BNY Mellon Massachusetts Fund (the “Fund”) (formerly, Dreyfus Massachusetts Fund) (one of the funds constituting BNY Mellon State Municipal Bond Funds), including the statement of investments, as of April 30, 2019, and the related statement of operations for the year then ended, the statements of changes in net assets for each of the two years in the period then ended, the financial highlights for each of the five years in the period then ended and the related notes (collectively referred to as the “financial statements”). In our opinion, the financial statements present fairly, in all material respects, the financial position of the Fund (one of the funds constituting BNY Mellon State Municipal Bond Funds) at April 30, 2019, the results of its operations for the year then ended, the changes in its net assets for each of the two years in the period then ended and its financial highlights for each of the five years in the period then ended, in conformity with U.S. generally accepted accounting principles.
Basis for Opinion
These financial statements are the responsibility of the Fund’s management. Our responsibility is to express an opinion on the Fund’s financial statements based on our audits. We are a public accounting firm registered with the Public Company Accounting Oversight Board (United States) (“PCAOB”) and are required to be independent with respect to the Fund in accordance with the U.S. federal securities laws and the applicable rules and regulations of the Securities and Exchange Commission and the PCAOB.
We conducted our audits in accordance with the standards of the PCAOB. Those standards require that we plan and perform the audit to obtain reasonable assurance about whether the financial statements are free of material misstatement, whether due to error or fraud. The Fund is not required to have, nor were we engaged to perform, an audit of the Fund’s internal control over financial reporting. As part of our audits, we are required to obtain an understanding of internal control over financial reporting, but not for the purpose of expressing an opinion on the effectiveness of the Fund’s internal control over financial reporting. Accordingly, we express no such opinion.
Our audits included performing procedures to assess the risks of material misstatement of the financial statements, whether due to error or fraud, and performing procedures that respond to those risks. Such procedures included examining, on a test basis, evidence regarding the amounts and disclosures in the financial statements. Our procedures included confirmation of securities owned as of April 30, 2019, by correspondence with the custodian and others or by other appropriate auditing procedures where replies from others were not received. Our audits also included evaluating the accounting principles used and significant estimates made by management, as well as evaluating the overall presentation of the financial statements. We believe that our audits provide a reasonable basis for our opinion.

We have served as the auditor of one or more investment companies in the BNY Mellon Family of Funds since at least 1957, but we are unable to determine the specific year.
New York, New York
June 26, 2019
32
IMPORTANT TAX INFORMATION(Unaudited)
In accordance with federal tax law, the fund hereby reports all the dividends paid from investment income-net during its fiscal year ended April 30, 2019 as “exempt-interest dividends” (not subject to regular federal income tax, and for individuals who are Massachusetts residents, Massachusetts personal income taxes). Where required by federal tax law rules, shareholders will receive notification of their portion of the fund’s taxable ordinary dividends (if any), capital gains distributions (if any) and tax-exempt dividends paid for the 2019 calendar year on Form 1099-DIV which will be mailed in early 2020.
33
BOARD MEMBERS INFORMATION(Unaudited)
INDEPENDENT BOARD MEMBERS
Chairman of the Board (1995)
Principal Occupation During Past 5 Years:
· Corporate Director and Trustee (1995-present)
Other Public Company Board Memberships During Past 5 Years:
· CBIZ (formerly, Century Business Services, Inc.), a provider of outsourcing functions for small and medium size companies, Director (1997-present)
No. of Portfolios for which Board Member Serves:120
———————
Francine J. Bovich (67)
Board Member (2012)
Principal Occupation During Past 5 Years:
· Trustee, The Bradley Trusts, private trust funds (2011-present)
Other Public Company Board Memberships During Past 5 Years:
· Annaly Capital Management, Inc., a real estate investment trust, Director (2014-present)
No. of Portfolios for which Board Member Serves:69
———————
Peggy C. Davis (76)
Board Member (1990)
Principal Occupation During Past 5 Years:
· Shad Professor of Law, New York University School of Law (1983-present)
No. of Portfolios for which Board Member Serves:44
———————
Diane Dunst (79)
Board Member (2007)
Principal Occupation During Past 5 Years:
· President of Huntting House Antiques (1999-present)
No. of Portfolios for which Board Member Serves:14
———————
34
Nathan Leventhal (76)
Board Member (1989)
Principal Occupation During Past 5 Years:
· President Emeritus of Lincoln Center for the Performing Arts (2001-present)
· Chairman of the Avery Fisher Artist Program (1997-2014)
Other Public Company Board Memberships During Past 5 Years:
· Movado Group, Inc., Director (2003-present)
No. of Portfolios for which Board Member Serves:47
———————
Robin A. Melvin (55)
Board Member (2012)
Principal Occupation During Past 5 Years:
· Co-chairman, Illinois Mentoring Partnership, non-profit organization dedicated to increasing the quantity and quality of mentoring services in Illinois (2014-present; board member since 2013)
No. of Portfolios for which Board Member Serves:98
———————
Once elected all Board Members serve for an indefinite term, but achieve Emeritus status upon reaching age 80. The address of the Board Members and Officers is c/o BNY Mellon Investment Adviser, Inc. 240 Greenwich Street, New York, New York 10166. Additional information about the Board Member is available in the fund’s Statement of Additional Information which can be obtained from the Adviser free of charge by calling this toll free number: 1-800-373-9387.
Clifford L. Alexander, Jr., Emeritus Board Member
Ernest Kafka, Emeritus Board Member
Daniel Rose, Emeritus Board Member
35
OFFICERS OF THE FUND(Unaudited)
RENEE LAROCHE-MORRIS, President since January 2018.
President and a director of BNY Mellon Investment Adviser, Inc. since January 2018. She is an officer of 62 investment companies (comprised of 120 portfolios) managed by the Adviser. She is 48 years old and has been an employee of BNY Mellon since 2003.
JAMES WINDELS, Treasurer since November 2001.
Director- BNY Mellon Fund Administration, and an officer of 63 investment companies (comprised of 143 portfolios) managed by the Adviser. He is 60 years old and has been an employee of the Adviser since April 1985.
BENNETT A. MACDOUGALL, Chief Legal Officer since October 2015.
Chief Legal Officer of the Adviser and Associate General Counsel and Managing Director of BNY Mellon since June 2015; Director and Associate General Counsel of Deutsche Bank – Asset & Wealth Management Division from June 2005 to June 2015, and as Chief Legal Officer of Deutsche Investment Management Americas Inc. from June 2012 to May 2015. He is an officer of 63 investment companies (comprised of 143 portfolios) managed by the Adviser. He is 47 years old and has been an employee of the Adviser since June 2015.
DAVID DIPETRILLO, Vice President since January 2018.
Head of North America Product, BNY Mellon Investment Management since January 2018, Director of Product Strategy, BNY Mellon Investment Management from January 2016 to December 2017; Head of US Retail Product and Channel Marketing, BNY Mellon Investment Management from January 2014 to December 2015. He is an officer of 62 investment companies (comprised of 120 portfolios) managed by the Adviser. He is 41 years old and has been an employee of BNY Mellon since 2005.
JAMES BITETTO, Vice President since August 2005 and Secretary since February 2018.
Managing Counsel of BNY Mellon and Secretary of the Adviser, and an officer of 63 investment companies (comprised of 143 portfolios) managed by the Adviser. He is 52 years old and has been an employee of the Adviser since December 1996.
SONALEE CROSS, Vice President and Assistant Secretary since March 2018.
Counsel of BNY Mellon since October 2016; Associate at Proskauer Rose LLP from April 2016 to September 2016; Attorney at EnTrust Capital from August 2015 to February 2016; Associate at Sidley Austin LLP from September 2013 to August 2015. She is an officer of 63 investment companies (comprised of 143 portfolios) managed by the Adviser. She is 31 years old and has been an employee of the Adviser since October 2016.
DEIRDRE CUNNANE, Vice President and Assistant Secretary since March 2019.
Counsel of BNY Mellon since August 2018; Senior Regulatory Specialist at BNY Mellon Investment Management Services from February 2016 to August 2018; Trustee Associate at BNY Mellon Trust Company (Ireland) Limited from August 2013 to February 2016. She is an officer of 63 investment companies (comprised of 143 portfolios) managed by the Adviser. She is 28 years old and has been an employee of the Adviser since August 2018.
SARAH S. KELLEHER, Vice President and Assistant Secretary since April 2014.
Managing Counsel of BNY Mellon since December 2017, Senior Counsel of BNY Mellon from March 2013 to December 2017. She is an officer of 63 investment companies (comprised of 143 portfolios) managed by the Adviser. She is 43 years old and has been an employee of the Adviser since March 2013.
JEFF PRUSNOFSKY, Vice President and Assistant Secretary since August 2005.
Senior Managing Counsel of BNY Mellon, and an officer of 63 investment companies (comprised of 143 portfolios) managed by the Adviser. He is 54 years old and has been an employee of the Adviser since October 1990.
PETER M. SULLIVAN, Vice President and Assistant Secretary since March 2019.
Managing Counsel of BNY Mellon, and an officer of 63 investment companies (comprised of 143 portfolios) managed by the Adviser. He is 51 years old and has been an employee of the Adviser since April 2004.
36
NATALYA ZELENSKY, Vice President and Assistant Secretary since March 2017.
Counsel of BNY Mellon since May 2016; Attorney at Wildermuth Endowment Strategy Fund/Wildermuth Advisory, LLC from November 2015 to May 2016 and Assistant General Counsel at RCS Advisory Services from July 2014 to November 2015. She is an officer of 63 investment companies (comprised of 143 portfolios) managed by the Adviser. She is 34 years old and has been an employee of the Adviser since May 2016.
GAVIN C. REILLY, Assistant Treasurer since December 2005.
Tax Manager of BNY Mellon Fund Administration, and an officer of 63 investment companies (comprised of 143 portfolios) managed by the Adviser. He is 50 years old and has been an employee of the Adviser since April 1991.
ROBERT S. ROBOL, Assistant Treasurer since August 2005.
Senior Accounting Manager- BNY Mellon Fund Administration, and an officer of 63 investment companies (comprised of 143 portfolios) managed by the Adviser. He is 55 years old and has been an employee of the Adviser since October 1988.
ROBERT SALVIOLO, Assistant Treasurer since July 2007.
Senior Accounting Manager – BNY Mellon Fund Administration, and an officer of 63 investment companies (comprised of 143 portfolios) managed by the Adviser. He is 52 years old and has been an employee of the Adviser since June 1989.
ROBERT SVAGNA, Assistant Treasurer since August 2005.
Senior Accounting Manager – BNY Mellon Fund Administration, and an officer of 63 investment companies (comprised of 143 portfolios) managed by the Adviser. He is 52 years old and has been an employee of the Adviser since November 1990.
JOSEPH W. CONNOLLY, Chief Compliance Officer since October 2004.
Chief Compliance Officer of the Adviser, the BNY Mellon Family of Funds and BNY Mellon Funds Trust (63 investment companies, comprised of 143 portfolios). He is 62 years old and has served in various capacities with the Adviser since 1980, including manager of the firm’s Fund Accounting Department from 1997 through October 2001.
CARIDAD M. CAROSELLA, Anti-Money Laundering Compliance Officer since January 2016.
Anti-Money Laundering Compliance Officer of the BNY Mellon Family of Funds and BNY Mellon Funds Trust since January 2016; from May 2015 to December 2015, Interim Anti-Money Laundering Compliance Officer of the BNY Mellon Family of Funds and BNY Mellon Funds Trust and the Distributor; from January 2012 to May 2015, AML Surveillance Officer of the Distributor. She is an officer of 57 investment companies (comprised of 137 portfolios) managed by the Adviser. She is 50 years old and has been an employee of the Distributor since 1997.
37
BNY Mellon State Municipal Bond Funds, BNY Mellon Massachusetts Fund
240 Greenwich Street
New York, NY 10286
Adviser
BNY Mellon Investment Adviser, Inc.
240 Greenwich Street
New York, NY 10286
Custodian
The Bank of New York Mellon
240 Greenwich Street
New York, NY 10286
Transfer Agent &
Dividend Disbursing Agent
BNY Mellon Transfer, Inc.
240 Greenwich Street
New York, NY 10286
Distributor
BNY Mellon Securities Corporation
240 Greenwich Street
New York, NY 10286
Ticker Symbols: | Class A: PSMAX Class C: PCMAX Class Z: PMAZX |
Telephone Call your financial representative or 1-800-373-9387
Mail The BNY Mellon Family of Funds, 144 Glenn Curtiss Boulevard, Uniondale, NY 11556-0144
E-mailSend your request toinfo@bnymellon.com
InternetInformation can be viewed online or downloaded atwww.bnymellonim.com/us
The fund files its complete schedule of portfolio holdings with the Securities and Exchange Commission (“SEC”) for the first and third quarters of each fiscal year on Form N-PORT. The fund’s Forms N-PORT are available on the SEC’s website atwww.sec.gov.
A description of the policies and procedures that the fund uses to determine how to vote proxies relating to portfolio securities and information regarding how the fund voted these proxies for the most recent 12-month period ended June 30 is available atwww.bnymellonim.com/us and on the SEC’s website atwww.sec.gov and without charge, upon request, by calling 1-800-373-9387.
© 2019 BNY Mellon Securities Corporation |
|

BNY Mellon State Municipal Bond Funds, BNY Mellon Pennsylvania Fund
ANNUAL REPORT April 30, 2019 |
Save time. Save paper. View your next shareholder report online as soon as it’s available. Log into www.bnymellonim.com/us and sign up for eCommunications. It’s simple and only takes a few minutes. |
The views expressed in this report reflect those of the portfolio manager(s) only through the end of the period covered and do not necessarily represent the views of BNY Mellon Investment Adviser, Inc. or any other person in the BNY Mellon Investment Adviser, Inc. organization. Any such views are subject to change at any time based upon market or other conditions and BNY Mellon Investment Adviser, Inc. disclaims any responsibility to update such views. These views may not be relied on as investment advice and, because investment decisions for a fund in the BNY Mellon Family of Funds are based on numerous factors, may not be relied on as an indication of trading intent on behalf of any fund in the BNY Mellon Family of Funds. |
Not FDIC-Insured • Not Bank-Guaranteed • May Lose Value |
Contents
THE FUND
BNY Mellon Investment Adviser, Inc. | |
With Those of Other Funds | |
Public Accounting Firm | |
FOR MORE INFORMATION
Back Cover
| The Fund |
A LETTER FROM THE PRESIDENT OF BNY MELLON INVESTMENT ADVISER, INC.
Dear Shareholder:
We are pleased to present this annual report for BNY Mellon Pennsylvania Fund (formerly the Dreyfus Pennsylvania Fund), covering the 12-month period from May 1, 2018 through April 30, 2019. For information about how the fund performed during the reporting period, as well as general market perspectives, we provide a Discussion of Fund Performance on the pages that follow.
At the beginning of the reporting period, developed economies outside of the U.S. continued to weaken, while the U.S. economy sustained its relatively healthy growth rate. Calm markets prevailed throughout the summer, as robust growth and strong corporate earnings supported U.S. stock returns, while other developed markets continued to decline.
The fourth quarter of 2018 saw broad market weakness, due in part to heightened concerns about interest-rate increases, trade tensions and slowing global growth. The slump largely erased prior gains on U.S. indices, while losses deepened in international markets. December experienced a sharp sell-off, as it appeared that the U.S. Federal Reserve (the “Fed”) would maintain its hawkish stance on monetary policy. However, comments made in January by the Fed indicated that it would slow the pace of interest-rate increases, and this helped stimulate a rebound across equity markets that continued through the end of the reporting period.
Fixed-income markets declined early in the period, as interest rates and inflation rose, pressuring most bond prices. Comparatively strong U.S. equity markets fed investor risk appetites, reducing the demand for Treasuries and increasing yields. But a return of stock-market volatility in October triggered a flight to quality, boosting Treasury prices and flattening the yield curve. Corporate bonds, however, were hindered somewhat by concerns about economic growth, resulting in widening spreads and lower prices through November. In January, when the Fed’s comments indicated that rate increases would be less likely in 2019, bond markets rallied, and most U.S. indices continued to post positive returns through the end of April.
We remain positive on the near-term economic outlook for the U.S. but will monitor relevant data for any signs of a change. As always, we encourage you to discuss the risks and opportunities in today’s investment environment with your financial advisor.
Thank you for your continued confidence and support.
Sincerely,

Renee LaRoche-Morris
President
BNY Mellon Investment Adviser, Inc.
June 3, 2019
2
DISCUSSION OF FUND PERFORMANCE(Unaudited)
For the period from May 1, 2018 through April 30, 2019, as provided by Daniel Rabasco and Thomas Casey, Portfolio Managers
Market and Fund Performance Overview
For the 12-month period ended April 30, 2019, Class A shares of BNY Mellon Pennsylvania Fund (formerly, Dreyfus Pennsylvania Fund), a series of BNY Mellon State Municipal Bond Funds (formerly, Dreyfus State Municipal Bond Funds), produced a total return of 4.97%, Class C shares returned 4.12% and Class Z shares returned 5.18%.1 In comparison, the Bloomberg Barclays U.S. Municipal Bond Index (the “Index”), the fund’s benchmark index, which is comprised of bonds issued nationally and not solely within Pennsylvania, achieved a total return of 6.16% for the same period.2
Municipal bonds during the reporting period encountered bouts of volatility stemming from rising interest rates and shifting supply-and-demand dynamics in the municipal securities market. The fund underperformed the Index, mainly due to its sector allocation strategy.
The Fund’s Investment Approach
The fund seeks to maximize current income exempt from federal income tax and from Pennsylvania state income tax, without undue risk. To pursue its goal, the fund normally invests at least 80% of its net assets, plus any borrowings for investment purposes, in municipal bonds that provide income exempt from federal and Pennsylvania state income taxes. The fund invests at least 70% of its assets in municipal bonds rated, at the time of purchase, investment grade (Baa/BBB or higher) or the unrated equivalent as determined by BNY Mellon Investment Adviser, Inc. (formerly, The Dreyfus Corporation). For additional yield, the fund may invest up to 30% of its assets in municipal bonds rated below investment grade (“high yield” or “junk” bonds) or the unrated equivalent as determined by BNY Mellon Investment Adviser, Inc. The dollar-weighted average maturity of the fund’s portfolio normally exceeds 10 years, but the fund may invest without regard to maturity.
The portfolio managers focus on identifying undervalued sectors and securities and minimize the use of interest-rate forecasting. The portfolio managers select municipal bonds for the fund’s portfolio by using fundamental credit analysis to estimate the relative value and attractiveness of various sectors and securities and to exploit pricing inefficiencies in the municipal bond market; and actively trading among various sectors, such as pre-refunded, general obligation and revenue, based on their apparent relative values. The fund seeks to invest in several of these sectors.
A Shift in Federal Reserve Policy Drove Municipal Bonds
Municipal bonds struggled during the first two-thirds of the reporting period, as the economy continued to perform well, and the Federal Reserve (the “Fed”) continued on a path of raising short-term interest rates. The Fed hiked the federal funds policy rate three times during the reporting period, bringing the target rate to 2.25%-2.50%. Flows into municipal bond funds were fairly steady and supply also was manageable, as new issuance for 2018 came in approximately 24% below that of 2017.
From a macroeconomic perspective, data became more mixed towards the end of 2018, and investors became increasingly concerned about the effect of the Fed’s hawkish stance on
3
DISCUSSION OF FUND PERFORMANCE(Unaudited) (continued)
interest rates. This resulted in some volatility in capital markets that resulted in a “flight to quality” in which higher-quality securities, including municipal bonds, rallied strongly. The Fed’s shift to a more dovish stance also fed demand, as it confirmed investor concerns about a possible weakening of the economy.
As 2019 progressed, supply through the first four months of the year continued to be manageable, while demand rallied significantly and fund flows surged, hitting record levels. Investors, especially those in high-tax states, reacted to the impact on their tax bills from the Tax Cuts and Jobs Act of 2017 and the new cap on the deductibility of state and local taxes. In response, these investors sought tax-exempt municipal bonds as a tax shelter. Also, the relative stability of the municipal bond market compared to that of the equity markets also attracted investors.
The flight to quality caused rates to fall, and investors then began to reach for yield. As a result, longer-term municipals, especially those 10 years and longer, experienced a greater compression of yields than did shorter maturities, resulting in a flatter municipal bond yield curve. The ratio of municipal bond yields to Treasury yields fell significantly, especially for longer-dated bonds, reflecting the outperformance of municipal bonds versus Treasuries. Investors also began to reach for the yield available from lower-quality issues, resulting in a tightening of quality spreads.
Although long-term obligations, including pension and health care liabilities, remain a concern, credit quality remained stable to strong during the period. Driven by continued economic strength, tax revenues were healthy, allowing many issuers to increase their “rainy day” funds. Tobacco bonds, those backed by certain states’ settlement of litigation with U.S. tobacco companies, were hurt by a proposal by the Food and Drug Administration to ban menthol cigarettes.
In Pennsylvania, the economy continues to perform well. Unemployment remained roughly the same as the national average, and household income continued to be above the national median. In addition, the state passed its fiscal year 2020 budget on time, and it was able to make its required annual payment to the state employee pension fund. Nevertheless, pension costs make up more than 10% of the budget, and the pension plan remains less than 60% funded.
Sector Allocation Hampered Fund Results
The fund’s performance versus the Index was hampered during the reporting period by the sector allocation strategy. Both the overweight to revenue bonds and the underweight to general obligation bonds constrained performance during the period. In particular, Index exposure to Illinois general obligation bonds, which performed well while the fund maintained no exposure to this out-of-state credit, was a major reason for the fund’s underperformance. Another detractor was the fund’s allocation to the hospital/health care sector, which produced weaker results during the reporting period.
On a more positive note, the fund’s yield-curve positioning contributed positively to its results; both the overweight to 10-year maturities and the underweight to shorter maturities were additive to returns. The fund’s allocation to A and BBB rated bonds also contributed positively.
4
A Constructive Investment Posture
The domestic economy remains strong, fueled by the 2017 tax cuts. Employment continues to be robust, with unemployment at near-record-low levels, and wage growth is picking up, further raising the prospect of an increase in inflation. One risk to this outlook is a deterioration in trade relations, which could derail the economy’s momentum. While market participants are concerned over the impact of trade tensions on economic growth, we believe the Fed is looking forward, focusing on economic data and, for the near term, will be on hold in adjusting short-term rates.
Nevertheless, even if rates eventually rise moderately over the coming year, demand for municipal bonds should remain strong and supply manageable. The municipal bond market should perform relatively well. In addition, the cap on federal deductibility of state and local taxes will continue to help drive demand for municipal securities, encouraging the reinvestment of the proceeds of a large number of bonds that are due to mature in the coming months. We expect to keep the fund’s duration neutral to modestly long relative to the benchmark, and we will continue to focus on security selection, emphasizing undervalued issues and relying on our credit research capabilities.
June 3, 2019
1 Total return includes reinvestment of dividends and any capital gains paid and does not take into consideration the maximum initial sales charge in the case of Class A shares or the applicable contingent deferred sales charge imposed on redemptions in the case of Class C shares. Had these charges been reflected, returns would have been lower. Class Z is not subject to any initial or deferred sales charge. Past performance is no guarantee of future results. Share price, yield, and investment return fluctuate such that upon redemption, fund shares may be worth more or less than their original cost. Income may be subject to state and local taxes, and some income may be subject to the federal alternative minimum tax (AMT) for certain investors. Capital gains, if any, are taxable.
2 Source: Lipper Inc. — The Bloomberg Barclays U.S. Municipal Bond Index covers the U.S. dollar-denominated long-term tax-exempt bond market. Investors cannot invest directly in any index.
Bonds are subject generally to interest-rate, credit, liquidity, and market risks, to varying degrees, all of which are more fully described in the fund’s prospectus. Generally, all other factors being equal, bond prices are inversely related to interest-rate changes, and rate increases can cause price declines.
The amount of public information available about municipal bonds is generally less than that for corporate equities or bonds. Special factors, such as legislative changes, and state and local economic and business developments, may adversely affect the yield and/or value of the fund’s investments in municipal bonds. Other factors include the general conditions of the municipal bond market, the size of the particular offering, the maturity of the obligation, and the rating of the issue. Changes in economic, business, or political conditions relating to a particular municipal project, municipality, or state in which the fund invests may have an impact on the fund’s share price.
5
FUND PERFORMANCE(Unaudited)
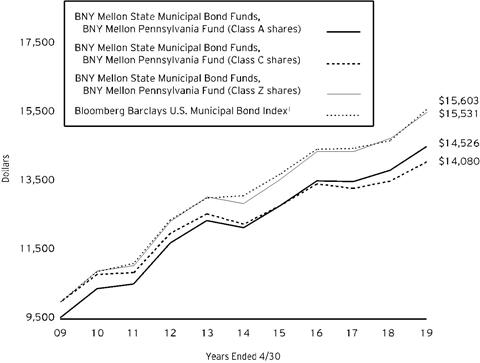
Comparison of change in value of a $10,000 investment in Class A shares, Class C shares and Class Z shares of BNY Mellon State Municipal Bond Funds, BNY Mellon Pennsylvania Fund with a hypothetical investment of $10,000 in the Bloomberg Barclays U.S. Municipal Bond Index (the “Index”).
† Source: Lipper Inc.
Past performance is not predictive of future performance.
The above graph compares a hypothetical $10,000 investment made in each of the Class A, Class C and Class Z shares of BNY Mellon State Municipal Bond Funds, BNY Mellon Pennsylvania Fund on 4/30/09 to a hypothetical investment of $10,000 made in the Index on that date. All dividends and capital gain distributions are reinvested.
The fund’s performance shown in the line graph above takes into account the maximum initial sales charge on Class A shares and all other applicable fees and expenses on all classes. The Index is not limited to investments principally in Pennsylvania municipal obligations. The Index, unlike the fund, covers the U.S. dollar-denominated long-term tax-exempt bond market. These factors can contribute to the Index potentially outperforming or underperforming the fund. Unlike a mutual fund, the Index is not subject to charges, fees and other expenses. Investors cannot invest directly in any index. Further information relating to fund performance, including expense reimbursements, if applicable, is contained in the Financial Highlights section of the prospectus and elsewhere in this report.
6
Average Annual Total Returns as of 4/30/19 | ||||||
1 Year | 5 Years | 10 Years | ||||
| ||||||
Class A shares | ||||||
with maximum sales charge (4.5%) | 0.22% | 2.67% | 3.80% | |||
without sales charge | 4.97% | 3.61% | 4.28% | |||
Class C shares | ||||||
with applicable redemption charge† | 3.12% | 2.80% | 3.48% | |||
without redemption | 4.12% | 2.80% | 3.48% | |||
Class Z shares | 5.18% | 3.82% | 4.50% | |||
Bloomberg Barclays U.S. | 6.16% | 3.56% | 4.55% | |||
† The maximum contingent deferred sales charge for Class C shares is 1% for shares redeemed within one year of the date of purchase.
The performance data quoted represents past performance, which is no guarantee of future results. Share price and investment return fluctuate and an investor’s shares may be worth more or less than original cost upon redemption. Current performance may be lower or higher than the performance quoted. Go to bnymellonim.com/us for the fund’s most recent month-end returns.
The fund’s performance shown in the graph and table does not reflect the deduction of taxes that a shareholder would pay on fund distributions or the redemption of fund shares. In addition to the performance of Class A shares shown with and without a maximum sales charge, the fund’s performance shown in the table takes into account all other applicable fees and expenses on all classes.
7
UNDERSTANDING YOUR FUND’S EXPENSES(Unaudited)
As a mutual fund investor, you pay ongoing expenses, such as management fees and other expenses. Using the information below, you can estimate how these expenses affect your investment and compare them with the expenses of other funds. You also may pay one-time transaction expenses, including sales charges (loads) and redemption fees, which are not shown in this section and would have resulted in higher total expenses. For more information, see your fund’s prospectus or talk to your financial adviser.
Review your fund’s expenses
The table below shows the expenses you would have paid on a $1,000 investment in BNY Mellon State Municipal Bond Funds, BNY Mellon Pennsylvania Fund from November 1, 2018 to April 30, 2019. It also shows how much a $1,000 investment would be worth at the close of the period, assuming actual returns and expenses.
Expenses and Value of a $1,000 Investment | ||||||||||||||
assuming actual returns for the six months ended April 30, 2019 | ||||||||||||||
|
|
| Class A | Class C | Class Z | |||||||||
Expenses paid per $1,000† |
| $5.08 |
| $9.27 |
| $4.27 | ||||||||
Ending value (after expenses) |
| $1,049.00 |
| $1,044.10 |
| $1,049.50 | ||||||||
COMPARING YOUR FUND’S EXPENSES
WITH THOSE OF OTHER FUNDS(Unaudited)
Using the SEC’s method to compare expenses
The Securities and Exchange Commission (“SEC”) has established guidelines to help investors assess fund expenses. Per these guidelines, the table below shows your fund’s expenses based on a $1,000 investment, assuming a hypothetical 5% annualized return. You can use this information to compare the ongoing expenses (but not transaction expenses or total cost) of investing in the fund with those of other funds. All mutual fund shareholder reports will provide this information to help you make this comparison. Please note that you cannot use this information to estimate your actual ending account balance and expenses paid during the period.
Expenses and Value of a $1,000 Investment | |||||||||||||||
assuming a hypothetical 5% annualized return for the six months ended April 30, 2019 | |||||||||||||||
|
|
|
| Class A | Class C | Class Z | |||||||||
Expenses paid per $1,000† |
| $5.01 |
| $9.15 |
| $4.21 | |||||||||
Ending value (after expenses) |
| $1,019.84 |
| $1,015.72 |
| $1,020.63 | |||||||||
† Expenses are equal to the fund’s annualized expense ratio of 1.00% for Class A, 1.83% for Class C and .84% for Class Z, multiplied by the average account value over the period, multiplied by 181/365 (to reflect the one-half year period).
8
STATEMENT OF INVESTMENTS
April 30, 2019
Description | Coupon | Maturity | Principal | Value ($) | |||||
Long-Term Municipal Investments - 98.6% | |||||||||
Pennsylvania - 97.7% | |||||||||
Adams County Industrial Development Authority, | 5.00 | 8/15/2025 | 1,000,000 | 1,038,820 | |||||
Allegheny County, | 5.00 | 12/1/2034 | 3,000,000 | 3,293,700 | |||||
Allegheny County, | 5.00 | 12/1/2034 | 1,000,000 | 1,139,260 | |||||
Allegheny County, | 5.00 | 12/1/2031 | 1,040,000 | 1,192,558 | |||||
Allegheny County Hospital Development Authority, | 5.00 | 4/1/2031 | 2,000,000 | 2,359,460 | |||||
Allentown Neighborhood Improvement Zone Development Authority, | 5.00 | 5/1/2033 | 500,000 | a | 559,920 | ||||
Allentown Neighborhood Improvement Zone Development Authority, | 5.00 | 5/1/2042 | 1,000,000 | a | 1,079,230 | ||||
Beaver County Hospital Authority, | 5.00 | 5/15/2028 | 1,575,000 | 1,664,145 | |||||
Berks County Industrial Development Authority, | 5.00 | 5/15/2038 | 415,000 | 454,803 | |||||
Berks County Industrial Development Authority, | 5.00 | 5/15/2043 | 500,000 | 545,235 | |||||
Berks County Industrial Development Authority, | 5.00 | 5/15/2042 | 500,000 | 547,795 | |||||
Berks County Industrial Development Authority, | 5.00 | 5/15/2047 | 600,000 | 656,082 | |||||
9
STATEMENT OF INVESTMENTS (continued)
Description | Coupon | Maturity | Principal | Value ($) | |||||
Long-Term Municipal Investments - 98.6% (continued) | |||||||||
Pennsylvania - 97.7% (continued) | |||||||||
Bethlehem Authority, | 5.00 | 11/15/2031 | 2,000,000 | 2,194,480 | |||||
Boyertown Area School District, | 5.00 | 10/1/2037 | 2,050,000 | 2,249,588 | |||||
Bucks County Water and Sewer Authority, | 5.00 | 12/1/2037 | 500,000 | 571,850 | |||||
Canonsburg-Houston Joint Authority, | 5.00 | 12/1/2040 | 2,000,000 | 2,248,720 | |||||
Centre County Hospital Authority, | 5.00 | 11/15/2041 | 750,000 | 834,803 | |||||
Charleroi Area School Authority, | 0.00 | 10/1/2020 | 2,000,000 | b | 1,932,860 | ||||
Clairton Municipal Authority, | 5.00 | 12/1/2037 | 2,000,000 | 2,145,660 | |||||
Commonwealth Financing Authority, | 5.00 | 6/1/2034 | 1,000,000 | 1,175,740 | |||||
Commonwealth of Pennsylvania, | 5.00 | 7/1/2034 | 1,000,000 | 1,159,610 | |||||
Commonwealth of Pennsylvania, | 5.00 | 10/15/2029 | 1,500,000 | 1,690,350 | |||||
Cumberland County Municipal Authority, | 5.00 | 1/1/2038 | 1,000,000 | 1,075,960 | |||||
Dauphin County General Authority, | 5.00 | 6/1/2042 | 3,030,000 | 3,225,102 | |||||
Delaware County Authority, | 5.00 | 8/1/2040 | 2,170,000 | 2,476,903 | |||||
Delaware County Authority, | 5.00 | 7/1/2042 | 1,000,000 | 1,073,370 | |||||
Delaware River Joint Toll Bridge Commission, | 5.00 | 7/1/2032 | 1,000,000 | 1,194,890 | |||||
10
Description | Coupon | Maturity | Principal | Value ($) | |||||
Long-Term Municipal Investments - 98.6% (continued) | |||||||||
Pennsylvania - 97.7% (continued) | |||||||||
Delaware River Port Authority, | 5.00 | 1/1/2037 | 3,000,000 | 3,357,930 | |||||
Delaware Valley Regional Finance Authority, | 2.72 | 9/1/2022 | 2,000,000 | c | 2,000,020 | ||||
Dover Area School District, | 5.00 | 4/1/2036 | 800,000 | 935,224 | |||||
Dover Area School District, | 5.00 | 4/1/2035 | 1,000,000 | 1,173,200 | |||||
East Hempfield Township Industrial Development Authority, | 5.00 | 12/1/2039 | 600,000 | 663,846 | |||||
Franklin County Industrial Development Authority, | 5.00 | 12/1/2048 | 1,000,000 | 1,064,970 | |||||
Geisinger Authority, | 5.00 | 6/1/2041 | 2,500,000 | 2,758,275 | |||||
General Authority of Southcentral Pennsylvania, | 5.00 | 6/1/2044 | 1,000,000 | 1,180,830 | |||||
Lancaster County Hospital Authority, | 5.00 | 11/1/2035 | 1,000,000 | 1,103,690 | |||||
Lancaster County Hospital Authority, | 5.13 | 7/1/2037 | 1,000,000 | 1,059,770 | |||||
Lancaster County Hospital Authority, | 5.00 | 8/15/2042 | 1,800,000 | 2,074,590 | |||||
Montgomery County Higher Education & Health Authority, | 5.00 | 12/1/2047 | 1,000,000 | 1,063,400 | |||||
Montgomery County Industrial Development Authority, | 5.00 | 11/15/2036 | 3,200,000 | 3,591,744 | |||||
11
STATEMENT OF INVESTMENTS (continued)
Description | Coupon | Maturity | Principal | Value ($) | |||||
Long-Term Municipal Investments - 98.6% (continued) | |||||||||
Pennsylvania - 97.7% (continued) | |||||||||
Montgomery County Industrial Development Authority, | 5.00 | 10/1/2041 | 2,000,000 | 2,126,220 | |||||
Montgomery County Industrial Development Authority, | 5.00 | 12/1/2048 | 1,000,000 | 1,078,860 | |||||
Pennsylvania Economic Development Financing Authority, | 6.25 | 1/1/2032 | 1,000,000 | 1,021,910 | |||||
Pennsylvania Higher Educational Facilities Authority, | 5.00 | 8/15/2040 | 1,500,000 | 1,699,260 | |||||
Pennsylvania Higher Educational Facilities Authority, | 5.00 | 5/1/2035 | 1,750,000 | 1,990,660 | |||||
Pennsylvania Higher Educational Facilities Authority, | 5.00 | 5/1/2041 | 1,000,000 | 1,141,130 | |||||
Pennsylvania Higher Educational Facilities Authority, | 5.00 | 9/1/2030 | 1,170,000 | 1,334,291 | |||||
Pennsylvania Higher Educational Facilities Authority, | 5.00 | 9/1/2045 | 1,500,000 | 1,666,620 | |||||
Pennsylvania Higher Educational Facilities Authority, | 5.00 | 11/1/2031 | 1,000,000 | 1,128,070 | |||||
Pennsylvania Housing Finance Agency, | 5.00 | 12/1/2025 | 1,210,000 | 1,213,691 | |||||
Pennsylvania Turnpike Commission, | 5.25 | 12/1/2048 | 1,000,000 | 1,175,310 | |||||
12
Description | Coupon | Maturity | Principal | Value ($) | |||||
Long-Term Municipal Investments - 98.6% (continued) | |||||||||
Pennsylvania - 97.7% (continued) | |||||||||
Pennsylvania Turnpike Commission, | 5.00 | 12/1/2032 | 3,000,000 | 3,551,610 | |||||
Pennsylvania Turnpike Commission, | 5.00 | 12/1/2036 | 3,000,000 | 3,429,510 | |||||
Pennsylvania Turnpike Commission, | 5.00 | 12/1/2042 | 1,000,000 | 1,076,090 | |||||
Pennsylvania Turnpike Commission, | 5.00 | 12/1/2036 | 1,605,000 | 1,833,087 | |||||
Pennsylvania Turnpike Commission, | 5.00 | 12/1/2043 | 2,500,000 | 2,739,125 | |||||
Philadelphia Airport, | 5.00 | 6/15/2035 | 2,000,000 | 2,246,680 | |||||
Philadelphia Airport, | 5.00 | 7/1/2047 | 1,500,000 | 1,706,535 | |||||
Philadelphia Authority for Industrial Development, | 5.00 | 7/1/2042 | 3,000,000 | 3,324,930 | |||||
Philadelphia Authority for Industrial Development, | 5.00 | 12/1/2037 | 1,250,000 | 1,384,775 | |||||
Philadelphia Authority for Industrial Development, | 5.00 | 4/1/2045 | 1,500,000 | 1,670,355 | |||||
Philadelphia Authority for Industrial Development, | 5.00 | 9/1/2047 | 1,000,000 | 1,128,820 | |||||
Philadelphia Gas Works, | 5.00 | 8/1/2031 | 1,250,000 | 1,430,000 | |||||
Philadelphia Gas Works, | 5.00 | 8/1/2032 | 1,000,000 | 1,140,350 | |||||
Philadelphia Housing Authority, | 5.00 | 12/1/2021 | 1,685,000 | 1,690,341 | |||||
Philadelphia School District, | 5.00 | 9/1/2038 | 1,000,000 | 1,124,930 | |||||
13
STATEMENT OF INVESTMENTS (continued)
Description | Coupon | Maturity | Principal | Value ($) | |||||
Long-Term Municipal Investments - 98.6% (continued) | |||||||||
Pennsylvania - 97.7% (continued) | |||||||||
Philadelphia School District, | 5.00 | 9/1/2043 | 1,000,000 | 1,129,530 | |||||
Pittsburgh, | 5.00 | 9/1/2030 | 1,585,000 | 1,807,391 | |||||
Pittsburgh Urban Redevelopment Authority, | 4.90 | 11/20/2047 | 1,155,000 | 1,156,432 | |||||
Reading Area Water Authority, | 5.00 | 12/1/2031 | 2,000,000 | 2,146,860 | |||||
State Public School Building Authority, | 5.00 | 5/1/2038 | 1,115,000 | 1,223,489 | |||||
State Public School Building Authority, | 5.00 | 12/1/2032 | 2,000,000 | 2,321,020 | |||||
Susquehanna Area Regional Airport Authority, | 4.00 | 1/1/2033 | 1,300,000 | 1,328,756 | |||||
West Shore Area Authority, | 6.00 | 1/1/2026 | 995,000 | 1,066,650 | |||||
Westmoreland County Municipal Authority, | 5.00 | 8/15/2042 | 1,000,000 | 1,136,420 | |||||
Wilkes-Barre Finance Authority, | 5.00 | 11/1/2034 | 1,000,000 | 1,140,990 | |||||
York County, | 5.00 | 6/1/2031 | 1,000,000 | 1,152,110 | |||||
122,471,191 | |||||||||
14
Description | Coupon | Maturity | Principal | Value ($) | |||||
Long-Term Municipal Investments - 98.6% (continued) | |||||||||
U.S. Related - .9% | |||||||||
Puerto Rico Highway & Transportation Authority, | 5.25 | 7/1/2034 | 1,000,000 | 1,087,020 | |||||
Total Investments(cost $119,437,103) | 98.6% | 123,558,211 | |||||||
Cash and Receivables (Net) | 1.4% | 1,786,178 | |||||||
Net Assets | 100.0% | 125,344,389 | |||||||
a Security exempt from registration pursuant to Rule 144A under the Securities Act of 1933. These securities may be resold in transactions exempt from registration, normally to qualified institutional buyers. At April 30, 2019, these securities were valued at $1,639,150 or 1.31% of net assets.
b Security issued with a zero coupon. Income is recognized through the accretion of discount.
c Variable rate security—rate shown is the interest rate in effect at period end.
Portfolio Summary (Unaudited)† | Value (%) |
Medical | 17.8 |
Transportation | 15.5 |
Education | 14.6 |
Nursing Homes | 10.3 |
General Obligation | 9.7 |
Water | 7.4 |
School District | 5.3 |
Multifamily Housing | 4.4 |
Airport | 4.2 |
Utilities | 3.8 |
Special Tax | 1.8 |
Facilities | 1.6 |
Other | .9 |
Development | .8 |
Industrial Revenue | .5 |
98.6 |
† Based on net assets.
See notes to financial statements.
15
Summary of Abbreviations(Unaudited) | |||
ABAG | Association of Bay Area Governments | ACA | American Capital Access |
AGC | ACE Guaranty Corporation | AGIC | Asset Guaranty Insurance Company |
AMBAC | American Municipal Bond Assurance Corporation | ARRN | Adjustable Rate Receipt Notes |
BAN | Bond Anticipation Notes | BPA | Bond Purchase Agreement |
CIFG | CDC Ixis Financial Guaranty | COP | Certificate of Participation |
CP | Commercial Paper | DRIVERS | Derivative Inverse Tax-Exempt Receipts |
EDR | Economic Development Revenue | EIR | Environmental Improvement Revenue |
EURIBOR | Euro Interbank Offered Rate | FGIC | Financial Guaranty Insurance Company |
FHA | Federal Housing Administration | FHLB | Federal Home Loan Bank |
FHLMC | Federal Home Loan Mortgage Corporation | FNMA | Federal National Mortgage Association |
GAN | Grant Anticipation Notes | GIC | Guaranteed Investment Contract |
GNMA | Government National Mortgage Association | GO | General Obligation |
HR | Hospital Revenue | IDB | Industrial Development Board |
IDC | Industrial Development Corporation | IDR | Industrial Development Revenue |
LIBOR | London Interbank Offered Rate | LIFERS | Long Inverse Floating Exempt Receipts |
LOC | Letter of Credit | LOR | Limited Obligation Revenue |
LR | Lease Revenue | MERLOTS | Municipal Exempt Receipts Liquidity Option Tender |
MFHR | Multi-Family Housing Revenue | MFMR | Multi-Family Mortgage Revenue |
MUNIPSA | Securities Industry and Financial Markets Association Municipal Swap Index Yield | PCR | Pollution Control Revenue |
PILOT | Payment in Lieu of Taxes | P-FLOATS | Puttable Floating Option Tax-Exempt Receipts |
PUTTERS | Puttable Tax-Exempt Receipts | RAC | Revenue Anticipation Certificates |
RAN | Revenue Anticipation Notes | RAW | Revenue Anticipation Warrants |
RIB | Residual Interest Bonds | ROCS | Reset Options Certificates |
RRR | Resources Recovery Revenue | SAAN | State Aid Anticipation Notes |
SBPA | Standby Bond Purchase Agreement | SFHR | Single Family Housing Revenue |
SFMR | Single Family Mortgage Revenue | SOFRRATE | Secured Overnight Financing Rate |
SONYMA | State of New York Mortgage Agency | SPEARS | Short Puttable Exempt Adjustable Receipts |
SWDR | Solid Waste Disposal Revenue | TAN | Tax Anticipation Notes |
TAW | Tax Anticipation Warrants | TRAN | Tax and Revenue Anticipation Notes |
XLCA | XL Capital Assurance | ||
See notes to financial statements.
16
STATEMENT OF ASSETS AND LIABILITIES
April 30, 2019
|
|
|
|
|
|
|
|
|
| Cost |
| Value |
|
Assets ($): |
|
|
|
| ||
Investments in securities—See Statement of Investments | 119,437,103 |
| 123,558,211 |
| ||
Cash |
|
|
|
| 121,987 |
|
Interest receivable |
| 1,863,813 |
| |||
Receivable for shares of Beneficial Interest subscribed |
| 13,197 |
| |||
Prepaid expenses |
|
|
|
| 24,604 |
|
|
|
|
|
| 125,581,812 |
|
Liabilities ($): |
|
|
|
| ||
Due to BNY Mellon Investment Adviser, Inc. and affiliates—Note 3(c) |
| 93,936 |
| |||
Payable for shares of Beneficial Interest redeemed |
| 66,699 |
| |||
Trustees fees and expenses payable |
| 2,704 |
| |||
Accrued expenses |
|
|
|
| 74,084 |
|
|
|
|
|
| 237,423 |
|
Net Assets ($) |
|
| 125,344,389 |
| ||
Composition of Net Assets ($): |
|
|
|
| ||
Paid-in capital |
|
|
|
| 121,086,262 |
|
Total distributable earnings (loss) |
|
|
|
| 4,258,127 |
|
Net Assets ($) |
|
| 125,344,389 |
| ||
Net Asset Value Per Share | Class A | Class C | Class Z |
|
Net Assets ($) | 89,527,046 | 1,919,550 | 33,897,793 |
|
Shares Outstanding | 5,575,384 | 119,490 | 2,111,497 |
|
Net Asset Value Per Share ($) | 16.06 | 16.06 | 16.05 |
|
|
|
|
|
|
See notes to financial statements. |
|
|
|
|
17
STATEMENT OF OPERATIONS
Year Ended April 30, 2019
|
|
|
|
|
|
|
|
|
|
|
|
|
|
Investment Income ($): |
|
|
|
| ||
Interest Income |
|
| 4,612,430 |
| ||
Expenses: |
|
|
|
| ||
Management fee—Note 3(a) |
|
| 694,916 |
| ||
Shareholder servicing costs—Note 3(c) |
|
| 316,080 |
| ||
Professional fees |
|
| 80,934 |
| ||
Registration fees |
|
| 34,074 |
| ||
Distribution fees—Note 3(b) |
|
| 16,051 |
| ||
Prospectus and shareholders’ reports |
|
| 13,741 |
| ||
Trustees’ fees and expenses—Note 3(d) |
|
| 10,968 |
| ||
Loan commitment fees—Note 2 |
|
| 2,620 |
| ||
Custodian fees—Note 3(c) |
|
| 1,882 |
| ||
Miscellaneous |
|
| 44,626 |
| ||
Total Expenses |
|
| 1,215,892 |
| ||
Less—reduction in fees due to earnings credits—Note 3(c) |
|
| (1,892) |
| ||
Net Expenses |
|
| 1,214,000 |
| ||
Investment Income—Net |
|
| 3,398,430 |
| ||
Realized and Unrealized Gain (Loss) on Investments—Note 4 ($): |
|
| ||||
Net realized gain (loss) on investments | 465,867 |
| ||||
Net unrealized appreciation (depreciation) on investments |
|
| 2,286,892 |
| ||
Net Realized and Unrealized Gain (Loss) on Investments |
|
| 2,752,759 |
| ||
Net Increase in Net Assets Resulting from Operations |
| 6,151,189 |
| |||
|
|
|
|
|
|
|
See notes to financial statements. | ||||||
18
STATEMENT OF CHANGES IN NET ASSETS
|
|
|
| Year Ended April 30, | |||||
|
|
|
| 2019 |
| 2018 | a | ||
Operations ($): |
|
|
|
|
|
|
|
| |
Investment income—net |
|
| 3,398,430 |
|
|
| 3,749,006 |
| |
Net realized gain (loss) on investments |
| 465,867 |
|
|
| 1,708,332 |
| ||
Net unrealized appreciation (depreciation) |
| 2,286,892 |
|
|
| (1,750,329) |
| ||
Net Increase (Decrease) in Net Assets | 6,151,189 |
|
|
| 3,707,009 |
| |||
Distributions ($): |
| ||||||||
Distributions to shareholders: |
|
|
|
|
|
|
|
| |
Class A |
|
| (3,110,457) |
|
|
| (4,204,795) |
| |
Class C |
|
| (56,161) |
|
|
| (109,803) |
| |
Class Z |
|
| (1,258,858) |
|
|
| (1,782,235) |
| |
Total Distributions |
|
| (4,425,476) |
|
|
| (6,096,833) |
| |
Beneficial Interest Transactions ($): |
| ||||||||
Net proceeds from shares sold: |
|
|
|
|
|
|
|
| |
Class A |
|
| 4,447,978 |
|
|
| 3,753,933 |
| |
Class C |
|
| 43,849 |
|
|
| 45,617 |
| |
Class Z |
|
| 1,592,017 |
|
|
| 1,892,275 |
| |
Distributions reinvested: |
|
|
|
|
|
|
|
| |
Class A |
|
| 2,706,117 |
|
|
| 3,646,266 |
| |
Class C |
|
| 54,123 |
|
|
| 104,248 |
| |
Class Z |
|
| 1,026,845 |
|
|
| 1,487,568 |
| |
Cost of shares redeemed: |
|
|
|
|
|
|
|
| |
Class A |
|
| (11,826,604) |
|
|
| (12,912,360) |
| |
Class C |
|
| (720,480) |
|
|
| (2,063,776) |
| |
Class Z |
|
| (4,856,729) |
|
|
| (16,645,621) |
| |
Increase (Decrease) in Net Assets | (7,532,884) |
|
|
| (20,691,850) |
| |||
Total Increase (Decrease) in Net Assets | (5,807,171) |
|
|
| (23,081,674) |
| |||
Net Assets ($): |
| ||||||||
Beginning of Period |
|
| 131,151,560 |
|
|
| 154,233,234 |
| |
End of Period |
|
| 125,344,389 |
|
|
| 131,151,560 |
| |
19
STATEMENT OF CHANGES IN NET ASSETS (continued)
|
|
|
| Year Ended April 30, | |||||
|
|
|
| 2019 |
| 2018 | a | ||
Capital Share Transactions (Shares): |
| ||||||||
Class Ab |
|
|
|
|
|
|
|
| |
Shares sold |
|
| 280,850 |
|
|
| 230,657 |
| |
Shares issued for distributions reinvested |
|
| 170,983 |
|
|
| 224,710 |
| |
Shares redeemed |
|
| (746,267) |
|
|
| (792,248) |
| |
Net Increase (Decrease) in Shares Outstanding | (294,434) |
|
|
| (336,881) |
| |||
Class Cb |
|
|
|
|
|
|
|
| |
Shares sold |
|
| 2,775 |
|
|
| 2,763 |
| |
Shares issued for distributions reinvested |
|
| 3,420 |
|
|
| 6,414 |
| |
Shares redeemed |
|
| (45,205) |
|
|
| (125,805) |
| |
Net Increase (Decrease) in Shares Outstanding | (39,010) |
|
|
| (116,628) |
| |||
Class Z |
|
|
|
|
|
|
|
| |
Shares sold |
|
| 100,441 |
|
|
| 116,175 |
| |
Shares issued for distributions reinvested |
|
| 64,900 |
|
|
| 91,659 |
| |
Shares redeemed |
|
| (307,017) |
|
|
| (1,024,163) |
| |
Net Increase (Decrease) in Shares Outstanding | (141,676) |
|
|
| (816,329) |
| |||
|
|
|
|
|
|
|
|
|
|
aDistributions to shareholders include $2,563,188 Class A, $63,199 Class C, and $1,140,881 Class Z distributions from investment income—net and $1,641,607 Class A, $46,604 Class C, and $641,354 Class Z distributions from net realized gains. | |||||||||
bDuring the period ended April 30, 2019, 1,471 Class C shares representing $23,342 were automatically converted to 1,472 Class A shares and during the period ended April 30, 2018, 9,688 Class C shares representing $160,057 were automatically converted to 9,695 Class A shares. | |||||||||
See notes to financial statements. | |||||||||
20
FINANCIAL HIGHLIGHTS
The following tables describe the performance for each share class for the fiscal periods indicated. All information (except portfolio turnover rate) reflects financial results for a single fund share. Total return shows how much your investment in the fund would have increased (or decreased) during each period, assuming you had reinvested all dividends and distributions. These figures have been derived from the fund’s financial statements.
Class A Shares | Year Ended April 30, | ||||||||||
2019 | 2018 | 2017 | 2016 | 2015 | |||||||
Per Share Data ($): | |||||||||||
Net asset value, beginning of period | 15.84 | 16.15 | 16.74 | 16.34 | 16.01 | ||||||
Investment Operations: | |||||||||||
Investment income—neta | .42 | .43 | .47 | .51 | .51 | ||||||
Net realized and unrealized | .35 | (.03) | (.50) | .40 | .32 | ||||||
Total from Investment Operations | .77 | .40 | (.03) | .91 | .83 | ||||||
Distributions: | |||||||||||
Dividends from | (.42) | (.43) | (.46) | (.51) | (.50) | ||||||
Dividends from net realized | (.13) | (.28) | (.10) | - | - | ||||||
Total Distributions | (.55) | (.71) | (.56) | (.51) | (.50) | ||||||
Net asset value, end of period | 16.06 | 15.84 | 16.15 | 16.74 | 16.34 | ||||||
Total Return (%)b | 4.97 | 2.44 | (.16) | 5.66 | 5.26 | ||||||
Ratios/Supplemental Data (%): | |||||||||||
Ratio of total expenses | 1.00 | .98 | .96 | .95 | .96 | ||||||
Ratio of net expenses | 1.00 | .98 | .96 | .95 | .96 | ||||||
Ratio of net investment income | 2.65 | 2.62 | 2.82 | 3.13 | 3.11 | ||||||
Portfolio Turnover Rate | 8.53 | 15.24 | 20.97 | 12.49 | 29.84 | ||||||
Net Assets, end of period ($ x 1,000) | 89,527 | 92,964 | 100,228 | 107,889 | 108,258 | ||||||
a Based on average shares outstanding.
b Exclusive of sales charge.
See notes to financial statements.
21
FINANCIAL HIGHLIGHTS (continued)
Class C Shares | Year Ended April 30, | |||||||||
2019 | 2018 | 2017 | 2016 | 2015 | ||||||
Per Share Data ($): | ||||||||||
Net asset value, beginning of period | 15.84 | 16.15 | 16.75 | 16.34 | 16.02 | |||||
Investment Operations: | ||||||||||
Investment income—neta | .29 | .30 | .34 | .39 | .39 | |||||
Net realized and unrealized | .35 | (.03) | (.51) | .40 | .31 | |||||
Total from Investment Operations | .64 | .27 | (.17) | .79 | .70 | |||||
Distributions: | ||||||||||
Dividends from | (.29) | (.30) | (.33) | (.38) | (.38) | |||||
Dividends from net realized | (.13) | (.28) | (.10) | - | - | |||||
Total Distributions | (.42) | (.58) | (.43) | (.38) | (.38) | |||||
Net asset value, end of period | 16.06 | 15.84 | 16.15 | 16.75 | 16.34 | |||||
Total Return (%)b | 4.12 | 1.63 | (.98) | 4.93 | 4.41 | |||||
Ratios/Supplemental Data (%): | ||||||||||
Ratio of total expenses | 1.82 | 1.76 | 1.73 | 1.72 | 1.71 | |||||
Ratio of net expenses | 1.82 | 1.76 | 1.73 | 1.72 | 1.71 | |||||
Ratio of net investment income | 1.83 | 1.83 | 2.05 | 2.36 | 2.36 | |||||
Portfolio Turnover Rate | 8.53 | 15.24 | 20.97 | 12.49 | 29.84 | |||||
Net Assets, end of period ($ x 1,000) | 1,920 | 2,511 | 4,445 | 4,913 | 4,660 | |||||
a Based on average shares outstanding.
b Exclusive of sales charge.
See notes to financial statements.
22
Class Z Shares | Year Ended April 30, | |||||||||
2019 | 2018 | 2017 | 2016 | 2015 | ||||||
Per Share Data ($): | ||||||||||
Net asset value, beginning of period | 15.83 | 16.15 | 16.74 | 16.33 | 16.01 | |||||
Investment Operations: | ||||||||||
Investment income—neta | .45 | .46 | .50 | .55 | .54 | |||||
Net realized and unrealized gain | .35 | (.04) | (.49) | .40 | .32 | |||||
Total from Investment Operations | .80 | .42 | .01 | .95 | .86 | |||||
Distributions: | ||||||||||
Dividends from | (.45) | (.46) | (.50) | (.54) | (.54) | |||||
Dividends from net realized | (.13) | (.28) | (.10) | - | - | |||||
Total Distributions | (.58) | (.74) | (.60) | (.54) | (.54) | |||||
Net asset value, end of period | 16.05 | 15.83 | 16.15 | 16.74 | 16.33 | |||||
Total Return (%) | 5.18 | 2.66 | .01 | 5.95 | 5.43 | |||||
Ratios/Supplemental Data (%): | ||||||||||
Ratio of total expenses | .82 | .76 | .73 | .74 | .73 | |||||
Ratio of net expenses | .82 | .76 | .73 | .74 | .73 | |||||
Ratio of net investment income | 2.85 | 2.83 | 3.05 | 3.34 | 3.34 | |||||
Portfolio Turnover Rate | 8.53 | 15.24 | 20.97 | 12.49 | 29.84 | |||||
Net Assets, end of period ($ x 1,000) | 33,898 | 35,676 | 49,560 | 51,559 | 51,116 | |||||
a Based on average shares outstanding.
See notes to financial statements.
23
NOTES TO FINANCIAL STATEMENTS
NOTE 1—Significant Accounting Policies:
BNY Mellon Pennsylvania Fund (the “fund”) is a separate non-diversified series of BNY Mellon State Municipal Bond Funds (the “Company”), which is registered under the Investment Company Act of 1940, as amended (the “Act”), as an open-end management investment company and operates as a series company currently offering three series, including the fund. The fund’s investment objective is to seek to maximize current income exempt from federal income tax and from Pennsylvania state income tax, without undue risk. BNY Mellon Investment Adviser, Inc. (the “Adviser”), a wholly-owned subsidiary of The Bank of New York Mellon Corporation (“BNY Mellon”), serves as the fund’s investment adviser.
Effective June 3, 2019, the fund changed its name from Dreyfus Pennsylvania Fund to BNY Mellon Pennsylvania Fund and the Company changed its name from Dreyfus State Municipal Bond Funds to BNY Mellon State Municipal Bond Funds. In addition, The Dreyfus Corporation, the fund’s investment adviser and administrator, changed its name to “BNY Mellon Investment Adviser, Inc.”, MBSC Securities Corporation, the fund’s distributor, changed its name to “BNY Mellon Securities Corporation” and Dreyfus Transfer, Inc., the fund’s transfer agent, changed its name to “BNY Mellon Transfer, Inc.”
BNY Mellon Securities Corporation (the “Distributor”), a wholly-owned subsidiary of the Adviser, is the distributor of the fund’s shares. The fund is authorized to issue an unlimited number of $.001 par value shares of Beneficial Interest in each of the following classes of shares: Class A, Class C, Class T and Class Z. Class A and Class T shares generally are subject to a sales charge imposed at the time of purchase. Class C shares are subject to a contingent deferred sales charge (“CDSC”) imposed on Class C shares redeemed within one year of purchase. Class C shares automatically convert to Class A shares ten years after the date of purchase, without the imposition of a sales charge. Class Z shares are sold at net asset value per share to certain shareholders of the fund. Class Z shares generally are not available for new accounts. As of the date of this report, the fund did not offer Class T shares for purchase. Other differences between the classes include the services offered to and the expenses borne by each class, the allocation of certain transfer agency costs, and certain voting rights. Income, expenses (other than expenses attributable to a specific class), and realized and unrealized gains or losses on investments are allocated to each class of shares based on its relative net assets.
24
The Company accounts separately for the assets, liabilities and operations of each series. Expenses directly attributable to each series are charged to that series’ operations; expenses which are applicable to all series are allocated among them on a pro rata basis.
The Financial Accounting Standards Board (“FASB”) Accounting Standards Codification is the exclusive reference of authoritative U.S. generally accepted accounting principles (“GAAP”) recognized by the FASB to be applied by nongovernmental entities. Rules and interpretive releases of the Securities and Exchange Commission (“SEC”) under authority of federal laws are also sources of authoritative GAAP for SEC registrants. The fund’s financial statements are prepared in accordance with GAAP, which may require the use of management estimates and assumptions. Actual results could differ from those estimates.
The Companyenters into contracts that contain a variety of indemnifications. The fund’s maximum exposure under these arrangements is unknown. The fund does not anticipate recognizing any loss related to these arrangements.
(a) Portfolio valuation: The fair value of a financial instrument is the amount that would be received to sell an asset or paid to transfer a liability in an orderly transaction between market participants at the measurement date (i.e., the exit price). GAAP establishes a fair value hierarchy that prioritizes the inputs of valuation techniques used to measure fair value. This hierarchy gives the highest priority to unadjusted quoted prices in active markets for identical assets or liabilities (Level 1 measurements) and the lowest priority to unobservable inputs (Level 3 measurements).
Additionally, GAAP provides guidance on determining whether the volume and activity in a market has decreased significantly and whether such a decrease in activity results in transactions that are not orderly. GAAP requires enhanced disclosures around valuation inputs and techniques used during annual and interim periods.
Various inputs are used in determining the value of the fund’s investments relating to fair value measurements. These inputs are summarized in the three broad levels listed below:
Level 1—unadjusted quoted prices in active markets for identical investments.
Level 2—other significant observable inputs (including quoted prices for similar investments, interest rates, prepayment speeds, credit risk, etc.).
25
NOTES TO FINANCIAL STATEMENTS(continued)
Level 3—significant unobservable inputs (including the fund’s own assumptions in determining the fair value of investments).
The inputs or methodology used for valuing securities are not necessarily an indication of the risk associated with investing in those securities.
Changes in valuation techniques may result in transfers in or out of an assigned level within the disclosure hierarchy. Valuation techniques used to value the fund’s investments are as follows:
Investments in securities are valued each business day by an independent pricing service (the “Service”) approved by the Company’s Board of Trustees (the “Board”). Investments for which quoted bid prices are readily available and are representative of the bid side of the market in the judgment of the Service are valued at the mean between the quoted bid prices (as obtained by the Service from dealers in such securities) and asked prices (as calculated by the Service based upon its evaluation of the market for such securities). Other investments (which constitute a majority of the portfolio securities) are carried at fair value as determined by the Service, based on methods which include consideration of the following: yields or prices of municipal securities of comparable quality, coupon, maturity and type; indications as to values from dealers; and general market conditions. All of the preceding securities are generally categorized within Level 2 of the fair value hierarchy.
The Service is engaged under the general oversight of the Board.
When market quotations or official closing prices are not readily available, or are determined not to accurately reflect fair value, such as when the value of a security has been significantly affected by events after the close of the exchange or market on which the security is principally traded, but before the fund calculates its net asset value, the fund may value these investments at fair value as determined in accordance with the procedures approved by the Board. Certain factors may be considered when fair valuing investments such as: fundamental analytical data, the nature and duration of restrictions on disposition, an evaluation of the forces that influence the market in which the securities are purchased and sold, and public trading in similar securities of the issuer or comparable issuers. These securities are either categorized within Level 2 or 3 of the fair value hierarchy depending on the relevant inputs used.
For restricted securities where observable inputs are limited, assumptions about market activity and risk are used and such securities are generally categorized within Level 3 of the fair value hierarchy.
26
The following is a summary of the inputs used as of April 30, 2019in valuing the fund’s investments:
Level 1 - Unadjusted Quoted Prices | Level 2 - Other Significant Observable Inputs | Level 3 -Significant Unobservable Inputs | Total | |
Assets ($) | ||||
Investments in Securities: | ||||
Municipal Bonds† | - | 123,558,211 | - | 123,558,211 |
† See Statement of Investments for additional detailed categorizations.
At April 30, 2019, there were no transfers between levels of the fair value hierarchy. It is the fund’s policy to recognize transfers between levels at the end of the reporting period.
(b) Securities transactions and investment income: Securities transactions are recorded on a trade date basis. Realized gains and losses from securities transactions are recorded on the identified cost basis. Interest income, adjusted for accretion of discount and amortization of premium on investments, is earned from settlement date and recognized on the accrual basis. Securities purchased or sold on a when issued or delayed delivery basis may be settled a month or more after the trade date.
The fund follows an investment policy of investing primarily in municipal obligations of one state. Economic changes affecting the state and certain of its public bodies and municipalities may affect the ability of issuers within the state to pay interest on, or repay principal of, municipal obligations held by the fund.
(c) Dividends and distributions to shareholders:It is the policy of the fund to declare dividends daily from investment income-net. Such dividends are paid monthly. Dividends from net realized capital gains, if any, are normally declared and paid annually, but the fund may make distributions on a more frequent basis to comply with the distribution requirements of the Internal Revenue Code of 1986, as amended (the “Code”). To the extent that net realized capital gains can be offset by capital loss carryovers, it is the policy of the fund not to distribute such gains. Income and capital gain distributions are determined in accordance with income tax regulations, which may differ from GAAP.
(d) Federal income taxes: It is the policy of the fund to continue to qualify as a regulated investment company, which can distribute tax-exempt dividends, by complying with the applicable provisions of the Code, and to make distributions of income and net realized capital gain sufficient to relieve it from substantially all federal income and excise taxes.
27
NOTES TO FINANCIAL STATEMENTS(continued)
As of and during the period ended April 30, 2019, the fund did not have any liabilities for any uncertain tax positions. The fund recognizes interest and penalties, if any, related to uncertain tax positions as income tax expense in the Statement of Operations. During the period ended April 30, 2019, the fund did not incur any interest or penalties.
Each tax year in the four-year period ended April 30, 2019 remains subject to examination by the Internal Revenue Service and state taxing authorities.
At April 30, 2019, the components of accumulated earnings on a tax basis were as follows: undistributed tax-exempt income $306,842, undistributed capital gains $136,770 and unrealized appreciation $4,121,357.
The tax character of distributions paid to shareholders during the fiscal periods ended April 30, 2019 and April 30, 2018 were as follows: tax–exempt income $3,397,232 and $3,767,268, ordinary income $4,497 and $314,873, and long-term capital gains $1,023,747 and $2,014,692, respectively.
(e) New Accounting Pronouncements: In March 2017, the FASB issued Accounting Standards Update 2017-08, Receivables—Nonrefundable Fees and Other Costs (Subtopic 310-20): Premium Amortization On Purchased Callable Debt Securities (“ASU 2017-08”). The update shortens the amortization period for the premium on certain purchased callable debt securities to the earliest call date. ASU 2017-08 will be effective for fiscal years beginning after December 15, 2018.
Also in August 2018, the FASB issued Accounting Standards Update 2018-13, Fair Value Measurement (Topic 820): Disclosure Framework—Changes to the Disclosure Requirements for Fair Value Measurement (“ASU 2018-13”). The update provides guidance that modifies certain disclosure requirements for fair value measurements. ASU 2018-13 will be effective for fiscal years beginning after December 15, 2019. Management is currently assessing the potential impact of these changes to future financial statements.
NOTE 2—Bank Lines of Credit:
The fund participates with other long-term open-end funds managed by the Adviser in a $1.030 billion unsecured credit facility led by Citibank, N.A. (the “Citibank Credit Facility”) and a $300 million unsecured credit facility provided by The Bank of New York Mellon (the “BNYM Credit Facility”), a subsidiary of BNY Mellon and an affiliate of the Adviser, each to be utilized primarily for temporary or emergency purposes, including the financing of redemptions (each, a “Facility”). The Citibank Credit Facility
28
is available in two tranches: (i) Tranche A is in an amount equal to $830 million and is available to all long-term open-ended funds, including the fund, and (ii) Tranche B is in amount equal to $200 million and is available only to BNY Mellon Floating Rate Income Fund, a series of BNY Mellon Investment Funds IV, Inc. Prior to October 3, 2018, the unsecured credit facility with Citibank, N.A. was $830 million. In connection therewith, the fund has agreed to pay its pro rata portion of commitment fees for Tranche A of the Citibank Credit Facility and the BNYM Credit Facility. Interest is charged to the fund based on rates determined pursuant to the terms of the respective Facility at the time of borrowing. During the period ended April 30, 2019, the fund did not borrow under the Facilities.
NOTE 3—Management Fee and Other Transactions with Affiliates:
(a)Pursuant to a management agreement with the Adviser, the management fee is computed at the annual rate of .55% of the value of the fund’s average daily net assets and is payable monthly.
During the period ended April 30, 2019, the Distributor retained $2,014 from commissions earned on sales of the fund’s Class A shares and $20 from CDSC fees on redemptions of the fund’s Class C shares.
(b) Under the Distribution Plan adopted pursuant to Rule 12b-1 under the Act, Class C shares pay the Distributor for distributing its shares at an annual rate of .75% of the value of its average daily net assets. During the period ended April 30, 2019, Class C shares were charged $16,051 pursuant to the Distribution Plan.
(c)Under the Shareholder Services Plan, Class A and Class C shares pay the Distributor at an annual rate of .25% of the value of their average daily net assets for the provision of certain services. The services provided may include personal services relating to shareholder accounts, such as answering shareholder inquiries regarding the fund and providing reports and other information, and services related to the maintenance of shareholder accounts. The Distributor may make payments to Service Agents (securities dealers, financial institutions or other industry professionals) with respect to these services. The Distributor determines the amounts to be paid to Service Agents. During the period ended April 30, 2019, Class A and Class C shares were charged $224,771and $5,350, respectively, pursuant to the Shareholder Services Plan.
Under the Shareholder Services Plan, Class Z shares reimburse the Distributor at an amount not to exceed an annual rate of .25% of the value of Class Z shares’ average daily net assets for the provision of certain services. The services provided may include personal services relating to
29
NOTES TO FINANCIAL STATEMENTS(continued)
shareholder accounts, such as answering shareholder inquiries regarding Class Z shares and providing reports and other information, and services related to the maintenance of shareholder accounts. During the period ended April 30, 2019,Class Z shares were charged $22,649 pursuant to the Shareholder Services Plan.
The fund has arrangements with the transfer agent and the custodian whereby the fund may receive earnings credits when positive cash balances are maintained, which are used to offset transfer agency and custody fees. For financial reporting purposes, the fund includes net earnings credits, if any, as an expense offset in the Statement of Operations.
The fund compensates BNY Mellon Transfer, Inc., a wholly-owned subsidiary of the Adviser, under a transfer agency agreement for providing transfer agency and cash management services for the fund. The majority of transfer agency fees are comprised of amounts paid on a per account basis, while cash management fees are related to fund subscriptions and redemptions. During the period ended April 30, 2019, the fund was charged $30,053 for transfer agency services. These fees are included in Shareholder servicing costs in the Statement of Operations.
The fund compensates The Bank of New York Mellon under a custody agreement for providing custodial services for the fund. These fees are determined based on net assets, geographic region and transaction activity. During the period ended April 30, 2019, the fund was charged $1,882 pursuant to the custody agreement. These fees were offset by earnings credits of $1,882.
The fund compensates The Bank of New York Mellon under a shareholder redemption draft processing agreement for providing certain services related to the fund’s check writing privilege. During the period ended April 30, 2019, the fund was charged $1,286 pursuant to the agreement, which is included in Shareholder servicing costs in the Statement of Operations. These fees were partially offset by earnings credits of $10.
During the period ended April 30, 2019, the fund was charged $12,173 for services performed by the Chief Compliance Officer and his staff. These fees are included in Miscellaneous in the Statement of Operations.
The components of “Due to BNY Mellon Investment Adviser, Inc. and affiliates” in the Statement of Assets and Liabilities consist of: management fees $56,494, Distribution Plan fees $1,178, Shareholder Services Plan fees $23,749, custodian fees $151, Chief Compliance Officer fees $6,790 and transfer agency fees $5,574.
30
(d) Each Board member also serves as a Board member of other funds in the BNY Mellon Family of Funds complex. Annual retainer fees and attendance fees are allocated to each fund based on net assets.
NOTE 4—Securities Transactions:
The aggregate amount of purchases and sales of investment securities, excluding short-term securities, during the period ended April 30, 2019, amounted to $10,657,294 and $17,991,705, respectively.
At April 30, 2019, the cost of investments for federal income tax purposes was $119,436,854; accordingly, accumulated net unrealized appreciation on investments was $4,121,357, consisting of $4,267,650 gross unrealized appreciation and $146,293 gross unrealized depreciation.
31
REPORT OF INDEPENDENT REGISTERED PUBLIC ACCOUNTING FIRM
To the Shareholders and the Board of Trustees of BNY Mellon Pennsylvania Fund (formerly, Dreyfus Pennsylvania Fund)
Opinion on the Financial Statements
We have audited the accompanying statement of assets and liabilities of BNY Mellon Pennsylvania Fund (the “Fund”) (formerly, Dreyfus Pennsylvania Fund) (one of the funds constituting BNY Mellon State Municipal Bond Funds), including the statement of investments, as of April 30, 2019, and the related statement of operations for the year then ended, the statements of changes in net assets for each of the two years in the period then ended, the financial highlights for each of the five years in the period then ended and the related notes (collectively referred to as the “financial statements”). In our opinion, the financial statements present fairly, in all material respects, the financial position of the Fund (one of the funds constituting BNY Mellon State Municipal Bond Funds) at April 30, 2019, the results of its operations for the year then ended, the changes in its net assets for each of the two years in the period then ended and its financial highlights for each of the five years in the period then ended, in conformity with U.S. generally accepted accounting principles.
Basis for Opinion
These financial statements are the responsibility of the Fund’s management. Our responsibility is to express an opinion on the Fund’s financial statements based on our audits. We are a public accounting firm registered with the Public Company Accounting Oversight Board (United States) (“PCAOB”) and are required to be independent with respect to the Fund in accordance with the U.S. federal securities laws and the applicable rules and regulations of the Securities and Exchange Commission and the PCAOB.
We conducted our audits in accordance with the standards of the PCAOB. Those standards require that we plan and perform the audit to obtain reasonable assurance about whether the financial statements are free of material misstatement, whether due to error or fraud. The Fund is not required to have, nor were we engaged to perform, an audit of the Fund’s internal control over financial reporting. As part of our audits, we are required to obtain an understanding of internal control over financial reporting, but not for the purpose of expressing an opinion on the effectiveness of the Fund’s internal control over financial reporting. Accordingly, we express no such opinion.
Our audits included performing procedures to assess the risks of material misstatement of the financial statements, whether due to error or fraud, and performing procedures that respond to those risks. Such procedures included examining, on a test basis, evidence regarding the amounts and disclosures in the financial statements. Our procedures included confirmation of securities owned as of April 30, 2019, by correspondence with the custodian and others or by other appropriate auditing procedures where replies from others were not received. Our audits also included evaluating the accounting principles used and significant estimates made by management, as well as evaluating the overall presentation of the financial statements. We believe that our audits provide a reasonable basis for our opinion.

We have served as the auditor of one or more investment companies in the BNY Mellon Family of Funds since at least 1957, but we are unable to determine the specific year.
New York, New York
June 26, 2019
32
IMPORTANT TAX INFORMATION(Unaudited)
In accordance with federal tax law, the fund hereby reports all the dividends paid from investment income-net during its fiscal year ended April 30, 2019 as “exempt-interest dividends” (not subject to regular federal income tax, and for individuals who are Pennsylvania residents, Pennsylvania personal income taxes). Where required by federal tax law rules, shareholders will receive notification of their portion of the fund’s taxable ordinary dividends (if any), capital gains distributions (if any) and tax-exempt dividends paid for the 2019 calendar year on Form 1099-DIV which will be mailed in early 2020. The fund also hereby reports $.0006 per share as a short-term capital gain distribution and $.1302 per share as a long-term capital gain distribution paid on December 28, 2018.
33
BOARD MEMBERS INFORMATION(Unaudited)
INDEPENDENT BOARD MEMBERS
Chairman of the Board (1995)
Principal Occupation During Past 5 Years:
· Corporate Director and Trustee (1995-present)
Other Public Company Board Memberships During Past 5 Years:
· CBIZ (formerly, Century Business Services, Inc.), a provider of outsourcing functions for small and medium size companies, Director (1997-present)
No. of Portfolios for which Board Member Serves:120
———————
Francine J. Bovich (67)
Board Member (2012)
Principal Occupation During Past 5 Years:
· Trustee, The Bradley Trusts, private trust funds (2011-present)
Other Public Company Board Memberships During Past 5 Years:
· Annaly Capital Management, Inc., a real estate investment trust, Director (2014-present)
No. of Portfolios for which Board Member Serves:69
———————
Peggy C. Davis (76)
Board Member (1990)
Principal Occupation During Past 5 Years:
· Shad Professor of Law, New York University School of Law (1983-present)
No. of Portfolios for which Board Member Serves:44
———————
Diane Dunst (79)
Board Member (2007)
Principal Occupation During Past 5 Years:
· President of Huntting House Antiques (1999-present)
No. of Portfolios for which Board Member Serves:14
———————
34
Nathan Leventhal (76)
Board Member (1989)
Principal Occupation During Past 5 Years:
· President Emeritus of Lincoln Center for the Performing Arts (2001-present)
· Chairman of the Avery Fisher Artist Program (1997-2014)
Other Public Company Board Memberships During Past 5 Years:
· Movado Group, Inc., Director (2003-present)
No. of Portfolios for which Board Member Serves:47
———————
Robin A. Melvin (55)
Board Member (2012)
Principal Occupation During Past 5 Years:
· Co-chairman, Illinois Mentoring Partnership, non-profit organization dedicated to increasing the quantity and quality of mentoring services in Illinois (2014-present; board member since 2013)
No. of Portfolios for which Board Member Serves:98
———————
Once elected all Board Members serve for an indefinite term, but achieve Emeritus status upon reaching age 80. The address of the Board Members and Officers is c/o BNY Mellon Investment Adviser, Inc. 240 Greenwich Street, New York, New York 10166. Additional information about the Board Member is available in the fund’s Statement of Additional Information which can be obtained from the Adviser free of charge by calling this toll free number: 1-800-373-9387.
Clifford L. Alexander, Jr., Emeritus Board Member
Ernest Kafka, Emeritus Board Member
Daniel Rose, Emeritus Board Member
35
OFFICERS OF THE FUND(Unaudited)
RENEE LAROCHE-MORRIS, President since January 2018.
President and a director of BNY Mellon Investment Adviser, Inc. since January 2018. She is an officer of 62 investment companies (comprised of 120 portfolios) managed by the Adviser. She is 48 years old and has been an employee of BNY Mellon since 2003.
JAMES WINDELS, Treasurer since November 2001.
Director- BNY Mellon Fund Administration, and an officer of 63 investment companies (comprised of 143 portfolios) managed by the Adviser. He is 60 years old and has been an employee of the Adviser since April 1985.
BENNETT A. MACDOUGALL, Chief Legal Officer since October 2015.
Chief Legal Officer of the Adviser and Associate General Counsel and Managing Director of BNY Mellon since June 2015; Director and Associate General Counsel of Deutsche Bank – Asset & Wealth Management Division from June 2005 to June 2015, and as Chief Legal Officer of Deutsche Investment Management Americas Inc. from June 2012 to May 2015. He is an officer of 63 investment companies (comprised of 143 portfolios) managed by the Adviser. He is 47 years old and has been an employee of the Adviser since June 2015.
DAVID DIPETRILLO, Vice President since January 2018.
Head of North America Product, BNY Mellon Investment Management since January 2018, Director of Product Strategy, BNY Mellon Investment Management from January 2016 to December 2017; Head of US Retail Product and Channel Marketing, BNY Mellon Investment Management from January 2014 to December 2015. He is an officer of 62 investment companies (comprised of 120 portfolios) managed by the Adviser. He is 41 years old and has been an employee of BNY Mellon since 2005.
JAMES BITETTO, Vice President since August 2005 and Secretary since February 2018.
Managing Counsel of BNY Mellon and Secretary of the Adviser, and an officer of 63 investment companies (comprised of 143 portfolios) managed by the Adviser. He is 52 years old and has been an employee of the Adviser since December 1996.
SONALEE CROSS, Vice President and Assistant Secretary since March 2018.
Counsel of BNY Mellon since October 2016; Associate at Proskauer Rose LLP from April 2016 to September 2016; Attorney at EnTrust Capital from August 2015 to February 2016; Associate at Sidley Austin LLP from September 2013 to August 2015. She is an officer of 63 investment companies (comprised of 143 portfolios) managed by the Adviser. She is 31 years old and has been an employee of the Adviser since October 2016.
DEIRDRE CUNNANE, Vice President and Assistant Secretary since March 2019.
Counsel of BNY Mellon since August 2018; Senior Regulatory Specialist at BNY Mellon Investment Management Services from February 2016 to August 2018; Trustee Associate at BNY Mellon Trust Company (Ireland) Limited from August 2013 to February 2016. She is an officer of 63 investment companies (comprised of 143 portfolios) managed by the Adviser. She is 28 years old and has been an employee of the Adviser since August 2018.
SARAH S. KELLEHER, Vice President and Assistant Secretary since April 2014.
Managing Counsel of BNY Mellon since December 2017, Senior Counsel of BNY Mellon from March 2013 to December 2017. She is an officer of 63 investment companies (comprised of 143 portfolios) managed by the Adviser. She is 43 years old and has been an employee of the Adviser since March 2013.
JEFF PRUSNOFSKY, Vice President and Assistant Secretary since August 2005.
Senior Managing Counsel of BNY Mellon, and an officer of 63 investment companies (comprised of 143 portfolios) managed by the Adviser. He is 54 years old and has been an employee of the Adviser since October 1990.
PETER M. SULLIVAN, Vice President and Assistant Secretary since March 2019.
Managing Counsel of BNY Mellon, and an officer of 63 investment companies (comprised of 143 portfolios) managed by the Adviser. He is 51 years old and has been an employee of the Adviser since April 2004.
36
NATALYA ZELENSKY, Vice President and Assistant Secretary since March 2017.
Counsel of BNY Mellon since May 2016; Attorney at Wildermuth Endowment Strategy Fund/Wildermuth Advisory, LLC from November 2015 to May 2016 and Assistant General Counsel at RCS Advisory Services from July 2014 to November 2015. She is an officer of 63 investment companies (comprised of 143 portfolios) managed by the Adviser. She is 34 years old and has been an employee of the Adviser since May 2016.
GAVIN C. REILLY, Assistant Treasurer since December 2005.
Tax Manager of BNY Mellon Fund Administration, and an officer of 63 investment companies (comprised of 143 portfolios) managed by the Adviser. He is 50 years old and has been an employee of the Adviser since April 1991.
ROBERT S. ROBOL, Assistant Treasurer since August 2005.
Senior Accounting Manager- BNY Mellon Fund Administration, and an officer of 63 investment companies (comprised of 143 portfolios) managed by the Adviser. He is 55 years old and has been an employee of the Adviser since October 1988.
ROBERT SALVIOLO, Assistant Treasurer since July 2007.
Senior Accounting Manager – BNY Mellon Fund Administration, and an officer of 63 investment companies (comprised of 143 portfolios) managed by the Adviser. He is 52 years old and has been an employee of the Adviser since June 1989.
ROBERT SVAGNA, Assistant Treasurer since December 2002.
Senior Accounting Manager – BNY Mellon Fund Administration, and an officer of 63 investment companies (comprised of 143 portfolios) managed by the Adviser. He is 52 years old and has been an employee of the Adviser since November 1990.
JOSEPH W. CONNOLLY, Chief Compliance Officer since October 2004.
Chief Compliance Officer of the Adviser, the BNY Mellon Family of Funds and BNY Mellon Funds Trust (63 investment companies, comprised of 143 portfolios). He is 62 years old and has served in various capacities with the Adviser since 1980, including manager of the firm’s Fund Accounting Department from 1997 through October 2001.
CARIDAD M. CAROSELLA, Anti-Money Laundering Compliance Officer since January 2016.
Anti-Money Laundering Compliance Officer of the BNY Mellon Family of Funds and BNY Mellon Funds Trust since January 2016; from May 2015 to December 2015, Interim Anti-Money Laundering Compliance Officer of the BNY Mellon Family of Funds and BNY Mellon Funds Trust and the Distributor; from January 2012 to May 2015, AML Surveillance Officer of the Distributor. She is an officer of 57 investment companies (comprised of 137 portfolios) managed by the Adviser. She is 50 years old and has been an employee of the Distributor since 1997.
37
BNY Mellon State Municipal Bond Funds, BNY Mellon Pennsylvania Fund
240 Greenwich Street
New York, NY 10286
Adviser
BNY Mellon Investment Adviser, Inc.
240 Greenwich Street
New York, NY 10286
Custodian
The Bank of New York Mellon
240 Greenwich Street
New York, NY 10286
Transfer Agent &
Dividend Disbursing Agent
BNY Mellon Transfer, Inc.
240 Greenwich Street
New York, NY 10286
Distributor
BNY Mellon Securities Corporation
240 Greenwich Street
New York, NY 10286
Ticker Symbols: | Class A: PTPAX Class C: PPACX Class Z: DPENX |
Telephone Call your financial representative or 1-800-373-9387
Mail The BNY Mellon Family of Funds, 144 Glenn Curtiss Boulevard, Uniondale, NY 11556-0144
E-mailSend your request toinfo@bnymellon.com
InternetInformation can be viewed online or downloaded atwww.bnymellonim.com/us
The fund files its complete schedule of portfolio holdings with the Securities and Exchange Commission (“SEC”) for the first and third quarters of each fiscal year on Form N-PORT. The fund’s Forms N-PORT are available on the SEC’s website atwww.sec.gov.
A description of the policies and procedures that the fund uses to determine how to vote proxies relating to portfolio securities and information regarding how the fund voted these proxies for the most recent 12-month period ended June 30 is available atwww.bnymellonim.com/us and on the SEC’s website atwww.sec.gov and without charge, upon request, by calling 1-800-373-9387.
© 2019 BNY Mellon Securities Corporation |
|

Item 2. Code of Ethics.
The Registrant has adopted a code of ethics that applies to the Registrant's principal executive officer, principal financial officer, principal accounting officer or controller, or persons performing similar functions. There have been no amendments to, or waivers in connection with, the Code of Ethics during the period covered by this Report.
Item 3. Audit Committee Financial Expert.
The Registrant's Board has determined that Joseph S. DiMartino, a member of the Audit Committee of the Board, is an audit committee financial expert as defined by the Securities and Exchange Commission (the "SEC"). Mr. DiMartino is "independent" as defined by the SEC for purposes of audit committee financial expert determinations.
Item 4. Principal Accountant Fees and Services.
(a) Audit Fees. The aggregate fees billed for each of the last two fiscal years (the "Reporting Periods") for professional services rendered by the Registrant's principal accountant (the "Auditor") for the audit of the Registrant's annual financial statements or services that are normally provided by the Auditor in connection with the statutory and regulatory filings or engagements for the Reporting Periods, were $107,529 in 2018 and $109,410 in 2019.
(b) Audit-Related Fees. The aggregate fees billed in the Reporting Periods for assurance and related services by the Auditor that are reasonably related to the performance of the audit of the Registrant's financial statements and are not reported under paragraph (a) of this Item 4 were $27,841 in 2018 and $20,421 in 2019. These services consisted of one or more of the following: (i) agreed upon procedures related to compliance with Internal Revenue Code section 817(h), (ii) security counts required by Rule 17f-2 under the Investment Company Act of 1940, as amended, (iii) advisory services as to the accounting or disclosure treatment of Registrant transactions or events and (iv) advisory services to the accounting or disclosure treatment of the actual or potential impact to the Registrant of final or proposed rules, standards or interpretations by the Securities and Exchange Commission, the Financial Accounting Standards Boards or other regulatory or standard-setting bodies.
The aggregate fees billed in the Reporting Periods for non-audit assurance and related services by the Auditor to the Registrant's investment adviser (not including any sub-investment adviser whose role is primarily portfolio management and is subcontracted with or overseen by another investment adviser), and any entity controlling, controlled by or under common control with the investment adviser that provides ongoing services to the Registrant ("Service Affiliates"), that were reasonably related to the performance of the annual audit of the Service Affiliate, which required pre-approval by the Audit Committee were $0 in 2018 and $0 in 2019.
(c) Tax Fees. The aggregate fees billed in the Reporting Periods for professional services rendered by the Auditor for tax compliance, tax advice, and tax planning ("Tax Services") were $9,700 in 2018 and $10,435 in 2019. These services consisted of: (i) review or preparation of U.S. federal, state, local and excise tax returns; (ii) U.S. federal, state and local tax planning, advice and assistance regarding statutory, regulatory or administrative developments, and (iii) tax advice regarding tax qualification matters and/or treatment of various financial instruments held or proposed to be acquired or held. The aggregate fees billed in the Reporting Periods for Tax Services by the Auditor to Service Affiliates, which required pre-approval by the Audit Committee were $0 in 2018 and $0 in 2019.
(d) All Other Fees. The aggregate fees billed in the Reporting Periods for products and services provided by the Auditor, other than the services reported in paragraphs (a) through (c) of this Item, were $1,267 in 2018 and $1,277 in 2019. These services consisted of a review of the Registrant's anti-money laundering program.
The aggregate fees billed in the Reporting Periods for Non-Audit Services by the Auditor to Service Affiliates, other than the services reported in paragraphs (b) through (c) of this Item, which required pre-approval by the Audit Committee, were $0 in 2018 and $0 in 2019.
(e)(1)Audit Committee Pre-Approval Policies and Procedures. The Registrant's Audit Committee has established policies and procedures (the "Policy") for pre-approval (within specified fee limits) of the Auditor's engagements for non-audit services to the Registrant and Service Affiliates without specific case-by-case consideration. The pre-approved services in the Policy can include pre-approved audit services, pre-approved audit-related services, pre-approved tax services and pre-approved all other services. Pre-approval considerations include whether the proposed services are compatible with maintaining the Auditor's independence. Pre-approvals pursuant to the Policy are considered annually.
(e)(2)Note. None of the services described in paragraphs (b) through (d) of this Item 4 were approved by the Audit Committee pursuant to paragraph (c)(7)(i)(C) of Rule 2-01 of Regulation S-X.
(f) None of the hours expended on the principal accountant's engagement to audit the registrant's financial statements for the most recent fiscal year were attributed to work performed by persons other than the principal account's full-time, permanent employees.
Non-Audit Fees. The aggregate non-audit fees billed by the Auditor for services rendered to the Registrant, and rendered to Service Affiliates, for the Reporting Periods were $28,081,041 in 2018 and $17,322,788 in 2019.
Auditor Independence. The Registrant's Audit Committee has considered whether the provision of non-audit services that were rendered to Service Affiliates, which were not pre-approved (not requiring pre-approval), is compatible with maintaining the Auditor's independence.
Item 5. Audit Committee of Listed Registrants.
Not applicable.
Item 6. Investments.
(a) Not applicable.
Item 7. Disclosure of Proxy Voting Policies and Procedures for Closed-End Management Investment Companies.
Not applicable.
Item 8. Portfolio Managers of Closed-End Management Investment Companies.
Not applicable.
Item 9. Purchases of Equity Securities by Closed-End Management Investment Companies and Affiliated Purchasers.
Not applicable.
Item 10. Submission of Matters to a Vote of Security Holders.
There have been no material changes to the procedures applicable to Item 10.
Item 11. Controls and Procedures.
(a) The Registrant's principal executive and principal financial officers have concluded, based on their evaluation of the Registrant's disclosure controls and procedures as of a date within 90 days of the filing date of this report, that the Registrant's disclosure controls and procedures are reasonably designed to ensure that information required to be disclosed by the Registrant on Form N-CSR is recorded, processed, summarized and reported within the required time periods and that information required to be disclosed by the Registrant in the reports that it files or submits on Form N-CSR is accumulated and communicated to the Registrant's management, including its principal executive and principal financial officers, as appropriate to allow timely decisions regarding required disclosure.
(b) There were no changes to the Registrant's internal control over financial reporting that occurred during the second fiscal quarter of the period covered by this report that have materially affected, or are reasonably likely to materially affect, the Registrant's internal control over financial reporting.
Item 12. Disclosure of Securities Lending Activities for Closed-End Management Investment Companies.
Not applicable.
Item 13. Exhibits.
(a)(1) Code of ethics referred to in Item 2.
(a)(2) Certifications of principal executive and principal financial officers as required by Rule 30a-2(a) under the Investment Company Act of 1940.
(a)(3) Not applicable.
(b) Certification of principal executive and principal financial officers as required by Rule 30a-2(b) under the Investment Company Act of 1940.
SIGNATURES
Pursuant to the requirements of the Securities Exchange Act of 1934 and the Investment Company Act of 1940, the Registrant has duly caused this Report to be signed on its behalf by the undersigned, thereunto duly authorized.
BNY Mellon State Municipal Bond Funds
By: /s/ Renee LaRoche-Morris
Renee LaRoche-Morris
President
Date: June 25, 2019
Pursuant to the requirements of the Securities Exchange Act of 1934 and the Investment Company Act of 1940, this Report has been signed below by the following persons on behalf of the Registrant and in the capacities and on the dates indicated.
By: /s/ Renee LaRoche-Morris
Renee LaRoche-Morris
President
Date: June 25, 2019
By: /s/ James Windels
James Windels
Treasurer
Date: June 25, 2019
EXHIBIT INDEX
(a)(1) Code of ethics referred to in Item 2.
(a)(2) Certifications of principal executive and principal financial officers as required by Rule 30a-2(a) under the Investment Company Act of 1940. (EX-99.CERT)
(b) Certification of principal executive and principal financial officers as required by Rule 30a-2(b) under the Investment Company Act of 1940. (EX-99.906CERT)