
Special Cautionary Notice
Regarding Forward-Looking Statements
This presentation may contain forward-looking statements about Codorus Valley Bancorp, Inc. These forward-looking
statements are subject to risks and uncertainties. Forward-looking statements include information concerning possible
or assumed future results of operations of the Corporation and its subsidiaries. When words such as “believes,”
“expects,” “anticipates” or similar expressions occur in this presentation, management is making forward-looking
statements.
Note that many factors could affect the future financial results of the Corporation and its subsidiaries, both individually
and collectively, and could cause those results to differ materially from those expressed in the forward-looking
statements. These factors include, but are not limited to, the following:
operating, legal and regulatory risks, including the impact of the Dodd-Frank Wall Street Reform Act;
a prolonged economic downturn;
an increase in nonperforming assets requiring loss provisions and the incurrence of carrying costs;
declines in the market value of investment securities considered to be other than temporary;
the effect of and changes in the rate of FDIC premiums, including special assessments;
interest rate fluctuations which could increase our cost of funds or decrease our yield on earning assets and therefore
reduce our net interest income;
unavailability of capital when needed or available at an excessive cost;
political and competitive forces affecting banking, securities, asset management and credit services businesses; and
the risk that management’s analysis of these risks and forces could be incorrect and/or that the strategies developed
to address them could be unsuccessful.
The Corporation undertakes no obligation to publicly revise or update these forward-looking statements to reflect
events or circumstances that arise after the date of this report.
Additional financial information can be found in Codorus Valley Bancorp, Inc.’s Quarterly Reports on Forms 10-Q and
its Annual Report on Form 10-K, each of which has been filed with the Securities and Exchange Commission and is
available on the corporation’s website at www.peoplesbanknet.com and on the Securities and Exchange Commission’s
website at www.sec.gov.
2

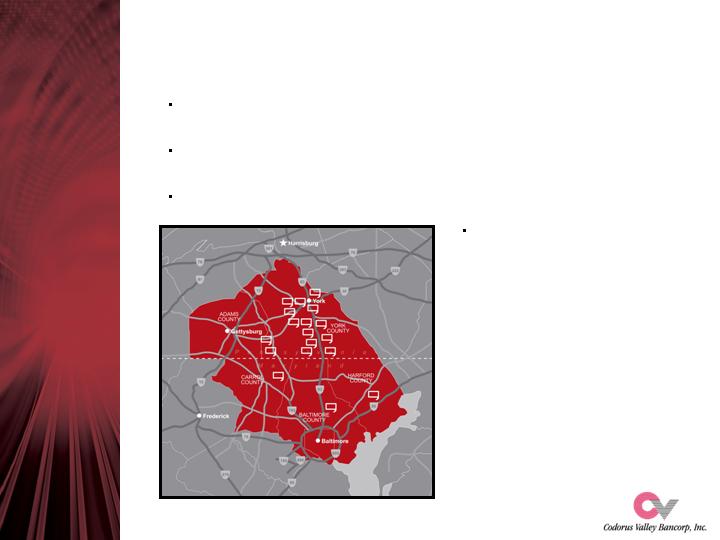
Franchise Overview
Largest independent financial institution headquartered in York, Pennsylvania
Founded in 1864
18 PeoplesBank financial centers in Pennsylvania and Maryland
- 15 in York County, Pennsylvania
- 1 in Baltimore County, Maryland
- 1 in Harford County, Maryland
- 1 in Carroll County, Maryland
$1 billion in total assets*
$696 million in total loans*
$854 million in total deposits*
Provides commercial and retail banking services to over 21,000 households
Offers trust and investment services, with total assets under management of $278 million*
Named by the Central Penn Business Journal as one of the Top 50 Fastest Growing Companies in
Central Pennsylvania for 2010 and 2011
* as of December 31, 2011
3
Market Overview
Ranked 2nd out of 15 banks in the York County market area with a deposit market share of
12.9%.*
Captured 93% of the total York County deposit increase from 2010 – 2011 and 86% of the
total York County deposit increase from 2006 – 2011.
Strategically-positioned in one of the fastest-growing regions along the East Coast within a
short drive of the major metropolitan areas of Philadelphia, Baltimore, and Washington, D. C.
The south central Pennsylvania and
northern Maryland markets are home to
a diverse mix of businesses and
industries, including major
manufacturing, health care, higher
education, government, and retail
services, resulting in strong employment
rates, a highly-educated workforce, and
household incomes that are greater than
state and national averages.
* According to June 30, 2011 FDIC data.
4
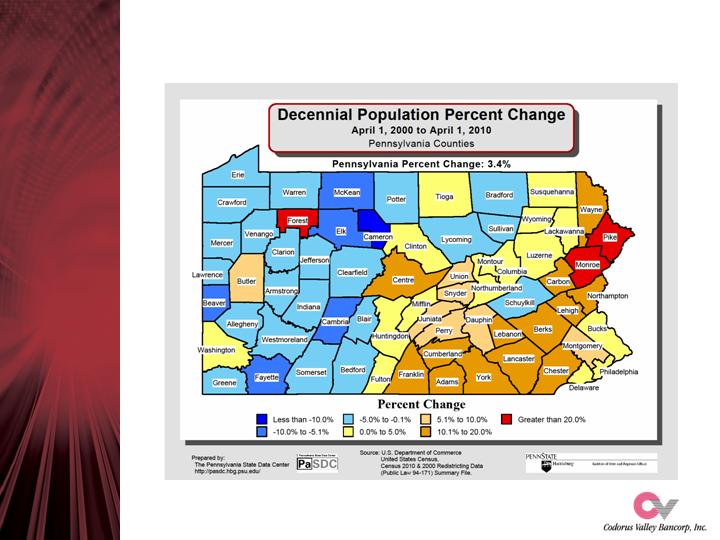
Pennsylvania Population Growth
5
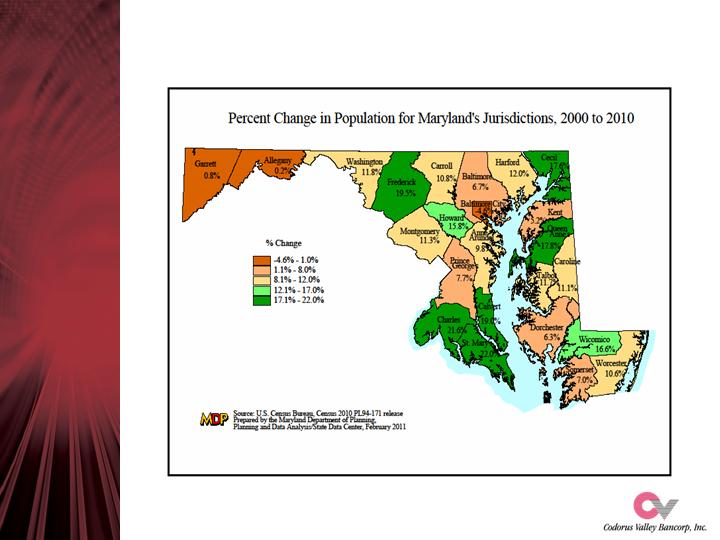
Maryland Population Growth
6
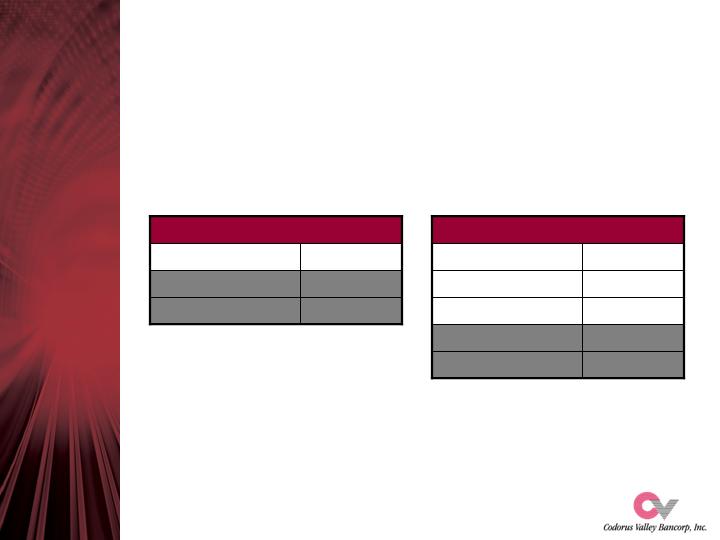
Recent Expansion
Produces Successful Results
($ data as of 12/31/2011)
$39
Total Deposits ($
millions)
$2
Total Loans ($ millions)
Open Aug. 2008
Hanover
Pennsylvania
7
Since 2008, PeoplesBank has opened four financial centers in York County, Pennsylvania
and Baltimore, Harford, and Carroll Counties in Maryland. To date, these four offices
represent $146 million of PeoplesBank’s total loan portfolio and $72 million of its total
deposit portfolio.
Open Nov. 2008
Bel Air
Open Aug. 2011
Westminster
$33
Total Deposits ($
millions)
$144
Total Loans ($ millions)
Open Jan. 2008
Hunt Valley
Maryland

Experienced Leadership
24
15
Vice President, Mortgage Banking Division
Keith L. Sheffer
17
17
Vice President, Auditor
Diane E. Hill, CPA*
31
10
Vice President, Chief Information Officer
Gregg A. Elicker
25
6
Vice President, Director of Marketing
Nathan A. Eifert
24
20
Senior Vice President, Cashier, and Chief Credit Officer
Scott T. Weaver
34
34
Senior Vice President, General Services Division and Security
Officer
Todd A. Tyson, CFSSP,
CBAP
40
5
Senior Vice President, Chief Lending Officer
Jeffrey A. Snyder
23
23
Senior Vice President, Senior Business Advisor
Kent A. Ketterman
37
6
Senior Vice President, Retail Sales and Services Division
Lynn D. Crenshaw
23
10
Senior Vice President, Human Resources Division
Matthew A. Clemens, SPHR
25
4
Senior Vice President, Wealth Management Division
Stephen M. Altland
36
26
Executive Vice President, Chief Financial Officer
Jann Allen Weaver, CPA*
14
14
Executive Vice President, Secretary, and General Counsel
Harry R. Swift, Esq.*
41
41
Vice Chairman, President, and Chief Executive Officer
Larry J. Miller*
Years in
Banking
Years
with
CVLY
Position
PeoplesBank Executive
* Bank Holding Company Officers
8
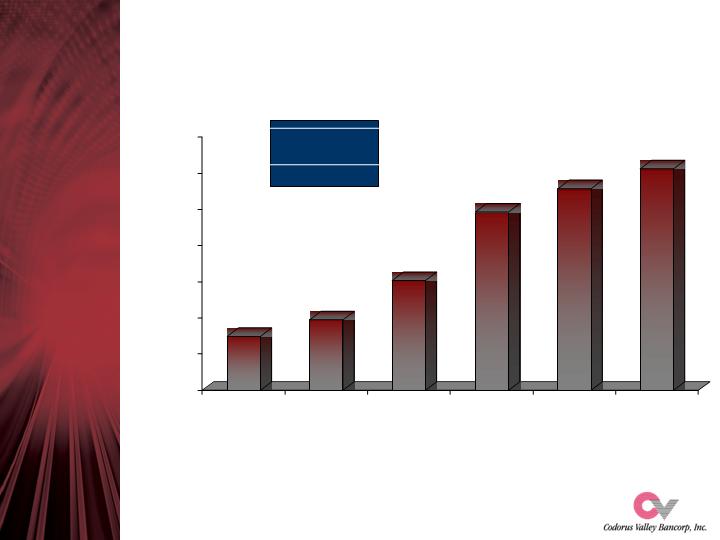
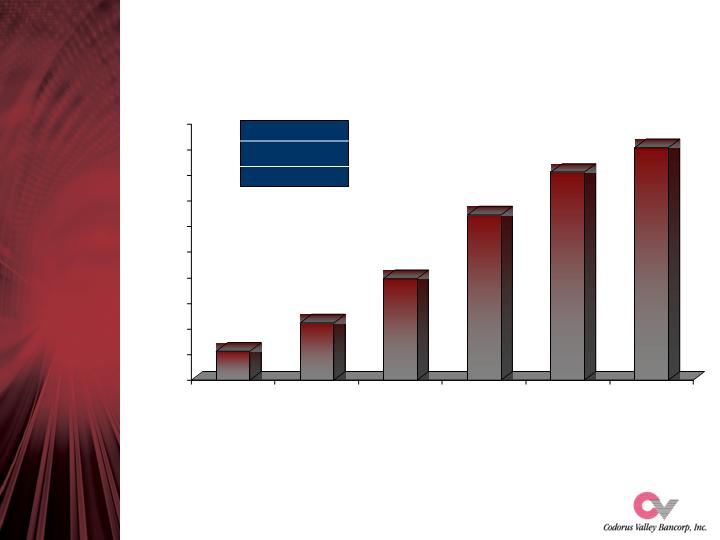
Total Assets
Annual % Increase
27.0%
5.7%
Note: Dollars in thousands
18.2%
5-Yr. CAGR
13.0%
9
7.2%
8.5%
15.2%
$548,212
$594,607
$702,766
$892,831
$957,332
$1,012,132
$400,000
$500,000
$600,000
$700,000
$800,000
$900,000
$1,000,000
$1,100,000
2006
2007
2008
2009
2010
2011
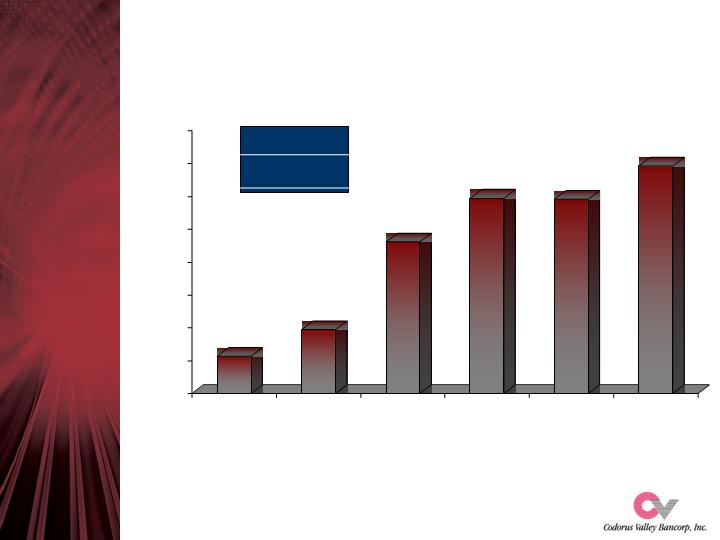
Total Loans
Annual % Increase
Note: Dollars in thousands
11.5%
7.8%
29.7%
9.9%
10.2%
5-Yr. CAGR
11.3%
10
-0.2%
12.4% 9.4% 7.0% (2.0%) (3.8%) 0.3%
Peer
Growth
Rate
$407,260
$447,497
$580,451
$647,143
$645,839
$696,384
$350,000
$400,000
$450,000
$500,000
$550,000
$600,000
$650,000
$700,000
$750,000
2006
2007
2008
2009
2010
2011
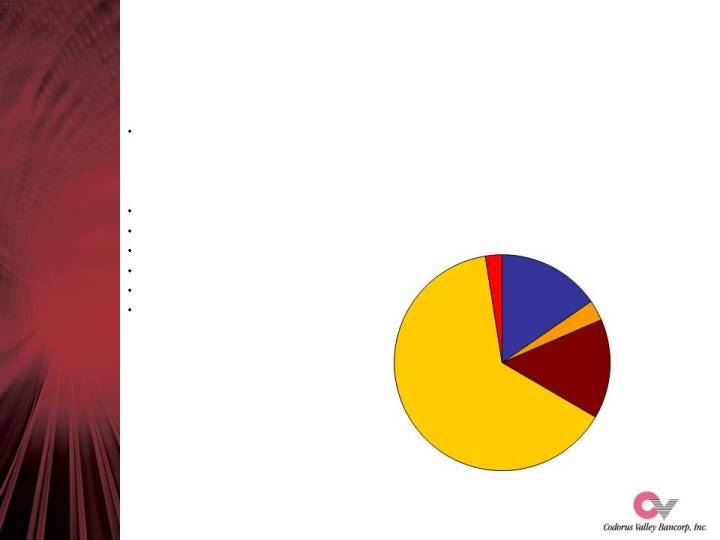
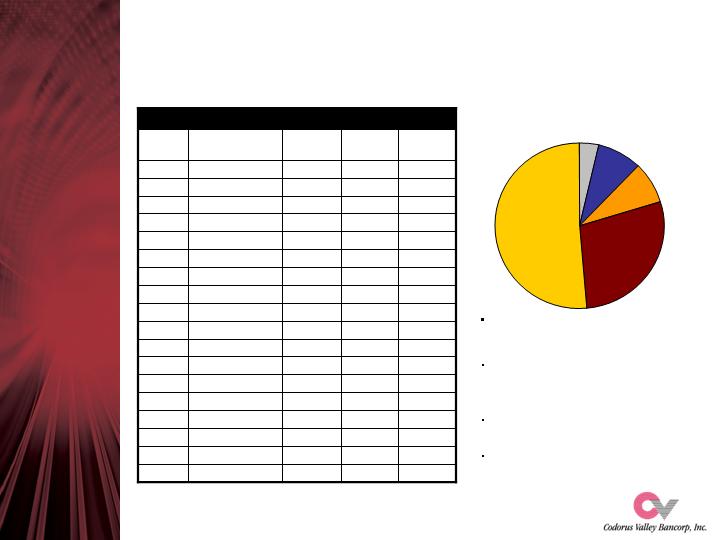
Loan Composition
as of 12/31/2011
11
Mortgage Banking loan production:
2011 - $57 million
2010 - $57 million
2009 - $89 million
Loan participations (purchased) total $40 million
Loan participations (sold) total $26 million
Loans secured by raw land total $2 million
Loans secured by real estate subdivisions total $40 million
$10 million house limit to one borrower
$15 million legal lending limit
Commercial - Other
64.1%
Commercial -
Construction, and
Land Dev.
14.9%
Agricultural
2.5%
Residential
Mortgages
3.1%
Consumer and Home
Equity
15.4%

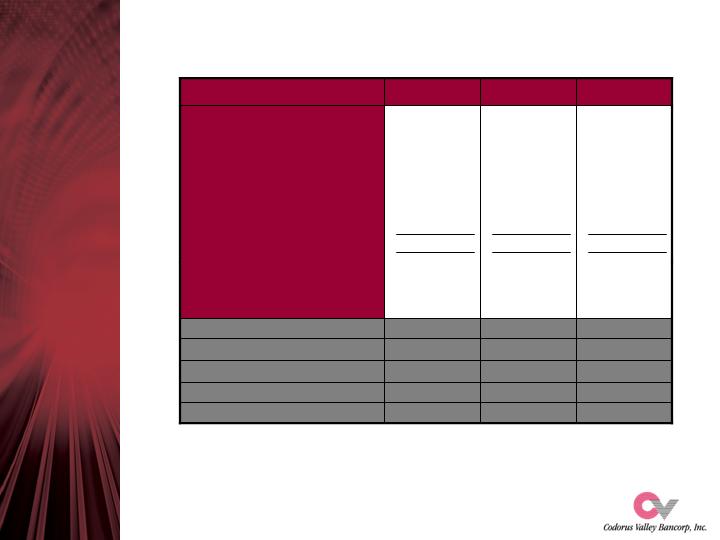
Loan Quality
(862) (5)
0.18
(0.20)
1.18
0.77
1.01
2.25
12/31/2007
614
0.52
0.13
1.40
0.82
2.42
1.83
12/31/2008
1,230
1.18
0.20
1.84
1.11
4.22
5.33
12/31/2009
2,539
1.12
0.39
1.99
1.19
4.71
4.50
12/31/2010
3,859
0.93
0.58
2.02
1.25
4.02
3.94
12/31/2011
CVB
Peer (4)
CVB
Peer (4)
CVB
Peer (4)
CVB
$ in
000’s
Net
c/offs
%
Charge-off Ratio (3)
%
ALLL Ratio (2)
%
NPA Ratio (1)
Notes:
1)
Nonaccrual loans plus net foreclosed real estate plus 90-day past-due as a % of total loans plus net foreclosed real estate.
2)
Allowance for loan and lease loss as a % of total loans.
3)
Net loan charge-offs (annualized) as a % of average total loans.
4)
For 2011, peer group is defined as bank holding companies with consolidated assets between $1 billion and $3 billion located in the
Federal Reserve Bank’s Third District comprised of eastern Pennsylvania, southern New Jersey, and Delaware. Prior to 2011, the peer
group consisted of bank holding companies with consolidated assets between $500 million and $1 billion.
5)
Includes a nonrecurring pretax recovery totaling $839,000.
12
Composition of Nonperforming Assets
$693,515
$640,849
$645,877
Total loans, not available for sale
$8,702
$7,626
$7,175
Allowance for loan and lease losses
1.25%
1.19%
1.11%
ALLL ratio
0.58%
0.39%
0.20%
Net charge-off ratio
3.94%
4.50%
5.33%
NPA ratio
16,243
0
$27,943
10,572
197
$29,293
9,314
40
$34,912
Foreclosed real estate, net
90-days past due
Total nonperforming assets
$1,160
2,079
4,499
2,970
552
-
440
11,700
$8,226
179
3,680
4,842
490
340
767
18,524
$15,688
5,505
3,739
-
-
-
626
25,558
Total nonaccrual loans
Builder & developer
Commercial RE investor
Restaurant
Wholesale & retail
Residential RE investor
Service
Consumer/res mtgs/home eq
Total nonaccrual loans
12/31/2011
12/31/2010
12/31/2009
Note: Dollars in thousands
13

Available for Sale Investment Securities
as of 12/31/2011
Conservative management, investment grade instruments
Well-laddered portfolio
Amortized cost of $224.9 million vs. fair market value of
$233.9 million at December 31, 2011
Weighted average remaining life, approx. 3.9 years
Weighted average TEY, approx. 3.47%
14
US Agencies
13.1%
State and Municipal
37.0%
US Agencies MBS
45.5%
US Treasuries
4.3%
Total Deposits
Annual % Increase
Note: Dollars in thousands
15
18.6%
11.5%
12.1%
20.9%
16.8%
5.99%
5-Yr. CAGR
13.3%
$456,645
$511,968
$598,129
$722,957
$806,110
$854,399
$400,000
$450,000
$500,000
$550,000
$600,000
$650,000
$700,000
$750,000
$800,000
$850,000
$900,000
2006
2007
2008
2009
2010
2011
Deposit Composition
as of 06/30/2011
FDIC Summary of Deposits, PeoplesBank
10.1
759,155
835,996
28.2
28,327
36,316
North Hanover
2008
27.1
12,611
16,031
Bel Air
2008
35.5
8,970
12,151
Hunt Valley
2008
12.9
29,514
33,309
New Freedom
2005
13.4
52,752
59,831
West York
2005
8.9
29,727
32,381
Brogue
2004
21.3
13,301
16,129
Philadelphia Street
2002
(7.3)
24,993
23,159
Market Street
2001
17.0
39,628
46,348
South Hanover
2001
7.9
59,861
64,584
East York
1997
13.6
47,257
53,699
Stewartstown
1994
7.6
90,569
97,423
Cape Horn
1993
13.8
91,490
104,143
Leader Heights
1987
4.0
83,463
86,778
York New Salem
1970
0.1
33,938
33,959
Jefferson
1963
4.5
73,863
77,208
Jacobus
1957
9.4
38,891
42,547
Glen Rock
c. 1864
%
Change
$ in 000’s
2010
$ in 000’s
2011
Branch
Year
Opened
Steady deposit growth from local markets
17 full-service branches with average
deposits of
$49 million per branch*
6 limited service facilities with total deposits of
$10.6 million
Large core deposit base of demand, NOW,
savings, and MMDA
*18th office (Westminster, MD) opened in August 2011
16
Savings
3.6%
Demand
8.6%
NOW
8.1%
Money Market
28.3%
Time
51.4%
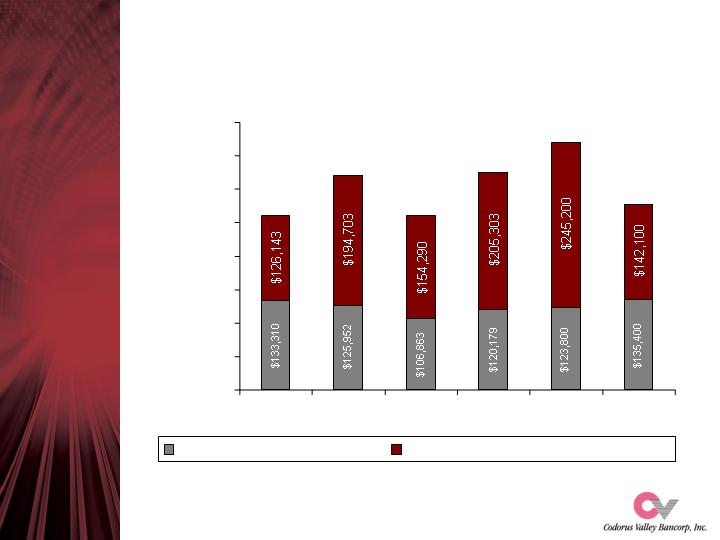
Wealth Management
Assets Under Management
Note: Dollars in thousands
17
$0
$50,000
$100,000
$150,000
$200,000
$250,000
$300,000
$350,000
$400,000
2006
2007
2008
2009
2010
2011
Trust and Investment Services
Codorus Valley Financial Advisors, Inc.
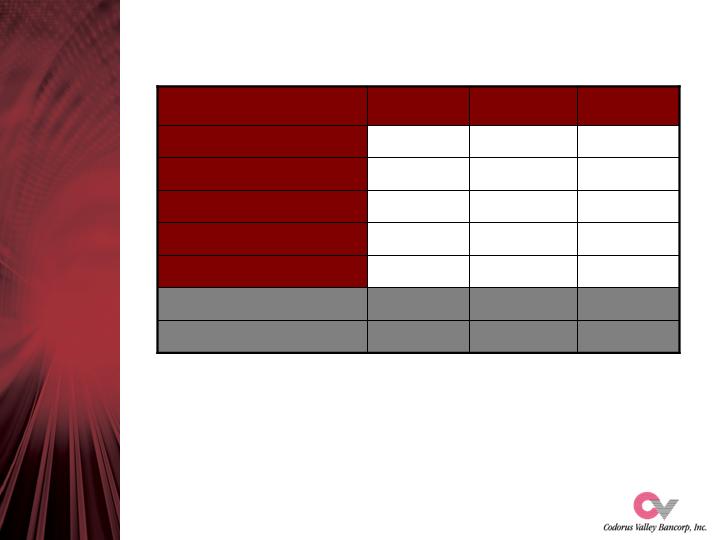
Consolidated Capital Ratios
5.0
10.0
6.0
Regulatory well-capitalized minimum
9.6
15.4
13.9
BHC peer group avg. at 12/31/2011
9.8
12.9
12.1
12/31/2007
9.1
10.8
10.0
12/31/2008
9.1
12.9
11.8
12/31/2009
8.8
13.6
12.5
12/31/2010
9.6
14.6
13.4
12/31/2011
Leverage %
(3)
Total RBC %
(2)
Tier 1 RBC %
(1)
Notes:
1)
Shareholders’ equity less unrealized gains (losses) plus trust preferred capital as a % of risk-weighted assets.
2)
Tier 1 capital plus ALLL as a % of risk-weighted assets.
3)
Tier 1 capital as a % of quarterly average total assets.
4)
Peer group is defined as 300 bank holding companies with consolidated assets between $1 billion and $3 billion located in the
Federal Reserve Bank’s Third District comprised of eastern Pennsylvania, southern New Jersey, and Delaware.
5)
In August 2011 the Corporation issued $25 million of preferred stock to the U.S. Treasury (Treasury) under its Small Business
Lending Fund program (SBLF program). Proceeds from the SBLF program were used in part to redeem $16.5 million of outstanding
preferred stock issued in January 2009 to the Treasury under its Capital Purchase Program (CPP) as required by the Treasury, and
to repurchase a related CPP stock warrant for approximately $527,000.
18

Net Income, Net Interest Margin and Net Overhead
2.08
2.21
3.88
3.94
5,820 (1)
12/31/2007
2.16
2.14
3.65
3.63
4,465
12/31/2008
2.26
2.07
3.61
3.18
2,477
12/31/2009
2.21
2.24
3.76
3.72
5,228
12/31/2010
2.12 (4)
2.02
3.78 (4)
3.73
5,319
12/31/2011
Peer Net
Overhead
%
Net
Overhead
% (3)
Peer NIM
%
NIM % (2)
$000 NI
avail. to CS
Notes:
1)
For analytical purposes, the reported $6,374 should be reduced by a nonrecurring loss recovery totaling $554 after-tax.
2)
Net interest income, taxable equivalent basis, as a % of average interest earning assets.
3)
Noninterest expense less noninterest income as a % of average assets.
4)
For 2011 and thereafter, the peer group is defined as bank holding companies with consolidated assets between $1 billion and $3 billion
located in the Federal Reserve Bank’s Third District comprised of eastern Pennsylvania, southern New Jersey, and Delaware. Prior to
2011, the peer group consisted of bank holding companies with consolidated assets between $500 million and $1 billion.
19

Selected Financial Data
2011
2010
2009
2008
2007
Summary of operations
(in thousands)
Interest income
45,411
$
44,027
$
40,310
$
36,732
$
39,169
$
Interest expense
12,359
13,154
16,358
15,809
18,489
Net interest income
33,052
30,873
23,952
20,923
20,680
Provision for (recovery of) loan losses
4,935
2,990
3,715
1,870
(554)
Noninterest income
7,358
7,574
7,497
6,665
5,688
Noninterest expense
27,079
28,116
24,491
20,044
18,368
Income before income taxes
8,396
7,341
3,243
5,674
8,554
Provision (benefit) for income taxes
1,617
1,133
(191)
1,209
2,180
Net income
6,779
6,208
3,434
4,465
6,374
Preferred stock dividends and discount accretion
1,460
980
957
0
0
Net income available to common shareholders
5,319
$
5,228
$
2,477
$
4,465
$
6,374
$
Per common share
(adjusted for stock dividends)
Net income, basic
$1.28
$1.28
$0.61
$1.13
$1.64
Net income, diluted
$1.27
$1.28
$0.61
$1.12
$1.61
Cash dividends paid
$0.35
$0.25
$0.26
$0.51
$0.56
Stock dividends distributed
-
-
-
5%
5%
Book value
$16.24
$14.51
$13.60
$12.99
$12.33
Tangible book value
$16.19
$14.44
$13.52
$12.90
$12.23
Cash dividend payout ratio
27.3%
19.6%
42.3%
45.1%
33.8%
Weighted average shares outstanding
4,158,550
4,093,192
4,042,910
3,965,996
3,881,501
Weighted average diluted shares outstanding
4,185,008
4,099,475
4,042,910
3,990,956
3,965,980
Profitability ratios
Return on average shareholders' equity (ROE)
8.04%
8.12%
4.88%
8.91%
13.91%
Return on average assets (ROA)
0.69%
0.67%
0.41%
0.71%
1.11%
Net interest margin
3.73%
3.72%
3.18%
3.63%
3.94%
Efficiency ratio
64.20%
69.87%
74.63%
70.59%
67.38%
Net overhead ratio
2.02%
2.24%
2.07%
2.14%
2.20%
Capital ratios
Tier 1 risk-based capital
13.35%
12.51%
11.83%
10.03%
12.14%
Total risk-based capital
14.55%
13.64%
12.90%
10.80%
12.86%
Average shareholders' equity to average assets
8.56%
8.29%
8.43%
7.94%
7.96%
Summary of financial condition
at year-end
(in thousands)
Investment securities
237,496
$
226,603
$
178,454
$
77,287
$
84,369
$
Loans
696,384
645,839
647,143
580,451
447,497
Assets
1,012,132
957,332
892,831
702,766
594,607
Deposits
854,399
806,110
722,957
598,129
511,968
Borrowings
56,885
68,805
92,748
47,779
30,660
Equity
93,242
76,539
72,012
52,181
48,415
Other data
Number of bank offices
18
17
17
17
14
Number of employees
(full-time equivalents)
203
198
201
200
179
Wealth Management assets,
market value
(in thousands)
277,505
$
368,985
$
325,482
$
261,153
$
320,655
$

105 Leader Heights Road
P.O. Box 2887
York, Pennsylvania 17405-2887
717-846-1970 or 888-846-1970
www.peoplesbanknet.com