Exhibit 99.1
INVESTOR PRESENTATION Larry J. Miller Vice Chairman, President, and CEO Jann Allen Weaver, CPA Treasurer and CFO
SPECIAL CAUTIONARY NOTICE REGARDING FORWARD - LOOKING STATEMENTS This presentation may contain forward - looking statements about Codorus Valley Bancorp, Inc . These forward - looking statements are subject to risks and uncertainties . Forward - looking statements include information concerning possible or assumed future results of operations of the Corporation and its subsidiaries . When words such as “believes,” “expects,” “anticipates” or similar expressions occur in this presentation, management is making forward - looking statements . Note that many factors could affect the future financial results of the Corporation and its subsidiaries, both individually and collectively, and could cause those results to differ materially from those expressed in the forward - looking statements . These factors include, but are not limited to, the following : • operating, legal and regulatory risks, including the impact of the Dodd - Frank Wall Street Reform Act ; • a prolonged economic downturn ; • an increase in nonperforming assets requiring loss provisions and the incurrence of carrying costs ; • declines in the market value of investment securities considered to be other than temporary ; • the effect of and changes in the rate of FDIC premiums, including special assessments ; • interest rate fluctuations which could increase our cost of funds or decrease our yield on earning assets and therefore reduce our net interest income ; • unavailability of capital when needed or available at an excessive cost ; • political and competitive forces affecting banking, securities, asset management and credit services businesses ; and • the risk that management’s analysis of these risks and forces could be incorrect and/or that the strategies developed to address them could be unsuccessful . The Corporation undertakes no obligation to publicly revise or update these forward - looking statements to reflect events or circumstances that arise after the date of this report . Additional financial information can be found in Codorus Valley Bancorp, Inc . ’s Quarterly Reports on Forms 10 - Q and its Annual Report on Form 10 - K, each of which has been filed with the Securities and Exchange Commission and is available on the Corporation’s website at www . peoplesbanknet . com and on the Securities and Exchange Commission’s website at www . sec . gov . 2

FRANCHISE OVERVIEW • Largest independent financial institution headquartered in York, Pennsylvania • Founded in 1864 • 22 PeoplesBank financial centers in Pennsylvania and Maryland • $1.2 billion in total assets* • $888 million in total loans* • $968 million in total deposits* • $286 million in wealth management assets under management* • Provides commercial and consumer banking services to over 24,000 households • Named one of the Fastest Growing Companies in Central Pennsylvania for three years straight** • Named one of the Best Places to Work in Pennsylvania in 2012 and 2013*** • Named one of the Top 200 Community Banks in the United States in 2014**** * as of June 30, 2014 ** by the Central Penn Business Journal *** by the Team Pennsylvania Foundation **** by American Banker Magazine 3 - 17 in York County, PA - 1 in Baltimore County, MD - 1 in Harford County, MD - 1 in Carroll County, MD - 2 under development in Shrewsbury, PA and Camp Hill, PA
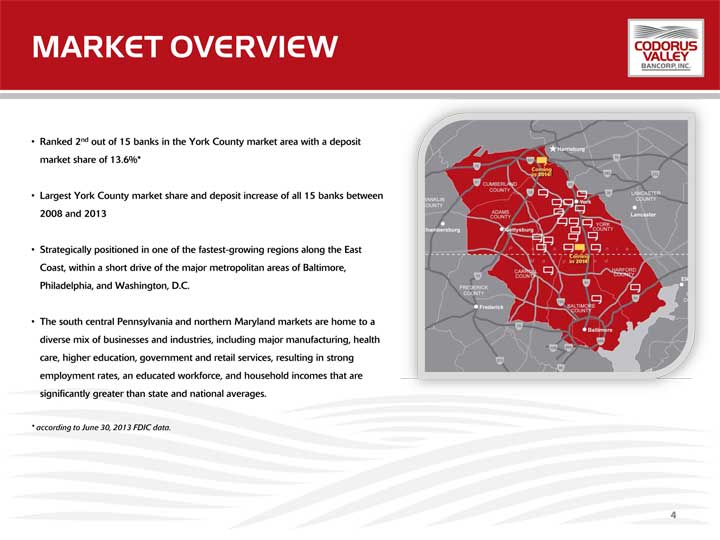
MARKET OVERVIEW • Ranked 2 nd out of 15 banks in the York County market area with a deposit market share of 13.6%* • Largest York County market share and deposit increase of all 15 banks between 2008 and 2013 • Strategically positioned in one of the fastest - growing regions along the East Coast, within a short drive of the major metropolitan areas of Baltimore, Philadelphia, and Washington, D.C. • The south central Pennsylvania and northern Maryland markets are home to a diverse mix of businesses and industries, including major manufacturing, health care, higher education, government and retail services, resulting in strong employment rates, an educated workforce, and household incomes that are significantly greater than state and national averages. * according to June 30, 2013 FDIC data. 4

PENDING ACQUISITION OVERVIEW • Codorus Valley Bancorp, Inc. recently announced the signing of a definitive agreement to acquire Madison Bancorp, Inc. in an all - cash transaction valued at approximately $14.4 million, or $22.90 per share, which represents a 6% premium over Madison’s fully - diluted tangible book value as of March 31, 2014. Pending regulatory and Madison shareholder approvals, and satisfaction or waiver of various customary conditions to closing, the transaction is expected to be completed during the first quarter of 2015. • Madison Bancorp, Inc. and its wholly - owned subsidiary, Madison Square Federal Savings Bank, have consolidated assets of approximately $140 million and deposits of approximately $130 million as of June 30, 2014, and operate four offices in the demographically - attractive Harford and Baltimore Counties in Maryland. • Beyond the initial merger - related costs estimated at $2.5 million, Codorus Valley expects to realize recurring savings by eliminating duplicative overhead and leveraging its operating processes across the four Madison offices. These expense savings are expected to accrete $0.26 per fully - diluted share annually beginning in the first year post - merger. • Additional accretion, from both revenue growth and further operational efficiencies, is expected as Codorus Valley’s sales and service activities become more established in the four Madison offices, with full integration expected within twelve months of the merger effective date. 5 = Madison Square FSB locations
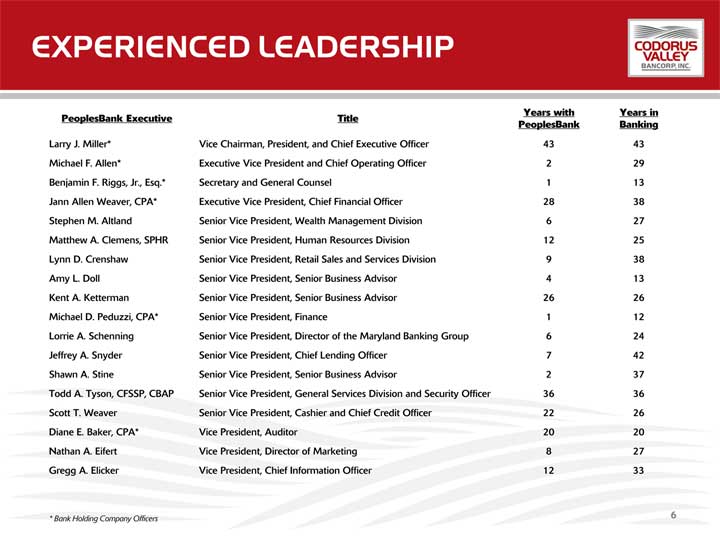
EXPERIENCED LEADERSHIP PeoplesBank Executive Title Years with PeoplesBank Years in Banking Larry J. Miller* Vice Chairman, President, and Chief Executive Officer 43 43 Michael F. Allen* Executive Vice President and Chief Operating Officer 2 29 Benjamin F. Riggs, Jr., Esq.* Secretary and General Counsel 1 13 Jann Allen Weaver, CPA* Executive Vice President, Chief Financial Officer 28 38 Stephen M. Altland Senior Vice President, Wealth Management Division 6 27 Matthew A. Clemens, SPHR Senior Vice President, Human Resources Division 12 25 Lynn D. Crenshaw Senior Vice President, Retail Sales and Services Division 9 38 Amy L. Doll Senior Vice President, Senior Business Advisor 4 13 Kent A. Ketterman Senior Vice President, Senior Business Advisor 26 26 Michael D. Peduzzi, CPA* Senior Vice President, Finance 1 12 Lorrie A. Schenning Senior Vice President, Director of the Maryland Banking Group 6 24 Jeffrey A. Snyder Senior Vice President, Chief Lending Officer 7 42 Shawn A. Stine Senior Vice President, Senior Business Advisor 2 37 Todd A. Tyson, CFSSP, CBAP Senior Vice President, General Services Division and Security Officer 36 36 Scott T. Weaver Senior Vice President, Cashier and Chief Credit Officer 22 26 Diane E. Baker, CPA* Vice President, Auditor 20 20 Nathan A. Eifert Vice President, Director of Marketing 8 27 Gregg A. Elicker Vice President, Chief Information Officer 12 33 * Bank Holding Company Officers 6
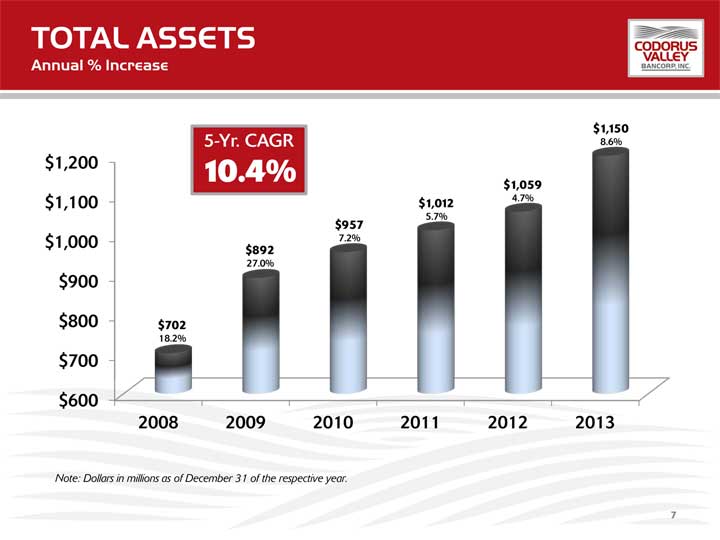
TOTAL ASSETS Annual % Increase $600 $700 $800 $900 $1,000 $1,100 $1,200 2008 2009 2010 2011 2012 2013 Note: Dollars in millions as of December 31 of the respective year. 5 - Yr. CAGR 10.4% 18.2 % 7 $702 18.2% $892 27.0% $957 7.2% $1,012 5.7% $1,059 4.7% $1,150 8.6%
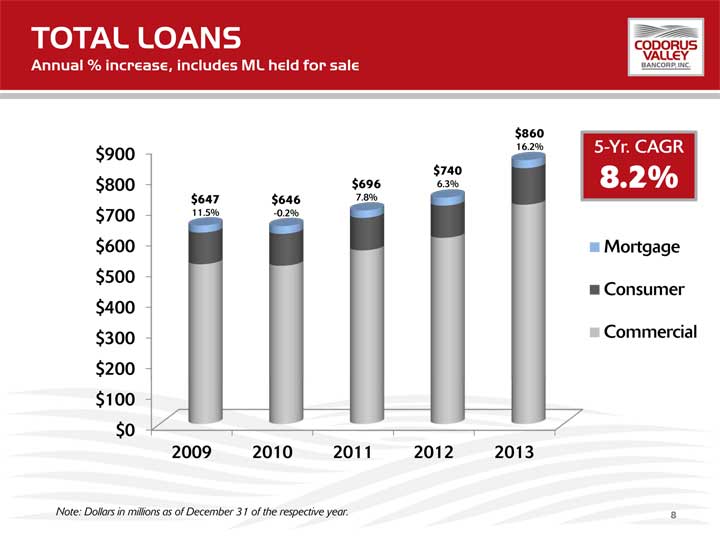
TOTAL LOANS Annual % increase, includes ML held for sale Note: Dollars in millions as of December 31 of the respective year. 8 $0 $100 $200 $300 $400 $500 $600 $700 $800 $900 2009 2010 2011 2012 2013 Mortgage Consumer Commercial 5 - Yr. CAGR 8.2% $860 16.2% $696 7.8% $647 11.5% $646 - 0.2% $740 6.3%
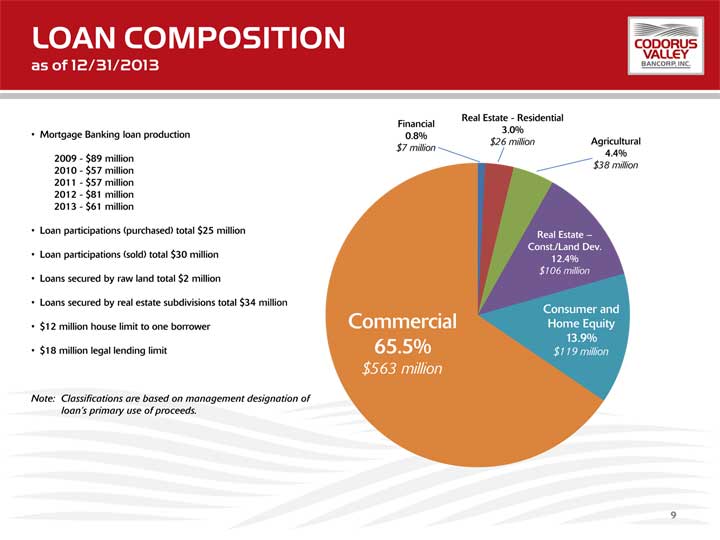
LOAN COMPOSITION as of 12/31/2013 29.7 % - 0.2% 11.5 % 16.2 % 6.3% 7.8% • Mortgage Banking loan production 2009 - $89 million 2010 - $57 million 2011 - $57 million 2012 - $81 million 2013 - $61 million • Loan participations (purchased) total $25 million • Loan participations (sold) total $30 million • Loans secured by raw land total $2 million • Loans secured by real estate subdivisions total $34 million • $12 million house limit to one borrower • $18 million legal lending limit Note: Classifications are based on management designation of loan’s primary use of proceeds. Commercia l 65.5% $563 million Consumer and Home Equity 13.9% $119 million Real Estate – Const./Land Dev. 12.4% $106 million Agricultural 4.4% $38 million Financial 0.8% $7 million Real Estate - Residential 3.0% $26 million 9

LOAN QUALITY % NPA Ratio (1) % ALLL Ratio (2) % Charge - off Ratio (3) $ in 000’s Net Charge - offs CVLY Peer (4) CVLY Peer (4) CVLY Peer (4) CVLY 12/31/2009 5.33 4.22 1.11 1.84 0.20 1.18 1,230 12/31/2010 4.50 4.71 1.19 1.99 0.39 1.12 2,539 12/31/2011 3.94 4.02 1.25 2.02 0.58 0.93 3,859 12/31/2012 1.64 3.07 1.26 1.80 0.16 0.59 1,150 12/31/2013 2.24 2.05 1.16 1.54 0.10 0.25 797 Notes: 1) Nonaccrual loans plus net foreclosed real estate plus 90 - day past - due as a % of total loans plus net foreclosed real estate. 2) Allowance for loan and lease loss as a % of total loans. 3) Net loan charge - offs (annualized) as a % of average total loans. 4) For 2011 - 2013, peer group is defined as bank holding companies with consolidated assets between $1 billion and $3 billion. Prior to 2011, the peer group consisted of bank holding companies with consolidated assets between $500 million and $1 billion. 10
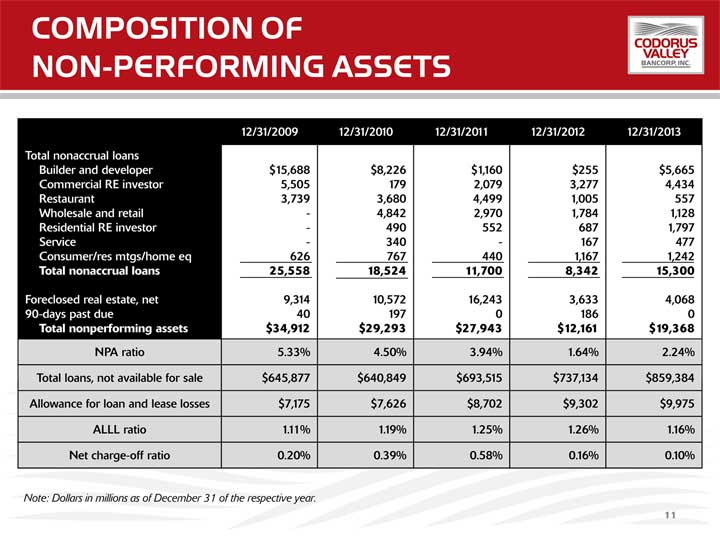
COMPOSITION OF NON - PERFORMING ASSETS 12/31/2009 12/31/2010 12/31/2011 12/31/2012 12/31/2013 Total nonaccrual loans Builder and developer Commercial RE investor Restaurant Wholesale and retail Residential RE investor Service Consumer/res mtgs/home eq Total nonaccrual loans Foreclosed real estate, net 90 - days past due Total nonperforming assets $15,688 5,505 3,739 - - - 626 25,558 9,314 40 $34,912 $8,226 179 3,680 4,842 490 340 767 18,524 10,572 197 $29,293 $1,160 2,079 4,499 2,970 552 - 440 11,700 16,243 0 $27,943 $255 3,277 1,005 1,784 687 167 1,167 8,342 3,633 186 $12,161 $5,665 4,434 557 1,128 1,797 477 1,242 15,300 4,068 0 $19,368 NPA ratio 5.33% 4.50% 3.94% 1.64% 2.24% Total loans, not available for sale $645,877 $640,849 $693,515 $737,134 $859,384 Allowance for loan and lease losses $7,175 $7,626 $8,702 $9,302 $9,975 ALLL ratio 1.11% 1.19% 1.25% 1.26% 1.16% Net charge - off ratio 0.20% 0.39% 0.58% 0.16% 0.10% 11 Note: Dollars in millions as of December 31 of the respective year.
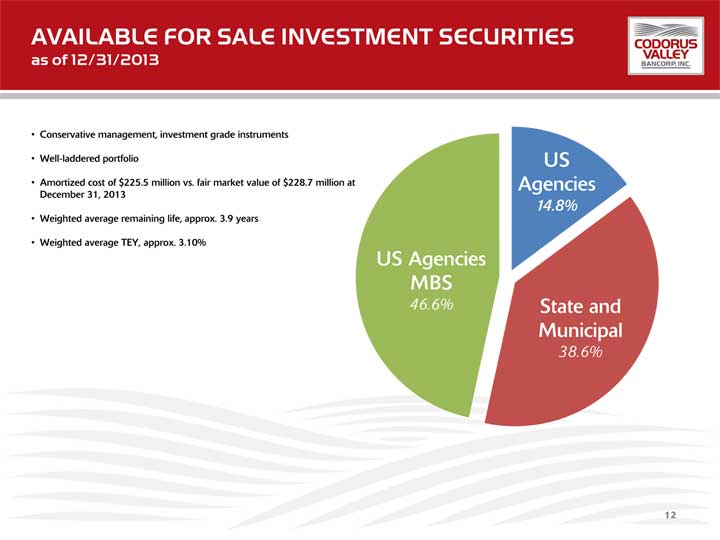
AVAILABLE FOR SALE INVESTMENT SECURITIES as of 12/31/2013 29.7 % - 0.2% 11.5 % 16.2 % 6.3% 7.8% • Conservative management, investment grade instruments • Well - laddered portfolio • Amortized cost of $225.5 million vs. fair market value of $228.7 million at December 31, 2013 • Weighted average remaining life, approx. 3.9 years • Weighted average TEY, approx. 3.10% US Agencies MBS 46.6% State and Municipal 38.6% US Agencies 14.8% 12
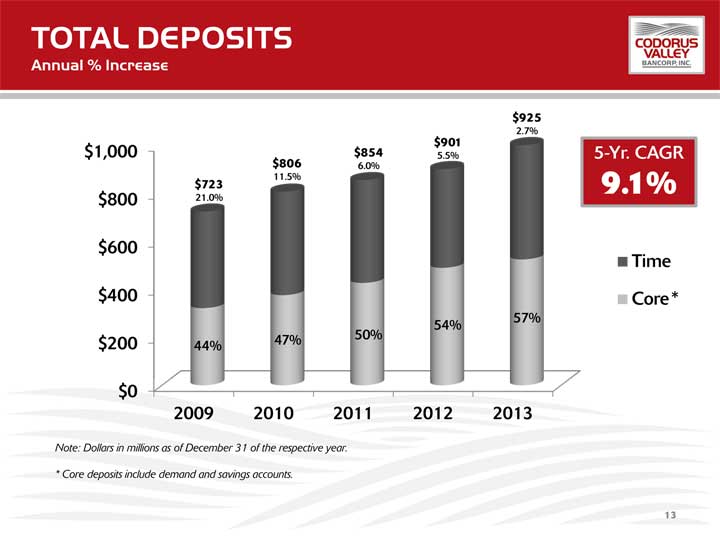
TOTAL DEPOSITS Annual % Increase Note: Dollars in millions as of December 31 of the respective year. * Core deposits include demand, savings, and money market accounts. 13 $0 $200 $400 $600 $800 $1,000 2009 2010 2011 2012 2013 Time Core 5 - Yr. CAGR 9.1% 44% 47% 50% 57% 54% $723 21.0% $806 11.5% $854 6.0% $901 5.5% $925 2.7% *
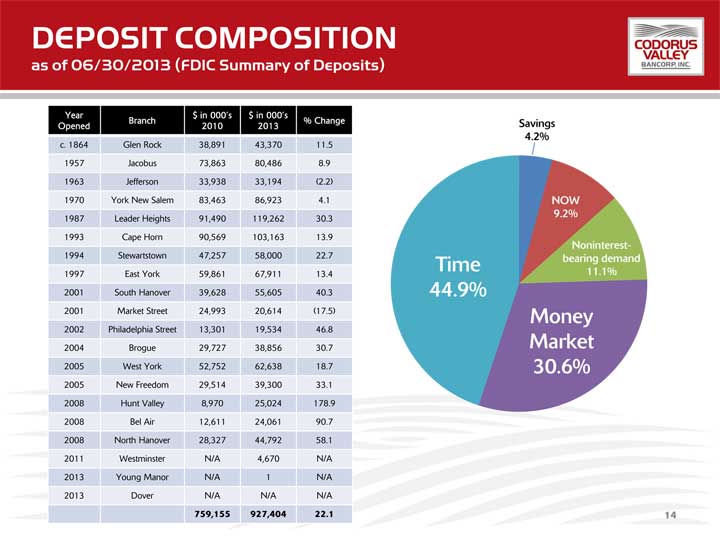
DEPOSIT COMPOSITION as of 06/30/2013 (FDIC Summary of Deposits) 29.7 % - 0.2% 11.5 % 16.2 % 6.3% 7.8% Time 44.9% Money Market 30.6% Year Opened Branch $ in 000’s 2010 $ in 000’s 2013 % Change c. 1864 Glen Rock 38,891 43,370 11.5 1957 Jacobus 73,863 80,486 8.9 1963 Jefferson 33,938 33,194 (2.2) 1970 York New Salem 83,463 86,923 4.1 1987 Leader Heights 91,490 119,262 30.3 1993 Cape Horn 90,569 103,163 13.9 1994 Stewartstown 47,257 58,000 22.7 1997 East York 59,861 67,911 13.4 2001 South Hanover 39,628 55,605 40.3 2001 Market Street 24,993 20,614 (17.5) 2002 Philadelphia Street 13,301 19,534 46.8 2004 Brogue 29,727 38,856 30.7 2005 West York 52,752 62,638 18.7 2005 New Freedom 29,514 39,300 33.1 2008 Hunt Valley 8,970 25,024 178.9 2008 Bel Air 12,611 24,061 90.7 2008 North Hanover 28,327 44,792 58.1 2011 Westminster N/A 4,670 N/A 2013 Young Manor N/A 1 N/A 2013 Dover N/A N/A N/A 759,155 927,404 22.1 Noninterest - bearing demand 11.1% NOW 9.2% Savings 4.2% 14

WEALTH MANAGEMENT ASSETS UNDER MANAGEMENT Note: Dollars in thousands as of December 31 of the respective year. * Wholly - owned subsidiary of PeoplesBank $0 $50,000 $100,000 $150,000 $200,000 $250,000 $300,000 $350,000 $400,000 2008 2009 2010 2011 2012 2013 Trust and Investment Services Codorus Valley Financial Advisors, Inc. $261,153 $325,482 $369,000 $261,000 $277,500 $329,600 $154,290 $205,303 $245,200 $170,300 $142,100 $86,900 $106,863 $120,179 $123,800 $135,400 $159,300 $174,100 15 *
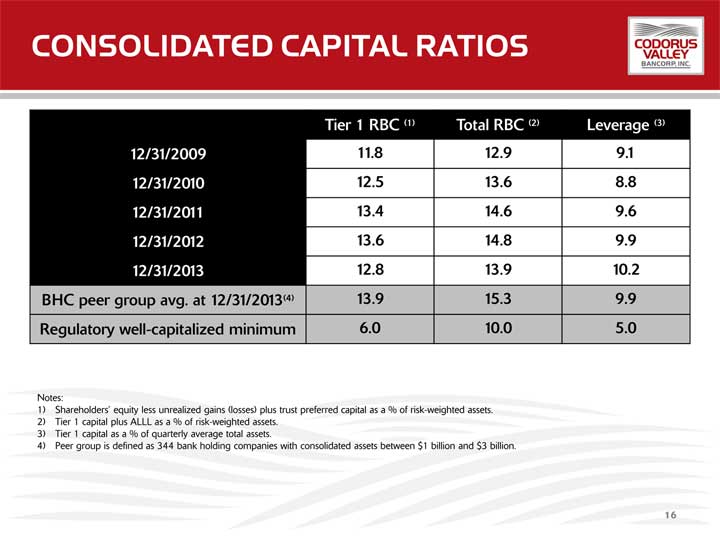
CONSOLIDATED CAPITAL RATIOS Tier 1 RBC (1) Total RBC (2) Leverage (3) 12/31/2009 11.8 12.9 9.1 12/31/2010 12.5 13.6 8.8 12/31/2011 13.4 14.6 9.6 12/31/2012 13.6 14.8 9.9 12/31/2013 12.8 13.9 10.2 BHC peer group avg. at 12/31/2013 (4) 13.9 15.3 9.9 Regulatory well - capitalized minimum 6.0 10.0 5.0 Notes: 1) Shareholders’ equity less unrealized gains (losses) plus trust preferred capital as a % of risk - weighted assets. 2) Tier 1 capital plus ALLL as a % of risk - weighted assets. 3) Tier 1 capital as a % of quarterly average total assets. 4) Peer group is defined as 344 bank holding companies with consolidated assets between $1 billion and $3 billion. 16
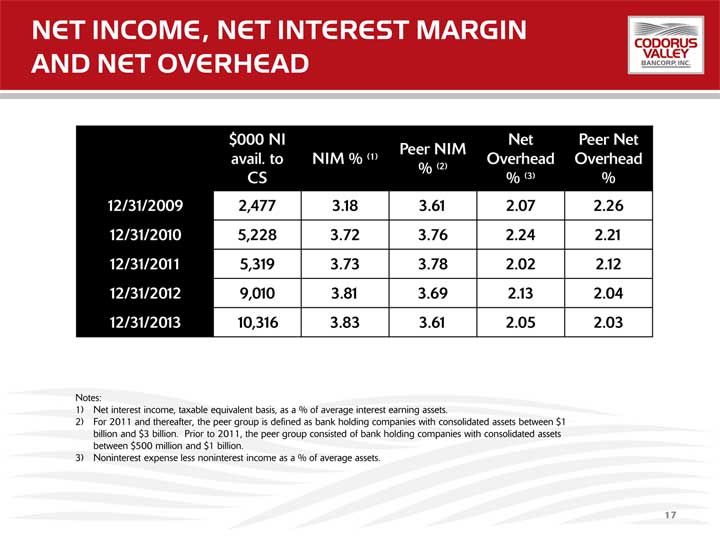
NET INCOME, NET INTEREST MARGIN AND NET OVERHEAD $000 NI avail. to CS NIM % (1) Peer NIM % (2) Net Overhead % (3) Peer Net Overhead % 12/31/2009 2,477 3.18 3.61 2.07 2.26 12/31/2010 5,228 3.72 3.76 2.24 2.21 12/31/2011 5,319 3.73 3.78 2.02 2.12 12/31/2012 9,010 3.81 3.69 2.13 2.04 12/31/2013 10,316 3.83 3.61 2.05 2.03 Notes: 1) Net interest income, taxable equivalent basis, as a % of average interest earning assets. 2) For 2011 and thereafter, the peer group is defined as bank holding companies with consolidated assets between $1 billion and $3 billion. Prior to 2011, the peer group consisted of bank holding companies with consolidated assets between $500 million and $1 billion. 3) Noninterest expense less noninterest income as a % of average assets. 17
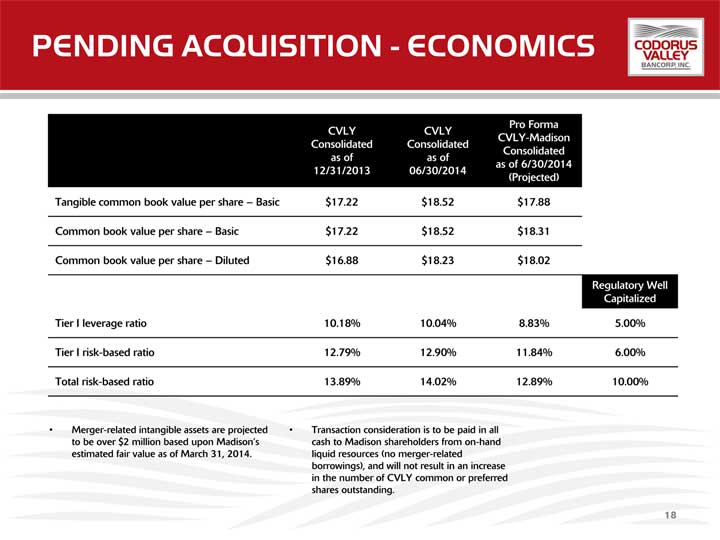
PENDING ACQUISITION - ECONOMICS 18 CVLY Consolidated as of 12/31/2013 CVLY Consolidated as of 06/30/2014 Pro Forma CVLY - Madison Consolidated as of 6/30/2014 (Projected) Tangible common book value per share – Basic $17.22 $18.52 $17.88 Common book value per share – Basic $17.22 $18.52 $18.31 Common book value per share – Diluted $16.88 $18.23 $18.02 Regulatory Well Capitalized Tier I leverage ratio 10.18% 10.04% 8.83% 5.00% Tier I risk - based ratio 12.79% 12.90% 11.84% 6.00% Total risk - based ratio 13.89% 14.02% 12.89% 10.00% • Merger - related intangible assets are projected to be over $2 million based upon Madison’s estimated fair value as of March 31, 2014. • Transaction consideration is to be paid in all cash to Madison shareholders from on - hand liquid resources (no merger - related borrowings), and will not result in an increase in the number of CVLY common or preferred shares outstanding.
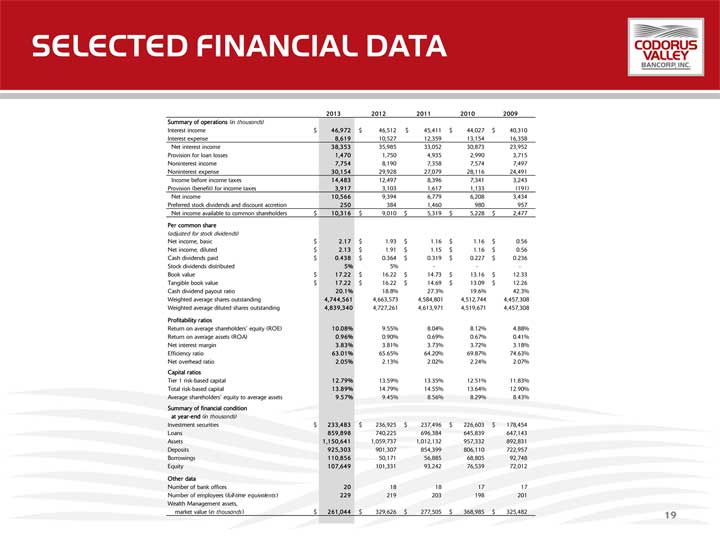
SELECTED FINANCIAL DATA Summary of operations (in thousands) Interest income $ 46,972 $ 46,512 $ 45,411 $ 44,027 $ 40,310 Interest expense 8,619 10,527 12,359 13,154 16,358 Net interest income 38,353 35,985 33,052 30,873 23,952 Provision for loan losses 1,470 1,750 4,935 2,990 3,715 Noninterest income 7,754 8,190 7,358 7,574 7,497 Noninterest expense 30,154 29,928 27,079 28,116 24,491 Income before income taxes 14,483 12,497 8,396 7,341 3,243 Provision (benefit) for income taxes 3,917 3,103 1,617 1,133 (191) Net income 10,566 9,394 6,779 6,208 3,434 Preferred stock dividends and discount accretion 250 384 1,460 980 957 Net income available to common shareholders $ 10,316 $ 9,010 $ 5,319 $ 5,228 $ 2,477 Per common share (adjusted for stock dividends) Net income, basic $ 2.17 $ 1.93 $ 1.16 $ 1.16 $ 0.56 Net income, diluted $ 2.13 $ 1.91 $ 1.15 $ 1.16 $ 0.56 Cash dividends paid $ 0.438 $ 0.364 $ 0.319 $ 0.227 $ 0.236 Stock dividends distributed 5% 5% - - - Book value $ 17.22 $ 16.22 $ 14.73 $ 13.16 $ 12.33 Tangible book value $ 17.22 $ 16.22 $ 14.69 $ 13.09 $ 12.26 Cash dividend payout ratio 20.1% 18.8% 27.3% 19.6% 42.3% Weighted average shares outstanding 4,744,561 4,663,573 4,584,801 4,512,744 4,457,308 Weighted average diluted shares outstanding 4,839,340 4,727,261 4,613,971 4,519,671 4,457,308 Profitability ratios Return on average shareholders' equity (ROE) 10.08% 9.55% 8.04% 8.12% 4.88% Return on average assets (ROA) 0.96% 0.90% 0.69% 0.67% 0.41% Net interest margin 3.83% 3.81% 3.73% 3.72% 3.18% Efficiency ratio 63.01% 65.65% 64.20% 69.87% 74.63% Net overhead ratio 2.05% 2.13% 2.02% 2.24% 2.07% Capital ratios Tier 1 risk-based capital 12.79% 13.59% 13.35% 12.51% 11.83% Total risk-based capital 13.89% 14.79% 14.55% 13.64% 12.90% Average shareholders' equity to average assets 9.57% 9.45% 8.56% 8.29% 8.43% Summary of financial condition at year-end (in thousands) Investment securities $ 233,483 $ 236,925 $ 237,496 $ 226,603 $ 178,454 Loans 859,898 740,225 696,384 645,839 647,143 Assets 1,150,641 1,059,737 1,012,132 957,332 892,831 Deposits 925,303 901,307 854,399 806,110 722,957 Borrowings 110,856 50,171 56,885 68,805 92,748 Equity 107,649 101,331 93,242 76,539 72,012 Other data Number of bank offices 20 18 18 17 17 Number of employees (full-time equivalents) 229 219 203 198 201 Wealth Management assets, market value (in thousands) $ 261,044 $ 329,626 $ 277,505 $ 368,985 $ 325,482 2013 2012 2011 2010 2009 19

CODORUS VALLEY CORPORATE CENTER 105 Leader Heights Road P.O. Box 2887 York, Pennsylvania 17405 - 2887 717 - 846 - 1970 or 888 - 846 - 1970 www.peoplesbanknet.com