Exhibit 99.1

Investor Presentation August 10, 2016 Larry J. Miller Chairman, President and Chief Executive Officer lmiller@peoplesbanknet.com 717 - 747 - 1500 A. Dwight Utz Executiv e Vice President and Chief Operating Officer dutz@peoplesbanknet.com 717 - 747 - 1501
SAFE HARBOR NOTICE REGARDING FORWARD - LOOKING STATEMENTS 2 This presentation contains forward - looking statements about Codorus Valley Bancorp, Inc. that are intended to be covered by the safe harbor for forward - looking statements provided by the Private Securities Litigation Reform Act of 1995. Forward - looking statements are not historical facts. These statements can be identified by the use of forward - looking terminology such as “believe,” “expect,” “may,” “will,” “should,” “project,” “plan,” “seek,” “intend,” “anticipate” or similar terminology. Such forward - looking statements include, but are not limited to, discussions of strategy, financial projections and estimates and their underlying assumptions ; statements regarding plans, objectives, goals, expectations or consequences ; and statements about future performance, operations, products and services of Codorus Valley Bancorp, Inc. and its subsidiaries. Codorus Valley Bancorp, Inc. cautions readers not to place undue reliance on forward - looking statements and to consider possible events or factors that could cause results or performance to materially differ from those expressed in the forward - looking statements, including, but not limited to : ineffectiveness of the corporation’s business strategy due to changes in current or future market conditions ; the effects of competition, and of changes in laws and regulations on competition, including industry consolidation and development of competing financial products and services ; inability to achieve merger - related synergies ; interest rate movements ; difficulties in integrating distinct business operations, including information technology difficulties ; challenges in establishing and maintaining operations in new markets ; volatilities in the securities markets ; and deteriorating economic conditions. Additional factors that may affect forward - looking statements made in this presentation can be found in Codorus Valley Bancorp, Inc. ’s Quarterly Reports on Forms 10 - Q and its Annual Report on Form 10 - K, as filed with the Securities and Exchange Commission and available on the corporation’s website at www.peoplesbanknet.com and on the Securities and Exchange Commission’s website at www.sec.gov. We include web addresses here as inactive textual references only. Information on these websites is not part of this presentation. Forward - looking statements in this presentation speak only as of the date of this presentation and Codorus Valley Bancorp, Inc. makes no commitment to revise or update such statements to reflect changes that occur after the date the forward - looking statement was made.
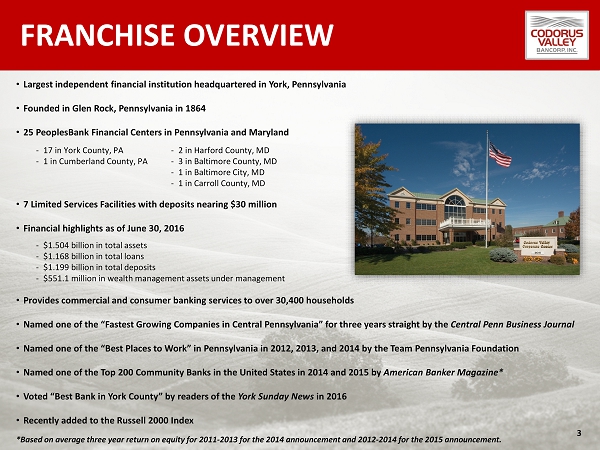
FRANCHISE OVERVIEW • Largest independent financial institution headquartered in York, Pennsylvania • Founded in Glen Rock, Pennsylvania in 1864 • 25 PeoplesBank Financial Centers in Pennsylvania and Maryland • 7 Limited Services Facilities with deposits nearing $30 million • Financial highlights as of June 30, 2016 • Provides commercial and consumer banking services to over 30,400 households • Named one of the “Fastest Growing Companies in Central Pennsylvania” for three years straight by the Central Penn Business Journal • Named one of the “Best Places to Work” in Pennsylvania in 2012, 2013, and 2014 by the Team Pennsylvania Foundation • Named one of the Top 200 Community Banks in the United States in 2014 and 2015 by American Banker Magazine* • Voted “Best Bank in York County” by readers of the York Sunday News in 2016 • Recently added to the Russell 2000 Index *Based on average three year return on equity for 2011 - 2013 for the 2014 announcement and 2012 - 2014 for the 2015 announcement. - 17 in York County, PA - 1 in Cumberland County, PA - 2 in Harford County, MD - 3 in Baltimore County, MD - 1 in Baltimore City, MD - 1 in Carroll County, MD 3 - $1.504 billion in total assets - $1.168 billion in total loans - $1.199 billion in total deposits - $551.1 million in wealth management assets under management
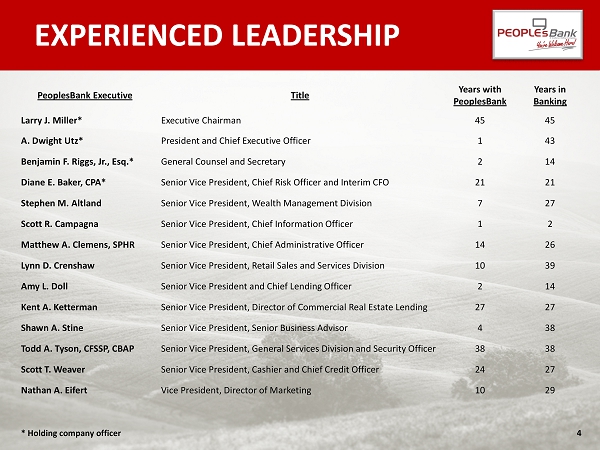
EXPERIENCED LEADERSHIP PeoplesBank Executive Title Years with PeoplesBank Years in Banking Larry J. Miller* Executive Chairman 45 45 A. Dwight Utz* President and Chief Executive Officer 1 43 Benjamin F. Riggs, Jr., Esq.* General Counsel and Secretary 2 14 Diane E. Baker, CPA* Senior Vice President, Chief Risk Officer and Interim CFO 21 21 Stephen M. Altland Senior Vice President, Wealth Management Division 7 27 Scott R. Campagna Senior Vice President, Chief Information Officer 1 2 Matthew A. Clemens, SPHR Senior Vice President, Chief Administrative Officer 14 26 Lynn D. Crenshaw Senior Vice President, Retail Sales and Services Division 10 39 Amy L. Doll Senior Vice President and Chief Lending Officer 2 14 Kent A. Ketterman Senior Vice President, Director of Commercial Real Estate Lending 27 27 Shawn A. Stine Senior Vice President, Senior Business Advisor 4 38 Todd A. Tyson, CFSSP, CBAP Senior Vice President, General Services Division and Security Officer 38 38 Scott T. Weaver Senior Vice President, Cashier and Chief Credit Officer 24 27 Nathan A. Eifert Vice President, Director of Marketing 10 29 4 * Holding company officer
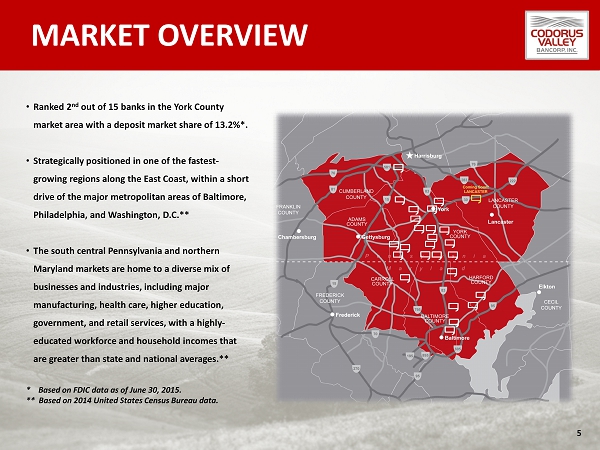
MARKET OVERVIEW • Ranked 2 nd out of 15 banks in the York County market area with a deposit market share of 13.2%*. • Strategically positioned in one of the fastest - growing regions along the East Coast, within a short drive of the major metropolitan areas of Baltimore, Philadelphia, and Washington, D.C.** • The south central Pennsylvania and northern Maryland markets are home to a diverse mix of businesses and industries, including major manufacturing, health care, higher education, government, and retail services, with a highly - educated workforce and household incomes that are greater than state and national averages.** * Based on FDIC data as of June 30, 2015. ** Based on 2014 United States Census Bureau data. 5
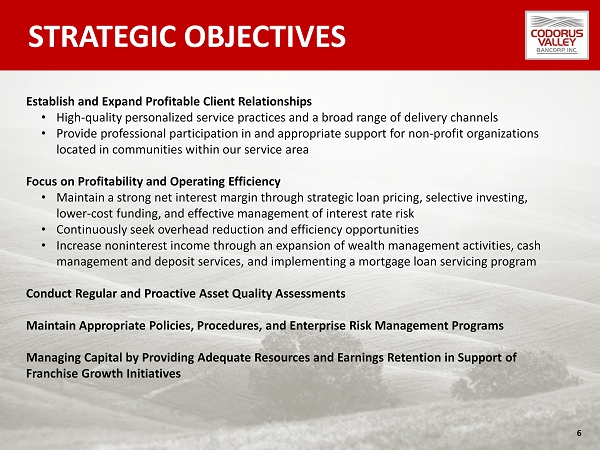
STRATEGIC OBJECTIVES Establish and Expand Profitable Client Relationships • High - quality personalized service practices and a broad range of delivery channels • Provide professional participation in and appropriate support for non - profit organizations located in communities within our service area Focus on Profitability and Operating Efficiency • Maintain a strong net interest margin through strategic loan pricing, selective investing, lower - cost funding, and effective management of interest rate risk • Continuously seek overhead reduction and efficiency opportunities • Increase noninterest income through an expansion of wealth management activities, cash management and deposit services, and implementing a mortgage loan servicing program Conduct Regular and Proactive Asset Quality Assessments Maintain Appropriate Policies, Procedures, and Enterprise Risk Management Programs Managing Capital by Providing Adequate Resources and Earnings Retention in Support of Franchise Growth Initiatives 6
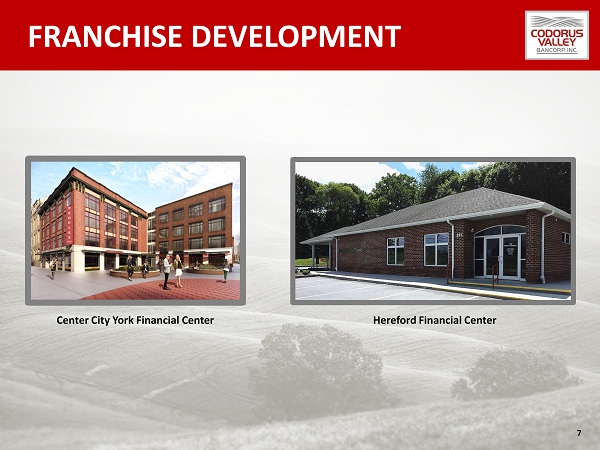
FRANCHISE DEVELOPMENT 7 Center City York Financial Center Hereford Financial Center
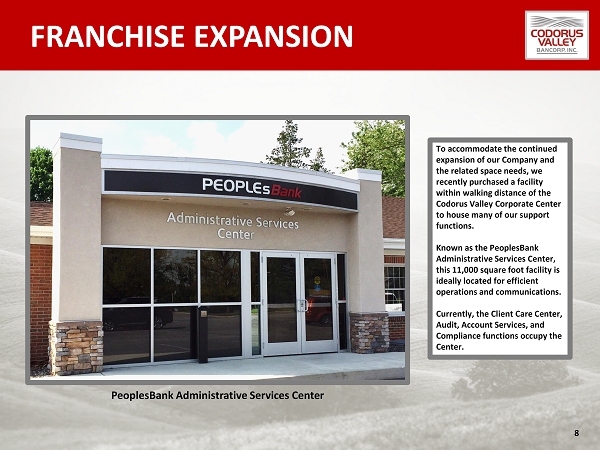
FRANCHISE EXPANSION 8 To accommodate the continued expansion of our Company and the related space needs, we recently purchased a facility within walking distance of the Codorus Valley Corporate Center to house many of our support functions. Known as the PeoplesBank Administrative Services Center, this 11,000 square foot facility is ideally located for efficient operations and communications. Currently, the Client Care Center, Audit, Account Services, and Compliance functions occupy the Center. PeoplesBank Administrative Services Center
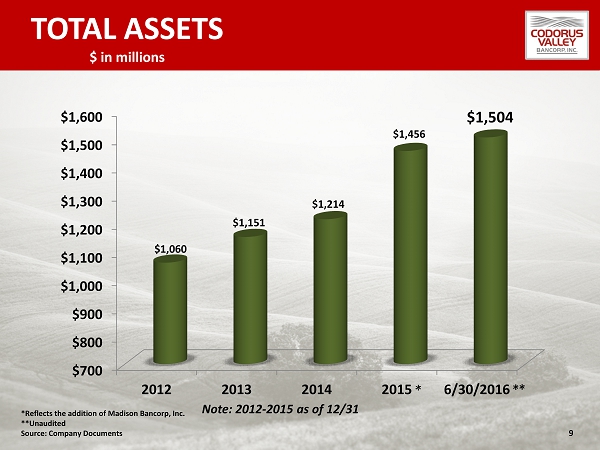
TOTAL ASSETS $ in millions $700 $800 $900 $1,000 $1,100 $1,200 $1,300 $1,400 $1,500 $1,600 2012 2013 2014 2015 6/30/2016 $1,060 $1,151 $1,214 $1,456 $1,504 Note: 2012 - 2015 as of 12/31 9 *Reflects the addition of Madison Bancorp, Inc. **Unaudited Source: Company Documents
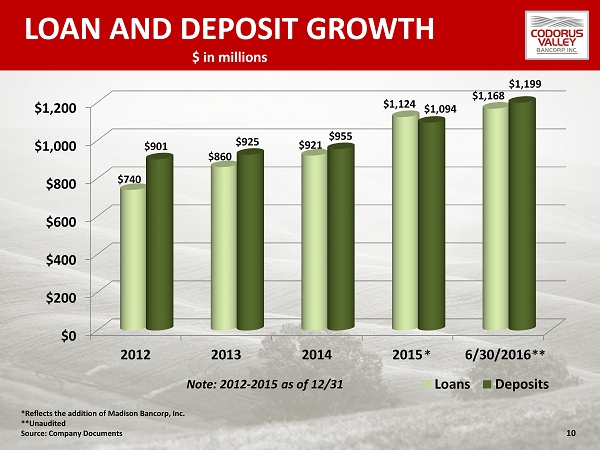
LOAN AND DEPOSIT GROWTH $ in millions 10 $0 $200 $400 $600 $800 $1,000 $1,200 2012 2013 2014 2015 6/30/2016 $740 $860 $921 $1,124 $1,168 $901 $925 $955 $1,094 $1,199 Loans Deposits Note: 2012 - 2015 as of 12/31 *Reflects the addition of Madison Bancorp, Inc. **Unaudited Source: Company Documents
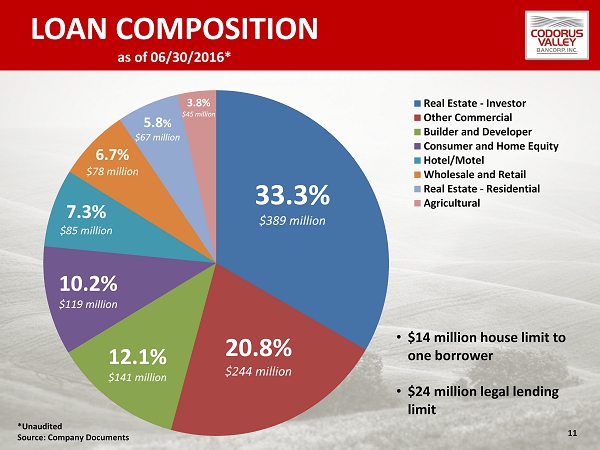
LOAN COMPOSITION as of 06/30/2016* Real Estate - Investor Other Commercial Builder and Developer Consumer and Home Equity Hotel/Motel Wholesale and Retail Real Estate - Residential Agricultural 33.3% $389 million 20.8% $244 million 12.1% $141 million 5.8 % $67 million 10.2% $119 million 3.8% $45 million • $14 million house limit to one borrower • $24 million legal lending limit 11 7.3% $85 million 6.7% $78 million *Unaudited Source: Company Documents
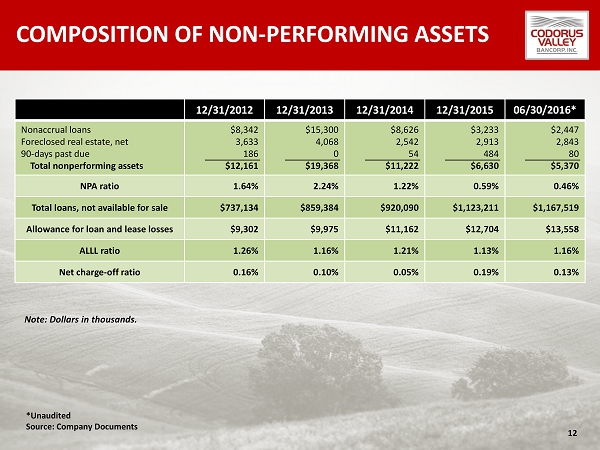
COMPOSITION OF NON - PERFORMING ASSETS 12/31/2012 12/31/2013 12/31/2014 12/31/2015 06/30/2016* Nonaccrual loans Foreclosed real estate, net 90 - days past due Total nonperforming assets $8,342 3,633 186 $12,161 $15,300 4,068 0 $19,368 $8,626 2,542 54 $11,222 $3,233 2,913 484 $6,630 $2,447 2,843 80 $5,370 NPA ratio 1.64% 2.24% 1.22% 0.59% 0.46% Total loans, not available for sale $737,134 $859,384 $920,090 $1,123,211 $1,167,519 Allowance for loan and lease losses $9,302 $9,975 $11,162 $12,704 $13,558 ALLL ratio 1.26% 1.16% 1.21% 1.13% 1.16% Net charge - off ratio 0.16% 0.10% 0.05% 0.19% 0.13% Note: Dollars in thousands. 12 *Unaudited Source: Company Documents
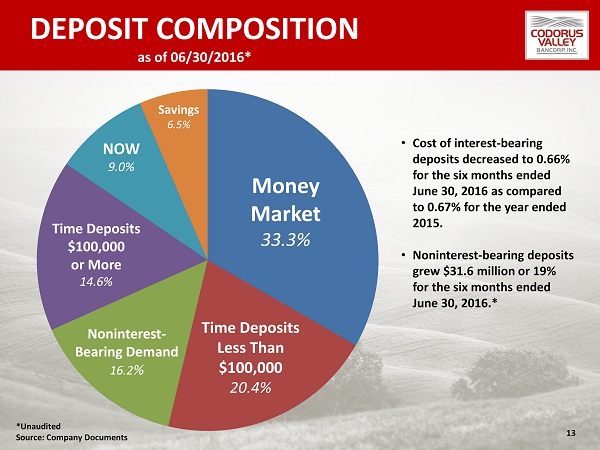
DEPOSIT COMPOSITION as of 06/30/2016* Money Market 33.3% Time Deposits Less Than $100,000 20.4% Noninterest - Bearing Demand 16.2 % NOW 9.0% Savings 6.5% • Cost of interest - bearing deposits decreased to 0.66% for the six months ended June 30, 2016 as compared to 0.67% for the year ended 2015. • Noninterest - bearing deposits grew $31.6 million or 19% for the six months ended June 30, 2016.* 13 Time Deposits $100,000 or More 14.6% *Unaudited Source: Company Documents
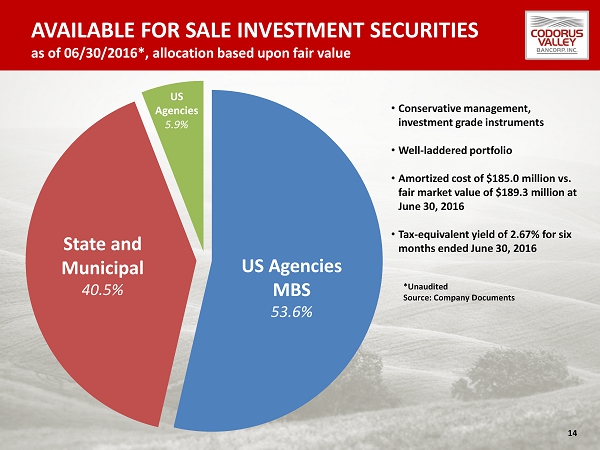
AVAILABLE FOR SALE INVESTMENT SECURITIES as of 06/30/2016*, allocation based upon fair value US Agencies MBS 53.6% State and Municipal 40.5% US Agencies 5.9% • Conservative management, investment grade instruments • Well - laddered portfolio • Amortized cost of $185.0 million vs. fair market value of $189.3 million at June 30, 2016 • Tax - equivalent yield of 2.67% for six months ended June 30, 2016 14 *Unaudited Source: Company Documents
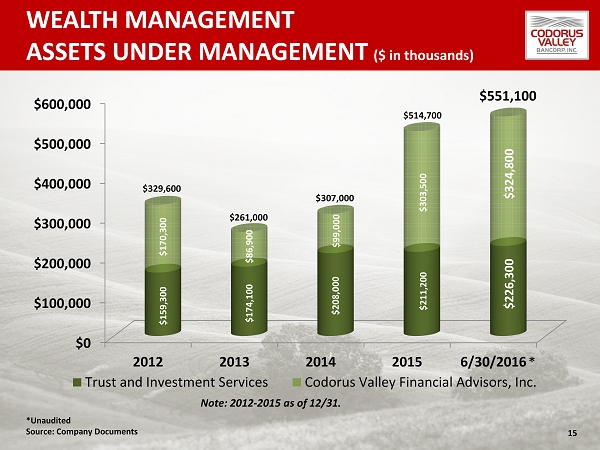
WEALTH MANAGEMENT ASSETS UNDER MANAGEMENT ($ in thousands) $0 $100,000 $200,000 $300,000 $400,000 $500,000 $600,000 2012 2013 2014 2015 6/30/2016 Trust and Investment Services Codorus Valley Financial Advisors, Inc. $329,600 $261,000 $307,000 $551,100 $170,300 $86,900 $99,000 $324,800 $159,300 $174,100 $208,000 $226,300 Note: 2012 - 2015 as of 12/31. 15 $303,500 $211,200 $514,700 *Unaudited Source: Company Documents
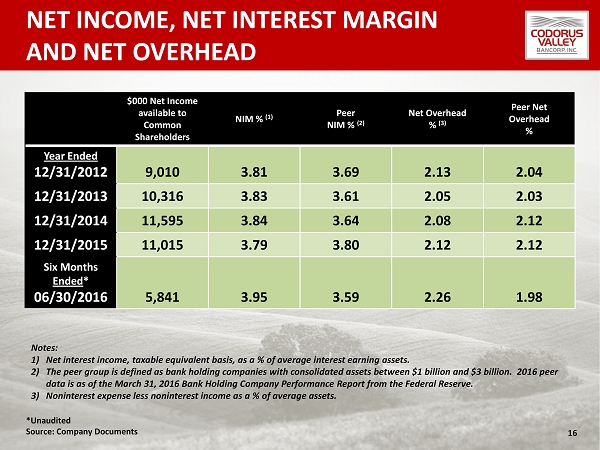
NET INCOME, NET INTEREST MARGIN AND NET OVERHEAD $000 Net I ncome available to Common Shareholders NIM % (1) Peer NIM % (2) Net Overhead % (3) Peer Net Overhead % Year Ended 12/31/2012 9,010 3.81 3.69 2.13 2.04 12/31/2013 10,316 3.83 3.61 2.05 2.03 12/31/2014 11,595 3.84 3.64 2.08 2.12 12/31/2015 11,015 3.79 3.80 2.12 2.12 Six Months Ended * 06/30/2016 5,841 3.95 3.59 2.26 1.98 Notes: 1) Net interest income, taxable equivalent basis, as a % of average interest earning assets. 2) The peer group is defined as bank holding companies with consolidated assets between $1 billion and $3 billion. 2016 peer data is as of the March 31, 2016 Bank Holding Company Performance Report from the Federal Reserve. 3) Noninterest expense less noninterest income as a % of average assets. 16 *Unaudited Source: Company Documents
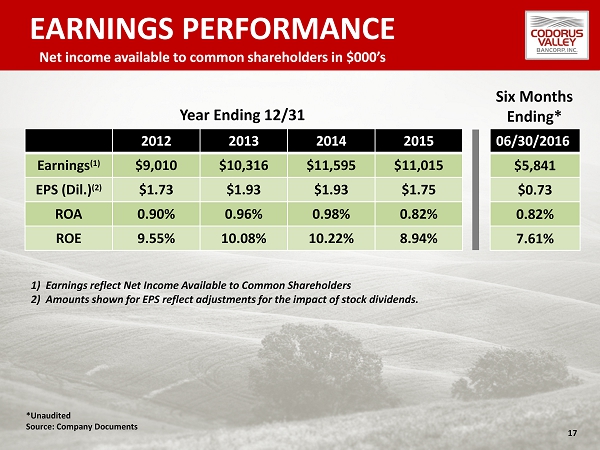
EARNINGS PERFORMANCE Net income available to common shareholders in $000’s 2012 2013 2014 2015 Earnings (1) $9,010 $10,316 $11,595 $11,015 EPS (Dil.) (2) $1.73 $1.93 $1.93 $1.75 ROA 0.90% 0.96% 0.98% 0.82% ROE 9.55% 10.08% 10.22% 8.94% 1) Earnings reflect Net Income Available to Common Shareholders 2) Amounts shown for EPS reflect adjustments for the impact of stock dividends. 06/30/2016 $5,841 $0.73 0.82% 7.61% Year Ending 12/31 Six Months Ending* 17 *Unaudited Source: Company Documents
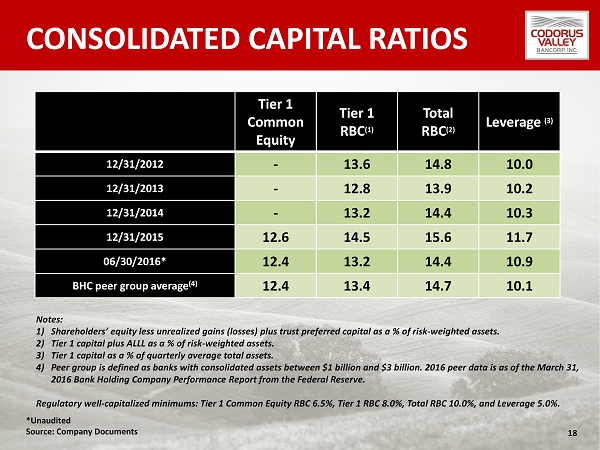
CONSOLIDATED CAPITAL RATIOS Notes: 1) Shareholders’ equity less unrealized gains (losses) plus trust preferred capital as a % of risk - weighted assets. 2) Tier 1 capital plus ALLL as a % of risk - weighted assets. 3) Tier 1 capital as a % of quarterly average total assets. 4) Peer group is defined as banks with consolidated assets between $1 billion and $3 billion. 2016 peer data is as of the March 31, 2016 Bank Holding Company Performance Report from the Federal Reserve. Regulatory well - capitalized minimums: Tier 1 Common Equity RBC 6.5%, Tier 1 RBC 8.0%, Total RBC 10.0%, and Leverage 5.0%. 18 Tier 1 Common Equity Tier 1 RBC (1) Total RBC (2) Leverage (3) 12/31/2012 - 13.6 14.8 10.0 12/31/2013 - 12.8 13.9 10.2 12/31/2014 - 13.2 14.4 10.3 12/31/2015 12.6 14.5 15.6 11.7 06/30/2016* 12.4 13.2 14.4 10.9 BHC peer group average (4) 12.4 13.4 14.7 10.1 *Unaudited Source: Company Documents
INVESTMENT CONSIDERATIONS 19 • Strong and consistent core profitability • 150+ year market presence with a continued commitment to community banking • Commercially focused bank with growing fee income platforms • Loan portfolio generating a solid net interest margin while maintaining a NPA ratio below 1.00% • Experienced management team • Strategic geographic market positioning with compelling opportunities going forward • Demonstrated organic growth and proven ability to execute acquisitions • Clear understanding of risks, opportunities and challenges

APPENDIX
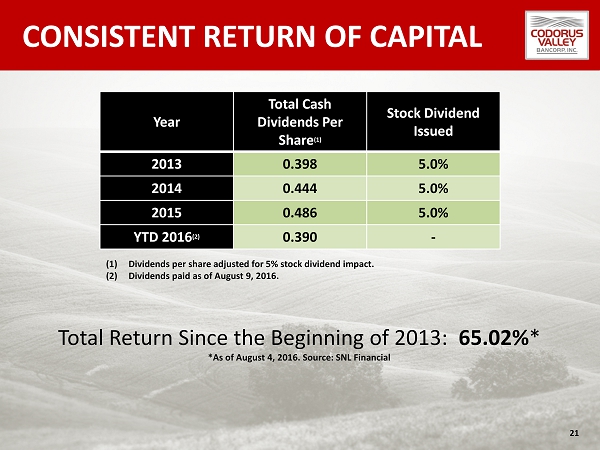
CONSISTENT RETURN OF CAPITAL 21 Year Total Cash Dividends Per Share (1) Stock Dividend Issued 2013 0.398 5.0% 2014 0.444 5.0% 2015 0.486 5.0% YTD 2016 (2) 0.390 - Total Return Since the Beginning of 2013: 65.02% * *As of August 4, 2016. Source: SNL Financial (1) Dividends per share adjusted for 5% stock dividend impact. (2) Dividends paid as of August 9, 2016.
EXPERIENCED MANAGEMENT 22 Larry J. Miller Chairman, President and CEO A resident of York County, PA since 1972, Mr. Miller has served as a Director, President and Chief Executive Officer of the Company since 1986 and of the Bank from 1981 to 2016. He was named Chairman of both entities in 2015. Mr. Miller attended York College of Pennsylvania, is a graduate from The Pennsylvania School of Banking at Bucknell University, and has served as Chairman of the Board of Directors of the United Way of York County, the York County Economic Development Corporation, YorkCounts, Cultural Alliance of York County, Wellspan Health System, and in leadership capacities for various other non - profit organizations. A. Dwight Utz Executive Vice President and Chief Operating Officer Mr. Utz joined the Company and the Bank in September 2015 as Executive Vice President and Chief Operating Officer. He was named President and Chief Executive Officer of the Bank in 2016. Most recently, Mr. Utz served as Director, President, and Chief Executive Officer of the former East Carolina Bank. He has served in various leadership capacities with PNC Bank, Mid - South Bank, and the former Cumberland County National Bank (CCNB). Mr. Utz is a graduate of the Central Pennsylvania College and the Stonier Graduate School of Banking at the University of Delaware. He currently serves on the Boards of Directors of Central Penn College and SpiriTrust Foundation and as a member of the Large Community Bank Council of the Independent Community Bankers of America (ICBA). He resides in York County, PA.
EXPERIENCED MANAGEMENT 23 Benjamin F. Riggs, Jr., Esq. General Counsel and Secretary Mr. Riggs joined the Company as General Counsel and Secretary in 2014 with an extensive background in financial services, having served the former Sovereign Bank, Waypoint Bank, and York Federal Savings and Loan Association in various legal capacities. He is a graduate of Dickinson College and the University of Richmond School of Law. Mr. Riggs is admitted to practice law in both the State of Maryland and the Commonwealth of Pennsylvania. He resides in Lancaster County, PA. Diane E. Baker, CPA Vice President Ms. Baker joined the Bank in 1994 and currently oversees the Risk Management functions of the Bank as Senior Vice President, Chief Risk Officer. Ms. Baker also currently serves as Interim Chief Financial Officer of the Bank and Interim Treasurer of the Company. She is a graduate of Franklin & Marshall College and the Stonier Graduate School of Banking. Ms. Baker is active in many community organizations and currently serves as Treasurer of the York County Heritage Trust, President of York City Dollars for Scholars, Inc., and Treasurer of Glenview Alliance Church. She is a resident of York County, PA.

105 Leader Heights Road, York, Pennsylvania 17403 www.peoplesbanknet.com