Exhibit 99.1
NASDAQ: CVLY Investor Presentation As of June 30, 2019 Larry J. Miller Chairman, President and Chief Executive Officer lmiller@peoplesbanknet.com 717 - 747 - 1500 Larry D. Pickett, CPA Treasurer lpickett@peoplesbanknet.com 717 - 747 - 1502 Craig L. Kauffman Executive Vice President and Chief Operating Officer ckauffman@peoplesbanknet.com 717 - 747 - 1501
SAFE HARBOR NOTICE REGARDING FORWARD - LOOKING STATEMENTS 2 This presentation contains forward - looking statements about Codorus Valley Bancorp, Inc . that are intended to be covered by the safe harbor for forward - looking statements provided by the Private Securities Litigation Reform Act of 1995 . Forward - looking statements are not historical facts . These statements can be identified by the use of forward - looking terminology such as “believe,” “expect,” “may,” “will,” “should,” “project,” “plan,” “seek,” “intend,” “anticipate” or similar terminology . Such forward - looking statements include, but are not limited to, discussions of strategy, financial projections and estimates and their underlying assumptions ; statements regarding plans, objectives, goals, expectations or consequences ; and statements about future performance, operations, products and services of Codorus Valley Bancorp, Inc . and its subsidiaries . Codorus Valley Bancorp, Inc . cautions readers not to place undue reliance on forward - looking statements and to consider possible events or factors that could cause results or performance to materially differ from those expressed in the forward - looking statements, including, but not limited to : ineffectiveness of the corporation’s business strategy due to changes in current or future market conditions ; the effects of competition, and of changes in laws and regulations on competition, including industry consolidation and development of competing financial products and services ; inability to achieve merger - related synergies ; interest rate movements ; difficulties in integrating distinct business operations, including information technology difficulties ; challenges in establishing and maintaining operations in new markets ; volatilities in the securities markets ; and deteriorating economic conditions . Additional factors that may affect forward - looking statements made in this presentation can be found in Codorus Valley Bancorp, Inc . ’s Quarterly Reports on Forms 10 - Q and its Annual Report on Form 10 - K, as filed with the Securities and Exchange Commission and available on the corporation’s website at www . peoplesbanknet . com and on the Securities and Exchange Commission’s website at www . sec . gov . We include web addresses here as inactive textual references only . Information on these websites is not part of this presentation . Forward - looking statements in this presentation speak only as of the date of this presentation and Codorus Valley Bancorp, Inc . makes no commitment to revise or update such statements to reflect changes that occur after the date the forward - looking statement was made .
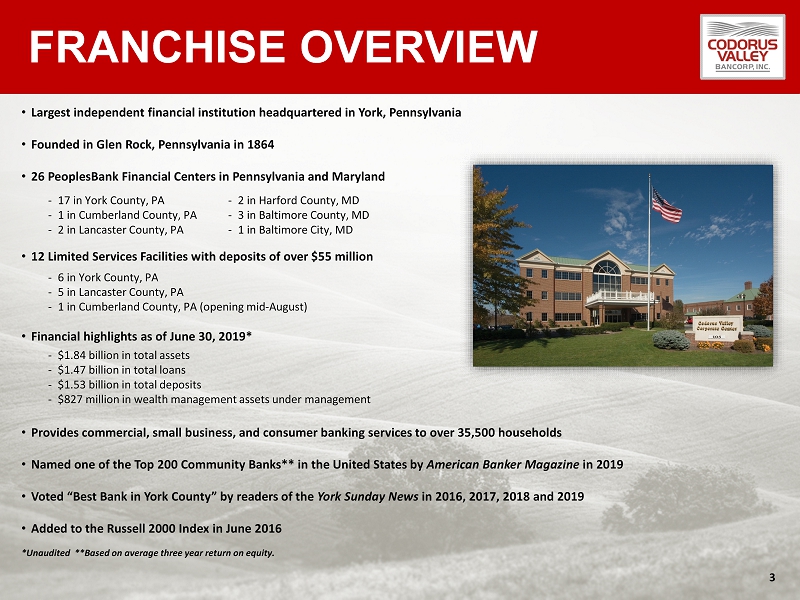
FRANCHISE OVERVIEW • Largest independent financial institution headquartered in York, Pennsylvania • Founded in Glen Rock, Pennsylvania in 1864 • 26 PeoplesBank Financial Centers in Pennsylvania and Maryland • 12 Limited Services Facilities with deposits of over $55 million • Financial highlights as of June 30, 2019* • Provides commercial, small business, and consumer banking services to over 35,500 households • Named one of the Top 200 Community Banks** in the United States by American Banker Magazine in 2019 • Voted “Best Bank in York County” by readers of the York Sunday News in 2016, 2017, 2018 and 2019 • Added to the Russell 2000 Index in June 2016 *Unaudited **Based on average three year return on equity. - 17 in York County, PA - 1 in Cumberland County, PA - 2 in Lancaster County, PA - 2 in Harford County, MD - 3 in Baltimore County, MD - 1 in Baltimore City, MD 3 - $1.84 billion in total assets - $1.47 billion in total loans - $1.53 billion in total deposits - $827 million in wealth management assets under management - 6 in York County, PA - 5 in Lancaster County, PA - 1 in Cumberland County, PA (opening mid - August)
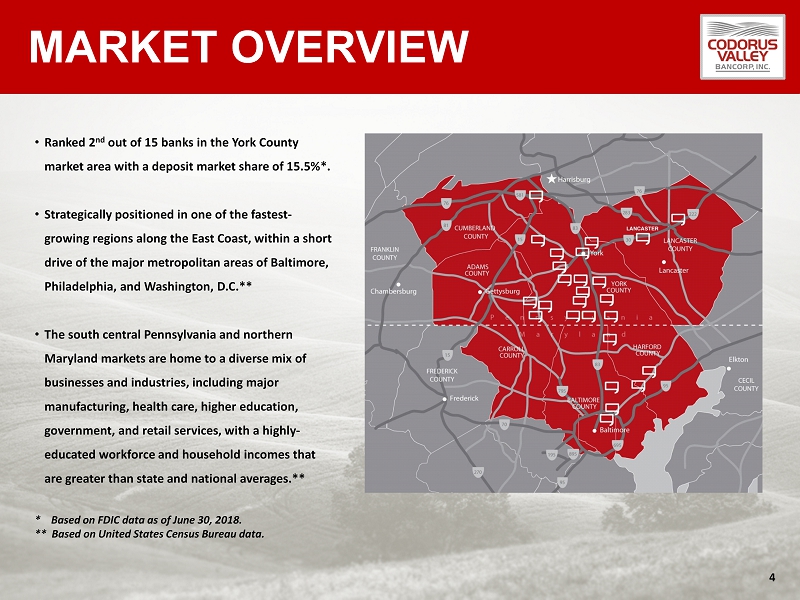
MARKET OVERVIEW • Ranked 2 nd out of 15 banks in the York County market area with a deposit market share of 15.5%*. • Strategically positioned in one of the fastest - growing regions along the East Coast, within a short drive of the major metropolitan areas of Baltimore, Philadelphia, and Washington, D.C.** • The south central Pennsylvania and northern Maryland markets are home to a diverse mix of businesses and industries, including major manufacturing, health care, higher education, government, and retail services, with a highly - educated workforce and household incomes that are greater than state and national averages.** * Based on FDIC data as of June 30, 2018. ** Based on United States Census Bureau data. 4
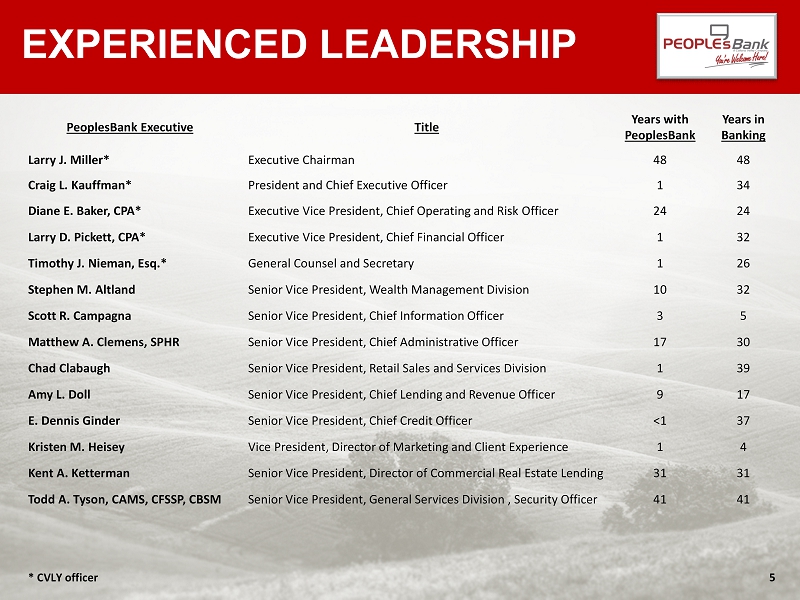
EXPERIENCED LEADERSHIP PeoplesBank Executive Title Years with PeoplesBank Years in Banking Larry J. Miller* Executive Chairman 48 48 Craig L. Kauffman* President and Chief Executive Officer 1 34 Diane E. Baker, CPA* Executive Vice President, Chief Operating and Risk Officer 24 24 Larry D. Pickett, CPA* Executive Vice President, Chief Financial Officer 1 32 Timothy J. Nieman, Esq.* General Counsel and Secretary 1 26 Stephen M. Altland Senior Vice President, Wealth Management Division 10 32 Scott R. Campagna Senior Vice President, Chief Information Officer 3 5 Matthew A. Clemens, SPHR Senior Vice President, Chief Administrative Officer 17 30 Chad Clabaugh Senior Vice President, Retail Sales and Services Division 1 39 Amy L. Doll Senior Vice President, Chief Lending and Revenue Officer 9 17 E. Dennis Ginder Senior Vice President, Chief Credit Officer <1 37 Kristen M. Heisey Vice President, Director of Marketing and Client Experience 1 4 Kent A. Ketterman Senior Vice President, Director of Commercial Real Estate Lending 31 31 Todd A. Tyson, CAMS, CFSSP, CBSM Senior Vice President, General Services Division , Security Officer 41 41 5 * CVLY officer
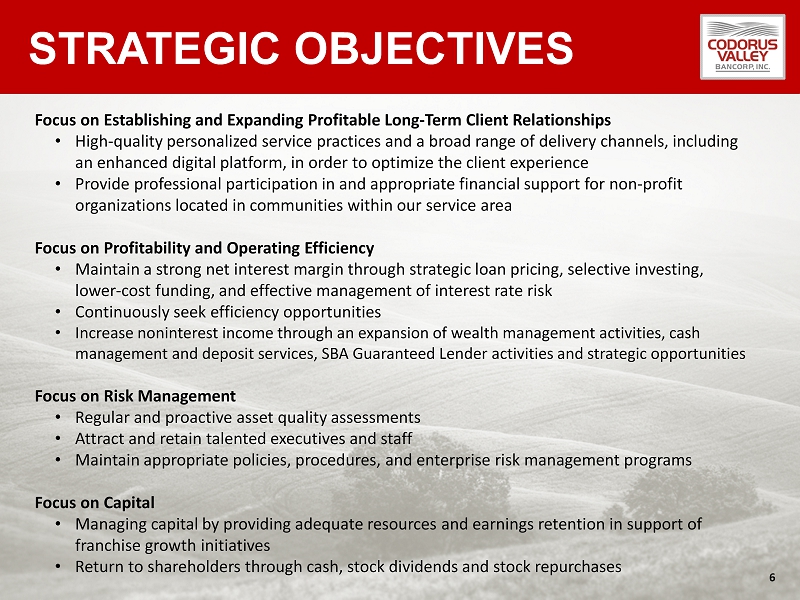
STRATEGIC OBJECTIVES Focus on Establishing and Expanding Profitable Long - Term Client Relationships • High - quality personalized service practices and a broad range of delivery channels, including an enhanced digital platform, in order to optimize the client experience • Provide professional participation in and appropriate financial support for non - profit organizations located in communities within our service area Focus on Profitability and Operating Efficiency • Maintain a strong net interest margin through strategic loan pricing, selective investing, lower - cost funding, and effective management of interest rate risk • Continuously seek efficiency opportunities • Increase noninterest income through an expansion of wealth management activities, cash management and deposit services, SBA Guaranteed Lender activities and strategic opportunities Focus on Risk Management • Regular and proactive asset quality assessments • Attract and retain talented executives and staff • Maintain appropriate policies, procedures, and enterprise risk management programs Focus on Capital • M anaging capital by providing adequate resources and earnings retention in support of franchise growth initiatives • Return to shareholders through cash, stock dividends and stock repurchases 6
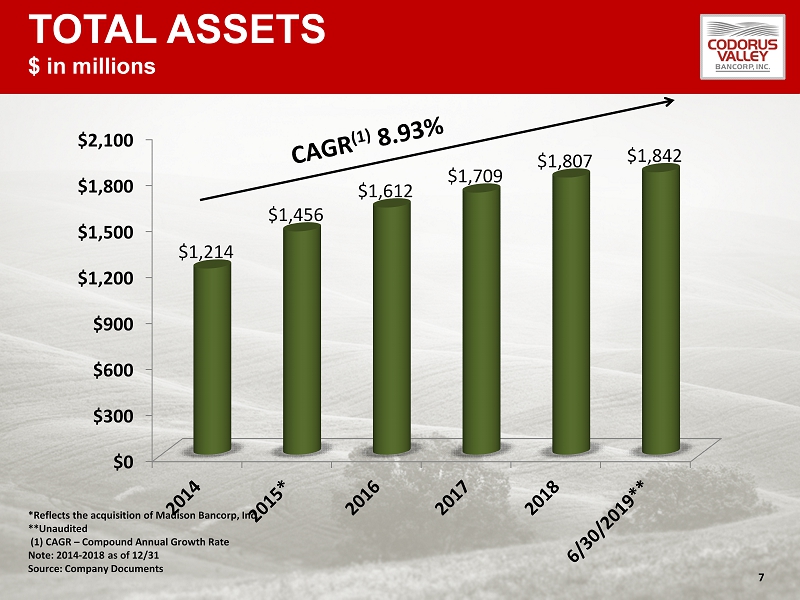
TOTAL ASSETS $ in millions $0 $300 $600 $900 $1,200 $1,500 $1,800 $2,100 $1,214 $1,456 $1,612 $1,709 $1,807 $1,842 7 *Reflects the acquisition of Madison Bancorp, Inc. **Unaudited (1) CAGR – Compound Annual Growth Rate Note: 2014 - 2018 as of 12/31 Source: Company Documents
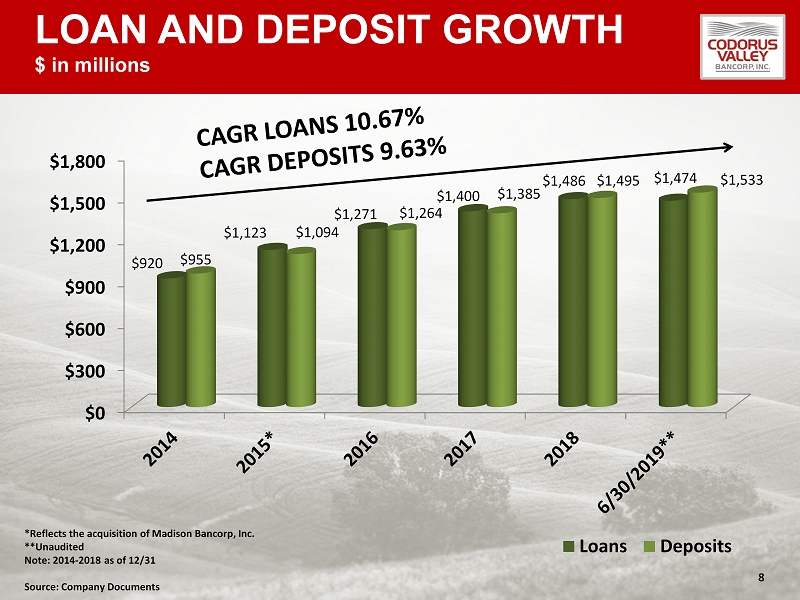
LOAN AND DEPOSIT GROWTH $ in millions 8 $0 $300 $600 $900 $1,200 $1,500 $1,800 $920 $1,123 $1,271 $1,400 $1,486 $1,474 $955 $1,094 $1,264 $1,385 $1,495 $1,533 Loans Deposits *Reflects the acquisition of Madison Bancorp, Inc. **Unaudited Note: 2014 - 2018 as of 12/31 Source: Company Documents
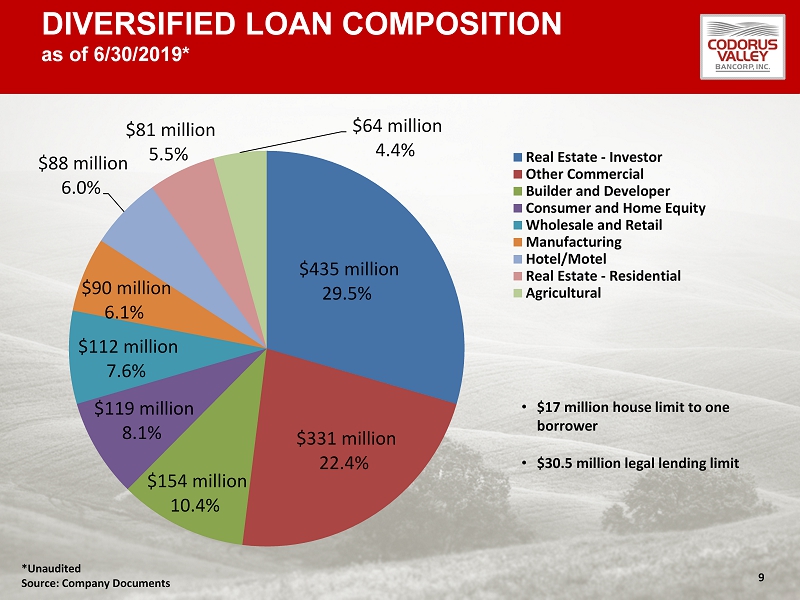
DIVERSIFIED LOAN COMPOSITION as of 6/30/2019* $ 435 million 29.5 % $ 331 million 22.4% $ 154 million 10.4 % $ 119 million 8.1 % $ 112 million 7.6 % $ 90 million 6.1 % $ 88 million 6.0 % $ 81 million 5.5 % $ 64 million 4.4% Real Estate - Investor Other Commercial Builder and Developer Consumer and Home Equity Wholesale and Retail Manufacturing Hotel/Motel Real Estate - Residential Agricultural • $17 million house limit to one borrower • $30.5 million legal lending limit 9 *Unaudited Source: Company Documents
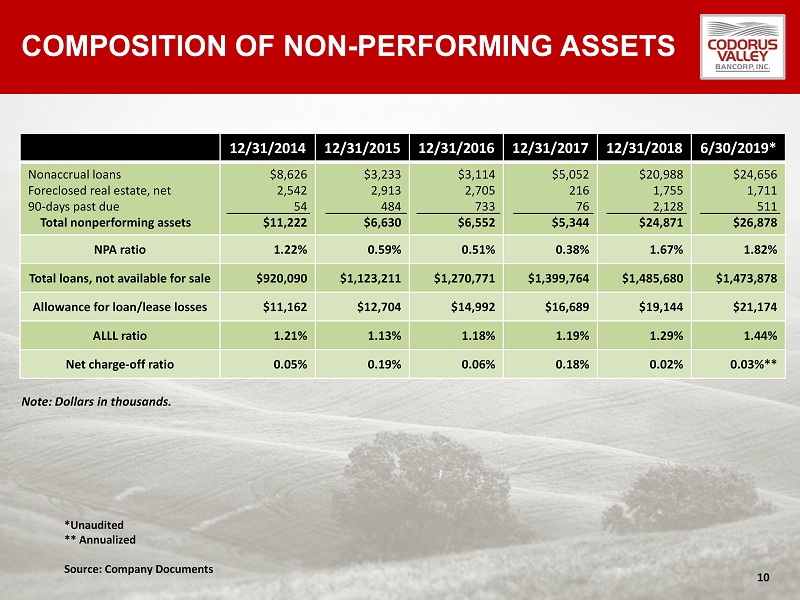
COMPOSITION OF NON - PERFORMING ASSETS 12/31/2014 12/31/2015 12/31/2016 12/31/2017 12/31/2018 6/30/2019* Nonaccrual loans Foreclosed real estate, net 90 - days past due Total nonperforming assets $8,626 2,542 54 $11,222 $3,233 2,913 484 $6,630 $3,114 2,705 733 $6,552 $5,052 216 76 $5,344 $20,988 1,755 2,128 $24,871 $24,656 1,711 511 $26,878 NPA ratio 1.22% 0.59% 0.51% 0.38% 1.67% 1.82% Total loans, not available for sale $920,090 $1,123,211 $1,270,771 $1,399,764 $1,485,680 $1,473,878 Allowance for loan/lease losses $11,162 $12,704 $14,992 $16,689 $19,144 $21,174 ALLL ratio 1.21% 1.13% 1.18% 1.19% 1.29% 1.44% Net charge - off ratio 0.05% 0.19% 0.06% 0.18% 0.02% 0.03%** Note: Dollars in thousands. 10 *Unaudited ** Annualized Source: Company Documents
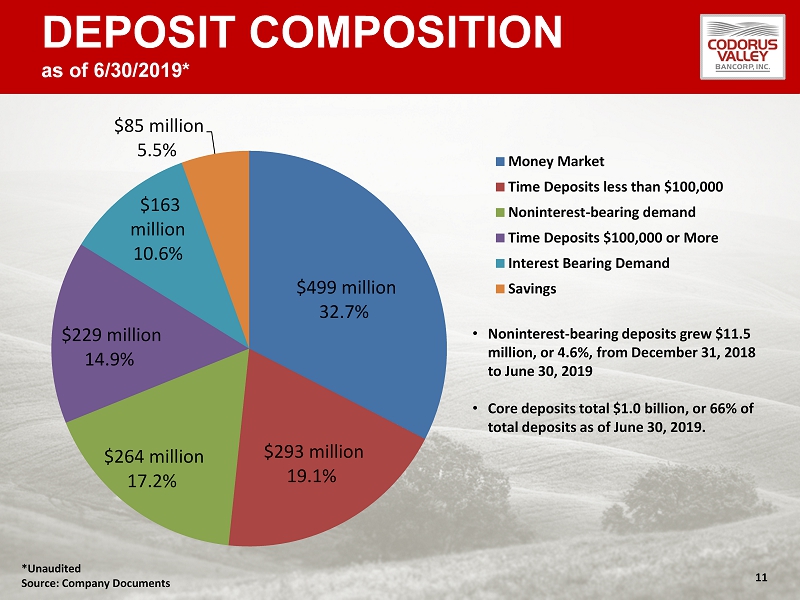
DEPOSIT COMPOSITION as of 6/30/2019* $ 499 million 32.7% $ 293 million 19.1 % $ 264 million 17.2 % $ 229 million 14.9 % $ 163 million 10.6 % $ 85 million 5.5 % Money Market Time Deposits less than $100,000 Noninterest-bearing demand Time Deposits $100,000 or More Interest Bearing Demand Savings • Noninterest - bearing deposits grew $11.5 million, or 4.6%, from December 31, 2018 to June 30, 2019 • Core deposits total $1.0 billion, or 66% of total deposits as of June 30, 2019. 11 *Unaudited Source: Company Documents
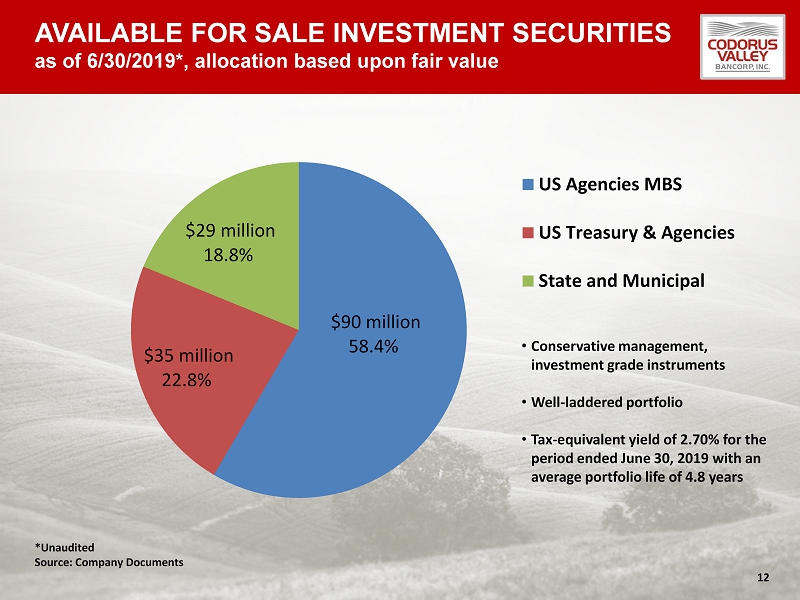
AVAILABLE FOR SALE INVESTMENT SECURITIES as of 6/30/2019*, allocation based upon fair value $ 90 million 58.4 % $ 35 million 22.8% $ 29 million 18.8 % US Agencies MBS US Treasury & Agencies State and Municipal • Conservative management, investment grade instruments • Well - laddered portfolio • Tax - equivalent yield of 2.70% for the period ended June 30, 2019 with an average portfolio life of 4.8 years 12 *Unaudited Source: Company Documents
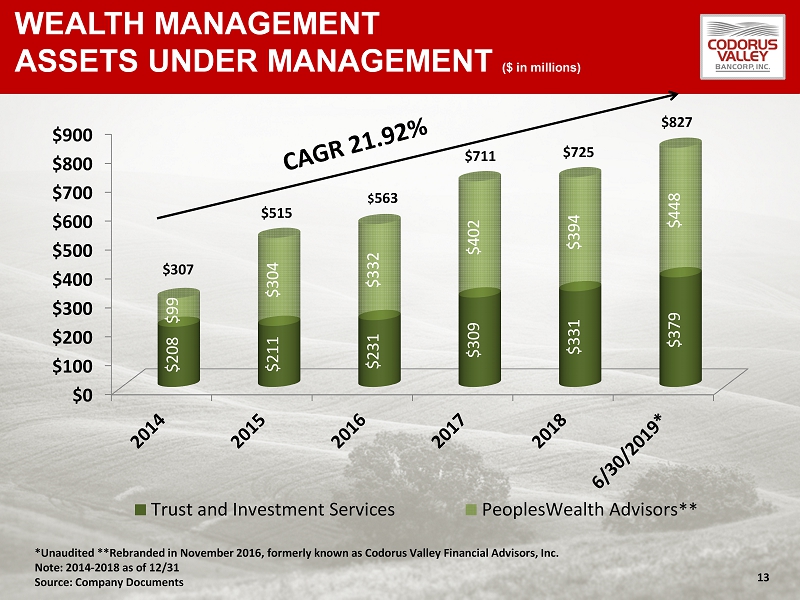
WEALTH MANAGEMENT ASSETS UNDER MANAGEMENT ($ in millions) $0 $100 $200 $300 $400 $500 $600 $700 $800 $900 $208 $211 $231 $309 $331 $379 $99 $304 $332 $402 $394 $448 Trust and Investment Services PeoplesWealth Advisors $725 $515 $711 13 $ 563 *Unaudited **Rebranded in November 2016, formerly known as Codorus Valley Financial Advisors, Inc. Note: 2014 - 2018 as of 12/31 Source: Company Documents ** $827 $307
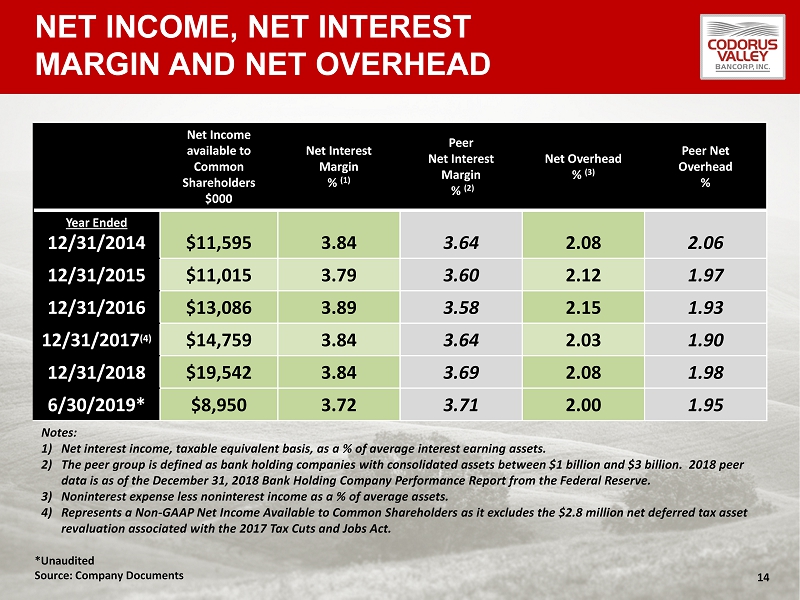
NET INCOME, NET INTEREST MARGIN AND NET OVERHEAD Net I ncome available to Common Shareholders $000 Net Interest Margin % (1) Peer Net Interest Margin % (2) Net Overhead % (3) Peer Net Overhead % Year Ended 12/31/2014 $11,595 3.84 3.64 2.08 2.06 12/31/2015 $11,015 3.79 3.60 2.12 1.97 12/31/2016 $13,086 3.89 3.58 2.15 1.93 12/31/2017 (4) $14,759 3.84 3.64 2.03 1.90 12/31/2018 $19,542 3.84 3.69 2.08 1.98 6/30/2019* $8,950 3.72 3.71 2.00 1.95 Notes: 1) Net interest income, taxable equivalent basis, as a % of average interest earning assets. 2) The peer group is defined as bank holding companies with consolidated assets between $1 billion and $3 billion. 2018 peer data is as of the December 31, 2018 Bank Holding Company Performance Report from the Federal Reserve. 3) Noninterest expense less noninterest income as a % of average assets. 4) Represents a Non - GAAP Net Income Available to Common Shareholders as it excludes the $2.8 million net deferred tax asset revaluation associated with the 2017 Tax Cuts and Jobs Act. 14 *Unaudited Source: Company Documents
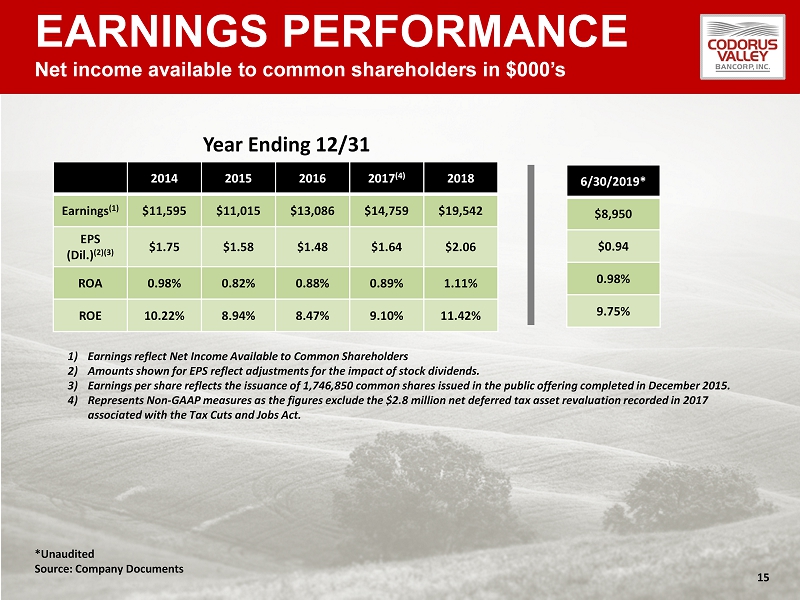
EARNINGS PERFORMANCE Net income available to common shareholders in $000’s 1) Earnings reflect Net Income Available to Common Shareholders 2) A mounts shown for EPS reflect adjustments for the impact of stock dividends. 3) Earnings per share reflects the issuance of 1,746,850 common shares issued in the public offering completed in December 2015. 4) Represents Non - GAAP measures as the figures exclude the $2.8 million net deferred tax asset revaluation recorded in 2017 associated with the Tax Cuts and Jobs Act. Year Ending 12/31 15 *Unaudited Source: Company Documents 2014 2015 2016 2017 (4) 2018 Earnings (1) $11,595 $11,015 $13,086 $14,759 $19,542 EPS (Dil.) (2)(3) $1.75 $1.58 $1.48 $1.64 $2.06 ROA 0.98% 0.82% 0.88% 0.89% 1.11% ROE 10.22% 8.94% 8.47% 9.10% 11.42% 6/30/2019* $8,950 $0.94 0.98% 9.75%
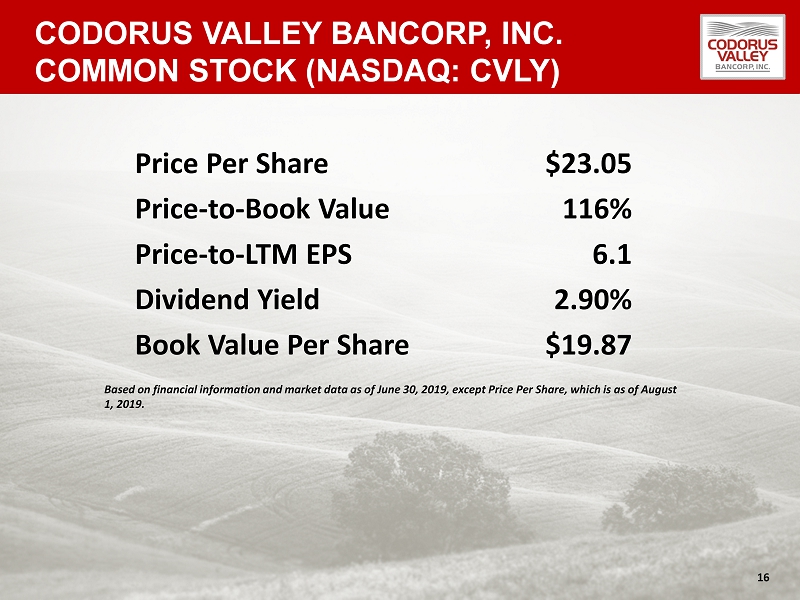
CODORUS VALLEY BANCORP, INC. COMMON STOCK (NASDAQ: CVLY) Based on financial information and market data as of June 30, 2019, except Price Per Share, which is as of August 1, 2019. 16 Price Per Share $23.05 Price - to - Book Value 116% Price - to - LTM EPS 6.1 Dividend Yield 2.90% Book Value Per Share $19.87
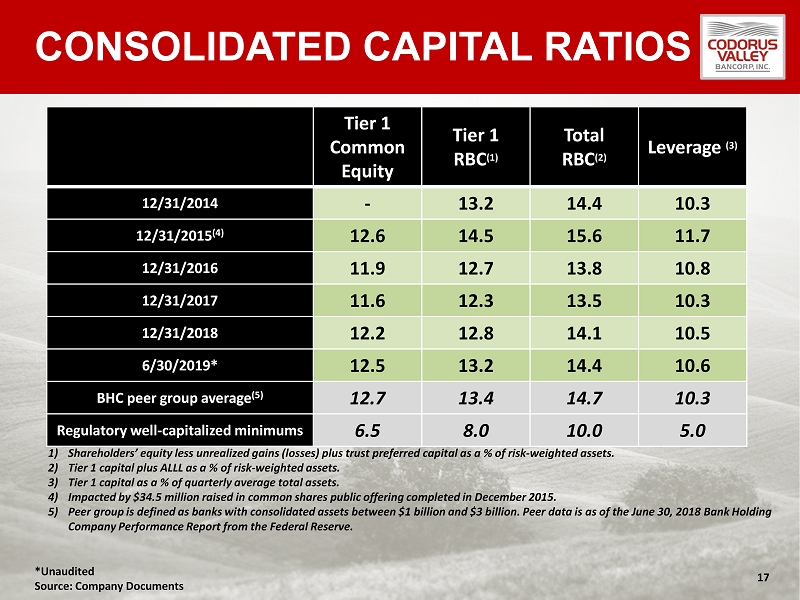
CONSOLIDATED CAPITAL RATIOS Notes: 1) Shareholders’ equity less unrealized gains (losses) plus trust preferred capital as a % of risk - weighted assets. 2) Tier 1 capital plus ALLL as a % of risk - weighted assets. 3) Tier 1 capital as a % of quarterly average total assets. 4) Impacted by $34.5 million raised in common shares public offering completed in December 2015. 5) Peer group is defined as banks with consolidated assets between $1 billion and $3 billion. Peer data is as of the June 30, 20 18 Bank Holding Company Performance Report from the Federal Reserve. 17 Tier 1 Common Equity Tier 1 RBC (1) Total RBC (2) Leverage (3) 12/31/2014 - 13.2 14.4 10.3 12/31/2015 (4) 12.6 14.5 15.6 11.7 12/31/2016 11.9 12.7 13.8 10.8 12/31/2017 11.6 12.3 13.5 10.3 12/31/2018 12.2 12.8 14.1 10.5 6/30/2019* 12.5 13.2 14.4 10.6 BHC peer group average (5) 12.7 13.4 14.7 10.3 Regulatory well - capitalized minimums 6.5 8.0 10.0 5.0 *Unaudited Source: Company Documents
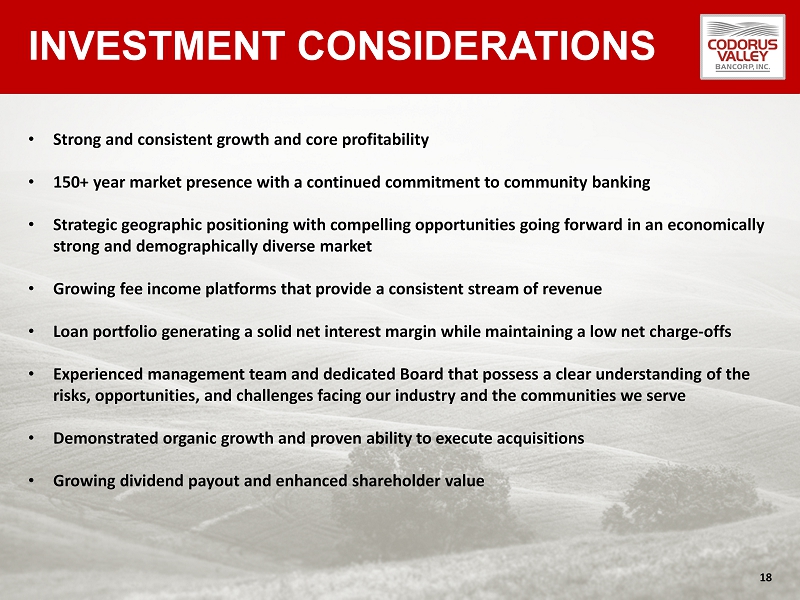
INVESTMENT CONSIDERATIONS 18 • Strong and consistent growth and core profitability • 150+ year market presence with a continued commitment to community banking • Strategic geographic positioning with compelling opportunities going forward in an economically strong and demographically diverse market • Growing fee income platforms that provide a consistent stream of revenue • Loan portfolio generating a solid net interest margin while maintaining a low net charge - offs • Experienced management team and dedicated Board that possess a clear understanding of the risks, opportunities, and challenges facing our industry and the communities we serve • Demonstrated organic growth and proven ability to execute acquisitions • Growing dividend payout and enhanced shareholder value

APPENDIX
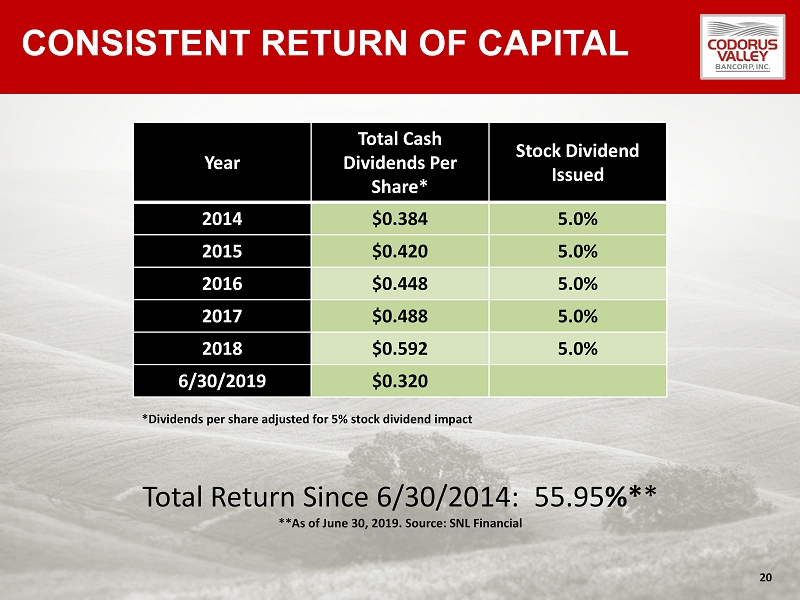
CONSISTENT RETURN OF CAPITAL 20 Year Total Cash Dividends Per Share* Stock Dividend Issued 2014 $0.384 5.0% 2015 $0.420 5.0% 2016 $0.448 5.0% 2017 $0.488 5.0% 2018 $0.592 5.0% 6/30/2019 $0.320 Total Return Since 6/30/2014: 55.95 %* * **As of June 30, 2019. Source: SNL Financial *Dividends per share adjusted for 5% stock dividend impact
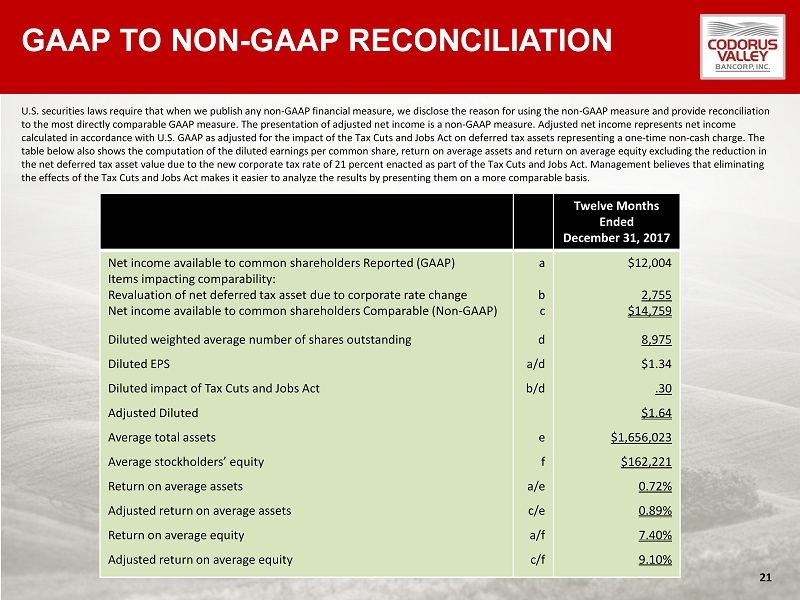
GAAP TO NON - GAAP RECONCILIATION 21 U.S. securities laws require that when we publish any non - GAAP financial measure, we disclose the reason for using the non - GAAP measure and provide reconciliation to the most directly comparable GAAP measure. The presentation of adjusted net income is a non - GAAP measure. Adjusted net income represents net income calculated in accordance with U.S. GAAP as adjusted for the impact of the Tax Cuts and Jobs Act on deferred tax assets repres ent ing a one - time non - cash charge. The table below also shows the computation of the diluted earnings per common share, return on average assets and return on avera ge equity excluding the reduction in the net deferred tax asset value due to the new corporate tax rate of 21 percent enacted as part of the Tax Cuts and Jobs Act . M anagement believes that eliminating the effects of the Tax Cuts and Jobs Act makes it easier to analyze the results by presenting them on a more comparable basis . Twelve Months Ended December 31, 2017 Net income available to common shareholders Reported (GAAP) Items impacting comparability: Revaluation of net deferred tax asset due to corporate rate change Net income available to common shareholders Comparable (Non - GAAP) Diluted weighted average number of shares outstanding Diluted EPS Diluted impact of Tax Cuts and Jobs Act Adjusted Diluted Average total assets Average stockholders’ equity Return on average assets Adjusted return on average assets Return on average equity Adjusted return on average equity a b c d a/d b/d e f a/e c/e a/f c/f $12,004 2,755 $14,759 8,975 $1.34 .30 $1.64 $1,656,023 $162,221 0.72% 0.89% 7.40% 9.10%
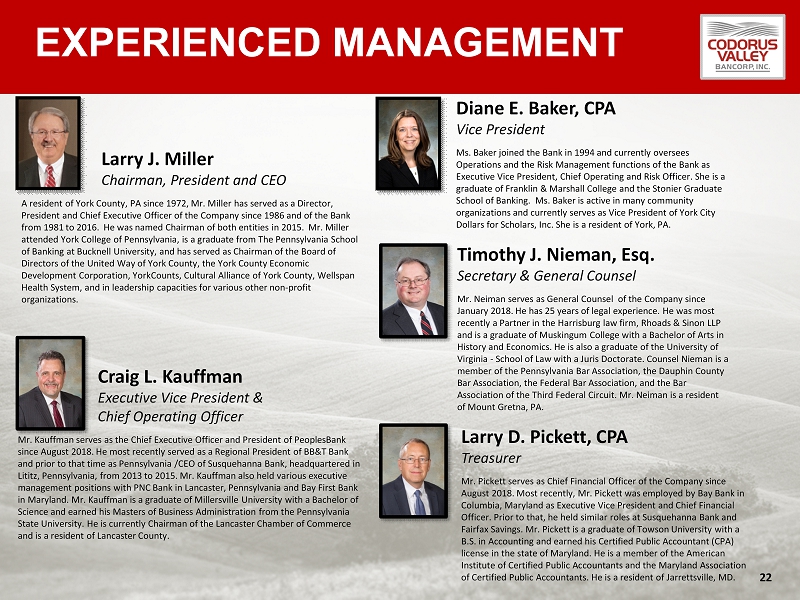
EXPERIENCED MANAGEMENT 22 Larry J. Miller Chairman, President and CEO A resident of York County, PA since 1972, Mr. Miller has served as a Director, President and Chief Executive Officer of the Company since 1986 and of the Bank from 1981 to 2016. He was named Chairman of both entities in 2015. Mr. Miller attended York College of Pennsylvania, is a graduate from The Pennsylvania School of Banking at Bucknell University, and has served as Chairman of the Board of Directors of the United Way of York County, the York County Economic Development Corporation, YorkCounts , Cultural Alliance of York County, Wellspan Health System, and in leadership capacities for various other non - profit organizations. Craig L. Kauffman Executive Vice President & Chief Operating Officer Mr. Kauffman serves as the Chief Executive Officer and President of PeoplesBank since August 2018. He most recently served as a Regional President of BB&T Bank and prior to that time as Pennsylvania /CEO of Susquehanna Bank, headquartered in Lititz, Pennsylvania, from 2013 to 2015. Mr. Kauffman also held various executive management positions with PNC Bank in Lancaster, Pennsylvania and Bay First Bank in Maryland. Mr. Kauffman is a graduate of Millersville University with a Bachelor of Science and earned his Masters of Business Administration from the Pennsylvania State University. He is currently Chairman of the Lancaster Chamber of Commerce and is a resident of Lancaster County. Timothy J. Nieman, Esq. Secretary & General Counsel Mr. Neiman serves as General Counsel of the Company since January 2018. He has 25 years of legal experience. He was most recently a Partner in the Harrisburg law firm, Rhoads & Sinon LLP and is a graduate of Muskingum College with a Bachelor of Arts in History and Economics. He is also a graduate of the University of Virginia - School of Law with a Juris Doctorate. Counsel Nieman is a member of the Pennsylvania Bar Association, the Dauphin County Bar Association, the Federal Bar Association, and the Bar Association of the Third Federal Circuit. Mr. Neiman is a resident of Mount Gretna, PA. Diane E. Baker, CPA Vice President Ms. Baker joined the Bank in 1994 and currently oversees Operations and the Risk Management functions of the Bank as Executive Vice President, Chief Operating and Risk Officer. She is a graduate of Franklin & Marshall College and the Stonier Graduate School of Banking. Ms. Baker is active in many community organizations and currently serves as Vice President of York City Dollars for Scholars, Inc. She is a resident of York, PA. Larry D. Pickett, CPA Treasurer Mr. Pickett serves as Chief Financial Officer of the Company since August 2018. Most recently, Mr. Pickett was employed by Bay Bank in Columbia, Maryland as Executive Vice President and Chief Financial Officer. Prior to that, he held similar roles at Susquehanna Bank and Fairfax Savings. Mr. Pickett is a graduate of Towson University with a B.S. in Accounting and earned his Certified Public Accountant (CPA) license in the state of Maryland. He is a member of the American Institute of Certified Public Accountants and the Maryland Association of Certified Public Accountants. He is a resident of Jarrettsville, MD.

105 Leader Heights Road, York, Pennsylvania 17403 www.peoplesbanknet.com