Exhibit 99.1

4_02026021 Investor Presentation NASDAQ: CVLY As of March 31, 2021 Larry J. Miller Chairman, President and Chief Executive Officer lmiller@peoplesbanknet.com 717 - 747 - 1500 Craig L. Kauffman Executive Vice President and Chief Operating Officer ckauffman@peoplesbanknet.com 717 - 747 - 1501 Larry D. Pickett, CPA Treasurer lpickett@peoplesbanknet.com 717 - 747 - 1502
Safe Harbor Notice Regarding Forward Looking Statements This presentation contains forward - looking statements about Codorus Valley Bancorp, Inc . that are intended to be covered by the safe harbor for forward - looking statements provided by the Private Securities Litigation Reform Act of 1995 . Forward - looking statements are not historical facts . These statements can be identified by the use of forward - looking terminology such as “believe,” “expect,” “may,” “will,” “should,” “project,” “plan,” “seek,” “intend,” “anticipate” or similar terminology . Such forward - looking statements include, but are not limited to, discussions of strategy, financial projections and estimates and their underlying assumptions ; statements regarding plans, objectives, goals, expectations or consequences ; and statements about future performance, operations, products and services of Codorus Valley Bancorp, Inc . and its subsidiaries . Note that many factors, some of which are discussed elsewhere in this presentation could affect the future financial results of the Codorus Valley Bancorp, Inc . and its subsidiaries, both individually and collectively, and could cause those results to differ materially from those expressed in the forward - looking statements contained or incorporated by reference in this presentation . These factors include, but are not limited to, the following : • Operating, legal and regulatory risks ; • Credit risk, including an increase in nonperforming assets requiring loss provisions and the incurrence of carrying costs related to nonperforming assets ; • Interest rate fluctuations which could increase our cost of funds or decrease our yield on earning assets and therefore reduce our net interest income ; • Declines in the market value of investment securities considered to be other - than - temporary ; • Unavailability of capital when needed, or availability at less than favorable terms ; • Unauthorized disclosure of sensitive or confidential client or customer information, whether through a breach of our computer systems or otherwise, which may adversely affect the Codorus Valley Bancorp, Inc . 's operations, net income or reputation ; • Inability to achieve merger - related synergies, and difficulties in integrating the business and operations of acquired institutions ; • A prolonged economic downturn or excessive inflation ; • Political and competitive forces affecting banking, securities, asset management and credit services businesses ; • Occurrence of natural or man - made disasters or calamities, including health emergencies, the spread of infectious diseases, or pandemics ; • The effects of and changes in the rate of FDIC premiums, including special assessments ; • Future legislative or administrative changes to U . S . governmental capital programs ; • Future changes in federal or state tax laws or tax rates ; • Enacted financial reform legislation, e . g . , Dodd - Frank Wall Street Reform and Consumer Protection Act, may have a significant impact on Codorus Valley Bancorp, Inc . ’s business and results of operations ; and • The risk that management's analyses of these risks and forces could be incorrect and/or that the strategies developed to address them could be unsuccessful .

Safe Harbor Notice Regarding Forward Looking Statements (cont.) In addition to the foregoing, the effect of COVID - 19 and related events, including those described above and those not yet known or knowable, could have a negative effect on the Corporation's business prospects, financial condition and results of operations, as a result of quarantines ; market volatility ; market downturns ; changes in consumer behavior ; business closures ; deterioration in the credit quality of borrowers or the inability of borrowers to satisfy their obligations (and any related forbearances or restructurings that may be implemented) ; changes in the value of collateral securing outstanding loans ; changes in the value of the investment securities portfolio ; effects on key employees, including operational management personnel and those charged with preparing, monitoring and evaluating the Corporation's financial reporting and internal controls ; declines in the demand for loans and other banking services and products ; declines in demand resulting from adverse impacts of the disease on businesses deemed to be "non - essential" by governments ; and Financial Center or office closures and business interruptions . Additional factors that may affect forward - looking statements made in this presentation can be found in Codorus Valley Bancorp, Inc . ’s Quarterly Reports on Forms 10 - Q and its Annual Report on Form 10 - K, as filed with the Securities and Exchange Commission and available on the Corporation’s website at www . peoplesbanknet . com and on the Securities and Exchange Commission’s website at www . sec . gov . We include web addresses here as inactive textual references only . Information on these websites is not part of this presentation . Forward - looking statements in this presentation speak only as of the date of this presentation and Codorus Valley Bancorp, Inc . makes no commitment to revise or update such statements to reflect changes that occur after the date the forward - looking statement was made .
4_02026021 Executive Summary

About Codorus Valley Bancorp, Inc. Overview • Codorus Valley Bancorp, Inc. (“Codorus Valley”, “CVLY”, or the “Company”), is the bank holding company for PeoplesBank, A Codorus Valley Company (“PeoplesBank” or the “Bank”). Codorus Valley’s common stock is listed on the NASDAQ Global Market under the symbol CVLY and the Company is an SEC filer. • Founded in 1864 in Glen Rock, Pennsylvania, PeoplesBank is the largest independent bank headquartered in York, Pennsylvania. Codorus Valley was established in 1987 as the Bank’s holding company. • PeoplesBank offers a full range of banking, wealth management, and mortgage services to both small and mid sized businesses and consumers through a branch network of financial centers located in communities throughout south - central Pennsylvania and northern Maryland. • The Company is strategically positioned in one of the fastest - growing regions along the East Coast, located near Baltimore, Harrisburg, Philadelphia, and Washington, D.C 1 . • Codorus Valley seeks to focus on establishing long - term client relationships, adherence to prudent credit and risk management standards, and the development of non - interest income streams through complementary business lines. Financial Highlights (1Q21) 1) Based on United States Census Bureau data. Headquarters: York, PA Bank Founded: 1864 Total Assets: $ 2.3 billion Wealth Mgmt Assets Under Management: $758.3 million Gross Loans: $1.6 billion LTM Pre - Tax, Pre - Provision Income: $ 25.9 million Total Deposits: $2.0 billion YTD NIM 3.04% 5

Attractive Footprint, Market Share Source: S&P Global Market Intelligence. 1) Based on United States Census Bureau data. Market Notes • 26 PeoplesBank full - service financial center locations across Pennsylvania and Maryland, and 5 limited - service facilities in Pennsylvania. As measured by deposits, PeoplesBank holds the 2 nd market position in York, PA, with a 15.2% market share (out of 13 banks that report deposit data) for that market. • Located in growing regions of the East Coast, situated within a short drive to Harrisburg, Philadelphia, Baltimore, and Washington D.C. • The south - central Pennsylvania and northern Maryland markets are home to a diverse mix of businesses and industries, including major manufacturing, health - care, higher education, government, and retail services, with a highly - educated workforce and household income that is greater than state and national averages. 1 6 PeoplesBank Deposits by County: 6/30/2020 County State Total Deposits ($000s) York PA $ 1,373,744 Lancaster PA 78,488 Cumberland PA 17,511 Baltimore City MD 24,770 Baltimore MD 231,345 Harford MD 86,015
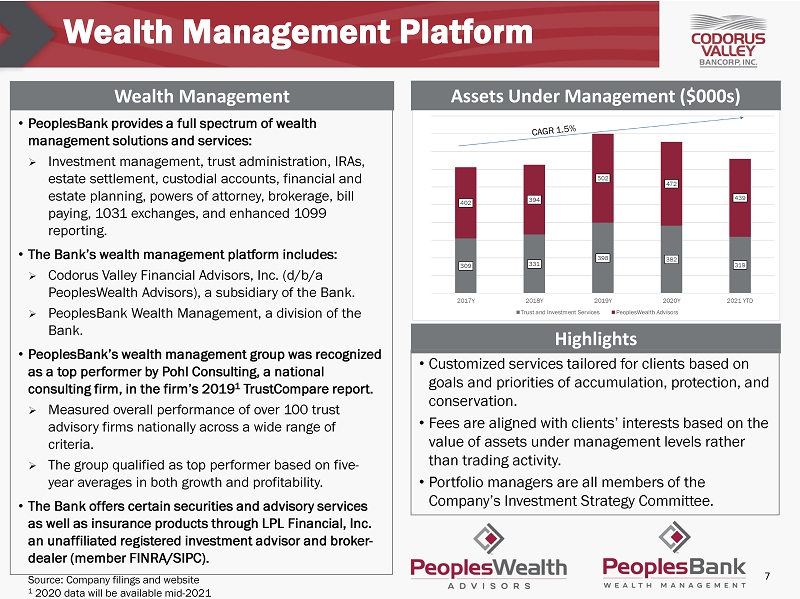
Wealth Management Platform Wealth Management Assets Under Management ($000s) Highlights Source: Company filings and website 1 2020 data will be available mid - 2021 7 • Customized services tailored for clients based on goals and priorities of accumulation, protection, and conservation. • Fees are aligned with clients’ interests based on the value of assets under management levels rather than trading activity. • Portfolio managers are all members of the Company’s Investment Strategy Committee. • PeoplesBank provides a full spectrum of wealth management solutions and services: » Investment management, trust administration, IRAs, estate settlement, custodial accounts, financial and estate planning, powers of attorney, brokerage, bill paying, 1031 exchanges, and enhanced 1099 reporting. • The Bank’s wealth management platform includes: » Codorus Valley Financial Advisors, Inc. (d/b/a PeoplesWealth Advisors), a subsidiary of the Bank. » PeoplesBank Wealth Management, a division of the Bank. • PeoplesBank’s wealth management group was recognized as a top performer by Pohl Consulting, a national consulting firm, in the firm’s 2019 1 TrustCompare report. » Measured overall performance of over 100 trust advisory firms nationally across a wide range of criteria. » The group qualified as top performer based on five - year averages in both growth and profitability. • The Bank offers certain securities and advisory services as well as insurance products through LPL Financial, Inc. an unaffiliated registered investment advisor and broker - dealer (member FINRA/SIPC).

Mortgage Business Mortgage Originations ($000s) Gain on Sale of HFS Loans ($000s) • The Bank has a growing mortgage business that is a meaningful contributor to non - interest income. » Approximately 24% of 2021 YTD non - interest income. » Attractive borrower interest rates combined with a strong home buying market positively impacted the Bank’s mortgage business year - to - date. » Recent additions to the Bank’s mortgage leadership team have contributed to favorable results . • Year - to - date 3/31/2021, the Bank originated and closed over 170 mortgages totaling approximately $41.0 million . » Approximately 52% self - sourced and 48% referrals. » Approximately 39% purchase or construction to permanent and 61% refinance. » Approximately 23% held for investment and 77% held for sale . • The Bank plans to continue investing in the growth of its mortgage operations, including expanding its network of loan officers within its financial centers, LPOs, and other locations. Source: S&P Global Market Intelligence, Company Filings. Mortgage Operations 8 $ 51,37
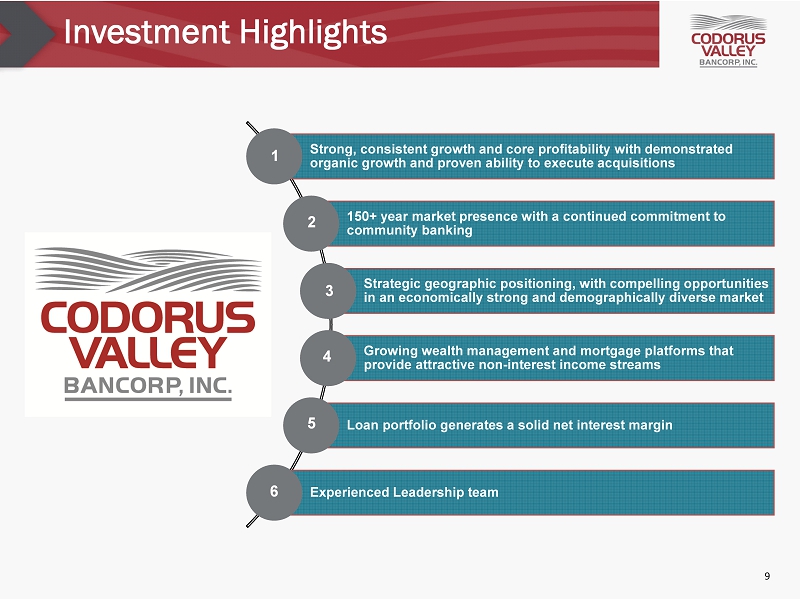
Investment Highlights Strong, consistent growth and core profitability with demonstrated organic growth and proven ability to execute acquisitions 150+ year market presence with a continued commitment to community banking Strategic geographic positioning, with compelling opportunities in an economically strong and demographically diverse market Growing wealth management and mortgage platforms that provide attractive non - interest income streams Loan portfolio generates a solid net interest margin Experienced Leadership team 1 5 4 2 3 6 9

Experienced Leadership Team Larry J . Miller Chairman, President, & CEO, and Director 50 50 • Mr . Miller has served as a Director, President and Chief Executive Officer of the Company since 1986 . • He previously served as Chief Executive Officer of the Bank from 1981 to 2016 . • He was named Chairman of both the Company and the Bank in 2015 . Craig L . Kauffman Executive Vice President, Chief Operating Officer, and Director 3 36 • Mr . Kauffman has served as Director, Chief Executive Officer and President of PeoplesBank since August 2018 and Director of the Company since September 2019 . • Served as Regional President of BB&T Bank, and prior to that held various executive positions with Susquehanna Bank, PNC Bank, and Sterling Financial Corporation . Diane E. Baker, CPA Vice President 26 26 • Ms . Baker currently serves as Executive Vice President, Chief Operations and Risk Officer of the Bank and Vice President, Assistant Treasurer and Assistant Secretary of the Company . • She previously served as Senior Vice President and Enterprise Risk Management Officer . Executive Years with PeoplesBank Biography Years in Banking Timothy J . Nieman, Esq . Secretary & General Counsel • Mr . Nieman has served as General Counsel of the Bank and Secretary of the Company since January 2018 . He has 28 years of legal experience . • He was most recently a Partner in the Harrisburg law firm, Rhoads & Sinon LLP . Larry D . Pickett, CPA Treasurer • Mr . Pickett has served as Chief Financial Officer of the Bank and Treasurer of the Company since August 2018 . • Most recently, he was employed by Bay Bank in Columbia, Maryland as Executive Vice President and Chief Financial Officer . Prior to that, he held similar roles at Susquehanna Bank and Fairfax Savings . 3 28 3 34 10

COVID - 19 Response Employees Facilities Customers and Credit • As of 3/31, PeoplesBank has processed over 1,900 PPP loans, with outstanding PPP loans totaling $ 152.2 million . • A significant majority of these loans supported small businesses, with the average outstanding loan balance below $150,000. • PeoplesBank offered several free PPP Forgiveness webinars in 3Q20, tailored specifically for PPP borrowers and to provide an overview of the PPP forgiveness process. • Due to the COVID - 19 pandemic, approximately 38% of the Company’s employees currently continue to work from home. • A phased approach and comprehensive plan to safely return employees who are still working remotely has been developed and will be implemented as the number of COVID - 19 cases decline, in coordination with vaccination levels. • A detailed protocol for safeguarding the safety of employees and clients has been followed, including notifying any clients who may have encountered an employee who has tested positive. • All financial centers are now operating with normal drive - thru hours and lobby hours. Additional lobby protocols, including the use of a lobby manager to screen and limit the number of clients within the lobby, continue. • All retirement community office lobbies also remain open by appointment only with several modifications to ensure the safety of clients and associates. Three loan production offices remain closed; however, staff are working remotely. 11

4_02026021 Financial Overview
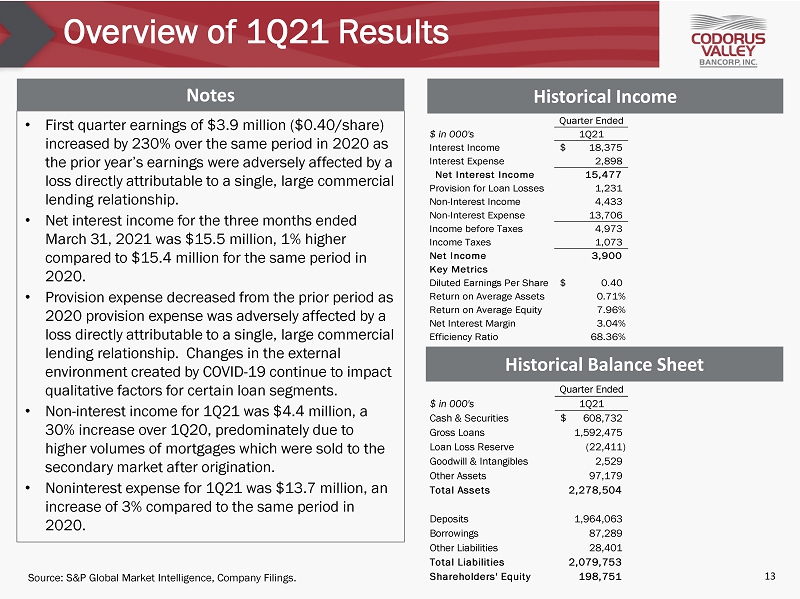
Overview of 1Q21 Results Notes • First quarter earnings of $3.9 million ($ 0.40/share ) increased by 230% over the same period in 2020 as the prior year’s earnings were adversely affected by a loss directly attributable to a single, large commercial lending relationship. • Net interest income for the three months ended March 31, 2021 was $15.5 million, 1% higher compared to $ 15.4 million for the same period in 2020. • Provision expense decreased from the prior period as 2020 provision expense was adversely affected by a loss directly attributable to a single, large commercial lending relationship. Changes in the external environment created by COVID - 19 continue to impact qualitative factors for certain loan segments. • Non - interest income for 1Q21 was $ 4.4 million, a 30% increase over 1Q20, predominately due to higher volumes of mortgages which were sold to the secondary market after origination. • Noninterest expense for 1Q21 was $13.7 million, an increase of 3% compared to the same period in 2020. Historical Income Historical Balance Sheet Source: S&P Global Market Intelligence, Company Filings. 13 $ in 000's 1Q21 Interest Income 18,375$ Interest Expense 2,898 Net Interest Income 15,477 Provision for Loan Losses 1,231 Non-Interest Income 4,433 Non-Interest Expense 13,706 Income before Taxes 4,973 Income Taxes 1,073 Net Income 3,900 Key Metrics Diluted Earnings Per Share 0.40$ Return on Average Assets 0.71% Return on Average Equity 7.96% Net Interest Margin 3.04% Efficiency Ratio 68.36% Quarter Ended $ in 000's 1Q21 Cash & Securities 608,732$ Gross Loans 1,592,475 Loan Loss Reserve (22,411) Goodwill & Intangibles 2,529 Other Assets 97,179 Total Assets 2,278,504 Deposits 1,964,063 Borrowings 87,289 Other Liabilities 28,401 Total Liabilities 2,079,753 Shareholders' Equity 198,751 Quarter Ended
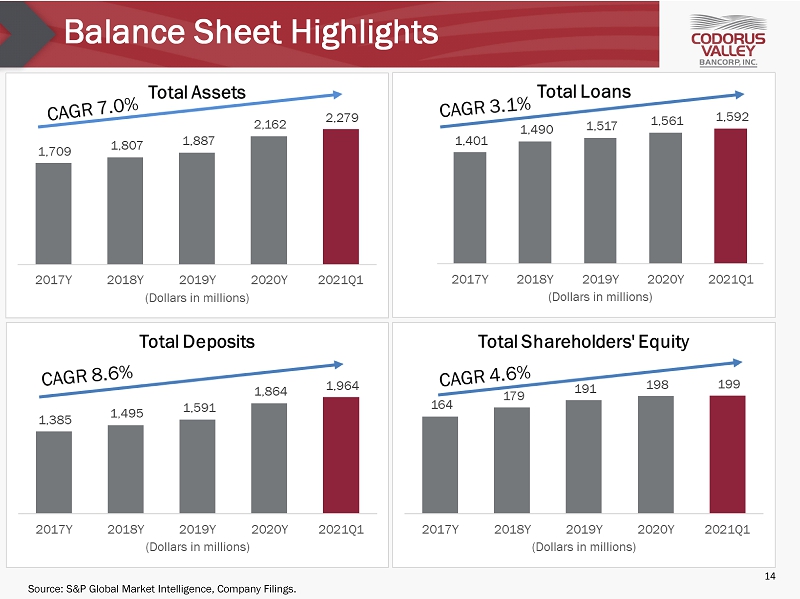
Balance Sheet Highlights Source: S&P Global Market Intelligence, Company Filings. 14
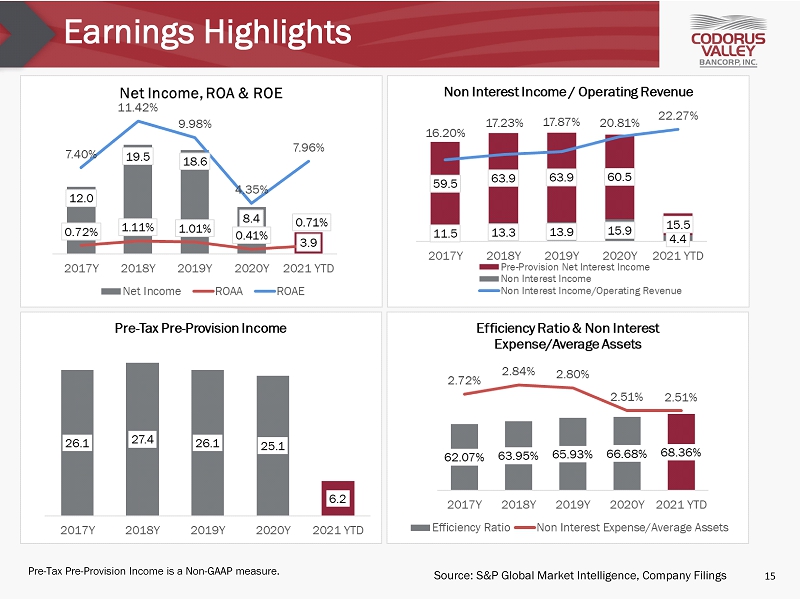
Earnings Highlights Pre - Tax Pre - Provision Income is a Non - GAAP measure. 15 Source: S&P Global Market Intelligence, Company Filings

Non - Interest Income • Diversified sources of non - interest income enhance earnings. • A growing wealth management platform generates a variety of trust and investment management fees. • The Bank’s mortgage business continues to expand and contribute to non - interest income. » Flexibility to retain or sell mortgages originated based on rate environment, market conditions, and liquidity / capital priorities. • Consistent deposit related fees on an attractive base of core deposits. Notes Source: S&P Global Market Intelligence, Company Filings. 16

Net Interest Margin Source: S&P Global Market Intelligence, Company Filings. • The low interest rate environment has led to a reduction in the Company’s net interest income and negatively impacted the Company’s net interest margin; however, there are some mitigating factors . • While loan yields have declined, so has the cost of the Company’s interest - bearing deposits . • The continued roll - off of comparatively higher rate CD’s should continue to reduce the Company’s cost of deposits . • In the coming months, the Company’s net interest margin should also be positively impacted by the accretion of capitalized, deferred PPP loan origination fees into interest income. Notes 17
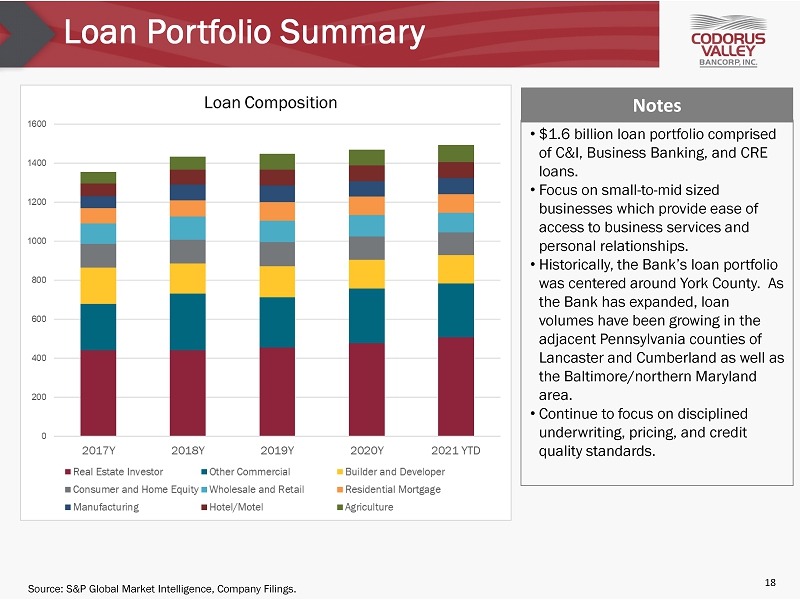
Loan Portfolio Summary • $1.6 billion loan portfolio comprised of C&I, Business Banking, and CRE loans. • Focus on small - to - mid sized businesses which provide ease of access to business services and personal relationships. • Historically, the Bank’s loan portfolio was centered around York County. As the Bank has expanded, loan volumes have been growing in the adjacent Pennsylvania counties of Lancaster and Cumberland as well as the Baltimore/northern Maryland area. • Continue to focus on disciplined underwriting, pricing, and credit quality standards . Notes Source: S&P Global Market Intelligence, Company Filings. 18
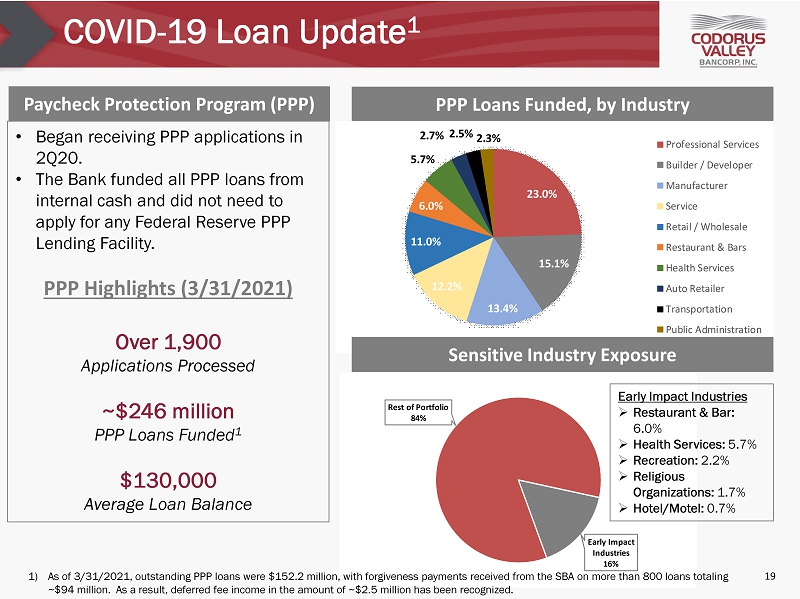
COVID - 19 Loan Update 1 • Began receiving PPP applications in 2Q20. • The Bank funded all PPP loans from internal cash and did not need to apply for any Federal Reserve PPP Lending Facility. PPP Highlights (3/31/2021) Over 1,900 Applications Processed ~$246 million PPP Loans Funded 1 $ 130,000 Average Loan Balance Paycheck Protection Program (PPP) PPP Loans Funded, by Industry 23.0% 15.1% 13.4% 12.2% 11.0% 6.0% 5.7% 2.7% 2.5% 2.3% Professional Services Builder / Developer Manufacturer Service Retail / Wholesale Restaurant & Bars Health Services Auto Retailer Transportation Public Administration Rest of Portfolio 84% Early Impact Industries 16% Early Impact Industries » Restaurant & Bar: 6.0% » Health Services: 5.7% » Recreation: 2.2% » Religious Organizations: 1.7% » Hotel/Motel: 0.7% 19 1) As of 3/31/2021, outstanding PPP loans were $152.2 million, with forgiveness payments received from the SBA on more than 800 loans totaling ~$94 million. As a result, deferred fee income in the amount of ~$2.5 million has been recognized . Sensitive Industry Exposure
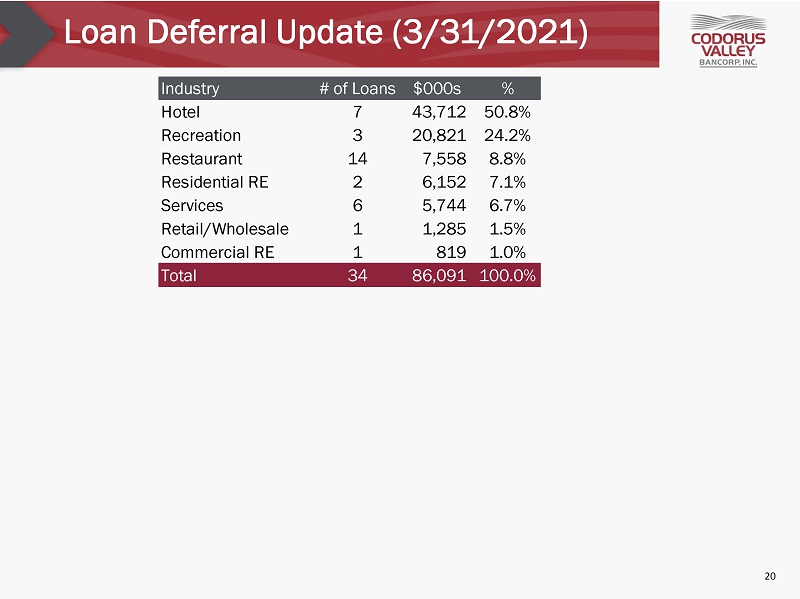
Loan Deferral Update (3/31/2021) 20 Industry # of Loans $000s % Hotel 7 43,712 50.8% Recreation 3 20,821 24.2% Restaurant 14 7,558 8.8% Residential RE 2 6,152 7.1% Services 6 5,744 6.7% Retail/Wholesale 1 1,285 1.5% Commercial RE 1 819 1.0% Total 34 86,091 100.0%
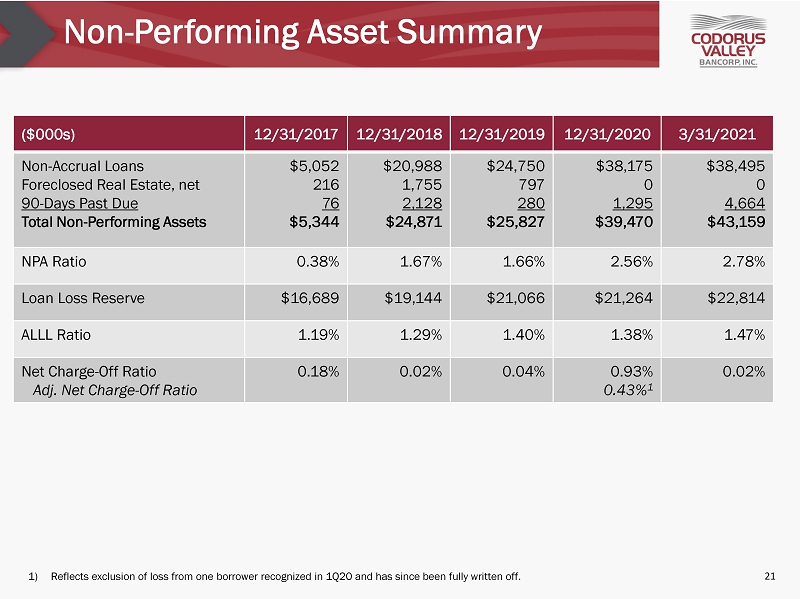
Non - Performing Asset Summary ($000s) 12/31/201 7 12/31/201 8 12/31/201 9 12/31/2020 3/31/2021 Non - Accrual Loans Foreclosed Real Estate, net 90 - Days Past Due Total Non - Performing Assets $5,052 216 76 $5,344 $20,988 1,755 2,128 $24,871 $ 24,750 797 280 $ 25,827 $38,175 0 1,295 $39,470 $38,495 0 4,664 $43,159 NPA Ratio 0.38% 1.67% 1.66% 2.56% 2.78% Loan Loss Reserve $ 16,689 $19,144 $21,066 $ 21,264 $ 22,814 ALLL Ratio 1.19% 1.29% 1.40% 1.38% 1.47% Net Charge - Off Ratio Adj. Net Charge - Off Ratio 0.18% 0.02% 0.04% 0.93% 0.43% 1 0.02% 1) Reflects exclusion of loss from one borrower recognized in 1Q20 and has since been fully written off. 21

Allowance for Loan Losses Source: S&P Global Market Intelligence and Company Filings. 22 • The Company’s allowance for loan losses was 1.47% of gross loans as of March 31, 2021. » Excluding $154.7 million in PPP loans, the allowance for loan losses totaled 1.63% of gross loans. • Reserve levels reflect the expectation of continued economic uncertainty. • The Company has conservatively classified commercial loans and has made proactive efforts to identify and mitigate any problem credits. Notes
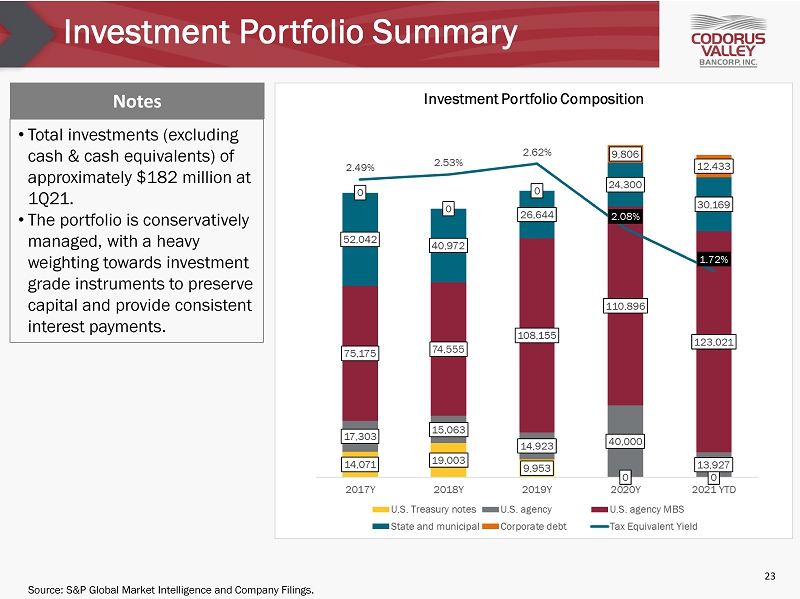
Investment Portfolio Summary Notes • Total investments (excluding cash & cash equivalents) of approximately $ 182 million at 1Q21. • The portfolio is conservatively managed, with a heavy weighting towards investment grade instruments to preserve capital and provide consistent interest payments . Source: S&P Global Market Intelligence and Company Filings. 23
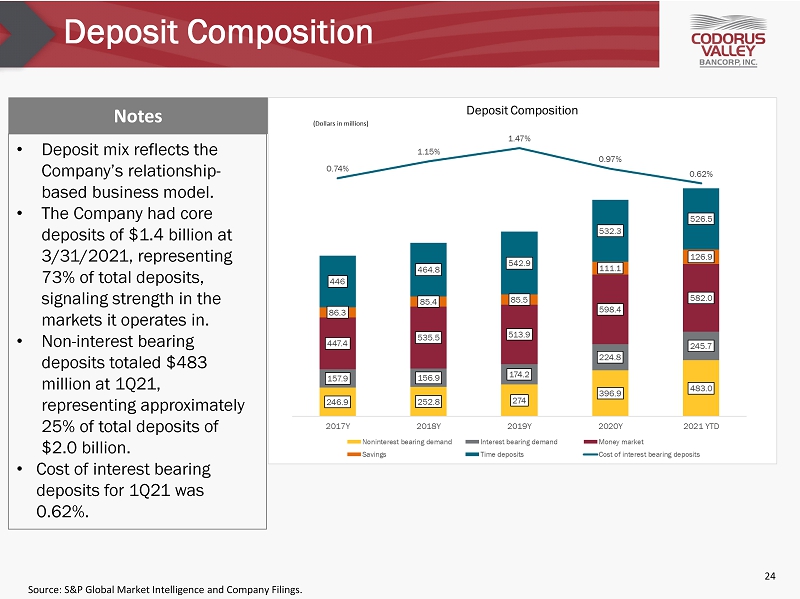
Deposit Composition Source: S&P Global Market Intelligence and Company Filings. • Deposit mix reflects the Company’s relationship - based business model. • The Company had core deposits of $ 1.4 billion at 3/31/2021, representing 73% of total deposits, signaling strength in the markets it operates in. • Non - interest bearing deposits totaled $483 million at 1Q21, representing approximately 25% of total deposits of $2.0 billion . • Cost of interest bearing deposits for 1Q21 was 0.62%. Notes 24

CD Repricing Opportunities Source: Company Filings. Certificate of Deposit Repricing Timeline ($000s): Remaining Months Until Maturity • Approximately 69% of CDs will reprice within the next 12 months. » This repricing will help benefit the Bank’s cost of deposits in the low interest - rate environment. • The total weighted - average rate on certificate of deposits at 3/31/2021 is 1.25%. • Average rates based on maturity date as are follows: » Maturing within the next 3 months: 1.60% » Maturing within 3 to 12 months: 1.22% » Maturing between 1 and 5 years: 1.14% 25 $80 ,298 $283,589 $159,314 $ 481 < 3 Months 3 - 12 Months 1 - 5 Years > 5 Years

4_02026021 Capital Overview
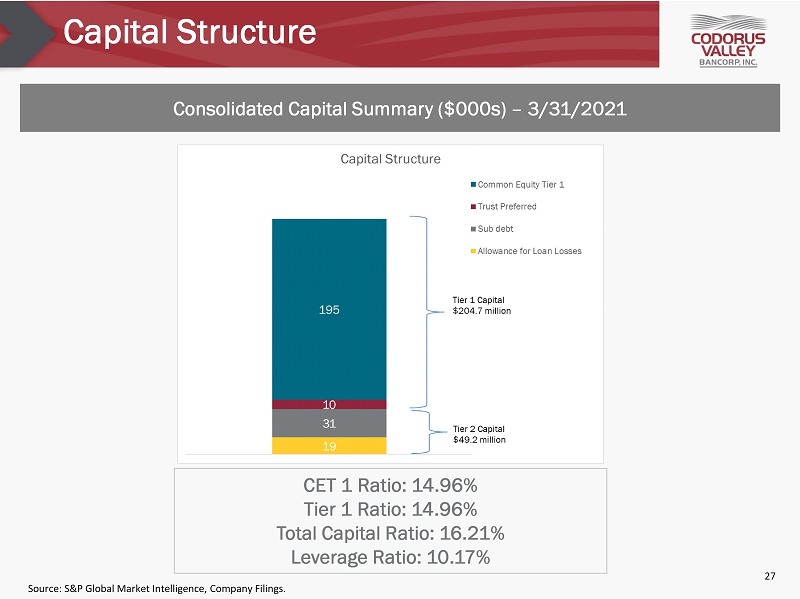
Capital Structure CET 1 Ratio: 14.96% Tier 1 Ratio: 14.96% Total Capital Ratio: 16.21% Leverage Ratio: 10.17% Consolidated Capital Summary ($000s) – 3/31/2021 Source: S&P Global Market Intelligence, Company Filings. 27
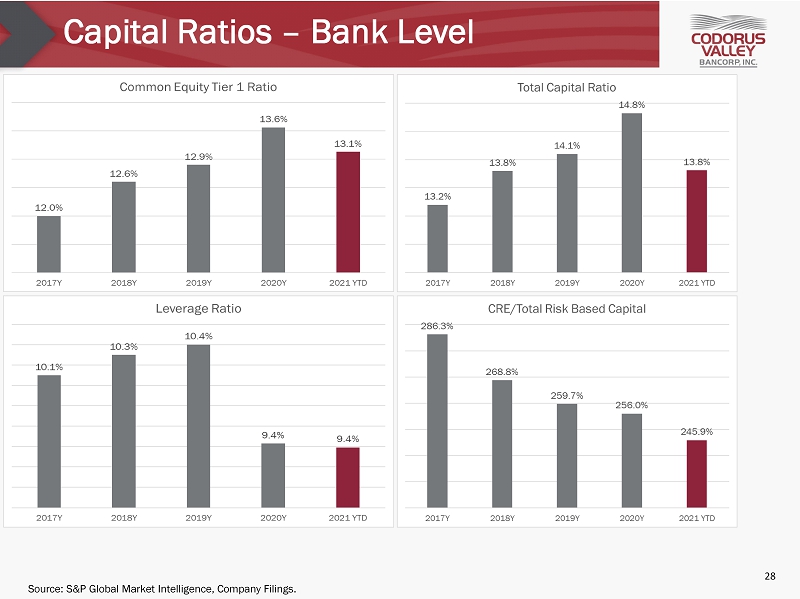
Capital Ratios – Bank Level Source: S&P Global Market Intelligence, Company Filings. 28

4_02026021 Appendix

Non - GAAP Disclosure Tangible common equity and tangible book value per common share are non - GAAP financial measures calculated using GAAP figures . Tangible common equity is calculated by excluding the balance of goodwill and intangibles from stockholder's equity . Tangible book value per share is calculated by dividing tangible common equity by the number of common shares outstanding . The Company has presented these non - GAAP financial measures because it believes that these measures provide useful and comparative information to assess trends in the Company’s financial condition and results of operations) . Because not all companies use the same calculations for tangible common equity, this presentation may not be comparable to other similarly titled measures calculated by other companies . These non - GAAP financial measures should not be considered a substitute for GAAP basis measures, and the Company encourages a review of its consolidated financial statements in their entirety . Following are reconciliations of these non - GAAP financial measures to the most directly comparable GAAP measure . 30 Tangible Common Equity Dollars in thousands, except per share data 2017 2018 2019 2020 1Q21 Common Equity 164,219$ 178,746$ 191,168$ 197,960$ 198,751$ Intangibles 2,321 2,633 2,547 2,308 2,307 Tangible Common Equity 161,898 176,113 188,621 195,652 196,444 Common Shares Outstanding 9,819,000 9,924,000 9,756,000 9,821,000 9,877,000 Book Value per Common Share 16.72$ 18.01$ 19.59$ 20.16$ 20.12$ Tangible Book Value per Common Share 16.49$ 17.75$ 19.33$ 19.93$ 19.89$ As of and for the year ending December 31,

Non - GAAP Disclosure Pre - Tax Pre - Provision Income measures net income or loss and excludes the effects of income taxes and the bank’s provision for loan losses, and any impairment charges . 31 Pre-Tax Pre-Provision Income Year-to-Date LTM Dollars in thousands, except per share data 2017 2018 2019 2020 1Q21 1Q21 Net Income 12,004$ 19,542$ 18,647$ 8,442$ 3,900$ 15,331$ Income Taxes 9,904 5,182 5,025 2,031 1,073 4,079 Loan Loss Provision 4,175 2,700 2,450 14,675 1,231 6,471 Pre-Tax Pre-Provision Income 26,083$ 27,424$ 26,122$ 25,148$ 6,204$ 25,881$ As of and for the year ending December 31