Investor Presentation NASDAQ: CVLY As of December 31, 2021 Exhibit 99.1
Safe Harbor Notice Regarding Forward Looking Statements This presentation contains forward - looking statements about Codorus Valley Bancorp, Inc . that are intended to be covered by the safe harbor for forward - looking statements provided by the Private Securities Litigation Reform Act of 1995 . Forward - looking statements are not historical facts . These statements can be identified by the use of forward - looking terminology such as “believe,” “expect,” “may,” “will,” “should,” “project,” “plan,” “seek,” “intend,” “anticipate” or similar terminology . Such forward - looking statements include, but are not limited to, discussions of strategy, financial projections and estimates and their underlying assumptions ; statements regarding plans, objectives, goals, expectations or consequences ; and statements about future performance, operations, products and services of Codorus Valley Bancorp, Inc . and its subsidiaries . Note that many factors, some of which are discussed elsewhere in this presentation, could affect the future financial results of Codorus Valley Bancorp, Inc . and its subsidiaries, both individually and collectively, and could cause those results to differ materially from those expressed in the forward - looking statements contained or incorporated by reference in this presentation . In addition to the foregoing, the effect of COVID - 19 and related events, including those described above and those not yet known or knowable, could have a negative effect on the Corporation’s business prospects, financial condition and results of operations, as a result of quarantines ; market volatility ; market downturns ; changes in consumer behavior ; business closures ; deterioration in the credit quality of borrowers or the inability of borrowers to satisfy their obligations (and any related forbearances or restructurings that may be implemented) ; changes in the value of collateral securing outstanding loans ; changes in the value of the investment securities portfolio ; effects on key employees, including operational management personnel and those charged with preparing, monitoring and evaluating the Corporation's financial reporting and internal controls ; declines in the demand for loans and other banking services and products ; declines in demand resulting from adverse impacts of COVID - 19 on businesses deemed to be "non - essential" by governments ; and Financial Center or office closures and business interruptions . Additional factors that may affect forward - looking statements made in this presentation can be found in Codorus Valley Bancorp, Inc . ’s Quarterly Reports on Forms 10 - Q and its Annual Report on Form 10 - K, filed with the Securities and Exchange Commission and available on the Corporation’s website at www . peoplesbanknet . com and on the Securities and Exchange Commission’s website at www . sec . gov . We include web addresses here as inactive textual references only . Information on these websites is not part of this presentation . Forward - looking statements in this presentation speak only as of the date of this presentation, and Codorus Valley Bancorp, Inc . makes no commitment to revise or update such statements to reflect changes that occur after the date the forward - looking statement was made . 2
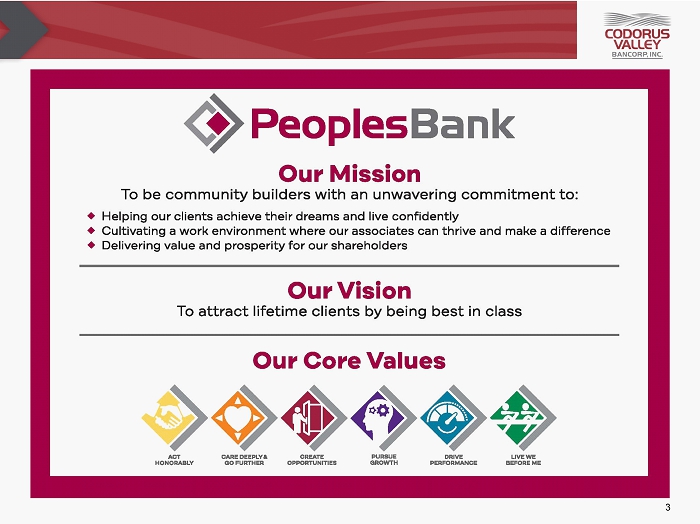
3
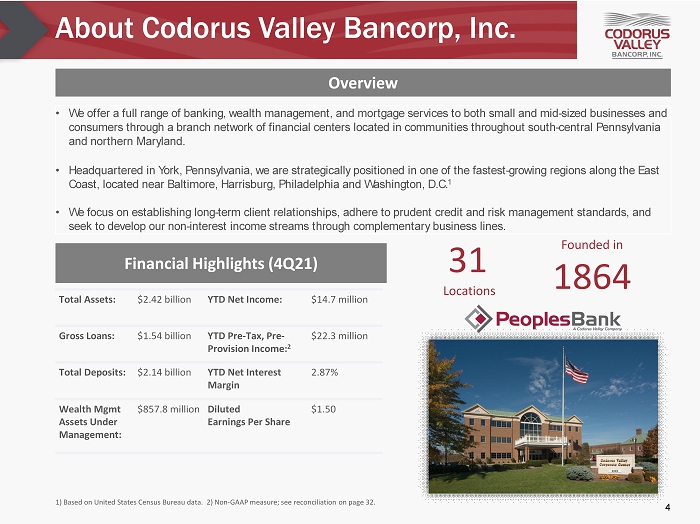
About Codorus Valley Bancorp, Inc. Overview • We offer a full range of banking, wealth management, and mortgage services to both small and mid - sized businesses and consumers through a branch network of financial centers located in communities throughout south - central Pennsylvania and northern Maryland. • Headquartered in York, Pennsylvania, we are strategically positioned in one of the fastest - growing regions along the East Coast, located near Baltimore, Harrisburg, Philadelphia and Washington, D.C. 1 • We focus on establishing long - term client relationships, adhere to prudent credit and risk management standards, and seek to develop our non - interest income streams through complementary business lines. 1) Based on United States Census Bureau data . 2) Non - GAAP measure; see reconciliation on page 32. Total Assets: $ 2.42 billion YTD Net Income: $14.7 million Gross Loans: $1.54 billion YTD Pre - Tax, Pre - Provision Income: 2 $22.3 million Total Deposits: $2.14 billion YTD Net Interest Margin 2.87% Wealth Mgmt Assets Under Management: $857.8 million Diluted Earnings Per Share $1.50 Financial Highlights (4Q21 ) 31 Locations Founded in 1864 4

Attractive Footprint & Market Share Source: FDIC Summary of Deposits. Deposit data as of June 30, 2021 . • #2 market position by deposits in York County, Pennsylvania, with a 14.5% market share (out of 15 banks that report deposit data); #1 market position for banks under $100 billion in assets. • Strategic focus is on maximizing presence in our existing market area while expanding into adjacent and contiguous markets where we can differentiate ourselves from competitors and grow market share. Deposit Market Share by County: June 30, 2021 Market County Share (%) Pennsylvania York 14.5 Lancaster 0.6 Cumberland 0.2 Maryland Baltimore City 0.1 Baltimore County 0.9 Harford 1.7 5
Leadership Transition Codorus Valley Bancorp, Inc’s Board of Directors appointed Craig L . Kauffman as President and Chief Executive Officer effective October 1 , 2021 . Mr . Kauffman served as Executive Vice President and Chief Operating Officer of Codorus Valley from 2018 - 2021 and as a member of the Board since 2019 . He brings a depth of strategic experience and is a proven business leader with a strong track record in the banking and financial services sector . Previously, he served as Regional President of BB&T Bank, and prior to that held various executive positions with Susquehanna Bank, PNC Bank and Sterling Financial Corporation . Craig L . Kauffman President and Chief Executive Officer Key Appointments : Chair, SCI Foundation Vice Chair, Millersville University Lombardo School of Business Advisory Council Board Member, Lancaster County Safety Coalition Past Chair, Lancaster Chamber of Commerce Craig L. Kauffman Appointed President and Chief Executive Officer 6
Recent Developments • In September 2021, recognized as 2021 Readers’ Choice for Best Mortgage Lender by readers of Hanover Evening Sun. • In September 2021, PeoplesBank received the Outstanding Community Service Award by The Salvation Army York Citadel. • In July 2021, Wealth Management Division recognized as Pohl Consulting and Training, Inc. Top Performer. • In May 2021, r ecognized as 2021 Best of the Best in two categories Best Bank and Best Mortgage Lender by readers of York Daily Record. • In January 2021, r eceived 2020 Laserfiche Run Smarter® Award. • In September 2020, Connections Center was recognized the winner in URC’s 6th Annual Unsurpassed Award Winners Competition. 7
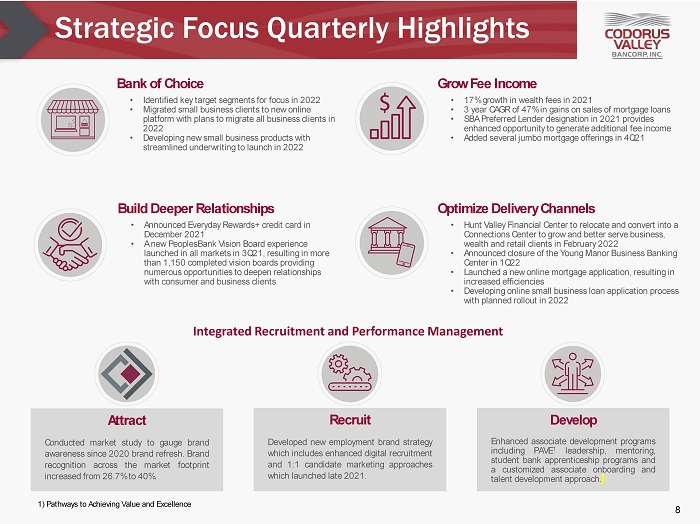
Strategic Focus Quarterly Highlights Attract Conducted market study to gauge brand awareness since 2020 brand refresh . Brand recognition across the market footprint increased from 26 . 7 % to 40 % . Recruit Developed new employment brand strategy which includes enhanced digital recruitment and 1 : 1 candidate marketing approaches which launched late 2021 . Develop Enhanced associate development programs including PAVE 1 leadership, mentoring, student bank apprenticeship programs and a customized associate onboarding and talent development approach . Build Deeper Relationships • Announced Everyday Rewards+ credit card in December 2021 • A new PeoplesBank Vision Board experience launched in all markets in 3Q21, resulting in more than 1,150 completed vision boards providing numerous opportunities to deepen relationships with consumer and business clients Grow Fee Income • 17% growth in wealth fees in 2021 • 3 year CAGR of 47% in gains on sales of mortgage loans • SBA Preferred Lender designation in 2021 provides enhanced opportunity to generate additional fee income • Added several jumbo mortgage offerings in 4Q21 Optimize Delivery Channels • Hunt Valley Financial Center to relocate and convert into a Connections Center to grow and better serve business, wealth and retail clients in February 2022 • Announced closure of the Young Manor Business Banking Center in 1Q22 • Launched a new online mortgage application, resulting in increased efficiencies • Developing online small business loan application process with planned rollout in 2022 8 Integrated Recruitment and Performance Management Bank of Choice • Identified key target segments for focus in 2022 • Migrated small business clients to new online platform with plans to migrate all business clients in 2022 • Developing new small business products with streamlined underwriting to launch in 2022 1) Pathways to Achieving Value and Excellence
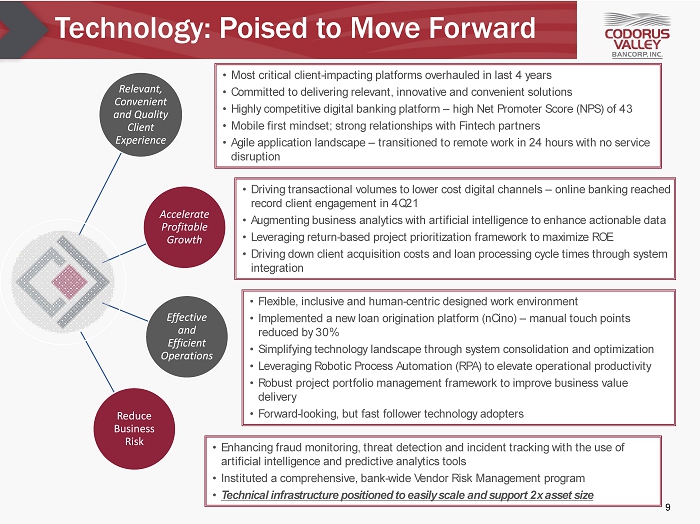
9 Technology: Poised to Move Forward • Most critical client - impacting platforms overhauled in last 4 years • Committed to delivering relevant, innovative and convenient solutions • Highly competitive digital banking platform – high Net Promoter Score (NPS) of 43 • Mobile first mindset; strong relationships with Fintech partners • Agile application landscape – transitioned to remote work in 24 hours with no service disruption • Driving transactional volumes to lower cost digital channels – online banking reached record client engagement in 4Q21 • Augmenting business analytics with artificial intelligence to enhance actionable data • Leveraging return - based project prioritization framework to maximize ROE • Driving down client acquisition costs and loan processing cycle times through system integration • Flexible, inclusive and human - centric designed work environment • Implemented a new loan origination platform ( nCino ) – manual touch points reduced by 30% • Simplifying technology landscape through system consolidation and optimization • Leveraging Robotic Process Automation (RPA) to elevate operational productivity • Robust project portfolio management framework to improve business value delivery • Forward - looking, but fast follower technology adopters • Enhancing fraud monitoring, threat detection and incident tracking with the use of artificial intelligence and predictive analytics tools • Instituted a comprehensive, bank - wide Vendor Risk Management program • Technical infrastructure positioned to easily scale and support 2x asset size Relevant, Convenient and Quality Client Experience Accelerate Profitable Growth Effective and Efficient Operations Reduce Business Risk

Key Technology Partners 10
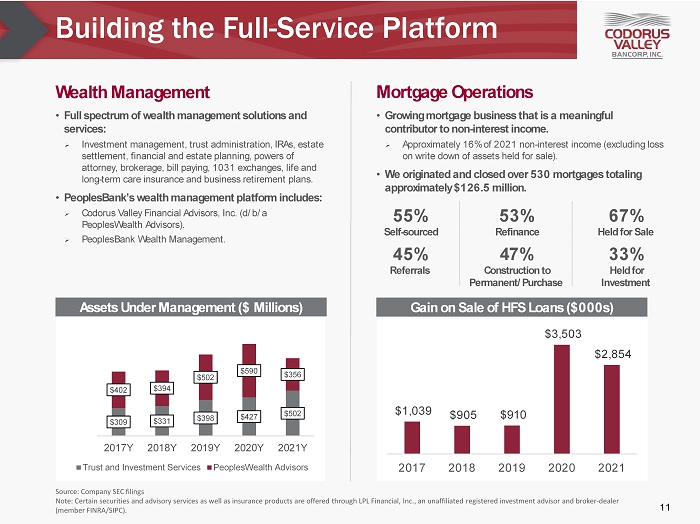
• Full spectrum of wealth management solutions and services: » Investment management, trust administration, IRAs, estate settlement, financial and estate planning, powers of attorney, brokerage, bill paying, 1031 exchanges, life and long - term care insurance and business retirement plans. • PeoplesBank’s wealth management platform includes: » Codorus Valley Financial Advisors, Inc. (d/b/a PeoplesWealth Advisors). » PeoplesBank Wealth Management. Building the Full - Service Platform Assets Under Management ($ Millions) Source: Company SEC filings Note: Certain securities and advisory services as well as insurance products are offered through LPL Financial, Inc ., an unaffiliated registered investment advisor and broker - dealer (member FINRA/SIPC). Gain on Sale of HFS Loans ($000s) • Growing mortgage business that is a meaningful contributor to non - interest income. » Approximately 16% of 2021 non - interest income (excluding loss on write down of assets held for sale). • We originated and closed over 530 mortgages totaling approximately $ 126.5 million. Wealth Management Mortgage Operations 11 55% Self - sourced 45% Referrals 47% Construction to Permanent/Purchase 53% Refinance 33% Held for Investment 67% Held for Sale $1,039 $905 $910 $3,503 $2,854 2017 2018 2019 2020 2021 $309 $331 $398 $427 $502 $402 $394 $502 $590 $356 $0 $200 $400 $600 $800 $1,000 $1,200 2017Y 2018Y 2019Y 2020Y 2021Y Trust and Investment Services PeoplesWealth Advisors
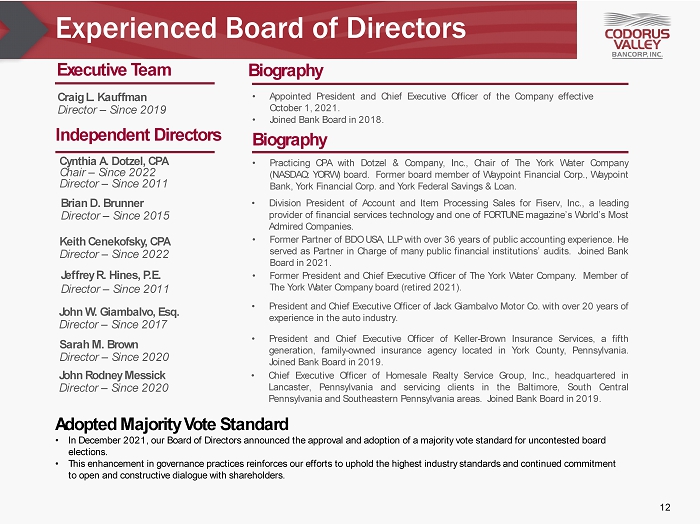
Experienced Board of Directors Cynthia A. Dotzel, CPA Chair – Since 2022 Director – Since 2011 • Practicing CPA with Dotzel & Company, Inc . , Chair of The York Water Company (NASDAQ : YORW) board . Former board member of Waypoint Financial Corp . , Waypoint Bank, York Financial Corp . and York Federal Savings & Loan . Brian D. Brunner Director – Since 2015 • Division President of Account and Item Processing Sales for Fiserv, Inc . , a leading provider of financial services technology and one of FORTUNE magazine’s World’s Most Admired Companies . • Former President and Chief Executive Officer of The York Water Company . Member of The York Water Company board (retired 2021 ) . Jeffrey R . Hines, P . E . Director – Since 2011 • President and Chief Executive Officer of Keller - Brown Insurance Services, a fifth generation, family - owned insurance agency located in York County, Pennsylvania . Joined Bank Board in 2019 . Sarah M. Brown Director – Since 2020 John W. Giambalvo, Esq. Director – Since 2017 • President and Chief Executive Officer of Jack Giambalvo Motor Co . with over 20 years of experience in the auto industry . John Rodney Messick Director – Since 2020 • Chief Executive Officer of Homesale Realty Service Group, Inc . , headquartered in Lancaster, Pennsylvania and servicing clients in the Baltimore, South Central Pennsylvania and Southeastern Pennsylvania areas . Joined Bank Board in 2019 . Executive Team Biography 12 Craig L. Kauffman Director – Since 2019 • Appointed President and Chief Executive Officer of the Company effective October 1 , 2021 . • Joined Bank Board in 2018 . Independent Directors Biography Keith Cenekofsky , CPA Director – Since 2022 • Former Partner of BDO USA, LLP with over 36 years of public accounting experience . He served as Partner in Charge of many public financial institutions’ audits . Joined Bank Board in 2021 . Adopted Majority Vote Standard • In December 2021, our Board of Directors announced the approval and adoption of a majority vote standard for uncontested board elections. • This enhancement in governance practices reinforces our efforts to uphold the highest industry standards and continued commit men t to open and constructive dialogue with shareholders.
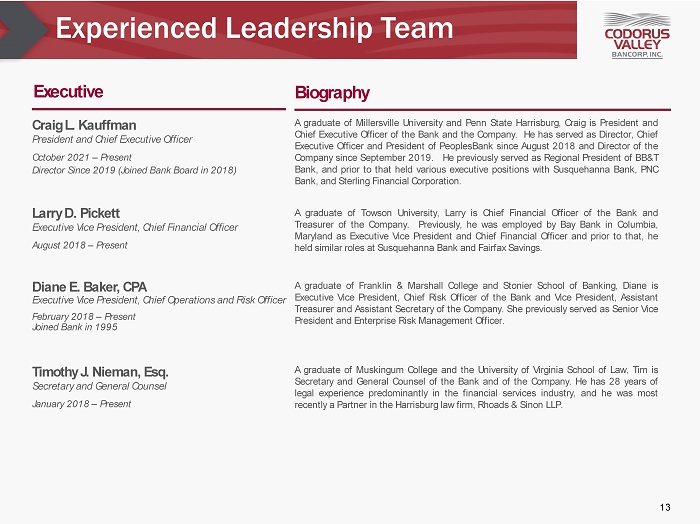
Experienced Leadership Team Craig L . Kauffman President and Chief Executive Officer October 2021 – Present Director Since 2019 (Joined Bank Board in 2018 ) Larry D. Pickett Executive Vice President, Chief Financial Officer August 2018 – Present Diane E. Baker, CPA Executive Vice President, Chief Operations and Risk Officer February 2018 – Present Joined Bank in 1995 Executive Biography Timothy J . Nieman, Esq . Secretary and General Counsel January 2018 – Present 13 A graduate of Millersville University and Penn State Harrisburg, Craig is President and Chief Executive Officer of the Bank and the Company . He has served as Director, Chief Executive Officer and President of PeoplesBank since August 2018 and Director of the Company since September 2019 . He previously served as Regional President of BB&T Bank, and prior to that held various executive positions with Susquehanna Bank, PNC Bank, and Sterling Financial Corporation . A graduate of Towson University, Larry is Chief Financial Officer of the Bank and Treasurer of the Company . Previously, he was employed by Bay Bank in Columbia, Maryland as Executive Vice President and Chief Financial Officer and prior to that, he held similar roles at Susquehanna Bank and Fairfax Savings . A graduate of Franklin & Marshall College and Stonier School of Banking, Diane is Executive Vice President, Chief Risk Officer of the Bank and Vice President, Assistant Treasurer and Assistant Secretary of the Company . She previously served as Senior Vice President and Enterprise Risk Management Officer . A graduate of Muskingum College and the University of Virginia School of Law, Tim is Secretary and General Counsel of the Bank and of the Company . He has 28 years of legal experience predominantly in the financial services industry, and he was most recently a Partner in the Harrisburg law firm, Rhoads & Sinon LLP .
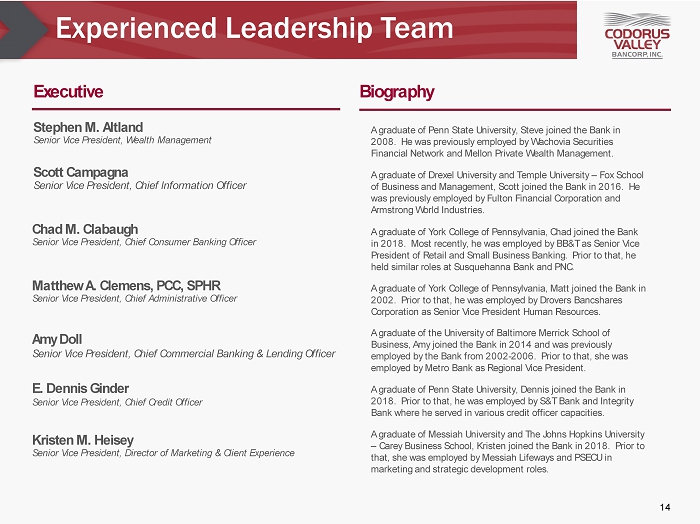
Experienced Leadership Team Amy Doll Senior Vice President, Chief Commercial Banking & Lending Officer Stephen M. Altland Senior Vice President, Wealth Management Matthew A. Clemens, PCC, SPHR Senior Vice President, Chief Administrative Officer Executive Biography E . Dennis Ginder Senior Vice President, Chief Credit Officer Chad M. Clabaugh Senior Vice President, Chief Consumer Banking Officer 14 Kristen M. Heisey Senior Vice President, Director of Marketing & Client Experience Scott Campagna Senior Vice President, Chief Information Officer A graduate of Penn State University, Steve joined the Bank in 2008. He was previously employed by Wachovia Securities Financial Network and Mellon Private Wealth Management. A graduate of Drexel University and Temple University – Fox School of Business and Management, Scott joined the Bank in 2016. He was previously employed by Fulton Financial Corporation and Armstrong World Industries. A graduate of York College of Pennsylvania, Chad joined the Bank in 2018. Most recently, he was employed by BB&T as Senior Vice President of Retail and Small Business Banking. Prior to that, he held similar roles at Susquehanna Bank and PNC. A graduate of York College of Pennsylvania, Matt joined the Bank in 2002. Prior to that, he was employed by Drovers Bancshares Corporation as Senior Vice President Human Resources. A graduate of the University of Baltimore Merrick School of Business, Amy joined the Bank in 2014 and was previously employed by the Bank from 2002 - 2006. Prior to that, she was employed by Metro Bank as Regional Vice President. A graduate of Penn State University, Dennis joined the Bank in 2018. Prior to that, he was employed by S&T Bank and Integrity Bank where he served in various credit officer capacities. A graduate of Messiah University and The Johns Hopkins University – Carey Business School, Kristen joined the Bank in 2018. Prior to that, she was employed by Messiah Lifeways and PSECU in marketing and strategic development roles.
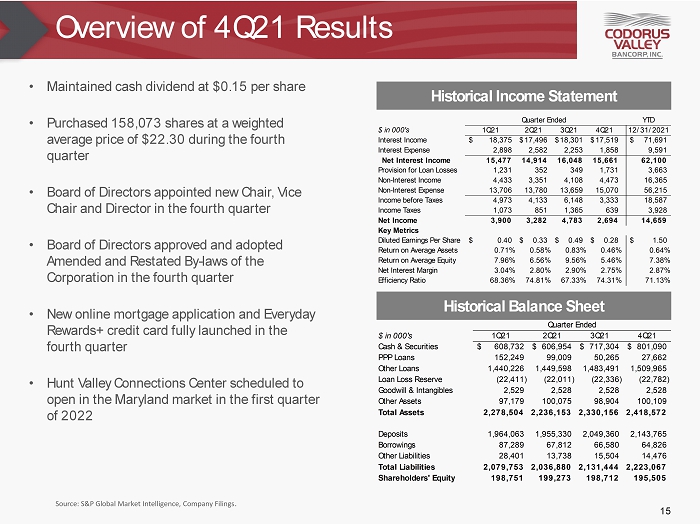
Overview of 4Q21 Results • Maintained cash dividend at $0.15 per share • Purchased 158,073 shares at a weighted average price of $ 22.30 during the fourth quarter • Board of Directors appointed new Chair, Vice Chair and Director in the fourth quarter • Board of Directors approved and adopted Amended and Restated By - laws of the Corporation in the fourth quarter • New online mortgage application and Everyday Rewards+ credit card fully launched in the fourth quarter • Hunt Valley Connections Center scheduled to open in the Maryland market in the first quarter of 2022 Source: S&P Global Market Intelligence, Company Filings . Historical Income Statement 15 Historical Balance Sheet YTD $ in 000's 1Q21 2Q21 3Q21 4Q21 12/31/2021 Interest Income 18,375$ 17,496$ 18,301$ 17,519$ 71,691$ Interest Expense 2,898 2,582 2,253 1,858 9,591 Net Interest Income 15,477 14,914 16,048 15,661 62,100 Provision for Loan Losses 1,231 352 349 1,731 3,663 Non-Interest Income 4,433 3,351 4,108 4,473 16,365 Non-Interest Expense 13,706 13,780 13,659 15,070 56,215 Income before Taxes 4,973 4,133 6,148 3,333 18,587 Income Taxes 1,073 851 1,365 639 3,928 Net Income 3,900 3,282 4,783 2,694 14,659 Key Metrics Diluted Earnings Per Share 0.40$ 0.33$ 0.49$ 0.28$ 1.50$ Return on Average Assets 0.71% 0.58% 0.83% 0.46% 0.64% Return on Average Equity 7.96% 6.56% 9.56% 5.46% 7.38% Net Interest Margin 3.04% 2.80% 2.90% 2.75% 2.87% Efficiency Ratio 68.36% 74.81% 67.33% 74.31% 71.13% Quarter Ended $ in 000's 1Q21 2Q21 3Q21 4Q21 Cash & Securities 608,732$ 606,954$ 717,304$ 801,090$ PPP Loans 152,249 99,009 50,265 27,662 Other Loans 1,440,226 1,449,598 1,483,491 1,509,965 Loan Loss Reserve (22,411) (22,011) (22,336) (22,782) Goodwill & Intangibles 2,529 2,528 2,528 2,528 Other Assets 97,179 100,075 98,904 100,109 Total Assets 2,278,504 2,236,153 2,330,156 2,418,572 Deposits 1,964,063 1,955,330 2,049,360 2,143,765 Borrowings 87,289 67,812 66,580 64,826 Other Liabilities 28,401 13,738 15,504 14,476 Total Liabilities 2,079,753 2,036,880 2,131,444 2,223,067 Shareholders' Equity 198,751 199,273 198,712 195,505 Quarter Ended
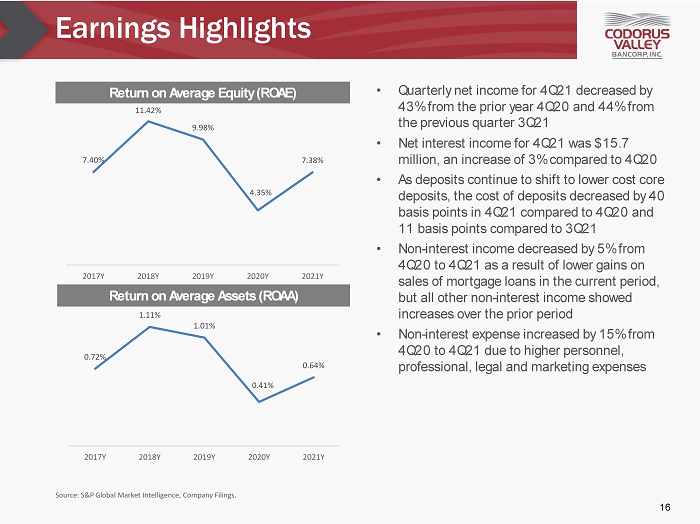
Earnings Highlights Source: S&P Global Market Intelligence, Company Filings. • Quarterly net income for 4Q21 decreased by 43% from the prior year 4Q20 and 44% from the previous quarter 3Q21 • Net interest income for 4Q21 was $ 15.7 million, an increase of 3% compared to 4Q20 • As deposits continue to shift to lower cost core deposits, the cost of deposits decreased by 40 basis points in 4Q21 compared to 4Q20 and 11 basis points compared to 3Q21 • Non - interest income decreased by 5% from 4Q20 to 4Q21 as a result of lower gains on sales of mortgage loans in the current period, but all other non - interest income showed increases over the prior period • Non - interest expense increased by 15% from 4Q20 to 4Q21 due to higher personnel, professional, legal and marketing expenses Return on Average Equity (ROAE) Return on Average Assets (ROAA) 16 7.40% 11.42% 9.98% 4.35% 7.38% 2017Y 2018Y 2019Y 2020Y 2021Y 0.72% 1.11% 1.01% 0.41% 0.64% 2017Y 2018Y 2019Y 2020Y 2021Y
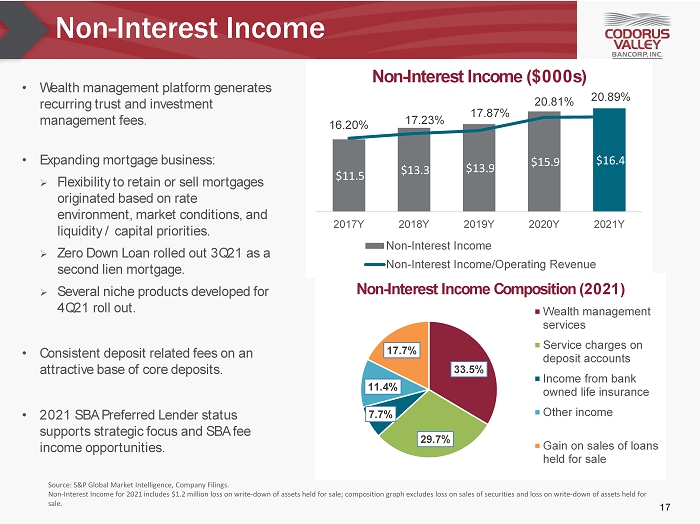
Non - Interest Income • Wealth management platform generates recurring trust and investment management fees. • Expanding mortgage business: » Flexibility to retain or sell mortgages originated based on rate environment, market conditions, and liquidity / capital priorities. » Zero Down Loan rolled out 3Q21 as a second lien mortgage. » Several niche products developed for 4Q21 roll out . • Consistent deposit related fees on an attractive base of core deposits. • 2021 SBA Preferred Lender status supports strategic focus and SBA fee income opportunities. Source: S&P Global Market Intelligence, Company Filings. Non - Interest Income for 2021 includes $ 1.2 million loss on write - down of assets held for sale; composition graph excludes loss on sales of securities and loss on write - down of ass ets held for sale. 17 33.5% 29.7% 7.7% 11.4% 17.7% Non - Interest Income Composition (2021) Wealth management services Service charges on deposit accounts Income from bank owned life insurance Other income Gain on sales of loans held for sale $11.5 $13.3 $13.9 $15.9 $16.4 16.20% 17.23% 17.87% 20.81% 20.89% 2017Y 2018Y 2019Y 2020Y 2021Y Non - Interest Income ($000s) Non-Interest Income Non-Interest Income/Operating Revenue
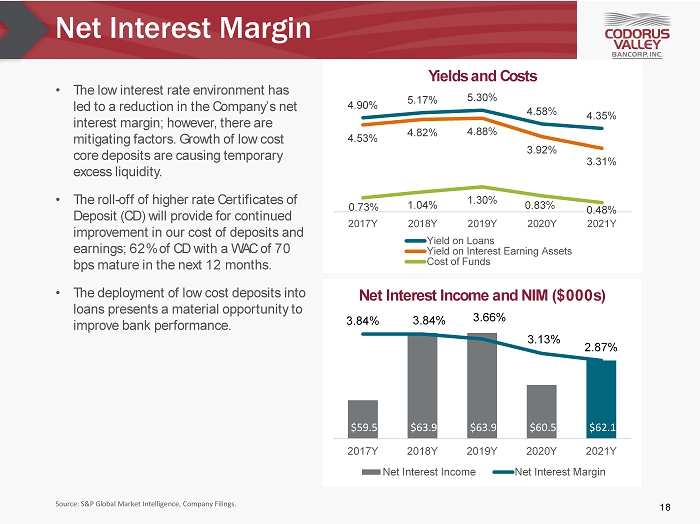
Net Interest Margin Source: S&P Global Market Intelligence, Company Filings. • The low interest rate environment has led to a reduction in the Company’s net interest margin; however, there are mitigating factors. Growth of low cost core deposits are causing temporary excess liquidity. • The roll - off of higher rate Certificates of Deposit (CD) will provide for continued improvement in our cost of deposits and earnings; 62% of CD with a WAC of 70 bps mature in the next 12 months. • The deployment of low cost deposits into loans presents a material opportunity to improve bank performance. 18 $59.5 $63.9 $63.9 $60.5 $62.1 3.84% 3.84% 3.66% 3.13% 2.87% 2017Y 2018Y 2019Y 2020Y 2021Y Net Interest Income and NIM ($000s) Net Interest Income Net Interest Margin 4.90% 5.17% 5.30% 4.58% 4.35% 4.53% 4.82% 4.88% 3.92% 3.31% 0.73% 1.04% 1.30% 0.83% 0.48% 2017Y 2018Y 2019Y 2020Y 2021Y Yields and Costs Yield on Loans Yield on Interest Earning Assets Cost of Funds

CD Repricing Opportunities Source: Company Filings. • Approximately 62% of CD will reprice within the next 12 months. » This repricing benefits the Bank’s cost of deposits in the low interest - rate environment. • The total weighted - average rate on CD at December 31, 2021 is 0.70%. • Average rates based on maturity date are as follows : » Maturing within the next 3 months: 0.94% » Maturing within 3 to 12 months: 0.60% » Maturing between 1 and 5 years: 1.40% Certificates of Deposit Repricing Timeline ($000s): Remaining Months Until Maturity 19 $ 84,457 $ 203,172 $ 173,370 $ 716 < 3 Months 3 - 12 Months 1 - 5 Years > 5 Years
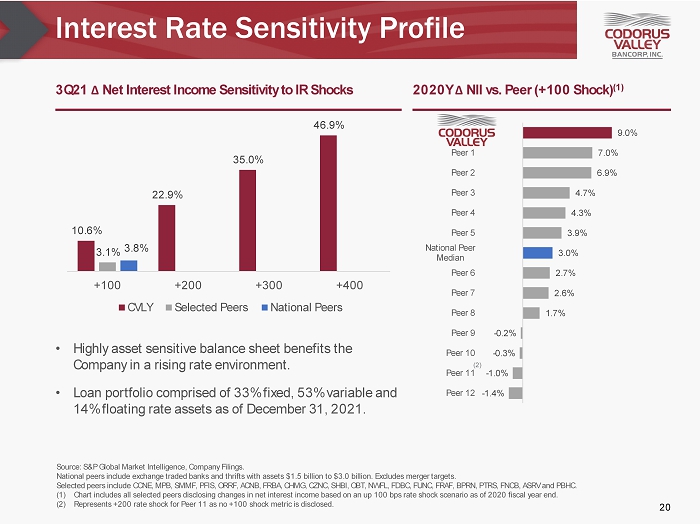
Interest Rate Sensitivity Profile 3Q21 ∆ Net Interest Income Sensitivity to IR Shocks 2020Y ∆ NII vs. Peer (+100 Shock) (1) 10.6% 22.9% 35.0% 46.9% 3.1% 3.8% +100 +200 +300 +400 CVLY Selected Peers National Peers Source: S&P Global Market Intelligence, Company Filings. National peers include exchange traded banks and thrifts with assets $1.5 billion to $3.0 billion. Excludes merger targets. Selected peers include CCNE, MPB, SMMF, PFIS, ORRF, ACNB, FRBA, CHMG, CZNC, SHBI, OBT, NWFL, FDBC, FUNC, FRAF, BPRN , PTRS, FNCB, ASRV and PBHC. (1) Chart includes all selected peers disclosing changes in net interest income based on an up 100 bps rate shock scenario as of 2020 fiscal year end. (2) Represents +200 rate shock for Peer 11 as no +100 shock metric is disclosed. 9.0% 7.0% 6.9% 4.7% 4.3% 3.9% 3.0% 2.7% 2.6% 1.7% - 0.2% - 0.3% - 1.0% - 1.4% CVLY Peer 1 Peer 2 Peer 3 Peer 4 Peer 5 National Peer Median Peer 6 Peer 7 Peer 8 Peer 9 Peer 10 Peer 11 Peer 12 (2) • Highly asset sensitive balance sheet benefits the Company in a rising rate environment. • Loan portfolio comprised of 33% fixed, 53% variable and 14% floating rate assets as of December 31, 2021. 20
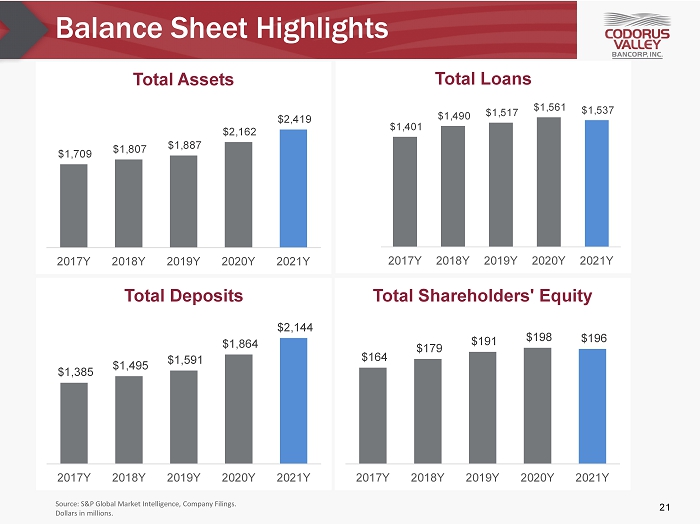
Balance Sheet Highlights Source: S&P Global Market Intelligence, Company Filings. Dollars in millions. 21 $1,709 $1,807 $1,887 $2,162 $2,419 2017Y 2018Y 2019Y 2020Y 2021Y Total Assets $1,401 $1,490 $1,517 $1,561 $1,537 $500 $700 $900 $1,100 $1,300 $1,500 $1,700 2017Y 2018Y 2019Y 2020Y 2021Y Total Loans $1,385 $1,495 $1,591 $1,864 $2,144 2017Y 2018Y 2019Y 2020Y 2021Y Total Deposits $164 $179 $191 $198 $196 2017Y 2018Y 2019Y 2020Y 2021Y Total Shareholders' Equity
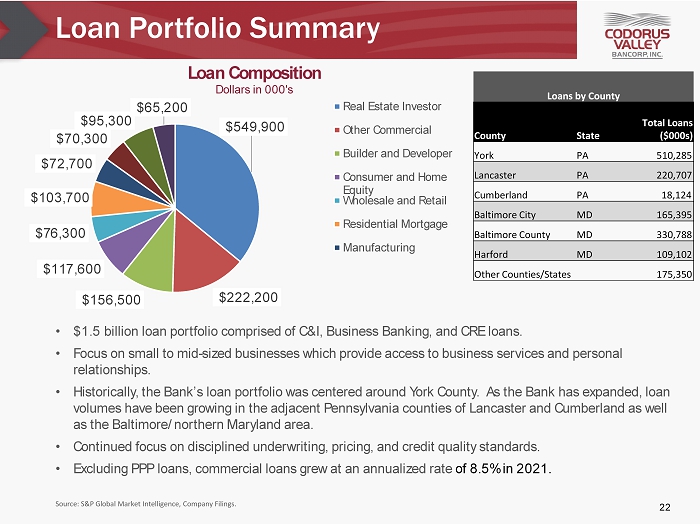
Loan Portfolio Summary • $1.5 billion loan portfolio comprised of C&I, Business Banking, and CRE loans. • Focus on small to mid - sized businesses which provide access to business services and personal relationships. • Historically, the Bank’s loan portfolio was centered around York County. As the Bank has expanded, loan volumes have been growing in the adjacent Pennsylvania counties of Lancaster and Cumberland as well as the Baltimore/northern Maryland area. • Continued focus on disciplined underwriting, pricing, and credit quality standards. • Excluding PPP loans, commercial loans grew at an annualized rate of 8.5% in 2021. Source: S&P Global Market Intelligence, Company Filings. 22 Loans by County County State Total Loans ($000s) York PA 510,285 Lancaster PA 220,707 Cumberland PA 18,124 Baltimore City MD 165,395 Baltimore County MD 330,788 Harford MD 109,102 Other Counties/States 175,350 $549,900 $222,200 $156,500 $117,600 $76,300 $103,700 $72,700 $70,300 $95,300 $65,200 Loan Composition Dollars in 000's Real Estate Investor Other Commercial Builder and Developer Consumer and Home Equity Wholesale and Retail Residential Mortgage Manufacturing

COVID - 19 Loan Update • Began receiving PPP applications in 2Q20. • The Bank did not utilize the Federal Reserve PPP Lending Facility to fund PPP loan growth. Paycheck Protection Program (PPP) PPP Loans Funded, by Industry 23.0% 15.1% 13.4% 12.2% 11.0% 6.0% 5.7% 2.7% 2.5% 2.3% Professional Services Builder / Developer Manufacturer Service Retail / Wholesale Restaurant & Bars Health Services Auto Retailer Transportation Public Administration Rest of Portfolio 84% Early Impact Industries 16% Early Impact Industries » Restaurant & Bar: 6.0% » Health Services: 5.7% » Recreation: 2.2% » Religious Organizations: 1.7% » Hotel/Motel: 0.7% 1) As of 12/31/2021 , outstanding PPP loans were $27.7 million, with forgiveness payments received from the SBA on more than 1,500 loans totaling ~$222 million. As a result, deferred fee income in the amount of ~$5.4 million has been recognized. Sensitive Industry Exposure PPP Highlights Over 2,000 Applications Processed Over $250 million PPP Loans Funded 1 $125,000 Average Loan Balance 23
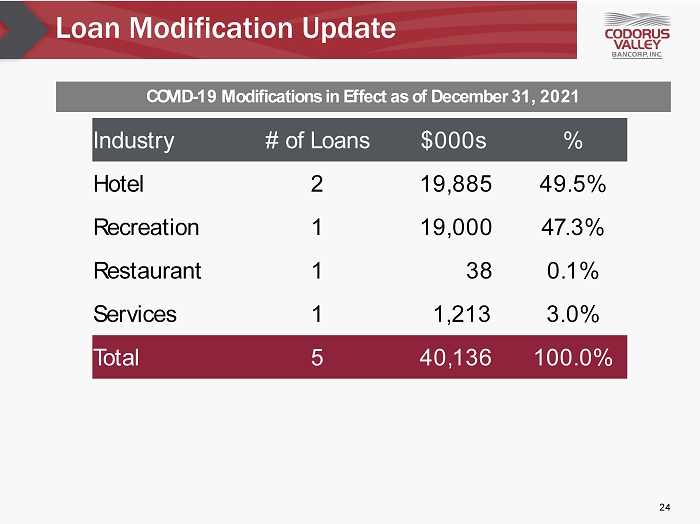
Loan Modification Update COVID - 19 Modifications in Effect as of December 31, 2021 24 Industry # of Loans $000s % Hotel 2 19,885 49.5% Recreation 1 19,000 47.3% Restaurant 1 38 0.1% Services 1 1,213 3.0% Total 5 40,136 100.0%
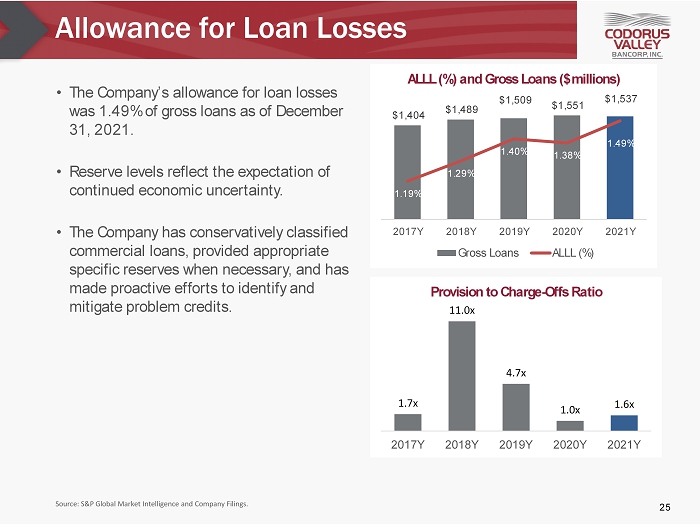
Allowance for Loan Losses Source: S&P Global Market Intelligence and Company Filings. • The Company’s allowance for loan losses was 1.49% of gross loans as of December 31, 2021. • Reserve levels reflect the expectation of continued economic uncertainty. • The Company has conservatively classified commercial loans, provided appropriate specific reserves when necessary, and has made proactive efforts to identify and mitigate problem credits. 25 $1,404 $1,489 $1,509 $1,551 $1,537 1.19% 1.29% 1.40% 1.38% 1.49% 2017Y 2018Y 2019Y 2020Y 2021Y ALLL (%) and Gross Loans ($millions) Gross Loans ALLL (%) 1.7x 11.0x 4.7x 1.0x 1.6x 2017Y 2018Y 2019Y 2020Y 2021Y Provision to Charge - Offs Ratio
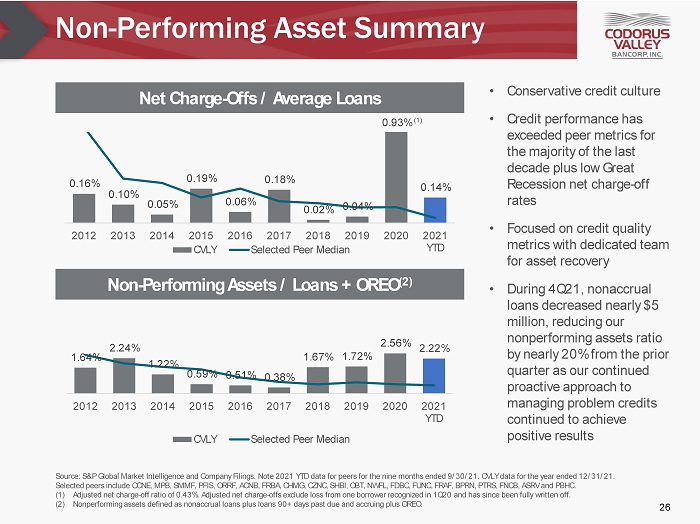
Non - Performing Asset Summary Source: S&P Global Market Intelligence and Company Filings. Note 2021 YTD data for peers for the nine months ended 9/30/21. CVLY data for the year ended 12/31/21. Selected peers include CCNE, MPB, SMMF, PFIS, ORRF, ACNB, FRBA, CHMG, CZNC, SHBI, OBT, NWFL, FDBC, FUNC, FRAF, BPRN, PTRS, FNCB, ASRV and PBHC. (1) Adjusted net charge - off ratio of 0.43%. Adjusted net charge - offs exclude loss from one borrower recognized in 1Q20 and has since been ful ly written off . (2) Nonperforming assets defined as nonaccrual loans plus loans 90+ days past due and accruing plus OREO. Net Charge - Offs / Average Loans Non - Performing Assets / Loans + OREO (2) 0.16% 0.10% 0.05% 0.19% 0.06% 0.18% 0.02% 0.04% 0.14% 2012 2013 2014 2015 2016 2017 2018 2019 2020 2021 YTD CVLY Selected Peer Median 1.64% 2.24% 1.22% 0.59% 0.51% 0.38% 1.67% 1.72% 2.56% 2.22% 2012 2013 2014 2015 2016 2017 2018 2019 2020 2021 YTD CVLY Selected Peer Median 0.93% (1) • Conservative credit culture • Credit performance has exceeded peer metrics for the majority of the last decade plus low Great Recession net charge - off rates • Focused on credit quality metrics with dedicated team for asset recovery • During 4Q21, nonaccrual loans decreased nearly $5 million, reducing our nonperforming assets ratio by nearly 20% from the prior quarter as our continued proactive approach to managing problem credits continued to achieve positive results 26
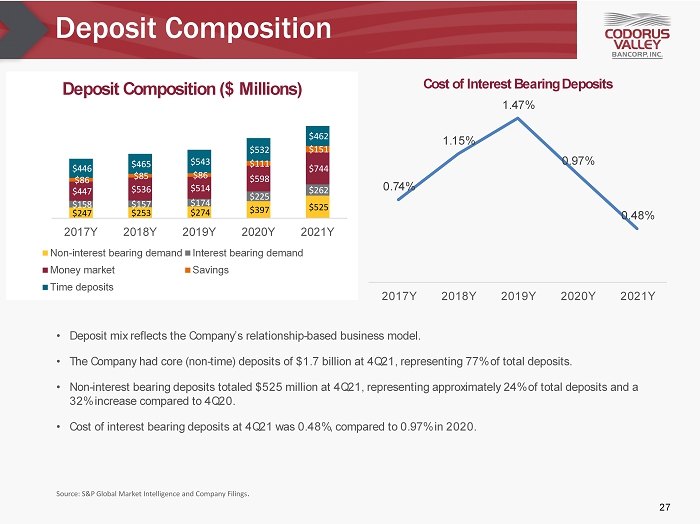
Deposit Composition Source: S&P Global Market Intelligence and Company Filings . • Deposit mix reflects the Company’s relationship - based business model. • The Company had core (non - time) deposits of $ 1.7 billion at 4Q21 , representing 77% of total deposits. • Non - interest bearing deposits totaled $525 million at 4Q21 , representing approximately 24% of total deposits and a 32% increase compared to 4Q20. • Cost of interest bearing deposits at 4Q21 was 0.48%, compared to 0.97% in 2020. 27 0.74% 1.15% 1.47% 0.97% 0.48% 2017Y 2018Y 2019Y 2020Y 2021Y Cost of Interest Bearing Deposits $247 $253 $274 $397 $525 $158 $157 $174 $225 $262 $447 $536 $514 $598 $744 $86 $85 $86 $111 $151 $446 $465 $543 $532 $462 $- $500 $1,000 $1,500 $2,000 $2,500 2017Y 2018Y 2019Y 2020Y 2021Y Deposit Composition ($ Millions) Non-interest bearing demand Interest bearing demand Money market Savings Time deposits
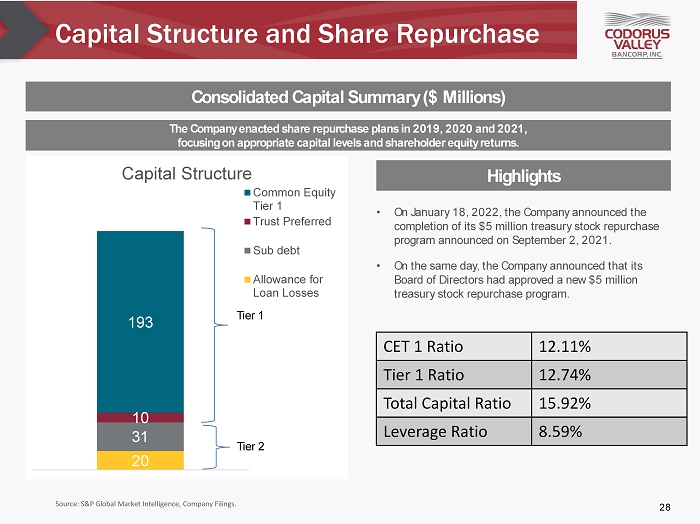
Capital Structure and Share Repurchase Consolidated Capital Summary ($ Millions) Source: S&P Global Market Intelligence, Company Filings. The Company enacted share repurchase plans in 2019, 2020 and 2021, focusing on appropriate capital levels and shareholder equity returns. • On January 18, 2022, the Company announced the completion of its $5 million treasury stock repurchase program announced on September 2 , 2021. • On the same day, the Company announced that its Board of Directors had approved a new $5 million treasury stock repurchase program. Highlights 28 CET 1 Ratio 12.11% Tier 1 Ratio 12.74% Total Capital Ratio 15.92% Leverage Ratio 8.59% 20 31 10 193 Capital Structure Common Equity Tier 1 Trust Preferred Sub debt Allowance for Loan Losses Tier 1 Tier 2

Appendix

COVID - 19 Response Employees Facilities Customers and Credit • PeoplesBank processed over 800 second round PPP loans totaling $77 million. • A significant majority of these loans supported small businesses, with the average outstanding loan balance below $150,000 and supporting 9,800 jobs. • PeoplesBank offered several free PPP Forgiveness webinars in 3Q20, tailored specifically for PPP borrowers and to provide an overview of the PPP forgiveness process. • The process of returning associates to the office in a phased and hybrid approach was completed in August. • A long - term remote work policy was recently adopted, allowing a portion of positions to work remotely on an ad hoc, part - time or full - time basis. This new employment strategy provides more work flexibility, broadens the employment geographic markets, allows for the redeployment of office space and ensures that PeoplesBank remains competitive in a tightening labor market. • All financial centers are now operating with normal drive - thru hours and lobby hours. • All retirement community office lobbies also remain open by appointment only with several modifications to ensure the safety of clients and associates. Three loan production offices remain closed; however, staff are working remotely . 30
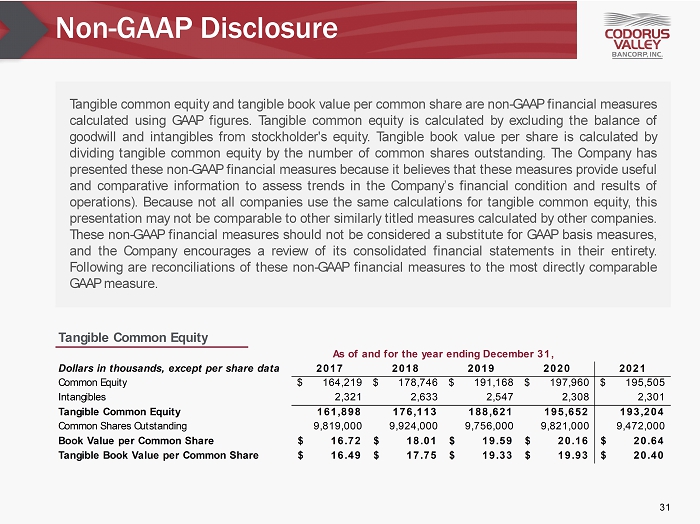
Non - GAAP Disclosure Tangible common equity and tangible book value per common share are non - GAAP financial measures calculated using GAAP figures . Tangible common equity is calculated by excluding the balance of goodwill and intangibles from stockholder's equity . Tangible book value per share is calculated by dividing tangible common equity by the number of common shares outstanding . The Company has presented these non - GAAP financial measures because it believes that these measures provide useful and comparative information to assess trends in the Company’s financial condition and results of operations) . Because not all companies use the same calculations for tangible common equity, this presentation may not be comparable to other similarly titled measures calculated by other companies . These non - GAAP financial measures should not be considered a substitute for GAAP basis measures, and the Company encourages a review of its consolidated financial statements in their entirety . Following are reconciliations of these non - GAAP financial measures to the most directly comparable GAAP measure . 31 Tangible Common Equity Dollars in thousands, except per share data 2017 2018 2019 2020 2021 Common Equity 164,219$ 178,746$ 191,168$ 197,960$ 195,505$ Intangibles 2,321 2,633 2,547 2,308 2,301 Tangible Common Equity 161,898 176,113 188,621 195,652 193,204 Common Shares Outstanding 9,819,000 9,924,000 9,756,000 9,821,000 9,472,000 Book Value per Common Share 16.72$ 18.01$ 19.59$ 20.16$ 20.64$ Tangible Book Value per Common Share 16.49$ 17.75$ 19.33$ 19.93$ 20.40$ As of and for the year ending December 31,

Non - GAAP Disclosure Pre - Tax Pre - Provision Income measures net income or loss and excludes the effects of income taxes and the bank’s provision for loan losses, and any impairment charges. 32 Pre - Tax Pre - Provision Income As of and for the year ending December 31, Dollars in thousands, except per share data 2017 2018 2019 2020 2021 Net Income $ 12,004 $ 19,542 $ 18,647 $ 8,442 $ 14,659 Income Taxes 9,904 5,182 5,025 2,031 3,928 Loan Loss Provision 4,175 2,700 2,450 14,675 3,663 Pre - Tax Pre - Provision Income $ 26,083 $ 27,424 $ 26,122 $ 25,148 $ 22,250