Exhibit 99.1
Exhibit 99.1Investor PresentationNASDAQ: CVLYAs of March 31, 2022
Safe Harbor Notice RegardingForward Looking StatementsThis presentation contains forward-looking statements about Codorus Valley Bancorp, Inc. that are intended to be covered by the safe harbor for forwardlookingstatements provided by the Private Securities Litigation Reform Act of 1995. Forward-looking statements are not historical facts. These statementscan be identified by the use of forward-looking terminology such as “believe,” “expect,” “may,” “will,” “should,” “project,” “plan,” “seek,” “intend,”“anticipate” or similar terminology. Such forward-looking statements include, but are not limited to, discussions of strategy, financial projections andestimates and their underlying assumptions; statements regarding plans, objectives, goals, expectations or consequences; and statements about futureperformance, operations, products and services of Codorus Valley Bancorp, Inc. and its subsidiaries.Note that many factors, some of which are discussed elsewhere in this presentation, could affect the future financial results of Codorus Valley Bancorp, Inc.and its subsidiaries, both individually and collectively, and could cause those results to differ materially from those expressed in the forward-lookingstatements contained or incorporated by reference in this presentation.In addition to the foregoing, the effect of COVID-19 and related events, including those described above and those not yet known or knowable, could have anegative effect on the Corporation’s business prospects, financial condition and results of operations, as a result of quarantines; market volatility; marketdownturns; changes in consumer behavior; business closures; deterioration in the credit quality of borrowers or the inability of borrowers to satisfy theirobligations (and any related forbearances or restructurings that may be implemented); changes in the value of collateral securing outstanding loans;changes in the value of the investment securities portfolio; effects on key employees, including operational management personnel and those charged withpreparing, monitoring and evaluating the Corporation's financial reporting and internal controls; declines in the demand for loans and other bankingservices and products; declines in demand resulting from adverse impacts of COVID-19 on businesses deemed to be "non-essential" by governments; andFinancial Center or office closures and business interruptions.Additional factors that may affect forward-looking statements made in this presentation can be found in Codorus Valley Bancorp, Inc.’s Quarterly Reports onForms 10-Q and its Annual Report on Form 10-K, filed with the Securities and Exchange Commission and available on the Corporation’s website atwww.peoplesbanknet.com and on the Securities and Exchange Commission’s website at www.sec.gov. We include web addresses here as inactive textualreferences only. Information on these websites is not part of this presentation. Forward-looking statements in this presentation speak only as of the date ofthis presentation, and Codorus Valley Bancorp, Inc. makes no commitment to revise or update such statements to reflect changes that occur after the datethe forward-looking statement was made.2
3

About Codorus Valley Bancorp, Inc.Overview• We offer a full range of banking, wealth management, and mortgage services to both small and mid-sized businesses andconsumers through a branch network of financial centers located in communities throughout south-central Pennsylvaniaand northern Maryland.• Headquartered in York, Pennsylvania, we are strategically positioned in one of the fastest-growing regions along the EastCoast, located near Baltimore, Harrisburg, Philadelphia and Washington, D.C.1• We focus on establishing long-term client relationships, adhere to prudent credit and risk management standards, andseek to develop our non-interest income streams through complementary business lines.1) Based on United States Census Bureau data. 2) Non-GAAP measure; see reconciliation on page 28.Total Assets: $2.36 billion 1Q22 Net Income: $3.1 millionGross Loans: $1.53 billion LTM Pre-Tax, Pre-Provision Income:2$20.9 millionTotal Deposits: $2.10 billion YTD Net InterestMargin2.79%Wealth MgmtAssets UnderManagement:$834.9 million DilutedEarnings Per Share$0.32Financial Highlights (1Q22) 30LocationsFounded in18644

Attractive Footprint & Market ShareSource: FDIC Summary of Deposits. Deposit data as of June 30, 2021 (most recent information).• #2 market position by deposits in York County, Pennsylvania, with a 14.5% market share (out of 15banks that report deposit data); #1 market position for banks under $100 billion in assets.• Strategic focus is on maximizing presence in our existing market area while expanding into adjacent andcontiguous markets where we can differentiate ourselves from competitors and grow market share.DepositMarket Share by County:June 30, 2021MarketCounty Share (%)PennsylvaniaYork 14.5Lancaster 0.6Cumberland 0.2MarylandBaltimore City 0.1Baltimore County 0.9Harford 1.75
Recent Developments• In September 2021, recognized as 2021 Readers’ Choice for Best Mortgage Lender byreaders of Hanover Evening Sun.• In September 2021, PeoplesBank received the Outstanding Community Service Award byThe Salvation Army York Citadel.• In July 2021, Wealth Management Division recognized as Pohl Consulting and Training, Inc.Top Performer.• In May 2021, recognized as 2021 Best of the Best in two categories Best Bank and BestMortgage Lender by readers of York Daily Record.6

Strategic Focus Quarterly HighlightsAttractIncrease Top of Mind Awareness (TOMA)through branding efforts resulting in thebank moving from #28 to #12 in TOMA from2019 to 2021.*RecruitAttract more applicants through newemployment brand strategy that includesenhanced digital recruitment and 1:1candidate marketing approaches thatlaunched late 2021.DevelopRecruited five college interns to participatein a summer internship program to exposefuture leaders to the banking profession andemployment opportunities at PeoplesBank.Build Deeper Relationships• Announced Everyday Rewards+ credit card inDecember 2021 resulting in 28% growth in creditcard sales in 1Q22, surpassing Q1 goals• A new PeoplesBank Vision Board experiencelaunched in all markets in 3Q21, resulting in morethan 840 completed vision boards in 1Q22providing numerous opportunities to deepenrelationships with consumer and business clientsGrow Fee Income• Launched 3 portfolio niche mortgage products in Q1 –Physician Preferred Mortgage, Entrepreneurial Mortgage,and the Private Banking & Private Wealth Mortgage• Total Business Solutions revenue up 14.3% over samequarter in 2021• $1.49 million in revenue in 1Q22 from WealthManagement with $835 million in assets undermanagementOptimize Delivery Channels• Opened the new Hunt Valley Connections Center inFebruary 2022 to grow and better serve business, wealthand retail clients in the Maryland market• Announced closure of the Gardenville Financial Center tooccur in 2Q22• Closed Young Manor Business Banking Center in 1Q22• 125 online mortgage applications received in first fullquarter of offering this new online capability in 1Q22• Increased mobile deposit adoption from 11% to 16% in1Q22 with a mobile deposit promotion7Integrated Recruitment and Performance ManagementBank of Choice• Developed new small business products withstreamlined underwriting to launch in 2Q22 via anonline application that an be completed in as little as15 minutes. Electronic signatures will be available forsome online products to expedite the process.* Based on market research studies conducted in 2019 and 2021 by Lepson Research

8Technology: Poised to Move Forward• Most critical client-impacting platforms overhauled in last 4 years• Committed to delivering relevant, innovative and convenient solutions• Highly competitive digital banking platform – high Net Promoter Score (NPS) of 43• Mobile first mindset; strong relationships with Fintech partners• Agile application landscape – transitioned to remote work in 24 hours with no servicedisruption• Driving transactional volumes to lower cost digital channels – online banking reachedrecord client engagement in 1Q22• Augmenting business analytics with artificial intelligence to enhance actionable data• Leveraging return-based project prioritization framework to maximize ROE• Driving down client acquisition costs and loan processing cycle times through systemintegration• Flexible, inclusive and human-centric designed work environment• Implemented a new loan origination platform (nCino) – manual touch pointsreduced by 30%• Simplifying technology landscape through system consolidation and optimization• Leveraging Robotic Process Automation (RPA) to elevate operational productivity• Robust project portfolio management framework to improve business valuedelivery• Forward-looking, but fast follower technology adopters• Enhancing fraud monitoring, threat detection and incident tracking with the use ofartificial intelligence and predictive analytics tools• Instituted a comprehensive, bank-wide Vendor Risk Management program• Technical infrastructure positioned to easily scale and support 2x asset sizeRelevant,Convenientand QualityClientExperienceAccelerateProfitableGrowthEffectiveandEfficientOperationsReduceBusinessRisk

Key Technology Partners9
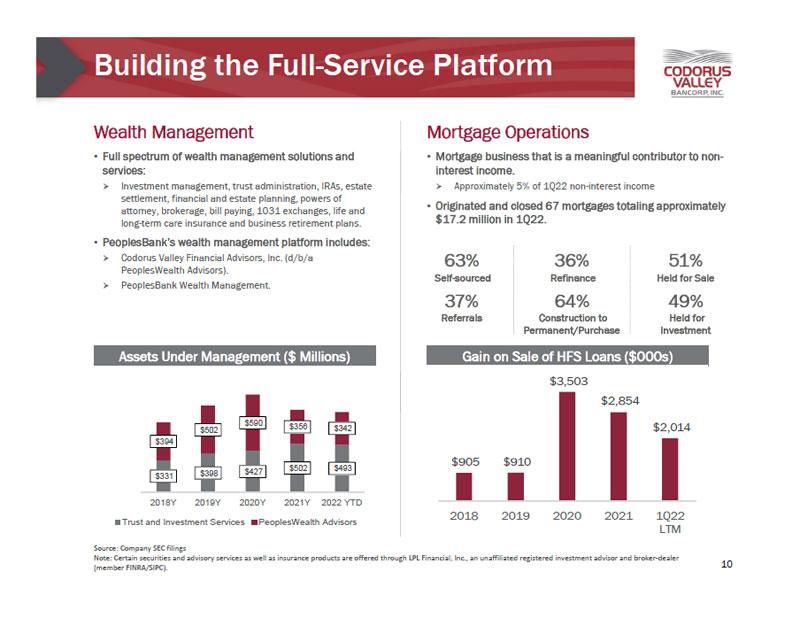
• Full spectrum of wealth management solutions andservices:» Investment management, trust administration, IRAs, estatesettlement, financial and estate planning, powers ofattorney, brokerage, bill paying, 1031 exchanges, life andlong-term care insurance and business retirement plans.• PeoplesBank’s wealth management platform includes:» Codorus Valley Financial Advisors, Inc. (d/b/aPeoplesWealth Advisors).» PeoplesBank Wealth Management.Building the Full-Service PlatformAssets Under Management ($ Millions)Source: Company SEC filingsNote: Certain securities and advisory services as well as insurance products are offered through LPL Financial, Inc., an unaffiliated registered investment advisor and broker-dealer(member FINRA/SIPC).Gain on Sale of HFS Loans ($000s)• Mortgage business that is a meaningful contributor to noninterestincome.» Approximately 5% of 1Q22 non-interest income• Originated and closed 67 mortgages totaling approximately$17.2 million in 1Q22.Wealth Management Mortgage Operations1063%Self-sourced37%Referrals64%Construction toPermanent/Purchase36%Refinance49%Held forInvestment51%Held for Sale$331 $398 $427 $502 $493$394$502$590 $356 $342$-$200$400$600$800$1,000$1,2002018Y 2019Y 2020Y 2021Y 2022 YTDTrust and Investment Services PeoplesWealth Advisors$905 $910$3,503$2,854$2,0142018 2019 2020 2021 1Q22LTM
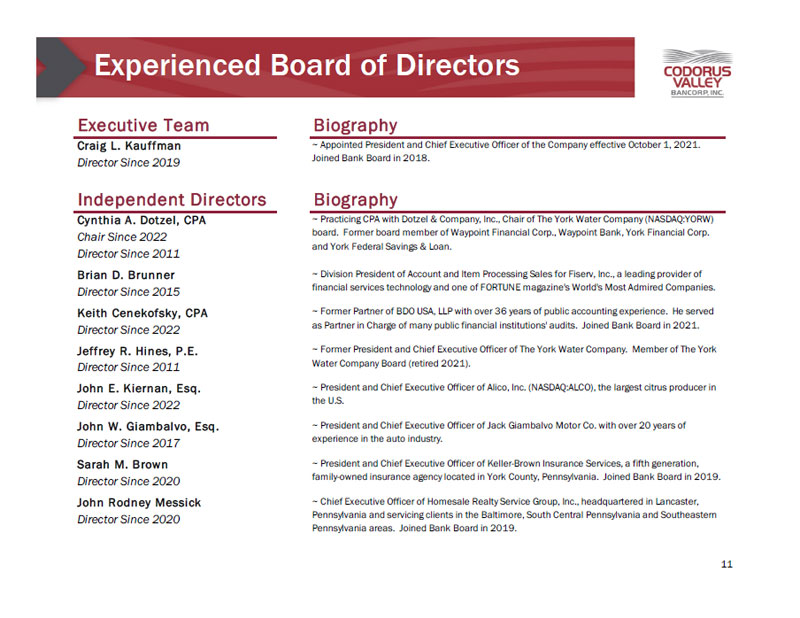
Experienced Board of Directors11Executive Team BiographyCraig L. KauffmanDirector Since 2019~ Appointed President and Chief Executive Officer of the Company effective October 1, 2021.Joined Bank Board in 2018.Independent Directors BiographyCynthia A. Dotzel, CPAChair Since 2022Director Since 2011~ Practicing CPA with Dotzel & Company, Inc., Chair of The York Water Company (NASDAQ:YORW)board. Former board member of Waypoint Financial Corp., Waypoint Bank, York Financial Corp.and York Federal Savings & Loan.Brian D. BrunnerDirector Since 2015~ Division President of Account and Item Processing Sales for Fiserv, Inc., a leading provider offinancial services technology and one of FORTUNE magazine's World's Most Admired Companies.Keith Cenekofsky, CPADirector Since 2022~ Former Partner of BDO USA, LLP with over 36 years of public accounting experience. He servedas Partner in Charge of many public financial institutions' audits. Joined Bank Board in 2021.Jeffrey R. Hines, P.E.Director Since 2011~ Former President and Chief Executive Officer of The York Water Company. Member of The YorkWater Company Board (retired 2021).John E. Kiernan, Esq.Director Since 2022~ President and Chief Executive Officer of Alico, Inc. (NASDAQ:ALCO), the largest citrus producer inthe U.S.John W. Giambalvo, Esq.Director Since 2017~ President and Chief Executive Officer of Jack Giambalvo Motor Co. with over 20 years ofexperience in the auto industry.Sarah M. BrownDirector Since 2020~ President and Chief Executive Officer of Keller-Brown Insurance Services, a fifth generation,family-owned insurance agency located in York County, Pennsylvania. Joined Bank Board in 2019.John Rodney MessickDirector Since 2020~ Chief Executive Officer of Homesale Realty Service Group, Inc., headquartered in Lancaster,Pennsylvania and servicing clients in the Baltimore, South Central Pennsylvania and SoutheasternPennsylvania areas. Joined Bank Board in 2019.

Experienced Leadership Team12Executive BiographyCraig L. KauffmanPresident and Chief Executive OfficerOctober 2021 - PresentDirector Since 2019 (Joined Bank Board in 2018)~ A graduate of Millersville University and Penn State Harrisburg, Craig isPresident and Chief Executive Officer of the Bank and the Company. He hasserved as Director, Chief Executive Officer and President of PeoplesBanksince August 2018 and Director of the Company since September 2019. Hepreviously served as Regional President of BB&T Bank, and prior to that heldvarious executive positions with Susquehanna Bank, PNC Bank and SterlingFinancial Corporation.Larry D. PickettExecutive Vice President, Chief Financial OfficerAugust 2018 - Present~ A graduate of Towson University, Larry is Chief Financial Officer of the Bankand Treasurer of the Company. Previously, he was employed by Bay Bank inColumbia, Maryland as Executive Vice President and Chief Financial Officerand prior to that, he held similar roles at Susquehanna Bank and FairfaxSavings.Diane E. Baker, CPAExecutive Vice President, Chief Risk OfficerFebruary 2018 - PresentJoined Bank in 1995~ A graduate of Franklin & Marshall College and Stonier School of Banking,Diane is Executive Vice President, Chief Risk Officer of the Bank and VicePresident, Assistant Treasurer and Assistant Secretary of the Company. Shepreviously served as Senior Vice President and Enterprise Risk ManagementOfficer and Chief Operations Officer.Timothy J. Nieman, Esq.Secretary and General CounselJanuary 2018 - Present~ A graduate of Muskingum College and the University of Virginia School ofLaw, Tim is Secretary and General Counsel of the Bank and of the Company.He has over 28 years of legal experience predominantly in the financialservices industry, and he was most recently a Partner in the Harrisburg lawfirm, Rhoads & Sinon LLP.
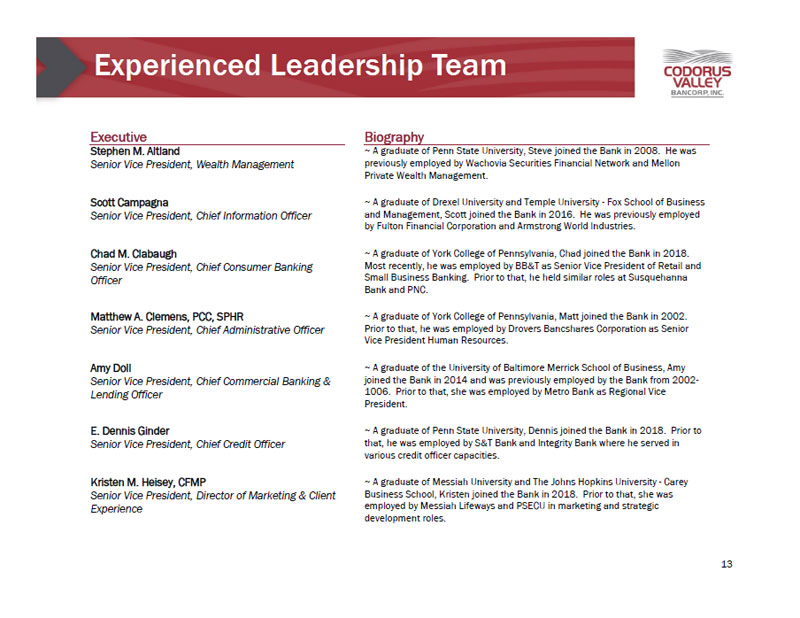
Experienced Leadership Team13Executive BiographyStephen M. AltlandSenior Vice President, Wealth Management~ A graduate of Penn State University, Steve joined the Bank in 2008. He waspreviously employed by Wachovia Securities Financial Network and MellonPrivate Wealth Management.Scott CampagnaSenior Vice President, Chief Information Officer~ A graduate of Drexel University and Temple University - Fox School of Businessand Management, Scott joined the Bank in 2016. He was previously employedby Fulton Financial Corporation and Armstrong World Industries.Chad M. ClabaughSenior Vice President, Chief Consumer BankingOfficer~ A graduate of York College of Pennsylvania, Chad joined the Bank in 2018.Most recently, he was employed by BB&T as Senior Vice President of Retail andSmall Business Banking. Prior to that, he held similar roles at SusquehannaBank and PNC.Matthew A. Clemens, PCC, SPHRSenior Vice President, Chief Administrative Officer~ A graduate of York College of Pennsylvania, Matt joined the Bank in 2002.Prior to that, he was employed by Drovers Bancshares Corporation as SeniorVice President Human Resources.Amy DollSenior Vice President, Chief Commercial Banking &Lending Officer~ A graduate of the University of Baltimore Merrick School of Business, Amyjoined the Bank in 2014 and was previously employed by the Bank from 2002-1006. Prior to that, she was employed by Metro Bank as Regional VicePresident.E. Dennis GinderSenior Vice President, Chief Credit Officer~ A graduate of Penn State University, Dennis joined the Bank in 2018. Prior tothat, he was employed by S&T Bank and Integrity Bank where he served invarious credit officer capacities.Kristen M. Heisey, CFMPSenior Vice President, Director of Marketing & ClientExperience~ A graduate of Messiah University and The Johns Hopkins University - CareyBusiness School, Kristen joined the Bank in 2018. Prior to that, she wasemployed by Messiah Lifeways and PSECU in marketing and strategicdevelopment roles.
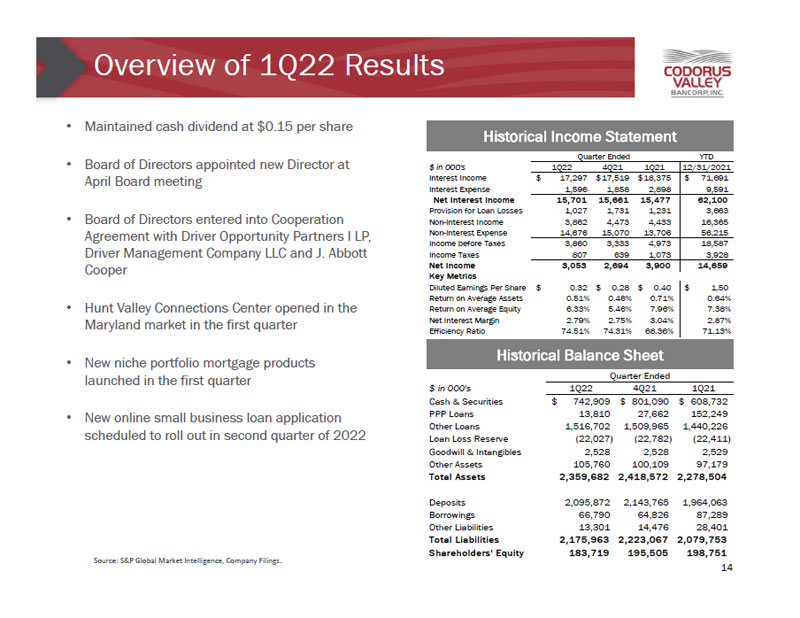
Overview of 1Q22 Results• Maintained cash dividend at $0.15 per share• Board of Directors appointed new Director atApril Board meeting• Board of Directors entered into CooperationAgreement with Driver Opportunity Partners I LP,Driver Management Company LLC and J. AbbottCooper• Hunt Valley Connections Center opened in theMaryland market in the first quarter• New niche portfolio mortgage productslaunched in the first quarter• New online small business loan applicationscheduled to roll out in second quarter of 2022Source: S&P Global Market Intelligence, Company Filings.Historical Income Statement14Historical Balance Sheet$ in 000's 1Q22 4Q21 1Q21Cash & Securities $ 742,909 $ 801,090 $ 608,732PPP Loans 13,810 27,662 152,249Other Loans 1,516,702 1,509,965 1,440,226Loan Loss Reserve (22,027) (22,782) (22,411)Goodwill & Intangibles 2,528 2,528 2,529Other Assets 105,760 100,109 97,179Total Assets 2,359,682 2,418,572 2,278,504Deposits 2,095,872 2,143,765 1,964,063Borrowings 66,790 64,826 87,289Other Liabilities 13,301 14,476 28,401Total Liabilities 2,175,963 2,223,067 2,079,753Shareholders' Equity 183,719 195,505 198,751Quarter EndedYTD$ in 000's 1Q22 4Q21 1Q21 12/31/2021Interest Income $ 17,297 $ 17,519 $ 18,375 $ 71,691Interest Expense 1,596 1,858 2,898 9,591Net Interest Income 15,701 15,661 15,477 62,100Provision for Loan Losses 1,027 1,731 1,231 3,663Non-Interest Income 3,862 4,473 4,433 16,365Non-Interest Expense 14,676 15,070 13,706 56,215Income before Taxes 3,860 3,333 4,973 18,587Income Taxes 807 639 1,073 3,928Net Income 3,053 2,694 3,900 14,659Key MetricsDiluted Earnings Per Share $ 0.32 $ 0.28 $ 0.40 $ 1.50Return on Average Assets 0.51% 0.46% 0.71% 0.64%Return on Average Equity 6.33% 5.46% 7.96% 7.38%Net Interest Margin 2.79% 2.75% 3.04% 2.87%Efficiency Ratio 74.51% 74.31% 68.36% 71.13%Quarter Ended
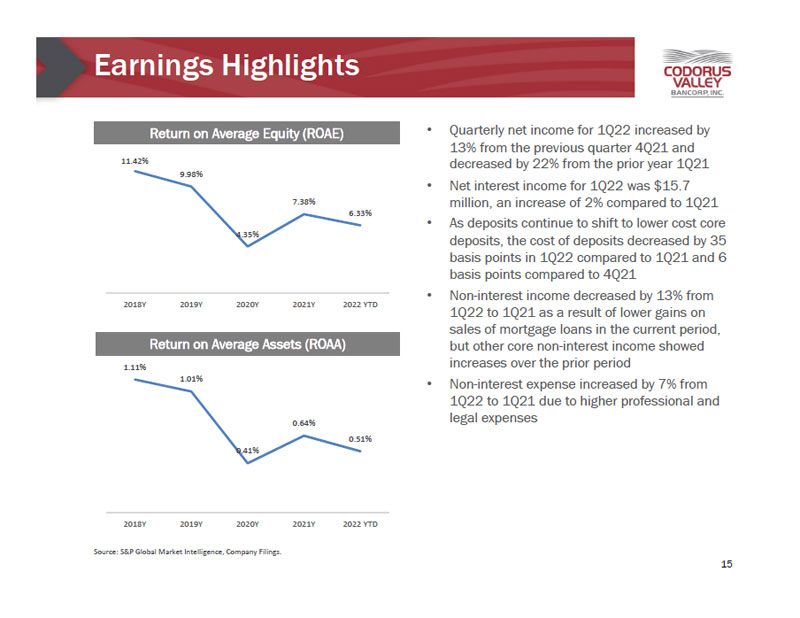
Earnings HighlightsSource: S&P Global Market Intelligence, Company Filings.• Quarterly net income for 1Q22 increased by13% from the previous quarter 4Q21 anddecreased by 22% from the prior year 1Q21• Net interest income for 1Q22 was $15.7million, an increase of 2% compared to 1Q21• As deposits continue to shift to lower cost coredeposits, the cost of deposits decreased by 35basis points in 1Q22 compared to 1Q21 and 6basis points compared to 4Q21• Non-interest income decreased by 13% from1Q22 to 1Q21 as a result of lower gains onsales of mortgage loans in the current period,but other core non-interest income showedincreases over the prior period• Non-interest expense increased by 7% from1Q22 to 1Q21 due to higher professional andlegal expensesReturn on Average Equity (ROAE)Return on Average Assets (ROAA)1511.42%9.98%4.35%7.38%6.33%2018Y 2019Y 2020Y 2021Y 2022 YTD1.11%1.01%0.41%0.64%0.51%2018Y 2019Y 2020Y 2021Y 2022 YTD
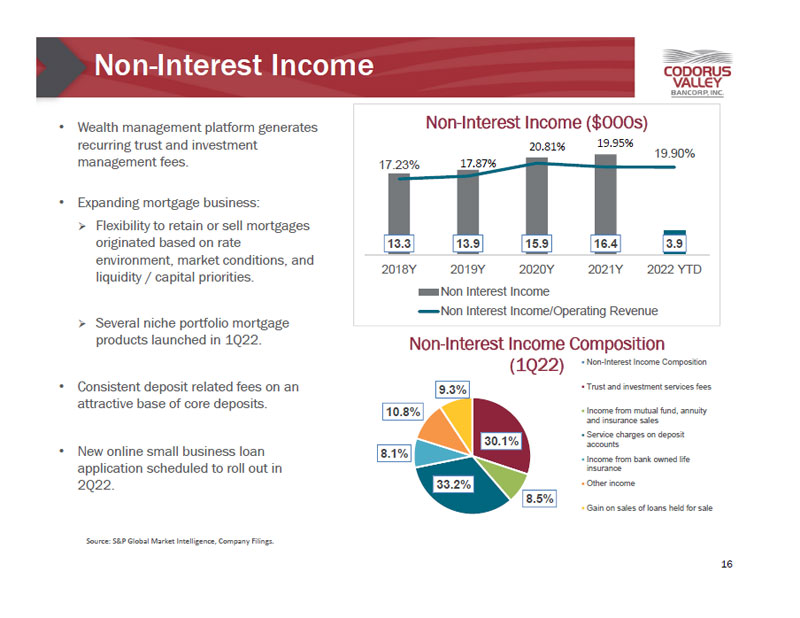
Non-Interest Income• Wealth management platform generatesrecurring trust and investmentmanagement fees.• Expanding mortgage business:» Flexibility to retain or sell mortgagesoriginated based on rateenvironment, market conditions, andliquidity / capital priorities.» Several niche portfolio mortgageproducts launched in 1Q22.• Consistent deposit related fees on anattractive base of core deposits.• New online small business loanapplication scheduled to roll out in2Q22.Source: S&P Global Market Intelligence, Company Filings.1630.1%8.5%33.2%8.1%10.8%9.3%Non-Interest Income Composition(1Q22) Non-Interest Income CompositionTrust and investment services feesIncome from mutual fund, annuityand insurance salesService charges on depositaccountsIncome from bank owned lifeinsuranceOther incomeGain on sales of loans held for sale13.3 13.9 15.9 16.4 3.917.23% 17.87%20.81% 19.95%19.90%2018Y 2019Y 2020Y 2021Y 2022 YTDNon-Interest Income ($000s)Non Interest IncomeNon Interest Income/Operating Revenue
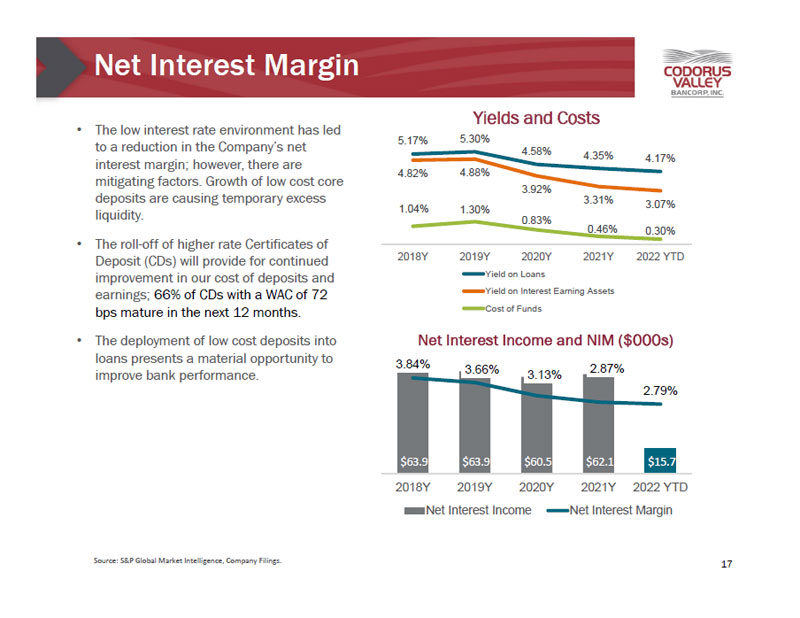
Net Interest MarginSource: S&P Global Market Intelligence, Company Filings.• The low interest rate environment has ledto a reduction in the Company’s netinterest margin; however, there aremitigating factors. Growth of low cost coredeposits are causing temporary excessliquidity.• The roll-off of higher rate Certificates ofDeposit (CDs) will provide for continuedimprovement in our cost of deposits andearnings; 66% of CDs with a WAC of 72bps mature in the next 12 months.• The deployment of low cost deposits intoloans presents a material opportunity toimprove bank performance.175.17% 5.30%4.58% 4.35% 4.17%4.82% 4.88%3.92%3.31% 1.04% 1.30% 3.07%0.83%0.46% 0.30%2018Y 2019Y 2020Y 2021Y 2022 YTDYields and CostsYield on LoansYield on Interest Earning AssetsCost of Funds$63.9 $63.9 $60.5 $62.1 $15.73.84% 3.66% 3.13% 2.87%2.79%2018Y 2019Y 2020Y 2021Y 2022 YTDNet Interest Income and NIM ($000s)Net Interest Income Net Interest Margin

CD Repricing OpportunitiesSource: Company Filings.• Approximately 66% of CDs will reprice within the next 12 months.» This repricing benefits the Bank’s cost of deposits in the low interest-rate environment.• The total weighted-average rate on CDs at March 31, 2022 is 0.65%.• Average rates based on maturity date are as follows:» Maturing within the next 3 months: 0.82%» Maturing within 3 to 12 months: 0.42%» Maturing between 1 and 5 years: 0.72%Certificates of Deposit Repricing Timeline ($000s): Remaining Months Until Maturity18$ 68,511$ 219,361$ 145,807$ 497< 3 Months 3 - 12 Months 1 - 5 Years > 5 Years

Interest Rate Sensitivity Profile4Q21 Δ Net Interest Income Sensitivity to IR Shocks 2021Y Δ NII vs. Peer (+100 Shock)(1)(2)• Highly asset sensitive balance sheet benefits theCompany in a rising rate environment.19
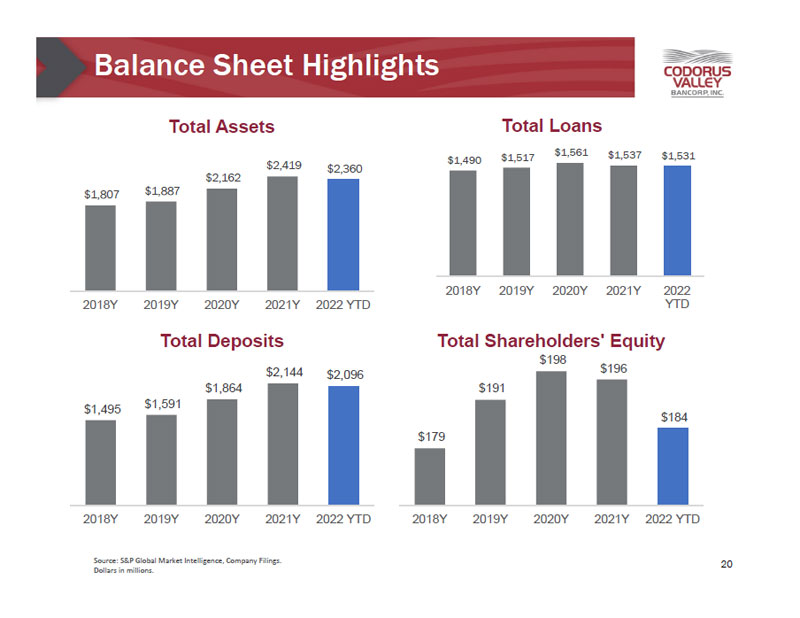
Balance Sheet HighlightsSource: S&P Global Market Intelligence, Company Filings.Dollars in millions. 20$1,807 $1,887$2,162$2,419 $2,3602018Y 2019Y 2020Y 2021Y 2022 YTDTotal Assets$1,490 $1,517 $1,561 $1,537 $1,531$500$700$900$1,100$1,300$1,500$1,7002018Y 2019Y 2020Y 2021Y 2022YTDTotal Loans$1,495 $1,591$1,864$2,144 $2,0962018Y 2019Y 2020Y 2021Y 2022 YTDTotal Deposits$179$191$198 $196$1842018Y 2019Y 2020Y 2021Y 2022 YTDTotal Shareholders' Equity
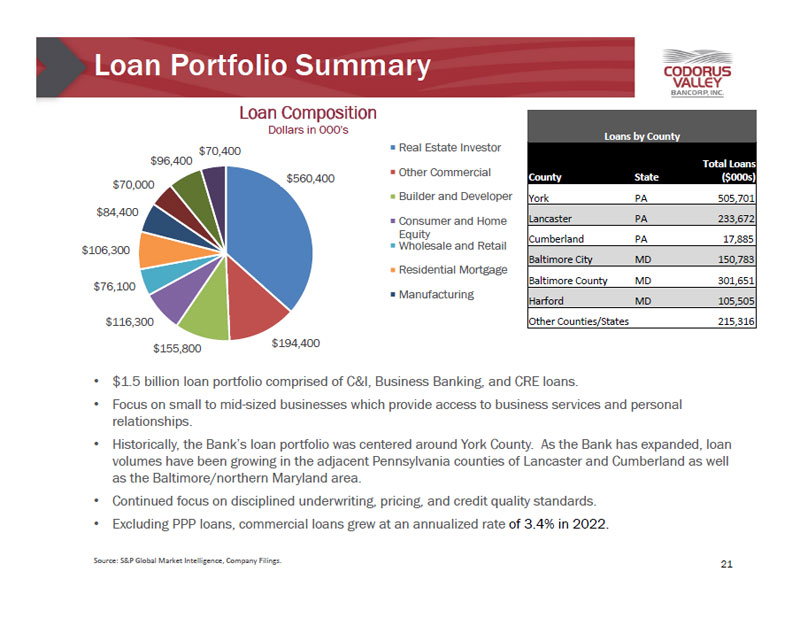
Loan Portfolio Summary• $1.5 billion loan portfolio comprised of C&I, Business Banking, and CRE loans.• Focus on small to mid-sized businesses which provide access to business services and personalrelationships.• Historically, the Bank’s loan portfolio was centered around York County. As the Bank has expanded, loanvolumes have been growing in the adjacent Pennsylvania counties of Lancaster and Cumberland as wellas the Baltimore/northern Maryland area.• Continued focus on disciplined underwriting, pricing, and credit quality standards.• Excluding PPP loans, commercial loans grew at an annualized rate of 3.4% in 2022.Source: S&P Global Market Intelligence, Company Filings. 21Loans by CountyCounty StateTotal Loans($000s)York PA 505,701Lancaster PA 233,672Cumberland PA 17,885Baltimore City MD 150,783Baltimore County MD 301,651Harford MD 105,505Other Counties/States 215,316$560,400$155,800 $194,400$116,300$76,100$106,300$84,400$70,000$96,400$70,400Loan CompositionDollars in 000'sReal Estate InvestorOther CommercialBuilder and DeveloperConsumer and HomeEquityWholesale and RetailResidential MortgageManufacturing
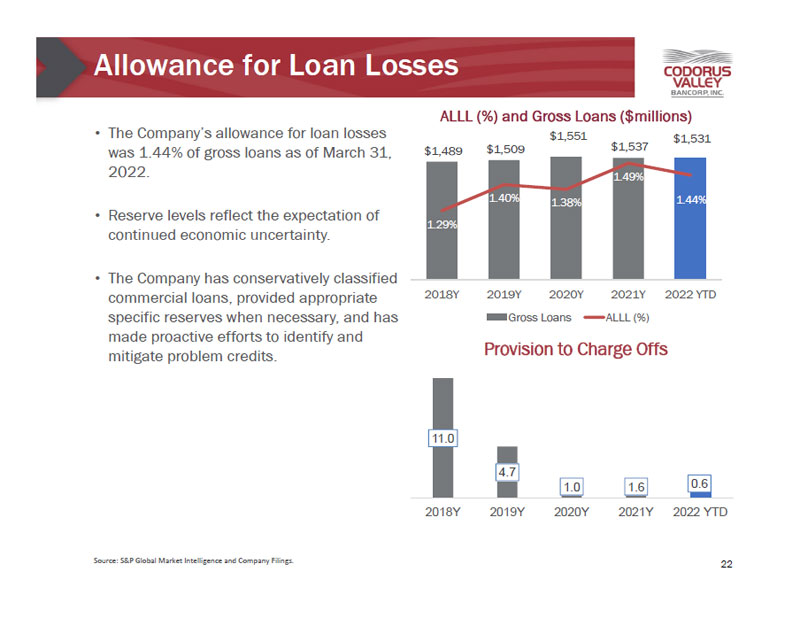
Allowance for Loan LossesSource: S&P Global Market Intelligence and Company Filings.• The Company’s allowance for loan losseswas 1.44% of gross loans as of March 31,2022.• Reserve levels reflect the expectation ofcontinued economic uncertainty.• The Company has conservatively classifiedcommercial loans, provided appropriatespecific reserves when necessary, and hasmade proactive efforts to identify andmitigate problem credits.2211.04.71.0 1.6 0.62018Y 2019Y 2020Y 2021Y 2022 YTDProvision to Charge Offs$1,489 $1,509$1,551$1,537$1,5311.29%1.40% 1.38%1.49%1.44%2018Y 2019Y 2020Y 2021Y 2022 YTDALLL (%) and Gross Loans ($millions)Gross Loans ALLL (%)
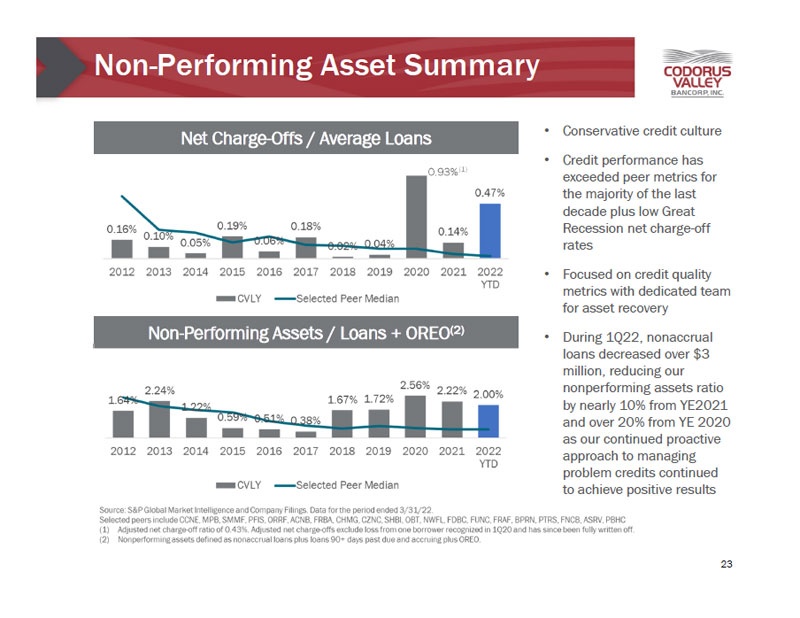
Non-Performing Asset SummaryNet Charge-Offs / Average LoansNon-Performing Assets / Loans + OREO(2)0.93%(1)• Conservative credit culture• Credit performance hasexceeded peer metrics forthe majority of the lastdecade plus low GreatRecession net charge-offrates• Focused on credit qualitymetrics with dedicated teamfor asset recovery• During 1Q22, nonaccrualloans decreased over $3million, reducing ournonperforming assets ratioby nearly 10% from YE2021and over 20% from YE 2020as our continued proactiveapproach to managingproblem credits continuedto achieve positive results23
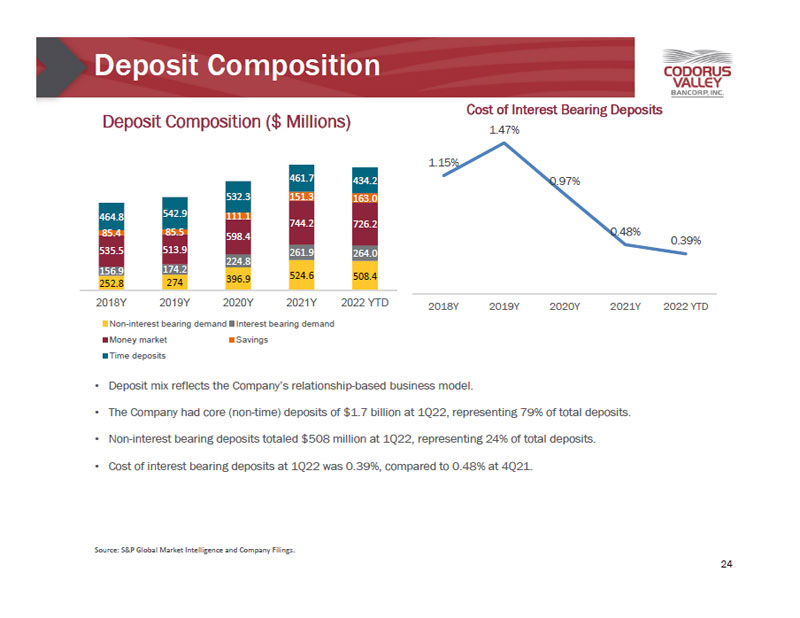
Deposit CompositionSource: S&P Global Market Intelligence and Company Filings.• Deposit mix reflects the Company’s relationship-based business model.• The Company had core (non-time) deposits of $1.7 billion at 1Q22, representing 79% of total deposits.• Non-interest bearing deposits totaled $508 million at 1Q22, representing 24% of total deposits.• Cost of interest bearing deposits at 1Q22 was 0.39%, compared to 0.48% at 4Q21.24252.8 274 396.9 156.9 174.2 524.6 508.4224.8535.5 513.9 261.9 264.0598.4744.2 726.285.4 85.5111.1151.3 163.0464.8 542.9532.3461.7 434.2050010001500200025002018Y 2019Y 2020Y 2021Y 2022 YTDDeposit Composition ($ Millions)Non-interest bearing demand Interest bearing demandMoney market SavingsTime deposits1.15%1.47%0.97%0.48%0.39%2018Y 2019Y 2020Y 2021Y 2022 YTDCost of Interest Bearing Deposits
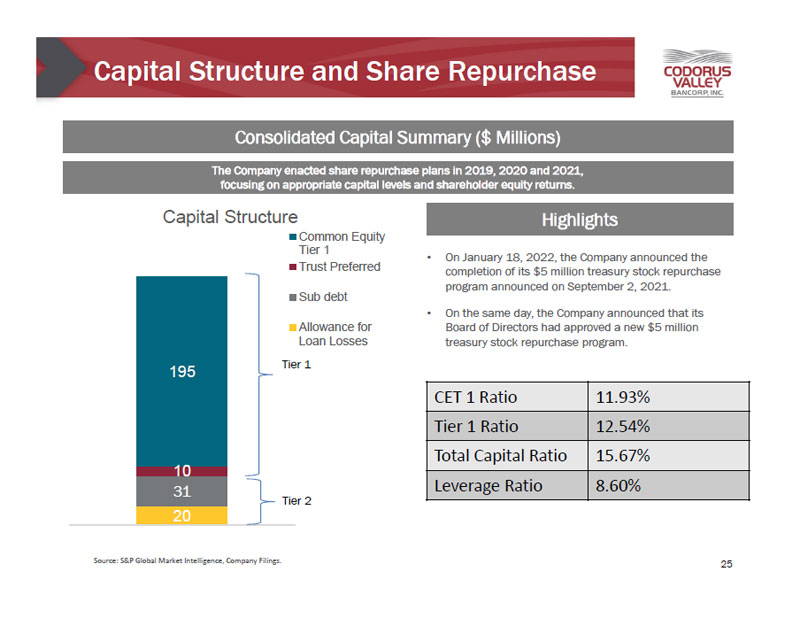
Capital Structure and Share RepurchaseConsolidated Capital Summary ($ Millions)Source: S&P Global Market Intelligence, Company Filings.The Company enacted share repurchase plans in 2019, 2020 and 2021,focusing on appropriate capital levels and shareholder equity returns.• On January 18, 2022, the Company announced thecompletion of its $5 million treasury stock repurchaseprogram announced on September 2, 2021.• On the same day, the Company announced that itsBoard of Directors had approved a new $5 milliontreasury stock repurchase program.Highlights25CET 1 Ratio 11.93%Tier 1 Ratio 12.54%Total Capital Ratio 15.67%Leverage Ratio 8.60%203110195Capital StructureCommon EquityTier 1Trust PreferredSub debtAllowance forLoan LossesTier 1Tier 2
Appendix
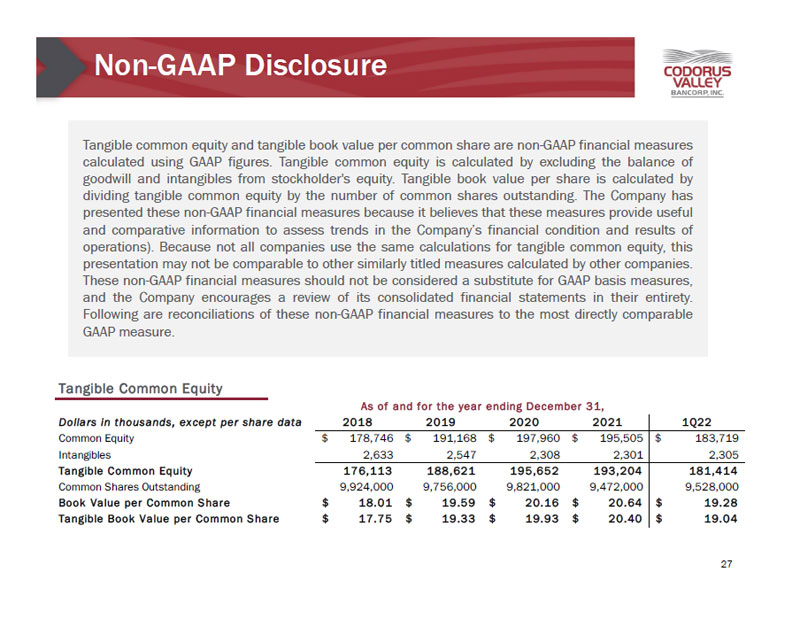
Non-GAAP DisclosureTangible common equity and tangible book value per common share are non-GAAP financial measurescalculated using GAAP figures. Tangible common equity is calculated by excluding the balance ofgoodwill and intangibles from stockholder's equity. Tangible book value per share is calculated bydividing tangible common equity by the number of common shares outstanding. The Company haspresented these non-GAAP financial measures because it believes that these measures provide usefuland comparative information to assess trends in the Company’s financial condition and results ofoperations). Because not all companies use the same calculations for tangible common equity, thispresentation may not be comparable to other similarly titled measures calculated by other companies.These non-GAAP financial measures should not be considered a substitute for GAAP basis measures,and the Company encourages a review of its consolidated financial statements in their entirety.Following are reconciliations of these non-GAAP financial measures to the most directly comparableGAAP measure.27Tangible Common EquityDollars in thousands, except per share data 2018 2019 2020 2021 1Q22Common Equity $ 178,746 $ 1 91,168 $ 197,960 $ 1 95,505 $ 1 83,719Intangibles 2,633 2,547 2,308 2,301 2,305Tangible Common Equity 176,113 188,621 195,652 193,204 181,414Common Shares Outstanding 9,924,000 9,756,000 9 ,821,000 9 ,472,000 9 ,528,000Book Value per Common Share $ 18.01 $ 19.59 $ 20.16 $ 20.64 $ 19.28Tangible Book Value per Common Share $ 17.75 $ 19.33 $ 19.93 $ 20.40 $ 19.04As of and for the year ending December 31,
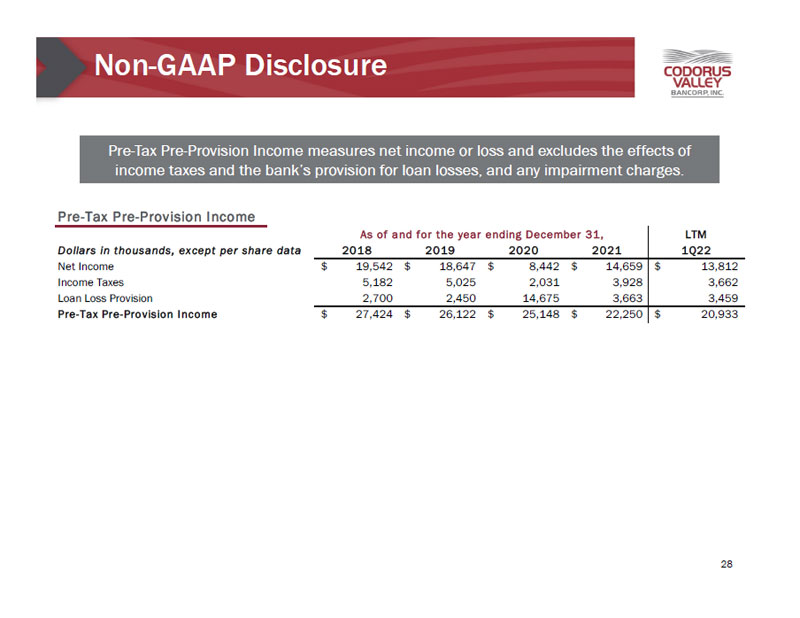
Non-GAAP DisclosurePre-Tax Pre-Provision Income measures net income or loss and excludes the effects ofincome taxes and the bank’s provision for loan losses, and any impairment charges.28Pre-Tax Pre-Provision IncomeLTMDollars in thousands, except per share data 2018 2019 2020 2021 1Q22Net Income $ 19,542 $ 18,647 $ 8,442 $ 14,659 $ 13,812Income Taxes 5,182 5,025 2,031 3,928 3,662Loan Loss Provision 2,700 2,450 14,675 3,663 3,459Pre-Tax Pre-Provision Income $ 27,424 $ 26,122 $ 25,148 $ 22,250 $ 20,933As of and for the year ending December 31,