Exhibit 99.1
Investor Presentation NASDAQ: CVLY As of and for the period ended December 31, 2022 u nless otherwise noted.
Safe Harbor Notice Regarding Forward - Looking Statements This presentation contains forward - looking statements about Codorus Valley Bancorp, Inc. (also referred to herein as the “Corporation”) that are intended to be covered by the safe harbor for forward - looking statements provided by the Private Securities Litigation Reform Act of 1995. For ward - looking statements are not historical facts. Such forward - looking statements include, but are not limited to, discussions of strategy, financial projection s and estimates and their underlying assumptions; statements regarding plans, objectives, goals, expectations or consequences; and statements about future perform anc e, operations, products and services of the Corporation and its subsidiaries. These statements typically can be identified by the use of forward - looking ter minology such as “believe,” “expect,” “estimate,” “potential,” “may,” “will,” “should,” “project,” “position,” “plan,” “seek,” “strive to,” “intend,” “anticipate,” “p ossible” or similar terminology. Many factors, including those described below or elsewhere in this presentation, could affect the future financial results of th e Corporation and its subsidiaries, both individually and collectively, and could cause actual results to differ materially from those expressed in the forward - look ing statements contained or incorporated by reference in this presentation. Actual results could differ materially from those indicated in forward - looking statements due to, among others, the following factors: general economic conditions; the scope and duration of the on - going COVID - 19 pandemic; the effects of the COVID - 19 pandemic, including on the Corporation’s c redit quality and operations as well as its impact on general economic conditions; legislative and regulatory changes including actions taken by governmental au thorities in response to the COVID - 19 pandemic; monetary and fiscal policies of the federal government; the effects of changes in accounting policies and pra ctices, as may be adopted by the regulatory agencies, as well as the Financial Accounting Standards Board and other accounting standard setters; changes i n m arket interest rates; the persistence of the current inflationary environment in the U.S. and our market areas; the uncertain impact of new laws and re gul ations; ineffectiveness of the Corporation’s business strategy due to changes in the current or future market conditions; changes in deposit flows, the cost of funds, demand for loan products and the demand for financial services, in each case as may be affected by the COVID - 19 pandemic; competition; market volatility, market downturns, changes in consumer behavior, business closures; adverse changes in the quality or composition of the Corporation’s loan, investment and mo rtgage - backed securities portfolios; geographic concentration of the Corporation’s business; fluctuations in real estate values; the adequacy of loan los s reserves; deterioration in the credit quality of borrowers; the Company’s ability to retain key personnel; failure or disruption of the Corporation’s inform ati on systems; failure or circumvention of our internal controls; changes in government regulation and supervision; occurrence of natural or man - made disasters or calamiti es, including health emergencies, the spread of infectious diseases, epidemics or pandemics, an outbreak or escalation of hostilities or other geo pol itical instabilities, the effects of climate change or extraordinary events beyond the Corporation’s control, and the Corporation’s ability to deal effectively wi th disruptions caused by the foregoing; and other economic, competitive, governmental and technological factors affecting the Corporation’s operations, markets, prod uct s, services and fees . Additional factors that may affect forward - looking statements made in this presentation can be found in the Corporation’s Quarte rly Reports on Forms 10 - Q and its Annual Report on Form 10 - K, filed with the Securities and Exchange Commission (“SEC”) and available on the Corporation’s web site at www.peoplesbanknet.com and on the SEC’s website at www.sec.gov. We include web addresses here as inactive textual references onl y. Information on these websites is not part of this presentation. Forward - looking statements in this presentation speak only as of the date of this pre sentation, and the Corporation does not commit to revise or update such statements to reflect changes that occur after the date of this presentation. Annualized , p ro forma, projected and estimated numbers are used for illustrative purposes only, are not forecasts and may not reflect actual results. The Corporation uses certain non - GAAP (Generally Accepted Accounting Principles) financial measures in this presentation. The C orporation’s management believes that the supplemental non - GAAP information included in this presentation is utilized by market analysts and others to e valuate the Corporation’s financial condition and results of operations and, therefore, such information is useful to investors. These measures have li mit ations as analytical tools and should not be considered a substitute for analysis of results under GAAP. These non - GAAP financial measures are reconciled to th e most comparable measures at the end of this presentation. 2
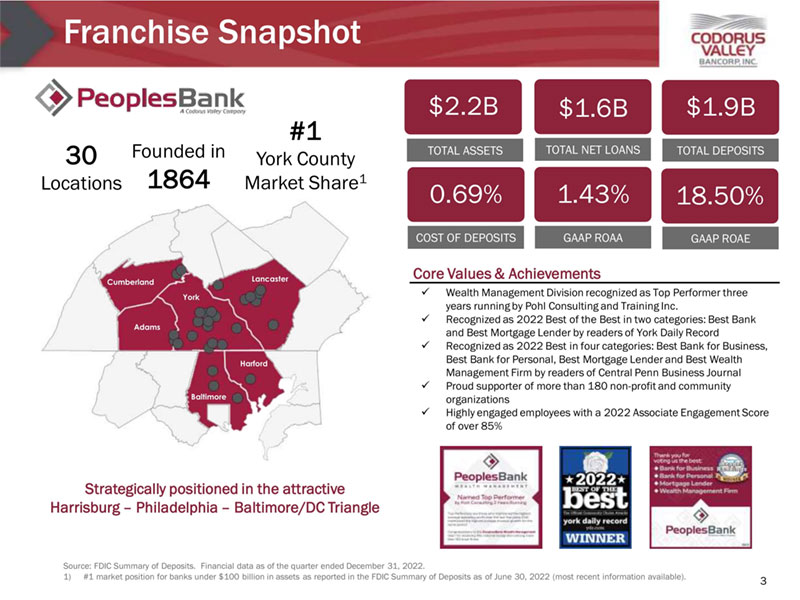
Franchise Snapshot Source: FDIC Summary of Deposits. Financial data as of the quarter ended December 31, 2022. 1) #1 market position for banks under $100 billion in assets as reported in the FDIC Summary of Deposits as of June 30, 2022 (most recent information available). 3 30 Locations Founded in 1864 #1 York County Market Share 1 Strategically positioned in the attractive Harrisburg – Philadelphia – Baltimore/DC Triangle $2.2B TOTAL ASSETS TOTAL NET LOANS TOTAL DEPOSITS $1.9B $1.6B 18.50% 1.43% 0.69% COST OF DEPOSITS GAAP ROAA GAAP ROAE Core Values & Achievements x Wealth Management Division recognized as Top Performer three years running by Pohl Consulting and Training Inc. x Recognized as 2022 Best of the Best in two categories: Best Bank and Best Mortgage Lender by readers of York Daily Record x Recognized as 2022 Best in four categories: Best Bank for Business, Best Bank for Personal, Best Mortgage Lender and Best Wealth Management Firm by readers of Central Penn Business Journal x Proud supporter of more than 180 non - profit and community organizations x Highly engaged employees with a 2022 Associate Engagement Score of over 85% Cumberland Adams York Lancaster Harford Baltimore
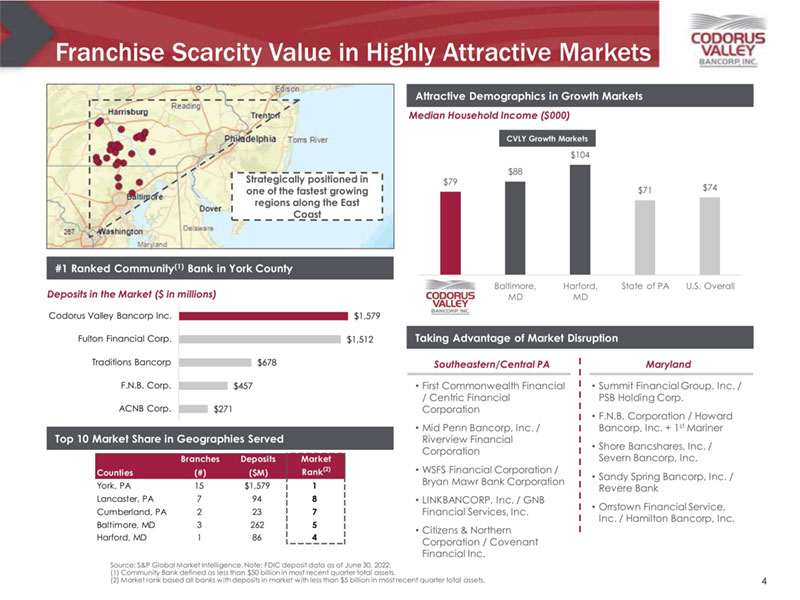
Franchise Scarcity Value in Highly Attractive Markets 4 Source: S&P Global Market Intelligence. Note: FDIC deposit data as of June 30, 2022. (1) Community Bank defined as less than $50 billion in most recent quarter total assets. (2) Market rank based all banks with deposits in market with less than $5 billion in most recent quarter total assets. Attractive Demographics in Growth Markets Taking Advantage of Market Disruption #1 Ranked Community (1) Bank in York County Deposits in the Market ($ in millions) Median Household Income ($000) CVLY Growth Markets Branches Deposits Market Counties (#) ($M) Rank (2) York, PA 15 $1,579 1 Lancaster, PA 7 94 8 Cumberland, PA 2 23 7 Baltimore, MD 3 262 5 Harford, MD 1 86 4 Top 10 Market Share in Geographies Served Strategically positioned in one of the fastest growing regions along the East Coast Southeastern/Central PA Maryland • First Commonwealth Financial / Centric Financial Corporation • Mid Penn Bancorp, Inc. / Riverview Financial Corporation • WSFS Financial Corporation / Bryan Mawr Bank Corporation • LINKBANCORP, Inc. / GNB Financial Services, Inc. • Citizens & Northern Corporation / Covenant Financial Inc. • Summit Financial Group, Inc. / PSB Holding Corp. • F.N.B. Corporation / Howard Bancorp, Inc. + 1 st Mariner • Shore Bancshares, Inc. / Severn Bancorp, Inc. • Sandy Spring Bancorp, Inc. / Revere Bank • Orrstown Financial Service, Inc. / Hamilton Bancorp, Inc. $79 $88 $104 $71 $74 Baltimore, MD Harford, MD State of PA U.S. Overall $271 $457 $678 $1,512 $1,579 ACNB Corp. F.N.B. Corp. Traditions Bancorp Fulton Financial Corp. Codorus Valley Bancorp Inc.
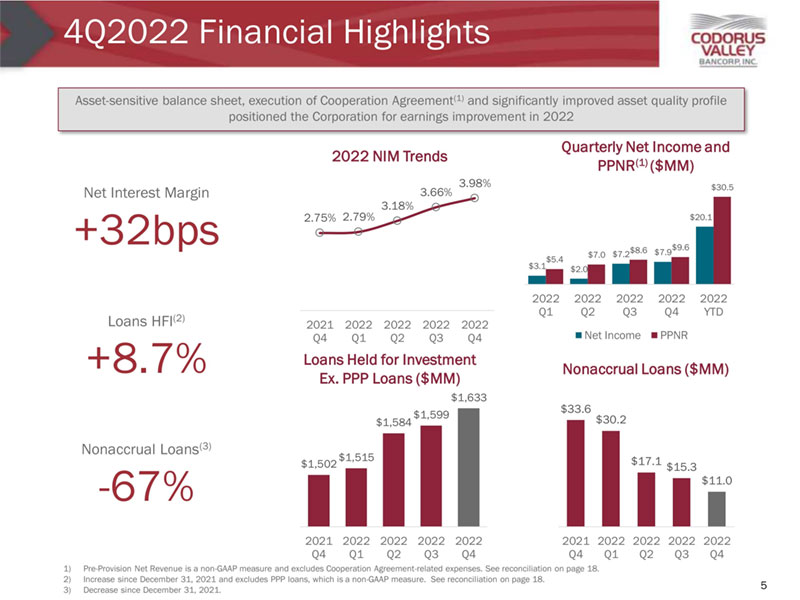
4Q2022 Financial Highlights 2022 NIM Trends 5 1) Pre - Provision Net Revenue is a non - GAAP measure and excludes Cooperation Agreement - related expenses. See reconciliation on page 18. 2) Increase since December 31, 2021 and excludes PPP loans, which is a non - GAAP measure. See reconciliation on page 18. 3) Decrease since December 31, 2021. Net Interest Margin +32bps Nonaccrual Loans (3) - 67% Quarterly Net Income and PPNR (1) ($MM) Loans Held for Investment Ex. PPP Loans ($ MM ) Nonaccrual Loans ($MM) Loans HFI (2) +8.7% 2.75% 2.79% 3.18% 3.66% 3.98% 2021 Q4 2022 Q1 2022 Q2 2022 Q3 2022 Q4 $3.1 $2.0 $7.2 $7.9 $20.1 $5.4 $7.0 $8.6 $9.6 $30.5 2022 Q1 2022 Q2 2022 Q3 2022 Q4 2022 YTD Net Income PPNR $1,502 $1,515 $1,584 $1,599 $1,633 2021 Q4 2022 Q1 2022 Q2 2022 Q3 2022 Q4 $33.6 $30.2 $17.1 $15.3 $11.0 2021 Q4 2022 Q1 2022 Q2 2022 Q3 2022 Q4 Asset - sensitive balance sheet, execution of Cooperation Agreement (1) and significantly improved asset quality profile positioned the Corporation for earnings improvement in 2022
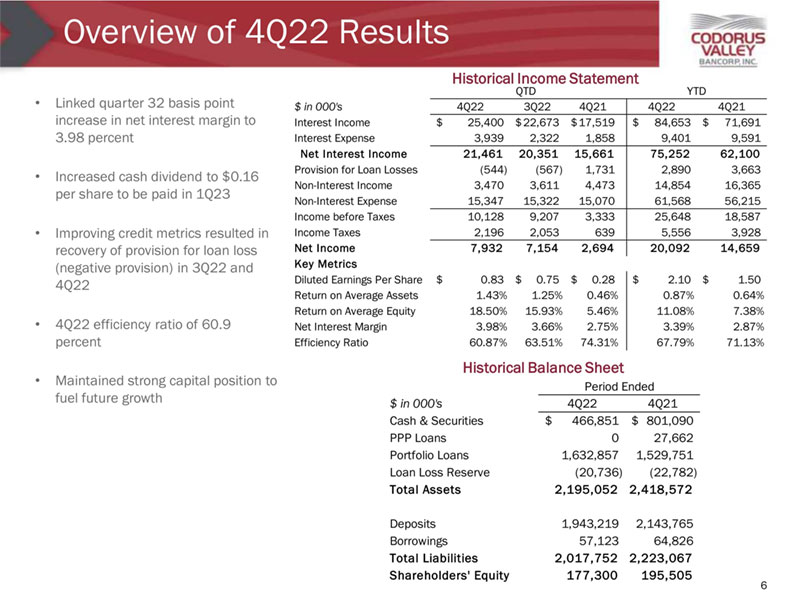
Overview of 4Q22 Results • Linked quarter 32 basis point increase in net interest margin to 3.98 percent • Increased cash dividend to $0.16 per share to be paid in 1Q23 • Improving credit metrics resulted in recovery of provision for loan loss (negative provision) in 3Q22 and 4Q22 • 4Q22 efficiency ratio of 60.9 percent • Maintained strong capital position to fuel future growth Historical Income Statement 6 Historical Balance Sheet $ in 000’s 4Q22 4Q21 Cash & Securities 466,851$ 801,090$ PPP Loans 0 27,662 Portfolio Loans 1,632,857 1,529,751 Loan Loss Reserve (20,736) (22,782) Total Assets 2,195,052 2,418,572 Deposits 1,943,219 2,143,765 Borrowings 57,123 64,826 Total Liabilities 2,017,752 2,223,067 Shareholders’ Equity 177,300 195,505 Period Ended $ in 000’s 4Q22 3Q22 4Q21 4Q22 4Q21 Interest Income 25,400$ 22,673$ 17,519$ 84,653$ 71,691$ Interest Expense 3,939 2,322 1,858 9,401 9,591 Net Interest Income 21,461 20,351 15,661 75,252 62,100 Provision for Loan Losses (544) (567) 1,731 2,890 3,663 Non-Interest Income 3,470 3,611 4,473 14,854 16,365 Non-Interest Expense 15,347 15,322 15,070 61,568 56,215 Income before Taxes 10,128 9,207 3,333 25,648 18,587 Income Taxes 2,196 2,053 639 5,556 3,928 Net Income 7,932 7,154 2,694 20,092 14,659 Key Metrics Diluted Earnings Per Share 0.83$ 0.75$ 0.28$ 2.10$ 1.50$ Return on Average Assets 1.43% 1.25% 0.46% 0.87% 0.64% Return on Average Equity 18.50% 15.93% 5.46% 11.08% 7.38% Net Interest Margin 3.98% 3.66% 2.75% 3.39% 2.87% Efficiency Ratio 60.87% 63.51% 74.31% 67.79% 71.13% QTD YTD

Full - Service Community Banking 7 38.6% 15.8% 7.9% 5.8% 5.6% 5.3% 21.0% Investor Real Estate Consumer Construction Hotel Agriculture Manufacturing Other Commercial $1.63 Billion $1.94 Billion 23.9% 14.9% 33.3% 8.3% 19.7% NIB Demand IB Demand Money Market Savings Time Deposits Loans Deposits • $1.6 billion loans, $1.9 billion deposits • 24 Full - Service Financial Centers • 6 Limited - Service Retirement Facilities • Full product line offering

• ~ $820M Assets Under Management (Q42022) » $342M – PeoplesWealth Advisors » $478M – Trust & Investment Services • ~40% of non - interest income • Full spectrum of wealth management solutions and services • Continued focus on Lancaster County market • Recognized as top performer by Pohl Consulting for third consecutive year Balanced Go - to - Market Business Model Note : Certain securities and advisory services as well as insurance products are offered through LPL Financial, Inc ., an unaffiliated SEC - registered investment advisor and broker - dealer. Member FINRA/SIPC. • Originated and closed 271 mortgages totaling approximately $70.4 million in 2022 • Utilized niche products such as Physician’s Preferred Mortgage, first - time homebuyer programs and adjustable rate mortgages to expand mortgage portfolio, growing by a net $31 million or 30% during 2022 • Recognized as 2022 Best Mortgage Lender by readers of York Daily Record • Recognized as 2022 Best Mortgage Lender by readers of Central Penn Business Journal Wealth Management Mortgage Banking 8 59% Self - sourced 41% Referrals 79% Construction to Permanent & Purchase 21% Refinance 78% Held for Investment 22% Held for Sale (HFS)
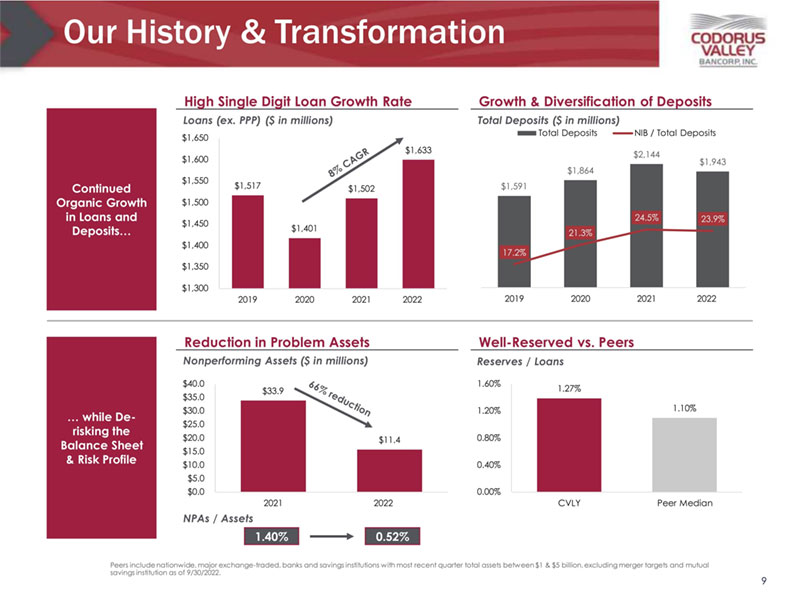
Our History & Transformation 9 Growth & Diversification of Deposits High Single Digit Loan Growth Rate Well - Reserved vs. Peers Reduction in Problem Assets Continued Organic Growth in Loans and Deposits… … while De - risking the Balance Sheet & Risk Profile NPAs / Assets Reserves / Loans Loans (ex. PPP) ($ in millions) Nonperforming Assets ($ in millions) Total Deposits ($ in millions) Peers include nationwide, major exchange - traded, banks and savings institutions with most recent quarter total assets between $1 & $5 billion, excluding merger targets and mutual savings institution as of 9/30/2022. 1.40% 0.52% $1,591 $1,864 $2,144 $1,943 17.2% 21.3% 24.5% 23.9% 2019 2020 2021 2022 Total Deposits NIB / Total Deposits $1,517 $1,401 $1,502 $1,633 $1,300 $1,350 $1,400 $1,450 $1,500 $1,550 $1,600 $1,650 2019 2020 2021 2022 1.27% 1.10% 0.00% 0.40% 0.80% 1.20% 1.60% CVLY Peer Median $33.9 $11.4 $0.0 $5.0 $10.0 $15.0 $20.0 $25.0 $30.0 $35.0 $40.0 2021 2022
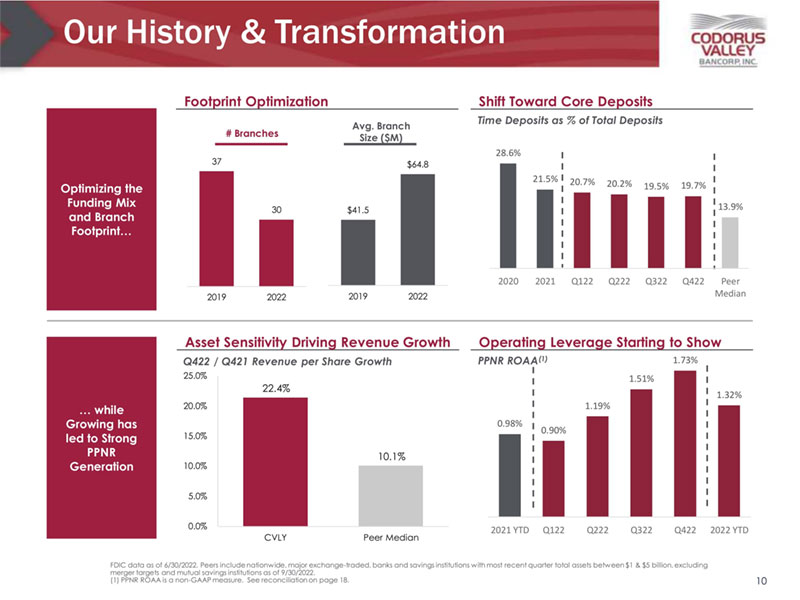
0.98% 0.90% 1.19% 1.51% 1.73% 1.32% 2021 YTD Q122 Q222 Q322 Q422 2022 YTD Our History & Transformation 10 Optimizing the Funding Mix and Branch Footprint… … while Growing has led to Strong PPNR Generation Shift Toward Core Deposits Footprint Optimization Time Deposits as % of Total Deposits Asset Sensitivity Driving Revenue Growth Q422 / Q421 Revenue per Share Growth # Branches Avg. Branch Size ($M) FDIC data as of 6/30/2022. Peers include nationwide, major exchange - traded, banks and savings institutions with most recent quarter total assets between $1 & $5 billion, excluding merger targets and mutual savings institutions as of 9/30/2022. (1) PPNR ROAA is a non - GAAP measure. See reconciliation on page 18. Operating Leverage Starting to Show PPNR ROAA (1) 37 30 2019 2022 $41.5 $64.8 2019 2022 22.4% 10.1% 0.0% 5.0% 10.0% 15.0% 20.0% 25.0% CVLY Peer Median 28.6% 21.5% 20.7% 20.2% 19.5% 19.7% 13.9% 2020 2021 Q122 Q222 Q322 Q422 Peer Median
Investment Highlights 11 Best - in - Class Corporate Governance & Insider Alignment Ability to Further Expand Operating Leverage Franchise Scarcity Value in Highly Attractive Markets Well - Positioned for Potential Higher - for - Longer Rate Environment
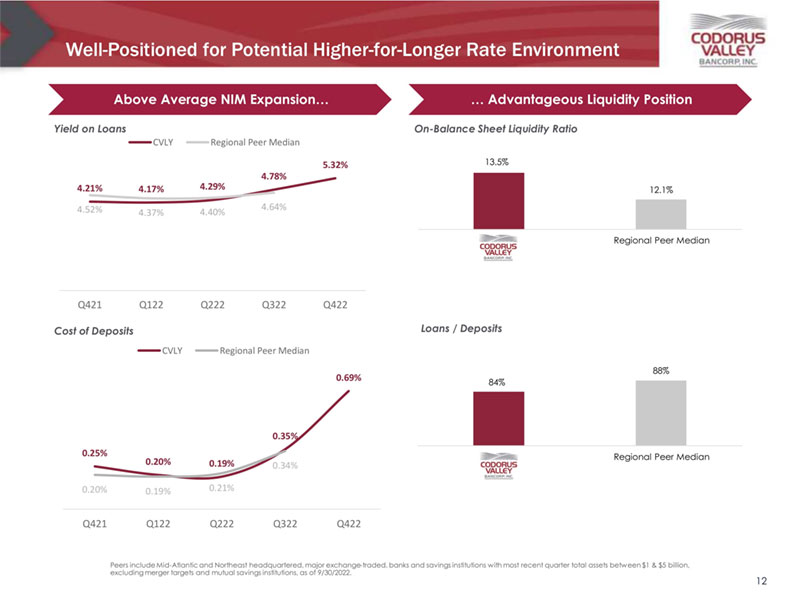
Well - Positioned for Potential Higher - for - Longer Rate Environment 12 Above Average NIM Expansion… … Advantageous Liquidity Position Yield on Loans Cost of Deposits On - Balance Sheet Liquidity Ratio Loans / Deposits Peers include Mid - Atlantic and Northeast headquartered, major exchange - traded, banks and savings institutions with most recent quarter total assets between $1 & $5 billion, excluding merger targets and mutual savings institutions, as of 9/30/2022. 13.5% 12.1% Regional Peer Median 84% 88% Regional Peer Median 4.21% 4.17% 4.29% 4.78% 5.32% 4.52% 4.37% 4.40% 4.64% Q421 Q122 Q222 Q322 Q422 CVLY Regional Peer Median 0.25% 0.20% 0.19% 0.35% 0.69% 0.20% 0.19% 0.21% 0.34% Q421 Q122 Q222 Q322 Q422 CVLY Regional Peer Median

Ability to Further Expand Operating Leverage 13 Note : 2022Q4 annualized. (1) SATMETRIX NPS (2021), NPS for U.S. banks Significant Investment & Focus on Technology Investments Revenue Growth Outpacing Expense Growth x Most critical client - impacting platforms overhauled in last 4 years x Online banking reached record client engagement in Q422 x Highly competitive digital platform – high Net Promoter Score x Implemented nCino – manual touch points reduced by 30% x Successful roll out of online application small business lending x Technology infrastructure positioned to easily scale and support 2x asset size NIM + Fee Income / Avg. Assets (1) Net Operating Expense / Avg. Assets Revenue Outpacing Expenses by 1.3x Revenue + 83bps Expenses + 36bps 2.73% 3.26% 3.72% 0.77% 0.64% 0.60% 3.49% 3.90% 4.32% 2021 Full Year 2022 Full Year Q422 Annualized NIM / Avg. Assets Fee Income / Avg. Assets 1.70% 2.03% 2.06% 2021 Full Year 2022 Full Year Q422 Annualized 34 CVLY U.S. Bank Average 59
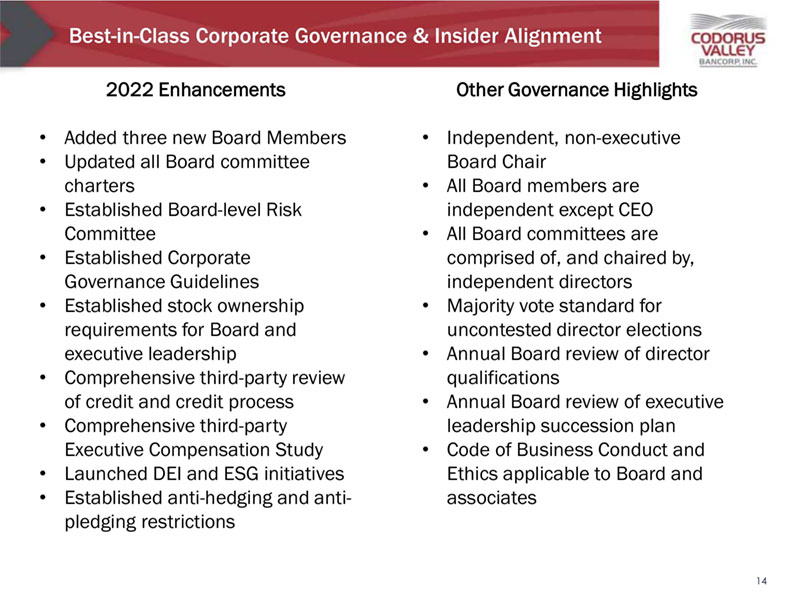
Best - in - Class Corporate Governance & Insider Alignment 14 2022 Enhancements • Added three new Board Members • Updated all Board committee charters • Established Board - level Risk Committee • Established Corporate Governance Guidelines • Established stock ownership requirements for Board and executive leadership • Comprehensive third - party review of credit and credit process • Comprehensive third - party Executive Compensation Study • Launched DEI and ESG initiatives • Established anti - hedging and anti - pledging restrictions Other Governance Highlights • Independent, non - executive Board Chair • All Board members are independent except CEO • All Board committees are comprised of, and chaired by, independent directors • Majority vote standard for uncontested director elections • Annual Board review of director qualifications • Annual Board review of executive leadership succession plan • Code of Business Conduct and Ethics applicable to Board and associates
15
Experienced Leadership Team 16 Key Leadership Craig L. Kauffman President & Chief Executive Officer Diane E. Baker, CPA Executive Vice President – Chief Risk Officer Stephen M. Altland Senior Vice President – Wealth Management Division Scott R. Campagna Senior Vice President – Chief Information Officer Chad M. Clabaugh Senior Vice President – Chief Consumer Banking Officer Matthew A. Clemens, PCC, SPHR Senior Vice President – Chief Administrative Officer Amy L. Doll Senior Vice President – Chief Commercial Banking & Lending Officer Dennis Ginder Senior Vice President – Chief Credit Officer Larry D. Pickett Executive Vice President – Chief Financial Officer Daniel R. Stolzer. Esq. Executive Vice President General Counsel and Secretary Key Leadership
Experienced Board of Directors 17 Independent Directors Biography Cynthia A. Dotzel, CPA Chair Since 2022 Director Since 2011 ~ Practicing CPA with Dotzel & Company, Inc., Chair of The York Water Company (NASDAQ:YORW) board. Former board member of Waypoint Financial Corp., Waypoint Bank, York Financial Corp. and York Federal Savings & Loan. John Rodney Messick Vice Chair Since 2022 Director Since 2020 ~ Chief Executive Officer of Homesale Realty Service Group, Inc., headquartered in Lancaster, Pennsylvania and servicing clients in the Baltimore, South Central Pennsylvania and Southeastern Pennsylvania areas. Joined PeoplesBank Board in 2019. Sarah M. Brown Director Since 2020 ~ President and Chief Executive Officer of Keller-Brown Insurance Services, a fifth generation, family-owned insurance agency located in York County, Pennsylvania. Joined PeoplesBank Board in 2019. Brian D. Brunner Director Since 2015 ~ Division President of Account and Item Processing Sales for Fiserv, Inc., a leading provider of financial services technology and one of FORTUNE magazine’s World’s Most Admired Companies. Keith Cenekofsky, CPA Director Since 2022 ~ Former Partner of BDO USA, LLP with over 36 years of public accounting experience. He served as Partner in Charge of many public financial institutions’ audits. Joined PeoplesBank Board in 2021. Scott V. Fainor Director Since 2022 ~ Chairman of Fainor Holdings, a company he launched following a distinguished career as a bank executive for 39 years. Most recently served as Group Executive of BB&T after serving as President and CEO of the public company National Penn Bancshares, Inc. John W. Giambalvo, Esq. Director Since 2017 ~ President and Chief Executive Officer of Jack Giambalvo Motor Co. with over 20 years of experience in the auto industry. John E. Kiernan, Esq. Director Since 2022 ~ President and Chief Executive Officer of Alico, Inc. (NASDAQ:ALCO), the largest citrus producer in the U.S. Kent K. Matsumoto, Esq. Director Since 2022 ~ Legal counsel with 36 years of experience at a number of public companies: Viatris, Inc., P.H. Glatfelter Company, and Wolters Kluwer Health and Pharma Solutions. Joined PeoplesBank Board in 2021.
Non - GAAP Disclosure The Corporation has presented non - GAAP financial measures in this presentation because it believes that these measures provide useful and comparative information to assess trends in the Corporation’s financial condition and results of operations . Investors and other interested parties should note that, because not all companies use the same calculations for their non - GAAP measures, this presentation may not be comparable to other similarly titled measures presented by other companies . These non - GAAP financial measures should not be considered a substitute for GAAP basis measures, and the Corporation encourages a review of its consolidated financial statements in their entirety . Following are reconciliations of these non - GAAP financial measures to the most directly comparable GAAP measures . “Pre - Tax Pre - Provision Net Revenue” measures net income excluding the effects of income taxes and the provision for loan losses, as well as any expenses related to the Cooperation Agreement ( 1 ) . “Total Loans Held for Investment Excluding PPP Loans” measures total loans excluding the impacts of short - term loans made during 2020 and 2021 with the intention of being forgiven under the US Treasury’s COVID - 19 related PPP Program to support small businesses . 18 (1) The “Cooperation Agreement” refers to the agreement dated as of April 12, 2022, among the Corporation, Driver Opportunity Par tne rs I LP, Driver Management Company LLC and J. Abbott Cooper. See Current Report on Form 8 - K dated April 14, 2022 on file with the Securi ties and Exchange Commission.
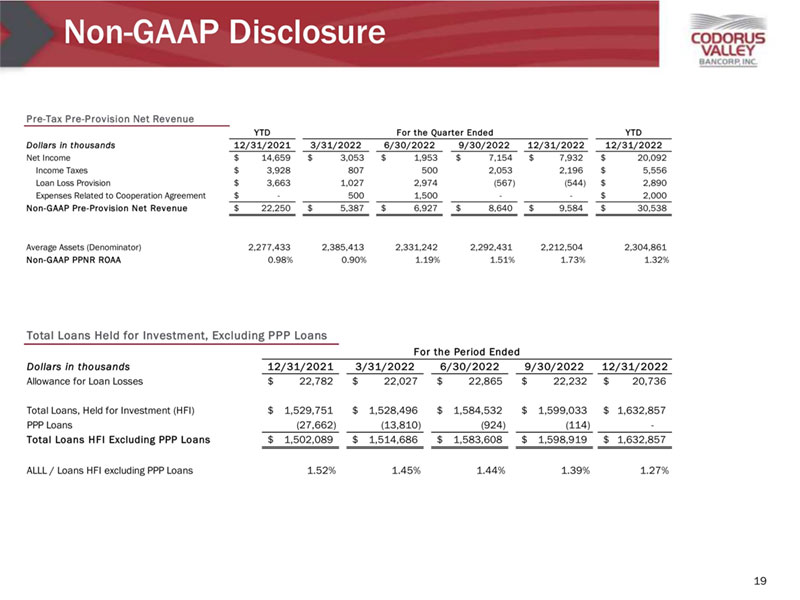
Non - GAAP Disclosure 19 Total Loans Held for Investment, Excluding PPP Loans Dollars in thousands 12/31/2021 3/31/2022 6/30/2022 9/30/2022 12/31/2022 Allowance for Loan Losses 22,782$ 22,027$ 22,865$ 22,232$ 20,736$ Total Loans, Held for Investment (HFI) 1,529,751$ 1,528,496$ 1,584,532$ 1,599,033$ 1,632,857$ PPP Loans (27,662) (13,810) (924) (114) - Total Loans HFI Excluding PPP Loans 1,502,089$ 1,514,686$ 1,583,608$ 1,598,919$ 1,632,857$ ALLL / Loans HFI excluding PPP Loans 1.52% 1.45% 1.44% 1.39% 1.27% For the Period Ended YTD YTD Dollars in thousands 12/31/2021 3/31/2022 6/30/2022 9/30/2022 12/31/2022 12/31/2022 Net Income 14,659$ 3,053$ 1,953$ 7,154$ 7,932$ 20,092$ Income Taxes 3,928$ 807 500 2,053 2,196 5,556$ Loan Loss Provision 3,663$ 1,027 2,974 (567) (544) 2,890$ Expenses Related to Cooperation Agreement -$ 500 1,500 - - 2,000$ Non-GAAP Pre-Provision Net Revenue 22,250$ 5,387$ 6,927$ 8,640$ 9,584$ 30,538$ Average Assets (Denominator) 2,277,433 2,385,413 2,331,242 2,292,431 2,212,504 2,304,861 Non-GAAP PPNR ROAA 0.98% 0.90% 1.19% 1.51% 1.73% 1.32% Pre-Tax Pre-Provision Net Revenue For the Quarter Ended