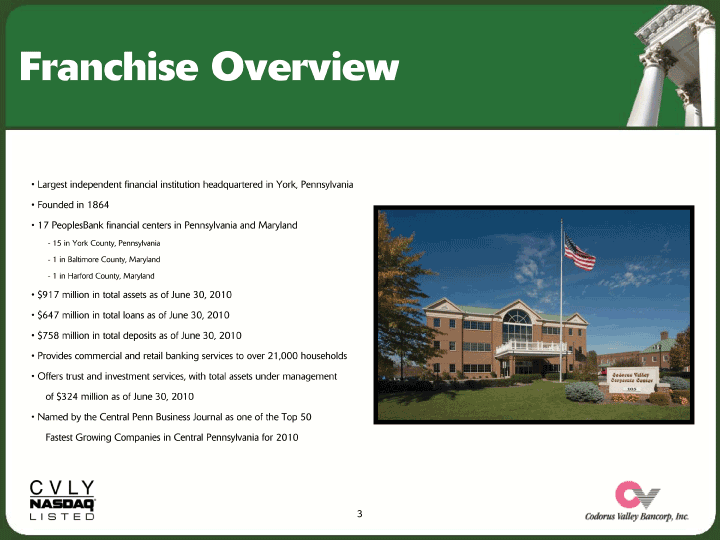
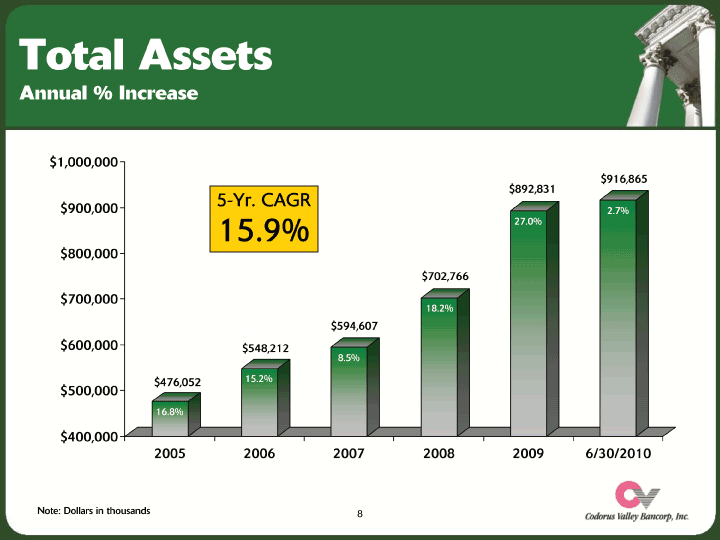
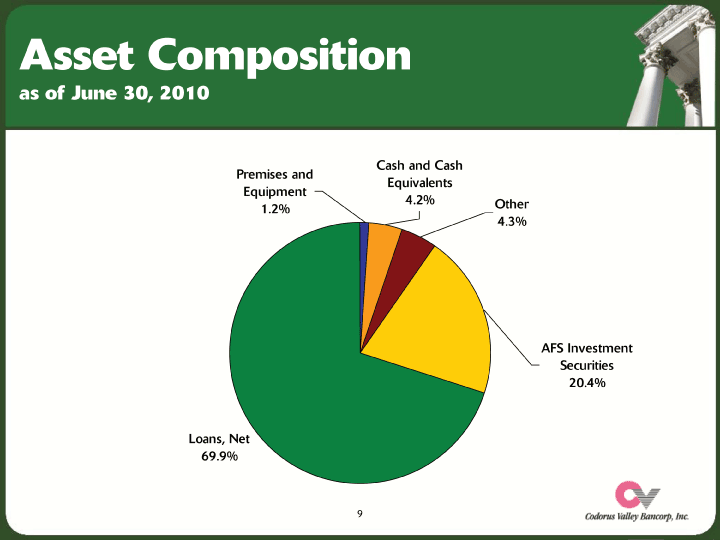
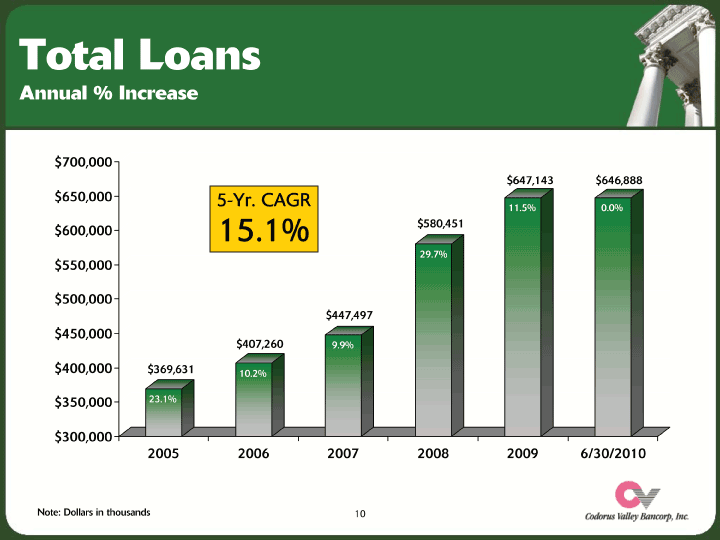
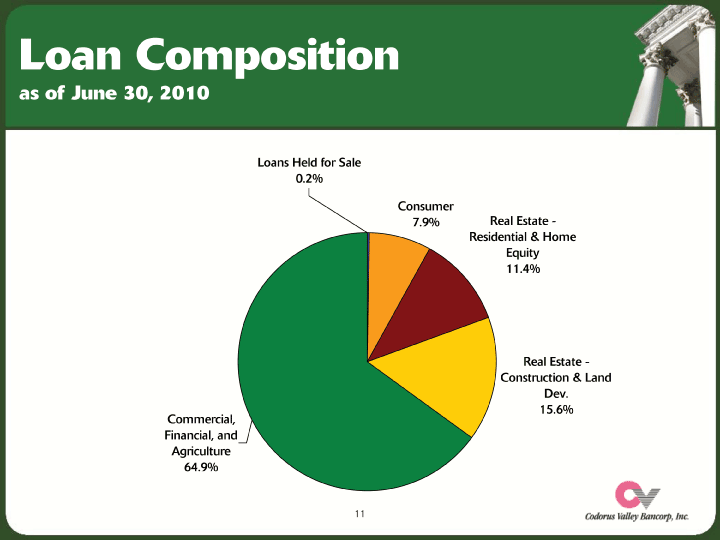
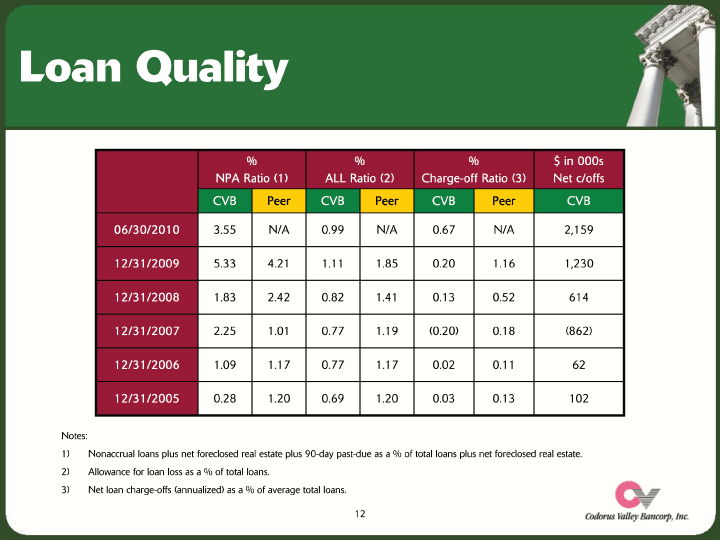
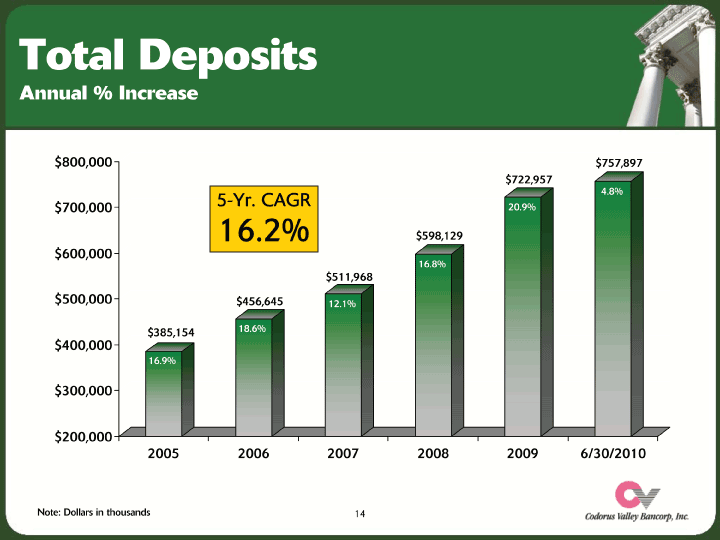
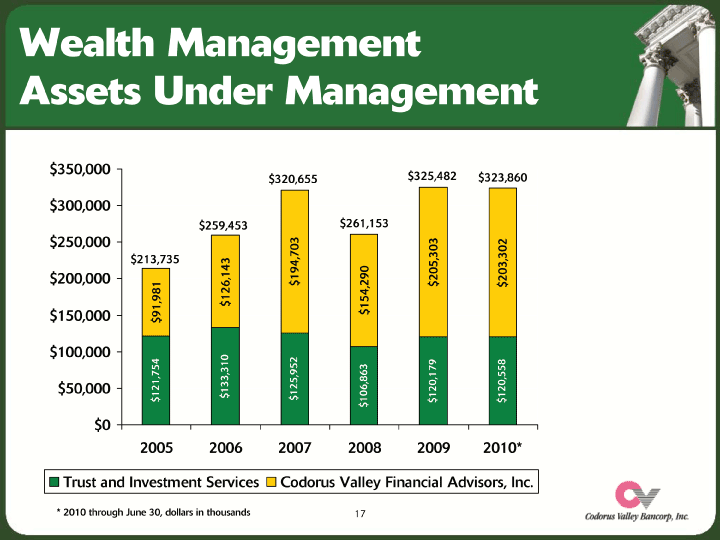
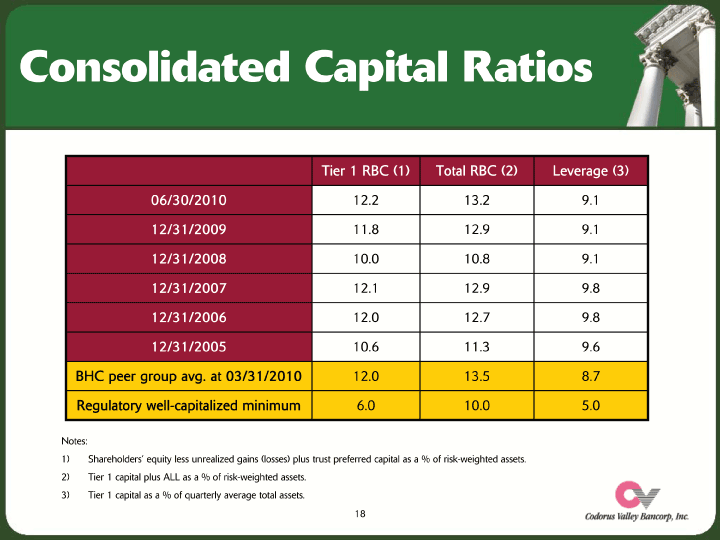
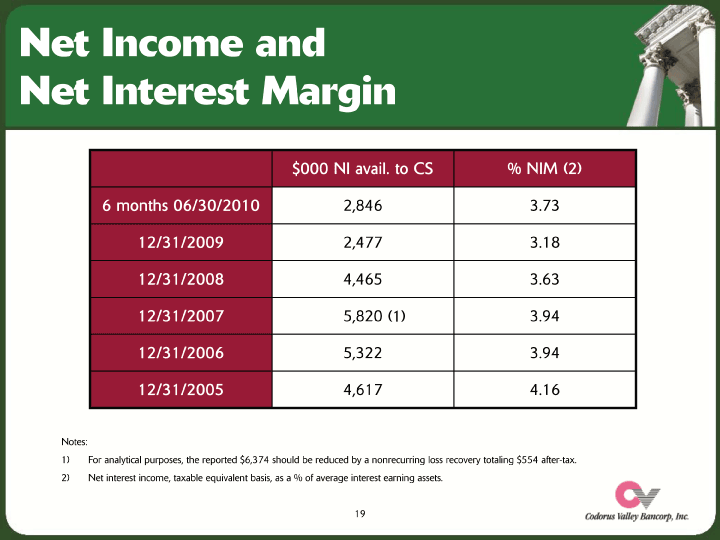
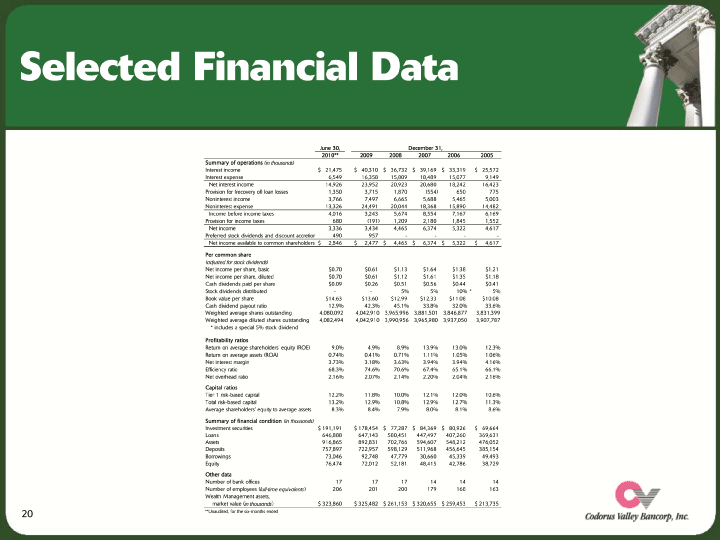
| Selected Financial Data June 30, December 31, 2010** 2009 2008 2007 2006 2005 Summary of operations(in thousands)Interest income $ 21,475 $ 40,310 $ 36,732 $ 39,169 $ 33,319 $ 25,572 Interest expense 6,549 16,358 15,809 18,489 15,077 9,149 Net interest income 14,926 23,952 20,923 20,680 18,242 16,423 Provision for (recovery of) loan losses 1,350 3,715 1,870 (554) 650 775 Noninterest income 3,766 7,497 6,665 5,688 5,465 5,003 Noninterest expense 13,326 24,491 20,044 18,368 15,890 14,482 Income before income taxes 4,016 3,243 5,674 8,554 7,167 6,169 Provision for income taxes 680 (191) 1,209 2,180 1,845 1,552 Net income 3,336 3,434 4,465 6,374 5,322 4,617 Preferred stock dividends and discount accretion 490 957 - - — - -Net income available to common shareholders $ 2,846 $ 2,477 $ 4,465 $ 6,374 $ 5,322 $ 4,617 Per common share(adjusted for stock dividends) Net income per share, basic $0.70 $0.61 $1.13 $1.64 $1.38 $1.21 Net income per share, diluted $0.70 $0.61 $1.12 $1.61 $1.35 $1.18 Cash dividends paid per share $0.09 $0.26 $0.51 $0.56 $0.44 $0.41 Stock dividends distributed — - 5% 5% 10% * 5% Book value per share $14.63 $13.60 $12.99 $12.33 $11.08 $10.08 Cash dividend payout ratio 12.9% 42.3% 45.1% 33.8% 32.0% 33.6% Weighted average shares outstanding 4,080,092 4,042,910 3,965,996 3,881,501 3,846,877 3,831,399 Weighted average diluted shares outstanding 4,082,494 4,042,910 3,990,956 3,965,980 3,937,050 3,907,787 * includes a special 5% stock dividend Profitability ratios Return on average shareholders’ equity (ROE) 9.0% 4.9% 8.9% 13.9% 13.0% 12.3% Return on average assets (ROA) 0.74% 0.41% 0.71% 1.11% 1.05% 1.06% Net interest margin 3.73% 3.18% 3.63% 3.94% 3.94% 4.16% Efficiency ratio 68.3% 74.6% 70.6% 67.4% 65.1% 66.1% Net overhead ratio 2.16% 2.07% 2.14% 2.20% 2.04% 2.16% Capital ratios Tier 1 risk-based capital 12.2% 11.8% 10.0% 12.1% 12.0% 10.6% Total risk-based capital 13.2% 12.9% 10.8% 12.9% 12.7% 11.3% Average shareholders’ equity to average assets 8.3% 8.4% 7.9% 8.0% 8.1% 8.6% Summary of financial condition(in thousands) Investment securities $ 191,191 $ 178,454 $ 77,287 $ 84,369 $ 80,926 $ 69,664 Loans 646,888 647,143 580,451 447,497 407,260 369,631 Assets 916,865 892,831 702,766 594,607 548,212 476,052 Deposits 757,897 722,957 598,129 511,968 456,645 385,154 Borrowings 73,046 92,748 47,779 30,660 45,339 49,493 Equity 76,474 72,012 52,181 48,415 42,786 38,729 Other data Number of bank offices 17 17 17 14 14 14 Number of employees (full-time equivalents) 206 201 200 179 168 163 Wealth Management assets, market value (in thousands) $ 323,860 $ 325,482 $ 261,153 $ 320,655 $ 259,453 $ 213,735 **Unaudited, for the six-months ended |