Table of Contents
UNITED STATES
SECURITIES AND EXCHANGE COMMISSION
Washington, D.C. 20549
FORM N-CSR
CERTIFIED SHAREHOLDER REPORT OF REGISTERED
MANAGEMENT INVESTMENT COMPANIES
Investment Company Act file number: 811-4920
WASATCH FUNDS, INC.
(Exact name of registrant as specified in charter)
150 Social Hall Avenue
4th Floor
Salt Lake City, Utah 84111
(Address of principal executive offices) (Zip code)
| (Name and Address of Agent for Service) | Copy to: | |
Samuel S. Stewart, Jr. Wasatch Funds, Inc. 150 Social Hall Avenue, 4th Floor Salt Lake City, Utah 84111 | Eric F. Fess, Esq. Chapman & Cutler LLP 111 West Monroe Street Chicago, IL 60603 | |
Registrant’s telephone number, including area code: (801) 533-0777
Date of fiscal year end: September 30
Date of reporting period: March 31, 2009
Table of Contents
| Item 1: | Report to Shareholders. |
Table of Contents
| SEMI-ANNUAL REPORT |

| MARCH 31, 2009 | EQUITY FUNDS | |
| WASATCH CORE GROWTH FUND | ||
| WASATCH EMERGING MARKETS SMALL CAP FUND | ||
| WASATCH GLOBAL OPPORTUNITIES FUND | ||
| WASATCH GLOBAL SCIENCE & TECHNOLOGY FUND | ||
| WASATCH HERITAGE GROWTH FUND | ||
| WASATCH HERITAGE VALUE FUND | ||
| WASATCH INTERNATIONAL GROWTH FUND | ||
| WASATCH INTERNATIONAL OPPORTUNITIES FUND | ||
| WASATCH MICRO CAP FUND | ||
| WASATCH MICRO CAP VALUE FUND | ||
| WASATCH SMALL CAP GROWTH FUND | ||
| WASATCH SMALL CAP VALUE FUND | ||
| WASATCH STRATEGIC INCOME FUND | ||
| WASATCH ULTRA GROWTH FUND | ||
| WASATCH-1ST SOURCE INCOME EQUITY FUND | ||
| WASATCH-1ST SOURCE LONG/SHORT FUND | ||
| BOND FUNDS (Sub-Advised) | ||
| WASATCH-HOISINGTON U.S. TREASURY FUND | ||
WASATCH-1ST SOURCE INCOME FUND
| ||
Table of Contents
Wasatch Funds, Inc.
Salt Lake City, Utah
www.wasatchfunds.com
800.551.1700
Table of Contents
| TABLEOF CONTENTS | ||
| 2 | ||
| 4 | ||
| 5 | ||
Wasatch Emerging Markets Small Cap Fund™ Management Discussion | 6 | |
| 7 | ||
| 8 | ||
| 9 | ||
Wasatch Global Science & Technology Fund® Management Discussion | 10 | |
| 11 | ||
| 12 | ||
| 13 | ||
| 14 | ||
| 15 | ||
| 16 | ||
| 17 | ||
Wasatch International Opportunities Fund® Management Discussion | 18 | |
| 19 | ||
| 20 | ||
| 21 | ||
| 22 | ||
| 23 | ||
| 24 | ||
| 25 | ||
| 26 | ||
| 27 | ||
| 28 | ||
| 29 | ||
| 30 | ||
| 31 | ||
Wasatch-1st Source Income Equity Fund™ Management Discussion | 32 | |
| 33 | ||
| 34 | ||
| 35 | ||
Wasatch-Hoisington U.S. Treasury Fund® Management Discussion | 36 | |
| 37 | ||
| 38 | ||
| 39 | ||
| 40 | ||
| 42 | ||
| 88 | ||
| 92 | ||
| 96 | ||
| 104 | ||
| 113 | ||
| 124 | ||
| 124 | ||
| 126 | ||
| 126 | ||
| 126 | ||
| 135 | ||
| 136 | ||
| 137 |
This material must be accompanied or preceded by a prospectus.
Please read the prospectus carefully before you invest.
Wasatch Funds are distributed by ALPS Distributors, Inc.
1
Table of Contents
| LETTERTO SHAREHOLDERS | ||
Samuel S. Stewart, Jr. PhD, CFA President of | DEAR FELLOW SHAREHOLDERS:
THE ECONOMY
“Leverage” has become a scapegoat during this crisis as we have heard about financial institutions that became recklessly leveraged and are now melting down because a portion of their investments turned sour while they failed to maintain an adequate capital base. Of course leverage is actually a healthy and vital part of our economic system. We want leverage; we just want to make sure that loans are given to people who can repay them. In recent years, a lot of loans were originated that should never have seen the light of day simply because these loans could be quickly re-sold as a security, and the risk off-loaded. I continue to talk about the importance of credit markets returning to normal. The challenge is that many of the sources of credit over the last several years simply don’t exist anymore. The securitization market has all but vanished. So, even though traditional sources of credit are beginning to open up, the credit market as a whole is a fraction of what it has been. This is forcing our economy to de-lever quickly, and with significant pain. |

The government is taking repeated actions in an attempt to unfreeze the credit markets and to stimulate the economy. Clearly the solution is not simple. Some actions are falling short of the goal, others are leading to unintended consequences, but most of them still need time to play out — which doesn’t sit well with our impatient society. At this stage in the crisis, I would like to see the government show patience, let the actions that have been taken play out, and thoughtfully consider any future actions. The government should become a calming influence in an environment too ripe for hysteria.
The good news is that credit markets are beginning to show improvement. The volume of new corporate credit has meaningfully increased, money velocity is heading up, and as of March 31st the yield curve was positive. However, for too many small businesses, the cost of debt is still more expensive than the cost of equity — the inverse of normal conditions. As I’ve mentioned before, once reasonable borrowers can get reasonable loans at reasonable terms, I believe we will see the economy stabilize. We’re moving in the right direction, but clearly we’re not there yet.
WASATCH PERFORMANCE
The market declines in January and February made for a distressing quarter. March provided a partial rebound and some hope. I have been particularly encouraged to see most of the Wasatch Funds begin the year well ahead of their benchmark indexes and their peers — providing the relative outperformance in a down market that has typified Wasatch Funds over the years. We have benefited as the market finally began to recognize the value of stronger, more stable companies. In the first quarter, 15 of our 16 equity funds were ahead of their benchmark, by an average of almost 7 percentage points. Relative outperformance, however, remains unsatisfying when absolute returns are negative for our shareholders. For the standardized performance of each Wasatch Fund please see the portfolio summaries beginning on page 5.
We made a significant effort last year to reduce the number of holdings across our funds — focusing on the highest quality companies with the best value, where we had our strongest conviction. We also took a lesson from history and relocated our portfolio managers to a shared office where they vet companies and challenge ideas with their seasoned peers on a daily basis. Late in the year we acquired the 1st Source Funds, whose portfolio managers add useful macro insights to our research team. One quarter is obviously a very short evaluation period, particularly for long-term investors like Wasatch, but I do think we are seeing the benefits of these actions.
MARKET OUTLOOK
I am frequently asked if we have seen the market bottom. Of course the answer is “I don’t know,” but as I mentioned in my March 3rd commentary — when the Dow was around 6700 — market bottoms usually come when it feels like the market has just given up. At that time it sure felt like the market had capitulated. [If you are interested in reading my regular commentaries, they can be found on the home page of our new web site www.wasatchfunds.com in the “Chairman’s Corner.”]
I expect the economy to continue to slog through 2009 as most economists are predicting. Despite such forecasts, our funds remain nearly fully invested because: a) we’re much better at long-term investing than market timing; b) during past recessions the market has generally turned well before the economy did; c) small cap companies have led coming out of all nine recessions since 1953*; and d) we feel bullish about the long-term quality and value of our holdings.
As previously mentioned, we saw the stocks of more stable, less economically sensitive companies rewarded in the first quarter. As a result, high quality companies with economic sensitivity now have the most appealing valuations. Due to the economic exposure of these companies, their stocks continue to get hammered. We expect the best-of-breed among these firms to rebound nicely when the economy improves, and at current valuations the risk/reward in their stocks is uniquely compelling. We will likely add some of these companies to our funds as we continue to evolve our holdings toward what we believe to be the best long-term opportunities available.
“Should I get back in yet?” is another frequent question I am asked. Here my answer is easier. If you’re a long-term investor who moved some of your equity allocation to the sidelines, I think you should consider re-entering the market. Again, I claim no
2
Table of Contents
MARCH 31, 2009 | ||
expertise in market timing; I don’t know if we’ve reached the bottom yet; and I don’t know how long it will take before the market moves meaningfully north again. What I do know is that the market is at historically attractive levels; that the market is likely to move before the economy; that market moves can be sudden and dramatic; and that those who wait for the market to begin rising consistently will likely miss much of the upside. Numerous studies have shown that unless you have an unusual gift for market timing, dollar cost averaging typically provides better returns. Since I believe we are closer to the bottom than the top, I think dollar-cost averaging your way into the market at these levels provides the potential for good long-term results.
We greatly appreciate our shareholders and the trust you place in us. We understand the pain and stress that many of you are going through as you have watched your portfolio values drop. Our investment team remains intensely committed, scouring the world, looking deeper and remaining true to our discipline in search of what we believe to be the best investments to position our funds for long-term success. We take comfort in knowing that historically over time the economy has grown and the market has gone up, and we expect both will again. Thank you for your similar commitment to this vision.
Sincerely,

Samuel S. Stewart, Jr.
President of Wasatch Funds
WASATCH-HOISINGTON U.S. TREASURY FUND
For information about the performance and outlook of the Fund, please see the management discussion and portfolio summary on pages 36 and 37. The views expressed in the management discussion are those of Hoisington Investment Management Company, sub-advisor to the Fund, and may differ from the views of Wasatch Advisors, investment advisor to Wasatch Funds.
WASATCH-1ST SOURCE INCOME FUND
For information about the performance and outlook of the Fund, please see the management discussion and portfolio summary on pages 38 and 39. The views expressed in the management discussion are those of 1st Source Corporation Investment Advisors, Inc., sub-advisor to the Fund, and may differ from the views of Wasatch Advisors, investment advisor to Wasatch Funds.
Information in this report regarding market or economic trends or the factors influencing historical or future performance reflects the opinions of management as of the date of this report. These statements should not be relied upon for any other purpose. Past performance is no guarantee of future results, and there is no guarantee that the market forecasts discussed will be realized.
*Source: www.jennisondryden.com, “A Historical Look at Recessions and Stock Market Returns,” 1/1/09. JennisonDryden is a registered service mark of the Prudential Insurance Company of America. Reprinted by permission. Copyright 2009 The Prudential Insurance Company of America. The use of the above in no way implies that Prudential endorses the views or interpretation or the use of such information or acts as any endorsement of Wasatch Advisors’ use of such information. The information is provided “as is” and Prudential does not warrant the accuracy or completeness of the information. Data shows past performance, which is no guarantee of future results.
Gross domestic product (GDP) is the monetary value of all the finished goods and services produced within a country’s borders in a specific time period. A recession is officially defined as two consecutive quarters of negative economic growth as measured by a country’s GDP.
The price-to-earnings or P/E ratio is the price of a stock divided by its earnings per share.
Dollar cost averaging is the practice of investing at regular intervals (such as monthly) in a particular investment, regardless of its share price, as opposed to making a large one-time investment. In this way, more shares are purchased when prices are low and fewer shares are bought when prices are high. Dollar cost averaging neither guarantees a profit nor protects against a loss in a declining market. Because dollar cost averaging involves continuous investment regardless of fluctuating price levels, investors should carefully consider their financial ability to continue investing through periods of low prices.
CFA® is a registered trademark owned by CFA Institute.
3
Table of Contents
| WASATCH CORE GROWTH FUND (WGROX) — Management Discussion | MARCH 31, 2009 | |
The Wasatch Core Growth Fund is managed by a team of Wasatch portfolio managers, led by JB Taylor and Paul Lambert.
JB Taylor |
Paul Lambert | OVERVIEW
The Wasatch Core Growth Fund returned -33.11% during the six-month period ended March 31, 2009, and outperformed the -37.17% return of its benchmark, the Russell 2000 Index. |


All of the Fund’s outperformance occurred during the second half of the period, when individual company fundamentals, rather than macroeconomic factors, were the key driver of stock prices. During this time, the Fund was helped by our emphasis on reasonably valued companies with high earnings potential.
DETAILSOFTHE PERIOD
An important positive for the Fund was that the extent of the downward earnings revisions for its holdings was much better than that of the overall market. During the past six months, the median downward revision in analysts’ 2009 consensus earnings estimates for stocks in the Russell 2000 Index was about 40% to 45%. During the same time, the median decline in consensus estimates for the companies held in the Fund was 20% to 25%. This indicates that while our companies certainly weren’t immune to the effects of the economic downturn, they have held up better than the average company in the Index.
The Fund generated some of its best performance in the consumer discretionary sector, where the -18.7% return of our holdings vastly outperforming the - -39.6% return for the broader sector. The largest source of outperformance was O’Reilly Automotive, Inc., a seller of auto parts that has benefited from consumers’ efforts to delay new car purchases by making repairs to their existing vehicles. One of the most heavily-weighted stocks in the Fund, O’Reilly gained over 30% at a time when the broader market registered a substantial loss.
The Fund outperformed in the industrials sector, an area of the market that was hit hard by concerns about slowing economic growth. Our leading performer within this potentially challenging market segment was URS Corp., an engineering and construction company whose outlook was revived by President Obama’s plans to increase infrastructure spending. Copart, Inc., the leading provider of auto salvage auction services in the United States, outperformed the broader industrials sector due to the recession-resistant nature of its business.
In the financials sector, we continued to avoid banking stocks with exposure to the various problems related to the financial crisis. This approach paid off during the past six
months, as evidenced by the fact that our holdings outpaced the overall sector by over 12 percentage points.
These positive factors were offset to some extent by the Fund’s substantial underperformance in health care. Here, Emeritus Corp., an operator of senior assisted living facilities, reported rising room rates and solid fourth quarter earnings. However, investors’ concern about the company’s high debt level caused its stock price to fall nearly 74%. A position in MEDNAX, Inc., a national network of neonatologists, also took a bite out of the Fund’s performance.
The Fund’s holdings in non-U.S. small company stocks weighed on performance during the past half-year. International stocks lagged the U.S. market by a wide margin, reflecting the fact that economic growth expectations slowed much more precipitously overseas than in the United States. While this hurt the Fund’s performance in the short term, we continue to hold a high level of conviction in our individual positions. Current and future portfolio holdings are subject to risk.
OUTLOOK
We typically look for companies that can generate consistent earnings growth in excess of 15%, but such companies are extremely hard to find when economic weakness is taking a toll on earnings estimates for virtually all companies. We expect the companies held in the Fund to produce flat to negative earnings growth in 2009, well below our 15% target. Nevertheless, we believe our holdings will post results that are attractive relative to the broader market. The pause in consistent earnings growth also has prompted us to sharpen our focus on those companies that are taking market share and gaining strength through the economic downturn. We believe such companies will generate better-than-average growth rates and warrant higher valuations once the economy eventually recovers. It is also important to note that slower growth appears to be reflected in stock prices. In the aggregate, the companies in the portfolio have been trading at a price-to-earnings (P/E) ratio* of nearly 17x, which compares favorably to a historical average closer to 20x.
With this as a background, we believe our emphasis on high-quality growth companies with strong balance sheets, together with the upside potential provided by attractive valuations, should hold the Fund in good stead throughout what is likely to be a long and uneven process of economic recovery.
Thank you for the opportunity to manage your assets.
| * | The price-to-earnings or P/E ratio is the price of a stock divided by its earnings per share. |
4
Table of Contents
| WASATCH CORE GROWTH FUND (WGROX) — Portfolio Summary | MARCH 31, 2009 | |
AVERAGE ANNUAL TOTAL RETURNS
| SIX MONTHS* | 1 YEAR | 5 YEARS | 10 YEARS | |||||
Core Growth | -33.11% | -40.20% | -7.78% | 5.67% | ||||
Russell 2000 Index | -37.17% | -37.50% | -5.24% | 1.93% |
Performance data quoted represents past performance. Past performance is not indicative of future performance and current performance may be lower or higher than the performance quoted. Wasatch Funds will deduct a fee of 2% from redemption proceeds on Fund shares held 60 days or less. Performance data does not reflect the deduction of this fee which, if charged, would reduce the performance quoted. The table above does not reflect the deduction of taxes that you would pay on fund distributions or the redemption of fund shares.
The Total Annual Fund Operating Expenses for the Wasatch Core Growth Fund are 1.21%. Total Annual Fund Operating Expenses include direct expenses paid to the Advisor as well as indirect expenses incurred by the Fund as a result of its investments in other investment companies (each an “Acquired Fund”), before any expense reimbursements by the Advisor. The Net Expenses may differ due to waivers and reimbursements by the Advisor. See the prospectus for additional information regarding Fund expenses.
To obtain the most recent month-end performance, please visit www.wasatchfunds.com or call 800.551.1700. Investment returns and principal value will fluctuate and shares, when redeemed, may be worth more or less than their original cost. The Advisor may have absorbed, currently or in the past, certain Fund expenses, without which total returns would have been lower.
Investing in small cap funds will be more volatile and loss of principal could be greater than investing in large cap or more diversified funds.
| * | Not annualized. |
TOP 10 EQUITY HOLDINGS**
| Company | % of Fund | |
| Copart, Inc. | 6.35% | |
| Annaly Capital Management, Inc. | 4.58% | |
| O’Reilly Automotive, Inc. | 3.82% | |
| Resources Connection, Inc. | 3.64% | |
| MSC Industrial Direct Co., Inc., Class A | 3.31% | |
| MEDNAX, Inc. | 3.27% |
| Company | % of Fund | |
| Redwood Trust, Inc. | 3.06% | |
| IDEX Corp. | 2.94% | |
| Emeritus Corp. | 2.92% | |
| Pool Corp. | 2.76% | |
| 36.65% | ||
| ** | As of March 31, 2009, the Fund had 36.65% invested in the Top 10 equity holdings and there were 58 long-term holdings in the Fund. Portfolio holdings are subject to change at any time. References to specific securities should not be construed as recommendations by the Funds or their Advisor. Current and future holdings are subject to risk. |
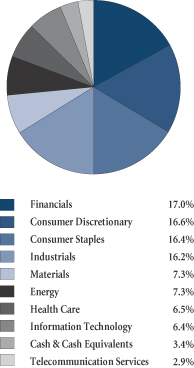
SECTOR BREAKDOWN†

†Excludes | securities sold short and written options, if any. |
GROWTHOFA $10,000 INVESTMENT
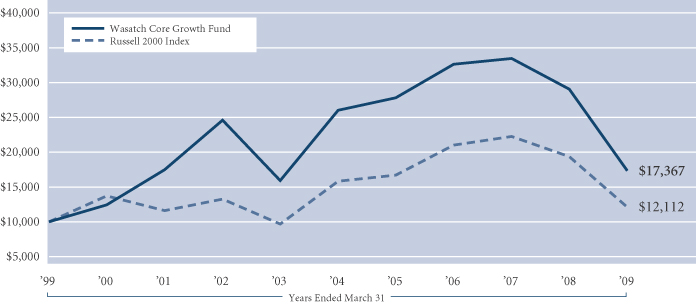
Past performance does not predict future performance and the graph above does not reflect the deduction of taxes that you would pay on fund distributions or the redemption of fund shares. Performance shown in the chart above does not include any applicable sales charges and fees. Wasatch does not charge any sales fees. The chart represents a hypothetical $10,000 investment at the beginning of the time period shown. The Russell 2000 Index is an unmanaged total return index of the smallest 2,000 companies in the Russell 3000 Index, as ranked by total market capitalization. The Russell 2000 Index is widely regarded in the industry as accurately capturing the universe of small company stocks. You cannot invest directly in this or any index.
5
Table of Contents
| WASATCH EMERGING MARKETS SMALL CAP FUND (WAEMX) — Management Discussion | MARCH 31, 2009 | |
The Wasatch Emerging Markets Small Cap Fund is managed by a team of Wasatch portfolio managers, led by Roger Edgley and Laura Geritz.
Roger D. Edgley, CFA Portfolio Manager |
Laura Geritz, CFA Portfolio Manager | OVERVIEW
For the six months ended March 31, 2009, the Wasatch Emerging Markets Small Cap Fund returned -33.77% and trailed the -23.63% return of the MSCI Emerging Markets Small Cap Index. |


Almost all of the Fund’s negative return occurred in the fourth quarter of 2008, when the U.S.-induced credit crisis led to economic slowdowns in many of the world’s economies. Investors reacted to economic distress by indiscriminately selling, taking down virtually all stocks, in all sectors, and in all regions. For most of the period, emerging markets bore the brunt of the selling as they were deemed to be the riskiest areas for investors.
Near the end of the period, investors began to realize that the economies of emerging nations were holding up much better than those of developed countries. Many of these nations, like Asia in the late 1990s, learned valuable lessons from their own financial crises. They have since been much more conservative. In general, emerging economies function with less debt and their banking systems are not exposed to the risky financial innovations that have recently weakened developed world economies. Investors also began to take note of emerging market companies. These companies are generally characterized by faster growth, better future growth forecasts, higher quality, and healthier balance sheets than their counterparts in the developed world.
When panic selling was replaced by a more rational sorting out, we were glad to see emerging markets start to outperform developed markets. We remain excited about the long-term potential of small companies in these vibrant, relatively healthy emerging economies.
DETAILSOFTHE PERIOD
Holding too much in some regions and not enough in others had significant impact on the Fund’s performance in the last six months. Brazil, our largest weight in Latin America, was a big detractor. When the global recession set in and demand for commodities was sharply curtailed, investments in producer nations like Brazil were liquidated. More than just commodity-related stocks were swept aside, including many of our holdings whose business models are relatively resistant to economic downturns. Among these were OdontoPrev S.A., the largest dental care provider in Brazil, and Amil Participacoes S.A., the second largest medical plan operator. Our take is that, over the long-term, demand for commodities will increase with the growth of emerging economies like China and India. This should support natural resource-dominated economies like Brazil’s.
Taiwan benefited from a strong run in technology stocks and we missed most of it because we were significantly underweight in this space. Taiwan’s technology sector primarily manufactures electronic components for products sold in developed markets. We have spent long hours with our colleagues at Wasatch looking at these types of companies. In the end we concluded that there are better investments for the Fund over a three- to five-year time horizon than companies whose fortunes depend on strapped U.S. consumers.
Our largest country weight is China, a plus for the period. The Chinese government is pushing for economic growth to come more from domestic demand and less from exports. We have identified several attractive themes in China that stand to benefit from this push, including consumer-focused companies, growth of the Internet, and accelerated health care spending.
Despite a March rally that pulled many financial stocks from historic lows, our financial holdings were a drag on performance over the past six months. We seek to own financials with strong positions in their local markets that we believe will continue to grow earnings in the face of the macroeconomic downturn. We also like global stock exchanges. They are often monopolies and do not suffer from impaired balance sheets like many financial institutions in the developed world. Trade volumes have been healthy and we believe these companies will survive to see much better days. One of our top contributors for the period was BM&F Bovespa S.A., Brazil’s primary stock exchange and Latin America’s biggest exchange. Current and future portfolio holdings are subject to risk.
OUTLOOK
World markets will continue to experience rough patches as governments work to get their economies out of this slump. While staying aware of the challenges that lie ahead, we remain excited about the prospects we are seeing. Stocks are attractively valued having been overly penalized in 2008, and we are having good success identifying companies that meet our investment criteria. We like the quality of our portfolio companies and believe that they have the potential, not only to produce earnings growth of at least 15% annually over the next three to five years, but also to grow in approximately this range in the next year.
For emerging markets investors, volatility comes with the territory. It can be tough to stomach at times, but we believe that the best way to mitigate it is to invest in companies with strong earnings growth and to be patient. Over time, we believe that the Fund will be rewarded.
Thank you for the opportunity to manage your assets.
| CFA® is a registered trademark owned by CFA Institute. |
6
Table of Contents
| WASATCH EMERGING MARKETS SMALL CAP FUND (WAEMX) — Portfolio Summary | MARCH 31, 2009 | |
AVERAGE ANNUAL TOTAL RETURNS
| SIX MONTHS* | 1 YEAR | 5 YEARS | SINCE INCEPTION 10/1/07 | |||||
Emerging Markets Small Cap | -33.77% | -51.12% | N/A | -44.71% | ||||
MSCI Emerging Markets Small Cap Index | -23.63% | -49.99% | N/A | -43.55% | ||||
MSCI Emerging Markets Index | -26.91% | -47.07% | N/A | -38.02% |
Performance data quoted represents past performance. Past performance is not indicative of future performance and current performance may be lower or higher than the performance quoted. Wasatch Funds will deduct a fee of 2% from redemption proceeds on Fund shares held 60 days or less. Performance data does not reflect the deduction of this fee which, if charged, would reduce the performance quoted. The table above does not reflect the deduction of taxes that you would pay on fund distributions or the redemption of fund shares.
The Total Annual Fund Operating Expenses for the Wasatch Emerging Markets Small Cap Fund are 2.69%. Total Annual Fund Operating Expenses include direct expenses paid to the Advisor as well as indirect expenses incurred by the Fund as a result of its investments in other investment companies (each an “Acquired Fund”), before any expense reimbursements by the Advisor. The Net Expenses may differ due to waivers and reimbursements by the Advisor. See the prospectus for additional information regarding Fund expenses.
To obtain the most recent month-end performance, please visit www.wasatchfunds.com or call 800.551.1700. Investment returns and principal value will fluctuate and shares, when redeemed, may be worth more or less than their original cost. The Advisor may have absorbed, currently or in the past, certain Fund expenses, without which total returns would have been lower.
Investing in foreign securities, especially in emerging markets, entails special risks, such as currency fluctuations and political uncertainties, which are described in more detail in the prospectus. Investing in small cap funds will be more volatile and loss of principal could be greater than investing in large cap or more diversified funds.
| * | Not annualized. |
TOP 10 EQUITY HOLDINGS**
| Company | % of Fund | |
| Anta Sports Products Ltd. (China) | 2.94% | |
| Shandong Weigao Group Medical Polymer Co. Ltd., Class H (China) | 2.54% | |
| CP ALL PCL (Thailand) | 2.20% | |
| Ports Design Ltd. (Hong Kong) | 2.16% | |
| Banco do Estado do Rio Grande do Sul S.A., Series B Pfd (Brazil) | 2.07% |
| Company | % of Fund | |
| Kingdee International Software Group Co. Ltd. (China) | 2.07% | |
| Dabur India Ltd. (India) | 1.98% | |
| Coca-Cola Icecek AS (Turkey) | 1.97% | |
| Wasion Group Holdings Ltd. (Hong Kong) | 1.95% | |
| Egyptian Co. for Mobile Services (Egypt) | 1.94% | |
| 21.82% | ||
| ** | As of March 31, 2009, the Fund had 21.82% invested in the Top 10 equity holdings and there were 67 long-term holdings in the Fund. Portfolio holdings are subject to change at any time. References to specific securities should not be construed as recommendations by the Funds or their Advisor. Current and future holdings are subject to risk. |
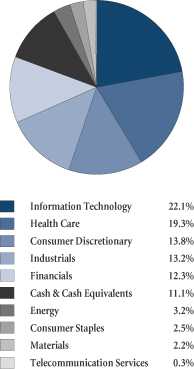
SECTOR BREAKDOWN†
†Excludes | securities sold short and written options, if any. |
GROWTHOFA $10,000 INVESTMENT
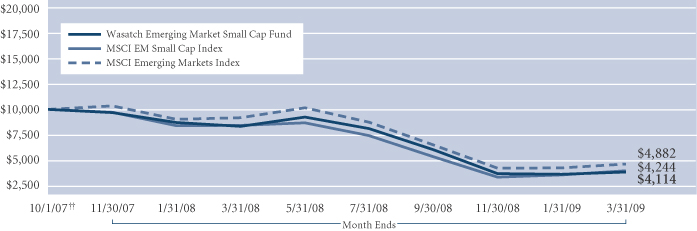
Past performance does not predict future performance and the graph above does not reflect the deduction of taxes that you would pay on fund distributions or the redemption of fund shares. Performance shown in the chart above does not include any applicable sales charges and fees. Wasatch does not charge any sales fees. The chart represents a hypothetical $10,000 investment at the beginning of the time period shown. ††Inception: October 1, 2007. The MSCI Emerging Markets and Small-Mid Cap Indexes are free float-adjusted market capitalization indexes that are designed to measure equity market performance in the global emerging markets. As of June 2006, the MSCI Emerging Markets Index consisted of the following 25 emerging market country indexes: Argentina, Brazil, Chile, China, Colombia, Czech Republic, Egypt, Hungary, India, Indonesia, Israel, Jordan, Korea, Malaysia, Mexico, Morocco, Pakistan, Peru, Philippines, Poland, Russia, South Africa, Taiwan, Thailand, and Turkey. You cannot invest directly in these or any indexes.
7
Table of Contents
| WASATCH GLOBAL OPPORTUNITIES FUND (WAGOX) — Management Discussion | MARCH 31, 2009 | |
The Wasatch Global Opportunities Fund is managed by a team of Wasatch portfolio managers led by Robert Gardiner and Blake Walker.
Robert Gardiner, CFA Portfolio Manager |
Blake H. Walker Portfolio Manager | OVERVIEW
The Global Opportunities Fund provided a total return of 10.00% for the period between its November 17, 2008 inception and March 31, 2009. This compared to a return of -2.23% |


for the MSCI AC World Small Cap Index, -3.61% for the S&P Global SmallCap Index, and -6.13% for the all-cap MSCI AC World Index. Global stock markets continued to be roiled during the period by uncertainties surrounding the unwinding of the financial crisis and the extent and depth of the current global recession. March saw a partial rebound off of recent lows.
The Fund’s outperformance has been the result of several factors. We outperformed with both our U.S. and international selections. As a general rule, we were underweight in underperforming sectors and overweight in outperforming sectors. More importantly, our stock picking within sectors was generally good. Our top 25 most heavily weighted holdings — our best ideas, did well. We are especially pleased that performance was not aided by the “new fund” effect where large positions in a small fund result in significant outperformance quickly. The Fund had well over 200 names virtually from day one, and we believe this speaks to the quality of the performance and the potential to extend these results over the long-run.
DETAILSOFTHE PERIOD
Almost all the news was good in the technology arena. We were significantly overweight in the sector and it was one of the best performing sectors in the market. In addition, semiconductors were the top performing industry group within technology and we had a large overweighting there. We simply believed that these stocks had been badly oversold given that a large part of the downturn in their numbers was related to an inventory correction. Big contributors included O2Micro International Ltd., Pericom Semiconductor Corp., Advanced Analogic Technologies, Inc., Wolfson Microelectronics plc and PLX Technologies, Inc.
Consumer discretionary stocks outperformed the market and we did extremely well with our selections in the category. A Japanese provider of wedding services, Best Bridal, Inc., did particularly well. Most of our selections within retail did exceptionally well. Some of the standouts included U.S. companies O’Reilly Automotive, Inc., casual apparel firm Buckle, Inc., Hibbett Sports, Inc., low-cost retailer DollarTree, Inc. and Big Five Sporting Goods Corp. In China we had some big winners among sports equipment and apparel retailers.
Despite some caution given the direction of the Obama administration, we are significantly overweight in health care. These stocks took a large hit around the time of the Fund’s opening in November, based on fears over the incoming administration’s likely policy. We took the opportunity to buy companies we believed were attractively valued and their stocks have since rebounded significantly. The biggest outperformance came from medical device companies and, to a lesser degree, health care services companies. Our top holding, VNUS Medical Technologies, Inc. turned in strong results and we’re projecting further growth. The stock price of our third largest holding, Abcam plc, a supplier of antibodies used in medical research, also experienced a sharp rise.
Perhaps our single most satisfying result came from our investments in the financials sector. While we lost money during the period, we lost much less than the overall market. We made a conscious decision to underweight the financials sector, and within the sector to overweight diversified financial services firms, such as money managers and exchanges, and to underweight real estate, insurance and banks. In banking, we made a decision to invest more heavily outside of the U.S. All of the above have proven to be beneficial so far.
Our biggest area of disappointment was in our consumer staples investments. These companies had done well for a long time, but investors began to rotate out of them into areas that have been beaten down, such as consumer discretionary and technology stocks. We were underweight in this area, which should have helped. However, we had a few selections that did poorly. Current and future portfolio holdings are subject to risk.
Finally, we have been overweight in China, as well as Hong Kong and South Korea, and this has helped the Fund’s performance significantly. However, our performance in China lagged the market as a result of several companies that experienced management and corporate governance issues. We continue to like China as an investment venue.
OUTLOOK
That stocks rallied in March raised hopes for some that the markets have bottomed. We don’t have a strong conviction either way. The more important point is that we don’t spend the majority of our time on the macro-environment. Instead, we focus on bottom-up stock selection in all environments, with a focus on smaller companies.
We look for great companies in every region of the globe and every industry. Our effort involves extensive research, conducting company-by-company financial analysis and traveling around the world to meet with management teams. This has resulted in a portfolio of over 250 stocks — a lot of companies but it’s a big world and we want to be everywhere.
Thank you for the opportunity to manage your assets.
| CFA® is a registered trademark of CFA Institute. |
8
Table of Contents
| WASATCH GLOBAL OPPORTUNITIES FUND (WAGOX) — Portfolio Summary | MARCH 31, 2009 | |
AVERAGE ANNUAL TOTAL RETURNS
| 1 MONTH* | 3 MONTHS* | SINCE INCEPTION 11/17/08* | ||||
Global Opportunities | 9.45% | -1.35% | 10.00% | |||
MSCI AC World Small Cap Index | 8.84% | -9.19% | -2.23% | |||
S&P Global SmallCap Index | 8.42% | -10.17% | -3.61% | |||
MSCI AC World Index | 8.24% | -10.70% | -6.13% |
Performance data quoted represents past performance. Past performance is not indicative of future performance and current performance may be lower or higher than the performance quoted. Wasatch Funds will deduct a fee of 2% from redemption proceeds on Fund shares held 60 days or less. Performance data does not reflect the deduction of this fee which, if charged, would reduce the performance quoted. The table above does not reflect the deduction of taxes that you would pay on fund distributions or the redemption of fund shares.
The Total Annual Fund Operating Expenses for the Wasatch Global Opportunities Fund are 2.61%. Total Annual Fund Operating Expenses include direct expenses paid to the Advisor as well as indirect expenses incurred by the Fund as a result of its investments in other investment companies (each an “Acquired Fund”), before any expense reimbursements by the Advisor. The Net Expenses may differ due to waivers and reimbursements by the Advisor. See the prospectus for additional information regarding Fund expenses.
To obtain the most recent month-end performance, please visit www.wasatchfunds.com or call 800.551.1700. Investment returns and principal value will fluctuate and shares, when redeemed, may be worth more or less than their original cost. The Advisor may have absorbed, currently or in the past, certain Fund expenses, without which total returns would have been lower.
Investing in small and micro cap funds will be more volatile and loss of principal could be greater than investing in large cap or more diversified funds. Investing in foreign securities entails special risks, such as currency fluctuations and political uncertainties, which are described in more detail in the prospectus. Investments in emerging markets are subject to the same risks as other foreign securities and may be subject to greater risks than investments in foreign countries with more established economies and securities markets.
| * | Not annualized. |
TOP 10 EQUITY HOLDINGS**
| Company | % of Fund | |
| VNUS Medical Technologies, Inc. | 2.33% | |
| Wirecard AG (Germany) | 1.63% | |
| Abcam plc (United Kingdom) | 1.50% | |
| AmSurg Corp. | 1.14% | |
| Resources Connection, Inc. | 1.10% | |
| Ted Baker plc (United Kingdom) | 1.04% |
| Company | % of Fund | |
| LMA International N.V. (Singapore) | 1.03% | |
| Ports Design Ltd. (Hong Kong) | 0.95% | |
| O2Micro International Ltd. ADR (Cayman Islands) | 0.87% | |
| Anta Sports Products Ltd. (China) | 0.83% | |
| 12.42% | ||
| **As | of March 31, 2009, the Fund had 12.42% invested in the Top 10 equity holdings and there were 268 long-term holdings in the Fund. Portfolio holdings are subject to change at any time. References to specific securities should not be construed as recommendations by the Funds or their Advisor. Current and future holdings are subject to risk. |
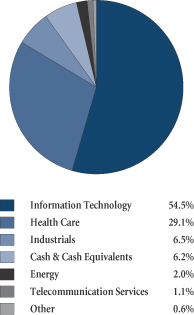
SECTOR BREAKDOWN†
†Excludes | securities sold short and written options, if any. |
GROWTHOFA $10,000 INVESTMENT
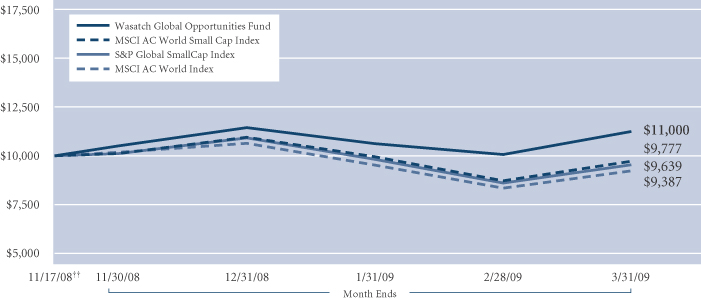
Past performance does not predict future performance and the graph above does not reflect the deduction of taxes that you would pay on fund distributions or the redemption of fund shares. Performance shown in the chart above does not include any applicable sales charges and fees. Wasatch does not charge any sales fees. The chart represents a hypothetical $10,000 investment at the beginning of the time period shown. The MSCI AC World Small Cap Index is an unmanaged index and includes reinvestment of all dividends of issuers located in countries throughout the world representing developed and emerging markets, including securities of U.S. issuers, with market capitalizations between US $200 million and $1.5 billion. The S&P Global Small Cap Index is an unmanaged index and includes reinvestment of all dividends of issuers located across developed and emerging markets, including the United States, who fall in the bottom 15% of their country’s market cap range. The MSCI AC World Index is an unmanaged index and includes reinvestment of all dividends of issuers located in countries throughout the world representing developed and emerging markets, including securities of U.S. issuers, of all capitalizations. You cannot invest directly in these or any indexes.
9
Table of Contents
| WASATCH GLOBAL SCIENCE & TECHNOLOGY FUND (WAGTX) — Management Discussion | MARCH 31, 2009 | |
The Wasatch Global Science & Technology Fund is managed by a team of Wasatch portfolio managers, led by Sam Stewart.
Samuel S. Stewart, Jr. PhD, CFA Portfolio Manager | OVERVIEW
Amid extremely poor performance for the broader market, the Wasatch Global Science & Technology Fund returned -27.45% for the six months ended March 31, 2009. The Fund outperformed the -28.62% return of its primary benchmark, the Russell 2000 Technology Index, and trailed the -26.48% return of the Nasdaq Composite Index. The fourth quarter of 2008, a time of extreme turmoil in the global financial |
markets, was challenging for the Fund. Since the new year began, the Fund has been helped by the fact that individual company fundamentals, rather than macroeconomic factors, have been the key driver of stock prices. This has been a positive for the Fund given our emphasis on companies with high earnings potential, attractive valuations, and strong product cycles.
DETAILSOFTHE PERIOD
The Fund’s technology stocks held up much better than those in the Russell 2000 Technology Index during the difficult market conditions of the last six months. Here, we were helped by many of our overseas holdings, some of which came through with strongly positive returns at a time when the returns of many technology stocks were deep in negative territory. The Fund’s top contributor was Wasion Meters Group Ltd., a China-based manufacturer of electronic power meters and data collection terminals for the gas, electricity, and water industries. Another strong performer was Tandberg ASA, a Norway-based designer of digital compression systems for on-demand television content. The company reported strong earnings in a potentially challenging environment, helping its share price to rise over 38%.
The better performance of our technology holdings was mostly offset by our selection of holdings in the health care sector. Here, the downturn in three senior assisted-living companies — Emeritus Corp., Capital Senior Living Corp. and Sunrise Senior Living, Inc. — weighed heavily on the Fund’s return. Our original thesis for investing in these companies was that the aging U.S. population would mean that the long-term demand for rooms in such facilities would likely outstrip the supply. However, demand came under pressure as the slowing economy led many families to postpone the expense of long-term care if possible. Additionally, these companies tend to have higher levels of debt due to their large real estate holdings. At a time of constricted credit, heavily indebted companies generally produced poor performance. We elected to eliminate all of the Fund’s holdings in this group.
Outside of the assisted-living group, many of the Fund’s prominent detractors were technology companies exposed to weakness in the industrials sector, such as Melexis N.V., a Belgian company that generates 70% of its revenues from the auto sector; and two manufacturers of computer-aided design solutions used by industrial companies: Rolta India Ltd. and Autodesk, Inc. Two other detractors of note were Tulip Telecom Ltd., an Indian telecommunication services provider whose shares fell 73%; and Goodpack Ltd., a Singapore-based manufacturer of shipping containers and packaging.
Somewhat surprisingly given the poor performance of the foreign markets, many of our non-U.S. holdings delivered strong returns during the past six months. In addition to the technology holdings we mentioned, a couple of health care companies also produced strong returns. The Fund benefited from positions in EPS Co. Ltd., a Japanese clinical research organization, and DiaSorin S.p.A, an Italian manufacturer of diagnostics kits. Current and future portfolio holdings are subject to risk.
OUTLOOK
It’s during bear markets* when fundamental research becomes most important. We say this because it is the in-depth knowledge of the companies in our portfolio that helps us discern whether the poor performance of individual stocks is the result of deteriorating fundamentals or simply the impact of general market fears. We will not always be right on this count — as evidenced by our experience with the senior assisted-living companies — and in these cases we will not hesitate to sell and move on to better opportunities. Still, we believe the Fund is populated with attractively valued companies that have identifiable, stock-specific drivers of earnings growth** and represent the favorite picks of the Wasatch health care and technology analysts’ teams. As such, the composition of the portfolio reflects the countless hours we have devoted to researching company fundamentals, getting to know management teams, and traveling around the world to conduct “on the ground” research.
This process has given us a high level of conviction in the individual companies we hold in the Fund. With valuations becoming increasingly attractive across the technology and health care sectors, we believe that a return to more normal market conditions will allow the solid fundamentals of our holdings to be reflected in their stock prices. We are confident that our patient, disciplined approach has the potential to be rewarded over time.
Thank you for the opportunity to manage your assets.
| CFA® is a registered trademark of CFA Institute. |
| * | A bear market is generally defined as a drop of 20% or more in stock prices over at least a two-month period. |
| ** | Earnings growth is a measure of growth in a company’s net income over a specific period, often one year. |
10
Table of Contents
| WASATCH GLOBAL SCIENCE & TECHNOLOGY FUND (WAGTX) — Portfolio Summary | MARCH 31, 2009 | |
AVERAGE ANNUAL TOTAL RETURNS
| SIX MONTHS* | 1 YEAR | 5 YEARS | SINCE INCEPTION 12/19/00 | |||||
Global Science & Technology | -27.45% | -36.56% | -6.26% | -1.43% | ||||
Russell 2000 Technology Index | -28.62% | -30.26% | -8.65% | -10.09% | ||||
Nasdaq Composite Index | -26.48% | -32.25% | -4.43% | -5.72% |
Performance data quoted represents past performance. Past performance is not indicative of future performance and current performance may be lower or higher than the performance quoted. Wasatch Funds will deduct a fee of 2% from redemption proceeds on Fund shares held 60 days or less. Performance data does not reflect the deduction of this fee which, if charged, would reduce the performance quoted. The table above does not reflect the deduction of taxes that you would pay on fund distributions or the redemption of fund shares.
The Total Annual Fund Operating Expenses for the Wasatch Global Science & Technology Fund are 1.92%. Total Annual Fund Operating Expenses include direct expenses paid to the Advisor as well as indirect expenses incurred by the Fund as a result of its investments in other investment companies (each an “Acquired Fund”), before any expense reimbursements by the Advisor. The Net Expenses may differ due to waivers and reimbursements by the Advisor. See the prospectus for additional information regarding Fund expenses.
To obtain the most recent month-end performance, please visit www.wasatchfunds.com or call 800.551.1700. Investment returns and principal value will fluctuate and shares, when redeemed, may be worth more or less than their original cost. The Advisor may have absorbed, currently or in the past, certain Fund expenses, without which total returns would have been lower.
Investing in concentrated funds will be more volatile and loss of principal could be greater than investing in more diversified funds. Investing in foreign securities, especially in emerging markets, entails special risks, such as currency fluctuations and political uncertainties, which are described in more detail in the prospectus.
| * | Not annualized. |
TOP 10 EQUITY HOLDINGS**
| Company | % of Fund | |
| Cognizant Technology Solutions Corp., Class A | 3.78% | |
| O2Micro International Ltd. ADR (Cayman Islands) | 2.94% | |
| Taiwan Semiconductor Manufacturing Co. Ltd. ADR (Taiwan) | 2.18% | |
| Wirecard AG (Germany) | 2.00% | |
| Netlogic Microsystems, Inc. | 1.97% |
| Company | % of Fund | |
| Redecard S.A. (Brazil) | 1.95% | |
| VNUS Medical Technologies, Inc. | 1.91% | |
| Infosys Technologies Ltd. (India) | 1.90% | |
| F5 Networks, Inc. | 1.88% | |
| DealerTrack Holdings, Inc. | 1.86% | |
| 22.37% | ||
| ** | As of March 31, 2009, the Fund had 22.37% invested in the Top 10 equity holdings and there were 83 long-term holdings in the Fund. Portfolio holdings are subject to change at any time. References to specific securities should not be construed as recommendations by the Funds or their Advisor. Current and future holdings are subject to risk. |
SECTOR BREAKDOWN†
†Excludes | securities sold short and written options, if any. |
GROWTHOFA $10,000 INVESTMENT
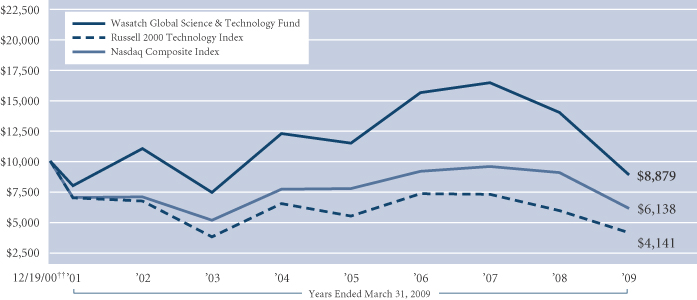
Past performance does not predict future performance and the graph above does not reflect the deduction of taxes that you would pay on fund distributions or the redemption of fund shares. Performance shown in the chart above does not include any applicable sales charges and fees. Wasatch does not charge any sales fees. The chart represents a hypothetical $10,000 investment at the beginning of the time period shown. ††Inception: December 19, 2000. The Russell 2000 Technology Index is a capitalization-weighted index of companies that serve the electronics and computer industries or that manufacture products based on the latest applied science. The Nasdaq Composite Index is unmanaged and measures all Nasdaq domestic and non-U.S. based common stocks listed on The Nasdaq Stock Market. The Index is market-value weighted. This means each company’s security affects the Index in proportion to its market value. The market value, the last sale price multiplied by total shares outstanding, is calculated throughout the trading day, and is related to the total value of the Index. Due to their number and size, technology stocks tend to dominate the direction of the Index. You cannot invest directly in these or any indexes.
11
Table of Contents
| WASATCH HERITAGE GROWTH FUND (WAHGX) — Management Discussion | MARCH 31, 2009 | |
The Wasatch Heritage Growth Fund is managed by a team of Wasatch portfolio managers, led by Chris Bowen and Ryan Snow.
Chris Bowen Portfolio Manager |
Ryan Snow Portfolio Manager | OVERVIEW
Amid harsh economic challenges and unprecedented market volatility, the Wasatch Heritage Growth Fund declined 23.87% during the six-month period ended March 31, 2009. This com- |


pared favorably to the Fund’s benchmarks as the Russell 1000 Growth fell 25.97% and the Russell Midcap Growth fared even worse, slumping 29.81%, while the S&P 500 lost 30.54%.
The broad-based market retreat was profound in its scope as every sector in the indexes declined substantially. Market losses continued for most of the period as economic uncertainty put a damper on investor confidence. A powerful market rally that started in early March closed the period.
Despite the market’s late rally, global economic problems persist and near-term visibility remains limited. While the earnings of many of the Fund’s holdings will be lower this year than last year, company fundamentals appear solid. Projected earnings growth* for our holdings is expected to be down significantly less than the overall market. We believe the Fund remains nicely positioned because it holds companies that are market share leaders, employ top management teams, and have solid balance sheets and sustainable business models that generate substantial cash. Core to our investment philosophy is that these types of companies have the best potential to be rewarded over the long run.
While we’re not pleased that the Fund lost money for our valued shareholders, we believe that our outperformance of the general market is a result of our investment discipline. As investor tolerance for risk wanes, high quality stocks, like the ones we believe the Fund holds, typically benefit as investors flee to the safety of more reliable companies. Even with the barrage of information and events that have unfolded lately, our core process and philosophy have remained unchanged.
DETAILSOFTHE PERIOD
Given the current economic turbulence, we have been pleased by the business performance of our top holdings. Especially important in this economic climate, the majority of companies in the Fund continue to generate cash that allows them to self-finance their operations and thus avoid the sticky capital and credit markets.
Not surprisingly, the Fund’s top performing stocks during the period had a countercyclical element to them. While they offered some insulation from the market devastation, we also believe that they have the potential to do well in a more normal environment.
The top performing stock was long-time holding Apollo Group, Inc. The company operates private universities that
provide post-secondary education to working adults. While the recession and higher unemployment has certainly played a role in Apollo Group’s recent success, our enduring investment theme revolves around the ongoing desire of workers to increase their skills in order to procure more gainful employment.
O’Reilly Automotive, Inc., an auto parts retailer and distributor, was also a top-performer. With a recession upon us, new car sales have plummeted, keeping older automobiles on the road and heightening the need for aftermarket parts and supplies. We also approved of O’Reilly’s recent acquisition of CSK Auto, which provides the company with a West Coast presence.
Information technology (IT) company BMC Software, Inc. also supplied a boost to the Fund’s results. BMC provides software that allows companies to decrease the high human capital costs of monitoring technological operations, and to have fewer business disruptions by automating, prioritizing and optimizing the functions of a firm’s servers and other IT resources.
Two holdings that weighed heavily on the downside were pharmaceutical companies Covance, Inc. and Express Scripts, Inc. Both companies suffered in part due to the uncertainty surrounding health care with President Obama’s election. Covance, a research service provider for pharmaceutical firms, was our largest detractor from performance during the period. With 40% of its revenue generated overseas, a strengthening dollar along with some new project delays dampened its near-term revenue outlook. Despite what we feel will be temporarily slower growth, Covance’s backlog of servicing opportunities has us encouraged about the company’s prospects and we increased our position when the stock price fell.
We’ve also continued to hold a significant position in pharmacy benefits manager Express Scripts. The company’s services are designed to help clients save money on their prescription medications. With an unprecedented number of generic drugs expected to come to market over the next few years, Express Scripts should be a key beneficiary as the more money the company saves for clients through generic substitution the better Express Scripts does. Current and future portfolio holdings are subject to risk.
OUTLOOK
We are in uncharted territory regarding our ability to forecast key metrics like captured earnings growth and appropriate valuations. Due to the fogginess in the economy, we are finding that even traditionally stable businesses have little visibility into the near future and have been reluctant to offer outlooks for 2009. We view this as a short-term hurdle, and are much more concerned with where our companies will be several years down the road rather than in several months.
We look forward to the challenge of helping you meet your investment needs and sincerely appreciate your trust and confidence.
Thank you for the opportunity to invest your assets.
| * | Earnings growth is a measure of growth in a company’s net income over a specific period, often one year. |
12
Table of Contents
| WASATCH HERITAGE GROWTH FUND (WAHGX) — Portfolio Summary | MARCH 31, 2009 | |
AVERAGE ANNUAL TOTAL RETURNS
| SIX MONTHS* | 1 YEAR | 5 YEARS | SINCE INCEPTION 6/18/04 | |||||
Heritage Growth | -23.87% | -30.30% | N/A | -4.69% | ||||
Russell Midcap Growth Index | -29.81% | -39.58% | N/A | -3.88% | ||||
S&P 500 Index | -30.54% | -38.09% | N/A | -5.15% | ||||
Russell 1000 Growth Index | -25.97% | -34.28% | N/A | -4.84% |
Performance data quoted represents past performance. Past performance is not indicative of future performance and current performance may be lower or higher than the performance quoted. Wasatch Funds will deduct a fee of 2% from redemption proceeds on Fund shares held 60 days or less. Performance data does not reflect the deduction of this fee which, if charged, would reduce the performance quoted. The table above does not reflect the deduction of taxes that you would pay on fund distributions or the redemption of fund shares.
The Total Annual Fund Operating Expenses for the Wasatch Heritage Growth Fund are 1.01%. Total Annual Fund Operating Expenses include direct expenses paid to the Advisor as well as indirect expenses incurred by the Fund as a result of its investments in other investment companies (each an “Acquired Fund”), before any expense reimbursements by the Advisor. The Net Expenses may differ due to waivers and reimbursements by the Advisor. See the prospectus for additional information regarding Fund expenses.
To obtain the most recent month-end performance, please visit www.wasatchfunds.com or call 800.551.1700. Investment returns and principal value will fluctuate and shares, when redeemed, may be worth more or less than their original cost. The Advisor may have absorbed, currently or in the past, certain Fund expenses, without which total returns would have been lower.
Investing in mid cap funds will be more volatile and loss of principal could be greater than investing in large cap funds. Equity investing involves risks including potential loss of the principal amount invested.
| * | Not annualized. |
TOP 10 EQUITY HOLDINGS**
| Company | % of Fund | |
| St. Jude Medical, Inc. | 4.68% | |
| Altera Corp. | 4.20% | |
| BMC Software, Inc. | 3.89% | |
| Redecard S.A. (Brazil) | 3.84% | |
| Amphenol Corp., Class A | 3.73% | |
| Copart, Inc. | 3.52% |
| Company | % of Fund | |
| Infosys Technologies Ltd. (India) | 3.43% | |
| Express Scripts, Inc. | 3.24% | |
| CVS Caremark Corp. | 3.04% | |
| IntercontinentalExchange, Inc. | 2.64% | |
| 36.21% | ||
| ** | As of March 31, 2009, the Fund had 36.21% invested in the Top 10 equity holdings and there were 50 long-term holdings in the Fund. Portfolio holdings are subject to change at any time. References to specific securities should not be construed as recommendations by the Funds or their Advisor. Current and future holdings are subject to risk. |
SECTOR BREAKDOWN†

†Excludes | securities sold short and written options, if any. |
GROWTHOFA $10,000 INVESTMENT
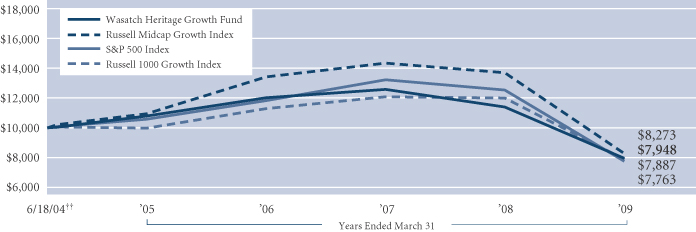
Past performance does not predict future performance and the graph above does not reflect the deduction of taxes that you would pay on fund distributions or the redemption of fund shares. Performance shown in the chart above does not include any applicable sales charges and fees. Wasatch does not charge any sales fees. The chart represents a hypothetical $10,000 investment at the beginning of the time period shown. ††Inception: June 18, 2004. The Russell Midcap Growth Index measures the performance of those Russell Midcap Index companies with higher price-to-book ratios and higher forecasted growth values. The stocks in the Russell Midcap Growth Index are also members of the Russell 1000 Growth Index. The S&P 500 Index represents 500 of the United States’ largest stocks from a broad variety of industries. The index is unmanaged, and a common measure of common stock total return performance. The Russell 1000 Growth Index measures the performance of those Russell 1000 Index companies with higher price-to-book ratios and higher forecasted growth values. You cannot invest directly in these or any indexes.
13
Table of Contents
| WASATCH HERITAGE VALUE FUND (WAHVX) — Management Discussion | MARCH 31, 2009 | |
The Wasatch Heritage Value Fund is managed by a team of Wasatch portfolio managers, led by Brian Bythrow.
Brian Bythrow, CFA Portfolio Manager
| OVERVIEW
After the volatile and even shocking developments at the end of the last reporting period, investors who thought relief would come in this one were disappointed. The financial markets continued to experience significant turmoil through the end of 2008 and into 2009, as risk-wary investors shed equities in favor of less-volatile assets, and the market offered few safe havens from the meltdown. |

The Federal Reserve threw virtually all the ammunition it had at the crisis, joined at many points by the efforts of other central banks. That these efforts were needed was confirmed by the official pronouncement late in 2008 that the U.S. economy had been in a recession for nearly a year. In the later part of March, stocks managed to stage a strong rally, though opinions were mixed as to whether the upturn marked the early stages of a recovery, or was merely a bear-market* rally.
In this challenging environment, the Wasatch Heritage Value Fund posted a return of -22.23% for the six months, placing it well ahead of the -35.22% return of its benchmark, the Russell 1000 Value Index. We recognize that the positive news of this outperformance is diminished by the substantial loss incurred over the period.
Our outperformance was driven as much by what we didn’t have in the portfolio as by what we did. Within the financials sector, we avoided companies that were exposed to credit risk. This helped our relative performance as such companies came under heavy pressure during the period. We also stayed away from health care stocks that are perceived to be vulnerable to lower government reimbursement levels that may occur if proposed health care reforms are adopted. In addition, our underexposure to consumer discretionary stocks — which were generally pummeled over the six months — benefited performance, as did the strength of our individual selections within the sector.
DETAILSOFTHE PERIOD
Despite a weak period for consumer discretionary stocks overall, the sector was home to our strongest single contributor to performance over the period. O’Reilly Automotive, Inc., a retailer of automotive parts and supplies, has thrived as cost-conscious drivers have elected to keep their cars on the road longer, rather than trading them in, and to perform more routine maintenance themselves. The company has also benefited from its strong management team and solid business model.
Although health care is generally viewed as an area of the economy that is recession-resistant, in recent months many health care companies have been hit by concerns that health care reform would hurt their reimbursement rates. Also, there were signs that consumers were beginning to defer
medical expenses viewed as discretionary. We were, however, able to identify health care companies positioned to benefit from cost-saving efforts. One of these was Mylan Inc., a producer of generic drugs. Mylan was our second-greatest contributor over the period. The company’s products are likely to be in greater demand as consumers — and their insurers — seek to get more for less from their health care dollars. Investors also responded positively as the company successfully integrated more of the operations, and paid down more of the debt, that it picked up in its acquisition of Merck’s generic drug portfolio in 2008.
The consumer staples sector came under some pressure during the period, but held up quite a bit better than many other areas of the market. Another of our top performers for the six months, Hansen Natural Corp., came from the sector, and reflected our emphasis on the food and beverage area. Hansen makes the popular Monster Energy drinks as well as other all-natural beverages. Despite the company’s strong growth prospects, we were able to purchase the stock at a low price in the midst of 2008’s market turmoil. As investors once again recognized the company’s many strengths, the stock price rose to a level that was too expensive for our tastes, so we sold our position. Current and future portfolio holdings are subject to risk.
OUTLOOK
Over the period we trimmed the number of holdings in the portfolio to 30, reflecting profit-taking on successful names, the removal of some companies in which we had lost confidence, and the calling of some stocks on which we had written options. One result of these sales was a significant increase in our cash position. This gives us a healthy level of resources to deploy as we identify companies positioned to benefit from economic stabilization and recovery.
Although the low valuations on many stocks can be appealing, we’re mindful that many of the issues that got the U.S. economy into its current situation are still in place. Foremost among these is that we live in a consumer-driven economy, but highly indebted Americans need to spend less, not more, complicating the prospects for a possible recovery.
We believe a cautious approach is still in order. In the coming months the challenge will be to find the balance between acting deliberately, and avoiding being left on the sidelines when the recovery begins to take hold.
Thank you for the opportunity to manage your assets.
| CFA® is a registered trademark of CFA Institute. |
| * | A bear market is generally defined as a drop of 20% or more in stock prices over at least a two-month period. |
14
Table of Contents
| WASATCH HERITAGE VALUE FUND ( WAHVX) — Portfolio Summary | MARCH 31, 2009 | |
AVERAGE ANNUAL TOTAL RETURNS
| SIX MONTHS* | 1 YEAR | 5 YEARS | SINCE INCEPTION 8/30/07 | |||||
Heritage Value | -22.23% | -30.05% | N/A | -24.40% | ||||
Russell 1000 Value Index | -35.22% | -42.42% | N/A | -34.17% |
Performance data quoted represents past performance. Past performance is not indicative of future performance and current performance may be lower or higher than the performance quoted. Wasatch Funds will deduct a fee of 2% from redemption proceeds on Fund shares held 60 days or less. Performance data does not reflect the deduction of this fee which, if charged, would reduce the performance quoted. The table above does not reflect the deduction of taxes that you would pay on fund distributions or the redemption of fund shares.
The Total Annual Fund Operating Expenses for the Wasatch Heritage Value Fund are 3.89%. Total Annual Fund Operating Expenses include direct expenses paid to the Advisor as well as indirect expenses incurred by the Fund as a result of its investments in other investment companies (each an “Acquired Fund”), before any expense reimbursements by the Advisor. The Net Expenses may differ due to waivers and reimbursements by the Advisor. See the prospectus for additional information regarding Fund expenses.
To obtain the most recent month-end performance, please visit www.wasatchfunds.com or call 800.551.1700. Investment returns and principal value will fluctuate and shares, when redeemed, may be worth more or less than their original cost. The Advisor may have absorbed, currently or in the past, certain Fund expenses, without which total returns would have been lower.
Investments in value stocks can perform differently from the market as a whole and other types of stocks and can continue to be undervalued by the market for long periods of time. Loss of principal is a risk of investing. Being non-diversified, the Fund can invest a larger portion of its assets in the securities of a limited number of companies than a diversified fund. Non-diversification increases the risk of loss to the Fund if the values of these securities decline. Investing in foreign securities, especially in emerging markets, entails special risks, such as currency fluctuations and political uncertainties, which are described in more detail in the prospectus.
| * | Not annualized. |
TOP 10 EQUITY HOLDINGS**
| Company | % of Fund | |
| Mylan, Inc. | 4.06% | |
| Copart, Inc. | 3.80% | |
| Annaly Capital Management, Inc. | 3.69% | |
| Syngenta AG ADR (Switzerland) | 3.65% | |
| Costco Wholesale Corp. | 3.43% | |
| Cognizant Technology Solutions Corp., Class A | 3.43% |
| Company | % of Fund | |
| Activision Blizzard, Inc. | 3.35% | |
| Wal-Mart Stores, Inc. | 3.16% | |
| EMC Corp. | 3.15% | |
| ARC Energy Trust (Canada) | 3.10% | |
| 34.82% | ||
| ** | As of March 31, 2009, the Fund had 34.82% invested in the Top 10 equity holdings and there were 28 long-term holdings in the Fund. Portfolio holdings are subject to change at any time. References to specific securities should not be construed as recommendations by the Funds or their Advisor. Current and future holdings are subject to risk. |
SECTOR BREAKDOWN†
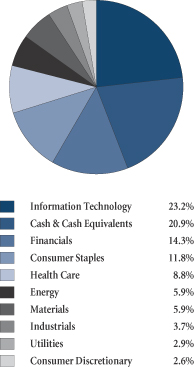
†Excludes | securities sold short and written options, if any. |
GROWTHOFA $10,000 INVESTMENT
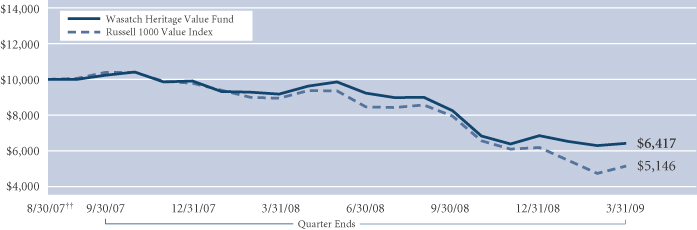
Past performance does not predict future performance and the graph above does not reflect the deduction of taxes that you would pay on fund distributions or the redemption of fund shares. Performance shown in the chart above does not include any applicable sales charges and fees. Wasatch does not charge any sales fees. The chart represents a hypothetical $10,000 investment at the beginning of the time period shown. ††Inception: August 30, 2007. The Russell 1000 Value Index measures the performance of those Russell 1000 Index companies with lower price-to-book ratios and lower forecasted growth values. The Russell 1000 Index measures the performance of the 1,000 largest companies in the Russell 3000 Index. The Russell 3000 Index is an unmanaged total return index of the 3,000 largest U.S. companies based on total market capitalization. You cannot invest directly in these or any indexes.
15
Table of Contents
| WASATCH INTERNATIONAL GROWTH FUND (WAIGX) — Management Discussion | MARCH 31, 2009 | |
The Wasatch International Growth Fund is managed by a team of Wasatch portfolio managers, led by Roger Edgley. Laura Hoffman was a co-manager for the Fund with Mr. Edgley until October 24, 2008.
Roger D. Edgley, CFA Portfolio Manager | OVERVIEW
For the six months ended March 31, 2009, the Wasatch International Growth Fund returned -29.49% compared to a return of -28.98% for the MSCI AC World Ex-U.S.A. Small Cap Index. World markets continued their downhill slide during the period, although the wholesale liquidation of stocks abated somewhat in March. As world governments worked to stimulate their economies and more concrete details about their plans emerged, |
investors began to calm their fears and take the more rational approach of considering the prospects of individual companies and the economic condition of individual regions.
After big losses last year, emerging markets began to outperform developed markets when investors realized that the economies of these countries are healthier and that their banking systems are not in need of systemic repair. For example, China, one of the world’s largest emerging markets, turned in much stronger results than the United Kingdom, whose challenges are symptomatic of those faced by other developed markets. While weakness was widespread across sectors, companies with solid balance sheets that have been able to grow their earnings stood out.
Although time and patience will be required to work through the problems in the global economy and repair badly damaged banking systems in the developed world, we remain optimistic about investing internationally. We expect emerging markets to bounce back more quickly than developed markets. From our perspective as bottom-up investors, we continue to find attractive businesses in our universe at attractive prices.
DETAILSOFTHE PERIOD
We have invested in two themes in China that continued to play out well for the Fund over the past six months. The first is in companies that sell products to China’s growing consumer class. Unlike their debt-ridden counterparts in the developed world, Chinese consumers are unburdened by debt and have the capacity to spend. We think this lends tremendous support to the earnings growth potential of retailers and other consumer-focused companies in China. Sportswear manufacturer Anta Sports Products Ltd. is an investment on this theme that benefited the Fund during the period. We also like the prospects of companies tied to Internet growth in China and recently added three new names to the Fund. While the Fund benefited from the performance of all three companies during the period, NetEase.com, Inc., a provider of online games and communities, was the standout contributor.
The two countries that were the biggest drag on the Fund’s results during the period were the United Kingdom
and Canada. Some of the biggest detractors in these countries were our energy holdings, as the sharp decline in oil and gas prices negatively impacted them. Beyond the handful of emerging countries showing some signs of optimism, the indiscriminate nature of the world economic downturn meant that stocks in most every country were down double digits during the period.
Sectors across the board were also down significantly. Industrials have been hit hard in the global economic downturn and the Fund’s holdings were no exception. Australia-based Campbell Brothers Ltd., a soap and chemical manufacturer, was a large detractor as annual revenues fell short of analysts’ expectations. Japan-based Aeon Delight Co. Ltd. and Nihon M&A Center, Inc. saw their stock prices drop precipitously when the Japanese economy took a turn for the worse as exports collapsed in the first quarter of 2009. Japanese industrial companies will likely see slower growth but their stocks are cheaply valued and they could benefit from a weaker yen and economic growth in other parts of Asia.
Given all the turmoil surrounding the credit markets and banks, it is not surprising that financial stocks were among the weakest performers for the period. Although the sector contained the Fund’s top contributor, it also contained the biggest detractor. On the bottom was the Bank of N.T. Butterfield & Son Ltd. based in Bermuda, whose substantial investment portfolio was hurt by exposure to U.S. fixed-income and mortgage-backed securities. The top contributor was Japan’s Osaka Securities Exchange Co. Ltd. Another exchange that has done well for us is BM&F Bovespa S.A., created by the merger of the Brazilian Mercantile & Futures Exchange and Sao Paulo Stock Exchange. We hold a number of securities exchanges in the Fund because we like their long-term competitive positions and strong balance sheets. Current and future portfolio holdings are subject to risk.
OUTLOOK
We expect emerging markets to lead as the global economy gets on the road to recovery. Economic growth forecasts are stronger for emerging markets and their banking systems are in better shape than those in the developed world. The emerging market companies we hold are characterized by solid balance sheets and strong earnings growth potential. In developed markets, our approach is to focus on companies that we think can withstand the difficult environment better than their competitors and that can start growing their earnings again as global economies begin to expand.
The challenge of investing when the outlook is so cloudy and nearly all stocks are attractively priced is to find companies that can generate earnings growth. At Wasatch, we rely on our time-tested, bottom-up research process to help us identify such companies. Wasatch’s philosophy for more than 30 years has been that “earnings growth drives stock prices over the long-term.” We believe it is especially relevant today.
Thank you for the opportunity to manage your assets.
| CFA® is a registered trademark of CFA Institute. |
16
Table of Contents
| WASATCH INTERNATIONAL GROWTH FUND (WAIGX) — Portfolio Summary | MARCH 31, 2009 | |
AVERAGE ANNUAL TOTAL RETURNS
| SIX MONTHS* | 1 YEAR | 5 YEARS | SINCE INCEPTION 6/28/02 | |||||
International Growth | -29.49% | -50.84% | -4.75% | 2.19% | ||||
MSCI AC World Ex-U.S.A. Small Cap Index | -28.98% | -49.54% | -1.38% | 5.30% |
Performance data quoted represents past performance. Past performance is not indicative of future performance and current performance may be lower or higher than the performance quoted. Wasatch Funds will deduct a fee of 2% from redemption proceeds on Fund shares held 60 days or less. Performance data does not reflect the deduction of this fee which, if charged, would reduce the performance quoted. The table above does not reflect the deduction of taxes that you would pay on fund distributions or the redemption of fund shares.
The Total Annual Fund Operating Expenses for the Wasatch International Growth Fund are 1.83%. Total Annual Fund Operating Expenses include direct expenses paid to the Advisor as well as indirect expenses incurred by the Fund as a result of its investments in other investment companies (each an “Acquired Fund”), before any expense reimbursements by the Advisor. The Net Expenses may differ due to waivers and reimbursements by the Advisor. See the prospectus for additional information regarding Fund expenses.
To obtain the most recent month-end performance, please visit www.wasatchfunds.com or call 800.551.1700. Investment returns and principal value will fluctuate and shares, when redeemed, may be worth more or less than their original cost. The Advisor may have absorbed, currently or in the past, certain Fund expenses, without which total returns would have been lower.
Investing in foreign securities, especially in emerging markets, entails special risks, such as currency fluctuations and political uncertainties, which are described in more detail in the prospectus. Investing in small cap funds will be more volatile and loss of principal could be greater than investing in large cap or more diversified funds.
| * | Not annualized. |
TOP 10 EQUITY HOLDINGS**
| Company | % of Fund | |
| DiaSorin S.p.A (Italy) | 3.63% | |
| Rotork plc (United Kingdom) | 3.10% | |
| Wirecard AG (Germany) | 3.00% | |
| Shandong Weigao Group Medical Polymer Co. Ltd., Class H (China) | 2.63% | |
| Osaka Securities Exchange Co. Ltd. (Japan) | 2.50% | |
| Tandberg ASA (Norway) | 2.40% |
| Company | % of Fund | |
| Bank of N.T. Butterfield & Son Ltd. (Bermuda) | 2.39% | |
| Abcam plc (United Kingdom) | 2.20% | |
| SimCorp A/S (Denmark) | 2.15% | |
| Campbell Brothers Ltd. (Australia) | 2.12% | |
| 26.12% | ||
| ** | As of March 31, 2009, the Fund had 26.12% invested in the Top 10 equity holdings and there were 78 long-term holdings in the Fund. Portfolio holdings are subject to change at any time. References to specific securities should not be construed as recommendations by the Funds or their Advisor. Current and future holdings are subject to risk. |
SECTOR BREAKDOWN†
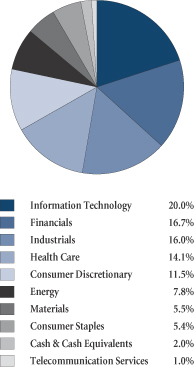
†Excludes | securities sold short and written options, if any. |
GROWTHOFA $10,000 INVESTMENT
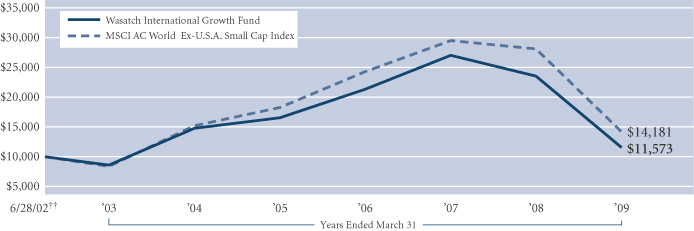
Past performance does not predict future performance and the graph above does not reflect the deduction of taxes that you would pay on fund distributions or the redemption of fund shares. Performance shown in the chart above does not include any applicable sales charges and fees. Wasatch does not charge any sales fees. The chart represents a hypothetical $10,000 investment at the beginning of the time period shown. ††Inception: June 28, 2002. The MSCI AC World Ex-U.S.A. Small Cap Index is an unmanaged index and includes reinvestment of all dividends of issuers located in countries throughout the world representing developed and emerging markets, excluding securities of U.S. issuers. This index is a free float-adjusted market capitalization index designed to measure the performance of small capitalization securities. You cannot invest directly in this or any index.
17
Table of Contents
| WASATCH INTERNATIONAL OPPORTUNITIES FUND (WAIOX) — Management Discussion | MARCH 31, 2009 | |
The Wasatch International Opportunities Fund is managed by a team of Wasatch portfolio managers, led by Roger Edgley and Blake Walker.
Roger D. Edgley, CFA Portfolio Manager |
Blake H. Walker Portfolio Manager | OVERVIEW
The past six months represented a period of almost unprecedented difficulty for the Fund and investors in general, though the latter half of the period showed some signs of hope. Through the end of |
2008, financial institutions around the world were still severely hampered by the global credit crunch, and concerned investors continued their flight out of international stocks. Even China was not immune to the global meltdown, despite a series of short-term rate cuts and the Chinese government’s announcement of a major economic stimulus and infrastructure development plan.
As 2009 dawned, global stocks continued on a volatile path, but unlike recent periods, not all countries were moving in the same direction. A number of emerging markets, including Brazil, Russia, and China, were among those posting positive results in early 2009. While many problems remain to be resolved, both enthusiasm about new leadership in the U.S. and widespread stimulus efforts around the globe are allowing many markets to move past the recent gloom and toward a more rational tone.
During this volatile period, the Wasatch International Opportunities Fund returned -27.85% for the six months ended March 31, 2009. This placed the Fund ahead of its benchmark, the MSCI World Ex-U.S.A. Small Cap Index, which returned - -30.38% over the same period. We recognize that outperforming the Index means little when absolute returns are so poor.
DETAILSOFTHE PERIOD
Our overweighting and stock selection in the health care sector played a major role in our outperformance of the Index. This was the only sector that made a positive contribution to the Fund’s absolute return. Our underweighting in the troubled financials sector also helped. With stocks down so broadly and indiscriminately, though, sector results were of only minimal use.
From a country perspective, our heaviest weighting in the portfolio remained China. This was detrimental to performance over the six months as a whole, though the country rebounded strongly in the first three months of 2009.
China Automation Group Ltd., a provider of safety and control systems for companies in the oil, gas and railroad industries in China, was our greatest positive contributor to performance over the period. The company stands to benefit from China’s massive infrastructure spending plans.
In the health care sector, Shandong Weigao Group Medical Polymer Co. Ltd., a maker of single-use medical devices,
contributed to our relative outperformance. It could be in line to benefit from the ever-increasing emphasis on cost-management in health care.
Of course, not all of our strong performers came from China. In the financials sector, Japan’s Osaka Securities Exchange Co. Ltd. avoided the turmoil rocking most of the sector and produced strong results for the six months. The company benefited from increased trading volume in futures, options, and other derivative securities in Japan. We’re attracted to securities exchanges because their market positions are fairly secure as would-be competitors face high barriers to entry.
Another positive holding over the period was Norway’s Tandberg ASA. This company controls about 40% of the worldwide market for video-conferencing equipment and technology. This sector of the telecom market is of particular interest today, as video conferencing can offer an attractive solution — and return on investment — for companies seeking ways to maintain close client relationships while cutting travel expenses and perhaps reducing their carbon footprint as well.
Unfortunately, a series of unexpected developments — including fraud and errors in judgment by the management of two Singapore-listed Chinese companies, helped make these some of our weakest performers for the period. These situations did more than cause steep declines in the stocks of the companies involved, such as Beauty China Holdings Ltd. They also created a sense of guilt by association that devastated the share prices of companies that appear to have had no part in any wrongdoing, such as athletic shoe and apparel maker China Hongxing Sports Ltd., the greatest detractor from the Fund’s performance for the period. We believe the company — whose valuation is currently below net cash — has been unfairly punished, but we reduced our position somewhat in the name of caution. Current and future portfolio holdings are subject to risk.
OUTLOOK
We are leaving the six months with a more positive outlook than we had when we entered the period. We’re confident that the coordinated fiscal and monetary stimulus activity around the world will eventually work, but we think that will happen sooner in some places (i.e., China) than in others (i.e., the U.S.).
Economic data overwhelmingly suggest that China is likely to experience some of the strongest relative growth in the coming months, and we are comfortable maintaining our overweight there. That said, we are also taking the opportunity to scour all the world’s markets for the best companies we can find. With the valuations of so many companies knocked down to historically low levels, we believe we have opportunities to buy companies with better quality and growth characteristics at better values than at any time in the past.
Thank you for the opportunity to manage your assets.
| CFA® is a registered trademark of CFA Institute. |
18
Table of Contents
| WASATCH INTERNATIONAL OPPORTUNITIES FUND (WAIOX) — Portfolio Summary | MARCH 31, 2009 | |
AVERAGE ANNUAL TOTAL RETURNS
| SIX MONTHS* | 1 YEAR | 5 YEARS | SINCE INCEPTION 1/27/05 | |||||
International Opportunities | -27.85% | -50.02% | N/A | -6.27% | ||||
MSCI World Ex-U.S.A. Small Cap Index | -30.38% | -49.40% | N/A | -7.49% | ||||
MSCI AC World Ex-U.S.A. Small Cap Index | -28.98% | -49.54% | N/A | -5.14% |
Performance data quoted represents past performance. Past performance is not indicative of future performance and current performance may be lower or higher than the performance quoted. Wasatch Funds will deduct a fee of 2% from redemption proceeds on Fund shares held 60 days or less. Performance data does not reflect the deduction of this fee which, if charged, would reduce the performance quoted. The table above does not reflect the deduction of taxes that you would pay on fund distributions or the redemption of fund shares.
The Total Annual Fund Operating Expenses for the Wasatch International Opportunities Fund are 2.54%. Total Annual Fund Operating Expenses include direct expenses paid to the Advisor as well as indirect expenses incurred by the Fund as a result of its investments in other investment companies (each an “Acquired Fund”), before any expense reimbursements by the Advisor. The Net Expenses may differ due to waivers and reimbursements by the Advisor. See the prospectus for additional information regarding Fund expenses.
To obtain the most recent month-end performance, please visit www.wasatchfunds.com or call 800.551.1700. Investment returns and principal value will fluctuate and shares, when redeemed, may be worth more or less than their original cost. The Advisor may have absorbed, currently or in the past, certain Fund expenses, without which total returns would have been lower.
Investing in foreign securities, especially in emerging markets, entails special risks, such as currency fluctuations and political uncertainties, which are described in more detail in the prospectus. Investing in small cap funds will be more volatile and loss of principal could be greater than investing in large cap or more diversified funds. Being non-diversified, the Fund can invest a larger portion of its assets in the stocks of a limited number of companies than a diversified fund. Non-diversification increases the risk of loss to the Fund if the values of these securities decline.
*Not annualized.
TOP 10 EQUITY HOLDINGS**
| Company | % of Fund | |
| iShares MSCI Emerging Markets Index Fund | 4.06% | |
| Wirecard AG (Germany) | 2.92% | |
| Anta Sports Products Ltd. (China) | 2.66% | |
| China Automation Group Ltd. (China) | 2.55% | |
| Osaka Securities Exchange Co. Ltd. (Japan) | 2.07% | |
| Tandberg ASA (Norway) | 2.06% |
| Company | % of Fund | |
| SPDR Metals & Mining ETF | 1.95% | |
| Wasion Group Holdings Ltd. (Hong Kong) | 1.83% | |
| Aramex PJSC (United Arab Emirates) | 1.69% | |
| Sino Biopharmaceutical Ltd. (China) | 1.67% | |
| 23.46% | ||
| ** | As of March 31, 2009, the Fund had 23.46% invested in the Top 10 equity holdings and there were 100 long-term holdings in the Fund. Portfolio holdings are subject to change at any time. References to specific securities should not be construed as recommendations by the Funds or their Advisor. Current and future holdings are subject to risk. |
SECTOR BREAKDOWN†
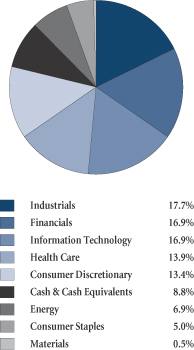
†Excludes | securities sold short and written options, if any. |
GROWTHOFA $10,000 INVESTMENT
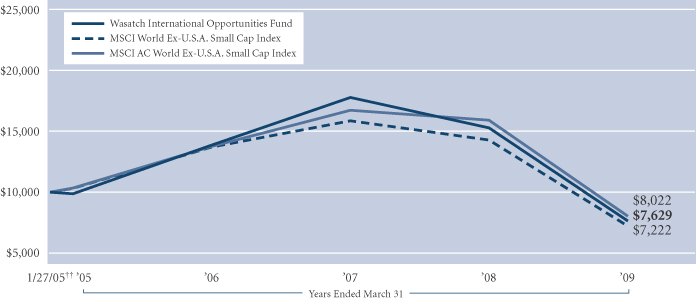
Past performance does not predict future performance and the graph above does not reflect the deduction of taxes that you would pay on fund distributions or the redemption of fund shares. Performance shown in the chart above does not include any applicable sales charges and fees. Wasatch does not charge any sales fees. The chart represents a hypothetical $10,000 investment at the beginning of the time period shown. ††Inception: January 27, 2005. The MSCI World Ex-U.S.A. Small Cap Index is an unmanaged index that measures the performance of stocks with market capitalizations between US $200 million and $1.5 billion across 22 developed markets, excluding the United States. The MSCI AC World Ex-U.S.A. Small Cap Index is an unmanaged index and includes reinvestment of all dividends of issuers located in countries throughout the world representing developed and emerging markets, excluding securities of U.S. issuers. This index is a free float-adjusted market capitalization index designed to measure the performance of small capitalization securities. You cannot invest directly in these or any indexes.
19
Table of Contents
| WASATCH MICRO CAP FUND (WMICX) — Management Discussion | MARCH 31, 2009 | |
The Wasatch Micro Cap Fund is managed by a team of Wasatch portfolio managers, led by Daniel Chace.
Daniel Chace, CFA Portfolio Manager | OVERVIEW
During the six months ended March 31, the Wasatch Micro Cap Fund lost 36.25% and the Russell 2000 and Russell Microcap indexes fell 37.17% and 39.05%, respectively. All of the major U.S. equity indexes plummeted as the worst financial crisis in decades wreaked havoc on the global economy. The Fund’s loss was concentrated in the first half of the period when we were not as defensive as we should have |

been given the steep decline in economic activity. The Fund also posted a loss in the second half of the period; however, the balance sheet strength in the portfolio helped us avoid much of the decline in the broad small cap market.
DETAILSOFTHE PERIOD
This was the most challenging period that we have ever experienced. Stock prices plunged as the freeze in the credit markets led to a rapid contraction in growth expectations for the U.S. and international economies. Unnerved by the losses, investors pulled money out of hedge funds and mutual funds, and managers had to sell stocks to meet redemptions. The forced selling drove stock prices even lower, resulting in a vicious downward spiral.
There were few places to hide in the volatile environment, and the Fund generated a significant loss. Most of the decline occurred in the first half of the period when we were not sensitive enough to the extreme level of risk aversion in the market. As business fundamentals deteriorated across the board, we remained willing to own quality companies with weaker business trends given their historically low valuations. While this has served the Fund well in the past, it was not a good strategy in the fourth quarter of 2008. Inexpensive valuations provided almost no cushion to stock prices, even for companies with strong balance sheets.
Our foreign exposure* was an area where we could have positioned the Fund more defensively. International stocks, especially small caps, also felt the pressure of the forced selling by hedge fund and mutual fund managers. Moreover, the consensus view that emerging markets like China would be less impacted by the global economic slowdown fell by the wayside. One of the Fund’s worst-performing holdings was China Hongxing Sports Ltd., an athletic shoe and apparel retailer. Earnings were below expectations, and the company lowered its 2009 same-store-sales forecast in response to cutbacks in consumer spending. Despite the weakness in the stock, we remain positive on China Hongxing’s long-term prospects — and on international investing in general, given the number of high-quality, well-managed businesses domiciled abroad.
Our performance improved in the second half of the period. The Fund still had a loss, but the loss was much smaller than it had been in the previous three months. Furthermore,
we picked up substantial ground relative to the Russell 2000 Index as the fear and liquidity-driven selling in the market abated. The credit markets remained stressed, but massive government intervention eased concerns of a systemic financial collapse. As market sentiment improved, investors refocused on company fundamentals. One of the characteristics they favored was financial strength, and small cap companies with strong balance sheets outperformed weaker-balance-sheet names. This benefited the Fund given the large percentage of its market value that is invested in companies with high-quality financial structures.
One of our best-performing stocks was VNUS Medical Technologies, Inc., a manufacturer of medical devices that use radio frequency (RF) energy to treat varicose veins. The company has no long-term debt, generated strong free cash flow in 2008 and is experiencing rapid sales growth. Demand for its products has proven to be fairly independent of the economy, because people have these treatments for health, rather than cosmetic, reasons. In addition, VNUS has strengthened its competitive position on multiple fronts, which is helping it gain share in a growing global market. Current and future portfolio holdings are subject to risk.
OUTLOOK
The United States has been in a recession for more than a year, and it is unclear when the economy will fully recover. That said, some slightly positive signs on forward-looking indicators make us more optimistic the economy is on the mend, though the pace of economic activity may remain below its potential for some time.
In light of our measured optimism, the Fund is generally positioned to benefit from a more normal economic environment. A substantial percentage of its market value is invested in economically sensitive companies with healthy balance sheets and good business models. We believe these companies will not only weather the recession but be stronger coming out of it, since the recession is hurting their competitors. And if our optimism is misplaced and the economy remains weak, the balance sheet strength of these holdings should lend support to their stock prices, as it did in the first quarter of 2009. We also have significant exposure to companies that can do well in any type of environment, because their growth drivers are independent of the economy.
Thank you for the opportunity to manage your assets.
| CFA® is a registered trademark of CFA Institute. |
| * | These holdings excluded American Depositary Receipts (ADRs — receipts issued by domestic banks for shares of foreign-based corporations that trade on U.S. stock exchanges) and companies incorporated in other countries but whose shares trade on U.S. stock exchanges. |
20
Table of Contents
| WASATCH MICRO CAP FUND (WMICX) — Portfolio Summary | MARCH 31, 2009 | |
AVERAGE ANNUAL TOTAL RETURNS
| SIX MONTHS* | 1 YEAR | 5 YEARS | 10 YEARS | |||||
Micro Cap | -36.25% | -43.72% | -7.75% | 10.48% | ||||
Russell 2000 Index | -37.17% | -37.50% | -5.24% | 1.93% | ||||
Russell Microcap Index | -39.05% | -41.70% | -9.66% | N/A |
Performance data quoted represents past performance. Past performance is not indicative of future performance and current performance may be lower or higher than the performance quoted. Wasatch Funds will deduct a fee of 2% from redemption proceeds on Fund shares held 60 days or less. Performance data does not reflect the deduction of this fee which, if charged, would reduce the performance quoted. The table above does not reflect the deduction of taxes that you would pay on fund distributions or the redemption of fund shares.
The Total Annual Fund Operating Expenses for the Wasatch Micro Cap Fund are 2.11%. Total Annual Fund Operating Expenses include direct expenses paid to the Advisor as well as indirect expenses incurred by the Fund as a result of its investments in other investment companies (each an “Acquired Fund”), before any expense reimbursements by the Advisor. The Net Expenses may differ due to waivers and reimbursements by the Advisor. See the prospectus for additional information regarding Fund expenses.
To obtain the most recent month-end performance, please visit www.wasatchfunds.com or call 800.551.1700. Investment returns and principal value will fluctuate and shares, when redeemed, may be worth more or less than their original cost. The Advisor may have absorbed, currently or in the past, certain Fund expenses, without which total returns would have been lower.
Investing in micro cap funds will be more volatile and loss of principal could be greater than investing in large cap or more diversified funds. Investing in foreign securities, especially in emerging markets, entails special risks, such as currency fluctuations and political uncertainties, which are described in more detail in the prospectus.
*Not annualized.
TOP 10 EQUITY HOLDINGS**
| Company | % of Fund | |
| Westwood Holdings Group, Inc. | 3.01% | |
| O2Micro International Ltd. ADR (Cayman Islands) | 2.85% | |
| Resources Connection, Inc. | 2.75% | |
| VNUS Medical Technologies, Inc. | 2.62% | |
| Redwood Trust, Inc. | 2.55% | |
| Dollar Financial Corp. | 2.51% |
| Company | % of Fund | |
| Micrel, Inc. | 2.48% | |
| Hibbett Sports, Inc. | 2.48% | |
| Power Integrations, Inc. | 2.43% | |
| Pericom Semiconductor Corp. | 2.34% | |
| 26.02% | ||
| ** | As of March 31, 2009, the Fund had 26.02% invested in the Top 10 equity holdings and there were 81 long-term holdings in the Fund. Portfolio holdings are subject to change at any time. References to specific securities should not be construed as recommendations by the Funds or their Advisor. Current and future holdings are subject to risk. |
SECTOR BREAKDOWN†
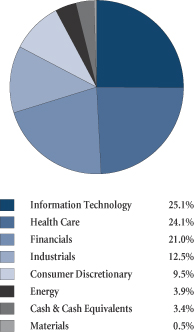
†Excludes | securities sold short and written options, if any. |
GROWTHOFA $10,000 INVESTMENT
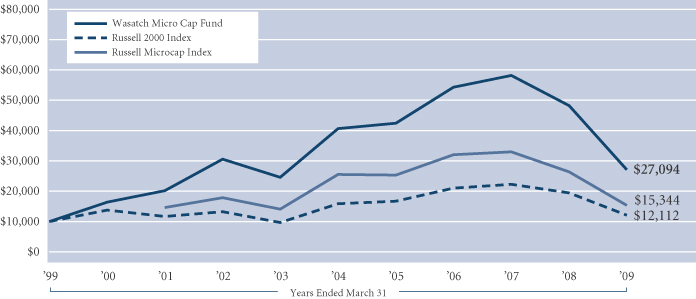
Past performance does not predict future performance and the graph above does not reflect the deduction of taxes that you would pay on fund distributions or the redemption of fund shares. Performance shown in the chart above does not include any applicable sales charges and fees. Wasatch does not charge any sales fees. The chart represents a hypothetical $10,000 investment at the beginning of the time period shown. The Russell 2000 Index is an unmanaged total return index of the smallest 2,000 companies in the Russell 3000 Index, as ranked by total market capitalization. The Russell 2000 Index is widely regarded in the industry as accurately capturing the universe of small company stocks. The Russell Microcap Index is an unmanaged total return index of the smallest 1,000 securities in the small-cap Russell 2000 Index along with the next smallest 1,000 companies, based on a ranking of all U.S. equities by market capitalization. No data was available for the Index prior to 6/30/00. Data for the Index from 6/30/00 until its official start data of July 1, 2005 was from a paper portfolio. You cannot invest directly in these or any indexes.
21
Table of Contents
| WASATCH MICRO CAP VALUE FUND (WAMVX) — Management Discussion | MARCH 31, 2009 | |
The Wasatch Micro Cap Value Fund is managed by a team of Wasatch portfolio managers, led by Brian Bythrow and John Malooly.
Brian Bythrow, CFA Portfolio Manager |
John Malooly, CFA Portfolio Manager | OVERVIEW
The market turmoil we experienced at the end of our last reporting period persisted into the first six months of this one, as volatility continued to affect virtually every sector, investment |

style, and market capitalization. To contend with the global credit crunch afflicting financial institutions in the U.S. and around the world, the Federal Reserve — joined by a number of the world’s central banks — took bold and at times unprecedented steps.
The need for these efforts was reinforced when the official pronouncement came in the late fall that the U.S. economy had been in a recession for nearly a year. Additional initiatives aimed at revitalizing the economy and stabilizing the financial markets were introduced shortly after the swearing in of the new Congress and Presidential administration. In the later part of March, stocks staged a strong rally, though opinions were mixed as to whether the upturn marked the early stages of a recovery, or was simply a bear market* rally.
In this turbulent environment, the Wasatch Micro Cap Value Fund posted a return of -30.56% for the six months ended March 31, 2009. This figure placed the Fund’s performance ahead of its primary benchmark, the Russell 2000 Index, which returned -37.17% over the same period. Although the Fund’s return represents significant outperformance relative to our benchmark, we recognize that this news is overshadowed by the size of the loss incurred over the six months.
The greatest factor in our outperformance for the six-month period was our position in industrial stocks. A number of the companies we selected from this sector appear poised to benefit from the Obama administration’s economic stimulus plans. In addition, our deliberate underweighting of financial stocks, particularly those with exposure to credit risk, helped our return as that sector was understandably one of the hardest hit by the credit crisis.
DETAILSOFTHE PERIOD
In the uncertain environment, the prospects for increased infrastructure spending as part of the government’s economic stimulus program were a welcome bright spot. Reflecting this trend, our strongest contributor to performance for the six months was Orion Marine Group, Inc. Orion provides dredging services that are often required by infrastructure projects situated along waterways.
Another strong positive contributor from the industrials sector was MYR Group, Inc., a company that installs
equipment used in electrical transmission and distribution. MYR Group benefits from growing interest in wind farms and other alternative energy sources. These facilities are often located long distances from existing power grids, and thus require additional infrastructure to bring them on line. Other industrial holdings benefiting from planned infrastructure spending that added to our performance included EnergySolutions, Inc. a provider of nuclear-material processing and disposal services, and Michael Baker Corp., an engineering and design services firm focused on bridges and other infrastructure projects.
We have some concerns that the ultimate impact of stimulus spending may be less than what is hoped for. So we have been reducing the aforementioned positions on strength, and investing some of the proceeds in manufacturing-related industrial stocks that are trading at almost unbelievably low valuations, while offering solid balance sheets and good cash flows.
International stocks continued to occupy a significant portion of the portfolio. Despite the global slowdown, we believe that solid growth opportunities remain, particularly in China and other emerging markets. Our focus is on companies that primarily serve the needs of their own domestic market, rather than producing goods for export.
The Fund’s largest individual holding is Chinese pork producer Zhongpin, Inc. The company has experienced healthy growth thanks to increasing demand from that country’s rising consumer class and its desire for higher-quality foods. Although the stock performed well in the last quarter of 2008, it was caught up in early 2009’s market volatility. Given the continued growth of the consumer class in China, we believe the stock should recover as the equity markets stabilize.
In the information technology sector, China’s Longtop Financial Technologies Ltd. has prospered by providing applications software and services for that country’s financials sector. Because China’s banking industry is still relatively early in its development, there has been strong growth in demand for Longtop’s products and services, leaving the company largely unscathed by the difficulties facing the financials sector in other parts of the world. Current and future portfolio holdings are subject to risk.
OUTLOOK
Over the period, we tightened the portfolio considerably. The reduction in our number of holdings reflected profit-taking on successful names and the removal of some companies in which we had lost confidence.
One result of these sales was an increase in the Fund’s cash position. This gives us significant resources to deploy as we identify companies positioned to benefit as the economy and markets move toward greater stability and recovery. We remain cautious, however, as the timeline for those developments is far from clear.
Thank you for the opportunity to manage your assets.
| CFA® is a registered trademark of CFA Institute. |
| * | A bear market is generally defined as a drop of 20% or more in stock prices over at least a two-month period. |
22
Table of Contents
| WASATCH MICRO CAP VALUE FUND (WAMVX) — Portfolio Summary | MARCH 31, 2009 | |
AVERAGE ANNUAL TOTAL RETURNS
| SIX MONTHS* | 1 YEAR | 5 YEARS | SINCE INCEPTION 7/28/03 | |||||
Micro Cap Value | -30.56% | -41.86% | -4.18% | 1.68% | ||||
Russell 2000 Index | -37.17% | -37.50% | -5.24% | -0.73% | ||||
Russell Microcap Index | -39.05% | -41.70% | -9.66% | -3.78% |
Performance data quoted represents past performance. Past performance is not indicative of future performance and current performance may be lower or higher than the performance quoted. Wasatch Funds will deduct a fee of 2% from redemption proceeds on Fund shares held 60 days or less. Performance data does not reflect the deduction of this fee which, if charged, would reduce the performance quoted. The table above does not reflect the deduction of taxes that you would pay on fund distributions or the redemption of fund shares.
The Total Annual Fund Operating Expenses for the Wasatch Micro Cap Value Fund are 2.30%. Total Annual Fund Operating Expenses include direct expenses paid to the Advisor as well as indirect expenses incurred by the Fund as a result of its investments in other investment companies (each an “Acquired Fund”), before any expense reimbursements by the Advisor. The Net Expenses may differ due to waivers and reimbursements by the Advisor. See the prospectus for additional information regarding Fund expenses.
To obtain the most recent month-end performance, please visit www.wasatchfunds.com or call 800.551.1700. Investment returns and principal value will fluctuate and shares, when redeemed, may be worth more or less than their original cost. The Advisor may have absorbed, currently or in the past, certain Fund expenses, without which total returns would have been lower.
Investing in micro cap funds will be more volatile and loss of principal could be greater than investing in large cap or more diversified funds. Investing in foreign securities, especially emerging markets, entails special risks, such as currency fluctuations and political uncertainties, which are described in more detail in the prospectus.
| * | Not annualized. |
TOP 10 EQUITY HOLDINGS**
| Company | % of Fund | |
| Zhongpin, Inc. | 2.30% | |
| Aegean Marine Petroleum Network, Inc. | 2.25% | |
| Orion Marine Group, Inc. | 2.06% | |
| LSB Industries, Inc. | 1.90% | |
| Heritage-Crystal Clean, Inc. | 1.89% | |
| Westwood Holdings Group, Inc. | 1.88% |
| Company | % of Fund | |
| Duff & Phelps Corp., Class A | 1.75% | |
| Haynes International, Inc. | 1.68% | |
| Opnet Technologies, Inc. | 1.58% | |
| Sino Biopharmaceutical Ltd. (China) | 1.53% | |
| 18.82% | ||
| ** | As of March 31, 2009, the Fund had 18.82% invested in the Top 10 equity holdings and there were 80 long-term holdings in the Fund. Portfolio holdings are subject to change at any time. References to specific securities should not be construed as recommendations by the Funds or their Advisor. Current and future holdings are subject to risk. |
SECTOR BREAKDOWN†
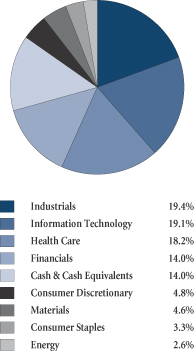
†Excludes | securities sold short and written options, if any. |
GROWTHOFA $10,000 INVESTMENT
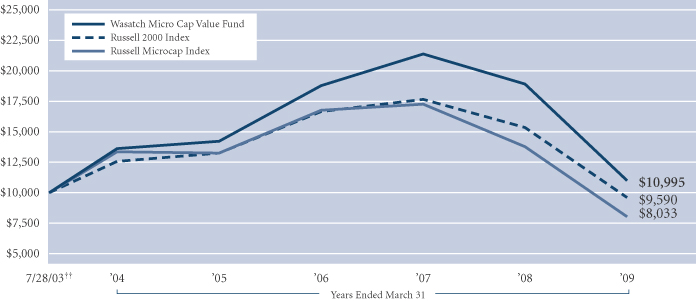
Past performance does not predict future performance and the graph above does not reflect the deduction of taxes that you would pay on fund distributions or the redemption of fund shares. Performance shown in the chart above does not include any applicable sales charges and fees. Wasatch does not charge any sales fees. The chart represents a hypothetical $10,000 investment at the beginning of the time period shown. ††Inception: July 28, 2003. The Russell 2000 Index is an unmanaged total return index of the smallest 2,000 companies in the Russell 3000 Index, as ranked by total market capitalization. The Russell 2000 Index is widely regarded in the industry as accurately capturing the universe of small company stocks. The Russell Microcap Index is an unmanaged total return index of the smallest 1,000 securities in the small-cap Russell 2000 Index along with the next smallest 1,000 companies, based on a ranking of all U.S. equities by market capitalization. Data for the Index from 6/30/00 until its official start date of July 1, 2005 was from a paper portfolio. You cannot invest directly in these or any indexes.
23
Table of Contents
| WASATCH SMALL CAP GROWTH FUND (WAAEX) — Management Discussion | MARCH 31, 2009 | |
The Wasatch Small Cap Growth Fund is managed by a team of Wasatch portfolio managers, led by Jeff Cardon.
Jeff Cardon, CFA Portfolio Manager | OVERVIEW
The Wasatch Small Cap Growth Fund lost 24.43% in the six months ended March 31. The Russell 2000 Growth and Russell 2000 indexes fell 34.51% and 37.17%, respectively, in what was the most dramatic downturn in the market that we have ever seen. The gradual sell-off that began in early 2008 intensified on well-founded fears that the bursting of the credit bubble had pushed the economy into a deep recession. |

Concerns about the economy weighed on many of our stocks. However, the Fund held up better than the broad small cap growth market due to our focus on investing in quality companies — companies with solid balance sheets, sustainable competitive advantages and strong management teams.
DETAILSOFTHE PERIOD
In the last five months of 2008, we saw faint signs that the market was starting to move toward quality. The Fund began to outperform the Russell 2000 Growth Index following the July peak in commodity prices and the subsequent retreat in commodity-driven stocks. We continued to outperform during the remainder of 2008 when stock prices plummeted in response to the growing financial crisis and the damage this crisis was inflicting on the real economy.
During the first quarter of 2009, the previous year’s faint signs gave way to a much stronger move toward quality, and the improvement in our relative performance accelerated. The market was still weak and volatile; however, the raw emotional panic of the fourth quarter of 2008 was replaced by a more rational sorting out of companies likely to weather this economic tsunami. As the market tried to regain its footing, many of the highest-quality names in the Fund performed well.
Closer analysis of this period’s results shows that our stock picking added significant value and was especially strong in some of the places where we have traditionally done well, such as retail and technology. Our retail investments gained more than 15% in the down market, led by strength in O’Reilly Automotive. O’Reilly is an automotive parts retailer/distributor and, in our view, one of our highest-quality holdings. The company is benefiting from the countercyclical nature of its business, as consumers are delaying new car purchases and spending more to maintain their aging cars.
Neutral Tandem, a communications services firm, was another strong performer. The company provides independent switching networks that let carriers efficiently route traffic to one another without having to pay fees to competitors. Neutral Tandem is a good example of our preference for owning growing companies whose stable
demand characteristics allow them to thrive even in a weak economy. Cell phone usage — the primary driver of Neutral Tandem’s revenues — has remained steady, since most people treat their cell phones as a non-discretionary expense.
On the other hand, one of our worst-performing stocks was Kendle International, a contract research organization that conducts clinical studies for biotech and pharmaceutical firms. Kendle and other health care stocks in the Fund were hurt by concerns that the government’s plans to reform the health care system would stifle innovation in the sector. We agree that innovation is likely to decline if major health care legislation is passed. In response to this changing regulatory environment, we finished the period with an underweight in health care, an area where we have historically been overweight. To be sure, we still think innovation in health care will occur, albeit at a slower pace, and we remain comfortable with the long-term prospects of the select health care companies we choose to own.
Overall, our foreign stocks* performed in line with the Russell 2000 Growth Index but trailed our domestic stocks. This was not unexpected, since the international small cap markets tend to be more volatile than the U.S. market. We continue to believe that our foreign holdings are attractively valued and have better earnings growth prospects than many U.S. companies. Current and future portfolio holdings are subject to risk.
OUTLOOK
We believe the stock market will continue to experience volatile swings in both directions as it searches for a bottom. There has been much capital destruction over the past several months, and many fundamental issues have yet to be sorted out in the minds of investors. Furthermore, we think that some of the problems facing the United States, including the massive federal deficit, will limit the long-run growth of our economy. This type of low-growth environment has historically been favorable for Wasatch, because it allows quality growth companies that are creating true economic value to shine.
In spite of strong relative performance and our optimism that buying quality growth stocks will ultimately be rewarded, it would not be proper for us to hide our feelings of disappointment in the Fund’s results at this time. We understand that by trusting us with your money, we have a tremendous responsibility to grow and protect your assets. Though losses have been and always will be part of the investment experience, the losses we have recently experienced put an extra burden on us to deliver a performance worthy of your trust. Your confidence and support are greatly appreciated.
Thank you for the opportunity to manage your assets.
| CFA® is a registered trademark of CFA Institute. |
| * | These holdings included American Depositary Receipts (ADRs — receipts issued by domestic banks for shares of foreign-based corporations that trade on U.S. stock exchanges) and companies incorporated in other countries but whose shares trade on U.S. stock exchanges. |
24
Table of Contents
| WASATCH SMALL CAP GROWTH FUND (WAAEX) — Portfolio Summary | MARCH 31, 2009 | |
AVERAGE ANNUAL TOTAL RETURNS
| SIX MONTHS* | 1 YEAR | 5 YEARS | 10 YEARS | |||||
Small Cap Growth | -24.43% | -32.52% | -4.83% | 5.98% | ||||
Russell 2000 Growth Index | -34.51% | -36.36% | -5.37% | -1.60% | ||||
Russell 2000 Index | -37.17% | -37.50% | -5.24% | 1.93% |
Performance data quoted represents past performance. Past performance is not indicative of future performance and current performance may be lower or higher than the performance quoted. Wasatch Funds will deduct a fee of 2% from redemption proceeds on Fund shares held 60 days or less. Performance data does not reflect the deduction of this fee which, if charged, would reduce the performance quoted. The table above does not reflect the deduction of taxes that you would pay on fund distributions or the redemption of fund shares.
The Total Annual Fund Operating Expenses for the Wasatch Small Cap Growth Fund are 1.21%. Total Annual Fund Operating Expenses include direct expenses paid to the Advisor as well as indirect expenses incurred by the Fund as a result of its investments in other investment companies (each an “Acquired Fund”), before any expense reimbursements by the Advisor. The Net Expenses may differ due to waivers and reimbursements by the Advisor. See the prospectus for additional information regarding Fund expenses.
To obtain the most recent month-end performance, please visit www.wasatchfunds.com or call 800.551.1700. Investment returns and principal value will fluctuate and shares, when redeemed, may be worth more or less than their original cost. The Advisor may have absorbed, currently or in the past, certain Fund expenses, without which total returns would have been lower.
Investing in small cap funds will be more volatile and loss of principal could be greater than investing in large cap or more diversified funds.
| * | Not annualized. |
TOP 10 EQUITY HOLDINGS**
| Company | % of Fund | |
| Resources Connection, Inc. | 3.99% | |
| O’Reilly Automotive, Inc. | 3.48% | |
| Knight Transportation, Inc. | 3.30% | |
| Copart, Inc. | 3.17% | |
| Hibbett Sports, Inc. | 3.08% | |
| MSC Industrial Direct Co., Inc., Class A | 3.05% |
| Company | % of Fund | |
| HDFC Bank Ltd. ADR (India) | 2.57% | |
| MSCI, Inc., Class A | 2.56% | |
| Cognizant Technology Solutions Corp., Class A | 2.45% | |
| Redwood Trust, Inc. | 2.24% | |
| 29.89% | ||
| **As | of March 31, 2009, the Fund had 29.89% invested in the Top 10 equity holdings and there were 86 long-term holdings in the Fund. Portfolio holdings are subject to change at any time. References to specific securities should not be construed as recommendations by the Funds or their Advisor. Current and future holdings are subject to risk. |
SECTOR BREAKDOWN†
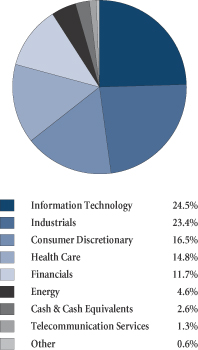
†Excludes | securities sold short and written options, if any. |
GROWTHOFA $10,000 INVESTMENT
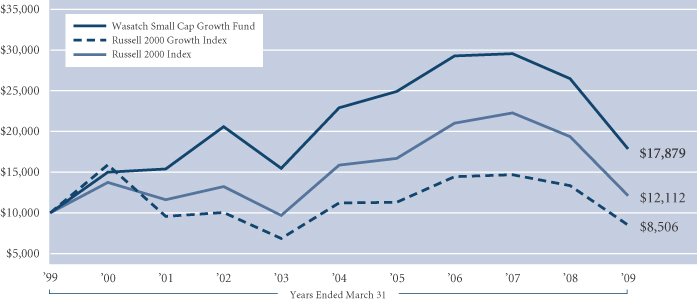
Past performance does not predict future performance and the graph above does not reflect the deduction of taxes that you would pay on fund distributions or the redemption of fund shares. Performance shown in the chart above does not include any applicable sales charges and fees. Wasatch does not charge any sales fees. The chart represents a hypothetical $10,000 investment at the beginning of the time period shown. The Russell 2000 Growth Index is an unmanaged total return index that measures the performance of those Russell 2000 Index companies with higher price-to-book ratios and higher forecasted growth values. The Russell 2000 Index is an unmanaged total return index of the smallest 2,000 companies in the Russell 3000 Index, as ranked by total market capitalization. The Russell 2000 Index is widely regarded in the industry as accurately capturing the universe of small company stocks. You cannot invest directly in these or any indexes.
25
Table of Contents
| WASATCH SMALL CAP VALUE FUND (WMCVX) — Management Discussion | MARCH 31, 2009 | |
The Wasatch Small Cap Value Fund is managed by a team of Wasatch portfolio managers, led by Jim Larkins.
Jim Larkins, MBA Portfolio Manager | OVERVIEW
The Wasatch Small Cap Value Fund returned -38.30% during the six-month period ended March 31, 2009, and slightly outperformed the -39.64% return of its benchmark, the Russell 2000 Value Index. It gives us little comfort to reap a small level of outperformance when absolute returns were so abysmal. Every sector within the Index posted negative returns for the period, while the Fund |

managed a positive contribution in just one sector. Most of the Fund’s losses came in the fourth quarter of 2008, when the extent of the world’s credit issues came to light, indiscriminately dragging down stocks across the board. Once investors began to refocus on fundamentals in the first quarter of 2009, the Fund’s performance improved significantly. We attribute this to our decision, made in the autumn of last year, to focus on higher-quality companies with stable business models and healthy balance sheets.
Another positive factor was that many of the stocks we purchased at extremely oversold levels in 2008 rebounded sharply during the first three months of 2009. We believe this underscores the value of our intensive research process. Our deep understanding of each company that we hold, as well as those on our watch list, enabled us to differentiate between stocks that fell due to investor overreaction versus those that suffered true deterioration of their underlying fundamentals. The result was that the Fund was positioned to benefit once market conditions began to somewhat normalize.
DETAILSOFTHE PERIOD
It’s no surprise that the financials sector was the biggest detractor from absolute performance. On a positive note, we maintained a significant underweight versus the Index and our stocks were down less, so the sector was a strong contributor on a relative basis. We expect that financial stocks will continue to face headwinds. Our strategy here is to own companies that are best suited to ride out the credit crunch: those that have reliable sources for credit or do not need outside credit in order to function. Redwood Trust, a lender of jumbo mortgages to prime rated borrowers, is a good example. Originally pummeled along with mortgage lenders in general, Redwood’s stock price rose in the first quarter of this year as investors realized that the company has successfully avoided many of the default issues impacting other lenders.
The Fund’s consumer discretionary holdings were down, but held up better than the Index. Despite rock bottom valuations, we avoided the potential minefield of loading up on stocks tied too closely to consumer spending. The leading performers were two companies that have benefited from the bad economy: LKQ Corp., a seller of recycled
replacement auto parts, and the auto parts retailer O’Reilly Automotive, Inc. Both companies have benefited as consumers hold onto their cars longer, boosting the demand for do-it-yourself replacement parts.
Some of the Fund’s top overall contributors for the period came from the industrials sector. Here, our focus on companies with strong niche businesses and the ability to perform well in any economic environment paid off. Notable contributors included Aegean Maritime Petroleum Network, Inc., one of the few companies specializing in the delivery of fuel to ships at sea, and MYR Group, Inc., a provider of electrical construction services.
Overweights in health care and energy proved to be difficult areas for the Fund. In health care, the senior assisted-living facility operator Emeritus Corp. was hurt by investors’ difficulty in assessing how much of a problem its heavy debt load will be in the next two years. The falling stock price prompted us to reassess the company, which confirmed our belief that concerns about debt have been overstated and that the company’s underlying fundamentals remain strong. In energy, TETRA Technologies, Inc., an oil and gas services and production company, was hurt by falling energy prices and a slowdown in exploration activities. Over the long term, we expect that TETRA’s leadership positions in drilling fluids and well decommissioning will be significant contributors to its bottom line. Current and future portfolio holdings are subject to risk.
OUTLOOK
When confronted with the market volatility witnessed in recent months, we have focused on building long-term positions in undervalued stocks that we think have the potential to outperform over a two- to three-year time frame. We believe our approach — which is to buy great companies when they stumble and undiscovered companies when they’re undervalued — is a time-tested way to generate long-term outperformance.
Indeed, the backdrop of slowing economic growth has created some outstanding opportunities for those with a long-term investment horizon. There are a wealth of compelling values across the small cap asset class, especially among higher-quality companies with some degree of economic sensitivity. In the industrials sector, for instance, we have established positions in the beaten-down trucking sector. The Fund also remains overweight in energy, where we continue to like the big picture outlook based on the expected increase in energy consumption in the developing world in the years ahead; and in information technology, where we are finding numerous companies with strong balance sheets and compelling long-term growth stories.
Overall, we continue to focus on positioning the Fund to weather uncertainty and be prepared to benefit when the market environment ultimately takes a turn for the better. We believe our emphasis on fundamental research, together with our long-term approach to investing, will continue to hold the Fund in good stead through these challenging times.
Thank you for the opportunity to manage your assets.
26
Table of Contents
| WASATCH SMALL CAP VALUE FUND (WMCVX) — Portfolio Summary | MARCH 31, 2009 | |
AVERAGE ANNUAL TOTAL RETURNS
| SIX MONTHS* | 1 YEAR | 5 YEARS | 10 YEARS | |||||
Small Cap Value | -38.30% | -46.63% | -8.94% | 8.27% | ||||
Russell 2000 Value Index | -39.64% | -38.89% | -5.30% | 4.87% | ||||
Russell 2000 Index | -37.17% | -37.50% | -5.24% | 1.93% |
Performance data quoted represents past performance. Past performance is not indicative of future performance and current performance may be lower or higher than the performance quoted. Wasatch Funds will deduct a fee of 2% from redemption proceeds on Fund shares held 60 days or less. Performance data does not reflect the deduction of this fee which, if charged, would reduce the performance quoted. The table above does not reflect the deduction of taxes that you would pay on fund distributions or the redemption of fund shares.
The Total Annual Fund Operating Expenses for the Wasatch Small Cap Value Fund are 1.81%. Total Annual Fund Operating Expenses include direct expenses paid to the Advisor as well as indirect expenses incurred by the Fund as a result of its investments in other investment companies (each an “Acquired Fund”), before any expense reimbursements by the Advisor. The Net Expenses may differ due to waivers and reimbursements by the Advisor. See the prospectus for additional information regarding Fund expenses.
To obtain the most recent month-end performance, please visit www.wasatchfunds.com or call 800.551.1700. Investment returns and principal value will fluctuate and shares, when redeemed, may be worth more or less than their original cost. The Advisor may have absorbed, currently or in the past, certain Fund expenses, without which total returns would have been lower.
Investing in small cap funds will be more volatile and loss of principal could be greater than investing in large cap or more diversified funds.
| * | Not annualized. |
TOP 10 EQUITY HOLDINGS**
| Company | % of Fund | |
| Copart, Inc. | 3.06% | |
| Redwood Trust, Inc. | 2.70% | |
| MFA Mortgage Investments, Inc. | 2.61% | |
| NeuStar, Inc., Class A | 2.51% | |
| Pericom Semiconductor Corp. | 2.45% | |
| HEICO Corp., Class A | 2.36% |
| Company | % of Fund | |
| Dollar Financial Corp. | 2.18% | |
| MSC Industrial Direct Co., Inc., Class A | 2.13% | |
| Washington Trust Bancorp PIPE | 2.13% | |
| CorVel Corp. | 2.09% | |
| 24.22% | ||
| ** | As of March 31, 2009, the Fund had 24.22% invested in the Top 10 equity holdings and there were 70 long-term holdings in the Fund. Portfolio holdings are subject to change at any time. References to specific securities should not be construed as recommendations by the Funds or their Advisor. Current and future holdings are subject to risk. |
SECTOR BREAKDOWN†
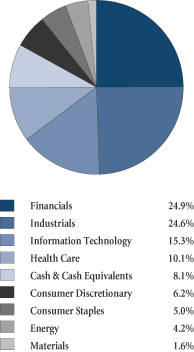
†Excludes | securities sold short and written options, if any. |
GROWTHOFA $10,000 INVESTMENT
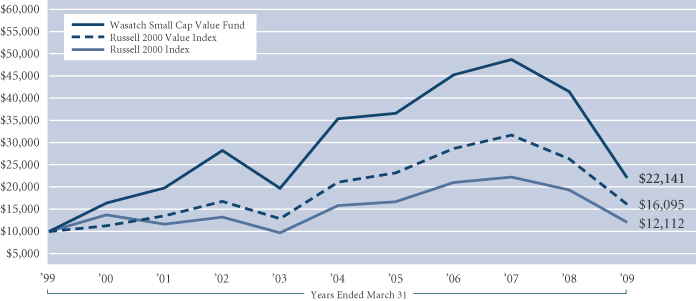
Past performance does not predict future performance and the graph above does not reflect the deduction of taxes that you would pay on fund distributions or the redemption of fund shares. Performance shown in the chart above does not include any applicable sales charges and fees. Wasatch does not charge any sales fees. The chart represents a hypothetical $10,000 investment at the beginning of the time period shown. The Russell 2000 Value Index measures the performance of those Russell 2000 Index companies with lower price-to-book ratios and lower forecasted growth values. The Russell 2000 Index is an unmanaged total return index of the smallest 2,000 companies in the Russell 3000 Index, as ranked by total market capitalization. The Russell 2000 Index is widely regarded in the industry as accurately capturing the universe of small company stocks. You cannot invest directly in these or any indexes.
27
Table of Contents
| WASATCH STRATEGIC INCOME FUND (WASIX) — Management Discussion | MARCH 31, 2009 | |
The Wasatch Strategic Income Fund is managed by a team of Wasatch portfolio managers, led by Sam Stewart.
Samuel S. Stewart, Jr. PhD, CFA Portfolio Manager | OVERVIEW
The last six months brought about one of the most vicious bear markets* in history. The fourth quarter sell-off led to a 2008 loss of 37% for the S&P 500 Index (“the Index”), its worst calendar year decline in 71 years. Stocks continued to fall as the new year commenced, with the Index hitting a 12-year low in early March before the market rallied to close the month. For the six-month period ended March 31, 2009, the Wasatch Strategic Income |
Fund posted a return in-line with the S&P 500, declining 30.91%, while the Index fell 30.54%.
Financial stocks played a key role in the market decline, as the S&P financials fell nearly 55%. With roughly a third of the Fund’s holdings in the financials sector, we managed to navigate this carnage more successfully, albeit with a still unpalatable decline of almost 32%.
Our investment focus remains cautious, and we continue to concentrate on what we believe to be the highest quality companies. The U.S. economy is far from being out of the woods, and we expect it will continue to struggle to regain its footing throughout this year. However, amidst the bad economic news, we are beginning to see a few encouraging signs, like slightly improving credit markets.
We don’t expect to see a lot of positive surprises in company earnings reports for the first quarter. As such, we are holding roughly 6% cash in case additional investment opportunities arise in the near future, but we remain nearly fully invested because the market has typically begun moving north well before the end of previous recessions.
DETAILSOFTHE PERIOD
Our concentration in the financials sector continued to be a strong headwind for the Fund. It never feels good to work really hard just to lose less money, but this has clearly been our battle in the financials sector. Fortunately, I think we are finally turning a corner, as no longer are all financial stocks moving in lock-step each day. The wheat is being sifted from the chaff, with the stock prices of expected survivors now showing more stability. In the first quarter of 2009, the Fund posted a slightly positive return across our financial holdings, while the S&P financials produced a double-digit decline.
Our relative success in the financials sector over the last six months was driven by three factors: 1) a sizeable investment in Redwood Trust, Inc.; 2) our position in agency mortgage real estate investment trusts (REITs); and 3) a hedge against the financials sector.
To veteran shareholders of Wasatch Funds and the Strategic Income Fund, Redwood Trust is a well-known name. While we’re certainly long-term investors, our in-depth knowledge of the company gained over years of ownership,
has given us unique insight into the company’s valuation. Over the last year or so, Redwood Trust’s stock price has fluctuated dramatically as financial firms came under fire. As of March 31, it was down roughly 60% from a year ago, but we were able to successfully buy and sell during these fluctuations to capture a positive return in a declining stock. Redwood Trust was the Fund’s largest holding and top contributor for the six-months ended March 31. The position size is based on our long-term confidence in the company’s talented management team, its low valuation, its cash reserves, and the tailwind that it is receiving from government stimulus efforts.
The Fund was also aided by a large allocation to agency mortgage REITs like MFA Mortgage Investments, Inc. With all of the negative publicity surrounding mortgage securitization, we think investors are missing an important point. While it is true that many securities were packaged with a severe misperception of the underlying credit quality, the companies we own primarily invest in securitizations of agency guaranteed mortgages that carry an implicit guarantee of the U.S. government. The stock prices of these firms were down during the period, but they are currently delivering yields in the 15% range. We think these companies are well positioned to either see their stock prices rise or to continue delivering over-sized dividends.
Finally, with our significant position in financial stocks, we took a small hedge position against the financials sector. This provided a positive return to the Fund as the market struggled.
Two of our largest detractors from performance for the period were General Electric Co. and Pool Corp. While we have great confidence in their business models, both companies have exposure to the most punished areas of the economy — finance and housing, respectively. We feel that both companies have healthy prospects when the economy turns, and at current valuations are oversold relative to their long-term potential. Current and future portfolio holdings are subject to risk.
OUTLOOK
We are remaining disciplined and cautious. This means holding what we believe are high quality companies with predictable earning streams, unique competitive advantages, and proven management teams. This disciplined approach also means seeking to avoid big mistakes. We intend to keep holdings around a 2% position size, except in the rare situations when we believe we truly have unique insight into a company that is being overlooked or misunderstood, as we think has been the case with Redwood Trust.
We are trying to structure the portfolio to weather a prolonged economic recovery, but we also want it to be well positioned for when the market begins to anticipate the recovery. For patient long-term investors the risk/reward tradeoff of investing in the stock market right now is compelling.
Thank you for the opportunity to manage your assets.
| CFA® is a registered trademark of CFA Institute. |
| *A | bear market is generally defined as a drop of 20% or more in stock prices over at least a two-month period. |
28
Table of Contents
| WASATCH STRATEGIC INCOME FUND (WASIX) — Portfolio Summary | MARCH 31, 2009 | |
AVERAGE ANNUAL TOTAL RETURNS
| SIX MONTHS* | 1 YEAR | 5 YEARS | SINCE INCEPTION 2/1/06 | |||||
Strategic Income | -30.91% | -39.73% | N/A | -11.99% | ||||
Barclays Capital U.S. Aggregate Bond Index | 4.70% | 3.13% | N/A | 5.25% | ||||
S&P 500 Index | -30.54% | -38.09% | N/A | -12.01% |
Performance data quoted represents past performance. Past performance is not indicative of future performance and current performance may be lower or higher than the performance quoted. Wasatch Funds will deduct a fee of 2% from redemption proceeds on Fund shares held 60 days or less. Performance data does not reflect the deduction of this fee which, if charged, would reduce the performance quoted. The table above does not reflect the deduction of taxes that you would pay on fund distributions or the redemption of fund shares.
The Total Annual Fund Operating Expenses for the Wasatch Strategic Income Fund are 1.73%. Total Annual Fund Operating Expenses include direct expenses paid to the Advisor as well as indirect expenses incurred by the Fund as a result of its investments in other investment companies (each an “Acquired Fund”), before any expense reimbursements by the Advisor. The Net Expenses may differ due to waivers and reimbursements by the Advisor. See the prospectus for additional information regarding Fund expenses.
To obtain the most recent month-end performance, please visit www.wasatchfunds.com or call 800.551.1700. Investment returns and principal value will fluctuate and shares, when redeemed, may be worth more or less than their original cost. The Advisor may have absorbed, currently or in the past, certain Fund expenses, without which total returns would have been lower.
With respect to the Fund’s assets invested in fixed income securities, you are subject, but not limited to, the same interest rate, inflation and credit risk associated with the underlying fixed-income securities owned by the Fund. Return of principal is not guaranteed. Equity investing involves risks, including potential loss of the principal amount invested. Being non-diversified, the Fund can invest a larger portion of its assets in the securities of a limited number of companies than a diversified fund. Non-diversification increases the risk of loss to the Fund if the values of these securities decline. Investing in foreign securities, especially in emerging markets, entails special risks, such as currency fluctuations and political uncertainties, which are described in more detail in the prospectus.
*Not annualized.
TOP 10 EQUITY HOLDINGS**
| Company | % of Fund | |
| Redwood Trust, Inc. | 8.99% | |
| MFA Mortgage Investments, Inc. | 4.82% | |
| Capstead Mortgage Corp. | 4.75% | |
| Paychex, Inc. | 3.97% | |
| Pool Corp. | 3.82% | |
| Annaly Capital Management, Inc. | 2.38% |
| Company | % of Fund | |
| Range Resources Corp. | 2.29% | |
| Microchip Technology, Inc. | 2.23% | |
| Chesapeake Energy Corp. | 2.16% | |
| Home Depot, Inc. | 2.14% | |
| 37.55% | ||
| ** | As of March 31, 2009, the Fund had 37.55% invested in the Top 10 equity holdings and there were 54 long-term holdings in the Fund. Portfolio holdings are subject to change at any time. References to specific securities should not be construed as recommendations by the Funds or their Advisor. Current and future holdings are subject to risk. |
SECTOR BREAKDOWN†
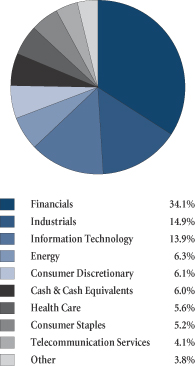
†Excludes | securities sold short and written options, if any. |
GROWTHOFA $10,000 INVESTMENT
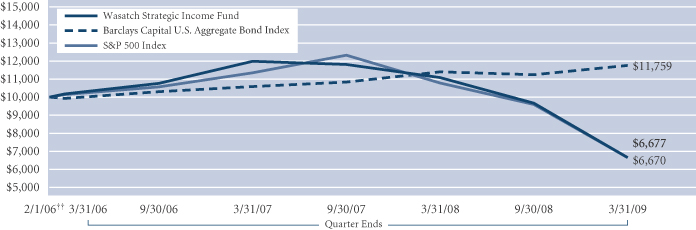
Past performance does not predict future performance and the graph above does not reflect the deduction of taxes that you would pay on fund distributions or the redemption of fund shares. Performance shown in the chart above does not include any applicable sales charges and fees. Wasatch does not charge any sales fees. The chart represents a hypothetical $10,000 investment at the beginning of the time period shown. ††Inception: February 1, 2006. The Barclays Capital U.S. Aggregate Bond Index (formerly the Lehman Brothers Aggregate Bond Index) covers the U.S. investment grade fixed rate bond market, including government and corporate securities, agency mortgage pass-through securities, and asset-backed securities. To be included in the index the security must meet the following criteria: must have at least one year to final maturity, regardless of call features; must have at least $100 million par amount outstanding; must be rated investment grade or better by Moody’s Investors Service, Standard & Poor’s, or Fitch Investor’s Service; must be fixed rate, although it can carry a coupon that steps up or changes to a predetermined schedule; must be dollar-denominated and nonconvertible. All corporate and asset-backed securities must be registered with the SEC and must be publicly issued. The S&P 500 Index represents 500 of the United States’ largest stocks from a broad variety of industries. The Index is unmanaged, and a common measure of common stock total return performance. You cannot invest directly in these or any indexes.
29
Table of Contents
| WASATCH ULTRA GROWTH FUND (WAMCX) — Management Discussion | MARCH 31, 2009 | |
The Wasatch Ultra Growth Fund is managed by a team of Wasatch portfolio managers, led by Ajay Krishnan. Neal Dihora was a co-manager for the Fund with Mr. Krishnan until October 24, 2008.
Ajay Krishnan, CFA Portfolio Manager
| OVERVIEW The Wasatch Ultra Growth Fund lost 32.95% and the Russell 2000 Growth Index fell 34.51% in the six months ended March 31. The stock market was extraordinarily weak and volatile as investors confronted the worst financial crisis since the Great Depression. The hurricane-force headwinds in the external environment took a severe toll on the Fund. Several of our positions in companies with exposure to the global economy were especially |

weak. However, the earnings resilience and balance sheet strength in the portfolio helped cushion the decline, and the Fund outperformed the Index.
DETAILSOFTHE PERIOD
The collapse or near collapse of several large U.S. financial institutions last September sent shock waves around the world. Risk aversion skyrocketed, investors fled equities and banks became afraid to lend. The credit markets remained tight throughout the rest of 2008 and into 2009, and the contraction in credit led to a rapid slowdown in economic activity. The recession in the United States and other industrialized nations deepened, and the pace of growth in emerging economic countries cooled.
Against this backdrop, some of the worst-performing stocks in the Fund were stocks of companies that are sensitive to the global economy. Many of our holdings in the energy sector generated big losses, as falling demand for oil and raw materials sent commodity prices sharply lower. Our position in Bucyrus International, Inc., a manufacturer of mining equipment, also did poorly. The stock was hurt by concerns that the sell-off in commodities would lead to capital spending cuts in the mining industry.
Although we were disappointed by the performance of Bucyrus and other economically sensitive names, our long-term outlook on these companies remains positive. The global economy has entered a cyclical downturn and, while we can’t predict when it will end, we are confident that growth will ultimately resume. We expect the rebound to be especially robust in emerging countries like China and India — important end-markets for Bucyrus — where we view the current slowdown as simply a pause in a period of strong secular expansion.
Overall, our portfolio companies reported a healthy rate of earnings growth* in the third quarter, but fourth quarter growth was flat. Even with the flat result, however, our companies’ earnings looked attractive compared to the back-to-back earnings declines posted by the broad small cap growth market.** In addition, the Fund’s market value was concentrated in companies that have low levels of debt relative to their operating earnings. This combination of
earnings stability and financial strength lent support to our performance, as investors favored companies with better earnings and balance sheets in the volatile environment.
One of our best-performing stocks was VNUS Medical Technologies, Inc., a manufacturer of medical devices that use radio frequency (RF) energy to treat varicose veins. The company, which has no long-term debt, grew sales by more than 40% in 2008 and provided 2009 guidance that exceeded Wall Street estimates. VNUS’s products serve patients who need vein repair for health rather than cosmetic reasons, so demand is not highly sensitive to the economy. NetLogic Microsystems, Inc. was another top contributor in the Fund — and another holding with no long-term debt. The company develops semiconductors for next-generation communications networks and has won a number of design contracts poised to go into production. Telecom carriers are cutting back spending, but less so when it comes to making important network upgrades that allow them to roll out new applications and services to their customers. Current and future portfolio holdings are subject to risk.
OUTLOOK
The Federal Reserve recently announced plans to buy more than $1 trillion in mortgage-backed and Treasury securities, helping send mortgage rates to record lows. The cost of a gallon of gas has dropped about $2 since last summer, and food prices have moderated. Taken together, these positive changes have left consumers with more breathing room in their household budgets. Rising job losses have made people reluctant to spend that extra money, but we believe spending will pick up and the economy will start to recover once the unemployment rate stabilizes. Although the timing of this is uncertain, we think the worst of the downturn may be behind us. The United States has been in a recession for 16 months, which is six months longer than the average length of the 11 previous recessions.
Historically, stock prices have bottomed several months before the economy, as investors anticipate a rebound in corporate earnings. That said, we do not expect to see the low-quality rally that we typically see coming out of bear markets† because risk aversion is so high. We therefore plan to maintain an emphasis on companies with stable demand characteristics that have high-quality financial structures or those we believe will emerge stronger out of this downturn.
Thank you for the opportunity to manage your assets.
| CFA® is a registered trademark of CFA Institute. |
| * | Earnings growth is a measure of growth in a company’s net income over a specific period, often one year. |
| ** | In the third and fourth quarters of 2008, year-over-year earnings for the broad small cap growth market declined 4.0% and 48.8%, respectively, according to data from Merrill Lynch. |
† | A bear market is generally defined as a drop of 20% or more in stock prices over a two-month period. |
30
Table of Contents
| WASATCH ULTRA GROWTH FUND (WAMCX) — Portfolio Summary | MARCH 31, 2009 | |
AVERAGE ANNUAL TOTAL RETURNS
| SIX MONTHS* | 1 YEAR | 5 YEARS | 10 YEARS | |||||
Ultra Growth | -32.95% | -45.09% | -11.20% | 2.25% | ||||
Russell 2000 Growth Index | -34.51% | -36.36% | -5.37% | -1.60% |
Performance data quoted represents past performance. Past performance is not indicative of future performance and current performance may be lower or higher than the performance quoted. Wasatch Funds will deduct a fee of 2% from redemption proceeds on Fund shares held 60 days or less. Performance data does not reflect the deduction of this fee which, if charged, would reduce the performance quoted. The table above does not reflect the deduction of taxes that you would pay on fund distributions or the redemption of fund shares.
The Total Annual Fund Operating Expenses for the Wasatch Ultra Growth Fund are 1.55%. Total Annual Fund Operating Expenses include direct expenses paid to the Advisor as well as indirect expenses incurred by the Fund as a result of its investments in other investment companies (each an “Acquired Fund”), before any expense reimbursements by the Advisor. The Net Expenses may differ due to waivers and reimbursements by the Advisor. See the prospectus for additional information regarding Fund expenses.
To obtain the most recent month-end performance, please visit www.wasatchfunds.com or call 800.551.1700. Investment returns and principal value will fluctuate and shares, when redeemed, may be worth more or less than their original cost. The Advisor may have absorbed, currently or in the past, certain Fund expenses, without which total returns would have been lower.
Investing in small cap funds will be more volatile and loss of principal could be greater than investing in large cap or more diversified funds.
| * | Not annualized. |
TOP 10 EQUITY HOLDINGS**
| Company | % of Fund | |
| Cognizant Technology Solutions Corp., Class A | 3.80% | |
| VNUS Medical Technologies, Inc. | 3.12% | |
| Netlogic Microsystems, Inc. | 3.02% | |
| O’Reilly Automotive, Inc. | 2.94% | |
| MSCI, Inc., Class A | 2.61% | |
| Westwood Holdings Group, Inc. | 2.58% |
| Company | % of Fund | |
| Montagu Newhall Global Partners II-B, L.P. | 2.56% | |
| VCA Antech, Inc. | 2.49% | |
| LKQ Corp. | 2.47% | |
| F5 Networks, Inc. | 2.38% | |
| 27.97% | ||
| ** | As of March 31, 2009, the Fund had 27.97% invested in the Top 10 equity holdings and there were 74 long-term holdings in the Fund. Portfolio holdings are subject to change at any time. References to specific securities should not be construed as recommendations by the Funds or their Advisor. Current and future holdings are subject to risk. |
SECTOR BREAKDOWN†
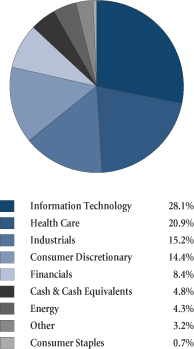
†Excludes | securities sold short and written options, if any. |
GROWTHOFA $10,000 INVESTMENT

Past performance does not predict future performance and the graph above does not reflect the deduction of taxes that you would pay on fund distributions or the redemption of fund shares. Performance shown in the chart above does not include any applicable sales charges and fees. Wasatch does not charge any sales fees. The chart represents a hypothetical $10,000 investment at the beginning of the time period shown. The Russell 2000 Growth Index is an unmanaged total return index that measures the performance of those Russell 2000 Index companies with higher price-to-book ratios and higher forecasted growth values. The Russell 2000 Index is an unmanaged total return index of the smallest 2,000 companies in the Russell 3000 Index, as ranked by total market capitalization. The Russell 2000 Index is widely regarded in the industry as accurately capturing the universe of small company stocks. You cannot invest directly in these or any indexes.
31
Table of Contents
| WASATCH-1ST SOURCE INCOME EQUITY FUND (FMIEX) — Management Discussion | MARCH 31, 2009 | |
The Wasatch-1st Source Income Equity Fund is managed by a team of Wasatch portfolio managers led by Ralph Shive and Mike Shinnick.
Ralph C. Shive, CFA Portfolio Manager
|
Michael L. Shinnick Portfolio Manager | OVERVIEW
The Wasatch-1st Source Income Equity Fund provided a total return of -27.69% for the six months ended March 31, 2009. This compared to a decline of |


-35.22% for the Fund’s benchmark, the Russell 1000 Value Index.
The bottom fell out of the economy and financial markets in October and November of 2008, as the issues with the financial system translated into the real economy in a major way. Every sector saw weak sales, plant and store closings and layoffs. We had expected a recession, but could not have predicted the severity and fallout for investors of what ensued.
The first quarter of 2009 opened with economic data that eliminated any doubt that a new year would mark the resolution of our economic difficulties, with continued deterioration in employment and rising mortgage delinquencies. The equity markets hit new lows in February, leading some to speculate that the long-awaited investor capitulation had occurred, possibly setting the stage for a new bull market.* While that could be the case, and March was a strong month, we are not ready to make that call.
The Fund’s outperformance of the benchmark continued to be the result of our decision months ago to take a defensive posture in view of our bearish outlook for the economy and markets. In particular, we have focused our equity holdings on sectors that are less impacted by changes in the economy, while also maintaining a significant cash position.
DETAILSOFTHE PERIOD
We generally start with a thematic approach with respect to our equity selections. This means looking to identify sectors of the economy that are positioned to outperform over time based on some trend we have identified. Then we look at companies that fall under that theme and seek to identify those that are attractively valued and that have good fundamentals, such as strong cash flow, a strong brand or hidden assets.
We have remained underweight in financial stocks, a stance that benefited the Fund’s performance significantly during the period. While an argument can be made that recent price levels have presented a buying opportunity, we continue to harbor concerns about the sector’s ability to rebound to anything near past valuations given the overall trend toward deleveraging. In addition, we believe the sector will not have the same operating flexibility going forward in view of the increased government oversight expected.
A major theme in the Fund has been a focus on defensive sectors that tend to be less impacted by economic conditions. This has helped performance as conditions remained weak. We continue to have overweight exposure to companies within the consumer staples category, and our stock selection has been favorable within the sector. Leading examples of strong performers include Archer Daniels Midland Co. and Walgreen Co. Archer Daniels is a food products conglomerate, while Walgreens is a leading national retail pharmacy chain.
Our exposure to the energy sector was the biggest detractor from the Fund’s performance as the price of oil collapsed. We have a long-term position in energy stocks that we add to or subtract from opportunistically as conditions indicate. We view energy as essentially a consumer staple sector, albeit one with erratic price movements. We took the opportunity provided by the decline to add to companies we believe will prosper as the economy ultimately recovers. These include integrated energy giant Conoco Phillips and exploration and refining firms Marathon Oil Corp. and The Williams Companies, Inc. Later in the period, we added a number of new positions under the theme of electrical energy generation, while trimming exposure to gas utilities. Our thinking in making this shift is that the trend toward a focus on greener energy sources will favor electrical utilities over gas going forward. Current and future portfolio holdings are subject to risk.
Finally, we have maintained a significant cash position in the Fund, which benefited performance as stock prices declined. While we want to be fully invested in stocks as a rule, we will use cash as a defensive measure when we see clear signs of a recession or bear market.**
OUTLOOK
We remain cautious with respect to conditions going forward. The current recession is clearly global in scope, the result of a closely connected supply chain that affects all stocks in all countries. We are watching closely as cuts in inventory and employment are implemented. Once these reductions are in place the potential is there for the deterioration in conditions to ease. Still, the distress in the financial sector has made the current downturn worse than most, and may limit the extent of any rebound. While recent government actions are helping, we remain concerned over the long-term impact of a weakened financing environment.
While stocks look attractive on a historical basis, and it is possible that most of the pain in terms of price declines has been felt, we expect to maintain a defensive posture in the portfolio. This continues to translate into a relatively high cash position and a tilt in favor of consumer staples and companies that produce non-discretionary products.
Thank you for the opportunity to manage your assets.
| CFA® is a registered trademark of CFA Institute. |
| *A | bull market is generally defined as a prolonged period when stock prices as a whole are moving upward. |
| **A | bear market is generally defined as a drop of 20% or more in stock prices over at least a two-month period. |
32
Table of Contents
| WASATCH-1ST SOURCE INCOME EQUITY FUND (FMIEX) — Portfolio Summary | MARCH 31, 2009 | |
AVERAGE ANNUAL TOTAL RETURNS
| SIX MONTHS* | 1 YEAR | 5 YEARS | 10 YEARS | |||||
Income Equity | -27.69% | -34.67% | 1.12% | 5.06% | ||||
Russell 1000 Value Index | -35.22% | -42.42% | -4.94% | -0.62% |
Performance data quoted represents past performance. Past performance is not indicative of future performance and current performance may be lower or higher than the performance quoted. Wasatch Funds will deduct a fee of 2% from redemption proceeds on Fund shares held 60 days or less. Performance data does not reflect the deduction of this fee which, if charged, would reduce the performance quoted. The table above does not reflect the deduction of taxes that you would pay on fund distributions or the redemption of fund shares.
The Total Annual Fund Operating Expenses for the Wasatch-1st Source Income Equity Fund are 1.16%. Total Annual Fund Operating Expenses include direct expenses paid to the Advisor before any expense reimbursements by the Advisor. The Net Expenses may differ due to waivers and reimbursements by the Advisor. See the prospectus for additional information regarding Fund expenses.
To obtain the most recent month-end performance, please visit www.wasatchfunds.com or call 800.551.1700. Investment returns and principal value will fluctuate and shares, when redeemed, may be worth more or less than their original cost. The Advisor may have absorbed, currently or in the past, certain Fund expenses, without which total returns would have been lower.
Investments in value stocks can perform differently from the market as a whole and other types of stocks and can continue to be undervalued by the market for long periods of time. Loss of principal is a risk of investing.
| * | Not annualized. |
TOP 10 EQUITY HOLDINGS**
| Company | % of Fund | |
| Intel Corp. | 1.78% | |
| Sysco Corp. | 1.75% | |
| Wal-Mart Stores, Inc. | 1.72% | |
| Hewlett-Packard Co. | 1.64% | |
| Marathon Oil Corp. | 1.63% | |
| Home Depot, Inc. | 1.56% |
| Company | % of Fund | |
| Abbott Laboratories | 1.55% | |
| Verizon Communications, Inc. | 1.55% | |
| Archer Daniels Midland Co. | 1.54% | |
| Computer Sciences Corp. | 1.53% | |
| 16.25% | ||
| ** | As of March 31, 2009, the Fund had 16.25% invested in the Top 10 equity holdings and there were 79 long-term holdings in the Fund. Portfolio holdings are subject to change at any time. References to specific securities should not be construed as recommendations by the Funds or their Advisor. Current and future holdings are subject to risk. |
SECTOR BREAKDOWN†
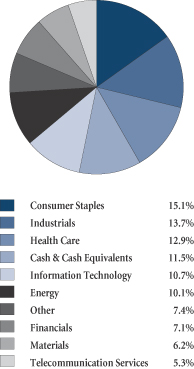
†Excludes | securities sold short and written options, if any. |
GROWTHOFA $10,000 INVESTMENT
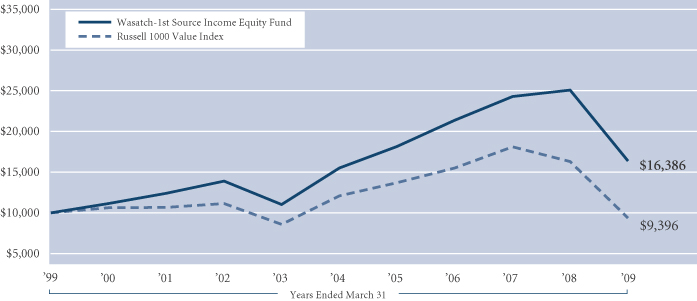
Past performance does not predict future performance and the graph above does not reflect the deduction of taxes that you would pay on fund distributions or the redemption of fund shares. Performance shown in the chart above does not include any applicable sales charges and fees. Wasatch does not charge any sales fees. The chart represents a hypothetical $10,000 investment at the beginning of the time period shown. The Russell 1000 Value Index measures the performance of Russell 1000 Index companies with lower price-to-book ratios and lower forecasted growth values. The Russell 1000 Index measures the performance of the largest 1,000 companies in the Russell 3000 Index. The Russell 3000 Index is an unmanaged total return index of the largest 3,000 U.S. companies based on total market capitalization. You cannot invest directly in these or any indexes.
33
Table of Contents
| WASATCH-1ST SOURCE LONG/SHORT FUND (FMLSX) — Management Discussion | MARCH 31, 2009 | |
The Wasatch-1st Source Long/Short Fund is managed by a team of Wasatch portfolio managers led by Mike Shinnick and Ralph Shive.
Michael L. Shinnick Portfolio Manager |
Ralph C. Shive, CFA Portfolio Manager | OVERVIEW
The Wasatch-1st Source Long/Short Fund provided a total return of -17.17% for the six months ended March 31, 2009. This compared to a decline of - -30.54% for the Fund’s benchmark, the S&P 500 Index. |
The Fund has also outperformed over the trailing three- and five-year periods.
As the issues with the financial system translated into the real economy in a major way, the bottom fell out of the financial markets in October and November of 2008. We had expected a recession, but could not have predicted the severity and fallout for investors of what ensued. Shrinking sales, plant and store closings and layoffs prevailed across sectors.
As 2009 opened, it became clear that the new year would not mark the resolution of our economic difficulties. Among other concerns, economic data reflected continued deterioration in employment and rising mortgage delinquencies. In February, the equity markets hit new lows. This suggested to some that the long-awaited investor capitulation had occurred, a view further fueled by the market rally in March. While it is possible that the stage has been set for a new bull market*, we are making no such prediction.
The Fund’s outperformance of the benchmark is in part the result of our short positions as well as stock selection within the long portfolio. In particular, we were net long for the brief rally that opened 2009 and added to our short position in time for the decline through February. Our equity holdings in sectors that are less impacted by changes in the economy and in a few special situations also added to performance.
DETAILSOFTHE PERIOD
We generally start with a thematic approach. This means we seek to identify sectors of the economy that are positioned to outperform over time based on some trend we have identified. Within those sectors, we look at companies that appear well-positioned to capitalize on that theme and we seek to identify those that are attractively valued and have good fundamentals, such as strong cash flow, a strong brand or hidden assets. In choosing companies to sell short, we simply reverse the analysis, (i.e., we look for industries where the trend is moving against them and companies within those industries that are particularly vulnerable from a fundamental perspective).
We have shorted financial stocks, in particular real estate investment trusts (REITs) such as Simon Property Group, Inc. and Regency Centers Corp., as well as some bank stocks. This benefited Fund performance significantly. While an argument can be made that recent price levels have presented buying opportunities, we continue to harbor concerns about the sector’s ability to rebound to anything near past valuations given the overall trend toward deleveraging. In addition, we believe the sector will not have the same operating flexibility going forward in view of increased government oversight and the higher costs of debt financing. The Fund also benefited from shorting the consumer discretionary sector. Stocks of companies such as Urban Outfitters, Inc. and Kohl’s Corp. experienced sharp declines, as “wants” have taken a back seat to “needs” in consumers’ budgets. A short position in media ratings service Arbitron Inc. was also a leading contributor to Fund performance,
On the long side of the portfolio, Cerner Corp. was a top contributor. Cerner provides information technology solutions for hospitals and is in an excellent position to weather difficult economic conditions. Another long position that helped performance was steel products manufacturer Nucor Corp. Leading detractors among our holdings included handheld device provider Nokia Corp. and computer giant Microsoft Corp.
Recently added long positions include companies poised to benefit from the continued growth in video games as a form of entertainment. We have also implemented short positions against certain specialty retailers that we think are likely to be impacted by the consumer focus on necessities. A recent successful example is Gymboree Corp., which specializes in products oriented to early childhood development.
OUTLOOK
While we remain cautious with respect to the overall economy, we strive to avoid being dogmatic about what “should happen.” This means taking a long position where there is a reasonable valuation, demand for a company’s products and the prospect of positive cash flow. By the same token, we will not hesitate to short companies in sectors under pressure from deleveraging and from the shift in consumer demand toward “needs” and away from discretionary items. Our strategy is directional rather than market neutral: we are trying to make money with each of our positions, rather than use long and short positions to eliminate the impact of market fluctuations.
The distress in the financials sector has made the current downturn worse than most and we remain concerned over the long-term impact of a weakened demand environment and the possibility of an extended debt-deflation type scenario. In stormy conditions, it makes sense not to get too far from shore. We will continue to take a common sense, logical approach to investing, while not being afraid to go against the “wisdom of the crowd” in order to opportunistically participate in situations that arise from mispriced securities.
Thank you for the opportunity to manage your assets.
| CFA® is a registered trademark of CFA Institute. |
| *A | bull market is generally defined as a prolonged period when stock prices as a whole are moving upward. |
34
Table of Contents
| WASATCH-1ST SOURCE LONG/SHORT FUND (FMLSX) — Portfolio Summary | MARCH 31, 2009 | |
AVERAGE ANNUAL TOTAL RETURNS
| SIX MONTHS* | 1 YEAR | 5 YEARS | SINCE INCEPTION 8/1/03 | |||||
Long/Short | -17.17% | -20.20% | 0.42% | 1.43% | ||||
Citigroup 3-Month U.S. Treasury Bills Index | 0.30% | 1.13% | 3.06% | 2.81% | ||||
S&P 500 Index | -30.54% | -38.09% | -4.76% | -1.82% |
Performance data quoted represents past performance. Past performance is not indicative of future performance and current performance may be lower or higher than the performance quoted. Wasatch Funds will deduct a fee of 2% from redemption proceeds on Fund shares held 60 days or less. Performance data does not reflect the deduction of this fee which, if charged, would reduce the performance quoted. The table above does not reflect the deduction of taxes that you would pay on fund distributions or the redemption of fund shares.
The Total Annual Fund Operating Expenses for the Wasatch-1st Source Long/Short Fund are 1.67%. Total Annual Fund Operating Expenses include direct expenses paid to the Advisor before any expense reimbursements by the Advisor. The Net Expenses may differ due to waivers and reimbursements by the Advisor. See the prospectus for additional information regarding Fund expenses.
To obtain the most recent month-end performance, please visit www.wasatchfunds.com or call 800.551.1700. Investment returns and principal value will fluctuate and shares, when redeemed, may be worth more or less than their original cost. The Advisor may have absorbed, currently or in the past, certain Fund expenses, without which total returns would have been lower.
The Fund makes short sales of securities which involve the risk that losses may exceed the original amount invested. Equity investing involves risks, including potential loss of the principal amount invested. Being non-diversified, the Fund can invest a larger portion of its assets in the securities of a limited number of companies than a diversified fund. Non-diversification increases the risk of loss to the Fund if the values of these securities decline.
| * | Not annualized. |
TOP 10 EQUITY HOLDINGS**
| Company | % of Fund | |||
| Wal-Mart Stores, Inc. | 3.97% | |||
| Cerner Corp. | 3.79% | |||
| Republic Services, Inc. | 3.22% | |||
| The Steak ’n Shake Co. | 3.07% | |||
| Waste Management, Inc. | 2.86% | |||
| Oracle Corp. | 2.75% |
| Company | % of Fund | |||
| Newmont Mining Corp. | 2.73% | |||
| Akamai Technologies, Inc. | 2.46% | |||
| Alliant Techsystems, Inc. | 2.38% | |||
| Energen Corp. | 2.36% | |||
| 29.59% | ||||
| ** | As of March 31, 2009, the Fund had 29.59% invested in the Top 10 equity holdings and there were 49 long-term holdings in the Fund. Portfolio holdings are subject to change at any time. References to specific securities should not be construed as recommendations by the Funds or their Advisor. Current and future holdings are subject to risk. |
SECTOR BREAKDOWN†
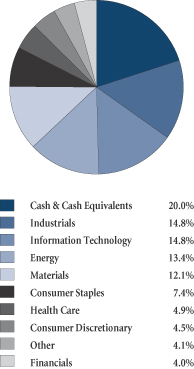
†Excludes | written options, if any. |
GROWTHOFA $10,000 INVESTMENT
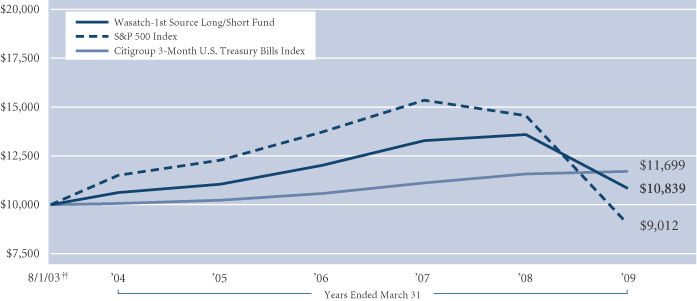
Past performance does not predict future performance and the graph above does not reflect the deduction of taxes that you would pay on fund distributions or the redemption of fund shares. Performance shown in the chart above does not include any applicable sales charges and fees. Wasatch does not charge any sales fees. The chart represents a hypothetical $10,000 investment at the beginning of the time period shown. ††Inception: August 1, 2003. The Citigroup 3-Month U.S. Treasury Bills Index tracks the performance of U.S. Treasury bills with a remaining maturity of three months. U.S. Treasury bills, which are short-term loans to the U.S. government, are full-faith-and-credit obligations of the U.S. Treasury and are generally regarded as being free of any risk of default. The S&P 500 Index includes 500 of the United States’ largest stocks from a broad variety of industries. The Index is unmanaged but is a commonly used measure of common stock total return performance. You cannot invest directly in these or any indexes.
35
Table of Contents
| WASATCH-HOISINGTON U.S. TREASURY FUND (WHOSX) — Management Discussion | MARCH 31, 2009 | |
Van R. Hoisington Portfolio Manager | OVERVIEW
The Wasatch-Hoisington U.S. Treasury Fund returned 19.35% in the six months ended March 31, 2009, versus 4.70% for the Barclays Capital U.S. Aggregate Bond Index. The yield on 30-year Treasury bonds fell to 3.53%, down from 4.31% on September 30, 2008. Reflecting this 0.78 percentage point decrease in yields, the market value of the Fund’s portfolio rose, resulting in a return that was far greater than the coupon interest |

on the Treasury bonds held in the Fund.
DETAILSOFTHE PERIOD
The recession that began in December 2007, as determined by the National Bureau of Economic Research (NBER),* continued through March 2009. The NBER utilizes employment, production, income and business sales data to make its determinations. Although only employment was available at this writing, proxies for production and income indicate that these two barometers continued to contract in March. By many measures, the current recession already ranks as one of the most severe since the end of World War II.
In the 12 months ended March, household employment contracted by 3.5%, the steepest decline in the past six decades. Private payroll employment slumped by 4.2% in the past 12 months, the greatest loss since August 1958. Industrial production declined more in the past 12 months than in any comparable period since the demobilization at the end of World War II. Real personal income less transfer payments, the exact income measure used by the NBER, declined 1.9% in the 12 months ended February.
Reflecting this severe recession, unused labor and other productive resources have increased sharply. In March, the unemployment rate stood at 8.5%, up from a cyclical low of 4.4% and at the highest level since the early 1980s.
The operating rates for all industries and manufacturing fell to their lowest on record in February. Manufacturing statistics date back to 1949. The total industry series started in 1967. Manufacturing capacity was about 14% below the 60-year average. New lows were undoubtedly reached in March.
In the face of such huge amounts of unutilized resources, the Consumer Price Index (CPI)** rose just 0.2% in the latest 12 months, with the core CPI up a very low 1.8%. Treasury bond yields followed current and likely future inflation rates lower.
OUTLOOK
The critical element in an investment portfolio over the next decade will be the correct call regarding inflation or its antipode, deflation. Despite near term deflation risks, it appears that the overwhelming consensus view is that “sooner or later” inflation will return and probably with great momentum. Inflationists argue that the unprecedented
increases in the Fed’s balance sheet are, by definition, inflationary. The Fed has to print money to restore the economy to health but this process will ultimately result in a substantially higher general price level. An unparalleled surge in Federal government spending and massive deficits, inflationists contend, will stimulate economic activity. This will serve to reinforce the reflationary efforts of the Fed, and lead to inflation. These propositions, however intuitively attractive, are beguiling and do not stand the test of history or economic theory. Betting on inflation as a portfolio strategy will be as bad a bet in the next decade as it has been in the past 20 years, when Treasury bonds produced a higher total return than common stocks. This is a reminder that both stocks and Treasury bond returns are sensitive to inflation, albeit with inverse results.
If inflation and interest rates were to rise in this economic recession or the early stages of a recovery, the expansion would be cut short and the economy would relapse into recession. In late stages of economic downturns, substantial amounts of unutilized labor and other resources exist. Thus, the factory utilization rate and the unemployment rate are lagging economic indicators. Let’s assume that inflation rises immediately. With unemployment widespread, wages would seriously lag inflation. Thus, real household income would decline and truncate any potential gain in consumer spending.
The current recession is much worse than the garden-variety economic downturn because of the record, ill financed leverage. The total debt to gross domestic product (GDP) ratio*** surged to a new peak of 3.70 in the fourth quarter of 2008. Nonfinancial, corporate nonfinancial and financial debt, the three major components of total debt, all surged to new records as a percent of GDP in the fourth quarter. Since nominal GDP fell again in the first quarter of 2009, the economy’s debt burden has moved to another new record, perpetuating the risk of debt deflation. For about 15 years following the debt deflations in the U.S. from 1874 to 1894 and 1928 to 1941 and Japan from 1988 to 2008, long-term Treasury yields declined, following the overall inflation rate lower.
We believe higher inflation is a long way off. Since history and economic theory indicate that inflation is a lagging economic indicator, the greater risk is that CPI and its core will move into deflation. Accordingly, Treasury bond yields appear poised to move lower, a trend that has historically supported increases in Treasury bond prices. Such an environment would be favorable for the Wasatch-Hoisington U.S. Treasury Fund.
Thank you for the opportunity to manage your assets.
| *The | National Bureau of Economic Research (NBER) is a U.S. private, nonprofit, nonpartisan research organization dedicated to promoting a greater understanding of how the economy works. The NBER is committed to undertaking and disseminating unbiased economic research among public policymakers, business professionals, and the academic community. |
| **Consumer | Price Index (CPI) is published monthly and is an inflationary indicator that measures the change in the cost of a fixed basket of products and services, including housing, electricity, food, and transportation. |
| ***A | measure of a country’s federal debt in relation to its gross domestic product (GDP). The higher the debt-to-GDP ratio, the less likely the country will pay its debt back, and the higher its risk of default. |
36
Table of Contents
| WASATCH-HOISINGTON U.S. TREASURY FUND (WHOSX) — Portfolio Summary | MARCH 31, 2009 | |
AVERAGE ANNUAL TOTAL RETURNS
| SIX MONTHS* | 1 YEAR | 5 YEARS | 10 YEARS | |||||
U.S. Treasury | 19.35% | 21.01% | 9.43% | 8.75% | ||||
Barclays Capital U.S. Aggregate Bond Index | 4.70% | 3.13% | 4.13% | 5.70% |
Performance data quoted represents past performance. Past performance is not indicative of future performance and current performance may be lower or higher than the performance quoted. Wasatch Funds will deduct a fee of 2% from redemption proceeds on Fund shares held 60 days or less. Performance data does not reflect the deduction of this fee which, if charged, would reduce the performance quoted. The table above does not reflect the deduction of taxes that you would pay on fund distributions or the redemption of fund shares.
The Total Annual Fund Operating Expenses for the Wasatch-Hoisington U.S. Treasury Fund are 0.74%. Total Annual Fund Operating Expenses include direct expenses paid to the Advisor before any expense reimbursements by the Advisor. The Net Expenses may differ due to waivers and reimbursements by the Advisor. See the prospectus for additional information regarding Fund expenses.
To obtain the most recent month-end performance, please visit www.wasatchfunds.com or call 800.551.1700. Investment returns and principal value will fluctuate and shares, when redeemed, may be worth more or less than their original cost. The Advisor may have absorbed, currently or in the past, certain Fund expenses, without which total returns would have been lower.
Investments in fixed income funds are subject to the same interest rate, inflation, credit and other risks associated with the underlying bonds. Return of principal is not guaranteed.
*Not annualized.
TOP 10 HOLDINGS**
| Holding | Maturity Date | % of Fund | ||
| U.S. Treasury Strip, principal only | 11/15/27 | 30.75% | ||
| U.S. Treasury Bond, 4.75% | 2/15/37 | 17.62% | ||
| U.S. Treasury Strip, principal only | 2/15/37 | 15.96% | ||
| U.S. Treasury Bond, 4.50% | 2/15/36 | 15.87% |
| Holding | Maturity Date | % of Fund | ||
| U.S. Treasury Bond, 4.50% | 5/15/38 | 9.38% | ||
| U.S. Treasury Bond, 5.25% | 2/15/29 | 5.72% | ||
| U.S. Treasury Bond, 5.375% | 2/15/31 | 2.34% | ||
| U.S. Treasury Bond, 4.375% | 2/15/38 | 0.98% | ||
| 98.62% | ||||
| ** | As of March 31, 2009, the Fund had 98.62% invested in the Top 10 holdings and there were 8 long-term holdings in the Fund. Portfolio holdings are subject to change at any time. References to specific securities should not be construed as recommendations by the Funds or their Advisor. Current and future holdings are subject to risk. |
INVESTMENTS & CASH
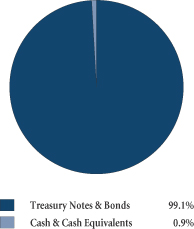
GROWTHOFA $10,000 INVESTMENT
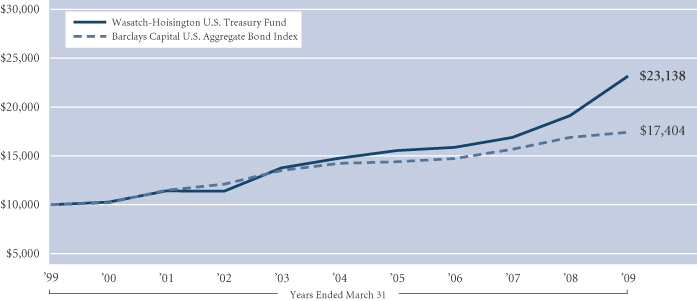
Past performance does not predict future performance and the graph above does not reflect the deduction of taxes that you would pay on fund distributions or the redemption of fund shares. Performance shown in the chart above does not include any applicable sales charges and fees. Wasatch does not charge any sales fees. The chart represents a hypothetical $10,000 investment at the beginning of the time period shown. The Barclays Capital U.S. Aggregate Bond Index (formerly the Lehman Brothers Aggregate Bond Index) covers the U.S. investment grade fixed rate bond market, including government and corporate securities, agency mortgage pass-through securities, and asset-backed securities. To be included in the index the security must meet the following criteria: must have at least one year to final maturity, regardless of call features; must have at least $100 million par amount outstanding; must be rated investment grade or better by Moody’s Investors Service, Standard & Poor’s, or Fitch Investor’s Service; must be fixed rate, although it can carry a coupon that steps up or changes to a predetermined schedule; must be dollar-denominated and nonconvertible. All corporate and asset-backed securities must be registered with the SEC and must be publicly issued. You cannot invest directly in this or any index.
37
Table of Contents
| WASATCH-1ST SOURCE INCOME FUND (FMEQX) — Management Discussion | MARCH 31, 2009 | |
Paul Gifford, CFA Portfolio Manager | OVERVIEW
For the six-month period ended March 31, 2009, the Wasatch-1st Source Income Fund returned 3.57%, and trailed the Barclays Capital U.S. Intermediate Government/Credit Bond Index, which returned 4.79%. Starker than this 1.22 percentage point difference is the comparison of the Fund’s performance to that of various peer groups including the Morningstar |

Short-Term Bond* and Intermediate-Term Bond** categories. The Fund outperformed in each of these categories by over four percentage points. Yes, this is short-term performance but in difficult times like these seeing positive returns can be comforting.
DETAILSOFTHE PERIOD
The primary reason for the variance between the Fund’s performance and that of its benchmark was that the Fund held fewer U.S. Treasury securities than the Index. Treasuries were the best performing asset class in the six-month period, with most of the return coming during the fourth quarter of 2008, when yields fell to cyclical lows. Yields rose in the first quarter of 2009 and the prices of U.S. Treasury bonds fell. The Fund outperformed over the past three months partly as a result of being less concentrated in treasuries.
In managing money over the past 20 years, there were only a handful of times when the fixed income market was as challenging as it has been in the last six months. In 1994, the Federal Reserve raised interest rates dramatically, decimating many mortgage-backed securities. In 1997 to 1998, we had “Asian Contagion” with the Asian financial crisis and the fall of the hedge fund Long-Term Capital Management. We had the credit crisis of 2001 to 2002. Now, we have been in a credit crunch since 2007.
Each event has helped to build on our fixed income philosophy, as well as confirm our core strategy of buying investment grade bonds with short to intermediate maturities with the goal of providing consistent levels of income and lower volatility. The challenge for portfolio managers is to understand that their approach will not always be in vogue or outperform yet keep the conviction to stick with the philosophy in those times.
The two quarters covered in this semi-annual report were very different in many ways and investments that worked in one did not do so well in the other. The earlier paragraph mentioned that our underweight exposure to U.S. Treasuries hurt performance in the fourth quarter of 2008 but helped in the first quarter of 2009. The same could be said of our call for short duration, which hurt our fourth quarter performance, but helped the Fund in the first quarter. Higher credit quality has been one constant that helped most of the last six months. We had more “A” and higher rated securities, especially versus the peer groups mentioned above, and that significantly helped performance.
OUTLOOK
Over the past six months, the U.S. government has been very active in the financial markets, in fact more active than at any time in the past 70 years. New banks were created to gain access to capital from the Trouble Assets Relief Program (TARP). And, we have had the alphabet soup of programs since. It is going to take time for the financial markets to see how effective these programs are going to be. Given the size of the problems in the credit markets and banks, not all of the programs may work nor are they a silver bullet.
We hope to eventually get out of this as a stronger and wiser capitalist economy.
Thank you for the opportunity to manage your assets.
| CFA® is a registered trademark of CFA Institute. |
| * | The Morningstar Short-Term Bond category includes funds that focus on corporate and other investment-grade issues with an average duration of more than one year but less than 3.5 years, or an average effective maturity of more than one year but less than four years. |
| **The | Morningstar Intermediate-Term Bond category includes funds that focus on corporate, government, foreign or other issues with an average duration of greater than or equal to 3.5 years but less than or equal to six years, or an average effective maturity of more than four years but less than 10 years. |
38
Table of Contents
| WASATCH-1ST SOURCE INCOME FUND (FMEQX) — Portfolio Summary | MARCH 31, 2009 | |
AVERAGE ANNUAL TOTAL RETURNS
| SIX MONTHS* | 1 YEAR | 5 YEARS | 10 YEARS | |||||
Income Fund | 3.57% | 1.83% | 2.91% | 4.40% | ||||
Barclays Capital U.S. Intermediate | 4.79% | 1.96% | 3.70% | 5.44% |
Performance data quoted represents past performance. Past performance is not indicative of future performance and current performance may be lower or higher than the performance quoted. Wasatch Funds will deduct a fee of 2% from redemption proceeds on Fund shares held 60 days or less. Performance data does not reflect the deduction of this fee which, if charged, would reduce the performance quoted. The table above does not reflect the deduction of taxes that you would pay on fund distributions or the redemption of fund shares.
The Total Annual Fund Operating Expenses for the Wasatch-1st Source Income Fund are 0.82%. Total Annual Fund Operating Expenses include direct expenses paid to the Advisor before any expense reimbursements by the Advisor. The Net Expenses may differ due to waivers and reimbursements by the Advisor. See the prospectus for additional information regarding Fund expenses.
To obtain the most recent month-end performance, please visit www.wasatchfunds.com or call 800.551.1700. Investment returns and principal value will fluctuate and shares, when redeemed, may be worth more or less than their original cost. The Advisor may have absorbed, currently or in the past, certain Fund expenses, without which total returns would have been lower.
Investments in fixed income funds are subject to the same interest rate, inflation, credit and other risks associated with the underlying bonds. Return of principal is not guaranteed.
| * | Not annualized. |
TOP 10 HOLDINGS**
| Holding | Maturity Date | % of Fund | ||
| U.S. Treasury Note, 4.25% | 8/15/15 | 4.14% | ||
| U.S. Treasury Note, 1.625% | 1/15/18 | 4.02% | ||
| Federal Home Loan Mortgage Corp., Series R010, Class AB, 5.50% | 12/15/19 | 2.87% | ||
| iShares Investment Grade Corporate Bond Fund | 2.16% | |||
| Federal Home Loan Bank, 5.00% | 9/14/12 | 1.76% | ||
| Citibank Credit Card Issuance Trust, Series 2006-A4, Class A4, 5.45% | 5/10/13 | 1.59% |
| Holding | Maturity Date | % of Fund | ||
| Federal Home Loan Mortgage Corp., 5.50% | 3/28/16 | 1.54% | ||
| Federal National Mortgage Assoc., Series 2005-4, Class VG, 5.00% | 7/25/23 | 1.41% | ||
| Federal National Mortgage Assoc., 4.375% | 9/15/12 | 1.40% | ||
| U.S. Treasury Note, 3.75% | 11/18/15 | 1.36% | ||
| 22.25% | ||||
| ** | As of March 31, 2009, the Fund had 22.25% invested in the Top 10 holdings and there were 154 long-term holdings in the Fund. Portfolio holdings are subject to change at any time. References to specific securities should not be construed as recommendations by the Funds or their Advisor. Current and future holdings are subject to risk. |
INVESTMENTS & CASH
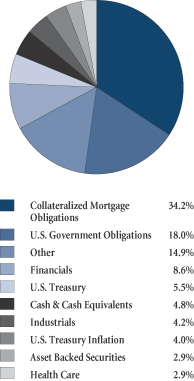
GROWTHOFA $10,000 INVESTMENT
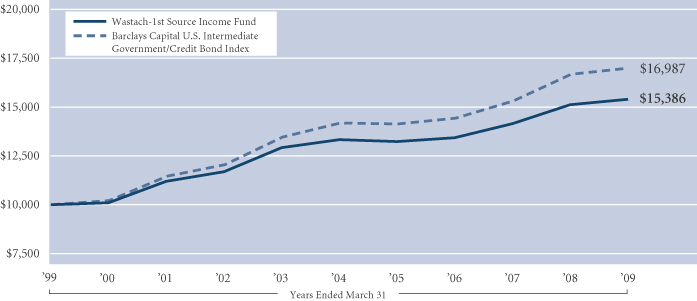
Past performance does not predict future performance and the graph above does not reflect the deduction of taxes that you would pay on fund distributions or the redemption of fund shares. Performance shown in the chart above does not include any applicable sales charges and fees. Wasatch does not charge any sales fees. The chart represents a hypothetical $10,000 investment at the beginning of the time period shown. The Barclays Capital U.S. Intermediate Government/Credit Bond Index (formerly the Lehman Brothers Intermediate U.S. Government/Credit Bond Index) is an unmanaged index considered representative of the performance of government and corporate bonds with maturities of less than 10 years. You cannot invest directly in this or any index.
39
Table of Contents
| WASATCH FUNDS — OPERATING EXPENSES | ||
EXPENSE EXAMPLE
As a shareholder of Wasatch Funds, you incur two types of costs: (1) transaction costs, including redemption fees and (2) ongoing costs, including management fees and other fund expenses. This example is intended to help you understand your ongoing costs (in dollars) of investing in a Wasatch Fund and to compare these costs with the ongoing costs of investing in other mutual funds.
The example is based on an investment of $1,000.00 invested at the beginning of the period and held for the entire six month period ended March 31, 2009.
ACTUAL EXPENSES
The first line of the table below provides information about actual account values and actual expenses, based upon the actual total return of the fund during the most recent six month period ended March 31. You may use the information in this line, together with the amount you invested, to estimate the expenses you paid over the period. Simply divide your account value by $1,000.00 (for example, an $8,600.00 account value divided by $1,000.00 = 8.6), then multiply the result by the number in the first line under the heading entitled “Expenses Paid During Period” to estimate the expenses you paid on your account during this period.
In addition, the Funds charge a $15.00 IRA distribution fee, a $12.50 IRA annual maintenance fee and a $15.00 fee for redemptions paid by wire. To the extent these fees apply to your account, your expenses paid during the period would be higher and your ending account value would be lower than the amounts shown in the table below.
HYPOTHETICAL EXAMPLEFOR COMPARISON PURPOSES
The second line of the table below provides information about hypothetical account values and hypothetical expenses based on a fund’s actual expense ratio and an assumed rate of return of 5% per year before expenses, which is not the fund’s actual return. The hypothetical account values and expenses may not be used to estimate the actual ending account balance or expenses you paid for the period. You may use this information to compare the ongoing costs of investing in a Wasatch Fund and other funds. To do so, compare this 5% hypothetical example with the 5% hypothetical examples that appear in the shareholder reports of other funds.
In addition, the Funds charge a $15.00 IRA distribution fee, a $12.50 IRA annual maintenance fee and a $15.00 fee for redemptions paid by wire. To the extent these fees apply to your account, your expenses paid during the period would be higher and your ending account value would be lower than the amounts shown in the table below. If another fund’s fees differ from those listed above, your expenses paid and your ending account value could be higher or lower than those of other funds.
Please note that the expenses shown in the table are meant to highlight your ongoing costs only and do not reflect any transactional costs, such as redemption fees. Therefore, the second line of the table is useful in comparing ongoing costs only, and will not help you determine the relative total costs of owning different funds. In addition, if these transactional costs were included, your costs would have been higher.
40
Table of Contents
| MARCH 31, 2009 (UNAUDITED) | ||
| Account Value | Expenses Paid During Period* | Annualized Expense Ratio* | ||||||
| Fund/Class and Return | Beginning of Period October 1, 2008 | End of Period March 31, 2009 | ||||||
Core Growth Fund | ||||||||
Actual | $1,000.00 | $668.90 | $5.83 | 1.40% | ||||
Hypothetical (5% before expenses) | $1,000.00 | $1,017.95 | $7.04 | 1.40% | ||||
Emerging Markets Small Cap Fund | ||||||||
Actual | $1,000.00 | $662.30 | $8.70 | 2.10% | ||||
Hypothetical (5% before expenses) | $1,000.00 | $1,014.46 | $10.55 | 2.10% | ||||
Global Opportunities Fund1 | ||||||||
Actual | $1,000.00 | $1,100.00 | $8.74 | 2.25% | ||||
Hypothetical (5% before expenses) | $1,000.00 | $1,010.17 | $8.36 | 2.25% | ||||
Global Science & Technology Fund | ||||||||
Actual | $1,000.00 | $725.50 | $8.39 | 1.95% | ||||
Hypothetical (5% before expenses) | $1,000.00 | $1,015.21 | $9.80 | 1.95% | ||||
Heritage Growth Fund | ||||||||
Actual | $1,000.00 | $761.30 | $4.17 | 0.95% | ||||
Hypothetical (5% before expenses) | $1,000.00 | $1,020.19 | $4.78 | 0.95% | ||||
Heritage Value Fund | ||||||||
Actual | $1,000.00 | $777.70 | $4.21 | 0.95% | ||||
Hypothetical (5% before expenses) | $1,000.00 | $1,020.19 | $4.78 | 0.95% | ||||
International Growth Fund2 | ||||||||
Actual | $1,000.00 | $705.10 | $8.33 | 1.96% | ||||
Hypothetical (5% before expenses) | $1,000.00 | $1,015.16 | $9.85 | 1.96% | ||||
International Opportunities Fund2 | ||||||||
Actual | $1,000.00 | $721.50 | $9.74 | 2.27% | ||||
Hypothetical (5% before expenses) | $1,000.00 | $1,013.61 | $11.40 | 2.27% | ||||
Micro Cap Fund | ||||||||
Actual | $1,000.00 | $637.50 | $9.35 | 2.29% | ||||
Hypothetical (5% before expenses) | $1,000.00 | $1,013.51 | $11.50 | 2.29% | ||||
Micro Cap Value Fund | ||||||||
Actual | $1,000.00 | $694.40 | $9.50 | 2.25% | ||||
Hypothetical (5% before expenses) | $1,000.00 | $1,013.71 | $11.30 | 2.25% | ||||
Small Cap Growth Fund | ||||||||
Actual | $1,000.00 | $755.70 | $5.91 | 1.35% | ||||
Hypothetical (5% before expenses) | $1,000.00 | $1,018.20 | $6.79 | 1.35% | ||||
Small Cap Value Fund | ||||||||
Actual | $1,000.00 | $617.00 | $7.86 | 1.95% | ||||
Hypothetical (5% before expenses) | $1,000.00 | $1,015.21 | $9.80 | 1.95% | ||||
Strategic Income Fund2 | ||||||||
Actual | $1,000.00 | $690.90 | $4.60 | 1.09% | ||||
Hypothetical (5% before expenses) | $1,000.00 | $1,019.50 | $5.49 | 1.09% | ||||
Ultra Growth Fund | ||||||||
Actual | $1,000.00 | $670.50 | $7.29 | 1.75% | ||||
Hypothetical (5% before expenses) | $1,000.00 | $1,016.21 | $8.80 | 1.75% | ||||
Wasatch-1st Source Income Equity Fund | ||||||||
Actual | $1,000.00 | $723.10 | $4.68 | 1.09% | ||||
Hypothetical (5% before expenses) | $1,000.00 | $1,019.50 | $5.49 | 1.09% | ||||
Wasatch-1st Source Long/Short Fund | ||||||||
Actual | $1,000.00 | $828.30 | $8.57 | 1.88% | ||||
Hypothetical (5% before expenses) | $1,000.00 | $1,015.56 | $9.45 | 1.88% | ||||
U.S. Treasury Fund | ||||||||
Actual | $1,000.00 | $1,193.50 | $4.10 | 0.75% | ||||
Hypothetical (5% before expenses) | $1,000.00 | $1,021.19 | $3.78 | 0.75% | ||||
Wasatch-1st Source Income Fund | ||||||||
Actual | $1,000.00 | $1,035.70 | $4.31 | 0.85% | ||||
Hypothetical (5% before expenses) | $1,000.00 | $1,020.69 | $4.28 | 0.85% | ||||
*Expenses are equal to the Funds’ annualized expense ratio as indicated above multiplied by the average account value over the period, multiplied by the number of days in the most recent fiscal half-year divided by the number of days in the full fiscal year (182/365).
1 Fund inception date was November 17, 2008.
2 The annualized expense ratio includes dividend payments for securities sold short and/or line of credit interest fees. Excluding these items the annualized expense ratio would have been 1.95%, 2.25%, and 0.95% for the International Growth, International Opportunities, and Strategic Income Funds, respectively. Dividend payments for securities sold short and line of credit interest fees are not a reimbursable expense under the contractual agreement between the Fund and the Advisor.
41
Table of Contents
| WASATCH CORE GROWTH FUND (WGROX) — Schedule of Investments | ||
| Shares | Value | ||||
| COMMON STOCKS 93.3% | |||||
| Aerospace & Defense 0.0% | |||||
| 687,880 | DataPath, Inc.* † | $ | 34,394 | ||
| Agricultural Products 1.8% | |||||
| 5,388,871 | Chaoda Modern Agriculture Holdings Ltd. (China) | 3,204,883 | |||
| 5,348,400 | China Green Holdings Ltd. (China) | 3,153,935 | |||
| 6,358,818 | |||||
| Apparel, Accessories & Luxury Goods 1.4% | |||||
| 4,282,187 | Ports Design Ltd. (Hong Kong) | 4,941,790 | |||
| Application Software 1.2% | |||||
| 86,080 | FactSet Research Systems, Inc. | 4,303,139 | |||
| Asset Management & Custody Banks 5.1% | |||||
| 125,424 | Affiliated Managers Group, Inc.* | 5,231,435 | |||
| 611,199 | SEI Investments Co. | 7,462,740 | |||
| 880,060 | Solar Capital, LLC* ** *** † | 5,042,744 | |||
| 17,736,919 | |||||
| Automotive Retail 3.8% | |||||
| 380,134 | O’Reilly Automotive, Inc.* | 13,308,491 | |||
| Construction & Engineering 1.1% | |||||
| 8,895 | Outotec Oyj (Finland) | 152,289 | |||
| 87,693 | URS Corp.* | 3,543,674 | |||
| 3,695,963 | |||||
| Consumer Finance 2.5% | |||||
| 907,514 | Dollar Financial Corp.* | 8,639,533 | |||
| Data Processing & Outsourced Services 1.0% | |||||
| 192,480 | Fidelity National Information Services, Inc. | 3,503,136 | |||
| Distributors 1.6% | |||||
| 389,800 | LKQ Corp.* | 5,562,446 | |||
| Diversified Banks 0.8% | |||||
| 338,626 | Axis Bank Ltd. (India) | 2,770,521 | |||
| Diversified Support Services 6.7% | |||||
| 746,587 | Copart, Inc.* | 22,143,771 | |||
| 517,571 | LPS Brasil — Consultoria de Imoveis S.A. (Brazil) | 1,291,821 | |||
| 23,435,592 | |||||
| Environmental & Facilities Services 1.1% | |||||
| 145,225 | Waste Connections, Inc.* | 3,732,282 | |||
| Footwear 0.8% | |||||
| 42,617,935 | China Hongxing Sports Ltd. (China) | 2,657,199 | |||
| Health Care Distributors 2.2% | |||||
| 523,277 | PSS World Medical, Inc.* | 7,509,025 | |||
| Health Care Facilities 4.2% | |||||
| 1,550,374 | Emeritus Corp.* | 10,170,453 | |||
| 204,740 | VCA Antech, Inc.* | 4,616,887 | |||
| 14,787,340 | |||||
| Health Care Services 3.3% | |||||
| 386,884 | MEDNAX, Inc.* | 11,401,471 | |||
| Homefurnishing Retail 2.5% | |||||
| 325,230 | Aaron Rents, Inc. | 8,670,632 | |||
| Industrial Machinery 3.6% | |||||
| 127,675 | Graco, Inc. | 2,179,412 | |||
| 469,280 | IDEX Corp. | 10,263,154 | |||
| 12,442,566 | |||||
| Shares | Value | ||||
| Internet Software & Services 1.9% | |||||
| 265,576 | DealerTrack Holdings, Inc.* | $ | 3,479,046 | ||
| 114,388 | VistaPrint Ltd.* | 3,144,526 | |||
| 6,623,572 | |||||
| IT Consulting & Other Services 1.2% | |||||
| 204,950 | Cognizant Technology Solutions Corp., Class A* | 4,260,910 | |||
| Leisure Facilities 2.4% | |||||
| 668,779 | Life Time Fitness, Inc.* | 8,399,864 | |||
| Leisure Products 2.8% | |||||
| 716,759 | Pool Corp. | 9,604,571 | |||
| Life Sciences Tools & Services 1.0% | |||||
| 150,585 | Pharmaceutical Product Development, Inc. | 3,571,876 | |||
| Mortgage REITs 7.6% | |||||
| 1,150,420 | Annaly Capital Management, Inc. | 15,956,325 | |||
| 695,036 | Redwood Trust, Inc. | 10,668,803 | |||
| 26,625,128 | |||||
| Oil & Gas Equipment & Services 2.6% | |||||
| 156,455 | Dril-Quip, Inc.* | 4,803,168 | |||
| 244,755 | Helix Energy Solutions Group, Inc.* | 1,258,041 | |||
| 915,155 | TETRA Technologies, Inc.* | 2,974,254 | |||
| 9,035,463 | |||||
| Oil & Gas Exploration & Production 2.8% | |||||
| 336,805 | GMX Resources, Inc.* | 2,189,233 | |||
| 395,075 | Petrohawk Energy Corp.* | 7,597,292 | |||
| 9,786,525 | |||||
| Personal Products 2.1% | |||||
| 215,196 | Emami Ltd. (India) | 878,822 | |||
| 437,170 | Herbalife Ltd. | 6,548,807 | |||
| 7,427,629 | |||||
| Property & Casualty Insurance 1.2% | |||||
| 163,832 | Tower Group, Inc. | 4,035,182 | |||
| Research & Consulting Services 5.1% | |||||
| 262,493 | CRA International, Inc.* | 4,955,868 | |||
| 840,737 | Resources Connection, Inc.* | 12,678,314 | |||
| 17,634,182 | |||||
| Semiconductors 6.1% | |||||
| 166,900 | Hittite Microwave Corp.* | 5,207,280 | |||
| 387,065 | Melexis N.V. (Belgium) | 1,798,265 | |||
| 680,169 | Micrel, Inc. | 4,788,390 | |||
| 192,450 | Netlogic Microsystems, Inc.* | 5,288,526 | |||
| 158,563 | Silicon Laboratories, Inc.* | 4,186,063 | |||
| 21,268,524 | |||||
| Specialized Finance 1.6% | |||||
| 328,540 | MSCI, Inc., Class A* | 5,555,611 | |||
| Specialty Stores 1.7% | |||||
| 305,015 | Hibbett Sports, Inc.* | 5,862,388 | |||
| Thrifts & Mortgage Finance 0.7% | |||||
| 90,280 | Housing Development Finance Corp. Ltd. (India) | 2,510,024 | |||
| Trading Companies & Distributors 5.4% | |||||
| 370,952 | MSC Industrial Direct Co., Inc., Class A | 11,525,479 | |||
| 486,090 | Rush Enterprises, Inc., Class B* | 3,806,085 | |||
| 105,225 | Watsco, Inc. | 3,580,807 | |||
| 18,912,371 | |||||
42
Table of Contents
| MARCH 31, 2009 (UNAUDITED) | ||
| Shares | Value | ||||
| Trucking 2.4% | |||||
| 359,860 | Old Dominion Freight Line, Inc.* | $ | 8,453,111 | ||
| Total Common Stocks (cost $488,757,148) | 325,058,188 | ||||
| PREFERRED STOCKS 0.6% | |||||
| Regional Banks 0.6% | |||||
| 1,062,475 | Banco Daycoval S.A. Pfd. (Brazil) | 2,181,446 | |||
| Total Preferred Stocks (cost $7,702,882) | 2,181,446 | ||||
| LIMITED PARTNERSHIP INTEREST 0.3% | |||||
| Specialized Finance 0.3% | |||||
| 1,246,037 | KKR Financial Holdings, LLC | 1,108,973 | |||
| Total Limited Partnership Interest (cost $14,383,770) | 1,108,973 | ||||
| Principal Amount | Value | ||||
| SHORT-TERM INVESTMENTS 4.1% | |||||
| Repurchase Agreement 4.1% | |||||
| $14,435,000 | Repurchase Agreement dated 3/31/09, 0.10% due 4/1/09 with Fixed Income Clearing Corporation collateralized by $10,100,000 of United States Treasury Bonds 8.125% due 8/15/19; value: $14,727,820; repurchase proceeds: $14,435,040 (cost $14,435,000) | $ | 14,435,000 | ||
| Total Short-Term Investments (cost $14,435,000) | 14,435,000 | ||||
| Total Investments (cost $525,278,800) 98.3%^^ | 342,783,607 | ||||
| Other Assets less Liabilities 1.7% | 5,852,065 | ||||
NET ASSETS 100.0%
| $ | 348,635,672 | |||
*Non-income producing.
**Common units.
***Security was fair valued under procedures adopted by the Board of Directors (see Note 2).
†Security purchased in a private placement transaction or under Rule 144A of the Securities Act of 1933 (see Note 9).
^^The aggregate amount of foreign securities fair valued pursuant to a systematic fair valuation model as a percent of net assets was 6.33%.
REIT Real Estate Investment Trust.
See notes to financial statements.
| |||||
At March 31, 2009, Wasatch Core Growth Fund’s investments, excluding short-term investments, were in the following countries:
| Country | % | ||
Belgium | 0.5 | ||
Brazil | 1.1 | ||
China | 2.7 | ||
Finland | 0.1 | ||
Hong Kong | 1.5 | ||
India | 1.9 | ||
United States | 92.2 | ||
TOTAL | 100.0 | % | |
43
Table of Contents
| WASATCH EMERGING MARKETS SMALL CAP FUND (WAEMX) — Schedule of Investments | ||
| Shares | Value | ||||
| COMMON STOCKS 90.9% | |||||
| Agricultural Products 3.0% | |||||
| 400,939 | Chaoda Modern Agriculture Holdings Ltd. (China) | $ | 238,447 | ||
| 462,320 | China Green Holdings Ltd. (China) | 272,629 | |||
| 511,076 | |||||
| Air Freight & Logistics 1.7% | |||||
| 1,009,777 | Aramex PJSC* (United Arab Emirates) | 293,343 | |||
| Alternative Carriers 0.9% | |||||
| 14,055 | Global Village Telecom Holding S.A.* (Brazil) | 161,491 | |||
| Apparel Retail 1.2% | |||||
| 61,030 | Truworths International Ltd. (South Africa) | 206,645 | |||
| Apparel, Accessories & Luxury Goods 6.8% | |||||
| 764,540 | Anta Sports Products Ltd. (China) | 504,232 | |||
| 813,000 | China Dongxiang Group Co. (China) | 299,289 | |||
| 320,345 | Ports Design Ltd. (Hong Kong) | 369,689 | |||
| 1,173,210 | |||||
| Application Software 3.1% | |||||
| 2,771,780 | Kingdee International Software Group Co. Ltd. (China) | 355,050 | |||
| 8,645 | Longtop Financial Technologies Ltd. ADR* (China) | 183,533 | |||
| 538,583 | |||||
| Brewers 1.7% | |||||
| 45,940 | Anadolu Efes Biracilik ve Malt Sanayii AS (Turkey) | 283,448 | |||
| Coal & Consumable Fuels 1.9% | |||||
| 153,340 | PT Indo Tambangraya Megah (Indonesia) | 131,884 | |||
| 325,300 | Tambang Batubara Bukit Asam Tbk PT (Indonesia) | 190,593 | |||
| 322,477 | |||||
| Construction & Engineering 1.6% | |||||
| 1,008,000 | Midas Holdings Ltd. (China) | 278,158 | |||
| Construction Materials 0.9% | |||||
| 109,100 | Corp Moctezuma S.A.B de C.V. (Mexico) | 146,521 | |||
| Consumer Finance 1.9% | |||||
| 171,305 | Banco Compartamos S.A. de C.V. (Mexico) | 320,875 | |||
| Department Stores 3.1% | |||||
| 475,170 | Golden Eagle Retail Group Ltd. (China) | 312,510 | |||
| 36,295 | Lojas Renner S.A. (Brazil) | 224,505 | |||
| 537,015 | |||||
| Diversified Banks 2.3% | |||||
| 33,355 | Commercial Int’l Bank GDR (Egypt) | 186,788 | |||
| 75,255 | Federal Bank Ltd. (India) | 205,514 | |||
| 392,302 | |||||
| Diversified Metals & Mining 1.9% | |||||
| 10,050 | Hindustan Zinc Ltd. (India) | 89,735 | |||
| 2,106,300 | Philex Mining Corp.* (Philippines) | 243,977 | |||
| 333,712 | |||||
| Drug Retail 1.4% | |||||
| 40,300 | Corporativo Fragua S.A.B., Class B (Mexico) | 239,279 | |||
| Shares | Value | ||||
| Electrical Components & Equipment 3.4% | |||||
| 1,016,460 | Wasion Group Holdings Ltd. (Hong Kong) | $ | 334,623 | ||
| 237,000 | Zhuzhou CSR Times Electric Co. Ltd., Series H (China) | 241,065 | |||
| 575,688 | |||||
| Electronic Equipment & Instruments 1.4% | |||||
| 319,313 | Chroma ATE, Inc. (Taiwan) | 234,064 | |||
| Food Retail 5.2% | |||||
| 14,660 | BIM Birlesik Magazalar AS (Turkey) | 311,058 | |||
| 1,061,975 | CP ALL PCL (Thailand) | 377,032 | |||
| 37,135 | Shoprite Holdings Ltd. (South Africa) | 197,915 | |||
| 886,005 | |||||
| General Merchandise Stores 1.3% | |||||
| 86,055 | Eurocash S.A. (Poland) | 228,393 | |||
| Health Care Equipment 0.2% | |||||
| 653,250 | Mingyuan Medicare Development Co. Ltd. (China) | 39,204 | |||
| Health Care Supplies 2.5% | |||||
| 244,695 | Shandong Weigao Group Medical Polymer Co. Ltd., Class H (China) | 435,568 | |||
| Home Entertainment Software 1.9% | |||||
| 8,010 | Shanda Interactive Entertainment Ltd. ADR* (China) | 316,635 | |||
| Hotels, Resorts & Cruise Lines 1.1% | |||||
| 1,046,200 | Minor International PCL (Thailand) | 190,138 | |||
| Household Products 1.1% | |||||
| 59,400 | Kimberly-Clark de Mexico S.A.B de C.V. (Mexico) | 193,053 | |||
| Industrial Machinery 3.7% | |||||
| 960,000 | China Automation Group Ltd. (China) | 205,962 | |||
| 258,025 | Shanthi Gears Ltd. (India) | 129,918 | |||
| 60,440 | Weg S.A. (Brazil) | 306,431 | |||
| 642,311 | |||||
| Investment Banking & Brokerage 1.2% | |||||
| 37,675 | Egyptian Financial Group-Hermes Holding GDR (Egypt) | 197,794 | |||
| Life & Health Insurance 1.1% | |||||
| 67,000 | Amil Participacoes S.A. (Brazil) | 184,096 | |||
| Managed Health Care 1.2% | |||||
| 20,335 | OdontoPrev S.A. (Brazil) | 203,019 | |||
| Marine Ports & Services 1.8% | |||||
| 634,749 | International Container Terminal Services, Inc. (Philippines) | 157,459 | |||
| 58,390 | Santos Brasil Participacoes S.A.** (Brazil) | 159,678 | |||
| 317,137 | |||||
| Oil & Gas Exploration & Production 5.3% | |||||
| 12,570 | Addax Petroleum Corp. (Canada) | 271,746 | |||
| 114,280 | Dragon Oil plc* (United Arab Emirates) | 306,433 | |||
| 48,055 | Gran Tierra Energy, Inc.* (Colombia) | 120,618 | |||
| 68,180 | JKX Oil and Gas plc (United Kingdom) | 214,949 | |||
| 913,746 | |||||
| Personal Products 2.0% | |||||
| 171,790 | Dabur India Ltd. (India) | 339,509 | |||
44
Table of Contents
| MARCH 31, 2009 (UNAUDITED) | ||
| Shares | Value | ||||
| Pharmaceuticals 2.5% | |||||
| 22,610 | Pharmstandard GDR* (Russia) | $ | 217,048 | ||
| 55,815 | Piramal Healthcare Ltd. (India) | 211,952 | |||
| 429,000 | |||||
| Railroads 1.8% | |||||
| 21,195 | Container Corp. of India (India) | 300,672 | |||
| Regional Banks 0.9% | |||||
| 237,280 | Asya Katilim Bankasi AS* (Turkey) | 157,988 | |||
| Restaurants 2.8% | |||||
| 409,045 | Ajisen China Holdings Ltd. (China) | 203,907 | |||
| 308,500 | Jollibee Foods Corp. (Philippines) | 277,952 | |||
| 481,859 | |||||
| Security & Alarm Services 1.2% | |||||
| 5,860 | S1 Corp. (Korea) | 197,097 | |||
| Soft Drinks 2.0% | |||||
| 71,910 | Coca-Cola Icecek AS (Turkey) | 337,458 | |||
| Specialized Finance 6.3% | |||||
| 105,605 | BM&F BOVESPA S.A. (Brazil) | 322,259 | |||
| 588,000 | Bolsa Mexicana de Valores S.A., Series A* (Mexico) | 324,184 | |||
| 2,276 | Crisil Ltd. (India) | 120,471 | |||
| 66,810 | JSE Ltd. (South Africa) | 313,454 | |||
| 1,080,368 | |||||
| Specialty Chemicals 1.0% | |||||
| 108,390 | China Steel Chemical Corp. (Taiwan) | 176,908 | |||
| Steel 1.8% | |||||
| 159,310 | Sesa Goa Ltd. (India) | 316,477 | |||
| Trading Companies & Distributors 0.9% | |||||
| 3,166,615 | AKR Corporindo Tbk PT (Indonesia) | 148,548 | |||
| Wireless Telecommunication Services 1.9% | |||||
| 12,780 | Egyptian Co. for Mobile Services (Egypt) | 332,958 | |||
| Total Common Stocks (cost $24,814,781) | 15,593,828 | ||||
| PREFERRED STOCKS 4.9% | |||||
| Diversified Banks 2.1% | |||||
| 117,200 | Banco do Estado do Rio Grande do Sul S.A., Series B Pfd (Brazil) | 355,606 | |||
| Fertilizers & Agricultural Chemicals 1.6% | |||||
| 45,050 | Fertilizantes Fosfatados S.A. Pfd. (Brazil) | 265,949 | |||
| Regional Banks 1.2% | |||||
| 101,345 | Banco Daycoval S.A. Pfd. (Brazil) | 208,079 | |||
| Total Preferred Stocks (cost $1,444,649) | 829,634 | ||||
| Principal Amount | Value | ||||
| SHORT-TERM INVESTMENTS 3.2% | |||||
| Repurchase Agreement 3.2% | |||||
| $550,000 | Repurchase Agreement dated 3/31/09, 0.10% due 4/1/09 with Fixed Income Clearing Corporation collateralized by $385,000 of United States Treasury Bonds 8.125% due 8/15/19; value: $561,407; repurchase proceeds: $550,002 (cost $550,000) | $ | 550,000 | ||
| Total Short-Term Investments (cost $550,000) | 550,000 | ||||
| Total Investments (cost $26,809,430) 99.0%^^ | 16,973,462 | ||||
| Other Assets less Liabilities 1.0% | 174,692 | ||||
| NET ASSETS 100.0% | $ | 17,148,154 | |||
*Non-income producing.
**Common units.
^^The aggregate amount of foreign securities fair valued pursuant to a systematic fair valuation model as a percent of net assets was 63.94%.
ADR American Depositary Receipt.
GDR Global Depositary Receipt.
See notes to financial statements. | |||||
At March 31, 2009, Wasatch Emerging Markets Small Cap Fund’s investments, excluding short-term investments, were in the following countries:
| Country | % | ||
Brazil | 14.5 | ||
Canada | 1.6 | ||
China | 23.7 | ||
Colombia | 0.7 | ||
Egypt | 4.4 | ||
Hong Kong | 4.3 | ||
India | 10.4 | ||
Indonesia | 2.9 | ||
Korea | 1.2 | ||
Mexico | 7.5 | ||
Philippines | 4.1 | ||
Poland | 1.4 | ||
Russia | 1.3 | ||
South Africa | 4.4 | ||
Taiwan | 2.5 | ||
Thailand | 3.5 | ||
Turkey | 6.6 | ||
United Arab Emirates | 3.7 | ||
United Kingdom | 1.3 | ||
TOTAL | 100.0 | % | |
45
Table of Contents
| WASATCH GLOBAL OPPORTUNITIES FUND (WAGOX) — Schedule of Investments | ||
| Shares | Value | ||||
| COMMON STOCKS 88.2% | |||||
| Agricultural Products 1.0% | |||||
| 358,920 | Chaoda Modern Agriculture Holdings Ltd. (China) | $ | 213,458 | ||
| 247,000 | China Green Holdings Ltd. (China) | 145,655 | |||
| 359,113 | |||||
| Air Freight & Logistics 0.8% | |||||
| 730,000 | Aramex PJSC* (United Arab Emirates) | 212,067 | |||
| 2,200 | Forward Air Corp. | 35,706 | |||
| 83,000 | Goodpack Ltd. (Singapore) | 36,059 | |||
| 283,832 | |||||
| Apparel Retail 0.9% | |||||
| 26,300 | Esprit Holdings Ltd. (Hong Kong) | 134,195 | |||
| 2,500 | Jos. A. Bank Clothiers, Inc.* | 69,525 | |||
| 18,700 | KappAhl Holding AB (Sweden) | 66,755 | |||
| 5,000 | Zumiez, Inc.* | 48,500 | |||
| 318,975 | |||||
| Apparel, Accessories & Luxury Goods 5.1% | |||||
| 463,000 | Anta Sports Products Ltd. (China) | 305,359 | |||
| 1,700 | Bijou Brigitte AG (Germany) | 182,914 | |||
| 795,000 | China Dongxiang Group Co. (China) | 292,663 | |||
| 5,400 | Fossil, Inc.* | 84,780 | |||
| 10,200 | Gerry Weber International AG (Germany) | 208,181 | |||
| 302,000 | Ports Design Ltd. (Hong Kong) | 348,519 | |||
| 78,000 | Ted Baker plc (United Kingdom) | 383,749 | |||
| 6,400 | Volcom, Inc.* | 62,080 | |||
| 1,868,245 | |||||
| Application Software 1.8% | |||||
| 2,500 | Aveva Group plc (United Kingdom) | 20,148 | |||
| 4,000 | Computer Modelling Group Ltd. (Canada) | 29,300 | |||
| 2,400 | FactSet Research Systems, Inc. | 119,976 | |||
| 1,566,000 | Kingdee International Software Group Co. Ltd. (China) | 200,596 | |||
| 6,204 | Longtop Financial Technologies Ltd. ADR* (China) | 131,711 | |||
| 1,400 | SimCorp A/S (Denmark) | 149,848 | |||
| 651,579 | |||||
| Asset Management & Custody Banks 3.2% | |||||
| 1,000 | Bank of New York Mellon Corp. | 28,250 | |||
| 1,000 | Diamond Hill Investment Group, Inc.* | 39,320 | |||
| 6,700 | Eaton Vance Corp. | 153,095 | |||
| 23,300 | SEI Investments Co. | 284,493 | |||
| 8,692 | T. Rowe Price Group, Inc. | 250,851 | |||
| 32,109 | Treasury Group Ltd. (Australia) | 99,491 | |||
| 7,945 | Waddell & Reed Financial, Inc., Class A | 143,566 | |||
| 4,500 | Westwood Holdings Group, Inc. | 175,905 | |||
| 1,174,971 | |||||
| Auto Parts & Equipment 0.2% | |||||
| 1,235,000 | Norstar Founders Group Ltd.*** (Hong Kong) | 58,161 | |||
| Automotive Retail 0.8% | |||||
| 8,500 | O’Reilly Automotive, Inc.* | 297,585 | |||
| Biotechnology 0.4% | |||||
| 13,215 | Orexigen Therapeutics, Inc.* | 34,491 | |||
| 715,486 | Sino Biopharmaceutical Ltd. (China) | 109,873 | |||
| 144,364 | |||||
| Shares | Value | ||||
| Commodity Chemicals 0.4% | |||||
| 6,000 | TechnoSemiChem Co. Ltd. (Korea) | $ | 61,460 | ||
| 15,200 | Tokai Carbon Korea Co. Ltd. (Korea) | 81,256 | |||
| 142,716 | |||||
| Communications Equipment 0.9% | |||||
| 3,000 | Neutral Tandem, Inc.* | 73,830 | |||
| 14,500 | Riverbed Technology, Inc.* | 189,660 | |||
| 5,000 | Tandberg ASA (Norway) | 73,301 | |||
| 336,791 | |||||
| Computer Storage & Peripherals 0.9% | |||||
| 38,000 | Intevac, Inc.* | 197,980 | |||
| 130 | Wacom Co. Ltd. (Japan) | 139,501 | |||
| 337,481 | |||||
| Construction & Engineering 0.6% | |||||
| 37,000 | Lycopodium Ltd. (Australia) | 33,420 | |||
| 386,000 | Midas Holdings Ltd. (China) | 106,517 | |||
| 295,000 | Rotary Engineering Ltd. (Singapore) | 61,085 | |||
| 65,000 | Swick Mining Services Ltd.* (Australia) | 12,973 | |||
| 213,995 | |||||
| Construction & Farm Machinery & Heavy Trucks 0.3% | |||||
| 1,600 | Faiveley S.A. (France) | 116,773 | |||
| Consumer Electronics 0.1% | |||||
| 6,500 | Thinkware Systems Corp.* (Korea) | 50,509 | |||
| Consumer Finance 0.9% | |||||
| 66,000 | Banco Compartamos S.A. de C.V. (Mexico) | 123,626 | |||
| 14,016 | Dollar Financial Corp.* | 133,432 | |||
| 24,700 | United PanAm Financial Corp.* | 35,815 | |||
| 2,900 | World Acceptance Corp.* | 49,590 | |||
| 342,463 | |||||
| Data Processing & Outsourced Services 2.8% | |||||
| 4,300 | NeuStar, Inc., Class A* | 72,025 | |||
| 25,000 | Redecard S.A. (Brazil) | 304,395 | |||
| 3,050 | Syntel, Inc. | 62,769 | |||
| 90,500 | Wirecard AG* (Germany) | 598,017 | |||
| 1,037,206 | |||||
| Department Stores 0.2% | |||||
| 12,400 | Lojas Renner S.A. (Brazil) | 76,701 | |||
| Distributors 0.6% | |||||
| 16,200 | LKQ Corp.* | 231,174 | |||
| Diversified Banks 1.3% | |||||
| 10,000 | Axis Bank Ltd. (India) | 81,817 | |||
| 1,530 | HDFC Bank Ltd. ADR (India) | 93,223 | |||
| 8,200 | ICICI Bank Ltd. ADR (India) | 108,978 | |||
| 64,700 | Union Bank of India Ltd. (India) | 185,896 | |||
| 1,000 | Wells Fargo & Co. | 14,240 | |||
| 484,154 | |||||
| Diversified Support Services 1.3% | |||||
| 10,100 | Copart, Inc.* | 299,566 | |||
| 20,500 | LPS Brasil — Consultoria de Imoveis S.A. (Brazil) | 51,167 | |||
| 90 | Prestige International, Inc. (Japan) | 109,712 | |||
| 460,445 | |||||
| Drug Retail 0.6% | |||||
| 14,895 | Create SD Holdings Co. Ltd.* (Japan) | 230,300 | |||
| Education Services 0.3% | |||||
| 12,900 | Kroton Educational S.A.* ** (Brazil) | 52,076 | |||
| 500 | MegaStudy Co. Ltd. (Korea) | 72,746 | |||
| 124,822 | |||||
46
Table of Contents
| MARCH 31, 2009 (UNAUDITED) | ||
| Shares | Value | ||||
| Electrical Components & Equipment 1.0% | |||||
| 4,000 | Emerson Electric Co. | $ | 114,320 | ||
| 265,000 | Wasion Group Holdings Ltd. (Hong Kong) | 87,240 | |||
| 147,000 | Zhuzhou CSR Times Electric Co. Ltd., Series H (China) | 149,521 | |||
| 351,081 | |||||
| Electronic Components 0.7% | |||||
| 8,684 | Amphenol Corp., Class A | 247,407 | |||
| Electronic Equipment & Instruments 0.8% | |||||
| 660 | KEYENCE Corp. (Japan) | 124,901 | |||
| 10,700 | Rotork plc (United Kingdom) | 130,471 | |||
| 7,200 | Viscom AG (Germany) | 23,355 | |||
| 278,727 | |||||
| Electronic Manufacturing Services 0.9% | |||||
| 413,000 | Ju Teng International Holdings Ltd.* (China) | 127,036 | |||
| 12,500 | TTM Technologies, Inc.* | 72,500 | |||
| 41,500 | Venture Corp. Ltd. (Singapore) | 137,525 | |||
| 337,061 | |||||
| Environmental & Facilities Services 0.3% | |||||
| 6,500 | Daiseki Co. Ltd. (Japan) | 111,263 | |||
| Food Retail 0.6% | |||||
| 865,000 | BreadTalk Group Ltd. (Singapore) | 165,837 | |||
| 1,600 | Ozeki Co. Ltd. (Japan) | 38,110 | |||
| 203,947 | |||||
| Footwear 0.4% | |||||
| 2,465,000 | China Hongxing Sports Ltd. (China) | 153,691 | |||
| General Merchandise Stores 0.3% | |||||
| 2,300 | Dollar Tree, Inc.* | 102,465 | |||
| Health Care Distributors 0.7% | |||||
| 9,300 | MWI Veterinary Supply, Inc.* | 264,864 | |||
| Health Care Equipment 6.7% | |||||
| 14,200 | Abaxis, Inc.* | 244,808 | |||
| 24,300 | Cardica, Inc.* | 70,713 | |||
| 5,600 | Cyberonics, Inc.* | 74,312 | |||
| 10,900 | DiaSorin S.p.A (Italy) | 243,449 | |||
| 4,400 | IDEXX Laboratories, Inc.* | 152,152 | |||
| 3,700 | Infopia Co. Ltd. (Korea) | 78,832 | |||
| 1,200 | Intuitive Surgical, Inc.* | 114,432 | |||
| 4,407,000 | LMA International N.V.* (Singapore) | 377,589 | |||
| 2,600 | Nakanishi, Inc. (Japan) | 147,984 | |||
| 3,200 | St. Jude Medical, Inc.* | 116,256 | |||
| 40,300 | VNUS Medical Technologies, Inc.* | 857,181 | |||
| 2,477,708 | |||||
| Health Care Facilities 2.7% | |||||
| 26,561 | AmSurg Corp.* | 420,992 | |||
| 43,250 | NovaMed, Inc.* | 98,178 | |||
| 479,000 | Raffles Medical Group Ltd. (Singapore) | 240,775 | |||
| 9,700 | VCA Antech, Inc.* | 218,735 | |||
| 978,680 | |||||
| Health Care Services 1.4% | |||||
| 5,600 | Bio-Reference Laboratories, Inc.* | 117,096 | |||
| 5,600 | CorVel Corp.* | 113,232 | |||
| 17,200 | Healthways, Inc.* | 150,844 | |||
| 3,500 | LHC Group, Inc.* | 77,980 | |||
| 2,500 | MEDNAX, Inc.* | 73,675 | |||
| 532,827 | |||||
| Shares | Value | ||||
| Health Care Supplies 2.5% | |||||
| 63,485 | Abcam plc (United Kingdom) | $ | 551,609 | ||
| 3,800 | ICU Medical, Inc.* | 122,056 | |||
| 86,000 | Shandong Weigao Group Medical Polymer Co. Ltd., Class H (China) | 153,084 | |||
| 7,500 | Standard Diagnostics, Inc. (Korea) | 97,629 | |||
| 924,378 | |||||
| Health Care Technology 0.1% | |||||
| 20,000 | RaySearch Laboratories AB (Sweden) | 39,089 | |||
| Home Entertainment Software 0.9% | |||||
| 50 | GameOn Co. Ltd. (Japan) | 47,248 | |||
| 12,300 | HUDSON SOFT Co. Ltd. (Japan) | 76,210 | |||
| 250,000 | Kingsoft Corp. Ltd. (China) | 103,883 | |||
| 2,600 | Shanda Interactive Entertainment Ltd. ADR* (China) | 102,778 | |||
| 330,119 | |||||
| Home Improvement Retail 0.6% | |||||
| 8,400 | Lumber Liquidators, Inc.* | 107,100 | |||
| 67,100 | Swedol AB, Class B (Sweden) | 129,929 | |||
| 237,029 | |||||
| Human Resource & Employment Services 1.1% | |||||
| 60 | Benefit One, Inc. (Japan) | 37,322 | |||
| 50,500 | Michael Page International plc (United Kingdom) | 132,692 | |||
| 13,300 | Robert Half International, Inc. | 237,139 | |||
| 407,153 | |||||
| Industrial Machinery 2.2% | |||||
| 1,300 | Burckhardt Compression Holding AG (Switzerland) | 120,712 | |||
| 646,000 | China Automation Group Ltd. (China) | 138,595 | |||
| 1,100 | Danaher Corp. | 59,642 | |||
| 5,200 | Graco, Inc. | 88,764 | |||
| 2,500 | Illinois Tool Works, Inc. | 77,125 | |||
| 2,100 | Konecranes Oyj (Finland) | 35,031 | |||
| 6,900 | Technotrans AG (Germany) | 28,752 | |||
| 22,600 | Weg S.A. (Brazil) | 114,582 | |||
| 10,900 | Yushin Precision Equipment Co. Ltd. (Japan) | 128,288 | |||
| 791,491 | |||||
| Insurance Brokers 0.4% | |||||
| 7,500 | Brown & Brown, Inc. | 141,825 | |||
| Internet Retail 0.6% | |||||
| 240 | START TODAY Co. Ltd. (Japan) | 209,289 | |||
| Internet Software & Services 1.3% | |||||
| 2,000 | Gmarket, Inc. ADR* (Korea) | 32,820 | |||
| 85 | Macromill, Inc. (Japan) | 79,005 | |||
| 5,800 | NetEase.com, Inc. ADR* (China) | 155,730 | |||
| 7,215 | VistaPrint Ltd.* | 198,340 | |||
| 465,895 | |||||
| Investment Banking & Brokerage 0.4% | |||||
| 4,100 | Charles Schwab Corp. (The) | 63,550 | |||
| 30 | GCA Savvian Group Corp. (Japan) | 36,119 | |||
| 5,300 | optionsXpress Holdings, Inc. | 60,261 | |||
| 159,930 | |||||
| IT Consulting & Other Services 1.6% | |||||
| 8,700 | Cognizant Technology Solutions Corp., Class A* | 180,873 | |||
| 170,000 | CSE Global Ltd. (Singapore) | 38,004 | |||
| 250 | Future Architect, Inc. (Japan) | 88,533 | |||
| 8,200 | Infosys Technologies Ltd. ADR (India) | 218,366 | |||
| 6,970 | Yuchen Technologies Ltd.* (China) | 44,399 | |||
| 570,175 | |||||
47
Table of Contents
| WASATCH GLOBAL OPPORTUNITIES FUND (WAGOX) — Schedule of Investments (continued) |
| Shares | Value | ||||
| Leisure Facilities 0.1% | |||||
| 1,800 | Life Time Fitness, Inc.* | $ | 22,608 | ||
| Leisure Products 0.6% | |||||
| 23,000 | Li Ning Co. Ltd. (Hong Kong) | 38,044 | |||
| 6,700 | Pool Corp. | 89,780 | |||
| 2,500 | Shimano, Inc. (Japan) | 76,135 | |||
| 203,959 | |||||
| Life Sciences Tools & Services 3.0% | |||||
| 570 | CMIC Co. Ltd. (Japan) | 139,506 | |||
| 2,200 | Covance, Inc.* | 78,386 | |||
| 35 | EPS Co. Ltd. (Japan) | 133,471 | |||
| 10,000 | ICON plc ADR* (Ireland) | 161,500 | |||
| 26,000 | Life Sciences Research, Inc.* | 186,420 | |||
| 2,100 | MorphoSys AG* (Germany) | 35,555 | |||
| 7,500 | Pharmaceutical Product Development, Inc. | 177,900 | |||
| 1,900 | Techne Corp. | 103,949 | |||
| 2,800 | Waters Corp.* | 103,460 | |||
| 1,120,147 | |||||
| Managed Health Care 0.4% | |||||
| 2,800 | AMERIGROUP Corp.* | 77,112 | |||
| 8,300 | OdontoPrev S.A. (Brazil) | 82,865 | |||
| 159,977 | |||||
| Mortgage REITs 0.4% | |||||
| 5,000 | Annaly Capital Management, Inc. | 69,350 | |||
| 5,800 | Redwood Trust, Inc. | 89,030 | |||
| 158,380 | |||||
| Movies & Entertainment 0.2% | |||||
| 5,700 | CJ Internet Corp. (Korea) | 67,495 | |||
| Multi-Line Insurance 0.1% | |||||
| 1,200 | HCC Insurance Holdings, Inc. | 30,228 | |||
| Oil & Gas Drilling 0.6% | |||||
| 6,000 | Cathedral Energy Services Income Trust** (Canada) | 17,580 | |||
| 93,000 | China Oilfield Services Ltd., Series H (China) | 73,226 | |||
| 2,900 | Ensign Energy Services, Inc. (Canada) | 25,077 | |||
| 19,900 | Phoenix Technology Income Fund** (Canada) | 107,159 | |||
| 223,042 | |||||
| Oil & Gas Equipment & Services 1.2% | |||||
| 181,000 | Anhui Tianda Oil Pipe Co. Ltd., Class H (China) | 38,691 | |||
| 700,000 | Anton Oilfield Services Group* (China) | 54,243 | |||
| 400 | Core Laboratories N.V. | 29,264 | |||
| 47,000 | Ezra Holdings Ltd. (Singapore) | 20,862 | |||
| 8,800 | Forbes Energy Services Ltd.* (Canada) | 3,693 | |||
| 13,500 | Gulf Island Fabrication, Inc. | 108,135 | |||
| 47,800 | Lamprell plc (United Arab Emirates) | 45,126 | |||
| 11,400 | Pason Systems, Inc. (Canada) | 85,942 | |||
| 6,000 | TGS-NOPEC Geophysical Co. ASA* (Norway) | 46,517 | |||
| 2,000 | Wellstream Holdings plc (United Kingdom) | 12,354 | |||
| 444,827 | |||||
| Shares | Value | ||||
| Oil & Gas Exploration & Production 1.4% | |||||
| 2,100 | Addax Petroleum Corp. (Canada) | $ | 45,399 | ||
| 700 | Canadian Oil Sands Trust** (Canada) | 13,442 | |||
| 36,000 | CNOOC Ltd. (China) | 36,317 | |||
| 36,000 | Dragon Oil plc* (United Arab Emirates) | 99,549 | |||
| 19,600 | Gran Tierra Energy, Inc.* (Colombia) | 49,196 | |||
| 21,000 | JKX Oil and Gas plc (United Kingdom) | 66,206 | |||
| 1,000 | Petrobank Energy and Resources Ltd.* (Canada) | 18,570 | |||
| 3,000 | Petrohawk Energy Corp.* | 57,690 | |||
| 6,500 | Petrominerales Ltd.* (Colombia) | 57,238 | |||
| 3,800 | Premier Oil plc* (United Kingdom) | 57,803 | |||
| 501,410 | |||||
| Other Diversified Financial Services 0.2% | |||||
| 104,000 | Count Financial Ltd. (Australia) | 74,760 | |||
| Packaged Foods & Meats 0.3% | |||||
| 11,800 | Zhongpin, Inc.* | 104,784 | |||
| Personal Products 0.1% | |||||
| 706,000 | Beauty China Holdings Ltd.* *** (China) | 31,308 | |||
| Pharmaceuticals 1.1% | |||||
| 148,000 | China Shineway Pharmaceutical Group Ltd. (China) | 83,952 | |||
| 37,300 | Dechra Pharmaceuticals plc (United Kingdom) | 222,638 | |||
| 10,600 | Whanin Pharmaceutical Co. Ltd. (Korea) | 104,709 | |||
| 411,299 | |||||
| Publishing 0.1% | |||||
| 1,600 | Morningstar, Inc.* | 54,640 | |||
| Real Estate Services 0.0% | |||||
| 65 | Funai Zaisan Consultants Co. Ltd. (Japan) | 16,433 | |||
| Regional Banks 0.9% | |||||
| 34,800 | Boston Private Financial Holdings, Inc. | 122,148 | |||
| 8,500 | Canadian Western Bank (Canada) | 70,003 | |||
| 2,600 | City National Corp. | 87,802 | |||
| 2,800 | First of Long Island Corp. | 56,532 | |||
| 336,485 | |||||
| Research & Consulting Services 2.5% | |||||
| 4,366 | Campbell Brothers Ltd. (Australia) | 41,492 | |||
| 12,900 | CRA International, Inc.* | 243,552 | |||
| 45 | Nihon M&A Center, Inc. (Japan) | 101,273 | |||
| 26,700 | Resources Connection, Inc.* | 402,636 | |||
| 6,300 | Stantec, Inc.* (Canada) | 113,747 | |||
| 902,700 | |||||
| Restaurants 0.8% | |||||
| 313,000 | Ajisen China Holdings Ltd. (China) | 156,029 | |||
| 9,200 | Chimney Co. Ltd. (Japan) | 131,119 | |||
| 700 | Saint Marc Holdings Co. Ltd. (Japan) | 17,647 | |||
| 304,795 | |||||
| Semiconductor Equipment 0.7% | |||||
| 2,800 | Cabot Microelectronics Corp.* | 67,284 | |||
| 2,800 | Disco Corp. (Japan) | 69,918 | |||
| 151,000 | inTEST Corp.* | 33,220 | |||
| 2,400 | KLA-Tencor Corp. | 48,000 | |||
| 3,500 | Tessera Technologies, Inc.* | 46,795 | |||
| 265,217 | |||||
48
Table of Contents
| MARCH 31, 2009 (UNAUDITED) | ||
| Shares | Value | ||||
| Semiconductors 6.6% | |||||
| 20,300 | Advanced Analogic Technologies, Inc.* | $ | 73,080 | ||
| 11,000 | CSR plc* (United Kingdom) | 38,495 | |||
| 16,000 | ELMOS Semiconductor AG* (Germany) | 37,954 | |||
| 4,900 | Hittite Microwave Corp.* | 152,880 | |||
| 4,500 | Linear Technology Corp. | 103,410 | |||
| 6,200 | Maxim Integrated Products, Inc. | 81,902 | |||
| 62,200 | Melexis N.V. (Belgium) | 288,975 | |||
| 15,700 | Micrel, Inc. | 110,528 | |||
| 12,600 | Microchip Technology, Inc. | 266,994 | |||
| 3,200 | Netlogic Microsystems, Inc.* | 87,936 | |||
| 94,000 | O2Micro International Ltd. ADR* (Hong Kong) | 321,480 | |||
| 31,000 | Pericom Semiconductor Corp.* | 226,610 | |||
| 96,700 | PLX Technology, Inc.* | 209,839 | |||
| 6,300 | Power Integrations, Inc. | 108,360 | |||
| 7,000 | Semtech Corp.* | 93,450 | |||
| 5,700 | Silicon Laboratories, Inc.* | 150,480 | |||
| 3,800 | Supertex, Inc.* | 87,780 | |||
| 2,440,153 | |||||
| Specialized Consumer Services 0.2% | |||||
| 30 | Best Bridal, Inc. (Japan) | 59,819 | |||
| Specialized Finance 3.0% | |||||
| 48,500 | BM&F BOVESPA S.A. (Brazil) | 148,000 | |||
| 162,000 | Bolsa Mexicana de Valores S.A., Series A* (Mexico) | 89,316 | |||
| 12,100 | Hong Kong Exchanges & Clearing Ltd. (Hong Kong) | 113,962 | |||
| 6,100 | IMAREX ASA* (Norway) | 38,913 | |||
| 900 | IntercontinentalExchange, Inc.* | 67,023 | |||
| 13,000 | MSCI, Inc., Class A* | 219,830 | |||
| 2,800 | NASDAQ OMX Group, Inc. (The)* | 54,824 | |||
| 2,700 | NYSE Euronext | 48,330 | |||
| 35 | Osaka Securities Exchange Co. Ltd. (Japan) | 112,749 | |||
| 4,043 | Oslo Bors VPS Holding ASA (Norway) | 36,002 | |||
| 3,900 | Portfolio Recovery Associates, Inc.* | 104,676 | |||
| 22,800 | Singapore Exchange Ltd. (Singapore) | 76,550 | |||
| 1,110,175 | |||||
| Specialty Chemicals 1.8% | |||||
| 10,600 | C. Uyemura & Co. Ltd. (Japan) | 185,246 | |||
| 685,000 | EcoGreen Fine Chemical Group Ltd. (China) | 109,609 | |||
| 80 | Japan Pure Chemical Co. Ltd. (Japan) | 161,680 | |||
| 54,600 | MEC Co. Ltd. (Japan) | 201,933 | |||
| 658,468 | |||||
| Specialty Stores 1.6% | |||||
| 44,000 | Big 5 Sporting Goods Corp. | 258,280 | |||
| 19,640 | easyhome Ltd. (Canada) | 143,863 | |||
| 8,900 | Hibbett Sports, Inc.* | 171,058 | |||
| 573,201 | |||||
| Systems Software 1.6% | |||||
| 7,100 | Commvault Systems, Inc.* | 77,887 | |||
| 25,700 | Opnet Technologies, Inc.* | 222,819 | |||
| 340 | Simplex Technology, Inc. (Japan) | 111,505 | |||
| 6,615 | Trend Micro, Inc. (Japan) | 189,025 | |||
| 601,236 | |||||
| Technology Distributors 0.5% | |||||
| 129,500 | Wolfson Microelectronics plc* (United Kingdom) | 195,607 | |||
| Textiles 0.1% | |||||
| 375,000 | Li Heng Chemical Fibre Technologies Ltd. (China) | 38,244 | |||
| Shares | Value | ||||
| Thrifts & Mortgage Finance 1.0% | |||||
| 7,800 | Home Capital Group, Inc. (Canada) | $ | 154,357 | ||
| 5,700 | Housing Development Finance Corp. Ltd. (India) | 158,475 | |||
| 2,800 | Washington Federal, Inc. | 37,212 | |||
| 350,044 | |||||
| Trading Companies & Distributors 2.3% | |||||
| 5,400 | Fastenal Co. | 173,637 | |||
| 35,480 | Houston Wire & Cable Co. | 274,970 | |||
| 16,500 | MISUMI Group, Inc. (Japan) | 201,011 | |||
| 3,500 | MSC Industrial Direct Co., Inc., Class A | 108,745 | |||
| 1,400 | W.W. Grainger, Inc. | 98,252 | |||
| 856,615 | |||||
| Trucking 1.0% | |||||
| 1,700 | J.B. Hunt Transport Services, Inc. | 40,987 | |||
| 7,200 | Knight Transportation, Inc. | 109,152 | |||
| 800 | Landstar System, Inc. | 26,776 | |||
| 4,800 | Old Dominion Freight Line, Inc.* | 112,752 | |||
| 4,600 | Universal Truckload Services, Inc. | 65,964 | |||
| 355,631 | |||||
| Wireless Telecommunication Services 0.2% | |||||
| 5,900 | NII Holdings, Inc.* | 88,500 | |||
| Total Common Stocks (cost $30,013,092) | 32,420,636 | ||||
| PREFERRED STOCKS 0.4% | |||||
| Regional Banks 0.4% | |||||
| 67,500 | Banco Daycoval S.A. Pfd. (Brazil) | 138,589 | |||
| Total Preferred Stocks (cost $117,507) | 138,589 | ||||
| Principal Amount | Value | ||||
| SHORT-TERM INVESTMENTS 11.0% | |||||
| Repurchase Agreement 11.0% | |||||
| $4,060,000 | Repurchase Agreement dated 3/31/09, 0.10% due 4/1/09 with Fixed Income Clearing Corporation collateralized by $2,840,000 of United States Treasury Bonds 8.125% due 8/15/19; value: $4,141,288; repurchase proceeds: $4,060,011 (cost $4,060,000) | $ | 4,060,000 | ||
| Total Short-Term Investments (cost $4,060,000) | 4,060,000 | ||||
| Total Investments (cost $34,190,599) 99.6% | 36,619,225 | ||||
| Other Assets less Liabilities 0.4% | 143,085 | ||||
| NET ASSETS 100.0% | $ | 36,762,310 | |||
*Non-income producing.
**Common units.
***Security was fair valued under procedures adopted by the Board of Directors (see Note 2).
ADR American Depositary Receipt.
REIT Real Estate Investment Trust.
See notes to financial statements. | |||||
49
Table of Contents
| WASATCH GLOBAL OPPORTUNITIES FUND (WAGOX) — Schedule of Investments (continued) | ||
At March 31, 2009, Wasatch Global Opportunities Fund’s investments, excluding short-term investments, were in the following countries:
| Country | % | ||
Australia | 0.8 | ||
Belgium | 0.9 | ||
Brazil | 3.0 | ||
Canada | 2.5 | ||
China | 10.0 | ||
Colombia | 0.3 | ||
Denmark | 0.5 | ||
Finland | 0.1 | ||
France | 0.4 | ||
Germany | 3.4 | ||
Hong Kong | 3.4 | ||
India | 2.6 | ||
Ireland | 0.5 | ||
Italy | 0.7 | ||
Japan | 10.8 | ||
Korea | 2.0 | ||
Mexico | 0.7 | ||
Norway | 0.6 | ||
Singapore | 3.5 | ||
Sweden | 0.7 | ||
Switzerland | 0.4 | ||
United Arab Emirates | 1.1 | ||
United Kingdom | 5.6 | ||
United States | 45.5 | ||
TOTAL | 100.0 | % | |
50
Table of Contents
| WASATCH GLOBAL SCIENCE & TECHNOLOGY FUND (WAGTX) — Schedule of Investments | ||
| Shares | Value | ||||
| COMMON STOCKS 90.6% | |||||
| Air Freight & Logistics 1.7% | |||||
| 1,697,000 | Goodpack Ltd. (Singapore) | $ | 737,248 | ||
| Alternative Carriers 1.0% | |||||
| 39,600 | Global Village Telecom Holding S.A.* (Brazil) | 455,002 | |||
| Application Software 5.8% | |||||
| 21,470 | Adobe Systems, Inc.* ††† | 459,243 | |||
| 10,545 | FactSet Research Systems, Inc. | 527,145 | |||
| 46,050 | Interactive Intelligence, Inc.* | 417,213 | |||
| 3,443,510 | Kingdee International Software Group Co. Ltd. (China) | 441,095 | |||
| 21,200 | Longtop Financial Technologies Ltd. ADR* (China) | 450,076 | |||
| 2,000 | SimCorp A/S (Denmark) | 214,068 | |||
| 2,508,840 | |||||
| Biotechnology 1.0% | |||||
| 2,858,514 | Sino Biopharmaceutical Ltd. (China) | 438,964 | |||
| Communications Equipment 4.3% | |||||
| 28,405 | Cisco Systems, Inc.* | 476,352 | |||
| 38,795 | F5 Networks, Inc.* | 812,755 | |||
| 39,540 | Tandberg ASA (Norway) | 579,662 | |||
| 1,868,769 | |||||
| Computer Storage & Peripherals 0.9% | |||||
| 75,405 | Intevac, Inc.* | 392,860 | |||
| Construction & Engineering 1.0% | |||||
| 26,305 | Outotec Oyj (Finland) | 450,361 | |||
| Data Processing & Outsourced Services 4.9% | |||||
| 10,770 | Alliance Data Systems Corp.* | 397,951 | |||
| 69,500 | Redecard S.A. (Brazil) | 846,218 | |||
| 131,350 | Wirecard AG* (Germany) | 867,951 | |||
| 2,112,120 | |||||
| Electrical Components & Equipment 1.8% | |||||
| 2,403,000 | Wasion Group Holdings Ltd. (Hong Kong) | 791,079 | |||
| Electronic Equipment & Instruments 1.0% | |||||
| 33,900 | Rotork plc (United Kingdom) | 413,362 | |||
| Electronic Manufacturing Services 1.0% | |||||
| 72,755 | TTM Technologies, Inc.* | 421,979 | |||
| Health Care Equipment 8.7% | |||||
| 36,600 | Abaxis, Inc.* | 630,984 | |||
| 130,414 | Cardica, Inc.* | 379,505 | |||
| 26,605 | DiaSorin S.p.A (Italy) | 594,217 | |||
| 27,875 | Invacare Corp. | 446,836 | |||
| 4,235,440 | LMA International N.V.* (Singapore) | 362,890 | |||
| 2,646,805 | Mingyuan Medicare Development Co. Ltd. (China) | 158,845 | |||
| 11,625 | NuVasive, Inc.* | 364,793 | |||
| 38,960 | VNUS Medical Technologies, Inc.* | 828,679 | |||
| 3,766,749 | |||||
| Health Care Facilities 1.6% | |||||
| 400,000 | Raffles Medical Group Ltd. (Singapore) | 201,065 | |||
| 21,000 | VCA Antech, Inc.* | 473,550 | |||
| 674,615 | |||||
| Shares | Value | ||||
| Health Care Services 5.0% | |||||
| 32,600 | Bio-Reference Laboratories, Inc.* | $ | 681,666 | ||
| 20,987 | CorVel Corp.* | 424,357 | |||
| 7,800 | Express Scripts, Inc.* | 360,126 | |||
| 23,865 | MEDNAX, Inc.* | 703,302 | |||
| 2,169,451 | |||||
| Health Care Supplies 2.0% | |||||
| 27,665 | Abcam plc (United Kingdom) | 240,376 | |||
| 350,000 | Shandong Weigao Group Medical Polymer Co. Ltd., Class H (China) | 623,016 | |||
| 863,392 | |||||
| Health Care Technology 1.9% | |||||
| 9,900 | Cerner Corp.* | 435,303 | |||
| 196,100 | RaySearch Laboratories AB (Sweden) | 383,269 | |||
| 818,572 | |||||
| Home Entertainment Software 1.1% | |||||
| 12,000 | Shanda Interactive Entertainment Ltd. ADR* (China) | 474,360 | |||
| Industrial Machinery 2.0% | |||||
| 2,052,050 | China Automation Group Ltd. (China) | 440,255 | |||
| 80,000 | Weg S.A. (Brazil) | 405,600 | |||
| 845,855 | |||||
| Internet Software & Services 3.9% | |||||
| 23,000 | Akamai Technologies, Inc.* | 446,200 | |||
| 61,505 | DealerTrack Holdings, Inc.* | 805,715 | |||
| 1,230 | Google, Inc., Class A* | 428,114 | |||
| 1,680,029 | |||||
| IT Consulting & Other Services 6.6% | |||||
| 78,750 | Cognizant Technology Solutions Corp., Class A* | 1,637,213 | |||
| 31,360 | Infosys Technologies Ltd. (India) | 823,464 | |||
| 16,015 | NCI, Inc., Class A* | 416,390 | |||
| 2,877,067 | |||||
| Life Sciences Tools & Services 4.9% | |||||
| 8,190 | Covance, Inc.* | 291,810 | |||
| 91 | EPS Co. Ltd. (Japan) | 347,026 | |||
| 9,800 | Eurofins Scientific (France) | 415,589 | |||
| 18,530 | ICON plc ADR* (Ireland) | 299,260 | |||
| 21,460 | MorphoSys AG* (Germany) | 363,334 | |||
| 7,730 | Techne Corp. | 422,908 | |||
| 2,139,927 | |||||
| Managed Health Care 1.0% | |||||
| 44,495 | OdontoPrev S.A. (Brazil) | 444,226 | |||
| Oil & Gas Equipment & Services 2.0% | |||||
| 55,510 | Pason Systems, Inc. (Canada) | 418,479 | |||
| 59,500 | TGS-NOPEC Geophysical Co. ASA* (Norway) | 461,290 | |||
| 879,769 | |||||
| Pharmaceuticals 2.8% | |||||
| 655,000 | China Shineway Pharmaceutical Group Ltd. (China) | 371,545 | |||
| 69,000 | Dechra Pharmaceuticals plc (United Kingdom) | 411,849 | |||
| 9,750 | Teva Pharmaceutical Industries Ltd. ADR (Israel) | 439,238 | |||
| 1,222,632 | |||||
| Semiconductor Equipment 1.2% | |||||
| 38,703 | Tessera Technologies, Inc.* | 517,459 | |||
51
Table of Contents
| WASATCH GLOBAL SCIENCE & TECHNOLOGY FUND (WAGTX) — Schedule of Investments (continued) | ||
| Shares | Value | ||||
| Semiconductors 17.0% | |||||
| 27,400 | Altera Corp. | $ | 480,870 | ||
| 16,880 | Hittite Microwave Corp.* | 526,656 | |||
| 18,140 | Linear Technology Corp. | 416,857 | |||
| 60,134 | Melexis N.V. (Belgium) | 279,376 | |||
| 57,815 | Micrel, Inc. | 407,018 | |||
| 22,525 | Microchip Technology, Inc. | 477,305 | |||
| 31,081 | Netlogic Microsystems, Inc.* ††† | 854,106 | |||
| 372,879 | O2Micro International Ltd. ADR* (Hong Kong) | 1,275,246 | |||
| 56,750 | Pericom Semiconductor Corp.* | 414,842 | |||
| 45,768 | Power Integrations, Inc. | 787,210 | |||
| 18,505 | Silicon Laboratories, Inc.* | 488,532 | |||
| 105,605 | Taiwan Semiconductor Manufacturing Co. Ltd. ADR (Taiwan) | 945,165 | |||
| 7,353,183 | |||||
| Systems Software 4.5% | |||||
| 15,170 | BMC Software, Inc.* | 500,610 | |||
| 47,000 | NetSuite, Inc.* | 529,220 | |||
| 53,235 | Opnet Technologies, Inc.* | 461,548 | |||
| 25,275 | Oracle Corp.* | 456,719 | |||
| 1,948,097 | |||||
| Total Common Stocks (cost $56,295,346) | 39,265,967 | ||||
| PREFERRED STOCKS 2.2% | |||||
| Computer Storage & Peripherals 2.2% | |||||
| 78,502 | BlueArc Corp., Series DD Pfd.* *** † | 324,998 | |||
| 138,725 | BlueArc Corp., Series FF Pfd.* *** † | 628,067 | |||
| 953,065 | |||||
| Internet Software & Services 0.0% | |||||
| 30,265 | Incipient, Inc., Series D Pfd.* *** † | 302 | |||
| 6,528 | Xtera Communications, Inc., Series A-1 Pfd.* *** † | 6,339 | |||
| 6,641 | |||||
| Total Preferred Stocks (cost $1,099,359) | 959,706 | ||||
| LIMITED PARTNERSHIP INTEREST 0.6% | |||||
| Other 0.6% | |||||
| Montagu Newhall Global Partners II-B, L.P.* *** † | 238,740 | ||||
| Total Limited Partnership Interest (cost $384,387) | 238,740 | ||||
| WARRANTS 0.0% | |||||
| Air Freight & Logistics 0.0% | |||||
| 212,125 | Goodpack Ltd. expiring 7/16/09* (Singapore) | 697 | |||
| Computer Storage & Peripherals 0.0% | |||||
| 1 | BlueArc Corp. expiring 4/2/18* *** † | — | |||
| Total Warrants (cost $0) | 697 | ||||
| Principal Amount | Value | ||||
| SHORT-TERM INVESTMENTS 6.2% | |||||
| Repurchase Agreement 6.2% | |||||
| $2,665,000 | Repurchase Agreement dated 3/31/09, 0.10% due 4/1/09 with Fixed Income Clearing Corporation collateralized by $1,865,000 of United States Treasury Bonds 8.125% due 8/15/19; value: $2,719,543; repurchase proceeds: $2,665,007††† (cost $2,665,000) | $ | 2,665,000 | ||
| Total Short-Term Investments (cost $2,665,000) | 2,665,000 | ||||
| Total Investments (cost $60,444,093) 99.6%^^ | 43,130,110 | ||||
| Other Assets less Liabilities 0.4% | 183,026 | ||||
| NET ASSETS 100.0% | $ | 43,313,136 | |||
*Non-income producing.
***Security was fair valued under procedures adopted by the Board of Directors (see Note 2).
†Security purchased in a private placement transaction or under Rule 144A of the Securities Act of 1933 (see Note 9).
†††All or a portion of this security has been designated as collateral for future commitments (see Note 10).
^^The aggregate amount of foreign securities fair valued pursuant to a systematic fair valuation model as a percent of net assets was 26.35%.
ADR American Depositary Receipt.
See notes to financial statements. | |||||
At March 31, 2009, Wasatch Global Science & Technology Fund’s investments, excluding short-term investments, were in the following countries:
| Country | % | ||
Belgium | 0.7 | ||
Brazil | 5.3 | ||
Canada | 1.0 | ||
China | 8.4 | ||
Denmark | 0.5 | ||
Finland | 1.1 | ||
France | 1.0 | ||
Germany | 3.1 | ||
Hong Kong | 5.1 | ||
India | 2.0 | ||
Ireland | 0.7 | ||
Israel | 1.1 | ||
Italy | 1.5 | ||
Japan | 0.9 | ||
Norway | 2.6 | ||
Singapore | 3.2 | ||
Sweden | 1.0 | ||
Taiwan | 2.3 | ||
United Kingdom | 2.6 | ||
United States | 55.9 | ||
TOTAL | 100.0 | % | |
52
Table of Contents
| WASATCH HERITAGE GROWTH FUND (WAHGX) — Schedule of Investments | MARCH 31, 2009 (UNAUDITED) | |
| Shares | Value | ||||
| COMMON STOCKS 96.9% | |||||
| Aerospace & Defense 3.4% | |||||
| 9,610 | L-3 Communications Holdings, Inc. | $ | 651,558 | ||
| 40,100 | TransDigm Group, Inc.* | 1,316,884 | |||
| 1,968,442 | |||||
| Air Freight & Logistics 3.0% | |||||
| 20,760 | C.H. Robinson Worldwide, Inc. | 946,864 | |||
| 28,990 | Expeditors International of Washington, Inc. | 820,127 | |||
| 1,766,991 | |||||
| Apparel Retail 1.0% | |||||
| 112,575 | Esprit Holdings Ltd. (Hong Kong) | 574,412 | |||
| Asset Management & Custody Banks 2.4% | |||||
| 55,195 | SEI Investments Co. | 673,931 | |||
| 24,635 | T. Rowe Price Group, Inc. | 710,966 | |||
| 1,384,897 | |||||
| Automotive Retail 1.8% | |||||
| 29,843 | O’Reilly Automotive, Inc.* | 1,044,803 | |||
| Communications Equipment 3.2% | |||||
| 67,225 | Cisco Systems, Inc.* | 1,127,363 | |||
| 35,165 | F5 Networks, Inc.* | 736,707 | |||
| 1,864,070 | |||||
| Data Processing & Outsourced Services 8.7% | |||||
| 30,700 | Alliance Data Systems Corp.* | 1,134,365 | |||
| 49,370 | Fidelity National Information Services, Inc. | 898,534 | |||
| 31,745 | Paychex, Inc. | 814,894 | |||
| 185,030 | Redecard S.A. (Brazil) | 2,252,888 | |||
| 5,100,681 | |||||
| Diversified Metals & Mining 1.1% | |||||
| 4,740 | Rio Tinto plc ADR (United Kingdom) | 635,444 | |||
| Diversified Support Services 3.5% | |||||
| 69,710 | Copart, Inc.* | 2,067,599 | |||
| Drug Retail 3.0% | |||||
| 65,065 | CVS Caremark Corp. | 1,788,637 | |||
| Education Services 2.2% | |||||
| 16,705 | Apollo Group, Inc., Class A* | 1,308,503 | |||
| Electronic Components 3.7% | |||||
| 77,005 | Amphenol Corp., Class A | 2,193,872 | |||
| Health Care Equipment 4.7% | |||||
| 75,665 | St. Jude Medical, Inc.* | 2,748,910 | |||
| Health Care Services 3.2% | |||||
| 41,195 | Express Scripts, Inc.* | 1,901,973 | |||
| Investment Banking & Brokerage 1.6% | |||||
| 58,676 | Charles Schwab Corp. (The) | 909,478 | |||
| IT Consulting & Other Services 4.8% | |||||
| 37,610 | Cognizant Technology Solutions Corp., Class A* | 781,912 | |||
| 76,800 | Infosys Technologies Ltd. (India) | 2,016,648 | |||
| 2,798,560 | |||||
| Life Sciences Tools & Services 2.4% | |||||
| 39,180 | Covance, Inc.* | 1,395,983 | |||
| Mortgage REITs 2.0% | |||||
| 83,454 | Annaly Capital Management, Inc. | 1,157,507 | |||
| Shares | Value | ||||
| Multi-Line Insurance 1.4% | |||||
| 32,255 | HCC Insurance Holdings, Inc. | $ | 812,503 | ||
| Oil & Gas Equipment & Services 1.3% | |||||
| 35,990 | Cameron International Corp.* | 789,261 | |||
| Oil & Gas Exploration & Production 5.4% | |||||
| 52,280 | Chesapeake Energy Corp. | 891,897 | |||
| 58,685 | Petrohawk Energy Corp.* | 1,128,513 | |||
| 14,793 | Plains Exploration & Production Co.* | 254,883 | |||
| 29,658 | XTO Energy, Inc. | 908,128 | |||
| 3,183,421 | |||||
| Pharmaceuticals 1.9% | |||||
| 25,340 | Teva Pharmaceutical Industries Ltd. ADR (Israel) | 1,141,567 | |||
| Semiconductors 10.1% | |||||
| 140,610 | Altera Corp. | 2,467,706 | |||
| 53,335 | Linear Technology Corp. | 1,225,638 | |||
| 65,940 | Maxim Integrated Products, Inc. | 871,067 | |||
| 31,870 | Microchip Technology, Inc. | 675,325 | |||
| 77,042 | Taiwan Semiconductor Manufacturing Co. | ||||
| Ltd. ADR (Taiwan) | 689,526 | ||||
| 5,929,262 | |||||
| Specialized Finance 4.0% | |||||
| 20,815 | IntercontinentalExchange, Inc.* ††† | 1,550,093 | |||
| 47,440 | MSCI, Inc., Class A* | 802,210 | |||
| 2,352,303 | |||||
| Specialty Chemicals 2.5% | |||||
| 42,645 | Ecolab, Inc. | 1,481,061 | |||
| Specialty Stores 1.0% | |||||
| 33,680 | Staples, Inc. | 609,945 | |||
| Systems Software 3.9% | |||||
| 69,305 | BMC Software, Inc.* | 2,287,065 | |||
| Thrifts & Mortgage Finance 3.0% | |||||
| 26,735 | Housing Development Finance Corp. Ltd. (India) | 743,304 | |||
| 92,890 | New York Community Bancorp, Inc. | 1,037,581 | |||
| 1,780,885 | |||||
| Trading Companies & Distributors 3.0% | |||||
| 29,670 | Fastenal Co. | 954,039 | |||
| 25,585 | MSC Industrial Direct Co., Inc., Class A | 794,926 | |||
| 1,748,965 | |||||
| Trucking 1.5% | |||||
| 37,205 | J.B. Hunt Transport Services, Inc. | 897,013 | |||
| Wireless Telecommunication Services 2.2% | |||||
| 87,965 | NII Holdings, Inc.* | 1,319,475 | |||
| Total Common Stocks (cost $70,111,550) | 56,943,488 | ||||
| LIMITED PARTNERSHIP INTEREST 0.3% | |||||
| Specialized Finance 0.3% | |||||
| 216,220 | KKR Financial Holdings, LLC | 192,436 | |||
| Total Limited Partnership Interest (cost $2,071,354) | 192,436 | ||||
53
Table of Contents
| WASATCH HERITAGE GROWTH FUND (WAHGX) — Schedule of Investments (continued) | ||
| Principal Amount | Value | ||||
| SHORT-TERM INVESTMENTS 1.7% | |||||
| Repurchase Agreement 1.7% | |||||
| $960,000 | Repurchase Agreement dated 3/31/09, 0.10% due 4/1/09 with Fixed Income Clearing Corporation collateralized by $675,000 of United States Treasury Bonds 8.125% due 8/15/19; value: $984,285; repurchase proceeds: $960,003††† (cost $960,000) | $ | 960,000 | ||
| Total Short-Term Investments (cost $960,000) | 960,000 | ||||
| Total Investments (cost $73,142,904) 98.9%^^ | 58,095,924 | ||||
| Other Assets less Liabilities 1.1% | 652,254 | ||||
| NET ASSETS 100.0% | $ | 58,748,178 | |||
| Number of Contracts | Value | ||||
| CALL OPTIONS WRITTEN 0.0% | |||||
| Specialized Finance 0.0% | |||||
| 30 | IntercontinentalExchange, Inc., expiring 4/18/2009, exercise price $80 | $ | 6,600 | ||
| Total Call Options Written (premium $13,170) | 6,600 | ||||
*Non-income producing.
†††All or a portion of this security has been designated as collateral for call options written (see Note 10).
^^The aggregate amount of foreign securities fair valued pursuant to a systematic fair valuation model as a percent of net assets was 5.68%.
ADR American Depositary Receipt.
REIT Real Estate Investment Trust.
See notes to financial statements. | |||||
At March 31, 2009, Wasatch Heritage Growth Fund’s investments, excluding short-term investments and written options, were in the following countries:
| Country | % | ||
Brazil | 4.0 | ||
Hong Kong | 1.0 | ||
India | 4.8 | ||
Israel | 2.0 | ||
Taiwan | 1.2 | ||
United Kingdom | 1.1 | ||
United States | 85.9 | ||
TOTAL | 100.0 | % | |
54
Table of Contents
| WASATCH HERITAGE VALUE FUND (WAHVX) — Schedule of Investments | MARCH 31, 2009 (UNAUDITED) | |
| Shares | Value | ||||
| COMMON STOCKS 79.5% | |||||
| Computer & Electronics Retail 2.7% | |||||
| 2,800 | GameStop Corp., Class A* | $ | 78,456 | ||
| Computer Storage & Peripherals 3.2% | |||||
| 8,200 | EMC Corp.* | 93,480 | |||
| Data Processing & Outsourced Services 5.1% | |||||
| 3,400 | Fidelity National Information Services, Inc. | 61,880 | |||
| 1,600 | Visa, Inc., Class A | 88,960 | |||
| 150,840 | |||||
| Diversified Support Services 3.8% | |||||
| 3,800 | Copart, Inc.* | 112,708 | |||
| Fertilizers & Agricultural Chemicals 6.1% | |||||
| 2,700 | Syngenta AG ADR (Switzerland) | 108,297 | |||
| 1,700 | The Mosaic Co. | 71,366 | |||
| 179,663 | |||||
| Food Distributors 2.5% | |||||
| 3,300 | Sysco Corp. | 75,240 | |||
| Health Care Technology 2.2% | |||||
| 1,500 | Cerner Corp.* ††† | 65,955 | |||
| Home Entertainment Software 6.4% | |||||
| 9,500 | Activision Blizzard, Inc.* | 99,370 | |||
| 2,500 | Nintendo Co. Ltd. ADR (Japan) | 91,250 | |||
| 190,620 | |||||
| Hypermarkets & Super Centers 6.6% | |||||
| 2,200 | Costco Wholesale Corp. | 101,904 | |||
| 1,800 | Wal-Mart Stores, Inc. | 93,780 | |||
| 195,684 | |||||
| Insurance Brokers 2.2% | |||||
| 3,500 | Brown & Brown, Inc. | 66,185 | |||
| Internet Software & Services 2.5% | |||||
| 3,900 | Akamai Technologies, Inc.* | 75,660 | |||
| Investment Banking & Brokerage 2.6% | |||||
| 5,000 | Charles Schwab Corp. (The) | 77,500 | |||
| IT Consulting & Other Services 3.4% | |||||
| 4,900 | Cognizant Technology Solutions Corp., Class A* | 101,871 | |||
| Life Sciences Tools & Services 2.6% | |||||
| 2,400 | Life Technologies Corp.* | 77,952 | |||
| Mortgage REITs 3.7% | |||||
| 7,900 | Annaly Capital Management, Inc. | 109,573 | |||
| Oil & Gas Exploration & Production 3.1% | |||||
| 8,200 | ARC Energy Trust** (Canada) | 91,883 | |||
| Oil & Gas Storage & Transportation 3.0% | |||||
| 6,200 | Spectra Energy Corp. | 87,668 | |||
| Packaged Foods & Meats 2.9% | |||||
| 1,600 | Ralcorp Holdings, Inc.* | 86,208 | |||
| Pharmaceuticals 4.1% | |||||
| 9,000 | Mylan, Inc.* | 120,690 | |||
| Property & Casualty Insurance 2.3% | |||||
| 2,600 | First American Corp. | 68,926 | |||
| Semiconductors 2.9% | |||||
| 3,800 | Linear Technology Corp. | 87,324 | |||
| Shares | Value | |||||
| Specialized Finance 2.7% | ||||||
| 4,100 | NASDAQ OMX Group, Inc. (The)* | $ | 80,278 | |||
| Water Utilities 2.9% | ||||||
| 4,500 | American Water Works Co., Inc. | 86,580 | ||||
| Total Common Stocks (cost $2,431,830) | 2,360,944 | |||||
| PREFERRED STOCKS 1.0% | ||||||
| Regional Banks 1.0% | ||||||
| 3,000 | Fifth Third Capital Trust VI, 7.25%, 11/15/67* ** | 28,980 | ||||
| Total Preferred Stocks (cost $33,050) | 28,980 | |||||
| Principal Amount | Value | |||||
| SHORT-TERM INVESTMENTS 21.3% | ||||||
| Repurchase Agreement 21.3% | ||||||
| $633,000 | Repurchase Agreement dated 3/31/09, 0.10% due 4/1/09 with Fixed Income Clearing Corporation collateralized by $430,000 of United States Treasury Bonds 8.00% due 11/15/21; value: $647,623; repurchase proceeds: $633,002††† (cost $633,000) | $ | 633,000 | |||
| Total Short-Term Investments (cost $633,000) | 633,000 | |||||
| Total Investments (cost $3,097,880) 101.8% | 3,022,924 | |||||
| Liabilities less Other Assets (1.8)% | (53,709 | ) | ||||
| NET ASSETS 100.0% | $ | 2,969,215 | ||||
| Number of Contracts | Value | |||||
| CALL OPTIONS WRITTEN 0.1% | ||||||
| Health Care Technology 0.1% | ||||||
| 15 | Cerner Corp., expiring 4/9/09, exercise price $45 | |||||
| $ | 2,475 | |||||
| Total Call Options Written (premium $3,187) | 2,475 | |||||
*Non-income producing.
**Common units.
†††All or a portion of this security has been designated as collateral for call options written.
ADR American Depositary Receipt.
REIT Real Estate Investment Trust.
See notes to financial statements. |
| |||||
55
Table of Contents
| WASATCH HERITAGE VALUE FUND (WAHVX) — Schedule of Investments (continued) | ||
At March 31, 2009, Wasatch Heritage Value Fund’s investments, excluding short-term investments and options written, were in the following countries:
| Country | % | ||
Canada | 3.9 | ||
Japan | 3.8 | ||
Switzerland | 4.5 | ||
United States | 87.8 | ||
TOTAL | 100.0 | % | |
56
Table of Contents
| WASATCH INTERNATIONAL GROWTH FUND (WAIGX) — Schedule of Investments |
| Shares | Value | ||||
| COMMON STOCKS 96.2% | |||||
| Aerospace & Defense 2.4% | |||||
| 34,900 | Chemring Group plc (United Kingdom) | $ | 947,450 | ||
| 37,720 | Kongsberg Gruppen ASA (Norway) | 1,451,681 | |||
| 2,399,131 | |||||
| Agricultural Products 2.4% | |||||
| 2,687,340 | Chaoda Modern Agriculture Holdings Ltd. (China) | 1,598,222 | |||
| 1,319,280 | China Green Holdings Ltd. (China) | 777,975 | |||
| 2,376,197 | |||||
| Apparel Retail 1.5% | |||||
| 33,884 | Point, Inc. (Japan) | 1,539,747 | |||
| Apparel, Accessories & Luxury Goods 6.0% | |||||
| 2,166,254 | Anta Sports Products Ltd. (China) | 1,428,694 | |||
| 3,623,000 | China Dongxiang Group Co. (China) | 1,333,732 | |||
| 1,670,225 | Ports Design Ltd. (Hong Kong) | 1,927,497 | |||
| 277,005 | Ted Baker plc (United Kingdom) | 1,362,826 | |||
| 6,052,749 | |||||
| Application Software 2.4% | |||||
| 39,738 | Nemetschek AG (Germany) | 277,040 | |||
| 20,152 | SimCorp A/S (Denmark) | 2,156,945 | |||
| 2,433,985 | |||||
| Asset Management & Custody Banks 1.0% | |||||
| 17,390 | Partners Group Holding AG (Switzerland) | 1,042,344 | |||
| Coal & Consumable Fuels 0.5% | |||||
| 855,385 | Tambang Batubara Bukit Asam Tbk PT (Indonesia) | 501,168 | |||
| Commodity Chemicals 1.0% | |||||
| 235,775 | Tokai Carbon Co. Ltd. (Japan) | 959,799 | |||
| Communications Equipment 2.4% | |||||
| 164,475 | Tandberg ASA (Norway) | 2,411,226 | |||
| Construction & Engineering 2.0% | |||||
| 3,500,000 | Midas Holdings Ltd. (China) | 965,827 | |||
| 63,315 | Outotec Oyj (Finland) | 1,083,999 | |||
| 2,049,826 | |||||
| Construction & Farm Machinery & Heavy Trucks 0.8% | |||||
| 47,954 | Demag Cranes AG (Germany) | 830,074 | |||
| Construction Materials 1.0% | |||||
| 719,900 | Corp Moctezuma S.A.B de C.V. (Mexico) | 966,821 | |||
| Data Processing & Outsourced Services 3.0% | |||||
| 456,143 | Wirecard AG* (Germany) | 3,014,158 | |||
| Diversified Banks 4.2% | |||||
| 102,671 | Axis Bank Ltd. (India) | 840,019 | |||
| 438,747 | Bank of N.T. Butterfield & Son Ltd. (Bermuda) | 2,413,108 | |||
| 47,747 | HDFC Bank Ltd. (India) | 923,870 | |||
| 4,176,997 | |||||
| Diversified Metals & Mining 0.8% | |||||
| 89,345 | Hindustan Zinc Ltd. (India) | 797,748 | |||
| Electrical Components & Equipment 1.6% | |||||
| 4,742,525 | Wasion Group Holdings Ltd. (Hong Kong) | 1,561,263 | |||
| Shares | Value | ||||
| Electronic Equipment & Instruments 4.1% | |||||
| 1,399,166 | Chroma ATE, Inc. (Taiwan) | $ | 1,025,621 | ||
| 255,214 | Rotork plc (United Kingdom) | 3,111,972 | |||
| 4,137,593 | |||||
| Environmental & Facilities Services 1.3% | |||||
| 76,700 | Daiseki Co. Ltd. (Japan) | 1,312,905 | |||
| Food Retail 1.1% | |||||
| 50,145 | BIM Birlesik Magazalar AS (Turkey) | 1,063,982 | |||
| Health Care Equipment 3.6% | |||||
| 163,388 | DiaSorin S.p.A (Italy) | 3,649,235 | |||
| Health Care Supplies 4.8% | |||||
| 254,400 | Abcam plc (United Kingdom) | 2,210,431 | |||
| 1,483,000 | Shandong Weigao Group Medical Polymer Co. Ltd., Class H (China) | 2,639,808 | |||
| 4,850,239 | |||||
| Health Care Technology 1.0% | |||||
| 531,779 | RaySearch Laboratories AB (Sweden) | 1,039,340 | |||
| Home Entertainment Software 2.1% | |||||
| 158,302 | HUDSON SOFT Co. Ltd. (Japan) | 980,828 | |||
| 27,430 | Shanda Interactive Entertainment Ltd. ADR* (China) | 1,084,308 | |||
| 2,065,136 | |||||
| Industrial Machinery 4.3% | |||||
| 34,690 | Andritz AG (Austria) | 1,063,958 | |||
| 13,258 | Burckhardt Compression Holding AG (Switzerland) | 1,231,076 | |||
| 35,325 | Konecranes Oyj (Finland) | 589,272 | |||
| 289,800 | Weg S.A. (Brazil) | 1,469,284 | |||
| 4,353,590 | |||||
| Internet Retail 1.4% | |||||
| 1,650 | START TODAY Co. Ltd. (Japan) | 1,438,864 | |||
| Internet Software & Services 4.8% | |||||
| 5,895 | Baidu, Inc. ADR* (China) | 1,041,057 | |||
| 460 | Gourmet Navigator, Inc. (Japan) | 930,595 | |||
| 42,860 | NetEase.com, Inc. ADR* (China) | 1,150,791 | |||
| 15,140 | NHN Corp.* (Korea) | 1,668,220 | |||
| 4,790,663 | |||||
| Leisure Products 2.6% | |||||
| 1,003,230 | Li Ning Co. Ltd. (Hong Kong) | 1,659,440 | |||
| 29,380 | Shimano, Inc. (Japan) | 894,733 | |||
| 2,554,173 | |||||
| Life Sciences Tools & Services 3.7% | |||||
| 45,987 | Eurofins Scientific (France) | 1,950,172 | |||
| 40,715 | ICON plc ADR* (Ireland) | 657,547 | |||
| 62,655 | MorphoSys AG* (Germany) | 1,060,798 | |||
| 3,668,517 | |||||
| Oil & Gas Equipment & Services 4.3% | |||||
| 105,195 | Pason Systems, Inc. (Canada) | 793,044 | |||
| 37,385 | Schoeller-Bleckmann Oilfield Equipment AG (Austria) | 1,075,284 | |||
| 154,785 | TGS-NOPEC Geophysical Co. ASA* (Norway) | 1,200,014 | |||
| 99,230 | WorleyParsons Ltd. (Australia) | 1,250,255 | |||
| 4,318,597 | |||||
57
Table of Contents
| WASATCH INTERNATIONAL GROWTH FUND (WAIGX) — Schedule of Investments (continued) | ||
| Shares | Value | ||||
| Oil & Gas Exploration & Production 3.0% | |||||
| 30,670 | Addax Petroleum Corp. (Canada) | $ | 663,043 | ||
| 171,555 | Gran Tierra Energy, Inc.* (Colombia) | 430,603 | |||
| 250,442 | JKX Oil and Gas plc (United Kingdom) | 789,562 | |||
| 72,920 | Premier Oil plc* (United Kingdom) | 1,109,204 | |||
| 2,992,412 | |||||
| Packaged Foods & Meats 0.8% | |||||
| 32,376 | Unicharm PetCare Corp. (Japan) | 821,816 | |||
| Personal Products 1.2% | |||||
| 120,100 | Natura Cosmeticos S.A. (Brazil) | 1,180,799 | |||
| Pharmaceuticals 1.0% | |||||
| 162,839 | Dechra Pharmaceuticals plc (United Kingdom) | 971,958 | |||
| Regional Banks 1.7% | |||||
| 645 | Seven Bank Ltd. (Japan) | 1,718,961 | |||
| Research & Consulting Services 3.5% | |||||
| 223,433 | Campbell Brothers Ltd. (Australia) | 2,123,378 | |||
| 386 | Nihon M&A Center, Inc. (Japan) | 868,696 | |||
| 29,305 | Stantec, Inc.* (Canada) | 529,105 | |||
| 3,521,179 | |||||
| Semiconductors 0.4% | |||||
| 89,566 | Melexis N.V. (Belgium) | 416,115 | |||
| Specialized Finance 7.2% | |||||
| 544,355 | BM&F BOVESPA S.A. (Brazil) | 1,661,124 | |||
| 148,420 | IMAREX ASA* (Norway) | 946,800 | |||
| 1,002,935 | Infrastructure Development Finance Co. Ltd. (India) | 1,073,370 | |||
| 780 | Osaka Securities Exchange Co. Ltd. (Japan) | 2,512,678 | |||
| 319,000 | Singapore Exchange Ltd. (Singapore) | 1,071,033 | |||
| 7,265,005 | |||||
| Specialty Chemicals 1.3% | |||||
| 53,855 | SGL Carbon AG* (Germany) | 1,280,029 | |||
| Steel 0.5% | |||||
| 43,000 | Sims Metal Management Ltd. (Australia) | 510,624 | |||
| Systems Software 0.9% | |||||
| 2,857 | Simplex Technology, Inc. (Japan) | 936,968 | |||
| Thrifts & Mortgage Finance 1.6% | |||||
| 79,655 | Home Capital Group, Inc. (Canada) | 1,576,321 | |||
| Wireless Telecommunication Services 1.0% | |||||
| 38,800 | Egyptian Co. for Mobile Services (Egypt) | 1,010,859 | |||
| Total Common Stocks (cost $133,595,503) | 96,559,113 | ||||
| PREFERRED STOCKS 2.1% | |||||
| Fertilizers & Agricultural Chemicals 1.0% | |||||
| 177,750 | Fertilizantes Fosfatados S.A. Pfd. (Brazil) | 1,049,333 | |||
| Regional Banks 1.1% | |||||
| 521,575 | Banco Daycoval S.A. Pfd. (Brazil) | 1,070,884 | |||
| Total Preferred Stocks (cost $5,203,120) | 2,120,217 | ||||
| Shares | Value | |||||
| WARRANTS 0.0% | ||||||
| Gold 0.0% | ||||||
| 2,678,000 | Redcorp Ventures Ltd. expiring 7/10/09* *** † (Canada) | $ | 10,603 | |||
| Total Warrants (cost $0) | 10,603 | |||||
| Principal Amount | Value | |||||
| SHORT-TERM INVESTMENTS 1.9% | ||||||
| Repurchase Agreement 1.9% | ||||||
| $1,926,000 | Repurchase Agreement dated 3/31/09, 0.10% due 4/1/09 with Fixed Income Clearing Corporation collateralized by $1,350,000 of United States Treasury Bonds 8.125% due 8/15/09; value: $1,968,570; repurchase proceeds: $1,926,005 (cost $1,926,000) | $ | 1,926,000 | |||
| Total Short-Term Investments (cost $1,926,000) | 1,926,000 | |||||
| Total Investments (cost $140,724,623) 100.2%^^ | 100,615,933 | |||||
| Liabilities less Other Assets (0.2)% | (180,642 | ) | ||||
| NET ASSETS 100.0% | $ | 100,435,291 | ||||
*Non-income producing.
***Security was fair valued under procedures adopted by the Board of Directors (see Note 2).
†Security purchased in a private placement transaction or under Rule 144A of the Securities Act of 1933 (see Note 9).
^^The aggregate amount of foreign securities fair valued pursuant to a systematic fair valuation model as a percent of net assets was 80.59%.
ADR American Depositary Receipt.
See notes to financial statements. |
| |||||
58
Table of Contents
| MARCH 31, 2009 (UNAUDITED) | ||
At March 31, 2009, Wasatch International Growth Fund’s investments, excluding short-term investments, were in the following countries:
| Country | % | ||
Australia | 3.9 | ||
Austria | 2.2 | ||
Belgium | 0.4 | ||
Bermuda | 2.4 | ||
Brazil | 6.5 | ||
Canada | 3.6 | ||
China | 12.2 | ||
Colombia | 0.4 | ||
Denmark | 2.2 | ||
Egypt | 1.0 | ||
Finland | 1.7 | ||
France | 2.0 | ||
Germany | 6.6 | ||
Hong Kong | 5.2 | ||
India | 3.7 | ||
Indonesia | 0.5 | ||
Ireland | 0.7 | ||
Italy | 3.7 | ||
Japan | 15.1 | ||
Korea | 1.7 | ||
Mexico | 1.0 | ||
Norway | 6.1 | ||
Singapore | 1.1 | ||
Sweden | 1.1 | ||
Switzerland | 2.3 | ||
Taiwan | 1.0 | ||
Turkey | 1.1 | ||
United Kingdom | 10.6 | ||
TOTAL | 100.0 | % | |
59
Table of Contents
| WASATCH INTERNATIONAL OPPORTUNITIES FUND (WAIOX) — Schedule of Investments | ||
| Shares | Value | ||||
| COMMON STOCKS 84.0% | |||||
| Aerospace & Defense 0.5% | |||||
| 9,400 | Chemring Group plc (United Kingdom) | $ | 255,187 | ||
| Agricultural Products 2.1% | |||||
| 455,000 | Chaoda Modern Agriculture Holdings Ltd. (China) | 270,599 | |||
| 1,354,000 | China Green Holdings Ltd. (China) | 798,449 | |||
| 1,069,048 | |||||
| Air Freight & Logistics 2.7% | |||||
| 2,953,460 | Aramex PJSC* (United Arab Emirates) | 857,989 | |||
| 1,135,183 | Goodpack Ltd. (Singapore) | 493,171 | |||
| 1,351,160 | |||||
| Apparel, Accessories & Luxury Goods 6.1% | |||||
| 2,044,836 | Anta Sports Products Ltd. (China) | 1,348,616 | |||
| 15,110 | Gerry Weber International AG (Germany) | 308,394 | |||
| 121,796 | Mulberry Group plc (United Kingdom) | 112,019 | |||
| 699,503 | Ports Design Ltd. (Hong Kong) | 807,250 | |||
| 109,865 | Ted Baker plc (United Kingdom) | 540,521 | |||
| 3,116,800 | |||||
| Application Software 4.8% | |||||
| 48,000 | Computer Modelling Group Ltd. (Canada) | 351,600 | |||
| 6,182,000 | Kingdee International Software Group Co. Ltd. (China) | 791,881 | |||
| 23,750 | Longtop Financial Technologies Ltd. ADR* (China) | 504,213 | |||
| 7,200 | SimCorp A/S (Denmark) | 770,643 | |||
| 2,418,337 | |||||
| Asset Management & Custody Banks 0.3% | |||||
| 50,314 | Treasury Group Ltd. (Australia) | 155,900 | |||
| Auto Parts & Equipment 0.2% | |||||
| 2,500,000 | Norstar Founders Group Ltd.*** (Hong Kong) | 117,736 | |||
| Biotechnology 1.7% | |||||
| 5,502,470 | Sino Biopharmaceutical Ltd. (China) | 844,980 | |||
| Communications Equipment 2.4% | |||||
| 387,000 | Sepura Ltd. (United Kingdom) | 176,907 | |||
| 71,165 | Tandberg ASA (Norway) | 1,043,288 | |||
| 1,220,195 | |||||
| Construction & Engineering 3.1% | |||||
| 174,300 | Lycopodium Ltd. (Australia) | 157,433 | |||
| 2,573,960 | Midas Holdings Ltd. (China) | 710,285 | |||
| 24,320 | Outotec Oyj (Finland) | 416,376 | |||
| 1,461,000 | Rotary Engineering Ltd. (Singapore) | 302,528 | |||
| 1,586,622 | |||||
| Construction & Farm Machinery & Heavy Trucks 1.0% | |||||
| 7,005 | Faiveley S.A. (France) | 511,247 | |||
| Consumer Finance 1.3% | |||||
| 339,945 | Banco Compartamos S.A. de C.V. (Mexico) | 636,759 | |||
| Data Processing & Outsourced Services 2.9% | |||||
| 224,540 | Wirecard AG* (Germany) | 1,483,743 | |||
| Diversified Banks 1.1% | |||||
| 202,665 | Union Bank of India Ltd. (India) | 582,297 | |||
| Diversified Support Services 0.4% | |||||
| 88,223 | LPS Brasil — Consultoria de Imoveis S.A. (Brazil) | 220,198 | |||
| Shares | Value | ||||
| Drug Retail 0.6% | |||||
| 19,865 | Create SD Holdings Co. Ltd.* (Japan) | $ | 307,144 | ||
| Education Services 0.7% | |||||
| 89,170 | Kroton Educational S.A.* ** (Brazil) | 359,970 | |||
| 1,040,150 | Oriental Century Ltd.*** (China) | 6,833 | |||
| 366,803 | |||||
| Electrical Components & Equipment 3.8% | |||||
| 44,500 | Harbin Electric, Inc.* | 273,675 | |||
| 2,822,157 | Wasion Group Holdings Ltd. (Hong Kong) | 929,068 | |||
| 717,000 | Zhuzhou CSR Times Electric Co. Ltd., Series H (China) | 729,297 | |||
| 1,932,040 | |||||
| Electronic Manufacturing Services 0.2% | |||||
| 346,000 | Ju Teng International Holdings Ltd.* (China) | 106,427 | |||
| Environmental & Facilities Services 1.3% | |||||
| 37,625 | Daiseki Co. Ltd. (Japan) | 644,042 | |||
| Food Retail 0.6% | |||||
| 1,496,397 | BreadTalk Group Ltd. (Singapore) | 286,887 | |||
| Footwear 1.5% | |||||
| 12,314,395 | China Hongxing Sports Ltd. (China) | 767,794 | |||
| Health Care Equipment 2.2% | |||||
| 25,421 | DiaSorin S.p.A (Italy) | 567,772 | |||
| 17,525 | Infopia Co. Ltd. (Korea) | 373,386 | |||
| 1,083,560 | LMA International N.V.* (Singapore) | 92,839 | |||
| 1,347,445 | Mingyuan Medicare Development Co. Ltd. (China) | 80,865 | |||
| 1,114,862 | |||||
| Health Care Facilities 1.6% | |||||
| 1,598,670 | Raffles Medical Group Ltd. (Singapore) | 803,591 | |||
| Health Care Supplies 2.2% | |||||
| 79,620 | Abcam plc (United Kingdom) | 691,803 | |||
| 244,000 | Shandong Weigao Group Medical Polymer Co. Ltd., Class H (China) | 434,331 | |||
| 1,126,134 | |||||
| Health Care Technology 1.0% | |||||
| 253,230 | RaySearch Laboratories AB (Sweden) | 494,928 | |||
| Home Entertainment Software 1.3% | |||||
| 205 | GameOn Co. Ltd. (Japan) | 193,717 | |||
| 29,610 | HUDSON SOFT Co. Ltd. (Japan) | 183,462 | |||
| 683,000 | Kingsoft Corp. Ltd. (China) | 283,808 | |||
| 660,987 | |||||
| Industrial Machinery 4.2% | |||||
| 5,200 | Burckhardt Compression Holding AG (Switzerland) | 482,847 | |||
| 6,027,000 | China Automation Group Ltd. (China) | 1,293,058 | |||
| 15,695 | Muehlbauer Holding AG & Co. KGaA (Germany) | 346,922 | |||
| 2,122,827 | |||||
| Internet Retail 1.5% | |||||
| 866 | START TODAY Co. Ltd. (Japan) | 755,186 | |||
| Internet Software & Services 1.2% | |||||
| 15,880 | NetEase.com, Inc. ADR* (China) | 426,378 | |||
| 290,500 | Vendtek Systems, Inc.* *** (Canada) | 177,134 | |||
| 603,512 | |||||
60
Table of Contents
| MARCH 31, 2009 (UNAUDITED) | ||
| Shares | Value | ||||
| Investment Banking & Brokerage 0.4% | |||||
| 173 | GCA Savvian Group Corp. (Japan) | $ | 208,288 | ||
| IT Consulting & Other Services 1.5% | |||||
| 104,500 | China Information Security Technology, Inc.* (China) | 330,220 | |||
| 565 | Future Architect, Inc. (Japan) | 200,086 | |||
| 38,835 | Yuchen Technologies Ltd.* (China) | 247,379 | |||
| 777,685 | |||||
| Life Sciences Tools & Services 3.6% | |||||
| 2,034 | CMIC Co. Ltd. (Japan) | 497,814 | |||
| 107 | EPS Co. Ltd. (Japan) | 408,041 | |||
| 10,000 | Eurofins Scientific (France) | 424,070 | |||
| 28,720 | MorphoSys AG* (Germany) | 486,252 | |||
| 1,816,177 | |||||
| Oil & Gas Drilling 0.6% | |||||
| 55,660 | Phoenix Technology Income Fund** (Canada) | 299,721 | |||
| Oil & Gas Equipment & Services 2.6% | |||||
| 2,500,000 | Anton Oilfield Services Group* (China) | 193,725 | |||
| 954,430 | Ezra Holdings Ltd. (Singapore) | 423,633 | |||
| 232,000 | Lamprell plc (United Arab Emirates) | 219,022 | |||
| 63,685 | Pason Systems, Inc. (Canada) | 480,109 | |||
| 1,316,489 | |||||
| Oil & Gas Exploration & Production 3.6% | |||||
| 186,530 | Dragon Oil plc* (United Arab Emirates) | 515,803 | |||
| 89,467 | Gran Tierra Energy, Inc.* (Colombia) | 224,562 | |||
| 97,125 | JKX Oil and Gas plc (United Kingdom) | 306,204 | |||
| 53,695 | Petrominerales Ltd.* (Colombia) | 472,829 | |||
| 21,530 | Premier Oil plc* (United Kingdom) | 327,498 | |||
| 1,846,896 | |||||
| Other Diversified Financial Services 0.4% | |||||
| 314,680 | Count Financial Ltd. (Australia) | 226,206 | |||
| Packaged Foods & Meats 1.3% | |||||
| 73,355 | Zhongpin, Inc.* | 651,392 | |||
| Personal Products 0.4% | |||||
| 1,200,000 | Beauty China Holdings Ltd.* *** (China) | 53,214 | |||
| 9,111 | Proctor & Gamble Hygiene and Healthcare Ltd. (India) | 135,078 | |||
| 188,292 | |||||
| Pharmaceuticals 1.7% | |||||
| 796,000 | China Shineway Pharmaceutical Group Ltd. (China) | 451,527 | |||
| 64,619 | Dechra Pharmaceuticals plc (United Kingdom) | 385,700 | |||
| 837,227 | |||||
| Regional Banks 1.0% | |||||
| 63,695 | Canadian Western Bank (Canada) | 524,571 | |||
| Research & Consulting Services 0.6% | |||||
| 140 | Nihon M&A Center, Inc. (Japan) | 315,071 | |||
| Restaurants 2.5% | |||||
| 1,247,000 | Ajisen China Holdings Ltd. (China) | 621,622 | |||
| 13,000 | Chimney Co. Ltd. (Japan) | 185,277 | |||
| 581,950 | FU JI Food & Catering Services Holdings Ltd. (China) | 256,916 | |||
| 7,300 | Saint Marc Holdings Co. Ltd. (Japan) | 184,036 | |||
| 1,247,851 | |||||
| Shares | Value | ||||
| Semiconductors 0.7% | |||||
| 52,270 | Melexis N.V. (Belgium) | $ | 242,841 | ||
| 31,066 | O2Micro International Ltd. ADR* (Hong Kong) | 106,246 | |||
| 349,087 | |||||
| Specialized Finance 4.0% | |||||
| 518,600 | Bolsa Mexicana de Valores S.A., Series A* (Mexico) | 285,922 | |||
| 62,880 | IMAREX ASA* (Norway) | 401,124 | |||
| 326 | Osaka Securities Exchange Co. Ltd. (Japan) | 1,050,170 | |||
| 32,625 | Oslo Bors VPS Holding ASA (Norway) | 290,521 | |||
| 2,027,737 | |||||
| Specialty Chemicals 0.5% | |||||
| 15,120 | C. Uyemura & Co. Ltd. (Japan) | 264,238 | |||
| Specialty Stores 0.8% | |||||
| 53,705 | easyhome Ltd. (Canada) | 393,389 | |||
| Systems Software 1.8% | |||||
| 786,573 | Guestlogix, Inc.* (Canada) | 205,550 | |||
| 2,129 | Simplex Technology, Inc. (Japan) | 698,217 | |||
| 903,767 | |||||
| Thrifts & Mortgage Finance 1.5% | |||||
| 37,475 | Home Capital Group, Inc. (Canada) | 741,606 | |||
| Total Common Stocks (cost $54,270,321) | 42,599,063 | ||||
| PREFERRED STOCKS 0.8% | |||||
| Regional Banks 0.8% | |||||
| 199,510 | Banco Daycoval S.A. Pfd. (Brazil) | 409,629 | |||
| Total Preferred Stocks (cost $577,470) | 409,629 | ||||
| EXCHANGE TRADED FUNDS 6.0% | |||||
| Asset Management & Custody Banks 6.0% | |||||
| 83,025 | iShares MSCI Emerging Markets Index Fund | 2,059,850 | |||
| 39,320 | SPDR Metals & Mining ETF | 988,505 | |||
| 3,048,355 | |||||
| Total Exchange Traded Funds (cost $2,731,777) | 3,048,355 | ||||
| WARRANTS 0.0% | |||||
| Gold 0.0% | |||||
| 427,500 | Redcorp Ventures Ltd. expiring 7/10/09* *** † (Canada) | 1,693 | |||
| Total Warrants (cost $0) | 1,693 | ||||
61
Table of Contents
| WASATCH INTERNATIONAL OPPORTUNITIES FUND (WAIOX) — Schedule of Investments (continued) | ||
| Principal Amount | Value | ||||
| SHORT-TERM INVESTMENTS 8.7% | |||||
| Short Term Investments 8.7% | |||||
| $4,390,000 | Repurchase Agreement dated 3/31/09, 0.10% due 4/1/09 with Fixed Income Clearing Corporation collateralized by $3,075,000 of United States Treasury Bonds 8.125% due 8/15/19; value: $4,483,965; repurchase proceeds: $4,390,012 (cost $4,390,000) | $ | 4,390,000 | ||
| Total Short-Term Investments (cost $4,390,000) | 4,390,000 | ||||
| Total Investments (cost $61,969,568) 99.5%^^ | 50,448,740 | ||||
| Other Assets less Liabilities 0.5% | 271,309 | ||||
| NET ASSETS 100.0% | $ | 50,720,049 | |||
*Non-income producing.
**Common units.
***Security was fair valued under procedures adopted by the Board of Directors (see Note 2).
†Security purchased in a private placement transaction or under Rule 144A of the Securities Act of 1933 (see Note 9).
^^The aggregate amount of foreign securities fair valued pursuant to a systematic fair valuation model as a percent of net assets was 66.86%.
ADR American Depositary Receipt.
See Notes to Financial Statements. | |||||
At March 31, 2009, Wasatch International Opportunities Fund’s investments, excluding short-term investments, were in the following countries:
| Country | % | ||
Australia | 1.2 | ||
Belgium | 0.5 | ||
Brazil | 2.1 | ||
Canada | 6.9 | ||
China | 25.1 | ||
Colombia | 1.5 | ||
Denmark | 1.7 | ||
Finland | 0.9 | ||
France | 2.0 | ||
Germany | 5.7 | ||
Hong Kong | 4.3 | ||
India | 1.6 | ||
Italy | 1.2 | ||
Japan | 13.2 | ||
Korea | 0.8 | ||
Mexico | 2.0 | ||
Norway | 3.8 | ||
Singapore | 5.2 | ||
Sweden | 1.1 | ||
Switzerland | 1.0 | ||
United Arab Emirates | 3.5 | ||
United Kingdom | 6.1 | ||
United States | 8.6 | ||
TOTAL | 100.0 | % | |
62
Table of Contents
| WASATCH MICRO CAP FUND (WMICX) — Schedule of Investments | MARCH 31, 2009 (UNAUDITED) | |
| Shares | Value | ||||
| COMMON STOCKS 95.9% | |||||
| Air Freight & Logistics 1.2% | |||||
| 5,234,180 | Goodpack Ltd. (Singapore) | $ | 2,273,948 | ||
| Apparel Retail 1.5% | |||||
| 299,603 | Zumiez, Inc.* | 2,906,149 | |||
| Apparel, Accessories & Luxury Goods 2.5% | |||||
| 2,003,000 | Ports Design Ltd. (Hong Kong) | 2,311,530 | |||
| 262,362 | Volcom, Inc.* | 2,544,912 | |||
| 4,856,442 | |||||
| Application Software 1.4% | |||||
| 302,445 | Interactive Intelligence, Inc.* | 2,740,152 | |||
| Asset Management & Custody Banks 5.6% | |||||
| 57,790 | Diamond Hill Investment Group, Inc.* | 2,272,303 | |||
| 889,022 | Treasury Group Ltd. (Australia) | 2,754,664 | |||
| 147,631 | Westwood Holdings Group, Inc. | 5,770,896 | |||
| 10,797,863 | |||||
| Biotechnology 0.3% | |||||
| 327,555 | Luna Innovations, Inc.* | 337,382 | |||
| 64,330 | Orexigen Therapeutics, Inc.* | 167,901 | |||
| 505,283 | |||||
| Computer Storage & Peripherals 1.0% | |||||
| 359,795 | Intevac, Inc.* | 1,874,532 | |||
| Consumer Finance 4.4% | |||||
| 505,971 | Dollar Financial Corp.* | 4,816,844 | |||
| 542,750 | United PanAm Financial Corp.* | 786,988 | |||
| 170,715 | World Acceptance Corp.* | 2,919,226 | |||
| 8,523,058 | |||||
| Diversified Banks 0.7% | |||||
| 167,403 | Encore Bancshares, Inc.* | 1,484,864 | |||
| Education Services 0.4% | |||||
| 201,547 | Kroton Educational S.A.* ** (Brazil) | 813,624 | |||
| Electronic Manufacturing Services 1.6% | |||||
| 531,080 | TTM Technologies, Inc.* | 3,080,264 | |||
| Environmental & Facilities Services 1.8% | |||||
| 131,530 | American Ecology Corp. | 1,833,528 | |||
| 136,330 | Team, Inc.* | 1,597,788 | |||
| 3,431,316 | |||||
| Footwear 0.6% | |||||
| 18,706,125 | China Hongxing Sports Ltd. (China) | 1,166,314 | |||
| Health Care Distributors 1.4% | |||||
| 97,636 | MWI Veterinary Supply, Inc.* | 2,780,673 | |||
| Health Care Equipment 8.6% | |||||
| 210,525 | Abaxis, Inc.* | 3,629,451 | |||
| 476,001 | Cardica, Inc.* | 1,385,163 | |||
| 141,720 | Invacare Corp. | 2,271,772 | |||
| 24,315,170 | LMA International N.V.* (Singapore) | 2,083,311 | |||
| 64,535 | NuVasive, Inc.* | 2,025,108 | |||
| 235,822 | VNUS Medical Technologies, Inc.* | 5,015,934 | |||
| 16,410,739 | |||||
| Health Care Facilities 2.1% | |||||
| 113,406 | AmSurg Corp.* | 1,797,485 | |||
| 997,225 | NovaMed, Inc.* | 2,263,701 | |||
| 4,061,186 | |||||
| Shares | Value | ||||
| Health Care Services 4.9% | |||||
| 159,340 | American Caresource Holding, Inc.* | $ | 1,220,544 | ||
| 147,741 | Bio-Reference Laboratories, Inc.* | 3,089,264 | |||
| 149,295 | CorVel Corp.* | 3,018,745 | |||
| 236,240 | Healthways, Inc.* | 2,071,825 | |||
| 9,400,378 | |||||
| Health Care Supplies 3.0% | |||||
| 432,710 | Abcam plc (United Kingdom) | 3,759,732 | |||
| 59,920 | ICU Medical, Inc.* | 1,924,630 | |||
| 5,684,362 | |||||
| Health Care Technology 0.5% | |||||
| 454,005 | RaySearch Laboratories AB (Sweden) | 887,334 | |||
| Internet Software & Services 2.4% | |||||
| 219,765 | DealerTrack Holdings, Inc.* | 2,878,922 | |||
| 65,831 | VistaPrint Ltd.* | 1,809,694 | |||
| 4,688,616 | |||||
| IT Consulting & Other Services 0.6% | |||||
| 42,470 | NCI, Inc., Class A* | 1,104,220 | |||
| Life Sciences Tools & Services 3.2% | |||||
| 147,959 | ICON plc ADR* (Ireland) | 2,389,538 | |||
| 109,355 | Kendle International, Inc.* | 2,292,081 | |||
| 194,670 | Life Sciences Research, Inc.* | 1,395,784 | |||
| 6,077,403 | |||||
| Marine Ports & Services 0.7% | |||||
| 444,727 | CAI International, Inc.* | 1,258,577 | |||
| Mortgage REITs 4.4% | |||||
| 588,695 | MFA Mortgage Investments, Inc. | 3,461,527 | |||
| 318,632 | Redwood Trust, Inc. | 4,891,001 | |||
| 8,352,528 | |||||
| Oil & Gas Equipment & Services 1.0% | |||||
| 252,800 | Pason Systems, Inc. (Canada) | 1,905,809 | |||
| Oil & Gas Exploration & Production 1.8% | |||||
| 321,507 | Approach Resources, Inc.* | 1,993,343 | |||
| 138,310 | GMX Resources, Inc.* | 899,015 | |||
| 26,150 | Ithaca Energy, Inc.* (Canada) | 12,839 | |||
| 1,030,430 | Ithaca Energy, Inc.* † (Canada) | 505,913 | |||
| 3,411,110 | |||||
| Oil & Gas Refining & Marketing 1.0% | |||||
| 61,590 | World Fuel Services Corp. | 1,948,092 | |||
| Regional Banks 2.8% | |||||
| 401,390 | Boston Private Financial Holdings, Inc. | 1,408,879 | |||
| 133,114 | Commonwealth Bankshares, Inc. | 665,570 | |||
| 251,573 | Tamalpais Bancorp†† | 1,383,651 | |||
| 116,440 | Washington Trust Bancorp PIPE* † | 1,892,150 | |||
| 5,350,250 | |||||
| Research & Consulting Services 4.7% | |||||
| 95,620 | CRA International, Inc.* | 1,805,306 | |||
| 349,605 | Resources Connection, Inc.* | 5,272,043 | |||
| 108,025 | Stantec, Inc.* (Canada) | 1,966,055 | |||
| 9,043,404 | |||||
| Semiconductor Equipment 1.4% | |||||
| 199,375 | Tessera Technologies, Inc.* | 2,665,644 | |||
63
Table of Contents
| WASATCH MICRO CAP FUND (WMICX) — Schedule of Investments (continued) | MARCH 31, 2009 (UNAUDITED) | |
| Shares | Value | ||||
| Semiconductors 14.8% | |||||
| 246,210 | Melexis N.V. (Belgium) | $ | 1,143,867 | ||
| 676,065 | Micrel, Inc. | 4,759,497 | |||
| 1,069,034 | Microtune, Inc.* | 1,945,642 | |||
| 125,876 | Netlogic Microsystems, Inc.* | 3,459,072 | |||
| 1,596,457 | O2Micro International Ltd. ADR* (Hong Kong) | 5,459,883 | |||
| 614,583 | Pericom Semiconductor Corp.* | 4,492,602 | |||
| 270,728 | Power Integrations, Inc. | 4,656,522 | |||
| 104,545 | Supertex, Inc.* | 2,414,989 | |||
| 28,332,074 | |||||
| Specialized Finance 1.6% | |||||
| 154,000 | Goldwater Bank, NA* *** † | 743,820 | |||
| 735 | Osaka Securities Exchange Co. Ltd. (Japan) | 2,367,716 | |||
| 3,111,536 | |||||
| Specialty Chemicals 0.5% | |||||
| 1,063,635 | Neo Material Technologies, Inc.* (Canada) | 1,027,585 | |||
| Specialty Stores 4.3% | |||||
| 351,995 | Big 5 Sporting Goods Corp. | 2,066,211 | |||
| 197,015 | easyhome Ltd. (Canada) | 1,443,133 | |||
| 247,377 | Hibbett Sports, Inc.* | 4,754,586 | |||
| 8,263,930 | |||||
| Systems Software 1.8% | |||||
| 395,405 | Opnet Technologies, Inc.* | 3,428,161 | |||
| Thrifts & Mortgage Finance 1.3% | |||||
| 123,300 | Home Capital Group, Inc. (Canada) | 2,440,028 | |||
| Trading Companies & Distributors 1.3% | |||||
| 314,062 | Rush Enterprises, Inc., Class B* | 2,459,106 | |||
| Trucking 2.8% | |||||
| 115,965 | Old Dominion Freight Line, Inc.* | 2,724,018 | |||
| 496,925 | Vitran Corp., Inc.* | 2,613,825 | |||
| 5,337,843 | |||||
| Total Common Stocks (cost $282,927,794) | 183,884,397 | ||||
| WARRANTS 0.0% | |||||
| Air Freight & Logistics 0.0% | |||||
| 888,830 | Goodpack Ltd. expiring 7/16/09* (Singapore) | 2,919 | |||
| Health Care Distributors 0.0% | |||||
| 25,946 | Familymeds Group, Inc. expiring 11/30/09* *** † | — | |||
| Health Care Equipment 0.0% | |||||
| 121,124 | Cardica, Inc. expiring 6/7/12* *** † | — | |||
| Total Warrants (cost $19,380) | 2,919 | ||||
| Principal Amount | Value | ||||
| SHORT-TERM INVESTMENTS 3.3% | |||||
| Repurchase Agreement 3.3% | |||||
| $6,362,000 | Repurchase Agreement dated 3/31/09, 0.10% due 4/1/09 with Fixed Income Clearing Corporation collateralized by $4,455,000 of United States Treasury Bonds 8.125% due 8/15/19; value: $6,496,281; repurchase proceeds: $6,362,018 (cost $6,362,000) | $ | 6,362,000 | ||
| Total Short-Term Investments (cost $6,362,000) | 6,362,000 | ||||
| Total Investments (cost $289,309,174) 99.2%^^ | 190,249,316 | ||||
| Other Assets less Liabilities 0.8% | 1,577,410 | ||||
| NET ASSETS 100.0% | $ | 191,826,726 | |||
*Non-income producing.
**Common units.
***Security was fair valued under procedures adopted by the Board of Directors (see Note 2).
†Security purchased in a private placement transaction or under Rule 144A of the Securities Act of 1933 (see Note 9).
††Affiliated company (see Note 8).
^^ The aggregate amount of foreign securities fair valued pursuant to a systematic fair valuation model as a percent of net assets was 9.77%.
ADR American Depositary Receipt.
PIPE Private Investment in a Public Equity
REIT Real Estate Investment Trust.
See Notes to Financial Statements. | |||||
At March 31, 2009, Wasatch Micro Cap Fund’s investments, excluding short-term investments, were in the following countries:
| Country | % | ||
Australia | 1.5 | ||
Belgium | 0.6 | ||
Brazil | 0.4 | ||
Canada | 5.1 | ||
China | 0.6 | ||
Hong Kong | 4.2 | ||
Ireland | 1.3 | ||
Japan | 1.3 | ||
Singapore | 2.4 | ||
Sweden | 0.5 | ||
United Kingdom | 2.1 | ||
United States | 80.0 | ||
TOTAL | 100.0 | % | |
64
Table of Contents
| WASATCH MICRO CAP VALUE FUND (WAMVX) — Schedule of Investments | MARCH 31, 2009 (UNAUDITED) | |
| Shares | Value | ||||
| COMMON STOCKS 83.0% | |||||
| Agricultural Products 0.9% | |||||
| 800,000 | China Green Holdings Ltd. (China) | $ | 471,758 | ||
| Application Software 3.0% | |||||
| 5,164 | Interactive Intelligence, Inc.* | 46,786 | |||
| 28,000 | Longtop Financial Technologies Ltd. ADR* (China) | 594,440 | |||
| 50,000 | NetScout Systems, Inc.* | 358,000 | |||
| 5,000 | SimCorp A/S (Denmark) | 535,169 | |||
| 1,534,395 | |||||
| Asset Management & Custody Banks 2.7% | |||||
| 138,013 | Treasury Group Ltd. (Australia) | 427,638 | |||
| 25,000 | Westwood Holdings Group, Inc. | 977,250 | |||
| 1,404,888 | |||||
| Auto Parts & Equipment 0.6% | |||||
| 145,000 | Martinrea International, Inc.* (Canada) | 328,397 | |||
| Biotechnology 2.6% | |||||
| 220,000 | Luna Innovations, Inc.* | 226,600 | |||
| 101,331 | NeurogesX, Inc.* † | 308,046 | |||
| 5,200,000 | Sino Biopharmaceutical Ltd. (China) | 798,531 | |||
| 1,333,177 | |||||
| Communications Equipment 1.2% | |||||
| 25,000 | Comtech Telecommunications Corp.* | 619,250 | |||
| Computer Storage & Peripherals 1.0% | |||||
| 95,000 | Intevac, Inc.* | 494,950 | |||
| Construction & Engineering 4.3% | |||||
| 15,000 | Michael Baker Corp.* | 390,000 | |||
| 51,000 | MYR Group, Inc.* | 777,750 | |||
| 82,000 | Orion Marine Group, Inc.* | 1,074,200 | |||
| 2,241,950 | |||||
| Consumer Finance 1.0% | |||||
| 32,000 | World Acceptance Corp.* | 547,200 | |||
| Data Processing & Outsourced Services 1.5% | |||||
| 120,000 | Wirecard AG* (Germany) | 792,951 | |||
| Diversified Banks 0.5% | |||||
| 55,556 | Idaho Trust Bancorp* *** † | 260,002 | |||
| Diversified Capital Markets 0.9% | |||||
| 100,000 | JMP Group, Inc. | 481,000 | |||
| Diversified Chemicals 1.9% | |||||
| 100,000 | LSB Industries, Inc.* | 989,000 | |||
| Diversified Support Services 1.3% | |||||
| 44,000 | Healthcare Services Group, Inc. | 658,680 | |||
| Electrical Components & Equipment 1.5% | |||||
| 2,400,000 | Wasion Group Holdings Ltd. (Hong Kong) | 790,092 | |||
| Electronic Manufacturing Services 0.7% | |||||
| 1,240,000 | Sanmina-SCI Corp.* | 378,200 | |||
| Environmental & Facilities Services 3.2% | |||||
| 80,000 | EnergySolutions, Inc. | 692,000 | |||
| 131,700 | Heritage-Crystal Clean, Inc.* | 982,482 | |||
| 1,674,482 | |||||
| Footwear 0.6% | |||||
| 4,854,000 | China Hongxing Sports Ltd. (China) | 302,644 | |||
| Shares | Value | ||||
| Health Care Distributors 1.2% | |||||
| 22,000 | MWI Veterinary Supply, Inc.* | $ | 626,560 | ||
| Health Care Equipment 8.2% | |||||
| 250,000 | AtriCure, Inc.* | 320,000 | |||
| 103,865 | Cardica, Inc.* | 302,247 | |||
| 54,000 | Hill-Rom Holdings, Inc. | 534,060 | |||
| 30,000 | Invacare Corp. | 480,900 | |||
| 159,867 | MTS Medication Technologies, Inc.* | 565,929 | |||
| 20,000 | NuVasive, Inc.* | 627,600 | |||
| 254,300 | Solta Medical, Inc.* | 162,752 | |||
| 32,000 | VNUS Medical Technologies, Inc.* | 680,640 | |||
| 40,000 | Zoll Medical Corp.* | 574,400 | |||
| 4,248,528 | |||||
| Health Care Services 3.3% | |||||
| 30,000 | Bio-Reference Laboratories, Inc.* | 627,300 | |||
| 260,000 | Health Grades, Inc.* | 530,400 | |||
| 25,000 | LHC Group, Inc.* | 557,000 | |||
| 1,714,700 | |||||
| Health Care Supplies 1.4% | |||||
| 23,000 | ICU Medical, Inc.* ††† | 738,760 | |||
| Home Entertainment Software 1.5% | |||||
| 1,900,000 | Kingsoft Corp. Ltd. (China) | 789,510 | |||
| Industrial Machinery 1.1% | |||||
| 6,000 | Burckhardt Compression Holding AG (Switzerland) | 557,132 | |||
| Internet Software & Services 1.1% | |||||
| 20,000 | VistaPrint Ltd.* | 549,800 | |||
| Investment Banking & Brokerage 1.3% | |||||
| 210,000 | GFI Group, Inc. | 674,100 | |||
| IT Consulting & Other Services 4.6% | |||||
| 175,000 | China Information Security Technology, Inc.* (China) | 553,000 | |||
| 17,000 | NCI, Inc., Class A* | 442,000 | |||
| 100,000 | Rightnow Technologies, Inc.* | 757,000 | |||
| 50,000 | Telvent GIT S.A. (Spain) | 651,500 | |||
| 2,403,500 | |||||
| Marine Ports & Services 2.3% | |||||
| 70,000 | Aegean Marine Petroleum Network, Inc.††† | 1,172,500 | |||
| Oil & Gas Equipment & Services 1.9% | |||||
| 400,000 | Boots & Coots International Well Control, Inc.* | 500,000 | |||
| 150,000 | TETRA Technologies, Inc.* | 487,500 | |||
| 987,500 | |||||
| Oil & Gas Exploration & Production 0.7% | |||||
| 140,000 | Gran Tierra Energy, Inc.* (Colombia) | 351,400 | |||
| Other Diversified Financial Services 0.7% | |||||
| 99,445 | Hyde Park Acquisition Corp.* | 372,919 | |||
| Packaged Foods & Meats 2.3% | |||||
| 135,000 | Zhongpin, Inc.* ††† | 1,198,800 | |||
| Pharmaceuticals 1.1% | |||||
| 1,000,000 | China Shineway Pharmaceutical Group Ltd. (China) | 567,245 | |||
| Regional Banks 2.3% | |||||
| 2,000,000 | City Union Bank Ltd. (India) | 485,866 | |||
| 227,653 | First Bank of Delaware* | 232,206 | |||
| 25,000 | First of Long Island Corp. | 504,750 | |||
| 1,222,822 | |||||
65
Table of Contents
| WASATCH MICRO CAP VALUE FUND (WAMVX) — Schedule of Investments (continued) | ||
| Shares | Value | ||||
| Research & Consulting Services 3.2% | |||||
| 58,000 | Duff & Phelps Corp., Class A* | $ | 913,500 | ||
| 51,000 | Resources Connection, Inc.* | 769,080 | |||
| 1,682,580 | |||||
| Restaurants 2.3% | |||||
| 1,300,000 | Ajisen China Holdings Ltd. (China) | 648,043 | |||
| 170,000 | Brazil Fast Food Corp. (Brazil) | 552,500 | |||
| 1,200,543 | |||||
| Semiconductors 1.7% | |||||
| 192,700 | Microtune, Inc.* | 350,714 | |||
| 32,000 | Power Integrations, Inc. | 550,400 | |||
| 901,114 | |||||
| Specialized Finance 3.1% | |||||
| 900,000 | Bolsa Mexicana de Valores S.A., Series A* (Mexico) | 496,201 | |||
| 41,900 | Goldwater Bank, NA* *** † | 202,377 | |||
| 60,000 | IMAREX ASA* (Norway) | 382,751 | |||
| 170 | Osaka Securities Exchange Co. Ltd. (Japan) | 547,635 | |||
| 1,628,964 | |||||
| Specialty Stores 1.2% | |||||
| 83,310 | easyhome Ltd. (Canada) | 610,245 | |||
| Steel 2.6% | |||||
| 167,810 | Globe Specialty Metals, Inc.* (United Kingdom) | 461,477 | |||
| 49,000 | Haynes International, Inc.* | 873,180 | |||
| 1,334,657 | |||||
| Systems Software 2.4% | |||||
| 1,673,666 | Guestlogix, Inc.* (Canada) | 437,369 | |||
| 95,000 | Opnet Technologies, Inc.* ††† | 823,650 | |||
| 1,261,019 | |||||
| Trading Companies & Distributors 1.0% | |||||
| 16,000 | Watsco, Inc. | 544,480 | |||
| Trucking 1.1% | |||||
| 105,000 | Vitran Corp., Inc.* | 552,300 | |||
| Total Common Stocks (cost $56,742,689) | 43,194,694 | ||||
| PREFERRED STOCKS 1.0% | |||||
| Diversified Banks 1.0% | |||||
| 170,000 | Banco do Estado do Rio Grande do Sul S.A., Series B Pfd (Brazil) | 515,811 | |||
| Total Preferred Stocks (cost $385,120) | 515,811 | ||||
| WARRANTS 0.0% | |||||
| Biotechnology 0.0% | |||||
| 30,399 | NeurogesX, Inc., expiring 12/28/12* *** † | — | |||
| Health Care Distributors 0.0% | |||||
| 6,486 | Familymeds Group, Inc. expiring 11/30/09* *** † | — | |||
| Health Care Equipment 0.0% | |||||
| 58,140 | Cardica, Inc. expiring 6/7/12* *** † | — | |||
| Total Warrants (cost $13,102) | — | ||||
| Principal Amount | Value | ||||
| SHORT-TERM INVESTMENTS 13.6% | |||||
| Repurchase Agreement 13.6% | |||||
| $7,099,000 | Repurchase Agreement dated 3/31/09, 0.10% due 4/1/09 with Fixed Income Clearing Corporation collateralized by $4,970,000 of United States Treasury Bonds 8.125% due 8/15/19; value: $7,247,254; repurchase proceeds: $7,099,020††† (cost $7,099,000) | $ | 7,099,000 | ||
| Total Short-Term Investments (cost $7,099,000) | 7,099,000 | ||||
| Total Investments (cost $64,239,911) 97.6%^^ | 50,809,505 | ||||
| Other Assets less Liabilities 2.4% | 1,259,790 | ||||
| NET ASSETS 100.0% | $ | 52,069,295 | |||
| Number of Contracts | Value | ||||
| CALL OPTIONS WRITTEN 0.1% | |||||
| Health Care Supplies 0.1% | |||||
| 230 | ICU Medical, Inc., expiring 4/18/09, exercise price $30 | $ | 57,500 | ||
| Marine Ports & Services 0.0% | |||||
| 400 | Aegean Marine Petroleum Network, Inc., expiring 4/18/09, exercise price $20 | 12,000 | |||
| Total Call Options Written (premium $88,296) | 69,500 | ||||
| Shares | Value | ||||
| SECURITIES SOLD SHORT 1.1% | |||||
| Retail REITs 1.1% | |||||
| 18,000 | Tanger Factory Outlet Centers, Inc. (proceeds $462,825) | $ | 555,480 | ||
| Total Securities Sold Short (proceeds $462,825) | 555,480 | ||||
*Non-income producing.
***Security was fair valued under procedures adopted by the Board of Directors (see Note 2).
†Security purchased in a private placement transaction or under Rule 144A of the Securities Act of 1933 (see Note 9).
†††All or a portion of this security has been designated as collateral for call options written and short sales.
^^The aggregate amount of foreign securities fair valued pursuant to a systematic fair valuation model as a percent of net assets was 15.55%.
ADR American Depositary Receipt.
REIT Real Estate Investment Trust.
See notes to financial statements. | |||||
66
Table of Contents
| MARCH 31, 2009 (UNAUDITED) | ||
At March 31, 2009, Wasatch Micro Cap Value Fund’s investments, excluding short-term investments, written options, and securities sold short, were in the following countries:
| Country | % | ||
Australia | 1.0 | ||
Brazil | 2.4 | ||
Canada | 3.1 | ||
China | 10.8 | ||
Colombia | 0.8 | ||
Denmark | 1.2 | ||
Germany | 1.8 | ||
Hong Kong | 1.8 | ||
India | 1.1 | ||
Japan | 1.3 | ||
Mexico | 1.1 | ||
Norway | 0.9 | ||
Spain | 1.5 | ||
Switzerland | 1.3 | ||
United Kingdom | 1.1 | ||
United States | 68.8 | ||
TOTAL | 100.0 | % | |
67
Table of Contents
| WASATCH SMALL CAP GROWTH FUND (WAAEX) — Schedule of Investments | ||
| Shares | Value | ||||
| COMMON STOCKS 92.9% | |||||
| Aerospace & Defense 1.0% | |||||
| 194,850 | HEICO Corp. | $ | 4,734,855 | ||
| 24,700 | HEICO Corp., Class A | 509,561 | |||
| 5,244,416 | |||||
| Air Freight & Logistics 1.2% | |||||
| 14,377,902 | Aramex PJSC* (United Arab Emirates) | 4,176,823 | |||
| 4,320,092 | Goodpack Ltd. (Singapore) | 1,876,830 | |||
| 6,053,653 | |||||
| Apparel Retail 1.4% | |||||
| 757,424 | Zumiez, Inc.* | 7,347,013 | |||
| Apparel, Accessories & Luxury Goods 1.6% | |||||
| 4,731,640 | Ports Design Ltd. (Hong Kong) | 5,460,474 | |||
| 279,783 | Volcom, Inc.* | 2,713,895 | |||
| 8,174,369 | |||||
| Application Software 2.4% | |||||
| 62,615 | Concur Technologies, Inc.* | 1,201,582 | |||
| 76,162 | FactSet Research Systems, Inc. | 3,807,338 | |||
| 403,895 | Ultimate Software Group, Inc.* | 6,971,228 | |||
| 11,980,148 | |||||
| Asset Management & Custody Banks 1.5% | |||||
| 421,085 | Waddell & Reed Financial, Inc., Class A | 7,609,006 | |||
| Automotive Retail 3.5% | |||||
| 506,175 | O’Reilly Automotive, Inc.* ††† | 17,721,187 | |||
| Biotechnology 1.0% | |||||
| 17,896 | Myriad Genetics, Inc.* | 813,731 | |||
| 225,795 | Orexigen Therapeutics, Inc.* | 589,325 | |||
| 146,199 | Orexigen Therapeutics, Inc., Series C PIPE* † | 381,579 | |||
| 245,150 | Seattle Genetics, Inc.* | 2,417,179 | |||
| 205,700 | ZymoGenetics, Inc.* | 820,743 | |||
| 5,022,557 | |||||
| Communications Equipment 2.6% | |||||
| 317,245 | F5 Networks, Inc.* | 6,646,283 | |||
| 267,759 | Neutral Tandem, Inc.* | 6,589,549 | |||
| 13,235,832 | |||||
| Computer & Electronics Retail 1.3% | |||||
| 474,023 | hhgregg, Inc.* | 6,707,425 | |||
| Construction & Engineering 0.6% | |||||
| 11,305,282 | Midas Holdings Ltd. (China) | 3,119,698 | |||
| Construction & Farm Machinery & Heavy Trucks 1.0% | |||||
| 331,826 | Bucyrus International, Inc., Class A | 5,037,119 | |||
| Data Processing & Outsourced Services 3.0% | |||||
| 483,365 | NeuStar, Inc., Class A* | 8,096,364 | |||
| 1,119,960 | Wirecard AG* (Germany) | 7,400,609 | |||
| 15,496,973 | |||||
| Distributors 1.0% | |||||
| 340,105 | LKQ Corp.* | 4,853,298 | |||
| Diversified Banks 2.8% | |||||
| 204,917 | Bank of N.T. Butterfield & Son Ltd. (Bermuda) | 1,127,043 | |||
| 214,635 | HDFC Bank Ltd. ADR (India) | 13,077,711 | |||
| 14,204,754 | |||||
| Shares | Value | ||||
| Diversified Support Services 3.2% | |||||
| 543,576 | Copart, Inc.* | $ | 16,122,464 | ||
| Education Services 1.2% | |||||
| 114,066 | Capella Education Co.* | 6,045,498 | |||
| Environmental & Facilities Services 1.8% | |||||
| 443,140 | Tetra Tech, Inc.* | 9,031,193 | |||
| Footwear 0.2% | |||||
| 18,556,345 | China Hongxing Sports Ltd. (China) | 1,156,975 | |||
| Health Care Distributors 1.7% | |||||
| 295,456 | MWI Veterinary Supply, Inc.* | 8,414,587 | |||
| Health Care Equipment 4.1% | |||||
| 542,252 | Abaxis, Inc.* | 9,348,425 | |||
| 334,336 | Dexcom, Inc.* | 1,384,151 | |||
| 471,623 | VNUS Medical Technologies, Inc.* | 10,031,421 | |||
| 20,763,997 | |||||
| Health Care Services 2.7% | |||||
| 414,965 | Bio-Reference Laboratories, Inc.* | 8,676,918 | |||
| 174,240 | MEDNAX, Inc.* | 5,134,853 | |||
| 13,811,771 | |||||
| Integrated Telecommunication Services 1.3% | |||||
| 346,675 | Cbeyond, Inc.* | 6,527,890 | |||
| Internet Software & Services 4.6% | |||||
| 128,655 | Bankrate, Inc.* | 3,209,942 | |||
| 582,055 | DealerTrack Holdings, Inc.* | 7,624,921 | |||
| 943,390 | LoopNet, Inc.* | 5,735,811 | |||
| 246,255 | VistaPrint Ltd.* | 6,769,550 | |||
| 23,340,224 | |||||
| Investment Banking & Brokerage 0.7% | |||||
| 343,360 | optionsXpress Holdings, Inc. | 3,904,003 | |||
| IT Consulting & Other Services 2.4% | |||||
| 600,278 | Cognizant Technology Solutions Corp., Class A* | 12,479,780 | |||
| Leisure Facilities 0.9% | |||||
| 377,125 | Life Time Fitness, Inc.* | 4,736,690 | |||
| Life Sciences Tools & Services 2.9% | |||||
| 183,665 | ICON plc* ADR (Ireland) | 2,966,189 | |||
| 253,145 | Kendle International, Inc.* | 5,305,919 | |||
| 115,284 | Techne Corp. | 6,307,188 | |||
| 14,579,296 | |||||
| Mortgage REITs 2.2% | |||||
| 742,618 | Redwood Trust, Inc. | 11,399,186 | |||
| Oil & Gas Equipment & Services 4.0% | |||||
| 346,090 | Dril-Quip, Inc.* | 10,624,963 | |||
| 790,890 | Pason Systems, Inc. (Canada) | 5,962,364 | |||
| 455,035 | TGS-NOPEC Geophysical Co. ASA* (Norway) | 3,527,786 | |||
| 20,115,113 | |||||
| Oil & Gas Exploration & Production 0.5% | |||||
| 413,670 | GMX Resources, Inc.* | 2,688,855 | |||
| Other Diversified Financial Services 0.4% | |||||
| 2,661,038 | Count Financial Ltd. (Australia) | 1,912,869 | |||
68
Table of Contents
| MARCH 31, 2009 (UNAUDITED) | ||
| Shares | Value | ||||
| Pharmaceuticals 1.1% | |||||
| 656,923 | Alexza Pharmaceuticals, Inc.* | $ | 1,451,800 | ||
| 680,112 | Dechra Pharmaceuticals plc (United Kingdom) | 4,059,472 | |||
| 5,511,272 | |||||
| Regional Banks 1.1% | |||||
| 164,505 | City National Corp. | 5,555,334 | |||
| Research & Consulting Services 7.0% | |||||
| 294,323 | CRA International, Inc.* | 5,556,818 | |||
| 1,399 | Exponent, Inc.* | 35,437 | |||
| 1,346,699 | Resources Connection, Inc.* ††† | 20,308,221 | |||
| 541,174 | Stantec, Inc.* (Canada) | 9,849,367 | |||
| 35,749,843 | |||||
| Restaurants 1.8% | |||||
| 412,216 | Peet’s Coffee & Tea, Inc.* | 8,912,110 | |||
| Semiconductors 7.4% | |||||
| 267,565 | Hittite Microwave Corp.* | 8,348,028 | |||
| 11,853 | Melexis N.V. (Belgium) | 55,068 | |||
| 219,269 | Netlogic Microsystems, Inc.* | 6,025,512 | |||
| 1,509,480 | O2Micro International Ltd. ADR* (Hong Kong) | 5,162,422 | |||
| 652,291 | Power Integrations, Inc. | 11,219,405 | |||
| 258,135 | Silicon Laboratories, Inc.* | 6,814,764 | |||
| 37,625,199 | |||||
| Specialized Finance 2.6% | |||||
| 768,645 | MSCI, Inc., Class A* | 12,997,787 | |||
| Specialty Stores 3.1% | |||||
| 816,060 | Hibbett Sports, Inc.* | 15,684,673 | |||
| Systems Software 1.3% | |||||
| 570,432 | NetSuite, Inc.* | 6,423,064 | |||
| Trading Companies & Distributors 3.0% | |||||
| 498,585 | MSC Industrial Direct Co., Inc., Class A | 15,491,036 | |||
| Trucking 3.8% | |||||
| 115,170 | J.B. Hunt Transport Services, Inc. | 2,776,749 | |||
| 1,107,172 | Knight Transportation, Inc.††† | 16,784,727 | |||
| 19,561,476 | |||||
| Total Common Stocks (cost $549,754,476) | 472,349,633 | ||||
| PREFERRED STOCKS 1.0% | |||||
| Biotechnology 0.3% | |||||
| 677,966 | Nanosys, Inc., Series D Pfd.* *** † | 1,444,068 | |||
| Health Care Equipment 0.2% | |||||
| 750,000 | Orqis Medical Corp., Series D Pfd.* *** † | 555,000 | |||
| 1,620,220 | Zonare Medical Systems, Inc., Series E Pfd.* *** † | 291,640 | |||
| 846,640 | |||||
| Health Care Services 0.1% | |||||
| 516,161 | Bravo Health, Inc., Series G Pfd.* *** † | 851,666 | |||
| 362,782 | TargetRX, Inc., Series D Pfd.* *** † | 3,628 | |||
| 855,294 | |||||
| Internet Software & Services 0.0% | |||||
| 404,517 | Incipient, Inc., Series D Pfd.* *** † | 4,045 | |||
| Life Sciences Tools & Services 0.4% | |||||
| 178,571 | Fluidigm Corp., Series E Pfd.* *** † | 1,932,138 | |||
| Total Preferred Stocks (cost $10,401,298) | 5,082,184 | ||||
| Shares | Value | ||||
| LIMITED PARTNERSHIP INTEREST 0.5% | |||||
| Other 0.5% | |||||
| Montagu Newhall Global Partners II-B, L.P.* *** † | $ | 2,387,406 | |||
| Montagu Newhall Global Partners III-B, L.P.* *** † | 500,603 | ||||
| 2,888,009 | |||||
| Total Limited Partnership Interest (cost $4,683,853) | 2,888,009 | ||||
| RIGHTS 0.0% | |||||
| Life Sciences Tools & Services 0.0% | |||||
| 208,525 | Valera Pharmaceuticals, Inc. Ureteral Stent CSR* *** † | — | |||
| Pharmaceuticals 0.0% | |||||
| 208,525 | Valera Pharmaceuticals, Inc. VP003 (Octreotide Implant) CSR* *** † | — | |||
| Total Rights (cost $406,537) | — | ||||
| WARRANTS 0.0% | |||||
| Health Care Equipment 0.0% | |||||
| 243,033 | Zonare Medical Systems, Inc. expiring 6/30/11* *** † | — | |||
| Total Warrants (cost $0) | — | ||||
| Principal Amount | Value | ||||
| SHORT-TERM INVESTMENTS 2.6% | |||||
| Repurchase Agreement 2.6% | |||||
| $13,020,000 | Repurchase Agreement dated 3/31/09, 0.10% due 4/1/09 with Fixed Income Clearing Corporation collateralized by $6,590,000 of United States Treasury Bonds 8.00% due 11/15/21; value $9,925,199; United States Treasury Bonds 6.25% due 8/15/23; value $1,353,103; United States Treasury Bonds 9.50% due 11/15/24; repurchase proceeds: $13,020,036††† (cost $13,020,000) | $ | 13,020,000 | ||
| Total Short-Term Investments (cost $13,020,000) | 13,020,000 | ||||
| Total Investments (cost $578,266,164) 97.0%^^ | 493,339,826 | ||||
| Other Assets less Liabilities 3.0% | 15,123,226 | ||||
| NET ASSETS 100.0% | $ | 508,463,052 | |||
*Non-income producing.
***Security was fair valued under procedures adopted by the Board of Directors (see Note 2).
†Security purchased in a private placement transaction or under Rule 144A of the Securities Act of 1933, or received through a corporate action (see Note 9).
†††All or a portion of this security has been designated as collateral for future commitments (see Note 10).
^^The aggregate amount of foreign securities fair valued pursuant to a systematic fair valuation model as a percent of net assets was 6.44%.
ADR American Depositary Receipt.
REIT Real Estate Investment Trust.
See notes to financial statements. | |||||
69
Table of Contents
| WASATCH SMALL CAP GROWTH FUND (WAAEX) — Schedule of Investments (continued) | ||
At March 31, 2009, Wasatch Small Cap Growth Fund’s investments, excluding short-term investments, were in the following countries:
| Country | % | ||
Australia | 0.4 | ||
Belgium | <0.1 | ||
Bermuda | 0.2 | ||
Canada | 3.3 | ||
China | 0.9 | ||
Germany | 1.6 | ||
Hong Kong | 2.2 | ||
India | 2.7 | ||
Ireland | 0.6 | ||
Norway | 0.7 | ||
Singapore | 0.4 | ||
United Arab Emirates | 0.9 | ||
United Kingdom | 0.9 | ||
United States | 85.2 | ||
TOTAL | 100.0 | % | |
70
Table of Contents
| WASATCH SMALL CAP VALUE FUND (WMCVX) — Schedule of Investments | MARCH 31, 2009 (UNAUDITED) | |
| Shares | Value | ||||
| COMMON STOCKS 92.3% | |||||
| Aerospace & Defense 2.4% | |||||
| 175,915 | HEICO Corp., Class A | $ | 3,629,127 | ||
| Air Freight & Logistics 2.0% | |||||
| 7,185,696 | Goodpack Ltd. (Singapore) | 3,121,769 | |||
| Apparel Retail 1.3% | |||||
| 205,734 | Zumiez, Inc.* | 1,995,620 | |||
| Apparel, Accessories & Luxury Goods 1.1% | |||||
| 166,460 | Volcom, Inc.* | 1,614,662 | |||
| Asset Management & Custody Banks 3.6% | |||||
| 230,695 | SEI Investments Co. | 2,816,786 | |||
| 471,940 | Solar Capital, LLC* ** *** † | 2,704,216 | |||
| 5,521,002 | |||||
| Automotive Retail 1.4% | |||||
| 62,420 | O’Reilly Automotive, Inc.* | 2,185,324 | |||
| Coal & Consumable Fuels 1.0% | |||||
| 86,380 | Alpha Natural Resources, Inc.* | 1,533,245 | |||
| Communications Equipment 0.8% | |||||
| 104,085 | Plantronics, Inc. | 1,256,306 | |||
| Construction & Engineering 1.7% | |||||
| 169,970 | MYR Group, Inc.* | 2,592,043 | |||
| Construction & Farm Machinery & Heavy Trucks 1.2% | |||||
| 124,460 | Bucyrus International, Inc., Class A | 1,889,303 | |||
| Consumer Finance 4.3% | |||||
| 351,870 | Dollar Financial Corp.* | 3,349,802 | |||
| 532,416 | United PanAm Financial Corp.* | 772,003 | |||
| 146,325 | World Acceptance Corp.* | 2,502,158 | |||
| 6,623,963 | |||||
| Data Processing & Outsourced Services 2.5% | |||||
| 230,455 | NeuStar, Inc., Class A* | 3,860,121 | |||
| Distributors 1.5% | |||||
| 157,455 | LKQ Corp.* | 2,246,883 | |||
| Diversified Banks 1.1% | |||||
| 301,294 | Bank of N.T. Butterfield & Son Ltd. (Bermuda) | 1,657,117 | |||
| Diversified Capital Markets 1.0% | |||||
| 323,115 | JMP Group, Inc. | 1,554,183 | |||
| Diversified REITs 0.0% | |||||
| 60,000 | Star Asia Financial Ltd.* † | 60,000 | |||
| Diversified Support Services 3.5% | |||||
| 158,715 | Copart, Inc.* | 4,707,487 | |||
| 252,624 | LPS Brasil — Consultoria de Imoveis S.A. (Brazil) | 630,532 | |||
| 5,338,019 | |||||
| Education Services 0.5% | |||||
| 179,780 | Kroton Educational S.A.* ** (Brazil) | 725,753 | |||
| Electrical Components & Equipment 1.2% | |||||
| 5,625,118 | Wasion Group Holdings Ltd. (Hong Kong) | 1,851,817 | |||
| Electronic Manufacturing Services 0.9% | |||||
| 237,049 | TTM Technologies, Inc.* | 1,374,884 | |||
| Shares | Value | ||||
| Footwear 0.5% | |||||
| 11,542,115 | China Hongxing Sports Ltd. (China) | $ | 719,643 | ||
| Health Care Equipment 1.4% | |||||
| 134,810 | Invacare Corp. | 2,161,004 | |||
| Health Care Facilities 3.1% | |||||
| 74,389 | AmSurg Corp.* | 1,179,066 | |||
| 223,747 | Emeritus Corp.* | 1,467,780 | |||
| 94,795 | VCA Antech, Inc.* | 2,137,627 | |||
| 4,784,473 | |||||
| Health Care Services 3.1% | |||||
| 158,939 | CorVel Corp.* | 3,213,746 | |||
| 52,310 | MEDNAX, Inc.* | 1,541,576 | |||
| 4,755,322 | |||||
| Health Care Supplies 1.4% | |||||
| 66,132 | ICU Medical, Inc.* | 2,124,160 | |||
| Home Entertainment Software 0.9% | |||||
| 34,270 | Shanda Interactive Entertainment Ltd. ADR* (China) | 1,354,693 | |||
| Industrial Machinery 1.5% | |||||
| 108,335 | IDEX Corp. | 2,369,286 | |||
| Internet Software & Services 2.2% | |||||
| 143,064 | DealerTrack Holdings, Inc.* | 1,874,139 | |||
| 54,585 | NetEase.com, Inc. ADR* (China) | 1,465,607 | |||
| 3,339,746 | |||||
| Investment Banking & Brokerage 1.2% | |||||
| 161,185 | optionsXpress Holdings, Inc. | 1,832,673 | |||
| IT Consulting & Other Services 1.9% | |||||
| 137,115 | Cognizant Technology Solutions Corp., Class A* | 2,850,621 | |||
| Life Sciences Tools & Services 1.2% | |||||
| 50,710 | Covance, Inc.* | 1,806,797 | |||
| Marine Ports & Services 1.6% | |||||
| 149,870 | Aegean Marine Petroleum Network, Inc. | 2,510,322 | |||
| Mortgage REITs 6.3% | |||||
| 104,950 | Annaly Capital Management, Inc. | 1,455,656 | |||
| 681,590 | MFA Mortgage Investments, Inc. | 4,007,749 | |||
| 270,425 | Redwood Trust, Inc. | 4,151,024 | |||
| 9,614,429 | |||||
| Office Services & Supplies 0.7% | |||||
| 295,464 | American Reprographics Co.* | 1,045,943 | |||
| Oil & Gas Equipment & Services 1.1% | |||||
| 528,451 | TETRA Technologies, Inc.* | 1,717,466 | |||
| Oil & Gas Exploration & Production 1.2% | |||||
| 95,050 | Petrohawk Energy Corp.* | 1,827,812 | |||
| Oil & Gas Refining & Marketing 0.9% | |||||
| 45,355 | World Fuel Services Corp. | 1,434,579 | |||
| Packaged Foods & Meats 1.4% | |||||
| 241,005 | Zhongpin, Inc.* | 2,140,124 | |||
| Personal Products 3.6% | |||||
| 153,650 | Herbalife Ltd. | 2,301,677 | |||
| 227,260 | NBTY, Inc.* | 3,199,821 | |||
| 5,501,498 | |||||
| Property & Casualty Insurance 0.8% | |||||
| 51,950 | Tower Group, Inc. | 1,279,528 | |||
71
Table of Contents
| WASATCH SMALL CAP VALUE FUND (WMCVX) — Schedule of Investments (continued) | ||
| Shares | Value | ||||
| Regional Banks 5.5% | |||||
| 393,332 | Boston Private Financial Holdings, Inc. | $ | 1,380,595 | ||
| 79,010 | City National Corp. | 2,668,168 | |||
| 231,445 | Commonwealth Bankshares, Inc. | 1,157,225 | |||
| 201,713 | Washington Trust Bancorp PIPE* † | 3,277,836 | |||
| 8,483,824 | |||||
| Semiconductors 4.2% | |||||
| 514,336 | Pericom Semiconductor Corp.* | 3,759,796 | |||
| 69,632 | Power Integrations, Inc. | 1,197,671 | |||
| 67,412 | Supertex, Inc.* | 1,557,217 | |||
| 6,514,684 | |||||
| Specialized Finance 1.1% | |||||
| 104,315 | MSCI, Inc., Class A* | 1,763,967 | |||
| Steel 1.6% | |||||
| 343,825 | Globe Specialty Metals, Inc.* (United Kingdom) | 945,519 | |||
| 84,855 | Haynes International, Inc.* | 1,512,116 | |||
| 2,457,635 | |||||
| Systems Software 2.0% | |||||
| 140,455 | NetSuite, Inc.* | 1,581,523 | |||
| 174,365 | Opnet Technologies, Inc.* | 1,511,745 | |||
| 3,093,268 | |||||
| Trading Companies & Distributors 4.3% | |||||
| 105,520 | MSC Industrial Direct Co., Inc., Class A | 3,278,506 | |||
| 102,407 | Rush Enterprises, Inc., Class A* | 913,470 | |||
| 108,920 | Rush Enterprises, Inc., Class B* | 852,844 | |||
| 47,260 | Watsco, Inc. | 1,608,258 | |||
| 6,653,078 | |||||
| Trucking 4.6% | |||||
| 74,670 | J.B. Hunt Transport Services, Inc. | 1,800,294 | |||
| 97,391 | Old Dominion Freight Line, Inc.* | 2,287,714 | |||
| 561,350 | Vitran Corp., Inc.* | 2,952,701 | |||
| 7,040,709 | |||||
| Total Common Stocks (cost $215,797,365) | 141,808,425 | ||||
| Principal Amount | Value | |||||
| SHORT-TERM INVESTMENTS 8.2% | ||||||
| Repurchase Agreement 8.2% | ||||||
| $12,592,000 | Repurchase Agreement dated 3/31/09, 0.10% due 4/1/09 with Fixed Income Clearing Corporation collateralized by $8,810,000 of United States Treasury Bonds 8.125% due 8/15/19; value: $12,846,742; repurchase proceeds: $12,592,035 (cost $12,592,000) | $ | 12,592,000 | |||
| Total Short-Term Investments (cost $12,592,000) | 12,592,000 | |||||
| Total Investments (cost $228,389,365) 100.5%^^ | 154,400,425 | |||||
| Liabilities less Other Assets (0.5)% | (701,577 | ) | ||||
| NET ASSETS 100.0% | $ | 153,698,848 | ||||
*Non-income producing.
**Common units.
***Security was fair valued under procedures adopted by the Board of Directors (see Note 2).
†Security purchased in a private placement transaction or under Rule 144A of the Securities Act of 1933 (see Note 9).
^^The aggregate amount of foreign securities fair valued pursuant to a systematic fair valuation model as a percent of net assets was 3.70%.
ADR American Depositary Receipt.
PIPE Private Investment in a Public Equity.
REIT Real Estate Investment Trust.
See notes to financial statements. |
| |||||
At March 31, 2009, Wasatch Small Cap Value Fund’s investments, excluding short-term investments, were in the following countries:
| Country | % | ||
Bermuda | 1.1 | ||
Brazil | 1.0 | ||
China | 2.5 | ||
Hong Kong | 1.3 | ||
Singapore | 2.2 | ||
United Kingdom | 0.7 | ||
United States | 91.2 | ||
TOTAL | 100.0 | % | |
72
Table of Contents
| WASATCH STRATEGIC INCOME FUND (WASIX) — Schedule of Investments | MARCH 31, 2009 (UNAUDITED) | |
| Shares | Value | ||||
| COMMON STOCKS 86.6% | |||||
| Asset Management & Custody Banks 4.3% | |||||
| 52,732 | Apollo Investment Corp. | $ | 183,507 | ||
| 27,641 | Ares Capital Corp. | 133,783 | |||
| 14,115 | SEI Investments Co. | 172,344 | |||
| 19,600 | Solar Capital, LLC* ** *** † | 112,308 | |||
| 601,942 | |||||
| Construction & Farm Machinery & Heavy Trucks 1.8% | |||||
| 11,630 | Joy Global, Inc. | 247,719 | |||
| Consumer Finance 1.7% | |||||
| 19,079 | Capital One Financial Corp. | 233,527 | |||
| Data Processing & Outsourced Services 6.0% | |||||
| 21,660 | Paychex, Inc.††† | 556,012 | |||
| 23,600 | Redecard S.A. (Brazil) | 287,349 | |||
| 843,361 | |||||
| Diversified Banks 4.9% | |||||
| 14,695 | Itau Unibanco Banco Multiplo SA* ADR (Brazil) | 159,882 | |||
| 74,844 | Bank of East Asia Ltd. (Hong Kong) | 144,815 | |||
| 15,802 | Bank of N.T. Butterfield & Son Ltd. (Bermuda) | 86,911 | |||
| 4,885 | HDFC Bank Ltd. ADR (India) | 297,643 | |||
| 689,251 | |||||
| Diversified REITs 0.4% | |||||
| 32,005 | CapitalSource, Inc.††† | 39,046 | |||
| 17,279 | Star Asia Financial Ltd.* † | 17,279 | |||
| 56,325 | |||||
| Diversified Support Services 3.4% | |||||
| 24,843 | LPS Brasil — Consultoria de Imoveis S.A. (Brazil) | 62,007 | |||
| 17,183 | McGrath Rentcorp | 270,804 | |||
| 7,585 | Ritchie Bros. Auctioneers, Inc. | 141,005 | |||
| 473,816 | |||||
| Fertilizers & Agricultural Chemicals 0.9% | |||||
| 1,600 | Monsanto Co. | 132,960 | |||
| Gold 0.0% | |||||
| 200,000 | Redcorp Ventures Ltd.* (Canada) | 1,583 | |||
| 299 | Redcorp Ventures Ltd.* *** † (Canada) | — | |||
| 95,680 | Redcorp Ventures Ltd.* † (Canada) | 758 | |||
| 2,341 | |||||
| Home Improvement Retail 2.1% | |||||
| 12,700 | Home Depot, Inc. | 299,212 | |||
| Household Products 1.2% | |||||
| 3,565 | Procter & Gamble Co. | 167,876 | |||
| Hypermarkets & Super Centers 2.0% | |||||
| 5,255 | Wal-Mart Stores, Inc. | 273,785 | |||
| Industrial Conglomerates 2.0% | |||||
| 27,535 | General Electric Co. | 278,379 | |||
| Industrial Machinery 1.8% | |||||
| 50,700 | Weg S.A. (Brazil) | 257,049 | |||
| Leisure Products 3.8% | |||||
| 39,905 | Pool Corp.††† | 534,727 | |||
| Life Sciences Tools & Services 2.1% | |||||
| 6,800 | Eurofins Scientific (France) | 288,368 | |||
| Shares | Value | ||||
| Mortgage REITs 20.9% | |||||
| 24,045 | Annaly Capital Management, Inc.††† | $ | 333,504 | ||
| 61,990 | Capstead Mortgage Corp. | 665,773 | |||
| 114,700 | MFA Mortgage Investments, Inc. | 674,436 | |||
| 81,990 | Redwood Trust, Inc.††† | 1,258,546 | |||
| 2,932,259 | |||||
| Oil & Gas Exploration & Production 4.4% | |||||
| 17,705 | Chesapeake Energy Corp. | 302,047 | |||
| 7,800 | Range Resources Corp. | 321,048 | |||
| 623,095 | |||||
| Personal Products 2.0% | |||||
| 18,250 | Herbalife Ltd. | 273,385 | |||
| Pharmaceuticals 3.4% | |||||
| 4,095 | Johnson & Johnson | 215,397 | |||
| 5,835 | Teva Pharmaceutical Industries Ltd. ADR (Israel) | 262,867 | |||
| 478,264 | |||||
| Railroads 1.4% | |||||
| 15,520 | Kansas City Southern* | 197,259 | |||
| Semiconductors 7.6% | |||||
| 10,270 | Linear Technology Corp. | 236,005 | |||
| 14,715 | Microchip Technology, Inc. | 311,811 | |||
| 26,010 | Taiwan Semiconductor Manufacturing Co. Ltd. ADR (Taiwan) | 232,789 | |||
| 14,675 | Xilinx, Inc. | 281,173 | |||
| 1,061,778 | |||||
| Steel 0.2% | |||||
| 10,920 | Globe Specialty Metals, Inc.* (United Kingdom) | 30,030 | |||
| Trading Companies & Distributors 4.3% | |||||
| 13,000 | GATX Corp. | 262,990 | |||
| 5,000 | MSC Industrial Direct Co., Inc., Class A | 155,350 | |||
| 2,530 | W.W. Grainger, Inc. | 177,555 | |||
| 595,895 | |||||
| Water Utilities 2.1% | |||||
| 26,490 | Companhia de Saneamento Basico do Estado de Sao Paulo (Brazil) | 296,665 | |||
| Wireless Telecommunication Services 1.9% | |||||
| 9,845 | America Movil S.A.B. de C.V., Series L ADR (Mexico) | 266,603 | |||
| Total Common Stocks (cost $18,876,838) | 12,135,871 | ||||
| PREFERRED STOCKS 0.3% | |||||
| Diversified REITs 0.3% | |||||
| 15,745 | Gramercy Capital Corp., Series A Pfd., 8.125%* ** REIT | 41,724 | |||
| Total Preferred Stocks (cost $291,098) | 41,724 | ||||
| EXCHANGE TRADED FUNDS 0.9% | |||||
| Asset Management & Custody Banks 0.9% | |||||
| 6,035 | Direxionshares Financial Bear 3X Shares ETF* | 125,468 | |||
| Total Exchange Traded Funds (cost $139,179) | 125,468 | ||||
73
Table of Contents
| WASATCH STRATEGIC INCOME FUND (WASIX) — Schedule of Investments (continued) | ||
| Shares | Value | ||||
| LIMITED PARTNERSHIP INTEREST 1.8% | |||||
| Oil & Gas Storage & Transportation 1.8% | |||||
| 14,305 | Magellan Midstream Holdings L.P.** | $ | 250,337 | ||
| Total Limited Partnership Interest (cost $221,100) | 250,337 | ||||
| Principal Amount | Value | ||||
| CORPORATE BONDS 2.5% | |||||
| Gold 0.4% | |||||
| $299,000 | Redcorp Ventures Ltd., 13.00%, 7/11/12*** † (Canada) | $ | 52,091 | ||
| Integrated Telecommunication Services 2.1% | |||||
| 500,000 | Broadview Networks Holdings, Inc., 11.375%, 9/1/12 | 290,000 | |||
| Total Corporate Bonds (cost $782,863) | 342,091 | ||||
| Shares | Value | ||||
| WARRANTS 0.0% | |||||
| Gold 0.0% | |||||
| 209,599 | Redcorp Ventures Ltd. expiring 11/11/21* *** † (Canada) | $ | — | ||
| Total Warrants (cost $0) | — | ||||
| Principal Amount | Value | ||||
| SHORT-TERM INVESTMENTS 5.9% | |||||
| Repurchase Agreement 5.9% | |||||
| $829,000 | Repurchase Agreement dated 3/31/09, 0.10% due 4/1/09 with Fixed Income Clearing Corporation collateralized by $580,000 of United States Treasury Bonds 8.125% due 8/15/19; value: $845,756; repurchase proceeds: $829,002††† (cost $829,000) | $ | 829,000 | ||
| Total Short-Term Investments (cost $829,000) | 829,000 | ||||
| Total Investments (cost $21,140,078) 98.0%^^ | 13,724,491 | ||||
| Other Assets less Liabilities 2.0% | 281,879 | ||||
| NET ASSETS 100.0% | $ | 14,006,370 | |||
| Shares | Value | ||||
| SECURITIES SOLD SHORT | |||||
| Mortgage REITs | |||||
| 6,000 | NovaStar Financial, Inc.* | $ | 3,600 | ||
| Regional Banks | |||||
| 3,310 | Heartland Financial USA, Inc. | 44,817 | |||
| Thrifts & Mortgage Finance | |||||
| 8,322 | First Federal Bancshares of Arkansas, Inc. | 39,113 | |||
| Total Securities Sold Short (proceeds $460,105) | 87,531 | ||||
*Non-income producing.
**Common units.
***Security was fair valued under procedures adopted by the Board of Directors (see Note 2).
†Security purchased in a private placement transaction or under Rule 144A of the Securities Act of 1933, or received through a corporate action (see Note 9).
†††All or a portion of this security has been designated as collateral for short sales.
^^The aggregate amount of foreign securities fair valued pursuant to a systematic fair valuation model as a percent of net assets was 3.09%.
ADR American Depositary Receipt.
REIT Real Estate Investment Trust.
See notes to financial statements. | |||||
74
Table of Contents
| MARCH 31, 2009 (UNAUDITED) | ||
At March 31, 2009, Wasatch Strategic Income Fund’s investments, excluding short-term investments and securities sold short, were in the following countries:
| Country | % | ||
Bermuda | 0.7 | ||
Brazil | 8.3 | ||
Canada | 0.4 | ||
France | 2.2 | ||
Hong Kong | 1.1 | ||
India | 2.3 | ||
Israel | 2.0 | ||
Mexico | 2.1 | ||
Taiwan | 1.8 | ||
United Kingdom | 0.2 | ||
United States | 78.9 | ||
TOTAL | 100.0 | % | |
75
Table of Contents
| WASATCH ULTRA GROWTH FUND (WAMCX) — Schedule of Investments | ||
| Shares | Value | ||||
| COMMON STOCKS 86.8% | |||||
| Apparel Retail 1.4% | |||||
| 117,805 | Zumiez, Inc.* | $ | 1,142,708 | ||
| Apparel, Accessories & Luxury Goods 1.1% | |||||
| 784,000 | Ports Design Ltd. (Hong Kong) | 904,763 | |||
| Application Software 1.2% | |||||
| 20,845 | FactSet Research Systems, Inc. | 1,042,042 | |||
| Asset Management & Custody Banks 2.6% | |||||
| 55,398 | Westwood Holdings Group, Inc. | 2,165,508 | |||
| Automotive Retail 2.9% | |||||
| 70,560 | O’Reilly Automotive, Inc.* | 2,470,306 | |||
| Biotechnology 0.1% | |||||
| 46,960 | Orexigen Therapeutics, Inc.* | 122,566 | |||
| Communications Equipment 3.9% | |||||
| 95,315 | F5 Networks, Inc.* | 1,996,849 | |||
| 97,565 | Riverbed Technology, Inc.* | 1,276,150 | |||
| 3,272,999 | |||||
| Construction & Engineering 1.6% | |||||
| 1,164,000 | Midas Holdings Ltd. (China) | 321,206 | |||
| 69,970 | MYR Group, Inc.* | 1,067,043 | |||
| 1,388,249 | |||||
| Construction & Farm Machinery & Heavy Trucks 2.0% | |||||
| 108,382 | Bucyrus International, Inc., Class A††† | 1,645,239 | |||
| Data Processing & Outsourced Services 1.3% | |||||
| 167,175 | Wirecard AG* (Germany) | 1,104,679 | |||
| Distributors 2.5% | |||||
| 145,370 | LKQ Corp.* | 2,074,430 | |||
| Diversified Banks 3.0% | |||||
| 77,050 | HDFC Bank Ltd. (India) | 1,490,862 | |||
| 17,325 | HDFC Bank Ltd. ADR (India) | 1,055,612 | |||
| 2,546,474 | |||||
| Diversified Support Services 2.0% | |||||
| 57,140 | Copart, Inc.* | 1,694,772 | |||
| Education Services 0.9% | |||||
| 15,060 | Capella Education Co.* | 798,180 | |||
| Environmental & Facilities Services 2.4% | |||||
| 77,715 | Heritage-Crystal Clean, Inc.* | 579,754 | |||
| 57,950 | Team, Inc.* | 679,174 | |||
| 36,600 | Tetra Tech, Inc.* | 745,908 | |||
| 2,004,836 | |||||
| Footwear 0.2% | |||||
| 3,375,860 | China Hongxing Sports Ltd. (China) | 210,483 | |||
| General Merchandise Stores 2.0% | |||||
| 37,040 | Dollar Tree, Inc.* | 1,650,132 | |||
| Health Care Equipment 7.0% | |||||
| 77,035 | Abaxis, Inc.* | 1,328,083 | |||
| 203,255 | Cardica, Inc.* | 591,472 | |||
| 56,445 | Dexcom, Inc.* | 233,682 | |||
| 35,196 | NuVasive, Inc.* | 1,104,451 | |||
| 123,208 | VNUS Medical Technologies, Inc.* | 2,620,634 | |||
| 5,878,322 | |||||
| Shares | Value | ||||
| Health Care Facilities 3.1% | |||||
| 75,970 | Emeritus Corp.* | $ | 498,363 | ||
| 92,715 | VCA Antech, Inc.* | 2,090,723 | |||
| 2,589,086 | |||||
| Health Care Services 1.4% | |||||
| 55,000 | Bio-Reference Laboratories, Inc.* | 1,150,050 | |||
| Health Care Supplies 2.5% | |||||
| 29,200 | ICU Medical, Inc.* | 937,904 | |||
| 635,000 | Shandong Weigao Group Medical Polymer Co. Ltd., Class H (China) | 1,130,329 | |||
| 2,068,233 | |||||
| Internet Software & Services 2.2% | |||||
| 81,600 | DealerTrack Holdings, Inc.* | 1,068,960 | |||
| 28,455 | VistaPrint Ltd.* | 782,228 | |||
| 1,851,188 | |||||
| IT Consulting & Other Services 4.0% | |||||
| 153,306 | Cognizant Technology Solutions Corp., Class A* | 3,187,232 | |||
| 138,110 | Rolta India Ltd. (India) | 159,085 | |||
| 3,346,317 | |||||
| Leisure Facilities 1.0% | |||||
| 69,800 | Life Time Fitness, Inc.* | 876,688 | |||
| Life Sciences Tools & Services 2.7% | |||||
| 29,868 | ICON plc ADR* (Ireland) | 482,368 | |||
| 42,260 | Kendle International, Inc.* | 885,770 | |||
| 15,825 | Techne Corp. | 865,786 | |||
| 2,233,924 | |||||
| Marine Ports & Services 0.5% | |||||
| 148,471 | CAI International, Inc.* ††† | 420,173 | |||
| Oil & Gas Equipment & Services 2.7% | |||||
| 37,470 | Dril-Quip, Inc.* | 1,150,329 | |||
| 143,895 | Pason Systems, Inc. (Canada) | 1,084,796 | |||
| 2,235,125 | |||||
| Oil & Gas Exploration & Production 1.6% | |||||
| 28,955 | GMX Resources, Inc.* | 188,207 | |||
| 61,820 | Petrohawk Energy Corp.* | 1,188,799 | |||
| 1,377,006 | |||||
| Personal Products 0.7% | |||||
| 38,445 | Herbalife Ltd. | 575,906 | |||
| 50,403 | Ophthonix, Inc.* *** † | 504 | |||
| 576,410 | |||||
| Pharmaceuticals 0.1% | |||||
| 57,562 | Alexza Pharmaceuticals, Inc.* | 127,212 | |||
| Publishing 1.2% | |||||
| 28,361 | Morningstar, Inc.* | 968,528 | |||
| Research & Consulting Services 2.8% | |||||
| 77,150 | Resources Connection, Inc.* | 1,163,422 | |||
| 63,000 | Stantec, Inc.* (Canada) | 1,146,600 | |||
| 2,310,022 | |||||
| Restaurants 1.0% | |||||
| 37,580 | Peet’s Coffee & Tea, Inc.* | 812,480 | |||
| Semiconductor Equipment 1.6% | |||||
| 100,957 | Tessera Technologies, Inc.* | 1,349,795 | |||
76
Table of Contents
| MARCH 31, 2009 (UNAUDITED) | ||
| Shares | Value | ||||
| Semiconductors 10.7% | |||||
| 31,785 | Hittite Microwave Corp.* | $ | 991,692 | ||
| 92,280 | Netlogic Microsystems, Inc.* | 2,535,854 | |||
| 465,810 | O2Micro International Ltd. ADR* (Hong Kong) | 1,593,070 | |||
| 115,240 | Power Integrations, Inc. | 1,982,128 | |||
| 72,035 | Silicon Laboratories, Inc.* ††† | 1,901,724 | |||
| 9,004,468 | |||||
| Specialized Finance 2.6% | |||||
| 129,485 | MSCI, Inc., Class A* | 2,189,591 | |||
| Systems Software 2.6% | |||||
| 118,132 | NetSuite, Inc.* | 1,330,166 | |||
| 100,000 | Opnet Technologies, Inc.* | 867,000 | |||
| 2,197,166 | |||||
| Trucking 3.7% | |||||
| 126,975 | Knight Transportation, Inc. | 1,924,941 | |||
| 49,140 | Old Dominion Freight Line, Inc.* | 1,154,299 | |||
| 3,079,240 | |||||
| Total Common Stocks (cost $86,718,951) | 72,879,390 | ||||
| PREFERRED STOCKS 3.8% | |||||
| Biotechnology 0.4% | |||||
| 169,492 | Nanosys, Inc., Series D Pfd.* *** † | 361,018 | |||
| Health Care Equipment 0.2% | |||||
| 1,080,146 | Zonare Medical Systems, Inc., Series E Pfd.* *** † | 194,426 | |||
| Health Care Services 1.0% | |||||
| 516,161 | Bravo Health, Inc., Series G Pfd.* *** † | 851,666 | |||
| 108,917 | TargetRX, Inc., Series D Pfd.* *** † | 1,089 | |||
| 852,755 | |||||
| Health Care Technology 2.1% | |||||
| 243,902 | TherOx, Inc., Series I Pfd.* *** † | 895,120 | |||
| 253,064 | Transoma Medical, Inc., Series B Pfd.* *** † | 820,105 | |||
| 1,715,225 | |||||
| Internet Software & Services 0.1% | |||||
| 91,388 | Xtera Communications, Inc., Series A-1 Pfd.* *** † | 88,738 | |||
| Total Preferred Stocks (cost $3,876,400) | 3,212,162 | ||||
| LIMITED PARTNERSHIP INTEREST 3.2% | |||||
| Other 3.2% | |||||
| Montagu Newhall Global Partners II-B, L.P.* *** † | 2,148,660 | ||||
| Montagu Newhall Global Partners III-B, L.P.* *** † | 500,603 | ||||
| 2,649,263 | |||||
| Total Limited Partnership Interest (cost $4,299,467) | 2,649,263 | ||||
| WARRANTS 0.0% | |||||
| Gold 0.0% | |||||
| 1,497,500 | Redcorp Ventures Ltd. expiring 7/10/09* *** † (Canada) | 5,929 | |||
| Shares | Value | ||||
| Health Care Equipment 0.0% | |||||
| 162,021 | Zonare Medical Systems, Inc. expiring 6/30/11* *** † | $ | — | ||
| Total Warrants (cost $0) | 5,929 | ||||
| Principal Amount | Value | ||||
| SHORT-TERM INVESTMENTS 4.7% | |||||
| Repurchase Agreement 4.7% | |||||
| $3,948,000 | Repurchase Agreement dated 3/31/09, 0.10% due 4/1/09 with Fixed Income Clearing Corporation collateralized by $2,765,000 of United States Treasury Bonds 8.125% due 8/15/19; value: $4,031,923; repurchase proceeds: $3,948,011††† (cost $3,948,000) | $ | 3,948,000 | ||
| Total Short-Term Investments (cost $3,948,000) | 3,948,000 | ||||
| Total Investments (cost $98,842,818) 98.5%^^ | 82,694,744 | ||||
| Other Assets less Liabilities 1.5% | 1,292,631 | ||||
| NET ASSETS 100.0% | $ | 83,987,375 | |||
*Non-income producing.
***Security was fair valued under procedures adopted by the Board of Directors (see Note 2).
†Security purchased in a private placement transaction or under Rule 144A of the Securities Act of 1933 (see Note 9).
†††All or a portion of this security has been designated as collateral for future commitments (see Note 10).
^^The aggregate amount of foreign securities fair valued pursuant to a systematic fair valuation model as a percent of net assets was 6.34%.
ADR American Depositary Receipt.
See notes to financial statements. | |||||
At March 31, 2009, Wasatch Ultra Growth Fund’s investments, excluding short-term investments, were in the following countries:
| Country | % | ||
Canada | 2.9 | ||
China | 2.1 | ||
Germany | 1.4 | ||
Hong Kong | 3.2 | ||
India | 3.4 | ||
Ireland | 0.6 | ||
United States | 86.4 | ||
TOTAL | 100.0 | % | |
77
Table of Contents
| WASATCH-1ST SOURCE INCOME EQUITY FUND (FMIEX) — Schedule of Investments | ||
| Shares | Value | ||||
| COMMON STOCKS 87.9% | |||||
| Advertising 0.8% | |||||
| 320,000 | Omnicom Group, Inc. | $ | 7,488,000 | ||
| Aerospace & Defense 4.0% | |||||
| 260,000 | Honeywell International, Inc. | 7,243,600 | |||
| 310,000 | Raytheon Co. | 12,071,400 | |||
| 310,000 | Rockwell Collins, Inc. | 10,118,400 | |||
| 195,000 | United Technologies Corp. | 8,381,100 | |||
| 37,814,500 | |||||
| Agricultural Products 1.5% | |||||
| 520,000 | Archer Daniels Midland Co. | 14,445,600 | |||
| Aluminum 0.6% | |||||
| 750,000 | Alcoa, Inc. | 5,505,000 | |||
| Asset Management & Custody Banks 1.9% | |||||
| 450,000 | Federated Investors, Inc., Class B | 10,017,000 | |||
| 410,000 | Waddell & Reed Financial, Inc., Class A | 7,408,700 | |||
| 17,425,700 | |||||
| Auto Parts & Equipment 1.1% | |||||
| 840,000 | Johnson Controls, Inc. | 10,080,000 | |||
| Broadcasting 0.3% | |||||
| 640,000 | CBS Corp., Class B | 2,457,600 | |||
| Coal & Consumable Fuels 0.5% | |||||
| 300,000 | Cameco Corp. (Canada) | 5,151,000 | |||
| Communications Equipment 2.2% | |||||
| 450,000 | Harris Corp. | 13,023,000 | |||
| 670,000 | Nokia Oyj ADR (Finland) | 7,818,900 | |||
| 20,841,900 | |||||
| Computer Hardware 2.0% | |||||
| 480,000 | Hewlett-Packard Co. | 15,388,800 | |||
| 400,000 | Sun Microsystems, Inc.* | 2,928,000 | |||
| 18,316,800 | |||||
| Construction & Engineering 2.5% | |||||
| 340,000 | Flour Corp. | 11,747,000 | |||
| 440,000 | Shaw Group, Inc. (The)* | 12,060,400 | |||
| 23,807,400 | |||||
| Data Processing & Outsourced Services 1.5% | |||||
| 390,000 | Computer Sciences Corp.* | 14,367,600 | |||
| Diversified Chemicals 0.8% | |||||
| 320,000 | E. I. Du Pont de Nemours and Co. | 7,145,600 | |||
| Diversified Metals & Mining 0.9% | |||||
| 1,000,000 | Anglo American plc ADR (United Kingdom) | 8,530,000 | |||
| Drug Retail 1.5% | |||||
| 550,000 | Walgreen Co. | 14,278,000 | |||
| Electric Utilities 2.3% | |||||
| 340,000 | American Electric Power Co., Inc. | 8,588,400 | |||
| 430,000 | Duke Energy Corp. | 6,157,600 | |||
| 140,000 | FPL Group, Inc. | 7,102,200 | |||
| 21,848,200 | |||||
| Electrical Components & Equipment 1.2% | |||||
| 380,000 | Emerson Electric Co. | 10,860,400 | |||
| Shares | Value | ||||
| Environmental & Facilities Services 2.7% | |||||
| 660,000 | Republic Services, Inc. | $ | 11,319,000 | ||
| 560,000 | Waste Management, Inc. | 14,336,000 | |||
| 25,655,000 | |||||
| Fertilizers & Agricultural Chemicals 2.0% | |||||
| 130,000 | Potash Corp. of Saskatchewan, Inc. | 10,505,300 | |||
| 210,000 | Syngenta AG ADR (Switzerland) | 8,423,100 | |||
| 18,928,400 | |||||
| Food Distributors 1.8% | |||||
| 720,000 | Sysco Corp. | 16,416,000 | |||
| Food Retail 1.4% | |||||
| 900,000 | SUPERVALU, Inc. | 12,852,000 | |||
| Gold 1.4% | |||||
| 300,000 | Newmont Mining Corp. | 13,428,000 | |||
| Health Care Distributors 1.4% | |||||
| 370,000 | McKesson Corp. | 12,964,800 | |||
| Health Care Equipment 3.1% | |||||
| 890,000 | Boston Scientific Corp.* | 7,075,500 | |||
| 130,000 | C. R. Bard, Inc. | 10,363,600 | |||
| 325,000 | Zimmer Holdings, Inc.* | 11,862,500 | |||
| 29,301,600 | |||||
| Home Improvement Retail 1.6% | |||||
| 620,000 | Home Depot, Inc. | 14,607,200 | |||
| Household Products 1.4% | |||||
| 290,000 | Kimberly-Clark Corp. | 13,371,900 | |||
| Hypermarkets & Super Centers 1.7% | |||||
| 310,000 | Wal-Mart Stores, Inc. | 16,151,000 | |||
| Industrial Conglomerates 0.8% | |||||
| 690,000 | General Electric Co. | 6,975,900 | |||
| Industrial Machinery 1.2% | |||||
| 340,000 | Parker Hannifin Corp. | 11,553,200 | |||
| Integrated Oil & Gas 4.4% | |||||
| 200,000 | Chevron Corp. | 13,448,000 | |||
| 315,000 | ConocoPhillips | 12,335,400 | |||
| 580,000 | Marathon Oil Corp. | 15,248,200 | |||
| 41,031,600 | |||||
| Integrated Telecommunication Services 4.0% | |||||
| 540,000 | AT&T, Inc. | 13,608,000 | |||
| 730,000 | Deutsche Telekom AG ADR (Germany) | 9,015,500 | |||
| 480,000 | Verizon Communications, Inc. | 14,496,000 | |||
| 37,119,500 | |||||
| Life & Health Insurance 0.3% | |||||
| 440,000 | Lincoln National Corp. | 2,943,600 | |||
| Multi-Utilities 0.5% | |||||
| 450,000 | NiSource, Inc. | 4,410,000 | |||
| Oil & Gas Equipment & Services 1.2% | |||||
| 285,000 | Schlumberger Ltd. | 11,576,700 | |||
| Oil & Gas Exploration & Production 1.4% | |||||
| 270,000 | Anadarko Petroleum Corp. | 10,500,300 | |||
| 250,000 | Hugoton Royalty Trust** | 2,390,000 | |||
| 12,890,300 | |||||
78
Table of Contents
| MARCH 31, 2009 (UNAUDITED) | ||
| Shares | Value | ||||
| Oil & Gas Storage & Transportation 2.5% | |||||
| 900,000 | Spectra Energy Corp. | $ | 12,726,000 | ||
| 920,000 | Williams Cos. Inc. (The) | 10,469,600 | |||
| 23,195,600 | |||||
| Other Diversified Financial Services 1.7% | |||||
| 860,000 | Bank of America Corp. | 5,865,200 | |||
| 380,000 | JPMorgan Chase & Co. | 10,100,400 | |||
| 15,965,600 | |||||
| Packaged Foods & Meats 2.7% | |||||
| 840,000 | ConAgra Foods, Inc. | 14,170,800 | |||
| 350,000 | HJ Heinz Co. | 11,571,000 | |||
| 25,741,800 | |||||
| Paper Products 0.5% | |||||
| 610,000 | International Paper Co. | 4,294,400 | |||
| Personal Products 1.4% | |||||
| 700,000 | Avon Products, Inc. | 13,461,000 | |||
| Pharmaceuticals 8.3% | |||||
| 305,000 | Abbott Laboratories | 14,548,500 | |||
| 400,000 | Eli Lilly and Co. | 13,364,000 | |||
| 255,000 | Johnson & Johnson | 13,413,000 | |||
| 420,000 | Merck & Co., Inc. | 11,235,000 | |||
| 360,000 | Novartis AG ADR (Switzerland) | 13,618,800 | |||
| 830,000 | Pfizer, Inc. | 11,304,600 | |||
| 77,483,900 | |||||
| Property & Casualty Insurance 3.2% | |||||
| 850,000 | Old Republic International Corp. | 9,197,000 | |||
| 430,000 | The Allstate Corp. | 8,234,500 | |||
| 310,000 | Travelers Cos. Inc. (The) | 12,598,400 | |||
| 30,029,900 | |||||
| Railroads 1.1% | |||||
| 100,000 | Burlington Northern Santa Fe Corp. | 6,015,000 | |||
| 140,000 | Norfolk Southern Corp. | 4,725,000 | |||
| 10,740,000 | |||||
| Semiconductors 2.2% | |||||
| 1,110,000 | Intel Corp. | 16,705,500 | |||
| 310,000 | Maxim Integrated Products, Inc. | 4,095,100 | |||
| 20,800,600 | |||||
| Soft Drinks 1.5% | |||||
| 265,000 | PepsiCo, Inc. | 13,642,200 | |||
| Specialized Consumer Services 0.9% | |||||
| 450,000 | H&R Block, Inc. | 8,185,500 | |||
| Systems Software 1.4% | |||||
| 720,000 | Microsoft Corp. | 13,226,400 | |||
| Technology Distributors 1.3% | |||||
| 710,000 | Avnet, Inc.* | 12,432,100 | |||
| Wireless Telecommunication Services 1.3% | |||||
| 290,000 | China Mobile Ltd. ADR (China) | 12,620,800 | |||
| Total Common Stocks (cost $1,051,602,489) | 824,359,800 | ||||
| Principal Amount | Value | ||||
| SHORT-TERM INVESTMENTS 11.4% | |||||
| Repurchase Agreement 11.4% | |||||
| $106,745,000 | Repurchase Agreement dated 3/31/09, 0.10% due 4/1/09 with Fixed Income Clearing Corporation collateralized by $89,985,000 of United States Treasury Notes 5.125% due 5/15/16; value: $108,881,850; repurchase proceeds: $106,745,297 (cost $106,745,000) | $ | 106,745,000 | ||
| Total Short-Term Investments (cost $106,745,000) | 106,745,000 | ||||
| Total Investments (cost $1,158,347,489) 99.3% | 931,104,800 | ||||
| Other Assets less Liabilities 0.7% | 6,566,916 | ||||
| NET ASSETS 100.0% | $ | 937,671,716 | |||
*Non-income producing.
**Common units.
ADR American Depositary Receipt.
See notes to financial statements. | |||||
At March 31, 2009, Wasatch-1st Source Income Equity Fund’s investments, excluding short-term investments, were in the following countries:
| Country | % | ||
Canada | 0.6 | ||
China | 1.5 | ||
Finland | 1.0 | ||
Germany | 1.1 | ||
Switzerland | 2.7 | ||
United Kingdom | 1.0 | ||
United States | 92.1 | ||
TOTAL | 100.0 | % | |
79
Table of Contents
| WASATCH-1ST SOURCE LONG/SHORT FUND (FMLSX) — Schedule of Investments | ||
| Shares | Value | ||||
| COMMON STOCKS 77.3% | |||||
| Aerospace & Defense 4.6% | |||||
| 35,000 | Alliant Techsystems, Inc.* ††† | $ | 2,344,300 | ||
| 40,000 | Esterline Technologies Corp.* | 807,600 | |||
| 35,000 | Raytheon Co. | 1,362,900 | |||
| 4,514,800 | |||||
| Coal & Consumable Fuels 0.9% | |||||
| 50,000 | Alpha Natural Resources, Inc.* | 887,500 | |||
| Communications Equipment 0.8% | |||||
| 50,000 | Cisco Systems, Inc.* ††† | 838,500 | |||
| Computer & Electronics Retail 1.4% | |||||
| 50,000 | GameStop Corp., Class A* | 1,401,000 | |||
| Construction & Farm Machinery & Heavy Trucks 0.9% | |||||
| 35,000 | Lindsay Corp. | 945,000 | |||
| Data Processing & Outsourced Services 1.1% | |||||
| 30,000 | Computer Sciences Corp.* ††† | 1,105,200 | |||
| Diversified Chemicals 1.0% | |||||
| 100,000 | LSB Industries, Inc.* | 989,000 | |||
| Electric Utilities 0.8% | |||||
| 30,000 | American Electric Power Co., Inc.††† | 757,800 | |||
| Environmental & Facilities Services 6.1% | |||||
| 185,000 | Republic Services, Inc.††† | 3,172,750 | |||
| 110,000 | Waste Management, Inc. | 2,816,000 | |||
| 5,988,750 | |||||
| Fertilizers & Agricultural Chemicals 4.6% | |||||
| 15,000 | Potash Corp. of Saskatchewan, | ||||
| Inc. | 1,212,150 | ||||
| 30,000 | Syngenta AG ADR (Switzerland) | 1,203,300 | |||
| 50,000 | The Mosaic Co.††† | 2,099,000 | |||
| 4,514,450 | |||||
| Food Distributors 2.3% | |||||
| 100,000 | Sysco Corp. | 2,280,000 | |||
| Gas Utilities 2.4% | |||||
| 80,000 | Energen Corp.††† | 2,330,400 | |||
| Gold 2.7% | |||||
| 60,000 | Newmont Mining Corp.††† | 2,685,600 | |||
| Health Care Equipment 1.2% | |||||
| 80,000 | Zoll Medical Corp.* | 1,148,800 | |||
| Health Care Technology 3.8% | |||||
| 85,000 | Cerner Corp.* ††† | 3,737,450 | |||
| Heavy Electrical Equipment 2.0% | |||||
| 100,000 | General Cable Corp.* | 1,982,000 | |||
| Home Entertainment Software 2.9% | |||||
| 100,000 | Activision Blizzard, Inc.* | 1,046,000 | |||
| 100,000 | Electronic Arts, Inc.* | 1,819,000 | |||
| 2,865,000 | |||||
| Hypermarkets & Super Centers 4.0% | |||||
| 75,000 | Wal-Mart Stores, Inc. | 3,907,500 | |||
| Industrial Machinery 1.3% | |||||
| 25,000 | Valmont Industries, Inc. | 1,255,250 | |||
| Shares | Value | ||||
| Integrated Oil & Gas 3.3% | |||||
| 25,000 | Hess Corp. | $ | 1,355,000 | ||
| 72,028 | Marathon Oil Corp.††† | 1,893,616 | |||
| 3,248,616 | |||||
| Integrated Telecommunication Services 1.0% | |||||
| 40,000 | AT&T, Inc.††† | 1,008,000 | |||
| Internet Software & Services 4.4% | |||||
| 125,000 | Akamai Technologies, Inc.* | 2,425,000 | |||
| 150,000 | eBay, Inc.* ††† | 1,884,000 | |||
| 4,309,000 | |||||
| Oil & Gas Drilling 4.0% | |||||
| 75,000 | Atwood Oceanics, Inc.* | 1,244,250 | |||
| 50,000 | ENSCO International, Inc.††† | 1,320,000 | |||
| 24,000 | Transocean Ltd.* ††† | 1,412,160 | |||
| 3,976,410 | |||||
| Oil & Gas Equipment & Services 1.0% | |||||
| 797,600 | Boots & Coots International Well Control, Inc.* ††† | 997,000 | |||
| Oil & Gas Exploration & Production 1.9% | |||||
| 70,010 | Enerplus Resources Fund** ††† (Canada) | 1,146,064 | |||
| 75,000 | Penn West Energy Trust** (Canada) | 711,750 | |||
| 1,857,814 | |||||
| Oil & Gas Storage & Transportation 0.5% | |||||
| 35,000 | Spectra Energy Corp. | 494,900 | |||
| Personal Products 1.2% | |||||
| 60,000 | Avon Products, Inc. | 1,153,800 | |||
| Property & Casualty Insurance 2.6% | |||||
| 100,000 | Old Republic International Corp. | 1,082,000 | |||
| 80,000 | The Allstate Corp. | 1,532,000 | |||
| 2,614,000 | |||||
| Restaurants 3.1% | |||||
| 400,000 | The Steak ’n Shake Co.* ††† | 3,028,000 | |||
| Semiconductors 2.3% | |||||
| 150,000 | Intel Corp.††† | 2,257,500 | |||
| Steel 3.9% | |||||
| 50,000 | Nucor Corp.††† | 1,908,500 | |||
| 220,000 | Steel Dynamics, Inc. | 1,938,200 | |||
| 3,846,700 | |||||
| Systems Software 3.3% | |||||
| 30,000 | Microsoft Corp.††† | 551,100 | |||
| 150,000 | Oracle Corp.* | 2,710,500 | |||
| 3,261,600 | |||||
| Total Common Stocks (cost $83,315,581) | 76,187,340 | ||||
| PREFERRED STOCK 1.4% | |||||
| Specialized REITs 1.4% | |||||
| 50,000 | Public Storage, Pfd., 6.6250%, Series M* ** | 879,500 | |||
| 26,435 | Public Storage, Pfd., 7.250%, Series K* ** | 508,345 | |||
| 1,387,845 | |||||
| Total Preferred Stock (cost $1,302,402) | 1,387,845 | ||||
80
Table of Contents
| MARCH 31, 2009 (UNAUDITED) | ||
| Shares | Value | |||||
| LIMITED PARTNERSHIP INTEREST 1.9% | ||||||
| Oil & Gas Storage & Transportation 1.9% | ||||||
| 50,000 | Plains All American Pipeline L.P.** | $ | 1,838,000 | |||
| Total Limited Partnership Interest (cost $1,993,518) | 1,838,000 | |||||
| Principal Amount | Value | |||||
| SHORT-TERM INVESTMENTS 20.1% | ||||||
| Repurchase Agreement 20.1% | ||||||
| $19,807,000 | Repurchase Agreement dated 3/31/09, 0.10% due 4/1/09 with Fixed Income Clearing Corporation collateralized by $13,855,000 of United States Treasury Bonds 8.125% due 8/15/19; value: $20,203,361; repurchase proceeds: $19,807,055 (cost $19,807,000) | $ | 19,807,000 | |||
| Total Short-Term Investments (cost $19,807,000) | 19,807,000 | |||||
| Total Investments (cost $106,418,501) 100.7% | 99,220,185 | |||||
| Liabilities less Other Assets (0.7)% | (697,044 | ) | ||||
| NET ASSETS 100.0% | $ | 98,523,141 | ||||
| Shares | Value | |||||
| SECURITIES SOLD SHORT 20.0% | ||||||
| Air Freight & Logistics 3.3% | ||||||
| 50,000 | C.H. Robinson Worldwide, Inc. | $ | 2,280,500 | |||
| 35,000 | Expeditors International of Washington, Inc. | 990,150 | ||||
| 3,270,650 | ||||||
| Computer & Electronics Retail 1.9% | ||||||
| 50,000 | Best Buy Co., Inc. | 1,898,000 | ||||
| Education Services 1.0% | ||||||
| 20,000 | DeVry, Inc. | 963,600 | ||||
| Health Care Services 1.0% | ||||||
| 25,000 | Medco Health Solutions, Inc.* | 1,033,500 | ||||
| Health Care Technology 1.6% | ||||||
| 150,000 | Allscripts-Misys Healthcare Solutions, Inc. | 1,543,500 | ||||
| Homebuilding 1.0% | ||||||
| 100,000 | D.R. Horton, Inc. | 970,000 | ||||
| Homefurnishing Retail 1.8% | ||||||
| 70,000 | Bed Bath & Beyond, Inc.* | 1,732,500 | ||||
| Industrial Conglomerates 1.0% | ||||||
| 20,000 | 3M Co. | 994,400 | ||||
| Integrated Oil & Gas 1.4% | ||||||
| 20,000 | Exxon Mobil Corp. | 1,362,000 | ||||
| Internet Retail 0.4% | ||||||
| 25,000 | PetMed Express, Inc.* | 412,000 | ||||
| Motorcycle Manufacturers 1.1% | ||||||
| 80,000 | Harley-Davidson, Inc. | 1,071,200 | ||||
| Shares | Value | ||||
| Restaurants 2.0% | |||||
| 50,000 | Cracker Barrel Old Country Store, Inc. | $ | 1,432,000 | ||
| 10,000 | Panera Bread Co.* | 559,000 | |||
| 1,991,000 | |||||
| Retail REITs 2.5% | |||||
| 20,000 | Federal Realty Investment Trust | 920,000 | |||
| 853 | Simon Property Group, Inc. | 29,548 | |||
| 50,000 | Tanger Factory Outlet Centers, Inc. | 1,543,000 | |||
| 2,492,548 | |||||
| Total Securities Sold Short (proceeds $18,372,368) | 19,734,898 | ||||
*Non-income producing.
**Common units.
†††All or a portion of this security has been designated as collateral for short sales (see Note 10).
ADR American Depositary Receipt.
REIT Real Estate Investment Trust.
See notes to financial statements. | |||||
At March 31, 2009, Wasatch-1st Source Long/Short Fund’s investments, excluding short-term investments and securities sold short, were in the following countries:
| Country | % | ||
Canada | 2.3 | ||
Switzerland | 1.5 | ||
United States | 96.2 | ||
TOTAL | 100.0 | % | |
81
Table of Contents
| WASATCH-HOISINGTON U.S. TREASURY FUND (WHOSX) — Schedule of Investments |
| Principal Amount | Value | |||||
| U.S. GOVERNMENT OBLIGATIONS 98.6% | ||||||
| $ | 1,400,000 | U.S. Treasury Bond, 4.375%, 2/15/38 | $ | 1,590,313 | ||
| 22,300,000 | U.S. Treasury Bond, 4.50%, 2/15/36 | 25,693,792 | ||||
| 13,000,000 | U.S. Treasury Bond, 4.50%, 5/15/38 | 15,177,500 | ||||
| 23,800,000 | U.S. Treasury Bond, 4.75%, 2/15/37 | 28,515,375 | ||||
| 7,520,000 | U.S. Treasury Bond, 5.25%, 2/15/29 | 9,260,173 | ||||
| 3,000,000 | U.S. Treasury Bond, 5.375%, 2/15/31 | 3,782,343 | ||||
| 101,000,000 | U.S. Treasury Strip, principal only, 11/15/27 | 49,785,223 | ||||
| 71,837,000 | U.S. Treasury Strip, principal only, 2/15/37 | 25,842,068 | ||||
| Total U.S. Government Obligations (cost $139,713,295) | 159,646,787 | |||||
| SHORT-TERM INVESTMENTS 0.9% | ||||||
| Repurchase Agreement 0.9% | ||||||
| 1,398,000 | Repurchase Agreement dated 3/31/09, 0.10% due 4/1/09 with Fixed Income Clearing Corporation collateralized by $980,000 of United States Treasury Bonds 8.125% due 8/15/19; value: $1,429,036; repurchase proceeds: $1,398,004 (cost $1,398,000) | 1,398,000 | ||||
| Total Short-Term Investments (cost $1,398,000) | 1,398,000 | |||||
| Total Investments (cost $141,111,295) 99.5% | 161,044,787 | |||||
| Other Assets less Liabilities 0.5% | 840,528 | |||||
| NET ASSETS 100.0% | $ | 161,885,315 | ||||
| See notes to financial statements. | ||||||
82
Table of Contents
| WASATCH-1ST SOURCE INCOME FUND (FMEQX) — Schedule of Investments | MARCH 31, 2009 (UNAUDITED) | |
| Principal Amount | Value | |||||
| ASSET BACKED SECURITIES 3.0% | ||||||
| $ | 600,000 | Capital One Multi-Asset Execution Trust, 4.70%, 6/15/15, Series 2005-A7, Class A7 | $ | 564,998 | ||
| 1,500,000 | Citibank Credit Card Issuance Trust, 5.45%, 5/10/13, Series 2006-A4, Class A4 | 1,526,699 | ||||
| 650,000 | MBNA Credit Card Master Note Trust, 4.10%, 10/15/12, Series 2005-A3, Class A3 | 649,312 | ||||
| 114,227 | Navisitar Financial Corp., 3.53%, 10/15/12, Series 2004-B, Class A4 | 111,955 | ||||
| Total Asset Backed Securities (cost $2,858,187) | 2,852,964 | |||||
| COLLATERALIZED MORTGAGE OBLIGATIONS 34.3% | ||||||
| 428,791 | ABN Amro Mortgage Corp., 5.50%, 2/25/18, Series 2003-13, Class A2 | 407,410 | ||||
| 53,077 | Banc of America Mortgage Securities, Inc., 5.38915%, 2/25/33, Series 2003-A, Class 3A1 G | 43,806 | ||||
| 390,000 | Bear Stearns Commerical Mortgage Securities, 4.735%, 9/11/42, Series 2005-PWR9, Class A2 | 355,550 | ||||
| 363,147 | Chase Manhattan Bank-First Union National, 7.439%, 08/15/31, Series 1999-1, Class A2 G | 363,627 | ||||
| 611,352 | Citicorp Mortgage Securities, Inc., 5.50%, 2/25/26, Series 2006-1, Class 5A1 | 573,901 | ||||
| 546,394 | Countrywide Home Loans, 4.50%, 8/25/19, Series 2004-J7, Class 2A1 | 489,027 | ||||
| 246,447 | Credit Suisse First Boston Mortgage Securities Corp., 4.302%, 7/15/36, Series 2004-C3, Class A3 | 245,237 | ||||
| 305,907 | Credit Suisse First Boston Mortgage Securities Corp., 6.00%, 9/25/33, Series 2003-23, Class 5A1*** | 197,310 | ||||
| 1,099,244 | Federal Home Loan Bank, 4.75%, 10/25/10, Class H | 1,131,540 | ||||
| 625,696 | Federal Home Loan Mortgage Corp., 4.00%, 7/1/10, Series M80828 | 631,738 | ||||
| 554,823 | Federal Home Loan Mortgage Corp., 4.00%, 12/15/11, Series 2892, Class UJ | 558,749 | ||||
| 266,349 | Federal Home Loan Mortgage Corp., 4.00%, 12/15/13, Series 2584, Class LE | 271,693 | ||||
| 1,244,490 | Federal Home Loan Mortgage Corp., 4.00%, 12/15/16, Series 2672, Class NF, | 1,269,926 | ||||
| 169,395 | Federal Home Loan Mortgage Corp., 4.496%, 5/1/31, Series 847292 G | 173,138 | ||||
| 489,593 | Federal Home Loan Mortgage Corp., 4.50%, 3/1/10, Series M80807 | 493,021 | ||||
| 629,114 | Federal Home Loan Mortgage Corp., 4.50%, 12/15/13, Series 2717, Class HP | 650,710 | ||||
| 572,794 | Federal Home Loan Mortgage Corp., 4.50%, 12/15/13, Series 2723, Class AT | 578,575 | ||||
| 289,686 | Federal Home Loan Mortgage Corp., 4.50%, 6/15/15, Series 2622, Class PC | 293,522 | ||||
| 561,776 | Federal Home Loan Mortgage Corp., 4.50%, 7/15/15, Series 2864, Class CV | 570,546 | ||||
| 138,738 | Federal Home Loan Mortgage Corp., 4.543%, 12/1/32, Series 847527 G | 140,307 | ||||
| 288,654 | Federal Home Loan Mortgage Corp., 5.00%, 12/1/09, Series M80784 | 291,015 | ||||
| 416,289 | Federal Home Loan Mortgage Corp., 5.00%, 8/1/12, Series M80984 | 423,787 | ||||
| 479,371 | Federal Home Loan Mortgage Corp., 5.00%, 2/15/16, Series 2541, Class JB | 485,008 | ||||
| 478,220 | Federal Home Loan Mortgage Corp., 5.00%, 5/15/16, Series R007, Class AL | 483,340 | ||||
| 560,137 | Federal Home Loan Mortgage Corp., 5.00%, 2/15/23, Series 2960, Class KP | 575,547 | ||||
| Principal Amount | Value | |||||
| $ | 64,456 | Federal Home Loan Mortgage Corp., 5.046%, 8/1/33, Series 847281 G | $ | 65,780 | ||
| 485,495 | Federal Home Loan Mortgage Corp., 5.125%, 12/15/13, Series 3137, Class PJ | 486,984 | ||||
| 494,049 | Federal Home Loan Mortgage Corp., 5.125%, 6/15/18, Series R016, Class AM | 505,775 | ||||
| 636,281 | Federal Home Loan Mortgage Corp., 5.50%, 5/15/15, Series 2808, Class VA | 671,521 | ||||
| 2,705,069 | Federal Home Loan Mortgage Corp., 5.50%, 12/15/19, Series R010, Class AB | 2,760,653 | ||||
| 600,000 | Federal Home Loan Mortgage Corp., 5.50%, 1/15/26, Series 2702, Class DE | 601,790 | ||||
| 324,507 | Federal Home Loan Mortgage Corp., 5.50%, 10/1/25, Series C90925 | 337,904 | ||||
| 69,544 | Federal Home Loan Mortgage Corp., 5.50%, 4/15/26, Series 2549, Class PB | 69,585 | ||||
| 706,853 | Federal Home Loan Mortgage Corp., 5.50%, 8/1/29, Series C46102 | 737,576 | ||||
| 248,698 | Federal Home Loan Mortgage Corp., 5.768%, 11/1/35, Series 1M0010 G | 256,043 | ||||
| 765,152 | Federal Home Loan Mortgage Corp., 5.875%, 5/15/16, Series R007, Class AC | 778,394 | ||||
| 621,854 | Federal Home Loan Mortgage Corp., 6.50%, 10/15/14, Series R014, Class AL | 628,479 | ||||
| 344,363 | Federal National Mortgage Assoc., 4.00%, 10/1/10, Series 254955 | 350,891 | ||||
| 912,546 | Federal National Mortgage Assoc., 4.00%, 10/25/32, Series 2003-28, Class GA | 920,342 | ||||
| 504,564 | Federal National Mortgage Assoc., 4.25%, 9/25/22, Series 2003-17, Class ED | 519,628 | ||||
| 955,747 | Federal National Mortgage Assoc., 4.50%, 5/01/19, Series 725445 G | 989,875 | ||||
| 1,301,800 | Federal National Mortgage Assoc., 5.00%, 7/25/23, Series 2005-4, Class VG | 1,356,134 | ||||
| 18,394 | Federal National Mortgage Assoc., 5.35%, 10/1/32, Series 659657 G | 18,779 | ||||
| 250,000 | Federal National Mortgage Assoc., 5.50%, 5/25/23, Series 2003-42, Class EK | 270,535 | ||||
| 711,957 | Federal National Mortgage Assoc., 7.28%, 1/1/10, Series 382184 | 721,877 | ||||
| 379,748 | Federal National Mortgage Association, 4.013%, 1/1/35, Series 825245 G | 383,593 | ||||
| 325,854 | Federal National Mortgage Association, 4.578%, 11/1/34, Series 782320 G | 330,131 | ||||
| 295,710 | Federal National Mortgage Association, 5.50%, 11/25/26, Series 2007-63, Class PA | 300,361 | ||||
| 379,886 | First Horizon Mortgage, Inc., 5.75%, 2/25/33, Series 2002-9, Class 1A3 | 382,450 | ||||
| 1,031,967 | Government National Mortgage Assoc., 3.387%, 6/16/30, Series 2006-19, Class A | 1,034,879 | ||||
| 709,585 | Government National Mortgage Assoc., 4.50%, 1/20/31, Series 2005-38, Class A | 719,672 | ||||
| 1,000,000 | Government National Mortgage Assoc., 5.00%, 4/20/33, Series 2009-8, Class LA | 1,041,628 | ||||
| 650,000 | Government National Mortgage Assoc., 4.658%, 12/16/30, Series 2005-12, Class C | 668,893 | ||||
| 592,685 | Government National Mortgage Assoc., 5.00%, 11/20/28, Series 2004-1, Class TB | 598,128 | ||||
| 815,522 | Government National Mortgage Assoc., 5.00%, 12/20/29, Series 2004-101, Class MA | 833,139 | ||||
| 900,000 | Government National Mortgage Assoc., 5.00%, 5/20/31, Series 2004-19, Class PD | 935,595 | ||||
| 500,000 | Government National Mortgage Assoc., 5.00%, 7/20/34, Series 2004-105, Class MC | 524,118 | ||||
| 117,096 | Impac CMB Trust, .95188%, 5/25/35, Series 2005-4, Class 1M1 G | 21,071 | ||||
| 550,000 | LB-UBS Commercial Mortgage Trust, 4.187%, 8/15/29, Series 2004-C6, Class A2 | 539,378 | ||||
| Total Collateralized Mortgage Obligations (cost $32,792,784) | 33,059,611 | |||||
83
Table of Contents
| WASATCH-1ST SOURCE INCOME FUND (FMEQX) — Schedule of Investments (continued) | ||
| Principal Amount | Value | |||||
| CORPORATE BONDS 25.2% | ||||||
| Aerospace & Defense 0.3% | ||||||
| $ | 250,000 | Martin Marietta Corp., 7.375%, 4/15/13 | $ | 273,631 | ||
| Air Freight & Logistics 0.5% | ||||||
| 500,000 | United Parcel Service, Inc., 3.875%, 4/1/14 | 501,224 | ||||
| Aluminum 0.2% | ||||||
| 251,000 | Alcoa, Inc., 6.00%, 7/15/13 | 200,339 | ||||
| Automotive Retail 0.3% | ||||||
| 300,000 | AutoZone, Inc., 5.50%, 11/15/15 | 273,993 | ||||
| Biotechnology 0.6% | ||||||
| 300,000 | Amgen, Inc., 4.00%, 11/18/09 | 303,837 | ||||
| 300,000 | Amgen, Inc., 4.85%, 11/18/14 | 307,486 | ||||
| 611,323 | ||||||
| Cable & Satellite 0.6% | ||||||
| 550,000 | Comcast Corp., 5.30%, 1/15/14 | 533,964 | ||||
| Computer Hardware 0.3% | ||||||
| 300,000 | Hewlett-Packard Co., 6.50%, 7/1/12 | 324,189 | ||||
| Construction & Farm Machinery & Heavy Trucks 0.3% | ||||||
| 250,000 | John Deere Capital Corp., 4.90%, 9/9/13, MTN | 248,649 | ||||
| Consumer Finance 0.9% | ||||||
| 500,000 | American Express Bank FSB, 3.15%, 12/9/11, G MTN | 516,641 | ||||
| 400,000 | American Express Credit Corp., 5.875%, 5/2/13 MTN | 351,191 | ||||
| 867,832 | ||||||
| Distillers & Vintners 0.5% | ||||||
| 500,000 | Diageo Finance BV, 3.875%, 4/1/11 (Netherlands) | 498,334 | ||||
| Diversified Banks 2.4% | ||||||
| 500,000 | HSBC Capital Funding L.P., 4.61%, 6/27/13 (Jersey, C.I.) G | 210,816 | ||||
| 325,000 | HSBC Finance Corp., 6.375%, 10/15/11 | 280,971 | ||||
| 700,000 | Royal Bank of Canada, 5.65%, 7/20/11 (Canada) | 745,860 | ||||
| 500,000 | SouthTrust Corp., 5.80%, 6/15/14 | 437,724 | ||||
| 700,000 | Wells Fargo & Co., 1/24/12 1.18938 G | 615,193 | ||||
| 2,290,564 | ||||||
| Diversified Metals & Mining 0.4% | ||||||
| 450,000 | Rio Tinto Alcan, Inc., 4.50%, 5/15/13 (Canada) | 380,460 | ||||
| Drug Retail 1.6% | ||||||
| 500,000 | CVS Caremark Corp., 4.00%, 9/15/09 | 500,608 | ||||
| 550,000 | CVS Caremark Corp., 5.75%, 8/15/11 | 576,860 | ||||
| 400,000 | Walgreen Co., 4.875%, 8/1/13 | 423,871 | ||||
| 1,501,339 | ||||||
| Electric Utilities 0.7% | ||||||
| 350,000 | Energy East Corp., 6.75%, 6/15/12 | 343,784 | ||||
| 300,000 | Florida Power & Light, 4.85%, 2/1/13 | 310,805 | ||||
| 10,000 | Progressive Energy, Inc., 7.10%, 3/1/11 | 10,367 | ||||
| 664,956 | ||||||
| Footwear 0.6% | ||||||
| 600,000 | Nike Inc., 5.15%, 10/15/15 MTN | 585,491 | ||||
| Health Care Distributors 0.4% | ||||||
| 400,000 | Cardinal Health, Inc., 6.75%, 2/15/11 | 407,188 | ||||
| Principal Amount | Value | |||||
| Health Care Equipment 0.3% | ||||||
| $ | 250,000 | Baxter International, Inc., 4.625%, 3/15/15 | $ | 254,196 | ||
| Industrial Conglomerates 1.7% | ||||||
| 500,000 | 3M Co., 4.375%, 8/15/13 MTN | 526,564 | ||||
| 1,000,000 | General Electric Co., 5.40%, 2/15/17 MTN | 875,229 | ||||
| 240,000 | Tyco International Finance Ltd., 6.00%, 11/15/13 | 225,806 | ||||
| 1,627,599 | ||||||
| Industrial Machinery 0.6% | ||||||
| 600,000 | Parker Hannifin Corp., 4.875%, 2/15/13 | 608,461 | ||||
| Integrated Oil & Gas 0.7% | ||||||
| 360,000 | BP Capital Markets plc, 5.25%, 11/7/13 (United Kingdom) | 385,325 | ||||
| 300,000 | Marathon Oil Canada Corp., 8.375%, 5/1/12 (Canada) | 313,904 | ||||
| 699,229 | ||||||
| Integrated Telecommunication Services 1.0% | ||||||
| 500,000 | AT&T Corp., 7.30%, 11/15/11 | 537,254 | ||||
| 212,463 | Ameritech Capital Funding, 9.10%, 6/1/16 | 220,352 | ||||
| 300,000 | Verizon Communications, Inc., 4.375%, 6/1/13 | 297,140 | ||||
| 1,054,746 | ||||||
| Investment Banking & Brokerage 1.2% | ||||||
| 600,000 | Georgia Power Co., 5.125%, 11/15/12, Series K | 621,920 | ||||
| 100,000 | Goldman Sachs Group, Inc., 3/2/10 MTN 1.46125 G | 96,856 | ||||
| 500,000 | Goldman Sachs Group, Inc., 5.35%, 1/15/16 | 443,134 | ||||
| 1,161,910 | ||||||
| Life & Health Insurance 0.5% | ||||||
| 500,000 | Principal Life Income Funding Trusts, 5.30%, 4/24/13, MTN | 459,343 | ||||
| Movies & Entertainment 0.3% | ||||||
| 250,000 | The Walt Disney Co., 4.50%, 12/15/13 | 255,511 | ||||
| Multi-Utilities 0.6% | ||||||
| 550,000 | Pseg Power, LLC, 3.75%, 4/1/09 | 550,000 | ||||
| Oil & Gas Exploration & Production 0.3% | ||||||
| 300,000 | Apache Corp., 6.25%, 4/15/12 | 318,612 | ||||
| Other Diversified Financial Services 0.6% | ||||||
| 600,000 | JPMorgan Chase & Co., 4.85%, 6/16/11 | 600,443 | ||||
| Pharmaceuticals 1.6% | ||||||
| 350,000 | Abbott Laboratories, 5.60%, 5/15/11 | 375,284 | ||||
| 600,000 | AstraZeneca plc, 5.40%, 9/15/12 (United Kingdom) | 639,186 | ||||
| 500,000 | Pfizer, Inc., 4.45%, 3/15/12 | 513,576 | ||||
| 1,528,046 | ||||||
| Property & Casualty Insurance 1.5% | ||||||
| 435,000 | Allstate Corp., 7.50%, 6/15/13 | 437,492 | ||||
| 650,000 | Berkshire Hathaway Fin, 4.625%, 10/15/13 | 659,229 | ||||
| 325,000 | Progressive Corp., 6.375%, 1/15/12 | 329,848 | ||||
| 1,426,569 | ||||||
| Railroads 0.8% | ||||||
| 300,000 | Burlington Northe Santa Fe, 4.30%, 7/1/13 | 290,479 | ||||
| 500,000 | Union Pacific Corp., 6.125%, 1/15/12 | 513,630 | ||||
| 804,109 | ||||||
84
Table of Contents
| MARCH 31, 2009 (UNAUDITED) | ||
| Principal Amount | Value | ||||
| Regional Banks 1.1% | |||||
| $ 800,000 | BB&T Corp., 4.75%, 10/1/12 | $ | 771,774 | ||
| 250,000 | Old National Bancorp, 5.00%, 5/20/10 MTN | 250,325 | |||
| 1,022,099 | |||||
| Residential REITs 0.2% | |||||
| 192,000 | Equity Residential Operating L.P., 6.625%, 3/15/12 | 162,813 | |||
| Soft Drinks 0.6% | |||||
| 600,000 | Bottling Group, LLC, 4.625%, 11/15/12 | 619,740 | |||
| Special Purpose Entity 0.3% | |||||
| 266,000 | Targeted Return Index Fund, 6.814%, 1/15/12, Series 2002-10 G *** | 279,774 | |||
| Systems Software 0.7% | |||||
| 650,000 | Oracle Corp., 4.95%, 4/15/13 | 683,800 | |||
| 683,800 | |||||
| Total Corporate Bonds (cost $24,769,937) | 24,280,476 | ||||
| MUNICIPAL BONDS 2.3% | |||||
| 550,000 | Access Group, Inc., DE, 1.15%, 9/1/37, Series 2002-1, Class A4 G*** | 522,500 | |||
| 650,000 | Arizona State Transportation Board Highway Revenue, 5.00%, 7/1/23 | 684,638 | |||
| 500,000 | Iowa Student Loan Liquidity Corp., 12/1/37, 0.06% G*** | 475,000 | |||
| 600,000 | Kentucky Higher Education Student Loan Corp., 6/1/36, 3.99% Series A-2 G*** | 570,000 | |||
| Total Municipal Bonds (cost $2,308,354) | 2,252,138 | ||||
| Shares | Value | ||||
| MUTUAL FUNDS 0.5% | |||||
| 39,000 | Eaton Vance Short Duration Diversified Income Fund | $ | 486,720 | ||
| Total Mutual Funds (cost $583,078) | 486,720 | ||||
| EXCHANGE TRADED FUNDS 2.2% | |||||
| 22,100 | iShares Investment Grade Corporate Bond Fund | 2,080,052 | |||
| Total Exchange Traded Funds (cost $2,047,424) | 2,080,052 | ||||
| Principal Amount | Value | ||||
| U.S. GOVERNMENT AGENCY SECURITIES 18.1% | |||||
| $1,000,000 | Federal Farm Credit Bank, 2.25%, 4/24/12 | $ | 998,595 | ||
| 1,000,000 | Federal Farm Credit Bank, 3.85%, 2/11/15 | 1,043,004 | |||
| 650,000 | Federal Farm Credit Bank, 4.875%, 4/1/14 | 712,505 | |||
| 500,000 | Federal Farm Credit Bank, 4.875%, 1/17/17 | 544,456 | |||
| 650,000 | Federal Farm Credit Bank, 5.20%, 12/27/12 | 689,081 | |||
| Principal Amount | Value | |||||
| $ | 700,000 | Federal Farm Credit Bank, 5.95%, 7/9/14 | $ | 708,288 | ||
| 500,000 | Federal Home Loan Bank, 3.375%, 8/27/10 | 504,982 | ||||
| 1,000,000 | Federal Home Loan Bank, 4.875%, 11/15/11 | 1,078,321 | ||||
| 400,000 | Federal Home Loan Bank, 5.00%, 12/16/11 | 433,287 | ||||
| 1,550,000 | Federal Home Loan Bank, 5.00%, 9/14/12 | 1,693,575 | ||||
| 1,000,000 | Federal Home Loan Bank, 5.25%, 6/10/11 | 1,079,083 | ||||
| 500,000 | Federal Home Loan Bank, 5.375%, 11/20/13 | 512,870 | ||||
| 1,400,000 | Federal Home Loan Mortgage Corp., 5.50%, 3/28/16 | 1,487,028 | ||||
| 700,000 | Federal Home Loan Mortgage Corp., 5.55%, 10/4/16 | 725,066 | ||||
| 1,250,000 | Federal National Mortgage Assoc., 4.375%, 9/15/12 | 1,349,422 | ||||
| 350,000 | Federal National Mortgage Assoc., 4.625%, 10/15/14 | 385,430 | ||||
| 700,000 | Federal National Mortgage Assoc., 5.00%, 4/26/17 | 714,647 | ||||
| 600,000 | Federal National Mortgage Assoc., 5.24%, 8/7/18 | 639,947 | ||||
| 800,000 | Tennessee Valley Authority, 6.00%, 3/15/13, Series C | 901,629 | ||||
| 1,000,000 | Tennessee Valley Authority, 6.25%, 12/15/17, Series E | 1,172,222 | ||||
Total U.S. Government Agency Securities (cost $16,591,704) | 17,373,438 | |||||
| U.S. TREASURY NOTES 5.5% | ||||||
| 1,200,000 | U.S. Treasury Note, 3.75%, 11/15/18 | 1,308,096 | ||||
| 3,500,000 | U.S. Treasury Note, 4.25%, 8/15/15 | 3,987,812 | ||||
| Total U.S. Treasury Notes (cost $4,770,096) | 5,295,908 | |||||
| U.S. TREASURY INFLATION PROTECTED BONDS 4.0% | ||||||
| 3,829,336 | U.S. Treasury Note, 1.625%, 1/15/18 | 3,870,023 | ||||
| Total U.S. Treasury Inflation Protected Bonds (cost $3,828,709) | 3,870,023 | |||||
| Shares | Value | |||||
| PREFERRED STOCKS 0.3% | ||||||
| Diversified Banks 0.2% | ||||||
| 19,700 | CABCO TST FOR GS CAP I, 3.25%, 2/15/34* ** G | $ | 199,955 | |||
| Other Diversified Financial Services 0.1% | ||||||
| 5,000 | Bank of America Corp., Pfd, Series H, 8.20%, 5/1/13* ** | 54,800 | ||||
| 8,000 | ING Group N.V., Pfd. 7.375%**, 10/15/12 (Netherlands) | 74,640 | ||||
| 129,440 | ||||||
| Total Preferred Stocks (cost $795,585) | 329,395 | |||||
85
Table of Contents
| WASATCH-1ST SOURCE INCOME FUND (FMEQX) — Schedule of Investments (continued) | ||
| Principal Amount | Value | |||||
| SHORT-TERM INVESTMENTS 4.8% | ||||||
| Repurchase Agreement 4.8% | ||||||
| $4,647,000 | Repurchase Agreement dated 3/31/09, 0.10% due 4/1/09 with Fixed Income Clearing Corporation collateralized by $3,255,000 of United States Treasury Bonds 8.125% due 8/15/19; value: $4,746,441; repurchase proceeds: $4,647,013 (cost $4,647,000) | $ | 4,647,000 | |||
| Total Short-Term Investments (cost $4,647,000) | 4,647,000 | |||||
| Total Investments (cost $95,992,858) 100.2% | 96,527,725 | |||||
| Liabilities less Other Assets (0.2)% | (238,325 | ) | ||||
| NET ASSETS 100.0% | $ | 96,289,400 | ||||
*Non-income producing.
**Common units.
***Security was fair valued under procedures adopted by the Board of Directors (see Note 2).
G Variable Rate Securities.
MTN Medium Term Note.
REIT Real Estate Investment Trust.
See notes to financial statements. |
| |||||
At March 31, 2009, Wasatch-1st Source Income Fund’s investments, excluding short-term investments, were in the following countries:
| Country | % | ||
Canada | 1.6 | ||
Jersey, C.I. | 0.2 | ||
Netherlands | 0.6 | ||
United Kingdom | 1.1 | ||
United States | 96.5 | ||
TOTAL | 100.0 | % | |
86
Table of Contents
(This page intentionally left blank.)
87
Table of Contents
| WASATCH FUNDS — Statements of Assets and Liabilities | ||
| CORE GROWTH FUND | EMERGING MARKETS SMALL CAP FUND | GLOBAL OPPORTUNITIES FUND1 | ||||||||||
Assets: | ||||||||||||
Investments, at cost | ||||||||||||
Unaffiliated issuers | $ | 510,843,800 | $ | 26,259,430 | $ | 30,130,599 | ||||||
Affiliated issuers* | — | — | — | |||||||||
Repurchase agreements | 14,435,000 | 550,000 | 4,060,000 | |||||||||
| $ | 525,278,800 | $ | 26,809,430 | $ | 34,190,599 | |||||||
Investments, at market value | ||||||||||||
Unaffiliated issuers | $ | 328,348,607 | $ | 16,423,462 | $ | 32,559,225 | ||||||
Affiliated issuers* | — | — | — | |||||||||
Repurchase agreements | 14,435,000 | 550,000 | 4,060,000 | |||||||||
| 342,783,607 | 16,973,462 | 36,619,225 | ||||||||||
Cash | 856 | 454 | 70 | |||||||||
Foreign currency on deposit (cost of $2,359,953, $33,867, $5,247, $60,072, $0, $0, $98,946, $39,956, and $11, respectively) | 2,359,555 | 33,922 | 5,306 | |||||||||
Receivable for investment securities sold | 3,419,586 | 195,335 | — | |||||||||
Receivable from broker for securities sold short | — | — | — | |||||||||
Capital shares receivable | 291,375 | 3,997 | 82,250 | |||||||||
Interest and dividends receivable | 797,907 | 51,370 | 73,933 | |||||||||
Receivable from Investment Advisor | — | 29,133 | 18,625 | |||||||||
Prepaid expenses and other assets | 29,284 | 13,111 | 47,154 | |||||||||
Unrealized appreciation on foreign currency contracts | — | 169 | — | |||||||||
Total Assets | 349,682,170 | 17,300,953 | 36,846,563 | |||||||||
Liabilities: | ||||||||||||
Call options written at value (premiums of $0, $0, $0, $0, $13,170, $3,187, $0, $0, and $0, respectively) | — | — | — | |||||||||
Payable for securities purchased | — | 42,642 | 5,002 | |||||||||
Capital shares payable | 444,343 | 13,231 | 3,919 | |||||||||
Accrued investment advisory fees | 282,033 | 25,605 | 54,069 | |||||||||
Accrued expenses and other liabilities | 315,356 | 62,765 | 20,464 | |||||||||
Accrued deferred foreign capital gains taxes | — | 8,556 | 798 | |||||||||
Unrealized depreciation on foreign currency contracts | 4,766 | — | 1 | |||||||||
Total Liabilities | 1,046,498 | 152,799 | 84,253 | |||||||||
Net Assets | $ | 348,635,672 | $ | 17,148,154 | $ | 36,762,310 | ||||||
Net Assets Consist of: | ||||||||||||
Capital stock | $ | 200,483 | $ | 210,309 | $ | 166,990 | ||||||
Paid-in capital in excess of par | 607,916,422 | 50,668,015 | 33,932,975 | |||||||||
Undistributed net investment income (loss) | (3,129,477 | ) | (47,185 | ) | (55,465 | ) | ||||||
Undistributed net realized gain (loss) on investments and foreign currency translations | (73,852,686 | ) | (23,837,928 | ) | 290,561 | |||||||
Net unrealized appreciation (depreciation) on investments and | (182,499,070 | ) | (9,845,057 | ) | 2,427,249 | |||||||
Net Assets | $ | 348,635,672 | $ | 17,148,154 | $ | 36,762,310 | ||||||
Capital Stock, $.01 par value: | ||||||||||||
Authorized | 10,000,000,000 | 10,000,000,000 | 10,000,000,000 | |||||||||
Issued and outstanding | 20,048,307 | 21,030,862 | 16,699,015 | |||||||||
NET ASSET VALUE, REDEMPTION PRICEAND OFFERING PRICE PER SHARE | $ | 17.39 | $ | 0.82 | $ | 2.20 | ||||||
1Fund | inception date was November 17, 2008. |
| *See | Note 8 for information on affiliated issuers. |
See notes to financial statements.
88
Table of Contents
| MARCH 31, 2009 (UNAUDITED) | ||
| GLOBAL SCIENCE & TECHNOLOGY FUND | HERITAGE GROWTH FUND | HERITAGE VALUE FUND | INTERNATIONAL GROWTH FUND | INTERNATIONAL OPPORTUNITIES FUND | MICRO CAP FUND | |||||||||||||||||
| $ | 57,779,093 | $ | 72,182,904 | $ | 2,464,880 | $ | 138,798,623 | $ | 57,579,568 | $ | 279,493,522 | |||||||||||
| — | — | — | — | — | 3,453,652 | |||||||||||||||||
| 2,665,000 | 960,000 | 633,000 | 1,926,000 | 4,390,000 | 6,362,000 | |||||||||||||||||
| $ | 60,444,093 | $ | 73,142,904 | $ | 3,097,880 | $ | 140,724,623 | $ | 61,969,568 | $ | 289,309,174 | |||||||||||
| $ | 40,465,110 | $ | 57,135,924 | $ | 2,389,924 | $ | 98,689,933 | $ | 46,058,740 | $ | 182,503,664 | |||||||||||
| — | — | — | — | — | 1,383,652 | |||||||||||||||||
| 2,665,000 | 960,000 | 633,000 | 1,926,000 | 4,390,000 | 6,362,000 | |||||||||||||||||
| 43,130,110 | 58,095,924 | 3,022,924 | 100,615,933 | 50,448,740 | 190,249,316 | |||||||||||||||||
| 438 | 996 | 789 | 98 | 410 | 10 | |||||||||||||||||
| 60,391 | — | — | 99,166 | 39,894 | 9 | |||||||||||||||||
| 273,562 | 434,383 | — | 96,550 | 188,741 | 1,961,791 | |||||||||||||||||
| — | 147,380 | — | — | — | 824 | |||||||||||||||||
| 1,623 | 15,298 | — | 5,680 | 93,834 | 73,202 | |||||||||||||||||
| 33,196 | 148,584 | 6,158 | 445,200 | 103,249 | 287,746 | |||||||||||||||||
| 8,924 | 16,384 | 7,121 | 6,329 | 28,771 | — | |||||||||||||||||
| 15,452 | 16,513 | 24,745 | 18,078 | 19,914 | 17,837 | |||||||||||||||||
| — | — | — | 2,506 | 106 | — | |||||||||||||||||
| 43,523,696 | 58,875,462 | 3,061,737 | 101,289,540 | 50,923,659 | 192,590,735 | |||||||||||||||||
| — | 6,600 | 2,475 | — | — | — | |||||||||||||||||
| 30,726 | — | 60,557 | 263,233 | 24,760 | 347,663 | |||||||||||||||||
| 30,932 | 20,727 | 8 | 294,641 | 23,169 | 1,141 | |||||||||||||||||
| 52,633 | 33,342 | 1,720 | 122,974 | 76,182 | 301,247 | |||||||||||||||||
| 96,191 | 66,615 | 27,762 | 173,401 | 70,767 | 113,958 | |||||||||||||||||
| — | — | — | — | 8,732 | — | |||||||||||||||||
| 78 | — | — | — | — | — | |||||||||||||||||
| 210,560 | 127,284 | 92,522 | 854,249 | 203,610 | 764,009 | |||||||||||||||||
| $ | 43,313,136 | $ | 58,748,178 | $ | 2,969,215 | $ | 100,435,291 | $ | 50,720,049 | $ | 191,826,726 | |||||||||||
| $ | 57,932 | $ | 86,284 | $ | 4,769 | $ | 120,834 | $ | 440,037 | $ | 728,659 | |||||||||||
| 96,392,901 | 82,705,408 | 4,746,853 | 225,455,971 | 82,835,405 | 380,800,864 | |||||||||||||||||
| (925,315 | ) | 245,877 | 2,948 | (7,041,172 | ) | (2,111,705 | ) | (1,757,520 | ) | |||||||||||||
| (34,898,825 | ) | (9,247,708 | ) | (1,711,108 | ) | (77,984,438 | ) | (18,913,291 | ) | (88,888,498 | ) | |||||||||||
| (17,313,557 | ) | (15,041,683 | ) | (74,247 | ) | (40,115,904 | ) | (11,530,397 | ) | (99,056,779 | ) | |||||||||||
| $ | 43,313,136 | $ | 58,748,178 | $ | 2,969,215 | $ | 100,435,291 | $ | 50,720,049 | $ | 191,826,726 | |||||||||||
| 10,000,000,000 | 10,000,000,000 | 10,000,000,000 | 10,000,000,000 | 10,000,000,000 | 10,000,000,000 | |||||||||||||||||
| 5,793,181 | 8,628,366 | 476,903 | 12,083,401 | 44,003,656 | 72,865,897 | |||||||||||||||||
| $ | 7.48 | $ | 6.81 | $ | 6.23 | $ | 8.31 | $ | 1.15 | $ | 2.63 | |||||||||||
89
Table of Contents
| WASATCH FUNDS — Statements of Assets and Liabilities (continued) | ||
| MICRO CAP VALUE FUND | SMALL CAP GROWTH FUND | SMALL CAP VALUE FUND | ||||||||||
Assets: | ||||||||||||
Investments, at cost | ||||||||||||
Unaffiliated issuers | $ | 57,140,911 | $ | 565,246,164 | $ | 215,797,365 | ||||||
Repurchase agreements | 7,099,000 | 13,020,000 | 12,592,000 | |||||||||
| $ | 64,239,911 | $ | 578,266,164 | $ | 228,389,365 | |||||||
Investments, at market value | ||||||||||||
Unaffiliated issuers | $ | 43,710,505 | $ | 480,319,826 | $ | 141,808,425 | ||||||
Repurchase agreements | 7,099,000 | 13,020,000 | 12,592,000 | |||||||||
| 50,809,505 | 493,339,826 | 154,400,425 | ||||||||||
Cash | 93 | 404 | 66 | |||||||||
Foreign currency on deposit (cost of $10,634, $5, $0, $1, $0, $0, $0, $0, and | 10,626 | 4 | — | |||||||||
Receivable for investment securities sold | 1,019,321 | 14,841,718 | 1,011,225 | |||||||||
Receivable from broker for securities sold short | 1,750,013 | — | 231,964 | |||||||||
Capital shares receivable | 155 | 1,117,773 | 20,157 | |||||||||
Interest and dividends receivable | 32,924 | 284,819 | 181,479 | |||||||||
Receivable from Investment Advisor | 12,127 | — | 8,193 | |||||||||
Prepaid expenses and other assets | 12,040 | 36,737 | 19,177 | |||||||||
Total Assets | 53,646,804 | 509,621,281 | 155,872,686 | |||||||||
Liabilities: | ||||||||||||
Call options written at value (premiums of $88,296, $0, $0, $0, $0, $0, $0, $0, | 69,500 | — | — | |||||||||
Securities sold short, at value (proceeds of $462,825, $0, $0, $460,105, $0, $0, $18,372,368, $0, and $0, respectively) | 555,480 | — | — | |||||||||
Bank overdraft | — | — | — | |||||||||
Payable for securities purchased | 758,136 | — | 1,718,660 | |||||||||
Capital shares payable | 28,839 | 421,557 | 81,182 | |||||||||
Dividends payable to shareholders | — | — | — | |||||||||
Accrued investment advisory fees | 83,148 | 405,159 | 183,522 | |||||||||
Accrued expenses and other liabilities | 81,230 | 331,513 | 190,474 | |||||||||
Accrued deferred foreign capital gains taxes | — | — | — | |||||||||
Payable for dividends on securities sold short | — | — | — | |||||||||
Unrealized depreciation on foreign currency contracts | 1,176 | — | — | |||||||||
Total Liabilities | 1,577,509 | 1,158,229 | 2,173,838 | |||||||||
Net Assets | $ | 52,069,295 | $ | 508,463,052 | $ | 153,698,848 | ||||||
Net Assets Consist of: | ||||||||||||
Capital stock | $ | 417,758 | $ | 254,609 | $ | 883,520 | ||||||
Paid-in capital in excess of par | 104,304,348 | 670,517,547 | 385,443,130 | |||||||||
Undistributed net investment income (loss) | (669,268 | ) | (1,592,668 | ) | (539,370 | ) | ||||||
Undistributed net realized gain (loss) on investments and foreign currency translations | (38,480,308 | ) | (75,791,306 | ) | (158,099,418 | ) | ||||||
Net unrealized appreciation (depreciation) on investments and foreign currency translations | (13,503,235 | ) | (84,925,130 | ) | (73,989,014 | ) | ||||||
Net Assets | $ | 52,069,295 | $ | 508,463,052 | $ | 153,698,848 | ||||||
Capital Stock, $.01 par value: | ||||||||||||
Authorized | 10,000,000,000 | 10,000,000,000 | 10,000,000,000 | |||||||||
Issued and outstanding | 41,775,800 | 25,460,937 | 88,352,039 | |||||||||
NET ASSET VALUE, REDEMPTION PRICEAND OFFERING PRICE PER SHARE | $ | 1.25 | $ | 19.97 | $ | 1.74 | ||||||
See notes to financial statements.
90
Table of Contents
| MARCH 31, 2009 (UNAUDITED) | ||
| STRATEGIC INCOME FUND | ULTRA GROWTH FUND | INCOME EQUITY FUND | LONG/SHORT FUND | U.S. TREASURY FUND | INCOME FUND | |||||||||||||||||
| $ | 20,311,078 | $ | 94,894,818 | $ | 1,051,602,489 | $ | 86,611,501 | $ | 139,713,295 | $ | 91,345,858 | |||||||||||
| 829,000 | 3,948,000 | 106,745,000 | 19,807,000 | 1,398,000 | 4,647,000 | |||||||||||||||||
| $ | 21,140,078 | $ | 98,842,818 | $ | 1,158,347,489 | $ | 106,418,501 | $ | 141,111,295 | $ | 95,992,858 | |||||||||||
| $ | 12,895,491 | $ | 78,746,744 | $ | 824,359,800 | $ | 79,413,185 | $ | 159,646,787 | $ | 91,880,725 | |||||||||||
| 829,000 | 3,948,000 | 106,745,000 | 19,807,000 | 1,398,000 | 4,647,000 | |||||||||||||||||
| 13,724,491 | 82,694,744 | 931,104,800 | 99,220,185 | 161,044,787 | 96,527,725 | |||||||||||||||||
| 701 | 317 | — | 658 | 617 | 987 | |||||||||||||||||
| | 1 | | — | — | — | — | — | |||||||||||||||
| 139,406 | 1,477,733 | 2,734,285 | 177,098 | — | 689,262 | |||||||||||||||||
| 256,901 | — | — | 23,716,950 | — | — | |||||||||||||||||
| — | 6,894 | 3,666,651 | 142,779 | 942,037 | 3,225 | |||||||||||||||||
| 136,562 | 16,630 | 1,856,057 | 101,829 | 563,412 | 778,525 | |||||||||||||||||
| 7,909 | 8,354 | — | — | — | — | |||||||||||||||||
| 25,286 | 22,668 | 302,986 | 45,290 | 26,275 | 62,862 | |||||||||||||||||
| 14,291,257 | 84,227,340 | 939,664,779 | 123,404,789 | 162,577,128 | 98,062,586 | |||||||||||||||||
| — |
| — | — | — | — | — | |||||||||||||||
| 87,531 |
| — | — | 19,734,898 | — | — | |||||||||||||||
| — | — | 423,834 | — | — | — | |||||||||||||||||
| 140,626 | — | — | 4,937,110 | — | 1,226,198 | |||||||||||||||||
| 11,898 | 75,662 | 840,671 | 55,697 | 445,906 | 406,118 | |||||||||||||||||
| 4,806 | — | 11 | — | 118,299 | 47,411 | |||||||||||||||||
| 7,858 | 84,748 | 657,376 | 88,365 | 68,745 | 44,513 | |||||||||||||||||
| 32,085 | 79,555 | 71,171 | 42,978 | 58,863 | 48,946 | |||||||||||||||||
| 83 | — | — | — | — | — | |||||||||||||||||
| — | — | — | 22,600 | — | — | |||||||||||||||||
| — | — | — | — | — | — | |||||||||||||||||
| 284,887 | 239,965 | 1,993,063 | 24,881,648 | 691,813 | 1,773,186 | |||||||||||||||||
| $ | 14,006,370 | $ | 83,987,375 | $ | 937,671,716 | $ | 98,523,141 | $ | 161,885,315 | $ | 96,289,400 | |||||||||||
| $ | 27,471 | $ | 79,503 | $ | 1,013,470 | $ | 112,545 | $ | 92,026 | $ | 98,790 | |||||||||||
| 28,271,570 | 154,002,798 | 1,228,744,441 | 127,299,601 | 135,875,606 | 99,943,235 | |||||||||||||||||
| 88,998 | (502,545 | ) | 385,196 | 14,984 | (8,575 | ) | (57,539 | ) | ||||||||||||||
| (7,336,678 | ) | (53,444,307 | ) | (65,228,472 | ) | (20,358,821 | ) | 5,992,766 | (4,229,952 | ) | |||||||||||
| (7,044,991 | ) | (16,148,074 | ) | (227,242,919 | ) | (8,545,168 | ) | 19,933,492 | 534,866 | ||||||||||||
| $ | 14,006,370 | $ | 83,987,375 | $ | 937,671,716 | $ | 98,523,141 | $ | 161,885,315 | $ | 96,289,400 | |||||||||||
| 10,000,000,000 | 10,000,000,000 | 10,000,000,000 | 10,000,000,000 | 10,000,000,000 | 10,000,000,000 | |||||||||||||||||
| 2,747,116 | 7,950,339 | 101,346,970 | 11,254,509 | 9,202,623 | 9,878,953 | |||||||||||||||||
| $ | 5.10 | $ | 10.56 | $ | 9.25 | $ | 8.75 | $ | 17.59 | $ | 9.75 | |||||||||||
91
Table of Contents
| WASATCH FUNDS — Statements of Operations | ||
| CORE GROWTH FUND | EMERGING MARKETS SMALL CAP FUND | GLOBAL OPPORTUNITIES FUND1 | ||||||||||
Investment Income: | ||||||||||||
Interest | $ | 2,199 | $ | 213 | $ | 654 | ||||||
Dividends2 | ||||||||||||
Unaffiliated issuers | 3,835,426 | 170,120 | 171,961 | |||||||||
Affiliated issuers* | — | — | — | |||||||||
Total investment income | 3,837,625 | 170,333 | 172,615 | |||||||||
Expenses: | ||||||||||||
Investment advisory fees | 1,952,665 | 180,834 | 197,563 | |||||||||
Shareholder servicing fees | 387,913 | 48,454 | 11,450 | |||||||||
Fund administration fees | 87,092 | 4,620 | 4,794 | |||||||||
Fund accounting fees | 58,775 | 14,876 | 13,605 | |||||||||
Reports to shareholders | 71,655 | 6,438 | 4,250 | |||||||||
Custody fees | 59,137 | 86,549 | 34,644 | |||||||||
Federal and state registration fees | 15,317 | 11,207 | 10,409 | |||||||||
Legal fees | 28,790 | 1,608 | 1,003 | |||||||||
Directors’ fees | 22,476 | 1,228 | 819 | |||||||||
Audit fees | 12,551 | 12,755 | 10,339 | |||||||||
Interest | 2,958 | 511 | 122 | |||||||||
Other | 37,095 | 6,201 | 5,594 | |||||||||
Total expenses before reimbursement | 2,736,424 | 375,281 | 294,592 | |||||||||
Reimbursement of expenses by Advisor | — | (157,769 | ) | (66,512 | ) | |||||||
Net Expenses | 2,736,424 | 217,512 | 228,080 | |||||||||
Net Investment Income (Loss) | 1,101,201 | (47,179 | ) | (55,465 | ) | |||||||
Realized and Unrealized Gain (Loss): | ||||||||||||
Net realized gain (loss) on investments and foreign currency translations | ||||||||||||
Unaffiliated issuers | (65,250,208 | ) | (19,353,114 | ) | 290,561 | |||||||
Affiliated issuers* | — | — | — | |||||||||
Net realized gain on options written | — | — | — | |||||||||
Realized foreign capital gains taxes | — | (2,315 | ) | — | ||||||||
Change in unrealized appreciation (depreciation) on investments and foreign currency translations | (146,097,646 | ) | 7,147,081 | 2,428,047 | ||||||||
Deferred foreign capital gains taxes | — | (8,556 | ) | (798 | ) | |||||||
Net gain (loss) on investments | (211,347,854 | ) | (12,216,904 | ) | 2,717,810 | |||||||
Net Increase (Decrease) in Net Assets Resulting from Operations | $ | (210,246,653 | ) | $ | (12,264,083 | ) | $ | 2,662,345 | ||||
1Fund | inception date was November 17, 2008. |
2Net | of $96,512, $13,424, $10,278, $14,717, $1,599, $1,189, $87,272, $25,297 and $42,368 in foreign withholding taxes, respectively. |
| *See | Note 8 for information on affiliated issuers. |
See notes to financial statements.
92
Table of Contents
| FORTHESIXMONTHSENDED MARCH 31, 2009 (UNAUDITED) | ||
| GLOBAL SCIENCE & TECHNOLOGY FUND | HERITAGE GROWTH FUND | HERITAGE VALUE FUND | INTERNATIONAL GROWTH FUND | INTERNATIONAL OPPORTUNITIES FUND | MICRO CAP FUND | |||||||||||||||||
| $ | 424 | $ | 322 | $ | 131 | $ | 4 | $ | 1,010 | $ | 1,269 | |||||||||||
| 216,373 | 550,679 | 30,468 | 1,081,929 | 303,768 | 1,812,824 | |||||||||||||||||
| — | — | — | — | — | 30,371 | |||||||||||||||||
| 216,797 | 551,001 | 30,599 | 1,081,933 | 304,778 | 1,844,464 | |||||||||||||||||
| 372,995 | 222,191 | 10,517 | 889,510 | 428,601 | 2,156,557 | |||||||||||||||||
| 100,442 | 94,237 | 12,121 | 137,284 | 81,679 | 133,768 | |||||||||||||||||
| 11,091 | 14,173 | 669 | 26,448 | 9,626 | 48,499 | |||||||||||||||||
| 14,775 | 14,147 | 4,976 | 27,777 | 18,785 | 36,753 | |||||||||||||||||
| 15,330 | 12,632 | 1,456 | 20,239 | 17,754 | 21,207 | |||||||||||||||||
| 13,866 | 8,165 | 1,845 | 84,153 | 56,184 | 26,543 | |||||||||||||||||
| 9,939 | 8,040 | 8,338 | 12,246 | 10,572 | 10,629 | |||||||||||||||||
| 3,670 | 4,491 | 65 | 8,795 | 2,696 | 16,439 | |||||||||||||||||
| 3,078 | 3,466 | 97 | 7,604 | 1,783 | 12,405 | |||||||||||||||||
| 12,551 | 12,551 | 12,502 | 12,551 | 12,551 | 12,551 | |||||||||||||||||
| 681 | 541 | 17 | 3,239 | 3,333 | 1,373 | |||||||||||||||||
| 9,956 | 9,479 | 4,766 | 18,334 | 6,733 | 21,556 | |||||||||||||||||
| 568,374 | 404,113 | 57,369 | 1,248,180 | 650,297 | 2,498,280 | |||||||||||||||||
| (82,799 | ) | (102,025 | ) | (43,079 | ) | (88,578 | ) | (160,850 | ) | (6,965 | ) | |||||||||||
| 485,575 | 302,088 | 14,290 | 1,159,602 | 489,447 | 2,491,315 | |||||||||||||||||
| (268,778 | ) | 248,913 | 16,309 | (77,669 | ) | (184,669 | ) | (646,851 | ) | |||||||||||||
| (28,431,784 | ) | (8,832,984 | ) | (1,501,260 | ) | (52,594,142 | ) | (16,097,061 | ) | (68,984,900 | ) | |||||||||||
| — | — | — | — | — | (2,836,218 | ) | ||||||||||||||||
| — | 46,310 | 264,361 | — | — | — | |||||||||||||||||
| — | — | — | — | — | — | |||||||||||||||||
| | 5,682,520 | | (14,207,611 | ) | 344,490 | (3,089,921 | ) | 1,326,225 | (54,760,184 | ) | ||||||||||||
| — | — | — | — | (8,732 | ) | — | ||||||||||||||||
| (22,749,264 | ) | (22,994,285 | ) | (892,409 | ) | (55,684,063 | ) | (14,779,568 | ) | (126,581,302 | ) | |||||||||||
| $ | (23,018,042 | ) | $ | (22,745,372 | ) | $ | (876,100 | ) | $ | (55,761,732 | ) | $ | (14,964,237 | ) | $ | (127,228,153 | ) | |||||
93
Table of Contents
| WASATCH FUNDS — Statements of Operations (continued) | ||
| MICRO CAP VALUE FUND | SMALL CAP GROWTH FUND | SMALL CAP VALUE FUND | ||||||||||
Investment Income: | ||||||||||||
Interest | $ | 970 | $ | 4,834 | $ | 1,291 | ||||||
Dividends1 | ||||||||||||
Unaffiliated issuers | 148,864 | 2,124,896 | 1,790,234 | |||||||||
Affiliated issuers* | 35,851 | |||||||||||
Other | — | — | — | |||||||||
Total investment income | 149,834 | 2,129,730 | 1,827,376 | |||||||||
Expenses: | ||||||||||||
Investment advisory fees | 586,820 | 2,598,487 | 1,377,183 | |||||||||
Shareholder servicing fees | 84,641 | 452,477 | 252,259 | |||||||||
Distribution fees | — | — | — | |||||||||
Fund administration fees | 13,184 | 115,818 | 41,020 | |||||||||
Fund accounting fees | 15,671 | 77,143 | 31,199 | |||||||||
Reports to shareholders | 11,133 | 95,600 | 55,723 | |||||||||
Custody fees | 29,297 | 43,610 | 30,564 | |||||||||
Federal and state registration fees | 13,143 | 18,019 | 12,062 | |||||||||
Legal fees | 4,566 | 36,003 | 14,537 | |||||||||
Directors’ fees | 3,303 | 26,096 | 11,321 | |||||||||
Audit fees | 12,551 | 12,551 | 12,551 | |||||||||
Dividends on securities sold short | — | — | — | |||||||||
Interest | 369 | 4,532 | 1,501 | |||||||||
Other | 8,557 | 36,254 | 20,627 | |||||||||
Total expenses before reimbursement | 783,235 | 3,516,590 | 1,860,547 | |||||||||
Reimbursement of expenses by Advisor | (117,917 | ) | — | (68,708 | ) | |||||||
Distribution fees waived | — | — | — | |||||||||
Net Expenses | 665,318 | 3,516,590 | 1,791,839 | |||||||||
Net Investment Income (Loss) | (515,484 | ) | (1,386,860 | ) | 35,537 | |||||||
Realized and Unrealized Gain (Loss): | ||||||||||||
Net realized gain (loss) on investments and foreign currency translations | ||||||||||||
Unaffiliated issuers | (28,358,878 | ) | (69,584,221 | ) | (111,213,119 | ) | ||||||
Net realized gain on options written | 1,253,052 | — | (6,809,925 | ) | ||||||||
Net realized gain (loss) on short positions | — | — | — | |||||||||
Change in unrealized appreciation (depreciation) on investments and | (2,086,292 | ) | (110,525,246 | ) | (9,410,012 | ) | ||||||
Net gain (loss) on investments | (29,192,118 | ) | (180,109,467 | ) | (127,433,056 | ) | ||||||
Net Increase (Decrease) in Net Assets Resulting from Operations | $ | (29,707,602 | ) | $ | (181,496,327 | ) | $ | (127,397,519 | ) | |||
1Net | of $4,067, $70,899, $0, $2,336, $0, $138,776, $40,278, $0, and $553 in foreign withholding taxes, respectively. |
| *See | Note 8 for information on affiliated issuers. |
See notes to financial statements.
94
Table of Contents
| FORTHESIXMONTHSENDED MARCH 31, 2009 (UNAUDITED) | ||
| STRATEGIC INCOME FUND | ULTRA FUND | INCOME EQUITY FUND | LONG/SHORT FUND | U.S. TREASURY FUND | INCOME FUND | |||||||||||||||||
| $ | 44,349 | $ | 1,415 | $ | 781,301 | $ | 1,443 | $ | 3,102,373 | $ | 1,809,583 | |||||||||||
| 499,990 | 315,149 | 12,143,122 | 1,226,205 | — | 93,293 | |||||||||||||||||
| — | — | — | — | 820 | — | |||||||||||||||||
| 544,339 | 316,564 | 12,924,423 | 1,227,648 | 3,103,193 | 1,902,876 | |||||||||||||||||
| 51,966 | 570,444 | 3,442,395 | 524,854 | 399,201 | 244,782 | |||||||||||||||||
| 22,019 | 137,594 | 181,078 | 45,132 | 83,061 | 25,211 | |||||||||||||||||
| — | — | 361,149 | 50,140 | — | 44,486 | |||||||||||||||||
| 3,315 | 20,367 | 335,263 | 42,669 | 35,339 | 39,886 | |||||||||||||||||
| 8,283 | 19,205 | 116,878 | 18,393 | 22,296 | 23,823 | |||||||||||||||||
| 2,317 | 23,297 | 78,784 | 12,812 | 10,897 | 5,645 | |||||||||||||||||
| 4,898 | 11,625 | 36,674 | 16,731 | 1,837 | 7,967 | |||||||||||||||||
| 7,518 | 10,308 | 45,533 | 21,189 | 20,410 | 9,207 | |||||||||||||||||
| 1,069 | 6,734 | 29,488 | 5,066 | 8,739 | 4,298 | |||||||||||||||||
| 728 | 5,200 | 15,013 | 1,824 | 5,448 | 1,769 | |||||||||||||||||
| 12,551 | 12,551 | 6,942 | 7,234 | 12,551 | 7,205 | |||||||||||||||||
| 3,963 | — | — | 190,665 | — | — | |||||||||||||||||
| 6,345 | 1,059 | — | — | — | — | |||||||||||||||||
| 5,336 | 12,152 | 63,988 | 10,938 | 5,497 | 7,896 | |||||||||||||||||
| 130,308 | 830,536 | 4,713,185 | 947,647 | 605,276 | 422,175 | |||||||||||||||||
| (49,474 | ) | (30,855 | ) | — | — | (6,475 | ) | — | ||||||||||||||
| — | — | (361,149 | ) | (50,140 | ) | — | (44,486 | ) | ||||||||||||||
| 80,834 | 799,681 | 4,352,036 | 897,507 | 598,801 | 377,689 | |||||||||||||||||
| 463,505 | (483,117 | ) | 8,572,387 | 330,141 | 2,504,392 | 1,525,187 | ||||||||||||||||
| (5,106,528 | ) | (50,197,217 | ) | (63,464,698 | ) | (27,936,556 | ) | 10,594,381 | (463,235 | ) | ||||||||||||
| 82,475 | — | — | — | — | — | |||||||||||||||||
| (86,106 | ) | 497,763 | — | 9,793,304 | — | — | ||||||||||||||||
| (2,160,817 | ) | 2,795,669 | (187,991,476 | ) | (2,803,916 | ) | 13,089,199 | 2,048,273 | |||||||||||||
| (7,270,976 | ) | (46,903,785 | ) | (251,456,174 | ) | (20,947,168 | ) | 23,683,580 | 1,585,038 | |||||||||||||
| $ | (6,807,471 | ) | $ | (47,386,902 | ) | $ | (242,883,787 | ) | $ | (20,617,027 | ) | $ | 26,187,972 | $ | 3,110,225 | |||||||
95
Table of Contents
| WASATCH FUNDS — Statements of Changes in Net Assets | ||
| CORE GROWTH FUND | EMERGING MARKETS SMALL CAP FUND | |||||||||||||||
| Six Months Ended March 31, 2009 (Unaudited) | Year Ended September 30, 2008 | Six Months Ended March 31, 2009 (Unaudited) | Year Ended September 30, 2008 | |||||||||||||
Operations: | ||||||||||||||||
Net investment income (loss) | $ | 1,101,201 | $ | 4,856,128 | $ | (47,179 | ) | $ | 127,023 | |||||||
Net realized gain (loss) on investments and foreign | (65,250,208 | ) | 12,903,463 | (19,355,429 | ) | (4,510,609 | ) | |||||||||
Net realized gain on options written | — | 65,169 | — | — | ||||||||||||
Change in unrealized appreciation (depreciation) on | (146,097,646 | ) | (267,260,766 | ) | 7,138,525 | (16,983,582 | ) | |||||||||
Net increase (decrease) in net assets resulting from operations | (210,246,653 | ) | (249,436,006 | ) | (12,264,083 | ) | (21,367,168 | ) | ||||||||
Dividends paid from: | ||||||||||||||||
Net investment income | (5,739,872 | ) | — | (29,720 | ) | (99,236 | ) | |||||||||
Net realized gains | — | (205,306,297 | ) | — | — | |||||||||||
| (5,739,872 | ) | (205,306,297 | ) | (29,720 | ) | (99,236 | ) | |||||||||
Capital share transactions: | ||||||||||||||||
Shares sold | 24,758,742 | 75,441,442 | 2,851,462 | 75,870,364 | ||||||||||||
Shares issued to holders in reinvestment of dividends | 5,588,262 | 196,357,419 | 28,998 | 97,575 | ||||||||||||
Shares redeemed | (111,533,810 | ) | (421,955,118 | ) | (9,623,520 | ) | (18,336,592 | ) | ||||||||
Redemption fees | 39,895 | 49,702 | 8,781 | 11,293 | ||||||||||||
Net increase (decrease) | (81,146,911 | ) | (150,106,555 | ) | (6,734,279 | ) | 57,642,640 | |||||||||
Total increase (decrease) in net assets | (297,133,436 | ) | (604,848,858 | ) | (19,028,082 | ) | 36,176,236 | |||||||||
Net assets: | ||||||||||||||||
Beginning of period | 645,769,108 | 1,250,617,966 | 36,176,236 | — | ||||||||||||
End of period | $ | 348,635,672 | $ | 645,769,108 | $ | 17,148,154 | $ | 36,176,236 | ||||||||
Undistributed net investment income (loss) included in | $ | (3,129,477 | ) | $ | 1,509,194 | $ | (47,185 | ) | $ | 29,714 | ||||||
Capital share transactions — shares: | ||||||||||||||||
Shares sold | 1,367,986 | 2,304,714 | 3,343,390 | 40,105,645 | ||||||||||||
Shares issued to holders in reinvestment of dividends | 301,416 | 5,657,085 | 34,937 | 50,039 | ||||||||||||
Shares redeemed | (6,096,825 | ) | (12,581,815 | ) | (11,603,335 | ) | (10,899,814 | ) | ||||||||
Net increase (decrease) in shares outstanding | (4,427,423 | ) | (4,620,016 | ) | (8,225,008 | ) | 29,255,870 | |||||||||
1 | Fund inception date was November 17, 2008. |
See notes to financial statements.
96
Table of Contents
| MARCH 31, 2009 | ||
| GLOBAL OPPORTUNITIES FUND | GLOBAL SCIENCE & TECHNOLOGY FUND | HERITAGE GROWTH FUND | ||||||||||||||||
| Period Ended March 31, 20091 (Unaudited) | Six Months Ended March 31, 2009 (Unaudited) | Year Ended September 30, 2008 | Six Months Ended March 31, 2009 (Unaudited) | Year Ended September 30, 2008 | ||||||||||||||
| $ | (55,465 | ) | $ | (268,778 | ) | $ | (1,853,536 | ) | $ | 248,913 | $ | 618,086 | ||||||
| 290,561 | (28,431,784 | ) | (3,525,493 | ) | (8,832,984 | ) | 2,923,875 | |||||||||||
| — | — | 35,850 | 46,310 | 187,516 | ||||||||||||||
| 2,427,249 | 5,682,520 | (60,039,104 | ) | (14,207,611 | ) | (36,207,407 | ) | |||||||||||
| 2,662,345 | (23,018,042 | ) | (65,382,283 | ) | (22,745,372 | ) | (32,477,930 | ) | ||||||||||
| — | — | — | (167,143 | ) | — | |||||||||||||
| — | — | (17,434,195 | ) | (220,964 | ) | (14,407,067 | ) | |||||||||||
| — | — | (17,434,195 | ) | (388,107 | ) | (14,407,067 | ) | |||||||||||
| 34,805,561 | 1,823,932 | 35,585,007 | 2,663,910 | 7,026,838 | ||||||||||||||
| — | — | 16,802,106 | 374,358 | 14,080,421 | ||||||||||||||
| (709,758 | ) | (17,657,376 | ) | (91,579,559 | ) | (16,571,293 | ) | (87,728,948 | ) | |||||||||
| 4,162 | 603 | 30,453 | 645 | 2,612 | ||||||||||||||
| 34,099,965 | (15,832,841 | ) | (39,161,993 | ) | (13,532,380 | ) | (66,619,077 | ) | ||||||||||
| 36,762,310 | (38,850,883 | ) | (121,978,471 | ) | (36,665,859 | ) | (113,504,074 | ) | ||||||||||
| — | 82,164,019 | 204,142,490 | 95,414,037 | 208,918,111 | ||||||||||||||
| $ | 36,762,310 | $ | 43,313,136 | $ | 82,164,019 | $ | 58,748,178 | $ | 95,414,037 | |||||||||
| $ | (55,465 | ) | $ | (925,315 | ) | $ | (656,537 | ) | $ | 245,877 | $ | 164,107 | ||||||
| 17,042,198 | 243,878 | 2,381,520 | 396,204 | 643,479 | ||||||||||||||
| — | — | 1,098,177 | 55,297 | 1,267,365 | ||||||||||||||
| (343,183 | ) | (2,422,429 | ) | (7,049,819 | ) | (2,422,792 | ) | (7,926,581 | ) | |||||||||
| 16,699,015 | (2,178,551 | ) | (3,570,122 | ) | (1,971,291 | ) | (6,015,737 | ) | ||||||||||
97
Table of Contents
| WASATCH FUNDS — Statements of Changes in Net Assets (continued) | ||
| HERITAGE VALUE FUND | INTERNATIONAL GROWTH FUND | |||||||||||||||
| Six Months Ended March 31, 2009 (Unaudited) | Year Ended September 30, 2008 | Six Months Ended March 31, 2009 (Unaudited) | Year Ended September 30, 2008 | |||||||||||||
Operations: | ||||||||||||||||
Net investment income (loss) | $ | 16,309 | $ | 53,508 | $ | (77,669 | ) | $ | (578,642 | ) | ||||||
Net realized gain (loss) on investments and foreign | (1,501,260 | ) | (776,364 | ) | (52,594,142 | ) | (6,811,237 | ) | ||||||||
Net realized gain on options written | 264,361 | 316,005 | — | — | ||||||||||||
Net realized gain (loss) on short positions | — | (986 | ) | — | — | |||||||||||
Change in unrealized appreciation (depreciation) on | 344,490 | (461,738 | ) | (3,089,921 | ) | (185,431,901 | ) | |||||||||
Net decrease in net assets resulting from operations | (876,100 | ) | (869,575 | ) | (55,761,732 | ) | (192,821,780 | ) | ||||||||
Dividends paid from: | ||||||||||||||||
Net investment income | (47,255 | ) | (40,797 | ) | (466,090 | ) | (14,999,689 | ) | ||||||||
Net realized gains | — | (15,127 | ) | — | (53,899,506 | ) | ||||||||||
| (47,255 | ) | (55,924 | ) | (466,090 | ) | (68,899,195 | ) | |||||||||
Capital share transactions: | ||||||||||||||||
Shares sold | 725,532 | 3,275,032 | 5,744,015 | 56,044,771 | ||||||||||||
Shares issued to holders in reinvestment of dividends | 43,764 | 55,698 | 447,546 | 67,297,473 | ||||||||||||
Shares redeemed | (669,077 | ) | (1,046,240 | ) | (44,313,574 | ) | (201,780,070 | ) | ||||||||
Redemption fees | 185 | 791 | 5,207 | 36,035 | ||||||||||||
Net increase (decrease) | 100,404 | 2,285,281 | (38,116,806 | ) | (78,401,791 | ) | ||||||||||
Total increase (decrease) in net assets | (822,951 | ) | 1,359,782 | (94,344,628 | ) | (340,122,766 | ) | |||||||||
Net assets: | ||||||||||||||||
Beginning of period | 3,792,166 | 2,432,384 | 194,779,919 | 534,902,685 | ||||||||||||
End of period | $ | 2,969,215 | $ | 3,792,166 | $ | 100,435,291 | $ | 194,779,919 | ||||||||
Undistributed net investment income (loss) included in | $ | 2,948 | $ | 33,894 | $ | (7,041,172 | ) | $ | (6,497,413 | ) | ||||||
Capital share transactions — shares: | ||||||||||||||||
Shares sold | 109,007 | 334,711 | 652,319 | 2,743,933 | ||||||||||||
Shares issued to holders in reinvestment of dividends | 6,723 | 5,678 | 50,513 | 3,356,483 | ||||||||||||
Shares redeemed | (102,412 | ) | (114,532 | ) | (5,079,490 | ) | (11,547,140 | ) | ||||||||
Net increase (decrease) in shares outstanding | 13,318 | 225,857 | (4,376,658 | ) | (5,446,724 | ) | ||||||||||
See notes to financial statements.
98
Table of Contents
| MARCH 31, 2009 | ||
| INTERNATIONAL OPPORTUNITIES FUND | MICRO CAP FUND | MICRO CAP VALUE FUND | ||||||||||||||||||||
| Six Months Ended March 31, 2009 (Unaudited) | Year Ended September 30, 2008 | Six Months Ended March 31, 2009 (Unaudited) | Year Ended September 30, 2008 | Six Months Ended March 31, 2009 (Unaudited) | Year Ended September 30, 2008 | |||||||||||||||||
| $ | (184,669 | ) | $ | (48,164 | ) | $ | (646,851 | ) | $ | (6,107,945 | ) | $ | (515,484 | ) | $ | (1,351,039 | ) | |||||
| (16,097,061 | ) | (761,977 | ) | (71,821,118 | ) | 4,651,383 | (28,358,878 | ) | (12,006,387 | ) | ||||||||||||
| — | 21,037 | — | — | 1,253,052 | 2,052,817 | |||||||||||||||||
| — | 112,630 | — | — | — | 605,545 | |||||||||||||||||
| 1,317,493 | (29,949,193 | ) | (54,760,184 | ) | (173,381,475 | ) | (2,086,292 | ) | (29,171,790 | ) | ||||||||||||
| (14,964,237 | ) | (30,625,667 | ) | (127,228,153 | ) | (174,838,037 | ) | (29,707,602 | ) | (39,870,854 | ) | |||||||||||
| (168,034 | ) | (2,089,316 | ) | (777,904 | ) | — | — | — | ||||||||||||||
| — | (8,029,593 | ) | — | (98,389,979 | ) | — | (16,429,060 | ) | ||||||||||||||
| (168,034 | ) | (10,118,909 | ) | (777,904 | ) | (98,389,979 | ) | — | (16,429,060 | ) | ||||||||||||
| 18,943,214 | 41,682,055 | 11,505,784 | 16,149,674 | 5,595,806 | 46,417,131 | |||||||||||||||||
| 163,313 | 9,911,885 | 743,955 | 94,126,664 | — | 16,104,543 | |||||||||||||||||
| (8,973,863 | ) | (11,598,986 | ) | (51,814,885 | ) | (109,078,570 | ) | (21,737,114 | ) | (28,353,838 | ) | |||||||||||
| 29,145 | 6,956 | 4,416 | 6,533 | 6,661 | 4,193 | |||||||||||||||||
| 10,161,809 | 40,001,910 | (39,560,730 | ) | 1,204,301 | (16,134,647 | ) | 34,172,029 | |||||||||||||||
| (4,970,462 | ) | (742,666 | ) | (167,566,787 | ) | (272,023,715 | ) | (45,842,249 | ) | (22,127,885 | ) | |||||||||||
| 55,690,511 | 56,433,177 | 359,393,513 | 631,417,228 | 97,911,544 | 120,039,429 | |||||||||||||||||
| $ | 50,720,049 | $ | 55,690,511 | $ | 191,826,726 | $ | 359,393,513 | $ | 52,069,295 | $ | 97,911,544 | |||||||||||
| $ | (2,111,705 | ) | $ | (1,759,002 | ) | $ | (1,757,520 | ) | $ | (332,765 | ) | $ | (669,268 | ) | $ | (153,784 | ) | |||||
| 16,762,702 | 21,166,986 | 4,095,842 | 3,153,341 | 4,347,849 | 20,583,227 | |||||||||||||||||
| 133,863 | 3,604,322 | 265,698 | 16,778,372 | — | 6,493,767 | |||||||||||||||||
| (7,693,237 | ) | (5,453,107 | ) | (18,259,675 | ) | (20,943,978 | ) | (16,927,302 | ) | (12,980,831 | ) | |||||||||||
| 9,203,328 | 19,318,201 | (13,898,135 | ) | (1,012,265 | ) | (12,579,453 | ) | 14,096,163 | ||||||||||||||
99
Table of Contents
| WASATCH FUNDS — Statements of Changes in Net Assets (continued) | ||
SMALL CAP GROWTH FUND | SMALL CAP VALUE FUND | |||||||||||||||
| Six Months Ended March 31, 2009 (Unaudited) | Year Ended September 30, 2008 | Six Months March 31, 2009 | Year Ended September 30, 2008 | |||||||||||||
Operations: | ||||||||||||||||
Net investment income (loss) | $ | (1,386,860 | ) | $ | (4,329,573 | ) | $ | 35,537 | $ | 694,357 | ||||||
Net realized gain (loss) on investments and foreign | (69,584,221 | ) | 10,759,204 | (118,449,202 | ) | (26,463,524 | ) | |||||||||
Net realized gain on options written | — | — | 426,158 | 1,264,596 | ||||||||||||
Net realized gain (loss) on short positions | — | (847,296 | ) | — | 862,688 | |||||||||||
Change in unrealized appreciation (depreciation) on | (110,525,246 | ) | (265,175,462 | ) | (9,410,012 | ) | (116,642,157 | ) | ||||||||
Net decrease in net assets resulting from operations | (181,496,327 | ) | (259,593,127 | ) | (127,397,519 | ) | (140,284,040 | ) | ||||||||
Dividends paid from: | ||||||||||||||||
Net investment income | — | — | — | (1,304,069 | ) | |||||||||||
Net realized gains | (1,539,215 | ) | (120,648,854 | ) | — | (141,790,472 | ) | |||||||||
Return of Capital | — | — | — | — | ||||||||||||
| (1,539,215 | ) | (120,648,854 | ) | — | (143,094,541 | ) | ||||||||||
Capital share transactions: | ||||||||||||||||
Shares sold | 63,555,424 | 154,963,117 | 17,679,581 | 66,338,622 | ||||||||||||
Shares issued to holders in reinvestment of dividends | 1,498,523 | 117,697,647 | — | 137,074,565 | ||||||||||||
Shares redeemed | (109,138,942 | ) | (232,359,422 | ) | (73,502,742 | ) | (243,774,324 | ) | ||||||||
Redemption fees | 37,383 | 53,796 | 5,380 | 16,798 | ||||||||||||
Net increase (decrease) | (44,047,612 | ) | 40,355,138 | (55,817,781 | ) | (40,344,339 | ) | |||||||||
Total increase (decrease) in net assets | (227,083,154 | ) | (339,886,843 | ) | (183,215,300 | ) | (323,722,920 | ) | ||||||||
Net assets: | ||||||||||||||||
Beginning of period | 735,546,206 | 1,075,433,049 | 336,914,148 | 660,637,068 | ||||||||||||
End of period | $ | 508,463,052 | $ | 735,546,206 | $ | 153,698,848 | $ | 336,914,148 | ||||||||
Undistributed net investment income (loss) included in | $ | (1,592,668 | ) | $ | (205,808 | ) | $ | (539,370 | ) | $ | (574,907 | ) | ||||
Capital share transactions — shares: | ||||||||||||||||
Shares sold | 3,152,549 | 4,910,006 | 9,580,947 | 18,735,565 | ||||||||||||
Shares issued to holders in reinvestment of dividends | 73,746 | 3,294,085 | — | 38,504,091 | ||||||||||||
Shares redeemed | (5,523,567 | ) | (7,263,863 | ) | (40,861,174 | ) | (64,253,288 | ) | ||||||||
Net increase (decrease) in shares outstanding | (2,297,272 | ) | 940,228 | (31,280,227 | ) | (7,013,632 | ) | |||||||||
See notes to financial statements.
100
Table of Contents
| MARCH 31, 2009 | ||
STRATEGIC INCOME FUND | ULTRA GROWTH FUND | INCOME EQUITY FUND | ||||||||||||||||||||
| Six Months Ended March 31, 2009 (Unaudited) | Year Ended September 30, 2008 | Six Months Ended March 31, 2009 (Unaudited) | Year Ended September 30, 2008 | Six Months March 31, 2009 | Year Ended September 30, 2008 | |||||||||||||||||
| $ | 463,505 | $ | 1,229,319 | $ | (483,117 | ) | $ | (1,971,029 | ) | $ | 8,572,387 | $ | 6,391,793 | |||||||||
| (5,106,528 | ) | (3,227,582 | ) | (50,197,217 | ) | 5,945,886 | (63,464,698 | ) | 7,518 | |||||||||||||
| 82,475 | 387,076 | — | 274,600 | — | — | |||||||||||||||||
| (86,106 | ) | 1,439,965 | 497,763 | (414,078 | ) | — | — | |||||||||||||||
| (2,160,817 | ) | (4,016,554 | ) | 2,795,669 | (87,629,925 | ) | (187,991,476 | ) | (89,835,019 | ) | ||||||||||||
| (6,807,471 | ) | (4,187,776 | ) | (47,386,902 | ) | (83,794,546 | ) | (242,883,787 | ) | (83,435,708 | ) | |||||||||||
| (458,552 | ) | (1,057,146 | ) | — | — | (8,729,451 | ) | (6,063,576 | ) | |||||||||||||
| — | (2,217,011 | ) | — | (32,302,048 | ) | — | — | |||||||||||||||
| — | — | — | — | — | (112,239 | ) | ||||||||||||||||
| (458,552 | ) | (3,274,157 | ) | — | (32,302,048 | ) | (8,729,451 | ) | (6,175,815 | ) | ||||||||||||
| 419,276 | 11,271,913 | 5,872,096 | 23,567,676 | 554,905,392 | 493,306,878 | |||||||||||||||||
| 448,488 | 3,204,301 | — | 31,508,337 | 7,680,861 | 5,067,853 | |||||||||||||||||
| (1,484,695 | ) | (8,749,445 | ) | (18,507,379 | ) | (63,614,008 | ) | (153,720,658 | ) | (76,053,584 | ) | |||||||||||
| 144 | 3,128 | 5,982 | 5,057 | 35,238 | — | |||||||||||||||||
| (616,787 | ) | 5,729,897 | (12,629,301 | ) | (8,532,938 | ) | 408,900,833 | 422,321,147 | ||||||||||||||
| (7,882,810 | ) | (1,732,036 | ) | (60,016,203 | ) | (124,629,532 | ) | 157,287,595 | 332,709,624 | |||||||||||||
| 21,889,180 | 23,621,216 | 144,003,578 | 268,633,110 | 780,384,121 | 447,674,497 | |||||||||||||||||
| $ | 14,006,370 | $ | 21,889,180 | $ | 83,987,375 | $ | 144,003,578 | $ | 937,671,716 | $ | 780,384,121 | |||||||||||
| $ | 88,998 | $ | 84,045 | $ | (502,545 | ) | $ | (19,428 | ) | $ | 385,196 | $ | 542,260 | |||||||||
| 72,108 | 1,304,234 | 534,670 | 1,068,307 | 56,088,423 | 34,354,765 | |||||||||||||||||
| 86,170 | 347,534 | — | 1,297,708 | 805,542 | 359,009 | |||||||||||||||||
| (283,316 | ) | (926,251 | ) | (1,723,009 | ) | (2,896,081 | ) | (15,890,251 | ) | (5,377,107 | ) | |||||||||||
| (125,038 | ) | 725,517 | (1,188,339 | ) | (530,066 | ) | 41,003,714 | 29,336,667 | ||||||||||||||
101
Table of Contents
| WASATCH FUNDS — Statements of Changes in Net Assets (continued) | ||
| LONG/SHORT FUND | U.S. TREASURY FUND | |||||||||||||||
| Six Months Ended March 31, 2009 (Unaudited) | Year Ended September 30, 2008 | Six Months Ended March 31, 2009 (Unaudited) | Year Ended September 30, 2008 | |||||||||||||
Operations: | ||||||||||||||||
Net investment income | $ | 330,141 | $ | 506,511 | $ | 2,504,392 | $ | 4,603,385 | ||||||||
Net realized gain (loss) on investments and foreign | (27,936,556 | ) | (1,639,401 | ) | 10,594,381 | 2,091,586 | ||||||||||
Net realized gain on short positions | 9,793,304 | — | — | — | ||||||||||||
Change in unrealized appreciation (depreciation) on | (2,803,916 | ) | (4,654,306 | ) | 13,089,199 | 6,237,874 | ||||||||||
Net increase (decrease) in net assets resulting from operations | (20,617,027 | ) | (5,787,196 | ) | 26,187,972 | 12,932,845 | ||||||||||
Dividends paid from: | ||||||||||||||||
Net investment income | (556,325 | ) | (419,058 | ) | (2,513,020 | ) | (4,603,049 | ) | ||||||||
Net realized gains | (1,579,189 | ) | — | — | — | |||||||||||
Return of Capital | — | (59,547 | ) | — | — | |||||||||||
| (2,135,514 | ) | (478,605 | ) | (2,513,020 | ) | (4,603,049 | ) | |||||||||
Capital share transactions: | ||||||||||||||||
Shares sold | 35,244,484 | 51,821,912 | 94,667,009 | 78,165,995 | ||||||||||||
Shares issued to holders in reinvestment of dividends | 1,826,247 | 397,821 | 2,261,952 | 4,167,049 | ||||||||||||
Shares redeemed | (37,913,934 | ) | (11,249,918 | ) | (80,384,122 | ) | (85,104,785 | ) | ||||||||
Redemption fees | 4,920 | — | 245,639 | 73,908 | ||||||||||||
Net increase (decrease) | (838,283 | ) | 40,969,815 | 16,790,478 | (2,697,833 | ) | ||||||||||
Total increase (decrease) in net assets | (23,590,824 | ) | 34,704,014 | 40,465,430 | 5,631,963 | |||||||||||
Net assets: | ||||||||||||||||
Beginning of period | 122,113,965 | 87,409,951 | 121,419,885 | 115,787,922 | ||||||||||||
End of period | $ | 98,523,141 | $ | 122,113,965 | $ | 161,885,315 | $ | 121,419,885 | ||||||||
Undistributed net investment income (loss) included in | $ | 14,984 | $ | 241,168 | $ | (8,575 | ) | $ | 53 | |||||||
Capital share transactions — shares: | ||||||||||||||||
Shares sold | 4,029,357 | 4,496,374 | 5,576,253 | 5,302,453 | ||||||||||||
Shares issued to holders in reinvestment of dividends | 209,878 | 33,910 | 120,936 | 282,613 | ||||||||||||
Shares redeemed | (4,283,076 | ) | (987,313 | ) | (4,616,994 | ) | (5,828,618 | ) | ||||||||
Net increase (decrease) in shares outstanding | (43,841 | ) | 3,542,971 | 1,080,195 | (243,552 | ) | ||||||||||
See notes to financial statements.
102
Table of Contents
| MARCH 31, 2009 | ||
| INCOME FUND | ||||||||||||||
| Six Months Ended March 31, 2009 (Unaudited) | Year Ended September 30, 2008 | |||||||||||||
| $ | 1,525,187 | $ | 1,665,562 | |||||||||||
| (463,235 | ) | (247,963 | ) | |||||||||||
| — | — | |||||||||||||
| 2,048,273 | (2,942,965 | ) | ||||||||||||
| 3,110,225 | (1,525,366 | ) | ||||||||||||
| (1,657,101 | ) | (1,804,021 | ) | |||||||||||
| — | — | |||||||||||||
| — | — | |||||||||||||
| (1,657,101 | ) | (1,804,021 | ) | |||||||||||
| 26,221,701 | 16,839,954 | |||||||||||||
| 1,387,824 | 1,514,366 | |||||||||||||
| (21,854,867 | ) | (12,925,350 | ) | |||||||||||
| 707 | — | |||||||||||||
| 5,755,365 | 5,428,970 | |||||||||||||
| 7,208,489 | 2,099,583 | |||||||||||||
| 89,080,911 | 86,981,328 | |||||||||||||
| $ | 96,289,400 | $ | 89,080,911 | |||||||||||
| $ | (57,539 | ) | $ | 74,375 | ||||||||||
| 2,712,067 | 1,717,846 | |||||||||||||
| 144,308 | 155,705 | |||||||||||||
| (2,267,791 | ) | (1,324,409 | ) | |||||||||||
| 588,584 | 549,142 | |||||||||||||
103
Table of Contents
| WASATCH FUNDS — Financial Highlights | ||
| CORE GROWTH FUND | Six Months Ended March 31 (Unaudited) | Year Ended September 30 | ||||||||||||||||||||||
| (for a share outstanding throughout each period) | 2009 | 2008 | 2007 | 2006 | 2005 | 2004 | ||||||||||||||||||
Net asset value, beginning of period | $ | 26.38 | $ | 42.98 | $ | 41.08 | $ | 43.92 | $ | 38.49 | $ | 33.54 | ||||||||||||
Income (loss) from investment operations: | ||||||||||||||||||||||||
Net investment income (loss) | 0.05 | 0.19 | (0.05 | ) | 0.17 | 0.56 | 0.13 | |||||||||||||||||
Net realized and unrealized gains (losses) on investments | (8.77 | ) | (8.98 | ) | 5.65 | 0.90 | 6.41 | 4.84 | ||||||||||||||||
Net increase from payment by affiliate | — | — | — | — | — | 1 | — | |||||||||||||||||
Total from investment operations | (8.72 | ) | (8.79 | ) | 5.60 | 1.07 | 6.97 | 4.97 | ||||||||||||||||
Redemption fees (see Note 2) | — | 1 | — | 1 | — | 1 | — | 1 | — | 1 | — | 1 | ||||||||||||
Less distributions: | ||||||||||||||||||||||||
Dividends from net investment income | (0.27 | ) | — | (0.14 | ) | (0.63 | ) | (0.22 | ) | (0.02 | ) | |||||||||||||
Distributions from net realized gains | — | (7.81 | ) | (3.56 | ) | (3.28 | ) | (1.32 | ) | — | ||||||||||||||
Total distributions | (0.27 | ) | (7.81 | ) | (3.70 | ) | (3.91 | ) | (1.54 | ) | (0.02 | ) | ||||||||||||
Net asset value, end of period | $ | 17.39 | $ | 26.38 | $ | 42.98 | $ | 41.08 | $ | 43.92 | $ | 38.49 | ||||||||||||
Total return2 | (33.11)% | (24.82)% | 14.28% | 2.46% | 18.58% | 4 | 14.80% | |||||||||||||||||
Supplemental data and ratios: | ||||||||||||||||||||||||
Net assets, end of period (in thousands) | $ | 348,636 | $ | 645,769 | $ | 1,250,618 | $ | 1,381,027 | $ | 1,704,690 | $ | 1,496,969 | ||||||||||||
Ratio of expenses to average net assets3 | 1.40% | 1.21% | 1.18% | 1.17% | 1.20% | 1.21% | ||||||||||||||||||
Ratio of net investment income (loss) to average net assets3 | 0.56% | 0.52% | (0.09)% | 0.38% | 1.30% | 0.34% | ||||||||||||||||||
Portfolio turnover rate2 | 14% | 44% | 54% | 42% | 42% | 47% | ||||||||||||||||||
| EMERGING MARKETS SMALL CAP FUND | Six Months Ended March 31 (Unaudited) | Period Ended September 30 | ||||||||||||||||||||||
| (for a share outstanding throughout each period) | 2009 | 20085 | ||||||||||||||||||||||
Net asset value, beginning of period | $ | 1.24 | $ | 2.00 | ||||||||||||||||||||
Loss from investment operations: | ||||||||||||||||||||||||
Net investment income | — | — | ||||||||||||||||||||||
Net realized and unrealized losses on investments | (0.42 | ) | (0.76 | ) | ||||||||||||||||||||
Total from investment operations | (0.42 | ) | (0.76 | ) | ||||||||||||||||||||
Redemption fees (see Note 2) | — | 1 | — | 1 | ||||||||||||||||||||
Total distributions | — | 1 | — | 1 | ||||||||||||||||||||
Net asset value, end of period | $ | 0.82 | $ | 1.24 | ||||||||||||||||||||
Total return2 | (33.77)% | (37.88)% | ||||||||||||||||||||||
Supplemental data and ratios: | ||||||||||||||||||||||||
Net assets, end of period (in thousands) | $ | 17,148 | $ | 36,176 | ||||||||||||||||||||
Ratio of expenses to average net assets: | ||||||||||||||||||||||||
Net of waivers and reimbursements3 | 2.10% | 2.10% | ||||||||||||||||||||||
Before waivers and reimbursements3 | 3.63% | 2.67% | ||||||||||||||||||||||
Ratio of net investment income (loss) to average net assets: | ||||||||||||||||||||||||
Net of waivers and reimbursements3 | (0.46)% | 0.27% | ||||||||||||||||||||||
Before waivers and reimbursements3 | (1.99)% | (0.29)% | ||||||||||||||||||||||
Portfolio turnover rate2 | 51% | 38% | ||||||||||||||||||||||
1 | Represents amounts less than $.005 per share. |
2 | Not annualized for periods less than one year. |
3 | Annualized. |
4 | In 2005, 0.03% of the Fund’s total return consisted of a voluntary reimbursement by the Advisor for amounts relating to errors in applying the Fund’s cross-trading policies. Excluding this item, the total return would have been 18.55%. |
5 | Fund inception date was October 1, 2007. |
See notes to financial statements.
104
Table of Contents
| MARCH 31, 2009 | ||
| GLOBAL OPPORTUNITIES FUND | Period Ended March 31 (Unaudited) | |||||||||||||||||||||||
| (for a share outstanding throughout each period) | 20091 | |||||||||||||||||||||||
Net asset value, beginning of period | $ | 2.00 | ||||||||||||||||||||||
Income from investment operations: | ||||||||||||||||||||||||
Net investment income (loss) | — | |||||||||||||||||||||||
Net realized and unrealized gains on investments | 0.20 | |||||||||||||||||||||||
Total from investment operations | 0.20 | |||||||||||||||||||||||
Redemption fees (see Note 2) | — | 2 | ||||||||||||||||||||||
Total distributions | — | |||||||||||||||||||||||
Net asset value, end of period | $ | 2.20 | ||||||||||||||||||||||
Total return3 | 10.00% | |||||||||||||||||||||||
Supplemental data and ratios: | ||||||||||||||||||||||||
Net assets, end of period (in thousands) | $ | 36,762 | ||||||||||||||||||||||
Ratio of expenses to average net assets: | ||||||||||||||||||||||||
Net of waivers and reimbursements4 | 2.25% | |||||||||||||||||||||||
Before waivers and reimbursements4 | 2.91% | |||||||||||||||||||||||
Ratio of net investment loss to average net assets: | ||||||||||||||||||||||||
Net of waivers and reimbursements4 | (0.55)% | |||||||||||||||||||||||
Before waivers and reimbursements4 | (1.21)% | |||||||||||||||||||||||
Portfolio turnover rate3 | 9% | |||||||||||||||||||||||
| GLOBAL SCIENCE & TECHNOLOGY FUND | Six Months Ended March 31 (Unaudited) | Year Ended September 30 | ||||||||||||||||||||||
| (for a share outstanding throughout each period) | 2009 | 2008 | 2007 | 2006 | 2005 | 2004 | ||||||||||||||||||
Net asset value, beginning of period | $ | 10.31 | $ | 17.69 | $ | 13.97 | $ | 12.98 | $ | 10.15 | $ | 10.73 | ||||||||||||
Income (loss) from investment operations: | ||||||||||||||||||||||||
Net investment loss | (0.08 | ) | (0.25 | ) | (0.12 | ) | (0.14 | ) | (0.16 | ) | (0.18 | ) | ||||||||||||
Net realized and unrealized gains (losses) on investments | (2.75 | ) | (5.65 | ) | 4.43 | 1.40 | 2.99 | (0.41 | ) | |||||||||||||||
Net increase from payment by affiliate | — | — | — | — | — | 2 | — | |||||||||||||||||
Total from investment operations | (2.83 | ) | (5.90 | ) | 4.31 | 1.26 | 2.83 | (0.59 | ) | |||||||||||||||
Redemption fees (see Note 2) | — | 2 | — | 2 | — | 2 | — | 2 | — | 2 | 0.01 | |||||||||||||
Less distributions: | ||||||||||||||||||||||||
Dividends from net investment income | — | — | — | — | — | — | ||||||||||||||||||
Distributions from net realized gains | — | (1.48 | ) | (0.59 | ) | (0.27 | ) | — | — | |||||||||||||||
Total distributions | — | (1.48 | ) | (0.59 | ) | (0.27 | ) | — | �� | — | ||||||||||||||
Net asset value, end of period | $ | 7.48 | $ | 10.31 | $ | 17.69 | $ | 13.97 | $ | 12.98 | $ | 10.15 | ||||||||||||
Total return3 | (27.45)% | (36.07)% | 31.63% | 9.81% | 27.88% | 5 | (5.49)% | |||||||||||||||||
Supplemental data and ratios: | ||||||||||||||||||||||||
Net assets, end of period (in thousands) | $ | 43,313 | $ | 82,164 | $ | 204,142 | $ | 126,359 | $ | 89,353 | $ | 69,301 | ||||||||||||
Ratio of expenses to average net assets: | ||||||||||||||||||||||||
Net of waivers and reimbursements4 | 1.95% | 1.92% | 1.85% | 1.94% | 1.95% | 1.95% | ||||||||||||||||||
Before waivers and reimbursements4 | 2.28% | 1.92% | 1.85% | 1.94% | 1.97% | 1.97% | ||||||||||||||||||
Ratio of net investment loss to average net assets: | ||||||||||||||||||||||||
Net of waivers and reimbursements4 | (1.08)% | (1.24)% | (0.97)% | (1.15)% | (1.52)% | (1.66)% | ||||||||||||||||||
Before waivers and reimbursements4 | (1.41)% | (1.24)% | (0.97)% | (1.15)% | (1.54)% | (1.68)% | ||||||||||||||||||
Portfolio turnover rate3 | 25% | 89% | 78% | 58% | 80% | 55% | ||||||||||||||||||
1 | Fund inception date was November 17, 2008. |
2 | Represents amounts less than $.005 per share. |
3 | Not annualized for periods less than one year. |
4 | Annualized. |
5 | In 2005, the Fund’s total return included a voluntary reimbursement by the Advisor for amounts relating to errors in applying the Funds’ cross-trading policies that had no impact on the total return. |
See notes to financial statements.
105
Table of Contents
| WASATCH FUNDS — Financial Highlights (continued) | ||
| HERITAGE GROWTH FUND | Six Months Ended March 31 (Unaudited) | Year or Period Ended September 30 | ||||||||||||||||||||||
| (for a share outstanding throughout each period) | 2009 | 2008 | 2007 | 2006 | 2005 | 20041 | ||||||||||||||||||
Net asset value, beginning of period | $ | 9.00 | $ | 12.57 | $ | 11.40 | $ | 11.43 | $ | 9.86 | $ | 10.00 | ||||||||||||
Income (loss) from investment operations: | ||||||||||||||||||||||||
Net investment income (loss) | 0.03 | 0.06 | (0.01 | ) | — | 2 | 0.02 | — | 2 | |||||||||||||||
Net realized and unrealized gains (losses) on investments | (2.18 | ) | (2.57 | ) | 1.53 | 0.28 | 1.55 | (0.14 | ) | |||||||||||||||
Net increase from payment by affiliate | — | — | — | — | — | 2 | — | |||||||||||||||||
Total from investment operations | (2.15 | ) | (2.51 | ) | 1.52 | 0.28 | 1.57 | (0.14 | ) | |||||||||||||||
Redemption fees (see Note 2) | — | 2 | — | 2 | — | 2 | — | 2 | — | 2 | — | 2 | ||||||||||||
Less distributions: | ||||||||||||||||||||||||
Dividends from net investment income | (0.02 | ) | — | — | 2 | (0.01 | ) | — | — | |||||||||||||||
Distributions from net realized gains | (0.02 | ) | (1.06 | ) | (0.35 | ) | (0.30 | ) | — | 2 | — | |||||||||||||
Total distributions | (0.04 | ) | (1.06 | ) | (0.35 | ) | (0.31 | ) | — | — | ||||||||||||||
Net asset value, end of period | $ | 6.81 | $ | 9.00 | $ | 12.57 | $ | 11.40 | $ | 11.43 | $ | 9.86 | ||||||||||||
Total return3 | (23.87)% | (21.54)% | 13.59% | 2.46% | 15.95% | 5 | (1.40)% | |||||||||||||||||
Supplemental data and ratios: | ||||||||||||||||||||||||
Net assets, end of period (in thousands) | $ | 58,748 | $ | 95,414 | $ | 208,918 | $ | 244,380 | $ | 304,670 | $ | 128,136 | ||||||||||||
Ratio of expenses to average net assets: | ||||||||||||||||||||||||
Net of waivers and reimbursements4 | 0.95% | 0.95% | 0.95% | 0.95% | 0.95% | 0.95% | ||||||||||||||||||
Before waivers and reimbursements4 | 1.27% | 1.01% | 0.95% | 0.95% | 0.99% | 1.26% | ||||||||||||||||||
Ratio of net investment income (loss) to average net assets: | ||||||||||||||||||||||||
Net of waivers and reimbursements4 | 0.78% | 0.44% | (0.06)% | 0.01% | 0.17% | (0.01)% | ||||||||||||||||||
Before waivers and reimbursements4 | 0.46% | 0.38% | (0.06)% | 0.01% | 0.13% | (0.32)% | ||||||||||||||||||
Portfolio turnover rate3 | 19% | 48% | 56% | 54% | 36% | 5% | ||||||||||||||||||
| HERITAGE VALUE FUND | Six Months Ended March 31 (Unaudited) | Year or Period Ended September 30 | ||||||||||||||||||||||
| (for a share outstanding throughout each period) | 2009 | 2008 | 20076 | |||||||||||||||||||||
Net asset value, beginning of period | $ | 8.18 | $ | 10.23 | $ | 10.00 | ||||||||||||||||||
Income (loss) from investment operations: | ||||||||||||||||||||||||
Net investment income | 0.03 | 0.08 | 0.01 | |||||||||||||||||||||
Net realized and unrealized gains (losses) on investments | (1.88 | ) | (1.99 | ) | 0.22 | |||||||||||||||||||
Total from investment operations | (1.85 | ) | (1.91 | ) | 0.23 | |||||||||||||||||||
Redemption fees (see Note 2) | — | 2 | — | 2 | — | 2 | ||||||||||||||||||
Less distributions: | ||||||||||||||||||||||||
Dividends from net investment income | (0.10 | ) | (0.10 | ) | — | |||||||||||||||||||
Distributions from net realized gains | — | (0.04 | ) | — | ||||||||||||||||||||
Total distributions | (0.10 | ) | (0.14 | ) | — | |||||||||||||||||||
Net asset value, end of period | $ | 6.23 | $ | 8.18 | $ | 10.23 | ||||||||||||||||||
Total return3 | (22.23)% | (19.42)% | 2.40% | |||||||||||||||||||||
Supplemental data and ratios: | ||||||||||||||||||||||||
Net assets, end of period (in thousands) | $ | 2,969 | $ | 3,792 | $ | 2,432 | ||||||||||||||||||
Ratio of expenses to average net assets: | ||||||||||||||||||||||||
Net of waivers and reimbursements4 | 0.95% | 0.95% | 0.95% | |||||||||||||||||||||
Before waivers and reimbursements4 | 3.82% | 3.89% | 24.78% | |||||||||||||||||||||
Ratio of net investment income (loss) to average net assets: | ||||||||||||||||||||||||
Net of waivers and reimbursements4 | 1.09% | 1.31% | 1.49% | |||||||||||||||||||||
Before waivers and reimbursements4 | (1.78)% | (1.63)% | (22.34)% | |||||||||||||||||||||
Portfolio turnover rate3 | 136% | 246% | 0% | |||||||||||||||||||||
1 | Fund inception date was June 18, 2004. |
2 | Represents amounts less than $.005 per share. |
3 | Not annualized for periods less than one year. |
4 | Annualized. |
5 | In 2005, the Fund’s total return included a voluntary reimbursement by the Advisor for amounts relating to errors in applying the Funds’ cross-trading policies that had no impact on the total return. |
6 | Fund inception date was August 30, 2007. |
See notes to financial statements.
106
Table of Contents
| MARCH 31, 2009 | ||
| INTERNATIONAL GROWTH FUND | Six Months Ended March 31 (Unaudited) | Year Ended September 30 | ||||||||||||||||||||||
| (for a share outstanding throughout each period) | 2009 | 2008 | 2007 | 2006 | 2005 | 2004 | ||||||||||||||||||
Net asset value, beginning of period | $ | 11.83 | $ | 24.42 | $ | 21.83 | $ | 18.50 | $ | 14.71 | $ | 12.06 | ||||||||||||
Income (loss) from investment operations: | ||||||||||||||||||||||||
Net investment income (loss) | (0.16 | ) | (0.28 | ) | 0.03 | (0.09 | ) | (0.10 | ) | (0.11 | ) | |||||||||||||
Net realized and unrealized gains (losses) on investments | (3.33 | ) | (9.19 | ) | 6.61 | 3.42 | 3.91 | 2.76 | ||||||||||||||||
Net increase from payment by affiliate | — | — | — | — | 0.01 | — | ||||||||||||||||||
Total from investment operations | (3.49 | ) | (9.47 | ) | 6.64 | 3.33 | 3.82 | 2.65 | ||||||||||||||||
Redemption fees (see Note 2) | — | 1 | — | 1 | — | 1 | — | 1 | — | 1 | — | 1 | ||||||||||||
Less distributions: | ||||||||||||||||||||||||
Dividends from net investment income | (0.03 | ) | (0.68 | ) | — | — | — | — | ||||||||||||||||
Distributions from net realized gains | — | (2.44 | ) | (4.05 | ) | — | 1 | (0.03 | ) | — | ||||||||||||||
Total distributions | (0.03 | ) | (3.12 | ) | (4.05 | ) | — | 1 | (0.03 | ) | — | |||||||||||||
Net asset value, end of period | $ | 8.31 | $ | 11.83 | $ | 24.42 | $ | 21.83 | $ | 18.50 | $ | 14.71 | ||||||||||||
Total return2 | (29.49)% | (44.01)% | 34.02% | 18.00% | 5 | 26.02% | 4 | 21.97% | ||||||||||||||||
Supplemental data and ratios: | ||||||||||||||||||||||||
Net assets, end of period (in thousands) | $ | 100,435 | $ | 194,780 | $ | 534,903 | $ | 383,135 | $ | 338,792 | $ | 196,990 | ||||||||||||
Ratio of expenses to average net assets: | ||||||||||||||||||||||||
Net of waivers and reimbursements3 | 1.96% | 6 | 1.83% | 1.76% | 1.78% | 1.84% | 1.92% | |||||||||||||||||
Before waivers and reimbursements3 | 2.11% | 6 | 1.83% | 1.76% | 1.78% | 1.84% | 1.92% | |||||||||||||||||
Ratio of net investment income (loss) to average net assets: | ||||||||||||||||||||||||
Net of waivers and reimbursements3 | (0.13)% | (0.15)% | 0.11% | (0.42)% | (0.64)% | (1.06)% | ||||||||||||||||||
Before waivers and reimbursements3 | (0.28)% | (0.15)% | 0.11% | (0.42)% | (0.64)% | (1.06)% | ||||||||||||||||||
Portfolio turnover rate2 | 30% | 44% | 60% | 64% | 32% | 31% | ||||||||||||||||||
| INTERNATIONAL OPPORTUNITIES FUND | Six Months Ended March 31 (Unaudited) | Year or Period Ended September 30 | ||||||||||||||||||||||
| (for a share outstanding throughout each period) | 2009 | 2008 | 2007 | 2006 | 20057 | |||||||||||||||||||
Net asset value, beginning of period | $ | 1.60 | $ | 3.65 | $ | 2.71 | $ | 2.19 | $ | 2.00 | ||||||||||||||
Income (loss) from investment operations: | ||||||||||||||||||||||||
Net investment gain (loss) | — | 0.07 | (0.01 | ) | (0.01 | ) | — | 1 | ||||||||||||||||
Net realized and unrealized gains (losses) on investments | (0.45 | ) | (1.45 | ) | 1.13 | 0.53 | 0.19 | |||||||||||||||||
Total from investment operations | (0.45 | ) | (1.38 | ) | 1.12 | 0.52 | 0.19 | |||||||||||||||||
Redemption fees (see Note 2) | — | 1 | — | 1 | — | 1 | — | 1 | — | 1 | ||||||||||||||
Less distributions: | ||||||||||||||||||||||||
Dividends from net investment income | — | 1 | (0.14 | ) | — | 1 | — | — | ||||||||||||||||
Distributions from net realized gains | — | (0.53 | ) | (0.18 | ) | — | — | |||||||||||||||||
Total distributions | — | (0.67 | ) | (0.18 | ) | — | — | |||||||||||||||||
Net asset value, end of period | $ | 1.15 | $ | 1.60 | $ | 3.65 | $ | 2.71 | $ | 2.19 | ||||||||||||||
Total return2 | (27.85)% | (45.33)% | 42.73% | 23.74% | 9.50% | |||||||||||||||||||
Supplemental data and ratios: | ||||||||||||||||||||||||
Net assets, end of period (in thousands) | $ | 50,720 | $ | 55,691 | $ | 56,433 | $ | 36,839 | $ | 29,440 | ||||||||||||||
Ratio of expenses to average net assets: | ||||||||||||||||||||||||
Net of waivers and reimbursements3 | 2.27% | 8 | 2.25% | 2.25% | 2.25% | 2.25% | ||||||||||||||||||
Before waivers and reimbursements3 | 3.01% | 8 | 2.59% | 2.51% | 2.62% | 3.09% | ||||||||||||||||||
Ratio of net investment loss to average net assets: | ||||||||||||||||||||||||
Net of waivers and reimbursements3 | (0.85)% | (0.09)% | (0.18)% | (0.29)% | (0.21)% | |||||||||||||||||||
Before waivers and reimbursements3 | (1.59)% | (0.43)% | (0.44)% | (0.66)% | (1.05)% | |||||||||||||||||||
Portfolio turnover rate2 | 35% | 63% | 54% | 43% | 12% | |||||||||||||||||||
1 | Represents amounts less than $.005 per share. |
2 | Not annualized for periods less than one year. |
3 | Annualized. |
4 | In 2005, 0.07% of the Fund’s total return consisted of a voluntary reimbursement by the Advisor for a realized investment loss. Excluding this item, the total return would have been 25.95%. The Fund’s total return also included, in 2005, a voluntary reimbursement by the Advisor for amounts relating to errors in applying the Funds’ cross-trading policies that had no impact on the total return. |
5 | In 2006, the Fund’s total return included a voluntary reimbursement by the Advisor for an amount relating to an incorrect settlement that had no impact on the total return. |
6 | Includes interest expense of 0.01%. |
7 | Fund inception date was January 27, 2005. |
8 | Includes interest expense of 0.02%. |
See notes to financial statements.
107
Table of Contents
| WASATCH FUNDS — Financial Highlights (continued) | ||
| MICRO CAP FUND | Six Months Ended March 31 (Unaudited) | Year Ended September 30 | ||||||||||||||||||||||
| (for a share outstanding throughout each period) | 2009 | 2008 | 2007 | 2006 | 2005 | 2004 | ||||||||||||||||||
Net asset value, beginning of period | $ | 4.14 | $ | 7.19 | $ | 6.79 | $ | 7.58 | $ | 7.05 | $ | 6.98 | ||||||||||||
Income (loss) from investment operations: | ||||||||||||||||||||||||
Net investment loss | (0.01 | ) | (0.07 | ) | (0.09 | ) | (0.10 | ) | (0.11 | ) | (0.15 | ) | ||||||||||||
Net realized and unrealized gains (losses) on investments | (1.49 | ) | (1.81 | ) | 1.29 | 0.65 | 1.70 | 0.81 | ||||||||||||||||
Net increase from payment by affiliate | — | — | — | — | — | 1 | — | |||||||||||||||||
Total from investment operations | (1.50 | ) | (1.88 | ) | 1.20 | 0.55 | 1.59 | 0.66 | ||||||||||||||||
Redemption fees (see Note 2) | — | 1 | — | 1 | — | 1 | — | 1 | — | 1 | — | 1 | ||||||||||||
Less distributions: | ||||||||||||||||||||||||
Dividends from net investment income | (0.01 | ) | — | — | — | — | — | |||||||||||||||||
Distributions from net realized gains | — | (1.17 | ) | (0.80 | ) | (1.34 | ) | (1.06 | ) | (0.59 | ) | |||||||||||||
Total distributions | (0.01 | ) | (1.17 | ) | (0.80 | ) | (1.34 | ) | (1.06 | ) | (0.59 | ) | ||||||||||||
Net asset value, end of period | $ | 2.63 | $ | 4.14 | $ | 7.19 | $ | 6.79 | $ | 7.58 | $ | 7.05 | ||||||||||||
Total return2 | (36.25)% | (30.46)% | 18.72% | 8.51% | 26.42% | 4 | 9.96% | |||||||||||||||||
Supplemental data and ratios: | ||||||||||||||||||||||||
Net assets, end of period (in thousands) | $ | 191,827 | $ | 359,394 | $ | 631,417 | $ | 583,901 | $ | 579,244 | $ | 518,291 | ||||||||||||
Ratio of expenses to average net assets: | ||||||||||||||||||||||||
Net of waivers and reimbursements3 | 2.29% | 2.16% | 2.14% | 2.14% | 2.18% | 2.19% | ||||||||||||||||||
Before waivers and reimbursements3 | 2.30% | 2.16% | 2.14% | 2.14% | 2.18% | 2.19% | ||||||||||||||||||
Ratio of net investment loss to average net assets: | ||||||||||||||||||||||||
Net of waivers and reimbursements3 | (0.59)% | (1.26)% | (1.25)% | (1.39)% | (1.58)% | (1.95)% | ||||||||||||||||||
Before waivers and reimbursements3 | (0.60)% | (1.26)% | (1.25)% | (1.39)% | (1.58)% | (1.95)% | ||||||||||||||||||
Portfolio turnover rate2 | 26% | 54% | 48% | 46% | 50% | 56% | ||||||||||||||||||
| MICRO CAP VALUE FUND | Six Months Ended March 31 (Unaudited) | Year or Period Ended September 30 | ||||||||||||||||||||||
| (for a share outstanding throughout each period) | 2009 | 2008 | 2007 | 2006 | 2005 | 2004 | ||||||||||||||||||
Net asset value, beginning of period | $ | 1.80 | $ | 2.98 | $ | 2.93 | $ | 2.72 | $ | 2.57 | $ | 2.09 | ||||||||||||
Income (loss) from investment operations: | ||||||||||||||||||||||||
Net investment loss | (0.01 | ) | (0.02 | ) | (0.03 | ) | (0.03 | ) | (0.04 | ) | (0.05 | ) | ||||||||||||
Net realized and unrealized gains (losses) on investments | (0.54 | ) | (0.75 | ) | 0.64 | 0.50 | 0.49 | 0.53 | ||||||||||||||||
Net increase from payment by affiliate | — | — | — | — | — | 1 | — | |||||||||||||||||
Total from investment operations | (0.55 | ) | (0.77 | ) | 0.61 | 0.47 | 0.45 | 0.48 | ||||||||||||||||
Redemption fees (see Note 2) | — | 1 | — | 1 | — | 1 | — | 1 | — | 1 | — | 1 | ||||||||||||
Less distributions: | ||||||||||||||||||||||||
Distributions from net realized gains | — | (0.41 | ) | (0.56 | ) | (0.26 | ) | (0.30 | ) | — | 1 | |||||||||||||
Total distributions | — | (0.41 | ) | (0.56 | ) | (0.26 | ) | (0.30 | ) | — | ||||||||||||||
Net asset value, end of period | $ | 1.25 | $ | 1.80 | $ | 2.98 | $ | 2.93 | $ | 2.72 | $ | 2.57 | ||||||||||||
Total return2 | (30.56)% | (29.67)% | 22.84% | 18.89% | 19.87%5 | 23.06% | ||||||||||||||||||
Supplemental data and ratios: | ||||||||||||||||||||||||
Net assets, end of period (in thousands) | $ | 52,069 | $ | 97,912 | $ | 120,039 | $ | 95,508 | $ | 86,903 | $ | 84,835 | ||||||||||||
Ratio of expenses to average net assets: | ||||||||||||||||||||||||
Net of waivers and reimbursements3 6 | 2.25% | 2.25% | 2.25% | 2.25% | 2.25% | 2.27% | ||||||||||||||||||
Before waivers and reimbursements3 | 2.65% | 2.35% | 2.30% | 2.33% | 2.36% | 2.38% | ||||||||||||||||||
Ratio of net investment loss to average net assets: | ||||||||||||||||||||||||
Net of waivers and reimbursements3 | (1.74)% | (1.21)% | (1.06)% | (0.99)% | (1.41)% | (1.76)% | ||||||||||||||||||
Before waivers and reimbursements3 | (2.14)% | (1.31)% | (1.11)% | (1.07)% | (1.52)% | (1.87)% | ||||||||||||||||||
Portfolio turnover rate2 | 77% | 144% | 105% | 95% | 85% | 101% | ||||||||||||||||||
1 | Represents amounts less than $.005 per share. |
2 | Not annualized for periods less than one year. |
3 | Annualized. |
4 | In 2005, the Fund’s total return included a voluntary reimbursement by the Advisor for amounts relating to errors in applying the Funds’ cross-trading policies that had no impact on the total return. |
5 | In 2005, the Fund’s total return included a voluntary reimbursement by the Advisor for a realized investment loss that had no impact on the total return. |
6 | On February 1, 2004, the Advisor reduced the contractual expense limitation from 2.50% to 2.25% through January 31, 2005. As a result, the effective expense ratio net of waivers and reimbursements for the period ended September 30, 2004 was 2.27%. |
See notes to financial statements.
108
Table of Contents
| MARCH 31, 2009 | ||
| SMALL CAP GROWTH FUND | Six Months Ended March 31 (Unaudited) | Year Ended September 30 | ||||||||||||||||||||||
| (for a share outstanding throughout each period) | 2009 | 2008 | 2007 | 2006 | 2005 | 2004 | ||||||||||||||||||
Net asset value, beginning of period | $ | 26.50 | $ | 40.10 | $ | 36.99 | $ | 41.23 | $ | 34.94 | $ | 32.43 | ||||||||||||
Income (loss) from investment operations: | ||||||||||||||||||||||||
Net investment loss | (0.06 | ) | (0.16 | ) | (0.25 | ) | (0.26 | ) | (0.25 | ) | (0.33 | ) | ||||||||||||
Net realized and unrealized gains (losses) on investments | (6.41 | ) | (8.85 | ) | 6.28 | 0.84 | 7.32 | 3.01 | ||||||||||||||||
Net increase from payment by affiliate | — | — | — | — | — | 1 | — | |||||||||||||||||
Total from investment operations | (6.47 | ) | (9.01 | ) | 6.03 | 0.58 | 7.07 | 2.68 | ||||||||||||||||
Redemption fees (see Note 2) | — | 1 | — | 1 | — | 1 | — | 1 | — | 1 | — | 1 | ||||||||||||
Less distributions: | ||||||||||||||||||||||||
Distributions from net realized gains | (0.06 | ) | (4.59 | ) | (2.92 | ) | (4.82 | ) | (0.78 | ) | (0.17 | ) | ||||||||||||
Total distributions | (0.06 | ) | (4.59 | ) | (2.92 | ) | (4.82 | ) | (0.78 | ) | (0.17 | ) | ||||||||||||
Net asset value, end of period | $ | 19.97 | $ | 26.50 | $ | 40.10 | $ | 36.99 | $ | 41.23 | $ | 34.94 | ||||||||||||
Total return2 | (24.43)% | (25.42)% | 16.94% | 1.40% | 20.73%4 | 8.27% | ||||||||||||||||||
Supplemental data and ratios: | ||||||||||||||||||||||||
Net assets, end of period (in thousands) | $ | 508,463 | $ | 735,546 | $ | 1,075,433 | $ | 1,234,978 | $ | 1,357,862 | $ | 1,191,702 | ||||||||||||
Ratio of expenses to average net assets3 | 1.35% | 1.21% | 1.19% | 1.18% | 5 | 1.18% | 1.20% | |||||||||||||||||
Ratio of net investment loss to average net assets3 | (0.53)% | (0.47)% | (0.52)% | (0.64)% | (0.62)% | (0.91)% | ||||||||||||||||||
Portfolio turnover rate2 | 38% | 51% | 43% | 41% | 36% | 41% | ||||||||||||||||||
| SMALL CAP VALUE FUND | Six Months Ended March 31 (Unaudited) | Year Ended September 30 | ||||||||||||||||||||||
| (for a share outstanding throughout each period) | 2009 | 2008 | 2007 | 2006 | 2005 | 2004 | ||||||||||||||||||
Net asset value, beginning of period | $ | 2.82 | $ | 5.22 | $ | 5.29 | $ | 5.67 | $ | 5.54 | $ | 4.62 | ||||||||||||
Income (loss) from investment operations: | ||||||||||||||||||||||||
Net investment income (loss) | — | 0.01 | 0.01 | 0.05 | 0.05 | (0.01 | ) | |||||||||||||||||
Net realized and unrealized gains (losses) on investments | (1.08 | ) | (1.11 | ) | 0.67 | 0.36 | 0.86 | 0.93 | ||||||||||||||||
Net increase from payment by affiliate | — | — | — | — | — | 1 | — | |||||||||||||||||
Total from investment operations | (1.08 | ) | (1.10 | ) | 0.68 | 0.41 | 0.91 | 0.92 | ||||||||||||||||
Redemption fees (see Note 2) | — | 1 | — | 1 | — | 1 | — | 1 | — | 1 | — | 1 | ||||||||||||
Less distributions: | ||||||||||||||||||||||||
Dividends from net investment income | — | (0.01 | ) | (0.04 | ) | (0.07 | ) | — | — | |||||||||||||||
Distributions from net realized gains | — | (1.29 | ) | (0.71 | ) | (0.72 | ) | (0.78 | ) | — | 1 | |||||||||||||
Total distributions | — | (1.30 | ) | (0.75 | ) | (0.79 | ) | (0.78 | ) | — | ||||||||||||||
Net asset value, end of period | $ | 1.74 | $ | 2.82 | $ | 5.22 | $ | 5.29 | $ | 5.67 | $ | 5.54 | ||||||||||||
Total return2 | (38.30)% | (26.26)% | 13.32% | 7.88% | 19.47% | 6 | 19.73% | |||||||||||||||||
Supplemental data and ratios: | ||||||||||||||||||||||||
Net assets, end of period (in thousands) | $ | 153,699 | $ | 336,914 | $ | 660,637 | $ | 664,625 | $ | 734,842 | $ | 734,266 | ||||||||||||
Ratio of expenses to average net assets: | ||||||||||||||||||||||||
Net of waivers and reimbursements3 | 1.95% | 1.76% | 1.69% | 1.68% | 1.72% | 1.73% | ||||||||||||||||||
Before waivers and reimbursements3 | 2.02% | 1.76% | 1.69% | 1.68% | 1.72% | 1.73% | ||||||||||||||||||
Ratio of net investment income (loss) to average net assets: | ||||||||||||||||||||||||
Net of waivers and reimbursements3 | 0.04% | 0.15% | 0.18% | 0.81% | 0.94% | (0.26)% | ||||||||||||||||||
Before waivers and reimbursements3 | (0.03)% | 0.15% | 0.18% | 0.81% | 0.94% | (0.26)% | ||||||||||||||||||
Portfolio turnover rate2 | 48% | 78% | 84% | 40% | 43% | 56% | ||||||||||||||||||
1 | Represents amounts less than $.005 per share. |
2 | Not annualized for periods less than one year. |
3 | Annualized. |
4 | In 2005, the Fund’s total return included a voluntary reimbursement by the Advisor for amounts relating to errors in applying the Funds’ cross-trading policies that had no impact on the total return. The effect of net realized gains on the disposal of investments in violation of an investment restriction on total return was less than .01%. |
5 | In 2006, the Fund received a reimbursement of investment advisory fees, which had an impact on the Fund’s expense ratio of less than 0.01%. |
6 | In 2005, the Fund’s total return included a voluntary reimbursement by the Advisor for amounts relating to errors in applying the Funds’ cross-trading policies that had no impact on the total return. |
See notes to financial statements.
109
Table of Contents
| WASATCH FUNDS — Financial Highlights (continued) | ||
| STRATEGIC INCOME FUND | Six Months Ended March 31 (Unaudited) | Year or Period Ended September 30 | ||||||||||||||||||||||
| (for a share outstanding throughout each period) | 2009 | 2008 | 2007 | 20061 | ||||||||||||||||||||
Net asset value, beginning of period | $ | 7.62 | $ | 11.00 | $ | 10.48 | $ | 10.00 | ||||||||||||||||
Income (loss) from investment operations: | ||||||||||||||||||||||||
Net investment income | 0.17 | 0.55 | 0.48 | 0.31 | ||||||||||||||||||||
Net realized and unrealized gains (losses) on investments | (2.52 | ) | (2.29 | ) | 0.54 | 0.44 | ||||||||||||||||||
Total from investment operations | (2.35 | ) | (1.74 | ) | 1.02 | 0.75 | ||||||||||||||||||
Redemption fees (see Note 2) | — | 2 | — | 2 | 0.01 | — | 2 | |||||||||||||||||
Less distributions: | ||||||||||||||||||||||||
Dividends from net investment income | (0.17 | ) | (0.50 | ) | (0.47 | ) | (0.27 | ) | ||||||||||||||||
Distributions from net realized gains | — | (1.14 | ) | (0.04 | ) | — | ||||||||||||||||||
Total distributions | (0.17 | ) | (1.64 | ) | (0.51 | ) | (0.27 | ) | ||||||||||||||||
Net asset value, end of period | $ | 5.10 | $ | 7.62 | $ | 11.00 | $ | 10.48 | ||||||||||||||||
Total return3 | (30.91)% | (18.17)% | 9.77% | 7.58% | ||||||||||||||||||||
Supplemental data and ratios: | ||||||||||||||||||||||||
Net assets, end of period (in thousands) | $ | 14,006 | $ | 21,889 | $ | 23,621 | $ | 12,732 | ||||||||||||||||
Ratio of expenses to average net assets (including interest expense and dividend payments for securities sold short): | ||||||||||||||||||||||||
Net of waivers and reimbursements4 | 1.09% | 0.97% | 1.05% | 0.95% | ||||||||||||||||||||
Before waivers and reimbursements4 | 1.76% | 1.46% | 1.57% | 2.66% | ||||||||||||||||||||
Ratio of expenses to average net assets (excluding interest expense and dividend payments for securities sold short): | ||||||||||||||||||||||||
Net of waivers and reimbursements4 | 0.95% | 0.95% | 0.95% | 0.95% | ||||||||||||||||||||
Before waivers and reimbursements4 | 1.62% | 1.44% | 1.47% | 2.66% | ||||||||||||||||||||
Ratio of net investment income to average net assets: | ||||||||||||||||||||||||
Net of waivers and reimbursements4 | 6.24% | 5.96% | 4.14% | 5.40% | ||||||||||||||||||||
Before waivers and reimbursements4 | 5.57% | 5.47% | 3.62% | 3.69% | ||||||||||||||||||||
Portfolio turnover rate3 | 41% | 81% | 86% | 14% | ||||||||||||||||||||
| ULTRA GROWTH FUND | Six Months Ended March 31 (Unaudited) | Year Ended September 30 | ||||||||||||||||||||||
| (for a share outstanding throughout each period) | 2009 | 2008 | 2007 | 2006 | 2005 | 2004 | ||||||||||||||||||
Net asset value, beginning of period | $ | 15.76 | $ | 27.78 | $ | 24.09 | $ | 27.98 | $ | 24.07 | $ | 25.43 | ||||||||||||
Income (loss) from investment operations: | ||||||||||||||||||||||||
Net investment loss | (0.06 | ) | (0.22 | ) | (0.33 | ) | (0.34 | ) | (0.38 | ) | (0.42 | ) | ||||||||||||
Net realized and unrealized gains (losses) on investments | (5.14 | ) | (8.28 | ) | 5.80 | 0.23 | 5.26 | (0.68 | ) | |||||||||||||||
Net increase from payment by affiliate | — | — | — | — | 2 | — | 2 | — | ||||||||||||||||
Total from investment operations | (5.20 | ) | (8.50 | ) | 5.47 | (0.11 | ) | 4.88 | (1.10 | ) | ||||||||||||||
Redemption fees (see Note 2) | — | 2 | — | 2 | — | 2 | — | 2 | — | 2 | — | 2 | ||||||||||||
Less distributions: | ||||||||||||||||||||||||
Distributions from net realized gains | — | (3.52 | ) | (1.78 | ) | (3.78 | ) | (0.97 | ) | (0.26 | ) | |||||||||||||
Total distributions | — | (3.52 | ) | (1.78 | ) | (3.78 | ) | (0.97 | ) | (0.26 | ) | |||||||||||||
Net asset value, end of period | $ | 10.56 | $ | 15.76 | $ | 27.78 | $ | 24.09 | $ | 27.98 | $ | 24.07 | ||||||||||||
Total return3 | (32.95)% | (35.09)% | 23.80% | (0.48)% | 21.00%5 | (4.44)% | ||||||||||||||||||
Supplemental data and ratios: | ||||||||||||||||||||||||
Net assets, end of period (in thousands) | $ | 83,987 | $ | 144,004 | $ | 268,633 | $ | 306,406 | $ | 389,894 | $ | 427,013 | ||||||||||||
Ratio of expenses to average net assets: | ||||||||||||||||||||||||
Net of waivers and reimbursements4 | 1.75% | 1.53% | 1.49% | 1.48% | 1.50% | 1.50% | ||||||||||||||||||
Before waivers and reimbursements4 | 1.82% | 1.53% | 1.49% | 1.48% | 1.50% | 1.50% | ||||||||||||||||||
Ratio of net investment loss to average net assets: | ||||||||||||||||||||||||
Net of waivers and reimbursements4 | (1.06)% | (0.93)% | (1.12)% | (1.19)% | (1.30)% | (1.39)% | ||||||||||||||||||
Before waivers and reimbursements4 | (1.13)% | (0.93)% | (1.12)% | (1.19)% | (1.30)% | (1.39)% | ||||||||||||||||||
Portfolio turnover rate3 | 41% | 84% | 55% | 76% | 65% | 67% | ||||||||||||||||||
1 | Fund inception date was February 1, 2006. |
2 | Represents amounts less than $.005 per share. |
3 | Not annualized for periods less than one year. |
4 | Annualized. |
5 | In 2005, the Fund’s total return included a voluntary reimbursement by the Advisor for amounts relating to errors in applying the Funds’ cross-trading policies that had no impact on the total return. |
See notes to financial statements.
110
Table of Contents
| MARCH 31, 2009 | ||
| WASATCH-1ST SOURCE INCOME EQUITY FUND | Six Months Ended March 31 (Unaudited) | Period Ended September 30 | Year Ended March 31 | |||||||||||||||||||||
| (for a share outstanding throughout each period) | 2009 | 20081 | 2008 | 2007 | 2006 | 2005 | ||||||||||||||||||
Net asset value, beginning of period | $ | 12.93 | $ | 14.44 | $ | 14.80 | $ | 14.14 | $ | 13.61 | $ | 12.16 | ||||||||||||
Income (loss) from investment operations: | ||||||||||||||||||||||||
Net investment income | 0.09 | 0.14 | 2 | 0.21 | 0.22 | 0.17 | 0.14 | |||||||||||||||||
Net realized and unrealized gains (losses) on investments | (3.67 | ) | (1.52 | ) | 0.31 | 1.66 | 2.10 | 1.91 | ||||||||||||||||
Total from investment operations | (3.58 | ) | (1.38 | ) | 0.52 | 1.88 | 2.27 | 2.05 | ||||||||||||||||
Redemption fees (see Note 2) | — | 3 | — | — | — | — | — | |||||||||||||||||
Less distributions: | ||||||||||||||||||||||||
Dividends from net investment income | (0.10 | ) | (0.13 | ) | (0.21 | ) | (0.21 | ) | (0.18 | ) | (0.13 | ) | ||||||||||||
Distributions from net realized gains | — | — | (0.67 | ) | (1.01 | ) | (1.56 | ) | (0.47 | ) | ||||||||||||||
Total distributions | (0.10 | ) | (0.13 | ) | (0.88 | ) | (1.22 | ) | (1.74 | ) | (0.60 | ) | ||||||||||||
Net asset value, end of period | $ | 9.25 | $ | 12.93 | $ | 14.44 | $ | 14.80 | $ | 14.14 | $ | 13.61 | ||||||||||||
Total return4 | (27.69)% | (9.65)% | 3.22% | 13.69% | 17.72% | 17.17% | ||||||||||||||||||
Supplemental data and ratios: | ||||||||||||||||||||||||
Net assets, end of period (in thousands) | $ | 937,672 | $ | 780,384 | $ | 447,674 | $ | 167,133 | $ | 129,508 | $ | 103,127 | ||||||||||||
Ratio of expenses to average net assets: | ||||||||||||||||||||||||
Net of waivers and reimbursements5 | 1.09% | 1.04% | 1.13% | 1.15% | 1.19% | 1.19% | ||||||||||||||||||
Before waivers and reimbursements5 | 1.18% | 1.29% | 1.38% | 1.40% | 1.45% | 1.44% | ||||||||||||||||||
Ratio of net investment income to average net assets: | ||||||||||||||||||||||||
Net of waivers and reimbursements5 | 2.15% | 1.99% | 1.43% | 1.52% | 1.25% | 1.10% | ||||||||||||||||||
Before waivers and reimbursements5 | 2.06% | 1.74% | 1.18% | 1.27% | 0.99% | 0.85% | ||||||||||||||||||
Portfolio turnover rate4 | 8% | 5% | 36% | 26% | 37% | 44% | ||||||||||||||||||
| WASATCH-1ST SOURCE LONG/SHORT FUND | Six Months Ended March 31 (Unaudited) | Period Ended September 30 | Year Ended March 31 | |||||||||||||||||||||
| (for a share outstanding throughout each period) | 2009 | 20081 | 2008 | 2007 | 2006 | 2005 | ||||||||||||||||||
Net asset value, beginning of period | $ | 10.81 | $ | 11.27 | $ | 11.59 | $ | 11.21 | $ | 10.69 | $ | 10.59 | ||||||||||||
Income (loss) from investment operations: | ||||||||||||||||||||||||
Net investment income | 0.03 | 0.05 | 2 | 0.27 | 0.26 | 0.21 | 0.08 | |||||||||||||||||
Net realized and unrealized gains (losses) on investments | (1.89 | ) | (0.46 | ) | 0.02 | 0.90 | 0.71 | 0.35 | ||||||||||||||||
Total from investment operations | (1.86 | ) | (0.41 | ) | 0.29 | 1.16 | 0.92 | 0.43 | ||||||||||||||||
Redemption fees (see Note 2) | — | 3 | — | — | — | — | — | |||||||||||||||||
Less distributions: | ||||||||||||||||||||||||
Dividends from net investment income | (0.05 | ) | (0.05 | ) | (0.28 | ) | (0.28 | ) | (0.20 | ) | (0.09 | ) | ||||||||||||
Distributions from net realized gains | (0.15 | ) | — | (0.33 | ) | (0.50 | ) | (0.20 | ) | (0.24 | ) | |||||||||||||
Total distributions | (0.20 | ) | (0.05 | ) | (0.61 | ) | (0.78 | ) | (0.40 | ) | (0.33 | ) | ||||||||||||
Net asset value, end of period | $ | 8.75 | $ | 10.81 | $ | 11.27 | $ | 11.59 | $ | 11.21 | $ | 10.69 | ||||||||||||
Total return4 | (17.17)% | (3.66)% | 2.34% | 10.44% | 8.80% | 4.07% | ||||||||||||||||||
Supplemental data and ratios: | ||||||||||||||||||||||||
Net assets, end of period (in thousands) | $ | 98,523 | $ | 122,114 | $ | 87,410 | $ | 53,894 | $ | 29,831 | $ | 25,127 | ||||||||||||
Ratio of expenses to average net assets (including dividend payments for securities sold short): | ||||||||||||||||||||||||
Net of waivers and reimbursements5 | 1.88% | 1.77% | 1.75% | 1.84% | 1.72% | 1.71% | ||||||||||||||||||
Before waivers and reimbursements5 | 1.99% | 2.02% | 2.00% | 2.09% | 1.98% | 1.97% | ||||||||||||||||||
Ratio of expenses to average net assets (excluding dividend payments for securities sold short): | ||||||||||||||||||||||||
Net of waivers and reimbursements5 | 1.48% | 1.46% | 1.57% | 1.56% | 1.63% | 1.64% | ||||||||||||||||||
Before waivers and reimbursements5 | 1.59% | 1.71% | 1.82% | 1.81% | 1.89% | 1.90% | ||||||||||||||||||
Ratio of net investment income to average net assets: | ||||||||||||||||||||||||
Net of waivers and reimbursements5 | 0.69% | 0.95% | 2.25% | 2.40% | 1.98% | 0.76% | ||||||||||||||||||
Before waivers and reimbursements5 | 0.58% | 0.70% | 2.00% | 2.15% | 1.72% | 0.50% | ||||||||||||||||||
Portfolio turnover rate4 | 92% | 71% | 179% | 172% | 123% | 206% | ||||||||||||||||||
1 | Effective September 19, 2008, the Fund changed its fiscal year end to September 30. |
2 | Average shares method used in calculation. |
3 | Represents amounts less than $.005 per share. |
4 | Not annualized for periods less than one year. |
5 | Annualized. |
See notes to financial statements.
111
Table of Contents
| WASATCH FUNDS — Financial Highlights (continued) | MARCH 31, 2009 | |
| U.S. TREASURY FUND | Six Months Ended March 31 (Unaudited) | Year Ended September 30 | ||||||||||||||||||||||
| (for a share outstanding throughout each period) | 2009 | 2008 | 2007 | 2006 | 2005 | 2004 | ||||||||||||||||||
Net asset value, beginning of period | $ | 14.95 | $ | 13.84 | $ | 14.12 | $ | 14.68 | $ | 13.77 | $ | 13.68 | ||||||||||||
Income (loss) from investment operations: | ||||||||||||||||||||||||
Net investment income | 0.27 | 0.58 | 0.64 | 0.39 | 0.45 | 0.70 | ||||||||||||||||||
Net realized and unrealized gains (losses) on investments | 2.61 | 1.10 | (0.29 | ) | (0.24 | ) | 1.05 | 0.11 | ||||||||||||||||
Total from investment operations | 2.88 | 1.68 | 0.35 | 0.15 | 1.50 | 0.81 | ||||||||||||||||||
Redemption fees (see Note 2) | 0.03 | 0.01 | 0.01 | 0.01 | 0.01 | 0.01 | ||||||||||||||||||
Less distributions: | ||||||||||||||||||||||||
Dividends from net investment income | (0.27 | ) | (0.58 | ) | (0.64 | ) | (0.72 | ) | (0.60 | ) | (0.73 | ) | ||||||||||||
Distributions from net realized gains | — | — | — | — | — | — | ||||||||||||||||||
Total distributions | (0.27 | ) | (0.58 | ) | (0.64 | ) | (0.72 | ) | (0.60 | ) | (0.73 | ) | ||||||||||||
Net asset value, end of period | $ | 17.59 | $ | 14.95 | $ | 13.84 | $ | 14.12 | $ | 14.68 | $ | 13.77 | ||||||||||||
Total return1 | 19.35% | 12.33% | 2.68% | 1.21% | 11.41% | 6.27% | ||||||||||||||||||
Supplemental data and ratios: | ||||||||||||||||||||||||
Net assets, end of period (in thousands) | $ | 161,885 | $ | 121,240 | $ | 115,788 | $ | 204,994 | $ | 82,599 | $ | 45,088 | ||||||||||||
Ratio of expenses to average net assets: | ||||||||||||||||||||||||
Net of waivers and reimbursements2 | 0.75% | 0.74% | 0.71% | 0.72% | 0.75% | 0.75% | ||||||||||||||||||
Before waivers and reimbursements2 | 0.76% | 0.74% | 0.71% | 0.72% | 0.86% | 0.94% | ||||||||||||||||||
Ratio of net investment income to average net assets: | ||||||||||||||||||||||||
Net of waivers and reimbursements2 | 3.14% | 3.85% | 4.23% | 4.21% | 4.01% | 4.50% | ||||||||||||||||||
Before waivers and reimbursements2 | 3.13% | 3.85% | 4.23% | 4.21% | 3.90% | 4.31% | ||||||||||||||||||
Portfolio turnover rate1 | 48% | 31% | 19% | 2% | 19% | 4% | ||||||||||||||||||
| WASATCH-1ST SOURCE INCOME FUND | Six Months Ended March 31 (Unaudited) | Period Ended September 30 | Year Ended March 31 | |||||||||||||||||||||
| (for a share outstanding throughout each period) | 2009 | 20083 | 2008 | 2007 | 2006 | 2005 | ||||||||||||||||||
Net asset value, beginning of period | $ | 9.59 | $ | 9.95 | $ | 9.73 | $ | 9.63 | $ | 9.88 | $ | 10.34 | ||||||||||||
Income (loss) from investment operations: | ||||||||||||||||||||||||
Net investment income | 0.16 | 0.18 | 4 | 0.40 | 0.38 | 0.33 | 0.29 | |||||||||||||||||
Net realized and unrealized gains (losses) on investments | 0.18 | (0.35 | ) | 0.24 | 0.13 | (0.18 | ) | (0.37 | ) | |||||||||||||||
Total from investment operations | 0.34 | (0.17 | ) | 0.64 | 0.51 | 0.15 | (0.08 | ) | ||||||||||||||||
Redemption fees (see Note 2) | — | 5 | — | — | — | — | — | |||||||||||||||||
Less distributions: | ||||||||||||||||||||||||
Dividends from net investment income | (0.18 | ) | (0.19 | ) | (0.42 | ) | (0.41 | ) | (0.40 | ) | (0.38 | ) | ||||||||||||
Distributions from net realized gains | — | — | — | — | — | — | ||||||||||||||||||
Total distributions | (0.18 | ) | (0.19 | ) | (0.42 | ) | (0.41 | ) | (0.40 | ) | (0.38 | ) | ||||||||||||
Net asset value, end of period | $ | 9.75 | $ | 9.59 | $ | 9.95 | $ | 9.73 | $ | 9.63 | $ | 9.88 | ||||||||||||
Total return1 | 3.57% | (1.69)% | 6.74% | 5.43% | 1.52% | (0.76)% | ||||||||||||||||||
Supplemental data and ratios: | ||||||||||||||||||||||||
Net assets, end of period (in thousands) | $ | 96,289 | $ | 89,081 | $ | 86,981 | $ | 78,921 | $ | 72,874 | $ | 75,445 | ||||||||||||
Ratio of expenses to average net assets: | ||||||||||||||||||||||||
Net of waivers and reimbursements2 | 0.85% | 0.87% | 0.95% | 0.92% | 0.95% | 0.93% | ||||||||||||||||||
Before waivers and reimbursements2 | 0.95% | 1.12% | 1.20% | 1.17% | 1.21% | 1.19% | ||||||||||||||||||
Ratio of net investment income to average net assets: | ||||||||||||||||||||||||
Net of waivers and reimbursements2 | 3.43% | 3.66% | 4.05% | 3.95% | 3.36% | 2.84% | ||||||||||||||||||
Before waivers and reimbursements2 | 3.33% | 3.41% | 3.80% | 3.70% | 3.10% | 2.58% | ||||||||||||||||||
Portfolio turnover rate1 | 18% | 15% | 56% | 59% | 70% | 79% | ||||||||||||||||||
1 | Not annualized for periods less than one year. |
2 | Annualized. |
3 | Effective September 19, 2008, the Fund changed its fiscal year end to September 30. |
4 | Average shares method used in calculation. |
5 | Represents amounts less than $.005 per share. |
See notes to financial statements.
112
Table of Contents
| WASATCH FUNDS — Notes to Financial Statements | MARCH 31, 2009 | |
1. ORGANIZATION
Wasatch Funds, Inc. is a Minnesota corporation registered under the Investment Company Act of 1940, as amended (the “1940 Act”), as an open-end management investment company and consists of 18 series or “funds” (each a “Fund” and collectively the “Funds”). The Core Growth Fund, Global Science & Technology Fund, Heritage Growth Fund, International Growth Fund, Micro Cap Fund, Micro Cap Value Fund, Small Cap Growth Fund, Small Cap Value Fund, Ultra Growth Fund, Wasatch-1st Source Income Equity Fund, Wasatch-Hoisington U.S. Treasury Fund (“U.S. Treasury Fund”), and Wasatch-1st Source Income Fund are each diversified funds. The Emerging Markets Small Cap Fund, Global Opportunities Fund, Heritage Value Fund, International Opportunities Fund, Strategic Income Fund, and Wasatch-1st Source Long/Short Fund are each non-diversified funds. Each Fund maintains its own investment objective. The Funds have entered into an investment advisory agreement with Wasatch Advisors, Inc. (the “Advisor”) as investment advisor.
The Core Growth Fund, Emerging Markets Small Cap Fund, Global Opportunities Fund, Global Science & Technology Fund, Heritage Growth Fund, Heritage Value Fund, International Growth Fund, Micro Cap Fund, Micro Cap Value Fund, Small Cap Growth Fund, Small Cap Value Fund, Strategic Income Fund, Ultra Growth Fund, Wasatch-1st Source Income Equity Fund, and Wasatch-1st Source Long/Short Fund are referred to herein as the “Equity Funds.”
1st Source Corporation Investment Advisors, Inc. (“1st Source”) signed an asset purchase agreement with Wasatch Advisors, Inc. (“Wasatch”) relating to the acquisition by Wasatch of the assets related to 1st Source’s mutual fund advisory business. At a Special Meeting of the Shareholders of the 1st Source Monogram Income Fund, a series of The Coventry Group, held on December 11, 2008, the shareholders of 1st Source Monogram Income Fund approved the acquisition of all of the assets of the 1st Source Monogram Income Fund by the Wasatch-1st Source Income Fund in exchange for shares of the Wasatch-1st Source Income Fund and the assumption of all liabilities of the 1st Source Monogram Income Fund by the Wasatch-1st Source Income Fund and the subsequent liquidation and dissolution of the 1st Source Monogram Income Fund.
At a Special Meeting of the Shareholders of the 1st Source Monogram Income Equity Fund, a series of The Coventry Group, held on December 11, 2008, the shareholders of 1st Source Monogram Income Equity Fund approved the acquisition of all of the assets of the 1st Source Monogram Income Equity Fund by the Wasatch-1st Source Income Equity Fund in exchange for shares of the Wasatch-1st Source Income Equity Fund and the assumption of all liabilities of the 1st Source Monogram Income Equity Fund by the Wasatch-1st Source Income Equity Fund and the subsequent liquidation and dissolution of the 1st Source Monogram Income Equity Fund.
At a Special Meeting of the Shareholders of the 1st Source Monogram Long/Short Fund, a series of The Coventry Group, held on December 11, 2008, the shareholders of 1st Source Monogram Long/Short Fund approved the acquis-
ition of all of the assets of the 1st Source Monogram Long/Short Fund by the Wasatch-1st Source Long/Short Fund in exchange for shares of the Wasatch-1st Source Long/Short Fund and the assumption of all liabilities of the 1st Source Monogram Long/Short Fund by the Wasatch-1st Source Long/Short Fund and the subsequent liquidation and dissolution of the 1st Source Monogram Long/Short Fund.
2. SIGNIFICANT ACCOUNTING POLICIES
The financial statements have been prepared in conformity with United States of America Generally Accepted Accounting Principles (“GAAP”). The following is a summary of significant policies related to investments of the Funds held at March 31, 2009.
Valuation of Securities — Securities are valued as of the close of the New York Stock Exchange (generally 4:00 p.m. Eastern Time) on the valuation date. Equity securities are valued using a commercial pricing service at the latest quoted sales price taken from the primary market in which each security trades and, with respect to equity securities traded on Nasdaq, such securities are valued using the Nasdaq Official Closing Price (“NOCP”) or last sales price if no NOCP is available. If there are no sales on the primary exchange or market on a given day, then the security is valued at the most recent bid price. Debt securities (other than short-term instruments) are valued at current market value by a commercial pricing service, or by using the last sale or bid price. Short term securities, which mature in 60 days or less, are valued at amortized cost, which approximates market value. Exchange-traded options are valued at the last sale price in the market where they are principally traded. If there are no sales on the primary exchange or market on a given day, then the option is valued at the most recent bid price. If market quotations are not readily available for the Funds’ investments in securities such as restricted securities, private placements, securities for which trading has been halted or other illiquid securities, these investments will be valued at fair value in accordance with Board-approved Pricing Policies and Procedures by the Pricing Committee of the Advisor (“Pricing Committee”) with oversight by the Board of Directors. Fair value is defined as the amount the owner of a security might reasonably expect to receive upon a current sale. For each applicable investment that is fair valued, the Pricing Committee considers, to the extent applicable, various factors including, but not limited to, the financial condition of the company or limited partnership, operating results, prices paid in follow-on rounds, comparable companies in the public market, the nature and duration of the restrictions for holding the securities, and other relevant factors.
Additionally, a Fund’s investments will be valued at fair value by the Pricing Committee if the Advisor determines that an event impacting the value of an investment occurred between the closing time of a security’s primary market or exchange (for example, a foreign exchange or market) and the time the Fund’s share price is calculated. Significant events include, but are not limited to the following: significant fluctuations in domestic markets, foreign markets or foreign currencies; occurrences not directly tied to the securities markets such as natural disasters, armed conflicts or
113
Table of Contents
| WASATCH FUNDS — Notes to Financial Statements (continued) | ||
significant governmental actions; and major announcements affecting a single issuer or an entire market or market sector. In responding to a significant event, the Pricing Committee would determine the fair value of affected securities by considering factors including, but not limited to: index options and futures traded subsequent to the close; American Depositary Receipts (“ADRs”), Global Depositary Receipts (“GDRs”) or other related receipts; currency spot or forward markets that trade after pricing of the foreign exchange; other derivative securities traded after the close such as Standard & Poor’s Depository Receipts (“SPDRs”) and other exchange traded funds (“ETFs”); and alternative market quotes on the affected securities. In addition, the Funds may use a systematic fair valuation model provided by an independent third party in certain circumstances to assist in adjusting the valuation of foreign securities.
As of March 31, 2009, the aggregate amount of fair valued securities, excluding any foreign securities fair valued pursuant to a systematic fair valuation model, as a percentage of net assets for the Funds was as follows:
Core Growth Fund | 1.45 | % | |
Emerging Markets Small Cap Fund | — | ||
Global Opportunities Fund | 0.24 | % | |
Global Science & Technology Fund | 2.77 | % | |
Heritage Growth Fund | — | ||
Heritage Value Fund | — | ||
International Growth Fund | 0.01 | % | |
International Opportunities Fund | 0.70 | % | |
Micro Cap Fund | 0.39 | % | |
Micro Cap Value Fund | 0.89 | % | |
Small Cap Growth Fund | 1.57 | % | |
Small Cap Value Fund | 1.76 | % | |
Strategic Income Fund | 1.17 | % | |
Ultra Growth Fund | 6.99 | % | |
Wasatch-1st Source Income Equity Fund | — | ||
Wasatch-1st Source Long/Short Fund | — | ||
U.S. Treasury Fund | — | ||
Wasatch-1st Source Income Fund | — |
In March 2008, the Financial Accounting Standards Board (FASB) issued FASB Statement of Financial Accounting Standards No. 161, Disclosures about Derivative Instruments and Hedging Activities (SFAS 161). SFAS 161 is intended to improve financial reporting about derivative instruments and hedging activities by requiring enhanced disclosures to enable investors to better understand their effects on an entity’s financial position, financial performance and cash flows. SFAS 161 is effective for fiscal years and interim periods beginning after November 15, 2008. Management is currently evaluating the impact the adoption of SFAS 161 will have on the Funds’ financial statement disclosures.
Foreign Currency Translations — Values of investments denominated in foreign currencies are converted into U.S. dollars using the current exchange rate. Purchases and sales of investments and dividend income are translated into U.S. dollars using the current prevailing exchange rate on the transaction date. The effect of changes in foreign exchange rates on realized and unrealized gains or losses on securities is reflected as a component of such gains or losses. Trans-
actions in foreign denominated assets may involve greater risks than domestic transactions, including currency, political, economic, regulatory, and market risks.
At March 31, 2009, the foreign currencies held by the Funds were as follows (amounts in U.S. dollars):
| Cost of Currency | Market Value of Currency | |||||
Core Growth Fund | ||||||
Euro Currency | $ | 175,324 | $ | 174,929 | ||
Indian Rupee | 2,184,602 | 2,184,602 | ||||
South Korean Won | 27 | 24 | ||||
| $ | 2,359,953 | $ | 2,359,555 | |||
Emerging Markets Small Cap Fund | ||||||
Brazilian Real | $ | 4,912 | $ | 4,981 | ||
Egyptian Pound | 11 | 11 | ||||
Indian Rupee | 1,788 | 1,788 | ||||
Taiwan Dollar | 2,340 | 2,330 | ||||
Qatari Rial | 24,811 | 24,807 | ||||
South Korean Won | 5 | 5 | ||||
| $ | 33,867 | $ | 33,922 | |||
Global Opportunities Fund | ||||||
Australian Dollar | $ | 11 | $ | 11 | ||
Japanese Yen | 286 | 282 | ||||
British Pound | 4,939 | 5,002 | ||||
UAE Dirham | 11 | 11 | ||||
| $ | 5,247 | $ | 5,306 | |||
Global Science & Technology Fund | ||||||
Euro Currency | $ | 29,732 | $ | 29,665 | ||
British Pound | 30,340 | 30,726 | ||||
| $ | 60,072 | $ | 60,391 | |||
International Growth Fund | ||||||
Euro Currency | $ | 71,340 | $ | 71,403 | ||
Japanese Yen | 11,249 | 11,079 | ||||
Taiwan Dollar | 16,352 | 16,678 | ||||
South Korean Won | 5 | 6 | ||||
| $ | 98,946 | $ | 99,166 | |||
International Opportunities Fund | ||||||
Euro Currency | $ | 27,489 | $ | 27,427 | ||
Indian Rupee | 12,448 | 12,448 | ||||
Taiwan Dollar | 3 | 3 | ||||
South Korean Won | 16 | 16 | ||||
| $ | 39,956 | $ | 39,894 | |||
Micro Cap Fund | ||||||
South Korean Won | $ | 11 | $ | 9 | ||
Micro Cap Value Fund | ||||||
Brazilian Real | $ | 10,634 | $ | 10,625 | ||
South Korean Won | — | 1 | ||||
| $ | 10,634 | $ | 10,626 | |||
Small Cap Growth Fund | ||||||
South Korean Won | $ | 5 | $ | 4 | ||
Strategic Income Fund | ||||||
Hong Kong Dollar | $ | 1 | $ | 1 | ||
114
Table of Contents
| MARCH 31, 2009 | ||
Investment in Securities and Related Investment Income — Security transactions are accounted for on the trade date. Gains or losses on securities sold are determined on the identified cost basis. Dividend income and distributions to shareholders are recorded on the ex-dividend date except that certain dividends from foreign securities may be recorded after the ex-dividend date based on when the Fund is informed of the dividend. Interest income and estimated expenses are accrued daily. Bond discount and premium are amortized using the interest method. To the extent dividends received from Real Estate Investment Trust securities include return of capital distributions; such distributions are recorded as income, and adjusted accordingly for tax purposes.
Short Sales — To a limited extent, the Equity Funds, except the Wasatch-1st Source Income Equity Fund, may enter into short sales whereby a fund sells a security it generally does not own (the security is borrowed), in anticipation of a decline in the security’s price. The initial amount of a short sale is recorded as a liability which is marked to market daily. Fluctuations in the value of the short liability are recorded as unrealized gains or losses. If a fund shorts a security when also holding a long position in the security (a “short against the box”), as the security’s price declines, the short position increases in value, offsetting the long position’s decrease in value. The opposite effect occurs if the security’s price rises. A Fund realizes a gain or loss upon closing of the short sale (returning the security to the counterparty by way of purchase or delivery of a long position owned). The Funds are liable to the buyer for any dividends payable on securities while those securities are in a short position. These dividends are an expense of the Funds. The Funds designate collateral consisting of cash, U.S. government securities or other liquid assets sufficient to collateralize the market value of short positions.
Options Transactions — The Equity Funds may buy and sell put and call options, write covered put and call options, including over-the-counter options, on portfolio securities where the completion of the obligation is dependent upon the credit standing of another party. The risk in writing a call option is that a Fund gives up the opportunity for profit if the market price of the security increases. The risk in writing a put option is that a Fund may incur a loss if the market price of the security decreases and the option is exercised. The risk in buying an option is that a Fund pays a premium whether or not the option is exercised. A Fund also has the additional risk of not being able to enter into a closing transaction if a liquid secondary market does not exist. Option contracts are valued daily and unrealized appreciation or depreciation is recorded. A Fund will realize a gain or loss upon expiration or closing of the option transaction. When an option is exercised, the proceeds on sales for a written call option, the purchase cost for a written put option, or the cost of a security for a purchased put or call option is adjusted by the amount of premium received or paid.
Repurchase Agreements — The Funds may engage in repurchase transactions. Under the terms of a typical repurchase agreement, a fund takes possession of an underlying debt obligation subject to an obligation of the seller to
repurchase and the fund to resell the obligation at an agreed upon price and time. The market value of the collateral must be equal at all times to the total amount of the repurchase obligation, including interest. Generally, in the event of counterparty default, the Fund has the right to use the collateral to offset losses incurred.
Federal Income Taxes — It is the Funds’ policy to comply with the requirements of the Internal Revenue Code applicable to regulated investment companies and to distribute substantially all taxable income to shareholders. Accordingly, no provision for federal income or excise taxes has been made.
Expenses — The Funds contract for various services mostly on a collective basis. Most expenses are directly attributable to each Fund and therefore are charged accordingly. Expenses that are not directly attributable to one or more Funds are allocated among applicable Funds on an equitable and consistent basis considering such things as the nature and type of expense and the relative net assets of the Funds.
Use of Management Estimates — The preparation of financial statements in conformity with GAAP requires management to make estimates and assumptions that affect the reported amounts of assets and liabilities at the date of the financial statements and the reported changes in net assets during the reporting period. Actual results could differ from those estimates.
Guarantees and Indemnifications — In the normal course of business, the Funds enter into contracts that contain a variety of representations and warranties which provide general indemnifications. The maximum exposure under these arrangements is unknown, as this would involve future claims that may be made against the Funds and/or its affiliates that have not yet occurred. Based on experience, however, the risk of loss is expected to be remote.
Redemption Fees — The Funds deduct a fee of 2.00% from redemption proceeds on shares of the Funds held 2 months or less. Redemption fees retained by the Funds are credited to additional paid-in capital.
3. DISTRIBUTIONS
Dividends from net investment income and net realized gains, if any, are declared and paid at least annually for all Funds, except for dividends from net investment income in five funds. The Wasatch-1st Source Income Fund declares and pays dividends monthly. The Strategic Income, Wasatch-1st Source Long/Short, U.S. Treasury and Wasatch-1st Source Income Equity Funds declare and pay dividends quarterly. The amount of dividends and distributions from net investment income and net realized gains are determined in accordance with federal income tax regulations, which may differ from GAAP. The Funds may utilize earnings and profits distributed to shareholders on redemption of shares as part of the dividends paid deduction (tax equalization).
To the extent these book and tax differences are permanent in nature, such amounts are reclassified at the end of the fiscal year among paid-in capital in excess of par value, undistributed net investment income (loss), and undistributed net realized gain (loss) on investments and foreign currency translations.
115
Table of Contents
| WASATCH FUNDS — Notes to Financial Statements (continued) | ||
4. PURCHASESAND SALESOF SECURITIES
Cost of investment securities purchased and proceeds from sales of investment securities, excluding U.S. government and short-term securities for the period ended March 31, 2009 are summarized below:
| Core Growth Fund | Emerging Markets Small Cap Fund | Global Opportunities Fund1 | Global Science & Technology Fund | Heritage Growth Fund | Heritage Value Fund | International Growth Fund | |||||||||||||||
Purchases | $ | 58,576,180 | $ | 10,616,341 | $ | 32,121,274 | $ | 12,701,495 | $ | 12,274,148 | $ | 3,635,470 | $ | 36,892,854 | |||||||
Sales | 129,543,895 | 12,499,717 | 2,297,500 | 29,799,275 | 22,299,381 | 3,577,058 | 74,912,652 | ||||||||||||||
| International Opportunities Fund | Micro Cap Fund | Micro Cap Value Fund | Small Cap Growth Fund | Small Cap Value Fund | Strategic Income Fund | Ultra Growth Fund | |||||||||||||||
Purchases | $ | 31,457,035 | $ | 57,529,673 | $ | 42,135,241 | $ | 202,455,967 | $ | 92,926,004 | $ | 6,174,001 | $ | 39,080,329 | |||||||
Sales | 14,082,419 | 87,034,534 | 49,267,896 | 223,383,707 | 143,958,899 | 6,221,341 | 51,452,284 | ||||||||||||||
| Wasatch-1st Source Income Equity Fund | Wasatch-1st Source Long/ Short Fund | Wasatch-1st Source Income Fund | |||||||||||||||||||
Purchases | 498,355,730 | 89,899,533 | 10,351,919 | ||||||||||||||||||
Sales | 56,604,915 | 72,483,240 | 7,040,431 | ||||||||||||||||||
1 | Inception date of the Fund was November 17, 2008. |
Purchases and sales of U.S. government securities in the U.S. Treasury Fund were $90,500,982 and $73,918,547, respectively. Purchases and sales of U.S. government securities in the Wasatch-1st Source Income Fund were $11,480,323 and $8,157,429, respectively.
5. OPTIONS CONTRACTS WRITTEN
Options written activity during the period ended March 31, 2009 was as follows:
Options Outstanding at | Written | Closed | Exercised | Expired | Options Outstanding at | |||||||||||||||
Heritage Growth Fund | ||||||||||||||||||||
Premium amount | $ | — | $ | 59,780 | $ | (11,170 | ) | $ | — | $ | (35,440 | ) | $ | 13,170 | ||||||
Number of contracts | — | 445 | (80 | ) | — | (335 | ) | 30 | ||||||||||||
Heritage Value Fund | ||||||||||||||||||||
Premium amount | $ | — | $ | 281,053 | $ | (175,419 | ) | $ | — | $ | (102,447 | ) | $ | 3,187 | ||||||
Number of contracts | — | 1,466 | (900 | ) | — | (551 | ) | 15 | ||||||||||||
Micro Cap Value Fund | ||||||||||||||||||||
Premium amount | $ | — | $ | 1,341,348 | $ | (662,014 | ) | $ | — | $ | (591,038 | ) | $ | 88,296 | ||||||
Number of contracts | — | 8,424 | (4,118 | ) | — | (3,676 | ) | 630 | ||||||||||||
Small Cap Value Fund | ||||||||||||||||||||
Premium amount | $ | — | $ | 426,158 | $ | (255,579 | ) | $ | — | $ | (170,579 | ) | $ | — | ||||||
Number of contracts | — | 3,691 | (2,266 | ) | — | (1,425 | ) | — | ||||||||||||
Strategic Income Fund | ||||||||||||||||||||
Premium amount | $ | — | $ | 82,475 | $ | (40,755 | ) | $ | — | $ | (41,720 | ) | $ | — | ||||||
Number of contracts | — | 1,340 | (460 | ) | — | (880 | ) | — | ||||||||||||
6. FEDERAL INCOME TAX INFORMATION
As of March 31, 2009, the cost and unrealized appreciation (depreciation) of securities, excluding written options and securities sold short, on a tax basis were as follows:
| Core Growth Fund | Emerging Markets Small Cap Fund | Global Opportunities Fund1 | Global Science & Technology Fund | Heritage Growth Fund | Heritage Value Fund | |||||||||||||||||||
Cost | $ | 527,896,750 | $ | 27,220,886 | $ | 34,191,373 | $ | 60,520,978 | $ | 73,793,961 | $ | 3,197,033 | ||||||||||||
Gross appreciation | $ | 37,276,484 | $ | 1,061,619 | $ | 4,128,555 | $ | 1,817,281 | $ | 2,190,066 | $ | 84,602 | ||||||||||||
Gross (depreciation) | (222,389,627 | ) | (11,309,043 | ) | (1,700,703 | ) | (19,208,149 | ) | (17,888,103 | ) | (258,711 | ) | ||||||||||||
Net appreciation (depreciation) | $ | (185,113,143 | ) | $ | (10,247,424 | ) | $ | 2,427,852 | $ | (17,390,868 | ) | $ | (15,698,037 | ) | $ | (174,109 | ) | |||||||
1 | Inception date of the Fund was November 17, 2008. |
116
Table of Contents
| MARCH 31, 2009 | ||
| International Growth Fund | International Opportunities Fund | Micro Cap Fund | Micro Cap Value Fund | Small Cap Growth Fund | Small Cap Value Fund | |||||||||||||||||||
Cost | $ | 141,837,833 | $ | 62,281,696 | $ | 291,462,713 | $ | 65,469,832 | $ | 585,953,758 | $ | 232,401,271 | ||||||||||||
Gross appreciation | $ | 7,542,950 | $ | 2,557,711 | $ | 13,704,936 | $ | 3,529,499 | $ | 68,116,238 | $ | 8,788,698 | ||||||||||||
Gross (depreciation) | (48,764,850 | ) | (14,390,667 | ) | (114,918,333 | ) | (18,189,826 | ) | (160,730,170 | ) | (86,789,544 | ) | ||||||||||||
Net depreciation | $ | (41,221,900 | ) | $ | (11,832,956 | ) | $ | (101,213,397 | ) | $ | (14,660,327 | ) | $ | (92,613,932 | ) | $ | (78,000,846 | ) | ||||||
| Strategic Income Fund | Ultra Growth Fund | Wasatch-1st Source Income Equity Fund | Wasatch-1st Source Long/Short Fund | U.S. Treasury Fund | Wasatch-1st Source Income Fund | |||||||||||||||||||
Cost | $ | 21,469,593 | $ | 99,266,462 | $ | 1,158,347,489 | $ | 106,423,528 | $ | 141,120,073 | $ | 95,992,858 | ||||||||||||
Gross appreciation | $ | 510,102 | $ | 9,668,949 | $ | 11,145,905 | $ | 4,031,203 | $ | 19,924,714 | $ | 2,415,198 | ||||||||||||
Gross (depreciation) | (8,255,204 | ) | (26,240,667 | ) | (238,388,594 | ) | (11,234,546 | ) | — | (1,880,331 | ) | |||||||||||||
Net appreciation (depreciation) | $ | (7,745,102 | ) | $ | (16,571,718 | ) | $ | (227,242,689 | ) | $ | (7,203,343 | ) | $ | 19,924,714 | $ | 534,867 | ||||||||
The difference between cost amounts for financial statement and federal income tax purposes is due primarily to timing differences in recognizing certain securities gains and losses.
The FASB issued Interpretation No. 48, “Accounting for Uncertainty in Income Taxes, and Interpretation of FASB Statement No. 109” (“FIN 48”), in June 2006. FIN 48 permits the recognition of tax benefits of an uncertain tax position only when the position is “more likely than not” to be sustained assuming examination by taxing authorities. The Funds adopted the provisions of FIN 48 on March 31, 2008. Management has reviewed the Funds’ tax positions for all open tax years, and concluded that adoption had no effect on the Funds’ financial positions or results of operations. As of September 30, 2008, the Funds have recorded no liability for net unrecognized tax benefits relating to uncertain income tax positions they have taken or expect to take in future tax returns. However, the conclusions regarding FIN 48 are subject to review and adjustment at a later date based on factors including, but not limited to, further implementation guidance expected from FASB, and on-going analysis of tax laws, regulation, and interpretations thereof.
The components of accumulated earnings on a tax basis as of September 30, 2008 were as follows:
| Core Growth Fund | Emerging Markets Small Cap Fund1 | Global Science & Technology Fund | Heritage Growth Fund | Heritage Value Fund | International Growth Fund | |||||||||||||||||||
Undistributed ordinary income | $ | 1,509,194 | $ | 29,714 | $ | — | $ | 164,629 | $ | 37,714 | $ | — | ||||||||||||
Undistributed capital gains | — | — | — | 223,369 | — | — | ||||||||||||||||||
Accumulated earnings | 1,509,194 | 29,714 | — | 387,998 | 37,714 | — | ||||||||||||||||||
Accumulated capital and other losses | (6,866,787 | ) | (4,482,499 | ) | (6,456,255 | ) | — | (466,111 | ) | (23,786,153 | ) | |||||||||||||
Other undistributed ordinary losses | — | — | (656,537 | ) | (522 | ) | (3,820 | ) | (6,446,639 | ) | ||||||||||||||
Net unrealized depreciation* | (38,137,115 | ) | (16,983,582 | ) | (23,006,863 | ) | (1,297,511 | ) | (426,835 | ) | (38,680,900 | ) | ||||||||||||
Total accumulated earnings (deficit) | $ | (43,494,708 | ) | $ | (21,436,367 | ) | $ | (30,119,655 | ) | $ | (910,035 | ) | $ | (859,052 | ) | $ | (68,913,692 | ) | ||||||
| International Opportunities Fund | Micro Cap Fund | Micro Cap Value Fund | Small Cap Growth Fund | Small Cap Value Fund | Strategic Income Fund | |||||||||||||||||||
Undistributed ordinary income | $ | — | $ | — | $ | — | $ | — | $ | — | $ | 91,310 | ||||||||||||
Undistributed capital gains | — | — | — | 1,539,212 | — | — | ||||||||||||||||||
Accumulated earnings | — | — | — | 1,539,212 | — | 91,310 | ||||||||||||||||||
Accumulated capital and other losses | (2,545,997 | ) | (16,271,491 | ) | (10,668,793 | ) | (1,429,868 | ) | (38,861,513 | ) | (1,766,910 | ) | ||||||||||||
Other undistributed ordinary gains/losses | (1,392,082 | ) | (332,841 | ) | (217,095 | ) | (100,930 | ) | (574,907 | ) | (13,654 | ) | ||||||||||||
Net unrealized appreciation (depreciation)* | (13,485,043 | ) | (45,092,408 | ) | (12,059,321 | ) | 20,718,024 | (65,793,863 | ) | (5,337,394 | ) | |||||||||||||
Total accumulated earnings (deficit) | $ | (17,423,122 | ) | $ | (61,696,740 | ) | $ | (22,945,209 | ) | $ | 20,726,438 | $ | (105,230,283 | ) | $ | (7,026,648 | ) | |||||||
1 | Inception date of Fund was October 1, 2007. |
| * | On investments, securities sold short, derivative and foreign currency denominated assets and liabilities. |
117
Table of Contents
| WASATCH FUNDS — Notes to Financial Statements (continued) | ||
| Ultra Growth Fund | Wasatch-1st Source Income Equity Fund | Wasatch-1st Source Long/Short Fund | U.S. Treasury Fund | Wasatch-1st Source Income Fund | ||||||||||||||||||
Undistributed ordinary income | $ | — | $ | — | $ | 1,468,680 | $ | 53 | $ | 74,375 | ||||||||||||
Undistributed capital gains | — | — | 110,509 | — | — | |||||||||||||||||
Accumulated earnings | — | — | 1,579,189 | 53 | 74,375 | |||||||||||||||||
Accumulated capital and other losses | (3,005,390 | ) | (1,775,352 | ) | (1,392,158 | ) | (4,601,615 | ) | (3,186,705 | ) | ||||||||||||
Other undistributed ordinary losses | (20,910 | ) | — | — | — | — | ||||||||||||||||
Net unrealized appreciation (depreciation)* | (19,681,724 | ) | (38,697,605 | ) | (6,323,495 | ) | 6,844,293 | (2,093,418 | ) | |||||||||||||
Total accumulated earnings (deficit) | $ | (22,708,024 | ) | $ | (40,472,957 | ) | $ | (6,136,464 | ) | $ | 2,242,731 | $ | (5,205,748 | ) | ||||||||
| * | On investments, securities sold short, derivative and foreign currency denominated assets and liabilities. |
Capital loss carryforwards are available through the date specified below to offset future realized net capital gains. To the extent future gains are offset by capital loss carryforwards, such gains will not be distributed.
Capital Loss carryforwards expire September 30:
| Fund | 2009 | 2010 | 2011 | 2012 | 2013 | 2014 | 2015 | 2016 | ||||||||||||||||
Emerging Markets Small Cap Fund | $ | — | $ | — | $ | — | $ | — | $ | — | $ | — | $ | — | $ | 158,461 | ||||||||
Wasatch-1st Source Income Equity Fund | — | — | 767,800 | — | — | — | — | 1,007,552 | ||||||||||||||||
Wasatch-1st Source Long/Short Fund | — | — | — | — | — | — | — | 1,392,158 | ||||||||||||||||
U.S. Treasury Fund | 3,544,582 | 831,495 | — | — | — | — | 225,538 | — | ||||||||||||||||
Wasatch-1st Source Income Fund | — | — | — | 283,047 | 958,942 | 1,382,991 | — | 561,725 | ||||||||||||||||
The Core Growth, Emerging Markets Small Cap, Global Science & Technology, Heritage Value, International Growth, International Opportunities, Micro Cap, Micro Cap Value, Small Cap Growth, Small Cap Value, Strategic Income, and Ultra Growth Funds had $6,866,787, $4,234,038, $6,456,255, $466,111, $23,786,153, $2,545,997, $16,271,491, $10,668,793, $1,429,868, $38,861,513, $1,766,910, and $3,005,390 of post-October capital losses. The Global Science & Technology, International Growth, International Opportunities, Micro Cap, Micro Cap Value , Small Cap Growth, Small Cap Value, and Ultra Growth Funds had $316,339, $136,229, $124,125, $96,320, $100,930, $61,217, $20,910, and $134,117 respectively, of post-October currency losses. The Global Science & Technology, International Growth, International Opportunities, Micro Cap, Micro Cap Value, and Small Cap Value Funds had $340,198, $6,310,410, $1,241,945, $236,521, $82,978, and $513,690 of post-October Passive Foreign Investment Company losses. Net capital losses incurred after October 31 and within the taxable year are deemed to arise on the first day of the following tax year.
The tax character of distributions paid during the year or period ended September 30, 2008 was as follows:
| 2008 | Core Growth Fund | Emerging Markets Small Cap Fund1 | Global Science & Technology Fund | Heritage Growth Fund | Heritage Value Fund | International Growth Fund | ||||||||||||
Ordinary income | $ | 9,254,596 | $ | 99,236 | $ | 6,265,922 | $ | — | $ | 55,924 | $ | 20,995,608 | ||||||
Capital gain | 196,051,701 | — | 11,168,273 | 14,407,067 | — | 47,903,587 | ||||||||||||
Total | $ | 205,306,297 | $ | 99,236 | $ | 17,434,195 | $ | 14,407,067 | $ | 55,924 | $ | 68,899,195 | ||||||
| 2008 | International Opportunities Fund | Micro Cap Fund | Micro Cap Value Fund | Small Cap Growth Fund | Small Cap Value Fund | Strategic Income Fund | ||||||||||||
Ordinary income | $ | 3,840,037 | $ | 4,999,978 | $ | 3,944,821 | $ | — | $ | 35,199,888 | $ | 2,956,671 | ||||||
Capital gain | 6,278,872 | 93,390,001 | 12,484,239 | 120,648,854 | 107,894,653 | 317,486 | ||||||||||||
Total | $ | 10,118,909 | $ | 98,389,979 | $ | 16,429,060 | $ | 120,648,854 | $ | 143,094,541 | $ | 3,274,157 | ||||||
| 2008 | Ultra Growth Fund | Wasatch-1st Source Income Equity Fund | Wasatch-1st Source Long/Short Fund | U.S. Treasury Fund | Wasatch-1st Source Income Fund | |||||||||||||
Ordinary income | $ | 4,736,134 | $ | 6,063,576 | $ | 419,058 | $ | 4,603,049 | $ | 1,804,021 | ||||||||
Capital gain | 27,565,914 | — | — | — | — | |||||||||||||
Tax Return of Capital | — | 112,239 | 59,547 | — | — | |||||||||||||
Total | $ | 32,302,048 | $ | 6,175,815 | $ | 478,605 | $ | 4,603,049 | $ | 1,804,021 | ||||||||
1Inception | date of the Fund was October 1, 2007. |
118
Table of Contents
| MARCH 31, 2009 | ||
The tax character of distributions paid during the year ended March 31, 2008 was as follows:
| 2008 | Wasatch-1st Source Income Equity Fund | Wasatch-1st Source Long/Short Fund | Wasatch-1st Source Income Fund | ||||||
Ordinary income | $ | 5,043,122 | $ | 3,276,239 | $ | 3,486,230 | |||
Capital gain | 13,662,031 | 613,791 | — | ||||||
Tax Return of Capital | 24,424 | — | — | ||||||
Total | $ | 18,729,577 | $ | 3,890,030 | $ | 3,486,230 | |||
The tax character of distributions paid during the year or period ended September 30, 2007 was as follows:
| 2007 | Core Growth Fund | Global Science & Technology Fund | Heritage Fund | Heritage Fund1 | International Fund | International Opportunities Fund | ||||||||||||
Ordinary income | $ | 7,290,307 | $ | — | $ | 23,657 | $ | — | $ | — | $ | 62,484 | ||||||
Capital gain | 107,442,861 | 5,210,791 | 7,225,239 | 69,456,586 | — | 2,442,244 | ||||||||||||
Total | $ | 114,733,168 | $ | 5,210,791 | $ | 7,248,896 | $ | 69,456,586 | $ | — | $ | 2,504,728 | ||||||
| 2007 | Micro Cap Fund | Micro Cap Value Fund | Small Cap Growth Fund | Small Cap Value Fund | Strategic Income Fund | Ultra Growth Fund | ||||||||||||
Ordinary income | $ | 2,745,719 | $ | 5,585,055 | $ | — | $ | 13,942,266 | $ | 2,956,671 | $ | 5,456,463 | ||||||
Capital gain | 64,975,198 | 12,810,726 | 92,697,704 | 75,189,464 | 317,486 | 15,688,974 | ||||||||||||
Total | $ | 67,720,917 | $ | 18,395,781 | $ | 92,697,704 | $ | 89,131,730 | $ | 3,274,157 | $ | 21,145,437 | ||||||
| 2007 | U.S. Treasury Fund | |||||||||||||||||
Ordinary income | $ | 7,951,409 | ||||||||||||||||
Capital gain | — | |||||||||||||||||
Total | $ | 7,951,409 | ||||||||||||||||
1Inception | date of the Fund was August 30, 2007. |
The tax character of distributions paid may differ from that shown in the Statements of Changes in Net Assets due to short-term gains being treated as ordinary income for tax purposes.
7. RELATED PARTY TRANSACTIONS
Investment Advisory Fees — As the Fund’s investment advisor, the Advisor receives a monthly fee calculated on average daily net assets. The Advisor has contractually agreed to waive its fees and/or reimburse a Fund should a Fund’s operating expenses exceed a specified annual limitation through at least January 31, 2010. Investment advisory fees and fees waived, if any, for the year or period ended March 31, 2009 are disclosed in the Statements of Operations. Investment advisory fee and expense limitation annual rates are shown below.
| Core Growth Fund | Emerging Markets Small Cap Fund | Global Opportunities Fund | Global Science & Technology Fund | Heritage Growth Fund | Heritage Value Fund | |||||||||||||
Advisory Fee | 1.00 | % | 1.75 | % | 1.95 | % | 1.50 | % | 0.70 | % | 0.70 | % | ||||||
Expense Limitation | 1.50 | % | 2.10 | % | 2.25 | % | 1.95 | % | 0.95 | % | 0.95 | % | ||||||
| International Growth Fund | International Opportunities Fund | Micro Cap Fund | Micro Cap Value Fund | Small Cap Growth Fund | Small Cap Value Fund | |||||||||||||
Advisory Fee | 1.50 | % | 1.95 | % | 1.95 | % | 1.95 | % | 1.00 | % | 1.50 | % | ||||||
Expense Limitation | 1.95 | % | 2.25 | % | 2.25 | % | 2.25 | % | 1.50 | % | 1.95 | % | ||||||
119
Table of Contents
| WASATCH FUNDS — Notes to Financial Statements (continued) | ||
| Strategic Income Fund | Ultra Growth Fund | Wasatch- 1st Source Income Equity Fund | Wasatch- 1st Source Long/ Short Fund | U.S. Treasury Fund | Wasatch-1st Source Income Fund | |||||||||||||
Advisory Fee | 0.70 | % | 1.25 | % | 0.90 | % | 1.10 | % | 0.50 | % | 0.55 | % | ||||||
Expense Limitation | 0.95 | % | 1.75 | % | 1.10 | % | — | 0.75 | % | — |
Affiliated Interests — An officer of the Funds owns approximately 42% of the shares outstanding of the Strategic Income Fund as of March 31, 2009.
8. TRANSACTIONSWITH AFFILIATES
If a Fund’s holding represents ownership of 5% or more of the voting securities of a company, the company is deemed to be an affiliate as defined by the 1940 Act. The following Funds conducted transactions during the period ended March 31, 2009 with “affiliated companies” as so defined:
| Share Activity | Dividends Credited to Income for the Six Months ended 3/31/09 | Loss Realized on Sale of Shares for the Six Months ended 3/31/09 | ||||||||||||||
| Balance 9/30/08 | Purchases/ Additions | Sales/ Reductions | Balance 3/31/09 | |||||||||||||
Micro Cap Fund | ||||||||||||||||
inTEST Corp. | 565,045 | — | 565,045 | — | * | $ | — | $ | (2,831,317 | ) | ||||||
Tamalpais Bancorp | 254,618 | — | 3,045 | 251,573 | 30,371 | (4,901 | ) | |||||||||
| $ | 30,371 | $ | (2,836,218 | ) | ||||||||||||
Small Cap Value Fund | ||||||||||||||||
MicroFinancial, Inc. | 742,623 | — | 742,623 | — | * | $ | 35,851 | $ | (6,809,925 | ) | ||||||
| *No | longer affiliated as of March 31, 2009. |
9. RESTRICTED SECURITIES
The Funds may own investments that were purchased through private placement transactions or under Rule 144A of the Securities Act of 1933 (the “Securities Act”) and cannot be sold without prior registration under the Securities Act or may be limited due to certain restrictions. These securities are generally deemed to be illiquid and are valued at fair value as determined by a designated Pricing Committee, comprised of personnel of the Advisor, with oversight by the Board of Directors and in accordance with Board-approved Pricing Policies and Procedures. If and when such securities are registered, the costs of registering such securities are paid by the issuer. At March 31, 2009, the Funds held the following restricted securities:
| Security Type | Acquisition Date | Acquisition Cost | Fair Value | Value as % of Net Assets | |||||||||
Core Growth Fund | |||||||||||||
DataPath, Inc. | Common Stock | 6/23/06 | $ | 7,566,680 | $ | 34,394 | 0.01 | % | |||||
Solar Capital, LLC | Common Stock | 3/7/07 | 13,200,900 | 5,042,744 | 1.45 | % | |||||||
| $ | 20,767,580 | $ | 5,077,138 | 1.46 | % | ||||||||
Global Science & Technology Fund | |||||||||||||
BlueArc Corp. | Warrants | 5/30/08 | $ | — | $ | — | — | ||||||
BlueArc Corp., Series DD | Preferred Stock | 6/6/06 | 324,998 | 324,998 | 0.75 | % | |||||||
BlueArc Corp., Series FF | Preferred Stock | 5/30/08 | 628,066 | 628,067 | 1.45 | % | |||||||
Incipient, Inc., Series D | Preferred Stock | 2/7/06 | 139,219 | 302 | — | ||||||||
Montagu Newhall Global Partners II-B, L.P. | LP Interest | 10/10/03 - 11/6/08 | 384,387 | 238,740 | 0.55 | % | |||||||
Xtera Communications, Inc., Series A-1 | Preferred Stock | 9/3/03 | 7,076 | 6,339 | 0.01 | % | |||||||
| $ | 1,483,746 | $ | 1,198,446 | 2.76 | % | ||||||||
International Growth Fund | |||||||||||||
Redcorp Ventures Ltd. | Warrants | 7/5/07 | $ | — | $ | 10,603 | 0.01 | % | |||||
International Opportunities Fund | |||||||||||||
Redcorp Ventures Ltd. | Warrants | 7/5/07 | $ | — | $ | 1,693 | — | ||||||
120
Table of Contents
| MARCH 31, 2009 | ||
| Security Type | Acquisition Date | Acquisition Cost | Fair Value | Value as % of Net Assets | |||||||||
Micro Cap Fund | |||||||||||||
Cardica, Inc. | Warrants | 6/7/07 | $ | 19,380 | $ | — | — | ||||||
Familymeds Group, Inc. | Warrants | 12/1/04 | — | — | — | ||||||||
Goldwater Bank, N.A. | Common Stock | 2/28/07 | 1,540,000 | 743,820 | 0.39 | % | |||||||
Ithaca Energy Inc. | Common Stock | 6/5/06 | 1,965,844 | 505,913 | 0.26 | % | |||||||
Washington Trust Bancorp, Inc. | PIPE | 10/2/08 | 2,328,800 | 1,892,150 | 0.99 | % | |||||||
| $ | 5,854,024 | $ | 3,141,883 | 1.64 | % | ||||||||
Micro Cap Value Fund | |||||||||||||
Cardica, Inc. | Warrants | 6/7/07 | $ | 9,302 | $ | — | — | ||||||
Familymeds Group, Inc. | Warrants | 12/1/04 | — | — | — | ||||||||
Goldwater Bank, N.A. | Common Stock | 2/28/07 | 419,000 | 202,377 | 0.39 | % | |||||||
Idaho Trust Bancorp | Common Stock | 8/30/06 | 500,004 | 260,002 | 0.50 | % | |||||||
NeurogesX, Inc. | PIPE | 12/28/07 | 626,226 | 308,046 | 0.59 | % | |||||||
NeurogesX, Inc. | Warrants | 12/28/07 | 3,800 | — | — | ||||||||
| $ | 1,558,332 | $ | 770,425 | 1.48 | % | ||||||||
Small Cap Growth Fund | |||||||||||||
Bravo Health, Inc., Series G | Preferred Stock | 11/1/04 | $ | 571,428 | $ | 851,666 | 0.17 | % | |||||
Fluidigm Corp., Series E | Preferred Stock | 12/22/06 | 2,500,000 | 1,932,138 | 0.38 | % | |||||||
Incipient, Inc., Series D | Preferred Stock | 2/7/06 | 1,860,778 | 4,045 | — | ||||||||
Montagu Newhall Global Partners II-B, L.P. | LP Interest | 10/10/03 - 11/6/08 | 3,843,853 | 2,387,406 | 0.47 | % | |||||||
Montagu Newhall Global Partners III-B, L.P. | LP Interest | 3/16/06 -10/17/08 | 840,000 | 500,603 | 0.10 | % | |||||||
Nanosys, Inc., Series D | Preferred Stock | 11/8/05 | 2,000,000 | 1,444,068 | 0.28 | % | |||||||
Orexigen Therapeutics, Inc. | PIPE | 11/21/2006 | 1,000,001 | 381,579 | 0.07 | % | |||||||
Orqis Medical Corp., Series D | Preferred Stock | 2/28/07 | 1,200,000 | 555,000 | 0.11 | % | |||||||
TargetRX, Inc., Series D | Preferred Stock | 4/8/05 | 769,098 | 3,628 | — | ||||||||
Valera Pharmaceuticals, Inc. VP003 (Octreotide Implant) CSR | Rights | 2/1/06 - 2/2/06 | 243,922 | — | — | ||||||||
Valera Pharmaceuticals, Inc. Ureteral Stent CSR | Rights | 2/1/06 - 2/2/06 | 162,615 | — | — | ||||||||
Zonare Medical Systems, Inc. | Warrants | 6/30/04 | — | — | — | ||||||||
Zonare Medical Systems, Inc., Series E | Preferred Stock | 6/30/04 | 1,500,000 | 291,640 | 0.06 | % | |||||||
| $ | 16,491,695 | $ | 8,351,773 | 1.64 | % | ||||||||
Small Cap Value Fund | |||||||||||||
Solar Capital, LLC | Common Stock | 3/7/07 | $ | 7,079,100 | $ | 2,704,216 | 1.76 | % | |||||
Star Asia Financial Ltd. | Common Stock | 2/22/07 | 6,000,000 | 60,000 | 0.04 | % | |||||||
Washington Trust Bancorp | PIPE | 10/2/08 | 4,034,260 | 3,277,836 | 2.13 | % | |||||||
| $ | 17,113,360 | $ | 6,042,052 | 3.93 | % | ||||||||
Strategic Income Fund | |||||||||||||
Redcorp NSR | Common Stock | 12/18/08 | $ | — | $ | — | — | ||||||
Redcorp Ventures, Ltd. | PIPE | 7/5/07 | — | 758 | 0.01 | % | |||||||
Redcorp Ventures, Ltd. | Warrants | 12/18/08 | — | — | — | ||||||||
Redcorp Ventures Ltd., 13.00%, 7/11/12 | Corporate Bond | 7/5/07 | 282,956 | 52,091 | 0.37 | % | |||||||
Solar Capital, LLC | Common Stock | 3/7/07 | 294,000 | 112,308 | 0.80 | % | |||||||
Star Asia Financial Ltd. | Common Stock | 2/22/07 - 4/28/08 | 619,710 | 17,279 | 0.12 | % | |||||||
| $ | 1,196,666 | $ | 182,436 | 1.30 | % | ||||||||
Ultra Growth Fund | |||||||||||||
Bravo Health, Inc., Series G | Preferred Stock | 11/1/04 | $ | 571,428 | $ | 851,666 | 1.01 | % | |||||
Montagu Newhall Global Partners II-B, L.P. | LP Interest | 10/10/03 - 11/6/08 | 3,459,467 | 2,148,660 | 2.56 | % | |||||||
Montagu Newhall Global Partners III-B, L.P. | LP Interest | 3/16/06 -10/17/08 | 840,000 | 500,603 | 0.60 | % | |||||||
Nanosys, Inc., Series D | Preferred Stock | 11/8/05 | 500,001 | 361,018 | 0.43 | % | |||||||
Ophthonix, Inc. | Common Stock | 9/23/05 | 500,000 | 504 | — | ||||||||
Redcorp Ventures Ltd. | Warrants | 7/5/07 | — | 5,929 | 0.01 | % | |||||||
TargetRX, Inc., Series D | Preferred Stock | 4/8/05 | 230,904 | 1,089 | — | ||||||||
121
Table of Contents
| WASATCH FUNDS — Notes to Financial Statements (continued) | ||
| Security Type | Acquisition Date | Acquisition Cost | Fair Value | Value as % of Net Assets | |||||||||
TherOx, Inc., Series I | Preferred Stock | 7/7/05 | 1,000,000 | 895,120 | 1.07 | % | |||||||
Transoma Medical, Inc., Series B | Preferred Stock | 1/20/06 | 475,001 | 820,105 | 0.98 | % | |||||||
Xtera Communications, Inc., Series A-1 | Preferred Stock | 9/3/03 | 99,065 | 88,738 | 0.10 | % | |||||||
Zonare Medical Systems, Inc. | Warrants | 6/30/04 | — | — | — | ||||||||
Zonare Medical Systems, Inc., Series E | Preferred Stock | 6/30/04 | 1,000,000 | 194,426 | 0.23 | % | |||||||
| $ | 8,675,866 | $ | 5,867,858 | 6.99 | % | ||||||||
LP Limited Partnership Interest
PIPE Private Investment in a Public Equity
10. PURCHASE COMMITMENTS
In September 2003, the Global Science & Technology, Small Cap Growth and Ultra Growth Funds entered into subscription agreements to acquire limited partnership interests in Montagu Newhall Global Partners II-B, L.P. The remaining commitment amounts at March 31, 2009 were $110,000, $1,100,000 and $990,000, respectively. Securities held by the Funds have been designated to meet these purchase commitments.
In November 2004, the Small Cap Growth and Ultra Growth Funds entered into subscription agreements to acquire shares of Bravo Health, Inc., Series G Pfd. The remaining commitment amounts at March 31, 2009 were $428,572 per Fund. Securities held by the Funds have been designated to meet these purchase commitments.
In December 2005, the Small Cap Growth and Ultra Growth Funds entered into subscription agreements to acquire limited partnership interests in Montagu Newhall Global Partners III-B, L.P. The remaining commitment amounts at March 31, 2009 were $660,000 per Fund. Securities held by the Funds have been designated to meet these purchase commitments.
11. LINEOF CREDIT
The Equity Funds opened two lines of credit totaling $75,000,000, one of which is $25,000,000 uncommitted, and the other of which is $50,000,000 committed, with State Street Bank and Trust Company on June 4, 2007 (together, the “Line”). The Line is for temporary or emergency purposes such as to provide liquidity for shareholder redemptions. The Equity Funds incur commitment fees on the undrawn portion of the committed part of the Line, and interest expense to the extent of amounts drawn (borrowed) under the entire Line. Interest is based on the higher of (a) the Federal Funds rate as in effect on the date of borrowing and (b) the overnight LIBOR rate as in effect on the date of borrowing, plus a margin. Commitment fees are pro-rated among the Equity Funds based upon relative average net assets. Interest expense is charged directly to the fund based upon actual amounts borrowed by the fund.
For the six months ended March 31, 2009, the following Funds had borrowings:
| Fund | Average Daily Borrowings | Number of Days Outstanding | Interest Expense | Weighted Average Annualized Interest Rate | Balance at March 31, 2009 | |||||||||
Core Growth Fund | $ | 2,281,083 | 12 | $ | 540 | 0.71 | % | $ | — | |||||
Emerging Markets Small Cap Fund | 476,594 | 32 | 379 | 0.89 | % | — | ||||||||
Global Science & Technology Fund | 2,368,333 | 6 | 365 | 0.92 | % | — | ||||||||
Heritage Growth Fund | 308,318 | 22 | 150 | 0.80 | % | — | ||||||||
International Growth Fund | 1,365,543 | 70 | 2,477 | 0.93 | % | — | ||||||||
Small Cap Growth Fund | 2,358,000 | 30 | 1,403 | 0.74 | % | — | ||||||||
Small Cap Value Fund | 727,923 | 13 | 327 | 1.24 | % | — | ||||||||
Ultra Growth Fund | 714,609 | 23 | 493 | 1.08 | % | — | ||||||||
12. FAIR VALUE MEASUREMENTS
Each Fund adopted the Financial Accounting Standards Board (“FASB”) Statement of Financial Accounting Standards No. 157, Fair Value Measurements (“FAS 157’’), effective October 1, 2008. In accordance with FAS 157, fair value is defined as the price that each Fund would receive upon selling an investment in a timely transaction to an independent buyer in the principal or most advantageous market of the investment. FAS 157 has established a three-tier hierarchy to maximize the use of observable market data “inputs” and minimize the use of unobservable “inputs” and to establish classification of fair value measurements for disclosure purposes. Inputs refer broadly to the assumptions that market participants would use in pricing the asset or liability, including assumptions about risk (for example, the risk inherent in a particular valuation technique used to measure fair value including such a pricing model and/or the risk inherent in the inputs to the valuation technique). Inputs may be observable or
122
Table of Contents
| MARCH 31, 2009 | ||
unobservable. Observable inputs are inputs that reflect the assumptions market participants would use in pricing the asset or liability developed based on market data obtained from sources independent of the reporting entity. Unobservable inputs are inputs that reflect the reporting entity’s own assumptions about the assumptions market participants would use in pricing the asset or liability developed based on the best information available in the circumstances. The three-tier hierarchy of inputs is summarized in the three broad levels listed below:
| • | Level 1 — quoted prices in active markets for identical investments |
| • | Level 2 — other significant observable inputs (including quoted prices for similar investments, interest rates, prepayment speeds, credit risk, etc.) |
| • | Level 3 — significant unobservable inputs (including the Funds’ own assumptions in determining the fair value of investments) |
The valuation techniques used by the Funds to measure fair value for the period ended March 31, 2009 maximized the use of observable inputs and minimized the use of unobservable inputs. The Funds utilized the following fair value techniques:
multi-dimensional relational pricing model and option adjusted spread pricing; the Funds estimated the price that would
have prevailed in a liquid market for an international equity security given information available at the time of evaluation.
The following is a summary of the fair valuations according to the inputs used as of March 31, 2009 in valuing the Funds’ assets and liabilities:
| Fund | Quoted Prices in Active Markets for Identical Investments (Level 1) | Significant Other Observable Inputs (Level 2) | Significant Unobservable Inputs (Level 3) | Value at 3/31/2009 | ||||||||||
Core Growth Fund | Investments in Securities | $ | 301,203,742 | $ | 41,579,865 | $ | — | $ | 342,783,607 | |||||
Emerging Markets Small Cap Fund | Investments in Securities | 5,220,030 | 11,753,432 | — | 16,973,462 | |||||||||
Global Opportunities Fund | Investments in Securities | 18,549,818 | 18,069,407 | — | 36,619,225 | |||||||||
Global Science & Technology Fund | Investments in Securities | 27,854,769 | 14,076,895 | 1,198,446 | 43,130,110 | |||||||||
Heritage Growth Fund | Investments in Securities | 53,794,960 | 4,294,364 | — | 58,089,324 | |||||||||
Heritage Value Fund | Investments in Securities | 2,387,449 | 633,000 | — | 3,020,449 | |||||||||
International Growth Fund | Investments in Securities | 17,747,778 | 82,868,155 | — | 100,615,933 | |||||||||
International Opportunities Fund | Investments in Securities | 11,503,109 | 38,938,798 | 6,833 | 50,448,740 | |||||||||
Micro Cap Fund | Investments in Securities | 164,392,161 | 25,113,335 | 743,820 | 190,249,316 | |||||||||
Micro Cap Value Fund | Investments in Securities | 34,064,705 | 15,657,441 | 462,379 | 50,184,525 | |||||||||
Small Cap Growth Fund | Investments in Securities | 439,603,029 | 45,766,604 | 7,970,193 | 493,339,826 | |||||||||
Small Cap Value Fund | Investments in Securities | 132,405,462 | 21,994,963 | — | 154,400,425 | |||||||||
Strategic Income Fund | Investments in Securities | 11,873,070 | 1,763,890 | — | 13,636,960 | |||||||||
Ultra Growth Fund | Investments in Securities | 67,563,409 | 9,269,407 | 5,861,928 | 82,694,744 | |||||||||
Wasatch-1st Source Income Equity Fund | Investments in Securities | 824,359,800 | 106,745,000 | — | 931,104,800 | |||||||||
Wasatch-1st Source Long/Short Fund | Investments in Securities | 59,678,287 | 19,807,000 | — | 79,485,287 | |||||||||
U.S. Treasury Fund | Investments in Securities | 159,646,787 | 1,398,000 | — | 161,044,787 | |||||||||
Wasatch-1st Source Income Fund | Investments in Securities | 29,435,536 | 67,092,189 | — | 96,527,725 | |||||||||
The following is a reconciliation of the fair valuations using significant unobservable inputs (Level 3) for the Funds during the period ended March 31, 2009:
| Fund | Market Value Beginning Balance 10/1/2008 | Purchases at Cost/ Sales (Proceeds) | Realized Gain/(Loss) | Change in Unrealized Gain/(Loss) | Transfers in and/or out at Market Value | Market Value Ending Balance 3/31/2009 | ||||||||||||||||
Core Growth Fund | Investments in Securities | $ | 18,726 | $ | — | $ | (12,181,173 | ) | $ | 12,162,447 | $ | — | $ | — | ||||||||
Global Science & Technology Fund | Investments in Securities | 1,380,784 | 20,000 | (21,508 | ) | (180,830 | ) | — | 1,198,446 | |||||||||||||
International Opportunities Fund | Investments in Securities | 2,428 | 30,630 | (815,284 | ) | 635,819 | 153,240 | 6,833 | ||||||||||||||
Micro Cap Fund | Investments in Securities | 1,235,454 | — | (4,883,105 | ) | 4,391,471 | — | 743,820 | ||||||||||||||
Micro Cap Value Fund | Investments in Securities | 835,454 | — | (1,040,181 | ) | 667,106 | — | 462,379 | ||||||||||||||
Small Cap Growth Fund | Investments in Securities | 11,678,921 | 274,994 | (286,777 | ) | (3,696,945 | ) | — | 7,970,193 | |||||||||||||
Small Cap Value Fund | Investments in Securities | 8,964 | — | (3,328,550 | ) | 3,319,586 | — | — | ||||||||||||||
Ultra Growth Fund | Investments in Securities | 9,122,653 | 255,000 | — | (3,515,725 | ) | — | 5,861,928 | ||||||||||||||
123
Table of Contents
| WASATCH FUNDS — Supplemental Information | ||
Management Information. The business affairs of Wasatch Funds are supervised by its Board of Directors. The Board consists of four directors who are elected and serve until their successors are elected and qualified.
The directors and executive officers of Wasatch Funds and their principal occupations for at least the last five years are set forth below.
| Name, Address and Age | Position(s) Held with Wasatch Funds | Term of Office1 and Length of Time Served | Principal Occupation(s) During Past 5 Years | Number of Portfolios in Fund Complex Overseen by Director | Other Directorships Held by Director2 | |||||
Independent Directors | ||||||||||
James U. Jensen, J.D., MBA c/o Wasatch Funds 150 Social Hall Ave. 4th Floor Salt Lake City, Utah 84111 Age 64 | Director and Chairman of the Board | Indefinite Served as Chairman of the Board since 2004 and Director since 1986 | Chief Executive Officer of Clearwater Governance Group (an operating board governance consulting company) July 2008 to present; Co-Founder and Chairman of the Board of Intelisum, Inc. (a company pursuing computer and measurement technology and products) 2001 to 2008; Consultant on corporate growth and technology transfer since 2004; Vice President, Corporate Development, Legal Affairs and General Counsel, and Secretary, NPS Pharmaceuticals, Inc. from 1991 to 2004. | 18 | Private companies and foundations.
Director of Cognigen Networks, Inc. (Internet and relationship enabled marketing company) since December 2007.
Director of Bayhill Capital Corp. (telephone communications) since December 2007. | |||||
William R. Swinyard, Ph.D. c/o Wasatch Funds 150 Social Hall Ave. 4th Floor Salt Lake City, Utah 84111 Age 68 | Director and Chairman of the Audit Committee | Indefinite Served as Chairman of the Audit Committee since 2004 and Director since 1986 | Professor of Business Management and Holder of the Fred G. Meyer Chair of Marketing (Emeritus), Brigham Young University since 1978. | 18 | None | |||||
D. James Croft, Ph.D. c/o Wasatch Funds 150 Social Hall Ave. 4th Floor Salt Lake City, Utah 84111 Age 67 | Director | Indefinite Served as Director since 2005 | Consultant since 2004 and Founder & Executive Director, Mortgage Asset Research Institute from 1990 to 2004. | 18 | None | |||||
Interested Director | ||||||||||
Samuel S. Stewart, Jr., Ph.D. CFA3 150 Social Hall Ave. 4th Floor Salt Lake City, UT 84111 Age 66 | President and Director | Indefinite Served as President and Director since 1986 | Chairman of the Board for the Advisor since 1975; Chief Investment Officer of the Advisor since 2004; Director of Research of the Advisor from 1975 to 2004; Chairman of the Board of Wasatch Funds from 1986 to 2004. | 18 | None | |||||
1 | A Director may serve until his death, resignation, removal or retirement. Each Independent Director shall retire as Director at the end of the calendar year in which he attains the age of 72 years. |
2 | Directorships are those held by a Director in any company with a class of securities registered pursuant to Section 12 of the Securities Exchange Act of 1934 or subject to the requirements of Section 15(d) of the Securities Exchange Act or any company registered as an investment company under the 1940 Act. |
3 | Mr. Stewart is an Interested Director because he serves as a director and officer of the Advisor. |
124
Table of Contents
| MARCH 31, 2009 (UNAUDITED) | ||
| Name, Address and Age | Position(s) Held with Wasatch Funds | Term of Office and Length of Time Served | Principal Occupation(s) during Past 5 Years | |||
Officers | ||||||
Daniel D. Thurber 150 Social Hall Ave. 4th Floor Salt Lake City, UT 84111 Age 39 | Vice President | Indefinite Served as Vice President since February 2007 | General Counsel, Chief Compliance Officer and Director of Compliance for the Advisor since 2006; Chief Compliance Officer and Secretary for Wasatch Funds from May 2006 to February 2007; Associate and Partner at Dorsey & Whitney LLP from 2001 to 2006. | |||
Russell L. Biles 150 Social Hall Ave. 4th Floor Salt Lake City, UT 84111 Age 41 | Chief Compliance Officer, Vice President and Secretary | Indefinite Served as Chief Compliance Officer and Vice President since February 2007 and Secretary since November 2008 | Chief Compliance Officer and Vice President for Wasatch Funds since February 2007; Counsel for the Advisor since October 2006; Senior Compliance Administrator for the Advisor from October 2005 to October 2006; Attorney and Managing Member of Nicholls Nicholls Biles & Bower, LLC from 2002 to 2005. | |||
Eric Huefner 150 Social Hall Ave. 4th Floor Salt Lake City, UT 84111 Age 44 | Vice President and Treasurer | Indefinite Served as Vice President since February 2008 and Treasurer from November 2008 to May 2009 | Vice President for Wasatch Funds since February 2008; Director of Mutual Funds for the Advisor since June 2006; Business Director, Campbell Soup Company, March 2003 to May 2006. | |||
Cindy B. Firestone, CPA 150 Social Hall Ave. 4th Floor Salt Lake City, UT 84111 Age 51 | Treasurer | Indefinite Served as Treasurer since May 2009 | Treasurer for Wasatch Funds since May 2009, Assistant Treasurer for Wasatch Funds from November 2008 to May 2009; Internal Auditor for the Advisor since December 2002. | |||
Additional information about the Funds’ directors is provided in the Statement of Additional Information and is available without charge, upon request, by calling 800.551.1700.
125
Table of Contents
| WASATCH FUNDS — Supplemental Information (continued) | ||
PROXY VOTING POLICIES, PROCEDURESAND RECORD
A description of the policies and procedures that Wasatch Advisors uses to vote proxies related to the Funds’ portfolio securities is set forth in the Funds’ Statement of Additional Information which is available without charge, upon request, on the Funds’ web site at www.wasatchfunds.com or by calling 800.551.1700 and on the Securities and Exchange Commission’s (SEC) web site at www.sec.gov.
Wasatch Funds’ proxy voting record is available on the Funds’ web site at www.wasatchfunds.com and the SEC’s web site at www.sec.gov no later than August 31 for the prior 12 months ending June 30.
QUARTERLY PORTFOLIO HOLDINGS DISCLOSUREON FORM N-Q
The Funds file their complete schedules of investments with the SEC for their first and third fiscal quarters of each fiscal year, commencing with the quarter ended December 31, 2004, on Form N-Q. The Funds�� Form N-Q is available on the SEC’s web site at www.sec.gov, and may be viewed at the SEC’s Public Reference Room in Washington, D.C. (information on the operation of the Public Reference Room may be obtained by calling 800.SEC.0330).
DISCLOSUREFOR BOARD APPROVALOF ADVISORY AND SERVICE CONTRACT FOR ALL FUNDS (EXCEPT THE HERITAGE VALUE FUND, THE GLOBAL OPPORTUNITIES FUND, THE WASATCH-1ST SOURCE INCOME EQUITY FUND, THE WASATCH-1ST SOURCE LONG/SHORT FUNDANDTHE WASATCH-1ST SOURCE INCOME FUND) AND SUB-ADVISORY AGREEMENT FOR THE U.S. TREASURY FUND
At a meeting held on January 28, 2009 (the “January Meeting”), the Board of Directors of Wasatch Funds, Inc. (the “Company”) including the Independent Directors, unanimously approved the Advisory and Service Contract (the “Advisory Contract”) between the Company on behalf of the Funds (other than the the Wasatch-1st Source Income Equity Fund, the Wasatch-1st Source Long/Short Fund, the Wasatch-1st Source Income Fund, the Global Opportunities Fund and the Heritage Value Fund) and Wasatch Advisors, Inc. (the “Advisor”) and the Sub-Advisory Agreement by and between the Advisor and Hoisington Investment Management Company (the “Sub-Advisor”) on behalf of the the U.S. Treasury Fund (the “Sub-Advisory Agreement”). To assist the Board in its evaluation of the Advisory Contract and Sub-Advisory Agreement, the Independent Directors received materials and other information, in adequate time in advance of the January Meeting, which outlined, among other things:
| • | the terms and conditions of the Advisory Contract and Sub-Advisory Agreement, including the nature, extent and quality of services provided by the Advisor and Sub-Advisor; |
| • | the organization and business operations of the Advisor and Sub-Advisor, including the experience of persons who have managed and who will manage the respective Fund; |
| • | the profitability of the Advisor from serving as adviser to the respective Fund (plus profitability analysis for advisers to unaffiliated investment companies generally and the expenses of the Advisor in providing the services); |
| • | the management fees of the Advisor, including comparisons of such fees with the management fees of comparable, unaffiliated funds prepared by an independent third party and the Advisor’s fee schedule for other clients; |
| • | the sub-advisory fees of the Sub-Advisor with respect to the U.S. Treasury Fund (including the Sub-Advisor’s fee schedule for other clients); |
| • | the expenses of each Fund, including comparisons with the expense ratios of comparable, unaffiliated funds compiled by an independent third party; |
| • | the respective Fund’s past performance plus such Fund’s performance compared to funds of similar investment objectives compiled by independent third parties and with recognized benchmarks; and |
| • | from Independent Counsel, a legal memorandum outlining, among other things, the duties of the Independent Directors under the Investment Company Act of 1940 (the “1940 Act”), as well as the general principles of relevant state law in reviewing and approving advisory contracts; the requirements of the 1940 Act in such matters; an adviser’s fiduciary duty with respect to advisory agreements and compensation; the standards used by courts in determining whether investment company boards of directors have fulfilled their duties and factors to be considered by the Board in voting on advisory agreements. |
In addition to the materials, as noted, the Independent Directors met in Executive Sessions with independent counsel to discuss, among other things, the Advisory Contract and Sub-Advisory Agreement, the materials provided, and the Board’s duties in reviewing and approving advisory contracts. The Independent Directors, in consultation with independent counsel, also reviewed the factors set out in judicial decisions and SEC directives relating to the renewal of advisory contracts. The information provided for the Meeting supplements the information the Board receives throughout the year regarding a Fund’s performance, expense ratios, portfolio composition, trade execution and sales activity. In this regard, the Independent Directors have considered and recognized the extraordinary and challenging market conditions during the last year and have therefore focused their attention on the Funds’ performance throughout the year, including the Board’s deliberations at a special meeting held on October 17, 2008 (the “October Meeting”). In response to a request from the Board, each portfolio manager provided written reviews of his/her respective Fund’s performance and proposed modifications deemed necessary or appropriate to the manner in which the Funds’ are managed. At the October Meeting, the Board met with management to discuss, among other things, the Advisor’s investment process and philosophy, investment strategies, and the portfolio managers’ evaluations of their respective Fund’s performance. The Independent Directors also met in Executive Session with independent legal counsel to discuss, among other things, the Funds’ performance, the portfolio managers’ reviews and recommendations, if any, and the current market environment.
126
Table of Contents
| MARCH 31, 2009 (UNAUDITED) | ||
As outlined in more detail below, the Independent Directors considered all factors they believed relevant with respect to the Funds, including the following: (a) the nature, extent and quality of the services to be provided by the Advisor and Sub-Advisor; (b) the investment performance of the respective Fund as available (as described in further detail in Section (B) below); (c) the profits to be realized by the Advisor from the relationship with the Fund; (d) the extent to which economies of scale would be realized as a Fund grows; and (e) whether fee levels reflect these economies of scale for the benefit of Fund investors.
| A. | NATURE, EXTENTAND QUALITYOF SERVICES |
In evaluating the nature, extent and quality of the Advisor’s and Sub-Advisor’s services, the Independent Directors reviewed information concerning the types of services (advisory and non-advisory or administrative services) that the Advisor and Sub-Advisor provide to the respective Fund; the performance record of the applicable Fund; and information describing the Advisor’s and Sub-Advisor’s organization and business. In connection with their service as Independent Directors of the Company, the Independent Directors also periodically have met with the Advisor and Sub-Advisor’s personnel and have evaluated their professional experience, qualifications and credentials as well as their investment approach and research process. Given the Independent Directors’ experience with the Funds, Advisor and Sub-Advisor, the Independent Directors were familiar with and have a good understanding of the organization, operations, investment philosophy and personnel of the Advisor and Sub-Advisor.
In connection with their review of the advisory services being provided, the Independent Directors considered the investment philosophy and investment mandates of each Fund and whether the Advisor and Sub-Advisor (as applicable) have performed consistently with such philosophy and mandates. While the Directors believe that the Advisor and Sub-Advisor have consistently applied their traditional investment philosophy and processes in managing the applicable Funds, the Directors also have recognized the Advisor’s continual review of its research process in order to keep refining and improving its investment process, particularly in light of recent market conditions. In connection with its review of advisory services, the Independent Directors also considered the changes to the personnel involved with the portfolio management of each Fund and its research team and the impact, if any, to the services provided to the Funds. The Independent Directors further reviewed the compensation arrangements of the Advisor’s personnel to evaluate the Advisor’s ability to attract and retain key employees, including portfolio managers, preserve stability and reward performance but not provide an incentive for taking undue risks. In addition to compensation, the Directors also considered the Advisor’s succession plans to preserve stability over time. In light of the regulatory emphasis on compliance, in reviewing the services that have been provided to the Funds, the Independent Directors also considered the Advisor’s compliance activities and regulatory history.
In their review of services, the Independent Directors also evaluated the quality of administrative or non-advisory services provided. The terms of the Advisory Contract provide that the Advisor shall administer the Company’s affairs to the extent requested by and subject to the supervision of the Board for the period and terms of the contract. In this regard, the Advisor provides business, administrative, compliance, marketing and other services required to operate the Funds, such as assistance with preparation and filing of regulatory and tax reports, preparation and distribution of prospectuses and shareholder reports, provision of information to Fund directors, analysis to ensure compliance with federal and state laws and regulations, valuation of portfolio securities, and oversight of the performance of the Funds’ service providers (e.g., administrator, fund accountant, transfer agent and custodian). The Advisor also pays for office space and facilities for the Funds. In reviewing the services provided, the Independent Directors considered the changes to Advisor personnel, the qualifications of personnel performing new roles in servicing the Funds, and the impact on the level of services provided to the Funds, if any.
With respect to the Sub-Advisor for the U.S. Treasury Fund, it was noted that the Sub-Advisory Agreement is essentially an agreement for portfolio management services only and the Sub-Advisor was not expected to supply other significant administrative services.
Based on their review, the Independent Directors found that, overall, the nature, extent and quality of services provided under the Advisory Contract and the Sub-Advisory Agreement were satisfactory on behalf of each applicable Fund.
| B. | THE INVESTMENT PERFORMANCEOFTHE FUNDS |
In evaluating each Fund’s performance, the Directors reviewed both short-term and long-term performance of each Fund relative to its peer group and relevant benchmarks, with greater weight given to performance over longer periods of time. More specifically, the Independent Directors reviewed, among other things, materials reflecting the respective Fund’s historic performance for the one-, three-, five-, and 10-year periods ending November 30, 2008 (as applicable) compared to its respective benchmarks and unaffiliated funds in its investment category. Additionally, the Independent Directors reviewed a report prepared by an unaffiliated third-party comparing the respective Fund’s total return for the one-, two-, three-, four-, five-, and 10- year periods ending November 30, 2008 (as applicable) compared to the performance of unaffiliated funds with similar investment objectives or classifications (a “Peer Group”) for the prescribed periods. In addition, the Independent Directors received reports prepared by a second unaffiliated party regarding the Funds, which generally included an analyst report on the respective Fund (other than the International Opportunities Fund, Emerging Markets Small Cap Fund, Strategic Income Fund and the U.S. Treasury Fund). This information supplemented the performance information provided to the Board at each of its quarterly meetings as well as at other meetings or executive sessions during the year in response to the Board’s requests,
127
Table of Contents
| WASATCH FUNDS — Supplemental Information (continued) | ||
including the October Meeting. Further, the Independent Directors also recognized the limitations on some of the usefulness of the performance comparison information as the closest Peer Group for a Fund may not adequately reflect the Fund’s investment strategies and may be invested in sectors or industries in which the respective Fund has limited or no exposure. The Independent Directors further considered the performance of the Funds in the context of the volatile market conditions during the past year. Based on their review and in light of the above considerations, the Independent Directors were satisfied with the steps taken by the Advisor to address Fund performance during extraordinary times.
| C. | FEES, EXPENSESAND PROFITABILITY |
1. Fees and Expenses
In their evaluation of fees and expenses, the Independent Directors reviewed the Advisor’s management fees and expense ratios for each Fund and the sub-advisory fee with respect to the U.S. Treasury Fund in absolute terms as well as with comparisons of fees and expenses of funds with similar objectives. In this regard, the Independent Directors reviewed and considered, among other things, comparisons of the respective Fund’s actual management fees, total expenses (including and excluding 12b-1/non-12b-1 service fees), and non-management expenses (such as transfer agency, custodian, administrative and accounting fees) with those of unaffiliated funds in its Peer Group compiled by an independent third party. In reviewing fees, the Independent Directors also considered the expense limitation agreement provided by the Advisor for the Funds and the amounts the Advisor has reimbursed to the Funds for the last three fiscal years (if any) which effectively reduces the amount of advisory fees paid to the Advisor.
As noted above, the Independent Directors considered not only a Fund’s management fee, but also its total expense ratio compared to their Peer Groups. In this regard, the Core Growth Fund, the Heritage Growth Fund, and the Strategic Income Fund had total expense ratios below the Peer Group median. The remaining Funds had advisory fees and total expense ratios higher than the Peer Group median. The Independent Directors noted that with respect to the International Opportunities Fund, the Micro Cap Fund, and the Micro Cap Value Fund, the Advisor has agreed to reduce its advisory fee by 0.05% of average daily net assets of the respective Fund. The Advisor has also agreed to reduce the expense cap on the Micro Cap Fund from 2.50% of average daily net assets to 2.25% of average daily net assets, effective through January 31, 2010.
In addition to reviewing fees and expenses in absolute terms and in comparisons to peers, the Independent Directors recognized the Advisor’s research intensive investment approach and the related costs, including, in particular, the Advisor’s significant investment in its research personnel. The Independent Directors also noted the Advisor’s continued investment philosophy to close a Fund to new and/or existing investors when necessary to preserve the integrity of a Fund’s investment strategy, particularly for
Funds that primarily invest in smaller companies. The Independent Directors recognized that this practice may result in the Advisor foregoing additional fees on a larger asset base and exposing the Advisor to reduced revenues from asset outflows. The Independent Directors seek to encourage the Advisor’s practice of closing Funds when necessary or appropriate to maintain or enhance performance. Given the foregoing, the Independent Directors recognized that the current advisory fee levels were acceptable.
2. Fees Charged to Other Advisor and Sub-Advisor Clients
In reviewing fees, the Independent Directors also compared the advisory fees to the fees the Advisor assesses other types of clients, including institutional and high net worth separate accounts and a private investment company. Currently, the Advisor manages separate account client assets in styles similar to those used for certain Funds, including the Core Growth, the Emerging Markets Small Cap, the Heritage Growth, the International Growth, the Micro Cap, the Small Cap Growth, the Small Cap Value, and the Ultra Growth Funds. With respect to separate accounts, the fees for these accounts are generally lower than the comparable Fund (except the fees are the same in the case of the Heritage Growth Fund). The Independent Directors considered the differences in the product types, including the services provided. In this regard, the Independent Directors have noted that the range of services provided to the Funds in managing and operating registered investment companies is more extensive than those provided to separately managed accounts. The Advisor provides services to the Funds that extend beyond the portfolio management services provided to its separate account clients. As described in more detail above, these services include business, administrative, compliance, marketing and other services required to operate the Funds. Further, the Independent Directors recognized that the Funds operate in a highly regulated industry requiring extensive compliance. Such responsibilities generally are not required to the same extent for separate accounts. Accordingly, the Independent Directors believe the nature and number of services provided to operate a Fund merit higher fees than those of separate accounts. Similarly, with respect to the private investment company, such company is not subject to the extensive regulatory scheme required of operating registered investment companies such as the Funds, and therefore the services required differ. In addition, the Independent Directors noted the advisory fee arrangement of the private investment company with the Advisor provides for a performance fee and therefore its fee structure differs significantly from that of the Funds.
In considering the fees of the Sub-Advisor, the Independent Directors also considered the pricing schedule the Sub-Advisor charges for similar investment management services for other clients. In this regard, the sub-advisory fees for the U.S. Treasury Fund were at the lower end of the Sub-Advisor’s fee schedule. The Independent Directors also noted that the sub-advisory fees were established through arm’s length negotiations between the Advisor and the Sub-Advisor which is unaffiliated with the Advisor.
128
Table of Contents
| MARCH 31, 2009 (UNAUDITED) | ||
3. Profitability of Advisor
The Independent Directors reviewed pro forma profitability information for the Advisor derived from its relationship with each Fund for the calendar year ending December 31, 2008. In reviewing profitability, the Independent Directors reviewed the methodology utilized to allocate revenue and expenses of the Advisor among the Funds. In considering profitability, the Independent Directors have recognized the inherent limitations in determining profitability which may be affected by many factors, including the allocation of expenses across multiple investment products served by the Advisor. The allocation of research and personnel expenses is also particularly difficult given the Advisor’s shared research culture. The Independent Directors further noted the impact on profitability due to the Advisor’s compensation arrangements and the reduction of assets under management during the recent challenging market conditions. In addition to reviewing the Advisor’s profitability, the Directors also reviewed the Advisor’s relative profitability compared to publicly available information concerning unaffiliated advisers. However, the Independent Directors recognized the difficulties in comparing the profitability of various advisors given that individual fund or product line profitability of other advisers generally is not publicly available and the profitability information that is available for certain advisers or management firms may not be representative of the industry and may be affected by numerous factors including the structure of the particular adviser, the types of funds managed, its business mix, expense allocations, and the adviser’s capital structure and cost of capital. The Independent Directors noted that the Advisor’s profitability is within a reasonable range compared to the peer group of unaffiliated advisers. Based on their review, the Independent Directors were satisfied that the Advisor’s level of profitability from its relationship with each Fund was not unreasonable in light of the services provided.
With respect to the Sub-Advisor, although a profitability analysis was not available, the Independent Directors received certain financial statements of the Sub-Advisor. Given that the Sub-Advisor’s fee is at the low end of its fee schedule and the fact that the sub-advisory fee is established through arm’s length negotiations, the Independent Directors believe the Sub-Advisor’s profitability from its relationship with the U.S. Treasury Fund is not unreasonable.
In addition to the above, the Independent Directors also considered that the Advisor benefits from soft dollar arrangements whereby it receives brokerage and research services from brokers that execute a Fund’s purchases and sales of securities, as described in further detail below.
| D. | ECONOMIESOF SCALEAND WHETHER FEE LEVELS REFLECT THESE ECONOMIESOF SCALE |
In reviewing advisory fees, the Independent Directors recognized that the advisory fee schedules for the Funds do not contain breakpoints that reduce the fee rate on assets above certain levels. With respect to funds investing in small and micro-cap companies, the Independent Directors recognized that the economies of scale and profit potential
that may be achieved may be limited. In this regard, the Independent Directors are aware that it is more difficult to replicate performance in the small- and micro-cap funds at larger asset sizes and therefore, as noted above, a Fund may be closed to new and/or existing shareholders from time to time. This practice enhances the Advisor’s focus on achieving performance by maintaining assets at levels it can effectively manage but may limit economies of scale derived from a larger asset base. The Independent Directors, as noted, also recognized that this practice may limit the Advisor’s profit potential from earning additional fees on a larger asset base and expose the Advisor to reduced revenues from asset outflows when Funds are closed to investors. The Independent Directors also have noted the costs associated with the Advisor’s research intensive investment approach. The Independent Directors further recognized the Advisor’s position that to the extent economies of scale exist, the proposed level of advisory fee reflects such economies of scale. In addition, the Independent Directors recognized the reduction in assets under management of the Funds during the past year and the corresponding impact on the Advisor to reimburse fees pursuant to its expense limitation agreement. Considering the factors above, the Independent Directors concluded the absence of breakpoints was acceptable and that such economies as exist are adequately reflected in the Advisor’s fee structure.
| E. | INDIRECT BENEFITS |
In evaluating fees, the Independent Directors also considered any indirect benefits or profits the Advisor or its affiliates may receive as a result of its relationship with the Funds. In this regard, the Independent Directors considered that the Advisor benefits from soft dollar arrangements pursuant to which it receives research from brokers that execute the applicable Fund’s brokerage transactions. The Independent Directors reviewed information regarding the soft dollar arrangements including, among other things, the commissions paid, the research credits earned and the services provided. Further, the Independent Directors at prior meetings have had extensive discussions regarding the soft dollar arrangements. The Independent Directors recognized that soft dollar arrangements provide benefits to the Advisor derived from the Funds’ transactions by obtaining research that it would otherwise have to acquire with hard dollars. Accordingly, the Advisor’s profitability would be somewhat lower if it did not receive the research services pursuant to soft dollar arrangements. The Independent Directors took these “fall out” benefits into account when reviewing the level of advisory fees.
| F. | APPROVAL |
The Independent Directors did not identify any single factor discussed previously as all-important or controlling. The Directors, including a majority of Independent Directors, concluded that the terms of the Advisory and Service Contract for each Fund and the Sub-Advisory Agreement for the U.S. Treasury Fund were fair and reasonable, that the Advisor’s and Sub-Advisor’s fees are reasonable in light of the services provided to the respective Fund,
129
Table of Contents
| WASATCH FUNDS — Supplemental Information (continued) | ||
and that the Advisory Contract should be and was approved on behalf of each Fund and the Sub-Advisory Agreement should be and was approved on behalf of the U.S. Treasury Fund.
DISCLOSUREFOR BOARD APPROVALOF THE ADVISORYAND SERVICE CONTRACTFOR THE WASATCH-1ST SOURCE INCOME EQUITY FUND, THE WASATCH-1ST SOURCE LONG/SHORT FUNDAND THE WASATCH-1ST SOURCE INCOME FUNDAND THE SUB-ADVISORY AGREEMENTFOR THE WASATCH-1ST SOURCE INCOME FUND
At a meeting held on August 27, 2008 (the “August Meeting”), the Board of Directors of Wasatch Funds, Inc. (the “Company”) including the Independent Directors, unanimously approved the Advisory and Service Contract between the Company on behalf of the Wasatch-1st Source Income Equity Fund (the “Income Equity Fund”), the Wasatch-1st Source Income Fund (the “Income Fund”) and the Wasatch-1st Source Long/Short Fund (the “Long/Short Fund”) (the “New Funds”) and Wasatch Advisors, Inc. (the “Advisor”), and the Sub-Advisory Agreement between the Advisor on behalf of the Income Fund and 1st Source Investment Corporation Advisors, Inc. (the “Sub-Advisor”).
At the August Meeting, the Independent Directors discussed the proposed reorganization of the 1st Source Monogram Income Equity Fund, the 1st Source Monogram Long/Short Fund, and the 1st Source Monogram Income Fund (each, a “1st Source Fund”, and collectively, the “1st Source Funds”) with and into the Income Equity Fund, the Income Fund and the Long/Short Fund, including, the Independent Director’s responsibilities in approving the Advisory and Service Contract and the Sub-Advisory Agreement.
To assist the Board in its evaluation of the Advisory and Service Contract with the Advisor on behalf of each New Fund and the Sub-Advisory Agreement between the Advisor and the Sub-Advisor on behalf of the Income Fund, the Independent Directors received materials and other information, in adequate time in advance of the meeting, which described, among other things:
| • | the terms and conditions of the Advisory and Service Contract and Sub-Advisory Agreement, including the nature, extent and quality of services provided to the applicable New Fund by the Advisor and Sub-Advisor; |
| • | the organization and business operations of the Advisor and Sub-Advisor, including the experience of persons who will manage the respective New Funds; |
| • | the proposed management fees of the Advisor, including comparisons of such fees with the management fees of comparable, unaffiliated funds prepared by an independent third party; |
| • | the proposed sub-advisory fees of the Sub-Advisor with respect to the Income Fund (including the Sub-Advisor’s range of fees for other clients); |
| • | the projected expenses of each New Fund, including comparisons with the expense ratios of comparable, unaffiliated funds compiled by an independent third party; |
| • | the profitability of the Advisor for advisory services and financial information regarding the Sub-Advisor; |
| • | past performance of the 1st Source Funds; and |
| • | from independent counsel, a legal memorandum outlining, among other things, the duties of the Independent Directors under the Investment Company Act of 1940, as amended (the “1940 Act”), as well as the general principles of the relevant state law in reviewing and approving advisory contracts; the requirements of the 1940 Act in such matters; an advisor’s fiduciary duty with respect to advisory agreements and compensation; the standards used by courts in determining whether investment company boards of directors have fulfilled their duties and factors to be considered by the Board in voting on advisory agreements. |
During the previous day, the Independent Directors also met privately with their legal counsel to review, among other things, the Advisory and Sub-Advisory Agreements, the materials provided, the Board’s duties in evaluating advisory contracts and the factors set out in judicial decisions and SEC directives relating to the approval of advisory contracts. It is with this background that the Independent Directors considered the approval of the Advisory and Service Contract for each New Fund and the Sub-Advisory Agreement for the Income Fund.
As outlined in more detail below, the Independent Directors considered all factors they believed relevant with respect to each New Fund, including the following: (a) the nature, extent and quality of the services to be provided by the Advisor and Sub-Advisor; (b) the investment performance of the 1st Source Funds (as described below); (c) the profitability of the Advisor for advisory services as well as financial information for the Sub-Advisor; (d) the extent to which economies of scale may be realized as a New Fund grows; and (e) whether fee levels reflect any such economies of scale.
| A. | NATURE, EXTENTAND QUALITYOF SERVICES |
With respect to the nature, extent and quality of services to be provided by the Advisor and Sub-Advisor, the Independent Directors reviewed the information regarding the types of services (advisory and non-advisory or administrative services) to be provided under the Advisory and Service Contract for each New Fund and to be provided by the Sub-Advisor under the Sub-Advisory Agreement; the performance record of the 1st Source Funds which have the same or substantially similar investment objectives and substantially similar investment strategies as that of their corresponding New Fund; and information describing the Advisor’s and Sub-Advisor’s organization and business. Further, given the Independent Directors’ experience with other Wasatch Funds, the Independent Directors noted that they were familiar with and have a good understanding of the organization, operations and personnel of the Advisor, including its research department and personnel. The Independent Directors further considered the experience, qualifications and credentials of the proposed portfolio managers for the New Funds. The proposed portfolio managers for the Income Equity Fund and Long/Short Fund
130
Table of Contents
| MARCH 31, 2009 (UNAUDITED) | ||
also discussed their background and qualifications as well as their investment strategies for such New Funds with the Independent Directors at the meeting.
In addition to advisory services, the Independent Directors also considered the quality of administrative or non-advisory services to be provided. The terms of the Advisory and Service Contract provide that the Advisor shall administer the New Funds’ affairs to the extent requested by and subject to the supervision of the Board of Directors for the period and terms of the contract. In this regard, the Advisor, among other things, shall provide business, administrative, compliance, marketing and other services required to operate the New Funds. The Advisor also pays for office space and facilities for the New Funds. With respect to the Sub-Advisor for the Income Fund, it was noted that the Sub-Advisory Agreement is essentially an agreement for portfolio management services only and the Sub-Advisor was not expected to supply other significant administrative services.
Based on their review, the Independent Directors concluded that, overall, the nature, extent and quality of services expected to be provided to the New Funds under the Advisory and Service Contract and to the Income Fund under the Sub-Advisory Agreement were satisfactory.
| B. | THE INVESTMENT PERFORMANCEOFTHE 1ST SOURCE FUNDS |
With respect to investment performance, although the New Funds have not commenced operations and therefore do not have their own performance information, the Independent Directors recognized that the New Funds are intended to be managed substantially similarly to their corresponding 1st Source Fund. The Independent Directors therefore reviewed the historic performance of each 1st Source Fund as well as its performance compared to its peer group and relevant benchmarks. More specifically, the Independent Directors reviewed, among other things, materials reflecting the respective 1st Source Fund’s annualized total return performance for the one-, two-, three-, four-, five- and 10-year periods ending July 31, 2008 (as available) compared to its respective benchmarks and unaffiliated funds with similar investment objectives or classifications (a “Peer Group”) prepared by an independent third party as well as the average total return for each 1st Source Fund for the one-, three-, five- and 10-year periods ending June 30, 2008 (as applicable) provided by the Advisor. In addition, the Independent Directors reviewed each 1st Source Fund’s calendar year performance for each of the last 10 years or for the life of the 1st Source Fund if shorter, as well as the average annual total returns for the one-, five- and 10-years ending December 31, 2007 (as applicable) and as compared to its relevant benchmark.
| C. | FEES, EXPENSESAND PROFITABILITY |
1. Fees and Expenses
In evaluating the proposed management fees and expenses, the Independent Directors considered each New Fund’s proposed management fees and expected expense ratios in absolute terms and as compared with the fees and
expenses of its Peer Group of comparable unaffiliated funds provided by an independent third party. In this regard, the Independent Directors reviewed and considered, among other things, comparisons of the respective New Fund’s proposed management fees, estimated total expenses, and estimated non-management fees (such as transfer agency, custodian, administrative and accounting fees) with those of its Peer Group. The Independent Directors considered not only a New Fund’s proposed management fee, but also its estimated total expense ratio compared to its Peer Group. In this regard, the Independent Directors noted that the estimated total expense ratio of each New Fund was either approximately the same or below the median in its Peer Group. The Independent Directors also reviewed the management fees and total expense ratios for each 1st Source Fund for its most recent fiscal year. Although the management fees of the Income Equity Fund were higher than its corresponding 1st Source Fund, the management fees of the Income Fund and Long/Short Fund were the same as their corresponding 1st Source Funds. With respect to the Income Equity Fund, the Independent Directors, however, considered the expense limitation agreement provided by the Advisor on behalf of such New Fund. In addition, the Independent Directors noted that the estimated expense ratio for each New Fund was below that of its corresponding 1st Source Fund.
In addition to reviewing fees and expenses in absolute terms and in comparisons to peers, the Independent Directors also considered the costs of the research personnel-intensive approach followed by the Advisor. In addition, the Independent Directors also considered the proposed sub-advisory fees to the Sub-Advisor on behalf of the Income Fund.
2. Fees Charged to Other Advisor and Sub-Advisor Clients
The Independent Directors noted that the Advisor does not currently manage other separately managed accounts with the same investment styles as the New Funds. While the Advisor also does not currently manage a Wasatch Fund with a style similar to the Long/Short Fund, the Independent Directors considered the advisory fees and sub-advisory fees (if any) of certain Wasatch Funds similar in investment style to the Income Equity Fund and Income Fund. As noted above, the Independent Directors also considered the management fees of the 1st Source Funds. In considering the fees of the Sub-Advisor, the Independent Directors also considered the range of fees the Sub-Advisor assesses for other clients. In this regard, the sub-advisory fee was within the range of fees for other 1st Source clients and was below the average fee.
Based upon their review of the fee and expense information provided, the Independent Directors determined that each New Fund’s proposed management fees and sub-advisory fees (as applicable) were reasonable in light of the nature, extent and quality of services provided to the New Funds.
3. Profitability of Advisor
In conjunction with their review of fees, the Independent Directors also considered the profitability of the Advisor for
131
Table of Contents
| WASATCH FUNDS — Supplemental Information (continued) | ||
its advisory activities. The Independent Directors reviewed information provided by the Advisor concerning the estimated revenue to the Advisor as a result of the proposed relationship with the New Funds. The Independent Directors also considered the Advisor’s profitability margin for 2007 and at prior meetings had reviewed the revenues and expenses of the Advisor for advisory services to the Wasatch Funds for the calendar year ending December 31, 2007 and the allocation methodology used in preparing the profitability data. In reviewing profitability, the Independent Directors have recognized the subjective nature of determining profitability which may be affected by numerous factors including the allocation of expenses. The Independent Directors have recognized that the allocation of research and personnel expenses is particularly difficult given the Advisor’s shared research culture. The Independent Directors also reviewed the Advisor’s profitability for 2007 compared to publicly available information concerning unaffiliated advisers. The Independent Directors have, however, recognized the difficulties in making comparisons as the profitability from other advisers generally is not publicly available and the profitability information that is available for certain advisers or management firms may not be representative of the industry and may be affected by numerous factors, including the structure of the particular adviser, the types of funds managed, its business mix, expense allocations, and the adviser’s capital structure and cost of capital. The Independent Directors also noted that the Advisor is privately held and is taxed as a Subchapter S corporation, thus certain expenses had to be attributed and/or estimated. As noted below, in considering profitability, the Independent Directors also considered the effect of fall-out benefits (such as soft-dollar arrangements) on the Advisor’s expenses. Based on their review, the Directors were satisfied that the Advisor’s level of profitability was reasonable in light of the services to be provided.
With respect to the Sub-Advisor, although a profitability analysis was not available, the Independent Directors received certain other financial statements of the Sub-Advisor. Given that the sub-advisory fee is established through arm’s length negotiations and considering the range of fees assessed to other clients of the Sub-Advisor, the Independent Directors believe the Sub-Advisor’s profitability from its relationship with the Income Fund is not unreasonable.
| D. | ECONOMIESOF SCALEAND WHETHER FEE LEVELS REFLECT THESE ECONOMIESOF SCALE |
In reviewing compensation, the Independent Directors noted that similar to other Wasatch Funds, the advisory fee schedule for the New Funds did not contain breakpoints that reduce the fee rate on assets above specified levels. The Independent Directors recognized that breakpoints may be one way for the benefits of any economies of scale to be shared with investors. The Independent Directors, however, recognized the Advisor’s position that the New Funds will benefit from economies of scale related to the size of the Wasatch Fund complex. In this regard, the Independent Directors noted that the New Funds are anticipated to have
lower overall expense ratios than their corresponding 1st Source Funds due to reductions in overall service provider fees because of the larger asset base of Wasatch Funds. The Independent Directors further recognized the costs of the Advisor’s research-intensive approach. Considering the factors above, the Independent Directors concluded that the absence of breakpoints was acceptable.
| E. | INDIRECT BENEFITS |
In evaluating fees, the Independent Directors also considered any indirect benefits or profits the Advisor or its affiliates may receive as a result of its relationship with a New Fund. In this regard, at the meeting and at prior meetings, the Independent Directors have reviewed information concerning the Advisor’s soft dollar arrangements, including its policies for allocating brokerage commissions for brokerage and research services. In light of their experience, the Independent Directors are familiar with the Advisor’s soft dollar arrangements and recognized that the Advisor’s profitability may be lower if the Advisor was required to pay for this research with hard dollars. In addition, the Independent Directors recognized that the Sub-Advisor may benefit from soft dollar arrangements pursuant to which it receives research from brokers that execute the Income Fund’s portfolio transactions.
| F. | APPROVAL |
The Independent Directors did not identify any single factor discussed previously as all-important or controlling. The Directors, including a majority of Independent Directors, concluded that the terms of the Advisory Agreement and Sub-Advisory Agreement were fair and reasonable, that the Advisor’s and Sub-Advisor’s fees are reasonable in light of the services expected to be provided to the respective New Fund, and that the Advisory Agreement and Sub-Advisory Agreement should be and were approved.
DISCLOSUREFOR BOARD APPROVALOF THE ADVISORYAND SERVICE CONTRACTFOR THE GLOBAL OPPORTUNITIES FUND
At a meeting held on May 14, 2008 (the “May Meeting”), the Board of Directors of Wasatch Funds, Inc. (the “Company”) including the Independent Directors, unanimously approved the Advisory and Service Contract (the “Advisory Contract”) between the Company on behalf of the Global Opportunities Fund (the “New Fund”) and Wasatch Advisors, Inc. (the “Advisor”). To assist the Board in its evaluation of the Advisory Contract, the Independent Directors received materials and other information, in adequate time in advance of the May Meeting, which outlined, among other things:
| • | the terms and conditions of the Advisory Contract, including the nature, extent and quality of services provided to the New Fund by the Advisor; |
| • | the organization and business operations of the Advisor, including the experience of persons who will manage the New Fund; |
132
Table of Contents
| MARCH 31, 2009 (UNAUDITED) | ||
| • | the proposed management fees of the Advisor, including comparisons of such fees with the management fees of comparable, unaffiliated funds prepared by an independent third party; |
| • | the projected expenses of the New Fund, including comparisons with the expense ratios of comparable, unaffiliated funds compiled by an independent third party; |
| • | the profitability of the Advisor for advisory services; and |
| • | the soft dollar practices of the Advisor. |
In addition to the foregoing materials, independent legal counsel to the Independent Directors provided, in advance of the meeting, a legal memorandum outlining, among other things, the duties of the Independent Directors under the 1940 Act as well as the general principles of relevant state law in reviewing and approving advisory contracts; the requirements of the 1940 Act in such matters; an adviser’s fiduciary duty with respect to advisory agreements and compensation; the standards used by courts in determining whether investment company boards of directors have fulfilled their duties and factors to be considered by the board in voting on advisory agreements.
In connection with a special telephonic meeting held on April 3, 2008 (the “April Meeting”), the Board received materials describing the proposed New Fund, including its investment strategies, investment objective and principal risks. At the April Meeting, the Advisor responded to questions from the Board regarding the proposed New Fund. At the May meeting, the Advisor further explained its investment strategies for the New Fund, discussed market conditions, described proposed fees and expenses, highlighted any changes from the previous discussion at the April Meeting and responded to questions from the Board.
The Independent Directors also met privately with their legal counsel to review the Board’s duties in reviewing advisory contracts and consider approval of the Advisory and Service Contract on behalf of the New Fund. It is with this background that the Independent Directors considered the approval of the Advisory Contract for the New Fund.
The Independent Directors, in consultation with independent counsel, reviewed the factors set out in judicial decisions and SEC directives relating to the approval of advisory contracts. As outlined in more detail below, the Independent Directors considered all factors they believed relevant with respect to the New Fund, including the following: (a) the nature, extent and quality of the services to be provided by the Advisor; (b) the performance of the Advisor; (c) the costs of the services to be provided and profits estimated to be realized by the Advisor and its affiliates; (d) the extent to which economies of scale may be realized as the New Fund grows; and (e) whether fee levels reflect any such economies of scale.
| A. | NATURE, EXTENTAND QUALITYOF SERVICES |
With respect to the nature, extent and quality of services to be provided by the Advisor, the Independent Directors reviewed the information regarding the types of services (advisory and non-advisory or administration) to be provided under the Advisory Contract for the New Fund;
narrative and statistical information concerning the Advisor’s performance record with other funds they advise; and information describing the Advisor’s organization and business. Further, given the Independent Directors’ experience with other Wasatch Funds, the Independent Directors noted that they were familiar with and have a good understanding of the organization, operations and personnel of the Advisor, including its research department and personnel as well as the professional experience, qualifications and credentials of the proposed portfolio managers for the New Fund. Based on their review, the Independent Directors concluded that, overall, the nature, extent and quality of services expected to be provided to the New Fund under the Advisory Contract were satisfactory.
| B. | INVESTMENT PERFORMANCE |
With respect to investment performance, it was noted that because the New Fund has not commenced operations and does not have its own performance history, the Board reviewed and considered performance information regarding the Advisor’s past performance record with other funds.
| C. | FEES, EXPENSEAND PROFITABILITY |
1. Fees and Expenses
In evaluating the proposed management fees and expenses, the Independent Directors considered the New Fund’s proposed management fees and expected expense ratios in absolute terms and as compared with the fees and expenses of a peer group of comparable unaffiliated funds provided by an independent third party. In addition, the Independent Directors considered the expense limitation agreement provided by the Advisor on behalf of the New Fund. Although the Advisor does not currently manage other funds or separately managed accounts with the same investment style as for the New Fund, the Independent Directors had at previous recent meetings reviewed the fees charged by the Advisor for non-mutual fund institutional clients and for “high net worth” separate accounts and were familiar with the fees the Advisor assesses to these other clients. The Independent Directors recognize the differences in services provided to separately managed accounts and those required in operating and managing registered investment companies, such as the Fund. The Independent Directors also considered the costs of the research personnel-intensive approach followed by the Advisor and the overall expense structure of the New Fund and peer group. Based upon this information, the Independent Directors noted that the proposed advisory fee was the highest among the peer group but recognized the experience and quality of the advisory services provided by the Advisor, including, in particular, the proposed portfolio managers of the New Fund.
2. Profitability of Advisor
In conjunction with its review of fees, the Independent Directors also considered the profitability of the Advisor for its advisory activities to Wasatch Funds. The Independent Directors reviewed information provided by the Advisor
133
Table of Contents
| WASATCH FUNDS — Supplemental Information (continued) | MARCH 31, 2009 (UNAUDITED) | |
concerning the estimated revenue to the Advisor as a result of the proposed relationship with the New Fund. The Independent Directors also considered the Advisor’s profitability margin for 2007 and at prior recent meetings had reviewed the revenues and expenses of the Advisor for advisory services to Wasatch Funds for the calendar year ending December 31, 2007 and the allocation methodology used in preparing the profitability data. In reviewing profitability, the Independent Directors have recognized the subjective nature of determining profitability which may be affected by numerous factors including the allocation of expenses. The Independent Directors have also recognized the difficulties in making comparisons as the profitability from other advisers generally is not publicly available and the profitability information that is available for certain advisers or management firms may not be representative of the industry and may be affected by, among other things, the adviser’s particular business mix, capital costs, types of funds managed and expense allocations. The Independent Directors also noted that the Advisor is privately held and is taxed as a Subchapter S corporation, thus certain expenses had to be attributed and/or estimated. As noted below, in considering profitability, the Independent Directors also considered the effect of fall-out benefits (such as soft-dollar arrangements) on the Advisor’s expenses. Based on their review, the Directors were satisfied that the Advisor’s level of profitability was reasonable in light of the services to be provided.
| D. | ECONOMIESOF SCALEAND WHETHER FEE LEVELS REFLECT THESE ECONOMIESOF SCALE |
In reviewing compensation, the Independent Directors noted that similar to other Wasatch Funds, the advisory fee schedule for the New Fund did not contain breakpoints that reduce the fee rate on assets above specified levels. The Independent Directors recognized that breakpoints may be one way for the benefits of any economies of scale to be shared with investors. The Independent Directors noted that most of the Wasatch Funds invest in small- and micro-cap securities, and that, traditionally, the Advisor has periodically closed certain equity funds at asset levels it believes are
necessary or appropriate to manage the respective fund effectively. In this regard, the Independent Directors are aware that it is more difficult to replicate performance in small-cap and micro-cap funds at larger asset sizes and therefore a fund may be closed to new and/or existing shareholders. This practice enhances the Advisor’s focus on achieving performance by maintaining assets at levels it can effectively manage but may limit economies of scale derived from a larger asset base. The Independent Directors also are aware that this practice may limit the Advisor’s profit potential from earning additional fees on a larger asset base and may expose the Advisor to reduced revenues from asset outflows when a fund is closed to investors. Considering the above, the Independent Directors concluded that the absence of breakpoints in the New Fund’s advisory fee schedule was acceptable.
| E. | INDIRECT BENEFITS |
In evaluating fees, the Independent Directors also considered any indirect benefits or profits the Advisor or its affiliates may receive as a result of its relationship with the New Fund. In this regard, at the meeting and at prior recent meetings, the Independent Directors have reviewed information concerning the Advisor’s soft dollar arrangements, including its policies for allocating brokerage commissions for brokerage and research services. In light of their experience, the Independent Directors are familiar with the Advisor’s soft dollar arrangements and recognize that the Advisor’s profitability may be lower if the Advisor were required to pay for this research with hard dollars.
| F. | APPROVAL |
The Independent Directors did not identify any single factor discussed previously as all-important or controlling. The Directors, including a majority of Independent Directors, concluded that the terms of the Advisory Contract were fair and reasonable, that the Advisor’s fees are reasonable in light of the services expected to be provided to the New Fund, and that the Advisory Contract should be and was approved.
134
Table of Contents
| WASATCH FUNDS — Service Providers | MARCH 31, 2009 | |
Investment Advisor
Wasatch Advisors, Inc.
150 Social Hall Avenue, 4th Floor
Salt Lake City, UT 84111
Sub-Advisor for the U.S. Treasury Fund
Hoisington Investment Management Co.
1250 Capital of Texas Highway South
Building 3, #600
Austin, TX 78746
Sub-Advisor for the Wasatch-1st Source Income Fund
1st Source Corporation Investment Advisors, Inc.
100 North Michigan Street
South Bend, IN 46601
Administrator and Fund Accountant
State Street Bank and Trust Company
801 Pennsylvania Avenue
Kansas City, MO 64105
Distributor
ALPS Distributors, Inc.
1290 Broadway, Suite 1100
Denver, CO 80203
Transfer Agent
UMB Fund Services, Inc.
803 West Michigan Street, Suite A
Milwaukee, WI 53233-2301
Custodian
State Street Bank and Trust Company
801 Pennsylvania Avenue
Kansas City, MO 64105
Legal Counsel to Wasatch Funds and Independent Directors
Chapman and Cutler, LLP
111 West Monroe Street
Chicago, IL 60603
Independent Registered Public Accounting Firm
PricewaterhouseCoopers LLP
1055 Broadway, 10th Floor
Kansas City, MO 64105
135
Table of Contents
| WASATCH FUNDS — Guide to Understanding Financial Statements | ||
Wasatch Funds provides reports to shareholders twice a year. The annual report is for the Funds’ fiscal year which ends September 30. The semi-annual report is for the six months or period ending March 31. Additionally, the Funds’ schedules of investments for the first and third quarters of each fiscal year are available to shareholders as described on page 126. These reports provide shareholders with important information that will help them evaluate the management and performance of their investments. It is the desire of Wasatch Funds to help shareholders stay in tune with their investments. If you have any questions about the information in this report, a shareholder services representative will be happy to assist you when you call 800.551.1700.
SCHEDULEOF INVESTMENTS
The holdings of each Wasatch Fund are detailed in the “Schedule of Investments.” This section provides a snapshot of the securities each Fund was invested in on the last day of the reporting period. The Wasatch Equity Funds invest primarily in Common Stocks of companies which are grouped together by industry. The U.S. Treasury Fund invests primarily in U.S. Treasury securities. The Wasatch-1st Source Income Fund invests primarily in fixed income securities. The Equity Funds will typically have only minor holdings in Short-Term Investments. At times the Funds may take temporary defensive positions by increasing cash or holdings in Short-Term Investments. Please see the prospectus under “Additional Information about the Funds.”
STATEMENTSOF ASSETSAND LIABILITIES
These financial statements show the Assets and Liabilities of a Fund on the last day of the reporting period. A Fund’s Assets include the value of securities owned, amounts receivable for purchases of Fund shares (capital shares receivable), securities sold, interest and dividends, prepaid expenses and other assets. Liabilities are amounts owed for shareholder redemptions (capital shares payable), securities purchased, investment advisory fees and other expenses. Totaling up the assets and subtracting the liabilities results in a Fund’s Net Assets.
Net Assets consist of capital stock, paid-in capital in excess of par, undistributed net investment income or loss, undistributed net realized gain or loss on investments and net unrealized appreciation or depreciation on investments. Capital stock is stock authorized by a company’s charter and having par value, stated value or no par value. Par value is set by the company issuing the shares and has no relation to Net Asset Value. The par value of one share of each Wasatch Fund is $.01. Paid-in capital in excess of par is capital received from shareholders in exchange for Fund shares that exceeds the par value of the shares. For example, if you bought one share of a Fund for $10, $.01 would show as “Capital stock” on the books of the Fund, and $9.99 would be accounted for under “Paid-in capital in excess of par.” Undistributed net investment income or loss is the amount of net investment income or loss of a Fund since inception that has not been paid to shareholders as a dividend.
Undistributed net realized gain (loss) on investments is the amount of net realized gains or losses generated by a Fund since inception that have not been distributed to shareholders in the form of a capital gain distribution. A gain or loss is realized when a security is sold by a Fund. Net unrealized appreciation (depreciation) on investments is the change in value from the purchase price of securities a Fund continues to hold.
The number of shares a Fund is authorized to sell can be found under Capital Stock, $.01 par value. Issued and outstanding indicates the number of shares owned by shareholders.
Net Asset Value (NAV), Redemption Price and Offering Price Per Share shows the value of one outstanding share of a Fund on the date of the report. A Fund’s share price (NAV) is calculated by dividing the value of all securities and other assets owned by a Fund, less the liabilities charged to that Fund, by the number of Fund shares outstanding. The share price is calculated at the close of business of the New York Stock Exchange on each day the Exchange is open for trading. Please see Wasatch Funds’ prospectus for more information about how share prices are calculated. Information about how the share price is affected by a Fund’s operation can be found under “Financial Highlights” on page 137.
STATEMENTSOF OPERATIONS
Statements of Operations show investment income and expenses for each Fund as well as realized gains or losses from securities sold and the appreciation or depreciation in the value of a Fund’s holdings during the reporting period.
Investment Income shows Interest and Dividends earned from interest-bearing and dividend-paying securities in a Fund’s portfolio.
Expenses show the various fees and expenses paid out of a Fund’s assets such as the fee paid to Wasatch Advisors, the Funds’ investment advisor. Additional fees include shareholder servicing, fund administration and accounting, custody of fund assets, federal and state registration, legal counsel, auditing and directors’ fees. The Funds pay for printing and mailing statements, prospectuses, annual reports and semi-annual reports to shareholders.
Net Investment Income (Loss) is the amount of dividends and interest income earned on securities held by a Fund, less the Fund’s expenses.
Net realized gain (loss) on investments and foreign currency translations is the net gain or loss on securities a Fund has sold. Change in unrealized appreciation (depreciation) on investments and foreign currency translations is the change in value of securities a Fund continues to hold.
Net gain (loss) on investments is the result of changes in the market value of securities a Fund has sold and securities it continues to hold.
STATEMENTSOF CHANGESIN NET ASSETS
Net Assets are a Fund’s remaining assets after taking into consideration any liabilities. Statements of Changes in Net
136
Table of Contents
| MARCH 31, 2009 (UNAUDITED) | ||
Assets show the increase or decrease in a Fund’s net assets during the reporting period. Investment operations, dividends and capital share transactions affect a Fund’s net assets. Operations is a summary of the Statements of Operations. It includes investment income or loss, net realized gain or loss on investments and foreign currency translations a Fund has sold as well as the change in appreciation or depreciation in the value of investments a Fund continues to hold.
Dividends are distributed by Wasatch Funds to sharehold-ers when Fund investments have earned income in excess of net expenses or when capital gains in excess of capital losses are realized from the sale of securities. Most shareholders choose to reinvest their dividends and capital gain distribu- tions. Each Fund is required by Internal Revenue Code regulations to distribute substantially all of its net investment income and capital gains to shareholders in order to retain its status as a “regulated investment company.”
Capital share transactions are any transactions involving shares of a Fund, including the selling of Fund shares, shares issued by a Fund to shareholders for the reinvestment of dividends, and share redemptions.
FINANCIAL HIGHLIGHTS
The Financial Highlights contain important historical operating information that you may find useful in making decisions or understanding the performance of your investment.
Net Asset Value (NAV) is defined under “Statements of Assets and Liabilities” on page 136. The difference between the Net asset value, beginning of period and the Net asset value, end of period in the Financial Highlights is the change in value of a Fund’s shares over the reporting period, but not its total return.
Income (loss) from investment operations shows how the share price was affected by a Fund’s operations on a per share basis. Net investment income (loss) is the per share
amount of dividends and interest income earned on securities held by a Fund, less the Fund’s expenses. Net realized and unrealized gains (losses) on securities is the per share increase or decrease in the value of securities a Fund holds or has sold during the reporting period. Gains or (losses) are realized when securities are sold. Gains or (losses) are unrealized when securities increase or decrease in value but are not sold.
Distributions are the per share amount that a Fund paid to shareholders from net investment income and net realized gains.
Total return is the percentage increase or decrease in the value of an investment over a stated period of time. A total return percentage includes both changes in unrealized and realized gains and income. For the purposes of calculating total return, it is assumed that dividends and distributions are reinvested at the share price on the ex-dividend day of the distribution. A FUND’S TOTAL RETURN CANNOT BE COMPUTED DIRECTLY FROM THE FINANCIAL HIGHLIGHTS.
Supplemental data and ratios are provided to help you better understand your investment. Net assets, end of period, are the net assets of a Fund on the reporting date. Ratio of expenses to average net assets shows the total of a Fund’s operating expenses divided by its average net assets for the stated period before and after waivers and reimbursements by the Advisor, if any. Ratio of net investment income to average net assets shows a Fund’s net investment income (loss) divided by its average net assets for the stated period before and after waivers and reimbursements by the Advisor, if any. Portfolio turnover rate measures a Fund’s buying and selling activity during the reporting period. It is computed by dividing total purchases or sales, whichever is less, by the average monthly market value of a Fund’s portfolio securities. This calculation does not include securities with a maturity date of less than 12 months.
| CONTACT WASATCH | ||
TELEPHONE
800.551.1700
M - F, 7:00 a.m. to 7:00 p.m. CT
Automated Line, 24 Hours
U.S. MAIL
Wasatch Funds
P.O. Box 2172
Milwaukee, WI 53201-2172
OVERNIGHT MAIL
Wasatch Funds
803 West Michigan Street, Suite A
Milwaukee, WI 53233-2301
ONLINE
www.wasatchfunds.com
shareholderservice@wasatchfunds.com
137
Table of Contents

WWW.WASATCHFUNDS.COM
800.551.1700
Table of Contents
| Item 2: | Code of Ethics. |
Not required.
| Item 3: | Audit Committee Financial Expert. |
Not required.
| Item 4. | Principal Accountant Fees and Services. |
Not required.
| Item 5. | Audit Committee of Listed Registrants. |
Not applicable.
| Item 6. | Schedule of Investments. |
| (a) | Schedule of Investments is included as a part of the report to shareholders filed under Item 1 of this Form N-CSR. |
| (b) | Not applicable. |
| Item 7. | Disclosure of Proxy Voting Policies and Procedures for Closed-End Management Investment Companies. |
Not applicable.
| Item 8. | Portfolio Managers of Closed-End Investment Companies. |
Not applicable.
| Item 9. | Purchases of Equity Securities by Closed-End Management Investment Company and Affiliated Purchasers. |
Not applicable.
| Item 10. | Submission of Matters to a Vote of Security Holders. |
The Board of Directors has not adopted procedures by which shareholders may recommend nominees to the Board.
| Item 11. | Controls and Procedures. |
| (a) | The Registrant’s principal executive and principal financial officers have concluded that the Registrant’s disclosure controls and procedures (as defined in Rule 30a-3(c) under the Investment Company Act of 1940, as amended (the “1940 Act”) (17 CFR 270.30a-3(c)) are effective, as of a date within 90 days of the filing date of this Form N-CSR based on their evaluation of these controls and procedures required by Rule 30a-3(b) under the 1940 Act (17 CFR 270.30a-3(b)) and Rules 13a-15(b) or 15d-15(b) under the Securities Exchange Act of 1934 (17 CFR 240.13a-15(b) or 240.15d-15(b)). |
Table of Contents
| (b) | There were no changes in the Registrant’s internal control over financial reporting (as defined in Rule 30a-3(d) under the 1940 Act (17 CFR 270.30a-3(d)) that occurred during the Registrant’s second fiscal quarter of the period covered by this report that has materially affected, or is reasonably likely to materially affect, the Registrant’s internal control over financial reporting. |
| Item 12. | Exhibits. |
| (a)(1) | Not required. | |
| (a)(2) | The certifications required by Rule 30a-2 of the 1940 Act are attached hereto. | |
| (a)(3) | Not applicable. | |
| (b) | The certifications required by Rule 30a-2(b) of the 1940 Act and Section 906 of the Sarbanes-Oxley Act of 2002 are attached hereto. | |
Table of Contents
SIGNATURES
Pursuant to the requirements of the Securities Exchange Act of 1934 and the Investment Company Act of 1940, the registrant has duly caused this report to be signed on its behalf by the undersigned, thereunto duly authorized.
WASATCH FUNDS, INC. | ||
| By: | /s/ Samuel S. Stewart, Jr. | |
Samuel S. Stewart, Jr. President (principal executive officer) of Wasatch Funds, Inc. | ||
Date: June 4, 2009
Pursuant to the requirements of the Securities Exchange Act of 1934 and the Investment Company Act of 1940, this report has been signed below by the following persons on behalf of the registrant and in the capacities and on the dates indicated.
| By: | /s/ Samuel S. Stewart, Jr. | |
Samuel S. Stewart, Jr. President (principal executive officer) of Wasatch Funds, Inc. |
Date: June 4, 2009
| By: | /s/ Cindy B. Firestone | |
Cindy B. Firestone Treasurer (principal financial officer) of Wasatch Funds, Inc. |
Date: June 4, 2009