UNITED STATES
SECURITIES AND EXCHANGE COMMISSION
Washington, D.C. 20549
FORM N-CSR
CERTIFIED SHAREHOLDER REPORT OF REGISTERED
MANAGEMENT INVESTMENT COMPANIES
Investment Company Act file number: 811-04920
WASATCH FUNDS TRUST
(Exact name of registrant as specified in charter)
150 Social Hall Avenue
4th Floor
Salt Lake City, Utah 84111
(Address of principal executive offices)(Zip code)
| | |
| (Name and Address of Agent for Service) | | Copy to: |
| |
Samuel S. Stewart, Jr. Wasatch Funds Trust 150 Social Hall Avenue, 4th Floor Salt Lake City, Utah 84111 | | Eric F. Fess, Esq. Chapman & Cutler LLP 111 West Monroe Street Chicago, IL 60603 |
Registrant’s telephone number, including area code: (801) 533-0777
Date of fiscal year end: September 30
Date of reporting period: March 31, 2013
| Item 1: | Report to Shareholders. |
Wasatch Funds
Salt Lake City, Utah
www.wasatchfunds.com
800.551.1700
This material must be accompanied or preceded by a prospectus.
Please read the prospectus carefully before you invest.
Wasatch Funds are distributed by ALPS Distributors, Inc.
1
| | |
| LETTER TO SHAREHOLDERS — BERNANKE’S BACKYARD BARBECUE |
|
|
|
| | |

Samuel S. Stewart, Jr. PhD, CFA President of
Wasatch Funds | | DEAR FELLOW SHAREHOLDERS: If you watch financial news programs on a regular basis, you’ll often see some short-term charts alongside a Wall Street talking head who’s frantically answering questions about how to invest based on the latest economic and market events. Can you imagine Warren Buffett appearing in this way, with periodic interruptions as he barks orders through a headset to buy and sell individual companies? Not likely. The difference here is that the Wall Street talking head is a trader, while Warren Buffett is an investor. Buffett focuses on long-term company fundamentals, which is what we try to do at Wasatch Advisors. So when I’ve recently been asked about my views regarding the all-time highs in the stock market, I have a mixed reaction. Clearly, the surge in stock prices is very impressive. But an equally valid point is that the U.S. market is only now reaching the heights it achieved more than five years ago. From my perspective, rather than focusing on the headlines about record levels in the market, I prefer to spend my time trying to find the World’s Best Growth Companies® — and buy them at what I believe to be reasonable valuations. While I don’t place much emphasis on new highs in stocks, I do believe it’s important to have views on both the fundamental and sentiment factors that drive the economy and the markets. These factors have |
direct and indirect influences on the companies in which we invest, and on the prices at which we can buy or sell them.
Some of the most-important factors I see today are the actions of the Federal Reserve (Fed). Under Chairman Ben Bernanke, the Fed has engaged in unprecedented levels of “quantitative easing” by buying government securities to support bond prices and reduce interest rates. In fact, the Fed has committed to these low rates at least through 2015. For those of us who’ve spent any time around a backyard barbecue, Chairman Bernanke’s approach is analogous to pouring massive amounts of lighter fluid on the grill and hoping the charcoal briquettes eventually catch fire.
ECONOMY
To continue the barbecue analogy, the use of lighter fluid certainly produces an impressive blaze in the short term. But the real key is to create a sustainable fire in the economic briquettes. The question remains: Is the lighter fluid simply burning off, or is the economy starting to fire on its own? We probably won’t know the answer to this question until Chairman Bernanke runs out of fluid or has a change of heart regarding the efficiency of his actions.
My views concerning economic conditions are shaped by the data. And based on the data, conditions remain mixed with a bias toward a muddling economy with slow growth. On the negative side, the Congressional Budget Office recently forecast that real gross domestic product (GDP) in the U.S. will grow at only 1.4% for 2013, down from the 1.9% estimate for 2012. On the positive side, retail sales have been decent, jobless claims have declined and the unemployment rate has edged down.
Among the problems we face in our economy today are too much debt (including future Medicare and Social Security obligations), a sizable and seemingly unending budget deficit, and artificially low interest rates. The Fed’s extreme measures to support asset prices and investor sentiment have allowed the balance-sheet recession to linger on. This means that bad debts remain on the books of our government, our banks and our corporations. Until these bad debts are resolved, we will not have a healthy lending environment. In addition, somewhat higher interest rates are needed so that savers, the would-be providers of capital, are incentivized with reasonable returns on their investments. Currently these savers, both individual and corporate, are largely encouraged to be hoarders of capital because the potential returns seem low relative to the risks.
My advice to Chairman Bernanke would be to put a cap on his bottle of lighter fluid because loose monetary policy can be inflationary over the longer term and is not a good tool for promoting capital investment, growing the economy and creating jobs. Instead, I believe Bernanke should more forcefully encourage the president and Congress to pursue sensible fiscal policies that address infrastructure, education and the bad debts currently being ignored in our financial system.
MARKETS
While I believe economic conditions lean toward slow growth, the stock market certainly caught fire during the first quarter of 2013. The S&P 500 Index was up 10.61% in the first quarter after being down 0.38% in the fourth quarter of 2012.
Despite my concerns about the economy and the Fed’s policies, I remain somewhat bullish on stocks for a few main reasons. First, academic research suggests that slower GDP growth does not necessarily translate into poor stock returns. Second, I’m finding companies that are beating their competition in a tough economic environment by providing better, faster and often less expensive products and services. Many of these companies are selling at reasonable price/earnings multiples with strong growth rates and sometimes-attractive dividend yields. Third, stocks are potentially good hedges against the eventual rise in inflation because an inflationary environment allows companies to increase prices, which can lead to higher earnings and stock valuations.
Another important point is that a slow-growth economic environment is a good backdrop for strong stock-pickers who can sort out the best companies. At Wasatch Advisors, we’ve historically found many of what we believe to be the best companies in the small- and micro-cap areas because these areas are often less well-researched and the companies are usually faster growers. More recently, I’ve also found good opportunities among mid- and large-cap stocks. In particular, I think many big-cap technology companies are amazingly inexpensive.
The two Wasatch mutual funds I currently manage — the World Innovators Fund (co-managed with Josh Stewart) and the Strategic Income Fund — have significant allocations to mid- and large-cap stocks for the reasons described above. Some of the
2
holdings in these funds have been selling at price/earnings multiples in the high single digits or low double digits. What I find so attractive are the combinations of these types of valuations with growth rates that exceed the price/earnings multiples and substantial dividend yields. In addition, the fact that the companies are larger gives investors the potential for less risk. In my career, I’ve generally had good success with stocks bought at such reasonable valuations.
A final point I’d like to make regarding the markets is that I believe diversification is now more important than ever. This is why I’ve diversified my small-cap U.S. stock investments with some larger-cap and international names. Similarly, I think holding a portion of a portfolio in cash is a wise form of diversification because it gives investors the ability to put money to work at attractive valuations when stocks suffer periodic corrections.
WASATCH
I’m pleased to announce that four of our Wasatch mutual funds received a total of six 2013 Lipper Awards on March 14, 2013. These awards recognize mutual funds that, relative to peers, have delivered consistently strong risk-adjusted performance whereby smaller downside losses are given even more importance than larger upside gains.
The Wasatch Emerging Markets Small Cap Fund (WAEMX) was recognized as #1 over the three-year and five-year periods ended December 31, 2012 among 308 and 219 emerging markets funds, respectively. This recognition was earned for the second year in a row — the Emerging Markets Small Cap Fund was recognized in 2012 for its three-year performance ended December 31, 2011 among 296 emerging markets funds. The Wasatch World Innovators Fund (WAGTX) was honored as #1 for the three-year and five-year periods ended December 31, 2012 among 144 and 72 global multi-cap growth funds, respectively. The Wasatch International Growth Fund (WAIGX) received the Lipper Award for #1 performance for the three-year period ended December 31, 2012 among 111 international small/mid-cap growth funds. Finally, the Wasatch-Hoisington U.S. Treasury Fund (WHOSX) earned the Lipper Award for the #1 ranking over the five-year period ended December 31, 2012 among 20 general U.S. Treasury funds.
All of us at Wasatch Advisors are very proud of these awards, in part because they cover a wide range of our fund strategies.
With sincere thanks for your continued investment and for your trust,

Sam Stewart
President of Wasatch Funds
P.S. As always, please be sure to read the prospectus before investing in any fund.
Information in this report regarding market or economic trends or the factors influencing historical or future performance reflects the opinions of management as of the date of this report. These statements should not be relied upon for any other purpose. Past performance is no guarantee of future results, and there is no guarantee that the market forecasts discussed will be realized.
CFA® is a trademark owned by CFA Institute.
Wasatch Advisors is the investment advisor to Wasatch Funds.
The Lipper Fund Awards program honors funds that have excelled in delivering consistently strong risk-adjusted performance relative to peers. Lipper designates award-winning funds in most individual classifications for the three-, five- and 10-year periods. Please visit the Awards for Excellence website (http://excellence.thomsonreuters.com/award/lipper) for more details about the Lipper Fund Awards. Lipper Award designations are not intended to constitute investment advice or predict future results, and Lipper does not guarantee the accuracy of this information. In addition to periods of positive returns, the Wasatch Funds that received Lipper Awards have experienced some periods of negative returns during the award time frames. Past performance is not indicative of future results.
The investment objective of the Wasatch Emerging Markets Small Cap Fund, the Wasatch World Innovators Fund and the Wasatch International Growth Fund is long-term growth of capital. The investment objective of the Wasatch-Hoisington U.S. Treasury Fund is to provide a rate of return that exceeds the rate of inflation over a business cycle by investing in U.S. Treasury securities with an emphasis on both income and capital appreciation. The primary investment objective of the Wasatch Strategic Income Fund is to capture current income; a secondary objective is long-term growth of capital.
World’s Best Growth Companies (WBGCs) are defined by Wasatch as companies that we believe possess an identifiable, sustainable competitive advantage, are well managed, undervalued and are producing above average earnings growth relative to their industry and country of origin.
Valuation is the process of determining the current worth of an asset or company.
Quantitative easing is a government monetary policy used to increase the money supply by buying government securities or other securities from the market. Quantitative easing increases the money supply by flooding financial institutions with capital in an effort to promote increased lending and liquidity.
Gross domestic product (GDP) is a basic measure of a country’s economic performance and is the market value of all final goods and services made within the borders of a country in a year.
A balance-sheet recession is a recession caused by some form of financial crisis or balance-sheet shock that can leave businesses in the position of having liabilities that exceed their assets.
The S&P 500 Index includes 500 of the United States’ largest stocks from a broad variety of industries. The Index is unmanaged but is a commonly used measure of common stock total return performance. You cannot invest directly in this or any index.
A price/earnings multiple, also known as the price-to-earnings or P/E ratio, is the price of a stock divided by its earnings per share.
Dividend yield is a company’s annual dividend payments divided by its market capitalization, or the dividend per share divided by the price per share. For example, a company whose stock sells for $30 per share that pays an annual dividend of $3 per share has a dividend yield of 10%.
3
| | |
| WASATCH CORE GROWTH FUND (WGROX / WIGRX) — Management Discussion | | MARCH 31, 2013 |
|
|
|
The Wasatch Core Growth Fund is managed by a team of Wasatch portfolio managers led by JB Taylor and Paul Lambert.
| | | | |

JB Taylor Portfolio Manager | | 
Paul Lambert Portfolio Manager | | OVERVIEW The Wasatch Core Growth Fund — Investor Class posted a gain of 7.59% in the first quarter of 2013 and lagged the Russell 2000 Index, which rose 12.39%. It appears that the relatively |
strong returns generated by small cap equities in 2012 have caused an increase in the amount of capital flowing to the space. This is understandable in an environment of low interest rates, when fixed income investments appear to offer unattractive absolute returns.
Our moderate underperformance in a market as strong as we saw in the first quarter is not surprising to us, especially in light of our relative outperformance last year. In addition, we would not characterize the first quarter as a stock picker’s environment because the move up in prices was unusually broad —advancers outnumbered decliners by a wide margin and security selection was less important. Accordingly, the Fund lagged the Index not because a large percentage of our stocks declined. Rather, most of them performed well but were hard pressed to keep pace with the broad market advance.
DETAILSOFTHE QUARTER
Two of our best performing stocks for the quarter were Copart, Inc. and SEI Investments Co. We believe Copart continues to execute extremely well. The company provides online auctions and vehicle remarketing services in the U.S., Canada and the United Kingdom. It is our opinion that Copart has a strong business model that would be difficult to replicate at any price. In the wake of Hurricane Sandy, the company’s services proved invaluable to auto insurers faced with the task of disposing of large numbers of damaged vehicles in a short period of time.
SEI is an investment manager that also provides back-end technology for banks and other financial services firms. SEI’s services allow financial advisors and institutions to get closer to their customers, to react to customer needs quicker, with better transaction processing and better service. We have owned the stock for years and have always admired SEI not only for what we consider to be a top-notch management team, but also for having one of the highest return on investment (ROI) business models we have encountered.
Herbalife Ltd., which has been in the news recently, was up strongly for the quarter and was a significant contributor to the Fund’s performance. The company delivered good fourth quarter results, with sales and earnings up over 20%. Herbalife’s stock has been volatile over the last several months as a few well known institutional investors have taken large long and short positions in the stock. In
addition, these investors have engaged in highly publicized debates regarding their views on the company. We are pleased that Herbalife has continued to execute well, despite the distractions resulting from the investor debates.
Polypore International, Inc. was one of our biggest detractors for the first quarter after posting strong gains in the previous quarter. Polypore makes filtration membranes used in batteries, including the lead-acid batteries used in conventional automobiles and the lithium-ion batteries used in consumer electronics and electric cars. In addition, the company has a growing and profitable business selling high technology filters to the health care industry for use in such products as kidney dialysis machines. We believe the conventional automobile and rapidly growing consumer electronics battery segments of Polypore’s business, together with its health care segment, largely support the stock’s current valuation. While the stock declined in the first quarter amid uncertainty about the timing for meaningful adoption of electric cars, we believe the inevitability of automobile electrification and Polypore’s leadership position in the membrane filtration industry justify a positive long term outlook for the company and the stock.
The share price of health club operator Life Time Fitness, Inc. fell during the quarter, and its substantial position size meant it was a big detractor in the Fund. After a good run from 2010 to 2012, Life Time’s fourth quarter earnings preannouncement revealed that membership had not grown as rapidly as expected. Earnings also weakened on increased marketing expenses and other costs to reinvest in the business. We believe the stock was punished somewhat unfairly and that Wall Street estimates had become too optimistic.
OUTLOOK
Valuations of our portfolio companies currently average 23 times trailing earnings, which is slightly above the longer term average of 21 times trailing earnings. So, while valuations are not strained, we would not describe the market or the Fund’s holdings as particularly inexpensive.
Regarding the U.S. economy, we are still facing the burdens of large government debt balances and higher tax rates. Restrained by these factors, subdued economic growth can create the type of market environment in which the stocks we favor can potentially outperform. Conversely, if the liquidity driven environment we see today continues and the small cap market broadly marches higher without respect to company fundamentals, we would expect the Fund to have some difficulty keeping pace. Nevertheless, we will stick with our time-tested approach of focusing on what we see as the highest quality companies and seeking to hold them at reasonable valuations.
Thank you for the opportunity to manage your assets and for your trust.
| Current | and future holdings are subject to risk. |
4
| | |
| WASATCH CORE GROWTH FUND (WGROX / WIGRX) — Portfolio Summary | | MARCH 31, 2013 |
|
|
|
AVERAGE ANNUAL TOTAL RETURNS
| | | | | | | | | | | | | | | | |
| | | SIX MONTHS* | | | 1 YEAR | | | 5 YEARS | | | 10 YEARS | |
Core Growth (WGROX) — Investor | | | 11.98% | | | | 15.52% | | | | 9.78% | | | | 11.26% | |
Core Growth (WIGRX) — Institutional | | | 12.02% | | | | 15.62% | | | | 9.81% | | | | 11.27% | |
Russell 2000® Index | | | 14.48% | | | | 16.30% | | | | 8.24% | | | | 11.52% | |
Russell 2000® Growth Index | | | 13.71% | | | | 14.52% | | | | 9.04% | | | | 11.61% | |
Data shows past performance, which is not indicative of future performance. Current performance may be lower or higher than the performance quoted. To obtain the most recent month-end performance data available, please visit www.wasatchfunds.com. The Advisor may absorb certain Fund expenses, without which total return would have been lower. Investment returns and principal value will fluctuate and shares, when redeemed, may be worth more or less than their original cost.
As of the January 31, 2013 prospectus, the Total Annual Fund Operating Expenses for the Wasatch Core Growth Fund — Investor Class: 1.23% / Institutional Class: 1.55%, Net: 1.12%. The expense ratio shown elsewhere in this report may be different. Net expenses are based on Fund expenses, net of waivers and reimbursements. See the prospectus for additional information regarding Fund expenses.
Wasatch Funds will deduct a 2.00% redemption proceeds fee on Fund shares held 60 days or less. Performance data does not reflect the deduction of fees or taxes, which if reflected, would reduce the performance quoted. For more complete information including charges, risks and expenses, read the prospectus carefully.
Performance for the Institutional Class prior to 1/31/2012 is based on the performance of the Investor Class. Performance of the Fund’s Institutional Class prior to 1/31/2012 uses the actual expenses of the Fund’s Investor Class without any adjustments. For any such period of time, the performance of the Fund’s Institutional Class would have been substantially similar to, yet higher than, the performance of the Fund’s Investor Class, because the shares of both classes are invested in the same portfolio of securities, but the classes bear different expenses.
Investing in small cap funds will be more volatile and loss of principal could be greater than investing in large cap or more diversified funds.
TOP 10 EQUITY HOLDINGS**
| | | | |
| Company | | % of Net
Assets | |
| Copart, Inc. | | | 5.4% | |
| IDEX Corp. | | | 3.3% | |
| Life Time Fitness, Inc. | | | 3.3% | |
| Waste Connections, Inc. | | | 3.2% | |
| MEDNAX, Inc. | | | 3.0% | |
| | | | |
| Company | | % of Net
Assets | |
| Polypore International, Inc. | | | 2.9% | |
| MSC Industrial Direct Co., Inc., Class A | | | 2.8% | |
| Alliance Data Systems Corp. | | | 2.6% | |
| SEI Investments Co. | | | 2.4% | |
| Allegiant Travel Co. | | | 2.3% | |
| ** | As of March 31, 2013, there were 60 holdings in the Fund. Foreign currency contracts, written options and repurchase agreements, if any, are not included in the number of holdings. Portfolio holdings are subject to change at any time. References to specific securities should not be construed as recommendations by the Funds or their Advisor. Current and future holdings are subject to risk. |
SECTOR BREAKDOWN†
| † | Excludes securities sold short and options written, if any. |
| †† | Also includes Other Assets & Liabilities. |
GROWTHOFA HYPOTHETICAL $10,000 INVESTMENT
Past performance does not predict future performance and the graph above does not reflect the deduction of taxes you would pay on fund distributions or the redemption of fund shares. Performance shown in the chart above does not include any applicable sales charges and fees. Wasatch does not charge any sales fees. The Russell 2000 Index is an unmanaged total return index of the smallest 2,000 companies in the Russell 3000 Index, as ranked by total market capitalization. The Russell 2000 Index is widely regarded in the industry as accurately capturing the universe of small company stocks. The Russell 2000 Growth Index is an unmanaged total return index that measures the performance of those Russell 2000 Index companies with higher price-to-book ratios and higher forecasted growth values. You cannot invest directly in these or any indices.
5
| | |
| WASATCH EMERGING INDIA FUND (WAINX) — Management Discussion | | MARCH 31, 2013 |
|
|
|
The Wasatch Emerging India Fund is managed by a team of Wasatch portfolio managers led by Ajay Krishnan.
| | |

Ajay Krishnan, CFA Portfolio Manager | | OVERVIEW The first quarter of 2013 was a disappointing period for the Fund. India’s markets started strong and then faded on concerns of a slowing economy and political instability. The Fund leans more toward investing in companies with growth driven by India’s rising middle class (domestic demand). We tend to under-invest in companies that are tied to the global economy. That is one of the reasons the Fund slightly |
underperformed its benchmark, the MSCI India Investable Market Index, in the first quarter. The strongest performing sector for the benchmark was information technology (IT), which gained over 22%, driven by global IT service companies like Infosys, Wipro, TCS, etc. We lost nearly three percentage points of relative performance in the IT sector because we were not invested in these types of companies and we were underweighted in the sector overall. While we think our focus on companies tied to domestic demand will bear fruit over the long term, that wasn’t the case this quarter.
DETAILSOFTHE QUARTER
Typically in a down market is where we expect to add alpha, but this quarter we were hurt by the underperformance of some of our holdings in the financials sector. There seems to be broad-based weakening in India’s economy (services and manufacturing) and financial services stocks were hit relatively hard. Part of this is attributable to concerns surrounding non-performing assets including loans to real estate developers, construction and power companies. The financials sector was also roiled by a recent investigation and subsequent allegations of money laundering (with the collusion of mid-level managers) at several large private banks. We remain convinced of the long-term investment opportunity in financials. India is still relatively unbanked — about 50% of the people do not have bank accounts and a large percentage of the population has no access to banking services. Public sector banks still have over 75% market share. We believe the better-run private banks have the opportunity to take share from them. The bottom line is that we think the headroom for growth in the financials sector is still significant. Banks have demonstrated adequate prudence in their past behavior (not 100% though) and regulators have kept a tight leash on the banking system in general.
Another development that weighed on the market in March was that the coalition government lost the support of a key ally. This has put additional pressure on the government and it is likely that planned reforms have been put on hold. There has been ongoing concern regarding the lack of movement on infrastructure and related projects, including power, mining and land reform. India’s current account deficit is also of concern. None of these challenges are new.
We think the types of companies we hold in the Fund have the potential to grow even in challenging circumstances. Although many of our stocks certainly seem to have taken a pause this quarter, the good news is that valuations among the Fund’s holdings look attractive. The market has been trading at a 13.6 times forward price-to-earnings (P/E) ratio and the Fund has been trading at 22 times with a P/E to growth rate of 1.
A recent CRISIL report (the Standard & Poor’s affiliate in India) shows that the textile, power, engineering, construction and capital goods areas of the market are showing the most stress. The Fund tends to be underinvested in companies that are capital intensive and have poor cash flow characteristics.
As noted earlier, the Fund underperformed the Index in the financials sector. LIC Housing Finance Ltd. (a non-bank finance company) was the biggest detractor in the quarter amid concerns regarding loans to real estate developers. This is relatively a small piece of LIC’s loan book (about 4%) and we believe it is an attractive segment. Although LIC’s margins have also compressed over the last three quarters, we believe the worst is behind them. We see LIC Housing Finance as a conservative lender and believe the big picture still looks attractive. We have trimmed the position a little but continue to stay invested.
OUTLOOK
The Indian economy has certainly slowed down over the past three months. However, stocks seem attractively valued at this point, and we believe the Fund is well positioned due to our conscious strategy to invest in companies tied to domestic demand. We are using this opportunity to selectively add to what we believe are our highest quality names.
Thank you for the opportunity to invest your assets.
| Current | and future holdings are subject to risk. |
6
| | |
| WASATCH EMERGING INDIA FUND (WAINX) — Portfolio Summary | | MARCH 31, 2013 |
|
|
|
AVERAGE ANNUAL TOTAL RETURNS
| | | | | | | | | | |
| | | SIX MONTHS* | | 1 YEAR | | 5 YEARS | | SINCE INCEPTION 4/26/11 | |
Emerging India | | -2.97% | | 4.81% | | N/A | | | -0.56% | |
MSCI India IMI | | -3.23% | | 0.54% | | N/A | | | -11.71% | |
Data shows past performance, which is not indicative of future performance. Current performance may be lower or higher than the performance quoted. To obtain the most recent month-end performance data available, please visit www.wasatchfunds.com. The Advisor may absorb certain Fund expenses, without which total return would have been lower. Investment returns and principal value will fluctuate and shares, when redeemed, may be worth more or less than their original cost.
As of the January 31, 2013 prospectus, the Total Annual Fund Operating Expenses for the Wasatch Emerging India Fund are 3.41%. The Net Expenses are 1.95%. The expense ratio shown elsewhere in this report may be different. Net Expenses are based on Fund expenses, net of waivers and reimbursements. See the prospectus for additional information regarding Fund expenses.
Wasatch Funds will deduct a 2.00% redemption proceeds fee on Fund shares held 60 days or less. Performance data does not reflect the deduction of fees or taxes, which if reflected, would reduce the performance quoted. For more complete information including charges, risks and expenses, read the prospectus carefully.
Investing in small or micro cap funds will be more volatile and loss of principal could be greater than investing in large cap or more diversified funds. Investing in foreign securities, especially in emerging markets, entails special risks, such as unstable currencies, highly volatile securities markets and political and social instability, which are described in more detail in the prospectus. The Fund is non-diversified, meaning that it can invest a larger portion of its assets in the stocks of a limited number of companies than a diversified fund. Non-diversification increases the risk of loss to the Fund if the values of these securities decline.
TOP 10 EQUITY HOLDINGS**
| | | | |
| Company | | % of Net
Assets | |
| Gruh Finance Ltd. (India) | | | 3.6% | |
| Mahindra & Mahindra Financial Services Ltd. (India) | | | 3.3% | |
| Amara Raja Batteries Ltd. (India) | | | 3.2% | |
| Jubilant Foodworks Ltd. (India) | | | 3.0% | |
| Cognizant Technology Solutions Corp., Class A | | | 3.0% | |
| | | | |
| Company | | % of Net
Assets | |
| Axis Bank Ltd. (India) | | | 3.0% | |
| Housing Development Finance Corp. Ltd. (India) | | | 2.7% | |
| IndusInd Bank Ltd. (India) | | | 2.7% | |
| CMC Ltd. (India) | | | 2.6% | |
| Berger Paints India Ltd. (India) | | | 2.5% | |
| ** | As of March 31, 2013, there were 56 holdings in the Fund. Foreign currency contracts, written options and repurchase agreements, if any, are not included in the number of holdings. Portfolio holdings are subject to change at any time. References to specific securities should not be construed as recommendations by the Funds or their Advisor. Current and future holdings are subject to risk. |
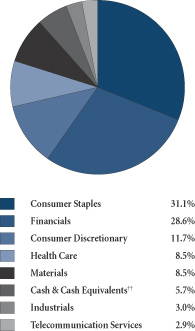
SECTOR BREAKDOWN†
| † | Excludes securities sold short and options written, if any. |
| †† | Also includes Other Assets & Liabilities. |
GROWTHOFA HYPOTHETICAL $10,000 INVESTMENT
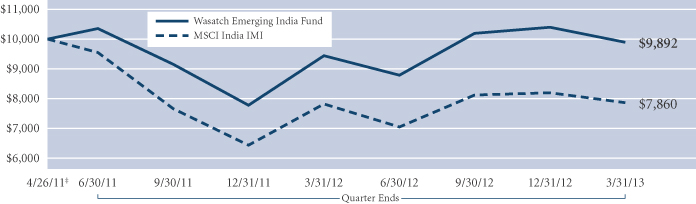
Past performance does not predict future performance and the graph above does not reflect the deduction of taxes you would pay on fund distributions or the redemption of fund shares. Performance shown in the chart above does not include any applicable sales charges and fees. Wasatch does not charge any sales fees. ‡Inception: April 26, 2011. The MSCI India IMI Investable Market Index (IMI) covers all investable large, mid and small cap securities across India, targeting approximately 99% of the Indian market’s free-float adjusted market capitalization. You cannot invest directly in this or any index.
7
| | |
| WASATCH EMERGING MARKETS SELECT FUND (WAESX/WIESX) — Management Discussion | | MARCH 31, 2013 |
|
|
|
The Wasatch Emerging Markets Select Fund is managed by a team of Wasatch portfolio managers led by Ajay Krishnan and Roger Edgley.
| | | | |
Ajay Krishnan, CFA Portfolio Manager | | 
Roger D. Edgley, CFA Portfolio Manager | | OVERVIEW The Emerging Markets Select Fund is off to a strong start. The Fund’s Investor Class gained 2.06% in the first quarter and outperformed its benchmark, the MSCI Emerging Markets Index, |
which returned -1.62%. Emerging markets trailed developed markets during the first quarter of 2013, and we saw slowing growth in large emerging economies like China and Brazil.
We have positioned the Fund to exploit opportunities arising from the explosion in domestic demand driven by consumers in emerging markets. As these markets grow and their middle class desires the same things as their contemporaries in the developed world, we think per-capita consumption expenditures can substantially increase. Roughly 70% of the Fund is invested in companies that we believe can benefit from this domestic consumption theme. This focus and our bottom-up process of analyzing the investment potential of individual companies have resulted in above benchmark weights in the consumer discretionary and consumer staples sectors.
Our goal is to find high quality companies, as defined by strong cash flow, high returns on capital and relatively small capital needs, that we believe have a sustainable competitive advantage demonstrated by stable or expanding margins, and are led by a strong management team. These companies also have significant headroom — the ability to continue growing for long periods of time.
We seek to mitigate risk through broad country exposure, low correlations between countries and companies, and reasonable valuations. The Fund has a lower beta than the Index. We believe this is due to our focus on the domestic consumption theme and because we have underemphasized global cyclicals.
DETAILSOFTHE QUARTER
During the quarter, many of the Fund’s holdings in the financials and consumer staples sectors outperformed their benchmark counterparts. Hong Kong-based investment manager First Pacific Co. Ltd., Philippines-based Metropolitan Bank & Trust Co., provider of a range of banking and financial products and services, and SM Prime Holdings, Inc., which develops and owns shopping malls in the Philippines, were among the significant number of financial companies that contributed to the Fund’s performance for the period.
Consumer staples companies that performed well during the quarter included Coca-Cola Icecek A.S., a bottler and distributor of soft drinks in Turkey, and Magnit, Russia’s largest food retailer by market value.
While the Fund was significantly underweighted in industrials and materials relative to the Index, the few names we held in these sectors dramatically outperformed in aggregate. These included International Container Terminal Services, Inc., a port management company in the Philippines, Asian Paints (India) Ltd., a paint manufacturer, and Semen Indonesia (Persero), a cement manufacturer.
The consumer discretionary sector underperformed. Golden Eagle Retail Group Ltd., an operator of department stores in China, weighed on results in the sector and was the Fund’s biggest detractor. The stock has been eliminated from the Fund.
OdontoPrev S.A., a dental plan provider in Brazil, also detracted. Aggressive efforts to gain market share by one of the company’s competitors, in the run-up to that company being acquired, resulted in higher loss ratios for OdontoPrev. While we believe OdontoPrev is a great way to invest in the emerging middle class in Brazil, we have chosen to move to the sidelines as we assess the competitive pressures the company faces.
South Africa was a weak-performing market in the quarter due to slowing growth for commodity exports. Our South African stocks struggled along with the market, especially food retailer Shoprite Holdings Ltd.
The Fund was not invested in Poland, Egypt or the Czech Republic, which were some of the weakest performing markets in the Index.
OUTLOOK
The Fund’s portfolio metrics remain favorable. We expect earnings growth in the high teens over the next three years. The weighted average price-to-earnings (P/E) ratio stood at 19.6 as of March 31, 2013, and the P/E to growth rate was 1.3, which tells us the Fund’s portfolio is reasonably valued. In addition, 75% of the Fund’s holdings outperformed the benchmark, supporting our confidence in the strategy.
Judging by the metrics and the outperformance of the majority of our holdings, we believe the Fund is well positioned. As noted, we view the growing middle class in emerging markets as an enduring theme that provides the potential for the Fund to produce outstanding results over the long run.
However, if there were a strong risk-on move and high beta sectors like energy and materials (i.e., global cyclicals) lead the performance, we would expect the Fund to experience short-term underperformance.
Thank you for the opportunity to manage your assets.
| Current | and future holdings are subject to risk. |
8
| | |
| WASATCH EMERGING MARKETS SELECT FUND (WAESX/WIESX) — Portfolio Summary | | MARCH 31, 2013 |
|
|
|
AVERAGE ANNUAL TOTAL RETURNS
| | | | | | | | | | | | | | | | |
| | | SIX MONTHS | | | 1 YEAR | | | 5 YEARS | | | SINCE INCEPTION* 12/13/12 | |
Emerging Markets Select (WAESX) — Investor | | | N/A | | | | N/A | | | | N/A | | | | 3.90% | |
Emerging Markets Select (WIESX) — Institutional | | | N/A | | | | N/A | | | | N/A | | | | 4.00% | |
MSCI Emerging Markets Index | | | N/A | | | | N/A | | | | N/A | | | | -0.23% | |
Data shows past performance, which is not indicative of future performance. Current performance may be lower or higher than the performance quoted. To obtain the most recent month-end performance data available, please visit www.wasatchfunds.com. The Advisor may absorb certain Fund expenses, without which total return would have been lower. Investment returns and principal value will fluctuate and shares, when redeemed, may be worth more or less than their original cost.
As of the January 31, 2013 prospectus, the Total Annual Fund Operating Expenses for the Wasatch Emerging Markets Select Fund are Investor Class — Gross: 2.27%, Net: 1.69% / Institutional Class —Gross: 2.29%, Net: 1.50%. The expense ratio shown elsewhere in this report may be different. Net Expenses are based on Fund expenses, net of waivers and reimbursements. See the prospectus for additional information regarding Fund expenses.
Wasatch Funds will deduct a 2.00% redemption proceeds fee on Fund shares held 60 days or less. Performance data does not reflect the deduction of fees or taxes, which if reflected, would reduce the performance quoted. For more complete information including charges, risks and expenses, read the prospectus carefully.
Investing in foreign securities, especially in emerging markets, entails special risks, such as currency fluctuations and political uncertainties, which are described in more detail in the prospectus. Investing in small cap funds will be more volatile and loss of principal could be greater than investing in large cap or more diversified funds. Being non-diversified, the Fund can invest a larger portion of its assets in the securities of a limited number of companies than a diversified fund. Non-diversification increases the risk of loss to the Fund if the values of these securities decline.
TOP 10 EQUITY HOLDINGS**
| | | | |
| Company | | % of Net
Assets | |
| Coca-Cola Icecek A.S. (Turkey) | | | 3.2% | |
| International Container Terminal Services, Inc. (Philippines) | | | 3.0% | |
| Imperial Holdings Ltd. (South Africa) | | | 3.0% | |
| PT Tower Bersama Infrastructure Tbk (Indonesia) | | | 3.0% | |
| | | | |
| Company | | % of Net
Assets | |
| Asian Paints Ltd. (India) | | | 3.0% | |
| Turkiye Halk Bankasi A.S. (Turkey) | | | 3.0% | |
| SM Prime Holdings, Inc. (Philippines) | | | 3.0% | |
| SJM Holdings Ltd. (Hong Kong) | | | 2.9% | |
| Credicorp Ltd. (Peru) | | | 2.9% | |
| Godrej Consumer Products Ltd. (India) | | | 2.9% | |
| ** | As of March 31, 2013, there were 33 holdings in the Fund. Foreign currency contracts, written options and repurchase agreements, if any, are not included in the number of holdings. Portfolio holdings are subject to change at any time. References to specific securities should not be construed as recommendations by the Funds or their Advisor. Current and future holdings are subject to risk. |
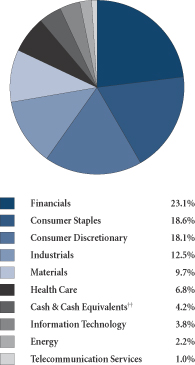
SECTOR BREAKDOWN†
| † | Excludes securities sold short and options written, if any. |
| †† | Also includes Other Assets & Liabilities. |
GROWTHOFA HYPOTHETICAL $10,000 INVESTMENT
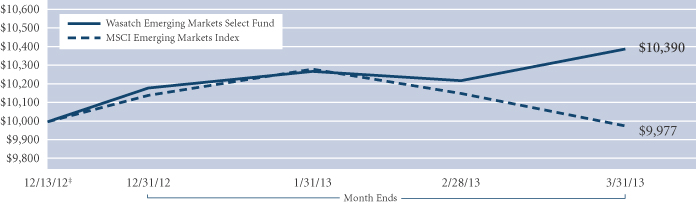
Past performance does not predict future performance and the graph above does not reflect the deduction of taxes you would pay on fund distributions or the redemption of fund shares. Performance shown in the chart above does not include any applicable sales charges and fees. Wasatch does not charge any sales fees. ‡Inception: December 13, 2012. The MSCI Emerging Markets Index is a free float-adjusted market capitalization index designed to measure the equity market performance of emerging markets. You cannot invest directly in this or any index.
9
| | |
| WASATCH EMERGING MARKETS SMALL CAP FUND (WAEMX) — Management Discussion | | MARCH 31, 2013 |
|
|
|
The Wasatch Emerging Markets Small Cap Fund is managed by a team of Wasatch portfolio managers led by Roger Edgley and Laura Geritz.
| | | | |
Roger D. Edgley, CFA Portfolio Manager | | 
Laura Geritz, CFA Portfolio Manager | | OVERVIEW For the first quarter of 2013, emerging markets lagged developed markets. After a strong 2012, we believed that this year could be more difficult for returns in emerging markets, especially considering the |
visible slowdowns in countries like China and Brazil. We are seeing more disparate performance across emerging markets, with smaller countries, those in Southeast Asia for example, outperforming the BRIC (Brazil, Russia, India and China) countries. We have been overweight in Thailand, the Philippines and Mexico to a significant degree and it helped performance in the quarter. The Wasatch Emerging Markets Small Cap Fund was up 4.63% for the quarter, and outperformed the MSCI Emerging Markets Small Cap Index, which returned 4.20%.
In March, the Fund was recognized with a Lipper Fund Award for #1 performance over the three-year and five-year periods ended December 31, 2012 among 308 and 219 emerging markets funds, respectively. This recognition was earned for the second year in a row. The Emerging Markets Small Cap Fund was previously recognized in 2012 for its three-year performance ended December 31, 2011 among 296 emerging markets funds.*
DETAILSOFTHE QUARTER
As mentioned, smaller countries outside of the BRICs showed stronger performance in general. In Thailand, strong performance from names that were larger positions for us came from Minor International Public Co. Ltd. (hotel management and restaurants), Home Product Center Public Co. Ltd. (a home improvement retailer), Bangkok Life Assurance Public Co. Ltd. (life insurance) and Siam Makro Public Co. Ltd. (membership-based cash and carry trade centers). In the Philippines, our names did well with strong performance from Universal Robina Corp. (snack foods), International Container Terminal Services, Inc. (container terminal management) and Security Bank Corp. (universal bank).
It is interesting how the fundamentals of markets like Thailand and the Philippines have forced a decoupling from the rest of the emerging markets. The equity markets of these countries at present are backed by solid gross domestic product (GDP) growth (in the 5% to 7% range), strong banking systems, and strengthening investment and consumer spending. Banks and corporations are wary of over-growing and over-investing, a result of the Asian financial crisis, which caused a decade-long aftermath of rebuilding balance sheets and increased capital discipline.
Recovery from crises like the Asian financial crisis, or like Ireland recently, take at least a decade. Of course, newspaper headlines will be full of those countries in crises of some sort, not those in steady recovery or rebuilding mode like Thailand.
Today, the main risk we see in these countries is less one of overinvestment causing massive misallocation of capital and more of too much enthusiasm by investors bidding up multiples. What is remarkable about Thailand today for us, aside from the economic recovery, is its central place in a region showing positive political development and growth — namely Laos, Vietnam, Cambodia and Myanmar. Thai corporations are already benefiting from growth and investment in these countries, as well as from visitors coming to Thailand.
Markets where we underperformed were Indonesia and China. China especially has proven to be a difficult market after a strong real estate led third quarter. Consumer names like Dah Chong Hong Holdings Ltd. and Golden Eagle Retail Group Ltd. saw softer consumer spending with disappointing growth numbers. We continue to be significantly underweight relative to the Index in China. However, companies we own in Taiwan that are growing in China include Standard Foods Corp., Chailease Holding Co. Ltd. and Taiwan Hon Chuan Enterprise Co. Ltd. South Africa also had a more difficult quarter, with weak consumer numbers and concerns over the country’s currency. Consumer names in Indonesia have been softer, as evidenced in the earnings being reported.
OUTLOOK
In terms of outlook, we see a more difficult year for equity markets in emerging countries (although we are wary of our own predictive abilities here). This is evident today especially in the BRIC markets. In the last two years, the BRIC markets have been underperforming emerging markets. Some of this is being driven by structural and political factors. Although the Fund has no holdings in South Korea, it is a significant part of the benchmark and there are clearly major political worries with North Korea — the KOSPI** was down about 4% year-to-date through March 31 as a result. For non-BRIC countries we are optimistic about the prospects of a number of the smaller markets like Thailand, Mexico, Turkey and the Philippines, where the economic drivers of growth are visibly better. We expect to see continued long-term divergence in performance — a reflection of the diversity of countries within emerging markets.
Thank you for the opportunity to manage your assets.
| * | The Lipper Fund Awards program honors funds that have excelled in delivering consistently strong risk-adjusted performance relative to peers. Lipper designates award-winning funds in most individual classifications for the three-, five- and 10-year periods. Please visit the Awards for Excellence website (http://excellence.thomsonreuters.com/award/lipper) for more details about the Lipper Fund Awards. Lipper Award designations are not intended to constitute investment advice or predict future results, and Lipper does not guarantee the accuracy of this information. In addition to periods of positive returns, the Wasatch Emerging Markets Small Cap Fund experienced some periods of negative returns during the award time frame. Past performance is not indicative of future results. |
| ** | KOSPI refers to the variety of indicators that are used to measure the performance of stocks on the Korea Stock Exchange. The KOSPI itself is best known and refers to a capitalization-weighted index of about 700 Korean equities. |
| | Current and future holdings are subject to risk. |
10
| | |
| WASATCH EMERGING MARKETS SMALL CAP FUND (WAEMX) — Portfolio Summary | | MARCH 31, 2013 |
|
|
|
AVERAGE ANNUAL TOTAL RETURNS
| | | | | | | | | | | | | | | | |
| | | SIX MONTHS* | | | 1 YEAR | | | 5 YEARS | | | SINCE INCEPTION 10/1/07 | |
Emerging Markets Small Cap | | | 11.05% | | | | 12.31% | | | | 12.09% | | | | 7.51% | |
MSCI Emerging Markets Small Cap Index | | | 9.52% | | | | 9.20% | | | | 4.13% | | | | 0.70% | |
MSCI Emerging Markets Index | | | 3.87% | | | | 1.96% | | | | 1.09% | | | | -0.48% | |
Data shows past performance, which is not indicative of future performance. Current performance may be lower or higher than the performance quoted. To obtain the most recent month-end performance data available, please visit www.wasatchfunds.com. The Advisor may absorb certain Fund expenses, without which total return would have been lower. Investment returns and principal value will fluctuate and shares, when redeemed, may be worth more or less than their original cost.
As of the January 31, 2013 prospectus, the Total Annual Fund Operating Expenses for the Wasatch Emerging Markets Small Cap Fund are 2.13%. The Net Expenses are 1.95%. The expense ratio shown elsewhere in this report may be different. Net Expenses are based on Fund expenses, net of waivers and reimbursements. See the prospectus for additional information regarding Fund expenses.
Wasatch Funds will deduct a 2.00% redemption proceeds fee on Fund shares held 60 days or less. Performance data does not reflect the deduction of fees or taxes, which if reflected, would reduce the performance quoted. For more complete information including charges, risks and expenses, read the prospectus carefully.
Investing in foreign securities, especially in emerging markets, entails special risks, such as currency fluctuations and political uncertainties, which are described in more detail in the prospectus. Investing in small cap funds will be more volatile and loss of principal could be greater than investing in large cap or more diversified funds.
TOP 10 EQUITY HOLDINGS**
| | | | |
| Company | | % of Net
Assets | |
| Minor International Public Co. Ltd. (Thailand) | | | 2.3% | |
| Home Product Center Public Co. Ltd. (Thailand) | | | 2.1% | |
| Universal Robina Corp. (Philippines) | | | 2.1% | |
| Siam Makro Public Co. Ltd. (Thailand) | | | 1.8% | |
| Security Bank Corp. (Philippines) | | | 1.8% | |
| PT Holcim Indonesia Tbk (Indonesia) | | | 1.7% | |
| | | | |
| Company | | % of Net
Assets | |
| Parque Arauco S.A. (Chile) | | | 1.6% | |
| Sonda S.A. (Chile) | | | 1.6% | |
| Chailease Holding Co. Ltd. (Taiwan) | | | 1.6% | |
| Mahindra & Mahindra Financial Services Ltd. (India) | | | 1.6% | |
| ** | As of March 31, 2013, there were 90 holdings in the Fund. Foreign currency contracts, written options and repurchase agreements, if any, are not included in the number of holdings. Portfolio holdings are subject to change at any time. References to specific securities should not be construed as recommendations by the Funds or their Advisor. Current and future holdings are subject to risk. |
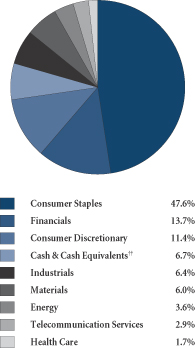
SECTOR BREAKDOWN†
| † | Excludes securities sold short and options written, if any. |
| †† | Also includes Other Assets & Liabilities. |
GROWTHOFA HYPOTHETICAL $10,000 INVESTMENT
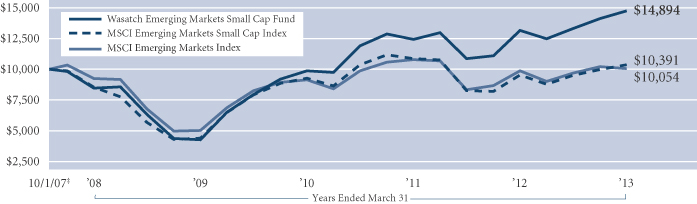
Past performance does not predict future performance and the graph above does not reflect the deduction of taxes you would pay on fund distributions or the redemption of fund shares. Performance shown in the chart above does not include any applicable sales charges and fees. Wasatch does not charge any sales fees. ‡Inception: October 1, 2007. The MSCI Emerging Markets and Emerging Markets Small Cap indices are free float-adjusted market capitalization indices designed to measure the equity market performance of emerging markets. You cannot invest directly in these or any indices.
11
| | |
| WASATCH FRONTIER EMERGING SMALL COUNTRIES FUND (WAFMX) — Management Discussion | | MARCH 31, 2013 |
|
|
|
The Wasatch Frontier Emerging Small Countries Fund is managed by a team of Wasatch portfolio managers led by Laura Geritz.
| | |
Laura Geritz, CFA Portfolio Manager | | OVERVIEW The Wasatch Frontier Emerging Small Countries Fund marked its first-year anniversary in the quarter with an absolute rank of #1, according to Morningstar, out of 560 Diversified Emerging Markets funds based on total return for the 12 months ended March 31, 2013.* The Fund continued to put up solid performance in the quarter, producing an 8.33% return versus the MSCI Frontier Emerging Markets |
Index, which was up 4.39%.
Year-to-date, media pundits have postulated a return to the risk-on trade. Yet the traditional high beta sectors, namely energy and materials, were weak in the quarter, and investors are showing a strong preference for markets with relatively strong growth prospects.
DETAILSOFTHE QUARTER
NagaCorp Ltd. was our top-contributing stock this quarter. We met NagaCorp’s management in our office recently, and the company’s long-term growth plans appear intact. We feel fortunate to have had very few torpedoes in this Fund and we have done well with our country tilts. A notable miss in the quarter was the United Arab Emirates due to our low weighting and the underperformance of our holdings relative to the Index. We are active in this market, but have struggled to find companies that meet our quality criteria.
Instead of recounting play-by-play details on Fund performance, I want to elaborate on one of our central tenets for launching the Fund. A core premise is that investors need to rethink index constructs, which emphasize the BRIC (Brazil, Russia, India and China) nations, Taiwan, and Korea. Instead, we believe investors need to consider using active management to craft a well-diversified portfolio, which seeks the next great growth countries and strives to mitigate risk through analyzing correlation statistics — how countries move in the same or vastly different directions.
One of the other tenets of the Fund I want to discuss comes as a direct response to a question I often receive from investors and that is “What do I think constitutes a frontier or an emerging small country?” Frontier and emerging small countries primarily have either low GDP per capita, and hence great growth potential like Nigeria and Kenya, or are wealthy countries whose markets are simply illiquid like the United Arab Emirates. Others are like Costa Rica, a country that is actually relatively wealthy. Little of its GDP is recognized in market capitalization yet. It is absent from the indices, and many Costa Rican companies are not public. That is a future opportunity for investors.
I like to call our frontier and emerging small countries portfolio a Frankenstein portfolio, constructed of different nations with vastly different economic and political parts.
Yet unlike Mary Shelley’s fictional beast, the sum of the parts — the portfolio — works. Remove the sutures and you have interesting uncorrelated growth and value markets where we believe quality abounds. This means a portfolio manager can potentially mitigate volatility by putting together countries that don’t move in concert.
To elaborate on our portfolio creation, let me talk about one of the trips we took in the quarter. We visited a number of countries in Africa including Zimbabwe and South Africa. I think Zimbabwe is a perfect example of how a seemingly dysfunctional country can still be a great investment — our brewer in Zimbabwe does not move in concert with our brewer in Morocco, yet both have gone up over time. Zimbabwe went from being the breadbasket of Africa to Africa’s basket case. Zimbabwe has had it all — a kleptocratic government, sweeping nationalizations, hyperinflation, price controls, capital controls, and a currency collapse. Yet, I’m optimistic. At some point, President Mugabe will have to go — he is the country’s past not its future. Zimbabwe is known for its high level of education. It is a pleasant country with agricultural resources and little crime. The informal economy is sizable, driving demand for our consumer goods holdings — Delta, Innscor and Dairibord. I can’t help but marvel at what I consider to be the biggest positive — the quality of the companies.
In the quarter, a number of our South African companies were weak, as the region is witnessing a slowdown in consumption following mining strikes last year and a credit boom. Mr Price Group, Shoprite, Woolworths and Tiger Brands were impacted in the quarter by softness in South African consumption. However, I believe these companies can use their scale and proximity — at the doorstep of sub-Sahara — to canvas the continent. Long-term, I expect these will be great Pan-African companies, and I have been rounding up into weakness.
OUTLOOK
Frontier and emerging small countries offer low correlations, valuations still appear reasonable, growth has been good, and quality looks high on an absolute and relative basis. We believe we can craft the Fund’s portfolio by using our process of screening and deep due diligence to find companies within these markets that have outstanding potential. Our upcoming quarter once again entails rigorous travel. We will be traveling to Vietnam, Sri Lanka, Turkey, Thailand, Kenya, Uganda, Rwanda and Tanzania to name just a few markets. We remain convinced that the Fund’s long-term opportunity looks good — even for a Frankenstein portfolio.
Thank you for your investment.
| * | The Morningstar absolute rank is the rank of a fund among its category peers, which rank is based on a comparison of a fund’s total return performance against its peers over the stated time period. Past performance is no guarantee of future results. © 2013 Morningstar, Inc. All rights reserved. The information contained herein (1) is proprietary to Morningstar and/or its content providers; (2) may not be copied or distributed; and (3) is not warranted to be accurate, complete, or timely. Neither Morningstar nor its content providers are responsible for any damages or losses arising from any use of this information. |
| | Current and future holdings are subject to risk. |
12
| | |
| WASATCH FRONTIER EMERGING SMALL COUNTRIES FUND (WAFMX) — Portfolio Summary | | MARCH 31, 2013 |
|
|
|
AVERAGE ANNUAL TOTAL RETURNS
| | | | | | | | | | | | | | |
| | | SIX MONTHS* | | | 1 YEAR | | | 5 YEARS | | SINCE INCEPTION 1/31/12 | |
Frontier Emerging Small Countries | | | 18.33% | | | | 39.69% | | | N/A | | | 36.10% | |
MSCI Frontier Emerging Markets Index | | | 10.42% | | | | 12.71% | | | N/A | | | 17.31% | |
MSCI Frontier Markets Index | | | 11.48% | | | | 11.62% | | | N/A | | | 14.90% | |
Data shows past performance, which is not indicative of future performance. Current performance may be lower or higher than the performance quoted. To obtain the most recent month-end performance data available, please visit www.wasatchfunds.com. The Advisor may absorb certain Fund expenses, without which total return would have been lower. Investment returns and principal value will fluctuate and shares, when redeemed, may be worth more or less than their original cost.
As of the January 31, 2013 prospectus, the Total Annual Fund Operating Expenses for the Wasatch Frontier Emerging Small Countries Fund are 3.64%. The Net Expenses are 2.25%. The expense ratio shown elsewhere in this report may be different. Net Expenses are based on Fund expenses, net of waivers and reimbursements. See the prospectus for additional information regarding Fund expenses.
Wasatch Funds will deduct a 2.00% redemption proceeds fee on Fund shares held 60 days or less. Performance data does not reflect the deduction of fees or taxes, which if reflected, would reduce the performance quoted. For more complete information including charges, risks and expenses, read the prospectus carefully.
Investing in small cap funds will be more volatile and loss of principal could be greater than investing in large cap or more diversified funds. Investing in foreign securities, especially in frontier and emerging markets, entails special risks, such as unstable currencies, highly volatile securities markets and political and social instability, which are described in more detail in the prospectus. Being non-diversified, the Fund can invest a larger portion of its assets in the stocks of a limited number of companies than a diversified fund. Non-diversification increases the risk of loss to the Fund if the values of these securities decline.
TOP 10 EQUITY HOLDINGS**
| | | | |
| Company | | % of Net
Assets | |
| Nestlé Nigeria plc (Nigeria) | | | 4.3% | |
| East African Breweries Ltd. (Kenya) | | | 3.7% | |
| NagaCorp Ltd. (Cambodia) | | | 3.3% | |
| Nigerian Breweries plc (Nigeria) | | | 2.7% | |
| Ulker Biskuvi Sanayi A.S. (Turkey) | | | 2.0% | |
| | | | |
| Company | | % of Net
Assets | |
| Shoprite Holdings Ltd. (South Africa) | | | 2.0% | |
| Commercial Bank of Ceylon plc (Sri Lanka) | | | 2.0% | |
| Zenith Bank plc (Nigeria) | | | 1.9% | |
| Kuwait Foods Americana (Kuwait) | | | 1.9% | |
| Universal Robina Corp. (Philippines) | | | 1.9% | |
| ** | As of March 31, 2013, there were 109 holdings in the Fund. Foreign currency contracts, written options and repurchase agreements, if any, are not included in the number of holdings. Portfolio holdings are subject to change at any time. References to specific securities should not be construed as recommendations by the Funds or their Advisor. Current and future holdings are subject to risk. |
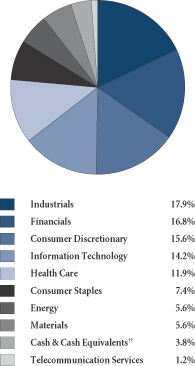
SECTOR BREAKDOWN†
| † | Excludes securities sold short and options written, if any. |
| †† | Also includes Other Assets & Liabilities. |
GROWTHOFA HYPOTHETICAL $10,000 INVESTMENT
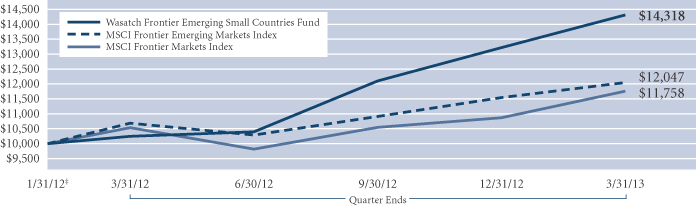
Past performance does not predict future performance and the graph above does not reflect the deduction of taxes you would pay on fund distributions or the redemption of fund shares. Performance shown in the chart above does not include any applicable sales charges and fees. Wasatch does not charge any sales fees. ‡Inception: January 31, 2012. The MSCI Frontier Emerging Markets and MSCI Frontier Markets indices are free float-adjusted market capitalization indices designed to measure the equity market performance of the global frontier and emerging markets. You cannot invest directly in these or any indices.
13
| | |
| WASATCH GLOBAL OPPORTUNITIES FUND (WAGOX) — Management Discussion | | MARCH 31, 2013 |
|
|
|
The Wasatch Global Opportunities Fund is managed by a team of Wasatch portfolio managers led by JB Taylor and Ajay Krishnan.
| | | | |
JB Taylor Portfolio Manager | |
Ajay Krishnan, CFA Portfolio Manager | | OVERVIEW The Wasatch Global Opportunities Fund gained 8.25% in the first quarter, and the MSCI AC World Small Cap Index rose 9.65%. The quarter was a combination of strong results in |
absolute terms and modest underperformance versus the benchmark. Our investments in the vast majority of sectors and countries posted gains, with particular strength in industrials, information technology, Australia and Japan. The biggest factor in the Fund’s performance versus the MSCI AC World Small Cap Index was our lower relative weight in U.S. stocks. Our holdings in the United States performed well, generating double-digit gains that were slightly behind the average for U.S. small caps. Our international stocks did slightly better than the international component of the Index, mitigating some of the effect of a low U.S. weight.
DETAILSOFTHE QUARTER
Our international holdings, which accounted for about 58% of the Fund, gained approximately 7.5% for the quarter, and exceeded the 6.54% increase in the MSCI AC World Ex-U.S.A. Small Cap Index.* Keeping pace with our benchmark, the MSCI AC World Small Cap Index, was made more difficult by our overweight positions in two markets that declined — India and South Africa. The political environment has been tenuous in India. One of the key members of the ruling coalition government recently pulled its support from the government, triggering a broad sell-off in equities. In South Africa, concerns about the country’s growth outlook and ongoing labor tensions put downward pressure on its currency, eroding equity returns for U.S.-based investors.
As a market, Japan caught many investors by surprise, posting a gain of nearly 16% for the period. Coming into the quarter, the Fund’s weight in Japan was less than half of the Index’s, but we still outperformed in the country. This was in part due to MonotaRO Co. Ltd., an Internet-based distributor of maintenance, repair and operations (MRO) supplies headquartered in Japan. It was the Fund’s largest position coming into the quarter and the stock gained nearly 51%. The company offers about two million products and has been posting record monthly sales. On the negative side, LIC Housing Finance Ltd., one of India’s largest mortgage lenders, was a major detractor. LIC reported slower loan growth and an increase in non-performing assets. We sold the stock in response to the disappointing results, as well as our concerns about LIC’s relatively new management team.
Our domestic holdings, which accounted for approximately 37% of the Fund, were up about 12.2%. This was a strong result. However, it was not quite as strong as the performance of the MSCI U.S. Small Cap Index,** which rose 12.79%. In the aggressive market environment that prevailed during the quarter, economically sensitive and more speculative stocks were generally the market’s best performers. Stocks related to construction and housing were especially strong. Biotechnology stocks were also top performers. With risk appetites elevated, many of our stable companies with consistent earnings and solid business models looked less appealing by comparison. While this was a challenge for our style of investing, the margin of underperformance in the domestic portion of the Fund was small.
One of our steady growth companies that did outperform was Copart, Inc., a provider of online auctions and vehicle remarketing services in the United States, the United Kingdom and Canada. Strong, profitable relationships with auto insurers are key drivers of its business, and Copart continues to win exclusive contracts with insurance companies. SEI Investments Co., a stock we added this quarter, was another notable contributor. SEI is an investment manager that also provides back-office technology to banks and other financial services firms. The company has been investing heavily in its “Global Wealth Services” to attract large bank customers, and this initiative is starting to pay off. Sales trends are positive, and earnings growth is reaccelerating.
One of the biggest U.S. detractors this quarter was Polypore International, Inc. Polypore makes filtration membranes used in batteries, including the lithium-ion batteries used in electric cars. The stock declined amid uncertainty about the timing for the meaningful adoption of electric vehicles. Despite the recent weakness, our long-term thesis on Polypore remains intact. We believe that vehicle electrification is inevitable and that the company is well positioned for this opportunity since it is one of the world’s leading suppliers of lithium battery membranes.
OUTLOOK
As always, we remain focused on identifying companies whose individual characteristics provide the potential for them to excel and grow regardless of broad trends in the global economy. According to our models, our portfolio companies are on track to generate 18% annual earnings growth over the next three years, while delivering a 24% return on equity. In addition, the Fund’s weighted-average price-to-earnings ratio is 19 times forward 12-month earnings, which is attractive relative to our earnings estimates. These metrics give us confidence that our portfolio of Wasatch’s best global ideas is well positioned for the months ahead.
Thank you for the opportunity to manage your assets.
| * | The MSCI All Country (AC) World Ex-U.S.A. Small Cap Index is an unmanaged index and includes reinvestment of all dividends of issuers located in countries throughout the world representing developed and emerging markets, excluding securities of U.S. issuers. This index is a free float-adjusted market capitalization index designed to measure the performance of small capitalization securities. |
| **The | MSCI U.S. Small Cap Index represents the universe of small capitalization companies in the U.S. equity market. |
| | Current and future holdings are subject to risk. |
14
| | |
| WASATCH GLOBAL OPPORTUNITIES FUND (WAGOX) — Portfolio Summary | | MARCH 31, 2013 |
|
|
|
AVERAGE ANNUAL TOTAL RETURNS
| | | | | | | | | | | | | | |
| | | SIX MONTHS* | | | 1 YEAR | | | 5 YEARS | | SINCE INCEPTION 11/17/08 | |
Global Opportunities | | | 13.92% | | | | 19.69% | | | N/A | | | 26.71% | |
MSCI AC World Small Cap Index | | | 13.74% | | | | 13.71% | | | N/A | | | 21.62% | |
S&P Global SmallCap Index | | | 14.33% | | | | 14.03% | | | N/A | | | 20.68% | |
Data shows past performance, which is not indicative of future performance. Current performance may be lower or higher than the performance quoted. To obtain the most recent month-end performance data available, please visit www.wasatchfunds.com. The Advisor may absorb certain Fund expenses, without which total return would have been lower. Investment returns and principal value will fluctuate and shares, when redeemed, may be worth more or less than their original cost.
As of the January 31, 2013 prospectus, the Total Annual Fund Operating Expenses for the Wasatch Global Opportunities Fund are 1.84%. The expense ratio shown elsewhere in this report may be different. See the prospectus for additional information regarding Fund expenses.
Wasatch Funds will deduct a 2.00% redemption proceeds fee on Fund shares held 60 days or less. Performance data does not reflect the deduction of fees or taxes, which if reflected, would reduce the performance quoted. For more complete information including charges, risks and expenses, read the prospectus carefully.
Investing in small and micro cap funds will be more volatile and loss of principal could be greater than investing in large cap or more diversified funds. Investing in foreign securities, especially in emerging markets, entails special risks, such as currency fluctuations and political uncertainties, which are described in more detail in the prospectus.
TOP 10 EQUITY HOLDINGS**
| | | | |
| Company | | % of Net
Assets | |
Wirecard AG (Germany) | | | 2.0% | |
REA Group Ltd. (Australia) | | | 2.0% | |
Coca-Cola Icecek A.S. (Turkey) | | | 2.0% | |
MonotaRO Co. Ltd. (Japan) | | | 1.9% | |
Sa Sa International Holdings Ltd. (China) | | | 1.7% | |
Aberdeen Asset Management plc
(United Kingdom) | | | 1.7% | |
| | | | |
| Company | | % of Net
Assets | |
Elekta AB, Class B (Sweden) | | | 1.7% | |
Abcam plc (United Kingdom) | | | 1.7% | |
Rotork plc (United Kingdom) | | | 1.6% | |
Domino’s Pizza Group plc
(United Kingdom) | | | 1.6% | |
| ** | As of March 31, 2013, there were 93 holdings in the Fund. Foreign currency contracts, written options and repurchase agreements, if any, are not included in the number of holdings. Portfolio holdings are subject to change at any time. References to specific securities should not be construed as recommendations by the Funds or their Advisor. Current and future holdings are subject to risk. |
SECTOR BREAKDOWN†
| † | Excludes securities sold short and options written, if any. |
| †† | Also includes Other Assets & Liabilities. |
GROWTHOFA HYPOTHETICAL $10,000 INVESTMENT

Past performance does not predict future performance and the graph above does not reflect the deduction of taxes you would pay on fund distributions or the redemption of fund shares. Performance shown in the chart above does not include any applicable sales charges and fees. Wasatch does not charge any sales fees. ‡Inception: November 17, 2008. The MSCI All Country (AC) World Small Cap Index is an unmanaged index and includes reinvestment of all dividends of issuers located in countries throughout the world representing developed and emerging markets. This index is a free float-adjusted market capitalization index designed to measure the performance of small capitalization securities. The S&P Global SmallCap Index is an unmanaged index and includes reinvestment of all dividends of issuers located across developed and emerging markets, including the United States, that fall in the bottom 15% of their country’s market cap range. You cannot invest directly in these or any indices.
15
| | |
| WASATCH HERITAGE GROWTH FUND (WAHGX) — Management Discussion | | MARCH 31, 2013 |
|
|
|
The Wasatch Heritage Growth Fund is managed by a team of Wasatch portfolio managers led by Chris Bowen and Ryan Snow.
| | | | |

Chris Bowen Portfolio Manager | | 
Ryan Snow Portfolio Manager | | OVERVIEW Spurred on, in part, by the rebound in the housing market, the stock market continued its upward advance to open the year. Virtually every sector finished the first quarter in |
positive territory during a broad market rally.
The Wasatch Heritage Growth Fund also posted strong performance with an 8.18% gain for the quarter. The Fund’s benchmark, the Russell Midcap Growth Index, performed even better by returning 11.51%.
We are pleased that the Fund delivered a significant gain. We are also disappointed — though not completely surprised — that it underperformed the benchmark. As we’ve said in the past, the steadily growing, top quality companies that we believe we hold in the Fund tend to generate less market excitement when stock prices are soaring. We would have liked the market to recognize the untapped potential of the Fund’s holdings. But — more importantly — we believe the consistent execution of the companies we hold gives them the potential to outperform when market participants aren’t so optimistic. Although our top 20 holdings by position size each delivered a positive return, we simply weren’t invested where the market was the strongest this quarter.
We believe we should be good stewards and vigorous protectors of the Fund’s capital. This means that part of our job is to drown out the short-term noise of market movements — whether up or down — so we can remain focused on the task of finding great companies valued at reasonable prices. We don’t invest with the intent of capturing all of the available upside because, in addition to securing gains, we also believe we are charged with minimizing downward movements. Though this isn’t always an immediately rewarding process, we are confident that our disciplined approach is the best way to achieve outstanding results over time.
DETAILSOFTHE QUARTER
The Fund’s underperformance was primarily attributable to being less exposed to consumer discretionary and consumer staples companies than the benchmark. Both sectors were meaningful contributors to the benchmark’s return.
Even though we are witnessing signs of modest economic improvement, the overhang of debt — both on the government and individual level — continues to make us cautious in our outlook. As irrepressible as consumer spending has been, with savings rates dipping and tax rates increasing, we currently see few enticing investment opportunities among companies dependent upon consumers, especially among retailers.
IntercontinentalExchange, Inc. was a strong performer during the quarter. While headlines focused on the company’s pending acquisition of NYSE Euronext,* operator of the New York Stock Exchange, we believe the more attractive component of the transaction is the NYSE Liffe, which deals in derivatives, a rapidly expanding segment of trading activity.
Covance, Inc. was also a significant contributor. The company, which partners primarily with pharmaceutical firms to assist in drug development, has been in a difficult environment. Its early-stage business virtually dried up in 2008 as biotechnology companies encountered severe challenges. We’re optimistic about the current Food and Drug Administration environment, which seems to now have a more efficient approval process. We believe that Covance has a good opportunity to return its margins back to where they once were, which should support a higher stock price.
SEI Investments Co. performed well and is an example of a quintessential portfolio holding. This diversified investment manager and processor has continued to make strides coming off of the deep decline of the equity markets since the financial crisis began in late 2007. We increased our position size during the quarter as we felt the company’s valuation looked appealing and we expect meaningful earnings growth driven by SEI’s expansion into new markets.
Few holdings detracted from the Fund’s performance. After being the Fund’s top-contributing stock during the fourth quarter, Polypore International, Inc. declined. Riverbed Technology, Inc. also detracted. With a dominant share of the wide area network optimization market, the company is transitioning from a single product company to a more diversified multi-product vendor. We believe this transition has resulted in a lack of clarity in the eyes of investors, and we have maintained a small position size. However, from a valuation standpoint, the stock appears inexpensive.
We sold a pair of small positions — Altera Corp., a semiconductor company, and SandRidge Energy, Inc. We lost some of our conviction about their prospects and felt that better opportunities were available.
OUTLOOK
While we forecast that companies’ earnings growth will continue to advance through the rest of the year, we also expect market returns to temper. In the broader market, stock price appreciation has vastly outpaced earnings growth. We are skeptical that this trend can continue over time.
The positive news coming out of the quarter was that we delivered a strong return and grew the Fund’s value. The downside of the rising market is that stocks are generally more expensive than they were just a few months ago. This means we must be even more disciplined about the valuation and quality of the companies held in the Fund.
Thank you for the opportunity to manage your assets.
| * | As of March 31, 2013, the Wasatch Heritage Growth Fund was not invested in NYSE Euronext. |
| | Current and future holdings are subject to risk. |
16
| | |
| WASATCH HERITAGE GROWTH FUND (WAHGX) — Portfolio Summary | | MARCH 31, 2013 |
|
|
|
AVERAGE ANNUAL TOTAL RETURNS
| | | | | | | | | | | | | | | | |
| | | SIX MONTHS* | | | 1 YEAR | | | 5 YEARS | | | SINCE INCEPTION 6/18/04 | |
Heritage Growth | | | 10.08% | | | | 6.99% | | | | 8.19% | | | | 6.16% | |
Russell Midcap® Growth Index | | | 13.39% | | | | 12.76% | | | | 7.98% | | | | 8.27% | |
S&P 500 Index | | | 10.19% | | | | 13.96% | | | | 5.81% | | | | 5.97% | |
Data shows past performance, which is not indicative of future performance. Current performance may be lower or higher than the performance quoted. To obtain the most recent month-end performance data available, please visit www.wasatchfunds.com. The Advisor may absorb certain Fund expenses, without which total return would have been lower. Investment returns and principal value will fluctuate and shares, when redeemed, may be worth more or less than their original cost.
As of the January 31, 2013 prospectus, the Total Annual Fund Operating Expenses for the Wasatch Heritage Growth Fund are 1.03%. The Net Expenses are 0.95%. The expense ratio shown elsewhere in this report may be different. Net Expenses are based on Fund expenses, net of waivers and reimbursements. See the prospectus for additional information regarding Fund expenses.
Wasatch Funds will deduct a 2.00% redemption proceeds fee on Fund shares held 60 days or less. Performance data does not reflect the deduction of fees or taxes, which if reflected, would reduce the performance quoted. For more complete information including charges, risks and expenses, read the prospectus carefully.
Investing in mid cap funds will be more volatile and loss of principal could be greater than investing in large cap funds. Equity investing involves risks including potential loss of the principal amount invested.
TOP TEN EQUITY HOLDINGS**
| | | | |
| Company | | % of Net
Assets | |
| Cognizant Technology Solutions Corp., Class A | | | 5.1% | |
| IHS, Inc., Class A | | | 4.4% | |
| Amphenol Corp., Class A | | | 4.0% | |
| MSC Industrial Direct Co., Inc., Class A | | | 4.0% | |
| Copart, Inc. | | | 3.7% | |
| | | | |
| Company | | % of Net
Assets | |
| Microchip Technology, Inc. | | | 3.4% | |
| SEI Investments Co. | | | 3.1% | |
| LKQ Corp. | | | 2.8% | |
| Tim Hortons, Inc. (Canada) | | | 2.8% | |
| Covance, Inc. | | | 2.8% | |
| ** | As of March 31, 2013, there were 43 holdings in the Fund. Foreign currency contracts, written options and repurchase agreements, if any, are not included in the number of holdings. Portfolio holdings are subject to change at any time. References to specific securities should not be construed as recommendations by the Funds or their Advisor. Current and future holdings are subject to risk. |
SECTOR BREAKDOWN†
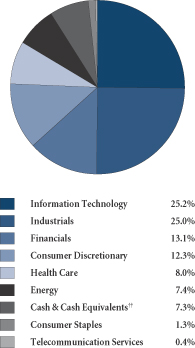
| † | Excludes securities sold short and options written, if any. |
| †† | Also includes Other Assets & Liabilities. |
GROWTHOFA HYPOTHETICAL $10,000 INVESTMENT
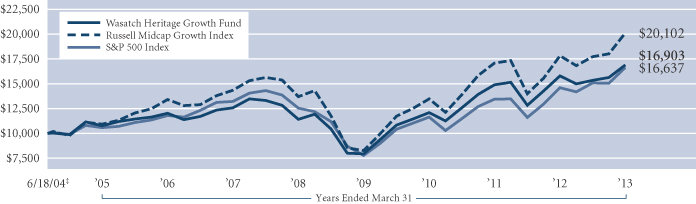
Past performance does not predict future performance and the graph above does not reflect the deduction of taxes you would pay on fund distributions or the redemption of fund shares. Performance shown in the chart above does not include any applicable sales charges and fees. Wasatch does not charge any sales fees. ‡Inception: June 18, 2004. The Russell Midcap Growth Index measures the performance of those Russell Midcap Index companies with higher price-to-book ratios and higher forecasted growth values. The stocks in the Russell Midcap Growth Index are also members of the Russell 1000 Growth Index. The S&P 500 Index represents 500 of the United States’ largest stocks from a broad variety of industries. The index is unmanaged but is a commonly used measure of common stock total return performance. You cannot invest directly in these or any indices.
17
| | |
| WASATCH INTERNATIONAL GROWTH FUND (WAIGX) — Management Discussion | | MARCH 31, 2013 |
|
|
|
The Wasatch International Growth Fund is managed by a team of Wasatch portfolio managers led by Roger Edgley.
| | |
Roger D. Edgley, CFA Portfolio Manager | | OVERVIEW The Wasatch International Growth Fund had quite a strong quarter, in absolute terms and versus its benchmark, the MSCI AC World Ex-U.S.A. Small Cap Index. The Fund was up 10.23% for the quarter while the benchmark was up 6.54%. The Fund performed well across countries and sectors with Japan being a key market — not only for the first quarter but also for the last year. We are pleased that the Fund received the Lipper |
Fund Award for #1 performance for the three-year period ended December 31, 2012 among 111 international small/mid growth funds.* The Fund also continued to show lower risk than the Index we are measured against, which is something we strive to do. Part of this comes from portfolio construction (both sector and country) but also from the types of companies we buy and hold in the portfolio.
DETAILSOFTHE QUARTER
So far, 2013 is turning into a very different year from 2012, in that we have seen strong performance from developed markets year-to-date, especially compared to emerging markets. The MSCI BRIC** (Brazil, Russia, India and China) Index was down 2.98% at the end of the first quarter, with evident economic slowdowns in China, Brazil and India. It is interesting that there are signs of recovery in economies like the U.S., although we are seeing quite soft energy and materials sectors.
For the quarter, the Fund benefited from strong performance in most sectors. We outperformed in the heavily weighted sectors — consumer discretionary, consumer staples, information technology and industrials — except for financials. Our best performing sector was consumer discretionary where we were overweight and outperformed the overall portfolio and the benchmark. The outperformance was driven by names like REA Group Ltd., an Australian company operating a real estate and commercial property advertising Internet portal, United Arrows Ltd., a Japanese retailer of men’s and women’s apparel and accessories, and Yoox S.p.A., an Italian Internet retailer selling clothing, shoes and accessories.
By country, the most notable performer was Japan. Although the Fund’s average weight in Japan for the period was about 11% compared to 17.6% for the benchmark, our companies outperformed, gaining nearly 36% compared to nearly 16% for the Index. We added value in Japan through stock picking. Even though we own very few weak yen beneficiaries, our stocks like MonotaRO Co. Ltd., M3, Inc. and Kakaku.com, Inc. did well, not just in the last quarter but in the last year. The stocks we own in Japan we believe are comparable in quality to their peer group elsewhere in
the world. Japan is a hard environment in which to achieve organic growth, and most, if not all, of the companies are demonstrating this.
Japan has been a challenging market for investors for many years due to its low velocity, deflationary economy. The more recent challenge for corporations in Japan has been the strong currency, which has made it difficult to compete against U.S., Korean and Asian companies in industries ranging from electronics to cars. However, we believe that the best Japanese companies are often world-class with centers of excellence in many areas of industry. We are constructive about Japan and we are pleased with how our process has identified what we believe are companies with growth and quality.
Disappointing country performance came from the United Kingdom, where we underperformed by virtue of two names — Renishaw plc and EMIS Group plc, which we still hold.
OUTLOOK
The Fund continues to be managed in a broad way across its rich universe of companies. Even with slower growth environments in Europe and elsewhere, we believe there are excellent companies to be found that are changing their industries and innovating for the future — whether they are Internet, health care or retail.
We remain constructive on the outlook for the Fund given some signs of recovery in developed markets. We believe Japan will be a key challenge for international investors this year, especially given that it is a large part of the universe. It is the single largest country by market capitalization in the universe we cover. The BRIC markets, as mentioned, can continue to be challenging for policymakers and central banks. For Europe, we will continue to seek what we consider to be high quality companies that are global leaders in their chosen niches.
The international team thanks all the Fund’s shareholders for their support and for the faith they have shown in us. Be assured that we continue to work hard in the challenging and exciting task of finding great small companies around the world.
| * | The Lipper Fund Awards program honors funds that have excelled in delivering consistently strong risk-adjusted performance relative to peers. Lipper designates award-winning funds in most individual classifications for the three-, five- and 10-year periods. Please visit the Awards for Excellence website (http://excellence.thomsonreuters.com/award/lipper) for more details about the Lipper Fund Awards. Lipper Award designations are not intended to constitute investment advice or predict future results, and Lipper does not guarantee the accuracy of this information. In addition to periods of positive returns, the Wasatch International Growth Fund experienced some periods of negative returns during the award time frame. Past performance is not indicative of future results. |
| ** | The MSCI BRIC Index is a free float-adjusted market capitalization weighted index that is designed to measure the equity market performance of the following four emerging market country indices: Brazil, Russia, India and China. |
| | Current and future holdings are subject to risk |
18
| | |
| WASATCH INTERNATIONAL GROWTH FUND (WAIGX) — Portfolio Summary | | MARCH 31, 2013 |
|
|
|
AVERAGE ANNUAL TOTAL RETURNS
| | | | | | | | | | | | | | | | |
| | | SIX MONTHS* | | | 1 YEAR | | | 5 YEARS | | | 10 YEARS | |
International Growth | | | 16.10% | | | | 25.14% | | | | 9.04% | | | | 15.47% | |
MSCI AC World Ex-U.S.A. Small Cap Index | | | 11.76% | | | | 10.48% | | | | 2.54% | | | | 14.27% | |
MSCI World Ex-U.S.A. Small Cap Index | | | 12.43% | | | | 10.87% | | | | 2.05% | | | | 13.15% | |
Data shows past performance, which is not indicative of future performance. Current performance may be lower or higher than the performance quoted. To obtain the most recent month-end performance data available, please visit www.wasatchfunds.com. The Advisor may absorb certain Fund expenses, without which total return would have been lower. Investment returns and principal value will fluctuate and shares, when redeemed, may be worth more or less than their original cost.
As of the January 31, 2013 prospectus, the Total Annual Fund Operating Expenses for the Wasatch International Growth Fund are 1.57%. The expense ratio shown elsewhere in this report may be different. See the prospectus for additional information regarding Fund expenses.
Wasatch Funds will deduct a 2.00% redemption proceeds fee on Fund shares held 60 days or less. Performance data does not reflect the deduction of fees or taxes, which if reflected, would reduce the performance quoted. For more complete information including charges, risks and expenses, read the prospectus carefully.
Investing in foreign securities, especially in emerging markets, entails special risks, such as currency fluctuations and political uncertainties, which are described in more detail in the prospectus. Investing in small cap funds will be more volatile and loss of principal could be greater than investing in large cap or more diversified funds.
TOP 10 EQUITY HOLDINGS**
| | | | |
| Company | | % of Net
Assets | |
| First Pacific Co. Ltd. (Hong Kong) | | | 2.9% | |
| Pigeon Corp. (Japan) | | | 2.6% | |
| Abcam plc (United Kingdom) | | | 2.4% | |
| Cosmos Pharmaceutical Corp. (Japan) | | | 2.4% | |
| Coca-Cola Icecek A.S. (Turkey) | | | 2.3% | |
| | | | |
| Company | | % of Net
Assets | |
| Wirecard AG (Germany) | | | 2.2% | |
| Rotork plc (United Kingdom) | | | 2.1% | |
| REA Group Ltd. (Australia) | | | 2.1% | |
| Sa Sa International Holdings Ltd. (China) | | | 2.0% | |
| NagaCorp Ltd. (Cambodia) | | | 2.0% | |
| ** | As of March 31, 2013, there were 76 holdings in the Fund. Foreign currency contracts, written options and repurchase agreements, if any, are not included in the number of holdings. Portfolio holdings are subject to change at any time. References to specific securities should not be construed as recommendations by the Funds or their Advisor. Current and future holdings are subject to risk. |
SECTOR BREAKDOWN†
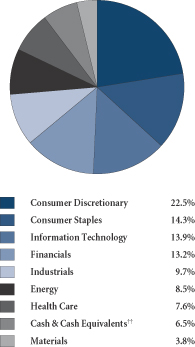
| † | Excludes securities sold short and options written, if any. |
| †† | Also includes Other Assets & Liabilities. |
GROWTHOFA HYPOTHETICAL $10,000 INVESTMENT
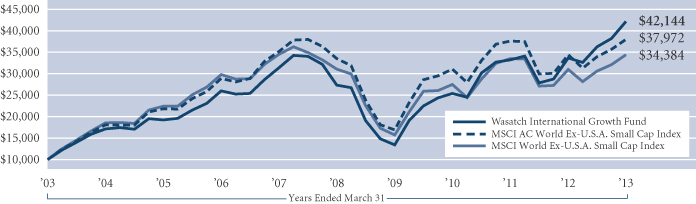
Past performance does not predict future performance and the graph above does not reflect the deduction of taxes you would pay on fund distributions or the redemption of fund shares. Performance shown in the chart above does not include any applicable sales charges and fees. Wasatch does not charge any sales fees. The MSCI All Country (AC) World Ex-U.S.A. Small Cap Index is an unmanaged index and includes reinvestment of all dividends of issuers located in countries throughout the world representing developed and emerging markets, excluding securities of U.S. issuers. This index is a free float-adjusted market capitalization index designed to measure the performance of small capitalization securities. The MSCI World Ex-U.S.A. Small Cap Index is a free float-adjusted market capitalization weighted index designed to measure the equity market performance of developed markets, excluding the United States. You cannot invest directly in these or any indices.
19
| | |
| WASATCH INTERNATIONAL OPPORTUNITIES FUND (WAIOX) — Management Discussion | | MARCH 31, 2013 |
|
|
|
The Wasatch International Opportunities Fund is managed by a team of Wasatch portfolio managers led by Roger Edgley and Laura Geritz.
| | | | |
Roger D. Edgley, CFA Portfolio Manager | |
Laura Geritz, CFA Portfolio Manager | | OVERVIEW The Wasatch International Opportunities Fund gained 11.28% in the quarter and outperformed its benchmark, the MSCI AC World Ex-U.S.A. Small Cap Index, which was up 6.54%. |
Japanese equities rallied as the Bank of Japan renewed its commitment to stamp out deflation through the use of aggressive stimulus. The yen weakened against the U.S. dollar in the first three months of the year, helping to boost the profitability of Japan’s exporters. While the International Opportunities Fund has relatively little exposure to exporters and our exposure to Japan is less significant than that of the benchmark, the Fund’s Japanese holdings returned over 43% in the quarter compared to under 16% for the Japanese stocks in the Index.
DETAILSOFTHE QUARTER
Japan had been one of the only nations not to respond to the threat of global deflation and depression by devaluing its currency, and hence the nation’s industrial powerhouse companies lost market share to countries competing with inexpensive, debased currencies. Enter 2013 and Japan is aggressively buying back bonds and driving down its currency, which will make Japanese exports more competitive. The secular growers we own in Japan aren’t as attractively valued as they were a quarter ago, but we could see growth accelerate, as Japan’s central bank warriors attack the strong currency to gain a competitive edge over their neighbors.
As for stock picking, our consumer staples stocks, which represent approximately 32% of the portfolio compared to about 6% for the benchmark, saw a healthy return in the quarter and comfortably outperformed the benchmark with help from Japanese names like Cosmos Pharmaceutical Corp., Kusuri No Aoki Co. Ltd. and Pigeon Corp.
The materials sector also contributed to the Fund’s outperformance of the Index primarily due to reasonable returns from chemical names like Berger Paints India Ltd. and, more importantly, our underweighting of the poor-performing metals and mining industry.
In the industrials sector, Japanese names like MonotaRO Co. Ltd. and Nihon M&A Center, Inc. aided the Fund’s outperformance along with Southeast Asian stocks Arwana Citramulia, Dynasty Ceramic Public Co. Ltd. and Astra Graphia. Headwinds in the Indonesian coal mining industry pushed down machinery distributor Hexindo Adiperkasa, the worst performing stock in the sector.
Consumer discretionary was the only significant sector where the Fund underperformed the benchmark. A few Indian names like Bata India Ltd. and auto component companies WABCO India Ltd. and Goodyear India Ltd. pressured returns.
Performance of our financial stocks also beat those in the Index, although the Fund’s exposure to financials is just over one-tenth of the benchmark’s 20% weight. It is difficult for us to find what we consider high-quality, long-term micro cap investments in the sector. Although the Fund underperformed the Index in financials due to our significant underweighting, the strong performance of our stocks added to the Fund’s absolute return.
Finally, the Fund’s energy stocks beat those in the benchmark, largely due to the performance of Korean Hankook Shell Oil Co. Ltd. We are less optimistic on the energy sector this year. It is hard for us to find energy names in the micro cap space that fit our quality parameters. In addition, when we reflect on companies in the sector, many are not inexpensive enough yet or they lack strong enough growth to make a convincing case for owning them.
OUTLOOK
Japan is now the bad boy on the developed market block, entering the realm of global currency debasers, and this action has driven a bull market in its stocks. Fortunately, we were already there, snapping up quality companies we viewed as attractively valued. We were not anticipating strong macro drivers, but we had discovered that high-quality secular growers in Japan, ones we would own in any country, had gotten inexpensive. As a result, the Fund outperformed the Index with a smaller weight.
As for international investing and the prospects ahead, the world’s central banks have succeeded in orchestrating low rates that force investors out of their low return bank accounts and into higher-yielding equities. We would expect to underperform in this type of risk-on environment because we strive to own higher-quality companies whose stocks can look unexciting to investors in a momentum driven market. We were worried that the Fund had gotten too aggressive and was rising with the risk-on trade. However, when we dissect the data, it is clear at least in the international world, that quality continues to work. With that in mind, we will continue to turn over new investment ideas from bottom up screening for companies with good balance sheets, cash flow and sustainable growth.
Last quarter, the Wasatch team was in Brazil, Mexico, the Middle East, Japan, Australia, Korea, China, South Africa, Zimbabwe, Zambia, Botswana and Mauritius. We will continue our rigorous travel schedules. In addition, we will focus on country diversification as we strive to mitigate risk and capture growth. We believe we can find high-quality micro cap companies in all regions of the world, but we expect great variability in country returns as the world’s economies diverge. We think it’s still a stock-picker’s environment.
Thank you for your investment.
| Current | and future holdings are subject to risk. |
20
| | |
| WASATCH INTERNATIONAL OPPORTUNITIES FUND (WAIOX) — Portfolio Summary | | MARCH 31, 2013 |
|
|
|
AVERAGE ANNUAL TOTAL RETURNS
| | | | | | | | | | | | | | | | |
| | | SIX MONTHS* | | | 1 YEAR | | | 5 YEARS | | | SINCE INCEPTION
1/27/05 | |
International Opportunities | | | 18.67% | | | | 25.44% | | | | 7.94% | | | | 10.35% | |
MSCI AC World Ex-U.S.A. Small Cap Index | | | 11.76% | | | | 10.48% | | | | 2.54% | | | | 7.38% | |
MSCI World Ex-U.S.A. Small Cap Index | | | 12.43% | | | | 10.87% | | | | 2.05% | | | | 5.75% | |
Data shows past performance, which is not indicative of future performance. Current performance may be lower or higher than the performance quoted. To obtain the most recent month-end performance data available, please visit www.wasatchfunds.com. The Advisor may absorb certain Fund expenses, without which total return would have been lower. Investment returns and principal value will fluctuate and shares, when redeemed, may be worth more or less than their original cost.
As of the January 31, 2013 prospectus, the Total Annual Fund Operating Expenses for the Wasatch International Opportunities Fund are 2.48%. The Net Expenses are 2.25%. The expense ratio shown elsewhere in this report may be different. Net Expenses are based on Fund expenses, net of waivers and reimbursements. See the prospectus for additional information regarding Fund expenses.
Wasatch Funds will deduct a 2.00% redemption proceeds fee on Fund shares held 60 days or less. Performance data does not reflect the deduction of fees or taxes, which if reflected, would reduce the performance quoted. For more complete information including charges, risks and expenses, read the prospectus carefully.
Investing in foreign securities, especially in emerging markets, entails special risks, such as currency fluctuations and political uncertainties, which are described in more detail in the prospectus. Investing in small cap funds will be more volatile and loss of principal could be greater than investing in large cap or more diversified funds.
TOP 10 EQUITY HOLDINGS**
| | | | |
| Company | | % of Net
Assets | |
| Spur Corp. Ltd. (South Africa) | | | 2.6% | |
Pigeon Corp. (Japan) | | | 2.5% | |
Super Group Ltd. (Singapore) | | | 2.2% | |
Pepsi-Cola Products Philippines, Inc. (Philippines) | | | 2.1% | |
Cosmos Pharmaceutical Corp. (Japan) | | | 2.0% | |
| | | | |
| Company | | % of Net
Assets | |
MonotaRO Co. Ltd. (Japan) | | | 2.0% | |
Kusuri No Aoki Co. Ltd. (Japan) | | | 1.9% | |
Famous Brands Ltd. (South Africa) | | | 1.9% | |
RFM Corp. (Philippines) | | | 1.9% | |
| Nihon M&A Center, Inc. (Japan) | | | 1.8% | |
| ** | As of March 31, 2013, there were 89 holdings in the Fund. Foreign currency contracts, written options and repurchase agreements, if any, are not included in the number of holdings. Portfolio holdings are subject to change at any time. References to specific securities should not be construed as recommendations by the Funds or their Advisor. Current and future holdings are subject to risk. |
SECTOR BREAKDOWN†
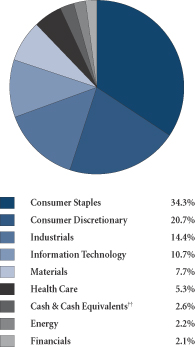
| † | Excludes securities sold short and options written, if any. |
| †† | Also includes Other Assets & Liabilities. |
GROWTHOFA HYPOTHETICAL $10,000 INVESTMENT
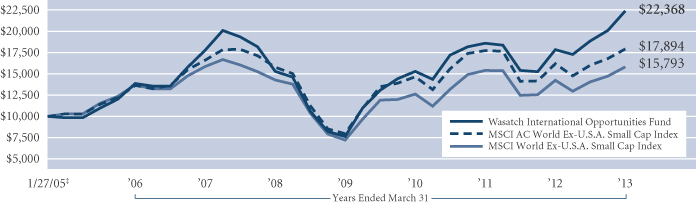
Past performance does not predict future performance and the graph above does not reflect the deduction of taxes you would pay on fund distributions or the redemption of fund shares. Performance shown in the chart above does not include any applicable sales charges and fees. Wasatch does not charge any sales fees. ‡Inception: January 27, 2005. The MSCI All Country (AC) World Ex-U.S.A. Small Cap Index is an unmanaged index and includes reinvestment of all dividends of issuers located in countries throughout the world representing developed and emerging markets, excluding securities of U.S. issuers. This index is a free float-adjusted market capitalization index designed to measure the performance of small capitalization securities. The MSCI World Ex-U.S.A. Small Cap Index is a free float-adjusted market capitalization weighted index designed to measure the equity market performance of developed markets, excluding the United States. You cannot invest directly in these or any indices.
21
| | |
| WASATCH LARGE CAP VALUE FUND (FMIEX / WILCX) — Management Discussion | | MARCH 31, 2013 |
|
|
|
The Wasatch Large Cap Value Fund is managed by a team of Wasatch portfolio managers led by Ralph Shive and Michael Shinnick.
| | | | |

Ralph C. Shive, CFA Portfolio Manager | | 
Michael L. Shinnick Portfolio Manager | | OVERVIEW The Wasatch Large Cap Value Fund — Investor Class returned 10.97% for the first quarter of 2013, and lagged the 12.31% return of the Russell 1000 Value Index. The year got off |
to a strong start, as the Dow Jones Industrial Average and S&P 500 Index made new all-time highs in the first quarter. This was perhaps not surprising in view of record high corporate profits, but was less predictable when viewed against a backdrop of stubbornly high deficits and unemployment. One constant since 2009 has been easy monetary policy. The U.S. Federal Reserve (Fed) reiterated its stance that monetary policy would continue to be “pedal to the metal” until employment recovered. The Bank of Japan has joined the easy money party, providing additional support for global growth expectations. With investors buying in at these levels, we are mindful of the stiff corrections experienced in 2010 and 2011. While earnings and dividends have risen, so have valuations.
In the quarter, our financial and consumer staples holdings bested the benchmark, while poor relative performance in information technology hurt results versus the Russell 1000 Value Index. Our cash position, which rose slightly as we sold some stocks into strength, also constrained returns.
DETAILSOFTHE QUARTER
The best news during the quarter came in the form of two takeovers. We had only just purchased PC firm Dell, Inc. in the fourth quarter of 2012, when the founder decided to take his company private. We sold half of the position on the announcement and the rest as other bids pushed the stock higher. In addition, Berkshire Hathaway* made an offer for food and beverage company HJ Heinz Co. at 11 times EBITA (earnings before interest, taxes and amortization — a measure of the efficiency with which a company generates earnings). Warren Buffett rarely pays over seven times EBITA, so we did not hesitate to sell the entire position.
The stock price of pharmaceutical chain Walgreen Co. rose nearly 30% on positive business metrics. We were a buyer of the stock on price weakness in 2011 and 2012 when the company had been controversial due to a disagreement with a large client, weakening sales, and a questionable strategic investment, all of which implied a potentially broken business model.
Anadarko Petroleum Corp. is a long-time holding with what we consider to be an excellent energy asset base. The stock has had a bumpy ride in the aftermath of the 2010 oil spill in the Gulf of Mexico and unrelated environmental
claims it inherited as part of an acquisition. However, Anadarko’s stock made it back to an all-time high in the quarter, reflecting our belief that, in the long run, fundamentals drive stock prices and patience pays off.
Apple, Inc. was among our biggest laggards. The stock of the consumer electronics icon has become controversial, but we think it has remained relatively inexpensive. Growth expectations, while still impressive, have diminished, and there were plenty of profits to be taken by long-term stockholders. We think Apple’s cash flow and dividends will grow and that the stock’s price could potentially move higher within the next several quarters. Another significant detractor was Barrick Gold Corp. Barrick suffered as gold prices softened and from operational issues that management asserts they are addressing.
We eliminated retailer Best Buy Co., Inc. and Transocean Ltd., a provider of offshore contract drilling services for oil and gas wells. We also sold engineering construction firm Fluor Corp. and online market eBay, Inc. We took two new positions — Kraft Foods Group, Inc., as a replacement for Heinz, and Freeport-McMoRan Copper & Gold, Inc., as we think prices for copper could stabilize based on demand from China and the nascent housing recovery in the U.S.
OUTLOOK
Not only were stock prices strong in the first quarter, but also real estate appears to have turned the corner as well, which may provide a boost to the American psyche. While we are not experts in fixed income, yields from Treasuries to junk bonds are exceedingly low, which helps make dividend-paying stocks more attractive. It is a stated goal of the Fed to drive interest rates lower, which pushes investors into higher-risk securities, helping the stock market. There seemed to be less drama coming out of Washington, D.C. over the past three months, although there still has been no substantial action to resolve the country’s longer-term structural issues.
We saw in the quarter at least two reminders that the Great Financial Crisis is not completely in our rear view mirrors. In Detroit, a financial manager was appointed by Michigan’s governor to forestall the city’s bankruptcy. Overseas, Cyprus bank deposits were taken from depositors to help recapitalize the banking sector.
As 2013 progresses, we continue to expect slow growth and the potential for broadly acceptable total returns for stocks. We thank you for your continued confidence and investment with us.
| * | As of March 31, 2013, the Wasatch Large Cap Value Fund was not invested in Berkshire Hathaway Inc. |
| | Current and future holdings are subject to risk. |
22
| | |
| WASATCH LARGE CAP VALUE FUND (FMIEX / WILCX) — Portfolio Summary | | MARCH 31, 2013 |
|
|
|
AVERAGE ANNUAL TOTAL RETURNS
| | | | | | | | |
| | | SIX MONTHS* | | 1 YEAR | | 5 YEARS | | 10 YEARS |
Large Cap Value (FMIEX) — Investor | | 11.78% | | 12.16% | | 3.48% | | 10.43% |
Large Cap Value (WILCX) — Institutional | | 11.77% | | 12.22% | | 3.49% | | 10.44% |
Russell 1000® Value Index | | 14.02% | | 18.77% | | 4.85% | | 9.18% |
Data shows past performance, which is not indicative of future performance. Current performance may be lower or higher than the performance quoted. To obtain the most recent month-end performance data available, please visit www.wasatchfunds.com. The Advisor may absorb certain Fund expenses, without which total return would have been lower. Investment returns and principal value will fluctuate and shares, when redeemed, may be worth more or less than their original cost.
As of the January 31, 2013 prospectus, the Total Annual Fund Operating Expenses for the Wasatch Large Cap Value Fund are Investor Class — Gross: 1.15%, Net: 1.10% / Institutional Class — Gross: 1.31%, Net: 0.98%. The expense ratio shown elsewhere in this report may be different. Net Expenses are based on Fund expenses, net of waivers and reimbursements. See the prospectus for additional information regarding Fund expenses.
Wasatch Funds will deduct a 2.00% redemption proceeds fee on Fund shares held 60 days or less. Performance data does not reflect the deduction of fees or taxes, which if reflected, would reduce the performance quoted. For more complete information including charges, risks and expenses, read the prospectus carefully.
Performance for the Institutional Class prior to 1/31/2012 is based on the performance of the Investor Class. Performance of the Fund’s Institutional Class prior to 1/31/2012 uses the actual expenses of the Fund’s Investor Class without any adjustments. For any such period of time, the performance of the Fund’s Institutional Class would have been substantially similar to, yet higher than, the performance of the Fund’s Investor Class, because the shares of both classes are invested in the same portfolio of securities, but the classes bear different expenses.
Investments in value stocks can perform differently from the market as a whole and other types of stocks and can continue to be undervalued by the market for long periods of time. Loss of principal is a risk of investing.
TOP 10 EQUITY HOLDINGS**
| | | | |
| Company | | % of Net
Assets | |
| Travelers Cos., Inc. (The) | | | 2.3% | |
| JPMorgan Chase & Co. | | | 2.2% | |
| Microsoft Corp. | | | 2.1% | |
| Intel Corp. | | | 2.0% | |
| Allstate Corp. (The) | | | 2.0% | |
| | | | |
| Company | | % of Net
Assets | |
| PNC Financial Services Group, Inc. | | | 2.0% | |
| C.R. Bard, Inc. | | | 2.0% | |
| Loews Corp. | | | 2.0% | |
| Marathon Oil Corp. | | | 2.0% | |
| Spectra Energy Corp. | | | 1.9% | |
| ** | As of March 31, 2013, there were 64 holdings in the Fund. Foreign currency contracts, written options and repurchase agreements, if any, are not included in the number of holdings. Portfolio holdings are subject to change at any time. References to specific securities should not be construed as recommendations by the Funds or their Advisor. Current and future holdings are subject to risk. |
SECTOR BREAKDOWN†
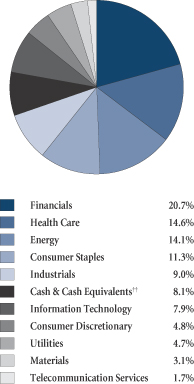
| † | Excludes securities sold short and options written, if any. |
| †† | Also includes Other Assets & Liabilities. |
GROWTHOFA HYPOTHETICAL $10,000 INVESTMENT
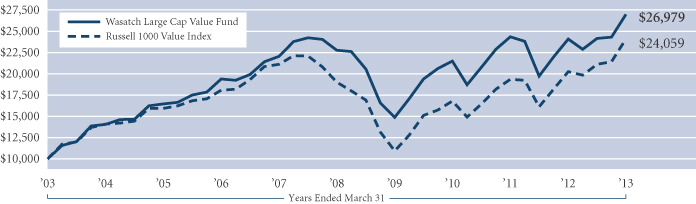
Past performance does not predict future performance and the graph above does not reflect the deduction of taxes you would pay on fund distributions or the redemption of fund shares. Performance shown in the chart above does not include any applicable sales charges and fees. Wasatch does not charge any sales fees. The Russell 1000 Value Index measures the performance of Russell 1000 Index companies with lower price-to-book ratios and lower forecasted growth values. You cannot invest directly in these or any indices.
23
| | |
| WASATCH LONG/SHORT FUND (FMLSX/WILSX) — Management Discussion | | MARCH 31, 2013 |
|
|
|
The Wasatch Long/Short Fund is managed by a team of Wasatch portfolio managers led by Michael Shinnick and Ralph Shive.
| | | | |
Michael L. Shinnick Portfolio Manager | |
Ralph C. Shive, CFA Portfolio Manager | | OVERVIEW We were pleased with performance in the first quarter, as the Fund provided a strong positive return in a rallying market while carrying a net long exposure of approximately 70%. In particular, |
we had good stock selection within the energy, financials and information technology groups. Importantly, our long positions in aggregate rose more than the S&P 500, while our short positions rose less than the market.
The market strength was spurred by relief as the threatened “fiscal cliff” was averted at the end of 2012, and was supported through the quarter by investors increasingly looking to equity markets given the low expected returns going forward from cash and fixed-income vehicles.
DETAILSOFTHE QUARTER
We had excellent performance in the long portion of the portfolio. The energy services space continued its recent strength with Patterson-UTI Energy, Inc. and Halliburton Co. contributing significantly to the Fund’s return. Denbury Resources, Inc., the Fund’s largest position, performed steadily as investors recognized the tremendous value in the company’s focused EOR (enhanced oil recovery) assets, improved balance sheet and attention to compounding shareholder value. Following debt refinancing and tri-party asset exchanges, Denbury is operating on a positive cash flow basis, and the market has rewarded the stock.
A number of strong individual stock selections added to performance in the quarter, including computing solutions company Silicon Graphics International Corp., insurer Unum Group, cosmetics giant Avon Products, Inc. and advertising firm The Interpublic Group of Cos., Inc. Silicon Graphics showed substantial evidence of the new management team’s operational focus, and the market reacted positively to the results as well as to a much better-than-expected operating outlook for 2013. This has been a challenging position over the past year and our patience and tenacity in taking an activist approach are beginning to bear fruit.
Our information technology sector exposure also had strong returns, driven in part by a pair of takeovers. Our thesis on PC firm Dell, Inc. was rewarded quickly as the company’s net cash balance sheet and low valuation provided a strong foundation for a leveraged buyout offer from its founder. Communications equipment provider Acme Packet, Inc. benefited from a bid for its unique technology, and we exited the last of our position through a covered call option.
On the short side, while we experienced small losses on a number of positions, our disciplined approach to maintaining low gross exposure worked to limit the impact of such a significantly positive equity market. We continue to focus our short efforts on covered calls as they provide a more direct hedge on some of our larger and more volatile long holdings.
The newest addition to our top 10 holdings is consumer electronics icon Apple, Inc. We purchased Apple after it declined on earnings announcements perceived as negative, and we believe our cost basis for the stock is very attractive. Our position is quite large for a starter position, but the stock’s valuation caused us to move aggressively, while at the same time we established a very meaningful covered call position as a hedge.
Finally, we added to the portfolio a pair of relatively small exploration and production companies with what we believe are underappreciated natural gas assets — Bill Barrett Corp. and Swift Energy Co. Bill Barrett is shaping up to be a unique turnaround story with the departure in the quarter of both the company’s CEO and head of exploration. At present the Chief Operating Officer is acting as CEO and he has demonstrated a sincere commitment to more disciplined operating efforts focused on shareholder return going forward.
OUTLOOK
We continue to believe that the majority of the stocks we own offer meaningful upside potential. Equity markets have experienced renewed interest from investors seeking both returns and stores of value in a world that is increasingly questioning the value of cash and the risk of holding fixed-income instruments given very, very low rates by historical standards. We are mindful of the increased risk to the macro economy posed by government actions or lack thereof with respect to the ongoing budget imbalances and entitlement obligations. While we will be watching closely for signs of any abrupt change of direction, we would expect incremental progress in these areas as opposed to going off some sort of cliff or attaining a “grand bargain.”
On the short side, we continue to see overvalued pockets in the market. We are once again looking toward the consumer discretionary area at companies that we believe have high valuations and semi-luxury brands, such as jeweler Tiffany & Co. and clothier Michael Kors Holdings Ltd.
As always, we will continue to strive to be responsible stewards of your capital by providing significant exposure to the market’s potential progress. In addition, we will strive to minimize risk in weaker market environments.
Thank you for your continued investment in the Fund.
| Current | and future holdings are subject to risk |
24
| | |
| WASATCH LONG/SHORT FUND (FMLSX/WILSX) — Portfolio Summary | | MARCH 31, 2013 |
|
|
|
AVERAGE ANNUAL TOTAL RETURNS
| | | | | | | | | | | | | | | | |
| | | SIX MONTHS* | | | 1 YEAR | | | 5 YEARS | | | SINCE INCEPTION
8/1/03 | |
Long/Short (FMLSX) — Investor | | | 11.62% | | | | 11.29% | | | | 6.83% | | | | 6.81% | |
Long/Short (WILSX) — Institutional | | | 11.62% | | | | 11.29% | | | | 6.83% | | | | 6.81% | |
S&P 500 Index | | | 10.19% | | | | 13.96% | | | | 5.81% | | | | 7.05% | |
Citigroup U.S. Domestic 3-Month Treasury Bills Index | | | 0.04% | | | | 0.08% | | | | 0.31% | | | | 1.68% | |
Data shows past performance, which is not indicative of future performance. Current performance may be lower or higher than the performance quoted. To obtain the most recent month-end performance data available, please visit www.wasatchfunds.com. The Advisor may absorb certain Fund expenses, without which total return would have been lower. Investment returns and principal value will fluctuate and shares, when redeemed, may be worth more or less than their original cost.
As of the January 31, 2013 prospectus, the Total Annual Fund Operating Expenses for the Wasatch Long/Short Fund — Investor Class: 1.51% / Institutional Class: 1.44%, Net: 1.41%. The expense ratio shown elsewhere in this report may be different. Net Expenses are based on Fund expenses, net of waivers and reimbursements. Expenses include dividend expense on short sales and interest expense. See the prospectus for additional information regarding Fund expenses.
Wasatch Funds will deduct a 2.00% redemption proceeds fee on Fund shares held 60 days or less. Performance data does not reflect the deduction of fees or taxes, which if reflected, would reduce the performance quoted. For more complete information including charges, risks and expenses, read the prospectus carefully.
The Institutional Class is new and does not have any performance history prior to 12/13/2012. Performance for the Institutional Class prior to 12/13/2012 is based on the performance of the Investor Class. Performance of the Fund’s Institutional Class prior to 12/13/2012 uses the actual expenses of the Fund’s Investor Class without any adjustments. For any such period of time, the performance of the Fund’s Institutional Class would have been substantially similar to, yet higher than, the performance of the Fund’s Investor Class, because the shares of both classes are invested in the same portfolio of securities, but the classes bear different expenses.
The Fund makes short sales of securities which involve the risk that losses may exceed the original amount invested. Equity investing involves risks, including potential loss of the principal amount invested. Being non-diversified, the Fund can invest a larger portion of its assets in the securities of a limited number of companies than a diversified fund. Non-diversification increases the risk of loss to the Fund if the values of these securities decline.
TOP 10 EQUITY HOLDINGS**
| | | | |
| Company | | % of Net
Assets | |
| Denbury Resources, Inc. | | | 4.9% | |
| Apple, Inc. | | | 4.6% | |
| Loews Corp. | | | 3.5% | |
| Mosaic Co. (The) | | | 3.2% | |
| Patterson-UTI Energy, Inc. | | | 2.8% | |
| | | | |
| Company | | % of Net
Assets | |
| General Motors Co. | | | 2.6% | |
| Unum Group | | | 2.4% | |
| Cisco Systems, Inc. | | | 2.3% | |
| Halliburton Co. | | | 2.2% | |
| Interpublic Group of Cos., Inc. (The) | | | 2.2% | |
| ** | As of March 31, 2013, there were 53 long and 11 short holdings in the Fund. Foreign currency contracts, written options and repurchase agreements, if any, are not included in the number of holdings. Portfolio holdings are subject to change at any time. References to specific securities should not be construed as recommendations by the Funds or their Advisor. Current and future holdings are subject to risk. |
SECTOR BREAKDOWN†
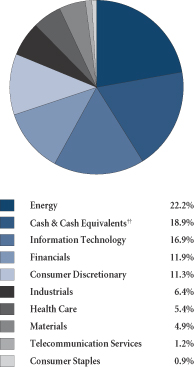
| † | Excludes securities sold short and options written, if any. |
| †† | Also includes Other Assets & Liabilities. |
GROWTHOFA HYPOTHETICAL $10,000 INVESTMENT
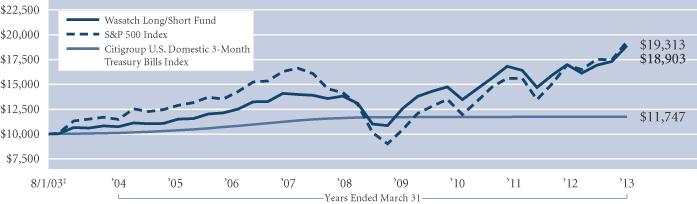
Past performance does not predict future performance and the graph above does not reflect the deduction of taxes you would pay on fund distributions or the redemption of fund shares. Performance shown in the chart above does not include any applicable sales charges and fees. Wasatch does not charge any sales fees. ‡Inception: August 1, 2003. The S&P 500 Index includes 500 of the United States’ largest stocks from a broad variety of industries. The Index is unmanaged but is a commonly used measure of common stock total return performance. The Citigroup U.S. Domestic 3-Month Treasury Bills Index tracks the performance of U.S. Treasury bills with a remaining maturity of three months. U.S. Treasury bills, which are short-term loans to the U.S. government, are full-faith-and-credit obligations of the U.S. Treasury and are generally regarded as being free of any risk of default. You cannot invest directly in these or any indices.
25
| | |
| WASATCH MICRO CAP FUND (WMICX) — Management Discussion | | MARCH 31, 2013 |
|
|
|
The Wasatch Micro Cap Fund is managed by a team of Wasatch portfolio managers led by Daniel Chace.
| | |

Daniel Chace, CFA Portfolio Manager | | OVERVIEW The Wasatch Micro Cap Fund gained 11.13% in the first quarter. The Russell Microcap Index (the Fund’s primary benchmark) and the Russell 2000 Index rose 12.58% and 12.39%, respectively. Looking across our holdings, the key driver of individual stock price performance was business momentum — investors seemed to be keenly focused on momentum while paying less attention to valuations. |
A significant number of our stocks were up 25% or more, and the common thread among them was accelerating sales growth, better-than-expected earnings, favorable guidance or a combination of these factors. Alternatively, we had some detractors whose operating results or guidance fell short of expectations. So, it was a relatively straightforward quarter in that good news generally drove the winners and bad news caused stocks to lag.
On a weighted-average basis, our companies reported low-teens earnings growth in the most recent reporting season. This growth rate was below our long-run target; however, it was in line with our expectations and better than the growth rate for the small cap market as a whole.* Our models suggest that the earnings growth in the Fund will potentially accelerate to the high-teens in the next reporting period.
DETAILSOFTHE QUARTER
Two of the quarter’s best-performing stocks came from the information technology sector — SciQuest, Inc. and Power Integrations, Inc. SciQuest provides an online software platform for companies to buy goods like office supplies and computers that are not part of the final products they sell. We purchased the stock in September 2010 on the initial public offering. After we bought it, SciQuest showed only moderate growth, and our analysis focused on the company’s ability to accelerate its growth rate. Through a series of acquisitions, the company has expanded its product line, making the platform more attractive to more customers. The expanded platform is gaining traction, and SciQuest’s organic growth rate is accelerating from the mid-teens toward 20%.
Power Integrations designs semiconductors that reduce energy consumption in a variety of electronic products, including cellphone chargers, LED lighting, industrial motors and personal computers. The company has struggled to grow over the past couple of years as its share of the cellphone charger market has eroded. We have patiently held onto our position, mainly because we have confidence in the management team’s ability to reinvigorate strong growth. The stock surged this quarter after fourth-quarter operating results showed that Power Integrations is starting to regain share in the cellphone charger market. The industrial and computing businesses are also doing well.
Angie’s List, Inc. was another stock that had an exceptionally strong quarter. The company operates a website that allows members to research and rate local service providers, such as auto mechanics and plumbers. In February, Angie’s List reported its first-ever quarterly profit, fueled by strong new member sales and lower acquisition costs per member. It is unlikely that the company will report a profit in the first quarter of this year given the seasonality in the business. Nonetheless, we believe the path to sustainable profitability is clear for Angie’s List. Mature markets, such as Indianapolis and Boston, are not only earning money but also generating good margins as membership fees and advertising rates rise and acquisition costs decline. So as the company finishes building out its footprint and newer markets gain critical mass, the high degree of operating leverage in the business should take hold.
Gordmans Stores, Inc., a big-box discount retailer, was our biggest detractor this quarter. The weakness in same-store sales that we discussed in our last report has persisted, and we do not foresee any short-term improvement. The consumer environment remains challenging, but sales have also been impacted by some merchandising missteps. We trimmed our position in recognition that earnings are likely to remain weak in the short term, but we still see long-term potential in Gordmans. The company appears to be making the right investments to drive improvement. For example, it recently appointed a new Chief Merchandising Officer and has implemented systems to better manage inventory and markdowns and to monitor store traffic. However, these initiatives will take time before they yield stronger same-store sales figures.
OUTLOOK
With the exception of housing, it is hard for us to be overly enthusiastic about the outlook for the U.S. economy. The unemployment rate has fallen, but one reason for the decline is that discouraged job seekers are dropping out of the labor force. The January 1 payroll tax increase has taken a bite out of consumers’ paychecks, and uncertainty about government spending and regulation may undermine business confidence. Meanwhile, the Federal Reserve continues to try to jump-start growth with quantitative easing and record-low interest rates — policies that seem to be benefiting asset prices more than the economy. In this challenging environment, we remain focused on investing in what we believe are high-quality micro cap companies that can grow despite the macro headwinds — companies with innovative products and services, unique business models and excellent management.
Thank you for the opportunity to manage your assets.
| * | The fourth-quarter earnings growth rate for the broad small cap market was 9.3% according to Bank of America-Merrill Lynch in a report dated March 12, 2013. |
| | Current and future holdings are subject to risk. |
26
| | |
| WASATCH MICRO CAP FUND (WMICX) — Portfolio Summary | | MARCH 31, 2013 |
|
|
|
AVERAGE ANNUAL TOTAL RETURNS
| | | | | | | | | | | | | | | | |
| | | SIX MONTHS* | | | 1 YEAR | | | 5 YEARS | | | 10 YEARS | |
Micro Cap | | | 8.41% | | | | 9.17% | | | | 5.78% | | | | 10.00% | |
Russell Microcap® Index | | | 12.63% | | | | 16.93% | | | | 6.68% | | | | 9.99% | |
Data shows past performance, which is not indicative of future performance. Current performance may be lower or higher than the performance quoted. To obtain the most recent month-end performance data available, please visit www.wasatchfunds.com. The Advisor may absorb certain Fund expenses, without which total return would have been lower. Investment returns and principal value will fluctuate and shares, when redeemed, may be worth more or less than their original cost.
As of the January 31, 2013 prospectus, the Total Annual Fund Operating Expenses for the Wasatch Micro Cap Fund are 2.14%. The expense ratio shown elsewhere in this report may be different. See the prospectus for additional information regarding Fund expenses.
Wasatch Funds will deduct a 2.00% redemption proceeds fee on Fund shares held 60 days or less. Performance data does not reflect the deduction of fees or taxes, which if reflected, would reduce the performance quoted. For more complete information including charges, risks and expenses, read the prospectus carefully.
Investing in micro cap funds will be more volatile and loss of principal could be greater than investing in large cap or more diversified funds. Investing in foreign securities, especially in emerging markets, entails special risks, such as currency fluctuations and political uncertainties, which are described in more detail in the prospectus.
TOP 10 EQUITY HOLDINGS**
| | | | |
| Company | | % of Net
Assets | |
| Power Integrations, Inc. | | | 2.7% | |
| Envestnet, Inc. | | | 2.4% | |
| DealerTrack Technologies, Inc. | | | 2.2% | |
| Ultimate Software Group, Inc. | | | 2.2% | |
| ICON plc ADR (Ireland) | | | 2.1% | |
| | | | |
| Company | | % of Net
Assets | |
| InnerWorkings, Inc. | | | 2.1% | |
| CAI International, Inc. | | | 2.1% | |
| SciQuest, Inc. | | | 2.0% | |
| Ensign Group, Inc. (The) | | | 2.0% | |
| Interactive Intelligence Group, Inc. | | | 1.9% | |
| ** | As of March 31, 2013, there were 91 holdings in the Fund. Foreign currency contracts, written options and repurchase agreements, if any, are not included in the number of holdings. Portfolio holdings are subject to change at any time. References to specific securities should not be construed as recommendations by the Funds or their Advisor. Current and future holdings are subject to risk. |
SECTOR BREAKDOWN†

| † | Excludes securities sold short and options written, if any. |
| †† | Also includes Other Assets & Liabilities. |
GROWTHOFA HYPOTHETICAL $10,000 INVESTMENT
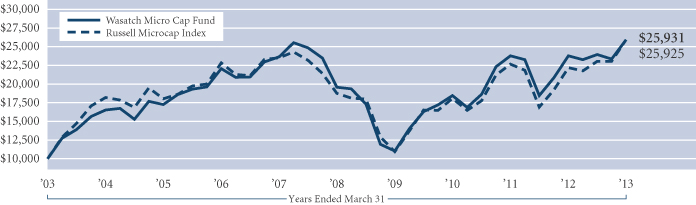
Past performance does not predict future performance and the graph above does not reflect the deduction of taxes you would pay on fund distributions or the redemption of fund shares. Performance shown in the chart above does not include any applicable sales charges and fees. Wasatch does not charge any sales fees. The Russell Microcap Index measures the performance of the micro cap segment of the U.S. equity market. Micro cap stocks make up less than 3% of the U.S. equity market (by market capitalization) and consist of the smallest 1,000 securities in the small cap Russell 2000 Index, plus the next smallest eligible securities by market cap. You cannot invest directly in this or any index.
27
| | |
| WASATCH MICRO CAP VALUE FUND (WAMVX) — Management Discussion | | MARCH 31, 2013 |
|
|
|
The Wasatch Micro Cap Value Fund is managed by a team of Wasatch portfolio managers led by Brian Bythrow.
| | |

Brian Bythrow, CFA Portfolio Manager | | OVERVIEW In the first quarter, the Wasatch Micro Cap Value Fund gained 12.78% and outperformed the Russell Microcap Index, which returned 12.58%. Upbeat news on the U.S. economy lifted stocks, as inflation remained low and the Federal Reserve gave no indication that tighter monetary policy was imminent. Micro cap stocks did especially well for the quarter, which usually tends to |
be the case in aggressive market environments such as was observed during the first three months of the year. Not surprisingly, economically sensitive areas of the micro cap market — including transportation, financial and consumer-discretionary stocks — performed best, while consumer staples lagged. More of a surprise was that information technology stocks also lagged, as growth in that sector appears to have slowed at least for the time being.
One area of the U.S. micro cap market in which we are finding attractively valued opportunities is the financials sector. The Fund owns a number of specialty-finance companies and small banks, which while not growing rapidly, represent potential value to be unlocked given a suitable catalyst.
In contrast with Europe especially, the U.S. continues to be a bright spot among the world’s developed markets. Economic data has been coming in better than expected and has underpinned the market’s positive tone during the past two quarters. On balance, the Fund’s domestic investments slightly outperformed its foreign holdings for the quarter. We have no particular view on how much longer the U.S. will continue to outperform, and we are maintaining our discipline by holding approximately 29% of the Fund’s assets in foreign companies as of quarter-end.
DETAILSOFTHE QUARTER
Two of our biggest contributors for the quarter were Caesarstone Sdot-Yam Ltd. and NorthStar Realty Finance Corp. Caesarstone, based in Israel, is a world leader in engineered quartz slabs for kitchen countertops and other interior surfaces. The company’s products are used primarily in the renovation and remodeling markets, where they are displacing granite as the surface of choice for high-end applications. After having had success in Australia, Israel, Europe and Canada, Caesarstone in 2011 began a major push into the U.S. market, which already accounts for 40% of the company’s sales. The company is benefiting from increased turnover in the U.S. housing market, and we expect Caesarstone’s products to continue taking share from other countertop options.
NorthStar is a real-estate investment trust (REIT) that operates as a commercial real estate investment and asset-management company. It originates and acquires real-estate related debt, including distressed debt purchased at a
substantial discount to the amount owed. NorthStar is benefiting from recovery in the real-estate market. Its investment portfolio has been appreciating, and the company continues to find profitable opportunities to deploy capital.
BofI Holding, Inc., the holding company for BofI Federal Bank, was another of our top contributors. The company provides Internet banking for customers in the U.S, as well as solutions that enable customers to electronically send and receive money and deposit checks. BofI specializes in jumbo and jumbo-non-conforming loans and is benefiting from improvement in the housing market and a pickup in mortgage originations. The efficiency of Internet banking is clearly a plus for BofI and its customers, and we think the company is well-situated for future growth.
Mutual-fund sponsor Virtus Investment Partners, Inc. was our best contributor for the fourth quarter of 2012 and near the top again for the first quarter of 2013. The company continues to attract investors with its distinctive, niche-type mutual funds.
Norwegian company Electromagnetic Geoservices was our biggest detractor. The company uses proprietary electromagnetic technology to provide worldwide support to oil and gas companies in their search for offshore hydrocarbons. Electromagnetic Geoservices has had a lull in its business, as a lack of contract visibility has caused investors to question whether its technology is viable. We recently reevaluated the company, and sold the Fund’s entire position (which was relatively small) subsequent to quarter-end.
Solta Medical, Inc. was another big detractor for the quarter. The company sells energy-based medical-device systems for aesthetic applications primarily in North America, the Asia Pacific, Europe and the Middle East. Its stock appears to have fallen out of favor despite a stronger U.S. economy, which typically would be expected to increase demand for aesthetic procedures and boost sales of the company’s products.
OUTLOOK
Despite somewhat stronger domestic economic data, the current U.S. recovery has been choppy and unusually slow. Even so, our portfolio companies do not require strong economic growth in order to execute and grow profitably. Generally, we think our companies can perform well in a sluggish economy in which annual GDP growth muddles along in the 1% to 3% range.
On the foreign front, we continue to work with the Wasatch International Team to seek undiscovered micro-cap companies with little or no analyst coverage. While the U.S. market tends to be better covered, small and unique companies with attractive valuations and strong growth potential are more commonly found in foreign markets. In fact, value companies that also have strong growth characteristics typically are the only investment opportunities we look at overseas — where currency risk and other factors unique to foreign investing make value turnarounds less appealing.
Thank you for the opportunity to manage your assets and for your trust.
| Current | and future holdings are subject to risk. |
28
| | |
| WASATCH MICRO CAP VALUE FUND (WAMVX) — Portfolio Summary | | MARCH 31, 2013 |
|
|
|
AVERAGE ANNUAL TOTAL RETURNS
| | | | | | | | | | | | | | | | |
| | | SIX MONTHS* | | | 1 YEAR | | | 5 YEARS | | | SINCE INCEPTION
7/28/03 | |
Micro Cap Value | | | 16.45% | | | | 20.68% | | | | 9.16% | | | | 11.75% | |
Russell Microcap® Index | | | 12.63% | | | | 16.93% | | | | 6.68% | | | | 6.88% | |
Data shows past performance, which is not indicative of future performance. Current performance may be lower or higher than the performance quoted. To obtain the most recent month-end performance data available, please visit www.wasatchfunds.com. The Advisor may absorb certain Fund expenses, without which total return would have been lower. Investment returns and principal value will fluctuate and shares, when redeemed, may be worth more or less than their original cost.
As of the January 31, 2013 prospectus, the Total Annual Fund Operating Expenses for the Wasatch Micro Cap Value Fund are 2.32%. The Net Expenses are 2.26%. The expense ratio shown elsewhere in this report may be different. Expenses include direct expenses paid to the Advisor as well as indirect expenses incurred by the Fund as a result of its investments in other investment companies (each an “Acquired Fund”), before any expense reimbursements by the Advisor. Net Expenses are based on Fund expenses, net of waivers and reimbursements. See the prospectus for additional information regarding Fund expenses.
Wasatch Funds will deduct a 2.00% redemption proceeds fee on Fund shares held 60 days or less. Performance data does not reflect the deduction of fees or taxes, which if reflected, would reduce the performance quoted. For more complete information including charges, risks and expenses, read the prospectus carefully.
Investing in micro cap funds will be more volatile and loss of principal could be greater than investing in large cap or more diversified funds. Investing in foreign securities, especially in emerging markets, entails special risks, such as currency fluctuations and political uncertainties, which are described in more detail in the prospectus.
TOP 10 EQUITY HOLDINGS**
| | | | |
| Company | | % of Net
Assets | |
| NorthStar Realty Finance Corp. | | | 2.3% | |
| BofI Holding, Inc. | | | 2.2% | |
| Colony Financial, Inc. | | | 2.0% | |
| Caesarstone Sdot-Yam Ltd. (Israel) | | | 2.0% | |
| Arbor Realty Trust, Inc. | | | 2.0% | |
| | | | |
| Company | | % of Net
Assets | |
| Interactive Intelligence Group, Inc. | | | 1.8% | |
| CAI International, Inc. | | | 1.7% | |
| DXP Enterprises, Inc. | | | 1.6% | |
| NagaCorp Ltd. (Cambodia) | | | 1.6% | |
| Encore Capital Group, Inc. | | | 1.5% | |
| ** | As of March 31, 2013, there were 103 holdings in the Fund. Foreign currency contracts, written options and repurchase agreements, if any, are not included in the number of holdings. Portfolio holdings are subject to change at any time. References to specific securities should not be construed as recommendations by the Funds or their Advisor. Current and future holdings are subject to risk. |
SECTOR BREAKDOWN†
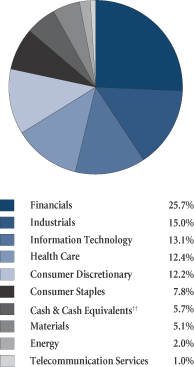
| † | Excludes securities sold short and options written, if any. |
| †† | Also includes Other Assets & Liabilities. |
GROWTHOFA HYPOTHETICAL $10,000 INVESTMENT
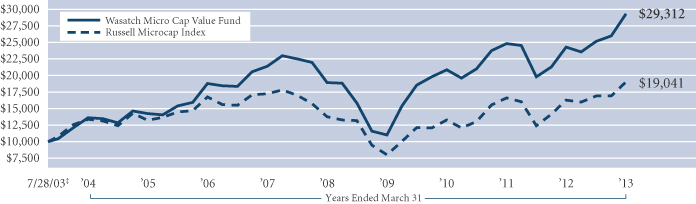
Past performance does not predict future performance and the graph above does not reflect the deduction of taxes you would pay on fund distributions or the redemption of fund shares. Performance shown in the chart above does not include any applicable sales charges and fees. Wasatch does not charge any sales fees. ‡Inception: July 28, 2003. The Russell Microcap Index measures the performance of the micro cap segment of the U.S. equity market. Micro cap stocks make up less than 3% of the U.S. equity market (by market capitalization) and consist of the smallest 1,000 securities in the small cap Russell 2000 Index, plus the next smallest eligible securities by market cap. You cannot invest directly in this or any index.
29
| | |
| WASATCH SMALL CAP GROWTH FUND (WAAEX) — Management Discussion | | MARCH 31, 2013 |
|
|
|
The Wasatch Small Cap Growth Fund is managed by a team of Wasatch portfolio managers led by Jeff Cardon and JB Taylor.
| | | | |

Jeff Cardon, CFA Portfolio Manager | |
JB Taylor Portfolio Manager | | OVERVIEW The Wasatch Small Cap Growth Fund gained 9.11% in what was another strong quarter for the U.S. equity market. Stocks rallied throughout the quarter on signs of a firming economy and a |
continued outlook for low interest rates. The Russell 2000 Growth Index gained 13.21% and the Russell 2000 Index rose 12.39%.
The Fund lagged the small cap benchmarks in a market led by more speculative stocks. Though our stocks participated and generally performed well, we were not as richly rewarded as investors who took more risk. This is a natural consequence of our investment style, which focuses on what we believe are high quality companies with solid business models and consistent earnings growth. During periods of elevated risk taking, such as was observed in the first quarter, the types of stocks we favor tend to underperform because investors seek to move up the risk spectrum in search of higher returns.
Outperformance of higher risk companies is normally observed coming off a market bottom when investors perceive an upturn in economic activity. That this paradigm has materialized so late in the current market cycle is quite unusual. The higher quality stocks we favor outperformed from the March 2009 bottom until midyear 2012, a period that would typically favor riskier stocks. We believe this reversal of order is due to the severity of the financial crisis — investors were uncomfortable holding risky stocks so early in uncharted economic territory. Massive amounts of stimulus and an investing public unhappy with low returns on fixed rate securities have finally translated into the risk taking behavior we would normally have seen four years ago.
DETAILSOFTHE QUARTER
Consistent with the market’s increasingly aggressive tone during the first quarter, what we consider our more dynamic, higher growth stocks were our best performers. These included Zillow, Seattle Genetics, Angie’s List, Sourcefire, and Shutterfly. By contrast, the stocks we consider to be our highest quality holdings generally struggled to keep pace. Some, such as Copart, Mednax, and Ultimate Software Group, performed roughly in line with the market. Others, such as HEICO, Hibbett Sports, and Techne, lagged the market.
The Fund’s information technology stocks made a solid contribution. Within the sector, Sourcefire’s stock performed well for the period and was one of our biggest contributors. This rapidly growing technology company sells network security software and hardware.
Health care was another sector that saw strong returns across the board. Abaxis, a maker of medical diagnostic tests, was one of our top performers for the quarter. The trend toward greater efficiency in the delivery of health care is helping the company’s business. Physicians and their assistants can use Abaxis products to rapidly diagnose and treat routine illnesses without having to send patient samples to off-site laboratories and wait for test results.
Polypore International was one of our biggest detractors for the quarter. Polypore’s filtration membrane technology is used in batteries for high growth areas of the consumer electronics market. In addition, the company has a growing and profitable line of filtration membranes sold to the health care sector for use in such products as kidney dialysis machines. We believe that the consumer electronics and health care segments of Polypore’s business largely support the stock’s current valuation. Polypore also makes filtration membranes for the lithium batteries used in electric cars. Although currently a small part of the company’s overall business, Polypore is the leader in this industry. The stock has been quite volatile, as automobile manufacturers have reported mixed success selling hybrid and all-electric vehicles. We believe automobile electrification is an inevitable step in our nation’s journey toward energy independence, and we are therefore willing to bear the volatility associated with this kind of emerging technology.
Fusion-io, Inc. is a lower weight position that fell sharply and was also a large detractor. The company specializes in solid-state memory technology that is disruptive to traditional hard disk drive storage architectures. This kind of disruptive technology is always accompanied by extreme competition from incumbents fighting a losing battle as well as from emerging companies jockeying for position in a very large potential market.
OUTLOOK
If the U.S. were a company, it could be said that the income statement is beginning to show improvement. However, the country’s debt-laden balance sheet remains very poor. The modest growth that’s been achieved in recent years has, in a very real sense, been “purchased” through the accumulation of debt. Of course, there is a limit to how far this strategy can be taken, and policymakers in Washington are struggling to define the boundaries of that limit.
Our view, therefore, is that U.S. economic growth is gaining momentum yet our expectations are for less-than-normal long run economic growth. Stock market valuations, while not excessively rich, are not as attractive as they had been. While risky stocks are currently leading the market, over the long run we believe our style of investing in high quality companies that have the potential to double earnings every five years makes sense in a subdued economic environment.
Thank you for the opportunity to manage your assets.
| Current | and future holdings are subject to risk. |
30
| | |
| WASATCH SMALL CAP GROWTH FUND (WAAEX) — Portfolio Summary | | MARCH 31, 2013 |
|
|
|
AVERAGE ANNUAL TOTAL RETURNS
| | | | | | | | | | | | | | | | |
| | | SIX MONTHS* | | | 1 YEAR | | | 5 YEARS | | | 10 YEARS | |
Small Cap Growth | | | 10.05% | | | | 11.73% | | | | 11.22% | | | | 11.30% | |
Russell 2000® Growth Index | | | 13.71% | | | | 14.52% | | | | 9.04% | | | | 11.61% | |
Russell 2000® Index | | | 14.48% | | | | 16.30% | | | | 8.24% | | | | 11.52% | |
Data shows past performance, which is not indicative of future performance. Current performance may be lower or higher than the performance quoted. To obtain the most recent month-end performance data available, please visit www.wasatchfunds.com. The Advisor may absorb certain Fund expenses, without which total return would have been lower. Investment returns and principal value will fluctuate and shares, when redeemed, may be worth more or less than their original cost.
As of the January 31, 2013 prospectus, the Total Annual Fund Operating Expenses for the Wasatch Small Cap Growth Fund are 1.26%. The expense ratio shown elsewhere in this report may be different. Expenses include direct expenses paid to the Advisor as well as indirect expenses incurred by the Fund as a result of its investments in other investment companies (each an “Acquired Fund”), before any expense reimbursements by the Advisor. See the prospectus for additional information regarding Fund expenses.
Wasatch Funds will deduct a 2.00% redemption proceeds fee on Fund shares held 60 days or less. Performance data does not reflect the deduction of fees or taxes, which if reflected, would reduce the performance quoted. For more complete information including charges, risks and expenses, read the prospectus carefully.
Investing in small cap funds will be more volatile and loss of principal could be greater than investing in large cap or more diversified funds.
TOP 10 EQUITY HOLDINGS**
| | | | |
| Company | | % of Net
Assets | |
| Knight Transportation, Inc. | | | 3.7% | |
| Ultimate Software Group, Inc. | | | 3.5% | |
| Power Integrations, Inc. | | | 2.6% | |
| MSC Industrial Direct Co., Inc., Class A | | | 2.3% | |
| Wirecard AG (Germany) | | | 2.1% | |
| | | | |
| Company | | % of Net
Assets | |
| Life Time Fitness, Inc. | | | 2.1% | |
| Seattle Genetics Inc. | | | 1.9% | |
| Copart, Inc. | | | 1.9% | |
| Syntel, Inc. | | | 1.8% | |
| Tetra Tech, Inc. | | | 1.8% | |
| ** | As of March 31, 2013, there were 88 holdings in the Fund. Foreign currency contracts, written options and repurchase agreements, if any, are not included in the number of holdings. Portfolio holdings are subject to change at any time. References to specific securities should not be construed as recommendations by the Funds or their Advisor. Current and future holdings are subject to risk. |
SECTOR BREAKDOWN†
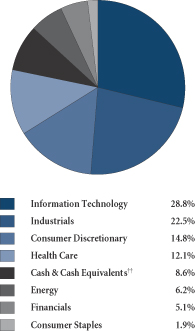
| † | Excludes securities sold short and options written, if any. |
| †† | Also includes Other Assets & Liabilities. |
GROWTHOFA HYPOTHETICAL $10,000 INVESTMENT
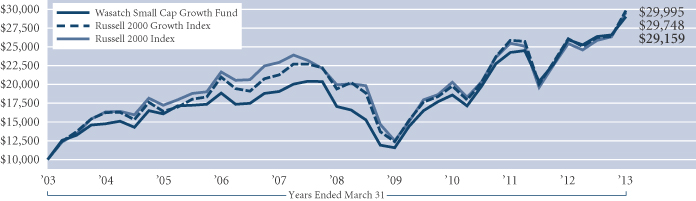
Past performance does not predict future performance and the graph above does not reflect the deduction of taxes you would pay on fund distributions or the redemption of fund shares. Performance shown in the chart above does not include any applicable sales charges and fees. Wasatch does not charge any sales fees. The Russell 2000 Growth Index is an unmanaged total return index that measures the performance of those Russell 2000 Index companies with higher price-to-book ratios and higher forecasted growth values. The Russell 2000 Index is an unmanaged total return index of the smallest 2,000 companies in the Russell 3000 Index, as ranked by total market capitalization. The Russell 2000 Index is widely regarded in the industry as accurately capturing the universe of small company stocks. You cannot invest directly in these or any indices.
31
| | |
| WASATCH SMALL CAP VALUE FUND (WMCVX / WICVX) — Management Discussion | | MARCH 31, 2013 |
|
|
|
The Wasatch Small Cap Value Fund is managed by a team of Wasatch portfolio managers led by Jim Larkins.
| | |

Jim Larkins, MBA Portfolio Manager | | OVERVIEW The year began on a strong note for the stock market, as investors and businesses alike reacted positively to improved clarity regarding the political environment. Throughout the latter half of 2012, lack of visibility regarding the election outcome and federal tax policy helped put a lid on business sentiment. The resolution of these issues boosted confidence and prompted corporations to get “back to |
business.” This positive shift, in combination with modestly improving economic growth and continued accommodation from the U.S. Federal Reserve (Fed), helped fuel a rally of 11.63% in the benchmark, the Russell 2000 Value Index. The Wasatch Small Cap Value Fund — Investor Class returned 10.20% in the first quarter.
DETAILSOFTHE QUARTER
We employ a unique approach in that we divide the universe of small cap value stocks into three categories:
| | Ÿ | | Fallen Angels — fundamentally sound, growing companies whose stocks have temporarily slid into value territory |
| | Ÿ | | Undiscovered Gems — companies whose current valuations do not reflect what we believe is their true value |
| | Ÿ | | Quality Value — stocks that possess traditional value characteristics but have a specific quality that sets them apart — such as an exceptional business model or strong balance sheet and cash flow. |
Undiscovered Gems were the Fund’s best performing group during the quarter, led by Copart, Inc. and DXP Enterprises, Inc. Copart operates a stable business as the country’s leading auction company for wrecked cars. The company’s expansion into international markets gives us confidence that the stock can still be a multi-year story. DXP, a newer holding, distributes replacement parts to the industrial and energy markets. We purchased the stock on the belief that it would be a prime long-run beneficiary of the resurgence in North American drilling and oil production, and this began to be reflected in DXP’s stock price during the quarter.
We see the North American drilling story as a powerful long-term theme not just for DXP, but also for a number of small cap companies positioned to benefit from rising domestic energy production, including Flotek Industries, Inc., Patterson-UTI Energy, Inc. and CARBO Ceramics, Inc. The common theme among these companies is that they don’t drill for oil and gas themselves, but they provide services and equipment to companies that do — a powerful “pick and shovel” model that we believe has the potential to fuel longer-term growth as drilling activity rises. We also own two drillers, Ultra Petroleum Corp. and Northern Oil and Gas, Inc. Northern is a “Quality Value” stock that detracted from first quarter performance after the company
was challenged with higher expenses. We continue to hold the stock on the belief that the company is effectively managing the higher costs.
Our “Fallen Angel” strategy generally underperformed our expectations during the quarter. The stocks in this group are in various stages of recovery from internal stumbles or broader industry downturns. A number of consumer stocks in the Fallen Angel category struggled due to investor concerns about consumer spending given the tax increase, persistently high unemployment and budget cuts. For instance, Chico’s FAS, Inc. and rue21, Inc. underperformed the Index during the quarter even though they have delivered consistent fundamental improvements. Two other underperformers, Skullcandy, Inc. and Body Central Corp., struggled with product/fashion challenges and management changes. We exited our position in Skullcandy due to continued competition and the departure of the CEO.
On the plus side, we benefited from the Fallen Angel USANA Health Sciences, Inc., a multi-level marketing company whose stock was hit hard amid the high-profile controversy surrounding Herbalife* earlier in the quarter. We have followed USANA for many years, so we were prepared to take advantage of this sell-off by establishing a position at a discounted price. The stock subsequently rebounded more than 30%, and finished the period as one of the Fund’s top contributors.
Quality Value names were solid performers in the quarter, led by new holding Arbor Realty Trust, Inc. We purchased Arbor late in 2012 after seeing improved results from a management team that we have known for almost a decade. Beacon Roofing Supply, Inc. also gained ground as the demand for roofing materials rebounded in conjunction with the recovery in the housing market.
OUTLOOK
The strong return of the U.S. stock market in the first quarter likely indicates that performance will be somewhat muted through the end of the year. Still, all of the factors that propelled the market higher in the first quarter — easy Fed policy, modest economic growth and healthy corporate earnings — should continue to provide support in the months ahead.
A more important consideration for us is that the small cap space continues to offer a wealth of opportunities for value-oriented investors. An important attribute of the asset class is that individual stock performance tends to be driven more by company-level developments than by broader, macroeconomic factors, which creates a steady inflow of new companies into our Fallen Angel and Quality Value categories. As always, we devote our efforts to researching such companies to identify whether they meet our strict criteria for inclusion in the Fund — a disciplined approach that we believe has the potential to translate into strong results over the long term.
Thank you for the opportunity to manage your assets.
| * | As of March 31, 2013, the Wasatch Small Cap Value Fund did not hold Herbalife Ltd. |
| | Current and future holdings are subject to risk. |
32
| | |
| WASATCH SMALL CAP VALUE FUND (WMCVX / WICVX) — Portfolio Summary | | MARCH 31, 2013 |
|
|
|
AVERAGE ANNUAL TOTAL RETURNS
| | | | | | | | | | | | | | | | |
| | | SIX MONTHS* | | | 1 YEAR | | | 5 YEARS | | | 10 YEARS | |
Small Cap Value (WMCVX) — Investor | | | 16.27% | | | | 15.36% | | | | 6.33% | | | | 11.06% | |
Small Cap Value (WICVX) — Institutional | | | 16.23% | | | | 15.32% | | | | 6.37% | | | | 11.08% | |
Russell 2000® Value Index | | | 15.23% | | | | 18.09% | | | | 7.29% | | | | 11.29% | |
Russell 2000® Index | | | 14.48% | | | | 16.30% | | | | 8.24% | | | | 11.52% | |
Data shows past performance, which is not indicative of future performance. Current performance may be lower or higher than the performance quoted. To obtain the most recent month-end performance data available, please visit www.wasatchfunds.com. The Advisor may absorb certain Fund expenses, without which total return would have been lower. Investment returns and principal value will fluctuate and shares, when redeemed, may be worth more or less than their original cost.
As of the January 31, 2013 prospectus, the Total Annual Fund Operating Expenses for the Wasatch Small Cap Value Fund are Investor Class — 1.29% / Institutional Class — Gross: 1.66%, Net: 1.15%. The expense ratio shown elsewhere in this report may be different. Net Expenses are based on Fund expenses, net of waivers and reimbursements. See the prospectus for additional information regarding Fund expenses.
Wasatch Funds will deduct a 2.00% redemption proceeds fee on Fund shares held 60 days or less. Performance data does not reflect the deduction of fees or taxes, which if reflected, would reduce the performance quoted. For more complete information including charges, risks and expenses, read the prospectus carefully.
Performance for the Institutional Class prior to 1/31/2012 is based on the performance of the Investor Class. Performance of the Fund’s Institutional Class prior to 1/31/2012 uses the actual expenses of the Fund’s Investor Class without any adjustments. For any such period of time, the performance of the Fund’s Institutional Class would have been substantially similar to, yet higher than, the performance of the Fund’s Investor Class, because the shares of both classes are invested in the same portfolio of securities, but the classes bear different expenses.
Investing in small cap funds will be more volatile and loss of principal could be greater than investing in large cap or more diversified funds.
TOP 10 EQUITY HOLDINGS**
| | | | |
| Company | | % of Net
Assets | |
| Copart, Inc. | | | 3.7% | |
| Polypore International, Inc. | | | 3.3% | |
| ICON plc ADR (Ireland) | | | 2.7% | |
| Yes Bank Ltd. (India) | | | 2.5% | |
| Portfolio Recovery Associates, Inc. | | | 2.4% | |
| | | | |
| Company | | % of Net
Assets | |
| Questcor Pharmaceuticals, Inc. | | | 2.4% | |
| HEICO Corp., Class A | | | 2.3% | |
| Ensign Group, Inc. (The) | | | 2.3% | |
| DFC Global Corp. | | | 2.3% | |
| Sketchers U.S.A., Inc., Class A | | | 2.2% | |
| ** | As of March 31, 2013, there were 61 holdings in the Fund. Foreign currency contracts, written options and repurchase agreements, if any, are not included in the number of holdings. Portfolio holdings are subject to change at any time. References to specific securities should not be construed as recommendations by the Funds or their Advisor. Current and future holdings are subject to risk. |
SECTOR BREAKDOWN†
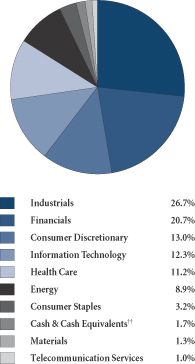
| † | Excludes securities sold short and options written, if any. |
| †† | Also includes Other Assets & Liabilities. |
GROWTHOFA HYPOTHETICAL $10,000 INVESTMENT
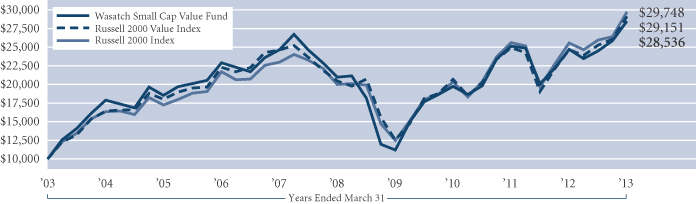
Past performance does not predict future performance and the graph above does not reflect the deduction of taxes you would pay on fund distributions or the redemption of fund shares. Performance shown in the chart above does not include any applicable sales charges and fees. Wasatch does not charge any sales fees. The Russell 2000 Value Index measures the performance of those Russell 2000 Index companies with lower price-to-book ratios and lower forecasted growth values. The Russell 2000 Index is an unmanaged total return index of the smallest 2,000 companies in the Russell 3000 Index, as ranked by total market capitalization. The Russell 2000 Index is widely regarded in the industry as accurately capturing the universe of small company stocks. You cannot invest directly in these or any indices.
33
| | |
| WASATCH STRATEGIC INCOME FUND (WASIX) — Management Discussion | | MARCH 31, 2013 |
|
|
|
The Wasatch Strategic Income Fund is managed by a team of Wasatch portfolio managers led by Sam Stewart.
| | |
Samuel S. Stewart, Jr. PhD, CFA Portfolio Manager | | OVERVIEW The total return for the Wasatch Strategic Income Fund during the first quarter was an unexpectedly robust 12.87%. This is a sizable return in a very short period of time. Further, this return was on top of an 11.29% gain during 2012. While we are happy to receive such a reward, we are highly skeptical that this level of performance can continue. For comparison purposes, our S&P 500 Index benchmark returned 10.61% |
for the quarter while bond returns, as reflected by the Barclays Capital U.S. Aggregate Bond Index, were relatively flat. For the past 12 months, the Fund similarly outperformed both of these benchmarks, besting the 13.96% return of the S&P 500 by almost one percentage point and the 3.77% return of the bond benchmark by over 11 percentage points.
Rather than glory in this higher-than-expected performance, we are looking for any and all ways to reduce the risk of the Fund in an attempt to avoid losing what we have attained.
DETAILSOFTHE QUARTER
This has been a particularly satisfying quarter as some of the tough decisions we made in the past bore fruit during the last three months.
As you may recall Herbalife Ltd., a direct marketer of health supplements, suffered a large price decline due to two successive attacks by short sellers, one during the first half of 2012 and the other just before year-end. As a result of these attacks, the stock price fell from over $70 to nearly $24 and closed the year at about $33. We studied the short sellers’ arguments carefully to see if we could discover anything amiss in our positive view of the company. As we could find no substance to these arguments, we decided to add to our holdings as the stock declined, including buying more near the bottom. While the short sellers remain active, Herbalife reported a strong fourth quarter. The stock rose to above $46, before closing the first quarter at about $37, which added approximately one percentage point to our quarterly return. While our holdings are still underwater, we continue to believe that Herbalife has a solid business, which is selling for less than eight times next year’s earnings.
The story of our holding in Best Buy Co., Inc. is somewhat similar. Early in 2012, Best Buy’s stock was selling for over $27. During the year, the price declined steadily to close the year at about $12. Investors worried (and the company’s results seemed to reflect) that shoppers were using Best Buy stores as a showroom to check out the products they were interested in, but then buying online to take advantage of greater convenience and lower prices. We not only made the decision to hold on to Best Buy, but we also continued to add to our position as the price became more attractive. Our rationale for doing so was two-fold. First, Apple has
demonstrated the tremendous value of having an actual store for customers to enjoy a hands-on experience with products they are considering. Other consumer-electronics manufacturers (Samsung, Motorola, etc.) generally rely on Best Buy and other stores to provide their customers with a hands-on experience. Because Best Buy is actually a key partner in their supply chain, manufacturers need to support its efforts to stay in business. Second, during the year, new management with experience in corporate turnarounds came to Best Buy. We believe they will be successful. As results were reported during the quarter, investors became more optimistic that the company would survive and marked its stock price up to about $22.
In reaction to the Strategic Income Fund’s strong return for the first quarter, our response has been aimed at reducing risk. To paraphrase Ben Stein, “If something is too good to be true, it isn’t true.” Were we market timers, it would be tempting to stand aside and hold cash for the remainder of the year, declaring that the almost 13% we earned during the quarter was a perfectly adequate return for the entire year. As the old saying goes, “Bulls make money, bears make money, but pigs get slaughtered.”
We believe the most important way of containing risk is to simply do our jobs well — pay fair prices for stocks in companies that have both the willingness and ability to pay a growing stream of dividends.
OUTLOOK
The Federal Reserve and central bankers around the globe have been holding interest rates on government debt artificially low with the goal of driving up asset prices. Ultimately, another goal of these artificially low rates is to stimulate the global economy. Judging by the prices of assets (including stocks), low rates seem to have accomplished the first goal. Unfortunately, regarding the second goal, the economy has yet to respond robustly. Our outlook is colored by the fact that artificially high stock prices don’t bode well for future returns. Just the opposite, in fact. So we have been relatively quick in taking our gains and trying to limit our losses. We continually examine the Fund’s portfolio with the goal of finding ways to limit risk.
Thank you for the opportunity to invest your assets.
| | Current and future holdings are subject to risk. |
34
| | |
| WASATCH STRATEGIC INCOME FUND (WASIX) — Portfolio Summary | | MARCH 31, 2013 |
|
|
|
AVERAGE ANNUAL TOTAL RETURNS
| | | | | | | | | | | | | | | | |
| | | SIX MONTHS* | | | 1 YEAR | | | 5 YEARS | | | SINCE INCEPTION 2/1/06 | |
Strategic Income | | | 12.83% | | | | 14.93% | | | | 6.72% | | | | 6.15% | |
S&P 500 Index | | | 10.19% | | | | 13.96% | | | | 5.81% | | | | 5.12% | |
Barclays Capital U.S. Aggregate Bond Index | | | 0.09% | | | | 3.77% | | | | 5.47% | | | | 5.70% | |
Data shows past performance, which is not indicative of future performance. Current performance may be lower or higher than the performance quoted. To obtain the most recent month-end performance data available, please visit www.wasatchfunds.com. The Advisor may absorb certain Fund expenses, without which total return would have been lower. Investment returns and principal value will fluctuate and shares, when redeemed, may be worth more or less than their original cost.
As of the January 31, 2013 prospectus, the Total Annual Fund Operating Expenses for the Wasatch Strategic Income Fund are 1.23%. The Net Expenses are 1.04%. The expense ratio shown elsewhere in this report may be different. Expenses include direct expenses paid to the Advisor as well as indirect expenses incurred by the Fund as a result of its investments in other investment companies (each an “Acquired Fund”), before any expense reimbursements by the Advisor. Net Expenses are based on Fund expenses, net of waivers and reimbursements. See the prospectus for additional information regarding Fund expenses.
Wasatch Funds will deduct a 2.00% redemption proceeds fee on Fund shares held 60 days or less. Performance data does not reflect the deduction of fees or taxes, which if reflected, would reduce the performance quoted. For more complete information including charges, risks and expenses, read the prospectus carefully.
The Fund has a concentration in the financials sector. Investing in concentrated funds can be more volatile and loss of principal could be greater than investing in more diversified funds. The financials sector can be significantly affected by various market factors, including the availability and cost of capital funds, changes in interest rates, the rate of corporate and consumer debt defaults, and price competition.
With respect to the Fund’s assets invested in fixed income securities, you are subject, but not limited to, the same interest rate, inflation and credit risk associated with the underlying fixed-income securities owned by the Fund. Return of principal is not guaranteed. Equity investing involves risks, including potential loss of the principal amount invested. Investing in foreign securities, especially in emerging markets, entails special risks, such as currency fluctuations and political uncertainties, which are described in more detail in the prospectus.
TOP 10 EQUITY HOLDINGS**
| | | | |
| Company | | % of Net
Assets | |
| Capital One Financial Corp. | | | 6.0% | |
| Herbalife Ltd. | | | 4.5% | |
| Walgreen Co. | | | 4.3% | |
| CapitalSource, Inc. | | | 4.2% | |
| Best Buy Co., Inc. | | | 4.1% | |
| | | | |
| Company | | % of Net
Assets | |
| NorthStar Realty Finance Corp. | | | 4.0% | |
| Visa, Inc., Class A | | | 3.9% | |
| Canadian National Railway Co. (Canada) | | | 3.9% | |
| Colony Financial, Inc. | | | 3.8% | |
| MasterCard, Inc., Class A | | | 3.7% | |
| ** | As of March 31, 2013, there were 36 holdings in the Fund. Foreign currency contracts, written options and repurchase agreements, if any, are not included in the number of holdings. Portfolio holdings are subject to change at any time. References to specific securities should not be construed as recommendations by the Funds or their Advisor. Current and future holdings are subject to risk. |
SECTOR BREAKDOWN†
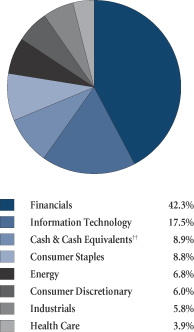
| † | Excludes securities sold short and options written, if any. |
| †† | Also includes Other Assets & Liabilities. |
GROWTHOFA HYPOTHETICAL $10,000 INVESTMENT
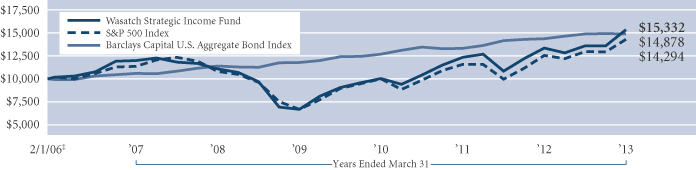
Past performance does not predict future performance and the graph above does not reflect the deduction of taxes you would pay on fund distributions or the redemption of fund shares. Performance shown in the chart above does not include any applicable sales charges and fees. Wasatch does not charge any sales fees. ‡Inception: February 1, 2006. The S&P 500 Index represents 500 of the United States’ largest stocks from a broad variety of industries. The Index is unmanaged but is a commonly used measure of common stock total return performance. The Barclays Capital U.S. Aggregate Bond Index covers the U.S. investment grade fixed rate bond market, including government and corporate securities, agency mortgage pass-through securities, and asset-backed securities. To be included in the index the security must meet the following criteria: must have at least one year to final maturity, regardless of call features; must have at least $100 million par amount outstanding; must be rated investment grade or better by Moody’s Investors Service, Standard & Poor’s, or Fitch Investor’s Service; must be fixed rate, although it can carry a coupon that steps up or changes to a predetermined schedule; must be dollar-denominated and nonconvertible. All corporate and asset-backed securities must be registered with the SEC and must be publicly issued. You cannot invest directly in these or any indices.
35
| | |
| WASATCH ULTRA GROWTH FUND (WAMCX) — Management Discussion | | MARCH 31, 2013 |
|
|
|
The Wasatch Ultra Growth Fund is managed by a team of Wasatch portfolio managers led by Paul Lambert and John Malooly.
| | | | |
Paul Lambert Portfolio Manager | | 
John Malooly, CFA Portfolio Manager | | OVERVIEW For the first quarter of 2013, the Wasatch Ultra Growth Fund posted a gain of 8.62% and lagged the Russell 2000 Growth Index, which rose 13.21%. U.S. equity markets rallied strongly as |
signs of a firming U.S. housing market helped boost stocks against a backdrop of accommodative Federal Reserve (Fed) policy and low inflation.
The U.S. economic picture continues to be one in which gross domestic product (GDP) growth averages between 2% and 3%, as high debt burdens tend to dampen spending by governments and households. In our view, the question to be answered is whether the stock market is being lifted by a broad-based recovery across autos, housing, employment and other key areas of the economy, or whether stocks are rising due to yet another bubble engineered by the Fed. As bottom-up managers, we have no intention of trying to position the Fund based on the outcome (whatever it may be) and instead remain focused on investing in interesting, rapidly growing companies that are disrupting their industries and taking market share away from competitors.
DETAILSOFTHE QUARTER
Two of our best-performing stocks for the first quarter were SciQuest and Interactive Intelligence Group. SciQuest provides cloud-based, on-demand strategic procurement and supplier management solutions to help customers reduce costs by managing their suppliers, contracts, purchases and payments. SciQuest has been making significant investments in sales and marketing and has built out its product portfolio. These initiatives have been paying off and the company’s organic growth rate has been accelerating.
Interactive Intelligence provides communications and workflow management software for contact centers. The company is transitioning from an on-premise to a cloud-based solution, and is rolling out a second cloud-based solution targeting small and mid-size businesses. Interactive Intelligence’s cash flow looks good, as do bookings and revenues.
Cardiovascular Systems is a rapidly growing medical-device company that was another one of our best performers. The company develops and sells products for the removal of hard plaque and calcium deposits from leg arteries in minimally invasive procedures. Cardiovascular Systems serves a previously unmet medical need that allows a significant percentage of vascular-disease patients to avoid amputation. The company is shifting to a new battery-powered product that is simpler, less expensive and easier to use.
Polypore International was our biggest detractor in the first quarter. Polypore makes filtration membranes used in batteries, including the lead-acid batteries used in conventional automobiles and the lithium-ion batteries used in consumer electronics and electric cars. In addition, the company has a growing and profitable business selling high-technology filters to the health care sector for use in such products as kidney dialysis machines. We believe the conventional-automobile and rapidly growing consumer-electronics battery segments of Polypore’s business, together with its health care segment, largely support the stock’s current valuation. While the stock declined in the first quarter amid uncertainty about the timing for meaningful adoption of electric cars, we believe the inevitability of automobile electrification and Polypore’s leadership position in the membrane-filtration industry justify a positive long-term outlook for the company and the stock.
Riverbed Technology and DFC Global also were big detractors. Riverbed historically has been one of the fastest-growing tech companies, as its technology allows data to travel much more efficiently across computer networks, especially to remote areas of the network. The company has done so well that it has captured over 50% of the market. However, market-share gains have diminished as the company has become larger. This trend has resulted in slower growth rates.
DFC Global is a retail finance company providing services to consumers who typically do not have bank accounts. The company has significant exposure in the United Kingdom (U.K.) and Canada. Approximately 50% of DFC’s revenues are derived from the U.K., which is experiencing a changing regulatory environment. Amid the uncertainty, the company has slowed its growth and is adjusting to new rules.
OUTLOOK
Unresolved concerns resulting primarily from high levels of debt are likely to persist for some time. The U.S. fiscal cliff has not been fully resolved, and the issues of federal spending and taxation are likely to remain at center stage until policymakers demonstrate greater willingness to come to grips with them. Europe shares many of the same problems as the U.S., and the situation there is being compounded by recession. China appears to have escaped a hard landing, at least for now. Although the numbers are not impressive, the Chinese economy appears to be picking up.
Meanwhile, the U.S. housing sector clearly is one of the biggest barometers of future economic activity. The Fed has targeted this sector in its attempt to get the economy moving, and the Fed’s extraordinary efforts appear to be gaining traction. Building products and home goods have shown strength in recent quarters, and the question now is whether or not the recovery has achieved enough momentum to become self-perpetuating. Artificially low interest rates have pulled demand forward and boosted the stock market — it now remains to be seen if this will become a sustainable economic recovery.
Thank you for the opportunity to manage your assets and for your trust.
| Current | and future holdings are subject to risk. |
36
| | |
| WASATCH ULTRA GROWTH FUND (WAMCX) — Portfolio Summary | | MARCH 31, 2013 |
|
|
|
AVERAGE ANNUAL TOTAL RETURNS
| | | | | | | | | | | | | | | | |
| | | SIX MONTHS* | | | 1 YEAR | | | 5 YEARS | | | 10 YEARS | |
Ultra Growth | | | 8.61% | | | | 7.15% | | | | 6.41% | | | | 8.11% | |
Russell 2000® Growth Index | | | 13.71% | | | | 14.52% | | | | 9.04% | | | | 11.61% | |
Data shows past performance, which is not indicative of future performance. Current performance may be lower or higher than the performance quoted. To obtain the most recent month-end performance data available, please visit www.wasatchfunds.com. The Advisor may absorb certain Fund expenses, without which total return would have been lower. Investment returns and principal value will fluctuate and shares, when redeemed, may be worth more or less than their original cost.
As of the January 31, 2013 prospectus, the Total Annual Fund Operating Expenses for the Wasatch Ultra Growth Fund are 1.52%. The expense ratio shown elsewhere in this report may be different. Expenses include direct expenses paid to the Advisor as well as indirect expenses incurred by the Fund as a result of its investments in other investment companies (each an “Acquired Fund”), before any expense reimbursements by the Advisor. See the prospectus for additional information regarding Fund expenses.
Wasatch Funds will deduct a 2.00% redemption proceeds fee on Fund shares held 60 days or less. Performance data does not reflect the deduction of fees or taxes, which if reflected, would reduce the performance quoted. For more complete information including charges, risks and expenses, read the prospectus carefully.
Investing in small cap funds will be more volatile and loss of principal could be greater than investing in large cap or more diversified funds.
TOP 10 EQUITY HOLDINGS**
| | | | |
| Company | | % of Net
Assets | |
| Polypore International, Inc. | | | 3.4% | |
| Yes Bank Ltd. (India) | | | 2.8% | |
| Greenspring Global Partners II-B, L.P. | | | 2.8% | |
| DFC Global Corp. | | | 2.4% | |
| Tangoe, Inc. | | | 2.4% | |
| | | | |
| Company | | % of Net
Assets | |
| SEI Investments Co. | | | 2.1% | |
| IDEX Corp. | | | 2.1% | |
| Waste Connections, Inc. | | | 2.0% | |
| Cognizant Technology Solutions Corp., Class A | | | 2.0% | |
| Ultimate Software Group, Inc. | | | 1.9% | |
| ** | As of March 31, 2013, there were 99 holdings in the Fund. Foreign currency contracts, written options and repurchase agreements, if any, are not included in the number of holdings. Portfolio holdings are subject to change at any time. References to specific securities should not be construed as recommendations by the Funds or their Advisor. Current and future holdings are subject to risk. |
SECTOR BREAKDOWN†

| † | Excludes securities sold short and options written, if any. |
| †† | Also includes Other Assets & Liabilities. |
GROWTHOFA HYPOTHETICAL $10,000 INVESTMENT
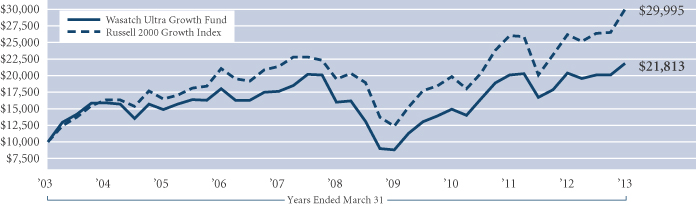
Past performance does not predict future performance and the graph above does not reflect the deduction of taxes you would pay on fund distributions or the redemption of fund shares. Performance shown in the chart above does not include any applicable sales charges and fees. Wasatch does not charge any sales fees. The Russell 2000 Growth Index is an unmanaged total return index that measures the performance of those Russell 2000 Index companies with higher price-to-book ratios and higher forecasted growth values. The Russell 2000 Index is an unmanaged total return index of the smallest 2,000 companies in the Russell 3000 Index, as ranked by total market capitalization. You cannot invest directly in these or any indices.
37
| | |
| WASATCH WORLD INNOVATORS FUND (WAGTX) — Management Discussion | | MARCH 31, 2013 |
|
|
|
The Wasatch World Innovators Fund is managed by a team of Wasatch portfolio managers led by Sam Stewart and Josh Stewart.
| | | | |
Samuel S. Stewart, Jr. PhD, CFA Portfolio Manager | | 
Josh Stewart Portfolio Manager | | OVERVIEW The Wasatch World Innovators Fund gained 8.42% in the first quarter, beating the 6.90% return of its benchmark, the MSCI All Country World Investable Market Index. The key fundamental metrics we |
track when comparing the Fund’s portfolio to the benchmark are sales growth and earnings per share (EPS) growth. We think a portfolio of true World Innovators should excel on these metrics because an innovator’s dramatically better products and services should fuel rapid market share gains, which in turn should translate into sales growth well above the growth rate of the average company. Furthermore, we expect that an innovator’s business model should benefit from scale economies that enable its earnings growth to outpace its sales growth. Our portfolio’s median sales and EPS annual growth rates in the most recent quarter were 13.7% and 9.0%, respectively.
We are concerned, however, that the EPS of our holdings grew more slowly than their sales for the second consecutive quarter. We have done some research to determine why our portfolio companies’ margins are down, and we think this short-term development is mostly transitional as companies move from defensive cash-conservation strategies — a legacy of the financial crisis — to more aggressive investment and growth plans. In other words, the under-investment from 2009 to 2010 resulted in peak margins in the earlier stages of the global economy’s recovery, but as growth has accelerated, renewed hiring and investment are dragging on margins. Nevertheless, we will be especially focused on the direction the margins of our companies are heading in the coming quarters.
DETAILSOFTHE QUARTER
Perhaps the most satisfying result of the first quarter was the strong performance of Herbalife, a direct marketer of health supplements that was the Fund’s top contributor. Herbalife provided some unwelcome excitement to the Fund’s previous quarter as the stock was subjected to its second well-publicized attack from short sellers (i.e., those that bet against a stock) in 2012. This time, the imbroglio was dragged into the spotlight at the hands of Bill Ackman and Carl Icahn, two of the country’s most famous hedge fund managers. Ackman has a large short position while Icahn has a big long position, and the two men proceeded to publicly argue their views on Herbalife, with lots of personal jabs included to enhance the dramatic effect.
We studied the short sellers’ arguments to see if we could discover anything amiss in our positive view of Herbalife. Finding no substance to these arguments, we decided to add to our holdings as the stock declined during 2012. While the short sellers remain active, Herbalife reported strong December financial results, at which point we sold a portion of our shares. We continue to hold Herbalife on the belief that it has a solid business that can be bought for what we consider to be a more-than-reasonable eight times next year’s earnings.
IntercontinentalExchange was the Fund’s second-largest contributor. This investment reflects our attempt to gain more exposure to financials, usually considered a commoditized sector with little innovation. Our dilemma in selecting financial stocks is the difficulty of finding those that offer meaningful innovation. The primary reason we wanted to add exposure is that the performance of financials tends to have a distinct negative correlation with the performance of information technology stocks, a sector in which we are perpetually above market-weight due to the abundance of innovative companies. Some of IntercontinentalExchange’s strong performance during the quarter was driven by its bid to acquire NYSE Euronext* (operator of the New York Stock Exchange). Investors gained confidence that the company’s management of the NYSE would prove to be more effective than the existing management.
On the other side of the ledger, our largest detractor for the quarter was Apple. While we made a good decision to trim Apple on the belief that the enthusiasm surrounding the successful launch of the iPhone 5 was overdone, the magnitude of our trade was small in comparison with the size of our position. We maintained this position because we remain confident in our basic thesis that Apple is the premier consumer electronics company and that it is gaining ever more share among corporate users. Additionally, we think being able to buy Apple’s stock at nine to 10 times trailing earnings is a great price to pay in order to own this premier global brand, especially in light of its large cash balance.
OUTLOOK
With global economic reports surprisingly positive during the past quarter and year, anchored by the performance of the United States, stock markets have fared well. We are glad the Fund has slightly outpaced the bull market in light of our substantial overweight in the information technology sector, which along with energy and materials has been a weak spot within the benchmark. We believe we were able to achieve this result with good stock picking, a testament to the merits of owning companies we consider to be World Innovators.
Thank you for the opportunity to manage your assets.
| * | As of March 31, 2013, the Wasatch World Innovators Fund was not invested in NYSE Euronext. |
| | Current and future holdings are subject to risk. |
38
| | |
| WASATCH WORLD INNOVATORS FUND (WAGTX) — Portfolio Summary | | MARCH 31, 2013 |
|
|
|
AVERAGE ANNUAL TOTAL RETURNS
| | | | | | | | | | | | | | | | |
| | | SIX MONTHS* | | | 1 YEAR | | | 5 YEARS | | | 10 YEARS | |
World Innovators | | | 8.25% | | | | 11.12% | | | | 11.27% | | | | 12.36% | |
MSCI AC World IMI | | | 10.10% | | | | 10.95% | | | | 2.58% | | | | 9.87% | |
Data shows past performance, which is not indicative of future performance. Current performance may be lower or higher than the performance quoted. To obtain the most recent month-end performance data available, please visit www.wasatchfunds.com. The Advisor may absorb certain Fund expenses, without which total return would have been lower. Investment returns and principal value will fluctuate and shares, when redeemed, may be worth more or less than their original cost.
As of the January 31, 2013 prospectus, the Total Annual Fund Operating Expenses for the Wasatch World Innovators Fund are 1.87%. The expense ratio shown elsewhere in this report may be different. Expenses include direct expenses paid to the Advisor as well as indirect expenses incurred by the Fund as a result of its investments in other investment companies (each an “Acquired Fund”), before any expense reimbursements by the Advisor. See the prospectus for additional information regarding Fund expenses.
Wasatch Funds will deduct a 2.00% redemption proceeds fee on Fund shares held 60 days or less. Performance data does not reflect the deduction of fees or taxes, which if reflected, would reduce the performance quoted. For more complete information including charges, risks and expenses, read the prospectus carefully.
Investing in concentrated funds will be more volatile and loss of principal could be greater than investing in more diversified funds. Investing in foreign securities, especially in emerging markets, entails special risks, such as currency fluctuations and political uncertainties, which are described in more detail in the prospectus.
TOP 10 EQUITY HOLDINGS**
| | | | |
| Company | | % of Net
Assets | |
| Apple, Inc. | | | 5.9% | |
| eBay, Inc. | | | 5.6% | |
| Google, Inc., Class A | | | 4.3% | |
| DiaSorin S.p.A. (Italy) | | | 3.9% | |
| MasterCard, Inc., Class A | | | 3.1% | |
| | | | |
| Company | | % of Net
Assets | |
| Herbalife Ltd. | | | 2.9% | |
| DIRECTV | | | 2.8% | |
| Visa, Inc., Class A | | | 2.7% | |
| Myriad Genetics, Inc. | | | 2.6% | |
| Check Point Software Technologies Ltd. (Israel) | | | 2.6% | |
| **As | of March 31, 2013, there were 57 holdings in the Fund. Foreign currency contracts, written options and repurchase agreements, if any, are not included in the number of holdings. Portfolio holdings are subject to change at any time. References to specific securities should not be construed as recommendations by the Funds or their Advisor. Current and future holdings are subject to risk. |
SECTOR BREAKDOWN†
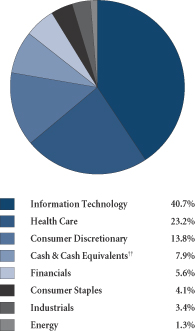
| † | Excludes securities sold short and options written, if any. |
| †† | Also includes Other Assets & Liabilities. |
GROWTHOFA HYPOTHETICAL $10,000 INVESTMENT
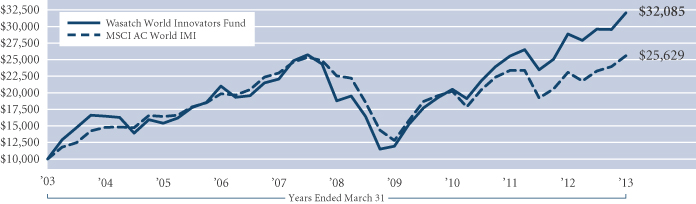
Past performance does not predict future performance and the graph above does not reflect the deduction of taxes you would pay on fund distributions or the redemption of fund shares. Performance shown in the chart above does not include any applicable sales charges and fees. Wasatch does not charge any sales fees. The MSCI All Country World Investable Market Index (AC World IMI) is a free float-adjusted market capitalization weighted index designed to measure the equity market performance of large, mid, and small cap companies across developed and emerging markets throughout the world. You cannot invest directly in this or any index.
39
| | |
| WASATCH-1ST SOURCE INCOME FUND (FMEQX) — Management Discussion | | MARCH 31, 2013 |
|
|
|
| | |

Paul W. Gifford, CFA Portfolio Manager | | OVERVIEW The Fund returned 0.26% during the first quarter and matched the performance of the Barclays Capital U.S. Intermediate Government/Credit Bond Index. Most of the Fund’s quarterly performance came from improvement in the yields of non-Treasury bonds. Riskier credits and assets continue to be supported by the Federal Reserve’s monetary policy of low interest rates and asset purchases. |
U.S. economic growth was essentially flat in the fourth quarter of 2012. But in the first quarter of 2013, the economy showed some signs of growth returning to near 2%. House prices continued to be a bright spot for the Federal Reserve (Fed), banks and especially consumers. Despite high unemployment, stagnant wages, and increased payroll taxes, consumers have been spending. Home price appreciation can factor into consumer’s propensity to spend even if they are not tapping the equity in their homes.
Persistent economic growth has many observers wondering how much longer extraordinary monetary policy accommodation will be necessary. Chairman Ben Bernanke restated the Fed’s position of continuing to buy bonds until the economy can sustainably grow on its own.
During the past few months, the U.S. investment markets have had to manage through three significant U.S. government-induced hurdles — the fiscal cliff, budget cuts and fiscal year funding. The first two were small down payments on improving the country’s trillion-dollar deficit and the third keeps the government open through its fiscal year-end in September. Tax increases and spending cuts could lower the deficit by $147 billion per year. It now seems likely that the U.S. deficit will be less than a trillion dollars at the close of the fiscal year, which will end a record four consecutive years of deficits of that size. While that is good news and the bond markets have shown no concern about the credit quality of the U.S., legislators still need to address unsustainable imbalances in Social Security, Medicare and Medicaid — which, in the coming five years, will more than offset all of the recent budget improvements.
Three signs of consumers’ improving financial health are auto and home sales and employment numbers. The auto industry has experienced a renaissance with Chrysler, General Motors and Ford posting improved sales and strong profits. Home prices, sales and starts have seen modest improvements after a persistent downward slide over the past five years. Case/Shiller, a firm that measures home prices nationwide, reported that for the quarter ended December 31, 2012 the average price of a home in the U.S. improved by 6.8% year-over-year, marking the third consecutive quarterly increase for the first time since 2006. Home sales also continued to improve and are back to an average of five million per year. Data for housing starts show improvement in the rate of homes being built to nearly one million per year after falling below 600,000 in 2009. The improvement in housing has been directly driven by the
Fed’s monetary policy of keeping interest rates low by buying mortgage-backed securities. Several other government programs, such as HARP (Home Affordable Refinance Program), are also helping by allowing homeowners who owe more than the current value of their homes to lower their monthly payments. This has kept many homes from going into foreclosure, and has limited the housing supply thus helping pricing.
Our current strategy of underweighting U.S. Treasury securities and interest rate risk in the Fund is still in place. The Fund currently has about 10% of its assets in Treasuries, well below the Index weight of 64%. The Fund is overweight relative to the Index in government agency bonds, mortgage-backed securities and credit markets. The Fund’s effective duration is 3.3 years, unchanged from last quarter and is 84% of the benchmark’s duration.
Corporate earnings were solid in the first quarter and, as a group, corporations’ credit characteristics appear strong. We have been comfortable with the Fund’s modest exposure to BBB-rated bonds. The Fund is overweight in A-rated bonds at 27% of the portfolio versus 14% in the Index. JP Morgan, Morgan Stanley and Comcast are examples of A-rated bonds bought during the quarter.*
The Fund’s exposure to mortgage-backed securities has been little changed. In the last several months, various government agencies and programs have made refinancing more attractive to borrowers. We have recently made a couple of trades to offset the potential for mortgage prepayments as homeowners refinance. We have also had to consider the risk that eventually interest rates will rise and slow prepayments. This conundrum is why we have not added to our weighting in these securities.
Thank you for allowing us the opportunity to be a trusted advisor for you.
| * | A credit rating is an assessment of the credit worthiness of individuals and corporations. It is based upon the history of borrowing and repayment, as well as the availability of assets and extent of liabilities. Ratings are issued by S&P or Moody’s and typically range from AAA (highest) to D (lowest). The credit quality of the investments in the Fund’s portfolio does not apply to the safety or stability of the Fund. Ratings and portfolio credit quality may change over time. Unrated securities do not necessarily indicate low quality. The Fund itself has not been rated by an independent rating agency. For information on the rating agency’s methodology visit: http://www.standardandpoors.com/home/en/us and http://www.moodys.com. |
40
| | |
WASATCH-1ST SOURCE INCOME FUND (FMEQX) —
Portfolio Summary | | MARCH 31, 2013 |
|
|
|
AVERAGE ANNUAL TOTAL RETURNS
| | | | | | | | | | | | | | | | |
| | | SIX MONTHS* | | | 1 YEAR | | | 5 YEARS | | | 10 YEARS | |
Income | | | 0.29% | | | | 2.54% | | | | 3.62% | | | | 3.41% | |
Barclays Capital U.S. Intermediate Government/Credit Bond Index | | | 0.61% | | | | 3.53% | | | | 4.61% | | | | 4.49% | |
Data shows past performance, which is not indicative of future performance. Current performance may be lower or higher than the performance quoted. To obtain the most recent month-end performance data available, please visit www.wasatchfunds.com. The Advisor may absorb certain Fund expenses, without which total return would have been lower. Investment returns and principal value will fluctuate and shares, when redeemed, may be worth more or less than their original cost.
As of the January 31, 2013 prospectus, the Total Annual Fund Operating Expenses for the Wasatch-1st Source Income Fund are 0.71%. The expense ratio shown elsewhere in this report may be different. Expenses include direct expenses paid to the Advisor as well as indirect expenses incurred by the Fund as a result of its investments in other investment companies (each an “Acquired Fund”). See the prospectus for additional information regarding Fund expenses.
Wasatch Funds will deduct a 2.00% redemption proceeds fee on Fund shares held 60 days or less. Performance data does not reflect the deduction of fees or taxes, which if reflected, would reduce the performance quoted. For more complete information including charges, risks and expenses, read the prospectus carefully.
Investments in fixed income funds are subject to the same interest rate, inflation, credit and other risks associated with the underlying bonds. Return of principal is not guaranteed.
TOP 10 HOLDINGS**
| | | | | | | | |
| Holding | | Maturity
Date | | | % of Net
Assets | |
| U.S. Treasury Note, 3.625% | | | 8/15/19 | | | | 4.9% | |
| U.S. Treasury Note, 3.250% | | | 12/31/16 | | | | 3.4% | |
| General Electric Capital Corp., MTN, 5.400% | | | 2/15/17 | | | | 2.0% | |
| Federal National Mortgage Assoc., 2.625% | | | 11/20/14 | | | | 1.7% | |
| Government National Mortgage Assoc., Series 2012-94, Class GA, 2.500% | | | 5/20/40 | | | | 1.7% | |
| | | | | | | | |
| Holding | | Maturity
Date | | | % of Net
Assets | |
| Federal Home Loan Mortgage Corp., 2.500% | | | 5/27/16 | | | | 1.6% | |
| Federal National Mortgage Assoc., 4.875% | | | 12/15/16 | | | | 1.6% | |
| Federal Home Loan Mortgage Corp., MTN, 2.000% | | | 10/22/21 | | | | 1.5% | |
| Federal Home Loan Bank, Series 0000, 1.500% | | | 11/8/22 | | | | 1.5% | |
| Citibank Credit Card Issuance Trust, Series 2007-A8, Class A8, 5.650% | | | 9/20/19 | | | | 1.3% | |
| ** | As of March 31, 2013, there were 165 holdings in the Fund. Repurchase agreements, if any, are not included in the number of holdings. Portfolio holdings are subject to change at any time. References to specific securities should not be construed as recommendations by the Funds or their Advisor. Current and future holdings are subject to risk. |
INVESTMENTS & CASH

| † | Also includes Other Assets & Liabilities. |
GROWTHOFA HYPOTHETICAL $10,000 INVESTMENT
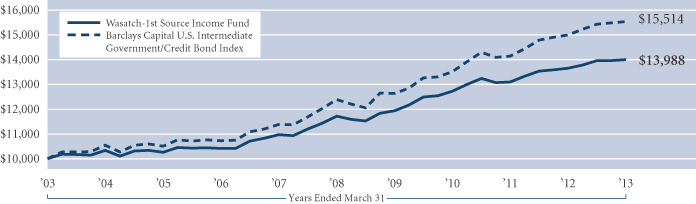
Past performance does not predict future performance and the graph above does not reflect the deduction of taxes you would pay on fund distributions or the redemption of fund shares. Performance shown in the chart above does not include any applicable sales charges and fees. Wasatch does not charge any sales fees. The Barclays Capital U.S. Intermediate Government/Credit Bond Index is an unmanaged index considered representative of the performance of government and corporate bonds with maturities of less than 10 years. You cannot invest directly in this or any index.
41
| | |
| WASATCH-HOISINGTON U.S. TREASURY FUND (WHOSX) — Management Discussion | | MARCH 31, 2013 |
|
|
|
| | |

Van R. Hoisington Portfolio Manager | | OVERVIEW In the first six months of the current fiscal year, economic growth was very erratic and below the threshold needed to boost job creation. The average monthly increase in payroll jobs was 168,000 in the first quarter, down from 208,000 in fourth quarter and 262,000 per month in the first quarter of 2012. The first quarter job numbers still have very favorable seasonal factors as a result of the 2008 to 2009 recession. |
Thus, the numbers are even worse than they seem. But taken at face value, 120,000 fewer jobs were added than in the fourth quarter of 2012 and almost 300,000 fewer than the first quarter of 2012. Household employment fell from October through March and the average increase in the past 12 months was only 105,000 per month. Many of these jobs were part-time and at very low pay. In the first quarter of 2012, manufacturing jobs rose 113,000 versus a minimal rise this year and a small decline in March. Not surprisingly, consumer spending contracted as the first quarter ended and consumer confidence measures slumped to recessionary levels.
Not taking into account a 2% hike in payroll taxes, March average hourly earnings were up just 1.8% year-over-year. Even though inflation was minimal, wage earners’ income fell further in the first quarter. Huge numbers of people continued to drop out of the labor market, with the labor force participation rate at the lowest level since 1979 — a stark indication of how discouraged the unemployed are at the possibility of being able to find work.
DETAILSOFTHE QUARTER
The Wasatch-Hoisington Treasury Fund registered a return of -3.84% in the first quarter of 2013, compared to -0.12% for the Barclays Capital U.S. Aggregate Bond Index. In spite of erratic business conditions and poor labor markets, the 30-year U.S. Treasury bond yield rose slightly, closing the quarter at 3.06% compared with 2.95% on the final day of 2012. This resulted in a negative return for the Fund in the first quarter due to the Fund’s focus on long-term Treasury bonds, which fall in price when yields rise.
Yields rose in the first calendar quarter in each of the past four years. We attribute this increase to typical seasonal volatility that occurs early in the year. Seasonally, interest rates are usually at their yearly highs between late February and mid-May. In fact, in 15 of the last 21 years the 30-year Treasury bond yield has peaked in the first half of the year. Inflationary conditions, the key long-run determinant of Treasury bond yields, continued to moderate in the first quarter, as commodity prices fell and the dollar rose in the foreign currency markets.
Over the past year the Fund performed extremely well, posting a 7.44% increase versus just 3.77% for the Index. On the last trading day of the first quarter in 2012, the 30-year Treasury bond yield stood at 3.34%. While yields rose in the quarter, they decreased over the past 12 months.
Over the latest 3-, 5- and 10-year intervals, the Fund posted compound annual returns of 15.36%, 9.69% and 8.22%. These returns exceeded the performance of the Index for each period.
OUTLOOK
Our present economic situation is nearly unparalleled in American economic history. The 1.8% average rise in gross domestic product (GDP) in the 13 years of this century was less than half the 3.8% GDP growth rate since 1790. Only growth in the 1930s was less than in the 2000s. The slowing expansion over the past five years points to the counterproductive influences of the U.S. Federal Reserve’s (Fed’s) unprecedented balance-sheet explosion. These efforts have slowed real income growth and exacerbated the wealth and income divide. Another major problem that has contributed to such lost potential is extreme over-indebtedness.
Credible academic research indicates that economies lose considerable growth when government debt exceeds 90% to 100% of GDP and private debt rises above 160% to 175% of GDP. Countries that comprise 75% of global GDP have already met these conditions. The financial and other markets do not seem to reflect the reality of subdued growth and a declining standard of living. Stock prices are high, or at least back to levels reached more than a decade ago, and bond yields contain a significant inflationary expectations premium. Stock and commodity prices have risen in concert with the announcement of QE1, QE2 and QE3. Theoretically, as well as from a long-term historical perspective, such a link between an expansion of the Fed’s balance sheet and these markets is lacking. Over the short run, psychology or irrational market behavior can override such fundamentals. This suggests that when expectations shift from inflation to deflation, irrational behavior might adjust risk asset prices significantly. Such signs that a shift is beginning can be viewed in the commodity markets where the Commodity Research Bureau (CRB) Index peaked about two years ago at 691, but now stands at 551, a 20% decline despite massive Fed balance-sheet expansion. The ability of the Fed to arrest a downside irrational move in risk assets may be limited. Non-risk assets such as U.S. Treasuries, which are backed by the full faith and credit of the U.S. government and are viewed as carrying minimal credit risk, have the potential to benefit from such a shift in perception.
We appreciate your investment in the Wasatch-Hoisington U.S. Treasury Fund.
42
| | |
| WASATCH-HOISINGTON U.S. TREASURY FUND (WHOSX) — Portfolio Summary | | MARCH 31, 2013 |
|
|
|
AVERAGE ANNUAL TOTAL RETURNS
| | | | | | | | | | | | | | | | |
| | | SIX MONTHS* | | | 1 YEAR | | | 5 YEARS | | | 10 YEARS | |
U.S. Treasury | | | -5.09% | | | | 7.44% | | | | 9.69% | | | | 8.22% | |
Barclays Capital U.S. Aggregate Bond Index | | | 0.09% | | | | 3.77% | | | | 5.47% | | | | 5.02% | |
Data shows past performance, which is not indicative of future performance. Current performance may be lower or higher than the performance quoted. To obtain the most recent month-end performance data available, please visit www.wasatchfunds.com. The Advisor may absorb certain Fund expenses, without which total return would have been lower. Investment returns and principal value will fluctuate and shares, when redeemed, may be worth more or less than their original cost.
As of the January 31, 2013 prospectus, the Total Annual Fund Operating Expenses for the Wasatch-Hoisington U.S. Treasury Fund are 0.72%. The expense ratio shown elsewhere in this report may be different. See the prospectus for additional information regarding Fund expenses.
Wasatch Funds will deduct a 2.00% redemption proceeds fee on Fund shares held 60 days or less. Performance data does not reflect the deduction of fees or taxes, which if reflected, would reduce the performance quoted. For more complete information including charges, risks and expenses, read the prospectus carefully.
Investments in fixed income funds are subject to the same interest rate, inflation, credit and other risks associated with the underlying bonds. Return of principal is not guaranteed.
TOP 10 HOLDINGS**
| | | | | | | | |
| Holding | | Maturity
Date | | | % of Net
Assets | |
| U.S. Treasury Strip, principal only | | | 2/15/31 | | | | 12.8% | |
| U.S. Treasury Strip, principal only | | | 5/15/30 | | | | 12.2% | |
| U.S. Treasury Bond, 3.125% | | | 11/15/41 | | | | 11.6% | |
| U.S. Treasury Strip, principal only | | | 2/15/37 | | | | 10.5% | |
| U.S. Treasury Strip, principal only | | | 5/15/39 | | | | 6.2% | |
| | | | | | | | |
| Holding | | Maturity
Date | | | % of Net
Assets | |
| U.S. Treasury Bond, 4.500% | | | 5/15/38 | | | | 5.3% | |
| U.S. Treasury Bond, 2.750% | | | 11/15/42 | | | | 5.1% | |
| U.S. Treasury Strip, principal only | | | 5/15/40 | | | | 4.4% | |
| U.S. Treasury Bond, 3.500% | | | 2/15/39 | | | | 4.4% | |
| U.S. Treasury Bond, 4.250% | | | 11/15/40 | | | | 3.5% | |
| ** | As of March 31, 2013, there were 19 holdings in the Fund. Repurchase agreements, if any, are not included in the number of holdings. Portfolio holdings are subject to change at any time. References to specific securities should not be construed as recommendations by the Funds or their Advisor. Current and future holdings are subject to risk. |
INVESTMENTS & CASH
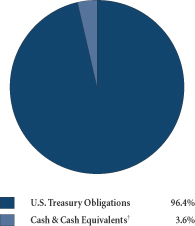
| † | Also includes Other Assets & Liabilities. |
GROWTHOFA HYPOTHETICAL $10,000 INVESTMENT
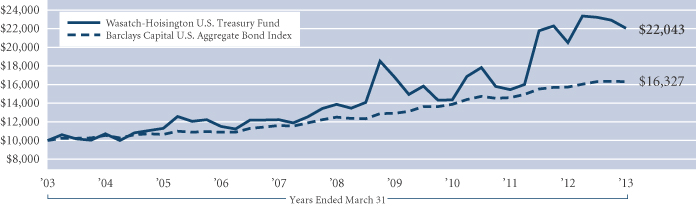
Past performance does not predict future performance and the graph above does not reflect the deduction of taxes you would pay on fund distributions or the redemption of fund shares. Performance shown in the chart above does not include any applicable sales charges and fees. Wasatch does not charge any sales fees. The Barclays Capital U.S. Aggregate Bond Index covers the U.S. investment grade fixed rate bond market, including government and corporate securities, agency mortgage pass-through securities, and asset-backed securities. To be included in the index the security must meet the following criteria: must have at least one year to final maturity, regardless of call features; must have at least $100 million par amount outstanding; must be rated investment grade or better by Moody’s Investors Service, Standard & Poor’s, or Fitch Investor’s Service; must be fixed rate, although it can carry a coupon that steps up or changes to a predetermined schedule; must be dollar-denominated and nonconvertible. All corporate and asset-backed securities must be registered with the SEC and must be publicly issued. You cannot invest directly in this or any index.
43
| | | | |
| WASATCH FUNDS MANAGEMENT DISCUSSIONS — Definitions of Financial Terms | | MARCH 31, 2013 |
|
|
|
Alpha is a risk-adjusted measure of the so-called “excess return” on an investment. It is a common measure of assessing an active manager’s performance, as it is the return in excess of a benchmark index or “risk-free” investment. The difference between the fair and actually expected rates of return on a stock is called the stock’s alpha.
Beta is a quantitative measure of the volatility of a given stock relative to the overall market. A beta above one is more volatile than the overall market, while a beta below one is less volatile.
A bull market is defined as a prolonged period in which investment prices rise faster than their historical average. Bull markets can happen as the result of an economic recovery, an economic boom, or investor psychology.
The “cloud” is the Internet. Cloud-computing is a model for delivering information technology services in which resources are retrieved from the Internet through web-based tools and applications, rather than from a direct connection to a server.
The Commodity Research Bureau (CRB) Index measures the overall direction of commodity sectors. The CRB is designed to isolate and reveal the directional movement of prices in overall commodity trades. Generally commodity prices move in the opposite direction of bond prices. This is because inflation causes commodities to increase in price while devaluing the price of bonds. This is one of the reasons bond and commodity traders closely watch the CRB.
Correlation, in the financial world, is a statistical measure of how asset classes, securities, markets, or countries move in relation to each other.
Dividend yield is a company’s annual dividend payments divided by its market capitalization, or the dividend per share divided by the price per share. For example, a company whose stock sells for $30 per share that pays an annual dividend of $3 per share has a dividend yield of 10%.
The Dow Jones Industrial Average is the most widely used indicator of the overall condition of the U.S. stock market. It is a price-weighted average of 30 blue chip stocks, primarily industrial stocks, traded on the New York Stock Exchange. The stocks are chosen by the editors of the Wall Street Journal, which is published by Dow Jones & Company.
Earnings growth is a measure of growth in a company’s net income over a specific period, often one year.
Earnings-per-share or EPS is the portion of a company’s profit allocated to each outstanding share of common stock. EPS growth rates help investors identify companies that are increasing or decreasing in profitability.
Effective duration is a measure of the responsiveness of a bond’s price to market interest rate changes. For example, if
the interest rate increased 1%, a bond with an effective duration of five years would experience a decline in price of 5%.
The “fiscal cliff” is the term given to the spending cuts and tax increases that would occur automatically if the U.S. Congress did not address them by the end of 2012.
Government agency bonds are debt securities issued by a U.S. government-sponsored agency.
Gross domestic product (GDP) is a basic measure of a country’s economic performance and is the market value of all final goods and services made within the borders of a country in a year.
An initial public offering (IPO) is a company’s first sale of stock to the public.
Mortgage-backed securities are debt issues backed by a pool of mortgages. Investors receive payments from the interest and principal payments made on the underlying mortgages.
The price-to-earnings multiple, also known as the price-to-earnings ratio or P/E ratio, is the price of a stock divided by its earnings per share.
Quantitative easing is a government monetary policy used to increase the money supply by buying government securities or other securities from the market. Quantitative easing increases the money supply by flooding financial institutions with capital in an effort to promote increased lending and liquidity. QE1, QE2 and QE3 are popular nicknames for the three rounds of quantitative easing implemented by the U.S. Federal Reserve.
Return on equity (ROE) measures a company’s efficiency at generating profits from shareholders’ equity.
Return on investment (ROI) is a performance measure used to evaluate the efficiency of an investment or to compare the efficiency of a number of investments. ROI is calculated by dividing the return of an investment by the cost of the investment. The result is expressed as a percentage or ratio.
“Risk-on” is when investors are seeking the potentially higher returns of riskier assets and put money back in the market willing to risk the money, thus risk on.
The S&P 500 Index includes 500 of the United States’ largest stocks from a broad variety of industries. The Index is unmanaged but is a commonly used measure of common stock total return performance.
Sales growth is the increase in sales over a specified period of time, not necessarily one year.
Valuation is the process of determining the current worth of an asset or company.
44
| | |
| WASATCH FUNDS — OPERATING EXPENSES (UNAUDITED) | | MARCH 31, 2013 |
|
|
|
EXPENSE EXAMPLE
As a shareholder of Wasatch Funds, you incur two types of costs: (1) transaction costs, including redemption fees and (2) ongoing costs, including management fees and other fund expenses. This example is intended to help you understand your ongoing costs (in dollars) of investing in a Wasatch Fund and to compare these costs with the ongoing costs of investing in other mutual funds.
The example is based on an investment of $1,000.00 invested at the beginning of the period and held for the entire six month period ended March 31, 2013.
ACTUAL EXPENSES
The first line of the table below provides information about actual account values and actual expenses, based upon the actual total return of the fund during the most recent six month period ended March 31, 2013. You may use the information in this line, together with the amount you invested, to estimate the expenses you paid over the period. Simply divide your account value by $1,000.00 (for example, an $8,600.00 account value divided by $1,000.00 = 8.6), then multiply the result by the number in the first line under the heading entitled “Expenses Paid During Period” to estimate the expenses you paid on your account during this period.
In addition, the Funds charge a $15.00 IRA distribution fee, a $12.50 IRA annual maintenance fee and a $15.00 fee for redemptions paid by wire. To the extent these fees apply to your account, your expenses paid during the period would be higher and your ending account value would be lower than the amounts shown in the table below.
HYPOTHETICAL EXAMPLEFOR COMPARISON PURPOSES
The second line of the table below provides information about hypothetical account values and hypothetical expenses
based on a fund’s actual expense ratio and an assumed rate of return of 5% per year before expenses, which is not the fund’s actual return. The hypothetical account values and expenses may not be used to estimate the actual ending account balance or expenses you paid for the period. You may use this information to compare the ongoing costs of investing in a Wasatch Fund and other funds. To do so, compare this 5% hypothetical example with the 5% hypothetical examples that appear in the shareholder reports of other funds.
In addition, the Funds charge a $15.00 IRA distribution fee, a $12.50 IRA annual maintenance fee and a $15.00 fee for redemptions paid by wire. To the extent these fees apply to your account, your expenses paid during the period would be higher and your ending account value would be lower than the amounts shown in the table below. If another fund’s fees differ from those listed above, your expenses paid and your ending account value could be higher or lower than those of other funds.
Please note that the expenses shown in the table are meant to highlight your ongoing costs only and do not reflect any transactional costs, such as redemption fees. Therefore, the second line of the table is useful in comparing ongoing costs only, and will not help you determine the relative total costs of owning different funds. In addition, if these transactional costs were included, your costs would have been higher.
A Fund’s annualized expense ratio may vary as a result of various factors including expenses that are not reimbursable under the contractual agreement between the Fund and the Advisor such as interest, taxes, brokerage commissions, other investment related costs, dividend expense on short sales, and extraordinary expenses. The Long/Short Investor Class and Income funds have no contractual limitation on expenses.
45
| | |
| WASATCH FUNDS — OPERATING EXPENSES (UNAUDITED) (continued) | | |
|
|
|
| | | | | | | | | | | | | | | | |
| | | Account Value | | | Expenses
Paid
During Period* | | | Annualized
Expense
Ratio* | |
| Fund/Class and Return | | Beginning of Period
October 1, 2012 | | | End of Period
March 31, 2013 | | | |
Core Growth Fund — Investor Class | | | | | | | | | | | | | | | | |
Actual | | | $1,000.00 | | | | $1,119.80 | | | | $6.39 | | | | 1.21% | |
Hypothetical (5% before expenses) | | | $1,000.00 | | | | $1,018.90 | | | | $6.09 | | | | 1.21% | |
Core Growth Fund — Institutional Class | | | | | | | | | | | | | | | | |
Actual | | | $1,000.00 | | | | $1,120.20 | | | | $5.92 | | | | 1.12% | |
Hypothetical (5% before expenses) | | | $1,000.00 | | | | $1,019.35 | | | | $5.64 | | | | 1.12% | |
Emerging India Fund | | | | | | | | | | | | | | | | |
Actual | | | $1,000.00 | | | | $970.30 | | | | $9.58 | | | | 1.95% | |
Hypothetical (5% before expenses) | | | $1,000.00 | | | | $1,015.21 | | | | $9.80 | | | | 1.95% | |
Emerging Markets Select Fund — Investor Class | | | | | | | | | | | | | | | | |
Actual | | | $1,000.00 | | | | $1,039.00 | | | | $5.15 | | | | 1.69% | |
Hypothetical (5% before expenses) | | | $1,000.00 | | | | $1,009.88 | | | | $5.07 | | | | 1.69% | |
Emerging Markets Select Fund — Institutional Class | | | | | | | | | | | | | | | | |
Actual | | | $1,000.00 | | | | $1,040.00 | | | | $4.57 | | | | 1.50% | |
Hypothetical (5% before expenses) | | | $1,000.00 | | | | $1,010.45 | | | | $4.50 | | | | 1.50% | |
Emerging Markets Small Cap Fund | | | | | | | | | | | | | | | | |
Actual | | | $1,000.00 | | | | $1,110.50 | | | | $10.26 | | | | 1.95% | |
Hypothetical (5% before expenses) | | | $1,000.00 | | | | $1,015.21 | | | | $9.80 | | | | 1.95% | |
Frontier Emerging Small Countries Fund | | | | | | | | | | | | | | | | |
Actual | | | $1,000.00 | | | | $1,183.30 | | | | $12.25 | | | | 2.25% | |
Hypothetical (5% before expenses) | | | $1,000.00 | | | | $1,013.71 | | | | $11.30 | | | | 2.25% | |
Global Opportunities Fund | | | | | | | | | | | | | | | | |
Actual | | | $1,000.00 | | | | $1,139.20 | | | | $9.55 | | | | 1.79% | |
Hypothetical (5% before expenses) | | | $1,000.00 | | | | $1,016.01 | | | | $9.00 | | | | 1.79% | |
Heritage Growth Fund | | | | | | | | | | | | | | | | |
Actual | | | $1,000.00 | | | | $1,100.80 | | | | $4.98 | | | | 0.95% | |
Hypothetical (5% before expenses) | | | $1,000.00 | | | | $1,020.20 | | | | $4.78 | | | | 0.95% | |
International Growth Fund | | | | | | | | | | | | | | | | |
Actual | | | $1,000.00 | | | | $1,161.00 | | | | $7.97 | | | | 1.48% | |
Hypothetical (5% before expenses) | | | $1,000.00 | | | | $1,017.55 | | | | $7.44 | | | | 1.48% | |
International Opportunities Fund | | | | | | | | | | | | | | | | |
Actual | | | $1,000.00 | | | | $1,186.70 | | | | $12.27 | | | | 2.25% | |
Hypothetical (5% before expenses) | | | $1,000.00 | | | | $1,013.71 | | | | $11.30 | | | | 2.25% | |
Large Cap Value Fund — Investor Class | | | | | | | | | | | | | | | | |
Actual | | | $1,000.00 | | | | $1,117.80 | | | | $5.81 | | | | 1.10% | |
Hypothetical (5% before expenses) | | | $1,000.00 | | | | $1,019.45 | | | | $5.54 | | | | 1.10% | |
Large Cap Value Fund — Institutional Class | | | | | | | | | | | | | | | | |
Actual | | | $1,000.00 | | | | $1,117.70 | | | | $5.17 | | | | 0.98% | |
Hypothetical (5% before expenses) | | | $1,000.00 | | | | $1,020.05 | | | | $4.94 | | | | 0.98% | |
Long/Short Fund — Investor Class | | | | | | | | | | | | | | | | |
Actual | | | $1,000.00 | | | | $1,116.20 | | | | $7.81 | | | | 1.48% | |
Hypothetical (5% before expenses) | | | $1,000.00 | | | | $1,017.55 | | | | $7.44 | | | | 1.48% | |
Long/Short Fund — Institutional Class | | | | | | | | | | | | | | | | |
Actual | | | $1,000.00 | | | | $1,104.80 | | | | $4.21 | | | | 1.34% | |
Hypothetical (5% before expenses) | | | $1,000.00 | | | | $1,010.93 | | | | $4.02 | | | | 1.34% | |
Micro Cap Fund | | | | | | | | | | | | | | | | |
Actual | | | $1,000.00 | | | | $1,084.10 | | | | $11.17 | | | | 2.15% | |
Hypothetical (5% before expenses) | | | $1,000.00 | | | | $1,014.21 | | | | $10.80 | | | | 2.15% | |
Micro Cap Value Fund | | | | | | | | | | | | | | | | |
Actual | | | $1,000.00 | | | | $1,164.50 | | | | $12.14 | | | | 2.25% | |
Hypothetical (5% before expenses) | | | $1,000.00 | | | | $1,013.71 | | | | $11.30 | | | | 2.25% | |
Small Cap Growth Fund | | | | | | | | | | | | | | | | |
Actual | | | $1,000.00 | | | | $1,100.50 | | | | $6.49 | | | | 1.24% | |
Hypothetical (5% before expenses) | | | $1,000.00 | | | | $1,018.75 | | | | $6.24 | | | | 1.24% | |
46
| | | | | | | | | | | | | | | | |
| | | Account Value | | | Expenses
Paid
During Period* | | | Annualized
Expense
Ratio* | |
| Fund/Class and Return | | Beginning of Period
October 1, 2012 | | | End of Period
March 31, 2013 | | | |
Small Cap Value Fund — Investor Class | | | | | | | | | | | | | | | | |
Actual | | | $1,000.00 | | | | $1,162.70 | | | | $7.01 | | | | 1.30% | |
Hypothetical (5% before expenses) | | | $1,000.00 | | | | $1,018.45 | | | | $6.54 | | | | 1.30% | |
Small Cap Value Fund — Institutional Class | | | | | | | | | | | | | | | | |
Actual | | | $1,000.00 | | | | $1,162.30 | | | | $6.20 | | | | 1.15% | |
Hypothetical (5% before expenses) | | | $1,000.00 | | | | $1,019.20 | | | | $5.79 | | | | 1.15% | |
Strategic Income Fund | | | | | | | | | | | | | | | | |
Actual | | | $1,000.00 | | | | $1,128.30 | | | | $5.04 | | | | 0.95% | |
Hypothetical (5% before expenses) | | | $1,000.00 | | | | $1,020.20 | | | | $4.78 | | | | 0.95% | |
Ultra Growth Fund | | | | | | | | | | | | | | | | |
Actual | | | $1,000.00 | | | | $1,086.10 | | | | $6.81 | | | | 1.31% | |
Hypothetical (5% before expenses) | | | $1,000.00 | | | | $1,018.40 | | | | $6.59 | | | | 1.31% | |
World Innovators Fund | | | | | | | | | | | | | | | | |
Actual | | | $1,000.00 | | | | $1,082.50 | | | | $9.35 | | | | 1.80% | |
Hypothetical (5% before expenses) | | | $1,000.00 | | | | $1,015.96 | | | | $9.05 | | | | 1.80% | |
Income Fund | | | | | | | | | | | | | | | | |
Actual | | | $1,000.00 | | | | $1,002.90 | | | | $3.55 | | | | 0.71% | |
Hypothetical (5% before expenses) | | | $1,000.00 | | | | $1,021.39 | | | | $3.58 | | | | 0.71% | |
U.S. Treasury Fund | | | | | | | | | | | | | | | | |
Actual | | | $1,000.00 | | | | $949.10 | | | | $3.50 | | | | 0.72% | |
Hypothetical (5% before expenses) | | | $1,000.00 | | | | $1,021.34 | | | | $3.63 | | | | 0.72% | |
*Expenses are equal to a fund’s annualized expense ratio as indicated above multiplied by the average account value over the period, multiplied by the number of days in the most recent fiscal half-year divided by the number of days in the full fiscal year (182/365), except for the Long/Short Fund — Institutional Class and the Emerging Markets Select Fund, which have 109 days in the most recent fiscal period due to their inception date of December 13, 2012.
47
| | |
| WASATCH CORE GROWTH FUND (WGROX/ WIGRX) — Schedule of Investments | | |
|
|
|
| | | | | | | | |
| Shares | | | | | Value | |
| | | | | | | |
| | | | COMMON STOCKS 88.6% | | | | |
| | |
| | | | Airlines 2.3% | | | | |
| | 203,151 | | | Allegiant Travel Co. | | $ | 18,035,746 | |
| | | | | | | | |
| | | | Apparel Retail 0.7% | | | | |
| | 331,430 | | | Chico’s FAS, Inc. | | | 5,568,024 | |
| | | | | | | | |
| | | | Application Software 5.4% | | | | |
| | 215,701 | | | ANSYS, Inc.* | | | 17,562,375 | |
| | 263,619 | | | RealPage, Inc.* | | | 5,459,550 | |
| | 153,392 | | | Tyler Technologies, Inc.* | | | 9,396,794 | |
| | 89,146 | | | Ultimate Software Group, Inc.* | | | 9,285,447 | |
| | | | | | | | |
| | | | | | | 41,704,166 | |
| | | | | | | | |
| | | | Asset Management & Custody Banks 4.7% | | | | |
| | 114,399 | | | Affiliated Managers Group, Inc.* | | | 17,568,254 | |
| | 654,603 | | | SEI Investments Co. | | | 18,885,297 | |
| | | | | | | | |
| | | | | | | 36,453,551 | |
| | | | | | | | |
| | | | Automobile Manufacturers 1.7% | | | | |
| | 341,045 | | | Tesla Motors, Inc.* | | | 12,922,195 | |
| | | | | | | | |
| | | | Automotive Retail 1.5% | | | | |
| | 288,999 | | | Monro Muffler Brake, Inc. | | | 11,476,150 | |
| | | | | | | | |
| | | | Commercial Printing 1.9% | | | | |
| | 978,904 | | | InnerWorkings, Inc.* | | | 14,820,607 | |
| | | | | | | | |
| | | | Consumer Electronics 0.1% | | | | |
| | 144,740 | | | Skullcandy, Inc.* | | | 764,227 | |
| | | | | | | | |
| | | | Consumer Finance 5.7% | | | | |
| | 897,842 | | | DFC Global Corp.* | | | 14,940,091 | |
| | 192,168 | | | First Cash Financial Services, Inc.* | | | 11,211,081 | |
| | 1,553,500 | | | Mahindra & Mahindra Financial Services Ltd. (India) | | | 5,588,027 | |
| | 97,185 | | | Portfolio Recovery Associates, Inc.* | | | 12,334,720 | |
| | | | | | | | |
| | | | | | | 44,073,919 | |
| | | | | | | | |
| | | | Data Processing & Outsourced Services 5.4% | | | | |
| | 124,818 | | | Alliance Data Systems Corp.* | | | 20,206,786 | |
| | 351,631 | | | ExlService Holdings, Inc.* | | | 11,561,628 | |
| | 746,608 | | | Higher One Holdings, Inc.* | | | 6,637,345 | |
| | 55,681 | | | Syntel, Inc. | | | 3,759,581 | |
| | | | | | | | |
| | | | | | | 42,165,340 | |
| | | | | | | | |
| | | | Distributors 1.5% | | | | |
| | 239,077 | | | Pool Corp. | | | 11,475,696 | |
| | | | | | | | |
| | | | Diversified Banks 2.8% | | | | |
| | 7,941,426 | | | City Union Bank Ltd. (India) | | | 7,685,722 | |
| | 1,985,356 | | | City Union Bank Ltd. — Partly Paid-up Equity Shares* (India) | | | 1,475,775 | |
| | 1,630,720 | | | Yes Bank Ltd. (India) | | | 12,916,743 | |
| | | | | | | | |
| | | | | | | 22,078,240 | |
| | | | | | | | |
| | | | Diversified Support Services 5.4% | | | | |
| | 1,217,075 | | | Copart, Inc.* | | | 41,721,331 | |
| | | | | | | | |
| | | | Electrical Components & Equipment 2.9% | | | | |
| | 554,058 | | | Polypore International, Inc.* | | | 22,262,050 | |
| | | | | | | | |
| | | | Environmental & Facilities Services 4.7% | | | | |
| | 364,490 | | | Tetra Tech, Inc.* | | | 11,113,300 | |
| | 698,047 | | | Waste Connections, Inc. | | | 25,115,731 | |
| | | | | | | | |
| | | | | | | 36,229,031 | |
| | | | | | | | |
| | | | General Merchandise Stores 0.6% | | | | |
| | 391,115 | | | Gordmans Stores, Inc.* | | | 4,579,957 | |
| | | | | | | | |
| | | | | | | | |
| Shares | | | | | Value | |
| | | | | | | |
| | | | Health Care Facilities 2.3% | | | | |
| | 539,076 | | | Ensign Group, Inc. (The) | | $ | 18,005,138 | |
| | | | | | | | |
| | | | Health Care Services 4.2% | | | | |
| | 206,803 | | | IPC The Hospitalist Co., Inc.* | | | 9,198,597 | |
| | 258,850 | | | MEDNAX, Inc.* | | | 23,200,726 | |
| | | | | | | | |
| | | | | | | 32,399,323 | |
| | | | | | | | |
| | | | Industrial Machinery 4.4% | | | | |
| | 147,926 | | | Graco, Inc. | | | 8,584,146 | |
| | 476,005 | | | IDEX Corp. | | | 25,428,187 | |
| | | | | | | | |
| | | | | | | 34,012,333 | |
| | | | | | | | |
| | | | Internet Retail 0.5% | | | | |
| | 107,590 | | | Blue Nile, Inc.* | | | 3,706,476 | |
| | | | | | | | |
| | | | Internet Software & Services 3.0% | | | | |
| | 247,566 | | | Dealertrack Technologies, Inc.* | | | 7,273,489 | |
| | 425,755 | | | Vistaprint N.V.* | | | 16,459,688 | |
| | | | | | | | |
| | | | | | | 23,733,177 | |
| | | | | | | | |
| | | | Leisure Facilities 3.2% | | | | |
| | 591,064 | | | Life Time Fitness, Inc.* | | | 25,285,718 | |
| | | | | | | | |
| | | | Life Sciences Tools & Services 1.9% | | | | |
| | 323,130 | | | ICON plc* (Ireland) | | | 10,433,868 | |
| | 68,040 | | | Techne Corp. | | | 4,616,514 | |
| | | | | | | | |
| | | | | | | 15,050,382 | |
| | | | | | | | |
| | | | Oil & Gas Equipment & Services 2.4% | | | | |
| | 91,526 | | | CARBO Ceramics, Inc. | | | 8,335,273 | |
| | 117,555 | | | Dril-Quip, Inc.* | | | 10,247,269 | |
| | | | | | | | |
| | | | | | | 18,582,542 | |
| | | | | | | | |
| | | | Oil & Gas Exploration & Production 0.2% | | | | |
| | 320,020 | | | SandRidge Energy, Inc.* | | | 1,686,505 | |
| | | | | | | | |
| | | | Oil & Gas Refining & Marketing 1.2% | | | | |
| | 240,584 | | | World Fuel Services Corp. | | | 9,555,996 | |
| | | | | | | | |
| | | | Personal Products 1.9% | | | | |
| | 398,345 | | | Herbalife Ltd. | | | 14,918,020 | |
| | | | | | | | |
| | | | Real Estate Services 0.4% | | | | |
| | 158,871 | | | LPS Brasil — Consultoria de Imoveis S.A. (Brazil) | | | 2,827,963 | |
| | | | | | | | |
| | | | Research & Consulting Services 3.2% | | | | |
| | 423,154 | | | Acacia Research Corp.* | | | 12,766,556 | |
| | 208,513 | | | Corporate Executive Board Co. (The) | | | 12,127,116 | |
| | | | | | | | |
| | | | | | | 24,893,672 | |
| | | | | | | | |
| | | | Semiconductors 3.4% | | | | |
| | 133,940 | | | Hittite Microwave Corp.* | | | 8,111,406 | |
| | 387,065 | | | Melexis N.V. (Belgium) | | | 7,239,525 | |
| | 108,525 | | | Power Integrations, Inc. | | | 4,711,070 | |
| | 151,643 | | | Silicon Laboratories, Inc.* | | | 6,271,955 | |
| | | | | | | | |
| | | | | | | 26,333,956 | |
| | | | | | | | |
| | | | Specialized Finance 0.8% | | | | |
| | 402,640 | | | CRISIL Ltd. (India) | | | 6,541,511 | |
| | | | | | | | |
| | | | Specialty Chemicals 1.3% | | | | |
| | 230,755 | | | Balchem Corp. | | | 10,139,375 | |
| | | | | | | | |
| | | | Specialty Stores 1.1% | | | | |
| | 156,551 | | | Hibbett Sports, Inc.* | | | 8,809,125 | |
| | | | | | | | |
| | | | Trading Companies & Distributors 3.2% | | | | |
| | 255,043 | | | MSC Industrial Direct Co., Inc., Class A | | | 21,877,589 | |
| | 143,605 | | | Rush Enterprises, Inc., Class B* | | | 2,958,263 | |
| | | | | | | | |
| | | | | | | 24,835,852 | |
| | | | | | | | |
48
| | |
| | MARCH 31, 2013 (UNAUDITED) |
|
|
|
| | | | | | | | |
| Shares | | | | | Value | |
| | | | | | | |
| | | | Trucking 2.7% | | | | |
| | 600,940 | | | Knight Transportation, Inc. | | $ | 9,675,134 | |
| | 302,485 | | | Old Dominion Freight Line, Inc.* | | | 11,554,927 | |
| | | | | | | | |
| | | | | | | 21,230,061 | |
| | | | | | | | |
| | |
| | | | Total Common Stocks
(cost $460,162,853) | | | 688,877,355 | |
| | | | | | | | |
| | |
| | | | PREFERRED STOCKS 0.7% | | | | |
| | |
| | | | Regional Banks 0.7% | | | | |
| | 977,675 | | | Banco Daycoval S.A. Pfd. (Brazil) | | | 5,857,565 | |
| | | | | | | | |
| | |
| | | | Total Preferred Stocks
(cost $6,232,161) | | | 5,857,565 | |
| | | | | | | | |
| | |
Principal
Amount | | | | | Value | |
| | | | | | | |
| | |
| | | | SHORT-TERM INVESTMENTS 10.7% | | | | |
| | |
| | | | Repurchase Agreement 10.7% | | | | |
| | $82,958,400 | | | Repurchase Agreement dated 3/28/13, 0.01% due 4/1/13 with State Street Bank and Trust Co. collateralized by $82,760,000 of United States Treasury Notes 1.000% due 03/31/17; value: $84,621,769; repurchase proceeds: $82,958,492 (cost $82,958,400) | | $ | 82,958,400 | |
| | | | | | | | |
| | |
| | | | Total Short-Term Investments
(cost $82,958,400) | | | 82,958,400 | |
| | | | | | | | |
| | |
| | | | Total Investments
(cost $549,353,414) 100.0% | | | 777,693,320 | |
| | |
| | | | Liabilities less Other Assets (<0.1%) | | | (225,869 | ) |
| | | | | | | | |
| | |
| | | | NET ASSETS 100.0% | | $ | 777,467,451 | |
| | | | | | | | |
| | |
| | | | *Non-income producing. | | | | |
| | |
| | | | See Notes to Financial Statements. | | | | |
At March 31, 2013, Wasatch Core Growth Fund’s investments, excluding short-term investments, were in the following countries:
| | | | |
| Country | | % | |
Belgium | | | 1.0 | |
Brazil | | | 1.3 | |
India | | | 4.9 | |
Ireland | | | 1.5 | |
United States | | | 91.3 | |
| | | | |
TOTAL | | | 100.0 | % |
| | | | |
49
| | |
| WASATCH EMERGING INDIA FUND (WAINX) — Schedule of Investments | | |
|
|
|
| | | | | | | | |
| Shares | | | | | Value | |
| | | | | | | |
| | | | COMMON STOCKS 98.9% | | | | |
| | |
| | | | Air Freight & Logistics 2.0% | | | | |
| | 6,675 | | | Blue Dart Express Ltd. (India) | | $ | 286,282 | |
| | | | | | | | |
| | | | Apparel, Accessories & Luxury Goods 3.3% | | | | |
| | 4,751 | | | Page Industries Ltd. (India) | | | 291,092 | |
| | 41,059 | | | Titan Industries Ltd. (India) | | | 191,999 | |
| | | | | | | | |
| | | | | | | 483,091 | |
| | | | | | | | |
| | | | Application Software 1.0% | | | | |
| | 2,943 | | | Oracle Financial Services Software Ltd.* (India) | | | 140,389 | |
| | | | | | | | |
| | | | Auto Parts & Equipment 5.2% | | | | |
| | 1,994 | | | Bosch Ltd. (India) | | | 330,377 | |
| | 60,881 | | | Exide Industries Ltd. (India) | | | 144,837 | |
| | 11,465 | | | WABCO India Ltd. (India) | | | 291,129 | |
| | | | | | | | |
| | | | | | | 766,343 | |
| | | | | | | | |
| | | | Automobile Manufacturers 1.1% | | | | |
| | 10,037 | | | Mahindra & Mahindra Ltd. (India) | | | 159,105 | |
| | | | | | | | |
| | | | Cable & Satellite 1.1% | | | | |
| | 134,447 | | | Dish TV India Ltd.* (India) | | | 166,976 | |
| | | | | | | | |
| | | | Commodity Chemicals 3.6% | | | | |
| | 100,031 | | | Berger Paints India Ltd. (India) | | | 359,541 | |
| | 27,432 | | | Castrol India Ltd. (India) | | | 159,999 | |
| | | | | | | | |
| | | | | | | 519,540 | |
| | | | | | | | |
| | | | Construction & Farm Machinery & Heavy Trucks 1.9% | | | | |
| | 5,997 | | | Eicher Motors Ltd. (India) | | | 280,816 | |
| | | | | | | | |
| | | | Consumer Finance 5.6% | | | | |
| | 133,665 | | | Mahindra & Mahindra Financial Services Ltd. (India) | | | 480,800 | |
| | 17,175 | | | Shriram City Union Finance Ltd. (India) | | | 341,288 | |
| | | | | | | | |
| | | | | | | 822,088 | |
| | | | | | | | |
| | | | Diversified Banks 9.5% | | | | |
| | 18,420 | | | Axis Bank Ltd. (India) | | | 442,283 | |
| | 225,774 | | | City Union Bank Ltd. (India) | | | 218,504 | |
| | 83,840 | | | City Union Bank Ltd. — Partly Paid-up Equity Shares* (India) | | | 62,321 | |
| | 52,505 | | | IndusInd Bank Ltd. (India) | | | 389,320 | |
| | 35,607 | | | Yes Bank Ltd. (India) | | | 282,039 | |
| | | | | | | | |
| | | | | | | 1,394,467 | |
| | | | | | | | |
| | | | Diversified Chemicals 3.2% | | | | |
| | 16,876 | | | BASF India Ltd. (India) | | | 179,178 | |
| | 60,613 | | | Pidilite Industries Ltd. (India) | | | 295,537 | |
| | | | | | | | |
| | | | | | | 474,715 | |
| | | | | | | | |
| | | | Electrical Components & Equipment 3.2% | | | | |
| | 91,185 | | | Amara Raja Batteries Ltd. (India) | | | 468,340 | |
| | | | | | | | |
| | | | Fertilizers & Agricultural Chemicals 1.2% | | | | |
| | 82,382 | | | Rallis India Ltd. (India) | | | 175,829 | |
| | | | | | | | |
| | | | Footwear 1.7% | | | | |
| | 19,087 | | | Bata India Ltd. (India) | | | 251,063 | |
| | | | | | | | |
| | | | Heavy Electrical Equipment 1.7% | | | | |
| | 50,229 | | | TD Power Systems Ltd. (India) | | | 244,630 | |
| | | | | | | | |
| | | | Household Appliances 2.3% | | | | |
| | 4,713 | | | Hawkins Cookers Ltd. (India) | | | 186,348 | |
| | 2,581 | | | TTK Prestige Ltd. (India) | | | 153,632 | |
| | | | | | | | |
| | | | | | | 339,980 | |
| | | | | | | | |
| | | | | | | | |
| Shares | | | | | Value | |
| | | | | | | |
| | | | Industrial Machinery 3.8% | | | | |
| | 26,348 | | | Cummins India Ltd. (India) | | $ | 237,544 | |
| | 7,529 | | | FAG Bearings India Ltd. (India) | | | 203,636 | |
| | 10,673 | | | SKF India Ltd. (India) | | | 108,036 | |
| | | | | | | | |
| | | | | | | 549,216 | |
| | | | | | | | |
| | | | Internet Retail 1.5% | | | | |
| | 15,524 | | | MakeMyTrip Ltd.* (India) | | | 215,784 | |
| | | | | | | | |
| | | | Internet Software & Services 1.0% | | | | |
| | 22,610 | | | Info Edge India Ltd. (India) | | | 149,763 | |
| | | | | | | | |
| | | | IT Consulting & Other Services 6.9% | | | | |
| | 15,434 | | | CMC Ltd. (India) | | | 385,495 | |
| | 5,788 | | | Cognizant Technology Solutions Corp., Class A* | | | 443,419 | |
| | 11,900 | | | HCL Technologies Ltd. (India) | | | 175,161 | |
| | | | | | | | |
| | | | | | | 1,004,075 | |
| | | | | | | | |
| | | | Life Sciences Tools & Services 1.2% | | | | |
| | 9,453 | | | Divi’s Laboratories Ltd. (India) | | | 173,406 | |
| | | | | | | | |
| | | | Other Diversified Financial Services 1.8% | | | | |
| | 21,700 | | | Kotak Mahindra Bank Ltd. (India) | | | 261,917 | |
| | | | | | | | |
| | | | Packaged Foods & Meats 3.2% | | | | |
| | 3,833 | | | GlaxoSmithKline Consumer Healthcare Ltd. (India) | | | 296,202 | |
| | 2,041 | | | Nestlé India Ltd. (India) | | | 173,119 | |
| | | | | | | | |
| | | | | | | 469,321 | |
| | | | | | | | |
| | | | Personal Products 7.8% | | | | |
| | 11,407 | | | Colgate-Palmolive India Ltd. (India) | | | 261,721 | |
| | 82,838 | | | Dabur India Ltd. (India) | | | 210,029 | |
| | 24,972 | | | Godrej Consumer Products Ltd. (India) | | | 356,086 | |
| | 47,903 | | | Marico Ltd. (India) | | | 186,853 | |
| | 2,582 | | | Procter & Gamble Hygiene & Health Care Ltd. (India) | | | 119,955 | |
| | | | | | | | |
| | | | | | | 1,134,644 | |
| | | | | | | | |
| | | | Pharmaceuticals 6.5% | | | | |
| | 11,834 | | | Cadila Healthcare Ltd. (India) | | | 162,649 | |
| | 26,901 | | | Glenmark Pharmaceuticals Ltd. (India) | | | 228,671 | |
| | 23,684 | | | IPCA Laboratories Ltd. (India) | | | 237,494 | |
| | 27,169 | | | Lupin Ltd. (India) | | | 313,931 | |
| | | | | | | | |
| | | | | | | 942,745 | |
| | | | | | | | |
| | | | Publishing 1.4% | | | | |
| | 47,874 | | | D.B. Corp. Ltd. (India) | | | 198,631 | |
| | | | | | | | |
| | | | Restaurants 3.0% | | | | |
| | 19,491 | | | Jubilant Foodworks Ltd.* (India) | | | 443,613 | |
| | | | | | | | |
| | | | Specialized Finance 1.9% | | | | |
| | 17,390 | | | CRISIL Ltd. (India) | | | 282,528 | |
| | | | | | | | |
| | | | Specialty Chemicals 2.0% | | | | |
| | 3,168 | | | Asian Paints Ltd. (India) | | | 286,461 | |
| | | | | | | | |
| | | | Systems Software 1.9% | | | | |
| | 163,110 | | | KPIT Cummins Infosystems Ltd. (India) | | | 284,955 | |
| | | | | | | | |
| | | | Thrifts & Mortgage Finance 7.4% | | | | |
| | 135,227 | | | Gruh Finance Ltd. (India) | | | 529,712 | |
| | 26,037 | | | Housing Development Finance Corp. Ltd. (India) | | | 394,004 | |
| | 36,229 | | | LIC Housing Finance Ltd. (India) | | | 150,215 | |
| | | | | | | | |
| | | | | | | 1,073,931 | |
| | | | | | | | |
50
| | |
| | MARCH 31, 2013 (UNAUDITED) |
|
|
|
| | | | | | |
| Shares | | | | Value | |
| | | | | | |
| | |
| | Total Common Stocks (cost $13,190,415) | | $ | 14,444,644 | |
| | | | | | |
| | |
| | Total Investments (cost $13,190,415) 98.9% | | | 14,444,644 | |
| | |
| | Other Assets less Liabilities 1.1% | | | 156,750 | |
| | | | | | |
| | |
| | NET ASSETS 100.0% | | $ | 14,601,394 | |
| | | | | | |
| |
| | *Non-income producing. See Notes to Financial Statements. | |
At March 31, 2013, Wasatch Emerging India Fund’s investments were in the following countries:
| | | | |
| Country | | % | |
India | | | 96.9 | |
United States | | | 3.1 | |
| | | | |
TOTAL | | | 100.0 | % |
| | | | |
51
| | |
| WASATCH EMERGING MARKETS SELECT FUND (WAESX / WIESX) — Schedule of Investments | | (UNAUDITED) |
|
|
|
| | | | | | | | |
| Shares | | | | | Value | |
| | | | | | | |
| | | | COMMON STOCKS 94.3% | | | | |
| | |
| | | | Casinos & Gaming 5.8% | | | | |
| | 155,239 | | | Galaxy Entertainment Group Ltd.*
(Hong Kong) | | $ | 647,925 | |
| | 265,400 | | | SJM Holdings Ltd. (Hong Kong) | | | 663,256 | |
| | | | | | | | |
| | | | | | | 1,311,181 | |
| | | | | | | | |
| | | | Construction Materials 5.5% | | | | |
| | 81,999 | | | Cemex Latam Holdings S.A.* (Colombia) | | | 615,441 | |
| | 346,027 | | | PT Semen Indonesia Persero Tbk (Indonesia) | | | 630,273 | |
| | | | | | | | |
| | | | | | | 1,245,714 | |
| | | | | | | | |
| | | | Department Stores 2.9% | | | | |
| | 17,400 | | | Lojas Renner S.A. (Brazil) | | | 652,592 | |
| | | | | | | | |
| | | | Distributors 3.0% | | | | |
| | 29,660 | | | Imperial Holdings Ltd. (South Africa) | | | 675,915 | |
| | | | | | | | |
| | | | Diversified Banks 17.2% | | | | |
| | 4,038,406 | | | Banco de Chile (Chile) | | | 636,381 | |
| | 545,359 | | | Bank of Ayudhya Public Co. Ltd. (Thailand) | | | 647,131 | |
| | 3,994 | | | Credicorp Ltd. (Peru) | | | 663,203 | |
| | 84,342 | | | IndusInd Bank Ltd. (India) | | | 625,388 | |
| | 226,176 | | | Metropolitan Bank & Trust (Philippines) | | | 648,442 | |
| | 61,900 | | | Turkiye Halk Bankasi A.S. (Turkey) | | | 668,164 | |
| | | | | | | | |
| | | | | | | 3,888,709 | |
| | | | | | | | |
| | | | Drug Retail 2.6% | | | | |
| | 54,516 | | | Raia Drogasil S.A. (Brazil) | | | 582,676 | |
| | | | | | | | |
| | | | Food Retail 11.4% | | | | |
| | 13,072 | | | BIM Birlesik Magazalar A.S. (Turkey) | | | 638,750 | |
| | 413,518 | | | CP ALL Public Co. Ltd. (Thailand) | | | 653,072 | |
| | 3,271 | | | Magnit (Russia) | | | 631,183 | |
| | 32,776 | | | Shoprite Holdings Ltd. (South Africa) | | | 649,469 | |
| | | | | | | | |
| | | | | | | 2,572,474 | |
| | | | | | | | |
| | | | Health Care Facilities 2.9% | | | | |
| | 175,566 | | | Life Healthcare Group Holdings Ltd. (South Africa) | | | 658,481 | |
| | | | | | | | |
| | | | Household Products 2.8% | | | | |
| | 1,162 | | | LG Household & Health Care Ltd. (Korea) | | | 643,351 | |
| | | | | | | | |
| | | | Hypermarkets & Super Centers 2.8% | | | | |
| | 87,886 | | | Big C Supercenter Public Co. Ltd. NVDR (Thailand) | | | 645,228 | |
| | | | | | | | |
| | | | Life & Health Insurance 2.8% | | | | |
| | 123,133 | | | Sanlam Ltd. (South Africa) | | | 629,737 | |
| | | | | | | | |
| | | | Marine Ports & Services 3.0% | | | | |
| | 301,396 | | | International Container Terminal Services, Inc. (Philippines) | | | 679,755 | |
| | | | | | | | |
| | | | Multi-Sector Holdings 2.9% | | | | |
| | 479,793 | | | First Pacific Co. Ltd. (Hong Kong) | | | 650,202 | |
| | | | | | | | |
| | | | Packaged Foods & Meats 2.7% | | | | |
| | 15,303 | | | M Dias Branco S.A. (Brazil) | | | 605,289 | |
| | | | | | | | |
| | | | Personal Products 5.5% | | | | |
| | 25,806 | | | Colgate-Palmolive India Ltd. (India) | | | 592,090 | |
| | 46,232 | | | Godrej Consumer Products Ltd. (India) | | | 659,242 | |
| | | | | | | | |
| | | | | | | 1,251,332 | |
| | | | | | | | |
| | | | Pharmaceuticals 5.6% | | | | |
| | 55,708 | | | Lupin Ltd. (India) | | | 643,691 | |
| | 4,868,684 | | | PT Kalbe Farma Tbk (Indonesia) | | | 621,268 | |
| | | | | | | | |
| | | | | | | 1,264,959 | |
| | | | | | | | |
| | | | | | | | |
| Shares | | | | | Value | |
| | | | | | | |
| | | | Real Estate Operating Companies 5.7% | | | | |
| | 21,620 | | | Multiplan Empreendimentos Imobiliarios S.A. (Brazil) | | $ | 621,927 | |
| | 1,424,189 | | | SM Prime Holdings, Inc. (Philippines) | | | 667,057 | |
| | | | | | | | |
| | | | | | | 1,288,984 | |
| | | | | | | | |
| | | | Soft Drinks 3.2% | | | | |
| | 25,256 | | | Coca-Cola Icecek A.S. (Turkey) | | | 728,612 | |
| | | | | | | | |
| | | | Specialty Chemicals 3.0% | | | | |
| | 7,393 | | | Asian Paints Ltd. (India) | | | 668,499 | |
| | | | | | | | |
| | | | Wireless Telecommunication Services 3.0% | | | | |
| | 1,075,215 | | | PT Tower Bersama Infrastructure Tbk* (Indonesia) | | | 669,416 | |
| | | | | | | | |
| | |
| | | | Total Common Stocks (cost $20,612,012) | | | 21,313,106 | |
| | | | | | | | |
| | |
Principal
Amount | | | | | Value | |
| | | | | | | |
| | |
| | | | SHORT-TERM INVESTMENTS 5.5% | | | | |
| | |
| | | | Repurchase Agreement 5.5% | | | | |
| | $1,253,546 | | | Repurchase Agreement dated 3/28/13, 0.01% due 4/1/13 with State Street Bank and Trust Co. collateralized by $1,280,000 of United States Treasury Notes 0.625% due 9/30/17; value: $1,281,734; repurchase proceeds: $1,253,548 (cost $1,253,546) | | $ | 1,253,546 | |
| | | | | | | | |
| | |
| | | | Total Short-Term Investments (cost $1,253,546) | | | 1,253,546 | |
| | | | | | | | |
| | |
| | | | Total Investments (cost $21,865,558) 99.8%§ | | | 22,566,652 | |
| | |
| | | | Other Assets less Liabilities 0.2% | | | 39,376 | |
| | | | | | | | |
| | |
| | | | NET ASSETS 100.0% | | $ | 22,606,028 | |
| | | | | | | | |
| |
| | | | *Non-income producing. §The aggregate amount of foreign securities fair valued pursuant to a systematic valuation model as a percent of net assets was 8.83% (see Note 15). NVDR Non-Voting Depositary Receipt. See Notes to Financial Statements. | |
At March 31, 2013, Wasatch Emerging Markets Select Fund’s investments, excluding short-term investments, were in the following countries:
| | | | |
| Country | | % | |
Brazil | | | 11.5 | |
Chile | | | 3.0 | |
Colombia | | | 2.9 | |
Hong Kong | | | 9.2 | |
India | | | 15.0 | |
Indonesia | | | 9.0 | |
Korea | | | 3.0 | |
Peru | | | 3.1 | |
Philippines | | | 9.4 | |
Russia | | | 3.0 | |
South Africa | | | 12.3 | |
Thailand | | | 9.1 | |
Turkey | | | 9.5 | |
| | | | |
TOTAL | | | 100.0 | % |
| | | | |
52
| | |
| WASATCH EMERGING MARKETS SMALL CAP FUND (WAEMX) — Schedule of Investments | | |
|
|
|
| | | | | | | | |
| Shares | | | | | Value | |
| | | | | | | |
| | |
| | | | COMMON STOCKS 94.0% | | | | |
| | |
| | | | Airport Services 1.4% | | | | |
| | 3,806,118 | | | TAV Havalimanlari Holding A.S. (Turkey) | | $ | 26,268,655 | |
| | | | | | | | |
| | | | Apparel Retail 2.0% | | | | |
| | 1,310,032 | | | Mr Price Group Ltd. (South Africa) | | | 16,613,350 | |
| | 39,363,765 | | | Trinity Ltd. (China) | | | 20,181,735 | |
| | | | | | | | |
| | | | | | | 36,795,085 | |
| | | | | | | | |
| | | | Apparel, Accessories & Luxury Goods 1.3% | | | | |
| | 14,437 | | | LPP S.A. (Poland) | | | 25,035,004 | |
| | | | | | | | |
| | | | Asset Management & Custody Banks 0.9% | | | | |
| | 1,354,686 | | | CETIP S.A. — Mercados Organizados (Brazil) | | | 16,125,215 | |
| | | | | | | | |
| | | | Brewers 0.9% | | | | |
| | 2,814,487 | | | Guinness Anchor Berhad (Malaysia) | | | 16,687,867 | |
| | | | | | | | |
| | | | Cable & Satellite 0.9% | | | | |
| | 74,298,294 | | | PT MNC Sky Vision Tbk* (Indonesia) | | | 16,820,813 | |
| | | | | | | | |
| | | | Commercial Printing 0.8% | | | | |
| | 790,300 | | | Valid Solucoes e Servicos de Seguranca em Meios de Pagamento e Identificacao S.A (Brazil) | | | 15,286,646 | |
| | | | | | | | |
| | | | Commodity Chemicals 1.8% | | | | |
| | 5,227,113 | | | Berger Paints India Ltd. (India) | | | 18,787,792 | |
| | 2,715,428 | | | Castrol India Ltd. (India) | | | 15,837,915 | |
| | | | | | | | |
| | | | | | | 34,625,707 | |
| | | | | | | | |
| | | | Computer & Electronics Retail 0.9% | | | | |
| | 2,192,206 | | | M Video OJSC (Russia) | | | 17,200,487 | |
| | | | | | | | |
| | | | Construction & Engineering 1.6% | | | | |
| | 3,616,249 | | | Promotora y Operadora de Infraestructura S.A.B. de C.V.* (Mexico) | | | 29,127,179 | |
| | | | | | | | |
| | | | Construction & Farm Machinery & Heavy Trucks 1.1% | | | | |
| | 627,772 | | | Turk Traktor ve Ziraat Makineleri A.S. (Turkey) | | | 21,143,523 | |
| | | | | | | | |
| | | | Construction Materials 3.4% | | | | |
| | 30,812,605 | | | Holcim Philippines, Inc. (Philippines) | | | 10,358,955 | |
| | 6,559,757 | | | Lafarge Malayan Cement Berhad (Malaysia) | | | 21,099,686 | |
| | 86,317,777 | | | PT Holcim Indonesia Tbk (Indonesia) | | | 31,977,772 | |
| | | | | | | | |
| | | | | | | 63,436,413 | |
| | | | | | | | |
| | | | Consumer Finance 1.6% | | | | |
| | 8,238,590 | | | Mahindra & Mahindra Financial Services Ltd. (India) | | | 29,634,671 | |
| | | | | | | | |
| | | | Department Stores 0.9% | | | | |
| | 17,005,227 | | | PT Mitra Adiperkasa Tbk (Indonesia) | | | 15,924,627 | |
| | | | | | | | |
| | | | Distributors 0.7% | | | | |
| | 14,518,673 | | | Dah Chong Hong Holdings Ltd. (China) | | | 13,727,827 | |
| | | | | | | | |
| | | | Diversified Banks 7.5% | | | | |
| | 10,833,800 | | | EastWest Banking Corp.* (Philippines) | | | 8,864,678 | |
| | 2,500,197 | | | IndusInd Bank Ltd. (India) | | | 18,538,719 | |
| | 29,681,945 | | | PT Bank Tabungan Pensiunan Nasional Tbk* (Indonesia) | | | 16,188,763 | |
| | 7,345,051 | | | Security Bank Corp. (Philippines) | | | 32,771,367 | |
| | 10,588,129 | | | Tisco Financial Group Public Co. Ltd. (Thailand) | | | 20,066,285 | |
| | 17,082,720 | | | Turkiye Sinai Kalkinma Bankasi A.S. (Turkey) | | | 23,485,616 | |
| | 2,515,931 | | | Yes Bank Ltd. (India) | | | 19,928,396 | |
| | | | | | | | |
| | | | | | | 139,843,824 | |
| | | | | | | | |
| | | | | | | | |
| Shares | | | | | Value | |
| | | | | | | |
| | | | Diversified Chemicals 1.0% | | | | |
| | 3,926,023 | | | Pidilite Industries Ltd. (India) | | $ | 19,142,522 | |
| | | | | | | | |
| | | | Diversified Metals & Mining 0.7% | | | | |
| | 52,597,717 | | | PT Vale Indonesia Tbk (Indonesia) | | | 12,855,115 | |
| | | | | | | | |
| | | | Diversified REITs 1.0% | | | | |
| | 5,692,800 | | | Fibra Uno Administracion S.A. de C.V. (Mexico) | | | 18,778,917 | |
| | | | | | | | |
| | | | Drug Retail 1.9% | | | | |
| | 2,365,900 | | | Brazil Pharma S.A. (Brazil) | | | 16,721,178 | |
| | 2,954,295 | | | Clicks Group Ltd. (South Africa) | | | 18,570,925 | |
| | | | | | | | |
| | | | | | | 35,292,103 | |
| | | | | | | | |
| | | | Electronic Equipment & Instruments 0.9% | | | | |
| | 6,969,452 | | | Chroma ATE, Inc. (Taiwan) | | | 16,618,073 | |
| | | | | | | | |
| | | | Environmental & Facilities Services 1.3% | | | | |
| | 3,282,900 | | | Cleanaway Co. Ltd. (Taiwan) | | | 24,207,991 | |
| | | | | | | | |
| | | | Food Distributors 0.9% | | | | |
| | 1,029,671 | | | Bizim Toptan Satis Magazalari AS (Turkey) | | | 17,396,644 | |
| | | | | | | | |
| | | | Food Retail 1.4% | | | | |
| | 1,647,727 | | | Eurocash S.A. (Poland) | | | 26,878,856 | |
| | | | | | | | |
| | | | Footwear 0.9% | | | | |
| | 1,246,450 | | | Bata India Ltd. (India) | | | 16,395,347 | |
| | | | | | | | |
| | | | General Merchandise Stores 0.7% | | | | |
| | 2,892,923 | | | Taiwan FamilyMart Co. Ltd. (Taiwan) | | | 13,108,973 | |
| | | | | | | | |
| | | | Gold 1.0% | | | | |
| | 824,699 | | | Koza Altin Isletmeleri A.S. (Turkey) | | | 19,124,511 | |
| | | | | | | | |
| | | | Health Care Facilities 3.3% | | | | |
| | 13,658,543 | | | KPJ Healthcare Berhad (Malaysia) | | | 26,201,113 | |
| | 4,297,390 | | | Life Healthcare Group Holdings Ltd. (South Africa) | | | 16,117,862 | |
| | 1,108,648 | | | MD Medical Group Investments plc GDR* (Russia) | | | 19,478,945 | |
| | | | | | | | |
| | | | | | | 61,797,920 | |
| | | | | | | | |
| | | | Health Care Supplies 1.5% | | | | |
| | 1,420,804 | | | St. Shine Optical Co. Ltd. (Taiwan) | | | 28,413,704 | |
| | | | | | | | |
| | | | Home Improvement Retail 3.0% | | | | |
| | 68,174,328 | | | Home Product Center Public Co. Ltd. (Thailand) | | | 39,808,128 | |
| | 200,288,110 | | | PT Ace Hardware Indonesia Tbk (Indonesia) | | | 17,107,191 | |
| | | | | | | | |
| | | | | | | 56,915,319 | |
| | | | | | | | |
| | | | Hotels, Resorts & Cruise Lines 2.3% | | | | |
| | 52,250,831 | | | Minor International Public Co. Ltd. (Thailand) | | | 43,356,503 | |
| | | | | | | | |
| | | | Hypermarkets & Super Centers 5.2% | | | | |
| | 881,838 | | | Inretail Peru Corp.* (Peru) | | | 21,075,928 | |
| | 1,580,987 | | | O’Key Group S.A. GDR (Russia) | | | 18,023,252 | |
| | 23,562,901 | | | Puregold Price Club, Inc. (Philippines) | | | 23,139,631 | |
| | 1,891,230 | | | Siam Makro Public Co. Ltd. (Thailand) | | | 34,356,645 | |
| | | | | | | | |
| | | | | | | 96,595,456 | |
| | | | | | | | |
| | | | Industrial Machinery 0.7% | | | | |
| | 2,595,430 | | | Airtac International Group (Taiwan) | | | 13,279,852 | |
| | | | | | | | |
| | | | Internet Software & Services 0.1% | | | | |
| | 633,251 | | | PChome Online, Inc. (Taiwan) | | | 2,731,858 | |
| | | | | | | | |
| | | | IT Consulting & Other Services 1.6% | | | | |
| | 8,628,102 | | | Sonda S.A. (Chile) | | | 30,157,184 | |
| | | | | | | | |
53
| | |
| WASATCH EMERGING MARKETS SMALL CAP FUND (WAEMX) — Schedule of Investments (continued) | | |
|
|
|
| | | | | | | | |
| Shares | | | | | Value | |
| | | | | | | |
| | | | Leisure Products 1.2% | | | | |
| | 3,696,500 | | | Merida Industry Co. Ltd. (Taiwan) | | $ | 21,695,034 | |
| | | | | | | | |
| | | | Life & Health Insurance 2.0% | | | | |
| | 10,126,344 | | | Bangkok Life Assurance Public Co. Ltd. NVDR (Thailand) | | | 25,847,506 | |
| | 1,346,710 | | | Discovery Ltd. (South Africa) | | | 11,421,667 | |
| | | | | | | | |
| | | | | | | 37,269,173 | |
| | | | | | | | |
| | | | Life Sciences Tools & Services 0.8% | | | | |
| | 770,904 | | | Divi’s Laboratories Ltd. (India) | | | 14,141,514 | |
| | | | | | | | |
| | | | Managed Health Care 1.3% | | | | |
| | 2,397,131 | | | Qualicorp S.A.* (Brazil) | | | 24,146,674 | |
| | | | | | | | |
| | | | Marine Ports & Services 2.7% | | | | |
| | 871,759 | | | Global Ports Investments plc GDR (Russia) | | | 12,945,621 | |
| | 13,036,004 | | | International Container Terminal Services, Inc. (Philippines) | | | 29,400,823 | |
| | 583,740 | | | Santos Brasil Participacoes S.A.** (Brazil) | | | 8,743,433 | |
| | | | | | | | |
| | | | | | | 51,089,877 | |
| | | | | | | | |
| | | | Metal & Glass Containers 0.8% | | | | |
| | 6,102,000 | | | Taiwan Hon Chuan Enterprise Co. Ltd. (Taiwan) | | | 15,835,305 | |
| | | | | | | | |
| | | | Oil & Gas Exploration & Production 2.2% | | | | |
| | 4,098,494 | | | Afren plc* (Nigeria) | | | 8,826,468 | |
| | 579,258 | | | Coastal Energy Co.* (Thailand) | | | 11,055,195 | |
| | 2,306,980 | | | Gran Tierra Energy, Inc.* (Colombia) | | | 13,565,042 | |
| | 1,741,200 | | | Parex Resources, Inc.* (Colombia) | | | 7,930,896 | |
| | | | | | | | |
| | | | | | | 41,377,601 | |
| | | | | | | | |
| | | | Other Diversified Financial Services 1.2% | | | | |
| | 565,096 | | | Intergroup Financial Services Corp. (Peru) | | | 22,603,840 | |
| | | | | | | | |
| | | | Packaged Foods & Meats 6.8% | | | | |
| | 2,982,462 | | | AVI Ltd. (South Africa) | | | 17,364,274 | |
| | 3,371,717 | | | Biostime International Holdings Ltd. (China) | | | 17,569,057 | |
| | 316,618 | | | GlaxoSmithKline Consumer Healthcare Ltd. (India) | | | 24,467,260 | |
| | 6,354,777 | | | Standard Foods Corp. (Taiwan) | | | 19,126,492 | |
| | 1,232,426 | | | Ulker Biskuvi Sanayi AS (Turkey) | | | 9,288,361 | |
| | 14,040,085 | | | Universal Robina Corp. (Philippines) | | | 38,724,735 | |
| | | | | | | | |
| | | | | | | 126,540,179 | |
| | | | | | | | |
| | | | Paper Packaging 0.9% | | | | |
| | 24,692,986 | | | Greatview Aseptic Packaging Co. Ltd. (China) | | | 16,222,680 | |
| | | | | | | | |
| | | | Personal Products 1.2% | | | | |
| | 941,760 | | | Colgate-Palmolive India Ltd. (India) | | | 21,607,630 | |
| | | | | | | | |
| | | | Railroads 0.8% | | | | |
| | 938,945 | | | Globaltrans Investment plc GDR (Russia) | | | 14,816,552 | |
| | | | | | | | |
| | | | Real Estate Operating Companies 1.6% | | | | |
| | 11,913,407 | | | Parque Arauco S.A. (Chile) | | | 30,800,516 | |
| | | | | | | | |
| | | | Regional Banks 1.5% | | | | |
| | 5,252,100 | | | Banregio Grupo Financiero S.A.B. de C.V.* (Mexico) | | | 27,350,392 | |
| | | | | | | | |
| | | | Restaurants 1.0% | | | | |
| | 788,670 | | | Jubilant Foodworks Ltd.* (India) | | | 17,950,042 | |
| | | | | | | | |
| | | | Retail REITs 1.1% | | | | |
| | 33,957,440 | | | CapitaMalls Malaysia Trust (Malaysia) | | | 20,726,485 | |
| | | | | | | | |
| | | | Soft Drinks 0.4% | | | | |
| | 2,832,797 | | | Organizacion Cultiba S.A.B. de C.V.* (Mexico) | | | 8,037,491 | |
| | | | | | | | |
| | | | | | | | |
| Shares | | | | | Value | |
| | | | | | | |
| | | | Specialized Finance 3.0% | | | | |
| | 9,474,588 | | | Bolsa Mexicana de Valores S.A.B. de C.V. (Mexico) | | $ | 27,135,334 | |
| | 10,783,800 | | | Chailease Holding Co. Ltd. (Taiwan) | | | 29,896,397 | |
| | | | | | | | |
| | | | | | | 57,031,731 | |
| | | | | | | | |
| | | | Specialty Stores 1.5% | | | | |
| | 30,110,347 | | | Sa Sa International Holdings Ltd. (China) | | | 29,013,236 | |
| | | | | | | | |
| | | | Systems Software 1.1% | | | | |
| | 1,023,800 | | | Totvs S.A. (Brazil) | | | 21,042,168 | |
| | | | | | | | |
| | | | Thrifts & Mortgage Finance 1.7% | | | | |
| | 3,789,600 | | | Gruh Finance Ltd. (India) | | | 14,844,634 | |
| | 4,237,195 | | | LIC Housing Finance Ltd. (India) | | | 17,568,572 | |
| | | | | | | | |
| | | | | | | 32,413,206 | |
| | | | | | | | |
| | | | Trucking 1.1% | | | | |
| | 1,241,700 | | | Tegma Gestao Logistica (Brazil) | | | 19,707,080 | |
| | | | | | | | |
| | | | Wireless Telecommunication Services 1.0% | | | | |
| | 29,191,832 | | | PT Tower Bersama Infrastructure Tbk* (Indonesia) | | | 18,174,488 | |
| | | | | | | | |
| | |
| | | | Total Common Stocks
(cost $1,368,516,339) | | | 1,760,323,285 | |
| | | | | | | | |
| | |
| | | | PREFERRED STOCKS 1.8% | | | | |
| | |
| | | | Construction & Farm Machinery & Heavy Trucks 1.0% | | | | |
| | 2,672,315 | | | Marcopolo S.A. Pfd. (Brazil) | | | 19,019,328 | |
| | | | | | | | |
| | | | Footwear 0.8% | | | | |
| | 2,198,520 | | | Alpargatas S.A. Pfd. (Brazil) | | | 14,829,447 | |
| | | | | | | | |
| | |
| | | | Total Preferred Stocks
(cost $24,275,670) | | | 33,848,775 | |
| | | | | | | | |
| | |
Principal
Amount | | | | | Value | |
| | | | | | | |
| | |
| | | | SHORT-TERM INVESTMENTS 3.8% | | | | |
| | |
| | | | Repurchase Agreement 3.8% | | | | |
| | $70,492,421 | | | Repurchase Agreement dated 3/28/13, 0.01% due 4/1/13 with State Street Bank and Trust Co. collateralized by $72,240,000 of United States Treasury Notes 0.500% due 07/31/17; value: $71,906,468; repurchase proceeds: $70,492,499 (cost $70,492,421) | | $ | 70,492,421 | |
| | | | | | | | |
| | |
| | | | Total Short-Term Investments
(cost $70,492,421) | | | 70,492,421 | |
| | | | | | | | |
| | |
| | | | Total Investments
(cost $1,463,284,430) 99.6%§ | | | 1,864,664,481 | |
| | |
| | | | Other Assets less Liabilities 0.4% | | | 7,797,042 | |
| | | | | | | | |
| | |
| | | | NET ASSETS 100.0% | | $ | 1,872,461,523 | |
| | | | | | | | |
| |
| | | | *Non-income producing. **Common units. §The aggregate amount of foreign securities fair valued pursuant to a systematic valuation model as a percent of net assets was 7.10% (see Note 15). GDR Global Depositary Receipt. NVDR Non-Voting Depositary Receipt. REIT Real Estate Investment Trust. See Notes to Financial Statements. | |
54
| | |
| | MARCH 31, 2013 (UNAUDITED) |
|
|
|
At March 31, 2013, Wasatch Emerging Markets Small Cap Fund’s investments, excluding short-term investments, were in the following countries:
| | | | |
| Country | | % | |
Brazil | | | 8.7 | |
Chile | | | 3.4 | |
China | | | 5.4 | |
Colombia | | | 1.2 | |
India | | | 13.9 | |
Indonesia | | | 7.2 | |
Malaysia | | | 4.7 | |
Mexico | | | 6.1 | |
Nigeria | | | 0.5 | |
Peru | | | 2.4 | |
Philippines | | | 8.0 | |
Poland | | | 2.9 | |
Russia | | | 4.6 | |
South Africa | | | 4.5 | |
Taiwan | | | 10.3 | |
Thailand | | | 9.7 | |
Turkey | | | 6.5 | |
| | | | |
TOTAL | | | 100.0 | % |
| | | | |
55
| | |
| WASATCH FRONTIER EMERGING SMALL COUNTRIES FUND (WAFMX) — Schedule of Investments | | |
|
|
|
| | | | | | | | |
| Shares | | | | | Value | |
| | | | | | | |
| | | | COMMON STOCKS 93.3% | | | | |
| | |
| | | | Advertising 0.0% | | | | |
| | 110,600 | | | Scan Group Ltd. (Kenya) | | $ | 92,490 | |
| | | | | | | | |
| | | | Air Freight & Logistics 1.0% | | | | |
| | 1,397,100 | | | Agility Public Warehousing Co. KSC (Kuwait) | | | 2,888,694 | |
| | 1,092,946 | | | Aramex PJSC (United Arab Emirates) | | | 663,564 | |
| | | | | | | | |
| | | | | | | 3,552,258 | |
| | | | | | | | |
| | | | Apparel Retail 1.1% | | | | |
| | 312,490 | | | Mr Price Group Ltd. (South Africa) | | | 3,962,885 | |
| | | | | | | | |
| | | | Auto Parts & Equipment 0.1% | | | | |
| | 462,773 | | | PT Astra Otoparts Tbk (Indonesia) | | | 191,681 | |
| | | | | | | | |
| | | | Automotive Retail 1.0% | | | | |
| | 141,962 | | | Kolao Holdings (Korea) | | | 3,483,339 | |
| | | | | | | | |
| | | | Brewers 12.1% | | | | |
| | 10,114 | | | Brasseries Maroc (Morocco) | | | 2,633,087 | |
| | 700,873 | | | Carlsberg Brewery Malaysia Berhad (Malaysia) | | | 3,123,542 | |
| | 2,931,627 | | | Delta Corp. Ltd. (Zimbabwe) | | | 3,371,371 | |
| | 3,560,908 | | | East African Breweries Ltd. (Kenya) | | | 12,952,543 | |
| | 3,581 | | | Guinness Anchor Berhad (Malaysia) | | | 21,233 | |
| | 72,051 | | | Guinness Ghana Breweries Ltd. (Ghana) | | | 132,016 | |
| | 2,378,271 | | | Guinness Nigeria plc (Nigeria) | | | 3,976,685 | |
| | 782,446 | | | Lion Brewery Ceylon plc (Sri Lanka) | | | 2,055,657 | |
| | 5,600 | | | Namibia Breweries Ltd. (Namibia) | | | 8,061 | |
| | 8,966,037 | | | Nigerian Breweries plc (Nigeria) | | | 9,229,561 | |
| | 82,170 | | | SABMiller plc (United Kingdom) | | | 4,324,432 | |
| | 6,852 | | | Union de Cervecerias Peruanas Backus y Johnston SAA (Peru) | | | 46,112 | |
| | | | | | | | |
| | | | | | | 41,874,300 | |
| | | | | | | | |
| | | | Building Products 0.7% | | | | |
| | 2,378,200 | | | Al Anwar Ceramic Tile Co. (Oman) | | | 2,396,731 | |
| | | | | | | | |
| | | | Casinos & Gaming 3.3% | | | | |
| | 13,413,882 | | | NagaCorp Ltd. (Cambodia) | | | 11,335,407 | |
| | | | | | | | |
| | | | Coal & Consumable Fuels 0.4% | | | | |
| | 430,169 | | | PT Indo Tambangraya Megah Tbk (Indonesia) | | | 1,571,495 | |
| | | | | | | | |
| | | | Commodity Chemicals 0.2% | | | | |
| | 61,450 | | | Berger Paints Bangladesh Ltd.* (Bangladesh) | | | 421,001 | |
| | 27,000 | | | Paints & Chemical Industries Co. S.A.E. (Egypt) | | | 158,752 | |
| | | | | | | | |
| | | | | | | 579,753 | |
| | | | | | | | |
| | | | Construction & Engineering 1.4% | | | | |
| | 1,103,850 | | | Grana y Montero S.A. (Peru) | | | 4,858,645 | |
| | | | | | | | |
| | | | Construction Materials 4.2% | | | | |
| | 1,419,760 | | | Bamburi Cement Co. Ltd. (Kenya) | | | 3,653,184 | |
| | 8,720,950 | | | Lafarge Republic, Inc. (Philippines) | | | 2,325,017 | |
| | 3,292,300 | | | Lucky Cement Ltd. (Pakistan) | | | 5,594,233 | |
| | 1,628,500 | | | PT Semen Indonesia Persero Tbk (Indonesia) | | | 2,966,241 | |
| | | | | | | | |
| | | | | | | 14,538,675 | |
| | | | | | | | |
| | | | Consumer Finance 0.5% | | | | |
| | 5,279,600 | | | Letshego Holdings Ltd. (Botswana) | | | 1,701,004 | |
| | | | | | | | |
| | | | Department Stores 2.0% | | | | |
| | 1,570,676 | | | Parkson Retail Asia Ltd. (Malaysia) | | | 2,077,178 | |
| | 625,593 | | | Woolworths Holdings Ltd. (South Africa) | | | 4,787,658 | |
| | | | | | | | |
| | | | | | | 6,864,836 | |
| | | | | | | | |
| | | | Distillers & Vintners 0.8% | | | | |
| | 217,284 | | | Distell Group Ltd. (South Africa) | | | 2,610,899 | |
| | | | | | | | |
| | | | | | | | |
| Shares | | | | | Value | |
| | | | | | | |
| | | | Diversified Banks 11.8% | | | | |
| | 89,950 | | | Attijariwafa Bank (Morocco) | | $ | 3,327,553 | |
| | 7,056,200 | | | Barclays Bank of Kenya Ltd. (Kenya) | | | 1,415,366 | |
| | 805,346 | | | BBVA Banco Continental S.A. (Peru) | | | 2,254,347 | |
| | 7,723,061 | | | Commercial Bank of Ceylon plc (Sri Lanka) | | | 6,885,254 | |
| | 8,994,700 | | | Equity Bank Ltd. (Kenya) | | | 3,445,338 | |
| | 400,618 | | | Guaranty Trust Bank plc GDR (Nigeria) | | | 3,265,037 | |
| | 11,013,095 | | | Kenya Commercial Bank Ltd. (Kenya) | | | 5,345,537 | |
| | 1,706,925 | | | MCB Bank Ltd. (Pakistan) | | | 3,278,372 | |
| | 2,991,825 | | | National Bank of Ras Al-Khaimah
(United Arab Emirates) | | | 4,479,999 | |
| | 341,500 | | | PT Bank Rakyat Indonesia (Persero) Tbk (Indonesia) | | | 307,499 | |
| | 43,526,499 | | | Stanbic Bank Uganda Ltd.* (Uganda) | | | 419,816 | |
| | 49,010,000 | | | Zenith Bank plc* (Nigeria) | | | 6,584,125 | |
| | | | | | | | |
| | | | | | | 41,008,243 | |
| | | | | | | | |
| | | | Diversified Chemicals 1.0% | | | | |
| | 195,548 | | | Omnia Holdings Ltd. (South Africa) | | | 3,349,169 | |
| | | | | | | | |
| | | | Food Retail 3.3% | | | | |
| | 1,703,570 | | | CP ALL Public Co. Ltd. (Thailand) | | | 2,690,460 | |
| | 874,146 | | | Philippine Seven Corp. (Philippines) | | | 1,951,405 | |
| | 351,140 | | | Shoprite Holdings Ltd. (South Africa) | | | 6,957,978 | |
| | | | | | | | |
| | | | | | | 11,599,843 | |
| | | | | | | | |
| | | | Footwear 1.2% | | | | |
| | 49,400 | | | Bata Shoe Co. Bangladesh Ltd. (Bangladesh) | | | 321,867 | |
| | 530,540 | | | Forus S.A. (Chile) | | | 3,734,597 | |
| | | | | | | | |
| | | | | | | 4,056,464 | |
| | | | | | | | |
| | | | General Merchandise Stores 0.2% | | | | |
| | 163,076 | | | Aeon Co. M Berhad (Malaysia) | | | 664,627 | |
| | | | | | | | |
| | | | Household Appliances 0.0% | | | | |
| | 50,250 | | | Singer Bangladesh Ltd. (Bangladesh) | | | 105,681 | |
| | | | | | | | |
| | | | Household Products 1.5% | | | | |
| | 6,769 | | | PT Unilever Indonesia Tbk (Indonesia) | | | 15,882 | |
| | 45,670 | | | Unilever Ghana Ltd. (Ghana) | | | 288,045 | |
| | 15,292,067 | | | Unilever Nigeria plc (Nigeria) | | | 4,978,723 | |
| | | | | | | | |
| | | | | | | 5,282,650 | |
| | | | | | | | |
| | | | Hypermarkets & Super Centers 0.7% | | | | |
| | 6,000 | | | Almacenes Exito S.A. (Colombia) | | | 108,315 | |
| | 28,285 | | | PriceSmart, Inc. (Costa Rica) | | | 2,201,422 | |
| | | | | | | | |
| | | | | | | 2,309,737 | |
| | | | | | | | |
| | | | Industrial Conglomerates 1.2% | | | | |
| | 2,950,951 | | | Innscor Africa Ltd. (Zimbabwe) | | | 2,567,327 | |
| | 755,615 | | | John Keells Holdings plc (Sri Lanka) | | | 1,472,481 | |
| | | | | | | | |
| | | | | | | 4,039,808 | |
| | | | | | | | |
| | | | Industrial Gases 0.1% | | | | |
| | 71,000 | | | Linde Bangladesh Ltd. (Bangladesh) | | | 438,322 | |
| | | | | | | | |
| | | | Integrated Oil & Gas 0.9% | | | | |
| | 1,152,490 | | | Ecopetrol S.A. (Colombia) | | | 3,183,848 | |
| | | | | | | | |
| | | | Marine Ports & Services 2.1% | | | | |
| | 299,600 | | | DP World Ltd. (United Arab Emirates) | | | 4,203,388 | |
| | 1,390,798 | | | International Container Terminal Services, Inc. (Philippines) | | | 3,136,744 | |
| | | | | | | | |
| | | | | | | 7,340,132 | |
| | | | | | | | |
| | | | Metal & Glass Containers 0.4% | | | | |
| | 410,100 | | | Nampak Ltd. (South Africa) | | | 1,426,991 | |
| | | | | | | | |
| | | | Oil & Gas Exploration &
Production 1.2% | | | | |
| | 711,410 | | | Pakistan Oilfields Ltd. (Pakistan) | | | 3,278,704 | |
| | 89,256 | | | Zhaikmunai L.P. GDR (Kazakhstan) | | | 892,560 | |
| | | | | | | | |
| | | | | | | 4,171,264 | |
| | | | | | | | |
56
| | |
| | MARCH 31, 2013 (UNAUDITED) |
|
|
|
| | | | | | | | |
| Shares | | | | | Value | |
| | | | | | | |
| | | | Oil & Gas Refining & Marketing 1.0% | | | | |
| | 1,976,040 | | | Chevron Lubricants Lanka plc (Sri Lanka) | | $ | 3,383,043 | |
| | | | | | | | |
| | | | Packaged Foods & Meats 22.3% | | | | |
| | 6,582,298 | | | Agthia Group PJSC (United Arab Emirates) | | | 4,516,034 | |
| | 1,125,733 | | | Alicorp S.A. (Peru) | | | 4,194,333 | |
| | 20,364,216 | | | Cadbury Nigeria plc* (Nigeria) | | | 4,495,412 | |
| | 15,581 | | | Centrale Laitiere (Morocco) | | | 2,692,839 | |
| | 6,651,700 | | | Dairibord Holdings Ltd.* (Zimbabwe) | | | 1,662,925 | |
| | 74,098 | | | Dutch Lady Milk Industries Berhad (Malaysia) | | | 1,139,049 | |
| | 1,114,000 | | | Engro Foods Ltd.* (Pakistan) | | | 1,438,917 | |
| | 1,004,386 | | | FAN Milk Ltd. (Ghana) | | | 2,840,792 | |
| | 1,420,700 | | | Grupo Herdez S.A.B. de C.V. (Mexico) | | | 5,229,310 | |
| | 4,084,031 | | | Juhayna Food Industries (Egypt) | | | 4,658,511 | |
| | 2,691 | | | Ledo dd* (Croatia) | | | 3,928,699 | |
| | 74,400 | | | Nestlé Malaysia Berhad (Malaysia) | | | 1,457,966 | |
| | 185,607 | | | Nestlé Lanka plc (Sri Lanka) | | | 2,460,116 | |
| | 2,496,371 | | | Nestlé Nigeria plc (Nigeria) | | | 14,831,797 | |
| | 6,776 | | | Nestlé Pakistan Ltd. (Pakistan) | | | 397,605 | |
| | 4,242,500 | | | PT Indofood CBP Sukses Makmur Tbk (Indonesia) | | | 4,191,201 | |
| | 80,637 | | | Tiger Brands Ltd. (South Africa) | | | 2,569,853 | |
| | 928,714 | | | Ulker Biskuvi Sanayi AS (Turkey) | | | 6,999,391 | |
| | 2,323,808 | | | Universal Robina Corp. (Philippines) | | | 6,409,423 | |
| | 142,500 | | | Viet Nam Dairy Products JSC (Vietnam) | | | 789,304 | |
| | 29,000 | | | Vinacafe Bien Hoa JSC (Vietnam) | | | 290,796 | |
| | | | | | | | |
| | | | | | | 77,194,273 | |
| | | | | | | | |
| | | | Personal Products 0.5% | | | | |
| | 23,552 | | | Colgate-Palmolive Pakistan Ltd. (Pakistan) | | | 437,569 | |
| | 41,100 | | | Marico Bangladesh Ltd. (Bangladesh) | | | 186,878 | |
| | 8,166 | | | Unilever Pakistan Ltd. (Pakistan) | | | 1,016,601 | |
| | | | | | | | |
| | | | | | | 1,641,048 | |
| | | | | | | | |
| | | | Pharmaceuticals 1.7% | | | | |
| | 342,535 | | | Abbott Laboratories Pakistan Ltd. (Pakistan) | | | 727,539 | |
| | 63,650 | | | DHG Pharmaceutical JSC (Vietnam) | | | 247,701 | |
| | 260,500 | | | Egyptian International Pharmaceutical Industrial Co. (Egypt) | | | 1,629,310 | |
| | 3,013,512 | | | GlaxoSmithKline Consumer Nigeria plc* (Nigeria) | | | 903,768 | |
| | 18,413,780 | | | PT Kalbe Farma Tbk (Indonesia) | | | 2,349,687 | |
| | | | | | | | |
| | | | | | | 5,858,005 | |
| | | | | | | | |
| | | | Publishing 0.6% | | | | |
| | 455,235 | | | Nation Media Group Ltd. (Kenya) | | | 1,996,645 | |
| | | | | | | | |
| | | | Restaurants 1.9% | | | | |
| | 1,062,830 | | | Kuwait Foods Americana (Kuwait) | | | 6,555,391 | |
| | | | | | | | |
| | | | Soft Drinks 2.8% | | | | |
| | 167,400 | | | Coca-Cola Icecek A.S. (Turkey) | | | 4,829,335 | |
| | 32,392,573 | | | Pepsi-Cola Products Philippines, Inc.* (Philippines) | | | 4,984,694 | |
| | | | | | | | |
| | | | | | | 9,814,029 | |
| | | | | | | | |
| | | | Specialized Finance 1.4% | | | | |
| | 70,577,365 | | | Bolsa de Valores de Colombia (Colombia) | | | 1,169,854 | |
| | 1,277,800 | | | Bolsa Mexicana de Valores S.A.B. de C.V. (Mexico) | | | 3,659,635 | |
| | | | | | | | |
| | | | | | | 4,829,489 | |
| | | | | | | | |
| | | | Specialty Chemicals 0.2% | | | | |
| | 2,479,953 | | | Chemical and Allied Products plc (Nigeria) | | | 586,711 | |
| | | | | | | | |
| | | | Tobacco 3.6% | | | | |
| | 202,700 | | | British American Tobacco Bangladesh Co. Ltd. (Bangladesh) | | | 2,344,908 | |
| | 877,003 | | | British American Tobacco Kenya Ltd. (Kenya) | | | 5,538,966 | |
| | 748,042 | | | Ceylon Tobacco Co. plc (Sri Lanka) | | | 4,626,942 | |
| | | | | | | | |
| | | | | | | 12,510,816 | |
| | | | | | | | |
| | | | | | | | |
| Shares | | | | | Value | |
| | | | | | | |
| | | | Wireless Telecommunication
Services 2.9% | | | | |
| | 4,726,021 | | | Econet Wireless Zimbabwe Ltd.* (Zimbabwe) | | $ | 3,308,215 | |
| | 37,898 | | | MTN Group Ltd. (South Africa) | | | 663,379 | |
| | 83,834,800 | | | Safaricom Ltd. (Kenya) | | | 6,079,248 | |
| | | | | | | | |
| | | | | | | 10,050,842 | |
| | | | | | | | |
| | |
| | | | Total Common Stocks
(cost $286,906,951) | | | 323,011,469 | |
| | | | | | | | |
| | |
Principal
Amount | | | | | Value | |
| | | | | | | |
| | | | SHORT-TERM INVESTMENTS 6.8% | | | | |
| | |
| | | | Repurchase Agreement 6.8% | | | | |
| | $23,689,647 | | | Repurchase Agreement dated 3/28/13, 0.01% due 4/1/13 with State Street Bank and Trust Co. collateralized by $24,280,000 of United States Treasury Notes 0.500% due 7/31/13; value: $24,167,899; repurchase proceeds: $23,689,673 (cost $23,689,647) | | $ | 23,689,647 | |
| | | | | | | | |
| | |
| | | | Total Short-Term Investments
(cost $23,689,647) | | | 23,689,647 | |
| | | | | | | | |
| | |
| | | | Total Investments (cost $310,596,598) 100.1%§ | | | 346,701,116 | |
| | |
| | | | Liabilities less Other Assets (0.1%) | | | (367,738 | ) |
| | | | | | | | |
| | |
| | | | NET ASSETS 100.0% | | $ | 346,333,378 | |
| | | | | | | | |
| |
| | | | *Non-income producing. §The aggregate amount of foreign securities fair valued pursuant to a systematic valuation model as a percent of net assets was 3.32% (see Note 15). GDR Global Depositary Receipt. See Notes to Financial Statements. | |
57
| | |
| WASATCH FRONTIER EMERGING SMALL COUNTRIES FUND (WAFMX) — Schedule of Investments (continued) | | |
|
|
|
At March 31, 2013, Wasatch Frontier Emerging Small Countries Fund’s investments, excluding short-term investments, were in the following countries:
| | | | |
| Country | | % | |
Bangladesh | | | 1.2 | |
Botswana | | | 0.5 | |
Cambodia | | | 3.5 | |
Chile | | | 1.2 | |
Colombia | | | 1.4 | |
Costa Rica | | | 0.7 | |
Croatia | | | 1.2 | |
Egypt | | | 2.0 | |
Ghana | | | 1.0 | |
Indonesia | | | 3.6 | |
Kazakhstan | | | 0.3 | |
Kenya | | | 12.5 | |
Korea | | | 1.1 | |
Kuwait | | | 2.9 | |
Malaysia | | | 2.6 | |
Mexico | | | 2.8 | |
Morocco | | | 2.7 | |
Namibia | | | <0.1 | |
Nigeria | | | 15.1 | |
Oman | | | 0.7 | |
Pakistan | | | 5.0 | |
Peru | | | 3.5 | |
Philippines | | | 5.8 | |
South Africa | | | 8.2 | |
Sri Lanka | | | 6.5 | |
Thailand | | | 0.8 | |
Turkey | | | 3.7 | |
Uganda | | | 0.1 | |
United Arab Emirates | | | 4.3 | |
United Kingdom | | | 1.3 | |
Vietnam | | | 0.4 | |
Zimbabwe | | | 3.4 | |
| | | | |
TOTAL | | | 100.0 | % |
| | | | |
58
| | |
| WASATCH GLOBAL OPPORTUNITIES FUND (WAGOX) — Schedule of Investments | | MARCH 31, 2013 (UNAUDITED) |
|
|
|
| | | | | | | | |
| Shares | | | | | Value | |
| | | | | | | |
| | | | COMMON STOCKS 96.2% | | | | |
| | |
| | | | Advertising 2.0% | | | | |
| | 138,619 | | | REA Group Ltd. (Australia) | | $ | 3,999,963 | |
| | | | | | | | |
| | | | Apparel Retail 0.6% | | | | |
| | 87,240 | | | Mr Price Group Ltd. (South Africa) | | | 1,106,346 | |
| | | | | | | | |
| | | | Apparel, Accessories & Luxury Goods 2.5% | | | | |
| | 42,300 | | | Gerry Weber International AG (Germany) | | | 1,846,411 | |
| | 113,200 | | | Salvatore Ferragamo Italia S.p.A. (Italy) | | | 3,131,618 | |
| | | | | | | | |
| | | | | | | 4,978,029 | |
| | | | | | | | |
| | | | Application Software 1.2% | | | | |
| | 23,410 | | | Ultimate Software Group, Inc.* | | | 2,438,386 | |
| | | | | | | | |
| | | | Asset Management & Custody Banks 5.8% | | | | |
| | 505,800 | | | Aberdeen Asset Management plc
(United Kingdom) | | | 3,297,046 | |
| | 13,902 | | | Affiliated Managers Group, Inc.* | | | 2,134,930 | |
| | 231,480 | | | CETIP S.A. — Mercados Organizados (Brazil) | | | 2,755,373 | |
| | 7,996 | | | Partners Group Holding AG (Switzerland) | | | 1,974,144 | |
| | 49,871 | | | SEI Investments Co. | | | 1,438,778 | |
| | | | | | | | |
| | | | | | | 11,600,271 | |
| | | | | | | | |
| | | | Automotive Retail 0.8% | | | | |
| | 38,669 | | | Monro Muffler Brake, Inc. | | | 1,535,546 | |
| | | | | | | | |
| | | | Biotechnology 2.4% | | | | |
| | 481,201 | | | Abcam plc (United Kingdom) | | | 3,270,439 | |
| | 40,000 | | | Seattle Genetics, Inc.* | | | 1,420,400 | |
| | | | | | | | |
| | | | | | | 4,690,839 | |
| | | | | | | | |
| | | | Casinos & Gaming 1.1% | | | | |
| | 2,596,800 | | | NagaCorp Ltd. (Cambodia) | | | 2,194,427 | |
| | | | | | | | |
| | | | Coal & Consumable Fuels 0.4% | | | | |
| | 504,500 | | | PT Tambang Batubara Bukit Asam (Persero) Tbk (Indonesia) | | | 747,600 | |
| | | | | | | | |
| | | | Commercial Printing 0.9% | | | | |
| | 118,516 | | | InnerWorkings, Inc.* | | | 1,794,332 | |
| | | | | | | | |
| | | | Commodity Chemicals 1.2% | | | | |
| | 395,600 | | | Castrol India Ltd. (India) | | | 2,307,363 | |
| | | | | | | | |
| | | | Computer Storage & Peripherals 0.7% | | | | |
| | 86,569 | | | Fusion-io, Inc.* | | | 1,417,134 | |
| | | | | | | | |
| | | | Construction Materials 3.3% | | | | |
| | 382,300 | | | Cemex Latam Holdings S.A.* (Colombia) | | | 2,869,341 | |
| | 641,000 | | | PT Indocement Tunggal Prakarsa Tbk (Indonesia) | | | 1,536,949 | |
| | 1,137,000 | | | PT Semen Indonesia Persero Tbk (Indonesia) | | | 2,070,996 | |
| | | | | | | | |
| | | | | | | 6,477,286 | |
| | | | | | | | |
| | | | Consumer Finance 3.3% | | | | |
| | 96,131 | | | DFC Global Corp.* | | | 1,599,620 | |
| | 671,044 | | | Mahindra & Mahindra Financial Services Ltd. (India) | | | 2,413,783 | |
| | 20,488 | | | Portfolio Recovery Associates, Inc.* | | | 2,600,337 | |
| | | | | | | | |
| | | | | | | 6,613,740 | |
| | | | | | | | |
| | | | Data Processing & Outsourced Services 3.0% | | | | |
| | 28,294 | | | Syntel, Inc. | | | 1,910,411 | |
| | 145,491 | | | Wirecard AG (Germany) | | | 4,019,336 | |
| | | | | | | | |
| | | | | | | 5,929,747 | |
| | | | | | | | |
| | | | | | | | |
| Shares | | | | | Value | |
| | | | | | | |
| | | | Diversified Banks 4.5% | | | | |
| | 98,300 | | | Axis Bank Ltd. (India) | | $ | 2,360,285 | |
| | 310,800 | | | IndusInd Bank Ltd. (India) | | | 2,304,552 | |
| | 473,835 | | | Security Bank Corp. (Philippines) | | | 2,114,107 | |
| | 279,497 | | | Yes Bank Ltd. (India) | | | 2,213,863 | |
| | | | | | | | |
| | | | | | | 8,992,807 | |
| | | | | | | | |
| | | | Diversified Support Services 1.5% | | | | |
| | 85,562 | | | Copart, Inc.* | | | 2,933,065 | |
| | | | | | | | |
| | | | Drug Retail 0.8% | | | | |
| | 258,500 | | | Clicks Group Ltd. (South Africa) | | | 1,624,951 | |
| | | | | | | | |
| | | | Electrical Components & Equipment 1.0% | | | | |
| | 47,338 | | | Polypore International, Inc.* | | | 1,902,041 | |
| | | | | | | | |
| | | | Electronic Equipment & Instruments 1.3% | | | | |
| | 106,168 | | | Oxford Instruments plc (United Kingdom) | | | 2,668,567 | |
| | | | | | | | |
| | | | Electronic Manufacturing Services 1.0% | | | | |
| | 31,320 | | | IPG Photonics Corp. | | | 2,079,961 | |
| | | | | | | | |
| | | | Environmental & Facilities Services 1.0% | | | | |
| | 64,819 | | | Tetra Tech, Inc.* | | | 1,976,331 | |
| | | | | | | | |
| | | | Footwear 0.4% | | | | |
| | 66,170 | | | Bata India Ltd. (India) | | | 870,376 | |
| | | | | | | | |
| | | | Gold 1.2% | | | | |
| | 104,030 | | | Koza Altin Isletmeleri A.S. (Turkey) | | | 2,412,423 | |
| | | | | | | | |
| | | | Health Care Equipment 1.7% | | | | |
| | 216,708 | | | Elekta AB, Class B (Sweden) | | | 3,295,844 | |
| | | | | | | | |
| | | | Health Care Facilities 1.9% | | | | |
| | 45,485 | | | Ensign Group, Inc. (The) | | | 1,519,199 | |
| | 587,735 | | | Life Healthcare Group Holdings Ltd. (South Africa) | | | 2,204,369 | |
| | | | | | | | |
| | | | | | | 3,723,568 | |
| | | | | | | | |
| | | | Health Care Services 2.1% | | | | |
| | 23,160 | | | Catamaran Corp.* (Canada) | | | 1,228,175 | |
| | 23,752 | | | CorVel Corp.* | | | 1,175,486 | |
| | 40,450 | | | IPC The Hospitalist Co., Inc.* | | | 1,799,216 | |
| | | | | | | | |
| | | | | | | 4,202,877 | |
| | | | | | | | |
| | | | Health Care Technology 1.1% | | | | |
| | 22,500 | | | athenahealth, Inc.* | | | 2,183,400 | |
| | | | | | | | |
| | | | Hypermarkets & Super Centers 1.7% | | | | |
| | 24,000 | | | PriceSmart, Inc. (Costa Rica) | | | 1,867,920 | |
| | 87,500 | | | Siam Makro Public Co. Ltd. (Thailand) | | | 1,589,551 | |
| | | | | | | | |
| | | | | | | 3,457,471 | |
| | | | | | | | |
| | | | Industrial Machinery 3.6% | | | | |
| | 31,170 | | | Graco, Inc. | | | 1,808,795 | |
| | 39,255 | | | IDEX Corp. | | | 2,097,002 | |
| | 72,855 | | | Rotork plc (United Kingdom) | | | 3,213,235 | |
| | | | | | | | |
| | | | | | | 7,119,032 | |
| | | | | | | | |
| | | | Internet Retail 2.3% | | | | |
| | 99,080 | | | MakeMyTrip Ltd.* (India) | | | 1,377,212 | |
| | 126,900 | | | Start Today Co. Ltd. (Japan) | | | 1,570,231 | |
| | 90,037 | | | Yoox S.p.A.* (Italy) | | | 1,687,482 | |
| | | | | | | | |
| | | | | | | 4,634,925 | |
| | | | | | | | |
| | | | Internet Software & Services 2.2% | | | | |
| | 121,768 | | | Envestnet, Inc.* | | | 2,132,158 | |
| | 35,495 | | | SPS Commerce, Inc.* | | | 1,514,571 | |
| | 20,415 | | | Vistaprint N.V.* | | | 789,244 | |
| | | | | | | | |
| | | | | | | 4,435,973 | |
| | | | | | | | |
59
| | |
| WASATCH GLOBAL OPPORTUNITIES FUND (WAGOX) — Schedule of Investments (continued) | | |
|
|
|
| | | | | | | | |
| Shares | | | | | Value | |
| | | | | | | |
| | | | Leisure Facilities 0.9% | | | | |
| | 40,380 | | | Life Time Fitness, Inc.* | | $ | 1,727,456 | |
| | | | | | | | |
| | | | Life & Health Insurance 1.0% | | | | |
| | 236,465 | | | Discovery Ltd. (South Africa) | | | 2,005,498 | |
| | | | | | | | |
| | | | Life Sciences Tools & Services 2.2% | | | | |
| | 41,835 | | | Covance, Inc.* | | | 3,109,177 | |
| | 63,979 | | | Fluidigm Corp.* | | | 1,184,251 | |
| | | | | | | | |
| | | | | | | 4,293,428 | |
| | | | | | | | |
| | | | Marine Ports & Services 2.2% | | | | |
| | 1,220,507 | | | International Container Terminal Services, Inc. (Philippines) | | | 2,752,677 | |
| | 110,400 | | | Santos Brasil Participacoes S.A.** (Brazil) | | | 1,653,605 | |
| | | | | | | | |
| | | | | | | 4,406,282 | |
| | | | | | | | |
| | | | Oil & Gas Equipment & Services 2.5% | | | | |
| | 6,900 | | | Core Laboratories N.V. | | | 951,648 | |
| | 38,818 | | | ShawCor Ltd. (Canada) | | | 1,644,753 | |
| | 60,900 | | | TGS-NOPEC Geophysical Co. ASA (Norway) | | | 2,309,490 | |
| | | | | | | | |
| | | | | | | 4,905,891 | |
| | | | | | | | |
| | | | Oil & Gas Exploration &
Production 2.8% | | | | |
| | 676,266 | | | Afren plc* (Nigeria) | | | 1,456,399 | |
| | 76,072 | | | Coastal Energy Co.* (Thailand) | | | 1,451,841 | |
| | 202,252 | | | Gran Tierra Energy, Inc.* (Colombia) | | | 1,189,242 | |
| | 144,133 | | | Zhaikmunai L.P. GDR (Kazakhstan) | | | 1,441,330 | |
| | | | | | | | |
| | | | | | | 5,538,812 | |
| | | | | | | | |
| | | | Packaged Foods & Meats 2.2% | | | | |
| | 21,300 | | | Calbee, Inc. (Japan) | | | 1,727,639 | |
| | 33,629 | | | GlaxoSmithKline Consumer Healthcare Ltd. (India) | | | 2,598,745 | |
| | | | | | | | |
| | | | | | | 4,326,384 | |
| | | | | | | | |
| | | | Personal Products 0.7% | | | | |
| | 34,818 | | | Herbalife Ltd. | | | 1,303,934 | |
| | | | | | | | |
| | | | Pharmaceuticals 0.6% | | | | |
| | 34,914 | | | Questcor Pharmaceuticals, Inc. | | | 1,136,102 | |
| | | | | | | | |
| | | | Publishing 0.7% | | | | |
| | 53,504 | | | Rightmove plc (United Kingdom) | | | 1,447,227 | |
| | | | | | | | |
| | | | Real Estate Operating
Companies 1.2% | | | | |
| | 83,500 | | | Multiplan Empreendimentos Imobiliarios S.A. (Brazil) | | | 2,401,984 | |
| | | | | | | | |
| | | | Regional Banks 0.9% | | | | |
| | 23,037 | | | Signature Bank* | | | 1,814,394 | |
| | | | | | | | |
| | | | Research & Consulting Services 1.2% | | | | |
| | 22,546 | | | IHS, Inc., Class A* | | | 2,361,017 | |
| | | | | | | | |
| | | | Restaurants 1.6% | | | | |
| | 348,114 | | | Domino’s Pizza Group plc
(United Kingdom) | | | 3,185,407 | |
| | | | | | | | |
| | | | Semiconductors 2.4% | | | | |
| | 28,534 | | | Hittite Microwave Corp.* | | | 1,728,019 | |
| | 43,000 | | | Microchip Technology, Inc. | | | 1,580,680 | |
| | 34,818 | | | Power Integrations, Inc. | | | 1,511,449 | |
| | | | | | | | |
| | | | | | | 4,820,148 | |
| | | | | | | | |
| | | | Soft Drinks 1.9% | | | | |
| | 134,047 | | | Coca-Cola Icecek A.S. (Turkey) | | | 3,867,132 | |
| | | | | | | | |
| | | | Specialty Stores 2.7% | | | | |
| | 34,618 | | | Hibbett Sports, Inc.* | | | 1,947,955 | |
| | 3,466,300 | | | Sa Sa International Holdings Ltd. (China) | | | 3,340,000 | |
| | | | | | | | |
| | | | | | | 5,287,955 | |
| | | | | | | | |
| | | | | | | | |
| Shares | | | | | Value | |
| | | | | | | |
| | | | Systems Software 2.2% | | | | |
| | 29,201 | | | Sourcefire, Inc.* | | $ | 1,729,575 | |
| | 129,000 | | | Totvs S.A. (Brazil) | | | 2,651,338 | |
| | | | | | | | |
| | | | | | | 4,380,913 | |
| | | | | | | | |
| | | | Trading Companies &
Distributors 3.4% | | | | |
| | 78,330 | | | MonotaRO Co. Ltd. (Japan) | | | 3,780,357 | |
| | 33,870 | | | MSC Industrial Direct Co., Inc., Class A | | | 2,905,369 | |
| | | | | | | | |
| | | | | | | 6,685,726 | |
| | | | | | | | |
| | | | Trucking 3.2% | | | | |
| | 26,700 | | | J.B. Hunt Transport Services, Inc. | | | 1,988,616 | |
| | 150,940 | | | Knight Transportation, Inc. | | | 2,430,134 | |
| | 51,352 | | | Old Dominion Freight Line, Inc.* | | | 1,961,646 | |
| | | | | | | | |
| | | | | | | 6,380,396 | |
| | | | | | | | |
| | | | Wireless Telecommunication
Services 1.2% | | | | |
| | 3,884,500 | | | PT Tower Bersama Infrastructure Tbk* (Indonesia) | | | 2,418,443 | |
| | | | | | | | |
| | |
| | | | Total Common Stocks
(cost $138,660,258) | | | 191,039,150 | |
| | | | | | | | |
| | |
| | | | WARRANTS 0.0% | | | | |
| | |
| | | | Health Care Equipment 0.0% | | | | |
| | 40,000 | | | Cardica, Inc., expiring 9/29/14* *** † | | | 2,000 | |
| | | | | | | | |
| | |
| | | | Total Warrants
(cost $5,000) | | | 2,000 | |
| | | | | | | | |
| | |
Principal
Amount | | | | | Value | |
| | | | | | | |
| | | | SHORT-TERM INVESTMENTS 3.3% | | | | |
| | |
| | | | Repurchase Agreement 3.3% | | | | |
| | $6,545,903 | | | Repurchase Agreement dated 3/28/13, 0.01% due 4/1/13 with State Street Bank and Trust Co. collateralized by $6,655,000 of United States Treasury Notes 0.625% due 5/31/17; value: $6,678,359; repurchase proceeds: $6,545,910 (cost $6,545,903) | | $ | 6,545,903 | |
| | | | | | | | |
| | |
| | | | Total Short-Term Investments
(cost $6,545,903) | | | 6,545,903 | |
| | | | | | | | |
| | |
| | | | Total Investments
(cost $145,211,161) 99.5%§ | | | 197,587,053 | |
| | |
| | | | Other Assets less Liabilities 0.5% | | | 893,810 | |
| | | | | | | | |
| | |
| | | | NET ASSETS 100.0% | | $ | 198,480,863 | |
| | | | | | | | |
| |
| | | | *Non-income producing. **Common units. ***Security was fair valued under procedures adopted by the Board of Trustees (see Note 15). †Security purchased in a private placement transaction or under Rule 144A of the Securities Act of 1933 (see Note 11). §The aggregate amount of foreign securities fair valued pursuant to a systematic valuation model as a percent of net assets was 3.62% (see Note 15). GDR Global Depositary Receipt. See Notes to Financial Statements. | |
60
| | |
| | MARCH 31, 2013 (UNAUDITED) |
|
|
|
At March 31, 2013, Wasatch Global Opportunities Fund’s investments, excluding short-term investments, were in the following countries:
| | | | |
| Country | | % | |
Australia | | | 2.1 | |
Brazil | | | 5.0 | |
Cambodia | | | 1.2 | |
Canada | | | 1.5 | |
China | | | 1.8 | |
Colombia | | | 2.1 | |
Costa Rica | | | 1.0 | |
Germany | | | 3.1 | |
India | | | 8.6 | |
Indonesia | | | 3.5 | |
Italy | | | 2.5 | |
Japan | | | 3.7 | |
Kazakhstan | | | 0.8 | |
Nigeria | | | 0.8 | |
Norway | | | 1.2 | |
Philippines | | | 2.5 | |
South Africa | | | 3.6 | |
Sweden | | | 1.7 | |
Switzerland | | | 1.0 | |
Thailand | | | 1.6 | |
Turkey | | | 3.3 | |
United Kingdom | | | 8.9 | |
United States | | | 38.5 | |
| | | | |
TOTAL | | | 100.0 | % |
| | | | |
61
| | |
| WASATCH HERITAGE GROWTH FUND (WAHGX) — Schedule of Investments | | |
|
|
|
| | | | | | | | |
| Shares | | | | | Value | |
| | | | | | | |
| | | | COMMON STOCKS 92.7% | | | | |
| | |
| | | | Aerospace & Defense 1.9% | | | | |
| | 15,030 | | | TransDigm Group, Inc. | | $ | 2,298,388 | |
| | | | | | | | |
| | | | Air Freight & Logistics 3.1% | | | | |
| | 25,563 | | | CH Robinson Worldwide, Inc. | | | 1,519,976 | |
| | 61,612 | | | Expeditors International of Washington, Inc. | | | 2,200,165 | |
| | | | | | | | |
| | | | | | | 3,720,141 | |
| | | | | | | | |
| | | | Apparel Retail 3.5% | | | | |
| | 48,458 | | | Ross Stores, Inc. | | | 2,937,524 | |
| | 31,343 | | | Urban Outfitters, Inc.* | | | 1,214,228 | |
| | | | | | | | |
| | | | | | | 4,151,752 | |
| | | | | | | | |
| | | | Application Software 2.7% | | | | |
| | 40,070 | | | ANSYS, Inc.* | | | 3,262,499 | |
| | | | | | | | |
| | | | Asset Management & Custody Banks 6.7% | | | | |
| | 109,054 | | | CETIP S.A. — Mercados Organizados (Brazil) | | | 1,298,101 | |
| | 130,383 | | | SEI Investments Co. | | | 3,761,550 | |
| | 40,174 | | | T. Rowe Price Group, Inc. | | | 3,007,827 | |
| | | | | | | | |
| | | | | | | 8,067,478 | |
| | | | | | | | |
| | | | Automobile Manufacturers 1.3% | | | | |
| | 41,498 | | | Tesla Motors, Inc.* | | | 1,572,359 | |
| | | | | | | | |
| | | | Automotive Retail 0.9% | | | | |
| | 10,016 | | | O’Reilly Automotive, Inc.* | | | 1,027,141 | |
| | | | | | | | |
| | | | Communications Equipment 2.5% | | | | |
| | 18,114 | | | F5 Networks, Inc.* | | | 1,613,595 | |
| | 90,173 | | | Riverbed Technology, Inc.* | | | 1,344,480 | |
| | | | | | | | |
| | | | | | | 2,958,075 | |
| | | | | | | | |
| | | | Computer Storage & Peripherals 0.6% | | | | |
| | 40,327 | | | Fusion-io, Inc.* | | | 660,153 | |
| | | | | | | | |
| | | | Data Processing & Outsourced Services 2.4% | | | | |
| | 18,089 | | | Alliance Data Systems Corp.* | | | 2,928,428 | |
| | | | | | | | |
| | | | Distributors 2.8% | | | | |
| | 156,964 | | | LKQ Corp.* | | | 3,415,537 | |
| | | | | | | | |
| | | | Diversified Support Services 3.7% | | | | |
| | 129,526 | | | Copart, Inc.* | | | 4,440,151 | |
| | | | | | | | |
| | | | Electrical Components & Equipment 2.2% | | | | |
| | 64,251 | | | Polypore International, Inc.* | | | 2,581,605 | |
| | | | | | | | |
| | | | Electronic Components 4.0% | | | | |
| | 64,659 | | | Amphenol Corp., Class A | | | 4,826,794 | |
| | | | | | | | |
| | | | Electronic Manufacturing
Services 1.4% | | | | |
| | 25,982 | | | IPG Photonics Corp. | | | 1,725,465 | |
| | | | | | | | |
| | | | Environmental & Facilities Services 1.2% | | | | |
| | 14,058 | | | Stericycle, Inc.* | | | 1,492,678 | |
| | | | | | | | |
| | | | Health Care Equipment 1.8% | | | | |
| | 53,062 | | | St. Jude Medical, Inc. | | | 2,145,827 | |
| | | | | | | | |
| | | | Health Care Services 2.6% | | | | |
| | 58,662 | | | Catamaran Corp.* (Canada) | | | 3,110,846 | |
| | | | | | | | |
| | | | Health Care Supplies 0.9% | | | | |
| | 31,155 | | | Align Technology, Inc.* | | | 1,044,004 | |
| | | | | | | | |
| | | | Industrial Machinery 2.2% | | | | |
| | 50,049 | | | IDEX Corp. | | | 2,673,618 | |
| | | | | | | | |
| | | | | | | | |
| Shares | | | | | Value | |
| | | | | | | |
| | | | IT Consulting & Other Services 5.1% | | | | |
| | 80,322 | | | Cognizant Technology Solutions Corp., Class A* | | $ | 6,153,468 | |
| | | | | | | | |
| | | | Leisure Facilities 1.0% | | | | |
| | 28,017 | | | Life Time Fitness, Inc.* | | | 1,198,567 | |
| | | | | | | | |
| | | | Life Sciences Tools & Services 2.8% | | | | |
| | 44,946 | | | Covance, Inc.* | | | 3,340,387 | |
| | | | | | | | |
| | | | Oil & Gas Equipment & Services 4.9% | | | | |
| | 29,400 | | | CARBO Ceramics, Inc. | | | 2,677,458 | |
| | 23,119 | | | Core Laboratories N.V. | | | 3,188,572 | |
| | | | | | | | |
| | | | | | | 5,866,030 | |
| | | | | | | | |
| | | | Oil & Gas Exploration & Production 2.5% | | | | |
| | 151,310 | | | Ultra Petroleum Corp.* | | | 3,041,331 | |
| | | | | | | | |
| | | | Personal Products 1.3% | | | | |
| | 41,934 | | | Herbalife Ltd. | | | 1,570,428 | |
| | | | | | | | |
| | | | Regional Banks 2.7% | | | | |
| | 40,344 | | | Signature Bank* | | | 3,177,493 | |
| | | | | | | | |
| | | | Research & Consulting Services 4.4% | | | | |
| | 50,785 | | | IHS, Inc., Class A* | | | 5,318,205 | |
| | | | | | | | |
| | | | Restaurants 2.8% | | | | |
| | 62,830 | | | Tim Hortons, Inc. (Canada) | | | 3,412,926 | |
| | | | | | | | |
| | | | Semiconductors 6.4% | | | | |
| | 36,326 | | | Linear Technology Corp. | | | 1,393,829 | |
| | 109,846 | | | Microchip Technology, Inc. | | | 4,037,939 | |
| | 55,693 | | | Silicon Laboratories, Inc.* | | | 2,303,462 | |
| | | | | | | | |
| | | | | | | 7,735,230 | |
| | | | | | | | |
| | | | Specialized Finance 3.7% | | | | |
| | 19,902 | | | IntercontinentalExchange, Inc.* | | | 3,245,419 | |
| | 369,102 | | | Power Finance Corp. Ltd. (India) | | | 1,240,074 | |
| | | | | | | | |
| | | | | | | 4,485,493 | |
| | | | | | | | |
| | | | Trading Companies & Distributors 4.0% | | | | |
| | 55,528 | | | MSC Industrial Direct Co., Inc., Class A | | | 4,763,192 | |
| | | | | | | | |
| | | | Trucking 2.3% | | | | |
| | 37,154 | | | J.B. Hunt Transport Services, Inc. | | | 2,767,230 | |
| | | | | | | | |
| | | | Wireless Telecommunication Services 0.4% | | | | |
| | 108,344 | | | NII Holdings, Inc.* | | | 469,130 | |
| | | | | | | | |
| | |
| | | | Total Common Stocks (cost $81,210,643) | | | 111,402,049 | |
| | | | | | | | |
62
| | |
| | MARCH 31, 2013 (UNAUDITED) |
|
|
|
| | | | | | | | |
| | |
Principal
Amount | | | | | Value | |
| | | | | | | |
| | | | SHORT-TERM INVESTMENTS 7.5% | | | | |
| | |
| | | | Repurchase Agreement 7.5% | | | | |
| | $9,003,455 | | | Repurchase Agreement dated 3/28/13, 0.01% due 4/1/13 with State Street Bank and Trust Co. collateralized by $9,155,000 of United States Treasury Notes 0.625% due 5/31/17; value: $9,187,134; repurchase proceeds: $9,003,465 (cost $9,003,455) | | $ | 9,003,455 | |
| | | | | | | | |
| | |
| | | | Total Short-Term Investments (cost $9,003,455) | | | 9,003,455 | |
| | | | | | | | |
| | |
| | | | Total Investments (cost $90,214,098) 100.2% | | | 120,405,504 | |
| | |
| | | | Liabilities less Other Assets (0.2%) | | | (254,654 | ) |
| | | | | | | | |
| | |
| | | | NET ASSETS 100.0% | | $ | 120,150,850 | |
| | | | | | | | |
| |
| | | | *Non-income producing. See Notes to Financial Statements. | |
At March 31, 2013, Wasatch Heritage Growth Fund’s investments, excluding short-term investments, were in the following countries:
| | | | |
| Country | | % | |
Brazil | | | 1.2 | |
Canada | | | 5.8 | |
India | | | 1.1 | |
United States | | | 91.9 | |
| | | | |
TOTAL | | | 100.0 | % |
| | | | |
63
| | |
| WASATCH INTERNATIONAL GROWTH FUND (WAIGX) — Schedule of Investments | | |
|
|
|
| | | | | | | | |
| Shares | | | | | Value | |
| | | | | | | |
| | | | COMMON STOCKS 93.5% | | | | |
| | |
| | | | Advertising 2.1% | | | | |
| | 627,204 | | | REA Group Ltd. (Australia) | | $ | 18,098,477 | |
| | | | | | | | |
| | | | Apparel Retail 1.4% | | | | |
| | 362,806 | | | United Arrows Ltd. (Japan) | | | 12,476,639 | |
| | | | | | | | |
| | | | Apparel, Accessories & Luxury Goods 1.9% | | | | |
| | 615,285 | | | Salvatore Ferragamo Italia S.p.A. (Italy) | | | 17,021,532 | |
| | | | | | | | |
| | | | Application Software 3.4% | | | | |
| | 89,400 | | | Aveva Group plc (United Kingdom) | | | 3,073,975 | |
| | 474,662 | | | Computer Modelling Group Ltd. (Canada) | | | 9,848,128 | |
| | 3,161,599 | | | Diligent Board Member Services, Inc.* (New Zealand) | | | 16,523,309 | |
| | | | | | | | |
| | | | | | | 29,445,412 | |
| | | | | | | | |
| | | | Asset Management & Custody Banks 5.0% | | | | |
| | 2,559,074 | | | Aberdeen Asset Management plc
(United Kingdom) | | | 16,681,265 | |
| | 7,049,271 | | | ARA Asset Management Ltd. (Singapore) | | | 10,914,120 | |
| | 605,975 | | | CETIP S.A. — Mercados Organizados (Brazil) | | | 7,213,094 | |
| | 36,504 | | | Partners Group Holding AG (Switzerland) | | | 9,012,526 | |
| | | | | | | | |
| | | | | | | 43,821,005 | |
| | | | | | | | |
| | | | Automotive Retail 1.2% | | | | |
| | 807,234 | | | ARB Corp. Ltd. (Australia) | | | 10,600,131 | |
| | | | | | | | |
| | | | Biotechnology 2.4% | | | | |
| | 3,081,068 | | | Abcam plc (United Kingdom) | | | 20,940,197 | |
| | | | | | | | |
| | | | Casinos & Gaming 2.0% | | | | |
| | 20,351,270 | | | NagaCorp Ltd. (Cambodia) | | | 17,197,850 | |
| | | | | | | | |
| | | | Coal & Consumable Fuels 0.8% | | | | |
| | 975,245 | | | PT Indo Tambangraya Megah Tbk (Indonesia) | | | 3,562,768 | |
| | 2,282,085 | | | PT Tambang Batubara Bukit Asam (Persero) Tbk (Indonesia) | | | 3,381,736 | |
| | | | | | | | |
| | | | | | | 6,944,504 | |
| | | | | | | | |
| | | | Construction Materials 2.3% | | | | |
| | 1,607,900 | | | Cemex Latam Holdings S.A.* (Colombia) | | | 12,068,046 | |
| | 3,366,371 | | | PT Indocement Tunggal Prakarsa Tbk (Indonesia) | | | 8,071,669 | |
| | | | | | | | |
| | | | | | | 20,139,715 | |
| | | | | | | | |
| | | | Consumer Finance 1.4% | | | | |
| | 3,342,000 | | | Mahindra & Mahindra Financial Services Ltd. (India) | | | 12,021,362 | |
| | | | | | | | |
| | | | Data Processing & Outsourced Services 2.2% | | | | |
| | 691,354 | | | Wirecard AG (Germany) | | | 19,099,352 | |
| | | | | | | | |
| | | | Diversified Banks 0.9% | | | | |
| | 1,849,803 | | | Security Bank Corp. (Philippines) | | | 8,253,254 | |
| | | | | | | | |
| | | | Drug Retail 2.4% | | | | |
| | 158,227 | | | Cosmos Pharmaceutical Corp. (Japan) | | | 20,587,844 | |
| | | | | | | | |
| | | | Electrical Components & Equipment 0.9% | | | | |
| | 1,553,200 | | | Amara Raja Batteries Ltd. (India) | | | 7,977,475 | |
| | | | | | | | |
| | | | Electronic Equipment & Instruments 3.7% | | | | |
| | 879,023 | | | Halma plc (United Kingdom) | | | 6,915,386 | |
| | 641,483 | | | Oxford Instruments plc (United Kingdom) | | | 16,123,881 | |
| | 319,508 | | | Renishaw plc (United Kingdom) | | | 8,918,949 | |
| | | | | | | | |
| | | | | | | 31,958,216 | |
| | | | | | | | |
| | | | | | | | |
| Shares | | | | | Value | |
| | | | | | | |
| | | | Gold 1.2% | | | | |
| | 383,800 | | | Alamos Gold, Inc. (Canada) | | $ | 5,267,103 | |
| | 218,145 | | | Koza Altin Isletmeleri A.S. (Turkey) | | | 5,058,714 | |
| | | | | | | | |
| | | | | | | 10,325,817 | |
| | | | | | | | |
| | | | Health Care Equipment 1.7% | | | | |
| | 954,915 | | | Elekta AB, Class B (Sweden) | | | 14,523,003 | |
| | | | | | | | |
| | | | Health Care Technology 2.1% | | | | |
| | 378,501 | | | EMIS Group plc (United Kingdom) | | | 4,225,137 | |
| | 7,505 | | | M3, Inc. (Japan) | | | 14,512,167 | |
| | | | | | | | |
| | | | | | | 18,737,304 | |
| | | | | | | | |
| | | | Household Products 2.6% | | | | |
| | 305,256 | | | Pigeon Corp. (Japan) | | | 22,293,066 | |
| | | | | | | | |
| | | | Hypermarkets & Super Centers 2.3% | | | | |
| | 91,902 | | | PriceSmart, Inc. (Costa Rica) | | | 7,152,733 | |
| | 731,700 | | | Siam Makro Public Co. Ltd. (Thailand) | | | 13,292,279 | |
| | | | | | | | |
| | | | | | | 20,445,012 | |
| | | | | | | | |
| | | | Industrial Machinery 3.8% | | | | |
| | 170,400 | | | KUKA AG* (Germany) | | | 7,433,655 | |
| | 221,063 | | | NORMA Group AG (Germany) | | | 6,967,182 | |
| | 418,907 | | | Rotork plc (United Kingdom) | | | 18,475,690 | |
| | | | | | | | |
| | | | | | | 32,876,527 | |
| | | | | | | | |
| | | | Internet Retail 5.0% | | | | |
| | 267,822 | | | ASOS plc* (United Kingdom) | | | 13,614,083 | |
| | 888,450 | | | Start Today Co. Ltd. (Japan) | | | 10,993,471 | |
| | 1,905,322 | | | Webjet Ltd. (Australia) | | | 9,404,667 | |
| | 504,701 | | | Yoox S.p.A.* (Italy) | | | 9,459,156 | |
| | | | | | | | |
| | | | | | | 43,471,377 | |
| | | | | | | | |
| | | | Internet Software & Services 4.1% | | | | |
| | 1,736,195 | | | carsales.com Ltd. (Australia) | | | 16,995,073 | |
| | 146,516 | | | Infomart Corp. (Japan) | | | 3,971,678 | |
| | 598,239 | | | Kakaku.com, Inc. (Japan) | | | 14,728,623 | |
| | | | | | | | |
| | | | | | | 35,695,374 | |
| | | | | | | | |
| | | | IT Consulting & Other Services 0.6% | | | | |
| | 353,722 | | | Bit-isle, Inc. (Japan) | | | 4,918,341 | |
| | | | | | | | |
| | | | Leisure Products 1.5% | | | | |
| | 2,220,640 | | | Merida Industry Co. Ltd. (Taiwan) | | | 13,033,102 | |
| | | | | | | | |
| | | | Life & Health Insurance 1.1% | | | | |
| | 1,130,325 | | | Discovery Ltd. (South Africa) | | | 9,586,470 | |
| | | | | | | | |
| | | | Marine Ports & Services 1.7% | | | | |
| | 6,485,222 | | | International Container Terminal Services, Inc. (Philippines) | | | 14,626,481 | |
| | | | | | | | |
| | | | Multi-Sector Holdings 2.9% | | | | |
| | 18,481,080 | | | First Pacific Co. Ltd. (Hong Kong) | | | 25,045,049 | |
| | | | | | | | |
| | | | Oil & Gas Drilling 1.3% | | | | |
| | 320,193 | | | Eurasia Drilling Co. Ltd. GDR (Russia) | | | 11,366,852 | |
| | | | | | | | |
| | | | Oil & Gas Equipment & Services 3.5% | | | | |
| | 29,010 | | | Core Laboratories N.V. | | | 4,001,059 | |
| | 74,200 | | | Schoeller-Bleckmann Oilfield Equipment AG (Austria) | | | 7,430,825 | |
| | 194,740 | | | ShawCor Ltd. (Canada) | | | 8,251,305 | |
| | 293,404 | | | TGS-NOPEC Geophysical Co. ASA (Norway) | | | 11,126,660 | |
| | | | | | | | |
| | | | | | | 30,809,849 | |
| | | | | | | | |
| | | | Oil & Gas Exploration & Production 2.8% | | | | |
| | 2,501,200 | | | Afren plc* (Nigeria) | | | 5,386,555 | |
| | 215,923 | | | Coastal Energy Co.* (Thailand) | | | 4,120,911 | |
| | 970,142 | | | Gran Tierra Energy, Inc.* (Colombia) | | | 5,704,435 | |
| | 896,796 | | | Premier Oil plc* (United Kingdom) | | | 5,294,130 | |
| | 409,337 | | | Zhaikmunai L.P. GDR (Kazakhstan) | | | 4,093,370 | |
| | | | | | | | |
| | | | | | | 24,599,401 | |
| | | | | | | | |
64
| | |
| | MARCH 31, 2013 (UNAUDITED) |
|
|
|
| | | | | | | | |
Shares | | | | | Value | |
| | | | | | | |
| | | | Packaged Foods & Meats 4.7% | | | | |
| | 157,680 | | | Calbee, Inc. (Japan) | | $ | 12,789,395 | |
| | 3,917,023 | | | Super Group Ltd. (Singapore) | | | 12,318,676 | |
| | 14,297,952 | | | Vitasoy International Holdings Ltd.
(Hong Kong) | | | 16,134,546 | |
| | | | | | | | |
| | | | | | | 41,242,617 | |
| | | | | | | | |
| | | | Pharmaceuticals 1.4% | | | | |
| | 767,500 | | | Glenmark Pharmaceuticals Ltd. (India) | | | 6,524,103 | |
| | 45,997,700 | | | PT Kalbe Farma Tbk (Indonesia) | | | 5,869,529 | |
| | | | | | | | |
| | | | | | | 12,393,632 | |
| | | | | | | | |
| | | | Publishing 1.5% | | | | |
| | 495,951 | | | Rightmove plc (United Kingdom) | | | 13,414,952 | |
| | | | | | | | |
| | | | Real Estate Operating Companies 1.3% | | | | |
| | 397,100 | | | Multiplan Empreendimentos Imobiliarios S.A. (Brazil) | | | 11,423,087 | |
| | | | | | | | |
| | | | Research & Consulting Services 1.8% | | | | |
| | 378,314 | | | ALS Ltd. (Australia) | | | 4,124,733 | |
| | 94,688 | | | DKSH Holding AG* (Switzerland) | | | 8,481,012 | |
| | 71,545 | | | Nihon M&A Center, Inc. (Japan) | | | 3,152,482 | |
| | | | | | | | |
| | | | | | | 15,758,227 | |
| | | | | | | | |
| | | | Restaurants 2.2% | | | | |
| | 356,400 | | | Domino’s Pizza Enterprises Ltd. (Australia) | | | 4,290,345 | |
| | 1,657,946 | | | Domino’s Pizza Group plc
(United Kingdom) | | | 15,170,988 | |
| | | | | | | | |
| | | | | | | 19,461,333 | |
| | | | | | | | |
| | | | Soft Drinks 2.3% | | | | |
| | 687,408 | | | Coca-Cola Icecek A.S. (Turkey) | | | 19,831,084 | |
| | | | | | | | |
| | | | Specialty Chemicals 0.3% | | | | |
| | 105,400 | | | Victrex plc (United Kingdom) | | | 2,657,267 | |
| | | | | | | | |
| | | | Specialty Stores 3.6% | | | | |
| | 4,346,654 | | | L’Occitane International S.A. (Luxembourg) | | | 13,214,352 | |
| | 18,481,986 | | | Sa Sa International Holdings Ltd. (China) | | | 17,808,570 | |
| | | | | | | | |
| | | | | | | 31,022,922 | |
| | | | | | | | |
| | | | Thrifts & Mortgage Finance 0.6% | | | | |
| | 1,383,955 | | | Gruh Finance Ltd. (India) | | | 5,421,233 | |
| | | | | | | | |
| | | | Trading Companies & Distributors 1.6% | | | | |
| | 285,728 | | | MonotaRO Co. Ltd. (Japan) | | | 13,789,785 | |
| | | | | | | | |
| | |
| | | | Total Common Stocks
(cost $652,638,579) | | | 815,352,129 | |
| | | | | | | | |
| | | | | | | | |
Principal
Amount | | | | | Value | |
| | | | | | | |
| | | | SHORT-TERM INVESTMENTS 5.8% | | | | |
| | |
| | | | Repurchase Agreement 5.8% | | | | |
| | $50,924,585 | | | Repurchase Agreement dated 3/28/13, 0.01% due 4/1/13 with State Street Bank and Trust Co. collateralized by $50,805,000 of United States Treasury Notes 1.000% due 3/31/17; value: $51,947,909; repurchase proceeds: $50,924,641 (cost $50,924,585) | | $ | 50,924,585 | |
| | | | | | | | |
| | |
| | | | Total Short-Term Investments
(cost $50,924,585) | | | 50,924,585 | |
| | | | | | | | |
| | |
| | | | Total Investments
(cost $703,563,164) 99.3%§ | | | 866,276,714 | |
| | |
| | | | Other Assets less Liabilities 0.7% | | | 5,720,535 | |
| | | | | | | | |
| | |
| | | | NET ASSETS 100.0% | | $ | 871,997,249 | |
| | | | | | | | |
| |
| | | | *Non-income producing. §The aggregate amount of foreign securities fair valued pursuant to a systematic valuation model as a percent of net assets was 3.90% (see Note 15). GDR Global Depositary Receipt. See Notes to Financial Statements. | |
At March 31, 2013, Wasatch International Growth Fund’s investments, excluding short-term investments, were in the following countries:
| | | | |
| Country | | % | |
Australia | | | 7.8 | |
Austria | | | 0.9 | |
Brazil | | | 2.3 | |
Cambodia | | | 2.1 | |
Canada | | | 2.9 | |
China | | | 2.2 | |
Colombia | | | 2.2 | |
Costa Rica | | | 0.9 | |
Germany | | | 4.1 | |
Hong Kong | | | 5.0 | |
India | | | 3.9 | |
Indonesia | | | 2.6 | |
Italy | | | 3.2 | |
Japan | | | 16.5 | |
Kazakhstan | | | 0.5 | |
Luxembourg | | | 1.6 | |
New Zealand | | | 2.0 | |
Nigeria | | | 0.7 | |
Norway | | | 1.4 | |
Philippines | | | 2.8 | |
Russia | | | 1.4 | |
Singapore | | | 2.8 | |
South Africa | | | 1.2 | |
Sweden | | | 1.8 | |
Switzerland | | | 2.1 | |
Taiwan | | | 1.6 | |
Thailand | | | 2.1 | |
Turkey | | | 3.1 | |
United Kingdom | | | 17.8 | |
United States | | | 0.5 | |
| | | | |
TOTAL | | | 100.0 | % |
| | | | |
65
| | |
| WASATCH INTERNATIONAL OPPORTUNITIES FUND (WAIOX) — Schedule of Investments | | |
|
|
|
| | | | | | | | |
| Shares | | | | | Value | |
| | | | | | | |
| | | | COMMON STOCKS 97.3% | | | | |
| | |
| | | | Apparel Retail 2.6% | | | | |
| | 2,247,700 | | | Giordano International Ltd. (Hong Kong) | | $ | 2,235,293 | |
| | 6,879,490 | | | Padini Holdings Berhad (Malaysia) | | | 4,265,661 | |
| | | | | | | | |
| | | | | | | 6,500,954 | |
| | | | | | | | |
| | | | Apparel, Accessories & Luxury Goods 2.8% | | | | |
| | 36,908 | | | Gerry Weber International AG (Germany) | | | 1,611,048 | |
| | 36,300 | | | Page Industries Ltd. (India) | | | 2,224,085 | |
| | 163,206 | | | Ted Baker plc (United Kingdom) | | | 3,222,299 | |
| | | | | | | | |
| | | | | | | 7,057,432 | |
| | | | | | | | |
| | | | Application Software 2.5% | | | | |
| | 163,000 | | | Computer Modelling Group Ltd. (Canada) | | | 3,381,869 | |
| | 1,539,295 | | | Technology One Ltd. (Australia) | | | 2,829,198 | |
| | | | | | | | |
| | | | | | | 6,211,067 | |
| | | | | | | | |
| | | | Auto Parts & Equipment 0.7% | | | | |
| | 69,407 | | | WABCO India Ltd. (India) | | | 1,762,440 | |
| | | | | | | | |
| | | | Biotechnology 1.7% | | | | |
| | 614,468 | | | Abcam plc (United Kingdom) | | | 4,176,176 | |
| | | | | | | | |
| | | | Brewers 3.0% | | | | |
| | 362,475 | | | Carlsberg Brewery Malaysia Berhad (Malaysia) | | | 1,615,422 | |
| | 116,213 | | | Olvi Oyj, Class A (Finland) | | | 3,173,257 | |
| | 30,857 | | | Royal UNIBREW A/S (Denmark) | | | 2,744,643 | |
| | | | | | | | |
| | | | | | | 7,533,322 | |
| | | | | | | | |
| | | | Building Products 2.3% | | | | |
| | 1,221,251 | | | Dynasty Ceramic Public Co. Ltd. (Thailand) | | | 2,595,966 | |
| | 12,743,000 | | | PT Arwana Citramulia Tbk (Indonesia) | | | 3,114,446 | |
| | | | | | | | |
| | | | | | | 5,710,412 | |
| | | | | | | | |
| | | | Commodity Chemicals 3.4% | | | | |
| | 1,224,627 | | | Berger Paints India Ltd. (India) | | | 4,401,672 | |
| | 130,700 | | | Tikkurila Oyj (Finland) | | | 2,747,833 | |
| | 518,400 | | | Yung Chi Paint & Varnish Manufacturing Co. Ltd. (Taiwan) | | | 1,243,016 | |
| | | | | | | | |
| | | | | | | 8,392,521 | |
| | | | | | | | |
| | | | Construction & Engineering 0.3% | | | | |
| | 17,300 | | | Badger Daylighting Ltd. (Canada) | | | 687,405 | |
| | | | | | | | |
| | | | Construction & Farm Machinery & Heavy Trucks 0.8% | | | | |
| | 41,645 | | | Eicher Motors Ltd. (India) | | | 1,950,074 | |
| | | | | | | | |
| | | | Construction Materials 0.9% | | | | |
| | 6,997,973 | | | Diamond Building Products Public Co. Ltd. (Thailand) | | | 2,162,597 | |
| | | | | | | | |
| | | | Data Processing & Outsourced Services 1.8% | | | | |
| | 80,000 | | | GMO Payment Gateway, Inc. (Japan) | | | 1,868,396 | |
| | 97,380 | | | Wirecard AG (Germany) | | | 2,690,221 | |
| | | | | | | | |
| | | | | | | 4,558,617 | |
| | | | | | | | |
| | | | Department Stores 1.9% | | | | |
| | 1,921,057 | | | Parkson Retail Asia Ltd. (Malaysia) | | | 2,540,548 | |
| | 727,100 | | | Poya Co. Ltd. (Taiwan) | | | 2,314,854 | |
| | | | | | | | |
| | | | | | | 4,855,402 | |
| | | | | | | | |
| | | | Diversified Banks 1.4% | | | | |
| | 4,170,000 | | | EastWest Banking Corp.* (Philippines) | | | 3,412,072 | |
| | | | | | | | |
| | | | Diversified Support Services 0.4% | | | | |
| | 256,000 | | | Vicom Ltd. (Singapore) | | | 1,059,011 | |
| | | | | | | | |
| | | | | | | | |
| Shares | | | | | Value | |
| | | | | | | |
| | | | Drug Retail 3.9% | | | | |
| | 37,353 | | | Cosmos Pharmaceutical Corp. (Japan) | | $ | 4,860,218 | |
| | 60,900 | | | Kusuri No Aoki Co. Ltd. (Japan) | | | 4,758,318 | |
| | | | | | | | |
| | | | | | | 9,618,536 | |
| | | | | | | | |
| | | | Electrical Components & Equipment 1.3% | | | | |
| | 648,140 | | | Amara Raja Batteries Ltd. (India) | | | 3,328,947 | |
| | | | | | | | |
| | | | Electronic Equipment & Instruments 1.5% | | | | |
| | 144,245 | | | Oxford Instruments plc (United Kingdom) | | | 3,625,644 | |
| | | | | | | | |
| | | | Food Distributors 1.2% | | | | |
| | 8,727,000 | | | Premier Marketing Public Co. Ltd. (Thailand) | | | 3,129,025 | |
| | | | | | | | |
| | | | Food Retail 4.9% | | | | |
| | 2,942,000 | | | Convenience Retail Asia Ltd. (Hong Kong) | | | 2,236,009 | |
| | 1,870,822 | | | Philippine Seven Corp. (Philippines) | | | 4,176,342 | |
| | 3,230,000 | | | PT Sumber Alfaria Trijaya Tbk (Indonesia) | | | 2,160,535 | |
| | 87,042 | | | Rami Levi Chain Stores Hashikma Marketing 2006 Ltd. (Israel) | | | 3,525,691 | |
| | | | | | | | |
| | | | | | | 12,098,577 | |
| | | | | | | | |
| | | | Footwear 0.7% | | | | |
| | 125,520 | | | Bata India Ltd. (India) | | | 1,651,044 | |
| | | | | | | | |
| | | | General Merchandise Stores 1.0% | | | | |
| | 98,972 | | | Seria Co. Ltd. (Japan) | | | 2,464,042 | |
| | | | | | | | |
| | | | Gold 1.3% | | | | |
| | 139,704 | | | Koza Altin Isletmeleri A.S. (Turkey) | | | 3,239,692 | |
| | | | | | | | |
| | | | Health Care Facilities 2.0% | | | | |
| | 1,231,430 | | | KPJ Healthcare Berhad (Malaysia) | | | 2,362,246 | |
| | 958,205 | | | Raffles Medical Group Ltd. (Singapore) | | | 2,534,402 | |
| | | | | | | | |
| | | | | | | 4,896,648 | |
| | | | | | | | |
| | | | Health Care Supplies 1.6% | | | | |
| | 8,806 | | | Sartorius Stedim Biotech (France) | | | 1,174,040 | |
| | 138,500 | | | St. Shine Optical Co. Ltd. (Taiwan) | | | 2,769,768 | |
| | | | | | | | |
| | | | | | | 3,943,808 | |
| | | | | | | | |
| | | | Home Improvement Retail 0.8% | | | | |
| | 139,513 | | | Cashbuild Ltd. (South Africa) | | | 1,893,414 | |
| | | | | | | | |
| | | | Household Products 2.5% | | | | |
| | 83,762 | | | Pigeon Corp. (Japan) | | | 6,117,199 | |
| | | | | | | | |
| | | | Hypermarkets & Super Centers 1.1% | | | | |
| | 2,822,900 | | | Puregold Price Club, Inc. (Philippines) | | | 2,772,191 | |
| | | | | | | | |
| | | | Industrial Machinery 2.2% | | | | |
| | 61,700 | | | FAG Bearings India Ltd. (India) | | | 1,668,795 | |
| | 735,200 | | | Howden Africa Holdings Ltd.
(South Africa) | | | 2,470,550 | |
| | 132,047 | | | SKF India Ltd. (India) | | | 1,336,627 | |
| | | | | | | | |
| | | | | | | 5,475,972 | |
| | | | | | | | |
| | | | Internet Retail 1.6% | | | | |
| | 529,300 | | | Webjet Ltd. (Australia) | | | 2,612,624 | |
| | 68,969 | | | Yoox S.p.A.* (Italy) | | | 1,292,624 | |
| | | | | | | | |
| | | | | | | 3,905,248 | |
| | | | | | | | |
| | | | Internet Software & Services 2.2% | | | | |
| | 69,000 | | | Infomart Corp. (Japan) | | | 1,870,416 | |
| | 169,633 | | | iomart Group plc (United Kingdom) | | | 592,549 | |
| | 119,110 | | | Kakaku.com, Inc. (Japan) | | | 2,932,484 | |
| | | | | | | | |
| | | | | | | 5,395,449 | |
| | | | | | | | |
| | | | IT Consulting & Other Services 2.7% | | | | |
| | 200,902 | | | Bit-isle, Inc. (Japan) | | | 2,793,450 | |
| | 731,925 | | | EOH Holdings Ltd. (South Africa) | | | 3,940,826 | |
| | | | | | | | |
| | | | | | | 6,734,276 | |
| | | | | | | | |
66
| | |
| | MARCH 31, 2013 (UNAUDITED) |
|
|
|
| | | | | | | | |
| Shares | | | | | Value | |
| | | | | | | |
| | | | Marine Ports & Services 0.5% | | | | |
| | 346,100 | | | Veripos, Inc.* (Norway) | | $ | 1,304,382 | |
| | | | | | | | |
| | | | Metal & Glass Containers 0.9% | | | | |
| | 119,158 | | | Winpak Ltd. (Canada) | | | 2,262,420 | |
| | | | | | | | |
| | | | Office Services & Supplies 2.3% | | | | |
| | 92,804 | | | Adel Kalemcilik Ticaret ve Sanayi AS (Turkey) | | | 2,702,930 | |
| | 15,625,000 | | | PT Astra Graphia Tbk (Indonesia) | | | 2,990,738 | |
| | | | | | | | |
| | | | | | | 5,693,668 | |
| | | | | | | | |
| | | | Oil & Gas Exploration &
Production 0.8% | | | | |
| | 99,210 | | | Coastal Energy Co.* (Thailand) | | | 1,893,432 | |
| | | | | | | | |
| | | | Oil & Gas Refining & Marketing 1.5% | | | | |
| | 12,619 | | | Hankook Shell Oil Co. Ltd. (Korea) | | | 3,629,409 | |
| | | | | | | | |
| | | | Packaged Foods & Meats 15.0% | | | | |
| | 566,900 | | | Clover Industries Ltd. (South Africa) | | | 1,044,677 | |
| | 1,810,000 | | | Del Monte Pacific Ltd. (Singapore) | | | 1,306,306 | |
| | 62,902 | | | Dutch Lady Milk Industries Berhad (Malaysia) | | | 966,942 | |
| | 1,069,300 | | | Grupo Herdez S.A.B. de C.V. (Mexico) | | | 3,935,877 | |
| | 398,700 | | | Malee Sampran Factory Public Co. Ltd. (Thailand) | | | 1,946,870 | |
| | 1,566,700 | | | Oldtown Berhad (Malaysia) | | | 1,244,657 | |
| | 1,253,000 | | | Petra Foods Ltd. (Indonesia) | | | 4,203,274 | |
| | 275,293 | | | Pinar Sut Mamulleri Sanayii A.S. (Turkey) | | | 2,333,185 | |
| | 3,265,000 | | | PT Nippon Indosari Corpindo Tbk (Indonesia) | | | 2,419,141 | |
| | 40,085,400 | | | RFM Corp. (Philippines) | | | 4,620,848 | |
| | 832,415 | | | Standard Foods Corp. (Taiwan) | | | 2,505,387 | |
| | 1,700,800 | | | Super Group Ltd. (Singapore) | | | 5,348,859 | |
| | 3,743,120 | | | Vitasoy International Holdings Ltd.
(Hong Kong) | | | 4,223,929 | |
| | 4,778 | | | Wawel S.A. (Poland) | | | 1,165,831 | |
| | | | | | | | |
| | | | | | | 37,265,783 | |
| | | | | | | | |
| | | | Photographic Products 0.6% | | | | |
| | 14,147,500 | | | PT Modern Internasional Tbk (Indonesia) | | | 1,455,879 | |
| | | | | | | | |
| | | | Regional Banks 0.7% | | | | |
| | 345,400 | | | Banregio Grupo Financiero S.A.B. de C.V.* (Mexico) | | | 1,798,676 | |
| | | | | | | | |
| | | | Research & Consulting Services 1.8% | | | | |
| | 100,800 | | | Nihon M&A Center, Inc. (Japan) | | | 4,441,544 | |
| | | | | | | | |
| | | | Restaurants 7.6% | | | | |
| | 313,067 | | | Domino’s Pizza Enterprises Ltd. (Australia) | | | 3,768,702 | |
| | 450,900 | | | Fairwood Holdings Ltd. (Hong Kong) | | | 975,817 | |
| | 501,188 | | | Famous Brands Ltd. (South Africa) | | | 4,666,813 | |
| | 142,700 | | | Hiday Hidaka Corp. (Japan) | | | 3,058,182 | |
| | 1,988,137 | | | Spur Corp. Ltd. (South Africa) | | | 6,333,918 | |
| | | | | | | | |
| | | | | | | 18,803,432 | |
| | | | | | | | |
| | | | Soft Drinks 2.1% | | | | |
| | 33,427,532 | | | Pepsi-Cola Products Philippines, Inc.* (Philippines) | | | 5,143,957 | |
| | | | | | | | |
| | | | Specialty Chemicals 1.2% | | | | |
| | 673,719 | | | DuluxGroup Ltd. (Australia) | | | 3,122,019 | |
| | | | | | | | |
| | | | Tires & Rubber 0.4% | | | | |
| | 199,183 | | | Goodyear India Ltd. (India) | | | 943,600 | |
| | | | | | | | |
| | | | Tobacco 0.5% | | | | |
| | 26,488 | | | Godfrey Phillips India Ltd. (India) | | | 1,328,543 | |
| | | | | | | | |
| | | | Trading Companies &
Distributors 2.4% | | | | |
| | 33,727 | | | Indutrade AB (Sweden) | | | 1,184,513 | |
| | 99,986 | | | MonotaRO Co. Ltd. (Japan) | | | 4,825,518 | |
| | | | | | | | |
| | | | | | | 6,010,031 | |
| | | | | | | | |
| | | | | | | | |
| Shares | | | | | Value | |
| | | | | | | |
| | |
| | | | Total Common Stocks
(cost $169,411,139) | | $ | 241,415,989 | |
| | | | | | | | |
| | |
Principal
Amount | | | | | Value | |
| | | | | | | |
| | | | SHORT-TERM INVESTMENTS 3.4% | | | | |
| | |
| | | | Repurchase Agreement 3.4% | | | | |
| | $8,399,722 | | | Repurchase Agreement dated 3/28/13, 0.01% due 4/1/13 with State Street Bank and Trust Co. collateralized by $8,610,000 of United States Treasury Notes 0.500% due 7/31/17; value: $8,570,248; repurchase proceeds: $8,399,732 (cost $8,399,722) | | $ | 8,399,722 | |
| | | | | | | | |
| | |
| | | | Total Short-Term Investments
(cost $8,399,722) | | | 8,399,722 | |
| | | | | | | | |
| | |
| | | | Total Investments
(cost $177,810,861) 100.7%§ | | | 249,815,711 | |
| | |
| | | | Liabilities less Other Assets (0.7%) | | | (1,856,177 | ) |
| | | | | | | | |
| | |
| | | | NET ASSETS 100.0% | | $ | 247,959,534 | |
| | | | | | | | |
| |
| | | | *Non-income producing. §The aggregate amount of foreign securities fair valued pursuant to a systematic valuation model as a percent of net assets was 7.15% (see Note 15). See Notes to Financial Statements. | |
At March 31, 2013, Wasatch International Opportunities Fund’s investments, excluding short-term investments, were in the following countries:
| | | | |
| Country | | % | |
Australia | | | 5.1 | |
Canada | | | 2.6 | |
Denmark | | | 1.1 | |
Finland | | | 2.5 | |
France | | | 0.5 | |
Germany | | | 1.8 | |
Hong Kong | | | 4.0 | |
India | | | 8.5 | |
Indonesia | | | 6.8 | |
Israel | | | 1.5 | |
Italy | | | 0.5 | |
Japan | | | 16.6 | |
Korea | | | 1.5 | |
Malaysia | | | 5.4 | |
Mexico | | | 2.4 | |
Norway | | | 0.5 | |
Philippines | | | 8.3 | |
Poland | | | 0.5 | |
Singapore | | | 4.2 | |
South Africa | | | 8.4 | |
Sweden | | | 0.5 | |
Taiwan | | | 3.7 | |
Thailand | | | 4.9 | |
Turkey | | | 3.4 | |
United Kingdom | | | 4.8 | |
| | | | |
TOTAL | | | 100.0 | % |
| | | | |
67
| | |
| WASATCH LARGE CAP VALUE FUND (FMIEX / WILCX) — Schedule of Investments | | |
|
|
|
| | | | | | | | |
| Shares | | | | | Value | |
| | | | | | | |
| | | | COMMON STOCKS 91.9% | | | | |
| | |
| | | | Aerospace & Defense 3.5% | | | | |
| | 188,751 | | | L-3 Communications Holdings, Inc. | | $ | 15,273,731 | |
| | 235,000 | | | Raytheon Co. | | | 13,815,650 | |
| | 234,000 | | | Rockwell Collins, Inc. | | | 14,770,080 | |
| | | | | | | | |
| | | | | | | 43,859,461 | |
| | | | | | | | |
| | | | Agricultural Products 1.6% | | | | |
| | 612,368 | | | Archer Daniels Midland Co. | | | 20,655,173 | |
| | | | | | | | |
| | | | Asset Management & Custody
Banks 3.2% | | | | |
| | 85,000 | | | BlackRock, Inc. | | | 21,834,800 | |
| | 335,000 | | | Northern Trust Corp. | | | 18,277,600 | |
| | | | | | | | |
| | | | | | | 40,112,400 | |
| | | | | | | | |
| | | | Auto Parts & Equipment 1.5% | | | | |
| | 543,000 | | | Johnson Controls, Inc. | | | 19,043,010 | |
| | | | | | | | |
| | | | Automobile Manufacturers 1.4% | | | | |
| | 1,362,000 | | | Ford Motor Co. | | | 17,910,300 | |
| | | | | | | | |
| | | | Communications Equipment 1.4% | | | | |
| | 385,000 | | | Harris Corp. | | | 17,840,900 | |
| | | | | | | | |
| | | | Computer Hardware 1.5% | | | | |
| | 43,350 | | | Apple, Inc. | | | 19,188,011 | |
| | | | | | | | |
| | | | Construction & Farm Machinery & Heavy Trucks 1.2% | | | | |
| | 173,295 | | | Deere & Co. | | | 14,899,904 | |
| | | | | | | | |
| | | | Department Stores 0.9% | | | | |
| | 281,000 | | | Macy’s, Inc. | | | 11,757,040 | |
| | | | | | | | |
| | | | Diversified Metals & Mining 0.6% | | | | |
| | 230,000 | | | Freeport-McMoRan Copper & Gold, Inc. | | | 7,613,000 | |
| | | | | | | | |
| | | | Drug Retail 3.3% | | | | |
| | 415,000 | | | CVS Caremark Corp. | | | 22,820,850 | |
| | 394,000 | | | Walgreen Co. | | | 18,785,920 | |
| | | | | | | | |
| | | | | | | 41,606,770 | |
| | | | | | | | |
| | | | Electric Utilities 3.1% | | | | |
| | 280,666 | | | Duke Energy Corp. | | | 20,373,545 | |
| | 246,000 | | | NextEra Energy, Inc. | | | 19,109,280 | |
| | | | | | | | |
| | | | | | | 39,482,825 | |
| | | | | | | | |
| | | | Electrical Components &
Equipment 1.5% | | | | |
| | 328,230 | | | Emerson Electric Co. | | | 18,338,210 | |
| | | | | | | | |
| | | | Environmental & Facilities
Services 1.7% | | | | |
| | 543,000 | | | Waste Management, Inc. | | | 21,291,030 | |
| | | | | | | | |
| | | | Fertilizers & Agricultural
Chemicals 0.7% | | | | |
| | 210,000 | | | Potash Corp. of Saskatchewan, Inc. (Canada) | | | 8,242,500 | |
| | | | | | | | |
| | | | Food Distributors 1.8% | | | | |
| | 631,000 | | | Sysco Corp. | | | 22,192,270 | |
| | | | | | | | |
| | | | Gold 1.2% | | | | |
| | 523,000 | | | Barrick Gold Corp. (Canada) | | | 15,376,200 | |
| | | | | | | | |
| | | | Health Care Distributors 1.9% | | | | |
| | 220,798 | | | McKesson Corp. | | | 23,837,352 | |
| | | | | | | | |
| | | | Health Care Equipment 6.0% | | | | |
| | 368,000 | | | Abbott Laboratories | | | 12,997,760 | |
| | 245,644 | | | C.R. Bard, Inc. | | | 24,756,002 | |
| | 436,000 | | | Medtronic, Inc. | | | 20,474,560 | |
| | 232,000 | | | Zimmer Holdings, Inc. | | | 17,451,040 | |
| | | | | | | | |
| | | | | | | 75,679,362 | |
| | | | | | | | |
| | | | | | | | |
| Shares | | | | | Value | |
| | | | | | | |
| | | | Home Improvement Retail 0.9% | | | | |
| | 302,000 | | | Lowe’s Cos., Inc. | | $ | 11,451,840 | |
| | | | | | | | |
| | | | Household Products 2.0% | | | | |
| | 60,255 | | | Energizer Holdings, Inc. | | | 6,009,231 | |
| | 195,000 | | | Kimberly-Clark Corp. | | | 19,106,100 | |
| | | | | | | | |
| | | | | | | 25,115,331 | |
| | | | | | | | |
| | | | Hypermarkets & Super Centers 1.9% | | | | |
| | 319,000 | | | Wal-Mart Stores, Inc. | | | 23,870,770 | |
| | | | | | | | |
| | | | Industrial Machinery 1.2% | | | | |
| | 158,000 | | | Parker Hannifin Corp. | | | 14,469,640 | |
| | | | | | | | |
| | | | Insurance Brokers 1.5% | | | | |
| | 486,000 | | | Marsh & McLennan Cos., Inc. | | | 18,453,420 | |
| | | | | | | | |
| | | | Integrated Oil & Gas 1.6% | | | | |
| | 121,000 | | | Chevron Corp. | | | 14,377,220 | |
| | 77,000 | | | Occidental Petroleum Corp. | | | 6,034,490 | |
| | | | | | | | |
| | | | | | | 20,411,710 | |
| | | | | | | | |
| | | | Integrated Telecommunication Services 1.7% | | | | |
| | 577,760 | | | AT&T, Inc. | | | 21,198,014 | |
| | | | | | | | |
| | | | Investment Banking & Brokerage 1.8% | | | | |
| | 152,450 | | | Goldman Sachs Group, Inc. (The) | | | 22,433,017 | |
| | | | | | | | |
| | | | Life & Health Insurance 2.2% | | | | |
| | 346,000 | | | MetLife, Inc. | | | 13,154,920 | |
| | 511,000 | | | Unum Group | | | 14,435,750 | |
| | | | | | | | |
| | | | | | | 27,590,670 | |
| | | | | | | | |
| | | | Managed Health Care 1.5% | | | | |
| | 283,000 | | | WellPoint, Inc. | | | 18,743,090 | |
| | | | | | | | |
| | | | Multi-Line Insurance 2.0% | | | | |
| | 558,809 | | | Loews Corp. | | | 24,626,713 | |
| | | | | | | | |
| | | | Oil & Gas Drilling 1.5% | | | | |
| | 321,210 | | | Ensco plc, Class A | | | 19,272,600 | |
| | | | | | | | |
| | | | Oil & Gas Equipment & Services 3.2% | | | | |
| | 441,000 | | | Halliburton Co. | | | 17,820,810 | |
| | 321,616 | | | National Oilwell Varco, Inc. | | | 22,754,332 | |
| | | | | | | | |
| | | | | | | 40,575,142 | |
| | | | | | | | |
| | | | Oil & Gas Exploration & Production 4.6% | | | | |
| | 232,000 | | | Anadarko Petroleum Corp. | | | 20,288,400 | |
| | 215,000 | | | ConocoPhillips | | | 12,921,500 | |
| | 727,000 | | | Marathon Oil Corp. | | | 24,514,440 | |
| | | | | | | | |
| | | | | | | 57,724,340 | |
| | | | | | | | |
| | | | Oil & Gas Storage & Transportation 3.1% | | | | |
| | 783,000 | | | Spectra Energy Corp. | | | 24,077,250 | |
| | 393,000 | | | Williams Cos., Inc. (The) | | | 14,721,780 | |
| | | | | | | | |
| | | | | | | 38,799,030 | |
| | | | | | | | |
| | | | Other Diversified Financial Services 2.2% | | | | |
| | 583,000 | | | JPMorgan Chase & Co. | | | 27,669,180 | |
| | | | | | | | |
| | | | Packaged Foods & Meats 0.7% | | | | |
| | 158,000 | | | Kraft Foods Group, Inc. | | | 8,141,740 | |
| | | | | | | | |
| | | | Pharmaceuticals 5.2% | | | | |
| | 105,000 | | | Johnson & Johnson | | | 8,560,650 | |
| | 424,000 | | | Merck & Co., Inc. | | | 18,753,520 | |
| | 647,000 | | | Pfizer, Inc. | | | 18,672,420 | |
| | 481,780 | | | Teva Pharmaceutical Industries Ltd. ADR (Israel) | | | 19,117,030 | |
| | | | | | | | |
| | | | | | | 65,103,620 | |
| | | | | | | | |
68
| | |
| | MARCH 31, 2013 (UNAUDITED) |
|
|
|
| | | | | | | | |
Shares | | | | | Value | |
| | | | | | | |
| | | | Property & Casualty Insurance 4.3% | | | | |
| | 519,000 | | | Allstate Corp. (The) | | $ | 25,467,330 | |
| | 337,735 | | | Travelers Cos., Inc. (The) | | | 28,433,910 | |
| | | | | | | | |
| | | | | | | 53,901,240 | |
| | | | | | | | |
| | | | Regional Banks 2.0% | | | | |
| | 377,000 | | | PNC Financial Services Group, Inc. | | | 25,070,500 | |
| | | | | | | | |
| | | | Semiconductors 2.0% | | | | |
| | 1,170,000 | | | Intel Corp. | | | 25,564,500 | |
| | | | | | | | |
| | | | Specialized REITs 1.6% | | | | |
| | 649,000 | | | Weyerhaeuser Co. | | | 20,365,620 | |
| | | | | | | | |
| | | | Steel 0.7% | | | | |
| | 177,000 | | | Nucor Corp. | | | 8,168,550 | |
| | | | | | | | |
| | | | Systems Software 2.9% | | | | |
| | 219,009 | | | Check Point Software Technologies Ltd.* (Israel) | | | 10,291,233 | |
| | 934,000 | | | Microsoft Corp. | | | 26,721,740 | |
| | | | | | | | |
| | | | | | | 37,012,973 | |
| | | | | | | | |
| | | | Water Utilities 1.6% | | | | |
| | 478,000 | | | American Water Works Co., Inc. | | | 19,808,320 | |
| | | | | | | | |
| | |
| | | | Total Common Stocks (cost $809,265,235) | | | 1,154,467,288 | |
| | | | | | | | |
| | | | | | | | |
Principal
Amount | | | | | Value | |
| | | | | | | |
| | | | SHORT-TERM INVESTMENTS 8.0% | | | | |
| | |
| | | | Repurchase Agreement 8.0% | | | | |
| | $100,859,370 | | | Repurchase Agreement dated 3/28/13, 0.01% due 4/1/13 with State Street Bank and Trust Co. collateralized by $100,615,000 of United States Treasury Notes 1.000% due 3/31/17; value: $102,878,435; repurchase proceeds: $100,859,482 (cost $100,859,370) | | $ | 100,859,370 | |
| | | | | | | | |
| | |
| | | | Total Short-Term Investments (cost $100,859,370) | | | 100,859,370 | |
| | | | | | | | |
| | |
| | | | Total Investments (cost $910,124,605) 99.9% | | | 1,255,326,658 | |
| | |
| | | | Other Assets less Liabilities 0.1% | | | 947,333 | |
| | | | | | | | |
| | |
| | | | NET ASSETS 100.0% | | $ | 1,256,273,991 | |
| | | | | | | | |
| |
| | | | *Non-income producing. ADR American Depositary Receipt. REIT Real Estate Investment Trust. See Notes to Financial Statements. | |
At March 31, 2013, Wasatch Large Cap Value Fund’s investments, excluding short-term investments, were in the following countries:
| | | | |
| Country | | % | |
Canada | | | 2.0 | |
Israel | | | 2.6 | |
United States | | | 95.4 | |
| | | | |
TOTAL | | | 100.0 | % |
| | | | |
69
| | |
| WASATCH LONG/SHORT FUND (FMLSX / WILSX) — Schedule of Investments | | |
|
|
|
| | | | | | | | |
| Shares | | | | | Value | |
| | | | | | | |
| | | | COMMON STOCKS 81.1% | | | | |
| | |
| | | | Advertising 2.2% | | | | |
| | 3,064,118 | | | Interpublic Group of Cos., Inc. (The) | | $ | 39,925,458 | |
| | | | | | | | |
| | | | Airlines 2.0% | | | | |
| | 2,769,700 | | | Southwest Airlines Co. | | | 37,335,556 | |
| | | | | | | | |
| | | | Apparel Retail 1.0% | | | | |
| | 607,452 | | | ANN, Inc.* | | | 17,628,257 | |
| | | | | | | | |
| | | | Automobile Manufacturers 2.6% | | | | |
| | 1,750,400 | | | General Motors Co.* ‡ | | | 48,696,128 | |
| | | | | | | | |
| | | | Automotive Retail 0.7% | | | | |
| | 1,126,430 | | | Pep Boys — Manny, Moe & Jack (The)* | | | 13,280,610 | |
| | | | | | | | |
| | | | Communications Equipment 2.3% | | | | |
| | 2,040,600 | | | Cisco Systems, Inc.‡ | | | 42,668,946 | |
| | | | | | | | |
| | | | Computer & Electronics Retail 0.8% | | | | |
| | 527,800 | | | GameStop Corp., Class A‡ | | | 14,762,566 | |
| | | | | | | | |
| | | | Computer Hardware 6.6% | | | | |
| | 193,873 | | | Apple, Inc.‡ | | | 85,814,006 | |
| | 2,687,438 | | | Silicon Graphics International Corp.* ‡‡ | | | 36,952,272 | |
| | | | | | | | |
| | | | | | | 122,766,278 | |
| | | | | | | | |
| | | | Construction & Engineering 1.2% | | | | |
| | 933,488 | | | Aegion Corp.* | | | 21,610,247 | |
| | | | | | | | |
| | | | Data Processing & Outsourced Services 2.7% | | | | |
| | 1,622,279 | | | Convergys Corp. | | | 27,627,411 | |
| | 468,607 | | | Global Payments, Inc. | | | 23,271,024 | |
| | | | | | | | |
| | | | | | | 50,898,435 | |
| | | | | | | | |
| | | | Electrical Components & Equipment 0.6% | | | | |
| | 306,913 | | | General Cable Corp.* | | | 11,242,223 | |
| | | | | | | | |
| | | | Electronic Equipment & Instruments 0.5% | | | | |
| | 197,900 | | | Itron, Inc.* | | | 9,182,560 | |
| | | | | | | | |
| | | | Environmental & Facilities Services 1.3% | | | | |
| | 722,352 | | | Republic Services, Inc.‡ | | | 23,837,616 | |
| | | | | | | | |
| | | | Fertilizers & Agricultural Chemicals 3.2% | | | | |
| | 1,000,400 | | | Mosaic Co. (The)‡ | | | 59,633,844 | |
| | | | | | | | |
| | | | General Merchandise Stores 1.6% | | | | |
| | 435,300 | | | Target Corp.‡ | | | 29,796,285 | |
| | | | | | | | |
| | | | Gold 1.1% | | | | |
| | 1,338,099 | | | Yamana Gold, Inc. (Canada) | | | 20,539,820 | |
| | | | | | | | |
| | | | Health Care Equipment 1.6% | | | | |
| | 352,900 | | | Medtronic, Inc.‡ | | | 16,572,184 | |
| | 208,800 | | | Stryker Corp.‡ | | | 13,622,112 | |
| | | | | | | | |
| | | | | | | 30,194,296 | |
| | | | | | | | |
| | | | Health Care Services 1.9% | | | | |
| | 611,201 | | | Express Scripts Holding Co.* | | | 35,235,738 | |
| | | | | | | | |
| | | | Household Appliances 0.8% | | | | |
| | 580,500 | | | iRobot Corp.* | | | 14,895,630 | |
| | | | | | | | |
| | | | Insurance Brokers 1.3% | | | | |
| | 377,000 | | | Aon plc | | | 23,185,500 | |
| | | | | | | | |
| | | | IT Consulting & Other Services 0.6% | | | | |
| | 795,703 | | | Saic, Inc. | | | 10,781,776 | |
| | | | | | | | |
| | | | | | | | |
| Shares | | | | | Value | |
| | | | | | | |
| | | | Life & Health Insurance 3.7% | | | | |
| | 672,700 | | | MetLife, Inc.‡ | | $ | 25,576,054 | |
| | 1,543,900 | | | Unum Group‡ | | | 43,615,175 | |
| | | | | | | | |
| | | | | | | 69,191,229 | |
| | | | | | | | |
| | | | Multi-Line Insurance 3.5% | | | | |
| | 1,465,171 | | | Loews Corp.‡ | | | 64,570,086 | |
| | | | | | | | |
| | | | Oil & Gas Drilling 8.0% | | | | |
| | 464,100 | | | Ensco plc, Class A | | | 27,846,000 | |
| | 298,857 | | | Helmerich & Payne, Inc. | | | 18,140,620 | |
| | 861,260 | | | Noble Corp.‡ | | | 32,857,069 | |
| | 2,139,811 | | | Patterson-UTI Energy, Inc. | | | 51,013,094 | |
| | 398,175 | | | Unit Corp.* | | | 18,136,871 | |
| | | | | | | | |
| | | | | | | 147,993,654 | |
| | | | | | | | |
| | | | Oil & Gas Equipment & Services 3.8% | | | | |
| | 992,700 | | | Halliburton Co.‡ | | | 40,115,007 | |
| | 434,095 | | | National Oilwell Varco, Inc. | | | 30,712,221 | |
| | | | | | | | |
| | | | | | | 70,827,228 | |
| | | | | | | | |
| | | | Oil & Gas Exploration & Production 10.4% | | | | |
| | 1,801,792 | | | Bill Barrett Corp.*‡ | | | 36,522,324 | |
| | 417,500 | | | ConocoPhillips | | | 25,091,750 | |
| | 4,879,732 | | | Denbury Resources, Inc.* | | | 91,007,002 | |
| | 490,380 | | | Energen Corp.‡ | | | 25,504,664 | |
| | 970,970 | | | Swift Energy Co.* | | | 14,380,065 | |
| | | | | | | | |
| | | | | | | 192,505,805 | |
| | | | | | | | |
| | | | Other Diversified Financial Services 0.9% | | | | |
| | 390,700 | | | Citigroup, Inc. | | | 17,284,568 | |
| | | | | | | | |
| | | | Personal Products 0.9% | | | | |
| | 848,392 | | | Avon Products, Inc. | | | 17,587,166 | |
| | | | | | | | |
| | | | Pharmaceuticals 1.8% | | | | |
| | 330,800 | | | Novartis AG ADR (Switzerland) | | | 23,566,192 | |
| | 318,016 | | | Questcor Pharmaceuticals, Inc. | | | 10,348,241 | |
| | | | | | | | |
| | | | | | | 33,914,433 | |
| | | | | | | | |
| | | | Property & Casualty Insurance 2.1% | | | | |
| | 1,178,200 | | | CNA Financial Corp.‡ | | | 38,515,358 | |
| | | | | | | | |
| | | | Regional Banks 0.5% | | | | |
| | 537,700 | | | Fifth Third Bancorp‡ | | | 8,769,887 | |
| | | | | | | | |
| | | | Research & Consulting Services 0.5% | | | | |
| | 748,352 | | | Resources Connection, Inc. | | | 9,504,070 | |
| | | | | | | | |
| | | | Semiconductors 1.5% | | | | |
| | 1,233,129 | | | Intel Corp. | | | 26,943,869 | |
| | | | | | | | |
| | | | Specialized Consumer Services 1.7% | | | | |
| | 538,798 | | | Coinstar, Inc.*‡ | | | 31,476,579 | |
| | | | | | | | |
| | | | Steel 0.5% | | | | |
| | 621,400 | | | Commercial Metals Co. | | | 9,849,190 | |
| | | | | | | | |
| | | | Systems Software 2.7% | | | | |
| | 1,108,500 | | | Microsoft Corp.‡ | | | 31,714,185 | |
| | 589,100 | | | Oracle Corp. | | | 19,051,494 | |
| | | | | | | | |
| | | | | | | 50,765,679 | |
| | | | | | | | |
| | | | Trucking 0.8% | | | | |
| | 949,900 | | | Knight Transportation, Inc. | | | 15,293,390 | |
| | | | | | | | |
| | | | Wireless Telecommunication Services 1.2% | | | | |
| | 779,500 | | | Vodafone Group plc ADR
(United Kingdom) | | | 22,145,595 | |
| | | | | | | | |
| | |
| | | | Total Common Stocks
(cost $1,259,381,344) | | | 1,505,235,555 | |
| | | | | | | | |
70
| | |
| | MARCH 31, 2013 (UNAUDITED) |
|
|
|
| | | | | | | | |
Principal
Amount | | | | | Value | |
| | | | | | | |
| | | | SHORT-TERM INVESTMENTS 18.8% | | | | |
| | |
| | | | Repurchase Agreement 18.8% | | | | |
| | $349,751,080 | | | Repurchase Agreement dated 3/28/13, 0.01% due 4/1/13 with State Street Bank and Trust Co. collateralized by $349,115,000 of United States Treasury Notes 0.500% due 7/31/17; value: $3,200,156; United States Treasury Notes 0.625% due 5/31/17; value: $6,713,482; United States Treasury Notes 0.625% due 9/30/17; value: $340,461; United States Treasury Notes 1.000% due 3/31/17; value: $346,493,220; repurchase proceeds: $349,751,469‡ (cost $349,751,080) | | $ | 349,751,080 | |
| | | | | | | | |
| | |
| | | | Total Short-Term Investments
(cost $349,751,080) | | | 349,751,080 | |
| | | | | | | | |
| | |
| | | | Total Investments
(cost $1,609,132,424) 99.9% | | | 1,854,986,635 | |
| | |
| | | | Other Assets less Liabilities 0.1% | | | 1,959,114 | |
| | | | | | | | |
| | |
| | | | NET ASSETS 100.0% | | $ | 1,856,945,749 | |
| | | | | | | | |
| | |
Number of
Contracts | | | | | Value | |
| | | | | | | |
| | | | CALL OPTIONS WRITTEN 0.5% | | | | |
| | |
| | | | Automobile Manufacturers 0.1% | | | | |
| | 3,980 | | | General Motors Co., expiring 6/22/13, exercise price $28 | | $ | 501,480 | |
| | 2,599 | | | General Motors Co., expiring 6/22/13, exercise price $29 | | | 226,113 | |
| | | | | | | | |
| | | | | | | 727,593 | |
| | | | | | | | |
| | | | Communications Equipment 0.0% | | | | |
| | 3,826 | | | Cisco Systems, Inc., expiring 5/18/13, exercise price $20 | | | 474,424 | |
| | | | | | | | |
| | | | Computer & Electronics Retail 0.0% | | | | |
| | 2,880 | | | GameStop Corp., Class A, expiring 4/20/13, exercise price $27 | | | 446,400 | |
| | | | | | | | |
| | | | Computer Hardware 0.1% | | | | |
| | 1,250 | | | Apple, Inc., expiring 6/22/13,
exercise price $455 | | | 2,376,250 | |
| | 239 | | | Apple, Inc., expiring 4/20/13,
exercise price $480 | | | 38,957 | |
| | | | | | | | |
| | | | | | | 2,415,207 | |
| | | | | | | | |
| | | | Fertilizers & Agricultural Chemicals 0.0% | | | | |
| | 2,284 | | | Mosaic Co. (The), expiring 6/22/13, exercise price $60 | | | 534,456 | |
| | | | | | | | |
| | | | Oil & Gas Drilling 0.0% | | | | |
| | 2,185 | | | Noble Corp., expiring 6/22/13, exercise price $40 | | | 294,975 | |
| | | | | | | | |
| | | | Oil & Gas Exploration &
Production 0.2% | | | | |
| | 1,988 | | | Bill Barrett Corp., expiring 6/22/13,
exercise price $17.50 | | | 675,920 | |
| | 1,974 | | | Bill Barrett Corp., expiring 9/21/13,
exercise price $17.50 | | | 799,470 | |
| | 5,681 | | | Bill Barrett Corp., expiring 6/22/13,
exercise price $20 | | | 1,036,783 | |
| | | | | | | | |
| | | | | | | 2,512,173 | |
| | | | | | | | |
| | | | | | | | |
Number of
Contracts | | | | | Value | |
| | | | | | | |
| | | | Specialized Consumer Services 0.1% | | | | |
| | 1,342 | | | Coinstar, Inc., expiring 4/20/13,
exercise price $52.50 | | $ | 805,200 | |
| | 2,000 | | | Coinstar, Inc., expiring 4/20/13,
exercise price $55 | | | 760,000 | |
| | 450 | | | Coinstar, Inc., expiring 7/20/13,
exercise price $60 | | | 128,250 | |
| | | | | | | | |
| | | | | | | 1,693,450 | |
| | | | | | | | |
| | |
| | | | Total Call Options Written
(premium $9,815,208) | | | 9,098,678 | |
| | | | | | | | |
| | |
| Shares | | | | | Value | |
| | | | | | | |
| | |
| | | | SECURITIES SOLD SHORT 10.1% | | | | |
| | |
| | | | Aerospace & Defense 1.0% | | | | |
| | 207,613 | | | Boeing Co. (The) | | $ | 17,823,576 | |
| | | | | | | | |
| | | | Apparel, Accessories & Luxury
Goods 0.7% | | | | |
| | 226,648 | | | Michael Kors Holdings Ltd.* | | | 12,871,340 | |
| | | | | | | | |
| | | | Automotive Retail 0.7% | | | | |
| | 300,000 | | | CarMax, Inc.* | | | 12,510,000 | |
| | | | | | | | |
| | | | Diversified Chemicals 0.8% | | | | |
| | 449,500 | | | Dow Chemical Co. (The) | | | 14,312,080 | |
| | | | | | | | |
| | | | Integrated Oil & Gas 1.3% | | | | |
| | 276,769 | | | Exxon Mobil Corp. | | | 24,939,655 | |
| | | | | | | | |
| | | | Integrated Telecommunication Services 1.6% | | | | |
| | 595,707 | | | Verizon Communications, Inc. | | | 29,278,999 | |
| | | | | | | | |
| | | | Packaged Foods & Meats 0.5% | | | | |
| | 199,605 | | | General Mills, Inc. | | | 9,842,522 | |
| | | | | | | | |
| | | | Restaurants 1.0% | | | | |
| | 317,600 | | | Starbucks Corp. | | | 18,090,496 | |
| | | | | | | | |
| | | | Retail REITs 0.8% | | | | |
| | 296,905 | | | Regency Centers Corp. | | | 15,709,244 | |
| | | | | | | | |
| | | | Specialty Stores 1.0% | | | | |
| | 273,063 | | | Tiffany & Co. | | | 18,988,801 | |
| | | | | | | | |
| | | | Tires & Rubber 0.7% | | | | |
| | 1,027,128 | | | Goodyear Tire & Rubber Co. (The)* | | | 12,952,084 | |
| | | | | | | | |
| | |
| | | | Total Securities Sold Short
(proceeds $166,608,399) | | | 187,318,797 | |
| | | | | | | | |
| |
| | | | *Non-income producing. ‡All or a portion of this security has been designated as collateral for short sales and call options written (see Notes 3, 4 and 7). ‡‡Affiliated company (see Note 10). ADR American Depositary Receipt. REIT Real Estate Investment Trust. See Notes to Financial Statements. | |
At March 31, 2013, Wasatch Long/Short Fund’s investments, excluding short-term investments, call options written and securities sold short, were in the following countries:
| | | | |
| Country | | % | |
Canada | | | 1.3 | |
Switzerland | | | 1.6 | |
United Kingdom | | | 1.5 | |
United States | | | 95.6 | |
| | | | |
TOTAL | | | 100.0 | % |
| | | | |
71
| | |
| WASATCH MICRO CAP FUND (WMICX) — Schedule of Investments | | |
|
|
|
| | | | | | | | |
| Shares | | | | | Value | |
| | | | | | | |
| | | | COMMON STOCKS 94.7% | | | | |
| | |
| | | | Alternative Carriers 1.1% | | | | |
| | 397,604 | | | inContact, Inc.* | | $ | 3,216,616 | |
| | | | | | | | |
| | | | Apparel Retail 2.9% | | | | |
| | 167,159 | | | Body Central Corp.* | | | 1,571,295 | |
| | 128,785 | | | rue21, Inc.* | | | 3,784,991 | |
| | 131,171 | | | Zumiez, Inc.* | | | 3,003,816 | |
| | | | | | | | |
| | | | | | | 8,360,102 | |
| | | | | | | | |
| | | | Apparel, Accessories & Luxury
Goods 0.9% | | | | |
| | 43,510 | | | Page Industries Ltd. (India) | | | 2,665,838 | |
| | | | | | | | |
| | | | Application Software 10.9% | | | | |
| | 151,821 | | | Ellie Mae, Inc.* | | | 3,651,295 | |
| | 257,970 | | | Exa Corp.* | | | 2,455,874 | |
| | 125,646 | | | Interactive Intelligence Group, Inc.* | | | 5,572,400 | |
| | 134,910 | | | PROS Holdings, Inc.* | | | 3,665,505 | |
| | 60,422 | | | RealPage, Inc.* | | | 1,251,340 | |
| | 333,506 | | | Tangoe, Inc.* | | | 4,132,139 | |
| | 72,611 | | | Tyler Technologies, Inc.* | | | 4,448,150 | |
| | 59,526 | | | Ultimate Software Group, Inc.* | | | 6,200,228 | |
| | | | | | | | |
| | | | | | | 31,376,931 | |
| | | | | | | | |
| | | | Asset Management & Custody
Banks 2.1% | | | | |
| | 19,712 | | | Diamond Hill Investment Group, Inc. | | | 1,533,791 | |
| | 23,862 | | | Virtus Investment Partners, Inc.* | | | 4,445,013 | |
| | | | | | | | |
| | | | | | | 5,978,804 | |
| | | | | | | | |
| | | | Automotive Retail 1.6% | | | | |
| | 116,260 | | | Monro Muffler Brake, Inc. | | | 4,616,685 | |
| | | | | | | | |
| | | | Biotechnology 2.6% | | | | |
| | 496,548 | | | Abcam plc (United Kingdom) | | | 3,374,743 | |
| | 258,770 | | | Exact Sciences Corp.* | | | 2,535,946 | |
| | 566,169 | | | NeurogesX, Inc.* *** | | | 5,662 | |
| | 159,440 | | | Sangamo Biosciences, Inc.* | | | 1,524,246 | |
| | | | | | | | |
| | | | | | | 7,440,597 | |
| | | | | | | | |
| | | | Commercial Printing 2.1% | | | | |
| | 394,596 | | | InnerWorkings, Inc.* | | | 5,974,183 | |
| | | | | | | | |
| | | | Computer Storage & Peripherals 0.5% | | | | |
| | 290,211 | | | Intevac, Inc.* | | | 1,369,796 | |
| | | | | | | | |
| | | | Consumer Electronics 0.2% | | | | |
| | 137,391 | | | Skullcandy, Inc.* | | | 725,425 | |
| | | | | | | | |
| | | | Consumer Finance 4.4% | | | | |
| | 320,494 | | | DFC Global Corp.* | | | 5,333,020 | |
| | 132,803 | | | Encore Capital Group, Inc.* | | | 3,997,370 | |
| | 169,972 | | | Regional Management Corp.* | | | 3,433,435 | |
| | | | | | | | |
| | | | | | | 12,763,825 | |
| | | | | | | | |
| | | | Data Processing & Outsourced Services 3.9% | | | | |
| | 120,511 | | | ExlService Holdings, Inc.* | | | 3,962,401 | |
| | 239,302 | | | Higher One Holdings, Inc.* | | | 2,127,395 | |
| | 187,302 | | | Wirecard AG (Germany) | | | 5,174,407 | |
| | | | | | | | |
| | | | | | | 11,264,203 | |
| | | | | | | | |
| | | | Diversified Banks 1.7% | | | | |
| | 4,154,569 | | | City Union Bank Ltd. (India) | | | 4,020,797 | |
| | 1,038,642 | | | City Union Bank Ltd. — Partly Paid-up Equity Shares* (India) | | | 772,054 | |
| | | | | | | | |
| | | | | | | 4,792,851 | |
| | | | | | | | |
| | | | Electronic Manufacturing
Services 0.8% | | | | |
| | 36,316 | | | IPG Photonics Corp. | | | 2,411,746 | |
| | | | | | | | |
| | | | | | | | |
| Shares | | | | | Value | |
| | | | | | | |
| | | | Environmental & Facilities
Services 1.8% | | | | |
| | 185,549 | | | Heritage-Crystal Clean, Inc.* | | $ | 2,801,790 | |
| | 594,574 | | | RPS Group plc (United Kingdom) | | | 2,413,744 | |
| | | | | | | | |
| | | | | | | 5,215,534 | |
| | | | | | | | |
| | | | General Merchandise Stores 1.4% | | | | |
| | 346,470 | | | Gordmans Stores, Inc.* | | | 4,057,164 | |
| | | | | | | | |
| | | | Health Care Distributors 1.1% | | | | |
| | 24,326 | | | MWI Veterinary Supply, Inc.* | | | 3,217,357 | |
| | | | | | | | |
| | | | Health Care Equipment 4.5% | | | | |
| | 75,688 | | | Abaxis, Inc. | | | 3,581,556 | |
| | 413,346 | | | AtriCure, Inc.* | | | 3,273,700 | |
| | 1,055,928 | | | Cardica, Inc.* | | | 1,372,706 | |
| | 7,393,429 | | | LMA International N.V.*** (Singapore) | | | 89,430 | |
| | 189,909 | | | Novadaq Technologies, Inc.* (Canada) | | | 1,881,998 | |
| | 123,741 | | | NuVasive, Inc.* | | | 2,636,921 | |
| | | | | | | | |
| | | | | | | 12,836,311 | |
| | | | | | | | |
| | | | Health Care Facilities 2.0% | | | | |
| | 171,428 | | | Ensign Group, Inc. (The) | | | 5,725,695 | |
| | | | | | | | |
| | | | Health Care Services 4.4% | | | | |
| | 101,313 | | | Bio-Reference Laboratories, Inc.* | | | 2,632,112 | |
| | 107,670 | | | CorVel Corp.* | | | 5,328,588 | |
| | 106,790 | | | IPC The Hospitalist Co., Inc.* | | | 4,750,019 | |
| | | | | | | | |
| | | | | | | 12,710,719 | |
| | | | | | | | |
| | | | Health Care Technology 2.0% | | | | |
| | 41,625 | | | Computer Programs and Systems, Inc. | | | 2,252,329 | |
| | 156,508 | | | HealthStream, Inc.* | | | 3,590,293 | |
| | | | | | | | |
| | | | | | | 5,842,622 | |
| | | | | | | | |
| | | | Human Resource & Employment Services 0.3% | | | | |
| | 214,951 | | | CTPartners Executive Search, Inc.* | | | 806,066 | |
| | | | | | | | |
| | | | Industrial Machinery 1.2% | | | | |
| | 69,083 | | | Proto Labs, Inc.* | | | 3,391,975 | |
| | | | | | | | |
| | | | Internet Retail 1.3% | | | | |
| | 190,380 | | | CafePress, Inc.* | | | 1,144,184 | |
| | 177,762 | | | MakeMyTrip Ltd.* (India) | | | 2,470,892 | |
| | | | | | | | |
| | | | | | | 3,615,076 | |
| | | | | | | | |
| | | | Internet Software & Services 10.7% | | | | |
| | 207,573 | | | Angie’s List, Inc.* | | | 4,101,643 | |
| | 217,595 | | | Dealertrack Technologies, Inc.* | | | 6,392,941 | |
| | 144,614 | | | E2open, Inc.* | | | 2,883,603 | |
| | 391,947 | | | Envestnet, Inc.* | | | 6,862,992 | |
| | 241,424 | | | SciQuest, Inc.* | | | 5,803,833 | |
| | 112,975 | | | SPS Commerce, Inc.* | | | 4,820,643 | |
| | | | | | | | |
| | | | | | | 30,865,655 | |
| | | | | | | | |
| | | | IT Consulting & Other Services 1.4% | | | | |
| | 191,378 | | | Pactera Technology International Ltd. ADR* (China) | | | 1,228,647 | |
| | 392,834 | | | ServiceSource International, Inc.* | | | 2,777,336 | |
| | | | | | | | |
| | | | | | | 4,005,983 | |
| | | | | | | | |
| | | | Leisure Products 1.1% | | | | |
| | 339,569 | | | Black Diamond, Inc.* | | | 3,093,474 | |
| | | | | | | | |
| | | | Life Sciences Tools & Services 2.9% | | | | |
| | 118,621 | | | Fluidigm Corp.* | | | 2,195,675 | |
| | 187,499 | | | ICON plc* (Ireland) | | | 6,054,342 | |
| | | | | | | | |
| | | | | | | 8,250,017 | |
| | | | | | | | |
| | | | Oil & Gas Equipment & Services 0.7% | | | | |
| | 120,093 | | | Pason Systems, Inc. (Canada) | | | 2,093,505 | |
| | | | | | | | |
72
| | |
| | MARCH 31, 2013 (UNAUDITED) |
|
|
|
| | | | | | | | |
| Shares | | | | | Value | |
| | | | | | | |
| | | | Oil & Gas Exploration &
Production 1.6% | | | | |
| | 142,677 | | | Northern Oil and Gas, Inc.* | | $ | 2,051,695 | |
| | 371,113 | | | Triangle Petroleum Corp.* | | | 2,449,346 | |
| | | | | | | | |
| | | | | | | 4,501,041 | |
| | | | | | | | |
| | | | Pharmaceuticals 3.6% | | | | |
| | 322,840 | | | Akorn, Inc.* | | | 4,464,877 | |
| | 221,021 | | | Cardiovascular Systems, Inc.* | | | 4,526,510 | |
| | 190,356 | | | Cempra, Inc.* | | | 1,284,903 | |
| | | | | | | | |
| | | | | | | 10,276,290 | |
| | | | | | | | |
| | | | Publishing 0.1% | | | | |
| | 6,087 | | | Shutterstock, Inc.* | | | 273,793 | |
| | | | | | | | |
| | | | Regional Banks 1.0% | | | | |
| | 218,405 | | | BBCN Bancorp, Inc. | | | 2,852,369 | |
| | | | | | | | |
| | | | Research & Consulting Services 0.7% | | | | |
| | 89,652 | | | CRA International, Inc.* | | | 2,005,515 | |
| | 10,497 | | | Franklin Covey Co.* | | | 152,522 | |
| | | | | | | | |
| | | | | | | 2,158,037 | |
| | | | | | | | |
| | | | Semiconductor Equipment 0.2% | | | | |
| | 300,450 | | | STR Holdings, Inc.* | | | 651,977 | |
| | | | | | | | |
| | | | Semiconductors 5.6% | | | | |
| | 172,735 | | | Melexis N.V. (Belgium) | | | 3,230,774 | |
| | 42,979 | | | NVE Corp.* | | | 2,424,875 | |
| | 446,669 | | | O2Micro International Ltd. ADR* (China) | | | 1,393,607 | |
| | 176,329 | | | Power Integrations, Inc. | | | 7,654,442 | |
| | 102,693 | | | Volterra Semiconductor Corp.* | | | 1,458,241 | |
| | | | | | | | |
| | | | | | | 16,161,939 | |
| | | | | | | | |
| | | | Specialized Finance 0.0% | | | | |
| | 154,000 | | | Goldwater Bank, N.A.* *** † ‡‡ | | | 50,820 | |
| | | | | | | | |
| | | | Specialty Chemicals 0.3% | | | | |
| | 287,643 | | | EcoSynthetix, Inc.* (Canada) | | | 990,409 | |
| | | | | | | | |
| | | | Specialty Stores 1.9% | | | | |
| | 98,059 | | | Hibbett Sports, Inc.* | | | 5,517,780 | |
| | | | | | | | |
| | | | Systems Software 0.6% | | | | |
| | 70,258 | | | FleetMatics Group plc* (Ireland) | | | 1,703,757 | |
| | | | | | | | |
| | | | Thrifts & Mortgage Finance 0.8% | | | | |
| | 583,865 | | | Gruh Finance Ltd. (India) | | | 2,287,118 | |
| | | | | | | | |
| | | | Trading Companies &
Distributors 3.6% | | | | |
| | 205,030 | | | CAI International, Inc.* | | | 5,908,964 | |
| | 211,458 | | | Rush Enterprises, Inc., Class B* | | | 4,356,035 | |
| | | | | | | | |
| | | | | | | 10,264,999 | |
| | | | | | | | |
| | | | Trucking 2.2% | | | | |
| | 160,588 | | | Marten Transport Ltd. | | | 3,232,637 | |
| | 79,337 | | | Old Dominion Freight Line, Inc.* | | | 3,030,673 | |
| | | | | | | | |
| | | | | | | 6,263,310 | |
| | | | | | | | |
| | |
| | | | Total Common Stocks
(cost $189,550,573) | | | 272,638,394 | |
| | | | | | | | |
| | |
| | | | PREFERRED STOCKS 0.9% | | | | |
| | |
| | | | Regional Banks 0.9% | | | | |
| | 434,600 | | | Banco Daycoval S.A. Pfd. (Brazil) | | | 2,603,828 | |
| | | | | | | | |
| | |
| | | | Total Preferred Stocks
(cost $1,639,882) | | | 2,603,828 | |
| | | | | | | | |
| | | | | | | | |
| Shares | | | | | Value | |
| | | | | | | |
| | | | WARRANTS 0.0% | | | | |
| | |
| | | | Biotechnology 0.0% | | | | |
| | 145,349 | | | NeurogesX, Inc., expiring 7/22/16* *** † | | $ | — | |
| | | | | | | | |
| | | | Health Care Equipment 0.0% | | | | |
| | 322,500 | | | Cardica, Inc., expiring 9/29/14* *** † | | | 16,125 | |
| | | | | | | | |
| | |
| | | | Total Warrants
(cost $58,481) | | | 16,125 | |
| | | | | | | | |
| | |
Principal
Amount | | | | | Value | |
| | | | | | | |
| | | | SHORT-TERM INVESTMENTS 4.6% | | | | |
| | |
| | | | Repurchase Agreement 4.6% | | | | |
| | $13,170,345 | | | Repurchase Agreement dated 3/28/13, 0.01% due 4/1/13 with State Street Bank and Trust Co. collateralized by $13,140,000 of United States Treasury Notes 1.000% due 3/31/17; value: $13,435,597; repurchase proceeds: $13,170,360 (cost $13,170,345) | | $ | 13,170,345 | |
| | | | | | | | |
| | |
| | | | Total Short-Term Investments
(cost $13,170,345) | | | 13,170,345 | |
| | | | | | | | |
| | |
| | | | Total Investments
(cost $204,419,281) 100.2% | | | 288,428,692 | |
| | |
| | | | Liabilities less Other Assets (0.2%) | | | (681,686 | ) |
| | | | | | | | |
| | |
| | | | NET ASSETS 100.0% | | $ | 287,747,006 | |
| | | | | | | | |
| | | | *Non-income producing. ***Security was fair valued under procedures adopted by the Board of
Trustees (see Note 15). †Security purchased in a private placement transaction or under Rule
144A of the Securities Act of 1933 (see Note 11). ‡‡Affiliated company (see Note 10). ADR American Depositary Receipt. See Notes to Financial Statements. | |
At March 31, 2013, Wasatch Micro Cap Fund’s investments, excluding short-term investments, were in the following countries:
| | | | |
| Country | | % | |
Belgium | | | 1.2 | |
Brazil | | | 0.9 | |
Canada | | | 1.8 | |
China | | | 1.0 | |
Germany | | | 1.9 | |
India | | | 4.4 | |
Ireland | | | 2.8 | |
Singapore | | | <0.1 | |
United Kingdom | | | 2.1 | |
United States | | | 83.9 | |
| | | | |
TOTAL | | | 100.0 | % |
| | | | |
73
| | |
| WASATCH MICRO CAP VALUE FUND (WAMVX) — Schedule of Investments | | |
|
|
|
| | | | | | | | |
| Shares | | | | | Value | |
| | | | | | | |
| | | | COMMON STOCKS 92.9% | | | | |
| | |
| | | | Aerospace & Defense 0.7% | | | | |
| | 115,000 | | | CPI Aerostructures, Inc.* | | $ | 985,550 | |
| | | | | | | | |
| | | | Air Freight & Logistics 0.7% | | | | |
| | 45,000 | | | Echo Global Logistics, Inc.* | | | 995,400 | |
| | | | | | | | |
| | | | Airlines 1.5% | | | | |
| | 24,000 | | | Allegiant Travel Co. | | | 2,130,720 | |
| | | | | | | | |
| | | | Alternative Carriers 1.0% | | | | |
| | 271,038 | | | ORBCOMM, Inc.* | | | 1,412,108 | |
| | | | | | | | |
| | | | Apparel Retail 1.1% | | | | |
| | 63,000 | | | Body Central Corp.* | | | 592,200 | |
| | 32,000 | | | rue21, Inc.* ‡ | | | 940,480 | |
| | | | | | | | |
| | | | | | | 1,532,680 | |
| | | | | | | | |
| | | | Apparel, Accessories & Luxury Goods 0.5% | | | | |
| | 35,000 | | | Ted Baker plc (United Kingdom) | | | 691,031 | |
| | | | | | | | |
| | | | Application Software 4.2% | | | | |
| | 150,000 | | | ClickSoftware Technologies Ltd. (Israel) | | | 1,206,000 | |
| | 65,000 | | | Exa Corp.* | | | 618,800 | |
| | 60,620 | | | Interactive Intelligence Group, Inc.* | | | 2,688,497 | |
| | 130,000 | | | Tangoe, Inc.* | | | 1,610,700 | |
| | | | | | | | |
| | | | | | | 6,123,997 | |
| | | | | | | | |
| | | | Asset Management & Custody Banks 1.5% | | | | |
| | 12,000 | | | Virtus Investment Partners, Inc.* | | | 2,235,360 | |
| | | | | | | | |
| | | | Auto Parts & Equipment 2.0% | | | | |
| | 38,000 | | | Dorman Products, Inc. | | | 1,413,980 | |
| | 90,000 | | | Gentherm, Inc.* | | | 1,474,200 | |
| | | | | | | | |
| | | | | | | 2,888,180 | |
| | | | | | | | |
| | | | Automotive Retail 2.6% | | | | |
| | 19,000 | | | Delticom AG (Germany) | | | 872,834 | |
| | 33,000 | | | Lithia Motors, Inc., Class A | | | 1,566,840 | |
| | 120,000 | | | Pep Boys — Manny, Moe & Jack (The)* | | | 1,414,800 | |
| | | | | | | | |
| | | | | | | 3,854,474 | |
| | | | | | | | |
| | | | Casinos & Gaming 1.6% | | | | |
| | 2,700,000 | | | NagaCorp Ltd. (Cambodia) | | | 2,281,636 | |
| | | | | | | | |
| | | | Commercial Printing 2.4% | | | | |
| | 100,000 | | | Ennis, Inc. | | | 1,507,000 | |
| | 130,000 | | | InnerWorkings, Inc.* | | | 1,968,200 | |
| | | | | | | | |
| | | | | | | 3,475,200 | |
| | | | | | | | |
| | | | Communications Equipment 0.7% | | | | |
| | 80,000 | | | Alliance Fiber Optic Products, Inc. | | | 1,042,400 | |
| | | | | | | | |
| | | | Construction & Engineering 1.3% | | | | |
| | 60,000 | | | Aegion Corp.* | | | 1,389,000 | |
| | 38,000 | | | Argan, Inc. | | | 566,580 | |
| | | | | | | | |
| | | | | | | 1,955,580 | |
| | | | | | | | |
| | | | Construction Materials 3.4% | | | | |
| | 108,800 | | | Caesarstone Sdot-Yam Ltd.* (Israel) | | | 2,872,320 | |
| | 7,000,000 | | | Diamond Building Products Public Co. Ltd. (Thailand) | | | 2,163,223 | |
| | | | | | | | |
| | | | | | | 5,035,543 | |
| | | | | | | | |
| | | | Consumer Finance 3.8% | | | | |
| | 109,000 | | | DFC Global Corp.* | | | 1,813,760 | |
| | 75,000 | | | Encore Capital Group, Inc.* | | | 2,257,500 | |
| | 76,000 | | | Regional Management Corp.* | | | 1,535,200 | |
| | | | | | | | |
| | | | | | | 5,606,460 | |
| | | | | | | | |
| | | | | | | | |
| Shares | | | | | Value | |
| | | | | | | |
| | | | Data Processing & Outsourced Services 0.5% | | | | |
| | 3,000,000 | | | My EG Services Berhad (Malaysia) | | $ | 789,601 | |
| | | | | | | | |
| | | | Department Stores 0.6% | | | | |
| | 650,000 | | | Parkson Retail Asia Ltd. (Malaysia) | | | 859,608 | |
| | | | | | | | |
| | | | Diversified Banks 2.9% | | | | |
| | 1,800,000 | | | City Union Bank Ltd. (India) | | | 1,742,042 | |
| | 550,000 | | | City Union Bank Ltd. — Partly Paid-up Equity Shares* (India) | | | 408,832 | |
| | 2,400,000 | | | EastWest Banking Corp.* (Philippines) | | | 1,963,783 | |
| | 55,556 | | | Idaho Trust Bancorp*** † | | | 186,668 | |
| | | | | | | | |
| | | | | | | 4,301,325 | |
| | | | | | | | |
| | | | Electronic Manufacturing Services 1.1% | | | | |
| | 110,000 | | | Fabrinet* | | | 1,607,100 | |
| | | | | | | | |
| | | | Environmental & Facilities Services 0.6% | | | | |
| | 60,000 | | | Heritage-Crystal Clean, Inc.* | | | 906,000 | |
| | | | | | | | |
| | | | Food Distributors 2.0% | | | | |
| | 110,000 | | | Bizim Toptan Satis Magazalari AS (Turkey) | | | 1,858,488 | |
| | 60,000 | | | Chefs’ Warehouse, Inc. (The)* | | | 1,108,200 | |
| | | | | | | | |
| | | | | | | 2,966,688 | |
| | | | | | | | |
| | | | Footwear 0.6% | | | | |
| | 40,000 | | | Skechers U.S.A., Inc., Class A* | | | 846,000 | |
| | | | | | | | |
| | | | General Merchandise Stores 0.9% | | | | |
| | 50,000 | | | Seria Co. Ltd. (Japan) | | | 1,244,818 | |
| | | | | | | | |
| | | | Health Care Equipment 2.7% | | | | |
| | 140,000 | | | AtriCure, Inc.* | | | 1,108,800 | |
| | 251,382 | | | Cardica, Inc.* | | | 326,797 | |
| | 70,000 | | | NuVasive, Inc.* | | | 1,491,700 | |
| | 450,000 | | | Solta Medical, Inc.* | | | 990,000 | |
| | | | | | | | |
| | | | | | | 3,917,297 | |
| | | | | | | | |
| | | | Health Care Facilities 3.6% | | | | |
| | 250,000 | | | CVS Group plc (United Kingdom) | | | 708,118 | |
| | 62,000 | | | Ensign Group, Inc. (The) | | | 2,070,800 | |
| | 700,000 | | | KPJ Healthcare Berhad (Malaysia) | | | 1,342,806 | |
| | 66,469 | | | MD Medical Group Investments plc GDR* (Russia) | | | 1,167,860 | |
| | | | | | | | |
| | | | | | | 5,289,584 | |
| | | | | | | | |
| | | | Health Care Services 3.5% | | | | |
| | 44,000 | | | Bio-Reference Laboratories, Inc.* | | | 1,143,120 | |
| | 28,000 | | | CorVel Corp.* | | | 1,385,720 | |
| | 32,000 | | | IPC The Hospitalist Co., Inc.* | | | 1,423,360 | |
| | 20,000 | | | National Research Corp. | | | 1,160,800 | |
| | | | | | | | |
| | | | | | | 5,113,000 | |
| | | | | | | | |
| | | | Health Care Supplies 1.4% | | | | |
| | 130,000 | | | Chembio Diagnostics, Inc.* | | | 656,500 | |
| | 100,000 | | | Rochester Medical Corp.* | | | 1,462,000 | |
| | | | | | | | |
| | | | | | | 2,118,500 | |
| | | | | | | | |
| | | | Household Appliances 1.1% | | | | |
| | 31,000 | | | SodaStream International Ltd.* (Israel) | | | 1,538,840 | |
| | | | | | | | |
| | | | Industrial Machinery 0.8% | | | | |
| | 65,000 | | | Hy-Lok Corp. (Korea) | | | 1,226,856 | |
| | | | | | | | |
| | | | Internet Software & Services 3.4% | | | | |
| | 155,000 | | | IntraLinks Holdings, Inc.* | | | 985,800 | |
| | 250,000 | | | iomart Group plc (United Kingdom) | | | 873,281 | |
| | 140,000 | | | Move, Inc.* | | | 1,673,000 | |
| | 130,000 | | | Perficient, Inc.* | | | 1,515,800 | |
| | | | | | | | |
| | | | | | | 5,047,881 | |
| | | | | | | | |
74
| | |
| | MARCH 31, 2013 (UNAUDITED) |
|
|
|
| | | | | | | | |
| Shares | | | | | Value | |
| | | | | | | |
| | | | IT Consulting & Other Services 1.8% | | | | |
| | 89,998 | | | Bit-isle, Inc. (Japan) | | $ | 1,251,381 | |
| | 62,000 | | | EPAM Systems, Inc.* | | | 1,440,260 | |
| | | | | | | | |
| | | | | | | 2,691,641 | |
| | | | | | | | |
| | | | Leisure Products 1.5% | | | | |
| | 138,000 | | | Black Diamond, Inc.* | | | 1,257,180 | |
| | 100,000 | | | Smith & Wesson Holding Corp.* | | | 900,000 | |
| | | | | | | | |
| | | | | | | 2,157,180 | |
| | | | | | | | |
| | | | Life & Health Insurance 1.0% | | | | |
| | 101,000 | | | Health Insurance Innovations, Inc.* | | | 1,524,090 | |
| | | | | | | | |
| | | | Mortgage REITs 6.2% | | | | |
| | 360,000 | | | Arbor Realty Trust, Inc. | | | 2,822,400 | |
| | 130,000 | | | Colony Financial, Inc. | | | 2,886,000 | |
| | 355,000 | | | NorthStar Realty Finance Corp. | | | 3,365,400 | |
| | | | | | | | |
| | | | | | | 9,073,800 | |
| | | | | | | | |
| | | | Office REITs 1.4% | | | | |
| | 6,000,000 | | | Prosperity REIT (Hong Kong) | | | 2,071,404 | |
| | | | | | | | |
| | | | Oil & Gas Equipment & Services 0.4% | | | | |
| | 346,000 | | | Electromagnetic Geoservices AS* (Norway) | | | 520,815 | |
| | | | | | | | |
| | | | Oil & Gas Exploration & Production 1.7% | | | | |
| | 180,000 | | | Emerald Oil, Inc.* | | | 1,267,200 | |
| | 80,000 | | | Northern Oil and Gas, Inc.* | | | 1,150,400 | |
| | | | | | | | |
| | | | | | | 2,417,600 | |
| | | | | | | | |
| | | | Packaged Foods & Meats 4.6% | | | | |
| | 1,400,000 | | | Oldtown Berhad (Malaysia) | | | 1,112,223 | |
| | 100,000 | | | Pinar Sut Mamulleri Sanayii A.S. (Turkey) | | | 847,528 | |
| | 11,000,000 | | | RFM Corp. (Philippines) | | | 1,268,026 | |
| | 500,000 | | | Super Group Ltd. (Singapore) | | | 1,572,454 | |
| | 1,700,000 | | | Vitasoy International Holdings Ltd.
(Hong Kong) | | | 1,918,368 | |
| | | | | | | | |
| | | | | | | 6,718,599 | |
| | | | | | | | |
| | | | Paper Packaging 0.8% | | | | |
| | 1,800,000 | | | Greatview Aseptic Packaging Co. Ltd. (China) | | | 1,182,555 | |
| | | | | | | | |
| | | | Personal Products 1.2% | | | | |
| | 37,600 | | | USANA Health Sciences, Inc.* | | | 1,817,208 | |
| | | | | | | | |
| | | | Pharmaceuticals 0.7% | | | | |
| | 85,000 | | | Torrent Pharmaceuticals Ltd. (India) | | | 1,075,989 | |
| | | | | | | | |
| | | | Regional Banks 3.1% | | | | |
| | 2,023 | | | Credit Agricole du Morbihan (France) | | | 98,056 | |
| | 92,000 | | | Eagle Bancorp, Inc.* | | | 2,013,880 | |
| | 40,000 | | | First of Long Island Corp. (The) | | | 1,186,000 | |
| | 120,000 | | | MetroCorp Bancshares, Inc.* | | | 1,210,800 | |
| | | | | | | | |
| | | | | | | 4,508,736 | |
| | | | | | | | |
| | | | Research & Consulting Services 1.7% | | | | |
| | 83,601 | | | Franklin Covey Co.* | | | 1,214,723 | |
| | 33,000 | | | Huron Consulting Group, Inc.* | | | 1,330,560 | |
| | | | | | | | |
| | | | | | | 2,545,283 | |
| | | | | | | | |
| | | | Semiconductors 0.6% | | | | |
| | 60,000 | | | Ceva, Inc.* ‡ | | | 936,000 | |
| | | | | | | | |
| | | | Specialized Finance 0.0% | | | | |
| | 41,900 | | | Goldwater Bank, N.A.*** † | | | 13,827 | |
| | | | | | | | |
| | | | Steel 0.9% | | | | |
| | 24,000 | | | Haynes International, Inc. | | | 1,327,200 | |
| | | | | | | | |
| | | | Systems Software 0.7% | | | | |
| | 60,000 | | | Proofpoint, Inc.* | | | 1,011,600 | |
| | | | | | | | |
| | | | | | | | |
| Shares | | | | | Value | |
| | | | | | | |
| | | | Thrifts & Mortgage Finance 4.6% | | | | |
| | 200,000 | | | Beneficial Mutual Bancorp, Inc.* | | $ | 2,060,000 | |
| | 90,000 | | | BofI Holding, Inc.* | | | 3,229,200 | |
| | 100,000 | | | Ocean Shore Holding Co. | | | 1,500,000 | |
| | | | | | | | |
| | | | | | | 6,789,200 | |
| | | | | | | | |
| | | | Trading Companies & Distributors 3.3% | | | | |
| | 85,000 | | | CAI International, Inc.* | | | 2,449,700 | |
| | 32,000 | | | DXP Enterprises, Inc.* | | | 2,390,400 | |
| | | | | | | | |
| | | | | | | 4,840,100 | |
| | | | | | | | |
| | | | Trucking 2.0% | | | | |
| | 73,000 | | | Marten Transport Ltd. | | | 1,469,490 | |
| | 40,000 | | | Saia, Inc.* | | | 1,446,800 | |
| | | | | | | | |
| | | | | | | 2,916,290 | |
| | | | | | | | |
| | |
| | | | Total Common Stocks
(cost $101,044,505) | | | 136,158,534 | |
| | | | | | | | |
| | |
| | | | PREFERRED STOCKS 1.5% | | | | |
| | |
| | | | Diversified Banks 1.1% | | | | |
| | 194,862 | | | Banco ABC Brasil S.A. Pfd. (Brazil) | | | 1,580,158 | |
| | | | | | | | |
| | |
| | | | Pharmaceuticals 0.4% | | | | |
| | 105,263 | | | Acetylon Pharmaceuticals, Inc., Series B Pfd.*** † | | | 625,262 | |
| | | | | | | | |
| | |
| | | | Total Preferred Stocks
(cost $1,633,178) | | | 2,205,420 | |
| | | | | | | | |
| | |
| | | | WARRANTS 0.0% | | | | |
| | |
| | | | Biotechnology 0.0% | | | | |
| | 50,000 | | | NeurogesX, Inc., expiring 7/22/16* *** † | | | — | |
| | | | | | | | |
| | |
| | | | Health Care Equipment 0.0% | | | | |
| | 110,500 | | | Cardica, Inc., expiring 9/29/14* *** † | | | 5,525 | |
| | | | | | | | |
| | |
| | | | Total Warrants
(cost $20,062) | | | 5,525 | |
| | | | | | | | |
| | |
Principal
Amount | | | | | Value | |
| | | | | | | |
| | | | SHORT-TERM INVESTMENTS 6.7% | | | | |
| | |
| | | | Repurchase Agreement 6.7% | | | | |
| | $9,877,259 | | | Repurchase Agreement dated 3/28/13, 0.01% due 4/1/13 with State Street Bank and Trust Co. collateralized by $10,125,000 of United States Treasury Notes 0.500% due 7/31/17; value: $10,078,253; repurchase proceeds: $9,877,270‡ (cost $9,877,259) | | $ | 9,877,259 | |
| | | | | | | | |
| | |
| | | | Total Short-Term Investments (cost $9,877,259) | | | 9,877,259 | |
| | | | | | | | |
| | |
| | | | Total Investments (cost $112,575,004) 101.1%§ | | | 148,246,738 | |
| | |
| | | | Liabilities less Other Assets (1.1%) | | | (1,568,137 | ) |
| | | | | | | | |
| | |
| | | | NET ASSETS 100.0% | | $ | 146,678,601 | |
| | | | | | | | |
75
| | |
| WASATCH MICRO CAP VALUE FUND (WAMVX) — Schedule of Investments (continued) | | MARCH 31, 2013 (UNAUDITED) |
|
|
|
| | | | | | | | |
| | |
Number of
Contracts | | | | | Value | |
| | | | | | | |
| | | | CALL OPTIONS WRITTEN 0.1% | | | | |
| | |
| | | | Apparel Retail 0.1% | | | | |
| | 320 | | | rue21, Inc., expiring 4/20/13, exercise price $25 | | $ | 140,800 | |
| | | | | | | | |
| | | | Semiconductors 0.0% | | | | |
| | 600 | | | Ceva, Inc., expiring 4/20/13, exercise price $15 | | | 51,000 | |
| | | | | | | | |
| | |
| | | | Total Call Options Written (premium $130,633) | | | 191,800 | |
| | | | | | | | |
| |
| | | | *Non-income producing. ***Security was fair valued under procedures adopted by the Board of Trustees (see Note 15). †Security purchased in a private placement transaction or under Rule 144A of the Securities Act of 1933 (see Note 11). ‡All or a portion of this security has been designated as collateral for call options written (see Notes 4 and 7). §The aggregate amount of foreign securities fair valued pursuant to a systematic valuation model as a percent of net assets was 2.56% (see Note 15). GDR Global Depositary Receipt. REIT Real Estate Investment Trust. See Notes to Financial Statements. | |
At March 31, 2013, Wasatch Micro Cap Value Fund’s investments, excluding short-term investments and call options written, were in the following countries:
| | | | |
| Country | | % | |
Brazil | | | 1.1 | |
Cambodia | | | 1.6 | |
China | | | 0.9 | |
France | | | 0.1 | |
Germany | | | 0.6 | |
Hong Kong | | | 2.9 | |
India | | | 2.3 | |
Israel | | | 4.1 | |
Japan | | | 1.8 | |
Korea | | | 0.9 | |
Malaysia | | | 3.0 | |
Norway | | | 0.4 | |
Philippines | | | 2.3 | |
Russia | | | 0.8 | |
Singapore | | | 1.1 | |
Thailand | | | 1.6 | |
Turkey | | | 2.0 | |
United Kingdom | | | 1.6 | |
United States | | | 70.9 | |
| | | | |
TOTAL | | | 100.0 | % |
| | | | |
76
| | |
| WASATCH SMALL CAP GROWTH FUND (WAAEX) — Schedule of Investments | | MARCH 31, 2013 (UNAUDITED) |
|
|
|
| | | | | | | | |
| Shares | | | | | Value | |
| | | | | | | |
| | | | COMMON STOCKS 91.1% | | | | |
| | |
| | | | Aerospace & Defense 1.5% | | | | |
| | 901,391 | | | HEICO Corp., Class A | | $ | 30,926,725 | |
| | | | | | | | |
| | | | Air Freight & Logistics 2.5% | | | | |
| | 36,319,023 | | | Aramex PJSC (United Arab Emirates) | | | 22,050,482 | |
| | 765,652 | | | HUB Group, Inc., Class A* | | | 29,446,976 | |
| | | | | | | | |
| | | | | | | 51,497,458 | |
| | | | | | | | |
| | | | Airlines 1.3% | | | | |
| | 311,717 | | | Allegiant Travel Co. | | | 27,674,235 | |
| | | | | | | | |
| | | | Airport Services 1.6% | | | | |
| | 2,215,969 | | | Wesco Aircraft Holdings, Inc.* | | | 32,619,064 | |
| | | | | | | | |
| | | | Apparel Retail 3.4% | | | | |
| | 1,145,050 | | | Chico’s FAS, Inc. | | | 19,236,840 | |
| | 966,636 | | | rue21, Inc.* | | | 28,409,432 | |
| | 1,059,354 | | | Zumiez, Inc.* | | | 24,259,207 | |
| | | | | | | | |
| | | | | | | 71,905,479 | |
| | | | | | | | |
| | | | Application Software 7.3% | | | | |
| | 345,394 | | | Concur Technologies, Inc.* | | | 23,714,752 | |
| | 77,807 | | | FactSet Research Systems, Inc. | | | 7,204,928 | |
| | 1,530,380 | | | RealPage, Inc.* | | | 31,694,170 | |
| | 1,387,975 | | | Tangoe, Inc.* | | | 17,197,010 | |
| | 698,534 | | | Ultimate Software Group, Inc.* | | | 72,759,302 | |
| | | | | | | | |
| | | | | | | 152,570,162 | |
| | | | | | | | |
| | | | Automotive Retail 2.1% | | | | |
| | 649,256 | | | Monro Muffler Brake, Inc. | | | 25,781,956 | |
| | 175,496 | | | O’Reilly Automotive, Inc.* | | | 17,997,115 | |
| | | | | | | | |
| | | | | | | 43,779,071 | |
| | | | | | | | |
| | | | Biotechnology 3.8% | | | | |
| | 394,068 | | | ChemoCentryx, Inc.* | | | 5,446,020 | |
| | 1,227,351 | | | Exact Sciences Corp.* | | | 12,028,040 | |
| | 398,079 | | | Myriad Genetics, Inc.* | | | 10,111,207 | |
| | 3,882,558 | | | NeurogesX, Inc.* *** ‡‡ | | | 38,825 | |
| | 1,339,709 | | | Sangamo Biosciences, Inc.* | | | 12,807,618 | |
| | 1,101,057 | | | Seattle Genetics, Inc.* | | | 39,098,534 | |
| | | | | | | | |
| | | | | | | 79,530,244 | |
| | | | | | | | |
| | | | Computer Storage & Peripherals 1.0% | | | | |
| | 1,329,869 | | | Fusion-io, Inc.* | | | 21,769,956 | |
| | | | | | | | |
| | | | Data Processing & Outsourced Services 5.2% | | | | |
| | 530,574 | | | ExlService Holdings, Inc.* | | | 17,445,273 | |
| | 1,182,343 | | | Higher One Holdings, Inc.* | | | 10,511,029 | |
| | 549,162 | | | Syntel, Inc. | | | 37,079,418 | |
| | 1,596,239 | | | Wirecard AG (Germany) | | | 44,097,714 | |
| | | | | | | | |
| | | | | | | 109,133,434 | |
| | | | | | | | |
| | | | Diversified Banks 3.1% | | | | |
| | 761,965 | | | HDFC Bank Ltd. ADR (India) | | | 28,512,730 | |
| | 4,581,117 | | | Yes Bank Ltd. (India) | | | 36,286,493 | |
| | | | | | | | |
| | | | | | | 64,799,223 | |
| | | | | | | | |
| | | | Diversified Support Services 1.9% | | | | |
| | 1,124,516 | | | Copart, Inc.* | | | 38,548,408 | |
| | 66,375 | | | Ritchie Bros. Auctioneers, Inc. (Canada) | | | 1,440,338 | |
| | | | | | | | |
| | | | | | | 39,988,746 | |
| | | | | | | | |
| | | | Electrical Components & Equipment 1.6% | | | | |
| | 832,388 | | | Polypore International, Inc.* | | | 33,445,350 | |
| | | | | | | | |
| | | | Electronic Manufacturing Services 1.4% | | | | |
| | 423,810 | | | IPG Photonics Corp. | | | 28,145,222 | |
| | | | | | | | |
| | | | | | | | |
| Shares | | | | | Value | |
| | | | | | | |
| | | | Environmental & Facilities Services 1.8% | | | | |
| | 1,199,055 | | | Tetra Tech, Inc.* | | $ | 36,559,187 | |
| | | | | | | | |
| | | | Health Care Distributors 1.1% | | | | |
| | 168,360 | | | MWI Veterinary Supply, Inc.* | | | 22,267,294 | |
| | | | | | | | |
| | | | Health Care Equipment 1.5% | | | | |
| | 498,944 | | | Abaxis, Inc. | | | 23,610,030 | |
| | 487,760 | | | DexCom, Inc.* | | | 8,155,347 | |
| | 24,690 | | | Zonare Medical Systems, Inc.* *** † | | | 247 | |
| | | | | | | | |
| | | | | | | 31,765,624 | |
| | | | | | | | |
| | | | Health Care Services 0.6% | | | | |
| | 142,820 | | | MEDNAX, Inc.* | | | 12,800,957 | |
| | | | | | | | |
| | | | Health Care Technology 0.4% | | | | |
| | 145,937 | | | Computer Programs and Systems, Inc. | | | 7,896,651 | |
| | | | | | | | |
| | | | Industrial Machinery 2.2% | | | | |
| | 484,674 | | | Graco, Inc. | | | 28,125,632 | |
| | 366,273 | | | Proto Labs, Inc.* | | | 17,984,004 | |
| | | | | | | | |
| | | | | | | 46,109,636 | |
| | | | | | | | |
| | | | Internet Retail 4.7% | | | | |
| | 957,819 | | | Blue Nile, Inc.* ‡‡ | | | 32,996,864 | |
| | 1,428,612 | | | MakeMyTrip Ltd.* (India) | | | 19,857,707 | |
| | 375,615 | | | Shutterfly, Inc.* | | | 16,590,915 | |
| | 656,026 | | | Yoox S.p.A.* (Italy) | | | 12,295,305 | |
| | 308,302 | | | zooplus AG* ‡‡ (Germany) | | | 16,154,926 | |
| | | | | | | | |
| | | | | | | 97,895,717 | |
| | | | | | | | |
| | | | Internet Software & Services 4.5% | | | | |
| | 1,210,193 | | | Angie’s List, Inc.* | | | 23,913,414 | |
| | 800,225 | | | Dealertrack Technologies, Inc.* | | | 23,510,610 | |
| | 26,366 | | | Millennial Media, Inc.* | | | 167,424 | |
| | 784,444 | | | SciQuest, Inc.* | | | 18,858,034 | |
| | 719,531 | | | Vistaprint N.V.* | | | 27,817,068 | |
| | | | | | | | |
| | | | | | | 94,266,550 | |
| | | | | | | | |
| | | | IT Consulting & Other Services 1.6% | | | | |
| | 275,737 | | | Cognizant Technology Solutions Corp., Class A* | | | 21,124,212 | |
| | 1,802,679 | | | ServiceSource International, Inc.* | | | 12,744,940 | |
| | | | | | | | |
| | | | | | | 33,869,152 | |
| | | | | | | | |
| | | | Leisure Facilities 2.1% | | | | |
| | 1,018,728 | | | Life Time Fitness, Inc.* | | | 43,581,184 | |
| | | | | | | | |
| | | | Life Sciences Tools & Services 4.2% | | | | |
| | 945,672 | | | Divi’s Laboratories Ltd. (India) | | | 17,347,470 | |
| | 868,644 | | | Fluidigm Corp.* | | | 16,078,600 | |
| | 1,103,068 | | | ICON plc* (Ireland) | | | 35,618,066 | |
| | 273,101 | | | Techne Corp. | | | 18,529,903 | |
| | | | | | | | |
| | | | | | | 87,574,039 | |
| | | | | | | | |
| | | | Oil & Gas Equipment & Services 4.0% | | | | |
| | 334,085 | | | Dril-Quip, Inc.* | | | 29,122,189 | |
| | 1,058,711 | | | Pason Systems, Inc. (Canada) | | | 18,455,838 | |
| | 382,702 | | | ShawCor Ltd. (Canada) | | | 16,215,421 | |
| | 496,825 | | | TGS-NOPEC Geophysical Co. ASA (Norway) | | | 18,840,924 | |
| | | | | | | | |
| | | | | | | 82,634,372 | |
| | | | | | | | |
| | | | Oil & Gas Exploration & Production 2.2% | | | | |
| | 2,058,954 | | | Gran Tierra Energy, Inc.* (Colombia) | | | 12,106,649 | |
| | 978,179 | | | Northern Oil and Gas, Inc.* | | | 14,066,214 | |
| | 3,387,260 | | | Premier Oil plc* (United Kingdom) | | | 19,996,294 | |
| | | | | | | | |
| | | | | | | 46,169,157 | |
| | | | | | | | |
| | | | Oil & Gas Refining & Marketing 0.0% | | | | |
| | 203,175 | | | Amyris, Inc.* | | | 625,779 | |
| | | | | | | | |
77
| | |
| WASATCH SMALL CAP GROWTH FUND (WAAEX) — Schedule of Investments (continued) | | |
|
|
|
| | | | | | | | |
| Shares | | | | | Value | |
| | | | | | | |
| | | | Packaged Foods & Meats 1.3% | | | | |
| | 2,461 | | | Annie’s, Inc.* | | $ | 94,158 | |
| | 350,128 | | | GlaxoSmithKline Consumer Healthcare Ltd. (India) | | | 27,056,809 | |
| | | | | | | | |
| | | | | | | 27,150,967 | |
| | | | | | | | |
| | | | Personal Products 0.6% | | | | |
| | 582,400 | | | Colgate-Palmolive India Ltd. (India) | | | 13,362,517 | |
| | | | | | | | |
| | | | Pharmaceuticals 0.4% | | | | |
| | 1,382,332 | | | Cempra, Inc.* ‡‡ | | | 9,330,741 | |
| | | | | | | | |
| | | | Real Estate Services 1.7% | | | | |
| | 650,647 | | | Zillow, Inc.* | | | 35,570,871 | |
| | | | | | | | |
| | | | Research & Consulting Services 2.2% | | | | |
| | 1,740,892 | | | Resources Connection, Inc. | | | 22,109,328 | |
| | 549,657 | | | Stantec, Inc. (Canada) | | | 24,140,936 | |
| | | | | | | | |
| | | | | | | 46,250,264 | |
| | | | | | | | |
| | | | Restaurants 1.1% | | | | |
| | 1,010,775 | | | Jubilant Foodworks Ltd.* (India) | | | 23,005,127 | |
| | | | | | | | |
| | | | Semiconductors 4.6% | | | | |
| | 400,771 | | | Hittite Microwave Corp.* | | | 24,270,692 | |
| | 1,259,149 | | | Power Integrations, Inc. | | | 54,659,658 | |
| | 424,490 | | | Silicon Laboratories, Inc.* | | | 17,556,906 | |
| | | | | | | | |
| | | | | | | 96,487,256 | |
| | | | | | | | |
| | | | Specialty Stores 1.4% | | | | |
| | 505,485 | | | Hibbett Sports, Inc.* | | | 28,443,641 | |
| | | | | | | | |
| | | | Systems Software 3.2% | | | | |
| | 38,572 | | | FleetMatics Group plc* (Ireland) | | | 935,371 | |
| | 384,324 | | | NetSuite, Inc.* | | | 30,768,979 | |
| | 578,807 | | | Sourcefire, Inc.* | | | 34,282,739 | |
| | | | | | | | |
| | | | | | | 65,987,089 | |
| | | | | | | | |
| | | | Trading Companies & Distributors 2.3% | | | | |
| | 547,600 | | | MSC Industrial Direct Co., Inc., Class A | | | 46,973,128 | |
| | | | | | | | |
| | | | Trucking 3.7% | | | | |
| | 4,792,398 | | | Knight Transportation, Inc.‡‡ | | | 77,157,608 | |
| | | | | | | | |
| | |
| | | | Total Common Stocks
(cost $1,245,145,723) | | | 1,901,518,877 | |
| | | | | | | | |
| | |
| | | | PREFERRED STOCKS 0.0% | | | | |
| | |
| | | | Biotechnology 0.0% | | | | |
| | 677,966 | | | Nanosys, Inc., Series D Pfd.* *** † | | | 828,407 | |
| | 161,519 | | | Nanosys, Inc., Series E Pfd.* *** † | | | 197,360 | |
| | | | | | | | |
| | | | | | | 1,025,767 | |
| | | | | | | | |
| | |
| | | | Total Preferred Stocks
(cost $2,184,939) | | | 1,025,767 | |
| | | | | | | | |
| | |
| | | | LIMITED PARTNERSHIP INTEREST 0.3% | | | | |
| | |
| | | | Asset Management & Custody
Banks 0.3% | | | | |
| | | | Greenspring Global Partners II-B, L.P.*** † | | | 4,376,480 | |
| | | | Greenspring Global Partners III-B, L.P.*** † | | | 1,614,172 | |
| | | | | | | | |
| | | | | | | 5,990,652 | |
| | | | | | | | |
| | |
| | | | Total Limited Partnership Interest (cost $6,008,853) | | | 5,990,652 | |
| | | | | | | | |
| | | | | | | | |
| Shares | | | | | Value | |
| | | | | | | |
| | |
| | | | WARRANTS 0.0% | | | | |
| | |
| | | | Biotechnology 0.0% | | | | |
| | 1,941,279 | | | NeurogesX, Inc., expiring 7/22/16* *** † | | $ | — | |
| | | | | | | | |
| | |
| | | | Total Warrants
(cost $242,660) | | | — | |
| | | | | | | | |
| | |
Principal
Amount | | | | | Value | |
| | | | | | | |
| | | | SHORT-TERM INVESTMENTS 8.8% | | | | |
| | |
| | | | Repurchase Agreement 8.8% | | | | |
| | $183,848,636 | | | Repurchase Agreement dated 3/28/13, 0.01% due 4/1/13 with State Street Bank and Trust Co. collateralized by $183,400,000 of United States Treasury Notes 1.000% due 3/31/17; value: $187,525,766; repurchase proceeds: $183,848,840†† (cost $183,848,636) | | $ | 183,848,636 | |
| | | | | | | | |
| | |
| | | | Total Short-Term Investments
(cost $183,848,636) | | | 183,848,636 | |
| | | | | | | | |
| | |
| | | | Total Investments
(cost $1,437,430,811) 100.2%§ | | | 2,092,383,932 | |
| | |
| | | | Liabilities less Other Assets (0.2%) | | | (4,496,879 | ) |
| | | | | | | | |
| | |
| | | | NET ASSETS 100.0% | | $ | 2,087,887,053 | |
| | | | | | | | |
| |
| | | | *Non-income producing. ***Security was fair valued under procedures adopted by the Board of Trustees (see Note 15). †Security purchased in a private placement transaction or under Rule 144A of the Securities Act of 1933 (see Note 11). ††All or a portion of this security has been designated as collateral for purchase commitments (see Note 12). ‡‡Affiliated company (see Note 10). §The aggregate amount of foreign securities fair valued pursuant to a systematic valuation model as a percent of net assets was 0.90% (see Note 15). ADR American Depositary Receipt. See Notes to Financial Statements. | |
At March 31, 2013, Wasatch Small Cap Growth Fund’s investments, excluding short-term investments, were in the following countries:
| | | | |
| Country | | % | |
Canada | | | 3.2 | |
Colombia | | | 0.6 | |
Germany | | | 3.2 | |
India | | | 8.7 | |
Ireland | | | 1.9 | |
Italy | | | 0.6 | |
Norway | | | 1.0 | |
United Arab Emirates | | | 1.2 | |
United Kingdom | | | 1.0 | |
United States | | | 78.6 | |
| | | | |
TOTAL | | | 100.0 | % |
| | | | |
78
| | |
| WASATCH SMALL CAP VALUE FUND (WMCVX / WICVX) — Schedule of Investments | | MARCH 31, 2013 (UNAUDITED) |
|
|
|
| | | | | | | | |
| Shares | | | | | Value | |
| | | | | | | |
| | | | COMMON STOCKS 98.2% | | | | |
| | |
| | | | Aerospace & Defense 2.3% | | | | |
| | 127,366 | | | HEICO Corp., Class A | | $ | 4,369,927 | |
| | | | | | | | |
| | | | Agricultural Products 1.5% | | | | |
| | 154,985 | | | Darling International, Inc.* | | | 2,783,531 | |
| | | | | | | | |
| | | | Airlines 2.2% | | | | |
| | 45,780 | | | Allegiant Travel Co. | | | 4,064,348 | |
| | | | | | | | |
| | | | Airport Services 2.1% | | | | |
| | 264,277 | | | Wesco Aircraft Holdings, Inc.* | | | 3,890,157 | |
| | | | | | | | |
| | | | Alternative Carriers 1.0% | | | | |
| | 371,036 | | | ORBCOMM, Inc.* | | | 1,933,098 | |
| | | | | | | | |
| | | | Apparel Retail 5.0% | | | | |
| | 211,018 | | | Body Central Corp.* | | | 1,983,569 | |
| | 245,578 | | | Chico’s FAS, Inc. | | | 4,125,711 | |
| | 108,401 | | | rue21, Inc.* | | | 3,185,905 | |
| | | | | | | | |
| | | | | | | 9,295,185 | |
| | | | | | | | |
| | | | Application Software 1.7% | | | | |
| | 72,188 | | | Interactive Intelligence Group, Inc.* | | | 3,201,538 | |
| | | | | | | | |
| | | | Asset Management & Custody
Banks 1.7% | | | | |
| | 16,743 | | | Virtus Investment Partners, Inc.* | | | 3,118,886 | |
| | | | | | | | |
| | | | Auto Parts & Equipment 0.7% | | | | |
| | 37,026 | | | Dorman Products, Inc. | | | 1,377,737 | |
| | | | | | | | |
| | | | Automotive Retail 1.1% | | | | |
| | 49,732 | | | Monro Muffler Brake, Inc. | | | 1,974,858 | |
| | | | | | | | |
| | | | Computer Storage & Peripherals 0.6% | | | | |
| | 257,483 | | | Intevac, Inc.* | | | 1,215,320 | |
| | | | | | | | |
| | | | Consumer Finance 4.7% | | | | |
| | 255,548 | | | DFC Global Corp.* | | | 4,252,319 | |
| | 35,907 | | | Portfolio Recovery Associates, Inc.* | | | 4,557,316 | |
| | | | | | | | |
| | | | | | | 8,809,635 | |
| | | | | | | | |
| | | | Data Processing & Outsourced Services 1.8% | | | | |
| | 49,809 | | | Syntel, Inc. | | | 3,363,104 | |
| | | | | | | | |
| | | | Diversified Banks 5.3% | | | | |
| | 2,876,000 | | | City Union Bank Ltd. (India) | | | 2,783,397 | |
| | 719,000 | | | City Union Bank Ltd. — Partly Paid-up Equity Shares* (India) | | | 534,454 | |
| | 4,171,654 | | | South Indian Bank Ltd. (India) | | | 1,895,858 | |
| | 585,800 | | | Yes Bank Ltd. (India) | | | 4,640,053 | |
| | | | | | | | |
| | | | | | | 9,853,762 | |
| | | | | | | | |
| | | | Diversified Support Services 3.7% | | | | |
| | 202,425 | | | Copart, Inc.* | | | 6,939,129 | |
| | | | | | | | |
| | | | Electrical Components &
Equipment 3.3% | | | | |
| | 153,179 | | | Polypore International, Inc.* | | | 6,154,732 | |
| | | | | | | | |
| | | | Electronic Manufacturing
Services 3.1% | | | | |
| | 245,956 | | | Fabrinet* | | | 3,593,417 | |
| | 32,783 | | | IPG Photonics Corp. | | | 2,177,119 | |
| | | | | | | | |
| | | | | | | 5,770,536 | |
| | | | | | | | |
| | | | Footwear 2.2% | | | | |
| | 197,670 | | | Skechers U.S.A., Inc., Class A* | | | 4,180,720 | |
| | | | | | | | |
| | | | Health Care Facilities 2.3% | | | | |
| | 130,501 | | | Ensign Group, Inc. (The) | | | 4,358,733 | |
| | | | | | | | |
| | | | | | | | |
| Shares | | | | | Value | |
| | | | | | | |
| | | | Health Care Services 3.8% | | | | |
| | 78,604 | | | CorVel Corp.* | | $ | 3,890,112 | |
| | 34,887 | | | MEDNAX, Inc.* | | | 3,126,922 | |
| | | | | | | | |
| | | | | | | 7,017,034 | |
| | | | | | | | |
| | | | Industrial Machinery 1.1% | | | | |
| | 37,489 | | | IDEX Corp. | | | 2,002,662 | |
| | | | | | | | |
| | | | Internet Retail 0.5% | | | | |
| | 69,700 | | | MakeMyTrip Ltd.* (India) | | | 968,830 | |
| | | | | | | | |
| | | | Internet Software & Services 1.9% | | | | |
| | 92,363 | | | Vistaprint N.V.* | | | 3,570,754 | |
| | | | | | | | |
| | | | IT Consulting & Other Services 1.0% | | | | |
| | 81,862 | | | EPAM Systems, Inc.* | | | 1,901,654 | |
| | | | | | | | |
| | | | Leisure Facilities 2.2% | | | | |
| | 94,456 | | | Life Time Fitness, Inc.* | | | 4,040,828 | |
| | | | | | | | |
| | | | Life Sciences Tools & Services 2.7% | | | | |
| | 153,562 | | | ICON plc* (Ireland) | | | 4,958,517 | |
| | | | | | | | |
| | | | Mortgage REITs 2.1% | | | | |
| | 492,673 | | | Arbor Realty Trust, Inc. | | | 3,862,556 | |
| | | | | | | | |
| | | | Oil & Gas Drilling 1.0% | | | | |
| | 77,631 | | | Patterson-UTI Energy, Inc. | | | 1,850,723 | |
| | | | | | | | |
| | | | Oil & Gas Equipment & Services 2.2% | | | | |
| | 30,526 | | | CARBO Ceramics, Inc. | | | 2,780,003 | |
| | 34,080 | | | TGS-NOPEC Geophysical Co. ASA (Norway) | | | 1,292,404 | |
| | | | | | | | |
| | | | | | | 4,072,407 | |
| | | | | | | | |
| | | | Oil & Gas Exploration &
Production 3.5% | | | | |
| | 219,775 | | | Northern Oil and Gas, Inc.* | | | 3,160,365 | |
| | 170,103 | | | Ultra Petroleum Corp.* | | | 3,419,070 | |
| | | | | | | | |
| | | | | | | 6,579,435 | |
| | | | | | | | |
| | | | Oil & Gas Refining & Marketing 2.1% | | | | |
| | 100,764 | | | World Fuel Services Corp. | | | 4,002,346 | |
| | | | | | | | |
| | | | Personal Products 1.7% | | | | |
| | 65,796 | | | USANA Health Sciences, Inc.* | | | 3,179,921 | |
| | | | | | | | |
| | | | Pharmaceuticals 2.4% | | | | |
| | 138,083 | | | Questcor Pharmaceuticals, Inc. | | | 4,493,221 | |
| | | | | | | | |
| | | | Property & Casualty Insurance 1.3% | | | | |
| | 32,939 | | | RLI Corp. | | | 2,366,667 | |
| | | | | | | | |
| | | | Regional Banks 3.8% | | | | |
| | 111,788 | | | Community Bank System, Inc. | | | 3,312,278 | |
| | 79,507 | | | Prosperity Bancshares, Inc. | | | 3,767,837 | |
| | | | | | | | |
| | | | | | | 7,080,115 | |
| | | | | | | | |
| | | | Research & Consulting Services 4.0% | | | | |
| | 34,795 | | | Corporate Executive Board Co. (The) | | | 2,023,677 | |
| | 154,230 | | | Franklin Covey Co.* | | | 2,240,962 | |
| | 48,715 | | | Huron Consulting Group, Inc.* | | | 1,964,189 | |
| | 535,545 | | | Sporton International, Inc. (Taiwan) | | | 1,325,318 | |
| | | | | | | | |
| | | | | | | 7,554,146 | |
| | | | | | | | |
| | | | Semiconductors 2.1% | | | | |
| | 356,915 | | | MaxLinear, Inc., Class A* | | | 2,212,873 | |
| | 549,747 | | | O2Micro International Ltd. ADR* (China) | | | 1,715,211 | |
| | | | | | | | |
| | | | | | | 3,928,084 | |
| | | | | | | | |
| | | | Specialized Consumer Services 1.3% | | | | |
| | 42,622 | | | Coinstar, Inc.* | | | 2,489,977 | |
| | | | | | | | |
| | | | Specialty Chemicals 1.3% | | | | |
| | 151,174 | | | Flotek Industries, Inc.* | | | 2,471,695 | |
| | | | | | | | |
79
| | |
| WASATCH SMALL CAP VALUE FUND (WMCVX / WICVX) — Schedule of Investments (continued) | | |
|
|
|
| | | | | | | | |
| Shares | | | | | Value | |
| | | | | | | |
| | | | Thrifts & Mortgage Finance 1.9% | | | | |
| | 98,901 | | | BofI Holding, Inc.* | | $ | 3,548,568 | |
| | | | | | | | |
| | | | Trading Companies &
Distributors 3.6% | | | | |
| | 47,304 | | | Beacon Roofing Supply, Inc.* | | | 1,828,773 | |
| | 32,236 | | | DXP Enterprises, Inc.* | | | 2,408,029 | |
| | 28,456 | | | MSC Industrial Direct Co., Inc., Class A | | | 2,440,956 | |
| | | | | | | | |
| | | | | | | 6,677,758 | |
| | | | | | | | |
| | | | Trucking 4.4% | | | | |
| | 181,046 | | | Knight Transportation, Inc. | | | 2,914,841 | |
| | 139,620 | | | Marten Transport Ltd. | | | 2,810,551 | |
| | 65,112 | | | Old Dominion Freight Line, Inc.* | | | 2,487,278 | |
| | | | | | | | |
| | | | | | | 8,212,670 | |
| | | | | | | | |
| | |
| | | | Total Common Stocks
(cost $140,438,370) | | | 183,485,504 | |
| | | | | | | | |
| | |
Principal
Amount | | | | | Value | |
| | | | | | | |
| | | | SHORT-TERM INVESTMENTS 2.4% | | | | |
| | |
| | | | Repurchase Agreement 2.4% | | | | |
| | $4,391,011 | | | Repurchase Agreement dated 3/28/13, 0.01% due 4/1/13 with State Street Bank and Trust Co. collateralized by $4,385,000 of United States Treasury Notes 1.000% due 3/31/17; value: $4,483,645; repurchase proceeds: $4,391,016 (cost $4,391,011) | | $ | 4,391,011 | |
| | | | | | | | |
| | |
| | | | Total Short-Term Investments
(cost $4,391,011) | | | 4,391,011 | |
| | | | | | | | |
| | |
| | | | Total Investments
(cost $144,829,381) 100.6%§ | | | 187,876,515 | |
| | |
| | | | Liabilities less Other Assets (0.6%) | | | (1,196,578 | ) |
| | | | | | | | |
| | |
| | | | NET ASSETS 100.0% | | $ | 186,679,937 | |
| | | | | | | | |
| | | | *Non-income producing. §The aggregate amount of foreign securities fair valued pursuant to a systematic valuation model as a percent of net assets was 0.69% (see Note 15). ADR American Depositary Receipt. REIT Real Estate Investment Trust. See Notes to Financial Statements. | |
At March 31, 2013, Wasatch Small Cap Value Fund’s investments, excluding short-term investments, were in the following countries:
| | | | |
| Country | | % | |
China | | | 0.9 | |
India | | | 5.9 | |
Ireland | | | 2.7 | |
Norway | | | 0.7 | |
Taiwan | | | 0.7 | |
United States | | | 89.1 | |
| | | | |
TOTAL | | | 100.0 | % |
| | | | |
80
| | |
| WASATCH STRATEGIC INCOME FUND (WASIX) — Schedule of Investments | | MARCH 31, 2013 (UNAUDITED) |
|
|
|
| | | | | | | | |
| Shares | | | | | Value | |
| | | | | | | |
| | | | COMMON STOCKS 80.8% | | | | |
| | |
| | | | Asset Management & Custody Banks 2.1% | | | | |
| | 4,400 | | | BlackRock, Inc. | | $ | 1,130,272 | |
| | | | | | | | |
| | | | Computer & Electronics Retail 4.1% | | | | |
| | 97,800 | | | Best Buy Co., Inc. | | | 2,166,270 | |
| | | | | | | | |
| | | | Computer Hardware 3.3% | | | | |
| | 3,989 | | | Apple, Inc. | | | 1,765,651 | |
| | | | | | | | |
| | | | Consumer Finance 5.9% | | | | |
| | 57,830 | | | Capital One Financial Corp. | | | 3,177,759 | |
| | | | | | | | |
| | | | Data Processing & Outsourced Services 7.5% | | | | |
| | 3,650 | | | MasterCard, Inc., Class A | | | 1,975,125 | |
| | 12,135 | | | Visa, Inc., Class A | | | 2,061,008 | |
| | | | | | | | |
| | | | | | | 4,036,133 | |
| | | | | | | | |
| | | | Diversified REITs 0.5% | | | | |
| | 177,857 | | | Star Asia Financial Ltd.* † | | | 266,786 | |
| | | | | | | | |
| | | | Drug Retail 4.3% | | | | |
| | 47,900 | | | Walgreen Co. | | | 2,283,872 | |
| | | | | | | | |
| | | | Health Care Services 2.0% | | | | |
| | 13,240 | | | Chemed Corp. | | | 1,058,935 | |
| | | | | | | | |
| | | | Integrated Oil & Gas 3.4% | | | | |
| | 8,500 | | | Occidental Petroleum Corp. | | | 666,145 | |
| | 39,237 | | | Suncor Energy, Inc. (Canada) | | | 1,174,987 | |
| | | | | | | | |
| | | | | | | 1,841,132 | |
| | | | | | | | |
| | | | Mortgage REITs 19.2% | | | | |
| | 73,600 | | | American Capital Mortgage Investment Corp. | | | 1,902,560 | |
| | 74,000 | | | Capstead Mortgage Corp. | | | 948,680 | |
| | 91,491 | | | Colony Financial, Inc. | | | 2,031,100 | |
| | 36,900 | | | Hatteras Financial Corp. | | | 1,012,167 | |
| | 226,366 | | | NorthStar Realty Finance Corp. | | | 2,145,950 | |
| | 44,700 | | | PennyMac Mortgage Investment Trust | | | 1,157,283 | |
| | 39,000 | | | Starwood Property Trust, Inc. | | | 1,082,640 | |
| | | | | | | | |
| | | | | | | 10,280,380 | |
| | | | | | | | |
| | | | Oil & Gas Drilling 1.7% | | | | |
| | 15,400 | | | Helmerich & Payne, Inc. | | | 934,780 | |
| | | | | | | | |
| | | | Oil & Gas Equipment & Services 1.6% | | | | |
| | 9,300 | | | CARBO Ceramics, Inc. | | | 846,951 | |
| | | | | | | | |
| | | | Personal Products 4.5% | | | | |
| | 64,323 | | | Herbalife Ltd. | | | 2,408,896 | |
| | | | | | | | |
| | | | Pharmaceuticals 2.0% | | | | |
| | 26,575 | | | Teva Pharmaceutical Industries Ltd. ADR (Israel) | | | 1,054,496 | |
| | | | | | | | |
| | | | Railroads 3.9% | | | | |
| | 20,500 | | | Canadian National Railway Co. (Canada) | | | 2,059,075 | |
| | | | | | | | |
| | | | Regional Banks 4.2% | | | | |
| | 234,005 | | | CapitalSource, Inc. | | | 2,251,128 | |
| | | | | | | | |
| | | | Restaurants 2.0% | | | | |
| | 10,570 | | | McDonald’s Corp. | | | 1,053,723 | |
| | | | | | | | |
| | | | Semiconductors 6.7% | | | | |
| | 23,545 | | | Altera Corp. | | | 835,141 | |
| | 42,730 | | | Intel Corp. | | | 933,651 | |
| | 27,515 | | | Microchip Technology, Inc. | | | 1,011,451 | |
| | 20,700 | | | Xilinx, Inc. | | | 790,119 | |
| | | | | | | | |
| | | | | | | 3,570,362 | |
| | | | | | | | |
| | | | | | | | |
| Shares | | | | | Value | |
| | | | | | | |
| | | | Trading Companies & Distributors 1.9% | | | | |
| | 4,530 | | | W.W. Grainger, Inc. | | $ | 1,019,159 | |
| | | | | | | | |
| | |
| | | | Total Common Stocks (cost $35,279,772) | | | 43,205,760 | |
| | | | | | | | |
| | |
| | | | EXCHANGE TRADED FUNDS 3.7% | | | | |
| | 40,600 | | | PowerShares Dynamic Pharmaceuticals Portfolio | | | 1,603,700 | |
| | 80,000 | | | ProShares VIX Short-Term Futures ETF* | | | 872,800 | |
| | | | | | | | |
| | | | | | | 2,476,500 | |
| | | | | | | | |
| | |
| | | | Total Exchange Traded Funds (cost $2,241,012) | | | 2,476,500 | |
| | | | | | | | |
| | |
| | | | LIMITED LIABILITY COMPANY MEMBERSHIP INTEREST 5.7% | | | | |
| | |
| | | | Asset Management & Custody Banks 2.0% | | | | |
| | 45,200 | | | Apollo Global Management, LLC | | | 978,128 | |
| | 77,279 | | | Star Asia SPV, LLC*** † | | | 98,144 | |
| | | | | | | | |
| | | | | | | 1,076,272 | |
| | | | | | | | |
| | | | Specialized Finance 3.7% | | | | |
| | 175,800 | | | KKR Financial Holdings, LLC | | | 1,946,106 | |
| | | | | | | | |
| | |
| | | | Total Limited Liability Company Membership Interest (cost $2,550,208) | | | 3,022,378 | |
| | | | | | | | |
81
| | |
| WASATCH STRATEGIC INCOME FUND (WASIX) — Schedule of Investments (continued) | | MARCH 31, 2013 (UNAUDITED) |
|
|
|
| | | | | | | | |
| | |
Principal
Amount | | | | | Value | |
| | | | | | | |
| | | | CORPORATE BONDS 0.0% | | | | |
| | |
| | | | Gold 0.0% | | | | |
| | $208,026 | | | Redcorp Ventures Ltd., 13.00%, 7/11/12, Series D*** † §§ (Canada) | | $ | 1,044 | |
| | | | | | | | |
| | |
| | | | Total Corporate Bonds (cost $153,634) | | | 1,044 | |
| | | | | | | | |
| | |
| | | | SHORT-TERM INVESTMENTS 9.3% | | | | |
| | |
| | | | Repurchase Agreement 9.3% | | | | |
| | 4,986,746 | | | Repurchase Agreement dated 3/28/13, 0.01% due 4/1/13 with State Street Bank and Trust Co. collateralized by $5,115,000 of United States Treasury Bills 0.500% due 7/31/17; value: $5,091,384; repurchase proceeds: $4,986,751 (cost $4,986,746) | | | 4,986,746 | |
| | | | | | | | |
| | |
| | | | Total Short-Term Investments (cost $4,986,746) | | | 4,986,746 | |
| | | | | | | | |
| | |
| | | | Total Investments (cost $45,211,372) 100.5% | | | 53,692,428 | |
| | |
| | | | Liabilities less Other Assets (0.5%) | | | (241,290 | ) |
| | | | | | | | |
| | |
| | | | NET ASSETS 100.0% | | $ | 53,451,138 | |
| | | | | | | | |
| |
| | | | *Non-income producing. ***Security was fair valued under procedures adopted by the Board of Trustees (see Note 15). †Security purchased in a private placement transaction or under Rule 144A of the Securities Act of 1933 (see Note 11). §§In default. ADR American Depositary Receipt. ETF Exchange Traded Fund. REIT Real Estate Investment Trust. See Notes to Financial Statements. | |
At March 31, 2013, Wasatch Strategic Income Fund’s investments, excluding short-term investments, were in the following countries:
| | | | |
| Country | | % | |
Canada | | | 6.6 | |
Israel | | | 2.2 | |
United States | | | 91.2 | |
| | | | |
TOTAL | | | 100.0 | % |
| | | | |
82
| | |
| WASATCH ULTRA GROWTH FUND (WAMCX) — Schedule of Investments | | MARCH 31, 2013 (UNAUDITED) |
|
|
|
| | | | | | | | |
| Shares | | | | | Value | |
| | | | | | | |
| | | | COMMON STOCKS 94.7% | | | | |
| | |
| | | | Air Freight & Logistics 0.5% | | | | |
| | 32,762 | | | Echo Global Logistics, Inc.* | | $ | 724,695 | |
| | | | | | | | |
| | | | Alternative Carriers 0.9% | | | | |
| | 156,554 | | | inContact, Inc.* | | | 1,266,522 | |
| | | | | | | | |
| | | | Apparel, Accessories & Luxury Goods 0.5% | | | | |
| | 11,200 | | | Page Industries Ltd. (India) | | | 686,219 | |
| | | | | | | | |
| | | | Application Software 9.1% | | | | |
| | 23,576 | | | Concur Technologies, Inc.* | | | 1,618,728 | |
| | 128,479 | | | Exa Corp.* | | | 1,223,120 | |
| | 55,683 | | | Interactive Intelligence Group, Inc.* | | | 2,469,541 | |
| | 77,500 | | | RealPage, Inc.* | | | 1,605,025 | |
| | 266,956 | | | Tangoe, Inc.* | | | 3,307,585 | |
| | 25,285 | | | Ultimate Software Group, Inc.* | | | 2,633,686 | |
| | | | | | | | |
| | | | | | | 12,857,685 | |
| | | | | | | | |
| | | | Asset Management & Custody Banks 3.8% | | | | |
| | 65,616 | | | CETIP S.A. — Mercados Organizados (Brazil) | | | 781,046 | |
| | 103,155 | | | SEI Investments Co. | | | 2,976,022 | |
| | 8,216 | | | Virtus Investment Partners, Inc.* | | | 1,530,476 | |
| | | | | | | | |
| | | | | | | 5,287,544 | |
| | | | | | | | |
| | | | Auto Parts & Equipment 1.2% | | | | |
| | 68,875 | | | WABCO India Ltd. (India) | | | 1,748,931 | |
| | | | | | | | |
| | | | Biotechnology 3.5% | | | | |
| | 207,698 | | | Abcam plc (United Kingdom) | | | 1,411,601 | |
| | 99,023 | | | Exact Sciences Corp.* | | | 970,425 | |
| | 401,759 | | | NeurogesX, Inc.* *** | | | 4,018 | |
| | 55,451 | | | OncoGenex Pharmaceutical, Inc.* | | | 628,260 | |
| | 102,772 | | | Sangamo Biosciences, Inc.* | | | 982,500 | |
| | 28,144 | | | Seattle Genetics, Inc.* | | | 999,393 | |
| | | | | | | | |
| | | | | | | 4,996,197 | |
| | | | | | | | |
| | | | Building Products 1.1% | | | | |
| | 31,138 | | | Trex Co., Inc.* | | | 1,531,367 | |
| | | | | | | | |
| | | | Communications Equipment 1.2% | | | | |
| | 6,371 | | | F5 Networks, Inc.* | | | 567,529 | |
| | 76,300 | | | Riverbed Technology, Inc.* | | | 1,137,633 | |
| | | | | | | | |
| | | | | | | 1,705,162 | |
| | | | | | | | |
| | | | Computer Storage & Peripherals 1.7% | | | | |
| | 85,566 | | | Fusion-io, Inc.* | | | 1,400,716 | |
| | 219,449 | | | Intevac, Inc.* | | | 1,035,799 | |
| | | | | | | | |
| | | | | | | 2,436,515 | |
| | | | | | | | |
| | | | Construction Materials 1.2% | | | | |
| | 4,496,994 | | | PT Holcim Indonesia Tbk (Indonesia) | | | 1,665,982 | |
| | | | | | | | |
| | | | Consumer Finance 3.2% | | | | |
| | 205,406 | | | DFC Global Corp.* | | | 3,417,956 | |
| | 311,965 | | | Mahindra & Mahindra Financial Services Ltd. (India) | | | 1,122,155 | |
| | | | | | | | |
| | | | | | | 4,540,111 | |
| | | | | | | | |
| | | | Data Processing & Outsourced Services 2.5% | | | | |
| | 67,375 | | | ExlService Holdings, Inc.* | | | 2,215,290 | |
| | 18,340 | | | Syntel, Inc. | | | 1,238,317 | |
| | | | | | | | |
| | | | | | | 3,453,607 | |
| | | | | | | | |
| | | | Distributors 0.8% | | | | |
| | 22,719 | | | Pool Corp. | | | 1,090,512 | |
| | | | | | | | |
| | | | | | | | |
| Shares | | | | | Value | |
| | | | | | | |
| | | | Diversified Banks 4.6% | | | | |
| | 1,399,402 | | | City Union Bank Ltd. (India) | | $ | 1,354,343 | |
| | 349,850 | | | City Union Bank Ltd. — Partly Paid-up Equity Shares* (India) | | | 260,054 | |
| | 79,546 | | | HDFC Bank Ltd. (India) | | | 917,816 | |
| | 497,545 | | | Yes Bank Ltd. (India) | | | 3,940,996 | |
| | | | | | | | |
| | | | | | | 6,473,209 | |
| | | | | | | | |
| | | | Electrical Components & Equipment 3.4% | | | | |
| | 119,697 | | | Polypore International, Inc.* | | | 4,809,425 | |
| | | | | | | | |
| | | | Electronic Manufacturing Services 1.1% | | | | |
| | 22,621 | | | IPG Photonics Corp. | | | 1,502,261 | |
| | | | | | | | |
| | | | Environmental & Facilities Services 2.8% | | | | |
| | 75,200 | | | Heritage-Crystal Clean, Inc.* | | | 1,135,520 | |
| | 79,099 | | | Waste Connections, Inc. | | | 2,845,982 | |
| | | | | | | | |
| | | | | | | 3,981,502 | |
| | | | | | | | |
| | | | Footwear 0.7% | | | | |
| | 46,108 | | | Skechers U.S.A., Inc., Class A* | | | 975,184 | |
| | | | | | | | |
| | | | General Merchandise Stores 0.7% | | | | |
| | 80,774 | | | Gordmans Stores, Inc.* | | | 945,863 | |
| | | | | | | | |
| | | | Health Care Equipment 4.2% | | | | |
| | 257,530 | | | AtriCure, Inc.* | | | 2,039,638 | |
| | 616,085 | | | Cardica, Inc.* | | | 800,910 | |
| | 138,747 | | | Novadaq Technologies, Inc.* (Canada) | | | 1,374,983 | |
| | 82,018 | | | NuVasive, Inc.* | | | 1,747,803 | |
| | 16,460 | | | Zonare Medical Systems, Inc.*** † | | | 165 | |
| | | | | | | | |
| | | | | | | 5,963,499 | |
| | | | | | | | |
| | | | Health Care Services 1.3% | | | | |
| | 23,728 | | | IPC The Hospitalist Co., Inc.* | | | 1,055,421 | |
| | 14,199 | | | National Research Corp. | | | 824,110 | |
| | | | | | | | |
| | | | | | | 1,879,531 | |
| | | | | | | | |
| | | | Health Care Technology 1.1% | | | | |
| | 28,605 | | | Computer Programs and Systems, Inc. | | | 1,547,817 | |
| | | | | | | | |
| | | | Industrial Machinery 3.8% | | | | |
| | 54,960 | | | IDEX Corp. | | | 2,935,963 | |
| | 47,921 | | | Proto Labs, Inc.* | | | 2,352,921 | |
| | | | | | | | |
| | | | | | | 5,288,884 | |
| | | | | | | | |
| | | | Internet Retail 3.0% | | | | |
| | 163,166 | | | CafePress, Inc.* | | | 980,628 | |
| | 131,151 | | | MakeMyTrip Ltd.* (India) | | | 1,822,999 | |
| | 31,148 | | | Shutterfly, Inc.* | | | 1,375,807 | |
| | | | | | | | |
| | | | | | | 4,179,434 | |
| | | | | | | | |
| | | | Internet Software & Services 6.8% | | | | |
| | 72,632 | | | Angie’s List, Inc.* | | | 1,435,208 | |
| | 80,829 | | | E2open, Inc.* | | | 1,611,730 | |
| | 94,668 | | | SciQuest, Inc.* | | | 2,275,819 | |
| | 54,503 | | | SPS Commerce, Inc.* | | | 2,325,643 | |
| | 153,138 | | | TechTarget, Inc.* | | | 748,845 | |
| | 31,507 | | | Vistaprint N.V.* | | | 1,218,061 | |
| | 91,388 | | | Xtera Communications, Inc.*** † | | | 914 | |
| | | | | | | | |
| | | | | | | 9,616,220 | |
| | | | | | | | |
| | | | IT Consulting & Other Services 3.6% | | | | |
| | 36,110 | | | Cognizant Technology Solutions Corp., Class A* | | | 2,766,387 | |
| | 315,973 | | | ServiceSource International, Inc.* | | | 2,233,929 | |
| | | | | | | | |
| | | | | | | 5,000,316 | |
| | | | | | | | |
83
| | |
| WASATCH ULTRA GROWTH FUND (WAMCX) — Schedule of Investments (continued) | | |
|
|
|
| | | | | | | | |
| Shares | | | | | Value | |
| | | | | | | |
| | | | Leisure Products 0.9% | | | | |
| | 145,000 | | | Black Diamond, Inc.* | | $ | 1,320,950 | |
| | | | | | | | |
| | | | Life Sciences Tools & Services 0.9% | | | | |
| | 38,904 | | | ICON plc* (Ireland) | | | 1,256,210 | |
| | | | | | | | |
| | | | Oil & Gas Equipment & Services 1.2% | | | | |
| | 19,440 | | | Dril-Quip, Inc.* | | | 1,694,585 | |
| | | | | | | | |
| | | | Oil & Gas Exploration & Production 1.7% | | | | |
| | 95,930 | | | Northern Oil and Gas, Inc.* | | | 1,379,473 | |
| | 47,200 | | | Ultra Petroleum Corp.* | | | 948,720 | |
| | | | | | | | |
| | | | | | | 2,328,193 | |
| | | | | | | | |
| | | | Oil & Gas Refining & Marketing 0.3% | | | | |
| | 133,460 | | | Amyris, Inc.* | | | 411,057 | |
| | | | | | | | |
| | | | Packaged Foods & Meats 1.6% | | | | |
| | 29,276 | | | GlaxoSmithKline Consumer Healthcare Ltd. (India) | | | 2,262,359 | |
| | | | | | | | |
| | | | Personal Products 0.0% | | | | |
| | 50,403 | | | Ophthonix, Inc.*** † | | | — | |
| | | | | | | | |
| | | | Pharmaceuticals 3.5% | | | | |
| | 102,845 | | | Cardiovascular Systems, Inc.* | | | 2,106,265 | |
| | 124,051 | | | Cempra, Inc.* | | | 837,344 | |
| | 49,200 | | | Endocyte, Inc.* | | | 612,540 | |
| | 509,946 | | | Horizon Pharma, Inc.* | | | 1,381,954 | |
| | | | | | | | |
| | | | | | | 4,938,103 | |
| | | | | | | | |
| | | | Restaurants 1.2% | | | | |
| | 72,650 | | | Jubilant Foodworks Ltd.* (India) | | | 1,653,506 | |
| | | | | | | | |
| | | | Semiconductors 4.3% | | | | |
| | 20,585 | | | Hittite Microwave Corp.* | | | 1,246,628 | |
| | 13,755 | | | NVE Corp.* | | | 776,057 | |
| | 44,779 | | | Power Integrations, Inc. | | | 1,943,856 | |
| | 31,975 | | | Silicon Laboratories, Inc.* | | | 1,322,486 | |
| | 52,015 | | | Volterra Semiconductor Corp.* | | | 738,613 | |
| | | | | | | | |
| | | | | | | 6,027,640 | |
| | | | | | | | |
| | | | Specialized Consumer Services 0.7% | | | | |
| | 104,914 | | | LifeLock, Inc.* | | | 1,010,322 | |
| | | | | | | | |
| | | | Specialized Finance 1.1% | | | | |
| | 98,350 | | | CRISIL Ltd. (India) | | | 1,597,848 | |
| | | | | | | | |
| | | | Specialty Chemicals 2.5% | | | | |
| | 48,081 | | | Balchem Corp. | | | 2,112,679 | |
| | 391,800 | | | EcoSynthetix, Inc.* (Canada) | | | 1,349,041 | |
| | | | | | | | |
| | | | | | | 3,461,720 | |
| | | | | | | | |
| | | | Systems Software 2.8% | | | | |
| | 36,498 | | | FleetMatics Group plc* (Ireland) | | | 885,077 | |
| | 14,272 | | | NetSuite, Inc.* | | | 1,142,616 | |
| | 32,002 | | | Sourcefire, Inc.* | | | 1,895,478 | |
| | | | | | | | |
| | | | | | | 3,923,171 | |
| | | | | | | | |
| | | | Thrifts & Mortgage Finance 0.6% | | | | |
| | 195,084 | | | LIC Housing Finance Ltd. (India) | | | 808,872 | |
| | | | | | | | |
| | | | Trading Companies & Distributors 1.1% | | | | |
| | 18,129 | | | MSC Industrial Direct Co., Inc., Class A | | | 1,555,106 | |
| | | | | | | | |
| | | | | | | | |
| | | | Trucking 2.0% | | | | |
| | 94,774 | | | Knight Transportation, Inc. | | | 1,525,862 | |
| | 32,481 | | | Old Dominion Freight Line, Inc.* | | | 1,240,774 | |
| | | | | | | | |
| | | | | | | 2,766,636 | |
| | | | | | | | |
| | |
| | | | Total Common Stocks
(cost $107,812,701) | | | 133,170,472 | |
| | | | | | | | |
| | | | | | | | |
| Shares | | | | | Value | |
| | | | | | | |
| | |
| | | | PREFERRED STOCKS 0.8% | | | | |
| | |
| | | | Biotechnology 0.2% | | | | |
| | 169,492 | | | Nanosys, Inc., Series D Pfd.* *** † | | $ | 207,102 | |
| | 40,380 | | | Nanosys, Inc., Series E Pfd.* *** † | | | 49,340 | |
| | | | | | | | |
| | | | | | | 256,442 | |
| | | | | | | | |
| | | | Health Care Technology 0.6% | | | | |
| | 253,064 | | | Data Sciences International, Inc., Series B Pfd.* *** † | | | 802,213 | |
| | 243,902 | | | TherOx, Inc., Series I Pfd.* *** † | | | 2,439 | |
| | | | | | | | |
| | | | | | | 804,652 | |
| | | | | | | | |
| | |
| | | | Total Preferred Stocks
(cost $2,021,237) | | | 1,061,094 | |
| | | | | | | | |
| | |
| | | | LIMITED PARTNERSHIP INTEREST 3.9% | | | | |
| | |
| | | | Asset Management & Custody Banks 3.9% | | | | |
| | | | Greenspring Global Partners II-B, L.P.*** † | | | 3,938,828 | |
| | | | Greenspring Global Partners III-B, L.P.*** † | | | 1,614,172 | |
| | | | | | | | |
| | | | | | | 5,553,000 | |
| | | | | | | | |
| | |
| | | | Total Limited Partnership Interest
(cost $5,544,467) | | | 5,553,000 | |
| | | | | | | | |
| | |
| | | | WARRANTS 0.0% | | | | |
| | |
| | | | Biotechnology 0.0% | | | | |
| | 43,605 | | | NeurogesX, Inc., expiring 7/22/16* *** † | | | — | |
| | | | | | | | |
| | | | Health Care Equipment 0.0% | | | | |
| | 165,000 | | | Cardica, Inc., expiring 9/29/14* *** † | | | 8,250 | |
| | | | | | | | |
| | |
| | | | Total Warrants
(cost $26,076) | | | 8,250 | |
| | | | | | | | |
| | |
Principal
Amount | | | | | Value | |
| | | | | | | |
| | |
| | | | SHORT-TERM INVESTMENTS 0.8% | | | | |
| | |
| | | | Repurchase Agreement 0.8% | | | | |
| | $1,097,751 | | | Repurchase Agreement dated 3/28/13, 0.01% due 4/1/13 with State Street Bank and Trust Co. collateralized by $1,100,000 of United States Treasury Notes 1.000% due 3/31/17; value: $1,124,746; repurchase proceeds: $1,097,752†† (cost $1,097,751) | | $ | 1,097,751 | |
| | | | | | | | |
| | |
| | | | Total Short-Term Investments
(cost $1,097,751) | | | 1,097,751 | |
| | | | | | | | |
| | |
| | | | Total Investments
(cost $116,502,232) 100.2% | | | 140,890,567 | |
| | |
| | | | Liabilities less Other Assets (0.2%) | | | (319,585 | ) |
| | | | | | | | |
| | |
| | | | NET ASSETS 100.0% | | $ | 140,570,982 | |
| | | | | | | | |
| |
| | | | *Non-income producing. ***Security was fair valued under procedures adopted by the Board of Trustees (see Note 15). †Security purchased in a private placement transaction or under Rule 144A of the Securities Act of 1933 (see Note 11). ††All or a portion of this security has been designated as collateral for purchase commitments (see Note 12). See Notes to Financial Statements. | |
84
| | |
| | MARCH 31, 2013 (UNAUDITED) |
|
|
|
At March 31, 2013, Wasatch Ultra Growth Fund’s investments, excluding short-term investments, were in the following countries:
| | | | |
| Country | | % | |
Brazil | | | 0.6 | |
Canada | | | 1.9 | |
India | | | 13.0 | |
Indonesia | | | 1.2 | |
Ireland | | | 1.5 | |
United Kingdom | | | 1.0 | |
United States | | | 80.8 | |
| | | | |
TOTAL | | | 100.0 | % |
| | | | |
85
| | |
| WASATCH WORLD INNOVATORS FUND (WAGTX) — Schedule of Investments | | |
|
|
|
| | | | | | | | |
| Shares | | | | | Value | |
| | | | | | | |
| | | | COMMON STOCKS 90.1% | | | | |
| | |
| | | | Apparel, Accessories & Luxury Goods 1.0% | | | | |
| | 905,306 | | | American Apparel, Inc.* | | $ | 1,964,514 | |
| | | | | | | | |
| | |
| | | | Application Software 1.2% | | | | |
| | 115,000 | | | Nuance Communications, Inc.* | | | 2,320,700 | |
| | | | | | | | |
| | | | Asset Management & Custody Banks 1.7% | | | | |
| | 43,500 | | | Ameriprise Financial, Inc. | | | 3,203,775 | |
| | | | | | | | |
| | | | Automobile Manufacturers 0.5% | | | | |
| | 26,826 | | | Tesla Motors, Inc.* | | | 1,016,437 | |
| | | | | | | | |
| | | | Automotive Retail 0.8% | | | | |
| | 45,677 | | | Mekonomen AB (Sweden) | | | 1,541,019 | |
| | | | | | | | |
| | | | Biotechnology 5.2% | | | | |
| | 721,773 | | | Abcam plc (United Kingdom) | | | 4,905,464 | |
| | 199,960 | | | Myriad Genetics, Inc.* | | | 5,078,984 | |
| | | | | | | | |
| | | | | | | 9,984,448 | |
| | | | | | | | |
| | | | Cable & Satellite 2.8% | | | | |
| | 94,000 | | | DIRECTV* | | | 5,321,340 | |
| | | | | | | | |
| | | | Commercial Printing 1.6% | | | | |
| | 205,700 | | | InnerWorkings, Inc.* | | | 3,114,298 | |
| | | | | | | | |
| | | | Communications Equipment 0.8% | | | | |
| | 205,383 | | | Infinera Corp.* | | | 1,437,681 | |
| | | | | | | | |
| | | | Computer Hardware 6.4% | | | | |
| | 25,810 | | | Apple, Inc. | | | 11,424,280 | |
| | 160,000 | | | Asetek A/S* (Norway) | | | 984,000 | |
| | | | | | | | |
| | | | | | | 12,408,280 | |
| | | | | | | | |
| | | | Computer Storage & Peripherals 1.9% | | | | |
| | 102,800 | | | EMC Corp.* | | | 2,455,892 | |
| | 78,600 | | | Fusion-io, Inc.* | | | 1,286,682 | |
| | | | | | | | |
| | | | | | | 3,742,574 | |
| | | | | | | | |
| | | | Data Processing & Outsourced Services 5.8% | | | | |
| | 11,075 | | | MasterCard, Inc., Class A | | | 5,993,014 | |
| | 31,295 | | | Visa, Inc., Class A | | | 5,315,143 | |
| | | | | | | | |
| | | | | | | 11,308,157 | |
| | | | | | | | |
| | | | Diversified Support Services 1.0% | | | | |
| | 86,028 | | | Ritchie Bros. Auctioneers, Inc. (Canada) | | | 1,866,808 | |
| | | | | | | | |
| | | | Drug Retail 0.8% | | | | |
| | 32,237 | | | Walgreen Co. | | | 1,537,060 | |
| | | | | | | | |
| | | | Electrical Components & Equipment 0.8% | | | | |
| | 38,470 | | | Polypore International, Inc.* | | | 1,545,725 | |
| | | | | | | | |
| | | | Electronic Equipment & Instruments 0.7% | | | | |
| | 33,129 | | | Hologram Industries (France) | | | 1,308,067 | |
| | | | | | | | |
| | | | Health Care Equipment 5.6% | | | | |
| | 215,720 | | | DiaSorin S.p.A. (Italy) | | | 7,549,600 | |
| | 55,347 | | | MAKO Surgical Corp.* | | | 617,119 | |
| | 69,200 | | | Mindray Medical International Ltd. ADR (China) | | | 2,763,848 | |
| | | | | | | | |
| | | | | | | 10,930,567 | |
| | | | | | | | |
| | | | | | | | |
| Shares | | | | | Value | |
| | | | | | | |
| | | | Health Care Services 3.8% | | | | |
| | 194,511 | | | Bio-Reference Laboratories, Inc.* | | $ | 5,053,396 | |
| | 24,400 | | | Laboratory Corp. of America Holdings* | | | 2,200,880 | |
| | | | | | | | |
| | | | | | | 7,254,276 | |
| | | | | | | | |
| | | | Health Care Supplies 2.3% | | | | |
| | 25,535 | | | Sartorius Stedim Biotech (France) | | | 3,404,396 | |
| | 1,245,382 | | | Shandong Weigao Group Medical Polymer Co. Ltd. (China) | | | 1,129,416 | |
| | | | | | | | |
| | | | | | | 4,533,812 | |
| | | | | | | | |
| | | | Home Entertainment Software 1.8% | | | | |
| | 244,408 | | | Activision Blizzard, Inc. | | | 3,561,024 | |
| | | | | | | | |
| | | | Household Appliances 3.1% | | | | |
| | 127,415 | | | iRobot Corp.* | | | 3,269,469 | |
| | 55,945 | | | SodaStream International Ltd.* (Israel) | | | 2,777,110 | |
| | | | | | | | |
| | | | | | | 6,046,579 | |
| | | | | | | | |
| | | | Internet Retail 4.6% | | | | |
| | 13,909 | | | Amazon.com, Inc.* | | | 3,706,609 | |
| | 26,995 | | | ASOS plc* (United Kingdom) | | | 1,372,226 | |
| | 313,853 | | | Start Today Co. Ltd. (Japan) | | | 3,883,543 | |
| | | | | | | | |
| | | | | | | 8,962,378 | |
| | | | | | | | |
| | | | Internet Software & Services 11.1% | | | | |
| | 201,104 | | | eBay, Inc.* | | | 10,903,859 | |
| | 56,311 | | | Facebook, Inc.* | | | 1,440,435 | |
| | 10,465 | | | Google, Inc., Class A* | | | 8,309,524 | |
| | 307,193 | | | NetGem S.A. (France) | | | 909,692 | |
| | 6,528 | | | Xtera Communications, Inc.*** † | | | 65 | |
| | | | | | | | |
| | | | | | | 21,563,575 | |
| | | | | | | | |
| | | | IT Consulting & Other Services 3.1% | | | | |
| | 30,900 | | | Cognizant Technology Solutions Corp., Class A* | | | 2,367,249 | |
| | 17,342 | | | International Business Machines Corp. | | | 3,699,049 | |
| | | | | | | | |
| | | | | | | 6,066,298 | |
| | | | | | | | |
| | | | Leisure Products 1.0% | | | | |
| | 22,602 | | | Shimano, Inc. (Japan) | | | 1,910,130 | |
| | | | | | | | |
| | | | Life Sciences Tools & Services 1.4% | | | | |
| | 64,000 | | | Agilent Technologies, Inc. | | | 2,686,080 | |
| | | | | | | | |
| | | | Oil & Gas Refining & Marketing 1.3% | | | | |
| | 63,900 | | | World Fuel Services Corp. | | | 2,538,108 | |
| | | | | | | | |
| | | | Packaged Foods & Meats 0.4% | | | | |
| | 288,766 | | | Cloetta AB, Class B* (Sweden) | | | 754,520 | |
| | | | | | | | |
| | | | Personal Products 2.9% | | | | |
| | 149,801 | | | Herbalife Ltd. | | | 5,610,047 | |
| | | | | | | | |
| | | | Pharmaceuticals 3.1% | | | | |
| | 58,730 | | | Teva Pharmaceutical Industries Ltd. ADR (Israel) | | | 2,330,406 | |
| | 49,600 | | | Valeant Pharmaceuticals International, Inc.* (Canada) | | | 3,720,992 | |
| | | | | | | | |
| | | | | | | 6,051,398 | |
| | | | | | | | |
| | | | Semiconductors 4.4% | | | | |
| | 72,512 | | | Altera Corp. | | | 2,572,001 | |
| | 135,000 | | | Intel Corp. | | | 2,949,750 | |
| | 77,700 | | | Xilinx, Inc. | | | 2,965,809 | |
| | | | | | | | |
| | | | | | | 8,487,560 | |
| | | | | | | | |
| | | | Specialized Finance 3.7% | | | | |
| | 29,958 | | | IntercontinentalExchange, Inc.* | | | 4,885,251 | |
| | 61,759 | | | MarketAxess Holdings, Inc. | | | 2,303,611 | |
| | | | | | | | |
| | | | | | | 7,188,862 | |
| | | | | | | | |
86
| | |
| | MARCH 31, 2013 (UNAUDITED) |
|
|
|
| | | | | | | | |
| Shares | | | | | Value | |
| | | | | | | |
| | | | Systems Software 3.5% | | | | |
| | 107,800 | | | Check Point Software Technologies Ltd.* (Israel) | | $ | 5,065,522 | |
| | 33,718 | | | Red Hat, Inc.* | | | 1,704,782 | |
| | | | | | | | |
| | | | | | | 6,770,304 | |
| | | | | | | | |
| | |
| | | | Total Common Stocks
(cost $145,183,692) | | | 174,536,401 | |
| | | | | | | | |
| | |
| | | | PREFERRED STOCKS 1.8% | | | | |
| | |
| | | | Health Care Equipment 1.8% | | | | |
| | 32,506 | | | Sartorius AG Pfd. (Germany) | | | 3,479,532 | |
| | | | | | | | |
| | |
| | | | Total Preferred Stocks
(cost $1,846,534) | | | 3,479,532 | |
| | | | | | | | |
| | |
| | | | LIMITED PARTNERSHIP INTEREST 0.2% | | | | |
| | |
| | | | Asset Management & Custody Banks 0.2% | | | | |
| | | | Greenspring Global Partners II-B, L.P.*** † | | | 437,652 | |
| | | | | | | | |
| | |
| | | | Total Limited Partnership Interest
(cost $464,387) | | | 437,652 | |
| | | | | | | | |
| | |
| | | | WARRANTS 0.0% | | | | |
| | |
| | | | Health Care Equipment 0.0% | | | | |
| | 71,500 | | | Cardica, Inc., expiring 9/29/14* *** † | | | 3,575 | |
| | | | | | | | |
| | |
| | | | Total Warrants
(cost $8,938) | | | 3,575 | |
| | | | | | | | |
| | |
Principal
Amount | | | | | Value | |
| | | | | | | |
| | |
| | | | SHORT-TERM INVESTMENTS 7.8% | | | | |
| | |
| | | | Repurchase Agreement 7.8% | | | | |
| | $15,152,120 | | | Repurchase Agreement dated 3/28/13, 0.01% due 4/1/13 with State Street Bank and Trust Co. collateralized by $15,120,000 of United States Treasury Notes 1.000% due 3/31/17; value: $15,460,140; repurchase proceeds: $15,152,137†† (cost $15,152,120) | | $ | 15,152,120 | |
| | | | | | | | |
| | |
| | | | Total Short-Term Investments
(cost $15,152,120) | | | 15,152,120 | |
| | | | | | | | |
| | |
| | | | Total Investments
(cost $162,655,671) 99.9% | | | 193,609,280 | |
| | |
| | | | Other Assets less Liabilities 0.1% | | | 162,363 | |
| | | | | | | | |
| | |
| | | | NET ASSETS 100.0% | | $ | 193,771,643 | |
| | | | | | | | |
| |
| | | | *Non-income producing. ***Security was fair valued under procedures adopted by the Board of Trustees (see Note 15). †Security purchased in a private placement transaction or under Rule 144A of the Securities Act of 1933 (see Note 11). ††All or a portion of this security has been designated as collateral for purchase commitments (see Note 12). ADR American Depositary Receipt. See Notes to Financial Statements. | |
At March 31, 2013, Wasatch World Innovators Fund’s investments, excluding short-term investments, were in the following countries:
| | | | |
| Country | | % | |
Canada | | | 3.1 | |
China | | | 2.2 | |
France | | | 3.2 | |
Germany | | | 1.9 | |
Israel | | | 5.7 | |
Italy | | | 4.2 | |
Japan | | | 3.2 | |
Norway | | | 0.6 | |
Sweden | | | 1.3 | |
United Kingdom | | | 3.5 | |
United States | | | 71.1 | |
| | | | |
TOTAL | | | 100.0 | % |
| | | | |
87
| | |
| WASATCH-1ST SOURCE INCOME FUND (FMEQX) — Schedule of Investments | | |
|
|
|
| | | | | | | | |
Principal
Amount | | | | | Value | |
| | | | | | | |
| | | | ASSET BACKED SECURITIES 3.6% | | | | |
| | |
| | $1,500,000 | | | Citibank Credit Card Issuance Trust, 5.65%, 9/20/19, Series 2007-A8, Class A8 | | $ | 1,796,760 | |
| | 900,000 | | | Citibank Omni Master Trust, 4.90%, 11/15/18, Series 2009-A17, Class A17† | | | 962,306 | |
| | 585,000 | | | World Financial Network Credit Card Master Trust, 1.76%, 5/17/21,
Series 2012-B, Class A | | | 595,227 | |
| | 1,400,000 | | | World Financial Network Credit Card Master Trust, 3.14%, 1/17/23,
Series 2012-A, Class A | | | 1,519,748 | |
| | | | | | | | |
| | |
| | | | Total Asset Backed Securities (cost $4,759,615) | | | 4,874,041 | |
| | | | | | | | |
| | |
| | | | COLLATERALIZED MORTGAGE OBLIGATIONS 22.4% | | | | |
| | |
| | 250,000 | | | Banc of America Merrill Lynch Commercial Mortgage, Inc., 5.077%, 11/10/42, Series 2005-1,
Class A4††† | | | 254,638 | |
| | 23,896 | | | Banc of America Mortgage Securities, Inc., 3.006%, 2/25/33, Series 2003-A,
Class 3A1††† | | | 22,960 | |
| | 53,314 | | | Bear Stearns Commercial Mortgage Securities, 4.735%, 9/11/42,
Series 2005-PWR9,
Class A2 | | | 54,142 | |
| | 84,763 | | | Countrywide Home Loan Mortgage Pass Through Trust, 4.50%, 8/25/19,
Series 2004-J7, Class 2A1 | | | 85,693 | |
| | 607,783 | | | Federal Home Loan Mortgage Corp.,
1.50%, 9/15/22, Series 3760, Class BA | | | 614,388 | |
| | 143,928 | | | Federal Home Loan Mortgage Corp.,
1.50%, 4/15/24, Series 3780, Class TA | | | 145,220 | |
| | 110,592 | | | Federal Home Loan Mortgage Corp.,
2.40%, 5/1/31, Series 847292††† | | | 118,280 | |
| | 77,865 | | | Federal Home Loan Mortgage Corp.,
2.431%, 12/1/32, Series 847527††† | | | 83,056 | |
| | 54,587 | | | Federal Home Loan Mortgage Corp.,
2.485%, 11/1/35, Series 1M0010††† | | | 57,976 | |
| | 28,133 | | | Federal Home Loan Mortgage Corp.,
2.842%, 8/1/33, Series 847281††† | | | 30,024 | |
| | 338,463 | | | Federal Home Loan Mortgage Corp.,
3.349%, 1/1/25, Series 775629††† | | | 339,437 | |
| | 233,971 | | | Federal Home Loan Mortgage Corp.,
3.554%, 5/1/25, Series 775617††† | | | 246,474 | |
| | 247,202 | | | Federal Home Loan Mortgage Corp.,
5.50%, 5/15/15, Series 2808, Class VA | | | 257,721 | |
| | 76,640 | | | Federal Home Loan Mortgage Corp.,
5.50%, 10/1/25, Series C90925 | | | 83,795 | |
| | 288,345 | | | Federal Home Loan Mortgage Corp.,
5.50%, 8/1/29, Series C46102 | | | 314,453 | |
| | 312,507 | | | Federal National Mortgage Assoc.,
1.984%, 12/1/35, Series 848390††† | | | 327,752 | |
| | 933,141 | | | Federal National Mortgage Assoc.,
2.00%, 4/25/42, Series 2012-82, Class E | | | 936,434 | |
| | 378,592 | | | Federal National Mortgage Assoc.,
2.079%, 1/1/35, Series 825245††† | | | 403,177 | |
| | 171,030 | | | Federal National Mortgage Assoc.,
2.513%, 11/1/34, Series 782320††† | | | 182,144 | |
| | 16,244 | | | Federal National Mortgage Assoc.,
2.60%, 10/1/32, Series 659567††† | | | 16,266 | |
| | 132,671 | | | Federal National Mortgage Assoc.,
2.774%, 1/1/18, Series 57735††† | | | 136,699 | |
| | 161,987 | | | Federal National Mortgage Assoc.,
2.807%, 2/1/21, Series 313380††† | | | 169,034 | |
| | 1,454,334 | | | Federal National Mortgage Assoc.,
3.00%, 1/1/28, Series AB7546 | | | 1,542,867 | |
| | | | | | | | |
Principal
Amount | | | | | Value | |
| | | | | | | |
| | $ 247,892 | | | Federal National Mortgage Assoc.,
3.50%, 6/25/23, Series 2003-46, Class LD | | $ | 264,146 | |
| | 268,053 | | | Federal National Mortgage Assoc.,
3.875%, 1/25/39, Series 2009-2, Class WJ | | | 287,193 | |
| | 154,145 | | | Federal National Mortgage Assoc.,
4.00%, 10/25/32, Series 2003-28, Class GA | | | 159,631 | |
| | 157,135 | | | Federal National Mortgage Assoc.,
4.066%, 7/1/19, Series 070377††† | | | 163,484 | |
| | 554,916 | | | Federal National Mortgage Assoc.,
4.50%, 6/25/29, Series 2005-121, Class V | | | 570,529 | |
| | 924,846 | | | Federal National Mortgage Assoc.,
5.00%, 7/25/23, Series 2005-4, Class VG | | | 937,399 | |
| | 250,000 | | | Federal National Mortgage Assoc.,
5.50%, 5/25/23, Series 2003-42, Class EK | | | 286,344 | |
| | 283,810 | | | Government National Mortgage Assoc.,
1.625%, 1/20/30, Series 80364††† | | | 295,795 | |
| | 725,585 | | | Government National Mortgage Assoc.,
1.75%, 6/20/30, Series 80416††† | | | 762,636 | |
| | 555,918 | | | Government National Mortgage Assoc.,
1.75%, 9/20/34, Series 81054††† | | | 583,934 | |
| | 723,587 | | | Government National Mortgage Assoc.,
2.25%, 7/20/34, Series 80987††† | | | 754,626 | |
| | 2,125,211 | | | Government National Mortgage Assoc.,
2.50%, 5/20/40, Series 2012-94, Class GA | | | 2,224,074 | |
| | 787,992 | | | Government National Mortgage Assoc.,
3.00%, 8/20/38, Series 2010-47, Class CG | | | 819,389 | |
| | 790,579 | | | Government National Mortgage Assoc.,
3.00%, 12/20/38, Series 2010-89, Class PA | | | 817,101 | |
| | 1,286,048 | | | Government National Mortgage Assoc.,
3.00%, 5/20/39, Series 2010-68, Class YE | | | 1,340,214 | |
| | 1,625,518 | | | Government National Mortgage Assoc., 3.00%, 10/20/39, Series 2010-117, Class GD | | | 1,707,769 | |
| | 852,234 | | | Government National Mortgage Assoc., 3.00%, 6/20/41, Series 2011-138, Class PN | | | 887,820 | |
| | 1,150,453 | | | Government National Mortgage Assoc., 3.50%, 1/20/37, Series 2009-31, Class PD | | | 1,181,926 | |
| | 1,641,427 | | | Government National Mortgage Assoc., 3.50%, 6/20/39, Series 2010-129, Class NU | | | 1,760,165 | |
| | 457,944 | | | Government National Mortgage Assoc., 4.00%, 6/20/38, Series 2009-69, Class WC | | | 477,756 | |
| | 955,396 | | | Government National Mortgage Assoc., 4.00%, 9/20/38, Series 2009-108, Class WG | | | 1,026,254 | |
| | 821,696 | | | Government National Mortgage Assoc., 4.00%, 3/20/39, Series 2009-31, Class TA | | | 874,345 | |
| | 787,846 | | | Government National Mortgage Assoc., 4.00%, 4/16/39, Series 2009-110, Class AB | | | 827,795 | |
| | 785,029 | | | Government National Mortgage Assoc., 4.00%, 8/20/39, Series 2009-69, Class PV | | | 832,565 | |
| | 548,513 | | | Government National Mortgage Assoc.,
4.50%, 6/20/34, Series 2009-101, Class G | | | 562,682 | |
| | 377,926 | | | Government National Mortgage Assoc.,
4.50%, 8/20/34, Series 2009-36, Class G | | | 386,289 | |
| | 483,392 | | | Government National Mortgage Assoc.,
4.50%, 8/16/35, Series 2009-62, Class DT | | | 495,957 | |
| | 406,871 | | | Government National Mortgage Assoc.,
4.50%, 2/20/38, Series 2009-55, Class NP | | | 429,496 | |
| | 638,355 | | | Government National Mortgage Assoc.,
4.50%, 3/20/39, Series 2009-14, Class AG | | | 691,217 | |
| | 169,675 | | | Government National Mortgage Assoc.,
4.658%, 12/16/30, Series 2005-12, Class C | | | 174,350 | |
| | 305,717 | | | Government National Mortgage Assoc.,
5.00%, 9/16/31, Series 2009-38, Class A | | | 315,467 | |
| | 500,000 | | | Government National Mortgage Assoc.,
5.00%, 7/20/34, Series 2004-105, Class MC | | | 550,535 | |
| | 105,699 | | | Government National Mortgage Assoc., 5.00%, 8/20/39, Series 004513 | | | 111,929 | |
| | | | | | | | |
| | |
| | | | Total Collateralized Mortgage Obligations
(cost $29,588,153) | | | 29,983,442 | |
| | | | | | | | |
88
| | |
| | MARCH 31, 2013 (UNAUDITED) |
|
|
|
| | | | | | | | |
Principal
Amount | | | | | Value | |
| | | | | | | |
| | |
| | | | CORPORATE BONDS 39.1% | | | | |
| | |
| | | | Aerospace & Defense 0.7% | | | | |
| | $ 600,000 | | | Lockheed Martin Corp., 3.35%, 9/15/21 | | $ | 629,794 | |
| | 250,000 | | | Martin Marietta Corp., 7.375%, 4/15/13 | | | 250,555 | |
| | | | | | | | |
| | | | | | | 880,349 | |
| | | | | | | | |
| | | | Air Freight & Logistics 0.6% | | | | |
| | 620,000 | | | United Parcel Service, Inc., 5.50%, 1/15/18 | | | 741,805 | |
| | | | | | | | |
| | | | Automotive Retail 0.6% | | | | |
| | 775,000 | | | AutoZone, Inc., 5.50%, 11/15/15 | | | 864,927 | |
| | | | | | | | |
| | | | Beverages — Non-alcoholic 1.1% | | | | |
| | 500,000 | | | PepsiAmericas, Inc., 5.00%, 5/15/17 | | | 572,078 | |
| | 750,000 | | | PepsiCo, Inc., 5.00%, 6/1/18 | | | 882,128 | |
| | | | | | | | |
| | | | | | | 1,454,206 | |
| | | | | | | | |
| | | | Commercial Banks — Non-U.S. 1.6% | | | | |
| | 1,100,000 | | | Royal Bank of Canada,
2.00%, 5/15/20 MTN## (Canada) | | | 1,103,587 | |
| | 1,000,000 | | | Toronto-Dominion Bank (The),
2.375%, 10/19/16 (Canada) | | | 1,046,194 | |
| | | | | | | | |
| | | | | | | 2,149,781 | |
| | | | | | | | |
| | | | Commercial Banks — Central
U.S. 0.4% | | | | |
| | 600,000 | | | SunTrust Bank, 1.284%, 6/30/14††† | | | 593,603 | |
| | | | | | | | |
| | | | Commercial Banks — Southern
U.S. 0.6% | | | | |
| | 800,000 | | | BB&T Corp., 3.20%, 3/15/16 MTN | | | 850,741 | |
| | | | | | | | |
| | | | Computer Hardware 0.7% | | | | |
| | 900,000 | | | Hewlett-Packard Co., 2.125%, 9/13/15 | | | 912,450 | |
| | | | | | | | |
| | | | Construction & Farm Machinery & Heavy Trucks 1.2% | | | | |
| | 500,000 | | | Caterpillar Financial Services Corp.,
5.85%, 9/1/17 MTN | | | 595,203 | |
| | 1,000,000 | | | John Deere Capital Corp., 2.25%, 4/17/19 | | | 1,034,057 | |
| | | | | | | | |
| | | | | | | 1,629,260 | |
| | | | | | | | |
| | | | Cosmetics & Toiletries 0.4% | | | | |
| | 441,775 | | | Procter & Gamble — ESOP,
9.36%, 1/1/21, Series A | | | 584,284 | |
| | | | | | | | |
| | | | Distillers & Vintners 0.4% | | | | |
| | 504,000 | | | Diageo Capital plc, 7.375%, 1/15/14 (United Kingdom) | | | 530,293 | |
| | | | | | | | |
| | | | Diversified Banks 3.9% | | | | |
| | 1,250,000 | | | Bank of America Corp.,
7.375%, 5/15/14 MTN | | | 1,337,725 | |
| | 500,000 | | | Goldman Sachs Group, Inc. (The),
3.625%, 2/7/16 | | | 530,997 | |
| | 500,000 | | | SouthTrust Corp., 5.80%, 6/15/14 | | | 523,341 | |
| | 1,125,000 | | | US Bancorp, 3.00%, 3/15/22 MTN | | | 1,159,622 | |
| | 750,000 | | | Wachovia Corp., 5.25%, 8/1/14 | | | 793,510 | |
| | 700,000 | | | Wachovia Corp., 5.75%, 2/1/18 MTN | | | 833,176 | |
| | | | | | | | |
| | | | | | | 5,178,371 | |
| | | | | | | | |
| | | | Diversified Financial Services 2.9% | | | | |
| | 2,350,000 | | | General Electric Capital Corp.,
5.40%, 2/15/17 MTN | | | 2,699,212 | |
| | 1,000,000 | | | General Electric Capital Corp.,
5.625%, 5/1/18 | | | 1,183,470 | |
| | | | | | | | |
| | | | | | | 3,882,682 | |
| | | | | | | | |
| | | | Diversified Metals & Mining 0.3% | | | | |
| | 450,000 | | | Rio Tinto Alcan, Inc.,
4.50%, 5/15/13 (Canada) | | | 451,855 | |
| | | | | | | | |
| | | | | | | | |
Principal
Amount | | | | | Value | |
| | | | | | | |
| | | | Drug Retail 0.3% | | | | |
| | $ 400,000 | | | Walgreen Co., 4.875%, 8/1/13 | | $ | 405,606 | |
| | | | | | | | |
| | | | Electric — Integrated 0.5% | | | | |
| | 659,000 | | | Southern Co. (The),
2.375%, 9/15/15, Series A | | | 683,380 | |
| | | | | | | | |
| | | | Enterprise Software & Services 0.9% | | | | |
| | 1,000,000 | | | Oracle Corp., 5.75%, 4/15/18 | | | 1,206,642 | |
| | | | | | | | |
| | | | Finance — Auto Loans 0.6% | | | | |
| | 750,000 | | | PACCAR Financial Corp.,
1.60%, 3/15/17 MTN | | | 761,392 | |
| | | | | | | | |
| | | | Finance — Credit Card 0.9% | | | | |
| | 975,000 | | | American Express Co., 6.15%, 8/28/17 | | | 1,166,297 | |
| | | | | | | | |
| | | | Finance — Other Services 0.4% | | | | |
| | 500,000 | | | Sun Canada Financial Co.,
7.25%, 12/15/15† | | | 555,251 | |
| | | | | | | | |
| | | | Footwear 0.5% | | | | |
| | 600,000 | | | Nike, Inc., 5.15%, 10/15/15 MTN | | | 662,148 | |
| | | | | | | | |
| | | | Health Care Equipment 0.2% | | | | |
| | 250,000 | | | Baxter International, Inc., 4.625%, 3/15/15 | | | 268,738 | |
| | | | | | | | |
| | | | Industrial Gases 0.5% | | | | |
| | 600,000 | | | Praxair, Inc., 4.625%, 3/30/15 | | | 648,164 | |
| | | | | | | | |
| | | | Instruments — Scientific 0.6% | | | | |
| | 700,000 | | | Thermo Fisher Scientific, Inc.,
4.70%, 5/1/20 | | | 773,998 | |
| | | | | | | | |
| | | | Integrated Telecommunication Services 1.6% | | | | |
| | 129,084 | | | Ameritech Capital Funding, 9.10%, 6/1/16 | | | 148,837 | |
| | 870,000 | | | AT&T, Inc., 5.50%, 2/1/18 | | | 1,022,808 | |
| | 300,000 | | | Verizon Communications, Inc.,
5.50%, 2/15/18 | | | 352,641 | |
| | 520,000 | | | Verizon Communications, Inc.,
5.55%, 2/15/16 | | | 586,628 | |
| | | | | | | | |
| | | | | | | 2,110,914 | |
| | | | | | | | |
| | | | Investment Banking & Brokerage 0.6% | | | | |
| | 700,000 | | | Morgan Stanley, 5.50%, 7/24/20 MTN | | | 806,163 | |
| | | | | | | | |
| | | | Life & Health Insurance 1.1% | | | | |
| | 850,000 | | | Prudential Financial, Inc., 6.20%, 1/15/15 | | | 927,185 | |
| | 480,000 | | | Prudential Holdings, LLC,
7.245%, 12/18/23, Series FSA† | | | 595,634 | |
| | | | | | | | |
| | | | | | | 1,522,819 | |
| | | | | | | | |
| | | | Medical Instruments 0.9% | | | | |
| | 1,100,000 | | | Medtronic, Inc., 4.45%, 3/15/20 | | | 1,264,117 | |
| | | | | | | | |
| | | | Medical — Drugs 0.6% | | | | |
| | 575,000 | | | Pharmacia Corp., 6.75%, 12/15/27 | | | 787,560 | |
| | | | | | | | |
| | | | Medical — Health Maintenance Organizations 0.8% | | | | |
| | 1,000,000 | | | WellPoint, Inc., 4.35%, 8/15/20 | | | 1,112,426 | |
| | | | | | | | |
| | | | Movies & Entertainment 0.7% | | | | |
| | 300,000 | | | Walt Disney Co. (The), 2.75%, 8/16/21 | | | 308,857 | |
| | 250,000 | | | Walt Disney Co. (The),
4.50%, 12/15/13 MTN | | | 257,361 | |
| | 350,000 | | | Walt Disney Co. (The),
6.00%, 7/17/17, Series C MTN | | | 420,913 | |
| | | | | | | | |
| | | | | | | 987,131 | |
| | | | | | | | |
| | | | Multimedia 0.7% | | | | |
| | 800,000 | | | NBCUniversal Media, LLC, 5.15%, 4/30/20 | | | 948,129 | |
| | | | | | | | |
89
| | |
| WASATCH-1ST SOURCE INCOME FUND (FMEQX) — Schedule of Investments (continued) | | |
|
|
|
| | | | | | | | |
Principal
Amount | | | | | Value | |
| | | | | | | |
| | | | Oil Companies — Exploration & Production 0.5% | | | | |
| | $ 600,000 | | | Apache Finance Canada Corp., 4.375%, 5/15/15 (Canada) | | $ | 645,111 | |
| | | | | | | | |
| | | | Oil Companies — Integrated 1.1% | | | | |
| | 750,000 | | | ConocoPhillips, 5.75%, 2/1/19 | | | 917,601 | |
| | 500,000 | | | XTO Energy, Inc., 5.75%, 12/15/13 | | | 519,052 | |
| | | | | | | | |
| | | | | | | 1,436,653 | |
| | | | | | | | |
| | | | Other Diversified Financial Services 1.1% | | | | |
| | 1,350,000 | | | JPMorgan Chase & Co., 4.35%, 8/15/21 | | | 1,489,286 | |
| | | | | | | | |
| | | | Personal Products 0.5% | | | | |
| | 655,000 | | | Avon Products, Inc., 5.625%, 3/1/14 | | | 683,284 | |
| | | | | | | | |
| | | | Pharmaceuticals 2.9% | | | | |
| | 745,000 | | | AstraZeneca plc, 5.90%, 9/15/17 (United Kingdom) | | | 894,298 | |
| | 795,000 | | | Cardinal Health, Inc., 6.00%, 6/15/17 | | | 927,530 | |
| | 1,000,000 | | | Johnson & Johnson, 5.55%, 8/15/17 | | | 1,196,051 | |
| | 725,000 | | | Pharmacia Corp., 6.50%, 12/1/18 | | | 917,194 | |
| | | | | | | | |
| | | | | | | 3,935,073 | |
| | | | | | | | |
| | | | Property & Casualty Insurance 0.3% | | | | |
| | 435,000 | | | Allstate Corp. (The), 7.50%, 6/15/13 | | | 441,057 | |
| | | | | | | | |
| | | | Railroads 1.1% | | | | |
| | 300,000 | | | Burlington Northern Santa Fe, LLC, 4.30%, 7/1/13 | | | 302,833 | |
| | 1,000,000 | | | Union Pacific Corp., 5.70%, 8/15/18 | | | 1,206,880 | |
| | | | | | | | |
| | | | | | | 1,509,713 | |
| | | | | | | | |
| | | | Regional Banks 0.6% | | | | |
| | 700,000 | | | Fifth Third Bancorp, 5.45%, 1/15/17 | | | 786,056 | |
| | | | | | | | |
| | | | Semiconductor Equipment 0.2% | | | | |
| | 250,000 | | | Applied Materials, Inc., 2.65%, 6/15/16 | | | 263,006 | |
| | | | | | | | |
| | | | Special Purpose Entity 0.4% | | | | |
| | 525,000 | | | Principal Life Global Funding I, 5.05%, 3/15/15† | | | 567,594 | |
| | | | | | | | |
| | | | Specialized Finance 0.5% | | | | |
| | 600,000 | | | CME Group, Inc., 5.40%, 8/1/13 | | | 609,590 | |
| | | | | | | | |
| | | | Specialty Chemicals 1.2% | | | | |
| | 1,150,000 | | | Lubrizol Corp., 8.875%, 2/1/19 | | | 1,592,400 | |
| | | | | | | | |
| | | | Steel 0.9% | | | | |
| | 1,000,000 | | | Nucor Corp., 5.75%, 12/1/17 | | | 1,191,861 | |
| | | | | | | | |
| | |
| | | | Total Corporate Bonds (cost $50,808,278) | | | 52,526,166 | |
| | | | | | | | |
| | |
| | | | MUNICIPAL BONDS 1.0% | | | | |
| | |
| | 650,000 | | | Arizona State Transportation Board Highway Revenue, 5.00%, 7/1/23 | | | 744,016 | |
| | 500,000 | | | Richmond Joint Powers Financing Authority, 8.25%, 7/1/19, Class B | | | 603,175 | |
| | | | | | | | |
| | |
| | | | Total Municipal Bonds (cost $1,152,956) | | | 1,347,191 | |
| | | | | | | | |
| | | | | | | | |
Shares | | | | | Value | |
| | | | | | | |
| | |
| | | | MUTUAL FUNDS 0.6% | | | | |
| | |
| | 49,453 | | | Eaton Vance Short Duration Diversified Income Fund | | $ | 852,075 | |
| | | | | | | | |
| | |
| | | | Total Mutual Funds (cost $752,394) | | | 852,075 | |
| | | | | | | | |
| | |
| | | | EXCHANGE TRADED FUNDS 1.0% | | | | |
| | |
| | 6,000 | | | iShares iBoxx Investment Grade Corporate Bond Fund | | | 719,400 | |
| | 30,000 | | | Market Vectors Preferred Securities
ex = Financials ETF | | | 615,900 | |
| | | | | | | | |
| | |
| | | | Total Exchange Traded Funds (cost $1,140,549) | | | 1,335,300 | |
| | | | | | | | |
| | |
Principal
Amount | | | | | Value | |
| | | | | | | |
| | |
| | | | U.S. GOVERNMENT AGENCY SECURITIES 20.1% | | | | |
| | |
| | $1,000,000 | | | Federal Farm Credit Bank, 2.65%, 5/11/15 | | $ | 1,048,748 | |
| | 1,000,000 | | | Federal Farm Credit Bank, 3.85%, 2/11/15 | | | 1,065,980 | |
| | 1,000,000 | | | Federal Farm Credit Bank, 3.875%, 10/7/13 | | | 1,019,454 | |
| | 650,000 | | | Federal Farm Credit Bank, 4.875%, 4/1/14 | | | 680,570 | |
| | 1,500,000 | | | Federal Home Loan Bank, 1.00%, 12/28/22, Series 0006## | | | 1,494,922 | |
| | 1,000,000 | | | Federal Home Loan Bank, 1.25%, 10/25/22, Series 0001## | | | 999,254 | |
| | 2,000,000 | | | Federal Home Loan Bank, 1.50%, 11/8/22, Series 0000## | | | 1,985,390 | |
| | 1,415,000 | | | Federal Home Loan Bank, 3.625%, 3/10/17 | | | 1,572,098 | |
| | 2,000,000 | | | Federal Home Loan Mortgage Corp., 2.00%, 10/22/21 MTN | | | 2,004,694 | |
| | 2,000,000 | | | Federal Home Loan Mortgage Corp., 2.50%, 5/27/16 | | | 2,125,530 | |
| | 1,300,000 | | | Federal Home Loan Mortgage Corp., 3.00%, 7/28/14 | | | 1,346,925 | |
| | 700,000 | | | Federal Home Loan Mortgage Corp., 4.75%, 11/17/15 | | | 779,659 | |
| | 1,000,000 | | | Federal National Mortgage Assoc., 1.00%, 12/28/18## | | | 998,604 | |
| | 1,050,000 | | | Federal National Mortgage Assoc., 2.05%, 5/23/17 | | | 1,107,508 | |
| | 2,200,000 | | | Federal National Mortgage Assoc., 2.625%, 11/20/14 | | | 2,285,996 | |
| | 1,800,000 | | | Federal National Mortgage Assoc., 4.875%, 12/15/16 | | | 2,082,532 | |
| | 600,000 | | | Federal National Mortgage Assoc., 5.24%, 8/7/18 | | | 610,444 | |
| | 528,803 | | | New Valley Generation IV, 4.687%, 1/15/22 | | | 601,973 | |
| | 800,000 | | | Tennessee Valley Authority, 3.875%, 2/15/21 | | | 927,858 | |
| | 1,000,000 | | | Tennessee Valley Authority, 6.25%, 12/15/17, Series E | | | 1,245,910 | |
| | 1,000,000 | | | Tennessee Valley Authority Generic Strip, 0.00%, 11/1/18, Series C### | | | 925,239 | |
| | | | | | | | |
| | |
| | | | Total U.S. Government Agency Securities (cost $26,206,519) | | | 26,909,288 | |
| | | | | | | | |
90
| | |
| | MARCH 31, 2013 (UNAUDITED) |
|
|
|
| | | | | | | | |
Principal
Amount | | | | | Value | |
| | | | | | | |
| | |
| | | | U.S. TREASURY INFLATION
PROTECTED BONDS 1.0% | | | | |
| | |
| | $1,154,055 | | | U.S. Treasury Bond, 1.625%, 1/15/18# | | $ | 1,345,465 | |
| | | | | | | | |
| | |
| | | | Total U.S. Treasury Inflation Protected Bonds (cost $1,117,908) | | | 1,345,465 | |
| | | | | | | | |
| | |
| | | | U.S. TREASURY NOTES 9.1% | | | | |
| | |
| | 950,000 | | | U.S. Treasury Note, 2.75%, 12/31/17 | | | 1,040,844 | |
| | 4,125,000 | | | U.S. Treasury Note, 3.25%, 12/31/16 | | | 4,544,913 | |
| | 5,700,000 | | | U.S. Treasury Note, 3.625%, 8/15/19 | | | 6,601,312 | |
| | | | | | | | |
| | |
| | | | Total U.S. Treasury Notes (cost $11,754,542) | | | 12,187,069 | |
| | | | | | | | |
| | |
| Shares | | | | | Value | |
| | | | | | | |
| | |
| | | | PREFERRED STOCKS 1.0% | | | | |
| | |
| | | | Diversified Banks 0.8% | | | | |
| | 4,762 | | | Bank One Capital TR VI, 7.20%, Pfd. | | $ | 124,955 | |
| | 19,200 | | | Harris Preferred Capital Corp., 7.375%, Series A Pfd.§§§ | | | 499,008 | |
| | 20,000 | | | JP Morgan Chase Capital XIX, 6.625%, Series S Pfd. | | | 506,800 | |
| | | | | | | | |
| | | | | | | 1,130,763 | |
| | | | | | | | |
| | | | Investment Banking & Brokerage 0.2% | | | | |
| | 10,000 | | | Morgan Stanley Cap TR VI, 6.60%, Pfd. | | | 254,100 | |
| | | | | | | | |
| | |
| | | | Total Preferred Stocks (cost $1,345,279) | | | 1,384,863 | |
| | | | | | | | |
| | | | | | | | |
Principal
Amount | | | | | Value | |
| | | | SHORT-TERM INVESTMENTS 1.0% | | | | |
| | |
| | | | Repurchase Agreement 1.0% | | | | |
| | $1,291,605 | | | Repurchase Agreement dated 3/28/13, 0.01% due 4/1/13 with State Street Bank and Trust Co. collateralized by $1,325,000 of United States Treasury Notes 0.500% due 7/31/17; value: $1,318,882; repurchase proceeds: $1,291,607 (cost $1,291,605) | | $ | 1,291,605 | |
| | | | | | | | |
| | |
| | | | Total Short-Term Investments (cost $1,291,605) | | | 1,291,605 | |
| | | | | | | | |
| | |
| | | | Total Investments (cost $129,917,798) 99.9% | | | 134,036,505 | |
| | |
| | | | Other Assets less Liabilities 0.1% | | | 177,844 | |
| | | | | | | | |
| | |
| | | | NET ASSETS 100.0% | | $ | 134,214,349 | |
| | | | | | | | |
| |
| | | | †Liquid security purchased in a private placement transaction or under Rule 144A of the Securities Act of 1933. †††Variable rate securities. §§§Perpetual maturity. Callable any time after first call date. Maturity date is next call date. #Treasury Inflation Protected Securities. A U.S. Treasury Note or Bond that offers protection from inflation by paying a fixed rate of interest on principal amount that is adjusted for inflation based on the Consumer Price Index. ##Step Bond. The rate shown is as of March 31, 2013 and will reset at a future date. ###Zero coupon bond. MTN Medium Term Note. ETF Exchanged Traded Fund See Notes to Financial Statements. | |
At March 31, 2013, Wasatch-1st Source Income Fund’s investments, excluding short-term investments, were in the following countries:
| | | | |
| Country | | % | |
Canada | | | 2.4 | |
United Kingdom | | | 1.1 | |
United States | | | 96.5 | |
| | | | |
TOTAL | | | 100.0 | % |
| | | | |
91
| | |
| WASATCH-HOISINGTON U.S. TREASURY FUND (WHOSX) — Schedule of Investments | | (UNAUDITED) |
|
|
|
| | | | | | | | |
Principal
Amount | | | | | Value | |
| | | | | | | |
| | |
| | | | U.S. GOVERNMENT OBLIGATIONS 96.4% | | | | |
| | |
| | $13,250,000 | | | U.S. Treasury Bond, 2.75%, 11/15/42 | | $ | 12,281,094 | |
| | 7,800,000 | | | U.S. Treasury Bond, 3.00%, 5/15/42 | | | 7,636,684 | |
| | 28,000,000 | | | U.S. Treasury Bond, 3.125%, 11/15/41 | | | 28,166,264 | |
| | 8,000,000 | | | U.S. Treasury Bond, 3.125%, 2/15/42 | | | 8,040,000 | |
| | 9,700,000 | | | U.S. Treasury Bond, 3.50%, 2/15/39 | | | 10,547,237 | |
| | 3,000,000 | | | U.S. Treasury Bond, 3.875%, 8/15/40 | | | 3,470,157 | |
| | 4,035,000 | | | U.S. Treasury Bond, 4.25%, 5/15/39 | | | 4,958,636 | |
| | 6,900,000 | | | U.S. Treasury Bond, 4.25%, 11/15/40 | | | 8,483,764 | |
| | 1,400,000 | | | U.S. Treasury Bond, 4.375%, 2/15/38 | | | 1,750,218 | |
| | 1,040,000 | | | U.S. Treasury Bond, 4.375%, 5/15/40 | | | 1,303,576 | |
| | 10,000,000 | | | U.S. Treasury Bond, 4.50%, 5/15/38 | | | 12,737,500 | |
| | 6,000,000 | | | U.S. Treasury Bond, 4.50%, 8/15/39 | | | 7,661,250 | |
| | 6,260,000 | | | U.S. Treasury Bond, 4.75%, 2/15/41 | | | 8,314,062 | |
| | 48,400,000 | | | U.S. Treasury Strip, principal only, 5/15/30 | | | 29,583,145 | |
| | 52,300,000 | | | U.S. Treasury Strip, principal only, 2/15/31 | | | 31,065,468 | |
| | 54,837,000 | | | U.S. Treasury Strip, principal only, 2/15/37 | | | 25,476,283 | |
| | 35,150,000 | | | U.S. Treasury Strip, principal only, 5/15/39 | | | 14,976,782 | |
| | 26,000,000 | | | U.S. Treasury Strip, principal only, 5/15/40 | | | 10,622,560 | |
| | 16,500,000 | | | U.S. Treasury Strip, principal only, 11/15/41 | | | 6,325,126 | |
| | | | | | | | |
| | |
| | | | Total U.S. Government Obligations (cost $210,889,121) | | | 233,399,806 | |
| | | | | | | | |
| | | | | | | | |
Principal
Amount | | | | | Value | |
| | | | | | | |
| | |
| | | | SHORT-TERM INVESTMENTS 0.8% | | | | |
| | |
| | | | Repurchase Agreement 0.8% | | | | |
| | $ 1,841,807 | | | Repurchase Agreement dated 3/28/13, 0.01% due 4/1/13 with State Street Bank and Trust Co. collateralized by $1,840,000 of United States Treasury Notes 1.000% due 3/31/17; value: $1,881,393; repurchase proceeds: $1,841,809 (cost $1,841,807) | | $ | 1,841,807 | |
| | | | | | | | |
| | |
| | | | Total Short-Term Investments (cost $1,841,807) | | | 1,841,807 | |
| | | | | | | | |
| | |
| | | | Total Investments (cost $212,730,928) 97.2% | | | 235,241,613 | |
| | |
| | | | Other Assets less Liabilities 2.8% | | | 6,896,728 | |
| | | | | | | | |
| | |
| | | | NET ASSETS 100.0% | | $ | 242,138,341 | |
| | | | | | | | |
| | |
| | | | See Notes to Financial Statements. | | | | |
92
(This page intentionally left blank.)
93
| | |
| WASATCH FUNDS — Statements of Assets and Liabilities | | |
|
|
|
| | | | | | | | | | | | |
| | | CORE GROWTH FUND | | | EMERGING INDIA FUND | | | EMERGING MARKETS SELECT FUND1 | |
| | | | | | | | | | | | |
Assets: | | | | | | | | | | | | |
Investments, at cost | | | | | | | | | | | | |
Unaffiliated issuers | | $ | 466,395,014 | | | $ | 13,190,415 | | | $ | 20,612,012 | |
Repurchase agreements | | | 82,958,400 | | | | — | | | | 1,253,546 | |
| | | | | | | | | | | | |
| | $ | 549,353,414 | | | $ | 13,190,415 | | | $ | 21,865,558 | |
| | | | | | | | | | | | |
Investments, at market value | | | | | | | | | | | | |
Unaffiliated issuers | | $ | 694,734,920 | | | $ | 14,444,644 | | | $ | 21,313,106 | |
Repurchase agreements | | | 82,958,400 | | | | — | | | | 1,253,546 | |
| | | | | | | | | | | | |
| | | 777,693,320 | | | | 14,444,644 | | | | 22,566,652 | |
Cash | | | 91,654 | | | | — | | | | — | |
Foreign currency on deposit (cost of $0, $436,342, $0, $4,672,057, $0, $3,300, $0 and $16,345, respectively) | | | — | | | | 436,341 | | | | — | |
Receivable for investment securities sold | | | — | | | | 136,041 | | | | — | |
Capital shares receivable | | | 1,280,719 | | | | 694 | | | | 72,620 | |
Interest and dividends receivable | | | 134,560 | | | | 5,994 | | | | 16,133 | |
Prepaid expenses and other assets | | | 54,622 | | | | 17,148 | | | | 6,521 | |
| | | | | | | | | | | | |
Total Assets | | | 779,254,875 | | | | 15,040,862 | | | | 22,661,926 | |
| | | | | | | | | | | | |
Liabilities: | | | | | | | | | | | | |
Bank overdraft of foreign currency (cost of $0, $0, $0, $0, $236,220, $0, $0 and $0, respectively) | | | — | | | | — | | | | — | |
Payable for securities purchased | | | — | | | | — | | | | — | |
Capital shares payable | | | 918,543 | | | | — | | | | 7,146 | |
Payable to Advisor | | | 649,802 | | | | 9,416 | | | | 3,531 | |
Accrued fund administration fees | | | 18,932 | | | | 415 | | | | 520 | |
Accrued expenses and other liabilities | | | 165,044 | | | | 28,708 | | | | 39,795 | |
Other payables | | | 35,103 | | | | 400,929 | | | | 4,906 | |
| | | | | | | | | | | | |
Total Liabilities | | | 1,787,424 | | | | 439,468 | | | | 55,898 | |
| | | | | | | | | | | | |
Net Assets | | $ | 777,467,451 | | | $ | 14,601,394 | | | $ | 22,606,028 | |
| | | | | | | | | | | | |
Net Assets Consist of: | | | | | | | | | | | | |
Capital stock | | $ | 167,672 | | | $ | 74,377 | | | $ | 21,714 | |
Paid-in-capital in excess of par | | | 578,074,184 | | | | 14,828,093 | | | | 22,199,257 | |
Undistributed net investment loss | | | (4,374,628 | ) | | | (275,261 | ) | | | (30,439 | ) |
Undistributed net realized gain (loss) on investments and foreign currency translations | | | (24,704,092 | ) | | | (1,280,047 | ) | | | (280,777 | ) |
Net unrealized appreciation on investments and foreign currency translations | | | 228,304,315 | | | | 1,254,232 | | | | 696,273 | |
| | | | | | | | | | | | |
Net Assets | | $ | 777,467,451 | | | $ | 14,601,394 | | | $ | 22,606,028 | |
| | | | | | | | | | | | |
Net Assets | | | | | | | | | | | | |
Investor Class | | | 762,404,384 | | | | 14,601,394 | | | | 20,876,127 | |
Institutional Class | | | 15,063,067 | | | | — | | | | 1,729,901 | |
| | | |
Capital Stock Issued and Outstanding (Unlimited number of shares authorized,
$.01 par value) | | | | | | | | | | | | |
Investor Class | | | 16,442,714 | | | | 7,437,728 | | | | 2,005,347 | |
Institutional Class | | | 324,522 | | | | — | | | | 166,030 | |
| | | |
NET ASSET VALUE, REDEMPTION PRICEAND OFFERING
PRICE PER SHARE | | | | | | | | | | | | |
Investor Class | | $ | 46.37 | | | $ | 1.96 | | | $ | 10.41 | |
| | | | | | | | | | | | |
Institutional Class | | $ | 46.42 | | | $ | — | | | $ | 10.42 | |
| | | | | | | | | | | | |
| 1 | Fund inception date was December 13, 2012. |
See Notes to Financial Statements.
94
| | |
| | MARCH 31, 2013 (UNAUDITED) |
|
|
|
| | | | | | | | | | | | | | | | | | |
EMERGING MARKETS SMALL CAP FUND | | | FRONTIER EMERGING SMALL COUNTRIES FUND | | | GLOBAL OPPORTUNITIES FUND | | | HERITAGE GROWTH FUND | | | INTERNATIONAL GROWTH
FUND | |
| | | | | | | | | | | | | | | | | | |
| | | | | | | | | | | | | | | | | | |
| | | | | | | | | | | | | | | | | | |
| $ | 1,392,792,009 | | | $ | 286,906,951 | | | $ | 138,665,258 | | | $ | 81,210,643 | | | $ | 652,638,579 | |
| | 70,492,421 | | | | 23,689,647 | | | | 6,545,903 | | | | 9,003,455 | | | | 50,924,585 | |
| | | | | | | | | | | | | | | | | | |
| $ | 1,463,284,430 | | | $ | 310,596,598 | | | $ | 145,211,161 | | | $ | 90,214,098 | | | $ | 703,563,164 | |
| | | | | | | | | | | | | | | | | | |
| | | | | | | | | | | | | | | | | | |
| $ | 1,794,172,060 | | | $ | 323,011,469 | | | $ | 191,041,150 | | | $ | 111,402,049 | | | $ | 815,352,129 | |
| | 70,492,421 | | | | 23,689,647 | | | | 6,545,903 | | | | 9,003,455 | | | | 50,924,585 | |
| | | | | | | | | | | | | | | | | | |
| | 1,864,664,481 | | | | 346,701,116 | | | | 197,587,053 | | | | 120,405,504 | | | | 866,276,714 | |
| | 1,531,150 | | | | 4,722,361 | | | | 738,443 | | | | 17,185 | | | | 1,312,649 | |
|
4,671,131 |
| |
|
— |
| |
|
3,301 |
| |
|
— |
| |
|
16,347 |
|
| | 11,471,530 | | | | 8,459 | | | | — | | | | — | | | | 6,122,216 | |
| | 12,391,786 | | | | 4,669,474 | | | | 203,689 | | | | 27,622 | | | | 24,642,681 | |
| | 3,029,423 | | | | 949,414 | | | | 270,564 | | | | 23,219 | | | | 1,856,957 | |
| | 72,714 | | | | 60,135 | | | | 19,286 | | | | 8,763 | | | | 91,543 | |
| | | | | | | | | | | | | | | | | | |
| | 1,897,832,215 | | | | 357,110,959 | | | | 198,822,336 | | | | 120,482,293 | | | | 900,319,107 | |
| | | | | | | | | | | | | | | | | | |
| | | | | | | | | | | | | | | | | | |
|
— |
| |
|
236,469 |
| |
|
— |
| |
|
— |
| |
|
— |
|
| | 8,763,137 | | | | 9,585,602 | | | | 8 | | | | 92,772 | | | | 26,818,307 | |
| | 1,908,451 | | | | 267,661 | | | | 11,096 | | | | 109,894 | | | | 273,290 | |
| | 2,548,539 | | | | 459,672 | | | | 251,256 | | | | 67,585 | | | | 873,057 | |
| | 45,021 | | | | 7,192 | | | | 4,849 | | | | 3,022 | | | | 19,405 | |
| | 571,806 | | | | 23,954 | | | | 64,827 | | | | 58,170 | | | | 138,455 | |
| | 11,533,738 | | | | 197,031 | | | | 9,437 | | | | — | | | | 199,344 | |
| | | | | | | | | | | | | | | | | | |
| | 25,370,692 | | | | 10,777,581 | | | | 341,473 | | | | 331,443 | | | | 28,321,858 | |
| | | | | | | | | | | | | | | | | | |
| $ | 1,872,461,523 | | | $ | 346,333,378 | | | $ | 198,480,863 | | | $ | 120,150,850 | | | $ | 871,997,249 | |
| | | | | | | | | | | | | | | | | | |
| | | | | | | | | | | | | | | | | | |
| $ | 6,361,162 | | | $ | 1,209,407 | | | $ | 472,520 | | | $ | 89,072 | | | $ | 335,769 | |
| | 1,535,052,682 | | | | 310,300,533 | | | | 135,483,316 | | | | 89,920,192 | | | | 706,149,987 | |
| | (11,052,627 | ) | | | (682,937 | ) | | | (1,633,056 | ) | | | (260,814 | ) | | | (2,391,956 | ) |
| | (47,744,531 | ) | | | (403,366 | ) | | | 11,790,711 | | | | 210,994 | | | | 5,389,362 | |
| | 389,844,837 | | | | 35,909,741 | | | | 52,367,372 | | | | 30,191,406 | | | | 162,514,087 | |
| | | | | | | | | | | | | | | | | | |
| $ | 1,872,461,523 | | | $ | 346,333,378 | | | $ | 198,480,863 | | | $ | 120,150,850 | | | $ | 871,997,249 | |
| | | | | | | | | | | | | | | | | | |
| | | | | | | | | | | | | | | | | | |
| | 1,872,461,523 | | | | 346,333,378 | | | | 198,480,863 | | | | 120,150,850 | | | | 871,997,249 | |
| | — | | | | — | | | | — | | | | — | | | | — | |
| | | | |
| | | | | | | | | | | | | | | | | | |
| | 636,116,192 | | | | 120,940,665 | | | | 47,252,027 | | | | 8,907,187 | | | | 33,576,905 | |
| | — | | | | — | | | | — | | | | — | | | | — | |
| | | | |
| | | | | | | | | | | | | | | | | | |
| $ | 2.94 | | | $ | 2.86 | | | $ | 4.20 | | | $ | 13.49 | | | $ | 25.97 | |
| | | | | | | | | | | | | | | | | | |
| $ | — | | | $ | — | | | $ | — | | | $ | — | | | $ | — | |
| | | | | | | | | | | | | | | | | | |
95
| | |
| WASATCH FUNDS — Statements of Assets and Liabilities (continued) | | |
|
|
|
| | | | | | | | | | | | |
| | | INTERNATIONAL
OPPORTUNITIES
FUND | | | LARGE CAP
VALUE FUND | | | LONG/SHORT
FUND | |
| | | | | | | | | | | | |
Assets: | | | | | | | | | | | | |
Investments, at cost | | | | | | | | | | | | |
Unaffiliated issuers | | $ | 169,411,139 | | | $ | 809,265,235 | | | $ | 1,235,620,631 | |
Affiliated issuers1 | | | — | | | | — | | | | 23,760,713 | |
Repurchase agreements | | | 8,399,722 | | | | 100,859,370 | | | | 349,751,080 | |
| | | | | | | | | | | | |
| | $ | 177,810,861 | | | $ | 910,124,605 | | | $ | 1,609,132,424 | |
| | | | | | | | | | | | |
Investments, at market value | | | | | | | | | | | | |
Unaffiliated issuers | | $ | 241,415,989 | | | $ | 1,154,467,288 | | | $ | 1,468,283,283 | |
Affiliated issuers1 | | | — | | | | — | | | | 36,952,272 | |
Repurchase agreements | | | 8,399,722 | | | | 100,859,370 | | | | 349,751,080 | |
| | | | | | | | | | | | |
| | | 249,815,711 | | | | 1,255,326,658 | | | | 1,854,986,635 | |
Cash | | | 114,656 | | | | 197,168 | | | | 237,341 | |
Foreign currency on deposit (cost of $15,326, $0, $0, $0, $0, $31,997, $0 and
$2, respectively) | | | 15,325 | | | | — | | | | — | |
Receivable for investment securities sold | | | 2,714 | | | | 8,389,649 | | | | 27,482,034 | |
Receivable from broker for securities sold short | | | — | | | | — | | | | 176,763,834 | |
Capital shares receivable | | | 194,530 | | | | 1,398,520 | | | | 4,532,036 | |
Interest and dividends receivable | | | 582,579 | | | | 1,310,637 | | | | 1,270,968 | |
Prepaid expenses and other assets | | | 19,278 | | | | 131,020 | | | | 73,984 | |
| | | | | | | | | | | | |
Total Assets | | | 250,744,793 | | | | 1,266,753,652 | | | | 2,065,346,832 | |
| | | | | | | | | | | | |
Liabilities: | | | | | | | | | | | | |
Call options written at value (premiums of $0, $0, $9,815,208, $0, $130,633, $0, $0 and
$0, respectively) | | | — | | | | — | | | | 9,098,678 | |
Securities sold short, at value (proceeds of $0, $0, $166,608,399, $0, $0, $0, $0 and
$0, respectively) | | | — | | | | — | | | | 187,318,797 | |
Payable for securities purchased | | | 1,920,375 | | | | 7,512,320 | | | | 8,509,970 | |
Capital shares payable | | | 160,171 | | | | 1,477,392 | | | | 1,329,150 | |
Dividends payable to shareholders | | | — | | | | 48,425 | | | | — | |
Payable to Advisor | | | 373,486 | | | | 891,309 | | | | 1,707,256 | |
Accrued fund administration fees | | | 5,923 | | | | 31,498 | | | | 45,241 | |
Accrued expenses and other liabilities | | | 138,362 | | | | 518,717 | | | | 248,151 | |
Other payables | | | 186,942 | | | | — | | | | 143,840 | |
| | | | | | | | | | | | |
Total Liabilities | | | 2,785,259 | | | | 10,479,661 | | | | 208,401,083 | |
| | | | | | | | | | | | |
Net Assets | | $ | 247,959,534 | | | $ | 1,256,273,991 | | | $ | 1,856,945,749 | |
| | | | | | | | | | | | |
Net Assets Consist of: | | | | | | | | | | | | |
Capital stock | | $ | 866,783 | | | $ | 798,266 | | | $ | 1,220,584 | |
Paid-in-capital in excess of par | | | 177,348,879 | | | | 879,297,392 | | | | 1,582,363,496 | |
Undistributed net investment income (loss) | | | (1,191,329 | ) | | | 62,809 | | | | (3,018,671 | ) |
Undistributed net realized gain (loss) on investments, options and foreign
currency translations | | | (871,944 | ) | | | 30,913,471 | | | | 50,519,997 | |
Net unrealized appreciation on investments, options and foreign currency translations | | | 71,807,145 | | | | 345,202,053 | | | | 225,860,343 | |
| | | | | | | | | | | | |
Net Assets | | $ | 247,959,534 | | | $ | 1,256,273,991 | | | $ | 1,856,945,749 | |
| | | | | | | | | | | | |
Net Assets | | | | | | | | | | | | |
Investor Class | | | 247,959,534 | | | | 1,241,622,043 | | | | 1,512,994,152 | |
Institutional Class | | | — | | | | 14,651,948 | | | | 343,951,597 | 2 |
| | | |
Capital Stock Issued and Outstanding (Unlimited number of shares authorized,
$.01 par value) | | | | | | | | | | | | |
Investor Class | | | 86,678,291 | | | | 78,895,431 | | | | 99,450,075 | |
Institutional Class | | | — | | | | 931,174 | | | | 22,608,333 | 2 |
| | | |
NET ASSET VALUE, REDEMPTION PRICEAND OFFERING
PRICE PER SHARE | | | | | | | | | | | | |
Investor Class | | $ | 2.86 | | | $ | 15.74 | | | $ | 15.21 | |
| | | | | | | | | | | | |
Institutional Class | | $ | — | | | $ | 15.73 | | | $ | 15.21 | 2 |
| | | | | | | | | | | | |
| 1See | Note 10 for information on affiliated issuers. |
| 2Institutional | Class inception date was December 13, 2012. |
See Notes to Financial Statements.
96
| | |
| | MARCH 31, 2013 (UNAUDITED) |
|
|
|
| | | | | | | | | | | | | | | | | | |
MICRO CAP
FUND | | | MICRO CAP
VALUE FUND | | | SMALL CAP
GROWTH FUND | | | SMALL CAP
VALUE FUND | | | STRATEGIC
INCOME
FUND | |
| | | | | | | | | | | | | | | | | | |
| | | | | | | | | | | | | | | | | | |
| | | | | | | | | | | | | | | | | | |
| $ | 189,708,936 | | | $ | 102,697,745 | | | $ | 1,115,258,368 | | | $ | 140,438,370 | | | $ | 40,224,626 | |
| | 1,540,000 | | | | — | | | | 138,323,807 | | | | — | | | | — | |
| | 13,170,345 | | | | 9,877,259 | | | | 183,848,636 | | | | 4,391,011 | | | | 4,986,746 | |
| | | | | | | | | | | | | | | | | | |
| $ | 204,419,281 | | | $ | 112,575,004 | | | $ | 1,437,430,811 | | | $ | 144,829,381 | | | $ | 45,211,372 | |
| | | | | | | | | | | | | | | | | | |
| | | | | | | | | | | | | | | | | | |
| $ | 275,207,527 | | | $ | 138,369,479 | | | $ | 1,772,856,332 | | | $ | 183,485,504 | | | $ | 48,705,682 | |
| | 50,820 | | | | — | | | | 135,678,964 | | | | — | | | | — | |
| | 13,170,345 | | | | 9,877,259 | | | | 183,848,636 | | | | 4,391,011 | | | | 4,986,746 | |
| | | | | | | | | | | | | | | | | | |
| | 288,428,692 | | | | 148,246,738 | | | | 2,092,383,932 | | | | 187,876,515 | | | | 53,692,428 | |
| | 18,121 | | | | 6,475 | | | | 388,276 | | | | 26,064 | | | | 7,273 | |
| | — | | | | — | | | | 32,002 | | | | — | | | | 2 | |
| | 1,093 | | | | 24,980 | | | | — | | | | — | | | | — | |
| | — | | | | — | | | | — | | | | — | | | | — | |
| | 27,703 | | | | 48,334 | | | | 2,364,451 | | | | 50,657 | | | | 16,171 | |
| | 68,547 | | | | 143,264 | | | | 557,937 | | | | 73,050 | | | | 190,529 | |
| | 16,169 | | | | 9,505 | | | | 84,933 | | | | 21,670 | | | | 13,042 | |
| | | | | | | | | | | | | | | | | | |
| | 288,560,325 | | | | 148,479,296 | | | | 2,095,811,531 | | | | 188,047,956 | | | | 53,919,445 | |
| | | | | | | | | | | | | | | | | | |
| | | | | | | | | | | | | | | | | | |
| | — | | | | 191,800 | | | | — | | | | — | | | | — | |
| | | | |
| | — | | | | — | | | | — | | | | — | | | | — | |
| | — | | | | 733,196 | | | | 4,243,423 | | | | 756,930 | | | | — | |
| | 174,451 | | | | 401,492 | | | | 1,107,412 | | | | 279,141 | | | | 403,419 | |
| | — | | | | — | | | | — | | | | — | | | | 11,486 | |
| | 473,566 | | | | 243,335 | | | | 1,761,477 | | | | 154,966 | | | | 26,452 | |
| | 7,171 | | | | 3,621 | | | | 51,187 | | | | 4,672 | | | | 1,320 | |
| | 75,888 | | | | 66,522 | | | | 673,155 | | | | 87,372 | | | | 25,630 | |
| | 82,243 | | | | 160,729 | | | | 87,824 | | | | 84,938 | | | | — | |
| | | | | | | | | | | | | | | | | | |
| | 813,319 | | | | 1,800,695 | | | | 7,924,478 | | | | 1,368,019 | | | | 468,307 | |
| | | | | | | | | | | | | | | | | | |
| $ | 287,747,006 | | | $ | 146,678,601 | | | $ | 2,087,887,053 | | | $ | 186,679,937 | | | $ | 53,451,138 | |
| | | | | | | | | | | | | | | | | | |
| | | | | | | | | | | | | | | | | | |
| $ | 465,219 | | | $ | 488,485 | | | $ | 463,464 | | | $ | 421,639 | | | $ | 51,833 | |
| | 241,453,282 | | | | 97,525,080 | | | | 1,425,010,752 | | | | 233,239,667 | | | | 50,013,836 | |
| | (5,643,006 | ) | | | (1,393,594 | ) | | | (9,007,651 | ) | | | (714,076 | ) | | | (218,382 | ) |
| (32,455,693 | ) | | | 14,614,986 | | | | 16,553,313 | | | | (89,229,489 | ) | | | (4,877,255 | ) |
| | 83,927,204 | | | | 35,443,644 | | | | 654,867,175 | | | | 42,962,196 | | | | 8,481,106 | |
| | | | | | | | | | | | | | | | | | |
| $ | 287,747,006 | | | $ | 146,678,601 | | | $ | 2,087,887,053 | | | $ | 186,679,937 | | | $ | 53,451,138 | |
| | | | | | | | | | | | | | | | | | |
| | | | | | | | | | | | | | | | | | |
| | 287,747,006 | | | | 146,678,601 | | | | 2,087,887,053 | | | | 178,404,671 | | | | 53,451,138 | |
| | — | | | | — | | | | — | | | | 8,275,266 | | | | — | |
| | | | |
| | | | | | | | | | | | | | | | | | |
| | 46,521,905 | | | | 48,848,530 | | | | 46,346,375 | | | | 40,300,785 | | | | 5,183,277 | |
| | — | | | | — | | | | — | | | | 1,863,120 | | | | — | |
| | | | |
| | | | | | | | | | | | | | | | | | |
| $ | 6.19 | | | $ | 3.00 | | | $ | 45.05 | | | $ | 4.43 | | | $ | 10.31 | |
| | | | | | | | | | | | | | | | | | |
| $ | — | | | $ | — | | | $ | — | | | $ | 4.44 | | | $ | — | |
| | | | | | | | | | | | | | | | | | |
97
| | |
| WASATCH FUNDS — Statements of Assets and Liabilities (continued) | | MARCH 31, 2013 (UNAUDITED) |
|
|
|
| | | | | | | | | | | | | | | | |
| | | ULTRA GROWTH FUND | | | WORLD INNOVATORS FUND | | | INCOME FUND | | | U.S. TREASURY FUND | |
| | | | | | | | | | | | | | | | |
Assets: | | | | | | | | | | | | | | | | |
Investments, at cost | | | | | | | | | | | | | | | | |
Unaffiliated issuers | | $ | 115,404,481 | | | $ | 147,503,551 | | | $ | 128,626,193 | | | $ | 210,889,121 | |
Repurchase agreements | | | 1,097,751 | | | | 15,152,120 | | | | 1,291,605 | | | | 1,841,807 | |
| | | | | | | | | | | | | | | | |
| | $ | 116,502,232 | | | $ | 162,655,671 | | | $ | 129,917,798 | | | $ | 212,730,928 | |
| | | | | | | | | | | | | | | | |
Investments, at market value | | | | | | | | | | | | | | | | |
Unaffiliated issuers | | $ | 139,792,816 | | | $ | 178,457,160 | | | $ | 132,744,900 | | | $ | 233,399,806 | |
Repurchase agreements | | | 1,097,751 | | | | 15,152,120 | | | | 1,291,605 | | | | 1,841,807 | |
| | | | | | | | | | | | | | | | |
| | | 140,890,567 | | | | 193,609,280 | | | | 134,036,505 | | | | 235,241,613 | |
Cash | | | 13,670 | | | | — | | | | 1,939 | | | | — | |
Foreign currency on deposit (cost of $0, $8,440, $0 and $0, respectively) | | | — | | | | 8,440 | | | | — | | | | — | |
Receivable for investment securities sold | | | 155,059 | | | | 89,009 | | | | 2,871,044 | | | | — | |
Capital shares receivable | | | 17,610 | | | | 298,937 | | | | 52,459 | | | | 6,383,663 | |
Interest and dividends receivable | | | 40,664 | | | | 169,699 | | | | 967,477 | | | | 1,086,882 | |
Prepaid expenses and other assets | | | 14,287 | | | | 22,879 | | | | 22,796 | | | | 28,029 | |
| | | | | | | | | | | | | | | | |
Total Assets | | | 141,131,857 | | | | 194,198,244 | | | | 137,952,220 | | | | 242,740,187 | |
| | | | | | | | | | | | | | | | |
Liabilities: | | | | | | | | | | | | | | | | |
Payable for securities purchased | | | 143,739 | | | | 33 | | | | 3,547,048 | | | | — | |
Capital shares payable | | | 228,778 | | | | 95,563 | | | | 44,728 | | | | 267,709 | |
Dividends payable to shareholders | | | — | | | | — | | | | 37,559 | | | | 152,885 | |
Payable to Advisor | | | 119,846 | | | | 248,195 | | | | 62,646 | | | | 99,259 | |
Accrued fund administration fees | | | 3,526 | | | | 4,834 | | | | 3,406 | | | | 6,017 | |
Accrued expenses and other liabilities | | | 64,986 | | | | 77,976 | | | | 42,484 | | | | 75,976 | |
| | | | | | | | | | | | | | | | |
Total Liabilities | | | 560,875 | | | | 426,601 | | | | 3,737,871 | | | | 601,846 | |
| | | | | | | | | | | | | | | | |
Net Assets | | $ | 140,570,982 | | | $ | 193,771,643 | | | $ | 134,214,349 | | | $ | 242,138,341 | |
| | | | | | | | | | | | | | | | |
Net Assets Consist of: | | | | | | | | | | | | | | | | |
Capital stock | | $ | 65,494 | | | $ | 96,525 | | | $ | 129,261 | | | $ | 140,338 | |
Paid-in-capital in excess of par | | | 110,772,179 | | | | 169,548,716 | | | | 130,379,262 | | | | 221,577,298 | |
Undistributed net investment income (loss) | | | 530,772 | | | | (1,518,671 | ) | | | 11,477 | | | | (133 | ) |
Undistributed net realized gain (loss) on investments and foreign currency translations | | | 4,814,012 | | | | (5,306,297 | ) | | | (424,358 | ) | | | (2,089,847 | ) |
Net unrealized appreciation on investments and foreign currency translations | | | 24,388,525 | | | | 30,951,370 | | | | 4,118,707 | | | | 22,510,685 | |
| | | | | | | | | | | | | | | | |
Net Assets | | $ | 140,570,982 | | | $ | 193,771,643 | | | $ | 134,214,349 | | | $ | 242,138,341 | |
| | | | | | | | | | | | | | | | |
Net Assets | | | | | | | | | | | | | | | | |
Investor Class | | | 140,570,982 | | | | 193,771,643 | | | | 134,214,349 | | | | 242,138,341 | |
Institutional Class | | | — | | | | — | | | | — | | | | — | |
| | | | |
Capital Stock Issued and Outstanding (Unlimited number of shares authorized, $.01 par value) | | | | | | | | | | | | | | | | |
Investor Class | | | 6,549,355 | | | | 9,652,473 | | | | 12,926,089 | | | | 14,033,833 | |
Institutional Class | | | — | | | | — | | | | — | | | | — | |
| | | | |
NET ASSET VALUE, REDEMPTION PRICEAND OFFERING PRICE
PER SHARE | | | | | | | | | | | | | | | | |
Investor Class | | $ | 21.46 | | | $ | 20.07 | | | $ | 10.38 | | | $ | 17.25 | |
| | | | | | | | | | | | | | | | |
Institutional Class | | $ | — | | | $ | — | | | $ | — | | | $ | — | |
| | | | | | | | | | | | | | | | |
See Notes to Financial Statements.
98
(This page intentionally left blank.)
99
| | |
| WASATCH FUNDS — Statements of Operations | | |
|
|
|
| | | | | | | | | | | | |
| | | CORE
GROWTH
FUND | | | EMERGING
INDIA
FUND | | | EMERGING
MARKETS
SELECT
FUND1 | |
| | | | | | | | | | | | |
Investment Income: | | | | | | | | | | | | |
Interest | | $ | 2,827 | | | $ | 26 | | | $ | 52 | |
Dividends2 | | | | | | | | | | | | |
Unaffiliated issuers | | | 2,608,046 | | | | 34,045 | | | | 40,896 | |
| | | | | | | | | | | | |
Total investment income | | | 2,610,873 | | | | 34,071 | | | | 40,948 | |
| | | | | | | | | | | | |
Expenses: | | | | | | | | | | | | |
Investment advisory fees | | | 3,294,474 | | | | 114,744 | | | | 53,125 | |
Shareholder servicing fees — Investor Class | | | 406,650 | | | | 27,037 | | | | 18,288 | |
Shareholder servicing fees — Institutional Class | | | 6,170 | | | | — | | | | 6,647 | |
Fund administration fees | | | 51,694 | | | | 1,201 | | | | 679 | |
Fund accounting fees | | | 35,558 | | | | 12,949 | | | | 6,750 | |
Reports to shareholders — Investor Class | | | 41,341 | | | | 1,728 | | | | 884 | |
Reports to shareholders — Institutional Class | | | 1,120 | | | | — | | | | 114 | |
Custody fees | | | 44,504 | | | | 21,068 | | | | 9,515 | |
Federal and state registration fees — Investor Class | | | 31,541 | | | | 9,811 | | | | 1,911 | |
Federal and state registration fees — Institutional Class | | | 10,977 | | | | — | | | | 48 | |
Legal fees | | | 10,281 | | | | 224 | | | | 404 | |
Trustees’ fees | | | 25,860 | | | | 600 | | | | 797 | |
Interest | | | 2,431 | | | | 342 | | | | 108 | |
Offering and organization costs | | | — | | | | — | | | | 31,091 | |
Audit fees | | | 10,617 | | | | 11,485 | | | | 8,319 | |
Other expenses | | | 17,181 | 3 | | | 4,198 | | | | 4,043 | 4 |
| | | | | | | | | | | | |
Total expenses before reimbursement | | | 3,990,399 | | | | 205,387 | | | | 142,723 | |
Reimbursement of expenses by Advisor | | | (15,093 | ) | | | (55,878 | ) | | | (71,336 | ) |
| | | | | | | | | | | | |
Net Expenses | | | 3,975,306 | | | | 149,509 | | | | 71,387 | |
| | | | | | | | | | | | |
Net Investment Income (Loss) | | | (1,364,433 | ) | | | (115,438 | ) | | | (30,439 | ) |
| | | | | | | | | | | | |
Realized and Unrealized Gain (Loss): | | | | | | | | | | | | |
Net realized gain (loss) on investments and foreign currency translations | | | | | | | | | | | | |
Unaffiliated issuers | | | 10,646,352 | | | | (427,161 | ) | | | (280,777 | ) |
Net realized gain on options | | | 150,916 | | | | — | | | | — | |
Realized foreign capital gains taxes | | | — | | | | — | | | | — | |
Change in unrealized appreciation on
investments, options and foreign currency translations | | | 65,347,684 | | | | 1,789 | | | | 701,179 | |
Change in deferred foreign capital gains taxes | | | (35,103 | ) | | | 64,914 | | | | (4,906 | ) |
| | | | | | | | | | | | |
Net gain (loss) on investments | | | 76,109,849 | | | | (360,458 | ) | | | 415,496 | |
| | | | | | | | | | | | |
Net Increase (Decrease) in Net Assets Resulting from Operations | | $ | 74,745,416 | | | $ | (475,896 | ) | | $ | 385,057 | |
| | | | | | | | | | | | |
| 1 | Fund inception date was December 13, 2012. |
| 2 | Net of $71,640, $0, $10,140, $1,514,007, $201,046, $39,073, $7,536 and $234,854 in foreign withholding taxes, respectively. |
| 3 | Includes class specific expenses of $237 for Investor and $228 for Institutional classes. |
| 4 | Includes class specific expenses of $78 for Investor and Institutional classes. |
See Notes to Financial Statements.
100
| | |
| | MARCH 31, 2013 (UNAUDITED) |
|
|
|
| | | | | | | | | | | | | | | | | | |
EMERGING
MARKETS
SMALL CAP
FUND | | | FRONTIER
EMERGING
SMALL COUNTRIES
FUND | | | GLOBAL
OPPORTUNITIES
FUND | | | HERITAGE
GROWTH
FUND | | | INTERNATIONAL
GROWTH FUND | |
| | | | | | | | | | | | | | | | | | |
| | | | | | | | | | | | | | | | | | |
| $ | 2,537 | | | $ | 971 | | | $ | 266 | | | $ | 399 | | | $ | 1,663 | |
| | | | | | | | | | | | | | | | | | |
| | 12,703,567 | | | | 1,495,430 | | | | 865,946 | | | | 718,898 | | | | 3,537,782 | |
| | | | | | | | | | | | | | | | | | |
| | 12,706,104 | | | | 1,496,401 | | | | 866,212 | | | | 719,297 | | | | 3,539,445 | |
| | | | | | | | | | | | | | | | | | |
| | | | | | | | | | | | | | | | | | |
| | 14,199,582 | | | | 1,635,719 | | | | 1,266,225 | | | | 396,277 | | | | 3,814,035 | |
| | 1,116,909 | | | | 183,259 | | | | 106,218 | | | | 107,288 | | | | 313,068 | |
| | — | | | | — | | | | — | | | | — | | | | — | |
| | 127,370 | | | | 14,627 | | | | 13,248 | | | | 8,891 | | | | 47,817 | |
| | 85,484 | | | | 22,701 | | | | 20,307 | | | | 11,041 | | | | 40,571 | |
| | 108,166 | | | | 29,327 | | | | 16,092 | | | | 8,635 | | | | 34,823 | |
| | — | | | | — | | | | — | | | | — | | | | — | |
| | 916,225 | | | | 197,259 | | | | 34,803 | | | | 3,817 | | | | 165,951 | |
| | 69,184 | | | | 34,712 | | | | 18,879 | | | | 12,822 | | | | 51,351 | |
| | — | | | | — | | | | — | | | | — | | | | — | |
| | 24,964 | | | | 1,819 | | | | 2,736 | | | | 1,873 | | | | 7,975 | |
| | 63,360 | | | | 4,241 | | | | 6,931 | | | | 4,810 | | | | 20,344 | |
| | 5,874 | | | | 506 | | | | 1,327 | | | | 527 | | | | 1,904 | |
| | — | | | | 26,484 | | | | — | | | | — | | | | — | |
| | 11,439 | | | | 12,598 | | | | 11,767 | | | | 11,295 | | | | 11,295 | |
| | 32,935 | | | | 4,336 | | | | 9,759 | | | | 6,055 | | | | 12,850 | |
| | | | | | | | | | | | | | | | | | |
| | 16,761,492 | | | | 2,167,588 | | | | 1,508,292 | | | | 573,331 | | | | 4,521,984 | |
| | (933,227 | ) | | | (64,017 | ) | | | — | | | | (34,999 | ) | | | — | |
| | | | | | | | | | | | | | | | | | |
| | 15,828,265 | | | | 2,103,571 | | | | 1,508,292 | | | | 538,332 | | | | 4,521,984 | |
| | | | | | | | | | | | | | | | | | |
| | (3,122,161 | ) | | | (607,170 | ) | | | (642,080 | ) | | | 180,965 | | | | (982,539 | ) |
| | | | | | | | | | | | | | | | | | |
| | | | | | | | | | | | | | | | | | |
| | | | | | | | | | | | | | | | | | |
| | 17,056,099 | | | | (385,751 | ) | | | 12,128,488 | | | | 878,732 | | | | 38,309,257 | |
| | — | | | | — | | | | — | | | | — | | | | — | |
| | (247,160 | ) | | | (17,713 | ) | | | — | | | | — | | | | (365,096 | ) |
| 162,070,489 | | | | 32,467,269 | | | | 11,041,488 | | | | 9,792,184 | | | | 61,125,922 | |
| | (5,257,943 | ) | | | (134,425 | ) | | | 54,988 | | | | — | | | | 25,726 | |
| | | | | | | | | | | | | | | | | | |
| | 173,621,485 | | | | 31,929,380 | | | | 23,224,964 | | | | 10,670,916 | | | | 99,095,809 | |
| | | | | | | | | | | | | | | | | | |
| $ | 170,499,324 | | | $ | 31,322,210 | | | $ | 22,582,884 | | | $ | 10,851,881 | | | $ | 98,113,270 | |
| | | | | | | | | | | | | | | | | | |
101
| | |
| WASATCH FUNDS — Statements of Operations (continued) | | |
|
|
|
| | | | | | | | | | | | |
| | | INTERNATIONAL
OPPORTUNITIES
FUND | | | LARGE CAP
VALUE FUND | | | LONG/SHORT
FUND | |
| | | | | | | | | | | | |
Investment Income: | | | | | | | | | | | | |
Interest | | $ | 285 | | | $ | 3,275 | | | $ | 17,047 | |
Dividends1 | | | | | | | | | | | | |
Unaffiliated issuers | | | 1,500,793 | | | | 15,276,687 | | | | 10,785,997 | |
Affiliated issuers2 | | | — | | | | — | | | | — | |
| | | | | | | | | | | | |
Total investment income | | | 1,501,078 | | | | 15,279,962 | | | | 10,803,044 | |
| | | | | | | | | | | | |
Expenses: | | | | | | | | | | | | |
Investment advisory fees | | | 2,064,587 | | | | 5,544,887 | | | | 9,062,997 | |
Shareholder servicing fees — Investor Class | | | 276,350 | | | | 1,215,478 | | | | 690,803 | |
Shareholder servicing fees — Institutional Class | | | — | | | | 6,276 | | | | 6,197 | 3 |
Fund administration fees | | | 16,620 | | | | 96,777 | | | | 129,353 | |
Fund accounting fees | | | 24,332 | | | | 59,055 | | | | 77,025 | |
Reports to shareholders — Investor Class | | | 33,368 | | | | 109,330 | | | | 86,125 | |
Reports to shareholders — Institutional Class | | | — | | | | 10,001 | | | | 7,746 | 3 |
Custody fees | | | 89,733 | | | | 16,113 | | | | 40,198 | |
Federal and state registration fees — Investor Class | | | 15,441 | | | | 39,759 | | | | 48,778 | |
Federal and state registration fees — Institutional Class | | | — | | | | 11,141 | | | | 4,783 | 3 |
Legal fees | | | 3,331 | | | | 23,511 | | | | 25,847 | |
Trustees’ fees | | | 8,519 | | | | 58,185 | | | | 65,540 | |
Dividends on securities sold short | | | — | | | | — | | | | 1,785,829 | |
Interest | | | 804 | | | | 5,387 | | | | 142,110 | |
Audit fees | | | 11,294 | | | | 10,472 | | | | 11,294 | |
Other expenses | | | 9,501 | | | | 35,600 | 4 | | | 27,073 | 5 |
| | | | | | | | | | | | |
Total expenses before reimbursement | | | 2,553,880 | | | | 7,241,972 | | | | 12,211,698 | |
Reimbursement of expenses by Advisor | | | (170,860 | ) | | | (468,019 | ) | | | (17,080 | ) |
| | | | | | | | | | | | |
Net Expenses | | | 2,383,020 | | | | 6,773,953 | | | | 12,194,618 | |
| | | | | | | | | | | | |
Net Investment Income (Loss) | | | (881,942 | ) | | | 8,506,009 | | | | (1,391,574 | ) |
| | | | | | | | | | | | |
Realized and Unrealized Gain (Loss): | | | | | | | | | | | | |
Net realized gain (loss) on investments and foreign currency translations | | | | | | | | | | | | |
Unaffiliated issuers | | | 6,139,896 | | | | 43,581,285 | | | | 52,241,511 | |
Affiliated issuers2 | | | — | | | | — | | | | (398,986 | ) |
Net realized gain on options | | | — | | | | — | | | | 10,017,561 | |
Net realized loss on short positions | | | — | | | | — | | | | (6,144,138 | ) |
Realized foreign capital gains taxes | | | — | | | | — | | | | — | |
Change in unrealized appreciation on investments, options and foreign currency translations | | | 31,959,752 | | | | 84,513,965 | | | | 128,315,891 | |
Change in deferred foreign capital gains taxes | | | 43,212 | | | | — | | | | — | |
| | | | | | | | | | | | |
Net gain on investments | | | 38,142,860 | | | | 128,095,250 | | | | 184,031,839 | |
| | | | | | | | | | | | |
Net Increase in Net Assets Resulting from Operations | | $ | 37,260,918 | | | $ | 136,601,259 | | | $ | 182,640,265 | |
| | | | | | | | | | | | |
| 1Net | of $165,318, $84,708, $148,154, $40,008, $15,994, $98,342, $0 and $5,846 in foreign withholding taxes, respectively. |
| 2See | Note 10 for information on affiliated issuers. |
| 3Institutional | Class inception date was December 13, 2012. |
| 4Includes | class specific expenses of $237 for Investor and $228 for Institutional classes. |
| 5Includes | class specific expenses of $116 for Investor and $189 for Institutional classes. |
See Notes to Financial Statements.
102
| | |
| | MARCH 31, 2013 (UNAUDITED) |
|
|
|
| | | | | | | | | | | | | | | | | | |
MICRO CAP FUND | | | MICRO CAP
VALUE FUND | | | SMALL CAP
GROWTH
FUND | | | SMALL CAP
VALUE FUND | | | STRATEGIC
INCOME
FUND | |
| | | | | | | | | | | | | | | | | | |
| | | | | | | | | | | | | | | | | | |
| $ | 574 | | | $ | 363 | | | $ | 8,381 | | | $ | 112 | | | $ | 200 | |
| | | | | | | | | | | | | | | | | | |
| | 1,062,192 | | | | 1,043,098 | | | | 8,159,647 | | | | 1,362,992 | | | | 1,106,072 | |
| | — | | | | — | | | | 2,971,287 | | | | — | | | | — | |
| | | | | | | | | | | | | | | | | | |
| | 1,062,766 | | | | 1,043,461 | | | | 11,139,315 | | | | 1,363,104 | | | | 1,106,272 | |
| | | | | | | | | | | | | | | | | | |
| | | | | | | | | | | | | | | | | | |
| | 2,689,144 | | | | 1,328,312 | | | | 9,418,707 | | | | 881,248 | | | | 167,561 | |
| | 121,822 | | | | 122,514 | | | | 1,462,545 | | | | 139,899 | | | | 39,863 | |
| | — | | | | — | | | | — | | | | 6,038 | | | | — | |
| | 21,659 | | | | 10,699 | | | | 147,867 | | | | 13,838 | | | | 3,757 | |
| | 21,110 | | | | 16,483 | | | | 90,581 | | | | 15,107 | | | | 6,877 | |
| | 15,397 | | | | 12,389 | | | | 151,606 | | | | 14,266 | | | | 2,957 | |
| | — | | | | — | | | | — | | | | 769 | | | | — | |
| | 35,570 | | | | 17,599 | | | | 189,183 | | | | 26,024 | | | | 991 | |
| | 12,402 | | | | 9,850 | | | | 60,674 | | | | 12,549 | | | | 12,858 | |
| | — | | | | — | | | | — | | | | 10,869 | | | | — | |
| | 4,913 | | | | 2,449 | | | | 30,992 | | | | 3,093 | | | | 728 | |
| | 12,410 | | | | 6,094 | | | | 78,218 | | | | 7,651 | | | | 1,987 | |
| | — | | | | — | | | | — | | | | — | | | | — | |
| | 1,186 | | | | 585 | | | | 7,268 | | | | 795 | | | | 230 | |
| | 11,439 | | | | 11,903 | | | | 11,294 | | | | 10,472 | | | | 11,903 | |
| | 11,795 | | | | 8,694 | | | | 41,594 | | | | 9,833 | 4 | | | 5,715 | |
| | | | | | | | | | | | | | | | | | |
| | 2,958,847 | | | | 1,547,571 | | | | 11,690,529 | | | | 1,152,451 | | | | 255,427 | |
| | — | | | | (14,319 | ) | | | — | | | | (15,885 | ) | | | (27,792 | ) |
| | | | | | | | | | | | | | | | | | |
| | 2,958,847 | | | | 1,533,252 | | | | 11,690,529 | | | | 1,136,566 | | | | 227,635 | |
| | | | | | | | | | | | | | | | | | |
| | (1,896,081 | ) | | | (489,791 | ) | | | (551,214 | ) | | | 226,538 | | | | 878,637 | |
| | | | | | | | | | | | | | | | | | |
| | | | | | | | | | | | | | | | | | |
| | | | | | | | | | | | | | | | | | |
| | 9,387,754 | | | | 16,805,438 | | | | 36,810,453 | | | | 8,662,817 | | | | (261,099 | ) |
| | — | | | | — | | | | — | | | | ��� | | | | — | |
| | — | | | | 163,435 | | | | — | | | | 134,261 | | | | — | |
| | — | | | | — | | | | — | | | | — | | | | — | |
| | — | | | | (227,379 | ) | | | — | | | | — | | | | — | |
|
14,388,970 |
| | | 4,741,424 | | | | 148,684,950 | | | | 17,830,800 | | | | 5,327,486 | |
| | 66,222 | | | | 72,316 | | | | 1,513,905 | | | | 52,642 | | | | — | |
| | | | | | | | | | | | | | | | | | |
| | 23,842,946 | | | | 21,555,234 | | | | 187,009,308 | | | | 26,680,520 | | | | 5,066,387 | |
| | | | | | | | | | | | | | | | | | |
| $ | 21,946,865 | | | $ | 21,065,443 | | | $ | 186,458,094 | | | $ | 26,907,058 | | | $ | 5,945,024 | |
| | | | | | | | | | | | | | | | | | |
103
| | |
| WASATCH FUNDS — Statements of Operations (continued) | | MARCH 31, 2013 (UNAUDITED) |
|
|
|
| | | | | | | | | | | | | | | | |
| | | ULTRA GROWTH FUND | | | WORLD INNOVATORS FUND | | | INCOME FUND | | | U.S. TREASURY FUND | |
| | | | | | | | | | | | | | | | |
Investment Income: | | | | | | | | | | | | | | | | |
Interest | | $ | 38 | | | $ | 758 | | | $ | 1,557,646 | | | $ | 3,923,032 | |
Dividends1 | | | | | | | | | | | | | | | | |
Unaffiliated issuers | | | 1,277,819 | | | | 1,137,534 | | | | 96,387 | | | | — | |
| | | | | | | | | | | | | | | | |
Total investment income | | | 1,277,857 | | | | 1,138,292 | | | | 1,654,033 | | | | 3,923,032 | |
| | | | | | | | | | | | | | | | |
Expenses: | | | | | | | | | | | | | | | | |
Investment advisory fees | | | 679,814 | | | | 1,320,026 | | | | 376,800 | | | | 644,185 | |
Shareholder servicing fees — Investor Class | | | 105,599 | | | | 159,660 | | | | 28,831 | | | | 164,071 | |
Fund administration fees | | | 10,678 | | | | 13,815 | | | | 10,766 | | | | 20,250 | |
Fund accounting fees | | | 16,037 | | | | 16,193 | | | | 21,844 | | | | 14,398 | |
Reports to shareholders — Investor Class | | | 11,242 | | | | 16,960 | | | | 3,229 | | | | 14,390 | |
Custody fees | | | 24,324 | | | | 7,664 | | | | 7,735 | | | | 3,711 | |
Federal and state registration fees — Investor Class | | | 10,848 | | | | 16,561 | | | | 12,106 | | | | 27,048 | |
Legal fees | | | 2,464 | | | | 3,145 | | | | 2,456 | | | | 4,652 | |
Trustees’ fees | | | 6,135 | | | | 6,994 | | | | 6,234 | | | | 11,625 | |
Interest | | | 1,026 | | | | 622 | | | | 635 | | | | 1,128 | |
Audit fees | | | 13,119 | | | | 11,295 | | | | 11,493 | | | | 11,493 | |
Other expenses | | | 8,768 | | | | 8,226 | | | | 4,626 | | | | 6,840 | |
| | | | | | | | | | | | | | | | |
Total Expenses | | | 890,054 | | | | 1,581,161 | | | | 486,755 | | | | 923,791 | |
| | | | | | | | | | | | | | | | |
Net Investment Income (Loss) | | | 387,803 | | | | (442,869 | ) | | | 1,167,278 | | | | 2,999,241 | |
| | | | | | | | | | | | | | | | |
Realized and Unrealized Gain (Loss): | | | | | | | | | | | | | | | | |
Net realized gain (loss) on investments and foreign currency translations
Unaffiliated issuers | | | 6,438,142 | | | | 2,814,417 | | | | 356,495 | | | | (1,582,724 | ) |
Change in unrealized appreciation (depreciation) on investments and foreign currency translations | | | 4,342,356 | | | | 11,700,209 | | | | (1,108,009 | ) | | | (16,192,046 | ) |
Change in deferred foreign capital gains taxes | | | 130,699 | | | | — | | | | — | | | | — | |
| | | | | | | | | | | | | | | | |
Net gain (loss) on investments | | | 10,911,197 | | | | 14,514,626 | | | | (751,514 | ) | | | (17,774,770 | ) |
| | | | | | | | | | | | | | | | |
Net Increase (Decrease) in Net Assets Resulting from Operations | | $ | 11,299,000 | | | $ | 14,071,757 | | | $ | 415,764 | | | $ | (14,775,529 | ) |
| | | | | | | | | | | | | | | | |
| 1 | Net of $664, $35,344, $0 and $0 in foreign withholding taxes, respectively. |
See Notes to Financial Statements.
104
(This page intentionally left blank.)
105
| | |
| WASATCH FUNDS — Statements of Changes in Net Assets | | |
|
|
|
| | | | | | | | | | | | | | | | |
| | | CORE GROWTH FUND | | | EMERGING INDIA FUND | |
| | | Six Months Ended
March 31, 2013
(Unaudited) | | | Year Ended
September 30, 20121 | | | Six Months
Ended
March 31, 2013
(Unaudited) | | | Year Ended
September 30, 2012 | |
| | | | | | | | | | | | | | | | |
Operations: | | | | | | | | | | | | | | | | |
Net investment income (loss) | | $ | (1,364,433 | ) | | $ | (3,651,264 | ) | | $ | (115,438 | ) | | $ | (76,950 | ) |
Net realized gain (loss) on investments, foreign
currency translations and foreign capital gains taxes | | | 10,646,352 | | | | 46,892,618 | | | | (427,161 | ) | | | (814,795 | ) |
Net realized gain on options | | | 150,916 | | | | 178,735 | | | | — | | | | — | |
Change in unrealized appreciation on
investments, options, foreign currency translations
and deferred capital gains | | | 65,312,581 | | | | 75,535,655 | | | | 66,703 | | | | 2,192,373 | |
| | | | | | | | | | | | | | | | |
Net increase (decrease) in net assets resulting from operations | | | 74,745,416 | | | | 118,955,744 | | | | (475,896 | ) | | | 1,300,628 | |
| | | | |
Dividends paid from: | | | | | | | | | | | | | | | | |
Investor Class | | | | | | | | | | | | | | | | |
Net investment income | | | — | | | | — | | | | — | | | | (82,606 | ) |
Net realized gains | | | — | | | | — | | | | — | | | | — | |
| | | | | | | | | | | | | | | | |
| | | — | | | | — | | | | — | | | | (82,606 | ) |
| | | | |
Capital share transactions: | | | | | | | | | | | | | | | | |
Investor Class | | | | | | | | | | | | | | | | |
Shares sold | | | 178,255,045 | | | | 140,556,596 | | | | 6,351,417 | | | | 7,512,543 | |
Shares issued to holders in reinvestment of dividends | | | — | | | | — | | | | — | | | | 80,715 | |
Shares redeemed | | | (70,674,878 | ) | | | (110,766,693 | ) | | | (4,933,138 | ) | | | (5,765,833 | ) |
Redemption fees | | | 81,532 | | | | 22,639 | | | | 1,125 | | | | 32,138 | |
| | | | | | | | | | | | | | | | |
Net increase | | | 107,661,699 | | | | 29,812,542 | | | | 1,419,404 | | | | 1,859,563 | |
| | | | | | | | | | | | | | | | |
Institutional Class | | | | | | | | | | | | | | | | |
Shares sold | | | 6,025,961 | | | | 8,421,536 | | | | — | | | | — | |
Shares redeemed | | | (1,437,229 | ) | | | (11,905 | ) | | | — | | | | — | |
Redemption fees | | | — | | | | — | | | | — | | | | — | |
| | | | | | | | | | | | | | | | |
Net increase | | | 4,588,732 | | | | 8,409,631 | | | | — | | | | — | |
| | | | | | | | | | | | | | | | |
Total increase in net assets | | | 186,995,847 | | | | 157,177,917 | | | | 943,508 | | | | 3,077,585 | |
| | | | |
Net assets: | | | | | | | | | | | | | | | | |
Beginning of period | | | 590,471,604 | | | | 433,293,687 | | | | 13,657,886 | | | | 10,580,301 | |
| | | | | | | | | | | | | | | | |
End of period | | $ | 777,467,451 | | | $ | 590,471,604 | | | $ | 14,601,394 | | | $ | 13,657,886 | |
| | | | | | | | | | | | | | | | |
Undistributed net investment income (loss) included in net assets at end of period | | $ | (4,374,628 | ) | | $ | (3,010,195 | ) | | $ | (275,261 | ) | | $ | (159,823 | ) |
| | | | | | | | | | | | | | | | |
| | | | |
Capital share transactions — shares: | | | | | | | | | | | | | | | | |
Investor Class | | | | | | | | | | | | | | | | |
Shares sold | | | 4,042,848 | | | | 3,632,220 | | | | 3,113,522 | | | | 4,213,059 | |
Shares issued to holders in reinvestment of dividends | | | — | | | | — | | | | — | | | | 52,755 | |
Shares redeemed | | | (1,638,173 | ) | | | (2,872,788 | ) | | | (2,437,801 | ) | | | (3,299,635 | ) |
| | | | | | | | | | | | | | | | |
Net increase in shares outstanding | | | 2,404,675 | | | | 759,432 | | | | 675,721 | | | | 966,179 | |
| | | | | | | | | | | | | | | | |
Institutional Class | | | | | | | | | | | | | | | | |
Shares sold | | | 137,959 | | | | 219,890 | | | | — | | | | — | |
Shares redeemed | | | (33,028 | ) | | | (299 | ) | | | — | | | | — | |
| | | | | | | | | | | | | | | | |
Net increase in shares outstanding | | | 104,931 | | | | 219,591 | | | | — | | | | — | |
| | | | | | | | | | | | | | | | |
| 1 | Institutional Class inception date was January 31, 2012. |
| 2 | Fund inception date was December 13, 2012. |
| 3 | Fund inception date was January 31, 2012. |
See Notes to Financial Statements.
106
| | |
| | MARCH 31, 2013 (UNAUDITED) |
|
|
|
| | | | | | | | | | | | | | | | | | |
EMERGING MARKETS
SELECT FUND | | | EMERGING MARKETS
SMALL CAP FUND | | | FRONTIER EMERGING
SMALL COUNTRIES FUND | |
Period
Ended
March 31, 2013
(Unaudited)2 | | | Six Months
Ended
March 31, 2013
(Unaudited) | | | Year Ended
September 30, 2012 | | | Six Months
Ended
March 31, 2013
(Unaudited) | | | Period Ended
September 30, 20123 | |
| | | | | | | | | | | | | | | | | | |
| | | | | | | | | | | | | | | | | | |
| $ | (30,439 | ) | | $ | (3,122,161 | ) | | $ | 3,292,459 | | | $ | (607,170 | ) | | $ | 126,998 | |
| (280,777 | ) | | | 16,808,939 | | | | (46,995,395 | ) | | | (403,464 | ) | | | (3,877 | ) |
| | — | | | | — | | | | — | | | | — | | | | — | |
| 696,273 | | | | 156,812,546 | | | | 264,780,019 | | | | 32,332,844 | | | | 3,576,897 | |
| | | | | | | | | | | | | | | | | | |
|
385,057 |
| | | 170,499,324 | | | | 221,077,083 | | | | 31,322,210 | | | | 3,700,018 | |
| | | | |
| | | | | | | | | | | | | | | | | | |
| | | | | | | | | | | | | | | | | | |
| | — | | | | (7,553,551 | ) | | | — | | | | (141,701 | ) | | | — | |
| | — | | | | — | | | | — | | | | (57,117 | ) | | | — | |
| | | | | | | | | | | | | | | | | | |
| | — | | | | (7,553,551 | ) | | | — | | | | (198,818 | ) | | | — | |
| | | | |
| | | | | | | | | | | | | | | | | | |
| | | | | | | | | | | | | | | | | | |
| | 22,349,081 | | | | 418,143,975 | | | | 810,878,044 | | | | 298,179,252 | | | | 30,457,825 | |
| | — | | | | 6,807,788 | | | | — | | | | 197,269 | | | | — | |
| | (1,830,088 | ) | | | (197,735,894 | ) | | | (324,158,137 | ) | | | (16,224,622 | ) | | | (1,119,216 | ) |
| | 3,178 | | | | 35,188 | | | | 270,084 | | | | 12,838 | | | | 6,622 | |
| | | | | | | | | | | | | | | | | | |
| | 20,522,171 | | | | 227,251,057 | | | | 486,989,991 | | | | 282,164,737 | | | | 29,345,231 | |
| | | | | | | | | | | | | | | | | | |
| | | | | | | | | | | | | | | | | | |
| | 1,738,896 | | | | — | | | | — | | | | — | | | | — | |
| | (40,296 | ) | | | — | | | | — | | | | — | | | | — | |
| | 200 | | | | — | | | | — | | | | — | | | | — | |
| | | | | | | | | | | | | | | | | | |
| | 1,698,800 | | | | — | | | | — | | | | — | | | | — | |
| | | | | | | | | | | | | | | | | | |
| | 22,606,028 | | | | 390,196,830 | | | | 708,067,074 | | | | 313,288,129 | | | | 33,045,249 | |
| | | | |
| | | | | | | | | | | | | | | | | | |
| | — | | | | 1,482,264,693 | | | | 774,197,619 | | | | 33,045,249 | | | | — | |
| | | | | | | | | | | | | | | | | | |
| $ | 22,606,028 | | | $ | 1,872,461,523 | | | $ | 1,482,264,693 | | | $ | 346,333,378 | | | $ | 33,045,249 | |
| | | | | | | | | | | | | | | | | | |
| | | | |
| $ | (30,439 | ) | | $ | (11,052,627 | ) | | $ | (376,915 | ) | | $ | (682,937 | ) | | $ | 65,934 | |
| | | | | | | | | | | | | | | | | | |
| | | | |
| | | | | | | | | | | | | | | | | | |
| | | | | | | | | | | | | | | | | | |
| | 2,184,251 | | | | 147,938,296 | | | | 331,129,894 | | | | 113,216,985 | | | | 14,198,947 | |
| | — | | | | 2,431,353 | | | | — | | | | 75,293 | | | | — | |
| | (178,904 | ) | | | (70,666,936 | ) | | | (133,758,992 | ) | | | (6,038,804 | ) | | | (511,756 | ) |
| | | | | | | | | | | | | | | | | | |
| | 2,005,347 | | | | 79,702,713 | | | | 197,370,902 | | | | 107,253,474 | | | | 13,687,191 | |
| | | | | | | | | | | | | | | | | | |
| | | | | | | | | | | | | | | | | | |
| | 169,982 | | | | — | | | | — | | | | — | | | | — | |
| | (3,952 | ) | | | — | | | | — | | | | — | | | | — | |
| | | | | | | | | | | | | | | | | | |
| | 166,030 | | | | — | | | | — | | | | — | | | | — | |
| | | | | | | | | | | | | | | | | | |
107
| | |
| WASATCH FUNDS — Statements of Changes in Net Assets (continued) | | |
|
|
|
| | | | | | | | | | | | | | | | |
| | | GLOBAL OPPORTUNITIES FUND | | | HERITAGE GROWTH FUND | |
| | | Six Months
Ended
March 31, 2013
(Unaudited) | | | Year Ended
September 30, 2012 | | | Six Months
Ended
March 31, 2013
(Unaudited) | | | Year Ended
September 30, 2012 | |
| | | | | | | | | | | | | | | | |
Operations: | | | | | | | | | | | | | | | | |
Net investment income (loss) | | $ | (642,080 | ) | | $ | (992,763 | ) | | $ | 180,965 | | | $ | (283,383 | ) |
Net realized gain (loss) on investments, foreign currency translations and foreign capital gains taxes | | | 12,128,488 | | | | 21,874,067 | | | | 878,732 | | | | 4,240,086 | |
Change in unrealized appreciation on investments, foreign currency translations and deferred capital gains taxes | | | 11,096,476 | | | | 18,928,031 | | | | 9,792,184 | | | | 11,559,865 | |
| | | | | | | | | | | | | | | | |
Net increase in net assets resulting from operations | | | 22,582,884 | | | | 39,809,335 | | | | 10,851,881 | | | | 15,516,568 | |
| | | | |
Dividends paid from: | | | | | | | | | | | | | | | | |
Investor Class | | | | | | | | | | | | | | | | |
Net investment income | | | — | | | | — | | | | (106,546 | ) | | | (106,542 | ) |
Net realized gains | | | (17,635,551 | ) | | | (18,174,913 | ) | | | (4,555,183 | ) | | | (990,738 | ) |
| | | | | | | | | | | | | | | | |
| | | (17,635,551 | ) | | | (18,174,913 | ) | | | (4,661,729 | ) | | | (1,097,280 | ) |
Institutional Class | | | | | | | | | | | | | | | | |
Net investment income | | | — | | | | — | | | | — | | | | — | |
Net realized gains | | | — | | | | — | | | | — | | | | — | |
| | | | | | | | | | | | | | | | |
| | | — | | | | — | | | | — | | | | — | |
| | | | |
Capital share transactions: | | | | | | | | | | | | | | | | |
Investor Class | | | | | | | | | | | | | | | | |
Shares sold | | | 48,525,074 | | | | 29,847,635 | | | | 11,663,769 | | | | 47,519,908 | |
Shares issued to holders in reinvestment of dividends | | | 17,450,564 | | | | 18,021,095 | | | | 4,582,284 | | | | 1,072,610 | |
Shares redeemed | | | (26,029,855 | ) | | | (115,783,494 | ) | | | (14,240,331 | ) | | | (23,637,012 | ) |
Redemption fees | | | 5,785 | | | | 7,511 | | | | 2,674 | | | | 16,594 | |
| | | | | | | | | | | | | | | | |
Net increase (decrease) | | | 39,951,568 | | | | (67,907,253 | ) | | | 2,008,396 | | | | 24,972,100 | |
| | | | | | | | | | | | | | | | |
Institutional Class | | | | | | | | | | | | | | | | |
Shares sold | | | — | | | | — | | | | — | | | | — | |
Shares issued to holders in reinvestment of dividends | | | — | | | | — | | | | — | | | | — | |
Shares redeemed | | | — | | | | — | | | | — | | | | — | |
Redemption fees | | | — | | | | — | | | | — | | | | — | |
| | | | | | | | | | | | | | | | |
Net increase (decrease) | | | — | | | | — | | | | — | | | | — | |
| | | | | | | | | | | | | | | | |
Total increase (decrease) in net assets | | | 44,898,901 | | | | (46,272,831 | ) | | | 8,198,548 | | | | 39,391,388 | |
| | | | |
Net assets: | | | | | | | | | | | | | | | | |
Beginning of period | | | 153,581,962 | | | | 199,854,793 | | | | 111,952,302 | | | | 72,560,914 | |
| | | | | | | | | | | | | | | | |
End of period | | $ | 198,480,863 | | | $ | 153,581,962 | | | $ | 120,150,850 | | | $ | 111,952,302 | |
| | | | | | | | | | | | | | | | |
Undistributed net investment income (loss) included in
net assets at end of period | | $ | (1,633,056 | ) | | $ | (990,976 | ) | | $ | (260,814 | ) | | $ | (335,233 | ) |
| | | | | | | | | | | | | | | | |
| | | | |
Capital share transactions — shares: | | | | | | | | | | | | | | | | |
Investor Class | | | | | | | | | | | | | | | | |
Shares sold | | | 12,064,310 | | | | 7,800,853 | | | | 898,505 | | | | 3,844,702 | |
Shares issued to holders in reinvestment of dividends | | | 4,544,418 | | | | 5,223,506 | | | | 370,136 | | | | 90,592 | |
Shares redeemed | | | (6,404,247 | ) | | | (30,223,552 | ) | | | (1,105,205 | ) | | | (1,892,648 | ) |
| | | | | | | | | | | | | | | | |
Net increase (decrease) in shares outstanding | | | 10,204,481 | | | | (17,199,193 | ) | | | 163,436 | | | | 2,042,646 | |
| | | | | | | | | | | | | | | | |
Institutional Class | | | | | | | | | | | | | | | | |
Shares sold | | | — | | | | — | | | | — | | | | — | |
Shares issued to holders in reinvestment of dividends | | | — | | | | — | | | | — | | | | — | |
Shares redeemed | | | — | | | | — | | | | — | | | | — | |
| | | | | | | | | | | | | | | | |
Net increase (decrease) in shares outstanding | | | — | | | | — | | | | — | | | | — | |
| | | | | | | | | | | | | | | | |
| 1 | Institutional Class inception date was January 31, 2012. |
See Notes to Financial Statements.
108
| | |
| | MARCH 31, 2013 (UNAUDITED) |
|
|
|
| | | | | | | | | | | | | | | | | | | | | | |
INTERNATIONAL GROWTH FUND | | | INTERNATIONAL OPPORTUNITIES
FUND | | | LARGE CAP VALUE FUND | |
Six Months Ended March 31, 2013 (Unaudited) | | | Year Ended
September 30, 2012 | | | Six Months
Ended
March 31, 2013 (Unaudited) | | | Year Ended
September 30, 2012 | | | Six Months Ended March 31, 2013
(Unaudited) | | | Year Ended
September 30, 20121 | |
| | | | | | | | | | | | | | | | | | | | | | |
| | | | | | | | | | | | | | | | | | | | | | |
| $ | (982,539 | ) | | $ | 1,653,765 | | | $ | (881,942 | ) | | $ | (286,354 | ) | | $ | 8,506,009 | | | $ | 22,013,646 | |
|
37,944,161 |
| | | (6,264,434 | ) | | | 6,139,896 | | | | (7,282,586 | ) | | | 43,581,285 | | | | 20,729,577 | |
|
61,151,648 |
| | | 91,755,826 | | | | 32,002,964 | | | | 41,909,044 | | | | 84,513,965 | | | | 272,440,099 | |
| | | | | | | | | | | | | | | | | | | | | | |
| | 98,113,270 | | | | 87,145,157 | | | | 37,260,918 | | | | 34,340,104 | | | | 136,601,259 | | | | 315,183,322 | |
| | | | | |
| | | | | | | | | | | | | | | | | | | | | | |
| | | | | | | | | | | | | | | | | | | | | | |
| | (2,056,223 | ) | | | — | | | | — | | | | — | | | | (8,281,143 | ) | | | (21,674,187 | ) |
| | — | | | | — | | | | — | | | | (17,671,323 | ) | | | (10,767,081 | ) | | | — | |
| | | | | | | | | | | | | | | | | | | | | | |
| | (2,056,223 | ) | | | — | | | | — | | | | (17,671,323 | ) | | | (19,048,224 | ) | | | (21,674,187 | ) |
| | | | | | | | | | | | | | | | | | | | | | |
| | — | | | | — | | | | — | | | | — | | | | (101,044 | ) | | | (144,308 | ) |
| | — | | | | — | | | | — | | | | — | | | | (115,116 | ) | | | — | |
| | | | | | | | | | | | | | | | | | | | | | |
| | — | | | | — | | | | — | | | | — | | | | (216,160 | ) | | | (144,308 | ) |
| | | | | |
| | | | | | | | | | | | | | | | | | | | | | |
| | | | | | | | | | | | | | | | | | | | | | |
| | 389,178,575 | | | | 194,601,086 | | | | 33,986,684 | | | | 59,579,463 | | | | 93,859,043 | | | | 294,027,931 | |
| | 1,885,302 | | | | — | | | | — | | | | 17,496,781 | | | | 18,782,620 | | | | 20,774,043 | |
| | (50,031,511 | ) | | | (128,450,040 | ) | | | (17,854,073 | ) | | | (50,757,037 | ) | | | (285,223,436 | ) | | | (855,853,096 | ) |
| | 83,519 | | | | 47,000 | | | | 2,777 | | | | 6,619 | | | | 6,721 | | | | 37,526 | |
| | | | | | | | | | | | | | | | | | | | | | |
| | 341,115,885 | | | | 66,198,046 | | | | 16,135,388 | | | | 26,325,826 | | | | (172,575,052 | ) | | | (541,013,596 | ) |
| | | | | | | | | | | | | | | | | | | | | | |
| | | | | | | | | | | | | | | | | | | | | | |
| | — | | | | — | | | | — | | | | — | | | | 4,224,946 | | | | 22,986,777 | |
| | — | | | | — | | | | — | | | | — | | | | 215,416 | | | | 143,853 | |
| | — | | | | — | | | | — | | | | — | | | | (6,803,939 | ) | | | (8,077,111 | ) |
| | — | | | | — | | | | — | | | | — | | | | 66 | | | | 204 | |
| | | | | | | | | | | | | | | | | | | | | | |
| | — | | | | — | | | | — | | | | — | | | | (2,363,511 | ) | | | 15,053,723 | |
| | | | | | | | | | | | | | | | | | | | | | |
| | 437,172,932 | | | | 153,343,203 | | | | 53,396,306 | | | | 42,994,607 | | | | (57,601,688 | ) | | | (232,595,046 | ) |
| | | | | |
| | | | | | | | | | | | | | | | | | | | | | |
| | 434,824,317 | | | | 281,481,114 | | | | 194,563,228 | | | | 151,568,621 | | | | 1,313,875,679 | | | | 1,546,470,725 | |
| | | | | | | | | | | | | | | | | | | | | | |
| $ | 871,997,249 | | | $ | 434,824,317 | | | $ | 247,959,534 | | | $ | 194,563,228 | | | $ | 1,256,273,991 | | | $ | 1,313,875,679 | |
| | | | | | | | | | | | | | | | | | | | | | |
$ |
(2,391,956 |
) | | $ | 646,806 | | | $ | (1,191,329 | ) | | $ | (309,387 | ) | | $ | 62,809 | | | $ | (61,013 | ) |
| | | | | | | | | | | | | | | | | | | | | | |
| | | | | |
| | | | | | | | | | | | | | | | | | | | | | |
| | | | | | | | | | | | | | | | | | | | | | |
| | 16,214,808 | | | | 9,794,216 | | | | 13,032,488 | | | | 26,671,654 | | | | 6,374,366 | | | | 21,836,354 | |
| | 80,810 | | | | — | | | | — | | | | 9,018,959 | | | | 1,298,564 | | | | 1,514,720 | |
| | (2,095,270 | ) | | | (6,774,979 | ) | | | (6,971,625 | ) | | | (22,822,982 | ) | | | (19,483,958 | ) | | | (63,107,087 | ) |
| | | | | | | | | | | | | | | | | | | | | | |
| | 14,200,348 | | | | 3,019,237 | | | | 6,060,863 | | | | 12,867,631 | | | | (11,811,028 | ) | | | (39,756,013 | ) |
| | | | | | | | | | | | | | | | | | | | | | |
| | | | | | | | | | | | | | | | | | | | | | |
| | — | | | | — | | | | — | | | | — | | | | 294,914 | | | | 1,654,533 | |
| | — | | | | — | | | | — | | | | — | | | | 14,854 | | | | 10,265 | |
| | — | | | | — | | | | — | | | | — | | | | (462,404 | ) | | | (580,988 | ) |
| | | | | | | | | | | | | | | | | | | | | | |
| | — | | | | — | | | | — | | | | — | | | | (152,636 | ) | | | 1,083,810 | |
| | | | | | | | | | | | | | | | | | | | | | |
109
| | |
| WASATCH FUNDS — Statements of Changes in Net Assets (continued) | | |
|
|
|
| | | | | | | | | | | | | | | | |
| | | LONG/SHORT FUND | | | MICRO CAP FUND | |
| | | Six Months Ended March 31, 20131 (Unaudited) | | | Year Ended September 30, 2012 | | | Six Months Ended March 31, 2013 (Unaudited) | | | Year Ended September 30, 2012 | |
| | | | | | | | | | | | | | | | |
Operations: | | | | | | | | | | | | | | | | |
Net investment income (loss) | | $ | (1,391,574 | ) | | $ | (2,303,985 | ) | | $ | (1,896,081 | ) | | $ | (4,324,326 | ) |
Net realized gain on investments, foreign currency translations and foreign capital gains taxes | | | 51,842,525 | | | | 2,447,207 | | | | 9,387,754 | | | | 28,221,257 | |
Net realized gain on options | | | 10,017,561 | | | | 18,320,523 | | | | — | | | | — | |
Net realized loss on short positions | | | (6,144,138 | ) | | | (15,284,249 | ) | | | — | | | | — | |
Change in unrealized appreciation on investments, options, foreign currency translations and deferred capital gains taxes | | | 128,315,891 | | | | 132,606,941 | | | | 14,455,192 | | | | 48,580,355 | |
| | | | | | | | | | | | | | | | |
Net increase in net assets resulting from operations | | | 182,640,265 | | | | 135,786,437 | | | | 21,946,865 | | | | 72,477,286 | |
| | | | |
Dividends paid from: | | | | | | | | | | | | | | | | |
Investor Class | | | | | | | | | | | | | | | | |
Net investment income | | | — | | | | — | | | | — | | | | — | |
Net realized gains | | | (3,814,682 | ) | | | — | | | | — | | | | — | |
| | | | | | | | | | | | | | | | |
| | | (3,814,682 | ) | | | — | | | | — | | | | — | |
Institutional Class | | | | | | | | | | | | | | | | |
Net realized gains | | | (37 | ) | | | — | | | | — | | | | — | |
| | | | | | | | | | | | | | | | |
| | | (37 | ) | | | — | | | | — | | | | — | |
| | | | |
Capital share transactions: | | | | | | | | | | | | | | | | |
Investor Class | | | | | | | | | | | | | | | | |
Shares sold | | | 390,244,723 | | | | 971,122,525 | | | | 10,174,066 | | | | 15,670,851 | |
Shares issued to holders in reinvestment of dividends | | | 3,533,082 | | | | — | | | | — | | | | — | |
Shares redeemed | | | (599,315,357 | ) | | | (403,057,722 | ) | | | (33,823,945 | ) | | | (52,115,506 | ) |
Redemption fees | | | 120,214 | | | | 70,010 | | | | 971 | | | | 1,236 | |
| | | | | | | | | | | | | | | | |
Net increase (decrease) | | | (205,417,338 | ) | | | 568,134,813 | | | | (23,648,908 | ) | | | (36,443,419 | ) |
| | | | | | | | | | | | | | | | |
Institutional Class | | | | | | | | | | | | | | | | |
Shares sold | | | 350,311,931 | | | | — | | | | — | | | | — | |
Shares issued to holders in reinvestment of dividends | | | 36 | | | | — | | | | — | | | | — | |
Shares redeemed | | | (3,994,111 | ) | | | — | | | | — | | | | — | |
Redemption fees | | | — | | | | — | | | | — | | | | — | |
| | | | | | | | | | | | | | | | |
Net increase (decrease) | | | 346,317,856 | | | | — | | | | — | | | | — | |
| | | | | | | | | | | | | | | | |
Total increase (decrease) in net assets | | | 319,726,064 | | | | 703,921,250 | | | | (1,702,043 | ) | | | 36,033,867 | |
| | | | |
Net assets: | | | | | | | | | | | | | | | | |
Beginning of period | | | 1,537,219,685 | | | | 833,298,435 | | | | 289,449,049 | | | | 253,415,182 | |
| | | | | | | | | | | | | | | | |
End of period | | $ | 1,856,945,749 | | | $ | 1,537,219,685 | | | $ | 287,747,006 | | | $ | 289,449,049 | |
| | | | | | | | | | | | | | | | |
Undistributed net investment loss included in
net assets at end of period | | $ | (3,018,671 | ) | | $ | (1,627,098 | ) | | $ | (5,643,006 | ) | | $ | (3,746,925 | ) |
| | | | | | | | | | | | | | | | |
| | | | |
Capital share transactions — shares: | | | | | | | | | | | | | | | | |
Investor Class | | | | | | | | | | | | | | | | |
Shares sold | | | 27,158,239 | | | | 72,737,699 | | | | 1,779,931 | | | | 2,907,199 | |
Shares issued to holders in reinvestment of dividends | | | 255,281 | | | | — | | | | — | | | | — | |
Shares redeemed | | | (40,458,186 | ) | | | (30,538,577 | ) | | | (5,976,396 | ) | | | (9,724,315 | ) |
| | | | | | | | | | | | | | | | |
Net increase (decrease) in shares outstanding | | | (13,044,666 | ) | | | 42,199,122 | | | | (4,196,465 | ) | | | (6,817,116 | ) |
| | | | | | | | | | | | | | | | |
Institutional Class | | | | | | | | | | | | | | | | |
Shares sold | | | 22,871,190 | | | | — | | | | — | | | | — | |
Shares issued to holders in reinvestment of dividends | | | 3 | | | | — | | | | — | | | | — | |
Shares redeemed | | | (262,860 | ) | | | — | | | | — | | | | — | |
| | | | | | | | | | | | | | | | |
Net increase (decrease) in shares outstanding | | | 22,608,333 | | | | — | | | | — | | | | — | |
| | | | | | | | | | | | | | | | |
| 1 | Institutional Class inception date was December 13, 2012. |
| 2 | Institutional Class inception date was January 31, 2012. |
See Notes to Financial Statements.
110
| | |
| | MARCH 31, 2013 (UNAUDITED) |
|
|
|
| | | | | | | | | | | | | | | | | | | | | | |
MICRO CAP VALUE FUND | | | SMALL CAP GROWTH FUND | | | SMALL CAP VALUE FUND | |
Six Months Ended March 31, 2013 (Unaudited) | | | Year Ended September 30, 2012 | | | Six Months Ended March 31, 2013 (Unaudited) | | | Year Ended September 30, 2012 | | | Six Months Ended March 31, 2013 (Unaudited) | | | Year Ended September 30, 20122 | |
| | | | | | | | | | | | | | | | | | | | | | |
| | | | | | | | | | | | | | | | | | | | | | |
| $ | (489,791 | ) | | $ | (1,839,314 | ) | | $ | (551,214 | ) | | $ | (11,879,020 | ) | | $ | 226,538 | | | $ | (1,304,519 | ) |
| 16,578,059 | | | | 10,556,086 | | | | 36,810,453 | | | | 105,991,142 | | | | 8,662,817 | | | | 15,394,264 | |
| | 163,435 | | | | 1,221,805 | | | | — | | | | — | | | | 134,261 | | | | — | |
| | — | | | | — | | | | — | | | | — | | | | — | | | | — | |
| 4,813,740 | | | | 24,893,908 | | | | 150,198,855 | | | | 292,457,219 | | | | 17,883,442 | | | | 20,995,886 | |
| | | | | | | | | | | | | | | | | | | | | | |
| | 21,065,443 | | | | 34,832,485 | | | | 186,458,094 | | | | 386,569,341 | | | | 26,907,058 | | | | 35,085,631 | |
| | | | | |
| | | | | | | | | | | | | | | | | | | | | | |
| | | | | | | | | | | | | | | | | | | | | | |
| | — | | | | — | | | | — | | | | — | | | | — | | | | — | |
| | (12,598,831 | ) | | | — | | | | (120,513,937 | ) | | | (62,046,614 | ) | | | — | | | | — | |
| | | | | | | | | | | | | | | | | | | | | | |
| | (12,598,831 | ) | | | — | | | | (120,513,937 | ) | | | (62,046,614 | ) | | | — | | | | — | |
| | | | | | | | | | | | | | | | | | | | | | |
| | — | | | | — | | | | — | | | | — | | | | — | | | | — | |
| | | | | | | | | | | | | | | | | | | | | | |
| | — | | | | — | | | | — | | | | — | | | | — | | | | — | |
| | | | | |
| | | | | | | | | | | | | | | | | | | | | | |
| | | | | | | | | | | | | | | | | | | | | | |
| | 6,554,873 | | | | 13,004,644 | | | | 245,360,782 | | | | 429,551,711 | | | | 5,227,688 | | | | 9,236,992 | |
| | 12,236,099 | | | | — | | | | 113,588,148 | | | | 60,087,427 | | | | — | | | | — | |
| | (18,882,782 | ) | | | (52,353,934 | ) | | | (161,817,936 | ) | | | (287,432,932 | ) | | | (18,879,787 | ) | | | (47,184,106 | ) |
| | 4,446 | | | | 21,250 | | | | 30,603 | | | | 70,038 | | | | 420 | | | | 4,318 | |
| | | | | | | | | | | | | | | | | | | | | | |
| | (87,364 | ) | | | (39,328,040 | ) | | | 197,161,597 | | | | 202,276,244 | | | | (13,651,679 | ) | | | (37,942,796 | ) |
| | | | | | | | | | | | | | | | | | | | | | |
| | | | | | | | | | | | | | | | | | | | | | |
| | — | | | | — | | | | — | | | | — | | | | 112,219 | | | | 7,200,668 | |
| | — | | | | — | | | | — | | | | — | | | | — | | | | — | |
| | — | | | | — | | | | — | | | | — | | | | (261,201 | ) | | | (171,419 | ) |
| | — | | | | — | | | | — | | | | — | | | | 6 | | | | — | |
| | | | | | | | | | | | | | | | | | | | | | |
| | — | | | | — | | | | — | | | | — | | | | (148,976 | ) | | | 7,029,249 | |
| | | | | | | | | | | | | | | | | | | | | | |
| | 8,379,248 | | | | (4,495,555 | ) | | | 263,105,754 | | | | 526,798,971 | | | | 13,106,403 | | | | 4,172,084 | |
| | | | | |
| | | | | | | | | | | | | | | | | | | | | | |
| | 138,299,353 | | | | 142,794,908 | | | | 1,824,781,299 | | | | 1,297,982,328 | | | | 173,573,534 | | | | 169,401,450 | |
| | | | | | | | | | | | | | | | | | | | | | |
| $ | 146,678,601 | | | $ | 138,299,353 | | | $ | 2,087,887,053 | | | $ | 1,824,781,299 | | | $ | 186,679,937 | | | $ | 173,573,534 | |
| | | | | | | | | | | | | | | | | | | | | | |
$ | (1,393,594 | ) | | $ | (903,803 | ) | | $ | (9,007,651 | ) | | $ | (8,456,437 | ) | | $ | (714,076 | ) | | $ | (940,614 | ) |
| | | | | | | | | | | | | | | | | | | | | | |
| | | | | |
| | | | | | | | | | | | | | | | | | | | | | |
| | | | | | | | | | | | | | | | | | | | | | |
| | 2,307,970 | | | | 5,091,102 | | | | 5,680,127 | | | | 10,467,614 | | | | 1,279,818 | | | | 2,544,182 | |
| | 4,652,509 | | | | — | | | | 2,786,072 | | | | 1,599,772 | | | | — | | | | — | |
| | (6,711,553 | ) | | | (20,097,659 | ) | | | (3,759,076 | ) | | | (7,122,232 | ) | | | (4,689,897 | ) | | | (13,060,631 | ) |
| | | | | | | | | | | | | | | | | | | | | | |
| | 248,926 | | | | (15,006,557 | ) | | | 4,707,123 | | | | 4,945,154 | | | | (3,410,079 | ) | | | (10,516,449 | ) |
| | | | | | | | | | | | | | | | | | | | | | |
| | | | | | | | | | | | | | | | | | | | | | |
| | — | | | | — | | | | — | | | | — | | | | 26,532 | | | | 1,943,378 | |
| | — | | | | — | | | | — | | | | — | | | | — | | | | — | |
| | — | | | | — | | | | — | | | | — | | | | (61,956 | ) | | | (44,834 | ) |
| | | | | | | | | | | | | | | | | | | | | | |
| | — | | | | — | | | | — | | | | — | | | | (35,424 | ) | | | 1,898,544 | |
| | | | | | | | | | | | | | | | | | | | | | |
111
| | |
| WASATCH FUNDS — Statements of Changes in Net Assets (continued) | | |
|
|
|
| | | | | | | | | | | | | | | | |
| | | STRATEGIC INCOME
FUND | | | ULTRA GROWTH
FUND | |
| | | Six Months
Ended
March 31, 2013
(Unaudited) | | | Year Ended
September 30, 2012 | | | Six Months
Ended March 31, 2013
(Unaudited) | | | Year Ended
September 30, 2012 | |
| | | | | | | | | | | | | | | | |
Operations: | | | | | | | | | | | | | | | | |
Net investment income (loss) | | $ | 878,637 | | | $ | 673,632 | | | $ | 387,803 | | | $ | (510,312 | ) |
Net realized gain (loss) on investments and foreign
currency translations | | | (261,099 | ) | | | 2,327,909 | | | | 6,438,142 | | | | 16,871,948 | |
Net realized loss on options | | | — | | | | — | | | | — | | | | — | |
Change in unrealized appreciation (depreciation) on
investments, options, foreign currency translations
and deferred capital gains taxes | | | 5,327,486 | | | | 4,279,665 | | | | 4,473,055 | | | | 9,955,835 | |
| | | | | | | | | | | | | | | | |
Net increase (decrease) in net assets resulting from operations | | | 5,945,024 | | | | 7,281,206 | | | | 11,299,000 | | | | 26,317,471 | |
| | | | |
Dividends paid from: | | | | | | | | | | | | | | | | |
Investor Class | | | | | | | | | | | | | | | | |
Net investment income | | | (878,632 | ) | | | (880,410 | ) | | | — | | | | — | |
Net realized gains | | | — | | | | — | | | | (18,153,849 | ) | | | (7,674,675 | ) |
| | | | | | | | | | | | | | | | |
| | | (878,632 | ) | | | (880,410 | ) | | | (18,153,849 | ) | | | (7,674,675 | ) |
| | | | |
Capital share transactions: | | | | | | | | | | | | | | | | |
Investor Class | | | | | | | | | | | | | | | | |
Shares sold | | | 9,633,634 | | | | 26,915,715 | | | | 3,226,542 | | | | 12,295,837 | |
Shares issued to holders in reinvestment of dividends | | | 860,262 | | | | 858,788 | | | | 17,764,371 | | | | 7,457,542 | |
Shares redeemed | | | (6,746,734 | ) | | | (13,607,700 | ) | | | (16,824,000 | ) | | | (29,345,914 | ) |
Redemption fees | | | 2,162 | | | | 10,489 | | | | 235 | | | | 5,828 | |
| | | | | | | | | | | | | | | | |
Net increase (decrease) | | | 3,749,324 | | | | 14,177,292 | | | | 4,167,148 | | | | (9,586,707 | ) |
| | | | | | | | | | | | | | | | |
Total increase (decrease) in net assets | | | 8,815,716 | | | | 20,578,088 | | | | (2,687,701 | ) | | | 9,056,089 | |
| | | | |
Net assets: | | | | | | | | | | | | | | | | |
Beginning of period | | | 44,635,422 | | | | 24,057,334 | | | | 143,258,683 | | | | 134,202,594 | |
| | | | | | | | | | | | | | | | |
End of period | | $ | 53,451,138 | | | $ | 44,635,422 | | | $ | 140,570,982 | | | $ | 143,258,683 | |
| | | | | | | | | | | | | | | | |
Undistributed net investment income (loss) included
in net assets at end of period | | $ | (218,382 | ) | | $ | (218,387 | ) | | $ | 530,772 | | | $ | 142,969 | |
| | | | | | | | | | | | | | | | |
| | | | |
Capital share transactions — shares: | | | | | | | | | | | | | | | | |
Investor Class | | | | | | | | | | | | | | | | |
Shares sold | | | 991,015 | | | | 3,066,868 | | | | 153,278 | | | | 570,461 | |
Shares issued to holders in reinvestment of dividends | | | 87,507 | | | | 96,411 | | | | 909,128 | | | | 368,820 | |
Shares redeemed | | | (694,528 | ) | | | (1,543,697 | ) | | | (786,994 | ) | | | (1,339,149 | ) |
| | | | | | | | | | | | | | | | |
Net increase (decrease) in shares outstanding | | | 383,994 | | | | 1,619,582 | | | | 275,412 | | | | (399,868 | ) |
| | | | | | | | | | | | | | | | |
See Notes to Financial Statements.
112
| | |
| | MARCH 31, 2013 (UNAUDITED) |
|
|
|
| | | | | | | | | | | | | | | | | | | | | | |
WORLD INNOVATORS
FUND | | | INCOME
FUND | | | U.S. TREASURY
FUND | |
Six Months
Ended
March 31, 2013
(Unaudited) | | | Year Ended
September 30, 2012 | | | Six Months
Ended
March 31, 2013
(Unaudited) | | | Year Ended
September 30, 2012 | | | Six Months
Ended
March 31, 2013
(Unaudited) | | | Year Ended
September 30, 2012 | |
| | | | | | | | | | | | | | | | | | | | | | |
| | | | | | | | | | | | | | | | | | | | | | |
| $ | (442,869 | ) | | $ | (1,133,768 | ) | | $ | 1,167,278 | | | $ | 2,792,946 | | | $ | 2,999,241 | | | $ | 5,618,314 | |
| 2,814,417 | | | | 8,025,638 | | | | 356,495 | | | | 642,885 | | | | (1,582,724 | ) | | | 5,092,087 | |
| | — | | | | (33,758 | ) | | | — | | | | — | | | | — | | | | — | |
| 11,700,209 | | | | 16,559,256 | | | | (1,108,009 | ) | | | 1,042,565 | | | | (16,192,046 | ) | | | 5,530,925 | |
| | | | | | | | | | | | | | | | | | | | | | |
| 14,071,757 | | | | 23,417,368 | | | | 415,764 | | | | 4,478,396 | | | | (14,775,529 | ) | | | 16,241,326 | |
| | | | | |
| | | | | | | | | | | | | | | | | | | | | | |
| | | | | | | | | | | | | | | | | | | | | | |
| | — | | | | — | | | | (1,192,784 | ) | | | (2,775,995 | ) | | | (3,011,421 | ) | | | (5,618,367 | ) |
| | — | | | | — | | | | — | | | | — | | | | (5,092,087 | ) | | | (9,334,135 | ) |
| | | | | | | | | | | | | | | | | | | | | | |
| | — | | | | — | | | | (1,192,784 | ) | | | (2,775,995 | ) | | | (8,103,508 | ) | | | (14,952,502 | ) |
| | | | | |
| | | | | | | | | | | | | | | | | | | | | | |
| | | | | | | | | | | | | | | | | | | | | | |
| | 45,763,041 | | | | 91,278,636 | | | | 15,987,329 | | | | 48,029,640 | | | | 86,790,765 | | | | 202,065,443 | |
| | — | | | | — | | | | 969,683 | | | | 2,287,850 | | | | 7,432,253 | | | | 13,752,669 | |
| | (34,015,767 | ) | | | (19,268,178 | ) | | | (21,152,642 | ) | | | (48,462,084 | ) | | | (100,769,567 | ) | | | (133,158,322 | ) |
| | 18,702 | | | | 13,117 | | | | 820 | | | | 11,497 | | | | 69,057 | | | | 177,952 | |
| | | | | | | | | | | | | | | | | | | | | | |
| | 11,765,976 | | | | 72,023,575 | | | | (4,194,810 | ) | | | 1,866,903 | | | | (6,477,492 | ) | | | 82,837,742 | |
| | | | | | | | | | | | | | | | | | | | | | |
| | 25,837,733 | | | | 95,440,943 | | | | (4,971,830 | ) | | | 3,569,304 | | | | (29,356,529 | ) | | | 84,126,566 | |
| | | | | |
| | | | | | | | | | | | | | | | | | | | | | |
| | 167,933,910 | | | | 72,492,967 | | | | 139,186,179 | | | | 135,616,875 | | | | 271,494,870 | | | | 187,368,304 | |
| | | | | | | | | | | | | | | | | | | | | | |
| $ | 193,771,643 | | | $ | 167,933,910 | | | $ | 134,214,349 | | | $ | 139,186,179 | | | $ | 242,138,341 | | | $ | 271,494,870 | |
| | | | | | | | | | | | | | | | | | | | | | |
| | | | | |
| $ | (1,518,671 | ) | | $ | (1,075,802 | ) | | $ | 11,477 | | | $ | 36,983 | | | $ | (133 | ) | | $ | 12,047 | |
| | | | | | | | | | | | | | | | | | | | | | |
| | | | | |
| | | | | | | | | | | | | | | | | | | | | | |
| | | | | | | | | | | | | | | | | | | | | | |
| | 2,391,707 | | | | 5,247,433 | | | | 1,537,456 | | | | 4,642,038 | | | | 4,783,744 | | | | 11,006,306 | |
| | — | | | | — | | | | 93,256 | | | | 221,079 | | | | 411,806 | | | | 754,268 | |
| | (1,790,148 | ) | | | (1,125,535 | ) | | | (2,035,440 | ) | | | (4,677,451 | ) | | | (5,638,516 | ) | | | (7,277,900 | ) |
| | | | | | | | | | | | | | | | | | | | | | |
| | 601,559 | | | | 4,121,898 | | | | (404,728 | ) | | | 185,666 | | | | (442,966 | ) | | | 4,482,674 | |
| | | | | | | | | | | | | | | | | | | | | | |
113
| | |
| WASATCH FUNDS — Financial Highlights | | |
|
|
|
| | | | | | | | | | | | | | | | | | | | | | | | | | | | | | | | |
| | | | | | Income (Loss) from
Investment Operations | | | | | | | | | Less Distributions | | | | |
| | | Net Asset Value Beginning of Period | | | Net Investment Income (Loss) | | | Net Realized and Unrealized Gains (Losses)
on Investments | | | Total from
Investment
Operations | | | Redemption
Fees (See Note 2) | | | Dividends from Net Investment Income | | | Distributions from Net Realized Gains | | | Total Distributions | |
Core Growth Fund — Investor Class | | | | | | | | | | | | | | | | | | | | | | | | | | | | | | | | |
Six Months ended 3/31/13 (unaudited) | | $ | 41.41 | | | | (0.05 | ) | | | 5.00 | | | | 4.95 | | | | 0.01 | | | | — | | | | — | | | | — | |
Year ended 9/30/12 | | $ | 32.63 | | | | (0.26 | ) | | | 9.04 | | | | 8.78 | | | | — | 4 | | | — | | | | — | | | | — | |
Year ended 9/30/11 | | $ | 29.95 | | | | (0.19 | ) | | | 2.87 | | | | 2.68 | | | | — | 4 | | | — | | | | — | | | | — | |
Year ended 9/30/10 | | $ | 25.88 | | | | 0.03 | | | | 4.05 | | | | 4.08 | | | | — | 4 | | | (0.01 | ) | | | — | | | | (0.01 | ) |
Year ended 9/30/09 | | $ | 26.38 | | | | — | 4 | | | (0.23 | ) | | | (0.23 | ) | | | — | 4 | | | (0.27 | ) | | | — | | | | (0.27 | ) |
Year ended 9/30/08 | | $ | 42.98 | | | | 0.19 | | | | (8.98 | ) | | | (8.79 | ) | | | — | 4 | | | — | | | | (7.81 | ) | | | (7.81 | ) |
Core Growth Fund — Institutional Class | | | | | | | | | | | | | | | | | | | | | | | | | | | | | | | | |
Six Months ended 3/31/13 (unaudited) | | $ | 41.44 | | | | (0.02 | ) | | | 5.00 | | | | 4.98 | | | | — | | | | — | | | | — | | | | — | |
Period ended 9/30/129 | | $ | 38.32 | | | | (0.16 | ) | | | 3.28 | | | | 3.12 | | | | — | | | | — | | | | — | | | | — | |
Emerging India Fund | | | | | | | | | | | | | | | | | | | | | | | | | | | | | | | | |
Six Months ended 3/31/13 (unaudited) | | $ | 2.02 | | | | (0.01 | ) | | | (0.05 | ) | | | (0.06 | ) | | | — | 4 | | | — | | | | — | | | | — | |
Year ended 9/30/12 | | $ | 1.83 | | | | (0.01 | ) | | | 0.21 | | | | 0.20 | | | | — | 4 | | | (0.01 | ) | | | — | | | | (0.01 | ) |
Period ended 9/30/1111 | | $ | 2.00 | | | | — | 4 | | | (0.17 | ) | | | (0.17 | ) | | | — | 4 | | | — | | | | — | | | | — | |
Emerging Markets Select
Fund — Investor Class | | | | | | | | | | | | | | | | | | | | | | | | | | | | | |
Period ended 3/31/13 (unaudited)17 | | $ | 10.00 | | | | (0.01 | ) | | | 0.42 | | | | 0.41 | | | | — | 4 | | | — | | | | — | | | | — | |
Emerging Markets
Select Fund — Institutional Class | | | | | | | | | | | | | | | | | | | | | | | | | | | | | | | | |
Period ended 3/31/13 (unaudited)17 | | $ | 10.00 | | | | (0.01 | ) | | | 0.43 | | | | 0.42 | | | | — | 4 | | | — | | | | — | | | | — | |
Emerging Markets Small Cap Fund | | | | | | | | | | | | | | | | | | | | | | | | | | | | | | | | |
Six Months ended 3/31/13 (unaudited) | | $ | 2.66 | | | | — | 4 | | | 0.29 | | | | 0.29 | | | | — | 4 | | | (0.01 | ) | | | — | | | | (0.01 | ) |
Year ended 9/30/12 | | $ | 2.16 | | | | 0.01 | | | | 0.49 | | | | 0.50 | | | | — | 4 | | | — | | | | — | | | | — | |
Year ended 9/30/11 | | $ | 2.37 | | | | — | 4 | | | (0.21 | ) | | | (0.21 | ) | | | — | 4 | | | — | 4 | | | — | | | | — | 4 |
Year ended 9/30/10 | | $ | 1.57 | | | | 0.01 | | | | 0.80 | | | | 0.81 | | | | — | 4 | | | (0.01 | ) | | | — | | | | (0.01 | ) |
Year ended 9/30/09 | | $ | 1.24 | | | | — | 4 | | | 0.33 | | | | 0.33 | | | | — | 4 | | | — | 4 | | | — | | | | — | 4 |
Period ended 9/30/088 | | $ | 2.00 | | | | — | | | | (0.76 | ) | | | (0.76 | ) | | | — | 4 | | | — | 4 | | | — | | | | — | 4 |
Frontier Emerging Small Countries Fund | | | | | | | | | | | | | | | | | | | | | | | | | | | | | | | | |
Six Months ended 3/31/13 (unaudited) | | $ | 2.41 | | | | (0.01 | ) | | | 0.46 | | | | 0.45 | | | | — | 4 | | | — | 4 | | | — | 4 | | | — | 4 |
Period ended 9/30/1210 | | $ | 2.00 | | | | 0.01 | | | | 0.40 | | | | 0.41 | | | | — | 4 | | | — | | | | — | | | | — | |
Global Opportunities Fund | | | | | | | | | | | | | | | | | | | | | | | | | | | | | | | | |
Six Months ended 3/31/13 (unaudited) | | $ | 4.15 | | | | (0.01 | ) | | | 0.54 | | | | 0.53 | | | | — | 4 | | | — | | | | (0.48 | ) | | | (0.48 | ) |
Year ended 9/30/12 | | $ | 3.68 | | | | (0.03 | ) | | | 0.93 | | | | 0.90 | | | | — | 4 | | | — | | | | (0.43 | ) | | | (0.43 | ) |
Year ended 9/30/11 | | $ | 3.97 | | | | (0.02 | ) | | | (0.13 | ) | | | (0.15 | ) | | | — | 4 | | | — | | | | (0.14 | ) | | | (0.14 | ) |
Year ended 9/30/10 | | $ | 3.38 | | | | (0.02 | ) | | | 0.70 | | | | 0.68 | | | | — | 4 | | | (0.01 | ) | | | (0.08 | ) | | | (0.09 | ) |
Period ended 9/30/0914 | | $ | 2.00 | | | | (0.01 | ) | | | 1.39 | | | | 1.38 | | | | — | 4 | | | — | | | | — | | | | — | |
Heritage Growth Fund | | | | | | | | | | | | | | | | | | | | | | | | | | | | | | | | |
Six Months ended 3/31/13 (unaudited) | | $ | 12.80 | | | | 0.02 | | | | 1.22 | | | | 1.24 | | | | — | 4 | | | (0.01 | ) | | | (0.54 | ) | | | (0.55 | ) |
Year ended 9/30/12 | | $ | 10.83 | | | | (0.03 | ) | | | 2.16 | | | | 2.13 | | | | — | 4 | | | (0.02 | ) | | | (0.14 | ) | | | (0.16 | ) |
Year ended 9/30/11 | | $ | 10.70 | | | | — | 4 | | | 0.22 | | | | 0.22 | | | | — | 4 | | | (0.09 | ) | | | — | | | | (0.09 | ) |
Year ended 9/30/10 | | $ | 9.28 | | | | 0.09 | | | | 1.39 | | | | 1.48 | | | | — | 4 | | | (0.06 | ) | | | — | | | | (0.06 | ) |
Year ended 9/30/09 | | $ | 9.00 | | | | 0.06 | | | | 0.26 | | | | 0.32 | | | | — | 4 | | | (0.02 | ) | | | (0.02 | ) | | | (0.04 | ) |
Year ended 9/30/08 | | $ | 12.57 | | | | 0.06 | | | | (2.57 | ) | | | (2.51 | ) | | | — | 4 | | | — | | | | (1.06 | ) | | | (1.06 | ) |
International Growth Fund | | | | | | | | | | | | | | | | | | | | | | | | | | | | | | | | |
Six Months ended 3/31/13 (unaudited) | | $ | 22.44 | | | | (0.02 | ) | | | 3.63 | | | | 3.61 | | | | — | 4 | | | (0.08 | ) | | | — | | | | (0.08 | ) |
Year ended 9/30/12 | | $ | 17.21 | | | | 0.09 | | | | 5.14 | | | | 5.23 | | | | — | 4 | | | — | | | | — | | | | — | |
Year ended 9/30/11 | | $ | 18.66 | | | | — | 4 | | | (1.46 | ) | | | (1.46 | ) | | | 0.01 | | | | — | | | | — | | | | — | |
Year ended 9/30/10 | | $ | 13.91 | | | | 0.02 | | | | 4.73 | | | | 4.75 | | | | — | 4 | | | — | | | | — | | | | — | |
Year ended 9/30/09 | | $ | 11.83 | | | | (0.13 | ) | | | 2.24 | | | | 2.11 | | | | — | 4 | | | (0.03 | ) | | | — | | | | (0.03 | ) |
Year ended 9/30/08 | | $ | 24.42 | | | | (0.28 | ) | | | (9.19 | ) | | | (9.47 | ) | | | — | 4 | | | (0.68 | ) | | | (2.44 | ) | | | (3.12 | ) |
International Opportunities Fund | | | | | | | | | | | | | | | | | | | | | | | | | | | | | | | | |
Six Months ended 3/31/13 (unaudited) | | $ | 2.41 | | | | (0.01 | ) | | | 0.46 | | | | 0.45 | | | | — | 4 | | | — | | | | — | | | | — | |
Year ended 9/30/12 | | $ | 2.24 | | | | — | 4 | | | 0.44 | | | | 0.44 | | | | — | 4 | | | — | | | | (0.27 | ) | | | (0.27 | ) |
Year ended 9/30/11 | | $ | 2.57 | | | | (0.01 | ) | | | (0.25 | ) | | | (0.26 | ) | | | — | 4 | | | — | | | | (0.07 | ) | | | (0.07 | ) |
Year ended 9/30/10 | | $ | 1.97 | | | | (0.01 | ) | | | 0.63 | | | | 0.62 | | | | — | 4 | | | (0.02 | ) | | | — | | | | (0.02 | ) |
Year ended 9/30/09 | | $ | 1.60 | | | | 0.01 | | | | 0.36 | | | | 0.37 | | | | — | 4 | | | — | 4 | | | — | | | | — | |
Year ended 9/30/08 | | $ | 3.65 | | | | 0.07 | | | | (1.45 | ) | | | (1.38 | ) | | | — | 4 | | | (0.14 | ) | | | (0.53 | ) | | | (0.67 | ) |
Large Cap Value Fund — Investor Class | | | | | | | | | | | | | | | | | | | | | | | | | | | | | | | | |
Six Months ended 3/31/13 (unaudited) | | $ | 14.31 | | | | 0.10 | | | | 1.56 | | | | 1.66 | | | | — | 4 | | | (0.10 | ) | | | (0.13 | ) | | | (0.23 | ) |
Year ended 9/30/12 | | $ | 11.85 | | | | 0.20 | | | | 2.46 | | | | 2.66 | | | | — | 4 | | | (0.20 | ) | | | — | | | | (0.20 | ) |
Year ended 9/30/11 | | $ | 12.64 | | | | 0.17 | | | | (0.79 | ) | | | (0.62 | ) | | | — | 4 | | | (0.17 | ) | | | — | | | | (0.17 | ) |
Year ended 9/30/10 | | $ | 11.97 | | | | 0.17 | | | | 0.67 | | | | 0.84 | | | | — | 4 | | | (0.17 | ) | | | — | | | | (0.17 | ) |
Year ended 9/30/09 | | $ | 12.93 | | | | 0.20 | | | | (0.96 | ) | | | (0.76 | ) | | | — | 4 | | | (0.20 | ) | | | — | | | | (0.20 | ) |
Period ended 9/30/0815 | | $ | 14.44 | | | | 0.14 | 16 | | | (1.52 | ) | | | (1.38 | ) | | | — | | | | (0.13 | ) | | | — | | | | (0.13 | ) |
Year ended 3/31/08 | | $ | 14.80 | | | | 0.21 | | | | 0.31 | | | | 0.52 | | | | — | | | | (0.21 | ) | | | (0.67 | ) | | | (0.88 | ) |
See Notes to Financial Highlights and Notes to Financial Statements.
114
| | |
| | (for a share outstanding throughout each period) |
|
|
|
| | | | | | | | | | | | | | | | | | | | | | | | | | | | | | |
| | | | | | | Ratios to Average Net Assets | | | Supplemental Data | |
Net Asset Value End of Period | | | Total Return (%)1 19 | | | Expenses Net of Waivers and Reimbursements (%)2 | | | Expenses Before Waivers and Reimbursements (%)2 | | | Net Investment Income Net of Waivers and Reimbursements (%)2 | | | Net Investment Income Before Waivers and Reimbursements (%)2 | | | Net Assets End of Period (000’s) | | | Portfolio Turnover Rate1 3 | |
| | | | | | | | | | | | | | | | | | | | | | | | | | | | | | |
| $ | 46.37 | | | | 11.98 | | | | 1.21 | 5 | | | 1.21 | 5 | | | (0.41 | ) | | | (0.41 | ) | | $ | 762,404 | | | | 5% | |
| $ | 41.41 | | | | 26.91 | | | | 1.23 | 5 | | | 1.23 | 5 | | | (0.70 | ) | | | (0.70 | ) | | $ | 581,371 | | | | 28% | |
| $ | 32.63 | | | | 8.95 | | | | 1.22 | | | | 1.22 | | | | (0.57 | ) | | | (0.57 | ) | | $ | 433,294 | | | | 27% | |
| $ | 29.95 | | | | 15.75 | | | | 1.29 | 12 | | | 1.29 | 12 | | | 0.02 | | | | 0.02 | | | $ | 418,642 | | | | 19% | |
| $ | 25.88 | | | | (0.45 | ) | | | 1.34 | | | | 1.34 | | | | 0.24 | | | | 0.24 | | | $ | 409,949 | | | | 30% | �� |
| $ | 26.38 | | | | (24.82 | ) | | | 1.21 | | | | 1.21 | | | | 0.52 | | | | 0.52 | | | $ | 645,769 | | | | 44% | |
| | | | | | | | | | | | | | | | | | | | | | | | | | | | | | |
| $ | 46.42 | | | | 12.02 | | | | 1.12 | 5 | | | 1.38 | 5 | | | (0.40 | ) | | | (0.66 | ) | | $ | 15,063 | | | | 5% | |
| $ | 41.44 | | | | 8.14 | | | | 1.12 | 5 | | | 1.55 | 5 | | | (0.62 | ) | | | (1.05 | ) | | $ | 9,101 | | | | 28% | |
| | | | | | | | | | | | | | | | | | | | | | | | | | | | | | |
| $ | 1.96 | | | | (2.97 | ) | | | 1.95 | 5 | | | 2.68 | 5 | | | (1.51 | ) | | | (2.24 | ) | | $ | 14,601 | | | | 17% | |
| $ | 2.02 | | | | 11.42 | | | | 1.95 | 5 | | | 3.41 | 5 | | | (0.65 | ) | | | (2.11 | ) | | $ | 13,658 | | | | 17% | |
| $ | 1.83 | | | | (8.50 | ) | | | 1.95 | | | | 4.85 | | | | (0.07 | ) | | | (2.97 | ) | | $ | 10,580 | | | | 2% | |
| | | | | | | | | | | | | | | | | | | | | | | | | | | | | | |
| $ | 10.41 | | | | 3.90 | | | | 1.69 | 5 | | | 2.89 | 5 | | | (0.74 | ) | | | (1.94 | ) | | $ | 20,876 | | | | 13% | |
| | | | | | | | | | | | | | | | | | | | | | | | | | | | | | |
| $ | 10.42 | | | | 4.00 | | | | 1.50 | 5 | | | 9.44 | 5 | | | (0.43 | ) | | | (8.37 | ) | | $ | 1,730 | | | | 13% | |
| | | | | | | | | | | | | | | | | | | | | | | | | | | | | | |
| $ | 2.94 | | | | 11.05 | | | | 1.95 | 5 | | | 2.07 | 5 | | | (0.38 | ) | | | (0.50 | ) | | $ | 1,872,462 | | | | 17% | |
| $ | 2.66 | | | | 23.15 | | | | 1.95 | 5 | | | 2.13 | 5 | | | 0.29 | | | | 0.11 | | | $ | 1,482,265 | | | | 39% | |
| $ | 2.16 | | | | (8.85 | ) | | | 1.96 | | | | 2.19 | | | | 0.22 | | | | (0.01 | ) | | $ | 774,198 | | | | 48% | |
| $ | 2.37 | | | | 51.69 | | | | 2.06 | 13 | | | 2.39 | 13 | | | 0.82 | | | | 0.49 | | | $ | 446,751 | | | | 23% | |
| $ | 1.57 | | | | 26.80 | | | | 2.10 | | | | 3.03 | | | | 0.12 | | | | (0.81 | ) | | $ | 50,489 | | | | 78% | |
| $ | 1.24 | | | | (37.88 | ) | | | 2.10 | | | | 2.67 | | | | 0.27 | | | | (0.29 | ) | | $ | 36,176 | | | | 38% | |
| | | | | | | | | | | | | | | | | | | | | | | | | | | | | | |
| $ | 2.86 | | | | 18.33 | | | | 2.25 | 5 | | | 2.32 | 5 | | | (0.65 | ) | | | (0.72 | ) | | $ | 346,333 | | | | 5% | |
| $ | 2.41 | | | | 20.50 | | | | 2.25 | 5 | | | 3.64 | 5 | | | 1.31 | | | | (0.08 | ) | | $ | 33,045 | | | | 5% | |
| | | | | | | | | | | | | | | | | | | | | | | | | | | | | | |
| $ | 4.20 | | | | 13.92 | | | | 1.79 | 5 | | | 1.79 | 5 | | | (0.76 | ) | | | (0.76 | ) | | $ | 198,481 | | | | 21% | |
| $ | 4.15 | | | | 26.69 | | | | 1.84 | 5 | | | 1.84 | 5 | | | (0.61 | ) | | | (0.61 | ) | | $ | 153,582 | | | | 38% | |
| $ | 3.68 | | | | (4.21 | ) | | | 1.94 | | | | 1.94 | | | | (0.41 | ) | | | (0.41 | ) | | $ | 199,855 | | | | 59% | |
| $ | 3.97 | | | | 20.41 | | | | 2.25 | 13 | | | 2.33 | 13 | | | (0.73 | ) | | | (0.81 | ) | | $ | 234,904 | | | | 23% | |
| $ | 3.38 | | | | 69.00 | | | | 2.25 | | | | 2.61 | | | | (0.67 | ) | | | (1.03 | ) | | $ | 117,385 | | | | 22% | |
| | | | | | | | | | | | | | | | | | | | | | | | | | | | | | |
| $ | 13.49 | | | | 10.08 | | | | 0.95 | 5 | | | 1.01 | 5 | | | 0.32 | | | | 0.26 | | | $ | 120,151 | | | | 6% | |
| $ | 12.80 | | | | 19.76 | | | | 0.95 | 5 | | | 1.03 | 5 | | | (0.28 | ) | | | (0.37 | ) | | $ | 111,952 | | | | 26% | |
| $ | 10.83 | | | | 2.01 | | | | 0.95 | | | | 1.04 | | | | (0.02 | ) | | | (0.11 | ) | | $ | 72,561 | | | | 35% | |
| $ | 10.70 | | | | 16.06 | | | | 0.96 | 12 | | | 1.11 | 12 | | | 0.81 | | | | 0.66 | | | $ | 78,274 | | | | 36% | |
| $ | 9.28 | | | | 3.74 | | | | 0.95 | | | | 1.21 | | | | 0.74 | | | | 0.48 | | | $ | 77,194 | | | | 33% | |
| $ | 9.00 | | | | (21.54 | ) | | | 0.95 | | | | 1.01 | | | | 0.44 | | | | 0.38 | | | $ | 95,414 | | | | 48% | |
| | | | | | | | | | | | | | | | | | | | | | | | | | | | | | |
| $ | 25.97 | | | | 16.10 | | | | 1.48 | 5 | | | 1.48 | 5 | | | (0.32 | ) | | | (0.32 | ) | | $ | 871,997 | | | | 28% | |
| $ | 22.44 | | | | 30.39 | | | | 1.57 | 6 | | | 1.57 | 6 | | | 0.51 | | | | 0.51 | | | $ | 434,824 | | | | 44% | |
| $ | 17.21 | | | | (7.77 | ) | | | 1.66 | | | | 1.66 | | | | (0.01 | ) | | | (0.01 | ) | | $ | 281,481 | | | | 70% | |
| $ | 18.66 | | | | 34.15 | | | | 1.86 | 13 | | | 1.86 | 13 | | | 0.10 | | | | 0.10 | | | $ | 285,446 | | | | 44% | |
| $ | 13.91 | | | | 18.03 | | | | 1.94 | | | | 1.94 | | | | 0.03 | | | | 0.03 | | | $ | 173,226 | | | | 56% | |
| $ | 11.83 | | | | (44.01 | ) | | | 1.83 | | | | 1.83 | | | | (0.15 | ) | | | (0.15 | ) | | $ | 194,780 | | | | 44% | |
| | | | | | | | | | | | | | | | | | | | | | | | | | | | | | |
| $ | 2.86 | | | | 18.67 | | | | 2.25 | 5 | | | 2.41 | 5 | | | (0.83 | ) | | | (0.99 | ) | | $ | 247,960 | | | | 25% | |
| $ | 2.41 | | | | 22.33 | | | | 2.25 | 5 | | | 2.48 | 5 | | | (0.16 | ) | | | (0.39 | ) | | $ | 194,563 | | | | 41% | |
| $ | 2.24 | | | | (10.49 | ) | | | 2.25 | | | | 2.55 | | | | (0.58 | ) | | | (0.88 | ) | | $ | 151,569 | | | | 108% | |
| $ | 2.57 | | | | 31.71 | | | | 2.26 | 12 | | | 2.62 | 12 | | | (0.60 | ) | | | (0.96 | ) | | $ | 152,178 | | | | 51% | |
| $ | 1.97 | | | | 23.60 | | | | 2.26 | 6 | | | 2.79 | 6 | | | (0.28 | ) | | | (0.81 | ) | | $ | 93,856 | | | | 69% | |
| $ | 1.60 | | | | (45.33 | ) | | | 2.25 | | | | 2.59 | | | | (0.09 | ) | | | (0.43 | ) | | $ | 55,691 | | | | 63% | |
| | | | | | | | | | | | | | | | | | | | | | | | | | | | | | |
| $ | 15.74 | | | | 11.78 | | | | 1.10 | 5 | | | 1.17 | 5 | | | 1.38 | | | | 1.31 | | | $ | 1,241,622 | | | | 8% | |
| $ | 14.31 | | | | 22.50 | | | | 1.10 | 5 | | | 1.15 | 5 | | | 1.42 | | | | 1.37 | | | $ | 1,298,365 | | | | 14% | |
| $ | 11.85 | | | | (5.08 | ) | | | 1.10 | | | | 1.11 | | | | 1.24 | | | | 1.23 | | | $ | 1,546,471 | | | | 26% | |
| $ | 12.64 | | | | 7.07 | | | | 1.11 | 12 | | | 1.14 | 12 | | | 1.36 | | | | 1.33 | | | $ | 1,621,113 | | | | 17% | |
| $ | 11.97 | | | | (5.63 | ) | | | 1.10 | | | | 1.22 | | | | 1.93 | | | | 1.81 | | | $ | 1,385,508 | | | | 16% | |
| $ | 12.93 | | | | (9.65 | ) | | | 1.04 | | | | 1.29 | | | | 1.99 | | | | 1.74 | | | $ | 780,384 | | | | 5% | |
| $ | 14.44 | | | | 3.22 | | | | 1.13 | | | | 1.38 | | | | 1.43 | | | | 1.18 | | | $ | 447,674 | | | | 36% | |
115
| | |
| WASATCH FUNDS — Financial Highlights (continued) | | |
|
|
|
| | | | | | | | | | | | | | | | | | | | | | | | | | | | | | | | |
| | | | | | Income (Loss) from
Investment Operations | | | | | | | | | Less Distributions | | | | |
| | | Net Asset
Value
Beginning
of Period | | | Net
Investment
Income (Loss) | | | Net Realized
and Unrealized
Gains (Losses)
on Investments | | | Total from
Investment
Operations | | | Redemption
Fees (See Note 2) | | | Dividends
from Net
Investment
Income | | | Distributions
from Net
Realized
Gains | | | Total
Distributions | |
Large Cap Value Fund — Institutional Class | | | | | | | | | | | | | | | | | | | | | | | | | | | | | |
Six Months ended 3/31/13 (unaudited) | | $ | 14.31 | | | | 0.11 | | | | 1.55 | | | | 1.66 | | | | — | 4 | | | (0.11 | ) | | | (0.13 | ) | | | (0.24 | ) |
Period ended 9/30/129 | | $ | 13.77 | | | | 0.12 | | | | 0.57 | | | | 0.69 | | | | — | 4 | | | (0.15 | ) | | | — | | | | (0.15 | ) |
Long/Short Fund — Investor Class | | | | | | | | | | | | | | | | | | | | | | | | | | | | | | | | |
Six Months ended 3/31/13 (unaudited) | | $ | 13.66 | | | | (0.01 | ) | | | 1.59 | | | | 1.58 | | | | — | 4 | | | — | | | | (0.03 | ) | | | (0.03 | ) |
Year ended 9/30/12 | | $ | 11.85 | | | | (0.02 | ) | | | 1.83 | | | | 1.81 | | | | — | 4 | | | — | | | | — | | | | — | |
Year ended 9/30/11 | | $ | 11.74 | | | | (0.04 | ) | | | 0.16 | | | | 0.12 | | | | — | 4 | | | (0.01 | ) | | | — | | | | (0.01 | ) |
Year ended 9/30/10 | | $ | 11.13 | | | | (0.01 | ) | | | 0.62 | | | | 0.61 | | | | — | 4 | | | — | 4 | | | — | | | | — | 4 |
Year ended 9/30/09 | | $ | 10.81 | | | | 0.02 | | | | 0.50 | | | | 0.52 | | | | — | 4 | | | (0.05 | ) | | | (0.15 | ) | | | (0.20 | ) |
Period ended 9/30/0815 | | $ | 11.27 | | | | 0.05 | 16 | | | (0.46 | ) | | | (0.41 | ) | | | — | | | | (0.05 | ) | | | — | | | | (0.05 | ) |
Year ended 3/31/08 | | $ | 11.59 | | | | 0.27 | | | | 0.02 | | | | 0.29 | | | | — | | | | (0.28 | ) | | | (0.33 | ) | | | (0.61 | ) |
Long/Short Fund — Institutional Class | | | | | | | | | | | | | | | | | | | | | | | | | | | | | | | | |
Period ended 3/31/13 (unaudited)18 | | $ | 13.80 | | | | (0.01 | ) | | | 1.45 | | | | 1.44 | | | | — | | | | — | | | | (0.03 | ) | | | (0.03 | ) |
Micro Cap Fund | | | | | | | | | | | | | | | | | | | | | | | | | | | | | | | | |
Six Months ended 3/31/13 (unaudited) | | $ | 5.71 | | | | (0.05 | ) | | | 0.53 | | | | 0.48 | | | | — | 4 | | | — | | | | — | | | | — | |
Year ended 9/30/12 | | $ | 4.40 | | | | (0.09 | ) | | | 1.40 | | | | 1.31 | | | | — | 4 | | | — | | | | — | | | | — | |
Year ended 9/30/11 | | $ | 4.44 | | | | (0.06 | ) | | | 0.02 | | | | (0.04 | ) | | | — | 4 | | | — | | | | — | | | | — | |
Year ended 9/30/10 | | $ | 3.89 | | | | (0.05 | ) | | | 0.60 | | | | 0.55 | | | | — | 4 | | | — | | | | — | | | | — | |
Year ended 9/30/09 | | $ | 4.14 | | | | (0.03 | ) | | | (0.21 | ) | | | (0.24 | ) | | | — | 4 | | | (0.01 | ) | | | — | | | | (0.01 | ) |
Year ended 9/30/08 | | $ | 7.19 | | | | (0.07 | ) | | | (1.81 | ) | | | (1.88 | ) | | | — | 4 | | | — | | | | (1.17 | ) | | | (1.17 | ) |
Micro Cap Value Fund | | | | | | | | | | | | | | | | | | | | | | | | | | | | | | | | |
Six Months ended 3/31/13 (unaudited) | | $ | 2.85 | | | | (0.01 | ) | | | 0.44 | | | | 0.43 | | | | — | 4 | | | — | | | | (0.28 | ) | | | (0.28 | ) |
Year ended 9/30/12 | | $ | 2.24 | | | | (0.04 | ) | | | 0.65 | | | | 0.61 | | | | — | 4 | | | — | | | | — | | | | — | |
Year ended 9/30/11 | | $ | 2.38 | | | | (0.04 | ) | | | (0.10 | ) | | | (0.14 | ) | | | — | 4 | | | — | | | | — | | | | — | |
Year ended 9/30/10 | | $ | 2.11 | | | | (0.02 | ) | | | 0.30 | | | | 0.28 | | | | — | 4 | | | (0.01 | ) | | | — | | | | (0.01 | ) |
Year ended 9/30/09 | | $ | 1.80 | | | | (0.02 | ) | | | 0.33 | | | | 0.31 | | | | — | 4 | | | — | | | | — | | | | — | |
Year ended 9/30/08 | | $ | 2.98 | | | | (0.02 | ) | | | (0.75 | ) | | | (0.77 | ) | | | — | 4 | | | — | | | | (0.41 | ) | | | (0.41 | ) |
Small Cap Growth Fund | | | | | | | | | | | | | | | | | | | | | | | | | | | | | | | | |
Six Months ended 3/31/13 (unaudited) | | $ | 43.82 | | | | 0.01 | | | | 4.11 | | | | 4.12 | | | | — | 4 | | | — | | | | (2.89 | ) | | | (2.89 | ) |
Year ended 9/30/12 | | $ | 35.37 | | | | (0.29 | ) | | | 10.40 | | | | 10.11 | | | | — | 4 | | | — | | | | (1.66 | ) | | | (1.66 | ) |
Year ended 9/30/11 | | $ | 34.24 | | | | (0.13 | ) | | | 1.26 | | | | 1.13 | | | | — | 4 | | | — | | | | — | | | | — | |
Year ended 9/30/10 | | $ | 28.59 | | | | (0.22 | ) | | | 5.87 | | | | 5.65 | | | | — | 4 | | | — | | | | — | | | | — | |
Year ended 9/30/09 | | $ | 26.50 | | | | (0.12 | ) | | | 2.27 | | | | 2.15 | | | | — | 4 | | | — | | | | (0.06 | ) | | | (0.06 | ) |
Year ended 9/30/08 | | $ | 40.10 | | | | (0.16 | ) | | | (8.85 | ) | | | (9.01 | ) | | | — | 4 | | | — | | | | (4.59 | ) | | | (4.59 | ) |
Small Cap Value Fund — Investor Class | | | | | | | | | | | | | | | | | | | | | | | | | | | | | | | | |
Six Months ended 3/31/13 (unaudited) | | $ | 3.81 | | | | — | 4 | | | 0.62 | | | | 0.62 | | | | — | 4 | | | — | | | | — | | | | — | |
Year ended 9/30/12 | | $ | 3.12 | | | | (0.03 | ) | | | 0.72 | | | | 0.69 | | | | — | 4 | | | — | | | | — | | | | — | |
Year ended 9/30/11 | | $ | 3.08 | | | | (0.02 | ) | | | 0.06 | | | | 0.04 | | | | — | 4 | | | — | | | | — | | | | — | |
Year ended 9/30/10 | | $ | 2.75 | | | | (0.01 | ) | | | 0.34 | | | | 0.33 | | | | — | 4 | | | — | | | | — | | | | — | |
Year ended 9/30/09 | | $ | 2.82 | | | | (0.01 | ) | | | (0.06 | ) | | | (0.07 | ) | | | — | 4 | | | — | | | | — | | | | — | |
Year ended 9/30/08 | | $ | 5.22 | | | | 0.01 | | | | (1.11 | ) | | | (1.10 | ) | | | — | 4 | | | (0.01 | ) | | | (1.29 | ) | | | (1.30 | ) |
Small Cap Value Fund — Institutional Class | | | | | | | | | | | | | | | | | | | | | | | | | | | | | | | | |
Six Months ended 3/31/13 (unaudited) | | $ | 3.82 | | | | 0.01 | | | | 0.61 | | | | 0.62 | | | | — | 4 | | | — | | | | — | | | | — | |
Period ended 9/30/129 | | $ | 3.68 | | | | (0.01 | ) | | | 0.15 | | | | 0.14 | | | | — | | | | — | | | | — | | | | — | |
Strategic Income Fund | | | | | | | | | | | | | | | | | | | | | | | | | | | | | | | | |
Six Months ended 3/31/13 (unaudited) | | $ | 9.30 | | | | 0.18 | | | | 1.00 | | | | 1.18 | | | | — | 4 | | | (0.17 | ) | | | — | | | | (0.17 | ) |
Year ended 9/30/12 | | $ | 7.57 | | | | 0.16 | | | | 1.77 | | | | 1.93 | | | | — | 4 | | | (0.20 | ) | | | — | | | | (0.20 | ) |
Year ended 9/30/11 | | $ | 7.51 | | | | 0.25 | | | | 0.06 | | | | 0.31 | | | | — | 4 | | | (0.25 | ) | | | — | | | | (0.25 | ) |
Year ended 9/30/10 | | $ | 6.77 | | | | 0.31 | | | | 0.70 | | | | 1.01 | | | | — | 4 | | | (0.27 | ) | | | — | | | | (0.27 | ) |
Year ended 9/30/09 | | $ | 7.62 | | | | 0.29 | | | | (0.85 | ) | | | (0.56 | ) | | | — | 4 | | | (0.29 | ) | | | — | | | | (0.29 | ) |
Year ended 9/30/08 | | $ | 11.00 | | | | 0.55 | | | | (2.29 | ) | | | (1.74 | ) | | | — | 4 | | | (0.50 | ) | | | (1.14 | ) | | | (1.64 | ) |
Ultra Growth Fund | | | | | | | | | | | | | | | | | | | | | | | | | | | | | | | | |
Six Months ended 3/31/13 (unaudited) | | $ | 22.83 | | | | 0.06 | | | | 1.64 | | | | 1.70 | | | | — | 4 | | | — | | | | (3.07 | ) | | | (3.07 | ) |
Year ended 9/30/12 | | $ | 20.11 | | | | (0.08 | ) | | | 3.98 | | | | 3.90 | | | | — | 4 | | | — | | | | (1.18 | ) | | | (1.18 | ) |
Year ended 9/30/11 | | $ | 19.80 | | | | (0.17 | ) | | | 0.48 | | | | 0.31 | | | | — | 4 | | | — | | | | — | | | | — | |
Year ended 9/30/10 | | $ | 15.66 | | | | (0.15 | ) | | | 4.29 | | | | 4.14 | | | | — | 4 | | | — | | | | — | | | | — | |
Year ended 9/30/09 | | $ | 15.76 | | | | (0.14 | ) | | | 0.04 | | | | (0.10 | ) | | | — | 4 | | | — | | | | — | | | | — | |
Year ended 9/30/08 | | $ | 27.78 | | | | (0.22 | ) | | | (8.28 | ) | | | (8.50 | ) | | | — | 4 | | | — | | | | (3.52 | ) | | | (3.52 | ) |
World Innovators Fund | | | | | | | | | | | | | | | | | | | | | | | | | | | | | | | | |
Six Months ended 3/31/13 (unaudited) | | $ | 18.55 | | | | (0.04 | ) | | | 1.56 | | | | 1.52 | | | | — | 4 | | | — | | | | — | | | | — | |
Year ended 9/30/12 | | $ | 14.71 | | | | (0.12 | ) | | | 3.96 | | | | 3.84 | | | | — | 4 | | | — | | | | — | | | | — | |
Year ended 9/30/11 | | $ | 13.65 | | | | (0.13 | ) | | | 1.19 | | | | 1.06 | | | | — | 4 | | | — | | | | — | | | | — | |
Year ended 9/30/10 | | $ | 11.12 | | | | (0.10 | ) | | | 2.65 | | | | 2.55 | | | | — | 4 | | | (0.02 | ) | | | — | | | | (0.02 | ) |
Year ended 9/30/09 | | $ | 10.31 | | | | (0.12 | ) | | | 0.93 | | | | 0.81 | | | | — | 4 | | | — | | | | — | | | | — | |
Year ended 9/30/08 | | $ | 17.69 | | | | (0.25 | ) | | | (5.65 | ) | | | (5.90 | ) | | | — | 4 | | | — | | | | (1.48 | ) | | | (1.48 | ) |
See Notes to Financial Highlights and Notes to Financial Statements.
116
| | |
| | (for a share outstanding throughout each period) |
|
|
|
| | | | | | | | | | | | | | | | | | | | | | | | | | | | | | |
| | | | | | | Ratios to Average Net Assets | | | Supplemental Data | |
Net Asset
Value End of Period | | | Total Return (%)1 19 | | | Expenses Net of Waivers and Reimbursements (%)2 | | | Expenses Before Waivers and Reimbursements (%)2 | | | Net Investment Income Net of Waivers and Reimbursements (%)2 | | | Net Investment Income Before Waivers and Reimbursements (%)2 | | | Net Assets End of Period (000’s) | | | Portfolio Turnover Rate1 3 | |
| | | | | | | | | | | | | | | | | | | | | | | | | | | | | | |
| $ | 15.73 | | | | 11.77 | | | | 0.98 | 5 | | | 1.34 | 5 | | | 1.47 | | | | 1.11 | | | $ | 14,652 | | | | 8% | |
| $ | 14.31 | | | | 5.02 | | | | 0.98 | 5 | | | 1.31 | 5 | | | 1.44 | | | | 1.11 | | | $ | 15,511 | | | | 14% | |
| | | | | | | | | | | | | | | | | | | | | | | | | | | | | | |
| $ | 15.21 | | | | 11.62 | | | | 1.48 | 7 | | | 1.48 | 7 | | | (0.16 | ) | | | (0.16 | ) | | $ | 1,512,994 | | | | 28% | |
| $ | 13.66 | | | | 15.27 | | | | 1.51 | 7 | | | 1.51 | 7 | | | (0.20 | ) | | | (0.20 | ) | | $ | 1,537,220 | | | | 71% | |
| $ | 11.85 | | | | 0.98 | | | | 1.63 | 7 | | | 1.63 | 7 | | | (0.44 | ) | | | (0.44 | ) | | $ | 833,298 | | | | 82% | |
| $ | 11.74 | | | | 5.52 | | | | 1.71 | 13 7 | | | 1.71 | 13 7 | | | 0.03 | | | | 0.03 | | | $ | 300,255 | | | | 60% | |
| $ | 11.13 | | | | 5.35 | | | | 1.91 | 7 | | | 1.96 | 7 | | | 0.24 | | | | 0.19 | | | $ | 146,127 | | | | 167% | |
| $ | 10.81 | | | | (3.66 | ) | | | 1.77 | 7 | | | 2.02 | 7 | | | 0.95 | | | | 0.70 | | | $ | 122,114 | | | | 71% | |
| $ | 11.27 | | | | 2.34 | | | | 1.75 | 7 | | | 2.00 | 7 | | | 2.25 | | | | 2.00 | | | $ | 87,410 | | | | 179% | |
| | | | | | | | | | | | | | | | | | | | | | | | | | | | | | | |
| $ | 15.21 | | | | 10.48 | | | | 1.34 | 7 | | | 1.44 | 7 | | | (0.84 | ) | | | (0.94 | ) | | $ | 343,952 | | | | 28% | |
| | | | | | | | | | | | | | | | | | | | | | | | | | | | | | |
| $ | 6.19 | | | | 8.41 | | | | 2.15 | 5 | | | 2.15 | 5 | | | (1.37 | ) | | | (1.37 | ) | | $ | 287,747 | | | | 7% | |
| $ | 5.71 | | | | 29.77 | | | | 2.14 | 5 | | | 2.14 | 5 | | | (1.50 | ) | | | (1.50 | ) | | $ | 289,449 | | | | 25% | |
| $ | 4.40 | | | | (0.90 | ) | | | 2.14 | | | | 2.14 | | | | (1.05 | ) | | | (1.05 | ) | | $ | 253,415 | | | | 30% | |
| $ | 4.44 | | | | 14.14 | | | | 2.18 | 5 | | | 2.18 | 5 | | | (1.10 | ) | | | (1.10 | ) | | $ | 283,551 | | | | 34% | |
| $ | 3.89 | | | | (5.70 | ) | | | 2.24 | | | | 2.24 | | | | (0.96 | ) | | | (0.96 | ) | | $ | 272,537 | | | | 46% | |
| $ | 4.14 | | | | (30.46 | ) | | | 2.16 | | | | 2.16 | | | | (1.26 | ) | | | (1.26 | ) | | $ | 359,394 | | | | 54% | |
| | | | | | | | | | | | | | | | | | | | | | | | | | | | | | |
| $ | 3.00 | | | | 16.45 | | | | 2.25 | 5 | | | 2.27 | 5 | | | (0.72 | ) | | | (0.74 | ) | | $ | 146,679 | | | | 30% | |
| $ | 2.85 | | | | 27.23 | | | | 2.25 | 5 | | | 2.31 | 5 | | | (1.27 | ) | | | (1.33 | ) | | $ | 138,299 | | | | 78% | |
| $ | 2.24 | | | | (5.88 | ) | | | 2.25 | | | | 2.28 | | | | (1.21 | ) | | | (1.24 | ) | | $ | 142,795 | | | | 94% | |
| $ | 2.38 | | | | 13.26 | | | | 2.26 | 12 | | | 2.37 | 12 | | | (1.32 | ) | | | (1.43 | ) | | $ | 185,587 | | | | 88% | |
| $ | 2.11 | | | | 17.22 | | | | 2.26 | 7 | | | 2.46 | 7 | | | (1.36 | ) | | | (1.56 | ) | | $ | 115,216 | | | | 145% | |
| $ | 1.80 | | | | (29.67 | ) | | | 2.25 | | | | 2.35 | | | | (1.21 | ) | | | (1.31 | ) | | $ | 97,912 | | | | 144% | |
| | | | | | | | | | | | | | | | | | | | | | | | | | | | | | |
| $ | 45.05 | | | | 10.05 | | | | 1.24 | 5 | | | 1.24 | 5 | | | (0.06 | ) | | | (0.06 | ) | | $ | 2,087,887 | | | | 6% | |
| $ | 43.82 | | | | 29.41 | | | | 1.24 | 5 | | | 1.24 | 5 | | | (0.73 | ) | | | (0.73 | ) | | $ | 1,824,781 | | | | 20% | |
| $ | 35.37 | | | | 3.30 | | | | 1.23 | | | | 1.23 | | | | (0.32 | ) | | | (0.32 | ) | | $ | 1,297,982 | | | | 23% | |
| $ | 34.24 | | | | 19.76 | | | | 1.27 | 12 | | | 1.27 | 12 | | | (0.74 | ) | | | (0.74 | ) | | $ | 1,110,087 | | | | 17% | |
| $ | 28.59 | | | | 8.20 | | | | 1.29 | | | | 1.29 | | | | (0.60 | ) | | | (0.60 | ) | | $ | 809,318 | | | | 52% | |
| $ | 26.50 | | | | (25.42 | ) | | | 1.21 | | | | 1.21 | | | | (0.47 | ) | | | (0.47 | ) | | $ | 735,546 | | | | 51% | |
| | | | | | | | | | | | | | | | | | | | | | | | | | | | | | |
| $ | 4.43 | | | | 16.27 | | | | 1.30 | 5 | | | 1.30 | 5 | | | 0.25 | | | | 0.25 | | | $ | 178,405 | | | | 16% | |
| $ | 3.81 | | | | 22.12 | | | | 1.46 | 5 | | | 1.46 | 5 | | | (0.73 | ) | | | (0.73 | ) | | $ | 166,330 | | | | 55% | |
| $ | 3.12 | | | | 1.30 | | | | 1.78 | | | | 1.78 | | | | (0.65 | ) | | | (0.65 | ) | | $ | 169,401 | | | | 46% | |
| $ | 3.08 | | | | 12.00 | | | | 1.85 | 12 | | | 1.85 | 12 | | | (0.23 | ) | | | (0.23 | ) | | $ | 211,571 | | | | 62% | |
| $ | 2.75 | | | | (2.48 | ) | | | 1.92 | | | | 1.92 | | | | (0.33 | ) | | | (0.33 | ) | | $ | 218,358 | | | | 89% | |
| $ | 2.82 | | | | (26.26 | ) | | | 1.76 | | | | 1.76 | | | | 0.15 | | | | 0.15 | | | $ | 336,914 | | | | 78% | |
| | | | | | | | | | | | | | | | | | | | | | | | | | | | | | |
| $ | 4.44 | | | | 16.23 | | | | 1.15 | 5 | | | 1.57 | 5 | | | 0.39 | | | | (0.03 | ) | | $ | 8,275 | | | | 16% | |
| $ | 3.82 | | | | 3.80 | | | | 1.15 | 5 | | | 1.66 | 5 | | | (0.42 | ) | | | (0.93 | ) | | $ | 7,243 | | | | 55% | |
| | | | | | | | | | | | | | | | | | | | | | | | | | | | | | |
| $ | 10.31 | | | | 12.83 | | | | 0.95 | 5 | | | 1.07 | 5 | | | 3.67 | | | | 3.55 | | | $ | 53,451 | | | | 17% | |
| $ | 9.30 | | | | 25.61 | | | | 0.95 | 5 | | | 1.14 | 5 | | | 1.74 | | | | 1.55 | | | $ | 44,635 | | | | 57% | |
| $ | 7.57 | | | | 3.94 | | | | 0.95 | | | | 1.21 | | | | 2.99 | | | | 2.73 | | | $ | 24,057 | | | | 62% | |
| $ | 7.51 | | | | 15.18 | | | | 0.99 | 13 7 | | | 1.33 | 13 7 | | | 4.35 | | | | 4.01 | | | $ | 19,517 | | | | 73% | |
| $ | 6.77 | | | | (6.49 | ) | | | 1.05 | 7 | | | 1.71 | 7 | | | 4.93 | | | | 4.27 | | | $ | 17,710 | | | | 84% | |
| $ | 7.62 | | | | (18.17 | ) | | | 0.97 | 7 | | | 1.46 | 7 | | | 5.96 | | | | 5.47 | | | $ | 21,889 | | | | 81% | |
| | | | | | | | | | | | | | | | | | | | | | | | | | | | | | |
| $ | 21.46 | | | | 8.61 | | | | 1.31 | 5 | | | 1.31 | 5 | | | 0.57 | | | | 0.57 | | | $ | 140,571 | | | | 12% | |
| $ | 22.83 | | | | 20.13 | | | | 1.32 | 5 | | | 1.32 | 5 | | | (0.35 | ) | | | (0.35 | ) | | $ | 143,259 | | | | 43% | |
| $ | 20.11 | | | | 1.57 | | | | 1.42 | | | | 1.42 | | | | (0.51 | ) | | | (0.51 | ) | | $ | 134,203 | | | | 60% | |
| $ | 19.80 | | | | 26.44 | | | | 1.68 | 12 | | | 1.68 | 12 | | | (1.14 | ) | | | (1.14 | ) | | $ | 178,566 | | | | 45% | |
| $ | 15.66 | | | | (0.63 | ) | | | 1.75 | | | | 1.77 | | | | (1.12 | ) | | | (1.14 | ) | | $ | 121,284 | | | | 64% | |
| $ | 15.76 | | | | (35.09 | ) | | | 1.53 | | | | 1.53 | | | | (0.93 | ) | | | (0.93 | ) | | $ | 144,004 | | | | 84% | |
| | | | | | | | | | | | | | | | | | | | | | | | | | | | | | |
| $ | 20.07 | | | | 8.25 | | | | 1.80 | 5 | | | 1.80 | 5 | | | (0.50 | ) | | | (0.50 | ) | | $ | 193,772 | | | | 36% | |
| $ | 18.55 | | | | 26.10 | | | | 1.85 | 5 | | | 1.85 | 5 | | | (0.99 | ) | | | (0.99 | ) | | $ | 167,934 | | | | 66% | |
| $ | 14.71 | | | | 7.77 | | | | 1.95 | | | | 1.95 | | | | (0.84 | ) | | | (0.84 | ) | | $ | 72,493 | | | | 85% | |
| $ | 13.65 | | | | 22.91 | | | | 1.96 | 12 | | | 2.05 | 12 | | | (0.74 | ) | | | (0.83 | ) | | $ | 65,767 | | | | 74% | |
| $ | 11.12 | | | | 7.86 | | | | 1.95 | | | | 2.14 | | | | (0.88 | ) | | | (1.07 | ) | | $ | 59,540 | | | | 41% | |
| $ | 10.31 | | | | (36.07 | ) | | | 1.92 | | | | 1.92 | | | | (1.24 | ) | | | (1.24 | ) | | $ | 82,164 | | | | 89% | |
117
| | |
| WASATCH FUNDS — Financial Highlights (continued) | | |
|
|
|
| | | | | | | | | | | | | | | | | | | | | | | | | | | | | | | | |
| | | | | | Income (Loss) from
Investment Operations | | | | | | | | | Less Distributions | | | | |
| | | Net Asset
Value
Beginning
of Period | | | Net
Investment
Income | | | Net Realized
and Unrealized
Gains (Losses)
on Investments | | | Total from
Investment
Operations | | | Redemption
Fees (See Note 2) | | | Dividends
from Net
Investment
Income | | | Distributions
from Net
Realized
Gains | | | Total
Distributions | |
Wasatch-1st Source Income Fund | | | | | | | | | | | | | | | | | | | | | | | | | | | | | | | | |
Six Months ended 3/31/13 (unaudited) | | $ | 10.44 | | | | 0.09 | | | | (0.06 | ) | | | 0.03 | | | | — | 4 | | | (0.09 | ) | | | — | | | | (0.09 | ) |
Year ended 9/30/12 | | $ | 10.32 | | | | 0.20 | | | | 0.12 | | | | 0.32 | | | | — | 4 | | | (0.20 | ) | | | — | | | | (0.20 | ) |
Year ended 9/30/11 | | $ | 10.34 | | | | 0.25 | | | | (0.02 | ) | | | 0.23 | | | | — | 4 | | | (0.25 | ) | | | — | | | | (0.25 | ) |
Year ended 9/30/10 | | $ | 10.04 | | | | 0.29 | | | | 0.30 | | | | 0.59 | | | | — | 4 | | | (0.29 | ) | | | — | | | | (0.29 | ) |
Year ended 9/30/09 | | $ | 9.59 | | | | 0.33 | | | | 0.46 | | | | 0.79 | | | | — | 4 | | | (0.34 | ) | | | — | | | | (0.34 | ) |
Period ended 9/30/0815 | | $ | 9.95 | | | | 0.18 | 16 | | | (0.35 | ) | | | (0.17 | ) | | | — | | | | (0.19 | ) | | | — | | | | (0.19 | ) |
Year ended 3/31/08 | | $ | 9.73 | | | | 0.40 | | | | 0.24 | | | | 0.64 | | | | — | | | | (0.42 | ) | | | — | | | | (0.42 | ) |
U.S. Treasury Fund | | | | | | | | | | | | | | | | | | | | | | | | | | | | | | | | |
Six Months ended 3/31/13 (unaudited) | | $ | 18.75 | | | | 0.21 | | | | (1.14 | ) | | | (0.93 | ) | | | — | 4 | | | (0.22 | ) | | | (0.35 | ) | | | (0.57 | ) |
Year ended 9/30/12 | | $ | 18.75 | | | | 0.42 | | | | 0.77 | | | | 1.19 | | | | 0.01 | | | | (0.42 | ) | | | (0.78 | ) | | | (1.20 | ) |
Year ended 9/30/11 | | $ | 17.17 | | | | 0.52 | | | | 2.63 | | | | 3.15 | | | | 0.02 | | | | (0.52 | ) | | | (1.07 | ) | | | (1.59 | ) |
Year ended 9/30/10 | | $ | 16.29 | | | | 0.54 | | | | 1.35 | | | | 1.89 | | | | 0.01 | | | | (0.54 | ) | | | (0.48 | ) | | | (1.02 | ) |
Year ended 9/30/09 | | $ | 14.95 | | | | 0.55 | | | | 1.29 | | | | 1.84 | | | | 0.05 | | | | (0.55 | ) | | | — | | | | (0.55 | ) |
Year ended 9/30/08 | | $ | 13.84 | | | | 0.58 | | | | 1.10 | | | | 1.68 | | | | 0.01 | | | | (0.58 | ) | | | — | | | | (0.58 | ) |
See Notes to Financial Highlights and Notes to Financial Statements.
118
| | |
| | (for a share outstanding throughout each period) |
|
|
|
| | | | | | | | | | | | | | | | | | | | | | | | | | | | | | |
| | | | | | | Ratios to Average Net Assets | | | Supplemental Data | |
Net Asset
Value End of Period | | | Total Return (%)1 19 | | | Expenses Net of Waivers and Reimbursements (%)2 | | | Expenses Before Waivers and Reimbursements (%)2 | | | Net Investment Income Net of Waivers and Reimbursements (%)2 | | | Net Investment Income Before Waivers and Reimbursements (%)2 | | | Net Assets End of Period (000’s) | | | Portfolio Turnover Rate1 3 | |
| | | | | | | | | | | | | | | | | | | | | | | | | | | | | | |
| $ | 10.38 | | | | 0.29 | | | | 0.71 | 5 | | | 0.71 | 5 | | | 1.70 | | | | 1.70 | | | $ | 134,214 | | | | 17% | |
| $ | 10.44 | | | | 3.16 | | | | 0.70 | 5 | | | 0.70 | 5 | | | 1.97 | | | | 1.97 | | | $ | 139,186 | | | | 48% | |
| $ | 10.32 | | | | 2.26 | | | | 0.71 | | | | 0.71 | | | | 2.42 | | | | 2.42 | | | $ | 135,617 | | | | 43% | |
| $ | 10.34 | | | | 5.95 | | | | 0.72 | 13 | | | 0.73 | 13 | | | 2.87 | | | | 2.86 | | | $ | 138,095 | | | | 51% | |
| $ | 10.04 | | | | 8.42 | | | | 0.84 | | | | 0.88 | | | | 3.44 | | | | 3.40 | | | $ | 114,496 | | | | 28% | |
| $ | 9.59 | | | | (1.69 | ) | | | 0.87 | | | | 1.12 | | | | 3.66 | | | | 3.41 | | | $ | 89,081 | | | | 15% | |
| $ | 9.95 | | | | 6.74 | | | | 0.95 | | | | 1.20 | | | | 4.05 | | | | 3.80 | | | $ | 86,981 | | | | 56% | |
| | | | | | | | | | | | | | | | | | | | | | | | | | | | | | |
| $ | 17.25 | | | | (5.09 | ) | | | 0.72 | 5 | | | 0.72 | 5 | | | 2.33 | | | | 2.33 | | | $ | 242,138 | | | | 9% | |
| $ | 18.75 | | | | 6.66 | | | | 0.72 | 5 | | | 0.72 | 5 | | | 2.33 | | | | 2.33 | | | $ | 271,495 | | | | 13% | |
| $ | 18.75 | | | | 22.06 | | | | 0.75 | | | | 0.76 | | | | 3.44 | | | | 3.43 | | | $ | 187,368 | | | | 44% | |
| $ | 17.17 | | | | 12.65 | | | | 0.75 | 13 | | | 0.78 | 13 | | | 3.56 | | | | 3.53 | | | $ | 200,855 | | | | 49% | |
| $ | 16.29 | | | | 12.49 | | | | 0.75 | | | | 0.79 | | | | 3.34 | | | | 3.30 | | | $ | 154,099 | | | | 62% | |
| $ | 14.95 | | | | 12.33 | | | | 0.74 | | | | 0.74 | | | | 3.85 | | | | 3.85 | | | $ | 121,240 | | | | 31% | |
119
| | |
| WASATCH FUNDS — Notes to Financial Highlights | | MARCH 31, 2013 (UNAUDITED) |
|
|
|
| 1 | Not annualized for periods less than one year. |
| 2 | Annualized for periods less than one year. |
| 3 | Portfolio turnover is calculated on the basis of the Fund as a whole without distinguishing between the classes of shares issued. |
| 4 | Represents amounts less than $.005 per share. |
| 5 | Includes interest expense of less than 0.01%. |
| 6 | Includes interest expenses of 0.01%. |
| 7 | Includes interest expense and dividend payments for securities sold short. The ratios excluding such expenses are listed below: |
| | | | | | | | | | |
| | | Expenses Net of
Waivers and
Reimbursements2 | | Expenses Before
Waivers and
Reimbursements2 |
Long/Short Fund — Investor Class | | | | | | | | | | |
Six Months ended 3/31/13 (unaudited) | | | | 1.25% | | | | | 1.25% | |
Year ended 9/30/12 | | | | 1.27% | | | | | 1.27% | |
Year ended 9/30/11 | | | | 1.30% | | | | | 1.30% | |
Year ended 9/30/10 | | | | 1.34% | 13 | | | | 1.34% | 13 |
Year ended 9/30/09 | | | | 1.47% | | | | | 1.52% | |
Period ended 9/30/0815 | | | | 1.46% | | | | | 1.71% | |
Year ended 3/31/08 | | | | 1.57% | | | | | 1.82% | |
| | |
Long/Short Fund — Institutional Class | | | | | | | | | | |
Period ended 3/31/13 (unaudited)18 | | | | 1.17% | | | | | 1.27% | |
| | |
Micro Cap Value Fund | | | | | | | | | | |
Year ended 9/30/09 | | | | 2.25% | | | | | 2.45% | |
| | |
Strategic Income Fund | | | | | | | | | | |
Year ended 9/30/10 | | | | 0.95% | 13 | | | | 1.29% | 13 |
Year ended 9/30/09 | | | | 0.95% | | | | | 1.61% | |
Year ended 9/30/08 | | | | 0.95% | | | | | 1.44% | |
| 8 | Fund inception date was October 1, 2007. |
| 9 | Institutional Class inception date was January 31, 2012. |
| 10 | Fund inception date was January 31, 2012. |
| 11 | Fund inception date was April 26, 2011. |
| 12 | Includes extraordinary expenses of 0.01% (see Note 9). |
| 13 | Includes extraordinary expenses of less than 0.01% (see Note 9). |
| 14 | Fund inception date was November 17, 2008. |
| 15 | Effective September 19, 2008, the Fund changed its fiscal year end to September 30. |
| 16 | Average shares method used in calculation. |
| 17 | Fund inception date was December 13, 2012. |
| 18 | Institutional Class inception date was December 13, 2012. |
| 19 | The Net Asset Values for the End of Period include the pricing of some securities in foreign markets that were open for trading through March 31, 2013. However, the Total Returns are based on Net Asset Values calculated on March 28, 2013, which was the last trading day of the month for mutual funds available for sale in the U.S., including the Wasatch Funds. As a result, the Total Returns may not correspond to the Net Asset Values published in this report. |
See Notes to Financial Statements.
120
| | |
| WASATCH — Notes to Financial Statements | | MARCH 31, 2013 (UNAUDITED) |
|
|
|
1. ORGANIZATION
Wasatch Funds Trust (the “Trust”) is a Massachusetts business trust registered under the Investment Company Act of 1940, as amended (the “1940 Act”), as an open-end management investment company and consists of 20 series or funds (each a “Fund” and collectively the “Funds”). The Core Growth Fund, Emerging Markets Small Cap Fund, Global Opportunities Fund, Heritage Growth Fund, International Growth Fund, International Opportunities Fund, Large Cap Value Fund, Long/Short Fund, Micro Cap Fund, Micro Cap Value Fund, Small Cap Growth Fund, Small Cap Value Fund, Strategic Income Fund, Ultra Growth Fund, World Innovators Fund, Wasatch-1st Source Income Fund (“Income Fund”) (sub-advised), and Wasatch-Hoisington U.S. Treasury Fund (“U.S. Treasury Fund”) (sub-advised) are each diversified funds. The Emerging India Fund, Emerging Markets Select Fund and Frontier Emerging Small Countries Fund are non-diversified funds. Each Fund maintains its own investment objective.
On November 9, 2011, the Trust re-designated the shares of the Funds into Investor Class shares effective January 31, 2012, and authorized and designated a new Institutional Class of shares in the Funds. Currently, five funds offer Institutional Class shares: Core Growth Fund, Large Cap Value Fund and Small Cap Value Fund, which commenced operations on January 31, 2012, as well as the Emerging Markets Select Fund and Long/Short Fund, which commenced operations on December 13, 2012. Each class of shares for each Fund has identical rights and privileges except with respect to purchase minimums, distribution and service charges, shareholder services, voting rights on matters affecting a single class of shares, and the exchange and conversion features. The Funds have entered into an investment advisory agreement with Wasatch Advisors, Inc. (the “Advisor” or “Wasatch”) as investment advisor.
The Core Growth, Emerging India, Emerging Markets Select, Emerging Markets Small Cap, Frontier Emerging Small Countries, Global Opportunities, Heritage Growth, International Growth, International Opportunities, Large Cap Value, Long/Short, Micro Cap, Micro Cap Value, Small Cap Growth, Small Cap Value, Strategic Income, Ultra Growth and World Innovators Funds are referred to herein as the “Equity Funds.”
2. SIGNIFICANT ACCOUNTING POLICIES
The following is a summary of significant policies related to investments of the Funds held at March 31, 2013. These policies are in conformity with accounting principles generally accepted in the United States of America (“U.S. GAAP”).
Valuation of Securities — All investments in securities are recorded at their estimated fair value as described in Note 15.
Foreign Currency Translations — Values of investments denominated in foreign currencies are converted into U.S. dollars using the current exchange rates each business day. Purchases and sales of investments and dividend income are translated into U.S. dollars using the current prevailing exchange rate on the transaction date. The effect of changes
in foreign exchange rates on realized and unrealized gains or losses on securities is reflected as a component of such gains or losses. Transactions in foreign denominated assets may involve greater risks than domestic transactions.
At March 31, 2013, the foreign currencies held by the Funds were as follows (amounts in U.S. dollars):
| | | | | | | | |
| | | Cost of
Currency | | | Value of
Currency | |
Emerging India Fund | | | | | | | | |
Indian Rupee | | $ | 436,342 | | | $ | 436,341 | |
|
| |
Emerging Markets Small Cap Fund | | | | | | | | |
Brazilian Real | | $ | 336,391 | | | $ | 335,465 | |
Egyptian Pound | | | 1 | | | | 1 | |
Indian Rupee | | | 584,661 | | | | 584,661 | |
New Taiwan Dollar | | | 3,751,003 | | | | 3,751,003 | |
Moroccan Dirham | | | 1 | | | | 1 | |
| | | | | | | | |
| | $ | 4,672,057 | | | $ | 4,671,131 | |
| | | | | | | | |
|
| |
Global Opportunities Fund | | | | | | | | |
Australian Dollar | | $ | 4 | | | $ | 4 | |
Canadian Dollar | | | 3,246 | | | | 3,246 | |
Hong Kong Dollar | | | 33 | | | | 33 | |
Pound Sterling | | | 17 | | | | 18 | |
| | | | | | | | |
| | $ | 3,300 | | | $ | 3,301 | |
| | | | | | | | |
|
| |
International Growth Fund | | | | | | | | |
Australian Dollar | | $ | 37 | | | $ | 37 | |
Canadian Dollar | | | 16,282 | | | | 16,284 | |
Pound Sterling | | | 26 | | | | 26 | |
| | | | | | | | |
| | $ | 16,345 | | | $ | 16,347 | |
| | | | | | | | |
|
| |
International Opportunities Fund | | | | | | | | |
Indian Rupee | | $ | 15,326 | | | $ | 15,325 | |
|
| |
Small Cap Growth Fund | | | | | | | | |
Canadian Dollar | | $ | 31,997 | | | $ | 32,002 | |
|
| |
Strategic Income Fund | | | | | | | | |
Hong Kong Dollar | | $ | 2 | | | $ | 2 | |
|
| |
World Innovators Fund | | | | | | | | |
Japanese Yen | | $ | 8,440 | | | $ | 8,440 | |
|
| |
Investment in Securities and Related Investment Income — Security transactions are accounted for on the trade date. Gains or losses on securities sold are determined on the identified cost basis. Dividend income and distributions to shareholders are recorded on the ex-dividend date, except that certain dividends from foreign securities may be recorded after the ex-dividend date based on when the Fund is informed of the dividend. Interest income and estimated expenses are accrued daily. Bond discount and premiums are amortized using the interest method. To the extent dividends received from Limited Partnership and Real Estate Investment Trust securities include return of capital distributions; such distributions are recorded as income, and adjusted accordingly for tax purposes.
Expenses — The Funds contract for various services on a collective basis. Most expenses are directly attributable to each Fund and therefore are charged accordingly. Expenses that are not directly attributable to one or more Funds are
121
| | |
| WASATCH FUNDS — Notes to Financial Statements (continued) | | |
|
|
|
allocated among applicable Funds on an equitable and consistent basis considering such things as the nature and type of expense and the relative net assets of the Funds.
Use of Management Estimates — The preparation of financial statements in conformity with U.S. GAAP requires management to make estimates and assumptions that affect the reported amounts of assets and liabilities at the date of the financial statements and the reported changes in net assets during the reporting period. Actual results could differ from those estimates.
Guarantees and Indemnifications — In the normal course of business, the Funds enter into contracts that contain a variety of representations and warranties which provide general indemnifications. The maximum exposure under these arrangements is unknown, as this would involve future claims that may be made against the Funds and/or their affiliates that have not yet occurred. Based on experience, however, the risk of loss is expected to be remote.
Redemption Fees — The Funds deduct a fee of 2.00% from redemption proceeds on shares of the Funds held 60 days or less. Redemption fees retained by the Funds are credited to additional paid-in capital.
New Accounting Pronouncements — In December 2011, the International Accounting Standards Board (“IASB”) and the Financial Accounting Standards Board (“FASB”) issued Accounting Standards Update (“ASU”) No. 2011-11 “Disclosures about Offsetting Assets and Liabilities.” These common disclosure requirements are intended to help investors and other financial statement users to better assess the effect or potential effect of offsetting arrangements on a fund’s financial position. They also improve transparency in the reporting of how companies mitigate credit risk, including disclosure of related collateral pledged or received. In addition, ASU 2011-11 facilitates comparison between those entities that prepare their financial statements on the basis of U.S. GAAP and those entities that prepare their financial statements on the basis of International Financial Reporting Standards (“IFRS”). ASU 2011-11 requires entities to disclose gross and net information about instruments and transactions eligible for offset in the statement of financial position; and disclose instruments and transactions subject to an agreement similar to a master netting agreement (agreement with a counterparty that mitigates its credit exposure in the event of default. ASU 2011-11 is effective for fiscal years beginning on or after January 1, 2013, and interim periods within those annual periods. At this time, management is evaluating the implications of ASU 2011-11 and its impact on financial statements.
Other — Income, expenses, and realized and unrealized gains or losses on investments are allocated to each class of shares based on its relative net assets, except that each class separately bears expenses related specifically to that class, such as certain shareholder servicing fees.
3. SECURITIESAND OTHER INVESTMENTS
Repurchase Agreements — The Funds may engage in repurchase transactions. Under the terms of a typical repurchase agreement, a fund takes possession of an
underlying debt obligation subject to an obligation of the seller to repurchase and the fund to resell the obligation at an agreed upon price and time. The market value of the collateral must be at least equal at all times to the total amount of the repurchase obligation, including interest. Generally, in the event of counterparty default, the fund has the right to use the collateral to offset losses incurred.
Short Sales — The Long/Short Fund and to a lesser extent the other Equity Funds may enter into short sales whereby a fund sells a security it generally does not own (the security is borrowed), in anticipation of a decline in the security’s price. The initial amount of a short sale is recorded as a liability which is marked-to-market daily. Fluctuations in the value of the short liability are recorded as unrealized gains or losses. If a Fund shorts a security when also holding a long position in the security (a “short against the box”), as the security’s price declines, the short position increases in value, offsetting the long position’s decrease in value. The opposite effect occurs if the security’s price rises. A Fund realizes a gain or loss upon closing of the short sale (returning the security to the counterparty by way of purchase or delivery of a long position owned). Possible losses from short sales may be unlimited, whereas losses from security purchases cannot exceed the total amount invested. The Funds are liable to the buyer for any dividends payable on securities while those securities are in a short position. These dividends are an expense of the Funds. The Funds designate collateral consisting of cash, U.S. government securities or other liquid assets sufficient to collateralize the market value of short positions.
4. FINANCIAL DERIVATIVE INSTRUMENTS
Foreign Currency Contracts — The Funds may enter into foreign currency contracts to settle planned purchases or sales of securities or to protect against a possible loss resulting from the adverse change in the relationship between the U.S. dollar and a foreign currency involved in an underlying transaction. Foreign currency contracts are agreements between two parties to buy and sell a currency at a set price on a future date. The market value of a foreign currency contract fluctuates with changes in currency exchange rates. Foreign currency contracts are marked-to-market daily and the change in market value is recorded by a fund as unrealized appreciation or depreciation. When a foreign currency contract is closed, the fund records a realized gain or loss equal to the difference between the value at the time it was opened and the value at the time it was closed. These contracts may involve market risk in excess of the unrealized gain or loss reflected on the Schedule of Investments. In addition, a fund could be exposed to credit risk if a counterparty is unable or unwilling to meet the terms of the contracts or if the value of the currency changes unfavorably. In connection with these contracts, the Funds may segregate cash and/or securities in a sufficient amount as collateral in accordance with the terms of the respective contracts.
Options Transactions — The Equity Funds and the Income Fund may buy and sell put and call options and write covered put and call options, including over-the-counter options, on portfolio securities where the
122
completion of the obligation is dependent upon the credit standing of another party. Options are a type of derivative financial instrument. The Funds may invest in derivative financial instruments, including options, in order to manage risk or gain exposure to various other investments or markets. The risk in writing a call option is that a fund gives up the opportunity for profit if the market price of the security increases. The risk in writing a put option is that a fund may incur a loss if the market price of the security decreases and the option is exercised. The risk in buying an option is that a fund pays a premium whether or not the option is exercised. A fund also has the additional risk of not being able to enter into a closing transaction if a liquid secondary market does not exist. Possible losses from uncovered written options may be unlimited. Option contracts are valued daily and unrealized appreciation or depreciation is recorded. A fund will realize a gain or loss upon expiration or closing of the option transaction. When an option is exercised, the proceeds on sales for a written call option, the purchase cost for a written put option, or the cost of a security for a purchased put or call option is adjusted by the amount of premium received or paid. The Funds designate collateral consisting of cash, U.S. government securities or other liquid assets sufficient to collateralize the market value of written options.
5. DISTRIBUTIONS
Dividends from net investment income and net realized gains, if any, are declared and paid at least annually for all Funds, except for dividends from net investment income in five funds. The Income Fund declares and pays dividends monthly. The Large Cap Value, Long/Short, Strategic Income, and U.S. Treasury Funds declare and pay dividends quarterly. The amount of dividends and distributions from net investment income and net realized gains are determined in accordance with federal income tax regulations, which may differ from U.S. GAAP. The Funds may utilize earnings and profits distributed to shareholders on redemption of shares as part of the dividends paid deduction (tax equalization).
To the extent these book and tax differences are permanent in nature, such amounts are reclassified at the end of the fiscal year among additional paid-in capital, undistributed net investment income (loss), and undistributed net realized gains (losses) on investments and foreign currency translations.
6. PURCHASESAND SALESOF SECURITIES
Cost of investment securities purchased and proceeds from sales of investment securities, excluding U.S. government and short-term securities for the period ended March 31, 2013 are summarized below:
| | | | | | | | | | | | | | | | | | | | | | | | | | | | |
| | | Core Growth Fund | | | Emerging India Fund | | | Emerging
Markets Select Fund1 | | | Emerging
Markets Small Cap Fund | | | Frontier
Emerging Small Countries
Fund | | | Global
Opportunities
Fund | | | Heritage
Growth Fund | |
Purchases | | $ | 100,328,314 | | | $ | 4,096,639 | | | $ | 22,909,552 | | | $ | 435,043,734 | | | $ | 267,529,972 | | | $ | 46,600,276 | | | $ | 6,376,715 | |
Sales | | | 30,921,165 | | | | 2,532,685 | | | | 2,007,871 | | | | 271,637,075 | | | | 7,981,085 | | | | 34,311,054 | | | | 9,881,048 | |
| | | | | | | |
| | | International
Growth Fund | | | International
Opportunities
Fund | | | Large Cap
Value Fund | | | Long/Short
Fund | | | Micro Cap Fund | | | Micro Cap
Value Fund | | | Small Cap
Growth Fund | |
Purchases | | $ | 467,588,291 | | | $ | 67,156,172 | | | $ | 95,495,595 | | | $ | 501,049,331 | | | $ | 18,439,585 | | | $ | 38,619,351 | | | $ | 177,756,851 | |
Sales | | | 166,620,946 | | | | 52,752,560 | | | | 339,384,572 | | | | 361,459,151 | | | | 52,823,611 | | | | 54,151,677 | | | | 96,144,789 | |
| | | | | | | |
| | | Small Cap
Value Fund | | | Strategic
Income Fund | | | Ultra Growth
Fund | | | World
Innovators
Fund | | | Income Fund | | | | | | | |
Purchases | | $ | 27,763,079 | | | $ | 11,775,240 | | | $ | 16,212,239 | | | $ | 75,124,306 | | | $ | 14,003,430 | | | | | | | | | |
Sales | | | 42,656,847 | | | | 7,546,509 | | | | 29,168,615 | | | | 58,437,527 | | | | 16,119,396 | | | | | | | | | |
| 1 | Inception date of the Fund was December 13, 2012. |
Purchases and sales of U.S. government securities in the Income Fund were $9,041,730 and $8,272,634, respectively. Purchases and sales of U.S. government securities in the U.S. Treasury Fund were $22,075,692 and $38,910,471, respectively.
123
| | |
| WASATCH FUNDS — Notes to Financial Statements (continued) | | |
|
|
|
7. OPTIONS CONTRACTS WRITTEN
Options written activity during the period ended March 31, 2013 was as follows:
| | | | | | | | | | | | | | | | | | | | | | | | |
| | | Options
Outstanding at
9/30/2012 | | | Written | | | Closed | | | Exercised | | | Expired | | | Options
Outstanding at
3/31/2013 | |
Core Growth Fund | | | | | | | | | | | | | | | | | | | | | | | | |
Premium amount | | $ | 150,916 | | | $ | — | | | $ | — | | | $ | — | | | $ | (150,916 | ) | | $ | — | |
Number of contracts | | | 1,050 | | | | — | | | | — | | | | — | | | | (1,050 | ) | | | — | |
Long/Short Fund | | | | | | | | | | | | | | | | | | | | | | | | |
Premium amount | | $ | 8,653,127 | | | $ | 11,392,953 | | | $ | (681,090 | ) | | $ | (6,042,473 | ) | | $ | (3,507,309 | ) | | $ | 9,815,208 | |
Number of contracts | | | 38,020 | | | | 40,945 | | | | (2,864 | ) | | | (23,991 | ) | | | (19,432 | ) | | | 32,678 | |
Micro Cap Value Fund | | | | | | | | | | | | | | | | | | | | | | | | |
Premium amount | | $ | 255,255 | | | $ | 952,621 | | | $ | (519,098 | ) | | $ | (482,069 | ) | | $ | (76,076 | ) | | $ | 130,633 | |
Number of contracts | | | 795 | | | | 4,385 | | | | (2,262 | ) | | | (1,543 | ) | | | (455 | ) | | | 920 | |
Small Cap Value Fund | | | | | | | | | | | | | | | | | | | | | | | | |
Premium amount | | $ | 134,261 | | | $ | — | | | $ | — | | | $ | — | | | $ | (134,261 | ) | | $ | — | |
Number of contracts | | | 600 | | | | — | | | | — | | | | — | | | | (600 | ) | | | — | |
8. FEDERAL INCOME TAX INFORMATION
It is each Fund’s policy to comply with the requirements of the Internal Revenue Code applicable to regulated investment companies and to distribute substantially all taxable income to shareholders. The Funds are no longer subject to examination by tax authorities for years prior to 2009. At this time, management believes there are no uncertain tax positions which, based on their technical merit, would not be sustained upon examination and for which it is reasonably possible that the total of amounts of unrecognized tax benefits will significantly change in the next 12 months. Accordingly, no provision for federal income or excise taxes has been made.
As of March 31, 2013, the cost and unrealized appreciation (depreciation) of securities on a tax basis were as follows:
| | | | | | | | | | | | | | | | | | | | | | | | | | | | |
| | | Core
Growth
Fund | | | Emerging
India
Fund | | | Emerging
Markets
Select
Fund | | | Emerging
Markets
Small Cap
Fund | | | Frontier
Emerging
Small
Countries
Fund | | | Global
Opportunities
Fund | | | Heritage
Growth
Fund | |
Cost | | $ | 549,415,238 | | | $ | 13,210,559 | | | $ | 21,865,558 | | | $ | 1,463,477,603 | | | $ | 310,741,153 | | | $ | 145,237,303 | | | $ | 90,464,079 | |
| | | | |
Gross appreciation | | $ | 241,916,254 | | | $ | 1,851,242 | | | $ | 1,021,360 | | | $ | 430,197,825 | | | $ | 38,789,590 | | | $ | 55,110,961 | | | $ | 35,170,904 | |
Gross (depreciation) | | | (13,638,172 | ) | | | (617,157 | ) | | | (320,266 | ) | | | (29,010,947 | ) | | | (2,829,627 | ) | | | (2,761,211 | ) | | | (5,333,245 | ) |
| | | | |
Net appreciation | | $ | 228,278,082 | | | $ | 1,234,085 | | | $ | 701,094 | | | $ | 401,186,878 | | | $ | 35,959,963 | | | $ | 52,349,750 | | | $ | 29,837,659 | |
| | | | |
| | | | | | | |
| | | International
Growth
Fund | | | International
Opportunities
Fund | | | Large Cap
Value
Fund | | | Long/Short
Fund | | | Micro Cap
Fund | | | Micro Cap
Value
Fund | | | Small Cap
Growth
Fund | |
Cost | | $ | 704,130,054 | | | $ | 177,882,110 | | | $ | 911,020,549 | | | $ | 1,437,433,603 | | | $ | 205,461,529 | | | $ | 113,223,375 | | | $ | 1,442,097,680 | |
| | | | |
Gross appreciation | | $ | 166,895,237 | | | $ | 74,378,397 | | | $ | 353,165,937 | | | $ | 246,566,374 | | | $ | 108,084,609 | | | $ | 37,427,087 | | | $ | 699,545,564 | |
Gross (depreciation) | | | (4,748,577 | ) | | | (2,444,796 | ) | | | (8,859,828 | ) | | | (25,430,817 | ) | | | (25,117,446 | ) | | | (2,709,541 | ) | | | (49,259,312 | ) |
| | | | |
Net appreciation | | $ | 162,146,660 | | | $ | 71,933,601 | | | $ | 344,306,109 | | | $ | 221,135,557 | | | $ | 82,967,163 | | | $ | 34,717,546 | | | $ | 650,286,252 | |
| | | | |
| | | | | | | |
| | | Small Cap
Value
Fund | | | Strategic
Income
Fund | | | Ultra
Growth
Fund | | | World
Innovators
Fund | | | Income
Fund | | | U.S. Treasury
Fund | | | | |
Cost | | $ | 146,129,875 | | | $ | 45,727,485 | | | $ | 116,502,610 | | | $ | 164,749,698 | | | $ | 129,918,020 | | | $ | 213,285,663 | | | | | |
| | | | | | | | |
Gross appreciation | | $ | 48,364,522 | | | $ | 9,291,850 | | | $ | 37,176,713 | | | $ | 30,642,665 | | | $ | 4,369,232 | | | $ | 24,142,623 | | | | | |
Gross (depreciation) | | | (6,617,882 | ) | | | (1,569,753 | ) | | | (12,788,756 | ) | | | (1,783,083 | ) | | | (250,747 | ) | | | (2,186,673 | ) | | | | |
| | | | | | | | |
Net appreciation | | $ | 41,746,640 | | | $ | 7,722,097 | | | $ | 24,387,957 | | | $ | 28,859,582 | | | $ | 4,118,485 | | | $ | 21,955,950 | | | | | |
| | | | | | | | |
124
The difference between book-basis and tax-basis unrealized gains are primarily attributable to the tax deferral of losses on wash sales, unrealized appreciation on passive foreign investment companies and other temporary tax adjustments.
The components of accumulated earnings on a tax basis as of September 30, 2012 were as follows:
| | | | | | | | | | | | | | | | | | | | |
| | | Core
Growth
Fund | | | Emerging
India
Fund | | | Emerging
Markets
Small Cap
Fund | | | Frontier
Emerging Small
Countries
Fund | | | Global
Opportunities
Fund | |
Undistributed ordinary income | | $ | — | | | $ | — | | | $ | 5,219,469 | | | $ | 198,763 | | | $ | — | |
Undistributed capital gains | | | — | | | | — | | | | — | | | | — | | | | 17,205,439 | |
| | | | |
Accumulated earnings | | | — | | | | — | | | | 5,219,469 | | | | 198,763 | | | | 17,205,439 | |
Accumulated capital and other losses | | | (37,897,392 | ) | | | (859,376 | ) | | | (64,012,504 | ) | | | — | | | | (843,378 | ) |
Other undistributed ordinary losses | | | — | | | | (82,053 | ) | | | — | | | | (75,714 | ) | | | (9,566 | ) |
Net unrealized appreciation* | | | 162,377,571 | | | | 1,116,249 | | | | 226,894,941 | | | | 3,576,997 | | | | 41,225,199 | |
| | | | |
Total accumulated earnings | | $ | 124,480,179 | | | $ | 174,820 | | | $ | 168,101,906 | | | $ | 3,700,046 | | | $ | 57,577,694 | |
| | | | |
| | | | | |
| | | Heritage
Growth
Fund | | | International
Growth
Fund | | | International
Opportunities
Fund | | | Large Cap
Value
Fund | | | Long/Short
Fund | |
Undistributed ordinary income | | $ | — | | | $ | 1,909,496 | | | $ | — | | | $ | — | | | $ | — | |
Undistributed capital gains | | | 4,136,609 | | | | — | | | | — | | | | — | | | | 3,814,650 | |
| | | | |
Accumulated earnings | | | 4,136,609 | | | | 1,909,496 | | | | — | | | | — | | | | 3,814,650 | |
Accumulated capital and other losses | | | (128,088 | ) | | | (32,020,626 | ) | | | (7,234,180 | ) | | | (828,517 | ) | | | (1,627,098 | ) |
Other undistributed ordinary losses | | | — | | | | — | | | | (16,820 | ) | | | (61,013 | ) | | | — | |
Net unrealized appreciation* | | | 19,942,913 | | | | 99,565,576 | | | | 39,733,954 | | | | 259,730,988 | | | | 92,348,571 | |
| | | | |
Total accumulated earnings | | $ | 23,951,434 | | | $ | 69,454,446 | | | $ | 32,482,954 | | | $ | 258,841,458 | | | $ | 94,536,123 | |
| | | | |
| | | | | |
| | | Micro Cap
Fund | | | Micro Cap
Value
Fund | | | Small Cap
Growth
Fund | | | Small Cap
Value
Fund | | | Strategic
Income
Fund | |
Undistributed ordinary income | | $ | — | | | $ | — | | | $ | — | | | $ | — | | | $ | — | |
Undistributed capital gains | | | — | | | | 11,281,937 | | | | 104,861,904 | | | | — | | | | — | |
| | | | |
Accumulated earnings | | | — | | | | 11,281,937 | | | | 104,861,904 | | | | — | | | | — | |
Accumulated capital and other losses | | | (45,119,796 | ) | | | (523,723 | ) | | | (9,492,107 | ) | | | (97,665,048 | ) | | | (4,565,592 | ) |
Other undistributed ordinary losses | | | — | | | | — | | | | — | | | | — | | | | (16,379 | ) |
Net unrealized appreciation* | | | 69,001,436 | | | | 29,440,210 | | | | 501,098,883 | | | | 23,776,621 | | | | 2,901,048 | |
| | | | |
Total accumulated earnings (deficit) | | $ | 23,881,640 | | | $ | 40,198,424 | | | $ | 596,468,680 | | | ($ | 73,888,427 | ) | | ($ | 1,680,923 | ) |
| | | | |
| | | | | |
| | | Ultra
Growth
Fund | | | World
Innovators
Fund | | | Income
Fund | | | U.S.
Treasury
Fund | | | | |
Undistributed ordinary income | | $ | — | | | $ | — | | | $ | 75,618 | | | $ | 143,701 | | | | | |
Undistributed capital gains | | | 16,570,757 | | | | — | | | | — | | | | 5,092,077 | | | | | |
| | | | | | | | |
Accumulated earnings | | | 16,570,757 | | | | — | | | | 75,618 | | | | 5,235,778 | | | | | |
Accumulated capital and other losses | | | (730,134 | ) | | | (8,750,695 | ) | | | (714,842 | ) | | | — | | | | | |
Other undistributed ordinary losses | | | — | | | | — | | | | (38,635 | ) | | | (131,654 | ) | | | | |
Net unrealized appreciation* | | | 20,747,535 | | | | 18,805,340 | | | | 5,160,705 | | | | 38,195,618 | | | | | |
| | | | | | | | |
Total accumulated earnings | | $ | 36,588,158 | | | $ | 10,054,645 | | | $ | 4,482,846 | | | $ | 43,299,742 | | | | | |
| | | | | | | | |
| *On | investments, securities sold short, derivative and foreign currency denominated assets and liabilities. |
Capital loss carryforwards are available through the date specified below to offset future realized net capital gains for federal income tax purposes. Future capital loss carryover utilization in any given year may be subject to Internal Revenue Code limitations. To the extent future gains are offset by capital loss carryforwards, such gains will not be distributed.
125
| | |
| WASATCH FUNDS — Notes to Financial Statements (continued) | | |
|
|
|
Capital loss carryforwards as of September 30, 2012 are as follows:
| | | | | | | | | | | | | | | | |
| Fund | | 2014 | | | 2016 | | | 2017 | | | 2018 | |
Core Growth Fund | | $ | — | | | $ | — | | | $ | — | | | $ | 35,409,803 | |
Emerging Markets Small Cap Fund | | | — | | | | — | | | | 3,795,857 | | | | 6,828,580 | |
International Growth Fund | | | — | | | | — | | | | — | | | | 26,072,123 | |
Micro Cap Fund | | | — | | | | — | | | | — | | | | 41,372,871 | |
Small Cap Value Fund | | | — | | | | — | | | | 30,914,092 | | | | 63,852,620 | |
Strategic Income Fund | | | — | | | | — | | | | — | | | | 4,565,592 | |
World Innovators Fund | | | — | | | | — | | | | — | | | | 7,292,881 | |
Income Fund | | | 153,117 | | | | 561,725 | | | | — | | | | — | |
On December 22, 2010, The Regulated Investment Company Modernization Act of 2010 (the “Modernization Act”) was signed by the President of the United States of America. Under the Modernization Act, a Fund will be permitted to carry forward capital losses incurred in taxable years beginning after December 22, 2010 for an unlimited period. Post-enactment losses that are carried forward will retain their character as either short-term or long-term capital losses rather than being considered all short-term as under previous law. However, any losses incurred during those future taxable years will be required to be utilized prior to the losses incurred in pre-enactment taxable years, which carry an expiration date. As a result of this ordering rule, pre-enactment capital loss carryforwards may be more likely to expire unused.
Capital loss carryforwards as of September 30, 2012 with no expiration are as follows:
| | | | |
| Fund | | Short Term | |
Emerging India Fund | | $ | 93,466 | |
Emerging Markets Small Cap Fund | | | 12,120,230 | |
International Growth Fund | | | 417,006 | |
International Opportunities Fund | | | 6,940,313 | |
The Funds have elected to defer losses incurred from November 1, 2011 through September 30, 2012 in accordance with federal income tax rules. These losses are treated as having arisen on the first day of the following fiscal year. The Funds have elected to defer losses as follows:
| | | | | | | | |
| Fund | | Post-October
Capital Losses | | | Late-year Ordinary
Losses | |
Core Growth Fund | | $ | — | | | $ | 2,487,589 | |
Emerging India Fund | | | 733,297 | | | | 32,613 | |
Emerging Markets Small Cap Fund | | | 41,267,837 | | | | — | |
Global Opportunities Fund | | | — | | | | 843,378 | |
Heritage Growth Fund | | | — | | | | 128,088 | |
International Growth Fund | | | 5,531,497 | | | | — | |
International Opportunities Fund | | | — | | | | 293,867 | |
Large Cap Value Fund | | | 828,517 | | | | — | |
Long/Short Fund | | | — | | | | 1,627,098 | |
Micro Cap Fund | | | — | | | | 3,746,925 | |
Micro Cap Value Fund | | | — | | | | 523,723 | |
Small Cap Growth Fund | | | — | | | | 9,492,107 | |
Small Cap Value Fund | | | 1,969,866 | | | | 928,470 | |
Ultra Growth Fund | | | — | | | | 730,134 | |
World Innovators Fund | | | 382,290 | | | | 1,075,524 | |
During the tax year ended September 30, 2012, the Funds used capital loss carryforwards in the following amounts:
| | | | |
| Fund | | Amount Used | |
Core Growth Fund | | $ | 45,997,138 | |
Large Cap Value Fund | | | 23,080,189 | |
Long/Short Fund | | | 3,699,489 | |
Micro Cap Fund | | | 28,091,429 | |
Micro Cap Value Fund | | | 298,445 | |
Small Cap Value Fund | | | 15,799,053 | |
Strategic Income Fund | | | 2,323,842 | |
World Innovators Fund | | | 8,422,188 | |
Income Fund | | | 568,391 | |
126
The tax character of distributions paid during the year ended September 30, 2012 was as follows:
| | | | | | | | | | | | | | | | | | | | | | |
| 2012 | | Core
Growth
Fund | | | Emerging
India Fund | | | Emerging
Markets
Small Cap
Fund | | | Frontier
Emerging
Small
Countries
Fund | | | Global
Opportunities
Fund | | | |
Ordinary income | | $ | — | | | $ | 82,637 | | | $ | — | | | $ | — | | | $ | — | | | |
Capital gain | | | — | | | | — | | | | — | | | | — | | | | 18,174,913 | | | |
| | | | | | |
Total | | $ | — | | | $ | 82,637 | | | $ | — | | | $ | — | | | $ | 18,174,913 | | | |
| | | | | | |
| | | | | | |
| 2012 | | Heritage
Growth
Fund | | | International
Growth
Fund | | | International
Opportunities
Fund | | | Large Cap
Value Fund | | | Long/Short
Fund | | | |
Ordinary income | | $ | — | | | $ | — | | | $ | — | | | $ | 21,818,495 | | | $ | — | | | |
Capital gain | | | 1,097,280 | | | | — | | | | 17,671,323 | | | | — | | | | — | | | |
| | | | | | |
Total | | $ | 1,097,280 | | | $ | — | | | $ | 17,671,323 | | | $ | 21,818,495 | | | $ | — | | | |
| | | | | | |
| | | | | | |
| 2012 | | Micro
Cap Fund | | | Micro Cap
Value Fund | | | Small Cap
Growth Fund | | | Small Cap
Value Fund | | | Strategic
Income Fund | | | |
Ordinary income | | $ | — | | | $ | — | | | $ | — | | | $ | — | | | $ | 880,410 | | | |
Capital gain | | | — | | | | — | | | | 62,046,614 | | | | — | | | | — | | | |
| | | | | | |
Total | | $ | — | | | $ | — | | | $ | 62,046,614 | | | $ | — | | | $ | 880,410 | | | |
| | | | | | |
| | | | | | |
| 2012 | | Ultra
Growth
Fund | | | World
Innovators
Fund | | | Income Fund | | | U.S.
Treasury
Fund | | | | | | |
Ordinary income | | $ | — | | | $ | — | | | $ | 2,775,995 | | | $ | 5,618,367 | | | | | | | |
Capital gain | | | 7,674,675 | | | | — | | | | — | | | | 9,334,135 | | | | | | | |
| | | | | | | | | | |
Total | | $ | 7,674,675 | | | $ | — | | | $ | 2,775,995 | | | $ | 14,952,502 | | | | | | | |
| | | | | | | | | | |
The tax character of distributions paid during the year ended September 30, 2011 was as follows:
| | | | | | | | | | | | | | | | | | | | | | | | |
| 2011 | | Core Growth Fund | | | Emerging
India Fund | | | Emerging
Markets
Small Cap
Fund | | | Global
Opportunities
Fund | | | Heritage
Growth
Fund | | | International
Growth
Fund | |
Ordinary income | | $ | — | | | $ | — | | | $ | 86,408 | | | $ | 1,872,935 | | | $ | 653,414 | | | $ | — | |
Capital gain | | | — | | | | — | | | | — | | | | 7,528,532 | | | | 5,614 | | | | — | |
| | | | |
Total | | $ | — | | | $ | — | | | $ | 86,408 | | | $ | 9,401,467 | | | $ | 659,028 | | | $ | — | |
| | | | |
| | | | | | |
| 2011 | | International
Opportunities
Fund | | | Large Cap
Value Fund | | | Long/Short
Fund | | | Micro Cap Fund | | | Micro Cap
Value
Fund | | | Small Cap
Growth
Fund | |
Ordinary income | | $ | — | | | $ | 21,370,753 | | | $ | 300,223 | | | $ | — | | | $ | — | | | $ | — | |
Capital gain | | | 4,411,467 | | | | — | | | | — | | | | — | | | | — | | | | — | |
| | | | |
Total | | $ | 4,411,467 | | | $ | 21,370,753 | | | $ | 300,223 | | | $ | — | | | $ | — | | | $ | — | |
| | | | |
| | | | | | |
| 2011 | | Small Cap
Value Fund | | | Strategic
Income
Fund | | | Ultra
Growth
Fund | | | World
Innovators
Fund | | | Income
Fund | | | U.S.
Treasury
Fund | |
Ordinary income | | $ | — | | | $ | 762,128 | | | $ | — | | | $ | — | | | $ | 3,218,058 | | | $ | 5,596,881 | |
Capital gain | | | — | | | | — | | | | — | | | | — | | | | — | | | | 10,250,028 | |
| | | | |
Total | | $ | — | | | $ | 762,128 | | | $ | — | | | $ | — | | | $ | 3,218,058 | | | $ | 15,846,909 | |
| | | | |
The tax character of distributions paid may differ from that shown in the Statements of Changes in Net Assets due to short-term gains being treated as ordinary income for tax purposes.
127
| | |
| WASATCH FUNDS — Notes to Financial Statements (continued) | | |
|
|
|
9. RELATED PARTY TRANSACTIONS
Investment Advisory Fees, Expense Limitations — As the Funds’ investment advisor, the Advisor receives a monthly fee calculated on average daily net assets. The Advisor has contractually agreed to waive its fees and/or reimburse certain Funds should a Fund’s operating expenses exceed a specified annual limitation through at least January 31, 2014. If operating expenses are less than the specified expense limit for the Fund, the Advisor shall be entitled to reimbursement of the fees waived or reduced to the extent that the operating expenses and the amounts reimbursed do not exceed such expense limit for the Fund, under the period of the agreement (currently the 12 months commencing January 31, 2013). Such reimbursement shall be paid only while the expense limitation agreement is in effect and only if such amount paid, together with all other amounts reimbursed under this agreement in the fiscal year, does not cause the Fund to exceed the expense limitation. All amounts not recovered at the end of the period expire on January 31, 2014. Ordinary operating expenses exclude any interest, taxes, brokerage commissions, other investment-related costs and extraordinary expenses, such as litigation and other expenses not incurred in the ordinary course of the Fund’s business. The costs of the Proxy Statement related to the identification and shareholder approval of Trustee Nominees were treated as extraordinary expenses in the 2010 fiscal year. The impact of these payments is reflected in the net expense ratios in the Financial Highlights. Investment advisory fees and fees waived, if any, for the period ended March 31, 2013 are disclosed in the Statements of Operations. Investment advisory fee and expense limitation annual rates are shown below.
| | | | | | | | | | | | | | | | | | |
| Fund | | Advisory
Fee | | Expense
Limitation Investor Class | | | Expense Limitation Institutional Class | | | Contractual Expense
Limitation/
Reimbursement
Recoverable
Expiration Date | | | Reimbursement
Recoverable | |
Core Growth Fund | | 1.00% | | | 1.50 | % | | | 1.12 | % | | | 01/31/2014 | | | $ | 5,383 | |
Emerging India Fund | | 1.50% | | | 1.95 | % | | | N/A | | | | 01/31/2014 | | | | 18,842 | |
Emerging Markets Select Fund | | 1.25% | | | 1.69 | % | | | 1.50 | % | | | 01/31/2014 | | | | 37,041 | |
Emerging Markets Small Cap Fund | | 1.75% | | | 1.95 | % | | | N/A | | | | 01/31/2014 | | | | 319,780 | |
Frontier Emerging Small Countries Fund | | 1.75% | | | 2.25 | % | | | N/A | | | | 01/31/2014 | | | | 53,909 | |
Global Opportunities Fund | | 1.50% | | | 1.95 | % | | | N/A | | | | 01/31/2014 | | | | — | |
Heritage Growth Fund | | 0.70% | | | 0.95 | % | | | N/A | | | | 01/31/2014 | | | | 7,661 | |
International Growth Fund | | 1.25% | | | 1.75 | % | | | N/A | | | | 01/31/2014 | | | | — | |
International Opportunities Fund | | 1.95% | | | 2.25 | % | | | N/A | | | | 01/31/2014 | | | | 53,309 | |
Large Cap Value Fund | | 0.90% | | | 1.10 | % | | | 0.98 | % | | | 01/31/2014 | | | | 123,402 | |
Long/Short Fund | | 1.10% | | | N/A | | | | 1.17 | % | | | 01/31/2014 | | | | 8,594 | |
Micro Cap Fund | | 1.95% | | | 2.25 | % | | | N/A | | | | 01/31/2014 | | | | — | |
Micro Cap Value Fund | | 1.95% | | | 2.25 | % | | | N/A | | | | 01/31/2014 | | | | — | |
Small Cap Growth Fund | | 1.00% | | | 1.50 | % | | | N/A | | | | 01/31/2014 | | | | — | |
Small Cap Value Fund | | 1.00% | | | 1.50 | % | | | 1.15 | % | | | 01/31/2014 | | | | 6,189 | |
Strategic Income Fund | | 0.70% | | | 0.95 | % | | | N/A | | | | 01/31/2014 | | | | 8,843 | |
Ultra Growth Fund | | 1.00% | | | 1.50 | % | | | N/A | | | | 01/31/2014 | | | | — | |
World Innovators Fund | | 1.50% | | | 1.95 | % | | | N/A | | | | 01/31/2014 | | | | — | |
Income Fund | | 0.55% | | | N/A | | | | N/A | | | | N/A | | | | N/A | |
U.S. Treasury Fund | | 0.50% | | | 0.75 | % | | | N/A | | | | 01/31/2014 | | | | — | |
Affiliated Trades — Certain Funds are permitted to purchase or sell securities from or to certain related affiliated funds under specified conditions outlined in procedures adopted by the Board of Trustees. The procedures have been designed to ensure that any purchase or sale of securities by the Funds from or to another fund (or funds) that are, or could be, considered an affiliate by virtue of having a common investment advisor (or affiliated investment advisors), common Trustees and/or common officers complies with Rule 17a-7 of the 1940 Act. Further, each transaction is effected at the current market price, as that term is defined under the procedures. During the period ended March 31, 2013, the Funds had no purchases or sales of securities pursuant to Rule 17a-7 of the 1940 Act.
Institutional Class Legal Fees — As disclosed in the annual report dated September 30, 2011, the Board approved a multi-class plan pursuant to which the Board has established and designated two classes for each series known as Institutional Class shares and Investor Class shares. The Advisor paid the legal costs associated with the establishment and designation of the new share classes for existing funds.
Payments by Advisor — During the 2012 fiscal year the Advisor discovered a trade allocation error involving several of the Wasatch Funds. In August 2012, the Advisor reimbursed the Global Opportunities Fund $1,167, the Micro Cap Fund $1,074, the Micro Cap Value Fund $1,282, the Small Cap growth Fund $46,199, the Ultra Growth Fund $940 and the World Innovators Fund $437 as reimbursement for the error plus interest. The impact of these payments is reflected in the net expense ratios in the Financial Highlights.
128
10% Shareholders — As of March 31, 2013, the Funds had individual shareholder accounts and/or omnibus shareholder accounts (comprised of a group of individual shareholders), which individually amounted to more than 10% of the total shares outstanding of the fund as detailed below:
| | | | | | | | |
| | | Number of
Accounts | | | % of Shares
Outstanding | |
Core Growth Fund | | | 2 | | | | 56.22 | |
Emerging India Fund | | | 1 | | | | 26.32 | |
Emerging Markets Select Fund | | | 2 | | | | 68.74 | |
Emerging Markets Small Cap Fund | | | 2 | | | | 64.44 | |
Frontier Emerging Small Countries Fund | | | 2 | | | | 82.42 | |
Global Opportunities Fund | | | 2 | | | | 61.88 | |
Heritage Growth Fund | | | 2 | | | | 48.49 | |
International Growth Fund | | | 2 | | | | 56.53 | |
International Opportunities Fund | | | 2 | | | | 61.94 | |
Large Cap Value Fund | | | 3 | | | | 78.00 | |
Long/Short Fund | | | 2 | | | | 67.54 | |
Micro Cap Fund | | | 2 | | | | 29.32 | |
Micro Cap Value Fund | | | 2 | | | | 50.54 | |
Small Cap Growth Fund | | | 2 | | | | 49.82 | |
Small Cap Value Fund | | | 2 | | | | 31.30 | |
Strategic Income Fund | | | 3 | | | | 69.02 | |
Ultra Growth Fund | | | 2 | | | | 48.03 | |
World Innovators Fund | | | 2 | | | | 41.34 | |
Income Fund | | | 2 | | | | 85.50 | |
U.S. Treasury Fund | | | 3 | | | | 50.31 | |
Affiliated Interests — As of March 31, 2013, Wasatch Advisors, Inc. and its affiliates, and the retirement plans of Wasatch Advisors, Inc. and its affiliates, held shares which may be redeemed at any time as detailed below:
| | | | | | | | |
| | | Number of
Accounts* | | | % of Shares
Outstanding | |
Core Growth Fund | | | 15 | | | | 0.40 | |
Emerging India Fund | | | 17 | | | | 18.87 | |
Emerging Markets Select Fund | | | 12 | | | | 4.97 | |
Emerging Markets Small Cap Fund | | | 22 | | | | 0.24 | |
Frontier Emerging Small Countries Fund | | | 26 | | | | 1.81 | |
Global Opportunities Fund | | | 25 | | | | 1.83 | |
Heritage Growth Fund | | | 9 | | | | 3.70 | |
International Growth Fund | | | 13 | | | | 0.56 | |
International Opportunities Fund | | | 20 | | | | 2.55 | |
Large Cap Value Fund | | | 12 | | | | 0.17 | |
Long/Short Fund | | | 14 | | | | 0.16 | |
Micro Cap Fund | | | 10 | | | | 0.70 | |
Micro Cap Value Fund | | | 12 | | | | 1.89 | |
Small Cap Growth Fund | | | 20 | | | | 1.34 | |
Small Cap Value Fund | | | 8 | | | | 1.67 | |
Strategic Income Fund | | | 5 | | | | 20.27 | |
Ultra Growth Fund | | | 6 | | | | 1.19 | |
World Innovators Fund | | | 10 | | | | 1.67 | |
Income Fund | | | 2 | | | | 0.01 | |
U.S. Treasury Fund | | | 5 | | | | 0.75 | |
| *Multiple | accounts with the same beneficial owner are treated as one account. |
Payments by Former Service Provider — BISYS Fund Services, Inc. (“BISYS”) is a former service provider to the Large Cap Value Fund, Long/Short Fund and Income Fund. In August 2010, these funds received a one-time payment from the BISYS Fair Fund (a fund established pursuant to a settlement between the SEC and BISYS that requires, among other things, a distribution of settlement monies from the Fair Fund to benefit affected mutual funds). The impact of these payments is reflected in the net expense ratios in the Financial Highlights.
129
| | |
| WASATCH FUNDS — Notes to Financial Statements (continued) | | |
|
|
|
10. TRANSACTIONSWITH AFFILIATES
If a Fund’s holding represents ownership of 5% or more of the voting securities of a company, the company is deemed to be an affiliate as defined by the 1940 Act. The following Funds conducted transactions during the period ended March 31, 2013 with an “affiliated company” as so defined:
| | | | | | | | | | | | | | | | | | | | | | | | |
| | | Share Activity | | | Dividends
Credited to Income for the
period ended
3/31/13 | | | Gain (Loss)
Realized on
Sale of Shares
for the period ended
3/31/13 | |
| | | Balance
9/30/12 | | | Purchases /
Additions | | | Sales /
Reductions | | | Balance
3/31/13 | | | |
Long/Short Fund | | | | | | | | | | | | | | | | | | | | | | | | |
Silicon Graphics International Corp.* | | | 2,802,900 | | | | 58,400 | | | | 173,862 | | | | 2,687,438 | | | $ | — | | | $ | (398,986 | ) |
|
| |
Micro Cap Fund | | | | | | | | | | | | | | | | | | | | | | | | |
Goldwater Bank, N.A. | | | 154,000 | | | | — | | | | — | | | | 154,000 | | | $ | — | | | $ | — | |
|
| |
Small Cap Growth Fund | | | | | | | | | | | | | | | | | | | | | | | | |
Blue Nile, Inc. | | | 654,903 | | | | 302,916 | | | | — | | | | 957,819 | | | $ | — | | | $ | — | |
Cempra, Inc.** | | | 846,015 | | | | 536,317 | | | | | | | | 1,382,332 | | | | — | | | | — | |
Knight Transportation, Inc. | | | 4,655,806 | | | | 136,592 | | | | — | | | | 4,792,398 | | | | 2,971,287 | | | | — | |
NeurogesX, Inc. | | | 3,882,558 | | | | — | | | | — | | | | 3,882,558 | | | | — | | | | — | |
zooplus AG | | | 275,513 | | | | 32,789 | | | | — | | | | 308,302 | | | | — | | | | — | |
| *On | August 29, 2012, a Schedule 13D was filed for Silicon Graphics International Corp. (“the Company”) on behalf of the Advisor and the Wasatch Long/Short Fund, including the portfolio managers Michael L. Shinnick and Ralph C. Shive (“Reporting Persons”). |
| **The | purchases include 446,414 shares of a private investment in a public equity (PIPE) whose registration statement became effective January 25, 2013. |
11. RESTRICTED SECURITIES
The Funds may own investments that were purchased through private placement transactions or under Rule 144A of the Securities Act of 1933 (the “Securities Act”) and cannot be sold without prior registration under the Securities Act or may be limited due to certain restrictions. These securities are generally deemed to be illiquid and are valued at fair value as determined by a designated Pricing Committee of the Advisor (“Pricing Committee”), comprised of personnel of the Advisor, with oversight by the Board of Trustees and in accordance with Board-approved Pricing Policies and Procedures. If and when such securities are registered, the costs of registering such securities are paid by the issuer. At March 31, 2013, the Funds held the following restricted securities:
| | | | | | | | | | | | | | | | |
| | | Security
Type | | Acquisition
Date | | Acquisition
Cost | | | Fair
Value | | | Value as %
of Net Assets | |
Global Opportunities Fund | | | | | | | | | | | | | | | | |
Cardica, Inc. | | Warrants | | 9/25/09 | | $ | 5,000 | | | $ | 2,000 | | | | — | |
|
| |
Micro Cap Fund | | | | | | | | | | | | | | | | |
Cardica, Inc. | | Warrants | | 9/25/09 | | $ | 40,312 | | | $ | 16,125 | | | | 0.01 | % |
Goldwater Bank, N.A. | | Common Stock | | 2/28/07 | | | 1,540,000 | | | | 50,820 | | | | 0.01 | % |
NeurogesX, Inc. | | Warrants | | 7/21/11 | | | 18,169 | | | | — | | | | — | |
| | | | | | | | |
| | | | | | $ | 1,598,481 | | | $ | 66,945 | | | | 0.02 | % |
|
| |
Micro Cap Value Fund | | | | | | | | | | | | | | | | |
Acetylon Pharmaceuticals, Inc., Series B | | Preferred Stock | | 2/3/11 - 5/25/12 | | $ | 499,999 | | | $ | 625,262 | | | | 0.43 | % |
Cardica, Inc. | | Warrants | | 9/25/09 | | | 13,813 | | | | 5,525 | | | | — | |
Goldwater Bank, N.A. | | Common Stock | | 2/28/07 | | | 419,000 | | | | 13,827 | | | | 0.01 | % |
Idaho Trust Bancorp | | Common Stock | | 8/30/06 | | | 500,004 | | | | 186,668 | | | | 0.13 | % |
NeurogesX, Inc. | | Warrants | | 7/21/11 | | | 6,250 | | | | — | | | | — | |
| | | | | | | | |
| | | | | | $ | 1,439,066 | | | $ | 831,282 | | | | 0.57 | % |
|
| |
Small Cap Growth Fund | | | | | | | | | | | | | | | | |
Greenspring Global Partners II-B, L.P. | | LP Interest | | 10/10/03 - 1/16/13 | | $ | 4,643,853 | | | $ | 4,376,480 | | | | 0.21 | % |
Greenspring Global Partners III-B, L.P. | | LP Interest | | 3/16/06 - 1/16/13 | | | 1,365,000 | | | | 1,614,172 | | | | 0.08 | % |
Nanosys, Inc., Series D | | Preferred Stock | | 11/8/05 | | | 2,000,000 | | | | 828,407 | | | | 0.04 | % |
Nanosys, Inc., Series E | | Preferred Stock | | 8/13/10 | | | 184,939 | | | | 197,360 | | | | 0.01 | % |
NeurogesX, Inc. | | Warrants | | 7/21/11 | | | 242,660 | | | | — | | | | — | |
Zonare Medical Systems, Inc. | | Common Stock | | 6/30/04 | | | 1,500,000 | | | | 247 | | | | — | |
| | | | | | | | |
| | | | | | $ | 9,936,452 | | | $ | 7,016,666 | | | | 0.34 | % |
|
| |
130
| | | | | | | | | | | | | | | | |
| | | Security
Type | | Acquisition
Date | | Acquisition
Cost | | | Fair
Value | | | Value as %
of Net Assets | |
Strategic Income Fund | | | | | | | | | | | | | | | | |
Redcorp Ventures Ltd., 13.00%, 7/11/12 | | Corporate Bonds | | 7/5/07 | | $ | 153,634 | | | $ | 1,044 | | | | — | |
Star Asia Financial Ltd. | | Common Stock | | 2/22/07 - 3/19/10 | | | 305,812 | | | | 266,786 | | | | 0.50 | % |
Star Asia SPV, LLC | | LLC Membership Interest | | 3/19/10 | | | 457,316 | | | | 98,144 | | | | 0.18 | % |
| | | | | | | | |
| | | | | | $ | 925,378 | | | $ | 365,974 | | | | 0.68 | % |
|
| |
Ultra Growth Fund | | | | | | | | | | | | | | | | |
Cardica, Inc. | | Warrants | | 9/25/09 | | $ | 20,625 | | | $ | 8,250 | | | | 0.01 | % |
Data Sciences International, Inc., Series B | | Preferred Stock | | 1/20/06 | | | 475,001 | | | | 802,213 | | | | 0.57 | % |
Greenspring Global Partners II-B, L.P. | | LP Interest | | 10/10/03 - 1/16/13 | | | 4,179,467 | | | | 3,938,828 | | | | 2.80 | % |
Greenspring Global Partners III-B, L.P. | | LP Interest | | 3/16/06 - 1/16/13 | | | 1,365,000 | | | | 1,614,172 | | | | 1.15 | % |
Nanosys, Inc., Series D | | Preferred Stock | | 11/8/05 | | | 500,001 | | | | 207,102 | | | | 0.15 | % |
Nanosys, Inc., Series E | | Preferred Stock | | 8/13/10 | | | 46,235 | | | | 49,340 | | | | 0.03 | % |
NeurogesX, Inc. | | Warrants | | 7/21/11 | | | 5,451 | | | | — | | | | — | |
Ophthonix, Inc. | | Common Stock | | 9/23/05 | | | 499,998 | | | | — | | | | — | |
TherOx, Inc., Series I | | Preferred Stock | | 7/7/05 | | | 1,000,000 | | | | 2,439 | | | | — | |
Xtera Communications, Inc. | | Common Stock | | 9/3/03 | | | 99,065 | | | | 914 | | | | — | |
Zonare Medical Systems, Inc. | | Common Stock | | 6/30/04 | | | 1,000,000 | | | | 165 | | | | — | |
| | | | | | | | |
| | | | | | $ | 9,190,843 | | | $ | 6,623,423 | | | | 4.71 | % |
|
| |
World Innovators Fund | | | | | | | | | | | | | | | | |
Cardica, Inc. | | Warrants | | 9/25/09 | | $ | 8,938 | | | $ | 3,575 | | | | — | |
Greenspring Global Partners II-B, L.P. | | LP Interest | | 10/10/03 - 1/16/13 | | | 464,387 | | | | 437,652 | | | | 0.23 | % |
Xtera Communications, Inc. | | Common Stock | | 9/3/03 | | | 7,076 | | | | 65 | | | | — | |
| | | | | | | | |
| | | | | | $ | 480,401 | | | $ | 441,292 | | | | 0.23 | % |
12. PURCHASE COMMITMENTS
In September 2003, the Small Cap Growth, Ultra Growth and World Innovators Funds entered into subscription agreements to acquire limited partnership interests in Greenspring Global Partners II-B, L.P. The remaining commitment amounts at March 31, 2013 were $300,000, $270,000 and $30,000, respectively.
In December 2005, the Small Cap Growth and Ultra Growth Funds entered into subscription agreements to acquire limited partnership interests in Greenspring Global Partners III-B, L.P. The remaining commitment amounts at March 31, 2013 were $135,000, per Fund.
Securities held by the Funds have been designated to meet these purchase commitments as indicated in the Schedules of Investments.
13. LINEOF CREDIT
The Equity Funds opened two lines of credit totaling $75,000,000, one of which is $25,000,000 uncommitted, and the other of which is $50,000,000 committed, with State Street Bank and Trust Company on June 4, 2007 (together, the “Line”). As of May 25, 2012, the Board approved use of the Line by all funds in the Trust. The Line is for temporary or emergency purposes such as to provide liquidity for shareholder redemptions. The Funds incur commitment fees on the undrawn portion of the committed part of the Line, and interest expense to the extent of amounts drawn (borrowed) under the entire Line. Interest is based on the higher of (a) the Federal Funds rate as in effect on the date of borrowing, plus a margin, or (b) the overnight London Interbank Offered Rate (LIBOR) as in effect on the date of borrowing, plus a margin. Commitment fees are pro-rated among the Funds based upon relative average net assets. Interest expense is charged directly to a fund based upon actual amounts borrowed by the Fund.
For the period ended March 31, 2013, the following Funds had borrowings:
| | | | | | | | | | | | | | | | | | | | |
| | | Average Daily
Borrowings | | | Number of
Days
Outstanding | | | Interest
Expense | | | Weighted
Average
Annualized
Interest Rate | | | Balance at
March 31, 2013 | |
Emerging India Fund | | $ | 524,031 | | | | 20 | | | | 342 | | | | 1.18 | % | | $ | 400,929 | |
Emerging Markets Small Cap Fund | | | 451,183 | | | | 1 | | | | 15 | | | | 1.18 | % | | | — | |
Frontier Emerging Small Countries Fund | | | 1,504,623 | | | | 1 | | | | 49 | | | | 1.18 | % | | | — | |
Global Opportunities Fund | | | 1,416,711 | | | | 15 | | | | 699 | | | | 1.18 | % | | | — | |
Micro Cap Fund | | | 309,031 | | | | 2 | | | | 20 | | | | 1.18 | % | | | — | |
Small Cap Value Fund | | | 437,497 | | | | 6 | | | | 86 | | | | 1.18 | % | | | — | |
Ultra Growth Fund | | | 812,701 | | | | 19 | | | | 509 | | | | 1.19 | % | | | — | |
131
| | |
| WASATCH FUNDS — Notes to Financial Statements (continued) | | |
|
|
|
14. PRINCIPAL RISKS
Market and Credit Risk — In the normal course of business the Funds trade financial instruments and enter into financial transactions where risk of loss exists due to changes in the market (market risk) or failure of the other party to a transaction to perform (credit risk). Similar to credit risk, the Funds may be exposed to counterparty risk, or the risk that an institution or other entity with which the Funds have unsettled or open transactions will default. The potential loss could exceed the value of the financial assets recorded in the financial statements. Financial assets, which potentially expose the Funds to credit risk, consist principally of cash due from counterparties and investments. The extent of the Funds’ exposure to credit and counterparty risks with respect to these financial assets approximates their carrying value as recorded in the Funds’ Statements of Assets and Liabilities.
Non-Diversification Risk — A non-diversified fund can invest a larger portion of its assets in the stocks of a limited number of companies than a diversified fund, which means it may have more exposure to the price movements of a single security or small group of securities than funds that diversify their investments among many companies. The Emerging India, Emerging Markets Select and Frontier Emerging Small Countries Funds are non-diversified.
Inflation Risk — Inflation risk is the possibility that inflation will reduce the purchasing power of a currency, and subsequently reduce the value of a security or asset, and may result in rising interest rates. Inflation is the overall upward price movement of goods and services in an economy that causes the value of a currency to decline.
Interest Rate Risk — Interest rate risk is the risk that fixed income securities will decline in value because of changes in interest rates. A rise in interest rates typically causes a fall in values. Interest rate risk should be modest for shorter-term securities, moderate for intermediate-term securities and high for longer-term securities. Generally, an increase in the average maturity of a fund will make it more sensitive to interest rate risk. The interest rate is the amount charged, expressed as a percentage of principal, by a lender to a borrower for the use of assets.
Foreign Currency Risk — If a fund invests directly in foreign currencies or in securities that trade in, and receive revenues in, foreign currencies, or in derivatives that provide exposure to foreign currencies, it will be subject to the risk that those currencies will decline in value relative to the U.S. dollar. This also includes the risk associated with higher transaction costs, delayed settlements, currency controls and adverse economic developments related to foreign investments.
Region Risk — The Funds invest in equity and fixed income securities of non-U.S. issuers. Although the Funds maintain diversified investment portfolios, political or economic developments within a particular country or region may have an adverse effect on the ability of domiciled issuers to meet their obligations. These risks are exaggerated for securities of issuers tied economically to emerging and frontier market countries. Additionally, political or economic developments may have an adverse effect on the liquidity and volatility of portfolio securities and currency holdings.
Shareholder Concentration Risk — A significant portion of the net assets of the Frontier Emerging Small Countries Fund and International Opportunities Fund are owned by a group of shareholders advised by a common investment advisor. If this group of shareholders simultaneously redeems on the advice of their investment advisor, Fund expenses may increase and performance may be materially affected. However, the Advisor has contractually agreed to waive its fees and/or reimburse the Frontier Emerging Small Countries Fund and the International Opportunities Fund should their operating expenses exceed 2.25% through at least January 31, 2014.
15. SECURITIES VALUATION
Equity securities (common and preferred stock) — Securities are valued as of the close of the New York Stock Exchange (generally 4:00 p.m. Eastern Time) on the valuation date. Equity securities are valued using a commercial pricing service at the last quoted sales price taken from the primary market in which each security trades and, with respect to equity securities traded on NASDAQ, such securities are valued using the NASDAQ Official Closing Price (“NOCP”) or last sales price if no NOCP is available. If there are no sales on the primary exchange or market on a day, then the security shall be valued at the mean of the last bid and ask price on the primary exchange or market as provided by a pricing service. If the mean cannot be calculated or there is no trade activity on a day, then the security shall be valued at the previous trading day’s price as provided by a pricing service. In some instances, particularly on foreign exchanges, an official close or evaluated price may be used if the pricing service is unable to provide the last trade or most recent mean price. To the extent that these securities are actively traded and valuation adjustments are not applied, they are categorized in level 1 of the fair value hierarchy (see Note 16). Additionally, a fund’s investments are valued at fair value by the Pricing Committee if the Advisor determines that an event impacting the value of an investment occurred between the closing time of a security’s primary market or exchange (for example, a foreign exchange or market) and the time the fund’s share price is calculated. Significant events include, but are not limited to the following: significant fluctuations in domestic markets, foreign markets or foreign currencies; occurrences not directly tied to the securities markets such as natural disasters, armed conflicts or significant governmental actions; and major announcements affecting a single issuer or an entire market or market sector. In responding to a significant event, the Pricing Committee determines the fair value of affected securities by considering factors including, but not limited to: index options and futures traded subsequent to the close; American Depositary Receipts (“ADRs”), Global Depositary Receipts (“GDRs”) or other related receipts; currency spot or forward markets that trade after pricing of the foreign exchange; other derivative securities traded after the close such as Standard & Poor’s Depositary
132
Receipts (“SPDRs”) and other exchange traded funds (“ETFs”); and alternative market quotes on the affected securities. When applicable, the Funds use a systematic fair valuation model provided by an independent third party to assist in adjusting the valuation of foreign securities. When a Fund uses this fair value pricing method, the values assigned to the fund’s foreign securities may not be the quoted or published prices of the investments on their primary markets or exchanges and the securities are categorized in level 2 of the fair value hierarchy. These valuation procedures apply equally to long or short equity positions in a fund.
Corporate debt securities — Investments are valued at current market value by a pricing service, or by using the last sale or bid price based on observable inputs. Observable inputs may include benchmark yields, reported trades, broker/dealer quotes, issuer spreads, two-sided markets, benchmark securities, bids, offers and reference data including market research publications. Although most corporate bonds are categorized in level 2 of the fair value hierarchy, in instances where observable inputs are not available, they are categorized as level 3.
Short-term notes — Investments maturing in 60 days or less at the time of purchase, are generally valued at amortized cost, unless it is determined that the amortized cost method would not represent fair value, in which case the securities are marked-to-market. To the extent the inputs are observable and timely, the values would be categorized in level 2 of the fair value hierarchy.
Asset-backed securities — Investments are priced using the closing bid as supplied by a pricing service based on observable inputs. Observable inputs may include benchmark yields, reported trades, broker/dealer quotes, issuer spreads, two-sided markets, benchmark securities, bids, offers and reference data including market research publications, new issue data, monthly payment information and collateral performance. Although most asset-backed securities are categorized in level 2 of the fair value hierarchy, in instances where observable inputs are not available, they are categorized as level 3.
U.S. government issuers — Investments are priced using the closing bid as supplied by a pricing service based on observable inputs. Observable inputs may include benchmark yields, reported trades, broker/dealer quotes, issuer spreads, two-sided markets, benchmark securities, bids, offers and reference data including market research publications. Although most U.S. government bonds are categorized in level 2 of the fair value hierarchy, in instances where observable inputs are not available, they are categorized as level 3.
Derivative instruments — Listed derivatives that are actively traded are valued based on quoted prices from the exchange and are categorized in level 1 of the fair value hierarchy. Exchange-traded options are valued at the last sale price in the market where they are principally traded. If there are no sales on the primary exchange or market on a given day, then the option is valued at the mean of the last bid price and ask price on the primary exchange or market as provided by a pricing service.
Restricted securities — If market quotations are not readily available for the Funds’ investments in securities such as restricted securities, private placements, securities for which trading has been halted or other illiquid securities, these investments are valued at fair value in accordance with Board-approved Pricing Policies and Procedures by the Pricing Committee with oversight by the Board of Trustees. Fair value is defined as the price that would be received upon the sale of an asset, or paid to transfer a liability, in an orderly transaction between market participants at the measurement date under current market conditions. For each applicable investment that is fair valued, the Pricing Committee considers, to the extent applicable, various factors including, but not limited to, the financial condition of the company or limited partnership, operating results, prices paid in follow-on rounds, comparable companies in the public market, the nature and duration of the restrictions for holding the securities, a stated net asset value (NAV) for the partnership, if applicable, and other relevant factors. Depending on the relative significance of valuation inputs, these instruments may be classified in either level 2 or level 3 of the fair value hierarchy.
As of March 31, 2013, the aggregate amount of fair valued securities, excluding any foreign securities fair valued pursuant to a systematic fair valuation model, as a percentage of net assets for the Funds was as follows:
| | | | |
| | | % of
Net Assets | |
Core Growth Fund | | | — | |
Emerging India Fund | | | — | |
Emerging Markets Select Fund | | | — | |
Emerging Markets Small Cap Fund | | | — | |
Frontier Emerging Small Countries Fund | | | — | |
Global Opportunities Fund | | | <0.01 | % |
Heritage Growth Fund | | | — | |
International Growth Fund | | | — | |
International Opportunities Fund | | | — | |
Large Cap Value Fund | | | — | |
Long/Short Fund | | | — | |
Micro Cap Fund | | | 0.06 | % |
Micro Cap Value Fund | | | 0.57 | % |
Small Cap Growth Fund | | | 0.34 | % |
Small Cap Value Fund | | | — | |
Strategic Income Fund | | | 0.19 | % |
Ultra Growth Fund | | | 4.71 | % |
World Innovators Fund | | | 0.23 | % |
Income Fund | | | — | |
U.S. Treasury Fund | | | — | |
133
| | |
| WASATCH FUNDS — Notes to Financial Statements (continued) | | |
|
|
|
16. FAIR VALUE MEASUREMENTS
The Funds use various methods to measure the fair value of most of their investments on a recurring basis. U.S. GAAP established a hierarchy that prioritizes inputs to valuation methods. The three levels of inputs are:
| | Ÿ | | Level 1 — Unadjusted quoted prices in active markets for identical assets or liabilities that the Funds have the ability to access. |
| | Ÿ | | Level 2 — Observable inputs other than quoted prices included in level 1 that are observable for the asset or liability, either directly or indirectly. The inputs may include quoted prices for the identical investment on an inactive market, prices for similar investments, interest rates, prepayment speeds, credit risk, yield curves, default rates and similar data. |
| | Ÿ | | Level 3 — Unobservable inputs for the asset or liability, to the extent relevant observable inputs are not available, representing the Funds’ own assumptions about the assumptions a market participant would use in valuing the asset or liability, and would be based on the best information available. |
The availability of observable inputs can vary from security to security and is affected by a wide variety of factors, including, for example, the type of security, whether a security is new and not yet established in the marketplace, the liquidity of markets, and other characteristics particular to the security. To the extent that valuation is based on models or inputs that are less observable or unobservable in the market, the determination of fair value requires more judgment. Accordingly, the degree of judgment exercised in determining fair value is greatest for instruments categorized in level 3.
The Funds’ policy is to recognize transfers between levels at the end of the reporting period.
The following is a summary of the fair valuations according to the inputs used as of March 31, 2013 in valuing the Funds’ assets and liabilities:
| | | | | | | | | | | | | | | | | | |
| Fund | | Category | | Quoted Prices in Active Markets
for Identical
Investments
(Level 1) | | | Significant Other
Observable Inputs
(Level 2) | | | Significant
Unobservable
Inputs
(Level 3) | | | Value at
3/31/13 | |
Core Growth Fund | | | | | | | | | | | | | | | | | | |
Assets | | | | | | | | | | | | | | | | | | |
Common Stocks | | | | $ | 688,877,355 | | | $ | — | | | $ | — | | | $ | 688,877,355 | |
Preferred Stocks | | | | | 5,857,565 | | | | — | | | | — | | | | 5,857,565 | |
Short-Term Investments | | | | | — | | | | 82,958,400 | | | | — | | | | 82,958,400 | |
| | | | | | |
| | | | $ | 694,734,920 | | | $ | 82,958,400 | | | $ | — | | | $ | 777,693,320 | |
| | | | | | |
Emerging India Fund | | | | | | | | | | | | | | | | | | |
Assets | | | | | | | | | | | | | | | | | | |
Common Stocks | | | | $ | 14,444,644 | | | $ | — | | | $ | — | | | $ | 14,444,644 | |
| | | | | | |
Emerging Markets Select Fund | | | | | | | | | | | | | | | | | | |
Assets | | | | | | | | | | | | | | | | | | |
Common Stocks | | Diversified Banks | | $ | 2,593,136 | | | $ | 1,295,573 | | | $ | — | | | $ | 3,888,709 | |
| | Food Retail | | | 1,288,219 | | | | 1,284,255 | | | | — | | | | 2,572,474 | |
| | Marine Ports & Services | | | — | | | | 679,755 | | | | — | | | | 679,755 | |
| | Real Estate Operating Companies | | | 621,927 | | | | 667,057 | | | | — | | | | 1,288,984 | |
| | Other | | | 12,883,184 | | | | | | | | — | | | | 12,883,184 | |
Short-Term Investments | | | | | — | | | | 1,253,546 | | | | — | | | | 1,253,546 | |
| | | | | | |
| | | | $ | 17,386,466 | | | $ | 5,180,186 | | | $ | — | | | $ | 22,566,652 | |
| | | | | | |
Emerging Markets Small Cap Fund | | | | | | | | | | | | | | | | | | |
Assets | | | | | | | | | | | | | | | | | | |
Common Stocks | | Computer & Electronics Retail | | $ | — | | | $ | 17,200,487 | | | $ | — | | | $ | 17,200,487 | |
| | Diversified Banks | | | 78,141,494 | | | | 61,702,330 | | | | — | | | | 139,843,824 | |
| | Home Improvement Retail | | | 17,107,191 | | | | 39,808,128 | | | | — | | | | 56,915,319 | |
| | Hotels, Resorts & Cruise Lines | | | — | | | | 43,356,503 | | | | — | | | | 43,356,503 | |
| | Hypermarkets & Super Centers | | | 39,099,180 | | | | 57,496,276 | | | | — | | | | 96,595,456 | |
| | Marine Ports & Services | | | 21,689,054 | | | | 29,400,823 | | | | — | | | | 51,089,877 | |
| | Packaged Foods & Meats | | | 87,815,444 | | | | 38,724,735 | | | | — | | | | 126,540,179 | |
| | Other | | | 1,228,781,640 | | | | — | | | | — | | | | 1,228,781,640 | |
Preferred Stocks | | | | | 33,848,775 | | | | — | | | | — | | | | 33,848,775 | |
Short-Term Investments | | | | | — | | | | 70,492,421 | | | | — | | | | 70,492,421 | |
| | | | | | |
| | | | $ | 1,506,482,778 | | | $ | 358,181,703 | | | $ | — | | | $ | 1,864,664,481 | |
| | | | | | |
134
| | | | | | | | | | | | | | | | | | |
| Fund | | Category | | Quoted Prices in Active Markets
for Identical
Investments
(Level 1) | | | Significant Other
Observable Inputs
(Level 2) | | | Significant
Unobservable
Inputs
(Level 3) | | | Value at
3/31/13 | |
Frontier Emerging Small Countries Fund | | | | | | | | | | | | | | | | | | |
Assets | | | | | | | | | | | | | | | | | | |
Common Stocks | | Food Retail | | $ | 6,957,978 | | | $ | 4,641,865 | | | $ | — | | | $ | 11,599,843 | |
| | Marine Ports & Services | | | 4,203,388 | | | | 3,136,744 | | | | — | | | | 7,340,132 | |
| | Packaged Foods & Meats | | | 70,784,850 | | | | 6,409,423 | | | | — | | | | 77,194,273 | |
| | Other | | | 226,877,221 | | | | — | | | | — | | | | 226,877,221 | |
Short-Term Investments | | | | | — | | | | 23,689,647 | | | | — | | | | 23,689,647 | |
| | | | | | |
| | | | $ | 308,823,437 | | | $ | 37,877,679 | | | $ | — | | | $ | 346,701,116 | |
| | | | | | |
Global Opportunities Fund | | | | | | | | | | | | | | | | | | |
Assets | | | | | | | | | | | | | | | | | | |
Common Stocks | | Diversified Banks | | $ | 6,878,700 | | | $ | 2,114,107 | | | $ | — | | | $ | 8,992,807 | |
| | Hypermarkets & Super Centers | | | 1,867,920 | | | | 1,589,551 | | | | — | | | | 3,457,471 | |
| | Marine Ports & Services | | | 1,653,605 | | | | 2,752,677 | | | | — | | | | 4,406,282 | |
| | Oil & Gas Equipment & Services | | | 2,596,401 | | | | 2,309,490 | | | | — | | | | 4,905,891 | |
| | Other | | | 169,276,699 | | | | — | | | | — | | | | 169,276,699 | |
Warrants | | | | | — | | | | — | | | | 2,000 | | | | 2,000 | |
Short-Term Investments | | | | | — | | | | 6,545,903 | | | | — | | | | 6,545,903 | |
| | | | | | |
| | | | $ | 182,273,325 | | | $ | 15,311,728 | | | $ | 2,000 | | | $ | 197,587,053 | |
| | | | | | |
Heritage Growth Fund | | | | | | | | | | | | | | | | | | |
Assets | | | | | | | | | | | | | | | | | | |
Common Stocks | | | | $ | 111,402,049 | | | $ | — | | | $ | — | | | $ | 111,402,049 | |
Short-Term Investments | | | | | — | | | | 9,003,455 | | | | — | | | | 9,003,455 | |
| | | | | | |
| | | | $ | 111,402,049 | | | $ | 9,003,455 | | | $ | — | | | $ | 120,405,504 | |
| | | | | | |
International Growth Fund | | | | | | | | | | | | | | | | | | |
Assets | | | | | | | | | | | | | | | | | | |
Common Stocks | | Diversified Banks | | $ | — | | | $ | 8,253,254 | | | $ | — | | | $ | 8,253,254 | |
| | Hypermarkets & Super Centers | | | 7,152,733 | | | | 13,292,279 | | | | — | | | | 20,445,012 | |
| | Marine Ports & Services | | | — | | | | 14,626,481 | | | | — | | | | 14,626,481 | |
| | Oil Gas Equipment & Services | | | 19,683,189 | | | | 11,126,660 | | | | — | | | | 30,809,849 | |
| | Other | | | 741,217,533 | | | | — | | | | — | | | | 741,217,533 | |
Short-Term Investments | | | | | — | | | | 50,924,585 | | | | — | | | | 50,924,585 | |
| | | | | | |
| | | | $ | 768,053,455 | | | $ | 98,223,259 | | | $ | — | | | $ | 866,276,714 | |
| | | | | | |
International Opportunities Fund | | | | | | | | | | | | | | | | | | |
Assets | | | | | | | | | | | | | | | | | | |
Common Stocks | | Brewers | | $ | 4,788,679 | | | $ | 2,744,643 | | | $ | — | | | $ | 7,533,322 | |
| | Building Products | | | 3,114,446 | | | | 2,595,966 | | | | — | | | | 5,710,412 | |
| | Construction Materials | | | — | | | | 2,162,597 | | | | — | | | | 2,162,597 | |
| | Diversified Banks | | | — | | | | 3,412,072 | | | | — | | | | 3,412,072 | |
| | Food Distributors | | | — | | | | 3,129,025 | | | | — | | | | 3,129,025 | |
| | Food Retail | | | 7,922,235 | | | | 4,176,342 | | | | — | | | | 12,098,577 | |
| | Hypermarkets & Super Centers | | | — | | | | 2,772,191 | | | | — | | | | 2,772,191 | |
| | Packaged Foods & Meats | | | 30,698,065 | | | | 6,567,718 | | | | — | | | | 37,265,783 | |
| | Other | | | 167,332,010 | | | | — | | | | — | | | | 167,332,010 | |
Short-Term Investments | | | | | — | | | | 8,399,722 | | | | — | | | | 8,399,722 | |
| | | | | | |
| | | | $ | 213,855,435 | | | $ | 35,960,276 | | | $ | — | | | $ | 249,815,711 | |
| | | | | | |
Large Cap Value Fund | | | | | | | | | | | | | | | | | | |
Assets | | | | | | | | | | | | | | | | | | |
Common Stocks | | | | $ | 1,154,467,288 | | | $ | — | | | $ | — | | | $ | 1,154,467,288 | |
Short-Term Investments | | | | | — | | | | 100,859,370 | | | | — | | | | 100,859,370 | |
| | | | | | |
| | | | $ | 1,154,467,288 | | | $ | 100,859,370 | | | $ | — | | | $ | 1,255,326,658 | |
| | | | | | |
135
| | |
| WASATCH FUNDS — Notes to Financial Statements (continued) | | |
|
|
|
| | | | | | | | | | | | | | | | | | |
| Fund | | Category | | Quoted Prices in Active Markets
for Identical
Investments
(Level 1) | | | Significant Other
Observable Inputs
(Level 2) | | | Significant
Unobservable
Inputs
(Level 3) | | | Value at
3/31/13 | |
Long/Short Fund | | | | | | | | | | | | | | | | | | |
Assets | | | | | | | | | | | | | | | | | | |
Common Stocks | | | | $ | 1,505,235,555 | | | $ | — | | | $ | — | | | $ | 1,505,235,555 | |
Short-Term Investments | | | | | — | | | | 349,751,080 | | | | — | | | | 349,751,080 | |
| | | | | | |
| | | | $ | 1,505,235,555 | | | $ | 349,751,080 | | | $ | — | | | $ | 1,854,986,635 | |
| | | | | | |
Liabilities | | | | | | | | | | | | | | | | | | |
Equity Contracts | | | | $ | (9,098,678 | ) | | $ | — | | | $ | — | | | $ | (9,098,678 | ) |
Securities Sold Short | | | | | (187,318,797 | ) | | | — | | | | — | | | | (187,318,797 | ) |
| | | | | | |
| | | | $ | (196,417,475 | ) | | $ | — | | | $ | — | | | $ | (196,417,475 | ) |
| | | | | | |
Micro Cap Fund | | | | | | | | | | | | | | | | | | |
Assets | | | | | | | | | | | | | | | | | | |
Common Stocks | | Biotechnology | | $ | 7,434,935 | | | $ | — | | | $ | 5,662 | | | $ | 7,440,597 | |
| | Health Care Equipment | | | 12,746,881 | | | | — | | | | 89,430 | | | | 12,836,311 | |
| | Specialized Finance | | | — | | | | — | | | | 50,820 | | | | 50,820 | |
| | Other | | | 252,310,666 | | | | — | | | | — | | | | 252,310,666 | |
Preferred Stocks | | | | | 2,603,828 | | | | — | | | | — | | | | 2,603,828 | |
Warrants | | | | | — | | | | — | | | | 16,125 | | | | 16,125 | |
Short-Term Investments | | | | | — | | | | 13,170,345 | | | | — | | | | 13,170,345 | |
| | | | | | |
| | | | $ | 275,096,310 | | | $ | 13,170,345 | | | $ | 162,037 | | | $ | 288,428,692 | |
| | | | | | |
Micro Cap Value Fund | | | | | | | | | | | | | | | | | | |
Assets | | | | | | | | | | | | | | | | | | |
Common Stocks | | Construction Materials | | $ | 2,872,320 | | | $ | 2,163,223 | | | $ | — | | | $ | 5,035,543 | |
| | Diversified Banks | | | 2,150,874 | | | | 1,963,783 | | | | 186,668 | | | | 4,301,325 | |
| | Oil & Gas Equipment & Services | | | — | | | | 520,815 | | | | — | | | | 520,815 | |
| | Packaged Foods & Meats | | | 5,450,573 | | | | 1,268,026 | | | | — | | | | 6,718,599 | |
| | Specialized Finance | | | — | | | | — | | | | 13,827 | | | | 13,827 | |
| | Other | | | 119,568,425 | | | | — | | | | — | | | | 119,568,425 | |
Preferred Stocks | | Pharmaceuticals | | | — | | | | — | | | | 625,262 | | | | 625,262 | |
| | Other | | | 1,580,158 | | | | — | | | | — | | | | 1,580,158 | |
Warrants | | | | | — | | | | — | | | | 5,525 | | | | 5,525 | |
Short-Term Investments | | | | | — | | | | 9,877,259 | | | | — | | | | 9,877,259 | |
| | | | | | |
| | | | $ | 131,622,350 | | | $ | 15,793,106 | | | $ | 831,282 | | | $ | 148,246,738 | |
| | | | | | |
Liabilities | | | | | | | | | | | | | | | | | | |
| | | | $ | (191,800 | ) | | $ | — | | | $ | — | | | $ | (191,800 | ) |
| | | | | | |
| | | | $ | (191,800 | ) | | $ | — | | | $ | — | | | $ | (191,800 | ) |
| | | | | | |
Small Cap Growth Fund | | | | | | | | | | | | | | | | | | |
Assets | | | | | | | | | | | | | | | | | | |
Common Stocks | | Biotechnology | | $ | 79,491,419 | | | $ | — | | | $ | 38,825 | | | $ | 79,530,244 | |
| | Health Care Equipment | | | 31,765,377 | | | | — | | | | 247 | | | | 31,765,624 | |
| | Oil & Gas Equipment & Services | | | 63,793,448 | | | | 18,840,924 | | | | — | | | | 82,634,372 | |
| | Other | | | 1,707,588,637 | | | | — | | | | — | | | | 1,707,588,637 | |
Preferred Stocks | | | | | — | | | | — | | | | 1,025,767 | | | | 1,025,767 | |
Limited Partnership Interest | | | | | — | | | | — | | | | 5,990,652 | | | | 5,990,652 | |
Short-Term Investments | | | | | — | | | | 183,848,636 | | | | — | | | | 183,848,636 | |
| | | | | | |
| | | | $ | 1,882,638,881 | | | $ | 202,689,560 | | | $ | 7,055,491 | | | $ | 2,092,383,932 | |
| | | | | | |
Small Cap Value Fund | | | | | | | | | | | | | | | | | | |
Assets | | | | | | | | | | | | | | | | | | |
Common Stocks | | Oil & Gas Equipment & Services | | $ | 2,780,003 | | | $ | 1,292,404 | | | | — | | | $ | 4,072,407 | |
| | Other | | | 179,413,097 | | | | — | | | | — | | | | 179,413,097 | |
Short-Term Investments | | | | | — | | | | 4,391,011 | | | | — | | | | 4,391,011 | |
| | | | | | |
| | | | $ | 182,193,100 | | | $ | 5,683,415 | | | $ | — | | | $ | 187,876,515 | |
| | | | | | |
136
| | | | | | | | | | | | | | | | | | |
| Fund | | Category | | Quoted Prices in Active Markets
for Identical
Investments
(Level 1) | | | Significant Other
Observable Inputs
(Level 2) | | | Significant
Unobservable
Inputs
(Level 3) | | | Value at
3/31/13 | |
Strategic Income Fund | | | | | | | | | | | | | | | | | | |
Assets | | | | | | | | | | | | | | | | | | |
Common Stocks | | Diversified REITs | | $ | — | | | $ | 266,786 | | | $ | — | | | $ | 266,786 | |
| | Other | | | 42,938,974 | | | | — | | | | — | | | | 42,938,974 | |
Exchange Traded Funds | | | | | 2,476,500 | | | | — | | | | — | | | | 2,476,500 | |
Limited Liability Company Membership Interest | | | | | 2,924,234 | | | | — | | | | 98,144 | | | | 3,022,378 | |
Corporate Bonds | | | | | — | | | | — | | | | 1,044 | | | | 1,044 | |
Short-Term Investments | | | | | — | | | | 4,986,746 | | | | — | | | | 4,986,746 | |
| | | | | | |
| | | | $ | 48,339,708 | | | $ | 5,253,532 | | | $ | 99,188 | | | $ | 53,692,428 | |
| | | | | | |
Ultra Growth Fund | | | | | | | | | | | | | | | | | | |
Assets | | | | | | | | | | | | | | | | | | |
Common Stocks | | Biotechnology | | $ | 4,992,179 | | | $ | — | | | $ | 4,018 | | | $ | 4,996,197 | |
| | Health Care Equipment | | | 5,963,334 | | | | — | | | | 165 | | | | 5,963,499 | |
| | Internet Software & Services | | | 9,615,306 | | | | — | | | | 914 | | | | 9,616,220 | |
| | Other | | | 112,594,556 | | | | — | | | | — | | | | 112,594,556 | |
Preferred Stocks | | | | | — | | | | — | | | | 1,061,094 | | | | 1,061,094 | |
Limited Partnership Interest | | | | | — | | | | — | | | | 5,553,000 | | | | 5,553,000 | |
Warrants | | | | | — | | | | — | | | | 8,250 | | | | 8,250 | |
Short-Term Investments | | | | | — | | | | 1,097,751 | | | | — | | | | 1,097,751 | |
| | | | | | |
| | | | $ | 133,165,375 | | | $ | 1,097,751 | | | $ | 6,627,441 | | | $ | 140,890,567 | |
| | | | | | |
World Innovators Fund | | | | | | | | | | | | | | | | | | |
Assets | | | | | | | | | | | | | | | | | | |
Common Stocks | | Internet Software & Services | | $ | 21,563,510 | | | $ | — | | | $ | 65 | | | $ | 21,563,575 | |
| | Other | | | 152,972,826 | | | | — | | | | — | | | | 152,972,826 | |
Preferred Stocks | | | | | 3,479,532 | | | | — | | | | — | | | | 3,479,532 | |
Limited Partnership Interest | | | | | — | | | | — | | | | 437,652 | | | | 437,652 | |
Warrants | | | | | — | | | | — | | | | 3,575 | | | | 3,575 | |
Short-Term Investments | | | | | — | | | | 15,152,120 | | | | — | | | | 15,152,120 | |
| | | | | | |
| | | | $ | 178,015,868 | | | $ | 15,152,120 | | | $ | 441,292 | | | $ | 193,609,280 | |
| | | | | | |
Wasatch-1st Source Income Fund | | | | | | | | | | | | | | | | | | |
Assets | | | | | | | | | | | | | | | | | | |
Asset Backed Securities | | | | $ | — | | | $ | 4,874,041 | | | $ | — | | | $ | 4,874,041 | |
Collateralized Mortgage Obligations | | | | | — | | | | 29,983,442 | | | | — | | | | 29,983,442 | |
Corporate Bonds | | | | | — | | | | 52,526,166 | | | | — | | | | 52,526,166 | |
Municipal Bonds | | | | | — | | | | 1,347,191 | | | | — | | | | 1,347,191 | |
Mutual Funds | | | | | 852,075 | | | | — | | | | — | | | | 852,075 | |
Exchange Traded Funds | | | | | 1,335,300 | | | | — | | | | — | | | | 1,335,300 | |
U.S. Government Agency Securities | | | | | — | | | | 26,909,288 | | | | — | | | | 26,909,288 | |
U.S. Treasury Inflation Protected Bonds | | | | | — | | | | 1,345,465 | | | | — | | | | 1,345,465 | |
U.S. Treasury Notes | | | | | — | | | | 12,187,069 | | | | — | | | | 12,187,069 | |
Preferred Stocks | | | | | 1,384,863 | | | | — | | | | — | | | | 1,384,863 | |
Short-Term Investments | | | | | — | | | | 1,291,605 | | | | — | | | | 1,291,605 | |
| | | | | | |
| | | | $ | 3,572,238 | | | $ | 130,464,267 | | | $ | — | | | $ | 134,036,505 | |
| | | | | | |
U.S. Treasury Fund | | | | | | | | | | | | | | | | | | |
Assets | | | | | | | | | | | | | | | | | | |
U.S. Government Obligations | | | | $ | — | | | $ | 233,399,806 | | | $ | — | | | $ | 233,399,806 | |
Short-Term Investments | | | | | — | | | | 1,841,807 | | | | — | | | | 1,841,807 | |
| | | | | | |
| | | | $ | — | | | $ | 235,241,613 | | | $ | — | | | $ | 235,241,613 | |
| | | | | | |
If the securities of an Asset Class are all the same level, the asset class is shown in total. If the securities of an Asset Class cross levels, the level with the smallest number of categories and with multiple levels within a category is displayed by category. The remaining categories that do not cross levels are combined into the Other category.
The valuation techniques used by the Funds to measure fair value for the period ended March 31, 2013 maximized the use of observable inputs and minimized the use of unobservable inputs.
137
| | |
| WASATCH FUNDS — Notes to Financial Statements (continued) | | |
|
|
|
The table below shows the significant transfers between level 1 and level 2 due to fair valuation in certain foreign markets.
| | | | | | | | |
| Fund | | Transfers out
of Level 1 at
Market Value | | | Transfers into
Level 2 at
Market Value | |
Emerging Markets Small Cap Fund | | $ | 124,036,556 | | | $ | 124,036,556 | |
Frontier Emerging Small Countries Fund | | | 8,360,829 | | | | 8,360,829 | |
Global Opportunities Fund | | | 7,176,274 | | | | 7,176,274 | |
International Growth Fund | | | 34,006,394 | | | | 34,006,394 | |
International Opportunities Fund | | | 10,360,605 | | | | 10,360,605 | |
Micro Cap Value Fund | | | 2,484,597 | | | | 2,484,597 | |
Small Cap Growth Fund | | | 18,840,924 | | | | 18,840,924 | |
Small Cap Value Fund | | | 1,292,404 | | | | 1,292,404 | |
The following is a reconciliation of the fair valuations using significant unobservable inputs (level 3) for the Funds during the period ended March 31, 2013:
| | | | | | | | | | | | | | | | | | | | | | | | | | | | | | | | | | | | | | | | |
| Fund | | Market Value
Beginning
Balance
9/30/2012 | | | Purchases
at Cost | | | Sales
(Proceeds) | | | Accrued
Discounts
(Premiums) | | | Realized
Gain/
(Loss) | | | Change in
Unrealized
Appreciation
(Depreciation) | | | Transfers
in at
Market
Value | | | Transfers
out at
Market
Value | | | Market
Value
Ending
Balance
3/31/2013 | | | Net Change in
Unrealized
Appreciation
(Depreciation) on
Investments Held
at 3/31/2013 | |
Global Opportunities Fund | | | | | | | | | | | | | | | | | | | | | | | | | | | | | | | | | | | | | | | | |
Warrants | | $ | 2,400 | | | $ | — | | | $ | — | | | $ | — | | | $ | — | | | $ | (400) | | | $ | — | | | $ | — | | | $ | 2,000 | | | $ | (400) | |
| | | | |
Micro Cap Fund | | | | | | | | | | | | | | | | | | | | | | | | | | | | | | | | | | | | | | | | |
Common Stocks | | | 13,860 | | | | — | | | | — | | | | — | | | | — | | | | 36,960 | | | | 95,092 | | | | — | | | | 145,912 | | | | 36,960 | |
Warrants | | | 20,803 | | | | — | | | | — | | | | — | | | | — | | | | (4,678) | | | | — | | | | — | | | | 16,125 | | | | (4,678) | |
| | | | |
| | | 34,663 | | | | — | | | | — | | | | — | | | | — | | | | 32,282 | | | | 95,092 | | | | — | | | | 162,037 | | | | 32,282 | |
| | | | |
Micro Cap Value Fund | | | | | | | | | | | | | | | | | | | | | | | | | | | | | | | | | | | | | | | | |
Common Stocks | | | 186,550 | | | | — | | | | — | | | | — | | | | — | | | | 13,945 | | | | — | | | | — | | | | 200,495 | | | | 13,945 | |
Preferred Stocks | | | 625,263 | | | | — | | | | — | | | | — | | | | — | | | | (1) | | | | — | | | | — | | | | 625,262 | | | | (1) | |
Warrants | | | 7,130 | | | | — | | | | — | | | | — | | | | — | | | | (1,605) | | | | — | | | | — | | | | 5,525 | | | | (1,605) | |
| | | | |
| | | 818,943 | | | | — | | | | — | | | | — | | | | — | | | | 12,339 | | | | | | | | — | | | | 831,282 | | | | 12,339 | |
| | | | |
Small Cap Growth Fund | | | | | | | | | | | | | | | | | | | | | | | | | | | | | | | | | | | | | | | | |
Common Stocks | | | 247 | | | | — | | | | — | | | | — | | | | — | | | | — | | | | 38,825 | | | | — | | | | 39,072 | | | | — | |
Preferred Stocks | | | 961,210 | | | | — | | | | — | | | | — | | | | — | | | | 64,557 | | | | — | | | | — | | | | 1,025,767 | | | | 64,557 | |
Limited Partnership Interest | | | 6,625,910 | | | | 130,000 | | | | — | | | | — | | | | — | | | | (765,258) | | | | — | | | | — | | | | 5,990,652 | | | | (765,258) | |
Warrants | | | 19,413 | | | | — | | | | — | | | | — | | | | — | | | | (19,413) | | | | — | | | | — | | | | — | | | | (19,413) | |
| | | | |
| | | 7,606,780 | | | | 130,000 | | | | — | | | | — | | | | — | | | | (720,114) | | | | 38,825 | | | | — | | | | 7,055,491 | | | | (720,114) | |
| | | | |
Strategic Income Fund | | | | | | | | | | | | | | | | | | | | | | | | | | | | | | | | | | | | | | | | |
Limited Liability Company Membership Interest | | | 99,690 | | | | — | | | | — | | | | — | | | | — | | | | (1,546) | | | | — | | | | — | | | | 98,144 | | | | (1,546) | |
Corporate Bonds | | | 4,073 | | | | — | | | | (2,786) | | | | — | | | | 765 | | | | (1,008) | | | | — | | | | — | | | | 1,044 | | | | (2,977) | |
| | | | |
| | | 103,763 | | | | — | | | | (2,786) | | | | — | | | | 765 | | | | (2,554) | | | | — | | | | — | | | | 99,188 | | | | (4,523) | |
| | | | |
Ultra Growth Fund | | | | | | | | | | | | | | | | | | | | | | | | | | | | | | | | | | | | | | | | |
Common Stocks | | | 1,583 | | | | — | | | | — | | | | — | | | | — | | | | (504) | | | | 4,018 | | | | — | | | | 5,097 | | | | (504) | |
Preferred Stocks | | | 1,062,439 | | | | — | | | | — | | | | — | | | | — | | | | (1,345) | | | | — | | | | — | | | | 1,061,094 | | | | (1,345) | |
Limited Partnership Interest | | | 6,126,453 | | | | 120,000 | | | | — | | | | — | | | | — | | | | (693,453) | | | | — | | | | — | | | | 5,553,000 | | | | (693,453) | |
Warrants | | | 10,336 | | | | — | | | | — | | | | — | | | | — | | | | (2,086) | | | | — | | | | — | | | | 8,250 | | | | (2,086) | |
| | | | |
| | | 7,200,811 | | | | 120,000 | | | | — | | | | — | | | | — | | | | (697,388) | | | | 4,018 | | | | — | | | | 6,627,441 | | | | (697,388) | |
| | | | |
World Innovators Fund | | | | | | | | | | | | | | | | | | | | | | | | | | | | | | | | | | | | | | | | |
Common Stocks | | | 65 | | | | — | | | | — | | | | — | | | | — | | | | — | | | | — | | | | — | | | | 65 | | | | — | |
Limited Partnership Interest | | | 496,747 | | | | 10,000 | | | | — | | | | — | | | | — | | | | (69,095) | | | | — | | | | — | | | | 437,652 | | | | (69,095) | |
Warrants | | | 4,290 | | | | — | | | | — | | | | — | | | | — | | | | (715) | | | | — | | | | — | | | | 3,575 | | | | (715) | |
| | | | |
| | $ | 501,102 | | | $ | 10,000 | | | $ | — | | | $ | — | | | $ | — | | | $ | (69,810) | | | $ | — | | | $ | — | | | $ | 441,292 | | | $ | (69,810) | |
| | | | |
138
17. FAIR VALUEOF DERIVATIVE INSTRUMENTS*
The following is a summary of the fair valuations of the Funds’ derivative instruments categorized by risk exposure:
WASATCH CORE GROWTH FUND
The Effect of Derivative Instruments on the Statement of Operations for the period ended March 31, 2013:
| | | | | | | | | | | | | | | | | | | | | | | | |
| | | Derivatives not accounted for as hedging instruments under Statement 133 | |
| | | Interest Rate
Contracts | | | Foreign Exchange
Contracts | | | Credit
Contracts | | | Equity
Contracts | | | Other
Contracts | | | Total | |
Realized Gain (Loss) on Derivatives Recognized in Income | | | | | | | | | | | | | | | | | | | | | | | | |
Net realized gain on options | | $ | — | | | $ | — | | | $ | — | | | $ | 150,916 | | | $ | — | | | $ | 150,916 | |
| | | | |
Net Change in Unrealized Appreciation (Depreciation) on Derivatives Recognized in Income | | | | | | | | | | | | | | | | | | | | | | | | |
Change in unrealized appreciation (depreciation) on investments, options and foreign currency translations | | $ | — | | | $ | — | | | $ | — | | | $ | (38,216 | ) | | $ | — | | | $ | (38,216 | ) |
| | | | |
WASATCH LONG/SHORT FUND
Fair Values of Derivative Instruments on the Statement of Assets and Liabilities as of March 31, 2013:
| | | | | | | | | | | | | | | | | | | | | | | | |
| | | Derivatives not accounted for as hedging instruments under Statement 133 | |
| | | Interest Rate
Contracts | | | Foreign Exchange
Contracts | | | Credit
Contracts | | | Equity
Contracts | | | Other
Contracts | | | Total | |
Liabilities Derivatives | | | | | | | | | | | | | | | | | | | | | | | | |
Call options written at value | | $ | — | | | $ | — | | | $ | — | | | $ | 9,098,678 | | | $ | — | | | $ | 9,098,678 | |
| | | | |
The Effect of Derivative Instruments on the Statement of Operations for the period ended March 31, 2013:
| | | | | | | | | | | | | | | | | | | | | | | | |
| | | Derivatives not accounted for as hedging instruments under Statement 133 | |
| | | Interest Rate
Contracts | | | Foreign Exchange
Contracts | | | Credit
Contracts | | | Equity
Contracts | | | Other
Contracts | | | Total | |
Realized Gain (Loss) on Derivatives Recognized in Income | | | | | | | | | | | | | | | | | | | | | | | | |
Net realized gain on options | | $ | — | | | $ | — | | | $ | — | | | $ | 10,017,561 | | | $ | — | | | $ | 10,017,561 | |
| | | | |
Net Change in Unrealized Appreciation (Depreciation) on Derivatives Recognized in Income | | | | | | | | | | | | | | | | | | | | | | | | |
Change in unrealized appreciation (depreciation) on investments, options and foreign currency translations | | $ | — | | | $ | — | | | $ | — | | | $ | (1,338,812 | ) | | $ | — | | | $ | (1,338,812 | ) |
| | | | |
139
| | |
| WASATCH FUNDS — Notes to Financial Statements (continued) | | MARCH 31, 2013 |
|
|
|
WASATCH MICRO CAP VALUE FUND
Fair Values of Derivative Instruments on the Statement of Assets and Liabilities as of March 31, 2013:
| | | | | | | | | | | | | | | | | | | | | | | | |
| | | Derivatives not accounted for as hedging instruments under Statement 133 | |
| | | Interest Rate
Contracts | | | Foreign Exchange
Contracts | | | Credit
Contracts | | | Equity
Contracts | | | Other
Contracts | | | Total | |
Liabilities Derivatives | | | | | | | | | | | | | | | | | | | | | | | | |
Call options written at value | | $ | — | | | $ | — | | | $ | — | | | $ | 191,800 | | | $ | — | | | $ | 191,800 | |
| | | | |
The Effect of Derivative Instruments on the Statement of Operations for the period ended March 31, 2013:
| | | | | | | | | | | | | | | | | | | | | | | | |
| | | Derivatives not accounted for as hedging instruments under Statement 133 | |
| | | Interest Rate
Contracts | | | Foreign Exchange
Contracts | | | Credit
Contracts | | | Equity
Contracts | | | Other
Contracts | | | Total | |
Realized Gain (Loss) on Derivatives Recognized in Income | | | | | | | | | | | | | | | | | | | | | | | | |
Net realized gain (loss) on investments and foreign
currency translations | | $ | — | | | $ | (33,150 | ) | | $ | — | | | $ | — | | | $ | — | | | $ | (33,150 | ) |
Net realized gain on options | | | — | | | | — | | | | — | | | | 163,435 | | | | — | | | | 163,435 | |
| | | | |
| | $ | — | | | $ | (33,150 | ) | | $ | — | | | $ | 163,435 | | | $ | — | | | $ | 130,285 | |
| | | | |
Net Change in Unrealized Appreciation (Depreciation) on Derivatives Recognized in Income | | | | | | | | | | | | | | | | | | | | | | | | |
Change in unrealized appreciation (depreciation) on investments, options and foreign currency translations | | $ | — | | | $ | 15,841 | | | $ | — | | | $ | (150,847 | ) | | $ | — | | | $ | (135,006 | ) |
| | | | |
WASATCH SMALL CAP VALUE FUND
The Effect of Derivative Instruments on the Statement of Operations for the period ended March 31, 2013:
| | | | | | | | | | | | | | | | | | | | | | | | |
| | | Derivatives not accounted for as hedging instruments under Statement 133 | |
| | | Interest Rate
Contracts | | | Foreign Exchange
Contracts | | | Credit
Contracts | | | Equity
Contracts | | | Other
Contracts | | | Total | |
Realized Gain (Loss) on Derivatives Recognized in Income | | | | | | | | | | | | | | | | | | | | | | | | |
Net realized gain on options | | $ | — | | | $ | — | | | $ | — | | | $ | 134,261 | | | $ | — | | | $ | 134,261 | |
| | | | |
Net Change in Unrealized Appreciation (Depreciation) on Derivatives Recognized in Income | | | | | | | | | | | | | | | | | | | | | | | | |
Change in unrealized appreciation (depreciation) on investments, options and foreign currency translations | | $ | — | | | $ | — | | | $ | — | | | $ | (102,761 | ) | | $ | — | | | $ | (102,761 | ) |
| | | | |
| * | See Note 4 — Financial Derivative Instruments for additional information. |
For the period ended March 31, 2013, the average monthly balance of derivative financial instruments was as follows:
| | | | | | | | | | | | | | | | |
| | | Core Growth
Fund | | | Long/Short
Fund | | | Micro Cap
Value Fund | | | Small Cap
Value Fund | |
Option contracts: | | | | | | | | | | | | | | | | |
Average number of call contracts written | | | 83 | | | | 24,202 | | | | 870 | | | | 150 | |
Average value of call contracts written | | $ | 19,583 | | | $ | 3,905,862 | | | $ | 175,573 | | | $ | 8,750 | |
18. SUBSEQUENT EVENTS
Effective April 23, 2013, the Expense Limitation Agreement by and between Wasatch Advisors, Inc. and Wasatch Funds Trust, on behalf of Wasatch World Innovators Fund, has been renewed and extended through January 31, 2015.
140
| | |
| WASATCH FUNDS — Supplemental Information | | MARCH 31, 2013 (UNAUDITED) |
|
|
|
MANAGEMENTOFTHE COMPANY
Management Information. The business affairs of Wasatch Funds are overseen by its Board of Trustees. The Board consists of five Independent Trustees and one Interested Trustee. Four of the Independent Trustees and the Interested Trustee were elected by shareholders to serve until their successors are qualified, appointed or elected in accordance with the Trust’s Declaration of Trust and By-Laws. One Interested Trustee has been appointed by the elected Independent Trustees to serve until his successor is qualified, appointed or elected in accordance with the Trust’s Declaration of Trust and By-Laws.
The trustees and executive officers of Wasatch Funds and their principal occupations for at least the last five years are set forth below.
| | | | | | | | | | |
Name, Address and Age | | Position(s)
Held with
Wasatch Funds | | Term of Office1
and Length of
Time Served | | Principal Occupation(s)
during Past 5 Years | | Number of
Portfolios
in Fund
Complex
Overseen
by Trustee | | Other Directorships
Held by Trustees
during Past 5 Years2 |
Independent Trustees | | | | | | | | | | |
| | | | | |
James U. Jensen, J.D., MBA 150 Social Hall Ave. 4th Floor Salt Lake City, UT 84111 Age 68 | | Trustee and Chairman of the Board | | Indefinite Served as Chairman of the Board since 2004 and Trustee since 1986 | | Chief Executive Officer of Clearwater Law & Governance Group (an operating law firm board governance consulting company) April 2008 to present; Co-Founder and Chairman of the Board of Intelisum, Inc. (a company pursuing computer and measurement technology and products) 2001 - 2008; Consultant on corporate growth and technology transfer since 2004; Vice President, Corporate Development, Legal Affairs and General Counsel, and Secretary, NPS Pharmaceuticals, Inc. from 1991 to 2004. | | 20 | | Director and Board Chairman of Agricon Global Corporation (formerly known as Bayhill Capital Corporation (telephone communications) since December 2007; Trustee, Northern Lights Fund Trust III (4 portfolios) since 2012 |
| | | | | |
William R. Swinyard, Ph.D. 150 Social Hall Ave. 4th Floor Salt Lake City, UT 84111 Age 72 | | Trustee and Chairman of the Audit Committee | | Indefinite Served as Chairman of the Audit Committee since 2004 and Trustee since 1986 | | Retired Professor of Business Management and Holder of the
Fred G. Meyer Chair of Marketing (Emeritus), Brigham Young University, from 1978 to 2007. | | 20 | | None |
| | | | | |
D. James Croft, Ph.D. 150 Social Hall Ave. 4th Floor Salt Lake City, UT 84111 Age 71 | | Trustee and Chairman of the Governance & Nominating Committee | | Indefinite Served as Trustee since 2005 | | Consultant to the mortgage industry on issues of mortgage quality, identification of mortgage fraud, strategic planning and client development since 2004; Founder & Executive Director, Mortgage Asset Research Institute, from 1990 to 2004. | | 20 | | None |
| | | | | |
Miriam M. Allison3 150 Social Hall Ave. 4th Floor Salt Lake City, UT 84111 Age 65 | | Trustee | | Indefinite Served as Trustee since 2010 | | Rancher since 2004. From 2001 to 2005, Chairman of UMB Fund Services, Inc. | | 20 | | Director, Northwestern Mutual Series Fund, Inc. (28 portfolios) since 2006. |
| | | | | |
Heikki Rinne, Ph.D. 150 Social Hall Ave. 4th Floor Salt Lake City, Utah 84111 Age 60 | | Trustee | | Indefinite Served as Trustee since October 2012 | | Chief Executive Officer of the Halton Group Ltd. (an indoor environmental control manufacturing and technology company) since 2002 | | 20 | | Director, Touchfon International, through 2009; Director, Infostar Group, through 2009 |
|
|
Interested Trustee | | | | | | | | | | |
| | | | | |
Samuel S. Stewart, Jr., Ph.D. CFA4 150 Social Hall Ave. 4th Floor Salt Lake City, UT 84111 Age 70 | | President and Trustee | | Indefinite Served as President and Trustee since 1986 | | Chairman of the Board for the Advisor since 1975; Chief Investment Officer of the Advisor from 2004 to June 2009; Director of Research of the Advisor from 1975 to 2004; Chairman of the Board of Wasatch Funds from 1986 to 2004. | | 20 | | None |
|
|
| 1 | A Trustee may serve until his/her death, resignation, removal or retirement. Each Independent Trustee shall retire as Trustee at the end of the calendar year in which he/she attains the age of 75 years. |
141
| | |
| WASATCH FUNDS — Supplemental Information (continued) | | |
|
|
|
| 2 | Directorships are those held by a Trustee in any company with a class of securities registered pursuant to Section 12 of the Securities Exchange Act of 1934 or subject to the requirements of Section 15(d) of the Securities Exchange Act or any company registered as an investment company under the 1940 Act. |
| 3 | Ms. Allison previously owned shares of UMB Financial Corp., the parent company of UMB Fund Services, Inc., the Funds’ transfer agent. Ms. Allison no longer owns such shares. |
| 4 | Dr. Stewart is an Interested Trustee because he serves as the Chairman of the Board of the Advisor. |
| | | | | | |
Name, Address
and Age | | Position(s)
Held with Wasatch Funds | | Term of Office and
Length of Time Served | | Principal Occupation(s)
during Past 5 Years |
Officers | | | | | | |
| | | |
Daniel D. Thurber 150 Social Hall Ave. 4th Floor Salt Lake City, UT 84111 Age 43 | | Vice President | | Indefinite Served as Vice President since February 2007 | | General Counsel, Chief Compliance Officer and Director of Compliance for the Advisor since 2006; |
| | | |
Russell L. Biles 150 Social Hall Ave. 4th Floor Salt Lake City, UT 84111 Age 45 | | Chief Compliance Officer, Vice President and Secretary | | Indefinite Served as Chief Compliance Officer and Vice President since February 2007 and Secretary since November 2008 | | Chief Compliance Officer and Vice President for Wasatch Funds since February 2007; Secretary for Wasatch Funds since November 2008; Counsel for the Advisor since October 2006; |
| | | |
Cindy B. Firestone, CPA 150 Social Hall Ave. 4th Floor Salt Lake City, UT 84111 Age 55 | | Treasurer | | Indefinite Served as Treasurer since May 2009 | | Treasurer for Wasatch Funds since May 2009; Assistant Treasurer for Wasatch Funds from November 2008 to May 2009; Internal Auditor for the Advisor from December 2002 to August 2011. |
| | | |
David Corbett 150 Social Hall Ave. 4th Floor Salt Lake City, UT 84111 Age 40 | | Assistant Vice President | | Indefinite
Served as Assistant Vice President
since August 2012 | | Assistant Vice President for Wasatch Funds since August 2012; Director of Mutual Fund Services for the Advisor since June 2007. |
|
|
Additional information about the Funds’ trustees is provided in the Statement of Additional Information and is available without charge, upon request, by calling 800.551.1700.
142
| | |
| | MARCH 31, 2013 (UNAUDITED) |
|
|
|
PROXY VOTING POLICIES, PROCEDURESAND RECORD
A description of the policies and procedures that Wasatch Advisors uses to vote proxies related to the Funds’ portfolio securities is set forth in the Funds’ Statement of Additional Information which is available without charge, upon request, on the Funds’ website at www.wasatchfunds.com or by calling 800.551.1700 and on the Securities and Exchange Commission’s (SEC) website at www.sec.gov.
Wasatch Funds’ proxy voting record is available on the Funds’ website at www.wasatchfunds.com and the SEC’s website at www.sec.gov no later than August 31 for the prior 12 months ending June 30.
QUARTERLY PORTFOLIO HOLDINGS DISCLOSUREON FORM N-Q
The Funds file their complete schedules of investments with the SEC for their first and third fiscal quarters of each fiscal year, commencing with the quarter ended December 31, 2004, on Form N-Q. The Funds’ Form N-Q is available on the SEC’s website at www.sec.gov.
BOARD CONSIDERATIONSFORTHE ADVISORY AGREEMENTOFTHE WASATCH EMERGING MARKETS SELECT FUND
At a meeting held on August 15, 2012, (the “Meeting”), the Board of Trustees (the “Board”) of Wasatch Funds Trust (the “Trust”), including the Independent Trustees, unanimously approved the Advisory and Service Contract (the “New Fund Advisory Agreement”) between the Trust and Wasatch Advisors, Inc., (the “Advisor”) on behalf of the Wasatch Emerging Markets Select Fund (the “New Fund”).
In advance of the meeting, the Board and independent legal counsel received materials and other information which outlined, among other things:
| Ÿ | | the terms and conditions of the New Fund Advisory Agreement, including the nature, extent and quality of services provided to the New Fund by the Advisor; |
| Ÿ | | the organization and business operations of the Advisor, including the experience of persons who will manage the New Fund; |
| Ÿ | | the proposed management fees of the Advisor, including comparisons of such fees with the management fees of comparable, unaffiliated funds prepared by an independent third party; |
| Ÿ | | the projected expenses of the New Fund, including comparisons with the expense ratios of comparable, unaffiliated funds compiled by an independent third party; |
| Ÿ | | the profitability of the Advisor for advisory services; and |
| Ÿ | | the soft dollar practices of the Advisor. |
During the previous day, the Independent Trustees also had met privately with their legal counsel to review the Board’s duties in reviewing advisory contracts and consider, among other things, the approval of the New Fund Advisory Agreement. With this background, the Independent Trustees considered the approval of the New Fund Advisory Agreement for the New Fund.
The Independent Trustees, in consultation with independent counsel, reviewed the factors set out in judicial decisions and Securities and Exchange Commission (“SEC”) directives relating to the approval of advisory contracts. As outlined in more detail below, the Independent Trustees considered all factors they believed relevant with respect to the New Fund, including the following: (a) the nature, extent and quality of the services to be provided by the Advisor; (b) the performance of the Advisor; (c) the costs of the services to be provided and profits estimated to be realized by the Advisor and its affiliates; (d) the extent to which economies of scale may be realized as the New Fund grows; and (e) whether fee levels reflect any such economies of scale.
| A. | | NATURE, EXTENTAND QUALITYOF SERVICES |
With respect to the nature, extent and quality of services to be provided by the Advisor, the Independent Trustees reviewed the information regarding the types of services (advisory and non-advisory or administrative) to be provided under the New Fund Advisory Agreement for the New Fund; narrative and statistical information concerning the Advisor’s performance record with other funds it advises; and information describing the Advisor’s organization and business. Further, given the Independent Trustees’ experience with other Wasatch Funds, the Independent Trustees noted that they were familiar with and have a good understanding of the organization, operations and personnel of the Advisor, including its research department and personnel as well as the professional experience, qualifications and credentials of the proposed portfolio managers for the New Fund. Based on their review, the Independent Trustees concluded that, overall, the nature, extent and quality of services expected to be provided to the New Fund under the New Fund Advisory Agreement were satisfactory.
| B. | | THE INVESTMENT PERFORMANCEOFTHE NEW FUND |
With respect to investment performance, it was noted that because the New Fund had not commenced operations and did not have its own performance history, the Board reviewed and considered performance information regarding the Advisor’s past performance record with other funds.
| C. | | FEES, EXPENSESAND PROFITABILITY |
In evaluating the proposed management fees and expenses, the Independent Trustees considered the New Fund’s proposed management fee and expected expense ratio in absolute terms and as compared with the fees and expenses of a peer group of comparable unaffiliated funds provided by an independent third party. In addition, the Independent Trustees considered the expense limitation agreement provided by the Advisor on behalf of each class of the New Fund. Although the Advisor did not currently manage other funds or separately managed accounts with the same investment style as the New Fund, the Independent Trustees had reviewed the fees charged by the Advisor for other funds (including an emerging markets fund) and other types of clients, including separate accounts and collective
143
| | |
| WASATCH FUNDS — Supplemental Information (continued) | | |
|
|
|
investment trusts. The Independent Trustees recognized the differences in services provided to separately managed accounts and those required in operating and managing registered investment companies, such as the New Fund. The Independent Trustees also considered the costs of the research personnel-intensive approach followed by the Advisor, the expected costs of investing in emerging markets and the overall expense structure of the New Fund and peer group. Based upon this information, the Independent Trustees noted that the proposed advisory fee was above the median in the peer group but recognized the experience and quality of the advisory services provided by the Advisor and the expected expenses in operating this type of Fund with the Advisor’s research approach.
| 2. | Profitability of the Advisor |
In conjunction with its review of fees, the Independent Trustees also considered the profitability of the Advisor for its advisory activities related to the Wasatch Funds. The Independent Trustees reviewed the Advisor’s profitability margin for 2011 and 2010. In considering profitability, the Independent Trustees recognized the subjective nature of determining profitability which may be affected by numerous factors, including the allocation of expenses. In addition to reviewing the Advisor’s profitability, the Trustees also reviewed at the meeting or prior meetings the Advisor’s relative profitability compared to publicly available information concerning unaffiliated publicly traded investment managers. However, the Independent Trustees recognized the difficulties in comparing the profitability of various advisors given that, among other things, many of these managers are much larger than the Advisor, have different lines of business, may employ different expense allocations and charges, the profitability derived from individual funds or product lines is not generally publicly available and the profitability information of managers that is available may not be representative of the industry. The Independent Trustees also noted that the Advisor is privately held and is taxed as a Subchapter S corporation, thus certain expenses had to be attributed and/or estimated. Based on their review, the Trustees were satisfied that the Advisor’s level of profitability was not unreasonable in light of the services to be provided.
| C. | | ECONOMIESOF SCALEAND WHETHER FEE LEVELS REFLECT ECONOMIESOF SCALE |
In reviewing compensation, the Independent Trustees noted that, similar to other Wasatch funds, the proposed advisory fee schedule for the New Fund did not contain breakpoints that would reduce the fee rate on assets above specified levels. The Independent Trustees recognized that breakpoints may be one way for the benefits of any economies of scale to be shared with investors. The Trustees, however, recognized that as a New Fund with a small asset base, the Advisor generally must reimburse the New Fund for costs in excess of the expense limit until the New Fund has gained sufficient assets to be self-sustaining. Considering the above, the Independent Trustees concluded that the absence of breakpoints in the New Fund’s advisory fee schedule was acceptable.
In evaluating fees, the Independent Trustees also considered any indirect benefits or profits the Advisor or its affiliates may receive as a result of their relationship with the New Fund. In this regard, the Independent Trustees have reviewed information concerning the Advisor’s soft dollar arrangements, including its policies for allocating brokerage in exchange for brokerage and research services. In light of their experience, the Independent Trustees are familiar with the Advisor’s soft dollar arrangements and recognize that the Advisor’s profitability may be lower if the Advisor was required to pay for this research with hard dollars.
| E. | | APPROVALOF NEW FUND ADVISORY AGREEMENT |
The Independent Trustees did not identify any single factor discussed previously as all-important or controlling. The Trustees, including a majority of the Independent Trustees, concluded that the terms of the New Fund Advisory Agreement were fair and reasonable, that the Advisor’s fees are reasonable in light of the services expected to be provided to the New Fund, and that the Advisory Agreement should be approved.
BOARD CONSIDERATIONSFOR ADVISORY AGREEMENTSOFTHE WASATCH FUNDSFOR 2013
At a meeting held on November 7, 2012 (the “Meeting”), the Board of Trustees (the “Board”) of Wasatch Funds Trust (the “Trust”), including the Independent Trustees, unanimously approved the Advisory and Service Contract (the “Advisory Agreement”) between the Trust and Wasatch Advisors, Inc. (the “Advisor”) on behalf of each series of the Trust (each a “Fund”); the sub-advisory agreement between the Advisor and Hoisington Investment Management Company (“HIMCO”) on behalf of the Wasatch-Hoisington U.S. Treasury Fund (the “U.S. Treasury Fund”); and the sub-advisory agreement between the Advisor and 1st Source Corporation Investment Advisors, Inc. (“1st Source”) on behalf of the Wasatch-1st Source Income Fund (the “Income Fund”) (the foregoing sub-advisory agreements are each a “Sub-Advisory Agreement” and collectively, the “Sub-Advisory Agreements,” and HIMCO and 1st Source are each a “Sub-Advisor”).
In preparation for their role in the evaluation of the Advisory Agreement with the Advisor and the Sub-Advisory Agreements, the Independent Trustees met in executive sessions on October 30, 2012 and November 6, 2012. In addition to the executive sessions, the Independent Trustees also met at their quarterly meetings as well as at other times between the quarterly meetings with management. In evaluating the Advisory Agreement and Sub-Advisory Agreements, the Independent Trustees took into account the information provided and the knowledge gained from these meetings. At their regular Board meetings and executive sessions, the Independent Trustees were joined by independent legal counsel. In advance of the meeting, the Board and independent legal counsel received materials and other information which outlined, among other things:
| Ÿ | | the terms and conditions of the Advisory Agreement and Sub-Advisory Agreements, including the nature, extent and quality of services provided by the Advisor and each Sub-Advisor; |
144
| | |
| | MARCH 31, 2013 (UNAUDITED) |
|
|
|
| Ÿ | | the organization and business operations of the Advisor and Sub-Advisors, including the experience of persons who have managed and who will manage each respective Fund; |
| Ÿ | | the profitability of the Advisor from serving as advisor to each respective Fund (plus profitability analysis for advisors to unaffiliated investment companies); |
| Ÿ | | the management fees of the Advisor, including comparisons of such fees with the management fees of comparable, unaffiliated funds prepared by an independent third party and the Advisor’s fees for other clients; |
| Ÿ | | the sub-advisory fees of each Sub-Advisor with respect to the U.S. Treasury Fund and Income Fund (including the respective Sub-Advisor’s fee schedule for other clients); |
| Ÿ | | the expenses of each Fund, including comparisons with the expense ratios of comparable, unaffiliated funds compiled by an independent third party; and |
| Ÿ | | each respective Fund’s past performance plus such Fund’s performance compared to other unaffiliated funds compiled by independent third parties and with recognized benchmarks as described below. |
As the Independent Trustees reviewed the materials, they also requested in writing (through their independent legal counsel) and received supplemental information and responses to various questions. In addition to the material provided by the Advisor, the Independent Trustees also received from independent counsel a legal memorandum outlining, among other things, the duties of the Independent Trustees under the 1940 Act, as well as the general principles of relevant state law in reviewing and approving advisory contracts; the requirements of the 1940 Act in such matters; an advisor’s fiduciary duty with respect to advisory agreements and compensation; the standards used by courts in determining whether investment company boards of trustees have fulfilled their duties and factors to be considered by the Board in voting on advisory agreements.
During the executive sessions noted above, the Independent Trustees met with independent legal counsel to discuss, among other things, the Advisory and Sub-Advisory Agreements, the information provided, and the Independent Trustees’ duties in reviewing and approving advisory contracts. The Independent Trustees, in consultation with independent counsel, also reviewed the factors set out in judicial decisions and Securities and Exchange Commission (“SEC”) directives relating to the approval of advisory contracts. The information provided for the Meeting supplements the information the Board receives throughout the year regarding the Funds’ performance, expense ratios, portfolio composition, trade execution and sales activity. The Independent Trustees considered the legal advice provided by legal counsel and the materials provided, and relied upon their own business judgment and the knowledge they gained from their meetings and other interactions throughout the year of the Funds, the Advisor, the Sub-Advisors and the services they provided in determining the factors to be considered and the weight to be given to such factors in evaluating advisory agreements. Each Independent Trustee may have accorded different weight to the various factors in reaching his or her conclusions with respect to the Advisory
Agreement and applicable Sub-Advisory Agreements. The Independent Trustees did not identify any single factor as all-important or controlling. The Independent Trustees’ considerations were instead based on a comprehensive consideration of all the information presented. The principal factors considered by the Board and its conclusions are described below.
| A. | | NATURE, EXTENTAND QUALITYOF SERVICES |
In evaluating the nature, extent and quality of the Advisor’s and Sub-Advisors’ services, the Independent Trustees reviewed information concerning the types of services (advisory and non-advisory or administrative services) that the Advisor and Sub-Advisors provide to the applicable Fund; the performance record of the applicable Fund; and information describing the Advisor’s and Sub-Advisors’ organization and business. In connection with their service as Independent Trustees of the Trust, the Independent Trustees also periodically have met with the Advisor’s and Sub-Advisors’ personnel and have evaluated their professional experience, qualifications and credentials as well as their investment approach and research process. The Independent Trustees considered the compensation arrangements of portfolio managers to evaluate the ability of the Advisor to attract and retain high quality investment personnel, preserve stability, and reward performance without providing an incentive for investing inconsistently with the Fund’s disclosures and without taking undue risks.
In addition to the foregoing, in light of the regulatory emphasis on compliance, in reviewing the services that have been provided to each Fund, the Independent Trustees considered the Advisor’s and Sub-Advisors’ compliance and regulatory history. The Trustees also considered the Advisor’s approach, activities and procedures with regard to risk management.
In their review of services, the Independent Trustees evaluated the quality of administrative or non-advisory services provided. The terms of the Advisory Agreement provide that the Advisor shall administer the Trust’s affairs to the extent requested by and subject to the supervision of the Board for the period and terms of the contract. In this regard, the Advisor provides business, administrative, compliance, marketing and other services required to operate the Funds, such as assistance with preparation and filing of regulatory and tax reports, preparation and distribution of prospectuses and shareholder reports, provision of information to Fund Independent Trustees, analysis to ensure compliance with federal and state laws and regulations, valuation of portfolio securities, and oversight of the performance of the Funds’ service providers (e.g., administrator, fund accountant, transfer agent and custodian). The Advisor also pays for office space and facilities for each Fund.
With respect to the Sub-Advisors, it was noted that the Sub-Advisory Agreements are essentially agreements for portfolio management services only and the Sub-Advisors were not expected to supply other significant administrative services. The Trustees further noted that the Advisor, based on its evaluation of the Sub-Advisors, recommended the renewal of each Sub-Advisory Agreement.
145
| | |
| WASATCH FUNDS — Supplemental Information (continued) | | |
|
|
|
Based on their review, the Independent Trustees found that, overall, the nature, extent and quality of services provided under the Advisory Agreement and the Sub-Advisory Agreements were satisfactory on behalf of each applicable Fund.
| B. | | THE INVESTMENT PERFORMANCEOFTHE FUNDS |
In evaluating each Fund’s performance, the Trustees reviewed both short-term and long-term performance of each Fund relative to its peers and relevant benchmarks. More specifically, except for the Frontier Emerging Small Countries Fund described below, the Independent Trustees reviewed, among other things, a report prepared by an unaffiliated third party comparing the respective Fund’s total return for the one-, two-, three-, four-, five-, and 10-year periods ended August 31, 2012 (or for the periods available for Funds that did not exist for part of the foregoing timeframe) compared to the performance of unaffiliated funds with similar investment objectives or classifications (a “Peer Universe”), to a more focused subset
thereof, if any, (a “Peer Group”) and a benchmark assigned by the unaffiliated third party (the “Benchmark”) for the prescribed periods. The Independent Trustees also reviewed materials reflecting the respective Fund’s historic performance for the quarter, one-, three-, five-, and 10-year periods ended September 30, 2012 (or for the periods available for Funds that did not exist for part of the foregoing timeframe together with the average annual return since inception for Funds with the shorter duration) compared to additional benchmark(s) and unaffiliated funds in its investment category. The Independent Trustees noted that the Frontier Emerging Small Countries Fund had been in operation for less than one year and therefore reviewed the Fund’s total return for the quarter and since inception periods ended September 30, 2012. In addition, the Independent Trustees received analyst reports provided by an unaffiliated third party for the following Funds: Emerging Markets Small Cap Fund, Global Opportunities Fund, International Growth Fund, International Opportunities Fund, Small Cap Growth Fund and Long/Short Fund. This information supplemented the performance information provided to the Board at each of its quarterly meetings as well as at other meetings or executive sessions during the year.
The Board evaluated Fund performance in light of the respective Fund’s investment objectives, investment parameters and guidelines and recognized that the objectives, investment parameters and guidelines of peers and/or Benchmarks may differ from those of the Funds, and therefore, the performance results may also differ. In this regard, the Independent Trustees recognized the limitations on some of the usefulness of the performance comparison information as the closest Peer Group for a Fund may not adequately reflect the Wasatch Fund’s investment strategies and may be invested in sectors or industries in which the applicable Fund has limited or no exposure, including the Micro Cap Fund, the Micro Cap Value Fund (collectively, the “Micro Cap Funds”) and the Small Cap Value Fund. As the Peer Group assigned to the Micro Cap Funds appeared to generally focus on companies with a larger market
capitalization than those sought by the Micro Cap Funds, the Independent Trustees reviewed the Micro Cap Funds’ performance compared to a custom peer group provided by the Advisor. As the performance data for the Small Cap Value Fund included small cap growth funds, the Independent Trustees also reviewed the annualized total return performance history of the Small Cap Value Fund for the one-, three-, five-, and 10-year periods ended September 30, 2012 compared to the Russell 2000 Value Index and the average for peers in the small cap blend and small cap value investment categories.
In addition to the limitations on some of the comparative performance data, the Independent Trustees also recognized that the investment experience of a particular shareholder in the Wasatch Funds will vary depending on when such shareholder invests in the applicable Fund and that a Fund’s performance results may differ significantly based on the time period being measured. Accordingly, although the performance below reflects the performance results for the time periods ended August 31, 2012, the Board recognized that selecting a different ending time period may derive different results. Based on their review of performance, the Independent Trustees determined the following:
The Emerging Markets Small Cap Fund and U.S. Treasury Fund have had generally favorable performance, outperforming their respective Benchmark for the one-, two-, three- and four-year periods ended August 31, 2012. The performance of both the Core Growth Fund and Long/Short Fund has been generally favorable, outperforming their respective Benchmark for the one-, two-, three-, four-, and five-year periods ended August 31, 2012. Similarly, the performance of each of the International Growth Fund, World Innovators Fund and Small Cap Growth Fund over time has been generally favorable, outperforming their respective Benchmark for the one-, two-, three-, four-, five- and 10-year periods ended August 31, 2012. Although Global Opportunities Fund has been operating for only three years, the Fund generally has had favorable performance, outperforming its Benchmark for the one-, two- and three-year periods ended August 31, 2012. The Heritage Growth Fund and Strategic Income Fund also have had generally favorable performance, excluding the one-year period, such Funds outperformed their respective Benchmark for the two-, three-, four- and five-year periods ended August 31, 2012.
The Independent Trustees noted that the Emerging India Fund and the Frontier Emerging Small Countries Fund were new funds with a shorter performance history available thereby limiting the ability to make a meaningful assessment of performance. Nevertheless, the Independent Trustees noted that the Emerging India Fund outperformed the average of its Peer Group for the one-year period ended August 31, 2012 and the Frontier Emerging Small Countries Fund outperformed the MSCI Frontier Emerging Markets Index for the quarter ended September 30, 2012.
The Independent Trustees further determined that the investment performance over time of the following Funds also has been satisfactory. In this regard, the Independent Trustees noted that although the Micro Cap Value Fund underperformed its Benchmark for the one-, two- and
146
| | |
| | MARCH 31, 2013 (UNAUDITED) |
|
|
|
three-year periods ended August 31, 2012, the Fund outperformed its Benchmark in the longer four- and five-year periods. Although the Micro Cap Fund has underperformed its Benchmark in recent years, the Fund has improved its performance, outperforming its Benchmark for the one-year period ended August 31, 2012. The Board further noted that the performance of the Micro Cap Funds was ahead of the average for the custom peer group for the year-to-date period ended September 30, 2012. Although the Large Cap Value Fund underperformed its Benchmark for the one-, two-, three- and four-year periods ended August 31, 2012, the Large Cap Value Fund has outperformed its Benchmark over the longer five and 10-year periods. Similarly, the International Opportunities Fund underperformed its Benchmark for the last one- and two-year periods ended August 31, 2012, but outperformed its Benchmark over the longer three-, four-, and five-year periods. Although the Income Fund underperformed its Benchmark over various periods ended August 31, 2012, the performance was generally comparable.
In addition, the Ultra Growth Fund and the Small Cap Value Fund underperformed their respective Benchmark over various periods, although the Ultra Growth Fund outperformed its Benchmark in the three- and four-year periods ended August 31, 2012. With respect to the Funds that have underperformed their Benchmarks and/or peers from time to time, the Board monitors such Funds closely and was satisfied with the investment approach to these Funds and any steps the Advisor has taken to address any performance issues.
| C. | | FEES, EXPENSESAND PROFITABILITY |
The Independent Trustees considered the fees of the Advisor and Sub-Advisors. In their evaluation of fees and expenses, the Independent Trustees considered the Advisor’s management fees and expense ratios for each Fund in absolute terms as well as with comparisons of fees and expenses of funds with similar objectives. In this regard, the Independent Trustees reviewed and considered, among other things, comparisons of each respective Fund’s gross and net management fees, total expenses (including and excluding 12b-1/non-12b-1 service fees), and non-management expenses (such as transfer agency, custodian, administrative and accounting fees) with those of unaffiliated funds in its Peer Group, compiled by an independent third party, subject to the following. With respect to the Frontier Emerging Small Countries Fund, as a new Fund that had been in operation for less than a year as of August 31, 2012, the Independent Trustees had reviewed such Fund’s proposed management fee and expected expense ratio in absolute terms and as compared to a peer group of comparable unaffiliated funds provided by an independent third party at its November 7, 2012 meeting (the “November Meeting”). In addition, with respect to the Micro Cap Funds, the Independent Trustees also reviewed comparisons of the respective Fund’s management fee and net expense ratio with those of a custom peer group provided by the Advisor. In reviewing fees, the Independent
Trustees also considered the expense limitation agreement with the Advisor for the Funds and the amounts the Advisor has reimbursed to the Funds for the last three fiscal years (if any). The Independent Trustees also considers a Fund’s fees in light of the performance of the Fund. In their evaluation of the fees, the Independent Trustees considered, among other things, the following factors:
With respect to the Investor Class shares of the Micro Cap Fund, Micro Cap Value Fund, and Small Cap Growth Fund, such Funds had gross advisory fees and net expense ratios above the median of their respective Peer Group. With respect to the Investor Class and Institutional Class shares of the Small Cap Value Fund, such Fund had gross advisory fees below the median of its Peer Group, and the net expense ratio of the Institutional Class was below the median for its Peer Group but above the median for the Investor Class shares. The Independent Trustees also noted that the advisory fee of the Small Cap Value Fund was reduced in January 2012. In evaluating the fees for these Funds, the Independent Trustees also considered, among other things, the nature of the asset class (small- or mid-cap), the Advisor’s expertise in this asset class, the due diligence needed to evaluate small companies and the capacity constraints of this asset class. In their considerations, the Independent Trustees recognized the Advisor’s expertise in the small cap and micro cap arena and the research intensive approach the Advisor follows in evaluating companies in this category and the related costs incurred. The Independent Trustees also considered the inherent capacity constraints with small cap and micro cap investing which, in turn, limits the revenue potential from these Funds for the Advisor. More specifically, the Independent Trustees recognized that it is difficult to replicate the performance of small cap and micro cap funds at higher asset levels. Accordingly, the Advisor has continued its strategy to close Funds to new and/or existing investors as necessary to limit asset size and protect shareholder performance and the integrity of the Fund’s investment strategy. The Funds that have been closed to new and sometimes existing investors from time to time in the past include: the Core Growth Fund, Emerging Markets Small Cap Fund, World Innovators Fund, International Growth Fund, International Opportunities Fund, Micro Cap Fund, Micro Cap Value Fund, Small Cap Growth Fund, Small Cap Value Fund and Ultra Growth Fund. The Independent Trustees seek to encourage the Advisor’s practice of closing Funds when necessary or appropriate to maintain or enhance performance. However, the Independent Trustees recognized that this practice also limits the Advisor’s ability to earn fees on a larger asset base and exposes the Advisor to reduced revenues from asset outflows if a Fund is closed to, or has otherwise limited new investments. Given the foregoing factors, among others, the Independent Trustees determined the advisory fees for the foregoing Funds were acceptable.
With respect to the Investor Class shares of the Emerging Market Small Cap Fund, Global Opportunities Fund, International Growth Fund, International Opportunities Fund, and World Innovators Fund, the Independent Trustees noted that the gross advisory fees and net expense ratios were
147
| | |
| WASATCH FUNDS — Supplemental Information (continued) | | |
|
|
|
above the median of each Fund’s respective Peer Group. The Independent Trustees noted that the Investor Class of the Emerging India Fund, a new Fund, did not pay advisory fees after taking into account fee waivers and that the net expense ratio was equal to the median of its Peer Group. As with the above Funds, the Independent Trustees also considered any capacity constraints of these Funds which limit their asset size, the uniqueness of the Fund, and the expertise of the Advisor. The Independent Trustees also noted that the international aspect of these Funds adds an additional cost to the Advisor’s research-intensive investment program to cover an international landscape. Given the foregoing factors, among others, the Independent Trustees determined the advisory fees for the foregoing Funds are acceptable.
With respect to the Investor Class shares of the Frontier Emerging Small Countries Fund, the Independent Trustees had noted at its November Meeting that the Fund’s management fee was the highest among its peer group but also recognized the experience and quality of the advisory services provided by the Advisor and the expected expenses in operating this type of Fund with the Advisor’s research approach. Given the foregoing factors, among others, the Independent Trustees determined that the advisory fee for the foregoing Fund was acceptable.
With respect to the Core Growth Fund, the Independent Trustees noted that the gross advisory fee of the Investor Class and Institutional Class shares was above the median for its Peer Group but the net expense ratio for each class was below the median of its Peer Group. The Trustees also considered the capacity constraints of the Fund and the research-intensive approach of the Advisor. Given the foregoing factors, among others, the Independent Trustees determined that the advisory fee for the foregoing Fund was acceptable.
With respect to the Heritage Growth Fund and the Strategic Income Fund, the Independent Trustees noted that the gross advisory fees and net expense ratios of the Investor Class shares of these Funds were below the median of their respective Peer Group. With respect to the Investor Class shares of the Long/Short Fund and the Income Fund, the Independent Trustees noted that the gross advisory fee was above the median of its respective Peer Group, but the total expense ratio was below the median. Given their investment strategies, the Independent Trustees recognized that these Funds generally are not subject to capacity constraints limiting the asset size of the Funds upon which advisory fees are calculated as other Funds in the complex. Based on the foregoing factors, among others, the Independent Trustees determined that the advisory fees for the foregoing Funds were acceptable.
With respect to the Ultra Growth Fund, the Independent Trustees noted that the gross advisory fee and net expense ratio of the Investor Class shares were above the median for its Peer Group. The Trustees considered the capacity constraints applicable to the Fund. The Trustees further noted that the advisory fee and expense limitation of the Fund had been reduced in 2011. Given the foregoing factors, among others, the Independent Trustees determined that the advisory fee for the foregoing Fund was acceptable.
With respect to the Investor Class and Institutional Class shares of the Large Cap Value Fund and the Investor Class shares of the U.S. Treasury Fund, the Funds’ gross advisory fees and net expense ratios were above the median for their respective Peer Group. Although such Funds should not experience capacity constraints, the Independent Trustees recognized the investment expertise of the Advisor and Sub-Advisor (as applicable) with respect to the Funds. Given the foregoing factors, among others, the Independent Trustees determined that the advisory fee for the foregoing Funds were acceptable.
| 2. | Fees Charged to Other Advisor and Sub-Advisor Clients |
In reviewing fees, the Independent Trustees also compared the advisory fees to the fees the Advisor assesses other types of clients, including institutional and high net worth separate accounts, wrap accounts, and funds sponsored by other sponsors. Currently, the Advisor manages separate account client assets in styles similar to those used for certain Funds, including the Core Growth Fund, Emerging Markets Small Cap Fund, Heritage Growth Fund, International Growth Fund, Micro Cap Fund, Small Cap Growth Fund, Small Cap Value Fund, Ultra Growth Fund and Large Cap Value Fund. With respect to separate accounts, the weighted average fees for these accounts are generally lower than the comparable Fund (except in the case of the Heritage Growth Fund and Ultra Growth Fund). The Independent Trustees considered the differences in the product types, including the services provided, noting that the Advisor seeks to charge a higher fee to clients who require a higher degree of service. In this regard, the Independent Trustees have noted that the services provided to a Fund in managing and operating a registered investment company are more extensive than those provided to a separately managed account. The Advisor provides services to each Fund that extend beyond the portfolio management services provided to its separate account clients. As described in more detail above, these services include business, administrative, operational expertise (such as portfolio accounting, pricing, foreign registrations, and foreign filings), oversight of third party service providers (including sub-advisors), trustee support, marketing and other services required to operate a Fund. Further, the Independent Trustees recognized that each Fund operates in a highly regulated industry requiring extensive compliance. Such responsibilities generally are not required to the same extent for separate accounts. In addition, the Trustees considered the fees the Advisor assesses for other types of clients, including wrap accounts, uniform managed accounts, model accounts, collective investment trusts and sub-advisory accounts in which the fees may be lower but the services provided are also reduced. In light of the foregoing, the Independent Trustees determined that the nature and number of services provided to operate a Fund merit higher fees than those of separate and other accounts.
In considering the fees of the Sub-Advisors for the Income Fund and U.S. Treasury Fund, the Independent Trustees also considered the pricing schedule the respective Sub- Advisor charges for investment management services for
148
| | |
| | MARCH 31, 2013 (UNAUDITED) |
|
|
|
other clients. In this regard, the sub-advisory fee for the U.S. Treasury Fund was at the lower end of HIMCO’s fee schedule. Similarly, the sub-advisory fee for the Income Fund was at the low end of fees 1st Source assesses for institutional accounts. The Independent Trustees also noted that the sub-advisory fees were established through arm’s length negotiations between the Advisor and the Sub-Advisors, which are unaffiliated with the Advisor.
| 3. | Profitability of the Advisor |
The Independent Trustees reviewed profitability information for the Advisor derived from its relationship with each Fund for the calendar year ended December 31, 2011 and pro forma profitability for the calendar year ended December 31, 2012. In reviewing profitability, the Independent Trustees reviewed the methodology utilized to allocate revenue and expenses of the Advisor among the Funds. In considering profitability, the Independent Trustees recognized the inherent limitations in determining profitability which may be affected by many factors, including the allocation of expenses across multiple investment products served by the Advisor. The allocation of research and personnel expenses is also particularly difficult given the Advisor’s shared research culture. The Independent Trustees also noted that the Advisor is privately held and is taxed as a Subchapter S corporation, thus certain expenses had to be attributed and/or estimated.
In addition to reviewing the Advisor’s profitability, the Trustees also reviewed the Advisor’s relative profitability compared to publicly available information concerning unaffiliated publicly traded investment managers. However, the Independent Trustees recognized the difficulties in comparing the profitability of various advisors given that, among other things, many of these managers are much larger than the Advisor, have different lines of business, may employ different expense allocations and charges, the profitability derived from individual funds or product lines is not generally publicly available and the profitability information of managers that is available may not be representative of the industry. Notwithstanding the foregoing, the Independent Trustees noted that the Advisor’s profitability is within a reasonable range compared to the peer group of unaffiliated advisors. Based on their review, the Independent Trustees were satisfied that the Advisor’s level of profitability from its relationship with each Fund was not unreasonable in light of the services provided.
With respect to the Sub-Advisors, although a profitability analysis was not available, the Independent Trustees received certain financial statements of the Sub-Advisors. Given that the Sub-Advisors’ fees are at the low end of their respective fee schedules, the fact that the sub-advisory fees are established through arm’s length negotiations, and the range of fees the Sub-Advisors assess to other clients, the Independent Trustees concluded that HIMCO’s and 1st Source’s profitability from the Sub-Advisor’s relationship with the U.S. Treasury Fund and Income Fund, respectively, is not unreasonable.
In addition to the above, the Independent Trustees also considered that the Advisor benefits from soft dollar
arrangements whereby it receives brokerage and research services from brokers that execute a Fund’s purchases and sales of securities, as described in further detail below.
| D. | | ECONOMIESOF SCALEAND WHETHER FEE LEVELS REFLECT THESE ECONOMIESOF SCALE |
With respect to economies of scale, the Independent Trustees recognized the potential benefits resulting from the costs of a Fund being spread over a larger asset base, although economies of scale are difficult to measure and predict with precision. One method to help shareholders share in these benefits is to include breakpoints in the advisory fee schedule. The advisory fee schedules of the Funds, however, do not have breakpoints because, as noted above, the Independent Trustees recognized the capacity constraints of the Funds investing in small- and micro-cap companies. Because the Advisor generally seeks to maintain the assets of these Funds at a level that management believes can be managed effectively, the potential for the assets to grow beyond these levels to achieve economies of scale is limited. Further, with respect to the Funds without such capacity constraints, the Independent Trustees recognized the Advisor’s position that to the extent economies of scale exist, the current level of advisory fees reflects such economies of scale. Considering the factors above, the Independent Trustees concluded that the absence of breakpoints was acceptable and that such economies as exist are adequately reflected in the Advisor’s fee structure.
In evaluating fees, the Independent Trustees also considered any indirect benefits or profits the Advisor or its affiliates may receive as a result of their relationship with the Funds. In this regard, the Independent Trustees considered that the Advisor benefits from soft dollar arrangements pursuant to which it receives research from brokers that execute an applicable Fund’s brokerage transactions. The Advisor may receive soft dollar benefits from each Fund, subject to the exceptions noted below for the sub-advised Funds. The Independent Trustees reviewed information regarding the soft dollar arrangements including, among other things, the commissions paid, the research credits earned and the services provided. Further, the Independent Trustees at prior meetings have had extensive discussions regarding the soft dollar arrangements. The Independent Trustees recognized that soft dollar arrangements provide benefits to the Advisor derived from a Fund’s brokerage transactions by obtaining research that it would otherwise have to acquire with hard dollars. Accordingly, the Advisor’s profitability would be somewhat lower if it did not receive the research services pursuant to soft dollar arrangements. The Independent Trustees took these “fall out” benefits, if any, into account when reviewing the level of advisory fees. With respect to the Sub-Advisors, the Independent Trustees recognized that the Sub-Advisors currently do not have soft dollar arrangements on behalf of their respective Funds.
149
| | |
| WASATCH — Supplemental Information (continued) | | MARCH 31, 2013 (UNAUDITED) |
|
|
|
| F. | | ANNUAL APPROVALOF ADVISORYAND SUB-ADVISORY AGREEMENTS |
The Independent Trustees did not identify any single factor discussed previously as all-important or controlling. The Independent Trustees, including a majority of Independent Trustees, concluded that the terms of the Advisory Agreement for each Fund, the HIMCO Sub-Advisory Agreement for the U.S. Treasury Fund, and the 1st Source Sub-Advisory
Agreement for the Income Fund were fair and reasonable, that the Advisor’s and Sub-Advisors’ fees are reasonable in light of the services provided to each respective Fund, and that the Advisory Agreement should be approved on behalf of each Fund and the Sub-Advisory Agreements should be approved on behalf of the U.S. Treasury Fund and the Income Fund, respectively.
150
| | |
| WASATCH FUNDS — Service Providers | | MARCH 31, 2013 (UNAUDITED) |
|
|
|
INVESTMENT ADVISOR
Wasatch Advisors, Inc.
150 Social Hall Avenue, 4th Floor
Salt Lake City, UT 84111
SUB-ADVISORFORTHE WASATCH-1ST SOURCE INCOME FUND
1st Source Corporation Investment Advisors, Inc.
100 North Michigan Street
South Bend, IN 46601
SUB-ADVISORFORTHE U.S. TREASURY FUND
Hoisington Investment Management Co.
6836 Bee Caves Rd.
Building 2, Suite 100
Austin, TX 78746
ADMINISTRATORAND FUND ACCOUNTANT
State Street Bank and Trust Company
801 Pennsylvania Avenue
Kansas City, MO 64105
DISTRIBUTOR
ALPS Distributors, Inc.
1290 Broadway, Suite 1100
Denver, CO 80203
TRANSFER AGENT
UMB Fund Services, Inc.
803 West Michigan Street, Suite A
Milwaukee, WI 53233-2301
CUSTODIAN
State Street Bank and Trust Company
801 Pennsylvania Avenue
Kansas City, MO 64105
LEGAL COUNSELTO WASATCH FUNDSANDINDEPENDENT TRUSTEES
Chapman and Cutler, LLP
111 West Monroe Street
Chicago, IL 60603
INDEPENDENT REGISTERED PUBLIC ACCOUNTING FIRM
PricewaterhouseCoopers LLP
1100 Walnut, Suite 1300
Kansas City, MO 64106
151
| | |
| WASATCH FUNDS — Guide to Understanding Financial Statements | | |
|
|
|
Wasatch Funds provides reports to shareholders twice a year. The annual report is for the Funds’ fiscal year which ends September 30. The semi-annual report is for the six months or period ending March 31. Additionally, the Funds’ schedules of investments for the first and third quarters of each fiscal year are available to shareholders as described on page 143. These reports provide shareholders with important information that will help them evaluate the management and performance of their investments. It is the desire of Wasatch Funds to help shareholders stay in tune with their investments. If you have any questions about the information in this report, a shareholder services representative will be happy to assist you when you call 800.551.1700.
SCHEDULEOF INVESTMENTS
The holdings of each Wasatch Fund are detailed in the “Schedule of Investments.” This section provides a snapshot of the securities each Fund was invested in on the last day of the reporting period. The Wasatch Equity Funds invest primarily in Common Stocks of companies which are grouped together by industry. The Wasatch-1st Source Income Fund invests primarily in fixed income securities. The U.S. Treasury Fund invests primarily in U.S. Treasury securities. The Equity Funds will typically have only minor holdings in Short-Term Investments. At times the Funds may take temporary defensive positions by increasing cash or holdings in Short-Term Investments. Please see the prospectus under “Additional Information about the Funds.”
STATEMENTSOF ASSETSAND LIABILITIES
These financial statements show the Assets and Liabilities of a Fund on the last day of the reporting period. A Fund’s Assets include the value of securities owned, amounts receivable for purchases of Fund shares (capital shares receivable), securities sold, interest and dividends, prepaid expenses and other assets. Liabilities are amounts owed for shareholder redemptions (capital shares payable), securities purchased, investment advisory fees (payable to Advisor) and other payables. Totaling up the assets and subtracting the liabilities results in a Fund’s Net Assets.
Net Assets consist of capital stock, paid-in capital in excess of par, undistributed net investment income or loss, undistributed net realized gain or loss on investments and net unrealized appreciation or depreciation on investments. Capital stock is stock authorized by a company’s charter and having par value, stated value or no par value. Par value is set by the company issuing the shares and has no relation to Net Asset Value. The par value of one share of each Wasatch Fund is $.01. Paid-in capital in excess of par is capital received from shareholders in exchange for Fund shares that exceeds the par value of the shares. For example, if you bought one share of a Fund for $10, $.01 would show as “Capital stock” on the books of the Fund, and $9.99 would be accounted for under “Paid-in capital in excess of par.” Undistributed net investment income or loss is the amount of net investment income or loss of a Fund since inception that has not been paid to shareholders as a dividend.
Undistributed net realized gain (loss) on investments is the amount of net realized gains or losses generated by a Fund since inception that have not been distributed to shareholders in the form of a capital gain distribution. A gain or loss is realized when a security is sold by a Fund. Net unrealized appreciation (depreciation) on investments is the change in value from the purchase price of securities a Fund continues to hold.
The number of shares a Fund is authorized to sell can be found under Capital Stock Issued and Outstanding. Issued and outstanding indicates the number of shares owned by shareholders.
Net Asset Value (NAV), Redemption Price and Offering Price Per Share shows the value of one outstanding share of a Fund on the date of the report. A Fund’s share price (NAV) is calculated by dividing the value of all securities and other assets owned by a Fund, less the liabilities charged to that Fund, by the number of Fund shares outstanding. The share price is calculated at the close of business of the New York Stock Exchange on each day the Exchange is open for trading. Please see Wasatch Funds’ prospectus for more information about how share prices are calculated. Information about how the share price is affected by a Fund’s operation can be found under “Financial Highlights” on page 153.
STATEMENTSOF OPERATIONS
Statements of Operations show investment income and expenses for each Fund as well as realized gains or losses from securities sold and the appreciation or depreciation in the value of a Fund’s holdings during the reporting period.
Investment Income shows Interest and Dividends earned from interest-bearing and dividend-paying securities in a Fund’s portfolio.
Expenses show the various fees and expenses paid out of a Fund’s assets such as the fee paid to Wasatch Advisors, the Funds’ investment advisor. Additional fees include shareholder servicing, fund administration and accounting, custody of fund assets, federal and state registration, legal counsel, auditing and trustees’ fees and other expenses. The Funds pay for printing and mailing statements, prospectuses, annual reports and semi-annual reports to shareholders.
Net Investment Income (Loss) is the amount of dividends and interest income earned on securities held by a Fund, less the Fund’s expenses.
Net realized gain (loss) on investments and foreign currency translations is the net gain or loss on securities a Fund has sold. Change in unrealized appreciation (depreciation) on investments and foreign currency translations is the change in value of securities a Fund continues to hold.
Net gain (loss) on investments is the result of changes in the market value of securities a Fund has sold and securities it continues to hold.
STATEMENTSOF CHANGESIN NET ASSETS
Net Assets are a Fund’s remaining assets after taking into consideration any liabilities. Statements of Changes in Net
152
| | |
| | MARCH 31, 2013 (UNAUDITED) |
|
|
|
Assets show the increase or decrease in a Fund’s net assets during the reporting period. Investment operations, dividends and capital share transactions affect a Fund’s net assets. Operations is a summary of the Statements of Operations. It includes investment income or loss, net realized gain or loss on investments and foreign currency translations a Fund has sold as well as appreciation or depreciation in the value of investments a Fund continues to hold.
Dividends are distributed by Wasatch Funds to sharehold-ers when Fund investments have earned income in excess of net expenses or when capital gains in excess of capital losses are realized from the sale of securities. Most shareholders choose to reinvest their dividends and capital gain distribu- tions. Each Fund is required by Internal Revenue Code regulations to distribute substantially all of its net investment income and capital gains to shareholders in order to retain its status as a “regulated investment company.”
Capital share transactions are any transactions involving shares of a Fund, including the selling of Fund shares, shares issued by a Fund to shareholders for the reinvestment of dividends, and share redemptions.
FINANCIAL HIGHLIGHTS
The Financial Highlights contain important historical operating information that you may find useful in making decisions or understanding the performance of your investment.
Net Asset Value (NAV) is defined under “Statements of Assets and Liabilities” on page 152. The difference between the Net asset value, beginning of period and the Net asset value, end of period in the Financial Highlights is the change in value of a Fund’s shares over the reporting period, but not its total return.
Income (loss) from investment operations shows how the share price was affected by a Fund’s operations on a per share basis. Net investment income (loss) is the per share
amount of dividends and interest income earned on securities held by a Fund, less the Fund’s expenses. Net realized and unrealized gains (losses) on investments is the per share increase or decrease in the value of securities a Fund holds or has sold during the reporting period. Gains or (losses) are realized when securities are sold. Gains or (losses) are unrealized when securities increase or decrease in value but are not sold.
Distributions are the per share amount a Fund paid to shareholders from net investment income and net realized gains.
Total return is the percentage increase or decrease in the value of an investment over a stated period of time. A total return percentage includes both changes in unrealized and realized gains and income. For the purposes of calculating total return, it is assumed that dividends and distributions are reinvested at the share price on the ex-dividend date of the distribution. A FUND’S TOTAL RETURN CANNOT BE COMPUTED DIRECTLY FROM THE FINANCIAL HIGHLIGHTS.
Ratios to Average Net Assets and Supplemental Data are provided to help you better understand your investment. Net assets, end of period, are the net assets of a Fund on the reporting date. Ratio of expenses to average net assets shows the total of a Fund’s operating expenses divided by its average net assets for the stated period before and after waivers and reimbursements by the Advisor, if any. Ratio of net investment income (loss) to average net assets shows a Fund’s net investment income (loss) divided by its average net assets for the stated period before and after waivers and reimbursements by the Advisor, if any. Portfolio turnover rate measures a Fund’s buying and selling activity during the reporting period. It is computed by dividing total purchases or sales, whichever is less, by the average monthly market value of a Fund’s portfolio securities. This calculation does not include securities with a maturity date of less than 12 months.
TELEPHONE
800.551.1700
M - F, 7:00 a.m. to 7:00 p.m. CT
Automated Line, 24 Hours
U.S. MAIL
Wasatch Funds
P.O. Box 2172
Milwaukee, WI 53201-2172
OVERNIGHT MAIL
Wasatch Funds
803 West Michigan Street, Suite A
Milwaukee, WI 53233-2301
ONLINE
www.wasatchfunds.com
shareholderservice@wasatchfunds.com
153

Not required.
| Item 3: | Audit Committee Financial Expert. |
Not required.
| Item 4. | Principal Accountant Fees and Services. |
Not required.
| Item 5. | Audit Committee of Listed Registrants. |
Not applicable.
| Item 6. | Schedule of Investments. |
(a) Schedule of Investments is included as a part of the report to shareholders filed under Item 1 of this Form N-CSR.
(b) Not applicable.
| Item 7. | Disclosure of Proxy Voting Policies and Procedures for Closed-End Management Investment Companies. |
Not applicable.
| Item 8. | Portfolio Managers of Closed-End Investment Companies. |
Not applicable.
| Item 9. | Purchases of Equity Securities by Closed-End Management Investment Company and Affiliated Purchasers. |
Not applicable.
| Item 10. | Submission of Matters to a Vote of Security Holders. |
Shareholders may submit for the Governance and Nominating Committee’s (the “Committee”) consideration, recommendations regarding potential Trustee nominees. Any shareholder submissions must conform to the policies and procedures governing such nominations as established by the Committee and published on the Investor Education tab of the Registrant’s website www.WasatchFunds.com.
| Item 11. | Controls and Procedures. |
| (a) | The Registrant’s principal executive and principal financial officers have concluded that the Registrant’s disclosure controls and procedures (as defined in Rule 30a-3(c) under the Investment Company Act of 1940, as amended (the “1940 Act”)) are effective, as of a date within 90 days of the filing date of this Form N-CSR based on their evaluation of these controls and procedures required by Rule 30a-3(b) under the 1940 Act) and Rules 13a-15(b) or 15d-15(b) under the Securities Exchange Act of 1934). |
| (b) | There were no changes in the Registrant’s internal control over financial reporting (as defined in Rule 30a-3(d) under the 1940 Act) that occurred during the Registrant’s second fiscal quarter of the period covered by this report that has materially affected, or is reasonably likely to materially affect, the Registrant’s internal control over financial reporting. |
| | |
| |
| (a)(1) | | Not required. |
| |
| (a)(2) | | The certifications required by Rule 30a-2(a) of the 1940 Act are attached hereto. |
| |
| (a)(3) | | Not applicable. |
| |
| (b) | | The certifications required by Rule 30a-2(b) of the 1940 Act and Section 906 of the Sarbanes-Oxley Act of 2002 are attached hereto. |
SIGNATURES
Pursuant to the requirements of the Securities Exchange Act of 1934 and the Investment Company Act of 1940, the Registrant has duly caused this report to be signed on its behalf by the undersigned, thereunto duly authorized.
| | |
| WASATCH FUNDS TRUST |
| |
| By: | | /S/ SAMUEL S. STEWART, JR. |
| | Samuel S. Stewart, Jr. President (principal executive officer) of Wasatch Funds Trust |
Date: June 6, 2013
Pursuant to the requirements of the Securities Exchange Act of 1934 and the Investment Company Act of 1940, this report has been signed below by the following persons on behalf of the Registrant and in the capacities and on the dates indicated.
| | |
| |
| By: | | /S/ SAMUEL S. STEWART, JR. |
| | Samuel S. Stewart, Jr. President (principal executive officer) of Wasatch Funds Trust |
Date: June 6, 2013
| | |
| |
| By: | | /S/ CINDY B. FIRESTONE |
| | Cindy B. Firestone Treasurer (principal financial officer) of Wasatch Funds Trust |
Date: June 6, 2013