UNITED STATES
SECURITIES AND EXCHANGE COMMISSION
Washington, D.C. 20549
FORM N-CSR
CERTIFIED SHAREHOLDER REPORT OF REGISTERED
MANAGEMENT INVESTMENT COMPANIES
Investment Company Act file number: 811-04920
WASATCH FUNDS TRUST
(Exact name of registrant as specified in charter)
505 Wakara Way,
3rd Floor
Salt Lake City, UT 84108
(Address of principal executive offices)(Zip code)
| | |
| (Name and Address of Agent for Service) | | Copy to: |
| |
Samuel S. Stewart, Jr. Wasatch Advisors, Inc. 505 Wakara Way, Suite 300 Salt Lake City, UT 84108 | | Eric F. Fess, Esq. Chapman & Cutler LLP 111 West Monroe Street Chicago, IL 60603 |
Registrant’s telephone number, including area code: (801) 533-0777
Date of fiscal year end: September 30
Date of reporting period: March 31, 2014
| Item 1: | Report to Shareholders. |
Wasatch Funds
Salt Lake City, Utah
www.WasatchFunds.com
800.551.1700
This material must be accompanied or preceded by a prospectus.
Please read the prospectus carefully before you invest.
Wasatch Funds are distributed by ALPS Distributors, Inc.
1
| | | | |
LETTERTO SHAREHOLDERS — THREE YARDSANDA CLOUDOF DUST | | |
| |
| | |
| | |
| | |

Samuel S. Stewart, Jr. PhD, CFA President of
Wasatch Funds | | DEAR FELLOW SHAREHOLDERS: Former Ohio State football coach Woody Hayes was well-known for his conservative offense. He was often quoted as saying, “There are only three things that can happen when you pass, and two of them are bad.” The two bad outcomes are either an incompletion or an interception. Instead, Hayes favored a methodical, grind-it-out approach, running the ball directly into the line. Described as “three yards and a cloud of dust,” what Hayes’ style of play may have lacked in pizazz, it more than made up for in results. As head coach of the Buckeyes, Hayes compiled an impressive 205-61-10 win-lose-tie record. ECONOMY The U.S. economy today is following a similar offensive playbook, but with less satisfying results. Unlike other post-recession recoveries that featured at least one or two quarters of rapid growth — the economic equivalent of a 60-yard pass play — the current recovery has been characterized by quarter after quarter of slow, grind-it-out gains. The good news is that the economy is inching ahead, rather than slipping back into recession. The bad news is that the progress is modest and unlikely to put much of a dent in unemployment. |
The U.S. economy’s slow march forward is reflected in most of the leading indicators that I have found useful over the years. In addition, gross domestic product (GDP), which is a coincident indicator, has continued to make very small gains. A graph of U.S. GDP since 1947 (which is readily available from the Federal Reserve Bank of St. Louis) shows a remarkably smooth trend overall. But in years marked by recession and recovery, we see some significant quarterly fluctuations in GDP’s rate of change. In recession years, GDP sometimes fell by over 5% on an annualized basis. Those declines were often offset in recovery years by gains approaching or exceeding 10% on an annualized basis.
The economy has performed differently during the period that included the global financial crisis and the subsequent recovery. In 2008, GDP dropped by an annualized 8.3%, which was painful and on par with some of the worst downturns since 1947. Since the economic low in 2009, annualized GDP growth has averaged only 2.4%. This 2.4% average is certainly not what we’d expect during a “recovery,” considering that the overall average GDP growth rate since 1947 has been 3.2%. Because our current growth rate is below not only past recoveries but also below the long-term trend, you can see why I’ve dubbed this recovery as “the tortoise economy.”
GDP growth in the fourth quarter of 2013 fell to 2.6% from 4.1% for the third quarter. This trend may have weakened even further in the quarter ended March 31, 2014, partly due to the harsh winter most of the country experienced. For the entire year of 2014, I expect the overall growth rate to stay below 3%. So, like Woody Hayes’ offense, I expect our recovery to continue grinding forward. But as businesspeople and investors, we should also be aware that we’re operating within the tortoise economy.
MARKETS
Stock prices have certainly gone up a lot since the global financial crisis. For example, U.S. small-cap stocks, as represented by the Russell 2000® Index, have risen more than three-fold since the market’s bottom in 2009. Based on the dramatic rise in stock prices and my overall economic concerns, I have been cautioning investors that the market may experience periodic “air pockets,” much like an airplane that hits turbulence, drops precipitously and then recovers.
In January of 2014, my caution seemed warranted as the S&P 500® Index fell 3.46% and the Russell 2000 Index fell 2.77% for the month. But gains of 4.57% and 4.71%, respectively, in February brought both indices back into positive territory for the year-to-date. While March was bumpy, both indices remained positive for the quarter with the S&P 500 returning 1.81% and the Russell 2000 returning 1.12%.
For bonds, the ride was considerably smoother during the first quarter. The intermediate-term Barclays Capital U.S. Aggregate Bond Index rose 1.84% and the long-term Barclays U.S. 20+ Year Treasury Bond Index rose 7.73%. But at current prices, I believe that U.S. government bonds are more expensive than at almost any time in over 50 years. I continue to warn investors that if interest rates rise substantially, the declines in bond prices — particularly in long-term bond prices — could be devastating.
While I concede that the economy is sluggish, that overall stock valuations are relatively high, and that some indicators are pointing down, I remain cautiously bullish for two primary reasons. First, I believe that all market indicators must be taken with a grain of salt because the level of monetary stimulus by the Federal Reserve and other central banks has been massive, unprecedented and beyond any investor’s experience. We’re in uncharted territory, so I wouldn’t automatically assume that any indicator, positive or negative, is necessarily predictive in the current environment. Second, while the market as a whole seems overvalued, we at Wasatch invest in individual companies that we believe are unique and we take into account their valuations.
In the portfolios I manage, I’m maintaining a relatively high amount of cash, “dry powder” that I can use as I find companies with more reasonable valuations over time. Other than that, I’m sticking to the basics — like Woody Hayes — in an attempt to reduce risk. I’m operating under the philosophy of, “When in doubt, throw it out.” That means I’m pruning holdings with stock prices that seem to have gotten ahead of company fundamentals. I want my portfolios to only hold companies in which I’m comfortable with the valuations. I’m focused on companies that are growing their earnings, while at the same time maintaining or increasing their market share. This investment discipline causes me to stay away from social-media companies, for example, which may be increasing their market share, but are generally light on earnings.
2
| | |
| | MARCH 31, 2014 (UNAUDITED) |
|
|
|
Aggressive investing may have its place during a more normal economic recovery, with lower overall stock valuations and typical monetary policies in place. Today’s environment is much different. We’ve never been down this road before, and now is not the time to put the pedal to the metal. But, for the reasons discussed here, I don’t think it makes sense to abandon stocks, either. I’m simply proceeding with caution.
Despite the challenges and uncertainties we face, I’m optimistic about the future. And this optimism extends well beyond the United States. I recently returned from a trip to Southeast Asia and France. While traveling, I couldn’t help but notice the increased diversity of the other tourists I encountered. In Myanmar, for example, there were some Americans and Europeans, but also Chinese, Thais and others. This increased diversity is clear evidence of the prosperous middle class that’s spreading around the globe. While the rise of the middle class is gratifying to see because it means that overall living conditions are improving, it’s also a good sign for investors in companies that are serving the growing demands of middle-class consumers all over the world.
WASATCH
I’m pleased to announce that two Wasatch funds received a total of three 2014 Lipper Awards, which recognize mutual funds that deliver consistently strong risk-adjusted performance relative to peers.
The Wasatch World Innovators Fund (WAGTX) was honored as #1 for both the three-year and five-year periods ended December 31, 2013 among 163 and 112 global multi-cap growth funds, respectively. I manage the Fund with Josh Stewart. We focus on finding innovative companies across industries and around the globe. These companies often benefit from “creative destruction,” in which they set new standards, outmaneuver competitors, and increase market share. We also seek to invest in these companies at reasonable valuations.
The Wasatch Emerging Markets Small Cap Fund (WAEMX) was honored as #1 for the five-year period ended December 31, 2013 among 266 emerging markets funds. Portfolio Managers Roger Edgley and Laura Geritz, and Associate Portfolio Manager Andrey Kutuzov invest in small companies, many of which are meeting home-country consumer needs in emerging markets. The Fund is closed to new investors, though existing direct shareholders and intermediaries with established positions continue to have access to the Fund.
All of us at Wasatch Advisors are very proud of these awards and the performance results they represent.
With sincere thanks for your continued investment and for your trust,

Sam Stewart
President of Wasatch Funds
Information in this document regarding market or economic trends or the factors influencing historical or future performance reflects the opinions of management as of the date of this document. These statements should not be relied upon for any other purpose. Past performance is no guarantee of future results, and there is no guarantee that the market forecasts discussed will be realized.
CFA® is a trademark owned by CFA Institute.
Wasatch Advisors is the investment advisor to Wasatch Funds.
The Lipper Fund Awards program honors funds that have excelled in delivering consistently strong risk-adjusted performance relative to peers. Lipper designates award-winning funds in most individual classifications for the three-, five- and 10-year periods. Lipper Award designations are not intended to constitute investment advice or predict future results, and Lipper does not guarantee the accuracy of this information. In addition to periods of positive returns, the Wasatch Funds that received Lipper Awards experienced some periods of negative returns during the award time frames. Past performance is not indicative of future results.
The Lipper Fund Awards are part of the Thomson Reuters Awards for Excellence, a global family of awards that celebrate exceptional performance throughout the professional investment community. The Thomson Reuters Awards for Excellence recognize the world’s top funds, fund management firms, sell-side firms, research analysts, and investor relations teams. The Thomson Reuters Awards for Excellence also include the Extel Survey Awards, the StarMine Analyst Awards, and the StarMine Broker Rankings. For more information, please contact markets.awards@thomsonreuters.com or visit http://excellence.thomsonreuters.com/.
The Wasatch World Innovators Fund and the Wasatch Emerging Markets Small Cap Fund seek to provide long-term growth of capital.
Someone who is “bullish” or “a bull” is optimistic with regard to the stock market’s prospects.
Gross domestic product (GDP) is a basic measure of a country’s economic performance and is the market value of all final goods and services made within the borders of a country in a year.
Valuation is the process of determining the current worth of an asset or company.
The Russell 2000 Index is an unmanaged total return index of the smallest 2,000 companies in the Russell 3000 Index, as ranked by total market capitalization. The Russell 2000 is widely used in the industry to measure the performance of small company stocks.
The S&P 500 Index includes 500 of the United States’ largest stocks from a broad variety of industries. The Index is unmanaged but is a commonly used measure of common stock total return performance.
The Barclays Capital U.S. Aggregate Bond Index covers the U.S. investment grade fixed rate bond market, including government and corporate securities, agency mortgage pass-through securities, and asset-backed securities.
The Barclays U.S. 20+ Year Treasury Bond Index measures the performance of U.S. Treasury securities that have remaining maturities of 20 or more years.
You cannot invest directly in these or any indices.
3
| | |
| WASATCH CORE GROWTH FUND (WGROX / WIGRX) — Management Discussion | | MARCH 31, 2014 (UNAUDITED) |
|
|
|
The Wasatch Core Growth Fund is managed by a team of Wasatch portfolio managers led by JB Taylor and Paul Lambert.
| | | | |

JB Taylor Lead Portfolio Manager | | 
Paul Lambert Portfolio Manager | | OVERVIEW In the quarter ended March 31, 2014, the Wasatch Core Growth Fund — Investor Class returned -1.10% and underperformed its benchmark, the Russell 2000 Index, which |
returned 1.12%. Over the same period, the Russell 2000 Growth Index returned 0.48%. When compared to the tremendous gains of 2013, returns so far in 2014 seem relatively boring. However, the period-end results don’t illustrate the “tug-of-war” that seems to have started between momentum-oriented investors and investors focused on fundamentals and reasonable valuations. We remain steadfastly in the second camp. This hurt the Fund’s returns relative to the Russell 2000 in 2013.
We take underperformance in any type of market seriously. While we aren’t content with our underperformance over the last 18 months, we recognize that a Fed-fueled, liquidity-driven market like the one we’ve experienced is not optimal for our investment approach. We remain focused on companies with sustainable competitive advantages, high returns on capital and reasonable valuations. We would welcome a market that is driven by long-term fundamentals and appropriately priced risks. There are signs this may be occurring. From the beginning of March, stocks with nosebleed valuations such as those in the biotechnology industry have been selling off and the Fund has outperformed since.
Until the recent pivot, lower-quality stocks had also been some of the market’s strongest performers. This type of performance is unusual so late in a market cycle. Typically, we’ll see the lowest-quality companies do better right off a deep market bottom, but not several years into a recovery.
DETAILSOFTHE QUARTER
One of the Fund’s top contributors for the quarter was Spirit Airlines, a low-cost, low-frills airline. The stock was up over 30% and has increased over 130% since our first purchases in April of last year. Spirit had a phenomenal quarter, growing revenues 28% and earnings over 100% as the company benefited from a growing route network and a good pricing environment.
ICON and MEDNAX were health-care holdings that contributed positively to results during the quarter. ICON provides outsourced services for managing clinical trials in the pharmaceutical, biotechnology and medical-device industries. ICON is our “picks and shovels” play on the biotech boom. While not every highly valued biotech company will deliver the FDA-approved products their investors are hoping for, most of them need the services of a company like ICON. Clinical trials are costly, are highly
specialized, and increasingly require a global reach to run effectively. ICON continues to benefit from this trend. The management team at MEDNAX continues to execute its time-tested business plan with great results. MEDNAX partners with physicians, mostly neonatologists and pediatric sub-specialists, to help manage their businesses so the doctors can focus on better clinical care. This model has worked for decades in neonatology, and now MEDNAX is expanding its business in anesthesiology.
Nu Skin Enterprises was our worst performer during the quarter. Nu Skin is a global direct seller of premium-quality personal-care products and vitamins. We purchased Nu Skin last year and the stock turned out to be one of our strongest contributors in 2013. Our original thesis, that Nu Skin’s sales in China would continue to drive exceptionally high growth rates, was proving out. This momentum was derailed in January, when an enforcement agency of the Chinese government opened an inquiry into Nu Skin’s selling practices. The company has operated in China for over a decade, and we believe Nu Skin has done everything possible to operate within the local laws. This confidence seemed well-founded in March, when the same enforcement agency closed its inquiry and fined Nu Skin a relatively paltry sum of $540,000.
IPC The Hospitalist was another detractor for the quarter. The company is the market leader in the hospitalist industry. IPC’s physicians provide more efficient care of patients and allow hospitals to better manage resources in an increasingly complex and competitive health-care environment. IPC is an example of a well-run company growing in the mid-teens that has underperformed the market.
OUTLOOK
In navigating the current market, we are sticking to our time-tested approach. We continue to focus on what we consider to be high-quality growth companies with business models demonstrating real competitive advantages. In the recently reported quarter, our current portfolio companies generated earnings growth of 19% on revenue growth of 13%. This compares well to the average Russell 2000 company, which grew earnings 8% on revenue growth of 5%. Furthermore, the average Russell 2000 company is not seeing an acceleration in revenue or earnings growth. This is another reason the market’s buoyancy over the last year has been surprising.
While stock prices are up broadly, we are not paying unrealistic prices for our companies. When looking at the average price-to-earnings ratio on expected 2014 calendar-year earnings, the Fund’s holdings trade at a modest discount to the Russell 2000. We believe this combination of above-average growth rates, below average P/E multiples, and strong business models is a good balance for navigating what could be a choppier market environment going forward.
Thank you for the opportunity to manage your assets and for your trust.
| Current | and future holdings are subject to risk. |
4
| | |
| WASATCH CORE GROWTH FUND (WGROX / WIGRX) — Portfolio Summary | | MARCH 31, 2014 (UNAUDITED) |
|
|
|
AVERAGE ANNUAL TOTAL RETURNS
| | | | | | | | | | | | | | | | |
| | | SIX MONTHS* | | | 1 YEAR | | | 5 YEARS | | | 10 YEARS | |
Core Growth (WGROX) — Investor | | | 5.71% | | | | 19.67% | | | | 26.13% | | | | 7.85% | |
Core Growth (WIGRX) — Institutional | | | 5.74% | | | | 19.75% | | | | 26.17% | | | | 7.87% | |
Russell 2000® Index | | | 9.94% | | | | 24.90% | | | | 24.31% | | | | 8.53% | |
Russell 2000® Growth Index | | | 8.69% | | | | 27.19% | | | | 25.24% | | | | 8.87% | |
Data shows past performance, which is not indicative of future performance. Current performance may be lower or higher than the performance quoted. To obtain the most recent month-end performance data available, please visit www.WasatchFunds.com. The Advisor may absorb certain Fund expenses, without which total return would have been lower. Investment returns and principal value will fluctuate and shares, when redeemed, may be worth more or less than their original cost.
As of the January 31, 2014 prospectus, the Total Annual Fund Operating Expenses for the Wasatch Core Growth Fund — Investor Class: 1.21% / Institutional Class: 1.32%, Net: 1.12%. The expense ratio shown elsewhere in this report may be different. Net expenses are based on Fund expenses, net of waivers and reimbursements. See the prospectus for additional information regarding Fund expenses.
Wasatch Funds will deduct a 2.00% redemption proceeds fee on Fund shares held 60 days or less. Performance data does not reflect the deduction of fees, including sales charges, or the taxes you would pay on fund distributions or the redemption of fund shares. Fees and taxes, if reflected, would reduce the performance quoted. Wasatch does not charge any sales fees. For more complete information including charges, risks and expenses, read the prospectus carefully.
Performance for the Institutional Class prior to 1/31/2012 is based on the performance of the Investor Class. Performance of the Fund’s Institutional Class prior to 1/31/2012 uses the actual expenses of the Fund’s Investor Class without any adjustments. For any such period of time, the performance of the Fund’s Institutional Class would have been substantially similar to, yet higher than, the performance of the Fund’s Investor Class, because the shares of both classes are invested in the same portfolio of securities, but the classes bear different expenses.
Investing in small cap funds will be more volatile and loss of principal could be greater than investing in large cap or more diversified funds. Investing in foreign securities, especially in emerging markets, entails special risks, such as currency fluctuations and political uncertainties, which are described in more detail in the prospectus.
TOP 10 EQUITY HOLDINGS**
| | | | |
| Company | | % of Net
Assets | |
| Copart, Inc. | | | 6.0% | |
| Life Time Fitness, Inc. | | | 3.6% | |
| MEDNAX, Inc. | | | 3.2% | |
| IDEX Corp. | | | 3.0% | |
| Allegiant Travel Co. | | | 2.8% | |
| | | | |
| Company | | % of Net
Assets | |
| Alliance Data Systems Corp. | | | 2.7% | |
| Waste Connections, Inc. | | | 2.7% | |
| MSC Industrial Direct Co., Inc., Class A | | | 2.4% | |
| Ensign Group, Inc. (The) | | | 2.4% | |
| Credit Acceptance Corp. | | | 2.4% | |
| ** | As of March 31, 2014, there were 66 holdings in the Fund. Foreign currency contracts, written options and repurchase agreements, if any, are not included in the number of holdings. Portfolio holdings are subject to change at any time. References to specific securities should not be construed as recommendations by the Funds or their Advisor. Current and future holdings are subject to risk. |
SECTOR BREAKDOWN†
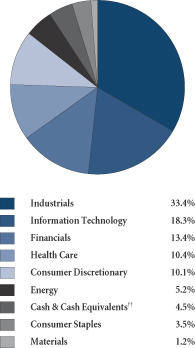
| † | Excludes securities sold short and options written, if any. |
| †† | Also includes Other Assets & Liabilities. |
GROWTHOFA HYPOTHETICAL $10,000 INVESTMENT
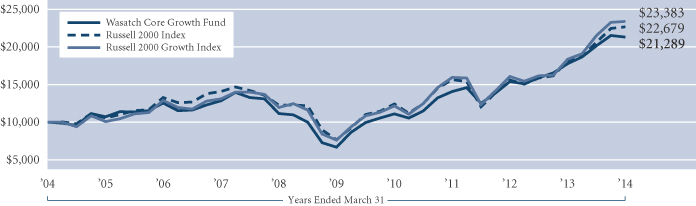
Past performance does not predict future performance. The graph above does not reflect the deduction of fees, sales charges, or taxes that you would pay on fund distributions or the redemption of fund shares. Wasatch does not charge any sales fees. The Russell 2000 Index is an unmanaged total return index of the smallest 2,000 companies in the Russell 3000 Index, as ranked by total market capitalization. The Russell 2000 Index is widely regarded in the industry as accurately capturing the universe of small company stocks. The Russell 2000 Growth Index is an unmanaged total return index that measures the performance of those Russell 2000 Index companies with higher price-to-book ratios and higher forecasted growth values. You cannot invest directly in these or any indices.
5
| | |
| WASATCH EMERGING INDIA FUND (WAINX) — Management Discussion | | MARCH 31, 2014 (UNAUDITED) |
|
|
|
The Wasatch Emerging India Fund is managed by a team of Wasatch portfolio managers led by Ajay Krishnan.
| | |

Ajay Krishnan, CFA Lead Portfolio Manager | | OVERVIEW For the quarter ended March 31, 2014, the Wasatch Emerging India Fund gained 7.39% in what was a strong period for the Indian equity market. The Fund’s benchmark, the MSCI India Investable Market Index (IMI), rose 8.49%. Optimism surrounding the upcoming national elections pushed India’s major stock indices to new all-time highs. The S&P Bombay Stock |
Exchange Sensitive Index (the SENSEX) crossed the previously unseen level of 22,000, while the CNX Nifty (the Nifty) closed above 6,700 for the first time on the final trading day of the quarter. Driving the euphoria was the expectation that Narendra Modi, leader of the Bharatiya Janata Party (BJP), will become prime minister. Investors hope that Mr. Modi will be able to bring to India the same expansions in infrastructure investment and economic growth he achieved as chief minister of the state of Gujarat.
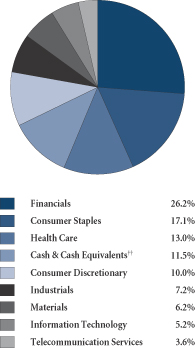
Expectations for a new cycle of infrastructure and corporate investment helped make industrials the top-performing sector of both the MSCI India IMI and the Fund. Our industrial stocks outperformed the benchmark’s industrials, and the Fund’s overweight position in this sector also helped its performance. However, our stocks rose less than the benchmark’s holdings in the financials and the consumer-staples sectors, which were the Fund’s main sources of underperformance relative to the benchmark.
We were not surprised the Fund modestly trailed its benchmark in such an aggressive market like the one we observed for most of the quarter. During sentiment-driven rallies, investors do not place as much emphasis on fundamentals, and in that circumstance, our favored stocks typically would be expected to underperform.
DETAILSOFTHE QUARTER
Our strongest contributor to performance for the quarter was MakeMyTrip, the largest online travel agency in India. Additional capacity in the Indian airline industry is benefiting the company by making air travel more affordable. Other positives for MakeMyTrip include continued strong earnings from its hotel bookings and the growing popularity of making travel reservations on the Internet. Additionally, the company’s successful completion of a secondary stock offering appears to have encouraged investors by eliminating a source of uncertainty.
Page Industries was our second-best contributor. The company makes and sells undergarments and other apparel under the Jockey brand in India, Sri Lanka, Bangladesh, Nepal and the United Arab Emirates. Earnings have been strong as major brands such as Jockey continue to gain market share at the expense of local competitors. Page also is benefiting from good distribution for its products and from its management team’s solid execution.
Our greatest detractor from performance for the quarter was India’s largest non-banking finance company, Mahindra & Mahindra Financial Services. Through its network of branches, Mahindra finances purchases of tractors, utility vehicles, cars and homes, primarily in rural India. In its most-recently reported quarter, the company’s loan provisions and write-offs increased 43% compared to the previous quarter and 121% year-over-year. As a result, earnings fell 18% versus the year-ago period, and the stock declined. However, we think at least some of the shortfall in loan collections will be made up when crops are harvested. We remain positive on the company’s long-term prospects and continue to hold the stock in the Fund.
Jubilant Foodworks operates Domino’s Pizza and Dunkin’ Donuts franchises in India. Earnings declined 10.9% year-over-year in the company’s most-recently reported quarter on higher costs for raw materials, combined with higher spending on advertising and promotion, new-product launches and new-restaurant openings. In addition, same-store sales at Jubilant’s Domino’s Pizza franchises fell 2.6% versus the year-ago period as consumers turned increasingly cautious. While disappointing, the decline in same-store sales was less than at similar chains. For example, at the KFC and Pizza Hut stores operated by YUM Restaurants India,* same-store sales fell 4%. Although Jubilant was our second-largest detractor from performance for the quarter, we believe it remains an attractive long-term holding for the Fund.
OUTLOOK
Recent data suggest the fundamentals in India are improving. In the quarter ended December 31, 2013, the current-account deficit narrowed to 0.9% of gross domestic product (GDP), its lowest level since 2010. The smaller shortfall helped support India’s currency, the rupee, which as of March 31, 2014 had risen nearly 15% since reaching an all-time low on August 28, 2013. From that low, the Fund gained 44.4% versus the benchmark’s 41.8% through March 31, 2014. The strong bounce-back illustrates the importance of patience and a long-term horizon, especially when investing in emerging markets.
Foreign investors, encouraged by improving fundamentals and the firmer rupee, have been helping fuel the gains in India’s stock market as they seek to put money to work ahead of the elections. Together with interest-rate hikes from the Reserve Bank of India, the inflows of foreign funds have contributed to the rupee’s rise.
While the BJP is likely to emerge from the elections as the largest party in India, it may fall short of a majority in parliament. Even with a strong mandate for Mr. Modi, optimism surrounding the elections may fade as the realities of governing a country the size of India become apparent.
To the extent that India’s equity market remains driven by sentiment rather than fundamentals, we would expect the Fund to lag its benchmark. Over the long term, however, we believe the strong fundamentals of our companies will enable them to outperform.
Thank you for the opportunity to manage your assets.
| * | As of March 31, 2014, the Wasatch Emerging India Fund did not hold YUM! Brands, Inc., the parent of YUM Restaurants India. |
| Current | and future holdings are subject to risk. |
6
| | |
| WASATCH EMERGING INDIA FUND (WAINX) — Portfolio Summary | | MARCH 31, 2014 (UNAUDITED) |
|
|
|
AVERAGE ANNUAL TOTAL RETURNS
| | | | | | | | | | |
| | | SIX MONTHS* | | 1 YEAR | | 5 YEARS | | SINCE INCEPTION 4/26/11 | |
Emerging India | | 22.47% | | 11.22% | | N/A | | | 3.31% | |
MSCI India IMI | | 21.02% | | 7.09% | | N/A | | | -5.71% | |
Data shows past performance, which is not indicative of future performance. Current performance may be lower or higher than the performance quoted. To obtain the most recent month-end performance data available, please visit www.WasatchFunds.com. The Advisor may absorb certain Fund expenses, without which total return would have been lower. Investment returns and principal value will fluctuate and shares, when redeemed, may be worth more or less than their original cost.
As of the January 31, 2014 prospectus, the Total Annual Fund Operating Expenses for the Wasatch Emerging India Fund are 2.99%. The Net Expenses are 1.95%. The expense ratio shown elsewhere in this report may be different. Net Expenses are based on Fund expenses, net of waivers and reimbursements. See the prospectus for additional information regarding Fund expenses.
Wasatch Funds will deduct a 2.00% redemption proceeds fee on Fund shares held 60 days or less. Performance data does not reflect the deduction of fees, including sales charges, or the taxes you would pay on fund distributions or the redemption of fund shares. Fees and taxes, if reflected, would reduce the performance quoted. Wasatch does not charge any sales fees. For more complete information including charges, risks and expenses, read the prospectus carefully.
Investing in small cap funds will be more volatile and loss of principal could be greater than investing in large cap or more diversified funds. Investing in foreign securities, especially in emerging markets, entails special risks, such as currency fluctuations and political uncertainties, which are described in more detail in the prospectus. Being non-diversified, the Fund can invest a larger portion of its assets in the stocks of a limited number of companies than a diversified fund. Non-diversification increases the risk of loss to the Fund if the values of these securities decline.
TOP 10 EQUITY HOLDINGS**
| | | | |
| Company | | % of Net
Assets | |
Cognizant Technology Solutions Corp., Class A | | | 3.3% | |
MakeMyTrip Ltd. (India) | | | 3.3% | |
Lupin Ltd. (India) | | | 3.2% | |
Gruh Finance Ltd. (India) | | | 2.8% | |
Mahindra & Mahindra Financial Services Ltd. (India) | | | 2.8% | |
| | | | |
| Company | | % of Net
Assets | |
IPCA Laboratories Ltd. (India) | | | 2.7% | |
Eicher Motors Ltd. (India) | | | 2.5% | |
HCL Technologies Ltd. (India) | | | 2.3% | |
Page Industries Ltd. (India) | | | 2.2% | |
Glenmark Pharmaceuticals Ltd. (India) | | | 2.1% | |
| ** | As of March 31, 2014, there were 63 holdings in the Fund. Foreign currency contracts, written options and repurchase agreements, if any, are not included in the number of holdings. Portfolio holdings are subject to change at any time. References to specific securities should not be construed as recommendations by the Funds or their Advisor. Current and future holdings are subject to risk. |
SECTOR BREAKDOWN†
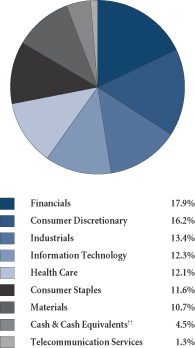
| † | Excludes securities sold short and options written, if any. |
| †† | Also includes Other Assets & Liabilities. |
GROWTHOFA HYPOTHETICAL $10,000 INVESTMENT
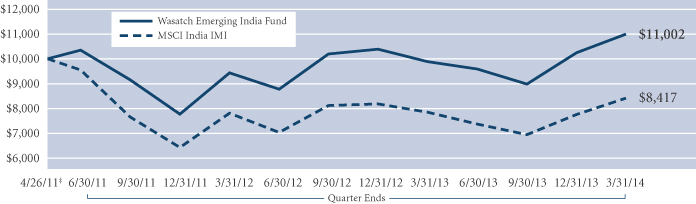
Past performance does not predict future performance. The graph above does not reflect the deduction of fees, sales charges, or taxes that you would pay on fund distributions or the redemption of fund shares. Wasatch does not charge any sales fees. ‡Inception: April 26, 2011. The MSCI India IMI (Investable Market Index) covers all investable large, mid and small cap securities across India, targeting approximately 99% of the Indian market’s free-float adjusted market capitalization. You cannot invest directly in this or any index.
7
| | |
| WASATCH EMERGING MARKETS SELECT FUND (WAESX/WIESX) — Management Discussion | | MARCH 31, 2014 (UNAUDITED) |
|
|
|
The Wasatch Emerging Markets Select Fund is managed by a team of Wasatch portfolio managers led by Ajay Krishnan and Roger Edgley.
| | | | |
Ajay Krishnan, CFA Lead Portfolio Manager | | 
Roger Edgley, CFA Portfolio Manager | | OVERVIEW The quarter ended March 31, 2014 was a volatile period for emerging markets. The Wasatch Emerging Markets Select Fund — Investor Class returned 0.10% for the quarter and |
outperformed its benchmark, the MSCI Emerging Markets Index, which fell 0.43%.
Indonesia was the best-performing country in the Index. The policies of new central-bank governor Agus Martowardogo have helped Indonesia reduce its current-account deficit, stabilize its currency and reassure foreign investors. Also fueling recent gains in the country’s stock market has been optimism about the candidacy of Jakarta governor and presidential frontrunner Joko Widodo. While our Indonesian stocks rose less than those in the Index, that underperformance was more than offset by the Fund’s overweight position in Indonesia compared to its benchmark. As the quarter progressed, we sold two of the Fund’s three Indonesian stocks because we believed the long-term fundamentals did not support their higher prices.
Other countries in which the Fund’s overweight positions helped its performance included India and Thailand. As in Indonesia, the local currencies in India and Thailand strengthened during the quarter in response to political optimism and improving current accounts. Our stocks performed roughly in line with the benchmark’s holdings in India and outperformed in Thailand.
Geopolitical tensions impacted equity prices in Russia, making it the worst-performing country in the Index. Slowing growth in China helped make that country another of the Index’s poor performers. Although we were underweight in China and reduced the Fund’s holdings in Russia during the quarter, in both countries our stocks fell more than those in the Index and hurt the Fund’s performance relative to its benchmark.
DETAILSOFTHE QUARTER
Brazilian drug-store chain Raia Drogasil was our strongest contributor to performance for the quarter after having been our greatest detractor the previous quarter. Higher costs had been frustrating Raia Drogasil’s efforts to realize the benefits of the merger of Raia, S.A. and Drogasil, S.A. that formed the company in 2011. The merger now appears to be paying off. Adjusted net income at Raia Drogasil rose 38.2% year-over-year on 17.5% sales growth in its most-recently reported quarter. Same-store sales during the period increased 6% for mature stores and 11.9% overall as the company closed four of its less-profitable stores and opened 41 new ones.
Promotora y Operadora de Infraestructura (PINFRA) operates toll-road concessions in Mexico under contracts with the government. PINFRA continues to benefit from its strong balance sheet, solid execution and leading position in an industry serving Mexico’s significant infrastructure needs. Earnings before interest, taxes, depreciation and amortization (EBITDA) grew 20.3% in the company’s most-recently reported quarter on revenue growth of 28.5%. Investors reacted positively, and the stock was one of our best contributors during the quarter.
Russia’s annexation of Crimea from Ukraine resulted in a repricing of risk for Russian stocks and for companies with significant exposure to Russia. Two of those, Yandex and O’Key Group, were our greatest detractors for the quarter.
Although the geopolitical risk is very high, the fundamental long-term growth prospects for both companies remain favorable in our view. Yandex, based in the Netherlands, operates Russia’s main Internet search engine. The company also has a strong search presence in Belarus, Kazakhstan, Turkey and Ukraine. O’Key operates a retail chain of hypermarkets and supermarkets in Russia. The company focuses on major metropolitan areas, where we think it is well-positioned to continue taking market share from informal retail-food distributors.
Another of the Fund’s weaker stocks was SouFun Holdings, which operates the leading real-estate Internet portal in China. Concerns about a potential bubble in Chinese real-estate prices weighed on the stock. While we believe weakness in Chinese real estate may pose significant risks for the country’s shadow-banking system, we think SouFun may be relatively insulated. We are cautiously maintaining the Fund’s position as we continue to monitor the situation.
OUTLOOK
Over the next several quarters, China will be a critical country to watch. China’s importance extends well beyond its own borders to its role as an engine of growth throughout Asia. Recently, that engine has been sputtering, as reports on trade, industrial production and investment have been disappointing. Slower growth in China impacts nearby countries dependent upon Chinese imports of their raw materials and finished goods. While the U.S. and Europe appear to be on solid footing, their ability to counteract flagging Chinese demand for Asian exports may be limited. Fiscal and monetary stimulus from the Chinese government may offer the best hope for a reacceleration of growth in the region.
Hope for political change drove rallies in the equity markets of several countries with recent or upcoming elections. Although we believe the gains may be justified in countries where the fundamentals are improving, in other countries the situation is less certain.
As a result of recent sales, the Fund currently holds approximately 11% of its assets in cash. If emerging markets should come under additional stress, we believe that cash could prove to be a valuable strategic asset for capitalizing on the unique opportunities we continue to find.
Thank you for the opportunity to manage your assets.
| Current | and future holdings are subject to risk. |
8
| | |
| WASATCH EMERGING MARKETS SELECT FUND (WAESX/WIESX) — Portfolio Summary | | MARCH 31, 2014 (UNAUDITED) |
|
|
|
AVERAGE ANNUAL TOTAL RETURNS
| | | | | | | | | | | | | | | | |
| | | SIX MONTHS* | | | 1 YEAR | | | 5 YEARS | | | SINCE INCEPTION 12/13/12 | |
Emerging Markets Select (WAESX) — Investor | | | 3.10% | | | | -5.13% | | | | N/A | | | | -1.11% | |
Emerging Markets Select (WIESX) — Institutional | | | 3.34% | | | | -4.51% | | | | N/A | | | | -0.53% | |
MSCI Emerging Markets Index | | | 1.39% | | | | -1.43% | | | | N/A | | | | -1.28% | |
Data shows past performance, which is not indicative of future performance. Current performance may be lower or higher than the performance quoted. To obtain the most recent month-end performance data available, please visit www.WasatchFunds.com. The Advisor may absorb certain Fund expenses, without which total return would have been lower. Investment returns and principal value will fluctuate and shares, when redeemed, may be worth more or less than their original cost.
As of the January 31, 2014 prospectus, the Total Annual Fund Operating Expenses for the Wasatch Emerging Markets Select Fund are Investor Class — Gross: 2.40%, Net: 1.69% / Institutional Class — Gross: 2.21%, Net: 1.50%. The expense ratio shown elsewhere in this report may be different. Net Expenses are based on Fund expenses, net of waivers and reimbursements. See the prospectus for additional information regarding Fund expenses.
Wasatch Funds will deduct a 2.00% redemption proceeds fee on Fund shares held 60 days or less. Performance data does not reflect the deduction of fees, including sales charges, or the taxes you would pay on fund distributions or the redemption of fund shares. Fees and taxes, if reflected, would reduce the performance quoted. Wasatch does not charge any sales fees. For more complete information including charges, risks and expenses, read the prospectus carefully.
Investing in foreign securities, especially in emerging markets, entails special risks, such as currency fluctuations and political uncertainties, which are described in more detail in the prospectus. Investing in small cap funds will be more volatile and loss of principal could be greater than investing in large cap or more diversified funds. Being non-diversified, the Fund can invest a larger portion of its assets in the securities of a limited number of companies than a diversified fund. Non-diversification increases the risk of loss to the Fund if the values of these securities decline.
TOP 10 EQUITY HOLDINGS**
| | | | |
| Company | | % of Net
Assets | |
| Galaxy Entertainment Group Ltd. (Hong Kong) | | | 4.5% | |
| Lupin Ltd. (India) | | | 4.0% | |
| International Container Terminal Services, Inc. (Philippines) | | | 3.7% | |
| Promotora y Operadora de Infraestructura S.A.B. de C.V. (Mexico) | | | 3.5% | |
| | | | |
| Company | | % of Net
Assets | |
| Sino Biopharmaceutical Ltd. (China) | | | 3.5% | |
| SJM Holdings Ltd. (Hong Kong) | | | 3.2% | |
| Coca-Cola Icecek A.S. (Turkey) | | | 3.2% | |
| Sanlam Ltd. (South Africa) | | | 3.2% | |
| Cemex Latam Holdings S.A. (Colombia) | | | 3.2% | |
| Raia Drogasil S.A. (Brazil) | | | 3.1% | |
| ** | As of March 31, 2014, there were 34 holdings in the Fund. Foreign currency contracts, written options and repurchase agreements, if any, are not included in the number of holdings. Portfolio holdings are subject to change at any time. References to specific securities should not be construed as recommendations by the Funds or their Advisor. Current and future holdings are subject to risk. |
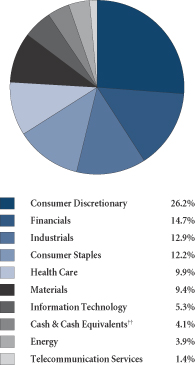
SECTOR BREAKDOWN†
| † | Excludes securities sold short and options written, if any. |
| †† | Also includes Other Assets & Liabilities. |
GROWTHOFA HYPOTHETICAL $10,000 INVESTMENT
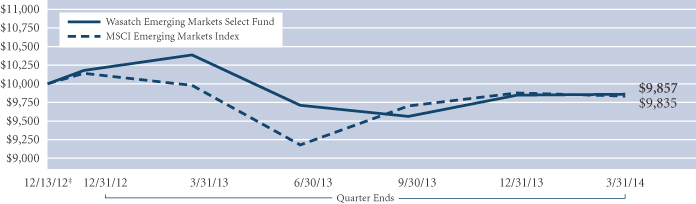
Past performance does not predict future performance. The graph above does not reflect the deduction of fees, sales charges, or taxes that you would pay on fund distributions or the redemption of fund shares. Wasatch does not charge any sales fees. ‡Inception: December 13, 2012. The MSCI Emerging Markets Index is a free float-adjusted market capitalization index designed to measure equity market performance of emerging markets. You cannot invest directly in this or any index.
9
| | |
| WASATCH EMERGING MARKETS SMALL CAP FUND (WAEMX) — Management Discussion | | MARCH 31, 2014 (UNAUDITED) |
|
|
|
The Wasatch Emerging Markets Small Cap Fund is managed by a team of Wasatch portfolio managers led by Roger Edgley, Laura Geritz and Andrey Kutuzov.
| | | | |
Roger Edgley, CFA Lead Portfolio Manager | | 
Laura Geritz, CFA Portfolio Manager | | 
Andrey Kutuzov, CFA Associate Portfolio Manager |
OVERVIEW
The Wasatch Emerging Markets Small Cap Fund returned -3.02% for the quarter ended March 31, 2014 and underperformed the MSCI Emerging Markets Small Cap Index, which returned 3.54%. Performance in emerging market equities was volatile during the quarter. In late January into the first part of February, stocks slid as weak U.S. data raised concerns over the ability of emerging market economies to withstand higher U.S. interest rates on top of softer demand from China. Entering March, geopolitics moved to the forefront, as tensions between Russia and Ukraine rose sharply, culminating in Russia’s annexation of Crimea. Stocks were volatile but mostly traded within a band throughout March.
DETAILSOFTHE QUARTER
The performance of the Fund’s Russian holdings reflected the challenging macro environment. TCS Group, Russia’s leading provider of online retail financial services; M Video, Russia’s largest electronic retail chain; O’Key Group, a fast growing food retailer; MD Medical Group, the leading provider of pre-natal health care; and Global Ports, a leading regional container port operator, were all down in March and detracted from performance for the quarter.
While hopes of stimulus measures to support China’s economy emerged toward the end of the quarter, the Fund’s Chinese stocks were generally down. The Fund continues to be structurally underweight in China and we continue to be highly selective of Chinese companies, as we believe there are real long-term issues that will be difficult to address. Biostime International, a pediatric nutrition and baby care products provider, and Sa Sa International, the largest specialty cosmetics retailer in Hong Kong, were among the Fund’s largest detractors from performance in the quarter.
Student protests in Taiwan continued to delay the passing of a trade pact with China and our Taiwanese stocks were generally weak. The Fund is structurally underweight versus the benchmark in Taiwan at nearly 16% versus the benchmark at approximately 21%. Several of the Fund’s holdings provided solid performance during the quarter, including Airtac International, a pneumatic equipment company with substantial business in China. Other stocks were down, including St. Shine Optical, a contact lens manufacturer.
The Fund’s holdings in India also detracted from absolute and relative performance. The Fund is structurally overweight in India. We have been able to find what we believe are high quality companies with strong corporate governance that fit our investment profile broadly across sectors. A notable detractor was Mahindra & Mahindra Financial Services. Mahindra is a vehicle financier focused on the rural economy of India. The stock has been weak as there were questions surrounding the asset quality in some of the Southern Indian states. Some of these concerns appear to be a matter of timing (collection of payments) and we continue to be constructive on the company’s long-term growth prospects.
The Fund’s holdings in Korea significantly outperformed, up approximately 15% versus the benchmark, which was up about 5%. The Fund is underweight in Korea. We see real opportunities in small cap companies in Korea and have been adding to the Fund’s weight. Some of the attractive main themes we see are in tourism, the Internet and technology companies. We are also seeing the emergence of entrepreneurial, founder-owned, non-chaebol, next-generation companies that have know-how and technology. Hotel Shilla, a hotel and leisure company, was the portfolio’s top contributor, as the stock rose over 27% during the quarter. Paradise, a gaming company, and Hanssem, a manufacturer of kitchen and bath cabinetry, were also among the Fund’s top 10 contributors.
OUTLOOK
One of the trends we are seeing unfold is increasing geopolitical risk globally. The impact is going to be felt throughout the world, whether in developed, emerging or frontier markets as rising geopolitical agitation tends to lead to slowing economic growth and rising risk premiums across the globe. While we are not, nor do we claim to be, experts on geopolitics, we are certainly cognizant of the impact conflict, real or perceived, could have on our companies. We are usually very careful about where we invest and the geopolitical flare-up between Russia and Ukraine caught us by surprise.
Overall, conditions for the companies held by the Fund remain benign. While emerging world growth is slowing, compounded by increasing cost of capital as central banks in emerging markets hike interest rates to offset currency weakness, our companies generally have been able to maintain rock-solid balance sheets and industry-leading margins. While in good times the rising tide lifts all boats, in challenging times like these our companies have been able to gain market share and continue to invest in products and innovation, even as the competition pulls back. As a result, we believe our companies will be well-positioned to take advantage of the new up-cycle in stronger form.
Thank you for your trust and the opportunity to manage your assets.
| Current | and future holdings are subject to risk. |
10
| | |
| WASATCH EMERGING MARKETS SMALL CAP FUND (WAEMX) — Portfolio Summary | | MARCH 31, 2014 (UNAUDITED) |
|
|
|
AVERAGE ANNUAL TOTAL RETURNS
| | | | | | | | | | | | | | | | |
| | | SIX MONTHS* | | | 1 YEAR | | | 5 YEARS | | | SINCE INCEPTION 10/1/07 | |
Emerging Markets Small Cap | | | -1.61% | | | | -10.64% | | | | 26.47% | | | | 4.50% | |
MSCI Emerging Markets Small Cap Index | | | 4.84% | | | | 0.40% | | | | 19.70% | | | | 0.65% | |
MSCI Emerging Markets Index | | | 1.39% | | | | -1.43% | | | | 14.48% | | | | -0.63% | |
Data shows past performance, which is not indicative of future performance. Current performance may be lower or higher than the performance quoted. To obtain the most recent month-end performance data available, please visit www.WasatchFunds.com. The Advisor may absorb certain Fund expenses, without which total return would have been lower. Investment returns and principal value will fluctuate and shares, when redeemed, may be worth more or less than their original cost.
As of the January 31, 2014 prospectus, the Total Annual Fund Operating Expenses for the Wasatch Emerging Markets Small Cap Fund are 2.06%. The Net Expenses are 1.95%. The expense ratio shown elsewhere in this report may be different. Net Expenses are based on Fund expenses, net of waivers and reimbursements. See the prospectus for additional information regarding Fund expenses.
Wasatch Funds will deduct a 2.00% redemption proceeds fee on Fund shares held 60 days or less. Performance data does not reflect the deduction of fees, including sales charges, or the taxes you would pay on fund distributions or the redemption of fund shares. Fees and taxes, if reflected, would reduce the performance quoted. Wasatch does not charge any sales fees. For more complete information including charges, risks and expenses, read the prospectus carefully.
Investing in foreign securities, especially in emerging markets, entails special risks, such as currency fluctuations and political uncertainties, which are described in more detail in the prospectus. Investing in small cap funds will be more volatile and loss of principal could be greater than investing in large cap or more diversified funds.
TOP 10 EQUITY HOLDINGS**
| | | | |
| Company | | % of Net
Assets | |
Hotel Shilla Co. Ltd. (Korea) | | | 2.0% | |
Merida Industry Co. Ltd. (Taiwan) | | | 2.0% | |
Paradise Co. Ltd. (Korea) | | | 1.9% | |
Grand Korea Leisure Co. Ltd. (Korea) | | | 1.8% | |
International Container Terminal Services, Inc. (Philippines) | | | 1.8% | |
| | | | |
| Company | | % of Net
Assets | |
St. Shine Optical Co. Ltd. (Taiwan) | | | 1.8% | |
Promotora y Operadora de Infraestructura S.A.B. de C.V. (Mexico) | | | 1.8% | |
Ulker Biskuvi Sanayi A.S. (Turkey) | | | 1.7% | |
Chailease Holding Co. Ltd. (Taiwan) | | | 1.7% | |
Pidilite Industries Ltd. (India) | | | 1.7% | |
| ** | As of March 31, 2014, there were 96 holdings in the Fund. Foreign currency contracts, written options and repurchase agreements, if any, are not included in the number of holdings. Portfolio holdings are subject to change at any time. References to specific securities should not be construed as recommendations by the Funds or their Advisor. Current and future holdings are subject to risk. |
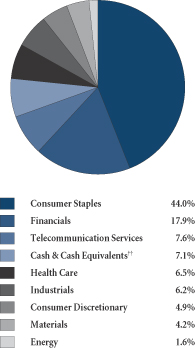
SECTOR BREAKDOWN†
| † | Excludes securities sold short and options written, if any. |
| †† | Also includes Other Assets & Liabilities. |
GROWTHOFA HYPOTHETICAL $10,000 INVESTMENT
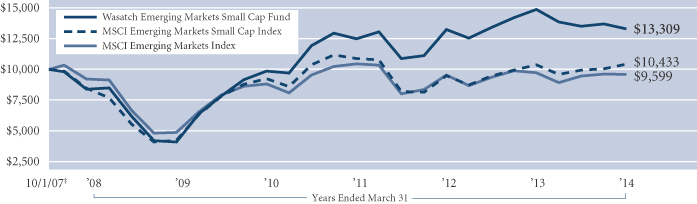
Past performance does not predict future performance. The graph above does not reflect the deduction of fees, sales charges, or taxes that you would pay on fund distributions or the redemption of fund shares. Wasatch does not charge any sales fees. ‡Inception: October 1, 2007. The MSCI Emerging Markets and Emerging Markets Small Cap indices are free float-adjusted market capitalization indices designed to measure the equity market performance of emerging markets. You cannot invest directly in these or any indices.
11
| | |
| WASATCH FRONTIER EMERGING SMALL COUNTRIES FUND (WAFMX) — Management Discussion | | MARCH 31, 2014 (UNAUDITED) |
|
|
|
The Wasatch Frontier Emerging Small Countries Fund is managed by a team of Wasatch portfolio managers led by Laura Geritz.
| | |
Laura Geritz, CFA Lead Portfolio Manager | | OVERVIEW The Wasatch Frontier Emerging Small Countries Fund returned 1.93% for the quarter ended March 31, 2014, underperforming its primary benchmark, the MSCI Frontier Emerging Markets Index, and the MSCI Frontier Markets Index, which gained 7.28% and 7.41%, respectively. Frontier markets finished the quarter well ahead of their emerging and developed market peers with some of the best performance coming from |
the Middle East in the United Arab Emirates (U.A.E.), Qatar and Kuwait — countries where the Fund is underweight relative to the benchmark. It appears these markets are being driven by two different but intertwined catalysts. The first is the upgrade of the U.A.E. and Qatar from frontier to emerging market status with their placement in the MSCI Emerging Markets Index. The second is Kuwait being left behind in the Frontier Emerging Markets Index but with a much larger position. The upgrade announcement was made in June of 2013 with the index changes becoming effective in May of this year. It was at the approximate time of this announcement that the Fund started to underperform relative to the Index.
We recognized that some of these markets in the Middle East had low valuations. We sought to invest in quality companies when we discovered them on fundamental research trips, but we saw a risk to the Fund’s short-term performance relative to the Index if valuation bounced up. We were also unable to find enough names that we thought were high enough quality to have the Fund’s weight match that of the benchmark in the Middle East. The stock prices of a number of inexpensive, cyclical companies in the Middle East have risen significantly. In addition, lower-quality companies, including a handful of cyclical property companies, led the rally in markets like the U.A.E. and our names, which we consider to be higher-quality, just didn’t keep up. When reviewing the companies that have led the rally, their stocks no longer seem inexpensive, and we do not believe market rallies driven by low-quality, cyclical companies are sustainable. In contrast, we feel we have a broadly positioned portfolio of high-quality stocks that should do well when this low-quality surge ends.
DETAILSOFTHE QUARTER
Looking at results for the quarter, the Fund had strong performance due to stock-picking and an overweight position in Bangladesh. A number of our best contributing stocks came from this market, including Square Pharmaceuticals, British American Tobacco Bangladesh and Olympic Industries. Saudi Arabia, a country we consider to be a frontier market, also added a number of top contributors including Abdullah Al Othaim Markets and Jarir Marketing. Our team was on the ground in Saudi Arabia during the quarter.
While the outlook for growth is still good, we are watching valuations carefully — the Saudi market has had a big move.
Our worst contributing market was Nigeria. Our stocks declined slightly more than those in the Index and our overweight hurt. Names like Zenith Bank, Nestlé Foods Nigeria, Guinness Nigeria and Cadbury Nigeria all contracted during the quarter. The good news is that valuations in Nigeria look attractive, and since quarter-end, we have been seeing a strong recovery in a number of our names.
I’m often asked the question, “Have frontier markets come too far too fast?” Frontier markets have enjoyed a sustained period of outperformance…their salad days. Investors have been attracted to the asset class on hopes of better growth than they are seeing in either the emerging or the developed world and on prospects of better diversification benefits. What’s curious to me is that markets that have had higher correlation to the developed world (e.g., those in the Middle East) have been driving recent performance. There are signs of a momentum trade gone too far — of valuations in some parts of the world that are rising too quickly. We are not chasing these investments.
OUTLOOK
The Fund is not positioned to keep up with the movements in the current market environment. Shareholder money should be treated dearly. When markets get too hot, we are willing to step back, stay diversified, and focus on quality. In other words, we are willing to lose a short-term battle in order to retain the potential to deliver good consistent returns over the long term. The U.S. economy is seeing some benefit in the short run, and this is helping other regions of the world, the Middle East and Frontier Europe, to cyclical recoveries. I’m worried that equity markets have gotten too hot in some regions of the world. It might simply be the shifting of the sands — the graduation of the U.A.E. and Qatar from frontier to emerging and the increasing weight of Kuwait in the frontier index. When these regions of the world are stripped away, frontier valuations look reasonable.
While I’m cognizant of a run up of stock prices in the Middle East, I’m optimistic about the portfolio we’ve constructed. I believe it is positioned to hold up well if the market pulls back, which we believe is possible given this stage of the rally. The Fund is composed of a unique and differentiated set of frontier market countries and companies. We believe our companies have outstanding potential for long-term growth and valuations look reasonable. However, we are always aware of where our countries sit in relation to the rest of the world.
Thank you for your investment.
| Current | and future holdings are subject to risk. |
12
| | |
| WASATCH FRONTIER EMERGING SMALL COUNTRIES FUND (WAFMX) — Portfolio Summary | | MARCH 31, 2014 (UNAUDITED) |
|
|
|
AVERAGE ANNUAL TOTAL RETURNS
| | | | | | | | | | | | | | |
| | | SIX MONTHS* | | | 1 YEAR | | | 5 YEARS | | SINCE INCEPTION 1/31/12 | |
Frontier Emerging Small Countries | | | 6.92% | | | | 11.03% | | | N/A
| | | 23.88% | |
MSCI Frontier Emerging Markets Index | | | 8.94% | | | | 7.17% | | | N/A | | | 12.52% | |
MSCI Frontier Markets Index | |
| 14.44%
|
| | | 24.99% | | | N/A | | | 19.46% | |
Data shows past performance, which is not indicative of future performance. Current performance may be lower or higher than the performance quoted. To obtain the most recent month-end performance data available, please visit www.WasatchFunds.com. The Advisor may absorb certain Fund expenses, without which total return would have been lower. Investment returns and principal value will fluctuate and shares, when redeemed, may be worth more or less than their original cost.
As of the January 31, 2014 prospectus, the Total Annual Fund Operating Expenses for the Wasatch Frontier Emerging Small Countries Fund are 2.43%. The Net Expenses are 2.25%. The expense ratio shown elsewhere in this report may be different. Net Expenses are based on Fund expenses, net of waivers and reimbursements. See the prospectus for additional information regarding Fund expenses.
Wasatch Funds will deduct a 2.00% redemption proceeds fee on Fund shares held 60 days or less. Performance data does not reflect the deduction of fees, including sales charges, or the taxes you would pay on fund distributions or the redemption of fund shares. Fees and taxes, if reflected, would reduce the performance quoted. Wasatch does not charge any sales fees. For more complete information including charges, risks and expenses, read the prospectus carefully.
Investing in small cap funds will be more volatile and loss of principal could be greater than investing in large cap or more diversified funds. Investing in foreign securities, especially in frontier and emerging markets, entails special risks, such as currency fluctuations and political uncertainties, which are described in more detail in the prospectus. Being non-diversified, the Fund can invest a larger portion of its assets in the stocks of a limited number of companies than a diversified fund. Non-diversification increases the risk of loss to the Fund if the values of these securities decline.
TOP 10 EQUITY HOLDINGS**
| | | | |
| Company | | % of Net
Assets | |
| Safaricom Ltd. (Kenya) | | | 3.3% | |
| Viet Nam Dairy Products JSC (Vietnam) | | | 3.0% | |
| MTN Group Ltd. (South Africa) | | | 2.9% | |
| Universal Robina Corp. (Philippines) | | | 2.8% | |
| Nestlé Nigeria plc (Nigeria) | | | 2.8% | |
| | | | |
| Company | | % of Net
Assets | |
| East African Breweries Ltd. (Kenya) | | | 2.4% | |
| Square Pharmaceuticals Ltd. (Bangladesh) | | | 2.4% | |
| Qatar National Bank (Qatar) | | | 2.2% | |
| Nigerian Breweries plc (Nigeria) | | | 2.0% | |
| Brasseries Maroc (Morocco) | | | 1.9% | |
| ** | As of March 31, 2014, there were 126 holdings in the Fund. Foreign currency contracts, written options and repurchase agreements, if any, are not included in the number of holdings. Portfolio holdings are subject to change at any time. References to specific securities should not be construed as recommendations by the Funds or their Advisor. Current and future holdings are subject to risk. |
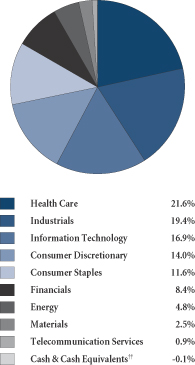
SECTOR BREAKDOWN†
| † | Excludes securities sold short and options written, if any. |
| †† | Also includes Other Assets & Liabilities. |
GROWTHOFA HYPOTHETICAL $10,000 INVESTMENT
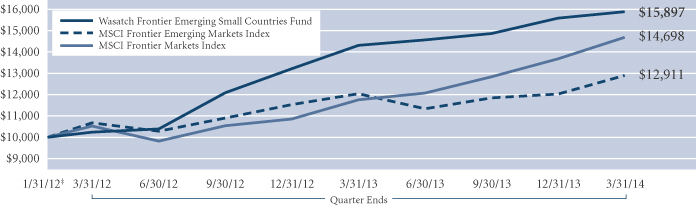
Past performance does not predict future performance. The graph above does not reflect the deduction of fees, sales charges, or taxes that you would pay on fund distributions or the redemption of fund shares. Wasatch does not charge any sales fees. ‡Inception: January 31, 2012. The MSCI Frontier Emerging Markets and MSCI Frontier Markets indices are free float-adjusted market capitalization indices designed to measure the equity market performance of the global frontier and emerging markets. You cannot invest directly in these or any indices.
13
| | |
| WASATCH GLOBAL OPPORTUNITIES FUND (WAGOX) — Management Discussion | | MARCH 31, 2014 (UNAUDITED) |
|
|
|
The Wasatch Global Opportunities Fund is managed by a team of Wasatch portfolio managers led by JB Taylor and Ajay Krishnan.
| | | | |
JB Taylor Lead Portfolio Manager | |
Ajay Krishnan, CFA Lead Portfolio Manager | | OVERVIEW In general, small cap equities began 2014 on a positive note. The MSCI AC World Small Cap Index gained 2.90% in the quarter ended March 31, 2014, and the Wasatch Global Opportunities Fund returned -2.06%. |
International small cap markets rose 3.47%, as measured by the MSCI AC World Ex-U.S.A. Small Cap Index. European equities performed especially well, as the euro zone recovery that began last spring showed signs of strengthening. Markets in Portugal, Italy, Spain and France posted double-digit gains for the quarter. Emerging markets rallied strongly in February and March after several countries took steps to narrow their current account deficits and support their currencies.
In the United States, small caps rose 2.39% for the quarter, as measured by the MSCI U.S.A. Small Cap Index. The market was volatile — the Index was down almost 5% through early February and then up almost 5% by early March. We believe the volatility was a function of investors trying to determine if continued gains in U.S. small caps were justified on the heels of last year’s exceptional returns. Their indecision was driven by several factors, including new leadership at the Federal Reserve, signs the housing recovery was losing momentum and conflicting reports on the health of the job market.
DETAILSOFTHE QUARTER
Our international holdings, which on average during the quarter represented about 60% of the Fund, lost more than 3% in the quarter, trailing the 3.47% gain in the MSCI AC World Ex-U.S.A. Small Cap Index. In developed markets, the Fund benefited from good stock selection in Japan and Norway where MonotaRO (Japan) and TGS-NOPEC Geophysical (Norway) were strong performers. Conversely, stock selection in Italy and the United Kingdom detracted. In emerging markets, being overweight in India and Indonesia added nearly 1.5% to relative performance, and stock selection in Brazil was a plus. However, these and other positive effects were overshadowed by the Fund’s positioning in Russia and China.
Two of the worst-performing stocks in the portfolio were Eurasia Drilling, a provider of oilfield services, and TCS Group, an online financial services firm. Both of these Russian stocks fell sharply in response to the unforeseen events in Ukraine, which led the United States and European Union to impose economic sanctions on Russia. We believe the fundamentals of Eurasia Drilling and TCS are sound but are reviewing these positions in light of the political crisis.
The Fund’s U.S. stocks, which accounted for about 38% of the portfolio, rose just over 1%, a result that trailed the 2.39% gain in the MSCI U.S.A. Small Cap Index. Strong stock selection in the health care and industrial sectors was offset by weakness elsewhere, most notably in some of our financial and consumer holdings.
Our U.S. health care stocks gained more than 9% overall, and Covance was one of our top-contributing stocks in the sector. Covance is a long-time holding and one of the bigger cap names in the Fund. The contract research organization (CRO) runs clinical trials for drug manufacturers and biotech firms. Increasingly, to have a really robust clinical trial, it has to be conducted globally. As a result, more business is being awarded to CROs like Covance, whose global reach allows them to access patients from around the world.
Knight Transportation was the top U.S. contributor in the Fund. We have owned Knight for a while and have always believed that it is the best-run trucking company in the country. That said, this was one of the stock’s first quarters of significant outperformance in about two years. The confounding part of this story is that the economy had been gaining momentum throughout this time, but the operating results of trucking companies were not improving. If anything, the industry was still losing capacity as truckers continued to go out of business following the 2008 - 2009 recession. The overcapacity that existed seems to have finally been weeded out and, with volumes still growing, trucking companies are finally starting to have pricing power.
Hibbett Sports was one of our weaker U.S. stocks. Hibbett operates a chain of stores that sell everyday sporting apparel and equipment, mainly in small towns across the United States. Because it doesn’t focus on trendier merchandise, which goes in and out of fashion, the company’s business has generally been very steady. However, the stock was impacted by the current perception that, if a retailer isn’t Internet retail, it can’t be that interesting. The price-to-earnings (P/E) ratio of predominately “brick-and-mortar” Hibbett has come down as a result. While sentiment may have taken a turn for the worse, Hibbett’s management team continues to execute well, and we remain positive on the stock.
OUTLOOK
Given the positive dynamics at work in many emerging countries, we believe our relatively high exposure to these markets has the potential to benefit the Fund in the months ahead. Additionally, we are starting to see signs that market leadership in the United States may be shifting from speculative and lower-quality, cyclical stocks to quality growth stocks. This also bodes well for the Fund.
Thank you for the opportunity to manage your assets.
| Current | and future holdings are subject to risk. |
14
| | |
| WASATCH GLOBAL OPPORTUNITIES FUND (WAGOX) — Portfolio Summary | | MARCH 31, 2014 (UNAUDITED) |
|
|
|
AVERAGE ANNUAL TOTAL RETURNS
| | | | | | | | | | | | | | | | | | | | |
| | | SIX MONTHS* | | 1 YEAR | | 5 YEARS | | SINCE INCEPTION 11/17/08 |
Global Opportunities | | | | 3.94% | | | | | 13.35% | | | 23.72% | | | | 24.10% | |
MSCI AC World Small Cap Index | | | | 9.91% | | | | | 20.74% | | | 23.77% | | | | 21.46% | |
Data shows past performance, which is not indicative of future performance. Current performance may be lower or higher than the performance quoted. To obtain the most recent month-end performance data available, please visit www.WasatchFunds.com. The Advisor may absorb certain Fund expenses, without which total return would have been lower. Investment returns and principal value will fluctuate and shares, when redeemed, may be worth more or less than their original cost.
As of the January 31, 2014 prospectus, the Total Annual Fund Operating Expenses for the Wasatch Global Opportunities Fund are 1.80%. The expense ratio shown elsewhere in this report may be different. See the prospectus for additional information regarding Fund expenses.
Wasatch Funds will deduct a 2.00% redemption proceeds fee on Fund shares held 60 days or less. Performance data does not reflect the deduction of fees, including sales charges, or the taxes you would pay on fund distributions or the redemption of fund shares. Fees and taxes, if reflected, would reduce the performance quoted. Wasatch does not charge any sales fees. For more complete information including charges, risks and expenses, read the prospectus carefully.
Investing in small and micro cap funds will be more volatile and loss of principal could be greater than investing in large cap or more diversified funds. Investing in foreign securities, especially in emerging markets, entails special risks, such as currency fluctuations and political uncertainties, which are described in more detail in the prospectus.
TOP 10 EQUITY HOLDINGS**
| | | | |
| Company | | % of Net
Assets | |
| Lupin Ltd. (India) | | | 2.9% | |
| MakeMyTrip Ltd. (India) | | | 2.4% | |
| Wirecard AG (Germany) | | | 2.4% | |
| IPCA Laboratories Ltd. (India) | | | 2.1% | |
| Promotora y Operadora de Infraestructura S.A.B. de C.V. (Mexico) | | | 1.9% | |
| | | | |
| Company | | % of Net
Assets | |
| Covance, Inc. | | | 1.9% | |
| International Container Terminal Services, Inc. (Philippines) | | | 1.8% | |
| SouFun Holdings Ltd. ADR (China) | | | 1.8% | |
| Coca-Cola Icecek A.S. (Turkey) | | | 1.8% | |
| Qualicorp S.A. (Brazil) | | | 1.7% | |
| ** | As of March 31, 2014, there were 82 holdings in the Fund. Foreign currency contracts, written options and repurchase agreements, if any, are not included in the number of holdings. Portfolio holdings are subject to change at any time. References to specific securities should not be construed as recommendations by the Funds or their Advisor. Current and future holdings are subject to risk. |
SECTOR BREAKDOWN†
| † | Excludes securities sold short and options written, if any. |
| †† | Also includes Other Assets & Liabilities. |
GROWTHOFA HYPOTHETICAL $10,000 INVESTMENT
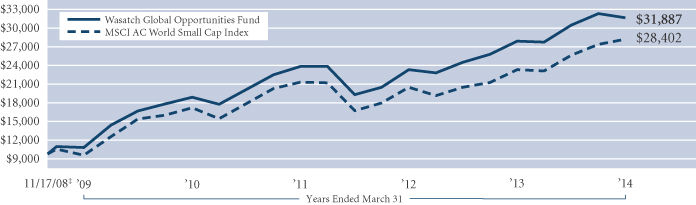
Past performance does not predict future performance. The graph above does not reflect the deduction of fees, sales charges, or taxes that you would pay on fund distributions or the redemption of fund shares. Wasatch does not charge any sales fees. ‡Inception: November 17, 2008. The MSCI AC (All Country) World Small Cap Index is an unmanaged index and includes reinvestment of all dividends of issuers located in countries throughout the world representing developed and emerging markets. This index is a free float-adjusted market capitalization index designed to measure the performance of small capitalization securities. You cannot invest directly in this or any index.
15
| | |
| WASATCH HERITAGE GROWTH FUND (WAHGX) — Management Discussion | | MARCH 31, 2014 (UNAUDITED) |
|
|
|
The Wasatch Heritage Growth Fund is managed by a team of Wasatch portfolio managers led by Chris Bowen.
| | |

Chris Bowen Lead Portfolio Manager | | OVERVIEW In comparison with the gains of recent quarters, the stock market tempered during the three months ended March 31, 2014 but still finished in positive territory. The Wasatch Heritage Growth Fund gained 1.25% and slightly underperformed its primary benchmark, the Russell Midcap Growth Index, which was up 2.04%. The U.S. markets essentially shrugged off the Federal Reserve’s continuing withdrawal of its asset purchase program |
under new Fed chair Janet Yellen, as well as strained international relations caused by Russia’s annexation of Crimea.
The Fund benefited from stellar stock performance from a number of holdings, including Spirit Airlines and a pair of energy-related companies, Ultra Petroleum and CARBO Ceramics. Unfortunately, a large portion of the positive result was offset by disappointing declines in LKQ and Nu Skin. We continue to hold these stocks. We believe that there was no fundamental reason for the pullback in the stock price of LKQ. Nu Skin was impacted by some negative developments in its rapidly growing Chinese business.
DETAILSOFTHE QUARTER
In our search for quality companies, we spend a great deal of time researching management teams because we believe it is a crucial element for investing success. We look for those with demonstrated success in an industry, a focus on prudent spending and long-term, sustainable plans for growing their businesses. This naturally aligns with our philosophy of investing for the long run. Of course, our assessment of quality goes beyond the management teams and ultimately hinges on the results the companies are able to produce. Relative to the benchmark, on average, the Fund’s holdings have better return on capital metrics, use less financial leverage, and have comparable growth metrics.
Spirit Airlines has many of the attributes we seek and has been an outstanding investment since we purchased the stock less than a year ago. Spirit was the largest contributor to the Fund’s performance for the quarter. The ultra-discount, no frills airline continues to grow by entering new markets as a low-cost alternative to the big carriers. It would be easy for an airline like Spirit to try to grow faster by spending more, but the management team appears to be sticking to its plan. We are keeping a close eye on Spirit’s valuation with the stock up over 130% since our initial purchase.
Ultra Petroleum, an oil and natural gas exploration and production company, was able to capitalize on a steep increase in natural gas prices. It has also made some property acquisitions, which we feel will benefit the company in the coming years.
CARBO Ceramics, a provider of proppants that are used in oil and gas “fracking,” has staged a strong rebound.
Competition — especially from cheaper, but lower quality imported proppants — seems to be easing. We believe that CARBO has a technologically superior product that will benefit as energy companies continue to look for ways to improve their returns from drilling.
The downward pressure on the stock price of LKQ seemed to have been caused primarily by short sellers. We have examined in depth the contentions of those betting against the company and we don’t think anything has fundamentally changed for LKQ’s prospects. We believe LKQ will continue to consolidate a very fragmented industry that supplies replacement non-OEM and salvage parts to auto and body shops. Management has been adept at adding complementary businesses, making LKQ a one-stop shop for everything that a repair shop needs. LKQ’s valuation also remains attractive to us.
Nu Skin undoubtedly took a step back this quarter. The company markets personal care products through a worldwide network of independent dealers that build their own businesses. A significant amount of our investment thesis revolved around Nu Skin’s growing business in China, which now accounts for over half of its revenue. However, Chinese regulators determined that a small portion of the company’s sales were out of compliance with Chinese regulations and Nu Skin was assessed a modest fine. However, the stock dropped over 38% in the quarter. Nu Skin’s management has proactively decided to slow down growth in China while it addresses reputational concerns and rebuilds its brand. Although we trimmed Nu Skin’s weight in the Fund, following the pullback we feel that the valuation is very attractive and that the Chinese market will continue to grow.
OUTLOOK
Valuations in the Fund are currently at the high end of the historical band, but we don’t believe that they are out of bounds. Our desire is to hold companies that we expect will perform consistently over time and should be able to weather company-specific or macro level shocks.
Margin improvement is an important way for a company to deliver strong earnings growth. Our analysis indicates that a number of our largest holdings are well-positioned to see widening margins over the next 12 to 18 months. We anticipate that the subsequent growth in earnings will provide the Fund with further appreciation potential and may help guard against general market retreats.
Volatility has largely been absent from the market for some time, however, it appears to be picking up. We expect that the Fund will hold up well in a fluctuating market and that our disciplined, deep due diligence approach will enable us to take advantage when stock prices appear to be misaligned with potential value.
Thank you for the opportunity to invest your assets.
| | Current and future holdings are subject to risk. |
16
| | |
| WASATCH HERITAGE GROWTH FUND (WAHGX) — Portfolio Summary | | MARCH 31, 2014 (UNAUDITED) |
|
|
|
AVERAGE ANNUAL TOTAL RETURNS
| | | | | | | | | | | | | | | | |
| | | SIX MONTHS* | | | 1 YEAR | | | 5 YEARS | | | SINCE INCEPTION 6/18/04 | |
Heritage Growth | | | 11.60% | | | | 23.35% | | | | 21.28% | | | | 7.80% | |
Russell Midcap® Growth Index | | | 10.44% | | | | 24.22% | | | | 24.73% | | | | 9.80% | |
S&P 500 Index | | | 12.51% | | | | 21.86% | | | | 21.16% | | | | 7.49% | |
Data shows past performance, which is not indicative of future performance. Current performance may be lower or higher than the performance quoted. To obtain the most recent month-end performance data available, please visit www.WasatchFunds.com. The Advisor may absorb certain Fund expenses, without which total return would have been lower. Investment returns and principal value will fluctuate and shares, when redeemed, may be worth more or less than their original cost.
As of the January 31, 2014 prospectus, the Total Annual Fund Operating Expenses for the Wasatch Heritage Growth Fund are 0.99%. The Net Expenses are 0.95%. The expense ratio shown elsewhere in this report may be different. Net Expenses are based on Fund expenses, net of waivers and reimbursements. See the prospectus for additional information regarding Fund expenses.
Wasatch Funds will deduct a 2.00% redemption proceeds fee on Fund shares held 60 days or less. Performance data does not reflect the deduction of fees, including sales charges, or the taxes you would pay on fund distributions or the redemption of fund shares. Fees and taxes, if reflected, would reduce the performance quoted. Wasatch does not charge any sales fees. For more complete information including charges, risks and expenses, read the prospectus carefully.
Investing in small and mid cap funds will be more volatile and loss of principal could be greater than investing in large cap funds. Investing in foreign securities, especially in emerging markets, entails special risks, such as currency fluctuations and political uncertainties, which are described in more detail in the prospectus.
TOP TEN EQUITY HOLDINGS**
| | | | |
| Company | | % of Net
Assets | |
| Cognizant Technology Solutions Corp., Class A | | | 4.8% | |
| Copart, Inc. | | | 4.5% | |
| Amphenol Corp., Class A | | | 4.2% | |
| Microchip Technology, Inc. | | | 4.2% | |
| Covance, Inc. | | | 4.1% | |
| | | | |
| Company | | % of Net
Assets | |
| IHS, Inc., Class A | | | 4.0% | |
| Spirit Airlines, Inc. | | | 3.7% | |
| MSC Industrial Direct Co., Inc., Class A | | | 3.5% | |
| SEI Investments Co. | | | 2.9% | |
| LKQ Corp. | | | 2.9% | |
| ** | As of March 31, 2014, there were 46 holdings in the Fund. Foreign currency contracts, written options and repurchase agreements, if any, are not included in the number of holdings. Portfolio holdings are subject to change at any time. References to specific securities should not be construed as recommendations by the Funds or their Advisor. Current and future holdings are subject to risk. |
SECTOR BREAKDOWN†
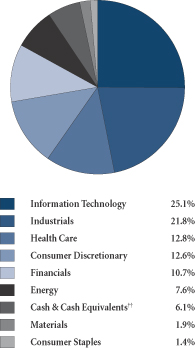
| † | Excludes securities sold short and options written, if any. |
| †† | Also includes Other Assets & Liabilities. |
GROWTHOFA HYPOTHETICAL $10,000 INVESTMENT
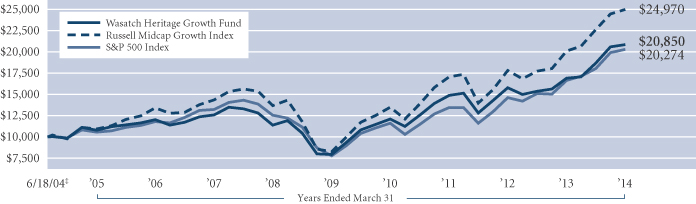
Past performance does not predict future performance. The graph above does not reflect the deduction of fees, sales charges, or taxes that you would pay on fund distributions or the redemption of fund shares. Wasatch does not charge any sales fees. ‡Inception: June 18, 2004. The Russell Midcap Growth Index measures the performance of those Russell Midcap Index companies with higher price-to-book ratios and higher forecasted growth values. The stocks in the Russell Midcap Growth Index are also members of the Russell 1000 Growth Index. The S&P 500 Index represents 500 of the United States’ largest stocks from a broad variety of industries. The index is unmanaged and is a common measure of common stock total return performance. You cannot invest directly in these or any indices.
17
| | |
| WASATCH INTERNATIONAL GROWTH FUND (WAIGX) — Management Discussion | | MARCH 31, 2014 (UNAUDITED) |
|
|
|
The Wasatch International Growth Fund is managed by a team of Wasatch portfolio managers led by Roger Edgley and Linda Lasater.
| | | | |
Roger Edgley, CFA Lead Portfolio Manager | | 
Linda Lasater, CFA Associate Portfolio Manager | | OVERVIEW During the quarter ended March 31, 2014, we saw European stocks do well driven by better sentiment toward Europe, the recovery of peripheral countries like Spain, and property markets like the |
one in the United Kingdom (U.K.) coming back, following a similar recovery to that of the U.S. The Japanese market had a very strong year in 2013 and we are not surprised there was a bit of a pull back at this point. Emerging markets have had a very rough period contending with just about every type of crisis, the main market anxiety being concern over China’s decelerating growth and deleveraging. The news and sentiment on emerging markets has clearly been poor across the board with issues ranging from slowing growth in Brazil to geopolitical turmoil in Ukraine. The Wasatch International Growth Fund returned -1.72% in the quarter, while the MSCI All Country (AC) World Ex-U.S.A. Small Cap Index returned 3.47%.
DETAILSOFTHE QUARTER
While the Japanese market cooled off following strong performance in 2013, the Japanese companies held in the Fund outperformed those in the Index and made a positive contribution to performance. Some members of the international team were in Japan visiting a list of current holdings and prospective investments — in all we met with some 30 companies over a two-week period. We think the opportunity set has increased enough to have a weight in Japan that is closer to the Index weight. We have seen some emerging growth companies in Japan that are world class, companies that are comparable to the best companies we see in Asia or Europe. Although Japan is rightly seen as a cheap market (based on price-to-book and price-to-earnings), our names tend to be more expensive than average but with significantly higher returns on capital and strong cash generation.
It is interesting that a number of what we consider to be our best companies in Japan are Internet-related or are operating internationally — it is in these areas that we are seeing the Japanese “next generation” management teams in action. These are companies with strong accumulated know-how and technology, managed generally by founders or the second generation of a family. These managers look outside Japan to learn best practices and they are well aware of the leading companies in their fields — whether Japanese or not. For example, Sawai Pharmaceutical is led by the son of the founder. Sawai is the leading Japanese generic drug
company. We believe it is well-positioned, as the government is keen to control drug costs. Internet-focused firms Start Today and Kakaku.com are both founder-led companies. In talking to the CEO of Sugi Holdings, which operates drug stores in Japan, we learned that he knows well the history of Walgreens* in the U.S. He believes that Sugi, like Walgreens, will be a consolidator in the market, fueling long-term growth.
The U.K. and Russia were the biggest detractors from the Fund’s performance in the quarter. The Fund’s holdings in the U.K. underperformed those in the Index. Oxford Instruments and Abcam were prominent detractors as recent public funding cuts for research have hurt revenues. Oxford Instruments is the leader in tools and technologies that facilitate nanotechnology scientific research. While Oxford Instruments has been increasing its exposure to commercial end markets, research still drives over 40% of the company’s revenues. As the market leader in the space, we believe Oxford Instruments will be a primary beneficiary of the long-term trend toward nanotechnology. Abcam, a web-based retailer of research antibodies, will be investing heavily to increase its portfolio of products and expand geographically. This will result in lower growth rates than the company has achieved historically. Given the recent sell-off in Abcam’s stock, its leading competitive position, and strong business model, we believe the market is presenting us with a buying opportunity.
Eurasia Drilling, a provider of drilling services to the oil and gas industry, is the Fund’s only Russia-related holding and was the largest detractor from performance for the quarter. When the Russian economy slowed to near-zero growth in 2013, we began to see diminishing pricing power as the company struggled to offset cost inflation — a typical sign of an economy beginning to face challenges. Eurasia Drilling also lost its second largest customer, but management was able to redeploy all of those assets with minimal impact to earnings. We have adjusted our position accordingly, reducing our weight as we see an increasingly difficult road ahead. We are still optimistic about the company’s long-term prospects and continue to hold the stock. Supporting our confidence is the company’s decision to buy back up to $200 million of stock.
OUTLOOK
Our outlook remains constructive for the year given signs of bottoming in emerging markets and the ongoing recovery evident in Europe. We are excited about the long-term future of the diverse set of what we consider to be quality companies that we own in the Fund.
We thank you for your support as always.
| * | As of March 31, 2014, the Wasatch International Growth Fund was not invested in Walgreen Co. |
| Current | and future holdings are subject to risk. |
18
| | |
| WASATCH INTERNATIONAL GROWTH FUND (WAIGX) — Portfolio Summary | | MARCH 31, 2014 (UNAUDITED) |
|
|
|
AVERAGE ANNUAL TOTAL RETURNS
| | | | | | | | | | | | | | | | |
| | | SIX MONTHS* | | | 1 YEAR | | | 5 YEARS | | | 10 YEARS | |
International Growth | | | 1.74% | | | | 12.71% | | | | 28.72% | | | | 10.73% | |
MSCI AC World Ex-U.S.A. Small Cap Index | | | 8.26% | | | | 16.28% | | | | 21.18% | | |
| 9.31%
|
|
MSCI World Ex-U.S.A. Small Cap Index | | | 9.16% | | | | 21.12% | | | | 21.51% | | | | 8.41% | |
Data shows past performance, which is not indicative of future performance. Current performance may be lower or higher than the performance quoted. To obtain the most recent month-end performance data available, please visit www.WasatchFunds.com. The Advisor may absorb certain Fund expenses, without which total return would have been lower. Investment returns and principal value will fluctuate and shares, when redeemed, may be worth more or less than their original cost.
As of the January 31, 2014 prospectus, the Total Annual Fund Operating Expenses for the Wasatch International Growth Fund are 1.49%. The expense ratio shown elsewhere in this report may be different. See the prospectus for additional information regarding Fund expenses.
Wasatch Funds will deduct a 2.00% redemption proceeds fee on Fund shares held 60 days or less. Performance data does not reflect the deduction of fees, including sales charges, or the taxes you would pay on fund distributions or the redemption of fund shares. Fees and taxes, if reflected, would reduce the performance quoted. Wasatch does not charge any sales fees. For more complete information including charges, risks and expenses, read the prospectus carefully.
Investing in foreign securities, especially in frontier and emerging markets, entails special risks, such as currency fluctuations and political uncertainties, which are described in more detail in the prospectus. Investing in small cap funds will be more volatile and loss of principal could be greater than investing in large cap or more diversified funds.
TOP 10 EQUITY HOLDINGS**
| | | | |
| Company | | % of Net
Assets | |
| Wirecard AG (Germany) | | | 2.6% | |
| Rightmove plc (United Kingdom) | | | 2.5% | |
| Start Today Co. Ltd. (Japan) | | | 2.4% | |
| Pigeon Corp. (Japan) | | | 2.4% | |
| CTS Eventim AG (Germany) | | | 2.3% | |
| | | | |
| Company | | % of Net
Assets | |
| Domino’s Pizza Enterprises Ltd. (Australia) | | | 2.2% | |
| Calbee, Inc. (Japan) | | | 2.2% | |
| Rotork plc (United Kingdom) | | | 2.1% | |
| Vitasoy International Holdings Ltd. (Hong Kong) | | | 2.1% | |
| M3, Inc. (Japan) | | | 2.1% | |
| ** | As of March 31, 2014, there were 79 holdings in the Fund. Foreign currency contracts, written options and repurchase agreements, if any, are not included in the number of holdings. Portfolio holdings are subject to change at any time. References to specific securities should not be construed as recommendations by the Funds or their Advisor. Current and future holdings are subject to risk. |
SECTOR BREAKDOWN†
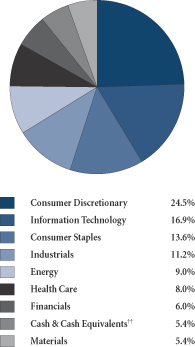
| † | Excludes securities sold short and options written, if any. |
| †† | Also includes Other Assets & Liabilities. |
GROWTHOFA HYPOTHETICAL $10,000 INVESTMENT
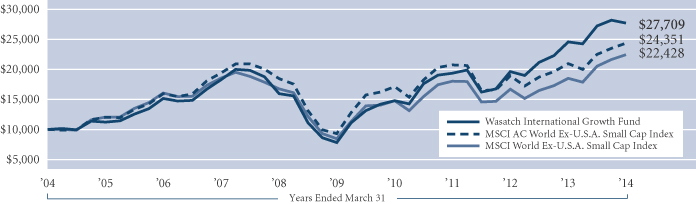
Past performance does not predict future performance. The graph above does not reflect the deduction of fees, sales charges, or taxes that you would pay on fund distributions or the redemption of fund shares. Wasatch does not charge any sales fees. The MSCI AC (All Country) World Ex-U.S.A. Small Cap Index is an unmanaged index and includes reinvestment of all dividends of issuers located in countries throughout the world representing developed and emerging markets, excluding securities of U.S. issuers. This index is a free float-adjusted market capitalization index designed to measure the performance of small capitalization securities. The MSCI World Ex-U.S.A. Small Cap Index is a free float-adjusted market capitalization weighted index designed to measure the equity market performance of developed markets, excluding the United States. You cannot invest directly in these or any indices.
19
| | |
| WASATCH INTERNATIONAL OPPORTUNITIES FUND (WAIOX) — Management Discussion | | MARCH 31, 2014 (UNAUDITED) |
|
|
|
The Wasatch International Opportunities Fund is managed by a team of Wasatch portfolio managers led by Roger Edgley, Laura Geritz and Jared Whatcott.
| | | | |
Roger Edgley, CFA Lead Portfolio Manager | |
Laura Geritz, CFA Portfolio Manager | | 
Jared Whatcott, CFA Associate Portfolio Manager |
OVERVIEW
The Wasatch International Opportunities Fund gained 2.77% in the quarter ended March 31, 2014, underperforming its benchmark, the MSCI All Country (AC) World Ex-U.S.A. Small Cap Index, which gained 3.47%.
Global markets stumbled in the latter half of January as concerns over Chinese economic growth added to worries about the impact of tapering of U.S. quantitative easing on vulnerable emerging economies. By March, emerging markets had bounced back, partly due to the easing geopolitical situation with Russia, improving economic data from Europe, and some cautious optimism with regard to China and Japan.
As those familiar with our style of investing know, this Fund has gravitated toward higher exposure to emerging markets given the appeal of companies that benefit from potent trends in demographics, potential productivity gains, and growth headroom. In the recent past, this heavier exposure to emerging markets has made it more difficult to outperform the developed-heavy benchmark. Fortunately, these trends reversed in March due to the rebound in emerging markets, and for the quarter, the performance of emerging and developed economy stocks was roughly equal.
The strong correlation between performance and market cap that we’ve seen over the last few quarters continued unabated into 2014’s first quarter, again creating a powerful headwind for a fund oriented toward micro-cap names. In fact, the benchmark’s largest decile stocks outperformed the smallest decile by over 12 percentage points in the three-month period ended March 31.
DETAILSOFTHE QUARTER
Our heavy consumer exposure (the consumer staples and consumer discretionary sectors), which is over 50% of the Fund, ended up being a bit of a drag on performance this quarter, as these sectors underperformed the Index as a whole. The strong performance of a few developed-market consumer stocks like Australia’s Domino’s Pizza Enterprises (+29%), Danish brewery Royal UNIBREW (+22%) and Nordic chocolate manufacturer Cloetta (+20%) failed to make up for the generally lackluster performance of consumer companies across the rest of the globe.
Industrials was essentially the only sector offering outperformance during the quarter, returning just over 15% relative to about 3% for the industrials component of the Index. Companies like Sarine Technologies (+34%), Eicher Motors (+24%), and Amara Raja Batteries (+21%), all of which we visited in India during the quarter, had very few underperforming peers pulling down the sector.
Two of the biggest contributors to performance from a country perspective were Japan, where our 1% portfolio return was enough to dominate the -2.3% return of the Index, and India, which had an 11% portfolio return that was in-line with the Indian portion of the Index.
Finally, it is worth discussing our exposure to Russia and Eastern Europe, given the recent geopolitical developments with Ukraine. Our lone investment in Russia, MD Medical Group Investments (-24%) was a small position, and therefore wasn’t a big detractor from performance. And while following our disciplined bottom-up process fortunately had limited our exposure to Russia to only 0.35% of the portfolio, we saw two of our Finnish companies, a total weight in the Fund of about 3%, suffer more than 10% declines. Tikkurila, a paint manufacturer, and Olvi, a beverage producer, both have significant revenue exposure to former Soviet republics. We believe both of these companies are well positioned with even better valuations now. Apranga, a clothing retailer in Lithuania, on the other hand, was actually up over 3% during the quarter.
OUTLOOK
As our own Dr. Sam Stewart points out in his most recent Message to Shareholders with regard to the current U.S. economic environment, “We’ve never been down this road before…” This is true internationally as well. There are a lot of question marks regarding the robustness of a global economic recovery, valuations remain stretched in some markets (including the U.S.), and the specter of geopolitical risk still looms.
While this might result in added volatility in the global equity markets, our goal is to structure the Fund to take advantage of the great long-term growth prospects we see for our companies. Because our process is focused on owning high-quality, undiscovered companies with long time horizons, we are occasionally exposed to market movements (such as strong performance of developed markets, large-cap stocks, or lower quality names) that make it more difficult to outperform the benchmark in the short-term. While waiting for such headwinds to abate, we rely on disciplined stock-picking to keep the Fund well-positioned.
The attractive structural drivers for the stocks of emerging market and micro-cap companies coupled with the relative attractiveness of stock valuations (which are generally more favorable for lower market capitalization and emerging market stocks), make us content with the Fund’s exposure to emerging market companies that we believe are high-quality, and we feel confident in the positioning of our micro-cap mandate.
Thank you for the opportunity to invest your assets.
| | Current and future holdings are subject to risk. |
20
| | |
| WASATCH INTERNATIONAL OPPORTUNITIES FUND (WAIOX) — Portfolio Summary | | MARCH 31, 2014 (UNAUDITED) |
|
|
|
AVERAGE ANNUAL TOTAL RETURNS
| | | | | | | | | | | | | | | | |
| | | SIX MONTHS* | | | 1 YEAR | | | 5 YEARS | | | SINCE INCEPTION
1/27/05 | |
International Opportunities | | | 7.20% | | | | 10.20% | | | | 26.43% | | | | 10.33% | |
MSCI AC World Ex-U.S.A. Small Cap Index | | | 8.26% | | | | 16.28% | | | | 21.18% | | | | 8.31% | |
MSCI World Ex-U.S.A. Small Cap Index | | | 9.16% | | | | 21.12% | | | | 21.51% | | | | 7.33% | |
Data shows past performance, which is not indicative of future performance. Current performance may be lower or higher than the performance quoted. To obtain the most recent month-end performance data available, please visit www.WasatchFunds.com. The Advisor may absorb certain Fund expenses, without which total return would have been lower. Investment returns and principal value will fluctuate and shares, when redeemed, may be worth more or less than their original cost.
As of the January 31, 2014 prospectus, the Total Annual Fund Operating Expenses for the Wasatch International Opportunities Fund are 2.42%. The Net Expenses are 2.25%. The expense ratio shown elsewhere in this report may be different. Net Expenses are based on Fund expenses, net of waivers and reimbursements. See the prospectus for additional information regarding Fund expenses.
Wasatch Funds will deduct a 2.00% redemption proceeds fee on Fund shares held 60 days or less. Performance data does not reflect the deduction of fees, including sales charges, or the taxes you would pay on fund distributions or the redemption of fund shares. Fees and taxes, if reflected, would reduce the performance quoted. Wasatch does not charge any sales fees. For more complete information including charges, risks and expenses, read the prospectus carefully.
Investing in foreign securities, especially in frontier and emerging markets, entails special risks, such as currency fluctuations and political uncertainties, which are described in more detail in the prospectus. Investing in small cap funds will be more volatile and loss of principal could be greater than investing in large cap or more diversified funds.
TOP 10 EQUITY HOLDINGS**
| | | | |
| Company | | % of Net
Assets | |
| Royal UNIBREW A/S (Denmark) | | | 2.7% | |
| Wawel S.A. (Poland) | | | 2.7% | |
| Pepsi-Cola Products Philippines, Inc. (Philippines) | | | 2.2% | |
| Domino’s Pizza Enterprises Ltd. (Australia) | | | 2.1% | |
| Olvi Oyj, Class A (Finland) | | | 2.0% | |
| | | | |
| Company | | % of Net
Assets | |
| Famous Brands Ltd. (South Africa) | | | 2.0% | |
| Nihon M&A Center, Inc. (Japan) | | | 2.0% | |
| RFM Corp. (Philippines) | | | 2.0% | |
| Poya Co. Ltd. (Taiwan) | | | 1.9% | |
| Rami Levi Chain Stores Hashikma Marketing 2006 Ltd. (Israel) | | | 1.9% | |
| ** | As of March 31, 2014, there were 111 holdings in the Fund. Foreign currency contracts, written options and repurchase agreements, if any, are not included in the number of holdings. Portfolio holdings are subject to change at any time. References to specific securities should not be construed as recommendations by the Funds or their Advisor. Current and future holdings are subject to risk. |
SECTOR BREAKDOWN†
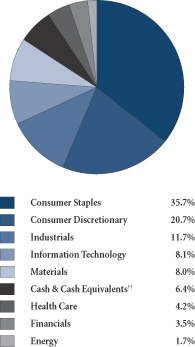
| † | Excludes securities sold short and options written, if any. |
| †† | Also includes Other Assets & Liabilities. |
GROWTHOFA HYPOTHETICAL $10,000 INVESTMENT
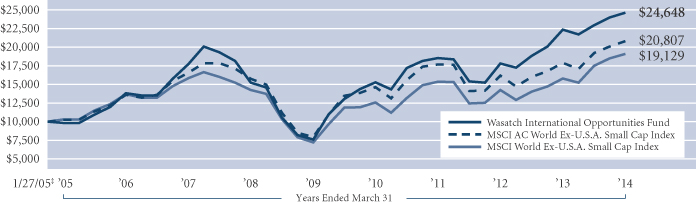
Past performance does not predict future performance. The graph above does not reflect the deduction of fees, sales charges, or taxes that you would pay on fund distributions or the redemption of fund shares. Wasatch does not charge any sales fees. ‡Inception: January 27, 2005. The MSCI AC (All Country) World Ex-U.S.A. Small Cap Index is an unmanaged index and includes reinvestment of all dividends of issuers located in countries throughout the world representing developed and emerging markets, excluding securities of U.S. issuers. This index is a free float-adjusted market capitalization index designed to measure the performance of small capitalization securities. The MSCI World Ex-U.S.A. Small Cap Index is a free float-adjusted market capitalization weighted index designed to measure the equity market performance of developed markets, excluding the United States. You cannot invest directly in these or any indices.
21
| | |
| WASATCH LARGE CAP VALUE FUND (FMIEX / WILCX) — Management Discussion | | MARCH 31, 2014 (UNAUDITED) |
|
|
|
The Wasatch Large Cap Value Fund is managed by a team of Wasatch portfolio managers led by David Powers.
| | |

David Powers, CFA Lead Portfolio Manager | | OVERVIEW The Wasatch Large Cap Value Fund — Investor Class gained 1.29% for the quarter ended March 31, 2014 and underperformed the Russell 1000 Value Index, which returned 3.02%. While stocks generally finished the quarter higher, the ride was anything but smooth. The flow of U.S. economic data in key areas such as retail sales and housing was disappointing for much of the period, although some of the |
weakness was attributed to extreme weather conditions. In late January and early February, stocks slid on weak U.S. data and concerns over the ability of emerging-market economies to withstand higher U.S. interest rates on top of softer demand from China.
For most of February, however, stocks climbed back toward their recent highs. The rebound occurred as some key indicators stabilized and investors seemed to feel more comfortable that the inevitable removal of U.S. Federal Reserve policy support would be done gradually and with regard for incoming data. Entering March, geopolitics moved to the forefront as tensions between Russia and Ukraine rose sharply, culminating in Russia’s annexation of Crimea. Stocks were volatile during March, as investors kept a wary eye on the Ukraine crisis while waiting to see if spring would indeed bring an improvement in U.S. economic releases.
For much of the quarter, investors favored momentum- and growth-oriented stocks, providing something of a headwind to our value strategy. The Fund’s performance relative to the Index was boosted by strong stock selection within the consumer-discretionary sector, while selection within financials and energy lagged.
DETAILSOFTHE QUARTER
On the positive side, stock performance of technology giant Microsoft was supported by a string of positive developments. A new CEO helped to engender optimism that Microsoft will build upon its leading enterprise- and cloud-based businesses to further its penetration in the mobile-device segment. In this vein, it was announced in late March that Microsoft’s Office Suite would be available for Apple’s iPad, the leading tablet.
Avionics-systems provider L-3 Communications continued to outperform as earnings have continued to exceed expectations and strong free cash flow has supported ongoing share buybacks and dividend growth. Revenue concerns with respect to the company’s core defense business have eased, while at the same time exposure to non-defense opportunities has increased.
During the quarter, retailer Macy’s rebounded from concerns related to bad weather and e-commerce competition that have impacted the overall consumer-discretionary sector. Macy’s reported better-than-expected earnings and communicated a pick-up in February activity. We believe the
company is well-managed, consistently beats expectations, and is trading at an attractive valuation based on market skepticism with respect to consumer spending power.
On the downside, it now appears that the recovery of regional bank First Niagara Financial will take longer to play out than we had anticipated. The bank’s shares had already been heavily discounted due to very expensive and dilutive acquisitions made in 2011. More recently, a new CEO has outlined strategic initiatives to invest in the company’s technology infrastructure. These initiatives are anticipated to negatively impact earnings and growth over the next several quarters. We are maintaining our position, as we believe that the stock is now trading well below the company’s intrinsic value and that most news going forward is likely to be at least in line with, if not better than, expectations.
Consumer-staples giant ConAgra Foods underperformed. The company’s integration of Ralcorp’s private-label brands is taking longer than expected. ConAgra’s consumer-foods division is producing lower sales than expected. And the company’s commercial-food segment has been hit with higher costs and weaker sales. The stock has been trading at a long-standing discount to many competitors, and we are evaluating whether this reflects a secular change in consumer attitudes toward processed foods. In the meantime, the attractive dividend yield gives us some cause for optimism.
Diversified energy giant Chevron has struggled due to disappointments related to production and refining, as well as stagnation in its chemical business. More broadly throughout the company, Chevron is in a growth phase and the capital intensity of its large development projects has meant higher spending commitments. Our assessment is that the company’s balance sheet is strong and is built for this development stage. We like the profitability improvement that is anticipated in the next year or two and believe it is not reflected in the stock price. However, project delays and higher costs have led us to consider trimming our exposure.
OUTLOOK
We expect to see the current trends of moderate growth and low inflation persist as 2014 progresses. In this environment, further stock-price gains are more likely to be based on price-to-earnings multiple expansion, rather than on earnings growth.
Our macro view is that the economy and market will improve from here. But the bigger driver of our decision-making process is our company-by-company research. We currently see better value in the cyclical sectors where opportunities have been created due to concerns over emerging markets and severe U.S. weather. As a result, the Fund is positioned somewhat more aggressively than in recent quarters.
While the recent growth- and momentum-oriented tenor of the market may act as a short-term constraint with respect to the relative performance of valuation-based strategies such as ours, we will continue to apply our rigorous approach to stock selection for the Fund.
Thank you for your continued confidence and investment in the Fund.
| Current | and future holdings are subject to risk |
22
| | |
| WASATCH LARGE CAP VALUE FUND (FMIEX / WILCX) — Portfolio Summary | | MARCH 31, 2014 (UNAUDITED) |
|
|
|
AVERAGE ANNUAL TOTAL RETURNS
| | | | | | | | | | | | | | | | |
| | | SIX MONTHS* | | | 1 YEAR | | | 5 YEARS | | | 10 YEARS | |
Large Cap Value (FMIEX) — Investor | | | 8.39% | | | | 14.81% | | | | 15.83% | | | | 8.23% | |
Large Cap Value (WILCX) — Institutional | | | 8.39% | | | | 14.96% | | | | 15.88% | | | | 8.25% | |
Russell 1000® Value Index | | | 13.33% | | | | 21.57% | | | | 21.75% | | | | 7.58% | |
Data shows past performance, which is not indicative of future performance. Current performance may be lower or higher than the performance quoted. To obtain the most recent month-end performance data available, please visit www.WasatchFunds.com. The Advisor may absorb certain Fund expenses, without which total return would have been lower. Investment returns and principal value will fluctuate and shares, when redeemed, may be worth more or less than their original cost.
As of the January 31, 2014 prospectus, the Total Annual Fund Operating Expenses for the Wasatch Large Cap Value Fund are Investor Class — Gross: 1.16%, Net: 1.10% / Institutional Class — Gross: 1.35%, Net: 0.98%. The expense ratio shown elsewhere in this report may be different. Net Expenses are based on Fund expenses, net of waivers and reimbursements. See the prospectus for additional information regarding Fund expenses.
Wasatch Funds will deduct a 2.00% redemption proceeds fee on Fund shares held 60 days or less. Performance data does not reflect the deduction of fees, including sales charges, or the taxes you would pay on fund distributions or the redemption of fund shares. Fees and taxes, if reflected, would reduce the performance quoted. Wasatch does not charge any sales fees. For more complete information including charges, risks and expenses, read the prospectus carefully.
Performance for the Institutional Class prior to 1/31/2012 is based on the performance of the Investor Class. Performance of the Fund’s Institutional Class prior to 1/31/2012 uses the actual expenses of the Fund’s Investor Class without any adjustments. For any such period of time, the performance of the Fund’s Institutional Class would have been substantially similar to, yet higher than, the performance of the Fund’s Investor Class, because the shares of both classes are invested in the same portfolio of securities, but the classes bear different expenses.
Investments in value stocks can perform differently from the market as a whole and from other types of stocks and can continue to be undervalued by the market for long periods of time. Loss of principal is a risk of investing.
TOP 10 EQUITY HOLDINGS**
| | | | |
| Company | | % of Net
Assets | |
JPMorgan Chase & Co. | | | 4.1% | |
Johnson & Johnson | | | 4.0% | |
Wells Fargo & Co. | | | 3.9% | |
Suncor Energy, Inc. (Canada) | | | 3.7% | |
Apple, Inc. | | | 3.7% | |
| | | | |
| Company | | % of Net
Assets | |
Pfizer, Inc | | | 3.6% | |
Citigroup, Inc. | | | 3.5% | |
Microsoft Corp. | | | 3.3% | |
General Electric Co. | | | 3.2% | |
PNC Financial Services Group, Inc. | | | 3.1% | |
| ** | As of March 31, 2014, there were 36 holdings in the Fund. Foreign currency contracts, written options and repurchase agreements, if any, are not included in the number of holdings. Portfolio holdings are subject to change at any time. References to specific securities should not be construed as recommendations by the Funds or their Advisor. Current and future holdings are subject to risk. |
SECTOR BREAKDOWN†
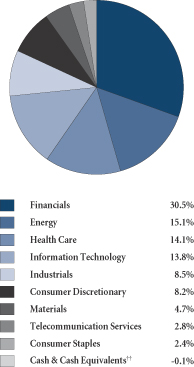
| † | Excludes securities sold short and options written, if any. |
| †† | Also includes Other Assets & Liabilities. |
GROWTHOFA HYPOTHETICAL $10,000 INVESTMENT

Past performance does not predict future performance. The graph above does not reflect the deduction of fees, sales charges, or taxes that you would pay on fund distributions or the redemption of fund shares. Wasatch does not charge any sales fees. The Russell 1000 Value Index measures the performance of Russell 1000 Index companies with lower price-to-book ratios and lower forecasted growth values. You cannot invest directly in these or any indices.
23
| | |
| WASATCH LONG/SHORT FUND (FMLSX/WILSX) — Management Discussion | | MARCH 31, 2014 (UNAUDITED) |
|
|
|
The Wasatch Long/Short Fund is managed by a team of Wasatch portfolio managers led by Michael Shinnick and Ralph Shive.
| | | | |

Michael Shinnick Lead Portfolio Manager | | 
Ralph Shive, CFA Portfolio Manager | | OVERVIEW Stocks finished the quarter ended March 31, 2014 modestly higher, but not without overcoming some challenges. Equities dipped in late January and early February due to weak U.S. data |
in key areas such as retail sales and housing, and concerns over the ability of emerging market economies to withstand higher U.S. interest rates and slower growth in China. Extreme winter weather in many parts of the U.S. also suppressed economic activity and clouded investor sentiment. Markets moved higher for most of February as some economic data improved and the Fed, under new leadership, indicated that it would continue an incremental approach to removing its monetary accommodation. March saw stocks largely trade within a band, while market leadership rotated out of growth and momentum stocks and into more contrarian, value-type names.
The Wasatch Long/Short Fund produced a gain for the quarter and trailed the S&P 500 Index. Weakness in relative performance was primarily on the long side of the portfolio, in particular, lower exposure to health care and utilities and stock selection within financials. Our selection on the short side of the portfolio detracted slightly, although we were pleased that our short positions rose less than half as much as the overall S&P 500 return for the quarter.
DETAILSOFTHE QUARTER
Our long-term theme within the energy sector to seek exposure to services companies positioned to benefit from increased land drilling worked well during the quarter. The U.S focused pursuit of oil has resulted in increased land activity, including 24 hour well pad operations, which is driving revenue and margin growth for land services providers, including Halliburton, Patterson-UTI Energy and Unit. We trimmed exposure to Patterson as we view valuation as close to full, and rotated assets into Diamond Offshore Drilling. Diamond’s stock recently experienced a dramatic sell off that we believe failed to account for the company’s revenue backlog, dividend coverage and the replacement value of its equipment fleet.
We continue to believe the real estate investment trust (REIT) industry offers compelling risk/return characteristics given underperformance in the second half of 2013 due to fears of higher interest rates. The recently established position in American Campus Communities, a provider of student housing for college campuses, outperformed as management reported strong pre-leasing trends for the
upcoming school year and allayed concerns over operational readiness in the wake of recent acquisitions.
Our focus on mega-cap technology companies aided the Fund’s performance. While companies such as Microsoft, Oracle and QUALCOMM are experiencing growth rates mostly in the single digits, we believe their strong cash flows with associated attractive dividends and ongoing share buybacks support the potential for significant shareholder total returns. Our position in Apple declined. However, premiums from our covered call writing on the stock more than compensated for the performance of the long position.
On the downside, General Motors suffered in the wake of a large product recall and was the largest detractor from performance. We evaluated the situation, and while it is incredibly difficult for the company, it is something that GM is addressing and we have chosen to increase our ownership given the valuation level. In the quarter, GM resumed paying a dividend and showed a return to stronger sales in March after weather-related difficulties in January and February. GM has made substantial progress in the last three years, returning to profitability and growth, improving its ratings status as a borrower, and shedding the U.S. government ownership stake.
On the short side, we closed with a gain, a large, longstanding position in energy giant Exxon Mobil. Electric utility Exelon was a large detractor on the short side. Exelon, which has been challenged by the relative advantages of natural gas-generated power versus its higher cost nuclear power base, saw its share price rise as natural gas prices rose. Another detractor on the short side was electric vehicle manufacturer Tesla Motors. We closed our short position in Tesla with a loss early in the quarter. New short positions included social media giant Facebook, specialty coffee company Keurig Green Mountain and WageWorks, an employee benefits service provider.
OUTLOOK
We prefer to purchase stocks when they are out of favor and trading at a substantial valuation discount. In this vein, we took advantage of selling pressure in contrarian value stocks to initiate positions in companies such as Diamond Offshore Drilling, convenience retailer CST Brands and gambling machine manufacturer International Game Technology. In the short book, we began to see our focus in momentum-type stocks work well, particularly the Software-as-a-Service (SaaS) and social media groups where we believe there is considerable room for compression of valuation multiples. The Fund remains roughly 80% long, while we increased position sizes in more defensive stocks such as low-cost retailers Wal-Mart and Target.
As always, our goal is to identify stocks with the potential to be steady gainers as we strive to compound capital at a moderate pace over time. We thank you for your continued investment and for your confidence as we seek to provide meaningful exposure to the market’s upside and mitigate the impact of market declines.
| Current | and future holdings are subject to risk. |
24
| | |
| WASATCH LONG/SHORT FUND (FMLSX/WILSX) — Portfolio Summary | | MARCH 31, 2014 (UNAUDITED) |
|
|
|
AVERAGE ANNUAL TOTAL RETURNS
| | | | | | | | | | | | | | | | |
| | | SIX MONTHS* | | | 1 YEAR | | | 5 YEARS | | | 10 YEARS | |
Long/Short (FMLSX) — Investor | | | 5.40% | | | | 9.63% | | | | 13.84% | | | | 6.92% | |
Long/Short (WILSX) — Institutional | | | 5.40% | | | | 9.69% | | | | 13.85% | | | | 6.93% | |
S&P 500 Index | | | 12.51% | | | | 21.86% | | | | 21.16% | | | | 7.42% | |
Citigroup U.S. Domestic 3-Month Treasury Bills Index | | | 0.02% | | | | 0.05% | | | | 0.09% | | | | 1.56% | |
Data shows past performance, which is not indicative of future performance. Current performance may be lower or higher than the performance quoted. To obtain the most recent month-end performance data available, please visit www.WasatchFunds.com. The Advisor may absorb certain Fund expenses, without which total return would have been lower. Investment returns and principal value will fluctuate and shares, when redeemed, may be worth more or less than their original cost.
As of the January 31, 2014 prospectus, the Total Annual Fund Operating Expenses for the Wasatch Long/Short Fund are — Investor Class: 1.51% / Institutional Class: 1.40%, Net: 1.39%. The expense ratio shown elsewhere in this report may be different. Net Expenses are based on Fund expenses, net of waivers and reimbursements. Expenses include dividend expense on short sales and interest expense. See the prospectus for additional information regarding Fund expenses.
Wasatch Funds will deduct a 2.00% redemption proceeds fee on Fund shares held 60 days or less. Performance data does not reflect the deduction of fees, including sales charges, or the taxes you would pay on fund distributions or the redemption of fund shares. Fees and taxes, if reflected, would reduce the performance quoted. Wasatch does not charge any sales fees. For more complete information including charges, risks and expenses, read the prospectus carefully.
The Institutional Class is new and does not have any performance history prior to 12/13/2012. Performance for the Institutional Class prior to 12/13/2012 is based on the performance of the Investor Class. Performance of the Fund’s Institutional Class prior to 12/13/2012 uses the actual expenses of the Fund’s Investor Class without any adjustments. For any such period of time, the performance of the Fund’s Institutional Class would have been substantially similar to, yet higher than, the performance of the Fund’s Investor Class, because the shares of both classes are invested in the same portfolio of securities, but the classes bear different expenses.
The Fund makes short sales of securities, which involve the risk that losses may exceed the original amount invested. Equity investing involves risks, including potential loss of the principal amount invested. Being non-diversified, the Fund can invest a larger portion of its assets in the securities of a limited number of companies than a diversified fund. Non-diversification increases the risk of loss to the Fund if the values of these securities decline.
TOP 10 EQUITY HOLDINGS**
| | | | |
| Company | | % of Net
Assets | |
| Denbury Resources, Inc. | | | 5.1% | |
| Apple, Inc. | | | 4.1% | |
| General Motors Co. | | | 3.7% | |
| Wal-Mart Stores, Inc. | | | 3.4% | |
| Halliburton Co. | | | 3.2% | |
| | | | |
| Company | | % of Net
Assets | |
| Loews Corp. | | | 3.1% | |
| Iron Mountain, Inc. | | | 2.9% | |
| Target Corp. | | | 2.5% | |
| Microsoft Corp. | | | 2.5% | |
| Ensco plc, Class A | | | 2.4% | |
| ** | As of March 31, 2014, there were 69 long and 13 short holdings in the Fund. Foreign currency contracts, written options and repurchase agreements, if any, are not included in the number of holdings. Portfolio holdings are subject to change at any time. References to specific securities should not be construed as recommendations by the Funds or their Advisor. Current and future holdings are subject to risk. |
SECTOR BREAKDOWN†
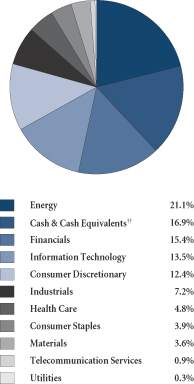
| † | Excludes securities sold short and options written, if any. |
| †† | Also includes Other Assets & Liabilities. |
GROWTHOFA HYPOTHETICAL $10,000 INVESTMENT
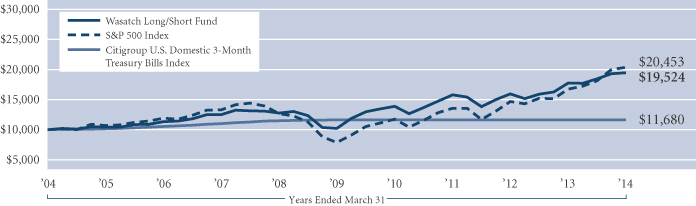
Past performance does not predict future performance. The graph above does not reflect the deduction of fees, sales charges, or taxes that you would pay on fund distributions or the redemption of fund shares. Wasatch does not charge any sales fees. The S&P 500 Index includes 500 of the United States’ largest stocks from a broad variety of industries. The Index is unmanaged but is a commonly used measure of common stock total return performance. The Citigroup U.S. Domestic 3-Month Treasury Bills Index tracks the performance of U.S. Treasury bills with a remaining maturity of three months. U.S. Treasury bills, which are short-term loans to the U.S. government, are full-faith-and-credit obligations of the U.S. Treasury and are generally regarded as being free of any risk of default. You cannot invest directly in these or any indices.
25
| | |
| WASATCH MICRO CAP FUND (WMICX) — Management Discussion | | MARCH 31, 2014 (UNAUDITED) |
|
|
|
The Wasatch Micro Cap Fund is managed by a team of Wasatch portfolio managers led by Dan Chace.
| | |

Dan Chace, CFA Lead Portfolio Manager | | OVERVIEW The Wasatch Micro Cap Fund returned 0.25% and trailed the rise of 3.01% in its benchmark, the Russell Microcap Index in the quarter ended March 31, 2014, while the Russell 2000 Index gained 1.12%. Cross-currents in investor sentiment caused fluctuations in the U.S. equity market for much of the quarter. While geopolitical strains in Ukraine and slowing growth in China weighed on global growth prospects, global markets |
for the most part moved higher, but not without more volatility than we have seen in some time. Biotechnology stocks, for example, traded lower late in the quarter on concerns that the industry may be approaching bubble territory. In the U.S., initial uneasiness about soft economic data soon gave way to optimism that the weakness was weather-related and unlikely to stall economic growth. Signals from the Federal Reserve (Fed) elicited equally mixed reactions, as investors concerned about the end of quantitative easing found solace in new Chair Janet Yellen’s assurance that the Fed would not raise short-term interest rates “for some time.”
The Fund’s international holdings generally posted solid gains that helped offset weaker performance in the U.S. Our international investments were especially beneficial in the consumer-discretionary sector, which was one of the Fund’s top-contributing sectors to performance relative to the Index.
After having been an area of strength for the past several quarters, information technology was one of the worst-performing sectors of the benchmark. Our information-technology stocks were down less than those in the Index, but our overweight position hurt relative performance.
Stock selection within the health-care sector was another reason the Fund underperformed its benchmark. Like information technology, health care has historically been a key driver of the Fund’s returns. Though our health-care holdings were positive contributors on the whole again this quarter, they lagged the benchmark’s health-care names on weak relative showings from our pharmaceutical stocks and several other individual positions. In addition, because biotechnology was one of the top-performing industry groups in health care, the underperformance of our holdings and our underweight position in the group were headwinds for the Fund.
DETAILSOFTHE QUARTER
One of our strongest contributors to performance for the quarter was MakeMyTrip, the largest online travel agency in India. The company is benefiting from increasing air travel in India as additional capacity in the airline industry has made fares more affordable. Other positives for MakeMyTrip include continued strong earnings from its hotel bookings and the growing popularity in India of making travel reservations on the Internet. Additionally, the
company’s successful completion of a secondary stock offering appears to have encouraged investors by eliminating a source of uncertainty.
Contract research organization ICON was another strong contributor. The company provides outsourced services for managing clinical trials in the pharmaceuticals, biotechnology and medical-device industries. ICON is benefiting from its decision to focus on partnering with large pharmaceutical companies. Recent investments that ICON has made in its business also are paying off as increasing revenues translate into strong earnings growth. We began trimming the Fund’s position in ICON during the quarter in response to its higher stock price and less attractive valuation.
One of the Fund’s greatest detractors from performance was Regional Management. The company makes small loans primarily to customers with limited access to consumer credit from banks and other traditional lenders. The company is experiencing higher loan losses that are expected to impact earnings. In addition, the stock declined sharply when Regional’s main competitor announced a government probe into its business practices. Though disappointing, these developments do not alter our long-term view of the company. We are maintaining a position in the stock as we continue to monitor developments both at Regional and within the consumer-lending industry.
IPC The Hospitalist was also a large detractor. The company provides, manages and coordinates the care of hospitalized patients in the U.S. The stock declined during the quarter when higher costs related primarily to recent acquisitions resulted in lower earnings guidance from the company. We remain patient and are maintaining our position in IPC. As pressures on traditional primary-care physicians increase, we believe hospitalists will play expanding roles in our health-care system.
OUTLOOK
The Fund’s two most-heavily weighted sectors account for about 60% of assets, divided roughly equally between health care and information technology. We watch our sector weights closely, but we do not have specific target weights. As bottom up investors, we build the Fund one company at a time based on the fundamentals of each individual company. Health care and information technology are areas ripe with change and innovation, so it makes sense that we would find so many interesting micro-cap companies sprouting up in these sectors. In addition, as the economy has rebounded over the last several years, stocks in these sectors have outperformed the market as a whole, further increasing their weight in the Fund.
While we expect health care and information technology to continue to represent a significant share of the Fund’s investments, we have begun trimming positions as valuations in these sectors have become less attractive. Should the economy continue to improve, we would anticipate and welcome a more-balanced sector profile for the Fund in response to a widening set of investments we find attractive. We also believe such an environment would favor our fundamental, bottom-up investment approach.
Thank you for the opportunity to manage your assets.
| Current | and future holdings are subject to risk |
26
| | |
| WASATCH MICRO CAP FUND (WMICX) — Portfolio Summary | | MARCH 31, 2014 (UNAUDITED) |
|
|
|
AVERAGE ANNUAL TOTAL RETURNS
| | | | | | | | | | | | | | | | |
| | | SIX MONTHS* | | | 1 YEAR | | | 5 YEARS | | | 10 YEARS | |
Micro Cap | | | 8.89% | | | | 30.53% | | | | 25.17% | | | | 7.45% | |
Russell Microcap® Index | | | 13.57% | | | | 33.24% | | | | 25.86% | | | | 6.63% | |
Data shows past performance, which is not indicative of future performance. Current performance may be lower or higher than the performance quoted. To obtain the most recent month-end performance data available, please visit www.WasatchFunds.com. The Advisor may absorb certain Fund expenses, without which total return would have been lower. Investment returns and principal value will fluctuate and shares, when redeemed, may be worth more or less than their original cost.
As of the January 31, 2014 prospectus, the Total Annual Fund Operating Expenses for the Wasatch Micro Cap Fund are 1.93%. The expense ratio shown elsewhere in this report may be different. See the prospectus for additional information regarding Fund expenses.
Wasatch Funds will deduct a 2.00% redemption proceeds fee on Fund shares held 60 days or less. Performance data does not reflect the deduction of fees, including sales charges, or the taxes you would pay on fund distributions or the redemption of fund shares. Fees and taxes, if reflected, would reduce the performance quoted. Wasatch does not charge any sales fees. For more complete information including charges, risks and expenses, read the prospectus carefully.
Investing in micro cap funds will be more volatile and loss of principal could be greater than investing in large cap or more diversified funds. Investing in foreign securities, especially in emerging markets, entails special risks, such as currency fluctuations and political uncertainties, which are described in more detail in the prospectus.
TOP 10 EQUITY HOLDINGS**
| | | | |
| Company | | % of Net
Assets | |
| Envestnet, Inc. | | | 2.3% | |
| Interactive Intelligence Group, Inc. | | | 2.2% | |
| Ensign Group, Inc. (The) | | | 2.2% | |
| CorVel Corp. | | | 2.1% | |
| ICON plc (Ireland) | | | 2.0% | |
| | | | |
| Company | | % of Net
Assets | |
| AtriCure, Inc. | | | 2.0% | |
| SciQuest, Inc. | | | 1.9% | |
| Dealertrack Technologies, Inc. | | | 1.9% | |
| CAI International, Inc. | | | 1.9% | |
| Ultimate Software Group, Inc. | | | 1.8% | |
| ** | As of March 31, 2014, there were 96 holdings in the Fund. Foreign currency contracts, written options and repurchase agreements, if any, are not included in the number of holdings. Portfolio holdings are subject to change at any time. References to specific securities should not be construed as recommendations by the Funds or their Advisor. Current and future holdings are subject to risk. |
SECTOR BREAKDOWN†
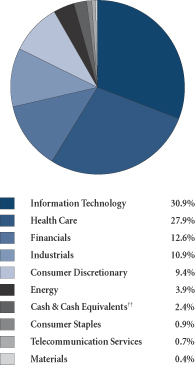
| † | Excludes securities sold short and options written, if any. |
| †† | Also includes Other Assets & Liabilities. |
GROWTHOFA HYPOTHETICAL $10,000 INVESTMENT
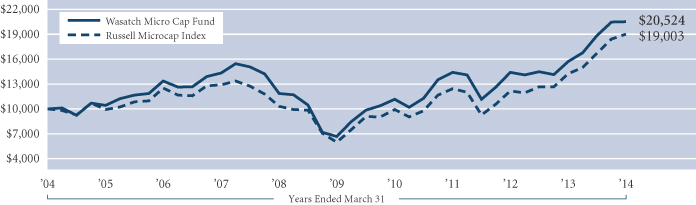
Past performance does not predict future performance. The graph above does not reflect the deduction of fees, sales charges, or taxes that you would pay on fund distributions or the redemption of fund shares. Wasatch does not charge any sales fees. The Russell Microcap Index is an unmanaged total return index of the smallest 1,000 securities in the small-cap Russell 2000 Index along with the next smallest 1,000 companies, based on a ranking of all U.S. equities by market capitalization. The official start date of the index was July 1, 2005. Data for the index prior to this date was from a paper portfolio. You cannot invest directly in this or any index.
27
| | |
| WASATCH MICRO CAP VALUE FUND (WAMVX) — Management Discussion | | MARCH 31, 2014 (UNAUDITED) |
|
|
|
The Wasatch Micro Cap Value Fund is managed by a team of Wasatch portfolio managers led by Brian Bythrow.
| | |

Brian Bythrow, CFA Lead Portfolio Manager | | OVERVIEW The Wasatch Micro Cap Value Fund gained 0.62% for the quarter ended March 31, 2014. The Fund’s benchmark, the Russell Microcap Index, rose 3.01%. International tensions in Ukraine and the potential impact of a slowing Chinese economy were among the factors affecting stocks during the quarter. An unusually cold winter throughout much of the U.S. dampened enthusiasm for retail shopping |
and may have held back gross domestic product (GDP) growth in January and February. In the absence of other important news, investors looked to the Federal Reserve (Fed) for clues about the likely course of U.S. interest rates. Concern that the Fed may raise short-term rates sooner than expected contributed to volatility in stocks.
Nevertheless, equity markets remained buoyant as sector and industry-group performance reflected investors’ strong appetite for risk. For example, a 17% gain in biotechnology stocks was mostly responsible for health care being the Russell Microcap Index’s top-contributing sector. In second place was the energy sector, led by companies specializing in experimental fuel-cell technology. While higher-risk, more-speculative companies such as these were standout performers, our revenue criteria and the Fund’s value mandate prevented us from owning the vast majority of them.
In the aggressive market environment, our comparatively unexciting industrial and consumer-staples companies became less appealing to investors and were headwinds for the Fund. However, underperformance in those sectors was largely offset by outperformance in the information-technology and consumer-discretionary sectors. While our international companies — led by strong showings in France, India and Israel — outpaced our U.S. investments, our international holdings overall lagged the benchmark and were modest drags on the Fund’s relative performance. The Fund’s cash position also dampened performance during a quarter in which risk-taking was rewarded by the markets.
DETAILSOFTHE QUARTER
Our strongest contributor to performance for the quarter was Horizon Pharma — a specialty-pharmaceuticals company with medicines for the treatment of arthritis, pain and inflammatory diseases. Strong demand has enabled Horizon to boost revenues by raising prices for its medications. The stock rose over 70% in the quarter nearing our estimate of full valuation, and we have begun reducing the Fund’s position.
Applied Optoelectronics is a leading designer and manufacturer of fiber-optic networking equipment. News that a major broadband-Internet and television provider would be using the company’s products in a major expansion of its fiber-to-the-premises service sent the stock up almost 60% for the quarter and helped make it the Fund’s second-best contributor. We used the stock’s recent strength as an opportunity to trim the Fund’s position.
Our greatest detractor from performance was specialty food-products distributor The Chefs’ Warehouse. Demand for the company’s products softened this winter as colder-than-normal weather impacted restaurant traffic in key regions. In addition, higher capital investment and costs related to a recent acquisition forced Chefs’ Warehouse to lower earnings guidance for 2014. Despite these short-term negatives, the company’s reported revenue growth has met expectations, and we believe earnings will follow as costs return to normal and the benefits of the acquisition are realized.
Another detractor was Move, which owns and operates the website REALTOR.com. The website offers property listings and other real-estate information services. Investors reacted negatively to news that the company and its two main competitors planned to increase advertising spending in an effort to boost growth. We like the company’s solid long-term growth prospects and believe Move is significantly undervalued relative to its competitors making it an attractive target for acquisition.
OUTLOOK
The speculative tone of U.S. equity markets during much of the quarter was one in which neither the Fund’s value orientation nor our disciplined investment approach typically shines. To the extent the Fed’s aggressive monetary stimulus has encouraged speculation in the markets, the winding down of that stimulus must be perceived as a reason for caution going forward.
Toward that end, we remain committed to our disciplined investment approach. As companies outgrow the Fund’s micro-cap mandate, we rotate out of those positions and recycle capital back into smaller companies we consider attractively valued. When markets are exceptionally strong, this process can exert a natural sell discipline and result in higher levels of cash in the Fund. Currently, we view our modestly elevated cash position as a strategic asset for deployment on market weakness or as other opportunities arise.
The standard paradigm for economic growth is that investment in new facilities and equipment creates jobs and raises household incomes, which then support consumption, savings and investment in a virtuous cycle. But in the current slow-growth environment, justifiably cautious corporate management teams have increasingly used capital investment (especially investment in technology) as a cost-cutting tool for eliminating jobs and boosting productivity. While that is unlikely to change until economic growth picks up, it is difficult to envision a stronger economy until we observe robust gains in employment.
In the meantime, our portfolio companies generally have continued to meet their growth targets while remaining reasonably valued on our metrics. When evaluating new companies, we do so with an eye toward those that we believe can grow in a sluggish economy — for example, by taking market share from competitors, or by providing solutions that enable other companies to cut costs. We believe the Fund’s portfolio of high-quality, undiscovered micro-cap companies is well-positioned for long-term growth.
Thank you for the opportunity to manage your assets.
| Current | and future holdings are subject to risk. |
28
| | |
| WASATCH MICRO CAP VALUE FUND (WAMVX) — Portfolio Summary | | MARCH 31, 2014 (UNAUDITED) |
|
|
|
AVERAGE ANNUAL TOTAL RETURNS
| | | | | | | | | | | | | | | | |
| | | SIX MONTHS* | | | 1 YEAR | | | 5 YEARS | | | 10 YEARS | |
Micro Cap Value | | | 11.12% | | | | 27.79% | | | | 27.78% | | | | 10.65% | |
Russell Microcap® Index | | | 13.57% | | | | 33.24% | | | | 25.86% | | | | 6.63% | |
Data shows past performance, which is not indicative of future performance. Current performance may be lower or higher than the performance quoted. To obtain the most recent month-end performance data available, please visit www.WasatchFunds.com. The Advisor may absorb certain Fund expenses, without which total return would have been lower. Investment returns and principal value will fluctuate and shares, when redeemed, may be worth more or less than their original cost.
As of the January 31, 2014 prospectus, the Total Annual Fund Operating Expenses for the Wasatch Micro Cap Value Fund are 2.05%. The Net Expenses are 1.95%. The expense ratio shown elsewhere in this report may be different. Net Expenses are based on Fund expenses, net of waivers and reimbursements. See the prospectus for additional information regarding Fund expenses.
Wasatch Funds will deduct a 2.00% redemption proceeds fee on Fund shares held 60 days or less. Performance data does not reflect the deduction of fees, including sales charges, or the taxes you would pay on fund distributions or the redemption of fund shares. Fees and taxes, if reflected, would reduce the performance quoted. Wasatch does not charge any sales fees. For more complete information including charges, risks and expenses, read the prospectus carefully.
Investing in micro cap funds will be more volatile and loss of principal could be greater than investing in large cap or more diversified funds. Investments in value stocks can perform differently from the market as a whole and from other types of stocks and can continue to be undervalued by the market for long periods of time. Investing in foreign securities, especially in emerging markets, entails special risks, such as currency fluctuations and political uncertainties, which are described in more detail in the prospectus.
TOP 10 EQUITY HOLDINGS**
| | | | |
| Company | | % of Net
Assets | |
| Caesarstone Sdot-Yam Ltd. (Israel) | | | 2.0% | |
| Ebix, Inc. | | | 1.9% | |
| ShoreTel, Inc. | | | 1.8% | |
| CorVel Corp. | | | 1.8% | |
| Horizon Pharma, Inc. | | | 1.6% | |
| | | | |
| Company | | % of Net
Assets | |
| Saia, Inc. | | | 1.6% | |
| Comstock Resources, Inc. | | | 1.6% | |
| Gentherm, Inc. | | | 1.6% | |
| Tristate Capital Holdings, Inc. | | | 1.5% | |
| DXP Enterprises, Inc. | | | 1.5% | |
| ** | As of March 31, 2014, there were 113 holdings in the Fund. Foreign currency contracts, written options and repurchase agreements, if any, are not included in the number of holdings. Portfolio holdings are subject to change at any time. References to specific securities should not be construed as recommendations by the Funds or their Advisor. Current and future holdings are subject to risk. |
SECTOR BREAKDOWN†
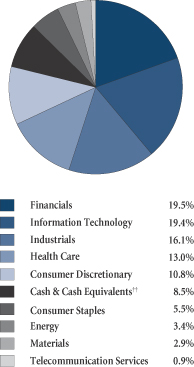
| † | Excludes securities sold short and options written, if any. |
| †† | Also includes Other Assets & Liabilities. |
GROWTHOFA HYPOTHETICAL $10,000 INVESTMENT
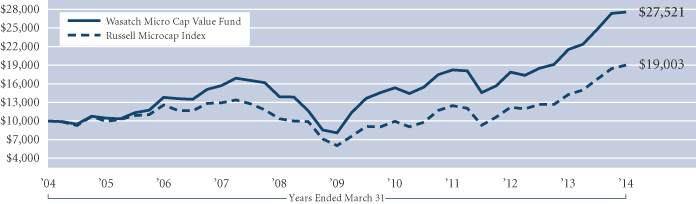
Past performance does not predict future performance. The graph above does not reflect the deduction of fees, sales charges, or taxes that you would pay on fund distributions or the redemption of fund shares. Wasatch does not charge any sales fees. The Russell Microcap Index is an unmanaged total return index of the smallest 1,000 securities in the small-cap Russell 2000 Index along with the next smallest 1,000 companies, based on a ranking of all U.S. equities by market capitalization. The official start date of the index was July 1, 2005. Data for the index prior to this date was from a paper portfolio. You cannot invest directly in this or any index.
29
| | |
| WASATCH SMALL CAP GROWTH FUND (WAAEX) — Management Discussion | | MARCH 31, 2014 (UNAUDITED) |
|
|
|
The Wasatch Small Cap Growth Fund is managed by a team of Wasatch portfolio managers led by Jeff Cardon and JB Taylor.
| | | | |

Jeff Cardon, CFA Lead Portfolio Manager | |
JB Taylor Portfolio Manager | | OVERVIEW The Wasatch Small Cap Growth Fund posted a gain of 0.88% for the quarter ended March 31, 2014, outperforming the 0.48% return of the Russell 2000 Growth Index and slightly under- |
performing the 1.12% return of the Russell 2000 Index.
On the surface, the first quarter of 2014 appears to have been a relatively quiet start to the new year, with most major U.S. stock indices flat to up about 2%. The Fund’s return was in line with market returns. Like the proverbial duck sitting on a pond, there was a substantial amount of activity underneath the surface. There were noticeable “mood swings” during the quarter, with relative return swings in both directions between high-flying growth stocks that have been leading the market since 2009 versus slower-growth, more value-oriented stocks that have been lagging since the market bottom. This has been a one-way fight for five years, but it appears that some previously less-popular stocks are finally joining the fray.
Our investment style is a hybrid between these two camps. On one hand, we hold larger weights in what we consider to be high-quality companies that we believe will grow earnings at a steady clip for the next several years. On the other hand, we are attracted to the fastest-growing companies in our economy. There is risk associated with this strategy of investing in innovative, disruptive companies. We deal with this risk by taking smaller portfolio weights in super-fast growers as a way to ensure that we are not over-exposed to companies’ inevitable stumbles and stock-price volatility. Over the past year or so, we have been trimming our high-growth stocks that have been among those leading the market upward. To be sure, we still have investments in these dynamic companies, but on the margin we are moving capital to some more stable growers that are selling at better valuations.
DETAILSOFTHE QUARTER
Our international holdings more than carried their weight in the quarter. One of our strongest contributors to performance was MakeMyTrip, the largest online travel agency in India. The company is benefiting from a rising middle class and an explosion in broadband use. A strengthening rupee provided a nice tailwind this quarter, helping to make India our top-contributing country.
Based in Ireland but with a global customer base, contract research organization (CRO) ICON was another positive contributor. The company provides outsourced services for managing clinical trials in the pharmaceutical, biotechnology and medical-device industries. ICON is benefiting from
management’s decision to focus on partnering with large multinational pharmaceutical companies as CRO services are becoming more complex and global in scope.
IPC The Hospitalist was a large detractor for the quarter. The company is the market leader in the hospitalist industry. IPC’s physicians provide more efficient care of patients and allow hospitals to better manage resources in an increasingly complex and competitive health-care environment. We believe IPC is an example of a well-run company growing in the mid-teens that has underperformed the market.
Blue Nile, an online retailer of diamonds and fine jewelry, also hurt the Fund’s performance. The stock was down during the quarter due to a weaker-than-expected holiday selling season. We believe Blue Nile has a compelling competitive position. Because the company holds little inventory and has very little overhead, Blue Nile has a significant price advantage that has led to consistent market-share gains at the expense of brick-and-mortar jewelers.
OUTLOOK
The U.S. economy continues to mend, with business generally improving across all industries. To be sure, this recovery is still a dramatic underperformer, especially in areas that matter to the most people, such as the absolute level of unemployment. The Small Cap Growth Fund, by contrast, has returned more than 80% from the quarter-end high water mark reached on September 30, 2007 just before the market crash and the Great Recession. It would be very difficult to find any statistic of economic health that would show an 80% improvement from a September 2007 base. Clearly, quantitative easing has benefited the Fund as investors have sought alternatives to the extremely low rates of return offered in safer assets such as bonds and certificates of deposit (CDs).
The market is beginning to show signs of a possible change in leadership away from pure “risk-on” assets such software and biotech stocks. We believe we are well-suited to navigate this kind of market given our long history of investing in our core stocks — companies that we believe are high quality that are growing slower than the hyper growers, but still at or above our 15% target range.
Small cap growth stocks are trading at historically high levels compared to earnings (known as price-to earnings ratios) and we expect that they will move lower. If we invest in stocks that can compound earnings by 15%, we believe long-run Fund returns will be less than 15%. Our models suggest compound returns in the Fund have the potential to be in the mid to upper single-digit range over the long run.
Thank you for the opportunity to manage your assets and for your trust.
| Current | and future holdings are subject to risk. |
30
| | |
| WASATCH SMALL CAP GROWTH FUND (WAAEX) — Portfolio Summary | | MARCH 31, 2014 (UNAUDITED) |
|
|
|
AVERAGE ANNUAL TOTAL RETURNS
| | | | | | | | | | | | | | | | | | | | |
| | | SIX MONTHS* | | 1 YEAR | | 5 YEARS | | 10 YEARS |
Small Cap Growth | | 6.48% | | | | 21.28% | | | | | 25.06% | | | | | 9.10% | |
Russell 2000® Growth Index | | 8.69% | | | | 27.19% | | | | | 25.24% | | | | | 8.87% | |
Russell 2000® Index | | 9.94% | | | | 24.90% | | | | | 24.31% | | | | | 8.53% | |
Data shows past performance, which is not indicative of future performance. Current performance may be lower or higher than the performance quoted. To obtain the most recent month-end performance data available, please visit www.WasatchFunds.com. The Advisor may absorb certain Fund expenses, without which total return would have been lower. Investment returns and principal value will fluctuate and shares, when redeemed, may be worth more or less than their original cost.
As of the January 31, 2014 prospectus, the Total Annual Fund Operating Expenses for the Wasatch Small Cap Growth Fund are 1.24%. The expense ratio shown elsewhere in this report may be different. Expenses include direct expenses paid to the Advisor as well as indirect expenses incurred by the Fund as a result of its investments in other investment companies (each an “Acquired Fund”), before any expense reimbursements by the Advisor. See the prospectus for additional information regarding Fund expenses.
Wasatch Funds will deduct a 2.00% redemption proceeds fee on Fund shares held 60 days or less. Performance data does not reflect the deduction of fees, including sales charges, or the taxes you would pay on fund distributions or the redemption of fund shares. Fees and taxes, if reflected, would reduce the performance quoted. Wasatch does not charge any sales fees. For more complete information including charges, risks and expenses, read the prospectus carefully.
Investing in small cap funds will be more volatile and loss of principal could be greater than investing in large cap or more diversified funds. Investing in foreign securities, especially in emerging markets, entails special risks, such as currency fluctuations and political uncertainties, which are described in more detail in the prospectus.
TOP 10 EQUITY HOLDINGS**
| | | | |
| Company | | % of Net
Assets | |
Knight Transportation, Inc. | | | 4.4% | |
Ultimate Software Group, Inc. | | | 2.8% | |
Wirecard AG (Germany) | | | 2.5% | |
Power Integrations, Inc. | | | 2.5% | |
Life Time Fitness, Inc. | | | 2.4% | |
| | | | |
| Company | | % of Net
Assets | |
Wesco Aircraft Holdings, Inc. | | | 2.1% | |
IPG Photonics Corp. | | | 2.1% | |
Allegiant Travel Co. | | | 2.1% | |
ICON plc (Ireland) | | | 2.0% | |
IPC The Hospitalist Co., Inc. | | | 1.9% | |
| ** | As of March 31, 2014, there were 100 holdings in the Fund. Foreign currency contracts, written options and repurchase agreements, if any, are not included in the number of holdings. Portfolio holdings are subject to change at any time. References to specific securities should not be construed as recommendations by the Funds or their Advisor. Current and future holdings are subject to risk. |
SECTOR BREAKDOWN†
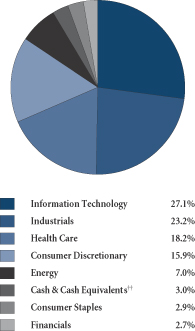
| † | Excludes securities sold short and options written, if any. |
| †† | Also includes Other Assets & Liabilities. |
GROWTHOFA HYPOTHETICAL $10,000 INVESTMENT
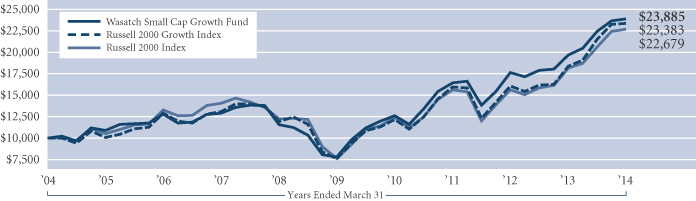
Past performance does not predict future performance. The graph above does not reflect the deduction of fees, sales charges, or taxes that you would pay on fund distributions or the redemption of fund shares. Wasatch does not charge any sales fees. The Russell 2000 Growth Index is an unmanaged total return index that measures the performance of those Russell 2000 Index companies with higher price-to-book ratios and higher forecasted growth values. The Russell 2000 Index is an unmanaged total return index of the smallest 2,000 companies in the Russell 3000 Index, as ranked by total market capitalization. The Russell 2000 Index is widely regarded in the industry as accurately capturing the universe of small company stocks. You cannot invest directly in these or any indices.
31
| | |
| WASATCH SMALL CAP VALUE FUND (WMCVX / WICVX) — Management Discussion | | MARCH 31, 2014 (UNAUDITED) |
|
|
|
The Wasatch Small Cap Value Fund is managed by a team of Wasatch portfolio managers led by Jim Larkins.
| | |

Jim Larkins Lead Portfolio Manager | | OVERVIEW The Wasatch Small Cap Value Fund — Investor Class returned 4.87% and significantly outpaced the 1.78% gain of the Russell 2000 Value Index for the quarter ended March 31, 2014. Small-cap stocks began the year with a downturn in January, rallied sharply in February, and then closed the quarter with a spate of renewed volatility. While the economy continues to show signs of strength, stocks were pressured |
by concerns about turmoil in the emerging markets and questions about future Federal Reserve policy.
Stock selection in the health-care and energy sectors, where the majority of our holdings delivered double-digit gains, was the most important factor in lifting the Fund’s performance above that of the Index.
DETAILSOFTHE QUARTER
The Fund’s performance continued to be driven by our Undiscovered Gems and Quality Value strategies. Our Undiscovered Gems strategy focuses on good companies that are relatively unknown to the broader market. With Quality Value we seek to invest in companies that feature not just traditional value characteristics, but also a specific attribute — such as an exceptional business model — that sets them apart. Our third major strategy, Fallen Angels, didn’t make a significant contribution to performance during the quarter. The companies in this category typically have short-term fundamental challenges that we believe are fully factored into their stock prices, which creates upside potential once investors look past the near-term headwinds. While the Fallen Angel strategy has added substantially to the Fund’s performance over time, investors generally favored “cleaner” value stories during the first three months of 2014.
Quality Value was our top-performing strategy in the quarter, as some of our larger weightings delivered solid performance. Ebix, an insurance software company, continues to demonstrate solid underlying fundamentals even as it navigates some legal issues. Comstock Resources, another top-weighted holding, is a drilling company that gained ground on the strength of rising natural gas prices. We believe investors are beginning to discover the company, as its new oil-focused investments have begun to play out. On the negative side, consumer-finance company Regional Management underperformed. Increased regulatory scrutiny in the consumer lending industry has cast a shadow over its business. We also saw some negative trends in the company’s loan delinquencies, and have since reduced the Fund’s weighting in the stock.
In the Undiscovered Gems category, Flotek Industries finished the quarter as one of our top-performing stocks. Flotek’s “green” chemicals are gaining traction as oil companies respond to concerns about toxic fluids that are employed in the process of drilling, “fracking” and complet-
ing wells. We elected to sell this investment as the stock had moved beyond what we viewed as its fair value. Tristate Capital Holdings, a bank in which we invested at its initial public offering (IPO) last spring, also performed well after acquiring an asset manager at what we believe is an attractive price. A notable detractor within Undiscovered Gems was Chico’s, a retailer that Wasatch has followed and owned off and on in various funds for over a decade. We reduced our position in the autumn of 2013 due to concerns about fashion trends, a well-timed move given that the overly competitive apparel-retailing environment during the holidays hurt Chico’s results. Rising competition — within malls as well as from online vendors — has prompted us to reevaluate this position.
MakeMyTrip, an online travel company focused on India, was one of the Fund’s top contributors. Our colleagues on the growth side of Wasatch owned the company and encouraged us to take a look at MakeMyTrip last year after the stock came under pressure from broader issues regarding India’s domestic airline industry. Since these issues were outside of the company’s control, we viewed the downturn as an opportunity to buy an attractive Fallen Angel. MakeMyTrip is a leader with a business model that has proven successful in other countries. The company’s key attribute is its ability to book the small “mom and pop” hotels that are common in India — something the market may have overlooked when the stock sold off.
OUTLOOK
Given that small-cap valuations have become more expensive, our outlook is more cautious now than it was throughout 2013. We believe that small-cap stocks still have the potential to deliver positive returns this year, but we urge investors to maintain realistic expectations. However, for active managers like us, the improving economy provides a continual opportunity to buy shares of good companies when their stocks experience short-term disruptions.
In terms of portfolio activity, we continue to follow our longstanding approach of trimming stocks that have become fully valued and rotating into stocks that offer a more compelling risk-return profile. We believe this allows us to maintain a reasonably valued overall portfolio, and helps us navigate a market in which the small-cap asset class has become more richly valued. It’s important to note that we are being very selective in our search for values at this stage of the cycle, since many stocks that appear to be attractively priced are in fact inexpensive for a reason. We therefore believe it’s essential to employ a cautious approach rather than reaching for low-priced stocks with questionable long-run fundamentals.
Overall, we believe our selective, value-driven and patient approach will provide the Fund with the potential to participate in additional market upside.
Thank you for the opportunity to manage your assets.
| Current | and future holdings are subject to risk. |
32
| | |
| WASATCH SMALL CAP VALUE FUND (WMCVX / WICVX) — Portfolio Summary | | MARCH 31, 2014 (UNAUDITED) |
|
|
|
AVERAGE ANNUAL TOTAL RETURNS
| | | | | | | | | | | | | | | | |
| | | SIX MONTHS* | | | 1 YEAR | | | 5 YEARS | | | 10 YEARS | |
Small Cap Value (WMCVX) — Investor | | | 13.48% | | | | 31.15% | | | | 27.27% | | | | 7.65% | |
Small Cap Value (WICVX) — Institutional | | | 13.62% | | | | 31.53% | | | | 27.40% | | | | 7.71% | |
Russell 2000® Value Index | | | 11.25% | | | | 22.65% | | | | 23.33% | | | | 8.07% | |
Russell 2000® Index | | | 9.94% | | | | 24.90% | | | | 24.31% | | | | 8.53% | |
Data shows past performance, which is not indicative of future performance. Current performance may be lower or higher than the performance quoted. To obtain the most recent month-end performance data available, please visit www.WasatchFunds.com. The Advisor may absorb certain Fund expenses, without which total return would have been lower. Investment returns and principal value will fluctuate and shares, when redeemed, may be worth more or less than their original cost.
As of the January 31, 2014 prospectus, the Total Annual Fund Operating Expenses for the Wasatch Small Cap Value Fund are Investor Class — 1.27% / Institutional Class — Gross: 1.46%, Net: 1.15%. The expense ratio shown elsewhere in this report may be different. Net Expenses are based on Fund expenses, net of waivers and reimbursements. See the prospectus for additional information regarding Fund expenses.
Wasatch Funds will deduct a 2.00% redemption proceeds fee on Fund shares held 60 days or less. Performance data does not reflect the deduction of fees, including sales charges, or the taxes you would pay on fund distributions or the redemption of fund shares. Fees and taxes, if reflected, would reduce the performance quoted. Wasatch does not charge any sales fees. For more complete information including charges, risks and expenses, read the prospectus carefully.
Performance for the Institutional Class prior to 1/31/2012 is based on the performance of the Investor Class. Performance of the Fund’s Institutional Class prior to 1/31/2012 uses the actual expenses of the Fund’s Investor Class without any adjustments. For any such period of time, the performance of the Fund’s Institutional Class would have been substantially similar to, yet higher than, the performance of the Fund’s Investor Class, because the shares of both classes are invested in the same portfolio of securities, but the classes bear different expenses.
Investing in small cap funds will be more volatile and loss of principal could be greater than investing in large cap or more diversified funds. Investments in value stocks can perform differently from the market as a whole and from other types of stocks and can continue to be undervalued by the market for long periods of time. Investing in foreign securities, especially in emerging markets, entails special risks, such as currency fluctuations and political uncertainties, which are described in more detail in the prospectus.
TOP 10 EQUITY HOLDINGS**
| | | | |
| Company | | % of Net
Assets | |
| Copart, Inc. | | | 3.1% | |
| Ebix, Inc. | | | 3.0% | |
| Polypore International, Inc. | | | 2.8% | |
| Saia, Inc. | | | 2.3% | |
| CARBO Ceramics, Inc. | | | 2.3% | |
| | | | |
| Company | | % of Net
Assets | |
| Comstock Resources, Inc. | | | 2.3% | |
| Arbor Realty Trust, Inc. | | | 2.2% | |
| Franklin Covey Co. | | | 2.1% | |
| Skechers U.S.A., Inc., Class A | | | 2.1% | |
| Customers Bancorp, Inc. | | | 2.1% | |
| ** | As of March 31, 2014, there were 60 holdings in the Fund. Foreign currency contracts, written options and repurchase agreements, if any, are not included in the number of holdings. Portfolio holdings are subject to change at any time. References to specific securities should not be construed as recommendations by the Funds or their Advisor. Current and future holdings are subject to risk. |
SECTOR BREAKDOWN†
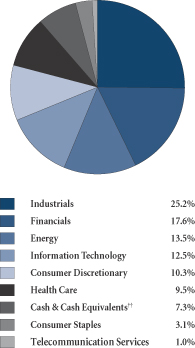
| † | Excludes securities sold short and options written, if any. |
| †† | Also includes Other Assets & Liabilities. |
GROWTHOFA HYPOTHETICAL $10,000 INVESTMENT
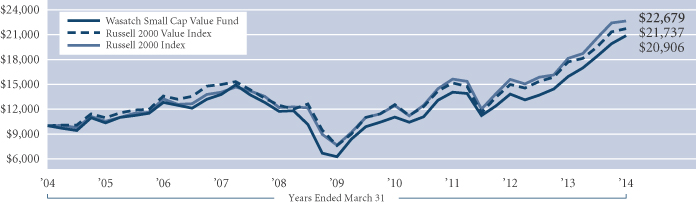
Past performance does not predict future performance. The graph above does not reflect the deduction of fees, sales charges, or taxes that you would pay on fund distributions or the redemption of fund shares. Wasatch does not charge any sales fees. The Russell 2000 Value Index measures the performance of those Russell 2000 Index companies with lower price-to-book ratios and lower forecasted growth values. The Russell 2000 Index is an unmanaged total return index of the smallest 2,000 companies in the Russell 3000 Index, as ranked by total market capitalization. The Russell 2000 Index is widely regarded in the industry as accurately capturing the universe of small company stocks. You cannot invest directly in these or any indices.
33
| | |
| WASATCH STRATEGIC INCOME FUND (WASIX) — Management Discussion | | MARCH 31, 2014 (UNAUDITED) |
|
|
|
The Wasatch Strategic Income Fund is managed by a team of Wasatch portfolio managers led by Sam Stewart.
| | |
Samuel S. Stewart, Jr. PhD, CFA Lead Portfolio Manager | | OVERVIEW The Wasatch Strategic Income Fund had a strong quarter with a 3.76% return and outperformed both of its benchmarks. The S&P 500 Index advanced 1.81%, while the Barclays Capital U.S. Aggregate Bond Index returned 1.84% for the quarter ended March 31, 2014. Our goal for the Fund is to realize a return somewhere between that of stocks and bonds. In fact, the Fund has been tracking above both stocks and |
bonds for the past one-, three-, five-year and since-inception periods. While we have enjoyed the above-average returns, my concern has been that we are taking above-average risk to achieve them.
Given the goals and objectives of the Fund, gaining returns at the expense of adding inordinate risks is not an appropriate strategy. My top concern each day is to ferret out risks that remain in the portfolio. As soon as I find an unwanted risk, I eliminate that position from the Fund.
Some of the holdings I sold this quarter reflect these efforts to reduce risk. My sale of the ProShares VIX Short-Term Futures ETF (VIXY), which I had regarded as insurance against declining market prices, was due to a colleague’s suggestion that VIXY exhibited a structural pattern of declining in price, making the cost of insurance more expensive than I had thought.
I sold Hatteras Financial, which showed a surprisingly large negative response to bond price declines last summer. Given the low duration of Hatteras Financial’s investment portfolio, the negative response to the decline in bond prices was an unexpected source of risk. Because bond prices seem likely to fall further, I decided to step aside just in case the company shows additional sensitivity to declining bond prices.
My sale of Taiwan Semiconductor was due to concern about its capital expenditures to keep technological pace with Intel and Samsung Group.* The sale wasn’t so much motivated by risk-reduction as by awareness that, due to its limited ability to raise dividends, Taiwan Semiconductor doesn’t fit the profile of other companies the Fund holds.
DETAILSOFTHE QUARTER
From a sector perspective, the financials sector was responsible for almost all of the Fund’s strong quarterly performance as we showed outstanding stock-picking ability in this perennially overweight sector. Consumer staples was the weakest sector, driven by the performance of Herbalife, which is discussed below. Information technology was also a detractor as we were underweight in this strong sector. The reason for our underweight position reflects another attempt to control risk. Bubbly Software-as-a-Service (SaaS) stocks led technology valuations higher across the board, causing me to exit solid businesses with what I saw as stretched
valuations in prior quarters. While this hindered the Fund’s results, I want to find every possible source of unwanted risk and eliminate it. Stretched valuations are a common source of risk in today’s market.
During the quarter, our strongest stock contributor was NorthStar Realty Finance. NorthStar reported several positive events during the quarter, which drove the stock price higher. The company announced that it had entered into a long-term partnership with Jay Flaherty to build a health care real estate business. Further, since joining NorthStar, Jay Flaherty sourced an investment in a $1.05 billion health care real estate portfolio. Also, NorthStar and RXR New York Metro Income, Inc.* announced a $2.0 billion initial public offering of common stock in a non-traded real estate investment trust (REIT).
Herbalife was the Fund’s largest detractor due to short seller Bill Ackman’s continuing efforts to bring the company down. This quarter, Ackman succeeded in getting the Federal Trade Commission (FTC) to open an inquiry into the company’s business practices, causing the stock to decline. We added to our position as we believe the FTC inquiry will not turn into anything major due to long-established FTC safe-harbor rules for multilevel-marketing companies. It is worth noting that over the past 12 months Herbalife was a strong contributor.
OUTLOOK
The current economic recovery has been characterized by quarter after quarter of slow, grind-it-out gains. The good news is that the economy is inching ahead, rather than slipping back into recession. The bad news is that the progress is modest and unlikely to put much of a dent in unemployment.
Because the current growth rate of the U.S. economy is below not only that of past economic recoveries but also below the long-term trend, I’ve dubbed this recovery as “the tortoise economy.” I expect the recovery to continue grinding forward, but as businesspeople and investors, we should also be aware that we’re operating within the tortoise economy.
I remain cautiously bullish for a few main reasons. First, I believe that all market indicators, particularly valuation metrics, must be taken with a grain of salt because of the level of monetary stimulus by the Federal Reserve. Second, the ratios that indicate overvaluation are for the market as a whole. The Wasatch Strategic Income Fund invests in individual companies that I think are unique. Third, I also monitor several technical indicators that were flashing warning signals prior to the global financial crisis. These same indicators, which can provide measures of overall investor psychology, are giving me reasons for optimism today.
Thank you for the opportunity to invest your assets.
| * | As of March 31, 2014, the Wasatch Strategic Income Fund was not invested in Samsung Group or RXR New York Metro Income, Inc. |
| | Current and future holdings are subject to risk. |
34
| | |
| WASATCH STRATEGIC INCOME FUND (WASIX) — Portfolio Summary | | MARCH 31, 2014 (UNAUDITED) |
|
|
|
AVERAGE ANNUAL TOTAL RETURNS
| | | | | | | | | | | | | | | | |
| | | SIX MONTHS* | | | 1 YEAR | | | 5 YEARS | | | SINCE INCEPTION 2/1/06 | |
Strategic Income | | | 12.35% | | | | 22.49% | | | | 22.98% | | | | 8.03% | |
S&P 500 Index | | | 12.51% | | | | 21.86% | | | | 21.16% | | | | 7.04% | |
Barclays Capital U.S. Aggregate Bond Index | | | 1.70% | | | | -0.10% | | | | 4.80% | | | | 4.98% | |
Data shows past performance, which is not indicative of future performance. Current performance may be lower or higher than the performance quoted. To obtain the most recent month-end performance data available, please visit www.WasatchFunds.com. The Advisor may absorb certain Fund expenses, without which total return would have been lower. Investment returns and principal value will fluctuate and shares, when redeemed, may be worth more or less than their original cost.
As of the January 31, 2014 prospectus, the Total Annual Fund Operating Expenses for the Wasatch Strategic Income Fund are 1.10%. The Net Expenses are 0.99%. The expense ratio shown elsewhere in this report may be different. Expenses include direct expenses paid to the Advisor as well as indirect expenses incurred by the Fund as a result of its investments in other investment companies (each an “Acquired Fund”), before any expense reimbursements by the Advisor. Net Expenses are based on Fund expenses, net of waivers and reimbursements. See the prospectus for additional information regarding Fund expenses.
Wasatch Funds will deduct a 2.00% redemption proceeds fee on Fund shares held 60 days or less. Performance data does not reflect the deduction of fees, including sales charges, or the taxes you would pay on fund distributions or the redemption of fund shares. Fees and taxes, if reflected, would reduce the performance quoted. Wasatch does not charge any sales fees. For more complete information including charges, risks and expenses, read the prospectus carefully.
The Fund has a concentration in the financials sector. Investing in concentrated funds can be more volatile and loss of principal could be greater than investing in more diversified funds. The financials sector can be significantly affected by various market factors, which are described in more detail in the prospectus.
With respect to the Fund’s assets invested in fixed income securities, you are subject, but not limited to, the same interest rate, inflation and credit risk associated with the underlying fixed-income securities owned by the Fund. Return of principal is not guaranteed. Investing in small cap funds will be more volatile and loss of principal could be greater than investing in large cap or more diversified funds. Investing in foreign securities, especially in emerging markets, entails special risks, such as currency fluctuations and political uncertainties, which are described in more detail in the prospectus.
TOP 10 EQUITY HOLDINGS**
| | | | |
| Company | | % of Net
Assets | |
| NorthStar Realty Finance Corp. | | | 6.2% | |
| Herbalife Ltd. | | | 5.0% | |
| Suncor Energy, Inc. (Canada) | | | 4.4% | |
| Occidental Petroleum Corp. | | | 4.2% | |
| PetSmart, Inc. | | | 4.1% | |
| | | | |
| Company | | % of Net
Assets | |
| Home Loan Servicing Solutions Ltd. | | | 4.1% | |
| PowerShares Dynamic Pharmaceuticals Portfolio | | | 4.1% | |
| Canadian National Railway Co. (Canada) | | | 4.0% | |
| Apple, Inc. | | | 3.8% | |
| Colony Financial, Inc. | | | 3.8% | |
| ** | As of March 31, 2014, there were 30 holdings in the Fund. Foreign currency contracts, written options and repurchase agreements, if any, are not included in the number of holdings. Portfolio holdings are subject to change at any time. References to specific securities should not be construed as recommendations by the Funds or their Advisor. Current and future holdings are subject to risk. |
SECTOR BREAKDOWN†
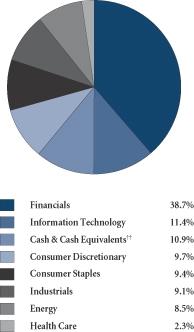
| † | Excludes securities sold short and options written, if any. |
| †† | Also includes Other Assets & Liabilities. |
GROWTHOFA HYPOTHETICAL $10,000 INVESTMENT
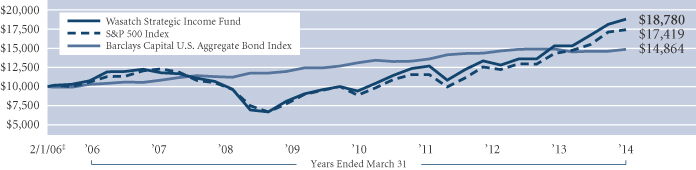
Past performance does not predict future performance. The graph above does not reflect the deduction of fees, sales charges, or taxes that you would pay on fund distributions or the redemption of fund shares. Wasatch does not charge any sales fees. ‡Inception: February 1, 2006. The S&P 500 Index represents 500 of the United States’ largest stocks from a broad variety of industries. The Index is unmanaged and is a common measure of common stock total return performance. The Barclays Capital U.S. Aggregate Bond Index covers the U.S. investment grade fixed rate bond market, including government and corporate securities, agency mortgage pass-through securities, and asset-backed securities. You cannot invest directly in these or any indices.
35
| | |
| WASATCH ULTRA GROWTH FUND (WAMCX) — Management Discussion | | MARCH 31, 2014 (UNAUDITED) |
|
|
|
The Wasatch Ultra Growth Fund is managed by a team of Wasatch portfolio managers led by John Malooly.
| | |

John Malooly, CFA Lead Portfolio Manager | | OVERVIEW The Wasatch Ultra Growth Fund gained 3.58% for the quarter ended March 31, 2014 and outperformed the Russell 2000 Growth Index, which rose 0.48%. Geopolitical tensions and the prospect of higher interest rates combined to temper investors’ optimism about the U.S. economy. The health-care sector drove the Fund’s performance for the quarter as strength in our pharmaceuticals, |
biotechnology and medical-instruments holdings helped our health-care stocks outperform their counterparts in the benchmark. Amid unusually cold weather throughout much of the U.S, consumer discretionary was the benchmark’s worst-performing sector. Our consumer stocks held up well by comparison and provided an additional source of outperformance. Advantageous stock-picking in those sectors more than offset weaker relative performance in other areas, such as energy and information technology.
Biotechnology stocks posted another strong quarter but gave back some gains during the latter part of March as investors began to question whether a biotech bubble was forming. In general, biotech stocks have delivered strong performance over the past several years even though the majority of companies operate at a loss. Our underweight allocation to the biotech industry helped mitigate the effect of the selloff on the Fund. In addition, the most-intense selling was concentrated in the popular, momentum-driven issues we generally seek to avoid. As a result, for the full quarter, our biotech stocks posted healthy gains that exceeded those of the benchmark’s holdings in the group.
When investing in biotechnology and other industries within the health-care sector, we look for smaller, lesser-known companies with strong science supported by promising clinical data. By trying to identify companies with unrecognized potential to bring effective new treatments to market, we seek investments driven by fundamentals rather than sentiment. We view health care somewhat differently than other sectors in that we are willing to relax our earnings-growth criteria when we believe a company possesses other desirable characteristics — such as patented technologies, strong barriers to competition and the potential to generate significant amounts of cash.
DETAILSOFTHE QUARTER
After having been our top contributor in the fourth quarter of 2013, Horizon Pharma was, once again, our top contributor. Horizon is a specialty-pharmaceuticals company that provides medicines for the treatment of arthritis, pain and inflammatory diseases. It is benefiting from strong demand for Vimovo, an arthritis drug it recently acquired. An expanded sales force and higher prices for the company’s medications have also boosted revenues. Investors reacted positively to news that Horizon has agreed to acquire an
Irish firm in a reverse merger that will add drugs targeting rare diseases to the company’s lineup. The reverse merger is also expected to lower Horizon’s tax rate. We continue to see upside in Horizon, but reduced our weight as the stock moved closer to what we consider full value.
Sangamo BioSciences was another solid contributor. Sangamo is a clinical-stage biopharmaceutical company specializing in treatments and cures for inherited genetic disorders. The stock soared on news that the company would partner its platform with a much-larger competitor seeking cures for sickle-cell disease and blood disorders. Investor enthusiasm about Sangamo’s experimental treatment for HIV also lifted the stock. Although we reduced our position in Sangamo during the quarter, we remain positive about the company’s long-term prospects.
One of our greatest detractors from performance for the quarter was FleetMatics Group. FleetMatics offers Web-based solutions to help the service and distribution industries operate fleets of commercial vehicles and improve the productivity of their mobile work forces. Investors reacted negatively to news that higher spending at the company would impact earnings in 2014 as FleetMatics expands in countries such as Mexico, Australia and the Netherlands. We think the company’s investments will pay off in the long run and we are maintaining the Fund’s position.
Polypore was another detractor. The company makes specialized membranes that are used in batteries for electronics, tools and cars. Polypore’s existing business is well established and the company is opportunistically expanding into membranes for electric-car batteries. We believe the electric-car component of the company will one day produce significant revenues and profits as this nascent industry evolves, but it will take time and investment to make that happen. Short-term earnings may suffer as a result, but we are optimistic that the long-term investment will be worthwhile.
OUTLOOK
The extent to which the selloff in biotechnology continues and affects other areas of the market will determine whether it should be viewed as the bursting of a bubble or simply an overdue correction in an overvalued industry. In either scenario, we believe that our bottom-up, fundamental research process will help us identify excellent opportunities in the biotech space at more favorable valuations.
We anticipate that continued tapering of the Federal Reserve’s monthly bond purchases may gradually reduce the distortions of artificially low interest rates and help to broaden investor focus beyond rapidly growing industries such as biotechnology and software. Against the backdrop of an improving economy, the result could be a wider range of investment choices in which equity returns are driven primarily by company fundamentals. We believe such a shift would favor our bottom-up investment approach and present opportunities for the Fund. Adjustments to the Fund discussed here — together with a higher cash position — reflect our desire to be prepared for these developments should they arise.
Thank you for the opportunity to manage your assets.
| Current | and future holdings are subject to risk. |
36
| | |
| WASATCH ULTRA GROWTH FUND (WAMCX) — Portfolio Summary | | MARCH 31, 2014 (UNAUDITED) |
|
|
|
AVERAGE ANNUAL TOTAL RETURNS
| | | | | | | | | | | | | | | | | | | | |
| | | SIX MONTHS* | | 1 YEAR | | 5 YEARS | | 10 YEARS |
Ultra Growth | | | | 12.85% | | | | | 29.38% | | | | | 26.31% | | | | | 5.91% | |
Russell 2000® Growth Index | | | | 8.69% | | | | | 27.19% | | | | | 25.24% | | | | | 8.87% | |
Data shows past performance, which is not indicative of future performance. Current performance may be lower or higher than the performance quoted. To obtain the most recent month-end performance data available, please visit www.WasatchFunds.com. The Advisor may absorb certain Fund expenses, without which total return would have been lower. Investment returns and principal value will fluctuate and shares, when redeemed, may be worth more or less than their original cost.
As of the January 31, 2014 prospectus, the Total Annual Fund Operating Expenses for the Wasatch Ultra Growth Fund are 1.41%. The expense ratio shown elsewhere in this report may be different. Expenses include direct expenses paid to the Advisor as well as indirect expenses incurred by the Fund as a result of its investments in other investment companies (each an “Acquired Fund”), before any expense reimbursements by the Advisor. See the prospectus for additional information regarding Fund expenses.
Wasatch Funds will deduct a 2.00% redemption proceeds fee on Fund shares held 60 days or less. Performance data does not reflect the deduction of fees, including sales charges, or the taxes you would pay on fund distributions or the redemption of fund shares. Fees and taxes, if reflected, would reduce the performance quoted. Wasatch does not charge any sales fees. For more complete information including charges, risks and expenses, read the prospectus carefully.
Investing in small cap funds will be more volatile and loss of principal could be greater than investing in large cap or more diversified funds. Investing in foreign securities, especially in emerging markets, entails special risks, such as currency fluctuations and political uncertainties, which are described in more detail in the prospectus.
TOP 10 EQUITY HOLDINGS**
| | | | |
| Company | | % of Net
Assets | |
Greenspring Global Partners II-B, L.P. | | | 2.4% | |
MakeMyTrip Ltd. (India) | | | 2.4% | |
Yes Bank Ltd. (India) | | | 2.2% | |
Interactive Intelligence Group, Inc. | | | 2.2% | |
Tangoe, Inc. | | | 2.1% | |
| | | | |
| Company | | % of Net
Assets | |
Cognizant Technology Solutions Corp., Class A | | | 2.0% | |
AtriCure, Inc. | | | 2.0% | |
Horizon Pharma, Inc. | | | 2.0% | |
Cardiovascular Systems, Inc. | | | 2.0% | |
FleetMatics Group plc | | | 1.8% | |
| ** | As of March 31, 2014, there were 91 holdings in the Fund. Foreign currency contracts, written options and repurchase agreements, if any, are not included in the number of holdings. Portfolio holdings are subject to change at any time. References to specific securities should not be construed as recommendations by the Funds or their Advisor. Current and future holdings are subject to risk. |
SECTOR BREAKDOWN†
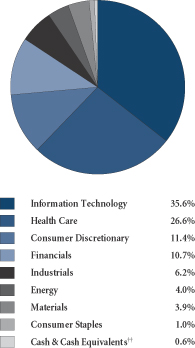
| † | Excludes securities sold short and options written, if any. |
| †† | Also includes Other Assets & Liabilities. |
GROWTHOFA HYPOTHETICAL $10,000 INVESTMENT
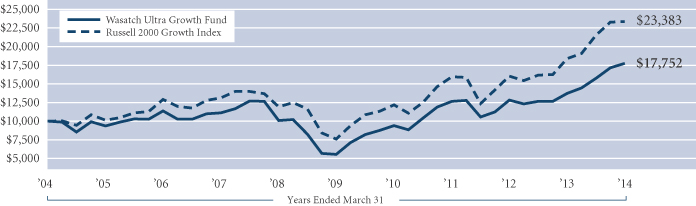
Past performance does not predict future performance. The graph above does not reflect the deduction of fees, sales charges, or taxes that you would pay on fund distributions or the redemption of fund shares. Wasatch does not charge any sales fees. The Russell 2000 Growth Index is an unmanaged total return index that measures the performance of those Russell 2000 Index companies with higher price-to-book ratios and higher forecasted growth values. The Russell 2000 Index is an unmanaged total return index of the smallest 2,000 companies in the Russell 3000 Index, as ranked by total market capitalization. You cannot invest directly in these or any indices.
37
| | |
| WASATCH WORLD INNOVATORS FUND (WAGTX) — Management Discussion | | MARCH 31, 2014 (UNAUDITED) |
|
|
|
The Wasatch World Innovators Fund is managed by a team of Wasatch portfolio managers led by Sam Stewart and Josh Stewart.
| | | | |
Samuel S. Stewart, Jr. PhD, CFA Lead Portfolio Manager | | 
Josh Stewart Portfolio Manager | | OVERVIEW The Wasatch World Innovators Fund returned 0.64% for the quarter ended March 31, 2014. The Fund’s benchmark, the MSCI All Country World Investable Market Index, gained 1.33%. |
Given the volatility in the markets, this short-term underperformance is not very meaningful. Over the longer term, the Fund has outperformed the benchmark.
As portfolio managers, we seek out market inefficiencies —situations in which we perceive that a company’s price tag offers a discount to its true value. We don’t get every investment right, but we think we have a decent batting average, which is reflected in our track record. That said, the stock market is volatile and can misprice a company for weeks, months or even years.
Because the market is so noisy in the short term, we look beyond stock prices to see how our companies are performing on a fundamental basis. The weighted-average sales growth of our companies was 20% this quarter, a slight increase from the 19% recorded last quarter, and well above the 5% or so growth of the average company. As a group, our companies are continuing to reflect their innovator status by rapidly taking market share. Our companies’ weighted-average return on assets and return on equity was 10% and 23%, respectively. These metrics are clear manifestations of outstanding business models. Profitability growth this quarter was strong as well; our companies registered weighted-average EBITDA (earnings before interest, taxes, depreciation and amortization) growth of 16%, just off the 17% pace from last quarter.
In general we’d like to see our companies grow profits faster than sales, and in the long run that’s what a more mature innovator does. The Fund is comprised of both mature innovators and emerging innovators. The latter group tends to include companies early in their life cycles. These emerging innovators tend to prioritize long-term leadership over short-term profits. In some cases, the stock market has a hard time putting the correct price tag on companies investing for the long term, giving active investors like us the chance to buy these businesses at attractive prices.
The best way to understand our investment strategy is to look at the mature innovators we currently own, such as Priceline Group, Amazon.com and Google. All three companies went through phases in which long-term growth and leadership were prioritized over short-term profits. To put it bluntly, these companies lost piles of money at times during their history. But in the long run, they created a great
deal of value. We hope some of our emerging innovators will go on to become leaders that revolutionize their industries and create billions of dollars in shareholder wealth.
DETAILSOFTHE QUARTER
Myriad Genetics was our largest contributor to performance for the first quarter. The company bounced back from overdone concerns regarding a lower reimbursement rate for the company’s breast-cancer test. We took advantage of the strong stock-price increase and sold our position.
Another contributor was Groupe Fnac, a French company that sells a wide range of books, music, consumer electronics, appliances and travel services. The company benefited from dramatic improvement in operating income, net income and free cash flow. With the stock up over 50% in the quarter, we considered it to be less attractively valued and trimmed our position.
On the other side of the ledger, Herbalife was our largest detractor as short seller Bill Ackman continued his efforts to bring the company down. He succeeded in getting the Federal Trade Commission (FTC) to open an inquiry. We added to our Herbalife position on price weakness, as we believe the FTC will not uncover any wrongdoing because Herbalife operates under long-established safe-harbor rules for multilevel-marketing companies.
Abcam, domiciled in the United Kingdom, is a web-based retailer of research antibodies. The company’s stock suffered a meaningful decline and hurt our performance for the quarter. While we were unable to pinpoint the cause, we have sufficient confidence in Abcam and its business model that we added to our position.
OUTLOOK
World stock markets have been in a bull mode for about five years since the depths of the global financial crisis. Valuations, as measured by price-to-earnings (P/E) ratios, are on the high side relative to historical levels for the Fund and the benchmark. This gives us reason to be wary.
In the current bull market, the range of P/E ratios investors are willing to pay seems to have broadened significantly. In many cases, investors are ignoring profits completely and have started to value companies based on sales. Some segments of the market are still valued at close to reasonable prices. Other segments such as biotech, Software-as-a-Service (SaaS) and social networking are likely in bubble territory.
As of this writing, global markets have started to make some adjustments and many extremely expensive stocks have seen sharp price declines. Our game plan, as always, is to use common sense when it comes to the prices we are willing to pay for stocks, and so far most of our holdings have avoided sharp declines.
Thank you for the opportunity to manage your assets.
| Current | and future holdings are subject to risk. |
38
| | |
| WASATCH WORLD INNOVATORS FUND (WAGTX) — Portfolio Summary | | MARCH 31, 2014 (UNAUDITED) |
|
|
|
AVERAGE ANNUAL TOTAL RETURNS
| | | | | | | | | | | | | | | | | | | | |
| | | SIX MONTHS* | | 1 YEAR | | 5 YEARS | | 10 YEARS |
World Innovators | | | | 7.64% | | | | | 24.10% | | | | | 27.24% | | | | | 9.22% | |
MSCI AC World IMI | | | | 8.67% | | | | | 17.11% | | | | | 18.53% | | | | | 7.33% | |
Data shows past performance, which is not indicative of future performance. Current performance may be lower or higher than the performance quoted. To obtain the most recent month-end performance data available, please visit www.WasatchFunds.com. The Advisor may absorb certain Fund expenses, without which total return would have been lower. Investment returns and principal value will fluctuate and shares, when redeemed, may be worth more or less than their original cost.
As of the January 31, 2014 prospectus, the Total Annual Fund Operating Expenses for the Wasatch World Innovators Fund are 1.80%. The expense ratio shown elsewhere in this report may be different. Expenses include direct expenses paid to the Advisor as well as indirect expenses incurred by the Fund as a result of its investments in other investment companies (each an “Acquired Fund”), before any expense reimbursements by the Advisor. See the prospectus for additional information regarding Fund expenses.
Wasatch Funds will deduct a 2.00% redemption proceeds fee on Fund shares held 60 days or less. Performance data does not reflect the deduction of fees, including sales charges, or the taxes you would pay on fund distributions or the redemption of fund shares. Fees and taxes, if reflected, would reduce the performance quoted. Wasatch does not charge any sales fees. For more complete information including charges, risks and expenses, read the prospectus carefully.
Investing in small cap funds will be more volatile and loss of principal could be greater than investing in large cap or more diversified funds. Investing in foreign securities, especially in emerging markets, entails special risks, such as currency fluctuations and political uncertainties, which are described in more detail in the prospectus.
TOP 10 EQUITY HOLDINGS**
| | | | |
| Company | | % of Net
Assets | |
| eBay, Inc. | | | 5.4% | |
| Abcam plc (United Kingdom) | | | 3.3% | |
| Ocwen Financial Corp. | | | 3.2% | |
| Google, Inc., Class A | | | 2.9% | |
| Altisource Portfolio Solutions S.A. | | | 2.8% | |
| | | | |
| Company | | % of Net
Assets | |
| Herbalife Ltd. | | | 2.7% | |
| DiaSorin S.p.A. (Italy) | | | 2.6% | |
| Activision Blizzard, Inc. | | | 2.1% | |
| PetSmart, Inc. | | | 2.1% | |
| IAC/InterActiveCorp | | | 2.0% | |
| ** | As of March 31, 2014, there were 77 holdings in the Fund. Foreign currency contracts, written options and repurchase agreements, if any, are not included in the number of holdings. Portfolio holdings are subject to change at any time. References to specific securities should not be construed as recommendations by the Funds or their Advisor. Current and future holdings are subject to risk. |
SECTOR BREAKDOWN†
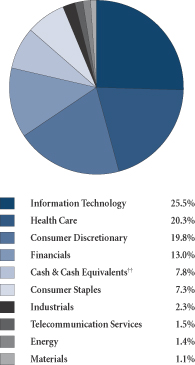
| † | Excludes securities sold short and options written, if any. |
| †† | Also includes Other Assets & Liabilities. |
GROWTHOFA HYPOTHETICAL $10,000 INVESTMENT
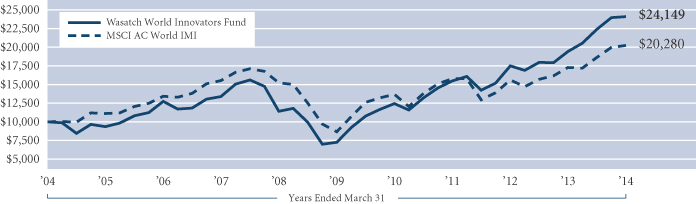
Past performance does not predict future performance. The graph above does not reflect the deduction of fees, sales charges, or taxes that you would pay on fund distributions or the redemption of fund shares. Wasatch does not charge any sales fees. The MSCI AC World IMI (All Country World Investable Market Index) is a free float-adjusted market capitalization weighted index designed to measure the equity market performance of large, mid, and small cap companies across developed and emerging markets throughout the world. You cannot invest directly in this or any index.
39
| | |
| WASATCH-1ST SOURCE INCOME FUND (FMEQX) — Management Discussion | | MARCH 31, 2014 (UNAUDITED) |
|
|
|
| | |

Paul Gifford, CFA Lead Portfolio Manager | | OVERVIEW The Wasatch-1st Source Income Fund returned 1.13% for the quarter ended March 31, 2014 and was up 1.00% for the six-month period. The Fund’s benchmark, the Barclays Capital U.S. Intermediate Government/Credit Bond Index, returned 1.00% for the quarter and 0.98% for the six-month period. U.S. Treasury bond yields were mixed during the quarter. Yields rose on Treasury bonds maturing in two |
and three years, while the 10-year bond yield fell 0.30% to 2.70%. Most of the Fund’s quarterly performance came from the improvement in yields of non-Treasury bonds and price appreciation of the 10-year Treasury. Riskier fixed income securities and assets continued to benefit from the Federal Reserve’s monetary policy of low interest rates.
ECONOMY
Weather matters, at least in the short run. The brutal winter experienced in many parts of the country slowed economic activity at the end of 2013 and into the first quarter of 2014. Indications are that as spring arrives, so will better economic numbers. The housing industry was hit particularly hard by the harsh winter, but recently has shown signs of improving. Housing also continues to benefit from mortgage rates that are still relatively low.
Weather-related news articles highlight winter’s dramatic effects. Delta Airlines cancelled over 8,000 flights in February, and Macy’s closed over 240 stores at least one day during the first quarter of 2014.* The railroad industry saw reduced traffic. UPS and FedEx made fewer deliveries due to bad weather.* Corporate earnings and gross domestic product (GDP) growth were almost certainly lower. However, we expect to see GDP growth improve in the second quarter.
INTEREST RATES
The “tapering” has continued as Janet Yellen replaced Ben Bernanke as head of the Federal Reserve (Fed). Monthly bond purchases have been cut from $85 billion to $55 billion and the bond market has been reasonably calm. Yields on securities with longer maturities remained stable over the past four months since the Fed began reducing its purchases. Yields on Treasury bonds maturing in two to five years have risen modestly. The Fed continues to communicate to and work with the market, as it unwinds the unprecedented financial stimulus deployed in response to the Great Recession (the global recession that began at the end of 2007). Recent challenges include the unemployment rate, which stands at about 6.7%. The Fed said it would begin raising short-term interest rates when unemployment fell to 6.5%. Unfortunately, the improvement has come by way of fewer people looking for work, thus they are no longer considered unemployed, rather than by the strength of the U.S. economy generating new jobs. As former Fed Chair Alan Greenspan would say, it’s a “conundrum.”
The market expects the Fed to end its bond-buying program later this summer and begin raising the federal funds rate in the spring or summer of 2015. If the economy continues to improve, we anticipate that the Fed’s approach will be similar to the one it took in 2004. At the beginning of 2004, with the tech bubble in the rearview mirror, the Fed started to raise interest rates incrementally at 0.25% several times a year. This continued until the end of 2006. Both the bond market and stock market reacted favorably to the conservative and paced adjustment to the federal funds rate.
STRATEGY
The Fund continues to maintain a bias toward holding securities with less interest rate risk but more credit risk. This strategy has been working well. The Fund’s effective duration is 3.33 years versus the benchmark at 3.87 years. The Fund’s overweight to bonds maturing in less than one year is keeping interest rate exposure below that of the benchmark. In terms of corporate bond exposure, the Fund has about 42% versus the benchmark at around 37%. The biggest overweight is in A-rated bonds,** where we have twice as much exposure as the benchmark. Lastly, we continue to slowly reduce the Fund’s exposure to mortgage-backed securities. As of March 31, 2014, the Fund had nearly 22% versus 24% at the end of September. The stable interest rate environment of the past several months has allowed us to modestly reduce the weighting as we have found opportunities.
We are looking closely at the Fund’s maturity structure. Currently, just over half of the Fund’s holdings are in bonds maturing in three to six years, which has allowed us to take advantage of the steepest part of the yield curve. However, those maturities will feel most of the impact as the Fed continues to prod interest rates slightly higher. As mentioned above, the Fund is overweight relative to the benchmark in bonds maturing in less than one year. Our largest underweight is in bonds with maturities of six to 10 years, where the Fund is at 9.9% versus 19.8% for the benchmark. We will continue monitoring the Fund’s maturity structure in order to respond to the Fed’s changes in interest rates.
Savers and fixed-income investors have seen their income drop dramatically over the past several years due to the Fed’s low interest rate strategy. Now, we believe savers and investors will see their current income stabilize and possibly begin to rise.
Thank you for the opportunity to manage your assets.
| * | As of March 31, 2014, the Wasatch-1st Source Income Fund held 0.6% of net assets in United Parcel Service, Inc., and did not hold Delta Air Lines, Inc., Macy’s, Inc. or FedEx Corp. |
| ** | A credit rating is an assessment of the credit worthiness of individuals and corporations. It is based upon the history of borrowing and repayment, as well as the availability of assets and extent of liabilities. Ratings are issued by S&P or Moody’s and typically range from AAA (highest) to D (lowest). The credit quality of the investments in the Fund’s portfolio does not apply to the safety or stability of the Fund. Ratings and portfolio credit quality may change over time. Unrated securities do not necessarily indicate low quality. The Fund itself has not been rated by an independent rating agency. For information on the rating agency’s methodology visit: http://www.standardandpoors.com/home/en/us and http://www.moodys.com. |
40
| | |
| WASATCH-1ST SOURCE INCOME FUND (FMEQX) — Portfolio Summary | | MARCH 31, 2014 (UNAUDITED) |
|
|
|
AVERAGE ANNUAL TOTAL RETURNS
| | | | | | | | | | | | | | | | | | | | |
| | | SIX MONTHS* | | 1 YEAR | | 5 YEARS | | 10 YEARS |
Income | | | | 1.00% | | | | | -0.65% | | | | | 3.12% | | | | | 3.01% | |
Barclays Capital U.S. Intermediate Government/Credit Bond Index | | | | 0.98% | | | | | -0.13% | | | | | 4.18% | | | | | 3.94% | |
Data shows past performance, which is not indicative of future performance. Current performance may be lower or higher than the performance quoted. To obtain the most recent month-end performance data available, please visit www.WasatchFunds.com. The Advisor may absorb certain Fund expenses, without which total return would have been lower. Investment returns and principal value will fluctuate and shares, when redeemed, may be worth more or less than their original cost.
As of the January 31, 2014 prospectus, the Total Annual Fund Operating Expenses for the Wasatch-1st Source Income Fund are 0.73%. The expense ratio shown elsewhere in this report may be different. Expenses include direct expenses paid to the Advisor as well as indirect expenses incurred by the Fund as a result of its investments in other investment companies (each an “Acquired Fund”). See the prospectus for additional information regarding Fund expenses.
Wasatch Funds will deduct a 2.00% redemption proceeds fee on Fund shares held 60 days or less. Performance data does not reflect the deduction of fees, including sales charges, or the taxes you would pay on fund distributions or the redemption of fund shares. Fees and taxes, if reflected, would reduce the performance quoted. Wasatch does not charge any sales fees. For more complete information including charges, risks and expenses, read the prospectus carefully.
Investments in fixed income funds are subject to the same interest rate, inflation, credit and other risks associated with the underlying bonds. Return of principal is not guaranteed.
TOP 10 HOLDINGS**
| | | | | | | | |
| Holding | | Maturity
Date | | | % of Net
Assets | |
| U.S. Treasury Note, 3.250% | | | 12/31/16 | | | | 4.0% | |
| U.S. Treasury Note, 3.625% | | | 8/15/19 | | | | 4.0% | |
| General Electric Capital Corp., MTN, 5.400% | | | 2/15/17 | | | | 2.2% | |
| Federal Home Loan Mortgage Corp., 2.500% | | | 5/27/16 | | | | 1.7% | |
| Federal National Mortgage Assoc., 4.875% | | | 12/15/16 | | | | 1.6% | |
| Federal Home Loan Bank, Series 0000, 1.500% | | | 11/8/22 | | | | 1.6% | |
| | | | | | | | |
| Holding | | Maturity
Date | | | % of Net
Assets | |
| Federal Home Loan Mortgage Corp., MTN, 2.000% | | | 10/22/21 | | | | 1.6% | |
| Federal National Mortgage Assoc., Series AL2525, 3.500% | | | 6/1/32 | | | | 1.5% | |
| Federal National Mortgage Assoc., 2.625% | | | 11/20/14 | | | | 1.4% | |
| Citibank Credit Card Issuance Trust, Series 2007-A8, Class A8, 5.650% | | | 9/20/19 | | | | 1.4% | |
| ** | As of March 31, 2014, there were 149 holdings in the Fund. Repurchase agreements, if any, are not included in the number of holdings. Portfolio holdings are subject to change at any time. References to specific securities should not be construed as recommendations by the Funds or their Advisor. Current and future holdings are subject to risk. |
INVESTMENTS & CASH
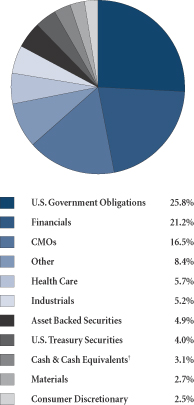
| † | Also includes Other Assets & Liabilities. |
GROWTHOFA HYPOTHETICAL $10,000 INVESTMENT
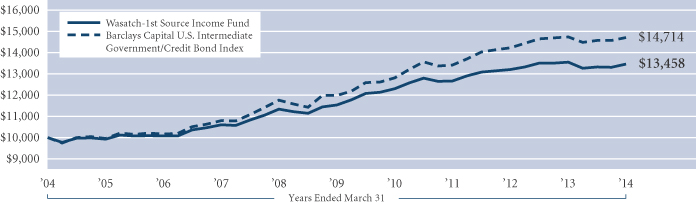
Past performance does not predict future performance. The graph above does not reflect the deduction of fees, sales charges, or taxes that you would pay on fund distributions or the redemption of fund shares. Wasatch does not charge any sales fees. The Barclays Capital U.S. Intermediate Government/Credit Bond Index is an unmanaged index considered representative of the performance of government and corporate bonds with maturities of less than 10 years. You cannot invest directly in this or any index.
41
| | |
| WASATCH-HOISINGTON U.S. TREASURY FUND (WHOSX) — Management Discussion | | MARCH 31, 2014 (UNAUDITED) |
|
|
|
| | |

Van Hoisington Lead Portfolio Manager | | OVERVIEW In the six months ended March 31, 2014, inflation and economic activity slowed. In the 12 months ended February 28th, the core personal consumption expenditures price index, the Fed’s target, fell to 1.0%, one of the slowest changes on record. Retail sales actually declined over the latest three-month interval and core retail sales (total retail sales excluding auto dealers, gas stations and building materials) in February fell below the year earlier level. |
Growth in nonfarm payroll employment in the 12 months ended March 31, 2014 was 1.7%, down from the cyclical peak of 1.9% reached in March 2012. Continuing deterioration in the quality of the jobs created has marked the slowing pace of job expansion. In the latest 12 months, temporary help agencies, retail trade and the hospitality and leisure industries have boosted employment. Average pay for jobs in these areas is well below the national median.
The Wasatch-Hoisington U.S. Treasury Fund returned 4.72% for the six months ended March 31, 2014, compared to a return of 1.70% for the Barclays Capital U.S. Aggregate Bond Index. Over this span, the 30-year Treasury bond yield fell from 3.69% to 3.55%. In the past six months, yields were extremely volatile in the Treasury market, rising in the final quarter of 2013 but falling in the first quarter of 2014. This is a reminder that investors in this Fund should be patient and allow our well established discipline to key on long-term economic fundamentals that we believe will eventually determine the value of the assets held in the Fund.
DETAILSOFTHE QUARTER
For the quarter ended March 31, 2014, the Fund gained 8.99% compared to 1.84% for the Index. The 30-year Treasury bond yield decreased 0.42 of a percentage point during the quarter, more than reversing the 0.28 percentage point gain in the prior quarter.
OUTLOOK
Since the last recession ended in 2009, the Federal Open Market Committee (FOMC) has continuously been overly optimistic regarding its expectations for economic growth in the United States. If its annual forecasts had been realized over the past four years, then at the end of 2013 the U.S. economy should have been approximately $1 trillion, or 6%, larger. A major reason for the FOMC’s overly optimistic forecast for economic growth and its incorrect view of the effectiveness of quantitative easing is reliance on the so-called “wealth effect” (described as a change in consumer wealth which results in a change in consumer spending).
In economics, theoretical propositions must be empirically verifiable. Researchers using numerous statistical procedures examining various sample periods should be able to identify at least some consistent patterns. This is not the case with the wealth effect. In fact, it is difficult to document
any consistent impact. Most of the research points to a spending increase of only one cent per one-dollar rise in wealth at best. Some studies even indicate that the wealth effect is only an interesting theory and cannot be observed in practice. Regardless, whether examining a simple scatter diagram or something far more sophisticated, the wealth effect has a weak and inconsistent relationship to consumer spending. To quote Chris Low, Chief Economist of FTN (FTN Financial, Economic Weekly, March 21, 2014), “There may not be a wealth effect at all. If there is a wealth effect, it is very difficult to pin down …” Since the FOMC began quantitative easing in 2009, there has been an increase of over $3 trillion in assets on the FOMC’s balance sheet. This may have boosted wealth, but the U.S. economy received no meaningful benefit. Furthermore, the FOMC has no idea what the ultimate outcome of such an increase or a return to a “normal” balance sheet will be. Given all of this, we do not see any evidence for economic growth as robust as the FOMC predicts.
Without a wealth effect, the stock market is not the “key player” in the economy and no “virtuous circle” runs through the stock market. We reiterate our view that nominal gross domestic product (GDP) will rise just 3% this year, down from 3.4% in 2013. Such an environment is conducive to lower inflation and lower yields on long-term Treasury bonds.
The inflation rate should continue to move irregularly lower in 2014. M2 growth in the latest 12 months was 5.8%, but velocity should decline by at least 3% and limit nominal GDP to 3%. Such weak top line growth will further diminish inflationary pressures as well as gains in real economic activity. Due to poor growing conditions, the USDA projects food prices may rise 4% this year, compared with only a 1% increase in 2013. Also, energy prices have risen thus far in 2014. These price increases will tend to force funds away from discretionary spending. The latest yearly increase in the core personal consumption expenditures deflator was one of the lowest for the entire series. Such inflation dynamics suggest that the 30-year bond yield should move lower this year, providing the potential to reward patient investors in long-term U.S. Treasury securities such as those held by the Fund.
Thank you for the opportunity to manage your assets.
42
| | |
| WASATCH-HOISINGTON U.S. TREASURY FUND (WHOSX) — Portfolio Summary | | MARCH 31, 2014 (UNAUDITED) |
|
|
|
AVERAGE ANNUAL TOTAL RETURNS
| | | | | | | | | | | | | | | | |
| | | SIX MONTHS* | | | 1 YEAR | | | 5 YEARS | | | 10 YEARS | |
U.S. Treasury | | | 4.72% | | | | -5.60% | | | | 4.37% | | | | 6.87% | |
Barclays Capital U.S. Aggregate Bond Index | | | 1.70% | | | | -0.10% | | | | 4.80% | | | | 4.46% | |
Data shows past performance, which is not indicative of future performance. Current performance may be lower or higher than the performance quoted. To obtain the most recent month-end performance data available, please visit www.WasatchFunds.com. The Advisor may absorb certain Fund expenses, without which total return would have been lower. Investment returns and principal value will fluctuate and shares, when redeemed, may be worth more or less than their original cost.
As of the January 31, 2014 prospectus, the Total Annual Fund Operating Expenses for the Wasatch-Hoisington U.S. Treasury Fund are 0.71%. The expense ratio shown elsewhere in this report may be different. See the prospectus for additional information regarding Fund expenses.
Wasatch Funds will deduct a 2.00% redemption proceeds fee on Fund shares held 60 days or less. Performance data does not reflect the deduction of fees, including sales charges, or the taxes you would pay on fund distributions or the redemption of fund shares. Fees and taxes, if reflected, would reduce the performance quoted. Wasatch does not charge any sales fees. For more complete information including charges, risks and expenses, read the prospectus carefully.
Investments in fixed income funds are subject to the same interest rate, inflation, credit and other risks associated with the underlying bonds. Return of principal is not guaranteed.
TOP 10 HOLDINGS**
| | | | | | | | |
| Holding | | Maturity
Date | | | % of Net
Assets | |
| U.S. Treasury Strip, principal only | | | 2/15/31 | | | | 15.3% | |
| U.S. Treasury Strip, principal only | | | 5/15/30 | | | | 14.7% | |
| U.S. Treasury Bond, 3.125% | | | 11/15/41 | | | | 13.6% | |
| U.S. Treasury Strip, principal only | | | 2/15/37 | | | | 12.7% | |
| U.S. Treasury Bond, 3.750% | | | 11/15/43 | | | | 8.1% | |
| | | | | | | | |
| Holding | | Maturity
Date | | | % of Net
Assets | |
| U.S. Treasury Strip, principal only | | | 5/15/39 | | | | 7.4% | |
| U.S. Treasury Bond, 4.500% | | | 5/15/38 | | | | 6.1% | |
| U.S. Treasury Strip, principal only | | | 5/15/40 | | | | 5.2% | |
| U.S. Treasury Bond, 3.500% | | | 2/15/39 | | | | 5.1% | |
| U.S. Treasury Bond, 3.125% | | | 2/15/42 | | | | 3.9% | |
| ** | As of March 31, 2014, there were 16 holdings in the Fund. Repurchase agreements, if any, are not included in the number of holdings. Portfolio holdings are subject to change at any time. References to specific securities should not be construed as recommendations by the Funds or their Advisor. Current and future holdings are subject to risk. |
INVESTMENTS & CASH
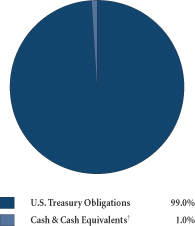
| † | Also includes Other Assets & Liabilities. |
GROWTHOFA HYPOTHETICAL $10,000 INVESTMENT
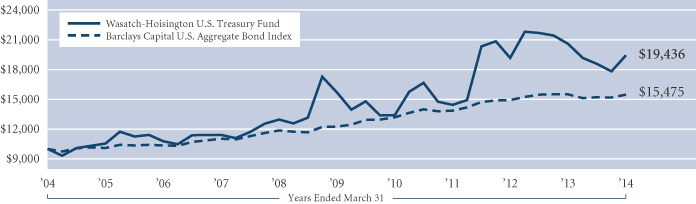
Past performance does not predict future performance. The graph above does not reflect the deduction of fees, sales charges, or taxes that you would pay on fund distributions or the redemption of fund shares. Wasatch does not charge any sales fees. The Barclays Capital U.S. Aggregate Bond Index covers the U.S. investment grade fixed rate bond market, including government and corporate securities, agency mortgage pass-through securities, and asset-backed securities. You cannot invest directly in this or any index.
43
| | | | |
| WASATCH FUNDS MANAGEMENT DISCUSSIONS — Definitions of Financial Terms | | |
|
|
|
Beta is a quantitative measure of the volatility of a given stock relative to the overall market. A beta above one is more volatile than the overall market, while a beta below one is less volatile.
Someone who is “bullish” or “a bull” is optimistic with regard to the stock market’s prospects.
A bull market is defined as a prolonged period in which investment prices rise faster than their historical average. Bull markets can happen as the result of an economic recovery, an economic boom, or investor psychology.
The word “chaebol” means “business family” or “monopoly” in Korean. The chaebol structure can encompass a single large company or several groups of companies. Each chaebol is owned, controlled or managed by the same family dynasty, generally that of the group’s founder.
The “cloud” is the Internet. Cloud-computing is a model for delivering information technology services in which resources are retrieved from the Internet through web-based tools and applications, rather than from a direct connection to a server.
The CNX Nifty, also called the Nifty 50 or simply the Nifty, is the National Stock Exchange of India’s benchmark index for the Indian equity market.
A corporate bond is a debt security issued by a corporation for the purpose of raising money to expand its business.
Correlation, in the financial world, is a statistical measure of how asset classes, securities, markets, or countries move in relation to each other.
Dividend yield is a company’s annual dividend payments divided by its market capitalization, or the dividend per share divided by the price per share. For example, a company whose stock sells for $30 per share that pays an annual dividend of $3 per share has a dividend yield of 10%.
Earnings growth is a measure of growth in a company’s net income over a specific period, often one year.
Earnings-per-share or EPS is the portion of a company’s profit allocated to each outstanding share of common stock. EPS growth rates help investors identify companies that are increasing or decreasing in profitability.
EBIT ROA is earnings before interest and taxes, divided by assets adjusted for cash and goodwill.
Effective duration is a measure of the responsiveness of a bond’s price to market interest rate changes. For example, if the interest rate increased 1%, a bond with an effective duration of five years would experience a decline in price of 5%.
The federal funds rate is the interest rate at which private depository institutions (mostly banks) lend balances (federal funds) at the Federal Reserve to other depository institutions, usually overnight. It is the interest rate banks charge each other for loans.
The Federal Open Market Committee (FOMC), a component of the Federal Reserve System, is charged under United States law with overseeing the nation’s open market operations. Open market operations are the means of implementing monetary policy by which a central bank controls the short term interest rate and the supply of base money in an economy, and thus indirectly the total money supply.
The Great Recession was the steep decline in economic activity during the late 2000s, which is generally considered
the largest downturn since the Great Depression. The term “Great Recession” applies to the U.S. recession, which officially lasted from December 2007 to June 2009, and the ensuing global recession in 2009. The economic slump began when the bubble in the U.S. housing market burst and large amounts of mortgage-backed securities and derivatives lost significant value.
Gross domestic product (GDP) is a basic measure of a country’s economic performance and is the market value of all final goods and services made within the borders of a country in a year.
An initial public offering (IPO) is a company’s first sale of stock to the public.
M2 money supply consists of currency and checking accounts, consumer-type time and savings accounts and equivalent near monies, while M3 money supply consists of M2 plus business-type time deposits and less liquid near monies. Both M2 and M3 exclude monies and near monies owned by the Treasury, depository institutions and foreign banks and official institutions and IRA and Keogh balances owned by consumers.
Mortgage-backed securities are debt issues backed by a pool of mortgages. Investors receive payments from the interest and principal payments made on the underlying mortgages.
The MSCI AC World Ex-U.S.A. Small Cap Index is an unmanaged index and includes reinvestment of all dividends of issuers located in countries throughout the world representing developed and emerging markets, excluding securities of U.S. issuers. This index is a free float-adjusted market capitalization index designed to measure the performance of small capitalization securities. You cannot invest in this or any index.
The MSCI U.S. Small Cap Index represents the universe of small capitalization companies in the U.S. equity market. You cannot invest in this or any index.
Operating margin equals operating income divided by revenues, expressed as a percentage.
The Personal Consumption Expenditure (PCE) price index, also referred to as the PCE deflator, is a United States-wide indicator of the average increase in prices for all domestic personal consumption using a variety of data including U.S. Consumer Price Index and Producer Price Index prices. It is derived from personal consumption expenditures, the largest component of Gross Domestic Product in the National Income and Product Accounts of the Bureau of Economic Analysis (BEA). The less volatile measure of the PCE price index is the core PCE price index, which excludes the more volatile and seasonal food and energy prices.
The price-to-book ratio is used to compare a company’s book value to its current market price.
The price-to-earnings (P/E) multiple, also known as the P/E ratio, is the price of a stock divided by its earnings per share.
Quantitative easing is a government monetary policy used to increase the money supply by buying government securities or other securities from the market. Quantitative easing increases the money supply by flooding financial institutions with capital in an effort to promote increased lending and liquidity.
44
| | |
| | MARCH 31, 2014 (UNAUDITED) |
|
|
|
Return on assets (ROA) measures a company’s profitability by showing how many dollars of earnings a company derives from each dollar of assets it controls.
Return on capital is a measure of how effectively a company uses the money, owned or borrowed, that has been invested in its operations.
Return on equity (ROE) measures a company’s efficiency at generating profits from shareholders’ equity.
“Risk-on” is when investors are seeking the potentially higher returns of riskier assets and put money back in the market willing to risk the money, thus risk on.
The S&P Bombay Stock Exchange Sensitive Index (S&P BSE SENSEX or simply the SENSEX) is a free-float market capitalization-weighted stock market index of 30 well-established and financially sound companies listed on BSE (Bombay Stock Exchange) Ltd. The 30 component companies, which are some of the largest and most actively traded stocks, are representative of various industrial sectors of the Indian economy.
The S&P 500 Index includes 500 of the United States’ largest stocks from a broad variety of industries. The Index is unmanaged but is a commonly used measure of common stock total return performance.
Valuation is the process of determining the current worth of an asset or company.
The velocity of money (V) is defined as the rate at which money circulates, changes hands or turns over in an economy.
The yield curve is a line on a graph that plots the interest rates, at a set point in time, of bonds having equal credit quality, but differing maturity dates. The most frequently reported yield curve compares three-month, two-year, five-year and 30-year U.S. Treasury securities. This yield curve is used as a benchmark for other interest rates, such as mortgage rates or bank lending rates. The curve is also used to predict changes in economic output and growth.
45
| | |
| WASATCH FUNDS — OPERATING EXPENSES (UNAUDITED) | | |
|
|
|
EXPENSE EXAMPLE
As a shareholder of Wasatch Funds, you incur two types of costs: (1) transaction costs, including redemption fees and (2) ongoing costs, including management fees and other fund expenses. This example is intended to help you understand your ongoing costs (in dollars) of investing in a Wasatch Fund and to compare these costs with the ongoing costs of investing in other mutual funds.
The example is based on an investment of $1,000.00 invested at the beginning of the period and held for the entire six month period ended March 31, 2014.
ACTUAL EXPENSES
The first line of the table below provides information about actual account values and actual expenses, based upon the actual total return of the fund during the most recent six month period ended March 31, 2014. You may use the information in this line, together with the amount you invested, to estimate the expenses you paid over the period. Simply divide your account value by $1,000.00 (for example, an $8,600.00 account value divided by $1,000.00 = 8.6), then multiply the result by the number in the first line under the heading entitled “Expenses Paid During Period” to estimate the expenses you paid on your account during this period.
In addition, the Funds charge a $15.00 IRA distribution fee, a $12.50 IRA annual maintenance fee and a $15.00 fee for redemptions paid by wire. To the extent these fees apply to your account, your expenses paid during the period would be higher and your ending account value would be lower than the amounts shown in the table below.
HYPOTHETICAL EXAMPLEFOR COMPARISON PURPOSES
The second line of the table below provides information about hypothetical account values and hypothetical expenses
based on a fund’s actual expense ratio and an assumed rate of return of 5% per year before expenses, which is not the fund’s actual return. The hypothetical account values and expenses may not be used to estimate the actual ending account balance or expenses you paid for the period. You may use this information to compare the ongoing costs of investing in a Wasatch Fund and other funds. To do so, compare this 5% hypothetical example with the 5% hypothetical examples that appear in the shareholder reports of other funds.
In addition, the Funds charge a $15.00 IRA distribution fee, a $12.50 IRA annual maintenance fee and a $15.00 fee for redemptions paid by wire. To the extent these fees apply to your account, your expenses paid during the period would be higher and your ending account value would be lower than the amounts shown in the table below. If another fund’s fees differ from those listed above, your expenses paid and your ending account value could be higher or lower than those of other funds.
Please note that the expenses shown in the table are meant to highlight your ongoing costs only and do not reflect any transactional costs, such as redemption fees. Therefore, the second line of the table is useful in comparing ongoing costs only, and will not help you determine the relative total costs of owning different funds. In addition, if these transactional costs were included, your costs would have been higher.
A Fund’s annualized expense ratio may vary as a result of various factors including expenses that are not reimbursable under the contractual agreement between the Fund and the Advisor such as interest, taxes, brokerage commissions, other investment related costs, dividend expense on short sales, and extraordinary expenses. The Long/Short Fund — Investor Class and the Income Fund have no contractual limitation on expenses.
46
| | |
| | MARCH 31, 2014 (UNAUDITED) |
|
|
|
| | | | | | | | | | | | | | | | |
| | | Account Value | | | Expenses
Paid
During Period* | | | Annualized
Expense
Ratio* | |
| Fund/Class and Return | | Beginning of Period
October 1, 2013 | | | End of Period
March 31, 2014 | | | |
Core Growth Fund — Investor Class | | | | | | | | | | | | | | | | |
Actual | | | $1,000.00 | | | | $1,057.10 | | | | $6.05 | | | | 1.18% | |
Hypothetical (5% before expenses) | | | $1,000.00 | | | | $1,019.05 | | | | $5.94 | | | | 1.18% | |
Core Growth Fund — Institutional Class | | | | | | | | | | | | | | | | |
Actual | | | $1,000.00 | | | | $1,057.40 | | | | $5.74 | | | | 1.12% | |
Hypothetical (5% before expenses) | | | $1,000.00 | | | | $1,019.35 | | | | $5.64 | | | | 1.12% | |
Emerging India Fund | | | | | | | | | | | | | | | | |
Actual | | | $1,000.00 | | | | $1,224.70 | | | | $10.82 | | | | 1.95% | |
Hypothetical (5% before expenses) | | | $1,000.00 | | | | $1,015.21 | | | | $9.80 | | | | 1.95% | |
Emerging Markets Select Fund — Investor Class | | | | | | | | | | | | | | | | |
Actual | | | $1,000.00 | | | | $1,031.00 | | | | $8.56 | | | | 1.69% | |
Hypothetical (5% before expenses) | | | $1,000.00 | | | | $1,016.50 | | | | $8.50 | | | | 1.69% | |
Emerging Markets Select Fund — Institutional Class | | | | | | | | | | | | | | | | |
Actual | | | $1,000.00 | | | | $1,033.40 | | | | $7.60 | | | | 1.50% | |
Hypothetical (5% before expenses) | | | $1,000.00 | | | | $1,017.45 | | | | $7.54 | | | | 1.50% | |
Emerging Markets Small Cap Fund | | | | | | | | | | | | | | | | |
Actual | | | $1,000.00 | | | | $983.90 | | | | $9.65 | | | | 1.95% | |
Hypothetical (5% before expenses) | | | $1,000.00 | | | | $1,015.21 | | | | $9.80 | | | | 1.95% | |
Frontier Emerging Small Countries Fund | | | | | | | | | | | | | | | | |
Actual | | | $1,000.00 | | | | $1,069.20 | | | | $11.45 | | | | 2.22% | |
Hypothetical (5% before expenses) | | | $1,000.00 | | | | $1,013.86 | | | | $11.15 | | | | 2.22% | |
Global Opportunities Fund | | | | | | | | | | | | | | | | |
Actual | | | $1,000.00 | | | | $1,039.40 | | | | $8.95 | | | | 1.76% | |
Hypothetical (5% before expenses) | | | $1,000.00 | | | | $1,016.16 | | | | $8.85 | | | | 1.76% | |
Heritage Growth Fund | | | | | | | | | | | | | | | | |
Actual | | | $1,000.00 | | | | $1,116.00 | | | | $5.01 | | | | 0.95% | |
Hypothetical (5% before expenses) | | | $1,000.00 | | | | $1,020.19 | | | | $4.78 | | | | 0.95% | |
International Growth Fund | | | | | | | | | | | | | | | | |
Actual | | | $1,000.00 | | | | $1,017.40 | | | | $7.24 | | | | 1.44% | |
Hypothetical (5% before expenses) | | | $1,000.00 | | | | $1,017.75 | | | | $7.24 | | | | 1.44% | |
International Opportunities Fund | | | | | | | | | | | | | | | | |
Actual | | | $1,000.00 | | | | $1,072.00 | | | | $11.62 | | | | 2.25% | |
Hypothetical (5% before expenses) | | | $1,000.00 | | | | $1,013.71 | | | | $11.30 | | | | 2.25% | |
Large Cap Value Fund — Investor Class | | | | | | | | | | | | | | | | |
Actual | | | $1,000.00 | | | | $1,083.90 | | | | $5.82 | | | | 1.12% | ** |
Hypothetical (5% before expenses) | | | $1,000.00 | | | | $1,019.35 | | | | $5.64 | | | | 1.12% | ** |
Large Cap Value Fund — Institutional Class | | | | | | | | | | | | | | | | |
Actual | | | $1,000.00 | | | | $1,083.90 | | | | $5.09 | | | | 0.98% | |
Hypothetical (5% before expenses) | | | $1,000.00 | | | | $1,020.04 | | | | $4.94 | | | | 0.98% | |
Long/Short Fund — Investor Class | | | | | | | | | | | | | | | | |
Actual | | | $1,000.00 | | | | $1,054.00 | | | | $7.99 | | | | 1.56% | |
Hypothetical (5% before expenses) | | | $1,000.00 | | | | $1,017.15 | | | | $7.85 | | | | 1.56% | |
Long/Short Fund — Institutional Class | | | | | | | | | | | | | | | | |
Actual | | | $1,000.00 | | | | $1,054.00 | | | | $7.48 | | | | 1.46% | |
Hypothetical (5% before expenses) | | | $1,000.00 | | | | $1,017.65 | | | | $7.34 | | | | 1.46% | |
Micro Cap Fund | | | | | | | | | | | | | | | | |
Actual | | | $1,000.00 | | | | $1,088.90 | | | | $10.57 | | | | 2.03% | |
Hypothetical (5% before expenses) | | | $1,000.00 | | | | $1,014.81 | | | | $10.20 | | | | 2.03% | |
Micro Cap Value Fund | | | | | | | | | | | | | | | | |
Actual | | | $1,000.00 | | | | $1,111.20 | | | | $11.11 | | | | 2.11% | |
Hypothetical (5% before expenses) | | | $1,000.00 | | | | $1,014.41 | | | | $10.60 | | | | 2.11% | |
Small Cap Growth Fund | | | | | | | | | | | | | | | | |
Actual | | | $1,000.00 | | | | $1,064.80 | | | | $6.18 | | | | 1.20% | |
Hypothetical (5% before expenses) | | | $1,000.00 | | | | $1,018.95 | | | | $6.04 | | | | 1.20% | |
47
| | |
| WASATCH FUNDS — OPERATING EXPENSES (continued) | | MARCH 31, 2014 (UNAUDITED) |
|
|
|
| | | | | | | | | | | | | | | | |
| | | Account Value | | | Expenses
Paid
During Period* | | | Annualized
Expense
Ratio* | |
| Fund/Class and Return | | Beginning of Period
October 1, 2013 | | | End of Period
March 31, 2014 | | | |
Small Cap Value Fund — Investor Class | | | | | | | | | | | | | | | | |
Actual | | | $1,000.00 | | | | $1,134.80 | | | | $6.39 | | | | 1.20% | |
Hypothetical (5% before expenses) | | | $1,000.00 | | | | $1,018.95 | | | | $6.04 | | | | 1.20% | |
Small Cap Value Fund — Institutional Class | | | | | | | | | | | | | | | | |
Actual | | | $1,000.00 | | | | $1,136.20 | | | | $6.12 | | | | 1.15% | |
Hypothetical (5% before expenses) | | | $1,000.00 | | | | $1,019.20 | | | | $5.79 | | | | 1.15% | |
Strategic Income Fund | | | | | | | | | | | | | | | | |
Actual | | | $1,000.00 | | | | $1,123.50 | | | | $5.03 | | | | 0.95% | |
Hypothetical (5% before expenses) | | | $1,000.00 | | | | $1,020.19 | | | | $4.78 | | | | 0.95% | |
Ultra Growth Fund | | | | | | | | | | | | | | | | |
Actual | | | $1,000.00 | | | | $1,128.50 | | | | $6.53 | | | | 1.23% | |
Hypothetical (5% before expenses) | | | $1,000.00 | | | | $1,018.80 | | | | $6.19 | | | | 1.23% | |
World Innovators Fund | | | | | | | | | | | | | | | | |
Actual | | | $1,000.00 | | | | $1,076.40 | | | | $8.85 | | | | 1.71% | |
Hypothetical (5% before expenses) | | | $1,000.00 | | | | $1,016.40 | | | | $8.60 | | | | 1.71% | |
Income Fund | | | | | | | | | | | | | | | | |
Actual | | | $1,000.00 | | | | $1,010.00 | | | | $3.51 | | | | 0.70% | |
Hypothetical (5% before expenses) | | | $1,000.00 | | | | $1,021.44 | | | | $3.53 | | | | 0.70% | |
U.S. Treasury Fund | | | | | | | | | | | | | | | | |
Actual | | | $1,000.00 | | | | $1,047.20 | | | | $3.67 | | | | 0.72% | |
Hypothetical (5% before expenses) | | | $1,000.00 | | | | $1,021.34 | | | | $3.63 | | | | 0.72% | |
*Expenses are equal to a fund’s annualized expense ratio as indicated above multiplied by the average account value over the period, multiplied by the number of days in the most recent fiscal half-year divided by the number of days in the full fiscal year (182/365).
**Includes extraordinary expenses of 0.02% (see Note 8).
48
| | |
| WASATCH CORE GROWTH FUND (WGROX / WIGRX) — Schedule of Investments | | MARCH 31, 2014 (UNAUDITED) |
|
|
|
| | | | | | | | |
| Shares | | | | | Value | |
| | | | | | | |
| | | | COMMON STOCKS 95.6% | | | | |
| | |
| | | | Airlines 5.0% | | | | |
| | 247,674 | | | Allegiant Travel Co. | | $ | 27,722,151 | |
| | 373,086 | | | Spirit Airlines, Inc.* | | | 22,161,308 | |
| | | | | | | | |
| | | | | | | 49,883,459 | |
| | | | | | | | |
| | | | Airport Services 1.1% | | | | |
| | 493,750 | | | Wesco Aircraft Holdings, Inc.* | | | 10,867,438 | |
| | | | | | | | |
| | | | Apparel Retail 1.4% | | | | |
| | 841,429 | | | Chico’s FAS, Inc. | | | 13,488,107 | |
| | | | | | | | |
| | | | Application Software 4.9% | | | | |
| | 215,701 | | | ANSYS, Inc.* | | | 16,613,291 | |
| | 416,730 | | | RealPage, Inc.* | | | 7,567,817 | |
| | 153,392 | | | Tyler Technologies, Inc.* | | | 12,835,842 | |
| | 87,603 | | | Ultimate Software Group, Inc.* | | | 12,001,611 | |
| | | | | | | | |
| | | | | | | 49,018,561 | |
| | | | | | | | |
| | | | Asset Management & Custody
Banks 2.8% | | | | |
| | 40,230 | | | Affiliated Managers Group, Inc.* | | | 8,048,011 | |
| | 597,285 | | | SEI Investments Co. | | | 20,074,749 | |
| | | | | | | | |
| | | | | | | 28,122,760 | |
| | | | | | | | |
| | | | Automotive Retail 1.0% | | | | |
| | 176,353 | | | Monro Muffler Brake, Inc. | | | 10,030,959 | |
| | | | | | | | |
| | | | Commercial Printing 1.0% | | | | |
| | 1,328,257 | | | InnerWorkings, Inc.* | | | 10,174,449 | |
| | | | | | | | |
| | | | Communications Equipment 0.3% | | | | |
| | 55,219 | | | Ubiquiti Networks, Inc.* | | | 2,510,808 | |
| | | | | | | | |
| | | | Consumer Finance 7.0% | | | | |
| | 164,316 | | | Credit Acceptance Corp.* | | | 23,357,519 | |
| | 812,136 | | | DFC Global Corp.* | | | 7,171,161 | |
| | 192,168 | | | First Cash Financial Services, Inc.* | | | 9,696,797 | |
| | 2,395,200 | | | Mahindra & Mahindra Financial Services Ltd. (India) | | | 10,154,710 | |
| | 322,036 | | | Portfolio Recovery Associates, Inc.* | | | 18,633,003 | |
| | | | | | | | |
| | | | | | | 69,013,190 | |
| | | | | | | | |
| | | | Data Processing & Outsourced Services 5.7% | | | | |
| | 98,435 | | | Alliance Data Systems Corp.* | | | 26,818,616 | |
| | 351,631 | | | ExlService Holdings, Inc.* | | | 10,868,914 | |
| | 660,150 | | | Higher One Holdings, Inc.* | | | 4,772,885 | |
| | 157,008 | | | Syntel, Inc.* | | | 14,115,019 | |
| | | | | | | | |
| | | | | | | 56,575,434 | |
| | | | | | | | |
| | | | Distributors 1.5% | | | | |
| | 239,077 | | | Pool Corp. | | | 14,660,202 | |
| | | | | | | | |
| | | | Diversified Banks 2.8% | | | | |
| | 10,926,782 | | | City Union Bank Ltd. (India) | | | 9,824,910 | |
| | 2,505,720 | | | Yes Bank Ltd. (India) | | | 17,432,738 | |
| | | | | | | | |
| | | | | | | 27,257,648 | |
| | | | | | | | |
| | | | Diversified Support Services 6.0% | | | | |
| | 1,636,919 | | | Copart, Inc.* | | | 59,567,482 | |
| | | | | | | | |
| | | | Electrical Components &
Equipment 3.1% | | | | |
| | 199,459 | | | Generac Holdings, Inc. | | | 11,762,097 | |
| | 559,414 | | | Polypore International, Inc.* | | | 19,137,553 | |
| | | | | | | | |
| | | | | | | 30,899,650 | |
| | | | | | | | |
| | | | Environmental & Facilities
Services 3.8% | | | | |
| | 364,490 | | | Tetra Tech, Inc.* | | | 10,785,259 | |
| | 608,499 | | | Waste Connections, Inc. | | | 26,688,766 | |
| | | | | | | | |
| | | | | | | 37,474,025 | |
| | | | | | | | |
| | | | | | | | |
| Shares | | | | | Value | |
| | | | | | | |
| | | | General Merchandise Stores 0.1% | | | | |
| | 218,125 | | | Gordmans Stores, Inc. | | $ | 1,190,963 | |
| | | | | | | | |
| | | | Health Care Facilities 2.4% | | | | |
| | 539,076 | | | Ensign Group, Inc. (The) | | | 23,525,277 | |
| | | | | | | | |
| | | | Health Care Services 4.5% | | | | |
| | 257,292 | | | IPC The Hospitalist Co., Inc.* | | | 12,627,891 | |
| | 517,700 | | | MEDNAX, Inc.* | | | 32,087,046 | |
| | | | | | | | |
| | | | | | | 44,714,937 | |
| | | | | | | | |
| | | | Homebuilding 0.3% | | | | |
| | 212,779 | | | Installed Building Products, Inc.* | | | 2,968,267 | |
| | | | | | | | |
| | | | Homefurnishing Retail 0.8% | | | | |
| | 166,153 | | | Mattress Firm Holding Corp.* | | | 7,947,098 | |
| | | | | | | | |
| | | | Human Resource & Employment Services 0.9% | | | | |
| | 125,284 | | | 51job, Inc. ADR* (China) | | | 8,926,485 | |
| | | | | | | | |
| | | | Industrial Machinery 4.0% | | | | |
| | 131,866 | | | Graco, Inc. | | | 9,855,665 | |
| | 408,555 | | | IDEX Corp. | | | 29,779,574 | |
| | | | | | | | |
| | | | | | | 39,635,239 | |
| | | | | | | | |
| | | | Internet Retail 0.6% | | | | |
| | 155,634 | | | Blue Nile, Inc.* | | | 5,416,063 | |
| | | | | | | | |
| | | | Internet Software & Services 3.7% | | | | |
| | 247,566 | | | Dealertrack Technologies, Inc.* | | | 12,177,771 | |
| | 71,531 | | | Envestnet, Inc.* | | | 2,874,116 | |
| | 448,282 | | | Vistaprint N.V.* | | | 22,064,440 | |
| | | | | | | | |
| | | | | | | 37,116,327 | |
| | | | | | | | |
| | | | Leisure Facilities 3.6% | | | | |
| | 748,218 | | | Life Time Fitness, Inc.* | | | 35,989,286 | |
| | | | | | | | |
| | | | Life Sciences Tools & Services 3.5% | | | | |
| | 573,500 | | | Divi’s Laboratories Ltd. (India) | | | 13,099,106 | |
| | 358,224 | | | ICON plc* (Ireland) | | | 17,033,551 | |
| | 56,412 | | | Techne Corp. | | | 4,815,892 | |
| | | | | | | | |
| | | | | | | 34,948,549 | |
| | | | | | | | |
| | | | Oil & Gas Equipment &
Services 3.9% | | | | |
| | 114,241 | | | CARBO Ceramics, Inc. | | | 15,764,116 | |
| | 117,555 | | | Dril-Quip, Inc.* | | | 13,177,915 | |
| | 298,022 | | | TGS-NOPEC Geophysical Co. ASA (Norway) | | | 9,765,586 | |
| | | | | | | | |
| | | | | | | 38,707,617 | |
| | | | | | | | |
| | | | Oil & Gas Refining &
Marketing 1.3% | | | | |
| | 291,271 | | | World Fuel Services Corp. | | | 12,845,051 | |
| | | | | | | | |
| | | | Personal Products 3.5% | | | | |
| | 259,158 | | | Herbalife Ltd. | | | 14,841,979 | |
| | 240,557 | | | Nu Skin Enterprises, Inc., Class A | | | 19,930,147 | |
| | | | | | | | |
| | | | | | | 34,772,126 | |
| | | | | | | | |
| | | | Research & Consulting
Services 2.6% | | | | |
| | 640,833 | | | Acacia Research Corp. | | | 9,791,928 | |
| | 208,513 | | | Corporate Executive Board Co. (The) | | | 15,477,920 | |
| | | | | | | | |
| | | | | | | 25,269,848 | |
| | | | | | | | |
| | | | Semiconductors 2.2% | | | | |
| | 387,065 | | | Melexis N.V. (Belgium) | | | 14,977,522 | |
| | 108,525 | | | Power Integrations, Inc. | | | 7,138,774 | |
| | | | | | | | |
| | | | | | | 22,116,296 | |
| | | | | | | | |
| | | | Specialized Finance 0.8% | | | | |
| | 402,640 | | | CRISIL Ltd. (India) | | | 8,258,763 | |
| | | | | | | | |
| | | | Specialty Chemicals 1.2% | | | | |
| | 230,755 | | | Balchem Corp. | | | 12,026,951 | |
| | | | | | | | |
49
| | |
| WASATCH CORE GROWTH FUND (WGROX / WIGRX) — Schedule of Investments (continued) | | MARCH 31, 2014 (UNAUDITED) |
|
|
|
| | | | | | | | |
| Shares | | | | | Value | |
| | | | | | | |
| | | | Specialty Stores 0.8% | | | | |
| | 156,551 | | | Hibbett Sports, Inc.* | | $ | 8,278,417 | |
| | | | | | | | |
| | | | Systems Software 1.1% | | | | |
| | 550,841 | | | Infoblox, Inc.* | | | 11,049,870 | |
| | | | | | | | |
| | | | Technology Hardware, Storage & Peripherals 0.4% | | | | |
| | 365,194 | | | Fusion-io, Inc.* | | | 3,841,841 | |
| | | | | | | | |
| | | | Trading Companies &
Distributors 2.9% | | | | |
| | 280,043 | | | MSC Industrial Direct Co., Inc., Class A | | | 24,229,320 | |
| | 143,605 | | | Rush Enterprises, Inc., Class B* | | | 4,052,533 | |
| | | | | | | | |
| | | | | | | 28,281,853 | |
| | | | | | | | |
| | | | Trucking 3.1% | | | | |
| | 600,940 | | | Knight Transportation, Inc. | | | 13,899,742 | |
| | 302,485 | | | Old Dominion Freight Line, Inc.* | | | 17,162,999 | |
| | | | | | | | |
| | | | | | | 31,062,741 | |
| | | | | | | | |
| | |
| | | | Total Common Stocks (cost $602,902,162) | | | 948,434,037 | |
| | | | | | | | |
| | |
Principal
Amount | | | | | Value | |
| | | | SHORT-TERM INVESTMENTS 4.5% | | | | |
| | |
| | | | Repurchase Agreement 4.5% | | | | |
| | $44,622,484 | | | Repurchase Agreement dated 3/31/14, 0.00% due 4/1/14 with State Street Bank and Trust Co. collateralized by $46,425,000 of United States Treasury Notes 2.000% due 2/28/21; value: $45,516,695; repurchase proceeds: $44,622,484 (cost $44,622,484) | | $ | 44,622,484 | |
| | | | | | | | |
| | |
| | | | Total Short-Term Investments (cost $44,622,484) | | | 44,622,484 | |
| | | | | | | | |
| | |
| | | | Total Investments
(cost $647,524,646) 100.1% | | | 993,056,521 | |
| | |
| | | | Liabilities less Other Assets (0.1%) | | | (736,540 | ) |
| | | | | | | | |
| | |
| | | | NET ASSETS 100.0% | | $ | 992,319,981 | |
| | | | | | | | |
| |
| | | | *Non-income producing. ADR American Depositary Receipt. See Notes to Financial Statements. | |
At March 31, 2014, Wasatch Core Growth Fund’s investments, excluding short-term investments, were in the following countries:
| | | | |
| Country | | % | |
Belgium | | | 1.6 | |
China | | | 0.9 | |
India | | | 6.2 | |
Ireland | | | 1.8 | |
Norway | | | 1.0 | |
United States | | | 88.5 | |
| | | | |
TOTAL | | | 100.0 | % |
| | | | |
50
| | |
| WASATCH EMERGING INDIA FUND (WAINX) — Schedule of Investments | | MARCH 31, 2014 (UNAUDITED) |
|
|
|
| | | | | | | | |
| Shares | | | | | Value | |
| | | | | | | |
| | | | COMMON STOCKS 95.5% | | | | |
| | |
| | | | Air Freight & Logistics 1.8% | | | | |
| | 5,644 | | | Blue Dart Express Ltd. (India) | | $ | 357,139 | |
| | | | | | | | |
| | | | Apparel, Accessories & Luxury
Goods 4.5% | | | | |
| | 4,016 | | | Page Industries Ltd. (India) | | | 434,167 | |
| | 34,706 | | | Titan Co. Ltd. (India) | | | 152,486 | |
| | 29,991 | | | Vaibhav Global Ltd.* (India) | | | 323,926 | |
| | | | | | | | |
| | | | | | | 910,579 | |
| | | | | | | | |
| | | | Auto Parts & Equipment 3.2% | | | | |
| | 1,683 | | | Bosch Ltd. (India) | | | 301,529 | |
| | 10,029 | | | WABCO India Ltd. (India) | | | 337,533 | |
| | | | | | | | |
| | | | | | | 639,062 | |
| | | | | | | | |
| | | | Biotechnology 1.6% | | | | |
| | 45,847 | | | Biocon Ltd. (India) | | | 324,723 | |
| | | | | | | | |
| | | | Building Products 2.0% | | | | |
| | 68,013 | | | Kajaria Ceramics Ltd. (India) | | | 400,864 | |
| | | | | | | | |
| | | | Commodity Chemicals 3.9% | | | | |
| | 84,555 | | | Berger Paints India Ltd. (India) | | | 324,147 | |
| | 23,188 | | | Castrol India Ltd. (India) | | | 120,556 | |
| | 40,567 | | | Supreme Industries Ltd. (India) | | | 339,697 | |
| | | | | | | | |
| | | | | | | 784,400 | |
| | | | | | | | |
| | | | Construction Machinery & Heavy Trucks 2.5% | | | | |
| | 5,069 | | | Eicher Motors Ltd. (India) | | | 503,738 | |
| | | | | | | | |
| | | | Consumer Finance 4.1% | | | | |
| | 130,521 | | | Mahindra & Mahindra Financial Services Ltd. (India) | | | 553,358 | |
| | 14,519 | | | Shriram City Union Finance Ltd. (India) | | | 267,431 | |
| | | | | | | | |
| | | | | | | 820,789 | |
| | | | | | | | |
| | | | Diversified Banks 6.8% | | | | |
| | 12,339 | | | Axis Bank Ltd. (India) | | | 301,644 | |
| | 278,187 | | | City Union Bank Ltd. (India) | | | 250,134 | |
| | 44,385 | | | IndusInd Bank Ltd. (India) | | | 371,594 | |
| | 18,630 | | | Kotak Mahindra Bank Ltd. (India) | | | 243,315 | |
| | 30,100 | | | Yes Bank Ltd. (India) | | | 209,411 | |
| | | | | | | | |
| | | | | | | 1,376,098 | |
| | | | | | | | |
| | | | Diversified Chemicals 2.7% | | | | |
| | 14,266 | | | BASF India Ltd. (India) | | | 205,191 | |
| | 65,358 | | | Pidilite Industries Ltd. (India) | | | 335,969 | |
| | | | | | | | |
| | | | | | | 541,160 | |
| | | | | | | | |
| | | | Diversified Real Estate Activities 1.1% | | | | |
| | 138,517 | | | Delta Corp. Ltd. (India) | | | 229,151 | |
| | | | | | | | |
| | | | Electrical Components &
Equipment 1.9% | | | | |
| | 57,175 | | | Amara Raja Batteries Ltd. (India) | | | 377,194 | |
| | | | | | | | |
| | | | Fertilizers & Agricultural
Chemicals 2.4% | | | | |
| | 11,523 | | | Bayer CropScience Ltd. (India) | | | 289,809 | |
| | 69,637 | | | Rallis India Ltd. (India) | | | 200,029 | |
| | | | | | | | |
| | | | | | | 489,838 | |
| | | | | | | | |
| | | | Footwear 1.2% | | | | |
| | 12,965 | | | Bata India Ltd. (India) | | | 246,416 | |
| | | | | | | | |
| | | | Heavy Electrical Equipment 0.9% | | | | |
| | 42,457 | | | TD Power Systems Ltd. (India) | | | 191,944 | |
| | | | | | | | |
| | | | Household Appliances 0.7% | | | | |
| | 3,984 | | | Hawkins Cookers Ltd. (India) | | | 133,684 | |
| | | | | | | | |
| | | | | | | | |
| Shares | | | | | Value | |
| | | | | | | |
| | | | Household Products 1.5% | | | | |
| | 85,950 | | | Jyothy Laboratories Ltd. (India) | | $ | 297,905 | |
| | | | | | | | |
| | | | Industrial Machinery 4.3% | | | | |
| | 35,313 | | | Cummins India Ltd. (India) | | | 354,180 | |
| | 3,750 | | | FAG Bearings India Ltd. (India) | | | 118,297 | |
| | 136,870 | | | Sarine Technologies Ltd. (Israel) | | | 269,662 | |
| | 9,172 | | | SKF India Ltd. (India) | | | 124,935 | |
| | | | | | | | |
| | | | | | | 867,074 | |
| | | | | | | | |
| | | | Internet Retail 3.3% | | | | |
| | 24,334 | | | MakeMyTrip Ltd.* (India) | | | 658,965 | |
| | | | | | | | |
| | | | Internet Software & Services 0.8% | | | | |
| | 6,079 | | | Just Dial Ltd.* (India) | | | 157,134 | |
| | | | | | | | |
| | | | IT Consulting & Other Services 10.6% | | | | |
| | 14,835 | | | CMC Ltd. (India) | | | 342,790 | |
| | 13,022 | | | Cognizant Technology Solutions Corp., Class A* | | | 659,043 | |
| | 20,130 | | | HCL Technologies Ltd. (India) | | | 469,860 | |
| | 22,619 | | | Persistent Systems Ltd. (India) | | | 397,672 | |
| | 8,872 | | | Tech Mahindra Ltd. (India) | | | 266,424 | |
| | | | | | | | |
| | | | | | | 2,135,789 | |
| | | | | | | | |
| | | | Life Sciences Tools & Services 1.1% | | | | |
| | 9,762 | | | Divi’s Laboratories Ltd. (India) | | | 222,970 | |
| | | | | | | | |
| | | | Packaged Foods & Meats 3.3% | | | | |
| | 24,779 | | | Britannia Industries Ltd. (India) | | | 349,348 | |
| | 2,491 | | | GlaxoSmithKline Consumer Healthcare Ltd.* (India) | | | 179,349 | |
| | 1,724 | | | Nestlé India Ltd. (India) | | | 146,072 | |
| | | | | | | | |
| | | | | | | 674,769 | |
| | | | | | | | |
| | | | Personal Products 6.8% | | | | |
| | 74,138 | | | Bajaj Corp. Ltd. (India) | | | 269,130 | |
| | 9,644 | | | Colgate-Palmolive India Ltd. (India) | | | 221,946 | |
| | 115,352 | | | Dabur India Ltd. (India) | | | 347,471 | |
| | 18,078 | | | Godrej Consumer Products Ltd. (India) | | | 264,863 | |
| | 32,318 | | | Marico Ltd. (India) | | | 112,638 | |
| | 2,762 | | | Procter & Gamble Hygiene & Health Care Ltd. (India) | | | 147,066 | |
| | | | | | | | |
| | | | | | | 1,363,114 | |
| | | | | | | | |
| | | | Pharmaceuticals 9.4% | | | | |
| | 43,765 | | | Glenmark Pharmaceuticals Ltd. (India) | | | 416,637 | |
| | 39,415 | | | IPCA Laboratories Ltd. (India) | | | 550,414 | |
| | 41,028 | | | Lupin Ltd. (India) | | | 639,267 | |
| | 33,018 | | | Torrent Pharmaceuticals Ltd. (India) | | | 289,282 | |
| | | | | | | | |
| | | | | | | 1,895,600 | |
| | | | | | | | |
| | | | Publishing 1.8% | | | | |
| | 69,945 | | | D.B. Corp. Ltd. (India) | | | 353,692 | |
| | | | | | | | |
| | | | Restaurants 1.6% | | | | |
| | 18,473 | | | Jubilant Foodworks Ltd.* (India) | | | 328,445 | |
| | | | | | | | |
| | | | Specialized Finance 0.8% | | | | |
| | 7,845 | | | CRISIL Ltd. (India) | | | 160,913 | |
| | | | | | | | |
| | | | Specialty Chemicals 1.7% | | | | |
| | 37,252 | | | Asian Paints Ltd. (India) | | | 341,255 | |
| | | | | | | | |
| | | | Systems Software 0.9% | | | | |
| | 69,413 | | | KPIT Technologies Ltd. (India) | | | 186,775 | |
| | | | | | | | |
| | | | Thrifts & Mortgage Finance 5.0% | | | | |
| | 114,311 | | | Gruh Finance Ltd. (India) | | | 566,555 | |
| | 22,008 | | | Housing Development Finance Corp. Ltd. (India) | | | 324,284 | |
| | 31,130 | | | LIC Housing Finance Ltd. (India) | | | 122,492 | |
| | | | | | | | |
| | | | | | | 1,013,331 | |
| | | | | | | | |
51
| | |
| WASATCH EMERGING INDIA FUND (WAINX) — Schedule of Investments (continued) | | MARCH 31, 2014 (UNAUDITED) |
|
|
|
| | | | | | | | |
| Shares | | | | | Value | |
| | | | | | | |
| | | | Wireless Telecommunication
Services 1.3% | | | | |
| | 112,072 | | | Idea Cellular Ltd. (India) | | $ | 258,963 | |
| | | | | | | | |
| | |
| | | | Total Common Stocks (cost $15,489,026) | | | 19,243,473 | |
| | | | | | | | |
| | |
Principal
Amount | | | | | Value | |
| | | | | | | |
| | | | SHORT-TERM INVESTMENTS 3.9% | | | | |
| | |
| | | | Repurchase Agreement 3.9% | | | | |
| | $794,089 | | | Repurchase Agreement dated 3/31/14, 0.00% due 4/1/14 with State Street Bank and Trust Co. collateralized by $745,000 of United States Treasury Notes 3.625% due 2/15/21; value: $812,050; repurchase proceeds: $794,089 (cost $794,089) | | $ | 794,089 | |
| | | | | | | | |
| | |
| | | | Total Short-Term Investments (cost $794,089) | | | 794,089 | |
| | | | | | | | |
| | |
| | | | Total Investments (cost $16,283,115) 99.4% | | | 20,037,562 | |
| | |
| | | | Other Assets less Liabilities 0.6% | | | 124,814 | |
| | | | | | | | |
| | |
| | | | NET ASSETS 100.0% | | $ | 20,162,376 | |
| | | | | | | | |
| |
| | | | *Non-income producing. See Notes to Financial Statements. | |
At March 31, 2014, Wasatch Emerging India Fund’s investments, excluding short-term investments, were in the following countries:
| | | | |
| Country | | % | |
India | | | 95.2 | |
Israel | | | 1.4 | |
United States | | | 3.4 | |
| | | | |
TOTAL | | | 100.0 | % |
| | | | |
52
| | |
| WASATCH EMERGING MARKETS SELECT FUND (WAESX / WIESX) — Schedule of Investments | | MARCH 31, 2014 (UNAUDITED) |
|
|
|
| | | | | | | | |
| Shares | | | | | Value | |
| | | | | | | |
| | | | COMMON STOCKS 88.7% | | | | |
| | |
| | | | Casinos & Gaming 10.0% | | | | |
| | 330,240 | | | Galaxy Entertainment Group Ltd.*
(Hong Kong) | | $ | 2,873,836 | |
| | 437,514 | | | Melco International Development Ltd. (China) | | | 1,463,720 | |
| | 743,500 | | | SJM Holdings Ltd. (Hong Kong) | | | 2,089,614 | |
| | | | | | | | |
| | | | | | | 6,427,170 | |
| | | | | | | | |
| | | | Construction & Engineering 3.5% | | | | |
| | 167,074 | | | Promotora y Operadora de Infraestructura S.A.B. de C.V.* (Mexico) | | | 2,242,675 | |
| | | | | | | | |
| | | | Construction Materials 3.2% | | | | |
| | 245,383 | | | Cemex Latam Holdings S.A.* (Colombia) | | | 2,043,230 | |
| | | | | | | | |
| | | | Diversified Banks 20.9% | | | | |
| | 673,033 | | | Abu Dhabi Commercial Bank PJSC (United Arab Emirates) | | | 1,337,637 | |
| | 31,262 | | | Axis Bank Ltd. (India) | | | 764,243 | |
| | 14,780,303 | | | Banco de Chile (Chile) | | | 1,863,001 | |
| | 988,307 | | | BBVA Banco Continental S.A. (Peru) | | | 1,808,758 | |
| | 132,664 | | | IndusInd Bank Ltd. (India) | | | 1,110,670 | |
| | 356,800 | | | Kasikornbank Public Co. Ltd. (Thailand) | | | 1,957,781 | |
| | 924,283 | | | Metropolitan Bank & Trust (Philippines) | | | 1,593,201 | |
| | 659,380 | | | National Bank of Ras Al-Khaimah (United Arab Emirates) | | | 1,617,483 | |
| | 229,984 | | | Turkiye Halk Bankasi A.S. (Turkey) | | | 1,423,567 | |
| | | | | | | | |
| | | | | | | 13,476,341 | |
| | | | | | | | |
| | | | Drug Retail 3.1% | | | | |
| | 229,143 | | | Raia Drogasil S.A. (Brazil) | | | 1,983,279 | |
| | | | | | | | |
| | | | Food Retail 2.3% | | | | |
| | 66,061 | | | BIM Birlesik Magazalar A.S. (Turkey) | | | 1,487,499 | |
| | | | | | | | |
| | | | Health Care Facilities 5.5% | | | | |
| | 398,307 | | | Bangkok Dusit Medical Services Public Co. Ltd. (Thailand) | | | 1,633,009 | |
| | 531,609 | | | Life Healthcare Group Holdings Ltd. (South Africa) | | | 1,946,588 | |
| | | | | | | | |
| | | | | | | 3,579,597 | |
| | | | | | | | |
| | | | Hypermarkets & Super Centers 1.1% | | | | |
| | 78,621 | | | O’Key Group S.A. GDR (Russia) | | | 707,589 | |
| | | | | | | | |
| | | | Internet Software & Services 3.6% | | | | |
| | 25,188 | | | SouFun Holdings Ltd. ADR (China) | | | 1,723,363 | |
| | 20,889 | | | Yandex N.V., Class A* (Netherlands) | | | 630,639 | |
| | | | | | | | |
| | | | | | | 2,354,002 | |
| | | | | | | | |
| | | | IT Consulting & Other Services 1.5% | | | | |
| | 41,822 | | | HCL Technologies Ltd. (India) | | | 976,179 | |
| | | | | | | | |
| | | | Life & Health Insurance 5.4% | | | | |
| | 174,237 | | | Discovery Ltd. (South Africa) | | | 1,397,773 | |
| | 376,319 | | | Sanlam Ltd. (South Africa) | | | 2,058,895 | |
| | | | | | | | |
| | | | | | | 3,456,668 | |
| | | | | | | | |
| | | | Marine Ports & Services 3.7% | | | | |
| | 991,326 | | | International Container Terminal Services, Inc. (Philippines) | | | 2,387,406 | |
| | | | | | | | |
| | | | Packaged Foods & Meats 4.9% | | | | |
| | 175,943 | | | Biostime International Holdings Ltd. (China) | | | 1,207,870 | |
| | 47,911 | | | M Dias Branco S.A. (Brazil) | | | 1,930,805 | |
| | | | | | | | |
| | | | | | | 3,138,675 | |
| | | | | | | | |
| | | | Personal Products 2.6% | | | | |
| | 115,002 | | | Godrej Consumer Products Ltd. (India) | | | 1,684,905 | |
| | | | | | | | |
| | | | Pharmaceuticals 7.5% | | | | |
| | 167,279 | | | Lupin Ltd. (India) | | | 2,606,412 | |
| | 2,616,759 | | | Sino Biopharmaceutical Ltd. (China) | | | 2,226,570 | |
| | | | | | | | |
| | | | | | | 4,832,982 | |
| | | | | | | | |
| | | | | | | | |
| Shares | | | | | Value | |
| | | | | | | |
| | | | Soft Drinks 3.2% | | | | |
| | 86,223 | | | Coca-Cola Icecek A.S. (Turkey) | | $ | 2,074,411 | |
| | | | | | | | |
| | | | Specialty Chemicals 3.1% | | | | |
| | 215,106 | | | Asian Paints Ltd. (India) | | | 1,970,522 | |
| | | | | | | | |
| | | | Wireless Telecommunication
Services 3.6% | | | | |
| | 353,923 | | | Idea Cellular Ltd. (India) | | | 817,805 | |
| | 2,892,146 | | | PT Tower Bersama Infrastructure Tbk (Indonesia) | | | 1,533,390 | |
| | | | | | | | |
| | | | | | | 2,351,195 | |
| | | | | | | | |
| | |
| | | | Total Common Stocks
(cost $54,320,505) | | | 57,174,325 | |
| | | | | | | | |
| | |
Principal
Amount | | | | | Value | |
| | | | SHORT-TERM INVESTMENTS 11.3% | | | | |
| | |
| | | | Repurchase Agreement 11.3% | | | | |
| | $7,320,483 | | | Repurchase Agreement dated 3/31/14, 0.00% due 4/1/14 with State Street Bank and Trust Co. collateralized by $7,620,000 of United States Treasury Notes 2.000% due 2/28/21; value: $7,470,915; repurchase proceeds: $7,320,483 (cost $7,320,483) | | $ | 7,320,483 | |
| | | | | | | | |
| | |
| | | | Total Short-Term Investments
(cost $7,320,483) | | | 7,320,483 | |
| | | | | | | | |
| | |
| | | | Total Investments
(cost $61,640,988) 100.0% | | | 64,494,808 | |
| | |
| | | | Other Assets less Liabilities <0.1% | | | 30,728 | |
| | | | | | | | |
| | |
| | | | NET ASSETS 100.0% | | $ | 64,525,536 | |
| | | | | | | | |
| |
| | | | *Non-income producing. §The aggregate amount of foreign securities fair valued pursuant to a systematic valuation model as a percent of net assets was 2.38%. ADR American Depositary Receipt. GDR Global Depositary Receipt. See Notes to Financial Statements. | |
At March 31, 2014, Wasatch Emerging Markets Select Fund’s investments, excluding short-term investments, were in the following countries:
| | | | |
| Country | | % | |
Brazil | | | 6.8 | |
Chile | | | 3.2 | |
China | | | 11.6 | |
Colombia | | | 3.6 | |
Hong Kong | | | 8.7 | |
India | | | 17.4 | |
Indonesia | | | 2.7 | |
Mexico | | | 3.9 | |
Netherlands | | | 1.1 | |
Peru | | | 3.2 | |
Philippines | | | 7.0 | |
Russia | | | 1.2 | |
South Africa | | | 9.4 | |
Thailand | | | 6.3 | |
Turkey | | | 8.7 | |
United Arab Emirates | | | 5.2 | |
| | | | |
TOTAL | | | 100.0 | % |
| | | | |
53
| | |
| WASATCH EMERGING MARKETS SMALL CAP FUND (WAEMX) — Schedule of Investments | | |
|
|
|
| | | | | | | | |
| Shares | | | | | Value | |
| | | | | | | |
| | | | COMMON STOCKS 95.5% | | | | |
| | |
| | | | Airport Services 3.3% | | | | |
| | 4,541,584 | | | Grupo Aeroportuario del Centro Norte S.A.B. de C.V. (Mexico) | | $ | 16,463,466 | |
| | 7,073,778 | | | Malaysia Airports Holdings Berhad (Malaysia) | | | 17,329,727 | |
| | 2,129,629 | | | TAV Havalimanlari Holding A.S. (Turkey) | | | 17,111,847 | |
| | | | | | | | |
| | | | | | | 50,905,040 | |
| | | | | | | | |
| | | | Apparel Retail 1.6% | | | | |
| | 1,033,210 | | | Mr Price Group Ltd. (South Africa) | | | 15,464,257 | |
| | 34,655,084 | | | Trinity Ltd. (China) | | | 9,069,672 | |
| | | | | | | | |
| | | | | | | 24,533,929 | |
| | | | | | | | |
| | | | Application Software 1.0% | | | | |
| | 769,100 | | | Linx S.A. (Brazil) | | | 15,127,668 | |
| | | | | | | | |
| | | | Asset Management & Custody
Banks 1.6% | | | | |
| | 1,230,406 | | | CETIP S.A. — Mercados Organizados (Brazil) | | | 14,918,944 | |
| | 1,036,320 | | | Coronation Fund Managers Ltd. (South Africa) | | | 9,755,223 | |
| | | | | | | | |
| | | | | | | 24,674,167 | |
| | | | | | | | |
| | | | Automotive Retail 0.7% | | | | |
| | 495,704 | | | Kolao Holdings (Korea) | | | 11,525,834 | |
| | | | | | | | |
| | | | Biotechnology 0.5% | | | | |
| | 1,113,400 | | | Biocon Ltd. (India) | | | 7,885,943 | |
| | | | | | | | |
| | | | Brewers 0.8% | | | | |
| | 2,842,457 | | | Guinness Anchor Berhad (Malaysia) | | | 12,255,947 | |
| | | | | | | | |
| | | | Cable & Satellite 1.4% | | | | |
| | 549,302 | | | KT Skylife Co. Ltd. (Korea) | | | 12,307,626 | |
| | 46,983,285 | | | PT MNC Sky Vision Tbk (Indonesia) | | | 9,915,035 | |
| | | | | | | | |
| | | | | | | 22,222,661 | |
| | | | | | | | |
| | | | Casinos & Gaming 5.0% | | | | |
| | 678,601 | | | Grand Korea Leisure Co. Ltd. (Korea) | | | 27,891,206 | |
| | 5,836,844 | | | Melco International Development Ltd. (China) | | | 19,527,383 | |
| | 974,535 | | | Paradise Co. Ltd. (Korea) | | | 29,708,921 | |
| | | | | | | | |
| | | | | | | 77,127,510 | |
| | | | | | | | |
| | | | Coal & Consumable Fuels 0.7% | | | | |
| | 4,960,809 | | | PT Indo Tambangraya Megah Tbk (Indonesia) | | | 10,696,491 | |
| | | | | | | | |
| | | | Commodity Chemicals 2.3% | | | | |
| | 5,055,313 | | | Berger Paints India Ltd. (India) | | | 19,379,864 | |
| | 3,085,028 | | | Castrol India Ltd. (India) | | | 16,039,201 | |
| | | | | | | | |
| | | | | | | 35,419,065 | |
| | | | | | | | |
| | | | Construction & Engineering 1.7% | | | | |
| | 2,021,287 | | | Promotora y Operadora de Infraestructura S.A.B. de C.V.* (Mexico) | | | 27,132,231 | |
| | | | | | | | |
| | | | Construction Materials 4.4% | | | | |
| | 1,761,208 | | | Cemex Latam Holdings S.A.* (Colombia) | | | 14,665,048 | |
| | 96,929,101 | | | PT Holcim Indonesia Tbk (Indonesia) | | | 23,672,794 | |
| | 1,413,102 | | | Siam City Cement Public Co. Ltd. (Thailand) | | | 15,071,926 | |
| | 13,005,195 | | | Union Andina de Cementos S.A.A. (Peru) | | | 14,077,192 | |
| | | | | | | | |
| | | | | | | 67,486,960 | |
| | | | | | | | |
| | | | Consumer Finance 1.5% | | | | |
| | 5,347,428 | | | Mahindra & Mahindra Financial Services Ltd. (India) | | | 22,671,000 | |
| | | | | | | | |
| | | | Department Stores 1.4% | | | | |
| | 2,564,642 | | | Poya Co. Ltd. (Taiwan) | | | 16,675,121 | |
| | 9,663,998 | | | PT Mitra Adiperkasa Tbk (Indonesia) | | | 5,338,758 | |
| | | | | | | | |
| | | | | | | 22,013,879 | |
| | | | | | | | |
| | | | | | | | |
| Shares | | | | | Value | |
| | | | | | | |
| | | | Distillers & Vintners 0.2% | | | | |
| | 320,736 | | | Distell Group Ltd. (South Africa) | | $ | 3,917,023 | |
| | | | | | | | |
| | | | Diversified Banks 3.7% | | | | |
| | 12,056,900 | | | EastWest Banking Corp.* (Philippines) | | | 7,689,315 | |
| | 492,196 | | | Intergroup Financial Services Corp. (Peru) | | | 15,504,174 | |
| | 8,411,281 | | | Security Bank Corp. (Philippines) | | | 19,881,721 | |
| | 17,306,168 | | | Turkiye Sinai Kalkinma Bankasi A.S. (Turkey) | | | 14,795,052 | |
| | | | | | | | |
| | | | | | | 57,870,262 | |
| | | | | | | | |
| | | | Diversified Chemicals 1.7% | | | | |
| | 5,012,566 | | | Pidilite Industries Ltd. (India) | | | 25,766,801 | |
| | | | | | | | |
| | | | Drug Retail 1.1% | | | | |
| | 2,789,595 | | | Clicks Group Ltd. (South Africa) | | | 17,386,893 | |
| | | | | | | | |
| | | | Electronic Components 0.4% | | | | |
| | 469,100 | | | Partron Co. Ltd. (Korea) | | | 5,817,201 | |
| | | | | | | | |
| | | | Electronic Equipment & Instruments 0.7% | | | | |
| | 1,959,600 | | | Vivotek, Inc. (Taiwan) | | | 11,164,620 | |
| | | | | | | | |
| | | | Environmental & Facilities Services 1.2% | | | | |
| | 3,100,300 | | | Cleanaway Co. Ltd. (Taiwan) | | | 18,936,238 | |
| | | | | | | | |
| | | | Fertilizers & Agricultural Chemicals 0.9% | | | | |
| | 533,520 | | | Bayer CropScience Ltd. (India) | | | 13,418,288 | |
| | | | | | | | |
| | | | Food Retail 1.0% | | | | |
| | 1,198,004 | | | Eurocash S.A. (Poland) | | | 15,832,966 | |
| | | | | | | | |
| | | | Footwear 0.7% | | | | |
| | 597,772 | | | Bata India Ltd. (India) | | | 11,361,396 | |
| | | | | | | | |
| | | | General Merchandise Stores 1.4% | | | | |
| | 3,214,426 | | | Taiwan FamilyMart Co. Ltd. (Taiwan) | | | 21,427,747 | |
| | | | | | | | |
| | | | Health Care Equipment 0.8% | | | | |
| | 236,277 | | | i-SENS, Inc.* (Korea) | | | 11,764,461 | |
| | | | | | | | |
| | | | Health Care Facilities 3.5% | | | | |
| | 6,702,739 | | | Bumrungrad Hospital Public Co. Ltd. (Thailand) | | | 19,887,134 | |
| | 12,435,477 | | | KPJ Healthcare Berhad (Malaysia) | | | 11,386,335 | |
| | 3,742,990 | | | Life Healthcare Group Holdings Ltd. (South Africa) | | | 13,705,671 | |
| | 1,162,428 | | | MD Medical Group Investments plc GDR (Russia) | | | 9,869,014 | |
| | | | | | | | |
| | | | | | | 54,848,154 | |
| | | | | | | | |
| | | | Health Care Supplies 2.3% | | | | |
| | 467,614 | | | Ginko International Co. Ltd. (Taiwan) | | | 8,061,648 | |
| | 1,225,399 | | | St. Shine Optical Co. Ltd. (Taiwan) | | | 27,322,746 | |
| | | | | | | | |
| | | | | | | 35,384,394 | |
| | | | | | | | |
| | | | Home Furnishings 1.2% | | | | |
| | 273,715 | | | Hanssem Co. Ltd. (Korea) | | | 17,999,953 | |
| | | | | | | | |
| | | | Home Improvement Retail 1.5% | | | | |
| | 51,368,054 | | | Home Product Center Public Co. Ltd. (Thailand) | | | 15,438,919 | |
| | 112,672,939 | | | PT Ace Hardware Indonesia Tbk (Indonesia) | | | 7,467,709 | |
| | | | | | | | |
| | | | | | | 22,906,628 | |
| | | | | | | | |
| | | | Hotels, Resorts & Cruise Lines 3.2% | | | | |
| | 377,609 | | | Hotel Shilla Co. Ltd. (Korea) | | | 30,543,600 | |
| | 25,711,998 | | | Minor International Public Co. Ltd. (Thailand) | | | 19,656,521 | |
| | | | | | | | |
| | | | | | | 50,200,121 | |
| | | | | | | | |
54
| | |
| | MARCH 31, 2014 (UNAUDITED) |
|
|
|
| | | | | | | | |
| Shares | | | | | Value | |
| | | | | | | |
| | | | Human Resource & Employment Services 0.9% | | | | |
| | 202,682 | | | 51job, Inc. ADR* (China) | | $ | 14,441,093 | |
| | | | | | | | |
| | | | Hypermarkets & Super Centers 3.8% | | | | |
| | 904,332 | | | Inretail Peru Corp.* (Peru) | | | 12,751,081 | |
| | 1,348,505 | | | O’Key Group S.A. GDR (Russia) | | | 12,136,545 | |
| | 22,249,501 | | | Puregold Price Club, Inc. (Philippines) | | | 21,830,261 | |
| | 8,574,598 | | | Robinsons Retail Holdings, Inc.* (Philippines) | | | 13,001,955 | |
| | | | | | | | |
| | | | | | | 59,719,842 | |
| | | | | | | | |
| | | | Industrial Machinery 1.6% | | | | |
| | 2,132,557 | | | Airtac International Group (Taiwan) | | | 22,094,138 | |
| | 260,133 | | | Cummins India Ltd. (India) | | | 2,609,061 | |
| | | | | | | | |
| | | | | | | 24,703,199 | |
| | | | | | | | |
| | | | Internet Retail 1.6% | | | | |
| | 2,186,024 | | | Interpark Corp. (Korea) | | | 25,054,716 | |
| | 14,838 | | | MakeMyTrip Ltd.* (India) | | | 401,813 | |
| | | | | | | | |
| | | | | | | 25,456,529 | |
| | | | | | | | |
| | | | Internet Software & Services 0.4% | | | | |
| | 162,264 | | | Bitauto Holdings Ltd. ADR* (China) | | | 5,815,542 | |
| | | | | | | | |
| | | | IT Consulting & Other Services 1.0% | | | | |
| | 6,658,620 | | | Sonda S.A. (Chile) | | | 16,130,936 | |
| | | | | | | | |
| | | | Leisure Products 3.1% | | | | |
| | 2,720,360 | | | Giant Manufacturing Co. Ltd. (Taiwan) | | | 18,491,569 | |
| | 4,573,397 | | | Merida Industry Co. Ltd. (Taiwan) | | | 30,336,629 | |
| | | | | | | | |
| | | | | | | 48,828,198 | |
| | | | | | | | |
| | | | Life & Health Insurance 1.4% | | | | |
| | 10,367,444 | | | Bangkok Life Assurance Public Co. Ltd. NVDR (Thailand) | | | 21,971,695 | |
| | | | | | | | |
| | | | Managed Health Care 1.5% | | | | |
| | 2,263,531 | | | Qualicorp S.A.* (Brazil) | | | 22,904,778 | |
| | | | | | | | |
| | | | Marine Ports & Services 2.5% | | | | |
| | 915,742 | | | Global Ports Investments plc GDR (Russia) | | | 10,979,746 | |
| | 11,354,004 | | | International Container Terminal Services, Inc. (Philippines) | | | 27,343,794 | |
| | | | | | | | |
| | | | | | | 38,323,540 | |
| | | | | | | | |
| | | | Oil & Gas Exploration & Production 3.2% | | | | |
| | 5,191,494 | | | Afren plc* (Nigeria) | | | 12,222,327 | |
| | 806,204 | | | Dragon Oil plc (United Arab Emirates) | | | 7,594,868 | |
| | 2,178,480 | | | Gran Tierra Energy, Inc.* (Colombia) | | | 16,295,031 | |
| | 1,516,600 | | | Parex Resources, Inc.* (Colombia) | | | 13,034,514 | |
| | | | | | | | |
| | | | | | | 49,146,740 | |
| | | | | | | | |
| | | | Packaged Foods & Meats 5.2% | | | | |
| | 3,307,328 | | | Biostime International Holdings Ltd. (China) | | | 22,705,208 | |
| | 94,492 | | | Britannia Industries Ltd. (India) | | | 1,332,199 | |
| | 175,637 | | | GlaxoSmithKline Consumer Healthcare Ltd.* (India) | | | 12,645,658 | |
| | 6,392,657 | | | Standard Foods Corp. (Taiwan) | | | 17,423,546 | |
| | 3,734,365 | | | Ulker Biskuvi Sanayi A.S. (Turkey) | | | 26,255,346 | |
| | | | | | | | |
| | | | | | | 80,361,957 | |
| | | | | | | | |
| | | | Pharmaceuticals 1.4% | | | | |
| | 72,383,403 | | | CFR Pharmaceuticals S.A. (Chile) | | | 14,516,102 | |
| | 8,040,000 | | | Sino Biopharmaceutical Ltd. (China) | | | 6,841,142 | |
| | | | | | | | |
| | | | | | | 21,357,244 | |
| | | | | | | | |
| | | | Real Estate Operating Companies 1.6% | | | | |
| | 13,252,320 | | | Parque Arauco S.A. (Chile) | | | 25,273,320 | |
| | | | | | | | |
| | | | | | | | |
| Shares | | | | | Value | |
| | | | | | | |
| | | | Regional Banks 2.2% | | | | |
| | 4,227,881 | | | Banregio Grupo Financiero S.A.B. de C.V. (Mexico) | | $ | 24,545,990 | |
| | 1,187,549 | | | TCS Group Holding plc GDR* (Russia) | | | 9,619,147 | |
| | | | | | | | |
| | | | | | | 34,165,137 | |
| | | | | | | | |
| | | | Restaurants 1.8% | | | | |
| | 744,570 | | | Jubilant Foodworks Ltd.* (India) | | | 13,238,254 | |
| | 1,007,401 | | | Wowprime Corp. (Taiwan) | | | 14,621,829 | |
| | | | | | | | |
| | | | | | | 27,860,083 | |
| | | | | | | | |
| | | | Retail REITs 1.0% | | | | |
| | 33,659,028 | | | CapitaMalls Malaysia Trust (Malaysia) | | | 15,151,974 | |
| | | | | | | | |
| | | | Semiconductor Equipment 0.6% | | | | |
| | 228,514 | | | Hermes Microvision, Inc. (Taiwan) | | | 9,154,818 | |
| | | | | | | | |
| | | | Semiconductors 0.1% | | | | |
| | 57,670 | | | LEENO Industrial, Inc. (Korea) | | | 1,609,093 | |
| | | | | | | | |
| | | | Specialized Finance 1.7% | | | | |
| | 10,919,720 | | | Chailease Holding Co. Ltd. (Taiwan) | | | 26,212,348 | |
| | | | | | | | |
| | | | Specialty Chemicals 0.3% | | | | |
| | 24,682,946 | | | D&L Industries, Inc. (Philippines) | | | 4,573,872 | |
| | | | | | | | |
| | | | Specialty Stores 1.5% | | | | |
| | 29,572,390 | | | Sa Sa International Holdings Ltd. (China) | | | 23,637,782 | |
| | | | | | | | |
| | | | Technology Hardware, Storage & Peripherals 1.1% | | | | |
| | 508,858 | | | KONA I Co. Ltd. (Korea) | | | 17,185,819 | |
| | | | | | | | |
| | | | Trading Companies & Distributors 1.2% | | | | |
| | 597,687 | | | iMarketKorea, Inc. (Korea) | | | 18,445,223 | |
| | | | | | | | |
| | | | Wireless Telecommunication Services 1.4% | | | | |
| | 40,025,513 | | | PT Tower Bersama Infrastructure Tbk (Indonesia) | | | 21,221,161 | |
| | | | | | | | |
| | |
| | | | Total Common Stocks (cost $1,335,468,957) | | | 1,481,333,394 | |
| | | | | | | | |
| | |
| | | | PREFERRED STOCKS 0.5% | | | | |
| | |
| | | | Construction Machinery & Heavy Trucks 0.5% | | | | |
| | 3,583,757 | | | Marcopolo S.A. Pfd. (Brazil) | | | 7,189,636 | |
| | | | | | | | |
| | |
| | | | Total Preferred Stocks (cost $5,367,139) | | | 7,189,636 | |
| | | | | | | | |
55
| | |
| WASATCH EMERGING MARKETS SMALL CAP FUND (WAEMX) — Schedule of Investments (continued) | | (UNAUDITED) |
|
|
|
| | | | | | | | |
Principal
Amount | | | | | Value | |
| | | | | | | |
| | | | SHORT-TERM INVESTMENTS 4.0% | | | | |
| | |
| | | | Repurchase Agreement 4.0% | | | | |
| | $62,262,728 | | | Repurchase Agreement dated 3/31/14, 0.00% due 4/1/14 with State Street Bank and Trust Co. collateralized by $64,780,000 of United States Treasury Notes 2.000% due 2/28/21; value: $63,512,579; repurchase proceeds: $62,262,728 (cost $62,262,728) | | $ | 62,262,728 | |
| | | | | | | | |
| | |
| | | | Total Short-Term Investments (cost $62,262,728) | | | 62,262,728 | |
| | | | | | | | |
| | |
| | | | Total Investments (cost $1,403,098,824) 100.0%§ | | | 1,550,785,758 | |
| | | | | | | |
| | |
| | | | Liabilities less Other Assets (<0.1%) | | | (325,404 | ) |
| | | | | | | | |
| | |
| | | | NET ASSETS 100.0% | | $ | 1,550,460,354 | |
| | | | | | | | |
| |
| | | | *Non-income producing. §The aggregate amount of foreign securities fair valued pursuant to a systematic valuation model as a percent of net assets was 5.05%. ADR American Depositary Receipt. GDR Global Depositary Receipt. NVDR Non-Voting Depositary Receipt. REIT Real Estate Investment Trust. See Notes to Financial Statements. | |
At March 31, 2014, Wasatch Emerging Markets Small Cap Fund’s investments, excluding short-term investments, were in the following countries:
| | | | |
| Country | | % | |
Brazil | | | 4.0 | |
Chile | | | 3.8 | |
China | | | 6.8 | |
Colombia | | | 3.0 | |
India | | | 9.9 | |
Indonesia | | | 5.3 | |
Korea | | | 14.1 | |
Malaysia | | | 3.8 | |
Mexico | | | 4.6 | |
Nigeria | | | 0.8 | |
Peru | | | 2.8 | |
Philippines | | | 6.3 | |
Poland | | | 1.1 | |
Russia | | | 2.9 | |
South Africa | | | 4.0 | |
Taiwan | | | 16.2 | |
Thailand | | | 6.2 | |
Turkey | | | 3.9 | |
United Arab Emirates | | | 0.5 | |
| | | | |
TOTAL | | | 100.0 | % |
| | | | |
56
| | |
| WASATCH FRONTIER EMERGING SMALL COUNTRIES FUND (WAFMX) — Schedule of Investments | | (UNAUDITED) |
|
|
|
| | | | | | | | |
| Shares | | | | | Value | |
| | | | | | | |
| | |
| | | | COMMON STOCKS 85.8% | | | | |
| | |
| | | | Advertising 0.0% | | | | |
| | 110,600 | | | Scan Group Ltd. (Kenya) | | $ | 61,444 | |
| | | | | | | | |
| | | | Air Freight & Logistics 1.4% | | | | |
| | 4,747,901 | | | Agility Public Warehousing Co. KSC (Kuwait) | | | 12,811,663 | |
| | 3,288,909 | | | Aramex PJSC (United Arab Emirates) | | | 2,954,914 | |
| | | | | | | | |
| | | | 15,766,577 | |
| | | | | | | | |
| | | | Apparel Retail 0.4% | | | | |
| | 312,490 | | | Mr Price Group Ltd. (South Africa) | | | 4,677,099 | |
| | | | | | | | |
| | | | Automotive Retail 0.0% | | | | |
| | 12,279 | | | Kolao Holdings (Korea) | | | 285,504 | |
| | | | | | | | |
| | | | Brewers 11.1% | | | | |
| | 79,340 | | | Brasseries Maroc (Morocco) | | | 21,193,369 | |
| | 1,321,873 | | | Carlsberg Brewery Malaysia Berhad (Malaysia) | | | 5,270,490 | |
| | 5,599,954 | | | Delta Corp. Ltd. (Zimbabwe) | | | 6,440,507 | |
| | 8,679,232 | | | East African Breweries Ltd. (Kenya) | | | 27,022,146 | |
| | 1,451,400 | | | Florida Ice & Farm Co. S.A. (Costa Rica) | | | 4,319,761 | |
| | 262,581 | | | Guinness Anchor Berhad (Malaysia) | | | 1,132,182 | |
| | 1,074,765 | | | Guinness Ghana Breweries Ltd. (Ghana) | | | 2,356,196 | |
| | 10,748,081 | | | Guinness Nigeria plc (Nigeria) | | | 12,698,430 | |
| | 2,256,243 | | | Lion Brewery Ceylon plc (Sri Lanka) | | | 6,749,740 | |
| | 5,600 | | | Namibia Breweries Ltd. (Namibia) | | | 8,685 | |
| | 23,844,906 | | | Nigerian Breweries plc (Nigeria) | | | 22,390,085 | |
| | 303,770 | | | SABMiller plc (United Kingdom) | | | 15,191,099 | |
| | 6,852 | | | Union de Cervecerias Peruanas Backus y Johnston S.A.A. (Peru) | | | 29,277 | |
| | | | | | | | |
| | | | 124,801,967 | |
| | | | | | | | |
| | | | Building Products 0.7% | | | | |
| | 5,344,977 | | | Al Anwar Ceramic Tile Co. (Oman) | | | 8,218,770 | |
| | | | | | | | |
| | | | Casinos & Gaming 0.9% | | | | |
| | 9,932,889 | | | NagaCorp Ltd. (Cambodia) | | | 10,347,026 | |
| | | | | | | | |
| | | | Commodity Chemicals 0.1% | | | | |
| | 123,150 | | | Berger Paints Bangladesh Ltd. (Bangladesh) | | | 1,452,250 | |
| | 27,000 | | | Paints & Chemical Industries Co. S.A.E. (Egypt) | | | 155,975 | |
| | | | | | | | |
| | | | 1,608,225 | |
| | | | | | | | |
| | | | Construction & Engineering 0.4% | | | | |
| | 1,103,850 | | | Grana y Montero S.A. (Peru) | | | 3,851,782 | |
| | | | | | | | |
| | | | Construction Materials 3.5% | | | | |
| | 1,896,460 | | | Bamburi Cement Co. Ltd. (Kenya) | | | 4,389,954 | |
| | 3,198,940 | | | Kohat Cement Co. Ltd. (Pakistan) | | | 3,815,623 | |
| | 15,562,929 | | | Lafarge Cement WAPCO Nigeria plc (Nigeria) | | | 9,915,768 | |
| | 8,926,976 | | | Lafarge Republic, Inc. (Philippines) | | | 1,825,407 | |
| | 5,915,100 | | | Lucky Cement Ltd. (Pakistan) | | | 19,075,144 | |
| | | | | | | | |
| | | | 39,021,896 | |
| | | | | | | | |
| | | | Consumer Finance 0.3% | | | | |
| | 10,963,288 | | | Letshego Holdings Ltd. (Botswana) | | | 2,799,585 | |
| | | | | | | | |
| | | | Department Stores 0.2% | | | | |
| | 2,951,376 | | | Parkson Retail Asia Ltd. (Malaysia) | | | 2,204,007 | |
| | | | | | | | |
| | | | Distillers & Vintners 1.4% | | | | |
| | 738,191 | | | Distell Group Ltd. (South Africa) | | | 9,015,237 | |
| | 4,230,100 | | | Distilleries Co. of Sri Lanka plc (Sri Lanka) | | | 6,570,087 | |
| | | | | | | | |
| | | | 15,585,324 | |
| | | | | | | | |
| | | | | | | | |
| Shares | | | | | Value | |
| | | | | | | |
| | | | Diversified Banks 16.8% | | | | |
| | 9,193,451 | | | Abu Dhabi Commercial Bank PJSC (United Arab Emirates) | | $ | 18,271,765 | |
| | 648,020 | | | Bancolombia S.A. (Colombia) | | | 8,852,903 | |
| | 10,426,300 | | | Barclays Bank of Kenya Ltd. (Kenya) | | | 1,936,830 | |
| | 985,588 | | | BBVA Banco Continental S.A. (Peru) | | | 1,803,782 | |
| | 120,144 | | | BLOM Bank SAL (Lebanon) | | | 1,087,303 | |
| | 659,681 | | | BLOM Bank SAL GDR (Lebanon) | | | 6,069,065 | |
| | 4,578,100 | | | CAL Bank Ltd. (Ghana) | | | 1,667,083 | |
| | 15,136,477 | | | Commercial Bank of Ceylon plc (Sri Lanka) | | | 14,128,923 | |
| | 1,090,024 | | | Doha Bank QSC (Qatar) | | | 18,500,098 | |
| | 19,569,100 | | | Equity Bank Ltd. (Kenya) | | | 7,191,191 | |
| | 3,777,991 | | | First Gulf Bank PJSC (United Arab Emirates) | | | 16,765,928 | |
| | 497,000 | | | Ghana Commercial Bank Ltd. (Ghana) | | | 755,311 | |
| | 1,534,490 | | | Guaranty Trust Bank plc GDR (Nigeria) | | | 12,114,799 | |
| | 25,470,795 | | | Kenya Commercial Bank Ltd. (Kenya) | | | 13,560,840 | |
| | 3,841,168 | | | MCB Bank Ltd. (Pakistan) | | | 9,810,023 | |
| | 1,685,128 | | | National Bank of Kuwait SAK (Kuwait) | | | 5,923,226 | |
| | 4,740,865 | | | National Bank of Ras Al-Khaimah (United Arab Emirates) | | | 11,629,511 | |
| | 472,495 | | | Qatar National Bank (Qatar) | | | 24,343,306 | |
| | 126,092,227 | | | Stanbic Bank Uganda Ltd. (Uganda) | | | 1,485,185 | |
| | 100,796,013 | | | Zenith Bank plc (Nigeria) | | | 12,213,997 | |
| | | | | | | | |
| | | | 188,111,069 | |
| | | | | | | | |
| | | | Diversified Chemicals 0.5% | | | | |
| | 281,143 | | | Omnia Holdings Ltd. (South Africa) | | | 5,641,840 | |
| | | | | | | | |
| | | | Food Retail 1.5% | | | | |
| | 1,500,000 | | | Cargills Ceylon plc (Sri Lanka) | | | 1,566,565 | |
| | 6,803,700 | | | OK Zimbabwe (Zimbabwe) | | | 1,258,685 | |
| | 1,354,745 | | | Philippine Seven Corp. (Philippines) | | | 2,930,321 | |
| | 720,134 | | | Shoprite Holdings Ltd. (South Africa) | | | 10,900,954 | |
| | | | | | | | |
| | | | 16,656,525 | |
| | | | | | | | |
| | | | Footwear 0.3% | | | | |
| | 49,400 | | | Bata Shoe Co. Bangladesh Ltd. (Bangladesh) | | | 557,023 | |
| | 709,840 | | | Forus S.A. (Chile) | | | 3,167,616 | |
| | | | | | | | |
| | | | 3,724,639 | |
| | | | | | | | |
| | | | Health Care Facilities 0.9% | | | | |
| | 273,000 | | | Al Noor Hospitals Group plc (United Kingdom) | | | 4,888,704 | |
| | 653,429 | | | NMC Health plc (United Arab Emirates) | | | 5,496,503 | |
| | | | | | | | |
| | | | 10,385,207 | |
| | | | | | | | |
| | | | Household Appliances 0.0% | | | | |
| | 78,515 | | | Singer Bangladesh Ltd. (Bangladesh) | | | 211,161 | |
| | | | | | | | |
| | | | Household Products 1.5% | | | | |
| | 1,038,070 | | | Unilever Ghana Ltd. (Ghana) | | | 6,960,325 | |
| | 36,399,807 | | | Unilever Nigeria plc (Nigeria) | | | 9,747,782 | |
| | | | | | | | |
| | | | 16,708,107 | |
| | | | | | | | |
| | | | Hypermarkets & Super Centers 1.9% | | | | |
| | 205,898 | | | PriceSmart, Inc. (Costa Rica) | | | 20,781,285 | |
| | | | | | | | |
| | | | Industrial Conglomerates 0.2% | | | | |
| | 3,684,458 | | | Innscor Africa Ltd. (Zimbabwe) | | | 2,291,733 | |
| | | | | | | | |
| | | | Industrial Gases 0.1% | | | | |
| | 71,000 | | | Linde Bangladesh Ltd. (Bangladesh) | | | 815,219 | |
| | | | | | | | |
| | | | Integrated Telecommunication Services 0.5% | | | | |
| | 109,661 | | | Sonatel (Senegal) | | | 5,271,838 | |
| | | | | | | | |
57
| | |
| WASATCH FRONTIER EMERGING SMALL COUNTRIES FUND (WAFMX) — Schedule of Investments (continued) | | |
|
|
|
| | | | | | | | |
| Shares | | | | | Value | |
| | | | | | | |
| | | | Marine Ports & Services 1.5% | | | | |
| | 603,238 | | | DP World Ltd. (United Arab Emirates) | | $ | 10,797,960 | |
| | 2,544,266 | | | International Container Terminal Services, Inc. (Philippines) | | | 6,127,344 | |
| | | | | | | | |
| | | | 16,925,304 | |
| | | | | | | | |
| | | | Oil & Gas Exploration & Production 0.7% | | | | |
| | 1,414,610 | | | Pakistan Oilfields Ltd. (Pakistan) | | | 7,842,955 | |
| | | | | | | | |
| | | | Oil & Gas Refining & Marketing 0.9% | | | | |
| | 5,098,891 | | | Chevron Lubricants Lanka plc (Sri Lanka) | | | 10,310,917 | |
| | | | | | | | |
| | | | Packaged Foods & Meats 20.0% | | | | |
| | 10,448,645 | | | Agthia Group PJSC (United Arab Emirates) | | | 13,512,405 | |
| | 3,397,733 | | | Alicorp S.A. (Peru) | | | 9,678,428 | |
| | 24,254,221 | | | Cadbury Nigeria plc (Nigeria) | | | 11,028,654 | |
| | 15,581 | | | Centrale Laitiere (Morocco) | | | 2,870,450 | |
| | 6,651,700 | | | Dairibord Holdings Ltd. (Zimbabwe) | | | 764,945 | |
| | 104,300 | | | Dutch Lady Milk Industries Berhad (Malaysia) | | | 1,513,316 | |
| | 1,295,986 | | | FAN Milk Ltd. (Ghana) | | | 3,587,588 | |
| | 2,001,500 | | | Grupo Herdez S.A.B. de C.V. (Mexico) | | | 5,944,147 | |
| | 891,041 | | | Grupo Nutresa S.A. (Colombia) | | | 12,326,556 | |
| | 7,681,346 | | | Juhayna Food Industries (Egypt) | | | 14,376,099 | |
| | 1,365,075 | | | Kinh Do Corp. (Vietnam) | | | 4,141,002 | |
| | 5,649 | | | Ledo dd (Croatia) | | | 8,782,803 | |
| | 517,172 | | | National Foods Holdings* (Zimbabwe) | | | 1,137,778 | |
| | 311,631 | | | Nestlé Lanka plc (Sri Lanka) | | | 4,732,881 | |
| | 74,400 | | | Nestlé Malaysia Berhad (Malaysia) | | | 1,519,214 | |
| | 4,795,334 | | | Nestlé Nigeria plc (Nigeria) | | | 30,855,163 | |
| | 21,076 | | | Nestlé Pakistan Ltd. (Pakistan) | | | 1,805,825 | |
| | 4,496,250 | | | Olympic Industries Ltd. (Bangladesh) | | | 11,941,716 | |
| | 13,604,752 | | | PT Indofood CBP Sukses Makmur Tbk (Indonesia) | | | 12,136,102 | |
| | 928,714 | | | Ulker Biskuvi Sanayi A.S. (Turkey) | | | 6,529,546 | |
| | 9,979,996 | | | Universal Robina Corp. (Philippines) | | | 31,601,281 | |
| | 4,934,897 | | | Viet Nam Dairy Products JSC (Vietnam) | | | 32,981,181 | |
| | 29,000 | | | Vinacafe Bien Hoa JSC (Vietnam) | | | 199,313 | |
| | | | | | | | |
| | | | 223,966,393 | |
| | | | | | | | |
| | | | Personal Products 0.3% | | | | |
| | 25,907 | | | Colgate-Palmolive Pakistan Ltd. (Pakistan) | | | 422,998 | |
| | 160,650 | | | Marico Bangladesh Ltd. (Bangladesh) | | | 2,334,808 | |
| | | | | | | | |
| | | | 2,757,806 | |
| | | | | | | | |
| | | | Pharmaceuticals 4.4% | | | | |
| | 2,024,735 | | | Abbott Laboratories Pakistan Ltd. (Pakistan) | | | 8,599,460 | |
| | 548,470 | | | DHG Pharmaceutical JSC (Vietnam) | | | 3,613,572 | |
| | 375,178 | | | Egyptian International Pharmaceutical Industrial Co. (Egypt) | | | 2,641,746 | |
| | 10,526,421 | | | GlaxoSmithKline Consumer Nigeria plc (Nigeria) | | | 4,465,039 | |
| | 1,685,500 | | | GlaxoSmithKline Pakistan Ltd. (Pakistan) | | | 2,788,362 | |
| | 7,624,250 | | | Square Pharmaceuticals Ltd. (Bangladesh) | | | 26,232,922 | |
| | 300,000 | | | Traphaco JSC (Vietnam) | | | 1,237,113 | |
| | | | | | | | |
| | | | 49,578,214 | |
| | | | | | | | |
| | | | Publishing 0.2% | | | | |
| | 743,422 | | | Nation Media Group Ltd. (Kenya) | | | 2,667,371 | |
| | | | | | | | |
| | | | Restaurants 1.7% | | | | |
| | 2,126,854 | | | Kuwait Foods Americana (Kuwait) | | | 19,180,576 | |
| | | | | | | | |
| | | | Soft Drinks 0.9% | | | | |
| | 241,909 | | | Coca-Cola Icecek A.S. (Turkey) | | | 5,820,010 | |
| | 36,456,973 | | | Pepsi-Cola Products Philippines, Inc. (Philippines) | | | 3,983,480 | |
| | | | | | | | |
| | | | 9,803,490 | |
| | | | | | | | |
| | | | | | | | |
| Shares | | | | | Value | |
| | | | | | | |
| | | | Specialty Chemicals 0.0% | | | | |
| | 863,988 | | | Chemical and Allied Products plc (Nigeria) | | $ | 202,007 | |
| | | | | | | | |
| | | | Tobacco 3.5% | | | | |
| | 598,500 | | | British American Tobacco Bangladesh Co. Ltd. (Bangladesh) | | | 17,931,862 | |
| | 1,103,641 | | | British American Tobacco Kenya Ltd. (Kenya) | | | 7,855,778 | |
| | 1,217,442 | | | Ceylon Tobacco Co. plc (Sri Lanka) | | | 9,836,410 | |
| | 263,645 | | | Pakistan Tobacco Co. Ltd. (Pakistan) | | | 3,430,335 | |
| | | | | | | | |
| | | | 39,054,385 | |
| | | | | | | | |
| | | | Wireless Telecommunication Services 7.1% | | | | |
| | 9,073,721 | | | Econet Wireless Zimbabwe Ltd.* (Zimbabwe) | | | 5,636,595 | |
| | 53,900 | | | Millicom International Cellular S.A. (Sweden) | | | 5,488,409 | |
| | 1,555,590 | | | MTN Group Ltd. (South Africa) | | | 31,882,421 | |
| | 253,590,700 | | | Safaricom Ltd. (Kenya) | | | 36,394,962 | |
| | | | | | | | |
| | | | 79,402,387 | |
| | | | | | | | |
| | |
| | | | Total Common Stocks (cost $867,335,396) | | | 961,519,634 | |
| | | | | | | | |
| | |
| | | | PARTICIPATION NOTES 7.0% | | | | |
| | |
| | | | Building Products 0.5% | | | | |
| | 145,295 | | | Saudi Ceramic, HSBC Bank, 4/13/15,
Series 0001 (Saudi Arabia) | | | 5,288,245 | |
| | | | | | | | |
| | | | Diversified Banks 0.9% | | | | |
| | 477,647 | | | Al Rajhi Bank, HSBC Bank, 8/22/16,
Series 0000 (Saudi Arabia) | | | 9,520,208 | |
| | | | | | | | |
| | | | Health Care Facilities 1.1% | | | | |
| | 520,064 | | | Al Mouwasat Medical Services, HSBC Bank, 4/13/15, Series 0002 (Saudi Arabia) | | | 12,480,371 | |
| | | | | | | | |
| | | | Hypermarkets & Super Centers 1.1% | | | | |
| | 251,811 | | | Abdullah Al Othaim Markets, HSBC Bank, 8/13/14, Series 000E (Saudi Arabia) | | | 11,884,370 | |
| | | | | | | | |
| | | | Office Services & Supplies 1.1% | | | | |
| | 226,252 | | | Jarir Marketing Co., HSBC Bank, 5/4/15, Series 000R (Saudi Arabia) | | | 12,427,617 | |
| | | | | | | | |
| | | | Packaged Foods & Meats 0.9% | | | | |
| | 271,565 | | | Halwani Bros Co., HSBC Bank, 5/4/15, Series 000H (Saudi Arabia) | | | 5,575,614 | |
| | 182,205 | | | Saudi Dairy & Foodstuff Co., HSBC Bank, 6/26/15, Series 0000 (Saudi Arabia) | | | 4,639,721 | |
| | | | | | | | |
| | | | 10,215,335 | |
| | | | | | | | |
| | | | Restaurants 1.0% | | | | |
| | 309,723 | | | Herfy Food Services Co., HSBC Bank, 10/8/15, Series 0000 (Saudi Arabia) | | | 11,396,743 | |
| | | | | | | | |
| | | | Trucking 0.4% | | | | |
| | 182,826 | | | United International Transportation, HSBC Bank, 2/23/15, Series 0008 (Saudi Arabia) | | | 4,972,403 | |
| | | | | | | | |
| | |
| | | | Total Participation Notes (cost $64,766,373) | | | 78,185,292 | |
| | | | | | | | |
| | | | | | | |
58
| | |
| | MARCH 31, 2014 (UNAUDITED) |
|
|
|
| | | | | | | | |
Principal Amount | | | | | Value | |
| | | | | | | |
| | | | SHORT-TERM INVESTMENTS 7.2% | | | | |
| | |
| | | | Repurchase Agreement 7.2% | | | | |
| | $80,899,058 | | | Repurchase Agreement dated 3/31/14, 0.00% due 4/1/14 with State Street Bank and Trust Co. collateralized by $75,705,000 of United States Treasury Notes 3.625% due 2/15/21; value: $82,518,450; repurchase proceeds: $80,899,058 (cost $80,899,058) | | $ | 80,899,058 | |
| | | | | | | | |
| | |
| | | | Total Short-Term Investments (cost $80,899,058) | | | 80,899,058 | |
| | | | | | | | |
| | |
| | | | Total Investments (cost $1,013,000,827) 100.0%§ | | | 1,120,603,984 | |
| | |
| | | | Other Assets less Liabilities <0.1% | | | 228,081 | |
| | | | | | | | |
| | |
| | | | NET ASSETS 100.0% | | $ | 1,120,832,065 | |
| | | | | | | | |
| |
| | | | *Non-income producing. §The aggregate amount of foreign securities fair valued pursuant to a systematic valuation model as a percent of net assets was 1.08%. GDR Global Depositary Receipt. See Notes to Financial Statements. | |
At March 31, 2014, Wasatch Frontier Emerging Small Countries Fund’s investments, excluding short-term investments, were in the following countries:
| | | | |
| Country | | % | |
Bangladesh | | | 5.9 | |
Botswana | | | 0.3 | |
Cambodia | | | 1.0 | |
Chile | | | 0.3 | |
Colombia | | | 2.0 | |
Costa Rica | | | 2.4 | |
Croatia | | | 0.8 | |
Egypt | | | 1.7 | |
Ghana | | | 1.5 | |
Indonesia | | | 1.2 | |
Kenya | | | 9.7 | |
Korea | | | <0.1 | |
Kuwait | | | 3.7 | |
Lebanon | | | 0.7 | |
Malaysia | | | 1.1 | |
Mexico | | | 0.6 | |
Morocco | | | 2.3 | |
Namibia | | | <0.1 | |
Nigeria | | | 12.1 | |
Oman | | | 0.8 | |
Pakistan | | | 5.5 | |
Peru | | | 1.5 | |
Philippines | | | 4.5 | |
Qatar | | | 4.1 | |
Saudi Arabia | | | 7.5 | |
Senegal | | | 0.5 | |
South Africa | | | 6.0 | |
Sri Lanka | | | 5.2 | |
Sweden | | | 0.5 | |
Turkey | | | 1.2 | |
Uganda | | | 0.1 | |
United Arab Emirates | | | 7.6 | |
United Kingdom | | | 1.9 | |
Vietnam | | | 4.1 | |
Zimbabwe | | | 1.7 | |
| | | | |
TOTAL | | | 100.0 | % |
| | | | |
59
| | |
| WASATCH GLOBAL OPPORTUNITIES FUND (WAGOX) — Schedule of Investments | | MARCH 31, 2014 (UNAUDITED) |
|
|
|
| | | | | | | | |
| Shares | | | | | Value | |
| | | | | | | |
| | | | COMMON STOCKS 99.1% | | | | |
| | |
| | | | Airlines 1.3% | | | | |
| | 25,423 | | | Allegiant Travel Co. | | $ | 2,845,596 | |
| | | | | | | | |
| | | | Apparel, Accessories & Luxury Goods 1.5% | | | | |
| | 106,470 | | | Salvatore Ferragamo Italia S.p.A. (Italy) | | | 3,133,152 | |
| | | | | | | | |
| | | | Application Software 1.1% | | | | |
| | 17,839 | | | Ultimate Software Group, Inc.* | | | 2,443,943 | |
| | | | | | | | |
| | | | Asset Management & Custody Banks 0.7% | | | | |
| | 46,906 | | | SEI Investments Co. | | | 1,576,511 | |
| | | | | | | | |
| | | | Biotechnology 3.5% | | | | |
| | 452,591 | | | Abcam plc (United Kingdom) | | | 2,935,502 | |
| | 416,917 | | | Biocon Ltd. (India) | | | 2,952,922 | |
| | 37,622 | | | Seattle Genetics, Inc.* | | | 1,714,058 | |
| | | | | | | | |
| | | | | | | 7,602,482 | |
| | | | | | | | |
| | | | Casinos & Gaming 2.6% | | | | |
| | 909,000 | | | Melco International Development Ltd. (China) | | | 3,041,094 | |
| | 2,442,404 | | | NagaCorp Ltd. (Cambodia) | | | 2,544,236 | |
| | | | | | | | |
| | | | | | | 5,585,330 | |
| | | | | | | | |
| | | | Construction & Engineering 2.0% | | | | |
| | 311,320 | | | Promotora y Operadora de Infraestructura S.A.B. de C.V.* (Mexico) | | | 4,178,925 | |
| | | | | | | | |
| | | | Construction Materials 1.4% | | | | |
| | 359,570 | | | Cemex Latam Holdings S.A.* (Colombia) | | | 2,994,031 | |
| | | | | | | | |
| | | | Consumer Finance 3.2% | | | | |
| | 768,427 | | | Mahindra & Mahindra Financial Services Ltd. (India) | | | 3,257,830 | |
| | 62,113 | | | Portfolio Recovery Associates, Inc.* | | | 3,593,858 | |
| | | | | | | | |
| | | | | | | 6,851,688 | |
| | | | | | | | |
| | | | Data Processing & Outsourced Services 4.8% | | | | |
| | 38,599 | | | GMO Payment Gateway, Inc. (Japan) | | | 1,644,264 | |
| | 39,634 | | | Syntel, Inc.* | | | 3,563,096 | |
| | 125,070 | | | Wirecard AG (Germany) | | | 5,187,497 | |
| | | | | | | | |
| | | | | | | 10,394,857 | |
| | | | | | | | |
| | | | Diversified Banks 2.3% | | | | |
| | 1,148,500 | | | Abu Dhabi Commercial Bank PJSC (United Arab Emirates) | | | 2,282,616 | |
| | 1,056,000 | | | National Bank of Ras Al-Khaimah (United Arab Emirates) | | | 2,590,406 | |
| | | | | | | | |
| | | | | | | 4,873,022 | |
| | | | | | | | |
| | | | Diversified Chemicals 1.1% | | | | |
| | 470,272 | | | Pidilite Industries Ltd. (India) | | | 2,417,406 | |
| | | | | | | | |
| | | | Diversified Support Services 1.7% | | | | |
| | 97,480 | | | Copart, Inc.* | | | 3,547,297 | |
| | | | | | | | |
| | | | Drug Retail 1.1% | | | | |
| | 20,270 | | | Cosmos Pharmaceutical Corp. (Japan) | | | 2,372,095 | |
| | | | | | | | |
| | | | Electronic Manufacturing Services 1.5% | | | | |
| | 44,442 | | | IPG Photonics Corp.* | | | 3,158,937 | |
| | | | | | | | |
| | | | Environmental & Facilities Services 0.8% | | | | |
| | 60,965 | | | Tetra Tech, Inc.* | | | 1,803,954 | |
| | | | | | | | |
| | | | Health Care Facilities 1.8% | | | | |
| | 42,781 | | | Ensign Group, Inc. (The) | | | 1,866,963 | |
| | 552,790 | | | Life Healthcare Group Holdings Ltd. (South Africa) | | | 2,024,146 | |
| | | | | | | | |
| | | | | | | 3,891,109 | |
| | | | | | | | |
| | | | | | | | |
| Shares | | | | | Value | |
| | | | | | | |
| | | | Health Care Services 2.5% | | | | |
| | 21,783 | | | Catamaran Corp.* (Canada) | | $ | 975,007 | |
| | 44,680 | | | CorVel Corp.* | | | 2,223,277 | |
| | 46,127 | | | IPC The Hospitalist Co., Inc.* | | | 2,263,913 | |
| | | | | | | | |
| | | | | | | 5,462,197 | |
| | | | | | | | |
| | | | Health Care Technology 1.1% | | | | |
| | 14,293 | | | athenahealth, Inc.* | | | 2,290,310 | |
| | | | | | | | |
| | | | Household Products 1.4% | | | | |
| | 65,274 | | | Pigeon Corp. (Japan) | | | 2,951,597 | |
| | | | | | | | |
| | | | Hypermarkets & Super Centers 1.3% | | | | |
| | 27,370 | | | PriceSmart, Inc. (Costa Rica) | | | 2,762,454 | |
| | | | | | | | |
| | | | Industrial Machinery 3.3% | | | | |
| | 29,317 | | | Graco, Inc. | | | 2,191,153 | |
| | 23,886 | | | IDEX Corp. | | | 1,741,051 | |
| | 69,600 | | | Rotork plc (United Kingdom) | | | 3,071,779 | |
| | | | | | | | |
| | | | | | | 7,003,983 | |
| | | | | | | | |
| | | | Internet Retail 4.4% | | | | |
| | 192,169 | | | MakeMyTrip Ltd.* (India) | | | 5,203,936 | |
| | 100,250 | | | Start Today Co. Ltd. (Japan) | | | 2,571,062 | |
| | 48,780 | | | Yoox S.p.A.* (Italy) | | | 1,667,893 | |
| | | | | | | | |
| | | | | | | 9,442,891 | |
| | | | | | | | |
| | | | Internet Software & Services 4.5% | | | | |
| | 83,234 | | | Envestnet, Inc.* | | | 3,344,342 | |
| | 57,357 | | | SouFun Holdings Ltd. ADR (China) | | | 3,924,366 | |
| | 22,945 | | | SPS Commerce, Inc.* | | | 1,409,971 | |
| | 19,201 | | | Vistaprint N.V.* | | | 945,073 | |
| | | | | | | | |
| | | | | | | 9,623,752 | |
| | | | | | | | |
| | | | IT Consulting & Other Services 3.1% | | | | |
| | 144,252 | | | HCL Technologies Ltd. (India) | | | 3,367,027 | |
| | 107,657 | | | Tech Mahindra Ltd. (India) | | | 3,232,910 | |
| | | | | | | | |
| | | | | | | 6,599,937 | |
| | | | | | | | |
| | | | Leisure Facilities 0.9% | | | | |
| | 37,979 | | | Life Time Fitness, Inc.* | | | 1,826,790 | |
| | | | | | | | |
| | | | Leisure Products 1.3% | | | | |
| | 427,007 | | | Merida Industry Co. Ltd. (Taiwan) | | | 2,832,458 | |
| | | | | | | | |
| | | | Life Sciences Tools & Services 3.1% | | | | |
| | 39,348 | | | Covance, Inc.* | | | 4,088,257 | |
| | 60,175 | | | Fluidigm Corp.* | | | 2,651,912 | |
| | | | | | | | |
| | | | | | | 6,740,169 | |
| | | | | | | | |
| | | | Managed Health Care 1.7% | | | | |
| | 365,871 | | | Qualicorp S.A.* (Brazil) | | | 3,702,266 | |
| | | | | | | | |
| | | | Marine Ports & Services 1.8% | | | | |
| | 1,645,825 | | | International Container Terminal Services, Inc. (Philippines) | | | 3,963,633 | |
| | | | | | | | |
| | | | Oil & Gas Drilling 0.6% | | | | |
| | 53,767 | | | Eurasia Drilling Co. Ltd. GDR (Russia) | | | 1,378,048 | |
| | | | | | | | |
| | | | Oil & Gas Equipment & Services 2.2% | | | | |
| | 6,490 | | | Core Laboratories N.V. | | | 1,287,876 | |
| | 36,510 | | | ShawCor Ltd. (Canada) | | | 1,522,695 | |
| | 57,279 | | | TGS-NOPEC Geophysical Co. ASA (Norway) | | | 1,876,918 | |
| | | | | | | | |
| | | | | | | 4,687,489 | |
| | | | | | | | |
| | | | Oil & Gas Exploration & Production 2.0% | | | | |
| | 636,058 | | | Afren plc* (Nigeria) | | | 1,497,470 | |
| | 190,227 | | | Gran Tierra Energy, Inc.* (Colombia) | | | 1,422,898 | |
| | 135,563 | | | Nostrum Oil & Gas L.P. GDR (Kazakhstan) | | | 1,423,412 | |
| | | | | | | | |
| | | | | | | 4,343,780 | |
| | | | | | | | |
60
| | |
| | MARCH 31, 2014 (UNAUDITED) |
|
|
|
| | | | | | | | |
| Shares | | | | | Value | |
| | | | | | | |
| | | | Packaged Foods & Meats 5.1% | | | | |
| | 481,869 | | | Biostime International Holdings Ltd. (China) | | $ | 3,308,089 | |
| | 137,790 | | | Calbee, Inc. (Japan) | | | 3,247,702 | |
| | 31,630 | | | GlaxoSmithKline Consumer Healthcare Ltd.* (India) | | | 2,277,323 | |
| | 314,000 | | | Viet Nam Dairy Products JSC (Vietnam) | | | 2,098,542 | |
| | | | | | | | |
| | | | | | | 10,931,656 | |
| | | | | | | | |
| | | | Personal Products 1.0% | | | | |
| | 39,044 | | | Herbalife Ltd. | | | 2,236,050 | |
| | | | | | | | |
| | | | Pharmaceuticals 7.8% | | | | |
| | 330,126 | | | IPCA Laboratories Ltd. (India) | | | 4,610,073 | |
| | 394,963 | | | Lupin Ltd. (India) | | | 6,154,009 | |
| | 39,255 | | | Questcor Pharmaceuticals, Inc. | | | 2,548,827 | |
| | 4,030,000 | | | Sino Biopharmaceutical Ltd. (China) | | | 3,429,080 | |
| | | | | | | | |
| | | | | | | 16,741,989 | |
| | | | | | | | |
| | | | Publishing 1.4% | | | | |
| | 67,964 | | | Rightmove plc (United Kingdom) | | | 2,989,376 | |
| | | | | | | | |
| | | | Regional Banks 2.2% | | | | |
| | 21,667 | | | Signature Bank* | | | 2,721,159 | |
| | 250,875 | | | TCS Group Holding plc GDR* (Russia) | | | 2,032,087 | |
| | | | | | | | |
| | | | | | | 4,753,246 | |
| | | | | | | | |
| | | | Research & Consulting Services 1.2% | | | | |
| | 21,205 | | | IHS, Inc., Class A* | | | 2,576,408 | |
| | | | | | | | |
| | | | Semiconductors 1.9% | | | | |
| | 40,443 | | | Microchip Technology, Inc. | | | 1,931,558 | |
| | 32,748 | | | Power Integrations, Inc. | | | 2,154,163 | |
| | | | | | | | |
| | | | | | | 4,085,721 | |
| | | | | | | | |
| | | | Soft Drinks 1.8% | | | | |
| | 156,961 | | | Coca-Cola Icecek A.S. (Turkey) | | | 3,776,274 | |
| | | | | | | | |
| | | | Specialty Stores 2.0% | | | | |
| | 32,560 | | | Hibbett Sports, Inc.* | | | 1,721,773 | |
| | 3,260,207 | | | Sa Sa International Holdings Ltd. (China) | | | 2,605,946 | |
| | | | | | | | |
| | | | | | | 4,327,719 | |
| | | | | | | | |
| | | | Trading Companies & Distributors 2.7% | | | | |
| | 123,056 | | | MonotaRO Co. Ltd. (Japan) | | | 3,130,880 | |
| | 31,856 | | | MSC Industrial Direct Co., Inc., Class A | | | 2,756,181 | |
| | | | | | | | |
| | | | | | | 5,887,061 | |
| | | | | | | | |
| | | | Trucking 3.5% | | | | |
| | 22,044 | | | J.B. Hunt Transport Services, Inc. | | | 1,585,404 | |
| | 141,966 | | | Knight Transportation, Inc. | | | 3,283,674 | |
| | 48,299 | | | Old Dominion Freight Line, Inc.* | | | 2,740,485 | |
| | | | | | | | |
| | | | | | | 7,609,563 | |
| | | | | | | | |
| | | | Wireless Telecommunication Services 0.9% | | | | |
| | 3,653,542 | | | PT Tower Bersama Infrastructure Tbk (Indonesia) | | | 1,937,075 | |
| | | | | | | | |
| | |
| | | | Total Common Stocks (cost $150,046,711) | | | 213,134,227 | |
| | | | | | | | |
| | |
| | | | WARRANTS 0.0% | | | | |
| | |
| | | | Health Care Equipment 0.0% | | | | |
| | 40,000 | | | Cardica, Inc., expiring 9/29/14* *** † | | | 400 | |
| | | | | | | | |
| | |
| | | | Total Warrants (cost $5,000) | | | 400 | |
| | | | | | | | |
| | | | | | | | |
| Shares | | | | | Value | |
| | | | | | | |
| | | | PARTICIPATION NOTES 1.1% | | | | |
| | |
| | | | Office Services & Supplies 1.1% | | | | |
| | 44,000 | | | Jarir Marketing Co., HSBC Bank, 5/4/15, Series 000R (Saudi Arabia) | | $ | 2,416,841 | |
| | | | | | | | |
| | |
| | | | Total Participation Notes (cost $2,283,107) | | | 2,416,841 | |
| | | | | | | | |
| | |
| | | | Total Investments (cost $152,334,818) 100.2%§ | | | 215,551,468 | |
| | |
| | | | Liabilities less Other Assets (0.2%) | | | (350,851 | ) |
| | | | | | | | |
| | |
| | | | NET ASSETS 100.0% | | $ | 215,200,617 | |
| | | | | | | | |
| |
| | | | *Non-income producing. ***Security was fair valued under procedures adopted by the Board of Trustees (see Note 14). †Security purchased in a private placement transaction or under Rule 144A of the Securities Act of 1933 (see Note 10). §The aggregate amount of foreign securities fair valued pursuant to a systematic valuation model as a percent of net assets was 0.90%. ADR American Depositary Receipt. GDR Global Depositary Receipt. See Notes to Financial Statements. | |
At March 31, 2014, Wasatch Global Opportunities Fund’s investments, excluding short-term investments, were in the following countries:
| | | | |
| Country | | % | |
Brazil | | | 1.7 | |
Cambodia | | | 1.2 | |
Canada | | | 1.2 | |
China | | | 7.6 | |
Colombia | | | 2.0 | |
Costa Rica | | | 1.3 | |
Germany | | | 2.4 | |
India | | | 15.5 | |
Indonesia | | | 0.9 | |
Italy | | | 2.2 | |
Japan | | | 7.4 | |
Kazakhstan | | | 0.7 | |
Mexico | | | 1.9 | |
Nigeria | | | 0.7 | |
Norway | | | 0.9 | |
Philippines | | | 1.8 | |
Russia | | | 1.6 | |
Saudi Arabia | | | 1.1 | |
South Africa | | | 0.9 | |
Taiwan | | | 1.3 | |
Turkey | | | 1.7 | |
United Arab Emirates | | | 2.3 | |
United Kingdom | | | 4.2 | |
United States | | | 36.5 | |
Vietnam | | | 1.0 | |
| | | | |
TOTAL | | | 100.0 | % |
| | | | |
61
| | |
| WASATCH HERITAGE GROWTH FUND (WAHGX) — Schedule of Investments | | |
|
|
|
| | | | | | | | |
| Shares | | | | | Value | |
| | | | | | | |
| | | | COMMON STOCKS 93.9% | | | | |
| | |
| | | | Aerospace & Defense 1.9% | | | | |
| | 13,403 | | | TransDigm Group, Inc. | | $ | 2,482,236 | |
| | | | | | | | |
| | | | Airlines 3.7% | | | | |
| | 80,449 | | | Spirit Airlines, Inc.* | | | 4,778,671 | |
| | | | | | | | |
| | | | Apparel Retail 3.3% | | | | |
| | 44,916 | | | Ross Stores, Inc. | | | 3,213,740 | |
| | 31,343 | | | Urban Outfitters, Inc.* | | | 1,143,079 | |
| | | | | | | | |
| | | | | | | 4,356,819 | |
| | | | | | | | |
| | | | Application Software 1.7% | | | | |
| | 27,852 | | | ANSYS, Inc.* | | | 2,145,161 | |
| | | | | | | | |
| | | | Asset Management & Custody Banks 5.0% | | | | |
| | 21,226 | | | Artisan Partners Asset Management, Inc. | | | 1,363,771 | |
| | 111,802 | | | SEI Investments Co. | | | 3,757,665 | |
| | 16,961 | | | T. Rowe Price Group, Inc. | | | 1,396,738 | |
| | | | | | | | |
| | | | | | | 6,518,174 | |
| | | | | | | | |
| | | | Auto Parts & Equipment 1.0% | | | | |
| | 41,306 | | | Gentex Corp. | | | 1,302,378 | |
| | | | | | | | |
| | | | Automotive Retail 1.1% | | | | |
| | 10,016 | | | O’Reilly Automotive, Inc.* | | | 1,486,274 | |
| | | | | | | | |
| | | | Biotechnology 0.8% | | | | |
| | 24,020 | | | Seattle Genetics, Inc.* | | | 1,094,351 | |
| | | | | | | | |
| | | | Communications Equipment 1.5% | | | | |
| | 13,534 | | | F5 Networks, Inc.* | | | 1,443,130 | |
| | 12,191 | | | Ubiquiti Networks, Inc.* | | | 554,325 | |
| | | | | | | | |
| | | | | | | 1,997,455 | |
| | | | | | | | |
| | | | Data Processing & Outsourced Services 2.8% | | | | |
| | 13,141 | | | Alliance Data Systems Corp.* | | | 3,580,266 | |
| | | | | | | | |
| | | | Distributors 2.9% | | | | |
| | 140,825 | | | LKQ Corp.* | | | 3,710,739 | |
| | | | | | | | |
| | | | Diversified Chemicals 1.9% | | | | |
| | 32,902 | | | FMC Corp. | | | 2,518,977 | |
| | | | | | | | |
| | | | Diversified Support Services 4.5% | | | | |
| | 162,508 | | | Copart, Inc.* | | | 5,913,666 | |
| | | | | | | | |
| | | | Electronic Components 4.2% | | | | |
| | 59,169 | | | Amphenol Corp., Class A | | | 5,422,839 | |
| | | | | | | | |
| | | | Electronic Manufacturing Services 1.8% | | | | |
| | 33,729 | | | IPG Photonics Corp.* | | | 2,397,457 | |
| | | | | | | | |
| | | | Health Care Equipment 2.4% | | | | |
| | 47,421 | | | St. Jude Medical, Inc. | | | 3,100,859 | |
| | | | | | | | |
| | | | Health Care Services 2.7% | | | | |
| | 78,519 | | | Catamaran Corp.* (Canada) | | | 3,514,511 | |
| | | | | | | | |
| | | | Health Care Supplies 0.9% | | | | |
| | 23,003 | | | Align Technology, Inc.* | | | 1,191,325 | |
| | | | | | | | |
| | | | Industrial Machinery 2.6% | | | | |
| | 45,487 | | | IDEX Corp. | | | 3,315,547 | |
| | | | | | | | |
| | | | IT Consulting & Other Services 4.8% | | | | |
| | 124,544 | | | Cognizant Technology Solutions Corp., Class A* | | | 6,303,172 | |
| | | | | | | | |
| | |
| | | | Leisure Facilities 0.9% | | | | |
| | 24,556 | | | Life Time Fitness, Inc.* | | | 1,181,144 | |
| | | | | | | | |
| | |
| | | | Life Sciences Tools & Services 4.1% | | | | |
| | 51,900 | | | Covance, Inc.* | | | 5,392,410 | |
| | | | | | | | |
| | | | | | | | |
| Shares | | | | | Value | |
| | | | | | | |
| | |
| | | | Managed Health Care 0.5% | | | | |
| | 10,136 | | | Centene Corp.* | | $ | 630,966 | |
| | | | | | | | |
| | |
| | | | Oil & Gas Equipment & Services 4.7% | | | | |
| | 22,425 | | | CARBO Ceramics, Inc. | | | 3,094,426 | |
| | 15,477 | | | Core Laboratories N.V. | | | 3,071,256 | |
| | | | | | | | |
| | | | | | | 6,165,682 | |
| | | | | | | | |
| | |
| | | | Oil & Gas Exploration & Production 2.8% | | | | |
| | 137,158 | | | Ultra Petroleum Corp.* | | | 3,688,179 | |
| | | | | | | | |
| | |
| | | | Personal Products 1.4% | | | | |
| | 15,754 | | | Herbalife Ltd. | | | 902,231 | |
| | 10,808 | | | Nu Skin Enterprises, Inc., Class A | | | 895,443 | |
| | | | | | | | |
| | | | | | | 1,797,674 | |
| | | | | | | | |
| | |
| | | | Pharmaceuticals 1.4% | | | | |
| | 27,558 | | | Questcor Pharmaceuticals, Inc. | | | 1,789,341 | |
| | | | | | | | |
| | |
| | | | Regional Banks 2.6% | | | | |
| | 26,587 | | | Signature Bank* | | | 3,339,061 | |
| | | | | | | | |
| | |
| | | | Research & Consulting Services 4.0% | | | | |
| | 42,552 | | | IHS, Inc., Class A* | | | 5,170,068 | |
| | | | | | | | |
| | |
| | | | Restaurants 2.4% | | | | |
| | 57,487 | | | Tim Hortons, Inc. (Canada) | | | 3,179,606 | |
| | | | | | | | |
| | |
| | | | Semiconductors 7.0% | | | | |
| | 36,326 | | | Linear Technology Corp. | | | 1,768,713 | |
| | 113,445 | | | Microchip Technology, Inc. | | | 5,418,133 | |
| | 37,261 | | | Silicon Laboratories, Inc.* | | | 1,946,887 | |
| | | | | | | | |
| | | | | | | 9,133,733 | |
| | | | | | | | |
| | |
| | | | Specialized Finance 3.1% | | | | |
| | 15,608 | | | IntercontinentalExchange Group, Inc. | | | 3,087,731 | |
| | 299,451 | | | Power Finance Corp. Ltd. (India) | | | 966,957 | |
| | | | | | | | |
| | | | | | | 4,054,688 | |
| | | | | | | | |
| | |
| | | | Specialty Stores 0.9% | | | | |
| | 26,119 | | | GNC Holdings, Inc., Class A | | | 1,149,758 | |
| | | | | | | | |
| | |
| | | | Technology Distributors 1.4% | | | | |
| | 65,024 | | | CDW Corp. | | | 1,784,259 | |
| | | | | | | | |
| | |
| | | | Trading Companies & Distributors 3.5% | | | | |
| | 53,106 | | | MSC Industrial Direct Co., Inc., Class A | | | 4,594,731 | |
| | | | | | | | |
| | |
| | | | Trucking 1.7% | | | | |
| | 30,703 | | | J.B. Hunt Transport Services, Inc. | | | 2,208,160 | |
| | | | | | | | |
| | |
| | | | Total Common Stocks
(cost $69,922,846) | | | 122,390,337 | |
| | | | | | | | |
62
| | |
| | MARCH 31, 2014 (UNAUDITED) |
|
|
|
| | | | | | | | |
Principal
Amount | | | | | Value | |
| | | | | | | |
| | |
| | | | SHORT-TERM INVESTMENTS 6.2% | | | | |
| | |
| | | | Repurchase Agreement 6.2% | | | | |
| | $8,035,006 | | | Repurchase Agreement dated 3/31/14, 0.00% due 4/1/14 with State Street Bank and Trust Co. collateralized by $7,520,000 of United States Treasury Notes 3.625% due 2/15/21; value: $8,196,800; repurchase proceeds: $8,035,006 (cost $8,035,006) | | $ | 8,035,006 | |
| | | | | | | | |
| | |
| | | | Total Short-Term Investments
(cost $8,035,006) | | | 8,035,006 | |
| | | | | | | | |
| | |
| | | | Total Investments
(cost $77,957,852) 100.1% | | | 130,425,343 | |
| | |
| | | | Liabilities less Other Assets (0.1%) | | | (134,257 | ) |
| | | | | | | | |
| | |
| | | | NET ASSETS 100.0% | | $ | 130,291,086 | |
| | | | | | | | |
| | |
| | | | *Non-income producing. See Notes to Financial Statements. | | | | |
At March 31, 2014, Wasatch Heritage Growth Fund’s investments, excluding short-term investments, were in the following countries:
| | | | |
| Country | | % | |
Canada | | | 5.5 | |
India | | | 0.8 | |
United States | | | 93.7 | |
| | | | |
TOTAL | | | 100.0 | % |
| | | | |
63
| | |
| WASATCH INTERNATIONAL GROWTH FUND (WAIGX) — Schedule of Investments | | |
|
|
|
| | | | | | | | |
| Shares | | | | | Value | |
| | | | | | | |
| | | | COMMON STOCKS 94.5% | | | | |
| | |
| | | | Apparel, Accessories & Luxury Goods 1.5% | | | | |
| | 853,766 | | | Salvatore Ferragamo Italia S.p.A. (Italy) | | $ | 25,124,250 | |
| | | | | | | | |
| | | | Application Software 4.2% | | | | |
| | 509,012 | | | Aveva Group plc (United Kingdom) | | | 17,771,805 | |
| | 887,292 | | | Computer Modelling Group Ltd. (Canada) | | | 23,407,459 | |
| | 4,679,359 | | | Diligent Board Member Services, Inc.* ‡‡ (New Zealand) | | | 16,833,657 | |
| | 1,236,211 | | | Fusionex International plc (United Kingdom) | | | 11,181,992 | |
| | | | | | | | |
| | | | | | | 69,194,913 | |
| | | | | | | | |
| | | | Asset Management & Custody Banks 1.3% | | | | |
| | 14,388,244 | | | ARA Asset Management Ltd. (Singapore) | | | 21,089,422 | |
| | | | | | | | |
| | | | Biotechnology 2.0% | | | | |
| | 5,191,688 | | | Abcam plc (United Kingdom) | | | 33,673,250 | |
| | | | | | | | |
| | | | Brewers 1.2% | | | | |
| | 123,059 | | | Royal UNIBREW A/S (Denmark) | | | 20,472,950 | |
| | | | | | | | |
| | | | Casinos & Gaming 3.4% | | | | |
| | 10,019,551 | | | Melco International Development Ltd. (China) | | | 33,520,788 | |
| | 21,545,134 | | | NagaCorp Ltd. (Cambodia) | | | 22,443,427 | |
| | | | | | | | |
| | | | | | | 55,964,215 | |
| | | | | | | | |
| | | | Commodity Chemicals 0.8% | | | | |
| | 526,255 | | | Tikkurila Oyj (Finland) | | | 12,392,019 | |
| | | | | | | | |
| | | | Construction Machinery & Heavy Trucks 0.4% | | | | |
| | 271,598 | | | Takeuchi Manufacturing Co. Ltd. (Japan) | | | 6,936,548 | |
| | | | | | | | |
| | | | Construction Materials 2.4% | | | | |
| | 2,625,819 | | | Cemex Latam Holdings S.A.* (Colombia) | | | 21,864,404 | |
| | 8,978,016 | | | PT Indocement Tunggal Prakarsa Tbk (Indonesia) | | | 18,589,225 | |
| | | | | | | | |
| | | | | | | 40,453,629 | |
| | | | | | | | |
| | | | Consumer Finance 1.0% | | | | |
| | 4,031,947 | | | Mahindra & Mahindra Financial Services Ltd. (India) | | | 17,093,876 | |
| | | | | | | | |
| | | | Data Processing & Outsourced Services 3.0% | | | | |
| | 153,100 | | | GMO Payment Gateway, Inc. (Japan) | | | 6,521,847 | |
| | 1,032,905 | | | Wirecard AG (Germany) | | | 42,841,541 | |
| | | | | | | | |
| | | | | | | 49,363,388 | |
| | | | | | | | |
| | | | Diversified Support Services 0.5% | | | | |
| | 553,864 | | | NAC Co. Ltd. (Japan) | | | 8,679,738 | |
| | | | | | | | |
| | | | Drug Retail 3.1% | | | | |
| | 269,165 | | | Cosmos Pharmaceutical Corp. (Japan) | | | 31,499,004 | |
| | 437,900 | | | Sugi Holdings Co. Ltd. (Japan) | | | 19,482,524 | |
| | | | | | | | |
| | | | | | | 50,981,528 | |
| | | | | | | | |
| | | | Electronic Equipment & Instruments 5.4% | | | | |
| | 579,789 | | | Axis Communications AB (Sweden) | | | 19,837,302 | |
| | 1,662,614 | | | Halma plc (United Kingdom) | | | 15,967,641 | |
| | 691,853 | | | LPKF Laser & Electronics AG (Germany) | | | 16,162,831 | |
| | 1,156,038 | | | Oxford Instruments plc (United Kingdom) | | | 24,421,682 | |
| | 410,935 | | | Renishaw plc (United Kingdom) | | | 13,360,865 | |
| | | | | | | | |
| | | | | | | 89,750,321 | |
| | | | | | | | |
| | | | General Merchandise Stores 2.5% | | | | |
| | 204,928 | | | Ryohin Keikaku Co. Ltd. (Japan) | | | 19,765,992 | |
| | 571,295 | | | Seria Co. Ltd. (Japan) | | | 21,204,244 | |
| | | | | | | | |
| | | | | | | 40,970,236 | |
| | | | | | | | |
| | | | | | | | |
| Shares | | | | | Value | |
| | | | | | | |
| | | | Health Care Equipment 1.3% | | | | |
| | 1,554,592 | | | Elekta AB, Class B (Sweden) | | $ | 20,702,291 | |
| | | | | | | | |
| | | | Health Care Supplies 0.8% | | | | |
| | 62,929 | | | Sartorius Stedim Biotech (France) | | | 12,621,502 | |
| | | | | | | | |
| | | | Health Care Technology 2.6% | | | | |
| | 837,691 | | | EMIS Group plc (United Kingdom) | | | 9,050,774 | |
| | 2,080,200 | | | M3, Inc. (Japan) | | | 34,193,962 | |
| | | | | | | | |
| | | | | | | 43,244,736 | |
| | | | | | | | |
| | | | Household Products 2.3% | | | | |
| | 858,672 | | | Pigeon Corp. (Japan) | | | 38,827,922 | |
| | | | | | | | |
| | | | Human Resource & Employment Services 1.2% | | | | |
| | 111,903 | | | 51job, Inc. ADR* (China) | | | 7,973,089 | |
| | 776,374 | | | Seek Ltd. (Australia) | | | 12,643,062 | |
| | | | | | | | |
| | | | | | | 20,616,151 | |
| | | | | | | | |
| | | | Hypermarkets & Super Centers 0.5% | | | | |
| | 82,478 | | | PriceSmart, Inc. (Costa Rica) | | | 8,324,505 | |
| | | | | | | | |
| | | | Industrial Machinery 2.4% | | | | |
| | 2,962,970 | | | Mincon Group plc* (Ireland) | | | 4,202,563 | |
| | 802,724 | | | Rotork plc (United Kingdom) | | | 35,428,032 | |
| | | | | | | | |
| | | | | | | 39,630,595 | |
| | | | | | | | |
| | | | Internet Retail 6.2% | | | | |
| | 197,921 | | | ASOS plc* (United Kingdom) | | | 17,110,688 | |
| | 267,300 | | | Oisix, Inc.* (Japan) | | | 6,712,652 | |
| | 1,555,914 | | | Start Today Co. Ltd. (Japan) | | | 39,903,748 | |
| | 109,029 | | | Vipshop Holdings Ltd. ADR* (China) | | | 16,278,030 | |
| | 1,673,402 | | | Webjet Ltd. (Australia) | | | 4,265,231 | |
| | 544,769 | | | Yoox S.p.A.* (Italy) | | | 18,626,825 | |
| | | | | | | | |
| | | | | | | 102,897,174 | |
| | | | | | | | |
| | | | Internet Software & Services 4.3% | | | | |
| | 1,584,126 | | | carsales.com Ltd. (Australia) | | | 15,930,485 | |
| | 5,657,607 | | | econtext Asia Ltd.* (Japan) | | | 2,968,628 | |
| | 646,714 | | | Infomart Corp. (Japan) | | | 10,837,660 | |
| | 1,377,725 | | | Kakaku.com, Inc. (Japan) | | | 22,446,269 | |
| | 286,656 | | | SouFun Holdings Ltd. ADR (China) | | | 19,613,004 | |
| | | | | | | | |
| | | | | | | 71,796,046 | |
| | | | | | | | |
| | | | Leisure Products 1.5% | | | | |
| | 3,646,006 | | | Merida Industry Co. Ltd. (Taiwan) | | | 24,184,984 | |
| | | | | | | | |
| | | | Life & Health Insurance 0.9% | | | | |
| | 1,827,333 | | | Discovery Ltd. (South Africa) | | | 14,659,322 | |
| | | | | | | | |
| | | | Marine Ports & Services 1.6% | | | | |
| | 10,952,268 | | | International Container Terminal Services, Inc. (Philippines) | | | 26,376,295 | |
| | | | | | | | |
| | | | Movies & Entertainment 2.3% | | | | |
| | 559,092 | | | CTS Eventim AG (Germany) | | | 37,263,048 | |
| | | | | | | | |
| | | | Oil & Gas Drilling 0.9% | | | | |
| | 610,474 | | | Eurasia Drilling Co. Ltd. GDR (Russia) | | | 15,646,449 | |
| | | | | | | | |
| | | | Oil & Gas Equipment & Services 5.3% | | | | |
| | 155,640 | | | Dril-Quip, Inc.* | | | 17,447,244 | |
| | 146,814 | | | Schoeller-Bleckmann Oilfield Equipment AG (Austria) | | | 17,160,209 | |
| | 510,619 | | | ShawCor Ltd. (Canada) | | | 21,296,002 | |
| | 958,211 | | | TGS-NOPEC Geophysical Co. ASA (Norway) | | | 31,398,661 | |
| | | | | | | | |
| | | | | | | 87,302,116 | |
| | | | | | | | |
64
| | |
| | MARCH 31, 2014 (UNAUDITED) |
|
|
|
| | | | | | | | |
Shares | | | | | Value | |
| | | | | | | |
| | | | Oil & Gas Exploration & Production 2.8% | | | | |
| | 6,222,601 | | | Afren plc* (Nigeria) | | $ | 14,649,861 | |
| | 1,119,797 | | | Caracal Energy, Inc.* (Canada) | | | 6,478,816 | |
| | 1,717,763 | | | Gran Tierra Energy, Inc.* (Colombia) | | | 12,848,867 | |
| | 1,181,024 | | | Nostrum Oil & Gas L.P. GDR (Kazakhstan) | | | 12,400,752 | |
| | | | | | | | |
| | | | | | | 46,378,296 | |
| | | | | | | | |
| | | | Packaged Foods & Meats 4.7% | | | | |
| | 1,515,929 | | | Calbee, Inc. (Japan) | | | 35,730,353 | |
| | 2,685,990 | | | Super Group Ltd. (Singapore) | | | 7,425,816 | |
| | 24,047,514 | | | Vitasoy International Holdings Ltd. (Hong Kong) | | | 34,846,976 | |
| | | | | | | | |
| | | | | | | 78,003,145 | |
| | | | | | | | |
| | | | Pharmaceuticals 1.3% | | | | |
| | 346,372 | | | Sawai Pharmaceutical Co. Ltd. (Japan) | | | 21,275,385 | |
| | | | | | | | |
| | | | Property & Casualty Insurance 1.4% | | | | |
| | 8,412,356 | | | Qualitas Controladora S.A.B. de C.V.** (Mexico) | | | 22,871,404 | |
| | | | | | | | |
| | | | Publishing 2.5% | | | | |
| | 927,549 | | | Rightmove plc (United Kingdom) | | | 40,797,965 | |
| | | | | | | | |
| | | | Real Estate Operating Companies 0.7% | | | | |
| | 523,275 | | | Multiplan Empreendimentos Imobiliarios S.A. (Brazil) | | | 11,171,506 | |
| | | | | | | | |
| | | | Research & Consulting Services 3.1% | | | | |
| | 303,459 | | | DKSH Holding AG (Switzerland) | | | 24,133,908 | |
| | 996,489 | | | Nihon M&A Center, Inc. (Japan) | | | 26,726,462 | |
| | | | | | | | |
| | | | | | | 50,860,370 | |
| | | | | | | | |
| | | | Restaurants 3.6% | | | | |
| | 1,999,779 | | | Domino’s Pizza Enterprises Ltd. (Australia) | | | 37,069,911 | |
| | 2,352,558 | | | Domino’s Pizza Group plc (United Kingdom) | | | 21,632,799 | |
| | | | | | | | |
| | | | | | | 58,702,710 | |
| | | | | | | | |
| | | | Soft Drinks 1.7% | | | | |
| | 1,162,033 | | | Coca-Cola Icecek A.S. (Turkey) | | | 27,956,974 | |
| | | | | | | | |
| | | | Specialty Chemicals 2.2% | | | | |
| | 472,561 | | | Chr Hansen Holding A/S (Denmark) | | | 18,739,450 | |
| | 209,006 | | | Hexpol AB (Sweden) | | | 18,410,148 | |
| | | | | | | | |
| | | | | | | 37,149,598 | |
| | | | | | | | |
| | | | Specialty Stores 1.1% | | | | |
| | 23,715,331 | | | Sa Sa International Holdings Ltd. (China) | | | 18,956,122 | |
| | | | | | | | |
| | | | Thrifts & Mortgage Finance 0.7% | | | | |
| | 2,475,083 | | | Gruh Finance Ltd. (India) | | | 12,267,145 | |
| | | | | | | | |
| | | | Trading Companies & Distributors 1.9% | | | | |
| | 1,174,303 | | | AddTech AB, Class B (Sweden) | | | 18,448,347 | |
| | 525,136 | | | MonotaRO Co. Ltd. (Japan) | | | 13,360,891 | |
| | | | | | | | |
| | | | | | | 31,809,238 | |
| | | | | | | | |
| | |
| | | | Total Common Stocks (cost $1,295,990,540) | | | 1,564,433,277 | |
| | | | | | | | |
| | | | | | | | |
Principal
Amount | | | | | Value | |
| | | | | | | |
| | | | SHORT-TERM INVESTMENTS 5.6% | | | | |
| | |
| | | | Repurchase Agreement 5.6% | | | | |
| | $92,554,493 | | | Repurchase Agreement dated 3/31/14, 0.00% due 4/1/14 with State Street Bank and Trust Co. collateralized by $86,615,000 of United States Treasury Notes 3.625% due 2/15/21; value: $94,410,350; repurchase proceeds: $92,554,493 (cost $92,554,493) | | $ | 92,554,493 | |
| | | | | | | | |
| | |
| | | | Total Short-Term Investments (cost $92,554,493) | | | 92,554,493 | |
| | | | | | | | |
| | |
| | | | Total Investments (cost $1,388,545,033) 100.1%§ | | | 1,656,987,770 | |
| | |
| | | | Liabilities less Other Assets (0.1%) | | | (1,914,371 | ) |
| | | | | | | | |
| | |
| | | | NET ASSETS 100.0% | | $ | 1,655,073,399 | |
| | | | | | | | |
| |
| | | | *Non-income producing. **Common units. ‡‡Affiliated company (see Note 9). §The aggregate amount of foreign securities fair valued pursuant to a systematic valuation model as a percent of net assets was 1.12%. ADR American Depositary Receipt. GDR Global Depositary Receipt. See Notes to Financial Statements. | |
At March 31, 2014, Wasatch International Growth Fund’s investments, excluding short-term investments, were in the following countries:
| | | | |
| Country | | % | |
Australia | | | 4.5 | |
Austria | | | 1.1 | |
Brazil | | | 0.7 | |
Cambodia | | | 1.4 | |
Canada | | | 3.3 | |
China | | | 6.2 | |
Colombia | | | 2.2 | |
Costa Rica | | | 0.5 | |
Denmark | | | 2.5 | |
Finland | | | 0.8 | |
France | | | 0.8 | |
Germany | | | 6.2 | |
Hong Kong | | | 2.2 | |
India | | | 1.9 | |
Indonesia | | | 1.2 | |
Ireland | | | 0.3 | |
Italy | | | 2.8 | |
Japan | | | 23.5 | |
Kazakhstan | | | 0.8 | |
Mexico | | | 1.5 | |
New Zealand | | | 1.1 | |
Nigeria | | | 0.9 | |
Norway | | | 2.0 | |
Philippines | | | 1.7 | |
Russia | | | 1.0 | |
Singapore | | | 1.8 | |
South Africa | | | 0.9 | |
Sweden | | | 4.9 | |
Switzerland | | | 1.5 | |
Taiwan | | | 1.5 | |
Turkey | | | 1.8 | |
United Kingdom | | | 15.4 | |
United States | | | 1.1 | |
| | | | |
TOTAL | | | 100.0 | % |
| | | | |
65
| | |
| WASATCH INTERNATIONAL OPPORTUNITIES FUND (WAIOX) — Schedule of Investments | | |
|
|
|
| | | | | | | | |
| Shares | | | | | Value | |
| | | | | | | |
| | | | COMMON STOCKS 93.5% | | | | |
| | |
| | | | Apparel Retail 2.4% | | | | |
| | 804,622 | | | Apranga PVA (Lithuania) | | $ | 2,969,453 | |
| | 8,321,590 | | | Padini Holdings Berhad (Malaysia) | | | 4,867,321 | |
| | | | | | | | |
| | | | | | | 7,836,774 | |
| | | | | | | | |
| | | | Apparel, Accessories & Luxury Goods 1.3% | | | | |
| | 132,987 | | | Delta-Galil Industries Ltd. (Israel) | | | 4,193,490 | |
| | | | | | | | |
| | | | Application Software 2.3% | | | | |
| | 163,000 | | | Computer Modelling Group Ltd. (Canada) | | | 4,300,068 | |
| | 165,375 | | | Linx S.A. (Brazil) | | | 3,252,812 | |
| | | | | | | | |
| | | | | | | 7,552,880 | |
| | | | | | | | |
| | | | Asset Management & Custody Banks 0.3% | | | | |
| | 509,000 | | | Peregrine Holdings Ltd. (South Africa) | | | 907,943 | |
| | | | | | | | |
| | | | Auto Parts & Equipment 0.8% | | | | |
| | 76,361 | | | WABCO India Ltd. (India) | | | 2,569,980 | |
| | | | | | | | |
| | | | Biotechnology 0.7% | | | | |
| | 384,178 | | | Abcam plc (United Kingdom) | | | 2,491,776 | |
| | | | | | | | |
| | | | Brewers 6.1% | | | | |
| | 362,475 | | | Carlsberg Brewery Malaysia Berhad (Malaysia) | | | 1,445,238 | |
| | 9,284,913 | | | International Breweries plc (Nigeria) | | | 1,429,443 | |
| | 194,166 | | | Olvi Oyj, Class A (Finland) | | | 6,657,670 | |
| | 54,247 | | | Royal UNIBREW A/S (Denmark) | | | 9,024,908 | |
| | 1,227,502 | | | Turk Tuborg Bira ve Malt Sanayii A.S.* (Turkey) | | | 1,559,752 | |
| | | | | | | | |
| | | | | | | 20,117,011 | |
| | | | | | | | |
| | | | Building Products 1.7% | | | | |
| | 716,251 | | | Dynasty Ceramic Public Co. Ltd. (Thailand) | | | 1,159,161 | |
| | 753,242 | | | Kajaria Ceramics Ltd. (India) | | | 4,439,552 | |
| | | | | | | | |
| | | | | | | 5,598,713 | |
| | | | | | | | |
| | | | Commodity Chemicals 4.4% | | | | |
| | 1,224,627 | | | Berger Paints India Ltd. (India) | | | 4,694,685 | |
| | 134,965 | | | Sniezka S.A. (Poland) | | | 1,892,102 | |
| | 350,857 | | | Supreme Industries Ltd. (India) | | | 2,937,981 | |
| | 130,700 | | | Tikkurila Oyj (Finland) | | | 3,077,666 | |
| | 764,500 | | | Yung Chi Paint & Varnish Manufacturing Co. Ltd. (Taiwan) | | | 1,965,696 | |
| | | | | | | | |
| | | | | | | 14,568,130 | |
| | | | | | | | |
| | | | Communications Equipment 0.3% | | | | |
| | 37,569 | | | Ituran Location and Control Ltd. (Israel) | | | 933,732 | |
| | | | | | | | |
| | | | Computer & Electronics Retail 0.4% | | | | |
| | 292,708 | | | Teknosa Ic Ve Dis Ticaret A.S. (Turkey) | | | 1,469,967 | |
| | | | | | | | |
| | | | Construction & Engineering 0.6% | | | | |
| | 51,900 | | | Badger Daylighting Ltd. (Canada) | | | 1,950,916 | |
| | | | | | | | |
| | | | Construction Machinery & Heavy Trucks 1.2% | | | | |
| | 41,645 | | | Eicher Motors Ltd. (India) | | | 4,138,525 | |
| | | | | | | | |
| | | | Construction Materials 0.8% | | | | |
| 4,766,503 | | | Diamond Building Products Public Co. Ltd. (Thailand) | | | 881,598 | |
| | 45,522,071 | | | PT Semen Baturaja* (Indonesia) | | | 1,737,938 | |
| | | | | | | | |
| | | | | | | 2,619,536 | |
| | | | | | | | |
| | | | Data Processing & Outsourced Services 1.7% | | | | |
| | 6,361,000 | | | My EG Services Berhad (Malaysia) | | | 5,512,672 | |
| | | | | | | | |
| | | | | | | | |
| Shares | | | | | Value | |
| | | | | | | |
| | | | Department Stores 2.3% | | | | |
| | 1,921,057 | | | Parkson Retail Asia Ltd. (Malaysia) | | $ | 1,434,593 | |
| | 964,853 | | | Poya Co. Ltd. (Taiwan) | | | 6,273,406 | |
| | | | | | | | |
| | | | | | | 7,707,999 | |
| | | | | | | | |
| | | | Distillers & Vintners 1.0% | | | | |
| | 2,015,680 | | | Capevin Holdings Ltd. (South Africa) | | | 1,399,112 | |
| | 1,100,000 | | | Watt’s Alimentos S.A. (Chile) | | | 1,953,534 | |
| | | | | | | | |
| | | | | | | 3,352,646 | |
| | | | | | | | |
| | | | Diversified Banks 1.0% | | | | |
| | 5,090,000 | | | EastWest Banking Corp.* (Philippines) | | | 3,246,159 | |
| | | | | | | | |
| | | | Diversified Real Estate Activities 0.5% | | | | |
| | 1,040,300 | | | Delta Corp. Ltd. (India) | | | 1,720,987 | |
| | | | | | | | |
| | | | Diversified Support Services 1.0% | | | | |
| | 105,711 | | | NAC Co. Ltd. (Japan) | | | 1,656,623 | |
| | 371,000 | | | Vicom Ltd. (Singapore) | | | 1,750,737 | |
| | | | | | | | |
| | | | | | | 3,407,360 | |
| | | | | | | | |
| | | | Drug Retail 1.2% | | | | |
| | 60,900 | | | Kusuri No Aoki Co. Ltd. (Japan) | | | 3,935,704 | |
| | | | | | | | |
| | | | Electrical Components & Equipment 1.3% | | | | |
| | 648,140 | | | Amara Raja Batteries Ltd. (India) | | | 4,275,895 | |
| | | | | | | | |
| | | | Fertilizers & Agricultural Chemicals 0.5% | | | | |
| | 581,810 | | | Rallis India Ltd. (India) | | | 1,671,221 | |
| | | | | | | | |
| | | | Food Distributors 0.7% | | | | |
| | 8,606,200 | | | Premier Marketing Public Co. Ltd. (Thailand) | | | 2,281,545 | |
| | | | | | | | |
| | | | Food Retail 6.0% | | | | |
| | 2,249,000 | | | BreadTalk Group Ltd. (Singapore) | | | 2,206,566 | |
| | 3,345,000 | | | Choppies Enterprises Ltd. (Botswana) | | | 1,563,453 | |
| | 3,915,100 | | | Convenience Retail Asia Ltd. (Hong Kong) | | | 2,745,809 | |
| | 2,432,810 | | | Philippine Seven Corp. (Philippines) | | | 5,262,182 | |
| | 32,300,000 | | | PT Sumber Alfaria Trijaya Tbk (Indonesia) | | | 1,481,527 | |
| | 106,070 | | | Rami Levi Chain Stores Hashikma Marketing 2006 Ltd. (Israel) | | | 6,166,436 | |
| | 1,164,000 | | | Sheng Siong Group Ltd. (Singapore) | | | 550,213 | |
| | | | | | | | |
| | | | | | | 19,976,186 | |
| | | | | | | | |
| | | | General Merchandise Stores 1.4% | | | | |
| | 98,972 | | | Seria Co. Ltd. (Japan) | | | 3,673,455 | |
| | 104,000 | | | Watts Co. Ltd. (Japan) | | | 938,528 | |
| | | | | | | | |
| | | | | | | 4,611,983 | |
| | | | | | | | |
| | | | Health Care Facilities 1.9% | | | | |
| | 143,600 | | | MD Medical Group Investments plc GDR (Russia) | | | 1,219,164 | |
| | 430,957 | | | NMC Health plc (United Arab Emirates) | | | 3,625,117 | |
| | 562,788 | | | Raffles Medical Group Ltd. (Singapore) | | | 1,435,193 | |
| | | | | | | | |
| | | | | | | 6,279,474 | |
| | | | | | | | |
| | | | Health Care Supplies 0.9% | | | | |
| | 138,500 | | | St. Shine Optical Co. Ltd. (Taiwan) | | | 3,088,137 | |
| | | | | | | | |
| | | | Home Improvement Retail 1.2% | | | | |
| | 139,513 | | | Cashbuild Ltd. (South Africa) | | | 1,804,105 | |
| | 33,496,700 | | | PT Ace Hardware Indonesia Tbk (Indonesia) | | | 2,220,086 | |
| | | | | | | | |
| | | | | | | 4,024,191 | |
| | | | | | | | |
| | | | Household Products 3.1% | | | | |
| | 7,450,700 | | | DSG International Thailand Public Co. Ltd. (Thailand) | | | 2,526,439 | |
| | 493,300 | | | Jyothy Laboratories Ltd. (India) | | | 1,709,793 | |
| | 135,505 | | | Pigeon Corp. (Japan) | | | 6,127,343 | |
| | | | | | | | |
| | | | | | | 10,363,575 | |
| | | | | | | | |
66
| | |
| | MARCH 31, 2014 (UNAUDITED) |
|
|
|
| | | | | | | | |
| Shares | | | | | Value | |
| | | | | | | |
| | | | Industrial Machinery 2.3% | | | | |
| | 854,171 | | | Howden Africa Holdings Ltd. (South Africa) | | $ | 3,574,410 | |
| | 2,094,814 | | | Sarine Technologies Ltd. (Israel) | | | 4,127,220 | |
| | | | | | | | |
| | | | | | | 7,701,630 | |
| | | | | | | | |
| | | | Internet Retail 1.2% | | | | |
| | 126,800 | | | Ikyu Corp. (Japan) | | | 1,443,272 | |
| | 50,429 | | | Oisix, Inc.* (Japan) | | | 1,266,414 | |
| | 529,300 | | | Webjet Ltd. (Australia) | | | 1,349,100 | |
| | | | | | | | |
| | | | | | | 4,058,786 | |
| | | | | | | | |
| | | | Internet Software & Services 2.8% | | | | |
| | 35,677 | | | AuFeminin.com S.A.* (France) | | | 1,581,954 | |
| | 1,391,491 | | | econtext Asia Ltd.* (Japan) | | | 730,135 | |
| | 185,200 | | | Infomart Corp. (Japan) | | | 3,103,589 | |
| | 169,633 | | | iomart Group plc (United Kingdom) | | | 697,902 | |
| | 202,000 | | | PChome Online, Inc. (Taiwan) | | | 1,512,388 | |
| | 37,000 | | | SMS Co. Ltd.* (Japan) | | | 723,090 | |
| | 7,290 | | | XING AG (Germany) | | | 1,048,040 | |
| | | | | | | | |
| | | | | | | 9,397,098 | |
| | | | | | | | |
| | | | IT Consulting & Other Services 1.1% | | | | |
| | 449,494 | | | EOH Holdings Ltd. (South Africa) | | | 3,526,030 | |
| | | | | | | | |
| | | | Leisure Products 0.8% | | | | |
| | 150,000 | | | Samchuly Bicycle Co. Ltd. (Korea) | | | 2,529,475 | |
| | | | | | | | |
| | | | Metal & Glass Containers 0.9% | | | | |
| | 119,158 | | | Winpak Ltd. (Canada) | | | 2,996,872 | |
| | | | | | | | |
| | | | Multi-Line Insurance 1.1% | | | | |
| | 17,165,300 | | | British-American Investments Co. Kenya Ltd. (Kenya) | | | 3,635,706 | |
| | | | | | | | |
| | | | Office Services & Supplies 0.6% | | | | |
| | 92,804 | | | Adel Kalemcilik Ticaret ve Sanayi A.S. (Turkey) | | | 2,063,660 | |
| | | | | | | | |
| | | | Oil & Gas Refining & Marketing 1.6% | | | | |
| | 12,619 | | | Hankook Shell Oil Co. Ltd. (Korea) | | | 5,500,696 | |
| | | | | | | | |
| | | | Packaged Foods & Meats 14.2% | | | | |
| | 71,120 | | | Agro Tech Foods Ltd. (India) | | | 614,831 | |
| | 1,293,927 | | | Cloetta AB, Class B* (Sweden) | | | 4,714,815 | |
| | 1,326,560 | | | Clover Industries Ltd. (South Africa) | | | 2,436,925 | |
| | 2,853,500 | | | Del Monte Pacific Ltd. (Singapore) | | | 1,416,832 | |
| | 81,100 | | | Dutch Lady Milk Industries Berhad (Malaysia) | | | 1,176,701 | |
| | 1,069,300 | | | Grupo Herdez S.A.B. de C.V. (Mexico) | | | 3,175,657 | |
| | 219,700 | | | Hup Seng Industries Berhad (Malaysia) | | | 524,777 | |
| | 2,020,362 | | | Oldtown Berhad (Malaysia) | | | 1,225,024 | |
| | 421,856 | | | Petra Foods Ltd. (Singapore) | | | 1,236,662 | |
| | 471,561 | | | Pinar Sut Mamulleri Sanayii A.S. (Turkey) | | | 3,888,186 | |
| | 4,626,000 | | | PT Ultrajaya Milk Industry & Trading Co. Tbk* (Indonesia) | | | 1,604,353 | |
| | 50,174,981 | | | RFM Corp. (Philippines) | | | 6,522,916 | |
| | 575,800 | | | Super Group Ltd. (Singapore) | | | 1,591,884 | |
| | 2,363,435 | | | TAT Gida Sanayi A.S.* (Turkey) | | | 2,086,748 | |
| | 269,681 | | | Vigor Alimentos S.A. (Brazil) | | | 749,114 | |
| | 3,743,120 | | | Vitasoy International Holdings Ltd. (Hong Kong) | | | 5,424,112 | |
| | 19,788 | | | Wawel S.A. (Poland) | | | 8,926,622 | |
| | | | | | | | |
| | | | | | | 47,316,159 | |
| | | | | | | | |
| | | | Pharmaceuticals 0.6% | | | | |
| | 1,704,177 | | | Lee’s Pharmaceutical Holdings Ltd. (China) | | | 1,977,360 | |
| | | | | | | | |
| | | | Publishing 0.5% | | | | |
| | 526,000 | | | Morningstar Japan KK (Japan) | | | 1,638,407 | |
| | | | | | | | |
| | | | Regional Banks 0.6% | | | | |
| | 345,400 | | | Banregio Grupo Financiero S.A.B. de C.V. (Mexico) | | | 2,005,304 | |
| | | | | | | | |
| | | | | | | | |
| Shares | | | | | Value | |
| | | | | | | |
| | | | Research & Consulting Services 2.0% | | | | |
| | 244,575 | | | Nihon M&A Center, Inc. (Japan) | | $ | 6,559,656 | |
| | | | | | | | |
| | | | Restaurants 8.5% | | | | |
| | 29,500 | | | B-R31 Ice Cream Co. Ltd. (Japan) | | | 1,205,133 | |
| | 381,125 | | | Domino’s Pizza Enterprises Ltd. (Australia) | | | 7,064,916 | |
| | 450,900 | | | Fairwood Holdings Ltd. (Hong Kong) | | | 911,496 | |
| | 696,953 | | | Famous Brands Ltd. (South Africa) | | | 6,577,879 | |
| | 249,900 | | | Hiday Hidaka Corp. (Japan) | | | 5,063,230 | |
| | 38,600 | | | Monogatari Corp. (The) (Japan) | | | 1,213,566 | |
| | 2,269,963 | | | Spur Corp. Ltd. (South Africa) | | | 6,151,369 | |
| | | | | | | | |
| | | | | | | 28,187,589 | |
| | | | | | | | |
| | | | Soft Drinks 3.0% | | | | |
| | 1,866,500 | | | Corp. Lindley S.A. (Peru) | | | 1,568,432 | |
| | 1,091,325 | | | Hey Song Corp. (Taiwan) | | | 1,180,828 | |
| | 65,981,632 | | | Pepsi-Cola Products Philippines, Inc. (Philippines) | | | 7,209,499 | |
| | | | | | | | |
| | | | | | | 9,958,759 | |
| | | | | | | | |
| | | | Specialty Chemicals 1.4% | | | | |
| | 5,017,000 | | | Chemical and Allied Products plc (Nigeria) | | | 1,173,014 | |
| | 673,719 | | | DuluxGroup Ltd. (Australia) | | | 3,578,022 | |
| | | | | | | | |
| | | | | | | 4,751,036 | |
| | | | | | | | |
| | | | Tobacco 0.3% | | | | |
| | 3,589 | | | Karelia Tobacco Co., Inc. S.A. (Greece) | | | 1,013,158 | |
| | | | | | | | |
| | | | Trading Companies & Distributors 1.0% | | | | |
| | 104,379 | | | AddTech AB, Class B (Sweden) | | | 1,639,798 | |
| | 33,727 | | | Indutrade AB (Sweden) | | | 1,609,085 | |
| | | | | | | | |
| | | | | | | 3,248,883 | |
| | | | | | | | |
| | |
| | | | Total Common Stocks (cost $242,158,397) | | | 310,471,371 | |
| | | | | | | | |
| | |
Principal
Amount | | | | | Value | |
| | | | | | | |
| | | | SHORT-TERM INVESTMENTS 6.4% | | | | |
| | |
| | | | Repurchase Agreement 6.4% | | | | |
| | $21,206,478 | | | Repurchase Agreement dated 3/31/14, 0.00% due 4/1/14 with State Street Bank and Trust Co. collateralized by $22,065,000 of United States Treasury Notes 2.000% due 2/28/21; value: $21,633,298; repurchase proceeds: $21,206,478 (cost $21,206,478) | | $ | 21,206,478 | |
| | | | | | | | |
| | |
| | | | Total Short-Term Investments
(cost $21,206,478) | | | 21,206,478 | |
| | | | | | | | |
| | |
| | | | Total Investments
(cost $263,364,875) 99.9%§ | | | 331,677,849 | |
| | |
| | | | Other Assets less Liabilities 0.1% | | | 304,010 | |
| | | | | | | | |
| | |
| | | | NET ASSETS 100.0% | | $ | 331,981,859 | |
| | | | | | | | |
| |
| | | | *Non-income producing. §The aggregate amount of foreign securities fair valued pursuant to a systematic valuation model as a percent of net assets was 2.12%. GDR Global Depositary Receipt. See Notes to Financial Statements. | |
67
| | |
| WASATCH INTERNATIONAL OPPORTUNITIES FUND (WAIOX) — Schedule of Investments (continued) | | (UNAUDITED) |
|
|
|
At March 31, 2014, Wasatch International Opportunities Fund’s investments, excluding short-term investments, were in the following countries:
| | | | |
| Country | | % | |
Australia | | | 3.9 | |
Botswana | | | 0.5 | |
Brazil | | | 1.3 | |
Canada | | | 3.0 | |
Chile | | | 0.6 | |
China | | | 0.6 | |
Denmark | | | 2.9 | |
Finland | | | 3.1 | |
France | | | 0.5 | |
Germany | | | 0.3 | |
Greece | | | 0.3 | |
Hong Kong | | | 2.9 | |
India | | | 9.3 | |
Indonesia | | | 2.3 | |
Israel | | | 5.0 | |
Japan | | | 12.6 | |
Kenya | | | 1.2 | |
Korea | | | 2.6 | |
Lithuania | | | 0.9 | |
Malaysia | | | 5.2 | |
Mexico | | | 1.7 | |
Nigeria | | | 0.8 | |
Peru | | | 0.5 | |
Philippines | | | 7.2 | |
Poland | | | 3.5 | |
Russia | | | 0.4 | |
Singapore | | | 3.3 | |
South Africa | | | 8.5 | |
Sweden | | | 2.6 | |
Taiwan | | | 4.5 | |
Thailand | | | 2.2 | |
Turkey | | | 3.6 | |
United Arab Emirates | | | 1.2 | |
United Kingdom | | | 1.0 | |
| | | | |
TOTAL | | | 100.0 | % |
| | | | |
68
| | |
| WASATCH LARGE CAP VALUE FUND (FMIEX / WILCX) — Schedule of Investments | | MARCH 31, 2014 (UNAUDITED) |
|
|
|
| | | | | | | | |
| Shares | | | | | Value | |
| | | | | | | |
| | | | COMMON STOCKS 100.1% | | | | |
| | |
| | | | Aerospace & Defense 2.6% | | | | |
| | 126,315 | | | L-3 Communications Holdings, Inc. | | $ | 14,924,117 | |
| | | | | | | | |
| | | | Automobile Manufacturers 2.2% | | | | |
| | 817,139 | | | Ford Motor Co. | | | 12,747,368 | |
| | | | | | | | |
| | | | Coal & Consumable Fuels 1.3% | | | | |
| | 469,375 | | | Peabody Energy Corp. | | | 7,669,588 | |
| | | | | | | | |
| | | | Commodity Chemicals 2.3% | | | | |
| | 150,186 | | | LyondellBasell Industries N.V., Class A | | | 13,357,543 | |
| | | | | | | | |
| | | | Communications Equipment 2.1% | | | | |
| | 555,530 | | | Cisco Systems, Inc. | | | 12,449,427 | |
| | | | | | | | |
| | | | Department Stores 3.1% | | | | |
| | 306,487 | | | Macy’s, Inc. | | | 18,171,614 | |
| | | | | | | | |
| | | | Diversified Banks 11.5% | | | | |
| | 426,788 | | | Citigroup, Inc. | | | 20,315,109 | |
| | 390,186 | | | JPMorgan Chase & Co. | | | 23,688,192 | |
| | 461,631 | | | Wells Fargo & Co. | | | 22,961,526 | |
| | | | | | | | |
| | | | | | | 66,964,827 | |
| | | | | | | | |
| | | | Diversified Chemicals 2.4% | | | | |
| | 160,243 | | | Eastman Chemical Co. | | | 13,814,549 | |
| | | | | | | | |
| | | | Electrical Components & Equipment 2.8% | | | | |
| | 218,191 | | | Eaton Corp. plc | | | 16,390,508 | |
| | | | | | | | |
| | | | General Merchandise Stores 2.9% | | | | |
| | 275,927 | | | Target Corp. | | | 16,696,343 | |
| | | | | | | | |
| | | | Health Care Equipment 5.1% | | | | |
| | 382,358 | | | Abbott Laboratories | | | 14,724,606 | |
| | 245,653 | | | Medtronic, Inc. | | | 15,117,486 | |
| | | | | | | | |
| | | | | | | 29,842,092 | |
| | | | | | | | |
| | | | Industrial Conglomerates 3.2% | | | | |
| | 715,955 | | | General Electric Co. | | | 18,536,075 | |
| | | | | | | | |
| | | | Integrated Oil & Gas 9.5% | | | | |
| | 135,217 | | | Chevron Corp. | | | 16,078,653 | |
| | 183,876 | | | Occidental Petroleum Corp. | | | 17,521,544 | |
| | 621,826 | | | Suncor Energy, Inc. (Canada) | | | 21,739,037 | |
| | | | | | | | |
| | | | | | | 55,339,234 | |
| | | | | | | | |
| | | | Integrated Telecommunication Services 2.8% | | | | |
| | 343,289 | | | Verizon Communications, Inc. | | | 16,330,258 | |
| | | | | | | | |
| | | | Investment Banking & Brokerage 2.5% | | | | |
| | 89,250 | | | Goldman Sachs Group, Inc. (The) | | | 14,623,613 | |
| | | | | | | | |
| | | | Life & Health Insurance 2.3% | | | | |
| | 379,466 | | | Unum Group | | | 13,398,944 | |
| | | | | | | | |
| | | | Oil & Gas Exploration & Production 4.3% | | | | |
| | 178,749 | | | Apache Corp. | | | 14,827,230 | |
| | 1,731,216 | | | Pengrowth Energy Corp. (Canada) | | | 10,525,793 | |
| | | | | | | | |
| | | | | | | 25,353,023 | |
| | | | | | | | |
| | | | Other Diversified Financial Services 2.7% | | | | |
| | 431,774 | | | ING U.S., Inc. | | | 15,660,443 | |
| | | | | | | | |
| | | | Packaged Foods & Meats 2.3% | | | | |
| | 442,412 | | | ConAgra Foods, Inc. | | | 13,728,044 | |
| | | | | | | | |
| | | | | | | | |
| Shares | | | | | Value | |
| | | | | | | |
| | | | Pharmaceuticals 9.0% | | | | |
| | 239,064 | | | Johnson & Johnson | | $ | 23,483,257 | |
| | 660,942 | | | Pfizer, Inc. | | | 21,229,457 | |
| | 116,784 | | | Questcor Pharmaceuticals, Inc. | | | 7,582,785 | |
| | | | | | | | |
| | | | | | | 52,295,499 | |
| | | | | | | | |
| | | | Property & Casualty Insurance 2.7% | | | | |
| | 343,928 | | | Axis Capital Holdings Ltd. | | | 15,769,099 | |
| | | | | | | | |
| | | | Regional Banks 5.7% | | | | |
| | 1,584,108 | | | First Niagara Financial Group, Inc. | | | 14,969,821 | |
| | 210,186 | | | PNC Financial Services Group, Inc. | | | 18,286,182 | |
| | | | | | | | |
| | | | | | | 33,256,003 | |
| | | | | | | | |
| | | | Semiconductors 2.5% | | | | |
| | 576,063 | | | Intel Corp. | | | 14,868,186 | |
| | | | | | | | |
| | | | Specialized REITs 3.1% | | | | |
| | 336,906 | | | EPR Properties | | | 17,987,411 | |
| | | | | | | | |
| | | | Systems Software 5.5% | | | | |
| | 189,778 | | | Check Point Software Technologies Ltd.* (Israel) | | | 12,834,686 | |
| | 470,081 | | | Microsoft Corp. | | | 19,268,620 | |
| | | | | | | | |
| | | | | | | 32,103,306 | |
| | | | | | | | |
| | | | Technology Hardware, Storage & Peripherals 3.7% | | | | |
| | 39,763 | | | Apple, Inc. | | | 21,342,393 | |
| | | | | | | | |
| | |
| | | | Total Common Stocks
(cost $498,562,600) | | | 583,619,507 | |
| | | | | | | | |
| | |
Principal
Amount | | | | | Value | |
| | | | | | | |
| | |
| | | | SHORT-TERM INVESTMENTS 0.1% | | | | |
| | |
| | | | Repurchase Agreement 0.1% | | | | |
| | $676,944 | | | Repurchase Agreement dated 3/31/14, 0.00% due 4/1/14 with State Street Bank and Trust Co. collateralized by $575,000 of United States Treasury Bonds 4.625% due 2/15/40; value: $691,438; repurchase proceeds: $676,944 (cost $676,944) | | $ | 676,944 | |
| | | | | | | | |
| | |
| | | | Total Short-Term Investments
(cost $676,944) | | | 676,944 | |
| | | | | | | | |
| | |
| | | | Total Investments
(cost $499,239,544) 100.2% | | | 584,296,451 | |
| | | | | | | | |
| | |
| | | | Liabilities less Other Assets (0.2%) | | | (1,173,678 | ) |
| | | | | | | | |
| | |
| | | | NET ASSETS 100.0% | | $ | 583,122,773 | |
| | | | | | | | |
| |
| | | | *Non-income producing. REIT Real Estate Investment Trust. See Notes to Financial Statements. | |
At March 31, 2014, Wasatch Large Cap Value Fund’s investments, excluding short-term investments, were in the following countries:
| | | | |
| Country | | % | |
Canada | | | 5.5 | |
Israel | | | 2.2 | |
United States | | | 92.3 | |
| | | | |
TOTAL | | | 100.0 | % |
| | | | |
69
| | |
| WASATCH LONG/SHORT FUND (FMLSX / WILSX) — Schedule of Investments | | |
|
|
|
| | | | | | | | |
| Shares | | | | | Value | |
| | | | | | | |
| | | | COMMON STOCKS 83.0% | | | | |
| | |
| | | | Advertising 1.8% | | | | |
| | 2,810,926 | | | Interpublic Group of Cos., Inc. (The)‡ | | $ | 48,179,272 | |
| | | | | | | | |
| | | | Airlines 1.6% | | | | |
| | 1,863,455 | | | Southwest Airlines Co. | | | 43,996,173 | |
| | | | | | | | |
| | | | Apparel Retail 0.5% | | | | |
| | 338,770 | | | ANN, Inc.* | | | 14,052,180 | |
| | | | | | | | |
| | | | Automobile Manufacturers 3.7% | | | | |
| | 2,935,670 | | | General Motors Co.‡ | | | 101,045,761 | |
| | | | | | | | |
| | | | Automotive Retail 1.6% | | | | |
| | 1,075,357 | | | CST Brands, Inc. | | | 33,594,153 | |
| | 830,657 | | | Pep Boys — Manny, Moe & Jack (The)* | | | 10,565,957 | |
| | | | | | | | |
| | | | | | | 44,160,110 | |
| | | | | | | | |
| | | | Casinos & Gaming 1.1% | | | | |
| | 2,232,420 | | | International Game Technology | | | 31,387,825 | |
| | | | | | | | |
| | | | Communications Equipment 2.4% | | | | |
| | 1,416,622 | | | Cisco Systems, Inc.‡ | | | 31,746,499 | |
| | 419,500 | | | QUALCOMM, Inc. | | | 33,081,770 | |
| | | | | | | | |
| | | | | | | 64,828,269 | |
| | | | | | | | |
| | | | Computer & Electronics Retail 0.6% | | | | |
| | 410,746 | | | Conn’s, Inc.* | | | 15,957,482 | |
| | | | | | | | |
| | | | Construction & Engineering 0.9% | | | | |
| | 933,488 | | | Aegion Corp.* | | | 23,626,581 | |
| | | | | | | | |
| | | | Data Processing & Outsourced Services 1.0% | | | | |
| | 404,241 | | | Global Payments, Inc. | | | 28,745,578 | |
| | | | | | | | |
| | | | Diversified Banks 1.2% | | | | |
| | 675,173 | | | Citigroup, Inc.‡ | | | 32,138,235 | |
| | | | | | | | |
| | | | Diversified REITs 0.5% | | | | |
| | 1,530,676 | | | Investors Real Estate Trust | | | 13,745,470 | |
| | | | | | | | |
| | | | Diversified Support Services 3.2% | | | | |
| | 273,024 | | | Copart, Inc.* | | | 9,935,343 | |
| | 2,861,322 | | | Iron Mountain, Inc.‡ | | | 78,886,648 | |
| | | | | | | | |
| | | | | | | 88,821,991 | |
| | | | | | | | |
| | | | Environmental & Facilities Services 0.9% | | | | |
| | 722,352 | | | Republic Services, Inc.‡ | | | 24,675,544 | |
| | | | | | | | |
| | | | Fertilizers & Agricultural Chemicals 1.9% | | | | |
| | 1,046,243 | | | Mosaic Co. (The)‡ | | | 52,312,150 | |
| | | | | | | | |
| | | | Gas Utilities 0.3% | | | | |
| | 160,687 | | | Atmos Energy Corp. | | | 7,573,178 | |
| | | | | | | | |
| | | | General Merchandise Stores 2.5% | | | | |
| | 1,131,548 | | | Target Corp.‡ | | | 68,469,969 | |
| | | | | | | | |
| | | | Gold 0.8% | | | | |
| | 2,356,037 | | | Yamana Gold, Inc. (Canada) | | | 20,686,005 | |
| | | | | | | | |
| | | | Health Care Equipment 1.4% | | | | |
| | 352,900 | | | Medtronic, Inc.‡ | | | 21,717,466 | |
| | 208,800 | | | Stryker Corp. | | | 17,010,936 | |
| | | | | | | | |
| | | | | | | 38,728,402 | |
| | | | | | | | |
| | | | Health Care REIT’s 0.9% | | | | |
| | 431,885 | | | Ventas, Inc. | | | 26,159,274 | |
| | | | | | | | |
| | | | Health Care Services 1.7% | | | | |
| | 611,201 | | | Express Scripts Holding Co.* ‡ | | | 45,895,083 | |
| | | | | | | | |
| | | | Hypermarkets & Super Centers 3.4% | | | | |
| | 1,210,581 | | | Wal-Mart Stores, Inc.‡ | | | 92,524,706 | |
| | | | | | | | |
| | | | | | | | |
| Shares | | | | | Value | |
| | | | | | | |
| | | | Insurance Brokers 0.8% | | | | |
| | 261,155 | | | Aon plc | | $ | 22,010,143 | |
| | | | | | | | |
| | | | Integrated Telecommunication Services 0.9% | | | | |
| | 525,685 | | | Verizon Communications, Inc. | | | 25,006,835 | |
| | | | | | | | |
| | | | IT Consulting & Other Services 0.4% | | | | |
| | 299,743 | | | Acxiom Corp.* | | | 10,309,660 | |
| | | | | | | | |
| | | | Life & Health Insurance 2.8% | | | | |
| | 672,700 | | | MetLife, Inc.‡ | | | 35,518,560 | |
| | 1,146,111 | | | Unum Group‡ | | | 40,469,179 | |
| | | | | | | | |
| | | | | | | 75,987,739 | |
| | | | | | | | |
| | | | Multi-Line Insurance 3.1% | | | | |
| | 1,920,712 | | | Loews Corp.‡ | | | 84,607,364 | |
| | | | | | | | |
| | | | Multi-Sector Holdings 0.9% | | | | |
| | 852,733 | | | Leucadia National Corp. | | | 23,876,524 | |
| | | | | | | | |
| | | | Office REITs 0.8% | | | | |
| | 403,582 | | | Digital Realty Trust, Inc. | | | 21,422,133 | |
| | | | | | | | |
| | | | Oil & Gas Drilling 6.8% | | | | |
| | 1,174,863 | | | Diamond Offshore Drilling, Inc. | | | 57,286,320 | |
| | 1,249,114 | | | Ensco plc, Class A | | | 65,928,237 | |
| | 465,412 | | | Patterson-UTI Energy, Inc.‡ | | | 14,744,252 | |
| | 751,941 | | | Unit Corp.* | | | 49,161,903 | |
| | | | | | | | |
| | | | | | | 187,120,712 | |
| | | | | | | | |
| | | | Oil & Gas Equipment & Services 4.2% | | | | |
| | 1,463,901 | | | Halliburton Co.‡ | | | 86,209,130 | |
| | 354,721 | | | National Oilwell Varco, Inc.‡ | | | 27,622,124 | |
| | | | | | | | |
| | | | | | | 113,831,254 | |
| | | | | | | | |
| | | | Oil & Gas Exploration & Production 10.1% | | | | |
| | 2,337,489 | | | Bill Barrett Corp.* | | | 59,839,719 | |
| | 8,500,367 | | | Denbury Resources, Inc.‡ | | | 139,406,019 | |
| | 3,193,224 | | | Swift Energy Co.* ‡‡ | | | 34,359,090 | |
| | 4,396,736 | | | Talisman Energy, Inc. (Canada) | | | 43,879,425 | |
| | | | | | | | |
| | | | | | | 277,484,253 | |
| | | | | | | | |
| | | | Packaged Foods & Meats 0.5% | | | | |
| | 452,131 | | | ConAgra Foods, Inc.‡ | | | 14,029,625 | |
| | | | | | | | |
| | | | Paper Products 1.0% | | | | |
| | 239,147 | | | Domtar Corp. | | | 26,837,076 | |
| | | | | | | | |
| | | | Pharmaceuticals 1.6% | | | | |
| | 294,335 | | | Novartis AG ADR (Switzerland) | | | 25,024,362 | |
| | 701,597 | | | Zoetis, Inc. | | | 20,304,217 | |
| | | | | | | | |
| | | | | | | 45,328,579 | |
| | | | | | | | |
| | | | Property & Casualty Insurance 2.4% | | | | |
| | 1,059,124 | | | CNA Financial Corp.‡ | | | 45,245,777 | |
| | 634,382 | | | XL Group plc | | | 19,824,438 | |
| | | | | | | | |
| | | | | | | 65,070,215 | |
| | | | | | | | |
| | | | Residential REITs 2.0% | | | | |
| | 1,485,981 | | | American Campus Communities, Inc.‡ | | | 55,501,390 | |
| | | | | | | | |
| | | | Semiconductors 0.6% | | | | |
| | 94,240 | | | Applied Micro Circuits Corp.* | | | 932,976 | |
| | 641,329 | | | Intel Corp. | | | 16,552,702 | |
| | | | | | | | |
| | | | | | | 17,485,678 | |
| | | | | | | | |
| | | | Specialty Stores 0.6% | | | | |
| | 211,596 | | | Outerwall, Inc.* | | | 15,340,710 | |
| | | | | | | | |
| | | | Systems Software 3.7% | | | | |
| | 1,644,390 | | | Microsoft Corp.‡ | | | 67,403,546 | |
| | 857,000 | | | Oracle Corp. | | | 35,059,870 | |
| | | | | | | | |
| | | | | | | 102,463,416 | |
| | | | | | | | |
70
| | |
| | MARCH 31, 2014 (UNAUDITED) |
|
|
|
| | | | | | | | |
| Shares | | | | | Value | |
| | | | | | | |
| | | | Technology Hardware, Storage & Peripherals 5.3% | | | | |
| | 206,795 | | | Apple, Inc. | | $ | 110,995,148 | |
| | 2,820,938 | | | Silicon Graphics International Corp.* ‡‡ | | | 34,641,119 | |
| | | | | | | | |
| | | | | | | 145,636,267 | |
| | | | | | | | |
| | | | Trucking 0.6% | | | | |
| | 734,390 | | | Knight Transportation, Inc. | | | 16,986,441 | |
| | | | | | | | |
| | |
| | | | Total Common Stocks
(cost $1,921,384,518) | | | 2,274,045,252 | |
| | | | | | | | |
| | |
Principal
Amount | | | | | Value | |
| | | | | | | |
| | | | SHORT-TERM INVESTMENTS 16.3% | | | | |
| | |
| | | | Repurchase Agreement 16.3% | | | | |
| | $447,207,058 | | | Repurchase Agreement dated 3/31/14, 0.00% due 4/1/14 with State Street Bank and Trust Co. collateralized by $449,370,000 of United States Treasury Notes 2.000% due 2/28/21; value: $303,150,502; United States Treasury Notes 3.625% due 2/15/21; value: $150,665,250; United States Treasury Bonds 4.625% due 2/15/40; value: $2,338,863; repurchase proceeds: $447,207,058 (cost $447,207,058) | | $ | 447,207,058 | |
| | | | | | | | |
| | |
| | | | Total Short-Term Investments
(cost $447,207,058) | | | 447,207,058 | |
| | | | | | | | |
| | |
| | | | Total Investments
(cost $2,368,591,576) 99.3% | | | 2,721,252,310 | |
| | |
| | | | Other Assets less Liabilities 0.7% | | | 17,858,410 | |
| | | | | | | | |
| | |
| | | | NET ASSETS 100.0% | | $ | 2,739,110,720 | |
| | | | | | | | |
| | |
| Shares | | | | | Value | |
| | | | | | | |
| | | | SECURITIES SOLD SHORT 10.1% | | | | |
| | |
| | | | Application Software 1.0% | | | | |
| | 112,958 | | | Salesforce.com, Inc.* | | $ | 6,448,772 | |
| | 227,866 | | | Workday, Inc., Class A* | | | 20,833,789 | |
| | | | | | | | |
| | | | | | | 27,282,561 | |
| | | | | | | | |
| | | | Construction Machinery & Heavy Trucks 0.6% | | | | |
| | 310,901 | | | Joy Global, Inc. | | | 18,032,258 | |
| | | | | | | | |
| | | | Electric Utilities 0.8% | | | | |
| | 684,208 | | | Exelon Corp. | | | 22,962,020 | |
| | | | | | | | |
| | | | Food Distributors 1.0% | | | | |
| | 775,903 | | | Sysco Corp. | | | 28,033,375 | |
| | | | | | | | |
| | | | Household Products 0.8% | | | | |
| | 273,476 | | | Procter & Gamble Co. (The) | | | 22,042,166 | |
| | | | | | | | |
| | | | Human Resource & Employment Services 0.7% | | | | |
| | 343,505 | | | WageWorks, Inc.* | | | 19,274,066 | |
| | | | | | | | |
| | | | Internet Software & Services 1.5% | | | | |
| | 183,214 | | | Facebook, Inc., Class A* | | | 11,036,811 | |
| | 381,245 | | | OpenTable, Inc.* | | | 29,329,178 | |
| | | | | | | | |
| | | | 40,365,989 | |
| | | | | | | | |
| | | | | | | | |
| Shares | | | | | Value | |
| | | | | | | |
| | | | IT Consulting & Other Services 0.7% | | | | |
| | 228,069 | | | Accenture plc, Class A | | $ | 18,181,661 | |
| | | | | | | | |
| | | | Packaged Foods & Meats 1.1% | | | | |
| | 275,046 | | | Keurig Green Mountain, Inc. | | | 29,042,107 | |
| | | | | | | | |
| | | | Retail REITs 0.6% | | | | |
| | 340,272 | | | Regency Centers Corp. | | | 17,374,288 | |
| | | | | | | | |
| | | | Specialty Stores 1.3% | | | | |
| | 409,736 | | | Tiffany & Co. | | | 35,298,756 | |
| | | | | | | | |
| | |
| | | | Total Securities Sold Short
(proceeds $261,574,051) | | | 277,889,247 | |
| | | | | | | | |
| |
| | | | *Non-income producing. ‡All or a portion of this security has been designated as collateral for securities sold short (see Note 3). ‡‡Affiliated company (see Note 9). ADR American Depositary Receipt. REIT Real Estate Investment Trust. See Notes to Financial Statements. | |
At March 31, 2014, Wasatch Long/Short Fund’s investments, excluding short-term investments and securities sold short, were in the following countries:
| | | | |
| Country | | % | |
Canada | | | 2.8 | |
Switzerland | | | 1.1 | |
United States | | | 96.1 | |
| | | | |
TOTAL | | | 100.0 | % |
| | | | |
71
| | |
| WASATCH MICRO CAP FUND (WMICX) — Schedule of Investments | | |
|
|
|
| | | | | | | | |
| Shares | | | | | Value | |
| | | | | | | |
| | | | COMMON STOCKS 97.7% | | | | |
| | |
| | | | Alternative Carriers 0.7% | | | | |
| | 246,635 | | | inContact, Inc.* | | $ | 2,367,696 | |
| | | | | | | | |
| | | | Apparel Retail 0.9% | | | | |
| | 131,171 | | | Zumiez, Inc.* | | | 3,179,585 | |
| | | | | | | | |
| | | | Apparel, Accessories & Luxury
Goods 1.4% | | | | |
| | 43,510 | | | Page Industries Ltd. (India) | | | 4,703,830 | |
| | | | | | | | |
| | | | Application Software 9.8% | | | | |
| | 405,760 | | | Diligent Board Member Services, Inc.* (New Zealand) | | | 1,459,692 | |
| | 133,337 | | | Ellie Mae, Inc.* | | | 3,845,439 | |
| | 249,716 | | | Exa Corp.* | | | 3,311,234 | |
| | 104,809 | | | Interactive Intelligence Group, Inc.* | | | 7,598,653 | |
| | 87,309 | | | PROS Holdings, Inc.* | | | 2,751,107 | |
| | 235,148 | | | Tangoe, Inc.* | | | 4,371,401 | |
| | 46,417 | | | Tyler Technologies, Inc.* | | | 3,884,175 | |
| | 43,557 | | | Ultimate Software Group, Inc.* | | | 5,967,309 | |
| | | | | | | | |
| | | | | | | 33,189,010 | |
| | | | | | | | |
| | | | Asset Management & Custody
Banks 3.7% | | | | |
| | 33,122 | | | Diamond Hill Investment Group, Inc. | | | 4,353,556 | |
| | 286,648 | | | Pzena Investment Management, Inc.,
Class A | | | 3,373,847 | |
| | 132,161 | | | Silvercrest Asset Management Group, Inc. | | | 2,417,225 | |
| | 12,956 | | | Virtus Investment Partners, Inc.* | | | 2,243,590 | |
| | | | | | | | |
| | | | | | | 12,388,218 | |
| | | | | | | | |
| | | | Automotive Retail 1.0% | | | | |
| | 61,597 | | | Monro Muffler Brake, Inc. | | | 3,503,637 | |
| | | | | | | | |
| | | | Biotechnology 3.7% | | | | |
| | 496,548 | | | Abcam plc (United Kingdom) | | | 3,220,607 | |
| | 90,474 | | | Cellular Dynamics International, Inc.* | | | 1,350,777 | |
| | 176,227 | | | ChemoCentryx, Inc.* | | | 1,168,385 | |
| | 62,309 | | | Esperion Therapeutics, Inc.* | | | 942,112 | |
| | 170,440 | | | Exact Sciences Corp.* | | | 2,415,135 | |
| | 56,199 | | | OncoGenex Pharmaceutical, Inc.* | | | 660,900 | |
| | 159,440 | | | Sangamo BioSciences, Inc.* | | | 2,882,675 | |
| | | | | | | | |
| | | | | | | 12,640,591 | |
| | | | | | | | |
| | | | Casinos & Gaming 0.9% | | | | |
| | 107,191 | | | Multimedia Games Holding Co., Inc.* | | | 3,112,827 | |
| | | | | | | | |
| | | | Commercial Printing 1.0% | | | | |
| | 436,475 | | | InnerWorkings, Inc.* | | | 3,343,399 | |
| | | | | | | | |
| | | | Consumer Finance 3.5% | | | | |
| | 320,494 | | | DFC Global Corp.* | | | 2,829,962 | |
| | 114,865 | | | Encore Capital Group, Inc.* | | | 5,249,330 | |
| | 157,972 | | | Regional Management Corp.* | | | 3,895,590 | |
| | | | | | | | |
| | | | | | | 11,974,882 | |
| | | | | | | | |
| | | | Data Processing & Outsourced Services 3.3% | | | | |
| | 120,511 | | | ExlService Holdings, Inc.* | | | 3,724,995 | |
| | 239,302 | | | Higher One Holdings, Inc.* | | | 1,730,153 | |
| | 137,823 | | | Wirecard AG (Germany) | | | 5,716,450 | |
| | | | | | | | |
| | | | | | | 11,171,598 | |
| | | | | | | | |
| | | | Diversified Banks 1.4% | | | | |
| | 5,193,211 | | | City Union Bank Ltd. (India) | | | 4,669,520 | |
| | | | | | | | |
| | | | Electronic Manufacturing Services 0.8% | | | | |
| | 36,316 | | | IPG Photonics Corp.* | | | 2,581,341 | |
| | | | | | | | |
| | | | Environmental & Facilities Services 1.0% | | | | |
| | 185,549 | | | Heritage-Crystal Clean, Inc.* | | | 3,364,003 | |
| | | | | | | | |
| | | | | | | | |
| Shares | | | | | Value | |
| | | | | | | |
| | | | Food Distributors 0.9% | | | | |
| | 139,020 | | | Chefs’ Warehouse, Inc. (The)* | | $ | 2,975,028 | |
| | | | | | | | |
| | | | General Merchandise Stores 0.4% | | | | |
| | 265,833 | | | Gordmans Stores, Inc. | | | 1,451,448 | |
| | | | | | | | |
| | | | Health Care Distributors 1.0% | | | | |
| | 20,696 | | | MWI Veterinary Supply, Inc.* | | | 3,220,712 | |
| | | | | | | | |
| | | | Health Care Equipment 6.7% | | | | |
| | 97,004 | | | Abaxis, Inc.* | | | 3,771,515 | |
| | 351,384 | | | AtriCure, Inc.* | | | 6,609,533 | |
| | 1,055,928 | | | Cardica, Inc.* | | | 1,066,487 | |
| | 151,770 | | | Novadaq Technologies, Inc.* (Canada) | | | 3,381,436 | |
| | 123,741 | | | NuVasive, Inc.* | | | 4,752,892 | |
| | 142,380 | | | Tandem Diabetes Care, Inc.* | | | 3,145,174 | |
| | | | | | | | |
| | | | | | | 22,727,037 | |
| | | | | | | | |
| | | | Health Care Facilities 2.2% | | | | |
| | 171,428 | | | Ensign Group, Inc. (The) | | | 7,481,118 | |
| | | | | | | | |
| | | | Health Care Services 4.2% | | | | |
| | 73,839 | | | Bio-Reference Laboratories, Inc.* | | | 2,043,864 | |
| | 139,473 | | | CorVel Corp.* | | | 6,940,176 | |
| | 106,790 | | | IPC The Hospitalist Co., Inc.* | | | 5,241,253 | |
| | | | | | | | |
| | | | | | | 14,225,293 | |
| | | | | | | | |
| | | | Health Care Technology 2.5% | | | | |
| | 29,933 | | | Computer Programs and Systems, Inc. | | | 1,933,672 | |
| | 117,895 | | | HealthStream, Inc.* | | | 3,147,796 | |
| | 208,241 | | | Vocera Communications, Inc.* | | | 3,400,576 | |
| | | | | | | | |
| | | | | | | 8,482,044 | |
| | | | | | | | |
| | | | Homebuilding 1.6% | | | | |
| | 153,732 | | | Installed Building Products, Inc.* | | | 2,144,561 | |
| | 199,274 | | | LGI Homes, Inc.* | | | 3,437,477 | |
| | | | | | | | |
| | | | | | | 5,582,038 | |
| | | | | | | | |
| | | | Industrial Machinery 1.2% | | | | |
| | 59,947 | | | Proto Labs, Inc.* | | | 4,056,613 | |
| | | | | | | | |
| | | | Internet Retail 1.4% | | | | |
| | 177,762 | | | MakeMyTrip Ltd.* (India) | | | 4,813,795 | |
| | | | | | | | |
| | | | Internet Software & Services 9.9% | | | | |
| | 186,709 | | | Amber Road, Inc.* | | | 2,875,318 | |
| | 124,020 | | | Angie’s List, Inc.* | | | 1,510,564 | |
| | 130,423 | | | Dealertrack Technologies, Inc.* | | | 6,415,507 | |
| | 152,854 | | | E2open, Inc.* | | | 3,602,769 | |
| | 197,955 | | | Envestnet, Inc.* | | | 7,953,832 | |
| | 237,921 | | | SciQuest, Inc.* | | | 6,427,436 | |
| | 75,718 | | | SPS Commerce, Inc.* | | | 4,652,871 | |
| | | | | | | | |
| | | | | | | 33,438,297 | |
| | | | | | | | |
| | | | IT Consulting & Other Services 1.0% | | | | |
| | 392,834 | | | ServiceSource International, Inc.* | | | 3,315,519 | |
| | | | | | | | |
| | | | Leisure Products 0.7% | | | | |
| | 184,430 | | | Black Diamond, Inc.* | | | 2,255,579 | |
| | | | | | | | |
| | | | Life Sciences Tools & Services 3.0% | | | | |
| | 78,802 | | | Fluidigm Corp.* | | | 3,472,804 | |
| | 142,278 | | | ICON plc* (Ireland) | | | 6,765,319 | |
| | | | | | | | |
| | | | | | | 10,238,123 | |
| | | | | | | | |
| | | | Oil & Gas Equipment & Services 0.9% | | | | |
| | 120,093 | | | Pason Systems, Inc. (Canada) | | | 3,037,771 | |
| | | | | | | | |
| | | | Oil & Gas Exploration & Production 3.0% | | | | |
| | 195,663 | | | Comstock Resources, Inc. | | | 4,470,899 | |
| | 223,073 | | | Northern Oil and Gas, Inc.* | | | 3,261,327 | |
| | 303,557 | | | Triangle Petroleum Corp.* | | | 2,501,310 | |
| | | | | | | | |
| | | | | | | 10,233,536 | |
| | | | | | | | |
72
| | |
| | MARCH 31, 2014 (UNAUDITED) |
|
|
|
| | | | | | | | |
Shares | | | | | Value | |
| | | | | | | |
| | | | Pharmaceuticals 4.7% | | | | |
| | 50,064 | | | Aerie Pharmaceuticals, Inc.* | | $ | 1,060,856 | |
| | 256,039 | | | Akorn, Inc.* | | | 5,632,858 | |
| | 163,308 | | | Cardiovascular Systems, Inc.* | | | 5,191,561 | |
| | 243,957 | | | Cempra, Inc.* | | | 2,817,704 | |
| | 77,430 | | | Egalet Corp.* | | | 1,083,246 | |
| | | | | | | | |
| | | | | | | 15,786,225 | |
| | | | | | | | |
| | | | Regional Banks 3.0% | | | | |
| | 195,192 | | | BBCN Bancorp, Inc. | | | 3,345,591 | |
| | 171,745 | | | Customers Bancorp, Inc.* | | | 3,584,318 | |
| | 231,798 | | | Tristate Capital Holdings, Inc.* | | | 3,293,850 | |
| | | | | | | | |
| | | | | | | 10,223,759 | |
| | | | | | | | |
| | | | Research & Consulting Services 1.4% | | | | |
| | 232,906 | | | Franklin Covey Co.* | | | 4,604,552 | |
| | | | | | | | |
| | | | Semiconductor Equipment 0.7% | | | | |
| | 137,001 | | | PDF Solutions, Inc.* | | | 2,489,308 | |
| | | | | | | | |
| | | | Semiconductors 4.0% | | | | |
| | 234,535 | | | MaxLinear, Inc., Class A* | | | 2,223,392 | |
| | 95,907 | | | Melexis N.V. (Belgium) | | | 3,711,131 | |
| | 42,979 | | | NVE Corp.* | | | 2,451,522 | |
| | 80,515 | | | Power Integrations, Inc. | | | 5,296,277 | |
| | | | | | | | |
| | | | | | | 13,682,322 | |
| | | | | | | | |
| | | | Specialized Finance 0.0% | | | | |
| | 154,000 | | | Goldwater Bank, N.A.* *** † ‡‡ | | | 47,740 | |
| | | | | | | | |
| | | | Specialty Chemicals 0.4% | | | | |
| | 531,795 | | | EcoSynthetix, Inc.* (Canada) | | | 1,250,886 | |
| | | | | | | | |
| | | | Specialty Stores 0.9% | | | | |
| | 60,752 | | | Hibbett Sports, Inc.* | | | 3,212,566 | |
| | | | | | | | |
| | | | Systems Software 0.7% | | | | |
| | 70,258 | | | FleetMatics Group plc* | | | 2,350,130 | |
| | | | | | | | |
| | | | Technology Hardware, Storage & Peripherals 0.8% | | | | |
| | 290,211 | | | Intevac, Inc.* | | | 2,815,047 | |
| | | | | | | | |
| | | | Thrifts & Mortgage Finance 1.1% | | | | |
| | 732,565 | | | Gruh Finance Ltd. (India) | | | 3,630,780 | |
| | | | | | | | |
| | | | Trading Companies & Distributors 3.2% | | | | |
| | 256,801 | | | CAI International, Inc.* | | | 6,335,281 | |
| | 164,455 | | | Rush Enterprises, Inc., Class B* | | | 4,640,920 | |
| | | | | | | | |
| | | | | | | 10,976,201 | |
| | | | | | | | |
| | | | Trucking 3.1% | | | | |
| | 177,004 | | | Marten Transport Ltd. | | | 3,809,126 | |
| | 54,337 | | | Old Dominion Freight Line, Inc.* | | | 3,083,082 | |
| | 95,687 | | | Saia, Inc.* | | | 3,656,200 | |
| | | | | | | | |
| | | | | | | 10,548,408 | |
| | | | | | | | |
| | |
| | | | Total Common Stocks
(cost $190,782,261) | | | 331,342,012 | |
| | | | | | | | |
| | |
| | | | WARRANTS 0.0% | | | | |
| | |
| | | | Health Care Equipment 0.0% | | | | |
| | 322,500 | | | Cardica, Inc., expiring 9/29/14* *** † | | | 3,225 | |
| | | | | | | | |
| | |
| | | | Total Warrants
(cost $40,313) | | | 3,225 | |
| | | | | | | | |
| | | | | | | | |
Principal
Amount | | | | | Value | |
| | | | | | | |
| | | | SHORT-TERM INVESTMENTS 2.5% | | | | |
| | |
| | | | Repurchase Agreement 2.5% | | | | |
| | $8,388,106 | | | Repurchase Agreement dated 3/31/14, 0.00% due 4/1/14 with State Street Bank and Trust Co. collateralized by $8,625,000 of United States Treasury Notes 2.125% due 1/31/21; value: $8,560,313; repurchase proceeds: $8,388,106 (cost $8,388,106) | | $ | 8,388,106 | |
| | | | | | | | |
| | |
| | | | Total Short-Term Investments
(cost $8,388,106) | | | 8,388,106 | |
| | | | | | | | |
| | |
| | | | Total Investments
(cost $199,210,680) 100.2% | | | 339,733,343 | |
| | |
| | | | Liabilities less Other Assets (0.2%) | | | (755,763 | ) |
| | | | | | | | |
| | |
| | | | NET ASSETS 100.0% | | $ | 338,977,580 | |
| | | | | | | | |
| |
| | | | *Non-income producing. ***Security was fair valued under procedures adopted by the Board of Trustees (see Note 14). †Security purchased in a private placement transaction or under Rule 144A of the Securities Act of 1933 (see Note 10). ‡‡Affiliated company (see Note 9). See Notes to Financial Statements. | |
At March 31, 2014, Wasatch Micro Cap Fund’s investments, excluding short-term investments, were in the following countries:
| | | | |
| Country | | % | |
Belgium | | | 1.1 | |
Canada | | | 2.3 | |
Germany | | | 1.7 | |
India | | | 5.4 | |
Ireland | | | 2.1 | |
New Zealand | | | 0.4 | |
United Kingdom | | | 1.0 | |
United States | | | 86.0 | |
| | | | |
TOTAL | | | 100.0 | % |
| | | | |
73
| | |
| WASATCH MICRO CAP VALUE FUND (WAMVX) — Schedule of Investments | | |
|
|
|
| | | | | | | | |
| Shares | | | | | Value | |
| | | | | | | |
| | | | COMMON STOCKS 90.8% | | | | |
| | |
| | | | Aerospace & Defense 0.8% | | | | |
| | 120,000 | | | CPI Aerostructures, Inc.* | | $ | 1,560,000 | |
| | | | | | | | |
| | | | Airlines 1.2% | | | | |
| | 21,000 | | | Allegiant Travel Co. | | | 2,350,530 | |
| | | | | | | | |
| | | | Alternative Carriers 0.9% | | | | |
| | 256,331 | | | ORBCOMM, Inc.* | | | 1,755,867 | |
| | | | | | | | |
| | | | Apparel, Accessories & Luxury Goods 0.7% | | | | |
| | 2,500,000 | | | American Apparel, Inc.* | | | 1,252,500 | |
| | | | | | | | |
| | | | Application Software 7.0% | | | | |
| | 120,000 | | | Cimatron Ltd.* (Israel) | | | 866,400 | |
| | 210,000 | | | ClickSoftware Technologies Ltd. (Israel) | | | 2,125,200 | |
| | 215,000 | | | Ebix, Inc.‡ | | | 3,670,050 | |
| | 42,000 | | | ESI Group* (France) | | | 1,503,739 | |
| | 65,000 | | | Exa Corp.* | | | 861,900 | |
| | 33,000 | | | Interactive Intelligence Group, Inc.* | | | 2,392,500 | |
| | 107,000 | | | Tangoe, Inc.* | | | 1,989,130 | |
| | | | | | | | |
| | | | | | | 13,408,919 | |
| | | | | | | | |
| | | | Asset Management & Custody Banks 2.6% | | | | |
| | 175,000 | | | Pzena Investment Management, Inc.,
Class A | | | 2,059,750 | |
| | 95,000 | | | Silvercrest Asset Management Group, Inc. | | | 1,737,550 | |
| | 7,000 | | | Virtus Investment Partners, Inc.* | | | 1,212,190 | |
| | | | | | | | |
| | | | | | | 5,009,490 | |
| | | | | | | | |
| | | | Auto Parts & Equipment 1.6% | | | | |
| | 85,000 | | | Gentherm, Inc.* | | | 2,951,200 | |
| | | | | | | | |
| | | | Automotive Retail 0.9% | | | | |
| | 136,000 | | | Pep Boys — Manny, Moe & Jack (The)* | | | 1,729,920 | |
| | | | | | | | |
| | | | Biotechnology 0.8% | | | | |
| | 82,000 | | | Argos Therapeutics, Inc.* | | | 820,000 | |
| | 63,000 | | | OncoGenex Pharmaceutical, Inc.* | | | 740,880 | |
| | | | | | | | |
| | | | | | | 1,560,880 | |
| | | | | | | | |
| | | | Commercial Printing 1.4% | | | | |
| | 70,400 | | | Ennis, Inc. | | | 1,166,528 | |
| | 202,000 | | | InnerWorkings, Inc.* | | | 1,547,320 | |
| | | | | | | | |
| | | | | | | 2,713,848 | |
| | | | | | | | |
| | | | Communications Equipment 3.9% | | | | |
| | 32,000 | | | Applied Optoelectronics, Inc.* | | | 789,440 | |
| | 88,000 | | | Oplink Communications, Inc.* | | | 1,580,480 | |
| | 405,000 | | | ShoreTel, Inc.* | | | 3,483,000 | |
| | 406,800 | | | Westell Technologies, Inc.* | | | 1,501,092 | |
| | | | | | | | |
| | | | | | | 7,354,012 | |
| | | | | | | | |
| | | | Computer & Electronics Retail 1.2% | | | | |
| | 44,000 | | | Groupe Fnac* (France) | | | 2,271,527 | |
| | | | | | | | |
| | | | Construction & Engineering 0.6% | | | | |
| | 45,000 | | | Aegion Corp.* | | | 1,138,950 | |
| | | | | | | | |
| | | | Construction Machinery & Heavy Trucks 1.3% | | | | |
| | 146,800 | | | Manitex International, Inc.* | | | 2,392,840 | |
| | | | | | | | |
| | | | Construction Materials 2.0% | | | | |
| | 69,000 | | | Caesarstone Sdot-Yam Ltd.‡ (Israel) | | | 3,752,220 | |
| | | | | | | | |
| | | | Consumer Finance 2.6% | | | | |
| | 44,000 | | | Encore Capital Group, Inc.* | | | 2,010,800 | |
| | 75,000 | | | JGWPT Holdings, Inc.* | | | 1,369,500 | |
| | 66,146 | | | Regional Management Corp.* | | | 1,631,160 | |
| | | | | | | | |
| | | | | | | 5,011,460 | |
| | | | | | | | |
| | | | | | | | |
| Shares | | | | | Value | |
| | | | | | | |
| | | | Distillers & Vintners 0.8% | | | | |
| | 165,000 | | | Crimson Wine Group Ltd.* | | $ | 1,460,250 | |
| | | | | | | | |
| | | | Diversified Banks 1.3% | | | | |
| | 1,300,000 | | | City Union Bank Ltd. (India) | | | 1,168,906 | |
| | 1,700,000 | | | EastWest Banking Corp.* (Philippines) | | | 1,084,179 | |
| | 55,556 | | | Idaho Trust Bancorp*** † | | | 200,557 | |
| | | | | | | | |
| | | | | | | 2,453,642 | |
| | | | | | | | |
| | | | Education Services 0.7% | | | | |
| | 60,000 | | | K12, Inc.* | | | 1,359,000 | |
| | | | | | | | |
| | | | Electronic Manufacturing Services 1.3% | | | | |
| | 63,000 | | | Fabrinet* | | | 1,308,510 | |
| | 112,500 | | | Global Display Co. Ltd. (Korea) | | | 1,231,270 | |
| | | | | | | | |
| | | | | | | 2,539,780 | |
| | | | | | | | |
| | | | Environmental & Facilities Services 1.1% | | | | |
| | 40,000 | | | Heritage-Crystal Clean, Inc.* | | | 725,200 | |
| | 510,000 | | | Hudson Technologies, Inc.* | | | 1,428,000 | |
| | | | | | | | |
| | | | | | | 2,153,200 | |
| | | | | | | | |
| | | | Food Distributors 0.9% | | | | |
| | 84,000 | | | Chefs’ Warehouse, Inc. (The)* | | | 1,797,600 | |
| | | | | | | | |
| | | | Food Retail 0.5% | | | | |
| | 125,000 | | | Roundy’s, Inc. | | | 860,000 | |
| | | | | | | | |
| | | | General Merchandise Stores 1.4% | | | | |
| | 30,000 | | | Seria Co. Ltd. (Japan) | | | 1,113,483 | |
| | 115,000 | | | Tuesday Morning Corp.* | | | 1,627,250 | |
| | | | | | | | |
| | | | | | | 2,740,733 | |
| | | | | | | | |
| | | | Health Care Equipment 1.9% | | | | |
| | 101,000 | | | AtriCure, Inc.* | | | 1,899,810 | |
| | 251,382 | | | Cardica, Inc.* | | | 253,896 | |
| | 125,000 | | | Ion Beam Applications* (Belgium) | | | 1,547,460 | |
| | | | | | | | |
| | | | | | | 3,701,166 | |
| | | | | | | | |
| | | | Health Care Facilities 1.1% | | | | |
| | 46,000 | | | Ensign Group, Inc. (The) | | | 2,007,440 | |
| | 15,064 | | | MD Medical Group Investments plc GDR (Russia) | | | 127,893 | |
| | | | | | | | |
| | | | | | | 2,135,333 | |
| | | | | | | | |
| | | | Health Care REITs 0.9% | | | | |
| | 120,000 | | | Physicians Realty Trust | | | 1,670,400 | |
| | | | | | | | |
| | | | Health Care Services 2.5% | | | | |
| | 68,000 | | | CorVel Corp.* | | | 3,383,680 | |
| | 88,000 | | | National Research Corp., Class A* | | | 1,459,920 | |
| | | | | | | | |
| | | | | | | 4,843,600 | |
| | | | | | | | |
| | | | Health Care Supplies 0.9% | | | | |
| | 40,000 | | | Guerbet (France) | | | 1,757,116 | |
| | | | | | | | |
| | | | Health Care Technology 1.6% | | | | |
| | 100,000 | | | Nexus AG (Germany) | | | 1,652,460 | |
| | 87,768 | | | Vocera Communications, Inc.* | | | 1,433,251 | |
| | | | | | | | |
| | | | | | | 3,085,711 | |
| | | | | | | | |
| | | | Heavy Electrical Equipment 0.5% | | | | |
| | 112,000 | | | Pioneer Power Solutions, Inc.* | | | 974,400 | |
| | | | | | | | |
| | | | Homebuilding 1.8% | | | | |
| | 127,000 | | | Installed Building Products, Inc.* | | | 1,771,650 | |
| | 90,000 | | | LGI Homes, Inc.* | | | 1,552,500 | |
| | 4,783 | | | New Home Co., Inc. (The)* | | | 68,110 | |
| | | | | | | | |
| | | | | | | 3,392,260 | |
| | | | | | | | |
| | | | Homefurnishing Retail 0.8% | | | | |
| | 85,000 | | | Select Comfort Corp.* | | | 1,536,800 | |
| | | | | | | | |
74
| | |
| | MARCH 31, 2014 (UNAUDITED) |
|
|
|
| | | | | | | | |
| Shares | | | | | Value | |
| | | | | | | |
| | | | Industrial Machinery 0.8% | | | | |
| | 50,000 | | | Hy-Lok Corp. (Korea) | | $ | 1,444,408 | |
| | | | | | | | |
| | | | Internet Software & Services 3.4% | | | | |
| | 170,000 | | | IntraLinks Holdings, Inc.* | | | 1,739,100 | |
| | 150,000 | | | Move, Inc.* | | | 1,734,000 | |
| | 160,000 | | | NetGem S.A. (France) | | | 768,945 | |
| | 123,000 | | | Perficient, Inc.* | | | 2,228,760 | |
| | | | | | | | |
| | | | | | | 6,470,805 | |
| | | | | | | | |
| | | | IT Consulting & Other Services 2.8% | | | | |
| | 62,000 | | | EPAM Systems, Inc.* | | | 2,039,800 | |
| | 220,000 | | | ServiceSource International, Inc.* | | | 1,856,800 | |
| | 900,000 | | | WidePoint Corp.* | | | 1,440,000 | |
| | | | | | | | |
| | | | | | | 5,336,600 | |
| | | | | | | | |
| | | | Leisure Facilities 0.8% | | | | |
| | 1,000,000 | | | Grupo Sports World S.A.B. de C.V.* (Mexico) | | | 1,530,848 | |
| | | | | | | | |
| | | | Leisure Products 0.9% | | | | |
| | 24,000 | | | Arctic Cat, Inc. | | | 1,146,960 | |
| | 51,908 | | | Black Diamond, Inc.* | | | 634,835 | |
| | | | | | | | |
| | | | | | | 1,781,795 | |
| | | | | | | | |
| | | | Managed Health Care 0.0% | | | | |
| | 148,544 | | | Healthcare Corp. of America* | | | 29,709 | |
| | | | | | | | |
| | | | Mortgage REITs 2.2% | | | | |
| | 340,000 | | | Arbor Realty Trust, Inc. | | | 2,352,800 | |
| | 80,000 | | | Colony Financial, Inc. | | | 1,756,000 | |
| | | | | | | | |
| | | | | | | 4,108,800 | |
| | | | | | | | |
| | | | Oil & Gas Exploration & Production 3.4% | | | | |
| | 187,262 | | | American Eagle Energy Corp.* | | | 1,338,925 | |
| | 130,000 | | | Comstock Resources, Inc. | | | 2,970,500 | |
| | 220,000 | | | Emerald Oil, Inc.* | | | 1,478,400 | |
| | 20,000 | | | Sanchez Energy Corp.* | | | 592,600 | |
| | | | | | | | |
| | | | | | | 6,380,425 | |
| | | | | | | | |
| | | | Packaged Foods & Meats 1.5% | | | | |
| | 32,000 | | | John B Sanfilippo & Son, Inc. | | | 736,640 | |
| | 1,875,000 | | | Oldtown Berhad (Malaysia) | | | 1,136,885 | |
| | 7,999,000 | | | RFM Corp. (Philippines) | | | 1,039,897 | |
| | | | | | | | |
| | | | | | | 2,913,422 | |
| | | | | | | | |
| | | | Paper Packaging 0.5% | | | | |
| | 1,800,000 | | | Greatview Aseptic Packaging Co. Ltd. (China) | | | 956,089 | |
| | | | | | | | |
| | | | Personal Products 1.3% | | | | |
| | 150,000 | | | MusclePharm Corp. PIPE | | | 960,000 | |
| | 20,000 | | | USANA Health Sciences, Inc.* | | | 1,506,800 | |
| | | | | | | | |
| | | | | | | 2,466,800 | |
| | | | | | | | |
| | | | Pharmaceuticals 3.3% | | | | |
| | 200,000 | | | Horizon Pharma, Inc.* ‡ | | | 3,024,000 | |
| | 1,595,000 | | | Lee’s Pharmaceutical Holdings Ltd. (China) | | | 1,850,682 | |
| | 170,000 | | | Torrent Pharmaceuticals Ltd. (India) | | | 1,489,430 | |
| | | | | | | | |
| | | | | | | 6,364,112 | |
| | | | | | | | |
| | | | Property & Casualty Insurance 2.0% | | | | |
| | 190,000 | | | Atlas Financial Holdings, Inc.* | | | 2,601,100 | |
| | 174,878 | | | Kingstone Cos., Inc. | | | 1,218,900 | |
| | | | | | | | |
| | | | | | | 3,820,000 | |
| | | | | | | | |
| | | | Regional Banks 4.5% | | | | |
| | 134,000 | | | Customers Bancorp, Inc.* | | | 2,796,580 | |
| | 40,000 | | | Eagle Bancorp, Inc.* | | | 1,444,000 | |
| | 34,000 | | | First of Long Island Corp. (The) | | | 1,380,740 | |
| | 201,000 | | | Tristate Capital Holdings, Inc.* | | | 2,856,210 | |
| | | | | | | | |
| | | | | | | 8,477,530 | |
| | | | | | | | |
| | | | | | | | |
| Shares | | | | | Value | |
| | | | | | | |
| | | | Research & Consulting Services 2.8% | | | | |
| | 80,000 | | | Acacia Research Corp. | | $ | 1,222,400 | |
| | 130,000 | | | Franklin Covey Co.* | | | 2,570,100 | |
| | 23,000 | | | Huron Consulting Group, Inc.* | | | 1,457,740 | |
| | | | | | | | |
| | | | | | | 5,250,240 | |
| | | | | | | | |
| | | | Residential REITs 1.0% | | | | |
| | 125,000 | | | Bluerock Residential Growth REIT, Inc.* | | | 1,812,500 | |
| | | | | | | | |
| | | | Security & Alarm Services 0.3% | | | | |
| | 60,100 | | | MiX Telematics Ltd. ADR* (South Africa) | | | 647,878 | |
| | | | | | | | |
| | | | Semiconductors 0.6% | | | | |
| | 700,000 | | | GigOptix, Inc.* | | | 1,176,000 | |
| | | | | | | | |
| | | | Soft Drinks 0.5% | | | | |
| | 8,000,000 | | | Pepsi-Cola Products Philippines, Inc. (Philippines) | | | 874,122 | |
| | | | | | | | |
| | | | Specialized Finance 0.6% | | | | |
| | 41,900 | | | Goldwater Bank, N.A.* *** † | | | 12,989 | |
| | 55,000 | | | Marlin Business Services Corp. | | | 1,144,550 | |
| | | | | | | | |
| | | | | | | 1,157,539 | |
| | | | | | | | |
| | | | Specialty Chemicals 0.4% | | | | |
| | 350,000 | | | EcoSynthetix, Inc.* (Canada) | | | 823,269 | |
| | | | | | | | |
| | | | Technology Hardware, Storage & Peripherals 0.4% | | | | |
| | 60,000 | | | Silicon Graphics International Corp.* | | | 736,800 | |
| | | | | | | | |
| | | | Thrifts & Mortgage Finance 2.0% | | | | |
| | 130,000 | | | Beneficial Mutual Bancorp, Inc.* | | | 1,714,700 | |
| | 15,000 | | | BofI Holding, Inc.* ‡ | | | 1,286,250 | |
| | 49,455 | | | Ocean Shore Holding Co. | | | 703,250 | |
| | | | | | | | |
| | | | | | | 3,704,200 | |
| | | | | | | | |
| | | | Trading Companies & Distributors 2.9% | | | | |
| | 110,000 | | | CAI International, Inc.* | | | 2,713,700 | |
| | 30,000 | | | DXP Enterprises, Inc.* | | | 2,847,900 | |
| | | | | | | | |
| | | | | | | 5,561,600 | |
| | | | | | | | |
| | | | Trucking 2.4% | | | | |
| | 57,500 | | | Roadrunner Transportation Systems, Inc.* | | | 1,451,300 | |
| | 79,000 | | | Saia, Inc.* | | | 3,018,590 | |
| | | | | | | | |
| | | | | | | 4,469,890 | |
| | | | | | | | |
| | |
| | | | Total Common Stocks (cost $127,870,885) | | | 172,970,535 | |
| | | | | | | | |
| | |
| | | | PREFERRED STOCKS 0.7% | | | | |
| | |
| | | | Pharmaceuticals 0.7% | | | | |
| | 105,263 | | | Acetylon Pharmaceuticals, Inc.,
Series B Pfd.* *** † | | | 1,366,314 | |
| | | | | | | | |
| | |
| | | | Total Preferred Stocks (cost $499,999) | | | 1,366,314 | |
| | | | | | | | |
| | |
| | | | WARRANTS 0.0% | | | | |
| | |
| | | | Health Care Equipment 0.0% | | | | |
| | 110,500 | | | Cardica, Inc., expiring 9/29/14* *** † | | | 1,105 | |
| | | | | | | | |
| | |
| | | | Total Warrants (cost $13,813) | | | 1,105 | |
| | | | | | | | |
75
| | |
| WASATCH MICRO CAP VALUE FUND (WAMVX) — Schedule of Investments (continued) | | MARCH 31, 2014 (UNAUDITED) |
|
|
|
| | | | | | | | |
Principal
Amount | | | | | Value | |
| | | | | | | |
| | | | SHORT-TERM INVESTMENTS 9.3% | | | | |
| | |
| | | | Repurchase Agreement 9.3% | | | | |
| | $17,805,103 | | | Repurchase Agreement dated 3/31/14, 0.00% due 4/1/14 with State Street Bank and Trust Co. collateralized by $18,300,000 of United States Treasury Notes 2.125% due 1/31/21; value: $18,162,750; repurchase proceeds: $17,805,103‡ (cost $17,805,103) | | $ | 17,805,103 | |
| | | | | | | | |
| | |
| | | | Total Short-Term Investments (cost $17,805,103) | | | 17,805,103 | |
| | | | | | | | |
| | |
| | | | Total Investments (cost $146,189,800) 100.8% | | | 192,143,057 | |
| | |
| | | | Liabilities less Other Assets (0.8%) | | | (1,534,803 | ) |
| | | | | | | | |
| | |
| | | | NET ASSETS 100.0% | | $ | 190,608,254 | |
| | | | | | | | |
| | |
Number of
Contracts | | | | | Value | |
| | | | | | | |
| | | | CALL OPTIONS WRITTEN 0.2% | | | | |
| | |
| | | | Application Software 0.1% | | | | |
| | 1,000 | | | Ebix, Inc., expiring 4/19/14, exercise price $17 | | $ | 75,000 | |
| | | | | | | | |
| | | | Construction Materials 0.0% | | | | |
| | 290 | | | Caesarstone Sdot-Yam Ltd.,
expiring 4/19/14, exercise price $55 | | | 53,650 | |
| | 400 | | | Caesarstone Sdot-Yam Ltd.,
expiring 4/19/14, exercise price $60 | | | 20,000 | |
| | | | | | | | |
| | | | | | | 73,650 | |
| | | | | | | | |
| | | | Pharmaceuticals 0.1% | | | | |
| | 800 | | | Horizon Pharma, Inc., expiring 4/19/14, exercise price $13 | | | 174,000 | |
| | | | | | | | |
| | | | Thrifts & Mortgage Finance 0.0% | | | | |
| | 150 | | | BofI Holding, Inc., expiring 5/17/14, exercise price $90 | | | 55,500 | |
| | | | | | | | |
| | |
| | | | Total Call Options Written (premium $455,854) | | | 378,150 | |
| | | | | | | | |
| |
| | | | *Non-income producing. ***Security was fair valued under procedures adopted by the Board of Trustees (see Note 14). †Security purchased in a private placement transaction or under Rule 144A of the Securities Act of 1933 (see Note 10). ‡All or a portion of this security has been designated as collateral for call options written (see Note 4). ADR American Depositary Receipt. GDR Global Depositary Receipt. PIPE Private Investment in a Public Equity. REIT Real Estate Investment Trust. See Notes to Financial Statements. | |
At March 31, 2014, Wasatch Micro Cap Value Fund’s investments, excluding short-term investments and call options written, were in the following countries:
| | | | |
| Country | | % | |
Belgium | | | 0.9 | |
Canada | | | 0.5 | |
China | | | 1.6 | |
France | | | 3.6 | |
Germany | | | 0.9 | |
India | | | 1.5 | |
Israel | | | 3.9 | |
Japan | | | 0.6 | |
Korea | | | 1.5 | |
Malaysia | | | 0.7 | |
Mexico | | | 0.9 | |
Philippines | | | 1.7 | |
Russia | | | 0.1 | |
South Africa | | | 0.4 | |
United States | | | 81.2 | |
| | | | |
TOTAL | | | 100.0 | % |
| | | | |
76
| | |
| WASATCH SMALL CAP GROWTH FUND (WAAEX) — Schedule of Investments | | MARCH 31, 2014 (UNAUDITED) |
|
|
|
| | | | | | | | |
| Shares | | | | | Value | |
| | | | | | | |
| | | | COMMON STOCKS 95.9% | | | | |
| | |
| | | | Aerospace & Defense 1.9% | | | | |
| | 1,126,738 | | | HEICO Corp., Class A | | $ | 48,911,697 | |
| | | | | | | | |
| | | | Air Freight & Logistics 2.4% | | | | |
| | 36,319,023 | | | Aramex PJSC (United Arab Emirates) | | | 32,630,759 | |
| | 765,652 | | | HUB Group, Inc., Class A* | | | 30,618,423 | |
| | | | | | | | |
| | | | | | | 63,249,182 | |
| | | | | | | | |
| | | | Airlines 2.1% | | | | |
| | 483,651 | | | Allegiant Travel Co. | | | 54,135,056 | |
| | | | | | | | |
| | | | Airport Services 2.1% | | | | |
| | 2,507,901 | | | Wesco Aircraft Holdings, Inc.* | | | 55,198,901 | |
| | | | | | | | |
| | | | Apparel Retail 1.9% | | | | |
| | 1,145,050 | | | Chico’s FAS, Inc. | | | 18,355,152 | |
| | 1,310,788 | | | Zumiez, Inc.* | | | 31,773,501 | |
| | | | | | | | |
| | | | | | | 50,128,653 | |
| | | | | | | | |
| | | | Application Software 6.0% | | | | |
| | 292,664 | | | Concur Technologies, Inc.* | | | 28,994,222 | |
| | 77,807 | | | FactSet Research Systems, Inc. | | | 8,388,373 | |
| | 1,248,707 | | | RealPage, Inc.* | | | 22,676,519 | |
| | 1,365,939 | | | Tangoe, Inc.* | | | 25,392,806 | |
| | 528,026 | | | Ultimate Software Group, Inc.* | | | 72,339,562 | |
| | | | | | | | |
| | | | | | | 157,791,482 | |
| | | | | | | | |
| | | | Automotive Retail 2.4% | | | | |
| | 649,256 | | | Monro Muffler Brake, Inc. | | | 36,929,681 | |
| | 175,496 | | | O’Reilly Automotive, Inc.* | | | 26,041,852 | |
| | | | | | | | |
| | | | | | | 62,971,533 | |
| | | | | | | | |
| | | | Biotechnology 5.0% | | | | |
| | 642,332 | | | Argos Therapeutics, Inc.* | | | 6,423,320 | |
| | 527,438 | | | Cellular Dynamics International, Inc.* | | | 7,874,649 | |
| | 1,357,191 | | | ChemoCentryx, Inc.* | | | 8,998,176 | |
| | 298,905 | | | Esperion Therapeutics, Inc.* | | | 4,519,444 | |
| | 1,621,982 | | | Exact Sciences Corp.* | | | 22,983,485 | |
| | 1,704,690 | | | Sangamo BioSciences, Inc.* | | | 30,820,795 | |
| | 1,101,057 | | | Seattle Genetics, Inc.* | | | 50,164,157 | |
| | | | | | | | |
| | | | | | | 131,784,026 | |
| | | | | | | | |
| | | | Consumer Finance 0.5% | | | | |
| | 3,305,639 | | | Mahindra & Mahindra Financial Services Ltd. (India) | | | 14,014,614 | |
| | | | | | | | |
| | | | Data Processing & Outsourced Services 5.6% | | | | |
| | 785,410 | | | ExlService Holdings, Inc.* | | | 24,277,023 | |
| | 806,834 | | | Higher One Holdings, Inc.* | | | 5,833,410 | |
| | 549,162 | | | Syntel, Inc.* | | | 49,369,664 | |
| | 1,596,239 | | | Wirecard AG (Germany) | | | 66,206,803 | |
| | | | | | | | |
| | | | | | | 145,686,900 | |
| | | | | | | | |
| | | | Diversified Banks 2.0% | | | | |
| | 761,965 | | | HDFC Bank Ltd. ADR (India) | | | 31,263,424 | |
| | 2,978,429 | | | Yes Bank Ltd. (India) | | | 20,721,458 | |
| | | | | | | | |
| | | | | | | 51,984,882 | |
| | | | | | | | |
| | | | Diversified Support Services 1.6% | | | | |
| | 1,124,516 | | | Copart, Inc.* | | | 40,921,137 | |
| | 66,375 | | | Ritchie Bros. Auctioneers, Inc. (Canada) | | | 1,601,629 | |
| | | | | | | | |
| | | | | | | 42,522,766 | |
| | | | | | | | |
| | | | Drug Retail 0.5% | | | | |
| | 119,229 | | | Cosmos Pharmaceutical Corp. (Japan) | | | 13,952,761 | |
| | | | | | | | |
| | | | Electrical Components & Equipment 0.9% | | | | |
| | 712,659 | | | Polypore International, Inc.* | | | 24,380,064 | |
| | | | | | | | |
| | | | | | | | |
| Shares | | | | | Value | |
| | | | | | | |
| | | | Electronic Manufacturing Services 2.1% | | | | |
| | 761,802 | | | IPG Photonics Corp.* | | $ | 54,148,886 | |
| | | | | | | | |
| | | | Environmental & Facilities Services 1.5% | | | | |
| | 1,334,005 | | | Tetra Tech, Inc.* | | | 39,473,208 | |
| | | | | | | | |
| | | | Food Distributors 1.1% | | | | |
| | 1,311,148 | | | Chefs’ Warehouse, Inc. (The)* ‡‡ | | | 28,058,567 | |
| | | | | | | | |
| | | | Health Care Distributors 1.0% | | | | |
| | 168,360 | | | MWI Veterinary Supply, Inc.* | | | 26,200,183 | |
| | | | | | | | |
| | | | Health Care Equipment 2.2% | | | | |
| | 659,371 | | | Abaxis, Inc.* | | | 25,636,344 | |
| | 462,232 | | | DexCom, Inc.* | | | 19,117,916 | |
| | 593,260 | | | Tandem Diabetes Care, Inc.* | | | 13,105,113 | |
| | | | | | | | |
| | | | | | | 57,859,373 | |
| | | | | | | | |
| | | | Health Care Services 2.6% | | | | |
| | 1,029,733 | | | IPC The Hospitalist Co., Inc.* ‡‡ | | | 50,539,296 | |
| | 285,640 | | | MEDNAX, Inc.* | | | 17,703,967 | |
| | | | | | | | |
| | | | | | | 68,243,263 | |
| | | | | | | | |
| | | | Health Care Technology 0.4% | | | | |
| | 145,937 | | | Computer Programs and Systems, Inc. | | | 9,427,530 | |
| | | | | | | | |
| | | | Homefurnishing Retail 0.9% | | | | |
| | 478,851 | | | Mattress Firm Holding Corp.* | | | 22,903,443 | |
| | | | | | | | |
| | | | Industrial Machinery 2.5% | | | | |
| | 484,674 | | | Graco, Inc. | | | 36,224,535 | |
| | 428,985 | | | Proto Labs, Inc.* | | | 29,029,415 | |
| | | | | | | | |
| | | | | | | 65,253,950 | |
| | | | | | | | |
| | | | Internet Retail 6.3% | | | | |
| | 999,639 | | | Blue Nile, Inc.* ‡‡ | | | 34,787,437 | |
| | 1,716,574 | | | MakeMyTrip Ltd.* (India) | | | 46,484,824 | |
| | 375,615 | | | Shutterfly, Inc.* | | | 16,031,248 | |
| | 1,016,502 | | | Start Today Co. Ltd. (Japan) | | | 26,069,718 | |
| | 514,448 | | | Yoox S.p.A.* (Italy) | | | 17,590,085 | |
| | 308,302 | | | zooplus AG* ‡‡ (Germany) | | | 24,700,162 | |
| | | | | | | | |
| | | | | | | 165,663,474 | |
| | | | | | | | |
| | | | Internet Software & Services 4.8% | | | | |
| | 1,035,158 | | | Angie’s List, Inc.* | | | 12,608,224 | |
| | 800,225 | | | Dealertrack Technologies, Inc.* | | | 39,363,068 | |
| | 187,369 | | | Envestnet, Inc.* | | | 7,528,486 | |
| | 26,366 | | | Millennial Media, Inc.* | | | 182,453 | |
| | 1,106,309 | | | SciQuest, Inc.* | | | 29,886,938 | |
| | 719,531 | | | Vistaprint N.V.* | | | 35,415,316 | |
| | | | | | | | |
| | | | | | | 124,984,485 | |
| | | | | | | | |
| | | | IT Consulting & Other Services 1.5% | | | | |
| | 551,474 | | | Cognizant Technology Solutions Corp., Class A* | | | 27,910,099 | |
| | 1,469,251 | | | ServiceSource International, Inc.* | | | 12,400,479 | |
| | | | | | | | |
| | | | | | | 40,310,578 | |
| | | | | | | | |
| | | | Leisure Facilities 2.4% | | | | |
| | 1,284,634 | | | Life Time Fitness, Inc.* | | | 61,790,895 | |
| | | | | | | | |
| | | | Life Sciences Tools & Services 5.3% | | | | |
| | 1,172,379 | | | Divi’s Laboratories Ltd. (India) | | | 26,777,884 | |
| | 897,084 | | | Fluidigm Corp.* | | | 39,534,492 | |
| | 1,103,068 | | | ICON plc* (Ireland) | | | 52,450,884 | |
| | 226,436 | | | Techne Corp. | | | 19,330,841 | |
| | | | | | | | |
| | | | | | | 138,094,101 | |
| | | | | | | | |
77
| | |
| WASATCH SMALL CAP GROWTH FUND (WAAEX) — Schedule of Investments (continued) | | |
|
|
|
| | | | | | | | |
| Shares | | | | | Value | |
| | | | | | | |
| | | | Oil & Gas Equipment & Services 4.5% | | | | |
| | 334,085 | | | Dril-Quip, Inc.* | | $ | 37,450,928 | |
| | 905,234 | | | Pason Systems, Inc. (Canada) | | | 22,898,035 | |
| | 160,362 | | | Schoeller-Bleckmann Oilfield Equipment AG (Austria) | | | 18,743,754 | |
| | 382,702 | | | ShawCor Ltd. (Canada) | | | 15,961,064 | |
| | 675,162 | | | TGS-NOPEC Geophysical Co. ASA (Norway) | | | 22,123,711 | |
| | | | | | | | |
| | | | | | | 117,177,492 | |
| | | | | | | | �� |
| | | | Oil & Gas Exploration & Production 1.9% | | | | |
| | 2,442,447 | | | Gran Tierra Energy, Inc.* (Colombia) | | | 18,269,503 | |
| | 978,179 | | | Northern Oil and Gas, Inc.* | | | 14,300,977 | |
| | 3,435,085 | | | Premier Oil plc (United Kingdom) | | | 16,890,368 | |
| | | | | | | | |
| | | | | | | 49,460,848 | |
| | | | | | | | |
| | | | Oil & Gas Refining & Marketing 0.0% | | | | |
| | 203,175 | | | Amyris, Inc.* | | | 757,843 | |
| | | | | | | | |
| | | | Packaged Foods & Meats 0.8% | | | | |
| | 2,461 | | | Annie’s, Inc.* | | | 98,907 | |
| | 286,067 | | | GlaxoSmithKline Consumer Healthcare Ltd.* (India) | | | 20,596,489 | |
| | | | | | | | |
| | | | | | | 20,695,396 | |
| | | | | | | | |
| | | | Personal Products 0.5% | | | | |
| | 582,400 | | | Colgate-Palmolive India Ltd. (India) | | | 13,403,318 | |
| | | | | | | | |
| | | | Pharmaceuticals 1.7% | | | | |
| | 1,560,471 | | | Cempra, Inc.* | | | 18,023,440 | |
| | 1,852,473 | | | IPCA Laboratories Ltd. (India) | | | 25,869,019 | |
| | | | | | | | |
| | | | | | | 43,892,459 | |
| | | | | | | | |
| | | | Research & Consulting Services 2.0% | | | | |
| | 1,250,723 | | | Resources Connection, Inc. | | | 17,622,687 | |
| | 549,657 | | | Stantec, Inc. (Canada) | | | 33,573,050 | |
| | | | | | | | |
| | | | | | | 51,195,737 | |
| | | | | | | | |
| | | | Restaurants 1.0% | | | | |
| | 1,491,986 | | | Jubilant Foodworks Ltd.* (India) | | | 26,527,110 | |
| | | | | | | | |
| | | | Semiconductors 4.3% | | | | |
| | 400,771 | | | Hittite Microwave Corp. | | | 25,264,604 | |
| | 989,470 | | | Power Integrations, Inc. | | | 65,087,337 | |
| | 424,490 | | | Silicon Laboratories, Inc.* | | | 22,179,602 | |
| | | | | | | | |
| | | | | | | 112,531,543 | |
| | | | | | | | |
| | | | Specialty Stores 1.0% | | | | |
| | 505,485 | | | Hibbett Sports, Inc.* | | | 26,730,047 | |
| | | | | | | | |
| | | | Systems Software 2.1% | | | | |
| | 529,530 | | | FleetMatics Group plc* | | | 17,712,779 | |
| | 786,167 | | | Infoblox, Inc.* | | | 15,770,510 | |
| | 229,359 | | | NetSuite, Inc.* | | | 21,750,114 | |
| | | | | | | | |
| | | | | | | 55,233,403 | |
| | | | | | | | |
| | | | Technology Hardware, Storage & Peripherals 0.4% | | | | |
| | 865,635 | | | Fusion-io, Inc.* | | | 9,106,480 | |
| | | | | | | | |
| | | | Trading Companies & Distributors 1.8% | | | | |
| | 547,600 | | | MSC Industrial Direct Co., Inc., Class A | | | 47,378,352 | |
| | | | | | | | |
| | | | Trucking 4.4% | | | | |
| | 4,929,768 | | | Knight Transportation, Inc.‡‡ | | | 114,025,534 | |
| | | | | | | | |
| | |
| | | | Total Common Stocks (cost $1,481,102,280) | | | 2,507,240,015 | |
| | | | | | | | |
| | | | | | | | |
| Shares | | | | | Value | |
| | | | | | | |
| | | | PREFERRED STOCKS 0.9% | | | | |
| | |
| | | | Biotechnology 0.0% | | | | |
| | 677,966 | | | Nanosys, Inc., Series D Pfd.* *** † | | $ | 632,475 | |
| | 161,519 | | | Nanosys, Inc., Series E Pfd.* *** † | | | 192,902 | |
| | | | | | | | |
| | | | | | | 825,377 | |
| | | | | | | | |
| | | | Oil & Gas Equipment & Services 0.6% | | | | |
| | 5,818,582 | | | Drilling Info Holdings, Inc., Series B Pfd.* *** † | | | 15,350,001 | |
| | | | | | | | |
| | | | Systems Software 0.3% | | | | |
| | 9,974 | | | DocuSign, Inc., Series B-1 Pfd.* *** † | | | 130,983 | |
| | 33,296 | | | DocuSign, Inc., Series B Pfd.* *** † | | | 437,256 | |
| | 23,905 | | | DocuSign, Inc., Series D Pfd.* *** † | | | 313,930 | |
| | 618,152 | | | DocuSign, Inc., Series E Pfd.* *** † | | | 8,117,819 | |
| | | | | | | | |
| | | | | | | 8,999,988 | |
| | | | | | | | |
| | |
| | | | Total Preferred Stocks (cost $26,534,928) | | | 25,175,366 | |
| | | | | | | | |
| | |
| | | | LIMITED PARTNERSHIP INTEREST 0.2% | | | | |
| | |
| | | | Asset Management & Custody Banks 0.2% | | | | |
| | | | Greenspring Global Partners II-B, L.P.* ** † | | | 3,119,543 | |
| | | | Greenspring Global Partners III-B, L.P.* ** † | | | 1,326,583 | |
| | | | | | | | |
| | | | | | | 4,446,126 | |
| | | | | | | | |
| | |
| | | | Total Limited Partnership Interest
(cost $4,630,614) | | | 4,446,126 | |
| | | | | | | | |
| | |
Principal
Amount | | | | | Value | |
| | | | | | | |
| | | | SHORT-TERM INVESTMENTS 3.2% | | | | |
| | |
| | | | Repurchase Agreement 3.2% | | | | |
| | $83,209,145 | | | Repurchase Agreement dated 3/31/14, 0.00% due 4/1/14 with State Street Bank and Trust Co. collateralized by $79,405,000 of United States Treasury Notes 2.125% due 1/31/21; value: $17,080,925; United States Treasury Notes 3.625% due 2/15/21; value: $67,792,550; repurchase proceeds: $83,209,145†† (cost $83,209,145) | | $ | 83,209,145 | |
| | | | | | | | |
| | |
| | | | Total Short-Term Investments
(cost $83,209,145) | | | 83,209,145 | |
| | | | | | | | |
| | |
| | | | Total Investments
(cost $1,595,476,967) 100.2% | | | 2,620,070,652 | |
| | |
| | | | Liabilities less Other Assets (0.2%) | | | (6,525,669 | ) |
| | | | | | | | |
| | |
| | | | NET ASSETS 100.0% | | $ | 2,613,544,983 | |
| | | | | | | | |
| |
| | | | *Non-income producing. ***Security was fair valued under procedures adopted by the Board of Trustees (see Note 14). †Security purchased in a private placement transaction or under Rule 144A of the Securities Act of 1933 (see Note 10). ††All or a portion of this security has been designated as collateral for purchase commitments (see Note 11). ‡‡Affiliated company (see Note 9). ADR American Depositary Receipt. See Notes to Financial Statements. | |
78
| | |
| | MARCH 31, 2014 (UNAUDITED) |
|
|
|
At March 31, 2014, Wasatch Small Cap Growth Fund’s investments, excluding short-term investments, were in the following countries:
| | | | |
| Country | | % | |
Austria | | | 0.7 | |
Canada | | | 2.9 | |
Colombia | | | 0.7 | |
Germany | | | 3.6 | |
India | | | 8.9 | |
Ireland | | | 2.1 | |
Italy | | | 0.7 | |
Japan | | | 1.6 | |
Norway | | | 0.9 | |
United Arab Emirates | | | 1.3 | |
United Kingdom | | | 0.6 | |
United States | | | 76.0 | |
| | | | |
TOTAL | | | 100.0 | % |
| | | | |
79
| | |
| WASATCH SMALL CAP VALUE FUND (WMCVX / WICVX) — Schedule of Investments | | |
|
|
|
| | | | | | | | |
| Shares | | | | | Value | |
| | | | | | | |
| | | | COMMON STOCKS 92.7% | | | | |
| | |
| | | | Aerospace & Defense 1.7% | | | | |
| | 93,007 | | | HEICO Corp., Class A | | $ | 4,037,434 | |
| | | | | | | | |
| | | | Agricultural Products 1.6% | | | | |
| | 184,942 | | | Darling International, Inc.* | | | 3,702,539 | |
| | | | | | | | |
| | | | Airlines 1.7% | | | | |
| | 36,182 | | | Allegiant Travel Co. | | | 4,049,851 | |
| | | | | | | | |
| | | | Airport Services 1.8% | | | | |
| | 196,510 | | | Wesco Aircraft Holdings, Inc.* | | | 4,325,185 | |
| | | | | | | | |
| | | | Alternative Carriers 1.0% | | | | |
| | 341,175 | | | ORBCOMM, Inc.* | | | 2,337,049 | |
| | | | | | | | |
| | | | Apparel Retail 1.5% | | | | |
| | 219,134 | | | Chico’s FAS, Inc. | | | 3,512,718 | |
| | | | | | | | |
| | | | Apparel, Accessories & Luxury Goods 0.9% | | | | |
| | 185,623 | | | Vaibhav Global Ltd.* (India) | | | 2,004,875 | |
| | | | | | | | |
| | | | Application Software 4.1% | | | | |
| | 417,206 | | | Ebix, Inc. | | | 7,121,706 | |
| | 34,660 | | | Interactive Intelligence Group, Inc.* | | | 2,512,850 | |
| | | | | | | | |
| | | | | | | 9,634,556 | |
| | | | | | | | |
| | | | Asset Management & Custody Banks 1.1% | | | | |
| | 14,846 | | | Virtus Investment Partners, Inc.* | | | 2,570,882 | |
| | | | | | | | |
| | | | Auto Parts & Equipment 0.9% | | | | |
| | 37,026 | | | Dorman Products, Inc.* | | | 2,186,756 | |
| | | | | | | | |
| | | | Consumer Finance 4.2% | | | | |
| | 180,994 | | | DFC Global Corp.* | | | 1,598,177 | |
| | 82,126 | | | Encore Capital Group, Inc.* | | | 3,753,158 | |
| | 45,814 | | | Portfolio Recovery Associates, Inc.* | | | 2,650,798 | |
| | 79,983 | | | Regional Management Corp.* | | | 1,972,381 | |
| | | | | | | | |
| | | | | | | 9,974,514 | |
| | | | | | | | |
| | | | Data Processing & Outsourced Services 1.7% | | | | |
| | 44,494 | | | Syntel, Inc.* | | | 4,000,011 | |
| | | | | | | | |
| | | | Diversified Banks 3.1% | | | | |
| | 3,595,000 | | | City Union Bank Ltd. (India) | | | 3,232,475 | |
| | 590,500 | | | Yes Bank Ltd. (India) | | | 4,108,213 | |
| | | | | | | | |
| | | | | | | 7,340,688 | |
| | | | | | | | |
| | | | Diversified Support Services 3.1% | | | | |
| | 202,425 | | | Copart, Inc.* | | | 7,366,246 | |
| | | | | | | | |
| | | | Electrical Components & Equipment 2.8% | | | | |
| | 189,622 | | | Polypore International, Inc.* | | | 6,486,969 | |
| | | | | | | | |
| | | | Electronic Manufacturing Services 1.1% | | | | |
| | 128,312 | | | Fabrinet* | | | 2,665,040 | |
| | | | | | | | |
| | | | Footwear 2.1% | | | | |
| | 135,347 | | | Skechers U.S.A., Inc., Class A* | | | 4,945,579 | |
| | | | | | | | |
| | | | Health Care Facilities 1.8% | | | | |
| | 96,500 | | | Ensign Group, Inc. (The) | | | 4,211,260 | |
| | | | | | | | |
| | | | Health Care Services 3.3% | | | | |
| | 70,373 | | | CorVel Corp.* | | | 3,501,760 | |
| | 69,774 | | | MEDNAX, Inc.* | | | 4,324,593 | |
| | | | | | | | |
| | | | | | | 7,826,353 | |
| | | | | | | | |
| | | | Homefurnishing Retail 1.2% | | | | |
| | 159,380 | | | Select Comfort Corp.* | | | 2,881,590 | |
| | | | | | | | |
| | | | | | | | |
| Shares | | | | | Value | |
| | | | | | | |
| | | | Hotels & Resort REITs 1.8% | | | | |
| | 452,991 | | | Summit Hotel Properties, Inc. | | $ | 4,203,757 | |
| | | | | | | | |
| | | | Human Resource & Employment Services 0.2% | | | | |
| | 26,714 | | | TriNet Group, Inc.* | | | 569,275 | |
| | | | | | | | |
| | | | Internet Retail 1.8% | | | | |
| | 155,292 | | | MakeMyTrip Ltd.* (India) | | | 4,205,307 | |
| | | | | | | | |
| | | | Internet Software & Services 1.9% | | | | |
| | 92,363 | | | Vistaprint N.V.* | | | 4,546,107 | |
| | | | | | | | |
| | | | IT Consulting & Other Services 1.4% | | | | |
| | 99,370 | | | EPAM Systems, Inc.* | | | 3,269,273 | |
| | | | | | | | |
| | | | Leisure Facilities 1.9% | | | | |
| | 94,456 | | | Life Time Fitness, Inc.* | | | 4,543,334 | |
| | | | | | | | |
| | | | Life Sciences Tools & Services 1.1% | | | | |
| | 54,582 | | | ICON plc* (Ireland) | | | 2,595,374 | |
| | | | | | | | |
| | | | Mortgage REITs 2.2% | | | | |
| | 741,082 | | | Arbor Realty Trust, Inc. | | | 5,128,287 | |
| | | | | | | | |
| | | | Oil & Gas Equipment & Services 5.4% | | | | |
| | 38,902 | | | CARBO Ceramics, Inc. | | | 5,368,087 | |
| | 37,236 | | | Geospace Technologies Corp.* | | | 2,463,906 | |
| | 8,000 | | | TGS-NOPEC Geophysical Co. ASA ADR* (Norway) | | | 260,000 | |
| | 141,400 | | | TGS-NOPEC Geophysical Co. ASA (Norway) | | | 4,633,396 | |
| | | | | | | | |
| | | | | | | 12,725,389 | |
| | | | | | | | |
| | | | Oil & Gas Exploration & Production 6.0% | | | | |
| | 233,235 | | | Comstock Resources, Inc. | | | 5,329,420 | |
| | 297,252 | | | Northern Oil and Gas, Inc.* | | | 4,345,824 | |
| | 160,981 | | | Ultra Petroleum Corp.* | | | 4,328,779 | |
| | | | | | | | |
| | | | | | | 14,004,023 | |
| | | | | | | | |
| | | | Oil & Gas Refining & Marketing 2.1% | | | | |
| | 110,164 | | | World Fuel Services Corp. | | | 4,858,232 | |
| | | | | | | | |
| | | | Personal Products 1.6% | | | | |
| | 48,787 | | | USANA Health Sciences, Inc.* | | | 3,675,613 | |
| | | | | | | | |
| | | | Pharmaceuticals 3.3% | | | | |
| | 75,002 | | | Questcor Pharmaceuticals, Inc. | | | 4,869,880 | |
| | 328,900 | | | Torrent Pharmaceuticals Ltd. (India) | | | 2,881,609 | |
| | | | | | | | |
| | | | | | | 7,751,489 | |
| | | | | | | | |
| | | | Regional Banks 5.2% | | | | |
| | 236,585 | | | Customers Bancorp, Inc.* | | | 4,937,529 | |
| | 35,496 | | | Prosperity Bancshares, Inc. | | | 2,348,061 | |
| | 338,844 | | | Tristate Capital Holdings, Inc.* | | | 4,814,973 | |
| | | | | | | | |
| | | | | | | 12,100,563 | |
| | | | | | | | |
| | | | Research & Consulting Services 5.4% | | | | |
| | 195,647 | | | Acacia Research Corp. | | | 2,989,486 | |
| | 254,043 | | | Franklin Covey Co.* | | | 5,022,430 | |
| | 36,532 | | | Huron Consulting Group, Inc.* | | | 2,315,398 | |
| | 481,426 | | | Sporton International, Inc. (Taiwan) | | | 2,308,126 | |
| | | | | | | | |
| | | | | | | 12,635,440 | |
| | | | | | | | |
| | | | Semiconductors 1.0% | | | | |
| | 690,487 | | | O2Micro International Ltd. ADR* (China) | | | 2,264,797 | |
| | | | | | | | |
| | | | Systems Software 1.2% | | | | |
| | 135,446 | | | AVG Technologies N.V.* | | | 2,838,948 | |
| | | | | | | | |
| | | | Trading Companies & Distributors 2.6% | | | | |
| | 40,510 | | | DXP Enterprises, Inc.* | | | 3,845,614 | |
| | 25,155 | | | MSC Industrial Direct Co., Inc., Class A | | | 2,176,411 | |
| | | | | | | | |
| | | | | | | 6,022,025 | |
| | | | | | | | |
80
| | |
| | MARCH 31, 2014 (UNAUDITED) |
|
|
|
| | | | | | | | |
| Shares | | | | | Value | |
| | | | | | | |
| | | | Trucking 5.9% | | | | |
| | 152,800 | | | Knight Transportation, Inc. | | $ | 3,534,264 | |
| | 41,546 | | | Old Dominion Freight Line, Inc.* | | | 2,357,320 | |
| | 140,894 | | | Saia, Inc.* | | | 5,383,560 | |
| | 85,644 | | | Universal Truckload Services, Inc. | | | 2,475,111 | |
| | | | | | | | |
| | | | | | | 13,750,255 | |
| | | | | | | | |
| | |
| | | | Total Common Stocks
(cost $151,231,506) | | | 217,747,583 | |
| | | | | | | | |
| | |
Principal
Amount | | | | | Value | |
| | | | | | | |
| | | | SHORT-TERM INVESTMENTS 6.7% | | | | |
| | |
| | | | Repurchase Agreement 6.7% | | | | |
| | $15,729,661 | | | Repurchase Agreement dated 3/31/14, 0.00% due 4/1/14 with State Street Bank and Trust Co. collateralized by $16,170,000 of United States Treasury Notes 2.125% due 1/31/21; value: $16,048,725; repurchase proceeds: $15,729,661 (cost $15,729,661) | | $ | 15,729,661 | |
| | | | | | | | |
| | |
| | | | Total Short-Term Investments
(cost $15,729,661) | | | 15,729,661 | |
| | | | | | | | |
| | |
| | | | Total Investments
(cost $166,961,167) 99.4% | | | 233,477,244 | |
| | |
| | | | Other Assets less Liabilities 0.6% | | | 1,320,844 | |
| | | | | | | | |
| | |
| | | | NET ASSETS 100.0% | | $ | 234,798,088 | |
| | | | | | | | |
| |
| | | | *Non-income producing. ADR American Depositary Receipt. REIT Real Estate Investment Trust. See Notes to Financial Statements. | |
At March 31, 2014, Wasatch Small Cap Value Fund’s investments, excluding short-term investments, were in the following countries:
| | | | |
| Country | | % | |
China | | | 1.0 | |
India | | | 7.5 | |
Ireland | | | 1.2 | |
Norway | | | 2.3 | |
Taiwan | | | 1.1 | |
United States | | | 86.9 | |
| | | | |
TOTAL | | | 100.0 | % |
| | | | |
81
| | |
| WASATCH STRATEGIC INCOME FUND (WASIX) — Schedule of Investments | | MARCH 31, 2014 (UNAUDITED) |
|
|
|
| | | | | | | | |
| Shares | | | | | Value | |
| | | | | | | |
| | | | COMMON STOCKS 82.1% | | | | |
| | |
| | | | Cable & Satellite 1.8% | | | | |
| | 26,000 | | | Comcast Corp., Class A | | $ | 1,300,520 | |
| | | | | | | | |
| | | | Consumer Finance 6.2% | | | | |
| | 29,330 | | | Capital One Financial Corp. | | | 2,263,103 | |
| | 38,000 | | | Discover Financial Services | | | 2,211,220 | |
| | | | | | | | |
| | | | | | | 4,474,323 | |
| | | | | | | | |
| | | | Data Processing & Outsourced Services 5.8% | | | | |
| | 27,000 | | | MasterCard, Inc., Class A | | | 2,016,900 | |
| | 10,035 | | | Visa, Inc., Class A | | | 2,166,155 | |
| | | | | | | | |
| | | | | | | 4,183,055 | |
| | | | | | | | |
| | | | Diversified REITs 0.3% | | | | |
| | 177,857 | | | Star Asia Financial Ltd.* *** † | | | 231,214 | |
| | | | | | | | |
| | | | Drug Retail 2.2% | | | | |
| | 21,000 | | | CVS Caremark Corp. | | | 1,572,060 | |
| | | | | | | | |
| | | | Health Care Services 2.2% | | | | |
| | 18,240 | | | Chemed Corp. | | | 1,631,568 | |
| | | | | | | | |
| | | | Hypermarkets & Super Centers 2.3% | | | | |
| | 21,600 | | | Wal-Mart Stores, Inc. | | | 1,650,888 | |
| | | | | | | | |
| | | | Integrated Oil & Gas 8.5% | | | | |
| | 31,400 | | | Occidental Petroleum Corp. | | | 2,992,106 | |
| | 90,615 | | | Suncor Energy, Inc. (Canada) | | | 3,165,192 | |
| | | | | | | | |
| | | | | | | 6,157,298 | |
| | | | | | | | |
| | | | Mortgage REITs 21.1% | | | | |
| | 106,600 | | | American Capital Mortgage Investment Corp. | | | 2,000,882 | |
| | 108,000 | | | Capstead Mortgage Corp. | | | 1,367,280 | |
| | 123,491 | | | Colony Financial, Inc. | | | 2,710,627 | |
| | 275,000 | | | NorthStar Realty Finance Corp. | | | 4,438,500 | |
| | 112,000 | | | Starwood Property Trust, Inc. | | | 2,642,080 | |
| | 209,000 | | | Two Harbors Investment Corp. | | | 2,142,250 | |
| | | | | | | | |
| | | | | | | 15,301,619 | |
| | | | | | | | |
| | | | Movies & Entertainment 2.0% | | | | |
| | 18,000 | | | Walt Disney Co. (The) | | | 1,441,260 | |
| | | | | | | | |
| | | | Personal Products 5.0% | | | | |
| | 63,300 | | | Herbalife Ltd. | | | 3,625,191 | |
| | | | | | | | |
| | | | Railroads 3.9% | | | | |
| | 50,800 | | | Canadian National Railway Co. (Canada) | | | 2,854,470 | |
| | | | | | | | |
| | | | Restaurants 1.8% | | | | |
| | 13,570 | | | McDonald’s Corp. | | | 1,330,267 | |
| | | | | | | | |
| | | | Semiconductors 1.8% | | | | |
| | 50,000 | | | Intel Corp. | | | 1,290,500 | |
| | | | | | | | |
| | | | Specialty Stores 4.1% | | | | |
| | 43,000 | | | PetSmart, Inc. | | | 2,962,270 | |
| | | | | | | | |
| | | | Technology Hardware, Storage & Peripherals 3.8% | | | | |
| | 5,139 | | | Apple, Inc. | | | 2,758,307 | |
| | | | | | | | |
| | | | Thrifts & Mortgage Finance 4.1% | | | | |
| | 136,000 | | | Home Loan Servicing Solutions Ltd. | | | 2,937,600 | |
| | | | | | | | |
| | | | Trading Companies & Distributors 5.2% | | | | |
| | 52,500 | | | TAL International Group, Inc. | | | 2,250,675 | |
| | 6,030 | | | W.W. Grainger, Inc. | | | 1,523,540 | |
| | | | | | | | |
| | | | | | | 3,774,215 | |
| | | | | | | | |
| | |
| | | | Total Common Stocks (cost $49,633,848) | | | 59,476,625 | |
| | | | | | | | |
| | | | | | | | |
| Shares | | | | | Value | |
| | | | | | | |
| | |
| | | | EXCHANGE-TRADED FUNDS 4.0% | | | | |
| | |
| | | | Asset Management & Custody Banks 4.0% | | | | |
| | 51,600 | | | PowerShares Dynamic Pharmaceuticals Portfolio | | $ | 2,923,140 | |
| | | | | | | | |
| | |
| | | | Total Exchange-Traded Funds (cost $1,681,053) | | | 2,923,140 | |
| | | | | | | | |
| | |
| | | | LIMITED PARTNERSHIP INTEREST 3.0% | | | | |
| | |
| | | | Asset Management & Custody Banks 3.0% | | | | |
| | 65,400 | | | Blackstone Group L.P. | | | 2,174,550 | |
| | | | | | | | |
| | |
| | | | Total Limited Partnership Interest (cost $1,646,680) | | | 2,174,550 | |
| | | | | | | | |
| | |
Principal
Amount | | | | | Value | |
| | | | | | | |
| | | | CORPORATE BONDS 0.0% | | | | |
| | |
| | | | Gold 0.0% | | | | |
| | $206,605 | | | Redcorp Ventures Ltd., 13.00%, 7/11/12, Series D* *** † §§ (Canada) | | $ | 1,215 | |
| | | | | | | | |
| | |
| | | | Total Corporate Bonds
(cost $152,584) | | | 1,215 | |
| | | | | | | | |
| | |
| | | | SHORT-TERM INVESTMENTS 10.3% | | | | |
| | |
| | | | Repurchase Agreement 10.3% | | | | |
| | 7,498,799 | | | Repurchase Agreement dated 3/31/14, 0.00% due 4/1/14 with State Street Bank and Trust Co. collateralized by $7,805,000 of United States Treasury Notes 2.000% due 2/28/21; value: $7,652,295; repurchase proceeds: $7,498,799 (cost $7,498,799) | | | 7,498,799 | |
| | | | | | | | |
| | |
| | | | Total Short-Term Investments
(cost $7,498,799) | | | 7,498,799 | |
| | | | | | | | |
| | |
| | | | Total Investments
(cost $60,612,964) 99.4% | | | 72,074,329 | |
| | |
| | | | Other Assets less Liabilities 0.6% | | | 409,960 | |
| | | | | | | | |
| | |
| | | | NET ASSETS 100.0% | | $ | 72,484,289 | |
| | | | | | | | |
| |
| | | | *Non-income producing. ***Security was fair valued under procedures adopted by the Board of Trustees (see Note 14). †Security purchased in a private placement transaction or under Rule 144A of the Securities Act of 1933 (see Note 10). §§In default. REIT Real Estate Investment Trust. See Notes to Financial Statements. | |
At March 31, 2014, Wasatch Strategic Income Fund’s investments, excluding short-term investments, were in the following countries:
| | | | |
| Country | | % | |
Canada | | | 9.3 | |
United States | | | 90.7 | |
| | | | |
TOTAL | | | 100.0 | % |
| | | | |
82
| | |
| WASATCH ULTRA GROWTH FUND (WAMCX) — Schedule of Investments | | MARCH 31, 2014 (UNAUDITED) |
|
|
|
| | | | | | | | |
| Shares | | | | | Value | |
| | | | | | | |
| | | | COMMON STOCKS 94.1% | | | | |
| | |
| | | | Apparel, Accessories & Luxury Goods 1.2% | | | | |
| | 13,540 | | | Page Industries Ltd. (India) | | $ | 1,463,798 | |
| | | | | | | | |
| | | | Application Software 10.2% | | | | |
| | 10,748 | | | Concur Technologies, Inc.* | | | 1,064,804 | |
| | 16,280 | | | Datawatch Corp.* | | | 441,514 | |
| | 100,003 | | | Exa Corp.* | | | 1,326,040 | |
| | 35,417 | | | Interactive Intelligence Group, Inc.* | | | 2,567,732 | |
| | 31,923 | | | QLIK Technologies, Inc.* | | | 848,833 | |
| | 72,850 | | | RealPage, Inc.* | | | 1,322,956 | |
| | 134,726 | | | Tangoe, Inc.* | | | 2,504,556 | |
| | 14,793 | | | Ultimate Software Group, Inc.* | | | 2,026,641 | |
| | | | | | | | |
| | | | | | | 12,103,076 | |
| | | | | | | | |
| | | | Asset Management & Custody Banks 0.9% | | | | |
| | 6,215 | | | Virtus Investment Partners, Inc.* | | | 1,076,251 | |
| | | | | | | | |
| | | | Auto Parts & Equipment 0.8% | | | | |
| | 27,400 | | | WABCO India Ltd. (India) | | | 922,165 | |
| | | | | | | | |
| | | | Biotechnology 8.1% | | | | |
| | 159,928 | | | Abcam plc (United Kingdom) | | | 1,037,292 | |
| | 63,040 | | | Argos Therapeutics, Inc.* | | | 630,400 | |
| | 68,458 | | | Cellular Dynamics International, Inc.* | | | 1,022,078 | |
| | 123,154 | | | ChemoCentryx, Inc.* | | | 816,511 | |
| | 109,126 | | | Cytokinetics, Inc.* | | | 1,036,697 | |
| | 32,426 | | | Esperion Therapeutics, Inc.* | | | 490,281 | |
| | 71,335 | | | Exact Sciences Corp.* | | | 1,010,817 | |
| | 80,986 | | | OncoGenex Pharmaceutical, Inc.* | | | 952,395 | |
| | 68,426 | | | Sangamo BioSciences, Inc.* | | | 1,237,142 | |
| | 29,796 | | | Seattle Genetics, Inc.* | | | 1,357,506 | |
| | | | | | | | |
| | | | | | | 9,591,119 | |
| | | | | | | | |
| | | | Building Products 1.1% | | | | |
| | 18,360 | | | Trex Co., Inc.* | | | 1,343,218 | |
| | | | | | | | |
| | | | Casinos & Gaming 0.6% | | | | |
| | 25,003 | | | Multimedia Games Holding Co., Inc.* | | | 726,087 | |
| | | | | | | | |
| | | | Consumer Finance 2.2% | | | | |
| | 205,406 | | | DFC Global Corp.* | | | 1,813,735 | |
| | 175,465 | | | Mahindra & Mahindra Financial Services Ltd. (India) | | | 743,903 | |
| | | | | | | | |
| | | | | | | 2,557,638 | |
| | | | | | | | |
| | | | Data Processing & Outsourced Services 1.1% | | | | |
| | 14,120 | | | Syntel, Inc.* | | | 1,269,388 | |
| | | | | | | | |
| | | | Diversified Banks 3.2% | | | | |
| | 1,346,922 | | | City Union Bank Ltd. (India) | | | 1,211,097 | |
| | 376,545 | | | Yes Bank Ltd. (India) | | | 2,619,690 | |
| | | | | | | | |
| | | | | | | 3,830,787 | |
| | | | | | | | |
| | | | Diversified Metals & Mining 1.7% | | | | |
| | 51,631 | | | U.S. Silica Holdings, Inc. | | | 1,970,755 | |
| | | | | | | | |
| | | | Electrical Components & Equipment 1.7% | | | | |
| | 58,786 | | | Polypore International, Inc.* | | | 2,011,069 | |
| | | | | | | | |
| | | | Electronic Manufacturing Services 1.7% | | | | |
| | 28,906 | | | IPG Photonics Corp.* | | | 2,054,638 | |
| | | | | | | | |
| | | | Environmental & Facilities Services 1.0% | | | | |
| | 27,001 | | | Waste Connections, Inc. | | | 1,184,264 | |
| | | | | | | | |
| | | | Footwear 1.2% | | | | |
| | 39,388 | | | Skechers U.S.A., Inc., Class A* | | | 1,439,237 | |
| | | | | | | | |
| | | | | | | | |
| Shares | | | | | Value | |
| | | | | | | |
| | | | Health Care Equipment 6.2% | | | | |
| | 124,322 | | | AtriCure, Inc.* | | $ | 2,338,497 | |
| | 616,085 | | | Cardica, Inc.* | | | 622,246 | |
| | 74,498 | | | Novadaq Technologies, Inc.* (Canada) | | | 1,659,815 | |
| | 34,097 | | | NuVasive, Inc.* | | | 1,309,666 | |
| | 63,297 | | | Tandem Diabetes Care, Inc.* | | | 1,398,231 | |
| | | | | | | | |
| | | | | | | 7,328,455 | |
| | | | | | | | |
| | | | Health Care Services 1.7% | | | | |
| | 21,345 | | | IPC The Hospitalist Co., Inc.* | | | 1,047,612 | |
| | 55,122 | | | National Research Corp., Class A* | | | 914,474 | |
| | | | | | | | |
| | | | | | | 1,962,086 | |
| | | | | | | | |
| | | | Health Care Technology 1.0% | | | | |
| | 71,878 | | | Vocera Communications, Inc.* | | | 1,173,768 | |
| | | | | | | | |
| | | | Homebuilding 1.0% | | | | |
| | 71,276 | | | LGI Homes, Inc.* | | | 1,229,511 | |
| | | | | | | | |
| | | | Industrial Machinery 1.3% | | | | |
| | 23,478 | | | Proto Labs, Inc.* | | | 1,588,756 | |
| | | | | | | | |
| | | | Internet Retail 2.9% | | | | |
| | 102,945 | | | MakeMyTrip Ltd.* (India) | | | 2,787,750 | |
| | 14,347 | | | Shutterfly, Inc.* | | | 612,330 | |
| | | | | | | | |
| | | | | | | 3,400,080 | |
| | | | | | | | |
| | | | Internet Software & Services 8.3% | | | | |
| | 95,448 | | | Amber Road, Inc.* | | | 1,469,899 | |
| | 72,119 | | | Angie’s List, Inc.* †† | | | 878,410 | |
| | 67,444 | | | E2open, Inc.* | | | 1,589,655 | |
| | 14,227 | | | Rocket Fuel, Inc.* | | | 610,054 | |
| | 76,758 | | | SciQuest, Inc.* | | | 2,073,617 | |
| | 29,672 | | | SPS Commerce, Inc.* | | | 1,823,344 | |
| | 26,781 | | | Vistaprint N.V.* | | | 1,318,161 | |
| | 91,388 | | | Xtera Communications, Inc.* *** † | | | 914 | |
| | | | | | | | |
| | | | | | | 9,764,054 | |
| | | | | | | | |
| | | | IT Consulting & Other Services 3.7% | | | | |
| | 47,241 | | | Cognizant Technology Solutions Corp., Class A* | | | 2,390,867 | |
| | 231,828 | | | ServiceSource International, Inc.* | | | 1,956,628 | |
| | | | | | | | |
| | | | | | | 4,347,495 | |
| | | | | | | | |
| | | | Leisure Products 1.5% | | | | |
| | 141,831 | | | Black Diamond, Inc.* | | | 1,734,593 | |
| | | | | | | | |
| | | | Life Sciences Tools & Services 1.1% | | | | |
| | 28,184 | | | ICON plc* (Ireland) | | | 1,340,149 | |
| | | | | | | | |
| | | | Oil & Gas Exploration & Production 2.0% | | | | |
| | 86,330 | | | Northern Oil and Gas, Inc.* | | | 1,262,145 | |
| | 42,480 | | | Ultra Petroleum Corp.* | | | 1,142,287 | |
| | | | | | | | |
| | | | | | | 2,404,432 | |
| | | | | | | | |
| | | | Oil & Gas Refining & Marketing 1.0% | | | | |
| | 312,457 | | | Amyris, Inc.* | | | 1,165,465 | |
| | | | | | | | |
| | | | Packaged Foods & Meats 1.0% | | | | |
| | 16,866 | | | GlaxoSmithKline Consumer Healthcare Ltd.* (India) | | | 1,214,332 | |
| | | | | | | | |
| | | | Pharmaceuticals 7.7% | | | | |
| | 33,519 | | | Aerie Pharmaceuticals, Inc.* | | | 710,268 | |
| | 72,677 | | | Cardiovascular Systems, Inc.* | | | 2,310,402 | |
| | 137,818 | | | Cempra, Inc.* | | | 1,591,798 | |
| | 52,369 | | | Egalet Corp.* | | | 732,642 | |
| | 154,265 | | | Horizon Pharma, Inc.* | | | 2,332,487 | |
| | 22,712 | | | Questcor Pharmaceuticals, Inc. | | | 1,474,690 | |
| | | | | | | | |
| | | | | | | 9,152,287 | |
| | | | | | | | |
| | | | Restaurants 1.4% | | | | |
| | 90,205 | | | Jubilant Foodworks Ltd.* (India) | | | 1,603,821 | |
| | | | | | | | |
83
| | |
| WASATCH ULTRA GROWTH FUND (WAMCX) — Schedule of Investments (continued) | | MARCH 31, 2014 (UNAUDITED) |
|
|
|
| | | | | | | | |
| Shares | | | | | Value | |
| | | | | | | |
| | | | Semiconductor Equipment 1.3% | | | | |
| | 83,460 | | | PDF Solutions, Inc.* | | $ | 1,516,468 | |
| | | | | | | | |
| | | | Semiconductors 3.6% | | | | |
| | 14,249 | | | Hittite Microwave Corp. | | | 898,257 | |
| | 93,135 | | | MaxLinear, Inc., Class A* | | | 882,920 | |
| | 23,498 | | | NVE Corp.* | | | 1,340,326 | |
| | 18,168 | | | Power Integrations, Inc. | | | 1,195,091 | |
| | | | | | | | |
| | | | | | | 4,316,594 | |
| | | | | | | | |
| | | | Specialized Consumer Services 0.8% | | | | |
| | 55,208 | | | LifeLock, Inc.* | | | 944,609 | |
| | | | | | | | |
| | | | Specialized Finance 0.9% | | | | |
| | 49,121 | | | CRISIL Ltd. (India) | | | 1,007,547 | |
| | | | | | | | |
| | | | Specialty Chemicals 2.3% | | | | |
| | 23,905 | | | Balchem Corp. | | | 1,245,929 | |
| | 603,360 | | | EcoSynthetix, Inc.* (Canada) | | | 1,419,221 | |
| | | | | | | | |
| | | | | | | 2,665,150 | |
| | | | | | | | |
| | | | Systems Software 3.4% | | | | |
| | 63,372 | | | FleetMatics Group plc* | | | 2,119,793 | |
| | 68,000 | | | Infoblox, Inc.* | | | 1,364,080 | |
| | 6,126 | | | NetSuite, Inc.* | | | 580,929 | |
| | | | | | | | |
| | | | | | | 4,064,802 | |
| | | | | | | | |
| | | | Technology Hardware, Storage & Peripherals 2.3% | | | | |
| | 110,770 | | | Fusion-io, Inc.* | | | 1,165,301 | |
| | 157,909 | | | Intevac, Inc.* | | | 1,531,717 | |
| | | | | | | | |
| | | | | | | 2,697,018 | |
| | | | | | | | |
| | | | Trucking 1.0% | | | | |
| | 52,374 | | | Knight Transportation, Inc. | | | 1,211,411 | |
| | | | | | | | |
| | |
| | | | Total Common Stocks
(cost $80,984,173) | | | 111,376,373 | |
| | | | | | | | |
| | |
| | | | PREFERRED STOCKS 1.8% | | | | |
| | |
| | | | Biotechnology 0.2% | | | | |
| | 169,492 | | | Nanosys, Inc., Series D Pfd.* *** † | | | 158,119 | |
| | 40,380 | | | Nanosys, Inc., Series E Pfd.* *** † | | | 48,226 | |
| | | | | | | | |
| | | | | | | 206,345 | |
| | | | | | | | |
| | | | Health Care Technology 0.6% | | | | |
| | 253,064 | | | Data Sciences International, Inc.,
Series B Pfd.* *** † | | | 727,559 | |
| | 243,902 | | | TherOx, Inc., Series I Pfd.* *** † | | | 2,439 | |
| | | | | | | | |
| | | | | | | 729,998 | |
| | | | | | | | |
| | | | Oil & Gas Equipment & Services 1.0% | | | | |
| | 435,920 | | | Drilling Info Holdings, Inc.,
Series B Pfd.* *** † | | | 1,150,001 | |
| | | | | | | | |
| | |
| | | | Total Preferred Stocks
(cost $3,171,238) | | | 2,086,344 | |
| | | | | | | | |
| | |
| | | | LIMITED PARTNERSHIP INTEREST 3.5% | | | | |
| | |
| | | | Asset Management & Custody Banks 3.5% | | | | |
| | | | Greenspring Global Partners II-B, L.P.*** † | | | 2,807,583 | |
| | | | Greenspring Global Partners III-B, L.P.*** † | | | 1,326,583 | |
| | | | | | | | |
| | | | | | | 4,134,166 | |
| | | | | | | | |
| | |
| | | | Total Limited Partnership Interest
(cost $4,303,216) | | | 4,134,166 | |
| | | | | | | | |
| | | | | | | | |
| Shares | | | | | Value | |
| | | | | | | |
| | | | WARRANTS 0.0% | | | | |
| | |
| | | | Health Care Equipment 0.0% | | | | |
| | 165,000 | | | Cardica, Inc., expiring 9/29/14* *** † | | $ | 1,650 | |
| | | | | | | | |
| | |
| | | | Total Warrants
(cost $20,625) | | | 1,650 | |
| | | | | | | | |
| | |
| | | | Total Investments
(cost $88,479,252) 99.4% | | | 117,598,533 | |
| | |
| | | | Other Assets less Liabilities 0.6% | | | 686,761 | |
| | | | | | | | |
| | |
| | | | NET ASSETS 100.0% | | $ | 118,285,294 | |
| | | | | | | | |
| |
| | | | *Non-income producing. ***Security was fair valued under procedures adopted by the Board of Trustees (see Note 14). †Security purchased in a private placement transaction or under Rule 144A of the Securities Act of 1933 (see Note 10). ††All or a portion of this security has been designated as collateral for purchase commitments (see Note 11). See Notes to Financial Statements. | |
At March 31, 2014, Wasatch Ultra Growth Fund’s investments, excluding short-term investments, were in the following countries:
| | | | |
| Country | | % | |
Canada | | | 2.6 | |
India | | | 11.6 | |
Ireland | | | 1.1 | |
United Kingdom | | | 0.9 | |
United States | | | 83.8 | |
| | | | |
TOTAL | | | 100.0 | % |
| | | | |
84
| | |
| WASATCH WORLD INNOVATORS FUND (WAGTX) — Schedule of Investments | | MARCH 31, 2014 (UNAUDITED) |
|
|
|
| | | | | | | | |
| Shares | | | | | Value | |
| | | | | | | |
| | | | COMMON STOCKS 90.3% | | | | |
| | |
| | | | Airlines 0.7% | | | | |
| | 265,000 | | | Controladora Vuela Cia de Aviacion S.A.B. de C.V. ADR* (Mexico) | | $ | 2,199,500 | |
| | | | | | | | |
| | | | Apparel, Accessories & Luxury Goods 1.2% | | | | |
| | 4,364,636 | | | American Apparel, Inc.* | | | 2,186,683 | |
| | 43,363 | | | Calida Holding AG* (Switzerland) | | | 1,532,998 | |
| | | | | | | | |
| | | | | | | 3,719,681 | |
| | | | | | | | |
| | | | Application Software 3.1% | | | | |
| | 35,919 | | | ESI Group* (France) | | | 1,286,019 | |
| | 54,701 | | | Esker S.A. (France) | | | 1,331,764 | |
| | 72,691 | | | Fidessa Group plc (United Kingdom) | | | 3,074,879 | |
| | 163,407 | | | Seamless Distribution AB* (Sweden) | | | 804,830 | |
| | 246,580 | | | TiVo, Inc.* | | | 3,262,253 | |
| | | | | | | | |
| | | | | | | 9,759,745 | |
| | | | | | | | |
| | | | Asset Management & Custody Banks 1.1% | | | | |
| | 33,300 | | | Ameriprise Financial, Inc. | | | 3,665,331 | |
| | | | | | | | |
| | | | Automotive Retail 0.9% | | | | |
| | 102,380 | | | Mekonomen AB (Sweden) | | | 2,821,605 | |
| | | | | | | | |
| | | | Biotechnology 3.2% | | | | |
| | 1,588,574 | | | Abcam plc (United Kingdom) | | | 10,303,479 | |
| | | | | | | | |
| | | | Cable & Satellite 3.8% | | | | |
| | 113,000 | | | Comcast Corp., Class A | | | 5,652,260 | |
| | 81,884 | | | DIRECTV* | | | 6,257,575 | |
| | | | | | | | |
| | | | | | | 11,909,835 | |
| | | | | | | | |
| | | | Communications Equipment 0.5% | | | | |
| | 176,281 | | | Infinera Corp.* | | | 1,600,631 | |
| | | | | | | | |
| | | | Computer & Electronics Retail 1.1% | | | | |
| | 66,139 | | | Groupe Fnac* (France) | | | 3,414,466 | |
| | | | | | | | |
| | | | Consumer Finance 3.9% | | | | |
| | 74,500 | | | Capital One Financial Corp. | | | 5,748,420 | |
| | 99,900 | | | Discover Financial Services | | | 5,813,181 | |
| | 1,794,805 | | | TrustBuddy International AB (Sweden) | | | 690,017 | |
| | | | | | | | |
| | | | | | | 12,251,618 | |
| | | | | | | | |
| | | | Data Processing & Outsourced Services 3.1% | | | | |
| | 69,750 | | | MasterCard, Inc., Class A | | | 5,210,325 | |
| | 21,195 | | | Visa, Inc., Class A | | | 4,575,153 | |
| | | | | | | | |
| | | | | | | 9,785,478 | |
| | | | | | | | |
| | | | Education Services 1.5% | | | | |
| | 220,000 | | | Kroton Educacional S.A. (Brazil) | | | 4,840,388 | |
| | | | | | | | |
| | | | Fertilizers & Agricultural Chemicals 1.1% | | | | |
| | 30,700 | | | Monsanto Co. | | | 3,492,739 | |
| | | | | | | | |
| | | | Food Distributors 0.7% | | | | |
| | 109,631 | | | Chefs’ Warehouse, Inc. (The)* | | | 2,346,103 | |
| | | | | | | | |
| | | | Health Care Equipment 5.2% | | | | |
| | 194,125 | | | DiaSorin S.p.A. (Italy) | | | 8,327,013 | |
| | 7,390 | | | Intuitive Surgical, Inc.* | | | 3,236,746 | |
| | 204,488 | | | Ion Beam Applications* (Belgium) | | | 2,531,496 | |
| | 69,200 | | | Mindray Medical International Ltd. ADR (China) | | | 2,239,312 | |
| | | | | | | | |
| | | | | | | 16,334,567 | |
| | | | | | | | |
| | |
| | | | Health Care Services 1.8% | | | | |
| | 208,511 | | | Bio-Reference Laboratories, Inc.* | | | 5,771,584 | |
| | | | | | | | |
| | | | | | | | |
| Shares | | | | | Value | |
| | | | | | | |
| | | | Health Care Supplies 4.0% | | | | |
| | 1,494,133 | | | Advanced Medical Solutions Group plc (United Kingdom) | | $ | 3,126,510 | |
| | 95,032 | | | Guerbet (France) | | | 4,174,556 | |
| | 26,828 | | | Sartorius Stedim Biotech (France) | | | 5,380,821 | |
| | | | | | | | |
| | | | | | | 12,681,887 | |
| | | | | | | | |
| | | | Health Care Technology 0.7% | | | | |
| | 86,813 | | | CompuGroup Medical AG (Germany) | | | 2,175,734 | |
| | | | | | | | |
| | | | Home Entertainment Software 2.1% | | | | |
| | 327,940 | | | Activision Blizzard, Inc. | | | 6,703,094 | |
| | | | | | | | |
| | | | Household Appliances 1.4% | | | | |
| | 104,974 | | | De’Longhi S.p.A. (Italy) | | | 2,363,465 | |
| | 51,036 | | | SodaStream International Ltd.* (Israel) | | | 2,250,688 | |
| | | | | | | | |
| | | | | | | 4,614,153 | |
| | | | | | | | |
| | | | Hypermarkets & Super Centers 0.5% | | | | |
| | 14,431 | | | PriceSmart, Inc. (Costa Rica) | | | 1,456,521 | |
| | | | | | | | |
| | | | Industrial Machinery 0.7% | | | | |
| | 44,110 | | | KUKA AG (Germany) | | | 2,157,544 | |
| | | | | | | | |
| | | | Internet Retail 4.1% | | | | |
| | 16,714 | | | Amazon.com, Inc.* | | | 5,624,596 | |
| | 43,284 | | | ASOS plc* (United Kingdom) | | | 3,741,993 | |
| | 3,000 | | | priceline.com, Inc.* | | | 3,575,670 | |
| | | | | | | | |
| | | | | | | 12,942,259 | |
| | | | | | | | |
| | | | Internet Software & Services 11.6% | | | | |
| | 310,067 | | | eBay, Inc.* | | | 17,128,101 | |
| | 8,157 | | | Google, Inc., Class A* | | | 9,091,058 | |
| | 88,000 | | | IAC/InterActiveCorp | | | 6,282,320 | |
| | 322,781 | | | NetGem S.A. (France) | | | 1,551,255 | |
| | 6,528 | | | Xtera Communications, Inc.* *** † | | | 65 | |
| | 31,422 | | | Zillow, Inc., Class A* | | | 2,768,278 | |
| | | | | | | | |
| | | | | | | 36,821,077 | |
| | | | | | | | |
| | | | IT Consulting & Other Services 1.2% | | | | |
| | 78,200 | | | Cognizant Technology Solutions Corp., Class A* | | | 3,957,702 | |
| | | | | | | | |
| | | | Leisure Products 0.6% | | | | |
| | 66,750 | | | Beneteau S.A.* (France) | | | 1,076,361 | |
| | 13,677 | | | Fenix Outdoor AB (Sweden) | | | 720,092 | |
| | | | | | | | |
| | | | | | | 1,796,453 | |
| | | | | | | | |
| | | | Movies & Entertainment 1.5% | | | | |
| | 56,900 | | | CTS Eventim AG (Germany) | | | 3,792,341 | |
| | 117,500 | | | SFX Entertainment, Inc.* | | | 828,375 | |
| | | | | | | | |
| | | | | | | 4,620,716 | |
| | | | | | | | |
| | | | Oil & Gas Refining & Marketing 1.4% | | | | |
| | 98,900 | | | World Fuel Services Corp. | | | 4,361,490 | |
| | | | | | | | |
| | | | Packaged Foods & Meats 2.3% | | | | |
| | 103,230 | | | Annie’s, Inc.* | | | 4,148,814 | |
| | 889,692 | | | Cloetta AB, Class B* (Sweden) | | | 3,241,862 | |
| | | | | | | | |
| | | | | | | 7,390,676 | |
| | | | | | | | |
| | | | Personal Products 3.7% | | | | |
| | 149,801 | | | Herbalife Ltd. | | | 8,579,103 | |
| | 31,220 | | | Interparfums S.A. (France) | | | 1,467,730 | |
| | 106,900 | | | Natura Cosmeticos S.A. (Brazil) | | | 1,796,750 | |
| | | | | | | | |
| | | | | | | 11,843,583 | |
| | | | | | | | |
| | | | Pharmaceuticals 3.6% | | | | |
| | 115,000 | | | Novo Nordisk A/S, Class B (Denmark) | | | 5,234,841 | |
| | 10,000 | | | Roche Holding AG (Switzerland) | | | 2,997,907 | |
| | 23,100 | | | Valeant Pharmaceuticals International, Inc.* (Canada) | | | 3,045,273 | |
| | | | | | | | |
| | | | | | | 11,278,021 | |
| | | | | | | | |
85
| | |
| WASATCH WORLD INNOVATORS FUND (WAGTX) — Schedule of Investments (continued) | | (UNAUDITED) |
|
|
|
| | | | | | | | |
Shares | | | | | Value | |
| | | | | | | |
| | | | Publishing 1.7% | | | | |
| | 309,546 | | | New York Times Co. (The) | | $ | 5,299,428 | |
| | | | | | | | |
| | | | Real Estate Services 2.8% | | | | |
| | 72,338 | | | Altisource Portfolio Solutions S.A.* | | | 8,800,641 | |
| | | | | | | | |
| | | | Research & Consulting Services 1.0% | | | | |
| | 1,246 | | | SGS S.A. (Switzerland) | | | 3,071,479 | |
| | | | | | | | |
| | | | Semiconductors 2.3% | | | | |
| | 2,500 | | | Samsung Electronics Co. Ltd. (Korea) | | | 3,154,211 | |
| | 202,500 | | | Taiwan Semiconductor Manufacturing Co. Ltd. ADR (Taiwan) | | | 4,054,050 | |
| | | | | | | | |
| | | | | | | 7,208,261 | |
| | | | | | | | |
| | | | Specialized Finance 1.9% | | | | |
| | 14,958 | | | IntercontinentalExchange Group, Inc. | | | 2,959,141 | |
| | 49,838 | | | MarketAxess Holdings, Inc. | | | 2,951,407 | |
| | | | | | | | |
| | | | | | | 5,910,548 | |
| | | | | | | | |
| | | | Specialty Stores 2.1% | | | | |
| | 95,500 | | | PetSmart, Inc. | | | 6,578,995 | |
| | | | | | | | |
| | | | Systems Software 1.5% | | | | |
| | 51,300 | | | Check Point Software Technologies Ltd.* (Israel) | | | 3,469,419 | |
| | 40,311 | | | Init Innovation In Traffic Systems AG (Germany) | | | 1,300,050 | |
| | | | | | | | |
| | | | | | | 4,769,469 | |
| | | | | | | | |
| | | | Thrifts & Mortgage Finance 3.2% | | | | |
| | 261,738 | | | Ocwen Financial Corp.* | | | 10,254,895 | |
| | | | | | | | |
| | | | Wireless Telecommunication Services 1.5% | | | | |
| | 7,731 | | | Millicom International Cellular S.A. (Sweden) | | | 787,215 | |
| | 40,417 | | | MTN Group Ltd. (South Africa) | | | 828,362 | |
| | 857,432 | | | Vodafone Group plc (United Kingdom) | | | 3,149,496 | |
| | | | | | | | |
| | | | | | | 4,765,073 | |
| | | | | | | | |
| | |
| | | | Total Common Stocks
(cost $236,010,164) | | | 285,676,449 | |
| | | | | | | | |
| | |
| | | | PREFERRED STOCKS 1.7% | | | | |
| | |
| | | | Health Care Equipment 1.7% | | | | |
| | 40,403 | | | Sartorius AG Pfd. (Germany) | | | 5,518,073 | |
| | | | | | | | |
| | |
| | | | Total Preferred Stocks
(cost $2,727,373) | | | 5,518,073 | |
| | | | | | | | |
| | |
| | | | LIMITED PARTNERSHIP INTEREST 0.1% | | | | |
| | |
| | | | Asset Management & Custody Banks 0.1% | | | | |
| | | | Greenspring Global Partners II-B, L.P.*** † | | | 311,953 | |
| | | | | | | | |
| | |
| | | | Total Limited Partnership Interest (cost $327,391) | | | 311,953 | |
| | | | | | | | |
| | |
| | | | WARRANTS 0.0% | | | | |
| | |
| | | | Health Care Equipment 0.0% | | | | |
| | 71,500 | | | Cardica, Inc., expiring 9/29/14* *** † | | | 715 | |
| | | | | | | | |
| | |
| | | | Total Warrants
(cost $8,937) | | | 715 | |
| | | | | | | | |
| | | | | | | | |
Principal
Amount | | | | | Value | |
| | | | | | | |
| | | | SHORT-TERM INVESTMENTS 9.8% | | | | |
| | |
| | | | Repurchase Agreement 9.8% | | | | |
| | $30,982,646 | | | Repurchase Agreement dated 3/31/14, 0.00% due 4/1/14 with State Street Bank and Trust Co. collateralized by $28,995,000 of United States Treasury Notes 3.625% due 2/15/21; value: $31,604,550; repurchase proceeds: $30,982,646†† (cost $30,982,646) | | $ | 30,982,646 | |
| | | | | | | | |
| | |
| | | | Total Short-Term Investments
(cost $30,982,646) | | | 30,982,646 | |
| | |
| | | | Total Investments
(cost $270,056,511) 101.9% | | | 322,489,836 | |
| | |
| | | | Liabilities less Other Assets (1.9%) | | | (6,088,358 | ) |
| | | | | | | | |
| | |
| | | | NET ASSETS 100.0% | | $ | 316,401,478 | |
| | | | | | | | |
| |
| | | | *Non-income producing. ***Security was fair valued under procedures adopted by the Board of Trustees (see Note 14). †Security purchased in a private placement transaction or under Rule 144A of the Securities Act of 1933 (see Note 10). ††All or a portion of this security has been designated as collateral for purchase commitments (see Note 11). ADR American Depositary Receipt. See Notes to Financial Statements. | |
At March 31, 2014, Wasatch World Innovators Fund’s investments, excluding short-term investments, were in the following countries:
| | | | |
| Country | | % | |
Belgium | | | 0.9 | |
Brazil | | | 2.3 | |
Canada | | | 1.0 | |
China | | | 0.8 | |
Costa Rica | | | 0.5 | |
Denmark | | | 1.8 | |
France | | | 6.7 | |
Germany | | | 5.1 | |
Israel | | | 2.0 | |
Italy | | | 3.7 | |
Korea | | | 1.1 | |
Mexico | | | 0.7 | |
South Africa | | | 0.3 | |
Sweden | | | 3.1 | |
Switzerland | | | 2.6 | |
Taiwan | | | 1.4 | |
United Kingdom | | | 8.0 | |
United States | | | 58.0 | |
| | | | |
TOTAL | | | 100.0 | % |
| | | | |
86
| | |
| WASATCH-1ST SOURCE INCOME FUND (FMEQX) — Schedule of Investments | | MARCH 31, 2014 (UNAUDITED) |
|
|
|
| | | | | | | | |
Principal
Amount | | | | | Value | |
| | | | | | | |
| | | | ASSET BACKED SECURITIES 4.9% | | | | |
| | |
| | $1,000,000 | | | Cabela’s Master Credit Card Trust,
2.29%, 9/17/18, Series 2010-2A, Class A1† | | $ | 1,023,883 | |
| | 1,500,000 | | | Citibank Credit Card Issuance Trust,
5.65%, 9/20/19, Series 2007-A8, Class A8 | | | 1,709,271 | |
| | 1,250,000 | | | GE Capital Credit Card Master Note Trust, 2.22%, 1/15/22, Series 2012-2, Class A | | | 1,241,109 | |
| | 585,000 | | | World Financial Network Credit Card Master Trust, 1.76%, 5/17/21,
Series 2012-B, Class A | | | 583,958 | |
| | 1,400,000 | | | World Financial Network Credit Card Master Trust, 3.14%, 1/17/23,
Series 2012-A, Class A | | | 1,443,891 | |
| | | | | | | | |
| | |
| | | | Total Asset Backed Securities
(cost $6,084,534) | | | 6,002,112 | |
| | | | | | | | |
| | |
| | | | COLLATERALIZED MORTGAGE OBLIGATIONS 16.5% | | | | |
| | |
| | 103,021 | | | Banc of America Merrill Lynch Commercial Mortgage, Inc.,
5.171%, 11/10/42, Series 2005-1,
Class A4††† | | | 104,135 | |
| | 22,987 | | | Banc of America Mortgage Securities, Inc., 2.689%, 2/25/33, Series 2003-A,
Class 3A1††† | | | 22,690 | |
| | 42,863 | | | Countrywide Home Loan Mortgage Pass Through Trust, 4.50%, 8/25/19,
Series 2004-J7, Class 2A1 | | | 43,098 | |
| | 467,880 | | | Federal Home Loan Mortgage Corp., 1.50%, 9/15/22, Series 3760, Class BA | | | 464,920 | |
| | 995,342 | | | Federal Home Loan Mortgage Corp., 1.50%, 7/15/23, Series 4221, Class HJ | | | 995,594 | |
| | 79,285 | | | Federal Home Loan Mortgage Corp., 1.50%, 4/15/24, Series 3780, Class TA | | | 79,109 | |
| | 51,264 | | | Federal Home Loan Mortgage Corp., 2.165%, 11/1/35, Series 1M0010††† | | | 54,454 | |
| | 79,621 | | | Federal Home Loan Mortgage Corp., 2.381%, 5/1/31, Series 847292††† | | | 82,715 | |
| | 74,114 | | | Federal Home Loan Mortgage Corp., 2.423%, 12/1/32, Series 847527††† | | | 78,588 | |
| | 21,081 | | | Federal Home Loan Mortgage Corp., 2.514%, 8/1/33, Series 847281††† | | | 22,412 | |
| | 292,597 | | | Federal Home Loan Mortgage Corp., 3.251%, 1/1/25, Series 775629††† | | | 295,511 | |
| | 190,262 | | | Federal Home Loan Mortgage Corp., 3.364%, 5/1/25, Series 775617††† | | | 201,423 | |
| | 135,840 | | | Federal Home Loan Mortgage Corp., 5.50%, 5/15/15, Series 2808, Class VA | | | 138,538 | |
| | 56,041 | | | Federal Home Loan Mortgage Corp., 5.50%, 10/1/25, Series C90925 | | | 62,179 | |
| | 223,062 | | | Federal Home Loan Mortgage Corp., 5.50%, 8/1/29, Series C46102 | | | 246,436 | |
| | 302,817 | | | Federal National Mortgage Assoc.,
1.914%, 12/1/35, Series 848390††† | | | 318,805 | |
| | 378,433 | | | Federal National Mortgage Assoc.,
2.055%, 1/1/35, Series 825245††† | | | 402,713 | |
| | 99,167 | | | Federal National Mortgage Assoc.,
2.16%, 11/1/34, Series 782320††† | | | 105,103 | |
| | 121,292 | | | Federal National Mortgage Assoc.,
2.701%, 2/1/21, Series 313380††† | | | 125,827 | |
| | 99,517 | | | Federal National Mortgage Assoc.,
2.758%, 1/1/18, Series 57735††† | | | 102,896 | |
| | 1,287,437 | | | Federal National Mortgage Assoc.,
3.00%, 1/1/28, Series AB7546 | | | 1,324,024 | |
| | 172,268 | | | Federal National Mortgage Assoc.,
3.50%, 6/25/23, Series 2003-46, Class LD | | | 180,749 | |
| | | | | | | | |
Principal
Amount | | | | | Value | |
| | | | | | | |
| | $ 1,829,878 | | | Federal National Mortgage Assoc.,
3.50%, 6/1/32, Series AL2525 | | $ | 1,885,777 | |
| | 1,274,863 | | | Federal National Mortgage Assoc.,
3.50%, 5/1/33, Series AB9412 | | | 1,311,942 | |
| | 163,334 | | | Federal National Mortgage Assoc.,
3.875%, 1/25/39, Series 2009-2, Class WJ | | | 172,036 | |
| | 67,741 | | | Federal National Mortgage Assoc.,
4.00%, 10/25/32, Series 2003-28, Class GA | | | 69,329 | |
| | 94,678 | | | Federal National Mortgage Assoc.,
4.062%, 7/1/19, Series 070377††† | | | 97,036 | |
| | 244,868 | | | Federal National Mortgage Assoc.,
4.50%, 6/25/29, Series 2005-121, Class V | | | 249,914 | |
| | 250,000 | | | Federal National Mortgage Assoc.,
5.50%, 5/25/23, Series 2003-42, Class EK | | | 275,685 | |
| | 237,360 | | | Government National Mortgage Assoc., 1.625%, 1/20/30, Series 80364††† | | | 246,748 | |
| | 606,422 | | | Government National Mortgage Assoc., 1.625%, 6/20/30, Series 80416††† | | | 630,799 | |
| | 475,331 | | | Government National Mortgage Assoc., 1.625%, 9/20/34, Series 81054††† | | | 493,940 | |
| | 425,981 | | | Government National Mortgage Assoc., 2.125%, 7/20/34, Series 80987††† | | | 445,542 | |
| | 540,912 | | | Government National Mortgage Assoc., 3.00%, 8/20/38, Series 2010-47, Class CG | | | 556,898 | |
| | 527,474 | | | Government National Mortgage Assoc., 3.00%, 12/20/38, Series 2010-89, Class PA | | | 541,727 | |
| | 923,836 | | | Government National Mortgage Assoc., 3.00%, 5/20/39, Series 2010-68, Class YE | | | 950,176 | |
| | 669,562 | | | Government National Mortgage Assoc., 3.50%, 1/20/37, Series 2009-31, Class PD | | | 685,031 | |
| | 1,423,443 | | | Government National Mortgage Assoc., 3.50%, 6/20/39, Series 2010-129, Class NU | | | 1,477,677 | |
| | 221,684 | | | Government National Mortgage Assoc., 4.00%, 6/20/38, Series 2009-69, Class WC | | | 228,468 | |
| | 682,020 | | | Government National Mortgage Assoc., 4.00%, 9/20/38, Series 2009-108, Class WG | | | 717,280 | |
| | 552,299 | | | Government National Mortgage Assoc., 4.00%, 3/20/39, Series 2009-31, Class TA | | | 581,156 | |
| | 560,612 | | | Government National Mortgage Assoc., 4.00%, 4/16/39, Series 2009-110, Class AB | | | 589,760 | |
| | 502,844 | | | Government National Mortgage Assoc., 4.00%, 8/20/39, Series 2009-69, Class PV | | | 528,502 | |
| | 267,379 | | | Government National Mortgage Assoc., 4.50%, 6/20/34, Series 2009-101, Class G | | | 276,075 | |
| | 96,342 | | | Government National Mortgage Assoc., 4.50%, 8/20/34, Series 2009-36, Class G | | | 97,901 | |
| | 211,357 | | | Government National Mortgage Assoc., 4.50%, 8/16/35, Series 2009-62, Class DT | | | 216,287 | |
| | 287,839 | | | Government National Mortgage Assoc., 4.50%, 2/20/38, Series 2009-55, Class NP | | | 307,714 | |
| | 455,055 | | | Government National Mortgage Assoc., 4.50%, 3/20/39, Series 2009-14, Class AG | | | 488,633 | |
| | 44,257 | | | Government National Mortgage Assoc., 5.00%, 9/16/31, Series 2009-38, Class A | | | 44,624 | |
| | 500,000 | | | Government National Mortgage Assoc., 5.00%, 7/20/34, Series 2004-105, Class MC | | | 529,681 | |
| | 65,399 | | | Government National Mortgage Assoc., 5.00%, 8/20/39, Series 004513 | | | 69,934 | |
| | | | | | | | |
| | |
| | | | Total Collateralized Mortgage Obligations
(cost $20,080,003) | | | 20,218,191 | |
| | | | | | | | |
| | |
| | | | CORPORATE BONDS 40.2% | | | | |
| | |
| | | | Aerospace & Defense 0.5% | | | | |
| | 600,000 | | | Lockheed Martin Corp., 3.35%, 9/15/21 | | | 611,732 | |
| | | | | | | | |
| | | | Air Freight & Logistics 0.6% | | | | |
| | 620,000 | | | United Parcel Service, Inc., 5.50%, 1/15/18 | | | 705,921 | |
| | | | | | | | |
87
| | |
| WASATCH-1ST SOURCE INCOME FUND (FMEQX) — Schedule of Investments (continued) | | |
|
|
|
| | | | | | | | |
Principal
Amount | | | | | Value | |
| | | | | | | |
| | | | Automotive Retail 0.7% | | | | |
| | $ 775,000 | | | AutoZone, Inc., 5.50%, 11/15/15 | | $ | 832,992 | |
| | | | | | | | |
| | | | Beverages — Non-alcoholic 1.1% | | | | |
| | 500,000 | | | PepsiAmericas, Inc., 5.00%, 5/15/17 | | | 555,851 | |
| | 750,000 | | | PepsiCo, Inc., 5.00%, 6/1/18 | | | 840,295 | |
| | | | | | | | |
| | | | | | | 1,396,146 | |
| | | | | | | | |
| | | | Computer Hardware 0.9% | | | | |
| | 1,000,000 | | | Hewlett-Packard Co., 2.60%, 9/15/17 | | | 1,030,407 | |
| | | | | | | | |
| | | | Construction Machinery & Heavy Trucks 1.3% | | | | |
| | 500,000 | | | Caterpillar Financial Services Corp.,
5.85%, 9/1/17 MTN | | | 567,784 | |
| | 1,000,000 | | | John Deere Capital Corp., 2.25%, 4/17/19 | | | 1,000,872 | |
| | | | | | | | |
| | | | | | | 1,568,656 | |
| | | | | | | | |
| | | | Cosmetics & Toiletries 0.4% | | | | |
| | 403,131 | | | Procter & Gamble — ESOP, 9.36%, 1/1/21, Series A | | | 503,722 | |
| | | | | | | | |
| | | | Diversified Banks 7.6% | | | | |
| | 750,000 | | | Bank of America Corp., 2.60%, 1/15/19 | | | 752,959 | |
| | 1,000,000 | | | Bank of America Corp., 3.75%, 7/12/16, Series 1 | | | 1,057,507 | |
| | 750,000 | | | Bank of America Corp., 7.375%, 5/15/14 MTN | | | 756,036 | |
| | 1,250,000 | | | Bank of Montreal, 1.45%, 4/9/18 MTN (Canada) | | | 1,232,090 | |
| | 1,250,000 | | | Goldman Sachs Group, Inc. (The),
3.625%, 2/7/16 | | | 1,309,100 | |
| | 500,000 | | | SouthTrust Corp., 5.80%, 6/15/14 | | | 505,517 | |
| | 1,000,000 | | | US Bancorp, 2.20%, 11/15/16 MTN | | | 1,032,196 | |
| | 1,125,000 | | | US Bancorp, 3.00%, 3/15/22 MTN | | | 1,115,205 | |
| | 750,000 | | | Wachovia Corp., 5.25%, 8/1/14 | | | 761,904 | |
| | 700,000 | | | Wachovia Corp., 5.75%, 2/1/18 MTN | | | 801,490 | |
| | | | | | | | |
| | | | | | | 9,324,004 | |
| | | | | | | | |
| | | | Diversified Financial Services 3.1% | | | | |
| | 2,350,000 | | | General Electric Capital Corp., 5.40%, 2/15/17 MTN | | | 2,623,119 | |
| | 1,000,000 | | | General Electric Capital Corp., 5.625%, 5/1/18 MTN | | | 1,142,881 | |
| | | | | | | | |
| | | | | | | 3,766,000 | |
| | | | | | | | |
| | | | Enterprise Software & Services 0.9% | | | | |
| | 1,000,000 | | | Oracle Corp., 5.75%, 4/15/18 | | | 1,151,252 | |
| | | | | | | | |
| | | | Finance — Auto Loans 0.6% | | | | |
| | 750,000 | | | PACCAR Financial Corp.,
1.60%, 3/15/17 MTN | | | 755,862 | |
| | | | | | | | |
| | | | Finance — Credit Card 0.9% | | | | |
| | 975,000 | | | American Express Co., 6.15%, 8/28/17 | | | 1,123,825 | |
| | | | | | | | |
| | | | Finance — Other Services 0.4% | | | | |
| | 500,000 | | | Sun Canada Financial Co., 7.25%, 12/15/15† | | | 535,880 | |
| | | | | | | | |
| | | | Footwear 0.5% | | | | |
| | 600,000 | | | Nike, Inc., 5.15%, 10/15/15 MTN | | | 636,087 | |
| | | | | | | | |
| | | | Health Care Equipment 0.2% | | | | |
| | 250,000 | | | Baxter International, Inc., 4.625%, 3/15/15 | | | 259,883 | |
| | | | | | | | |
| | | | Industrial Gases 0.5% | | | | |
| | 600,000 | | | Praxair, Inc., 4.625%, 3/30/15 | | | 624,269 | |
| | | | | | | | |
| | | | Instruments — Scientific 0.6% | | | | |
| | 700,000 | | | Thermo Fisher Scientific, Inc.,
4.70%, 5/1/20 | | | 759,110 | |
| | | | | | | | |
| | | | Integrated Oil & Gas 0.6% | | | | |
| | 750,000 | | | BP Capital Markets plc, 1.375%, 5/10/18 (United Kingdom) | | | 734,191 | |
| | | | | | | | |
| | | | | | | | |
Principal
Amount | | | | | Value | |
| | | | | | | |
| | | | Integrated Telecommunication Services 0.9% | | | | |
| | $ 108,239 | | | Ameritech Capital Funding, 9.10%, 6/1/16 | | $ | 120,071 | |
| | 870,000 | | | AT&T, Inc., 5.50%, 2/1/18 | | | 981,591 | |
| | | | | | | | |
| | | | | | | 1,101,662 | |
| | | | | | | | |
| | | | Investment Banking & Brokerage 0.7% | | | | |
| | 700,000 | | | Morgan Stanley, 5.50%, 7/24/20 MTN | | | 789,933 | |
| | | | | | | | |
| | | | Life & Health Insurance 1.2% | | | | |
| | 850,000 | | | Prudential Financial, Inc., 6.20%, 1/15/15 MTN | | | 887,207 | |
| | 480,000 | | | Prudential Holdings, LLC, 7.245%, 12/18/23, Series FSA† | | | 588,478 | |
| | | | | | | | |
| | | | | | | 1,475,685 | |
| | | | | | | | |
| | | | Medical Instruments 1.0% | | | | |
| | 1,100,000 | | | Medtronic, Inc., 4.45%, 3/15/20 | | | 1,207,584 | |
| | | | | | | | |
| | | | Medical — Drugs 0.6% | | | | |
| | 575,000 | | | Pharmacia Corp., 6.75%, 12/15/27 | | | 719,359 | |
| | | | | | | | |
| | | | Medical — Health Maintenance Organizations 0.9% | | | | |
| | 1,000,000 | | | WellPoint, Inc., 4.35%, 8/15/20 | | | 1,062,681 | |
| | | | | | | | |
| | | | Movies & Entertainment 0.6% | | | | |
| | 300,000 | | | Walt Disney Co. (The), 2.75%, 8/16/21 | | | 298,321 | |
| | 350,000 | | | Walt Disney Co. (The), 6.00%, 7/17/17, Series C MTN | | | 402,433 | |
| | | | | | | | |
| | | | | | | 700,754 | |
| | | | | | | | |
| | | | Multimedia 0.7% | | | | |
| | 800,000 | | | NBCUniversal Media, LLC, 5.15%, 4/30/20 | | | 903,789 | |
| | | | | | | | |
| | | | Oil Companies — Integrated 0.7% | | | | |
| | 750,000 | | | ConocoPhillips, 5.75%, 2/1/19 | | | 875,728 | |
| | | | | | | | |
| | | | Other Diversified Financial Services 1.2% | | | | |
| | 1,350,000 | | | JPMorgan Chase & Co., 4.35%, 8/15/21 | | | 1,447,060 | |
| | | | | | | | |
| | | | Pharmaceuticals 3.1% | | | | |
| | 745,000 | | | AstraZeneca plc, 5.90%, 9/15/17
(United Kingdom) | | | 856,466 | |
| | 795,000 | | | Cardinal Health, Inc., 6.00%, 6/15/17 | | | 889,685 | |
| | 1,000,000 | | | Johnson & Johnson, 5.55%, 8/15/17 | | | 1,140,999 | |
| | 725,000 | | | Pharmacia Corp., 6.50%, 12/1/18 | | | 866,216 | |
| | | | | | | | |
| | | | | | | 3,753,366 | |
| | | | | | | | |
| | | | Railroads 0.9% | | | | |
| | 1,000,000 | | | Union Pacific Corp., 5.70%, 8/15/18 | | | 1,144,865 | |
| | | | | | | | |
| | | | Regional Banks 3.5% | | | | |
| | 1,500,000 | | | BB&T Corp., 2.15%, 3/22/17 MTN | | | 1,534,767 | |
| | 1,200,000 | | | Fifth Third Bancorp, 5.45%, 1/15/17 | | | 1,324,940 | |
| | 600,000 | | | SunTrust Bank, 1.234%, 6/30/14††† | | | 593,821 | |
| | 750,000 | | | SunTrust Banks, Inc., 3.50%, 1/20/17 | | | 791,799 | |
| | | | | | | | |
| | | | | | | 4,245,327 | |
| | | | | | | | |
| | | | Semiconductor Equipment 0.2% | | | | |
| | 250,000 | | | Applied Materials, Inc., 2.65%, 6/15/16 | | | 259,229 | |
| | | | | | | | |
| | | | Special Purpose Entity 0.5% | | | | |
| | 525,000 | | | Principal Life Global Funding I,
5.05%, 3/15/15† | | | 546,942 | |
| | | | | | | | |
| | | | Specialty Chemicals 1.2% | | | | |
| | 1,150,000 | | | Lubrizol Corp., 8.875%, 2/1/19 | | | 1,485,552 | |
| | | | | | | | |
| | | | Steel 0.9% | | | | |
| | 1,000,000 | | | Nucor Corp., 5.75%, 12/1/17 | | | 1,131,764 | |
| | | | | | | | |
| | |
| | | | Total Corporate Bonds
(cost $48,540,191) | | | 49,171,219 | |
| | | | | | | | |
88
| | |
| | MARCH 31, 2014 (UNAUDITED) |
|
|
|
| | | | | | | | |
Principal
Amount | | | | | Value | |
| | | | | | | |
| | | | MUNICIPAL BONDS 2.1% | | | | |
| | |
| | $ 650,000 | | | Arizona State Transportation Board Highway Revenue, 5.00%, 7/1/23 | | $ | 716,892 | |
| | 737,888 | | | Minnesota Housing Finance Agency, 2.70%, 9/1/41 | | | 706,203 | |
| | 500,000 | | | Richmond Joint Powers Financing Authority, 8.25%, 7/1/19, Class B | | | 570,465 | |
| | 500,000 | | | State of Louisiana, 5.00%, 7/15/26, Series C | | | 575,610 | |
| | | | | | | | |
| | |
| | | | Total Municipal Bonds
(cost $2,439,369) | | | 2,569,170 | |
| | | | | | | | |
| | |
| Shares | | | | | Value | |
| | | | | | | |
| | | | MUTUAL FUNDS 0.5% | | | | |
| | |
| | 35,000 | | | Eaton Vance Short Duration Diversified Income Fund | | $ | 531,650 | |
| | | | | | | | |
| | |
| | | | Total Mutual Funds
(cost $506,163) | | | 531,650 | |
| | | | | | | | |
| | |
| | | | EXCHANGE-TRADED FUNDS 1.7% | | | | |
| | |
| | | | Asset Management & Custody Banks 1.7% | | | | |
| | 3,000 | | | iShares iBoxx Investment Grade Corporate Bond Fund ETF | | | 350,910 | |
| | 23,000 | | | iShares S&P US Preferred Stock Index
Fund ETF | | | 897,690 | |
| | 40,000 | | | Market Vectors Preferred Securities
ex Financials ETF | | | 817,200 | |
| | | | | | | | |
| | | | | | | 2,065,800 | |
| | | | | | | | |
| | |
| | | | Total Exchange-Traded Funds
(cost $2,012,451) | | | 2,065,800 | |
| | | | | | | | |
| | |
Principal
Amount | | | | | Value | |
| | | | | | | |
| | | | U.S. GOVERNMENT AGENCY SECURITIES 21.8% | | | | |
| | |
| | $1,000,000 | | | Federal Farm Credit Bank, 2.65%, 5/11/15 | | $ | 1,027,234 | |
| | 1,000,000 | | | Federal Farm Credit Bank, 3.85%, 2/11/15 | | | 1,031,944 | |
| | 650,000 | | | Federal Farm Credit Bank, 4.875%, 4/1/14 | | | 650,000 | |
| | 900,000 | | | Federal Home Loan Bank, 1.00%, 8/24/22## | | | 891,520 | |
| | 1,500,000 | | | Federal Home Loan Bank, 1.00%, 12/28/22, Series 0006## | | | 1,471,956 | |
| | 1,000,000 | | | Federal Home Loan Bank, 1.04%, 5/29/18 | | | 982,725 | |
| | 1,000,000 | | | Federal Home Loan Bank, 1.25%, 10/25/22, Series 0001## | | | 941,435 | |
| | 2,000,000 | | | Federal Home Loan Bank, 1.50%, 11/8/22, Series 0000## | | | 1,901,142 | |
| | 700,000 | | | Federal Home Loan Bank, 3.625%, 3/10/17 | | | 753,383 | |
| | 1,000,000 | | | Federal Home Loan Mortgage Corp., 0.875%, 2/28/17 MTN | | | 995,614 | |
| | 2,000,000 | | | Federal Home Loan Mortgage Corp., 2.00%, 10/22/21 MTN | | | 1,899,924 | |
| | 1,000,000 | | | Federal Home Loan Mortgage Corp., 2.10%, 4/24/19 MTN | | | 998,773 | |
| | 2,000,000 | | | Federal Home Loan Mortgage Corp., 2.50%, 5/27/16 | | | 2,084,732 | |
| | 1,000,000 | | | Federal Home Loan Mortgage Corp., 3.00%, 7/28/14 | | | 1,009,189 | |
| | 700,000 | | | Federal Home Loan Mortgage Corp., 4.75%, 11/17/15 | | | 750,321 | |
| | | | | | | | |
Principal
Amount | | | | | Value | |
| | | | | | | |
| | $ 1,000,000 | | | Federal National Mortgage Assoc.,
1.00%, 12/28/18## | | $ | 979,784 | |
| | 1,050,000 | | | Federal National Mortgage Assoc.,
2.05%, 5/23/17 | | | 1,081,490 | |
| | 1,700,000 | | | Federal National Mortgage Assoc.,
2.625%, 11/20/14 | | | 1,726,853 | |
| | 1,800,000 | | | Federal National Mortgage Assoc.,
4.875%, 12/15/16 | | | 1,995,797 | |
| | 475,746 | | | New Valley Generation IV, 4.687%, 1/15/22 | | | 520,339 | |
| | 800,000 | | | Tennessee Valley Authority, 3.875%, 2/15/21 | | | 862,266 | |
| | 1,000,000 | | | Tennessee Valley Authority, 6.25%, 12/15/17, Series E | | | 1,173,516 | |
| | 1,000,000 | | | Tennessee Valley Authority Generic Strip, 0.00%, 11/1/18, Series C### | | | 897,549 | |
| | | | | | | | |
| | |
| | | | Total U.S. Government Agency Securities
(cost $26,626,829) | | | 26,627,486 | |
| | | | | | | | |
| | |
| | | | U.S. TREASURY INFLATION PROTECTED BONDS 0.6% | | | | |
| | |
| | 614,037 | | | U.S. Treasury Bond, 1.625%, 1/15/18# | | | 666,518 | |
| | | | | | | | |
| | |
| | | | Total U.S. Treasury Inflation Protected Bonds
(cost $604,835) | | | 666,518 | |
| | | | | | | | |
| | |
| | | | U.S. TREASURY NOTES 8.0% | | | | |
| | |
| | 4,625,000 | | | U.S. Treasury Note, 3.25%, 12/31/16 | | | 4,933,936 | |
| | 4,450,000 | | | U.S. Treasury Note, 3.625%, 8/15/19 | | | 4,858,497 | |
| | | | | | | | |
| | |
| | | | Total U.S. Treasury Notes
(cost $9,717,497) | | | 9,792,433 | |
| | | | | | | | |
| | |
| Shares | | | | | Value | |
| | | | | | | |
| | | | PREFERRED STOCKS 0.7% | | | | |
| | |
| | | | Investment Banking & Brokerage 0.2% | | | | |
| | 10,000 | | | Morgan Stanley Cap TR VI, 6.60%, Pfd. | | $ | 254,600 | |
| | | | | | | | |
| | | | Life & Health Insurance 0.2% | | | | |
| | 10,000 | | | MetLife, Inc., 6.50%, Series B Pfd.§§§ | | | 251,500 | |
| | | | | | | | |
| | | | Other Diversified Financial Services 0.3% | | | | |
| | 15,000 | | | JPMorgan Chase Capital XXIX, 6.70%, Pfd. | | | 384,600 | |
| | | | | | | | |
| | |
| | | | Total Preferred Stocks
(cost $876,467) | | | 890,700 | |
| | | | | | | | |
89
| | |
| WASATCH-1ST SOURCE INCOME FUND (FMEQX) — Schedule of Investments (continued) | | (UNAUDITED) |
|
|
|
| | | | | | | | |
Principal
Amount | | | | | Value | |
| | | | | | | |
| | | | SHORT-TERM INVESTMENTS 3.2% | | | | |
| | |
| | | | Repurchase Agreement 3.2% | | | | |
| | $3,974,123 | | | Repurchase Agreement dated 3/31/14, 0.00% due 4/1/14 with State Street Bank and Trust Co. collateralized by $4,135,000 of United States Treasury Notes 2.000% due 2/28/21; value: $4,054,099; repurchase proceeds: $3,974,123 (cost $3,974,123) | | $ | 3,974,123 | |
| | | | | | | | |
| | |
| | | | Total Short-Term Investments
(cost $3,974,123) | | | 3,974,123 | |
| | | | | | | | |
| | |
| | | | Total Investments
(cost $121,462,462) 100.2% | | | 122,509,402 | |
| | |
| | | | Liabilities less Other Assets (0.2%) | | | (224,077 | ) |
| | | | | | | | |
| | |
| | | | NET ASSETS 100.0% | | $ | 122,285,325 | |
| | | | | | | | |
| |
| | | | †Liquid security purchased in a private placement transaction or under Rule 144A of the Securities Act of 1933. †††Variable rate securities. §§§Perpetual maturity. Callable any time after first call date. Maturity date is next call date. #Treasury Inflation Protected Securities. A U.S. Treasury Note or Bond that offers protection from inflation by paying a fixed rate of interest on principal amount that is adjusted for inflation based on the Consumer Price Index. ##Step Bond. The rate shown is as of March 31, 2014 and will reset at a future date. ###Zero coupon bond. ETF Exchange-Traded Fund MTN Medium Term Note. See Notes to Financial Statements. | |
At March 31, 2014, Wasatch-1st Source Income Fund’s investments, excluding short-term investments, were in the following countries:
| | | | |
| Country | | % | |
Canada | | | 1.0 | |
United Kingdom | | | 1.4 | |
United States | | | 97.6 | |
| | | | |
TOTAL | | | 100.0 | % |
| | | | |
90
| | |
| WASATCH-HOISINGTON U.S. TREASURY FUND (WHOSX) — Schedule of Investments | | MARCH 31, 2014 (UNAUDITED) |
|
|
|
| | | | | | | | |
Principal
Amount | | | | | Value | |
| | | | | | | |
| | | | U.S. GOVERNMENT
OBLIGATIONS 99.0% | | | | |
| | |
| | $28,000,000 | | | U.S. Treasury Bond, 3.125%, 11/15/41 | | $ | 25,952,500 | |
| | 8,000,000 | | | U.S. Treasury Bond, 3.125%, 2/15/42 | | | 7,405,000 | |
| | 9,700,000 | | | U.S. Treasury Bond, 3.50%, 2/15/39 | | | 9,730,313 | |
| | 15,000,000 | | | U.S. Treasury Bond, 3.75%, 11/15/43 | | | 15,529,680 | |
| | 4,035,000 | | | U.S. Treasury Bond, 4.25%, 5/15/39 | | | 4,567,745 | |
| | 1,400,000 | | | U.S. Treasury Bond, 4.375%, 2/15/38 | | | 1,613,719 | |
| | 1,040,000 | | | U.S. Treasury Bond, 4.375%, 5/15/40 | | | 1,201,038 | |
| | 10,000,000 | | | U.S. Treasury Bond, 4.50%, 5/15/38 | | | 11,740,620 | |
| | 48,400,000 | | | U.S. Treasury Strip, principal only, 5/15/30 | | | 28,025,681 | |
| | 52,300,000 | | | U.S. Treasury Strip, principal only, 2/15/31 | | | 29,326,911 | |
| | 54,837,000 | | | U.S. Treasury Strip, principal only, 2/15/37 | | | 24,213,935 | |
| | 35,150,000 | | | U.S. Treasury Strip, principal only, 5/15/39 | | | 14,089,139 | |
| | 26,000,000 | | | U.S. Treasury Strip, principal only, 5/15/40 | | | 10,015,668 | |
| | 15,000,000 | | | U.S. Treasury Strip, principal only, 2/15/42 | | | 5,331,450 | |
| | 4,000,000 | | | U.S. Treasury Strip, principal only, 2/15/43 | | | 1,359,484 | |
| | | | | | | | |
| | |
| | | | Total U.S. Government Obligations
(cost $182,866,314) | | | 190,102,883 | |
| | | | | | | | |
| | | | | | | | |
Principal
Amount | | | | | Value | |
| | | | | | | |
| | | | SHORT-TERM INVESTMENTS 1.0% | | | | |
| | |
| | | | Repurchase Agreement 1.0% | | | | |
| | $ 1,946,875 | | | Repurchase Agreement dated 3/31/14, 0.00% due 4/1/14 with State Street Bank and Trust Co. collateralized by $2,005,000 of United States Treasury Notes 2.125% due 1/31/21; value: $1,989,963; repurchase proceeds: $1,946,875 (cost $1,946,875) | | $ | 1,946,875 | |
| | | | | | | | |
| | |
| | | | Total Short-Term Investments
(cost $1,946,875) | | | 1,946,875 | |
| | | | | | | | |
| | |
| | | | Total Investments
(cost $184,813,189) 100.0% | | | 192,049,758 | |
| | |
| | | | Other Assets less Liabilities <0.1% | | | 10,538 | |
| | | | | | | | |
| | |
| | | | NET ASSETS 100.0% | | $ | 192,060,296 | |
| | | | | | | | |
| | |
| | | | See Notes to Financial Statements. | | | | |
91
| | |
| WASATCH FUNDS — Statements of Assets and Liabilities | | |
|
|
|
| | | | | | | | | | | | |
| | | CORE
GROWTH
FUND | | | EMERGING
INDIA
FUND | | | EMERGING
MARKETS
SELECT FUND | |
| | | | | | | | | | | | |
Assets: | | | | | | | | | | | | |
Investments, at cost | | | | | | | | | | | | |
Unaffiliated issuers | | $ | 602,902,162 | | | $ | 15,489,026 | | | $ | 54,320,505 | |
Affiliated issuers1 | | | — | | | | — | | | | — | |
Repurchase agreements | | | 44,622,484 | | | | 794,089 | | | | 7,320,483 | |
| | | | | | | | | | | | |
| | $ | 647,524,646 | | | $ | 16,283,115 | | | $ | 61,640,988 | |
| | | | | | | | | | | | |
Investments, at market value | | | | | | | | | | | | |
Unaffiliated issuers | | $ | 948,434,037 | | | $ | 19,243,473 | | | $ | 57,174,325 | |
Affiliated issuers1 | | | — | | | | — | | | | — | |
Repurchase agreements | | | 44,622,484 | | | | 794,089 | | | | 7,320,483 | |
| | | | | | | | | | | | |
| | | 993,056,521 | | | | 20,037,562 | | | | 64,494,808 | |
Cash | | | — | | | | — | | | | — | |
Foreign currency on deposit (cost of $0, $155,426, $62,660, $161,564, $830,432, $128,211, $0 and $120, respectively) | | | — | | | | 161,193 | | | | 62,856 | |
Receivable for investment securities sold | | | 1,358,385 | | | | — | | | | — | |
Capital shares receivable | | | 932,620 | | | | 49,211 | | | | 8,593 | |
Interest and dividends receivable | | | 116,077 | | | | 2,638 | | | | 103,477 | |
Prepaid expenses and other assets | | | 45,092 | | | | 12,383 | | | | 21,299 | |
| | | | | | | | | | | | |
Total Assets | | | 995,508,695 | | | | 20,262,987 | | | | 64,691,033 | |
| | | | | | | | | | | | |
Liabilities: | | | | | | | | | | | | |
Payable for securities purchased | | | — | | | | — | | | | — | |
Capital shares payable | | | 1,381,623 | | | | — | | | | 56,813 | |
Payable to Advisor | | | 836,455 | | | | 15,207 | | | | 57,244 | |
Accrued fund administration fees | | | 22,633 | | | | 427 | | | | 1,435 | |
Accrued expenses and other liabilities | | | 252,897 | | | | 38,487 | | | | 38,340 | |
Foreign capital gains taxes payable | | | 695,106 | | | | 46,490 | | | | 11,665 | |
Line of credit payable | | | — | | | | — | | | | — | |
| | | | | | | | | | | | |
Total Liabilities | | | 3,188,714 | | | | 100,611 | | | | 165,497 | |
| | | | | | | | | | | | |
Net Assets | | $ | 992,319,981 | | | $ | 20,162,376 | | | $ | 64,525,536 | |
| | | | | | | | | | | | |
Net Assets Consist of: | | | | | | | | | | | | |
Capital stock | | $ | 181,309 | | | $ | 92,323 | | | $ | 65,325 | |
Paid-in-capital in excess of par | | | 644,140,061 | | | | 17,783,422 | | | | 65,671,482 | |
Undistributed net investment income (loss) | | | (6,409,372 | ) | | | (321,849 | ) | | | (284,993 | ) |
Undistributed net realized gain (loss) on investments and foreign currency translations | | | 9,569,894 | | | | (1,105,281 | ) | | | (3,769,074 | ) |
Net unrealized appreciation on investments and foreign currency translations | | | 344,838,089 | | | | 3,713,761 | | | | 2,842,796 | |
| | | | | | | | | | | | |
Net Assets | | $ | 992,319,981 | | | $ | 20,162,376 | | | $ | 64,525,536 | |
| | | | | | | | | | | | |
Net Assets | | | | | | | | | | | | |
Investor Class | | | 943,042,603 | | | | 20,162,376 | | | | 32,683,903 | |
Institutional Class | | | 49,277,378 | | | | — | | | | 31,841,633 | |
| | | |
Capital Stock Issued and Outstanding (Unlimited number of shares authorized,
$.01 par value) | | | | | | | | | | | | |
Investor Class | | | 17,232,120 | | | | 9,232,276 | | | | 3,317,973 | |
Institutional Class | | | 898,757 | | | | — | | | | 3,214,555 | |
| | | |
NET ASSET VALUE, REDEMPTION PRICE AND OFFERING
PRICE PER SHARE | | | | | | | | | | | | |
Investor Class | | $ | 54.73 | | | $ | 2.18 | | | $ | 9.85 | |
| | | | | | | | | | | | |
Institutional Class | | $ | 54.83 | | | $ | — | | | $ | 9.91 | |
| | | | | | | | | | | | |
| 1 | See Note 9 for information on affiliated issuers. |
See Notes to Financial Statements.
92
| | |
| | MARCH 31, 2014 (UNAUDITED) |
|
|
|
| | | | | | | | | | | | | | | | | | |
EMERGING
MARKETS
SMALL CAP
FUND | | | FRONTIER
EMERGING
SMALL COUNTRIES
FUND | | | GLOBAL
OPPORTUNITIES
FUND | | | HERITAGE
GROWTH
FUND | | | INTERNATIONAL
GROWTH
FUND | |
| | | | | | | | | | | | | | | | | | |
| | | | | | | | | | | | | | | | | | |
| | | | | | | | | | | | | | | | | | |
| $ | 1,340,836,096 | | | $ | 932,101,769 | | | $ | 152,334,818 | | | $ | 69,922,846 | | | $ | 1,272,145,944 | |
| | — | | | | — | | | | — | | | | — | | | | 23,844,596 | |
| | 62,262,728 | | | | 80,899,058 | | | | — | | | | 8,035,006 | | | | 92,554,493 | |
| | | | | | | | | | | | | | | | | | |
| $ | 1,403,098,824 | | | $ | 1,013,000,827 | | | $ | 152,334,818 | | | $ | 77,957,852 | | | $ | 1,388,545,033 | |
| | | | | | | | | | | | | | | | | | |
| | | | | | | | | | | | | | | | | | |
| $ | 1,488,523,030 | | | $ | 1,039,704,926 | | | $ | 215,551,468 | | | $ | 122,390,337 | | | $ | 1,547,599,620 | |
| | — | | | | — | | | | — | | | | — | | | | 16,833,657 | |
| | 62,262,728 | | | | 80,899,058 | | | | — | | | | 8,035,006 | | | | 92,554,493 | |
| | | | | | | | | | | | | | | | | | |
| | 1,550,785,758 | | | | 1,120,603,984 | | | | 215,551,468 | | | | 130,425,343 | | | | 1,656,987,770 | |
| | — | | | | 1,703,448 | | | | — | | | | — | | | | — | |
| 161,271 | | | | 835,921 | | | | 128,259 | | | | — | | | | 120 | |
| | 10,726,250 | | | | 330,421 | | | | — | | | | — | | | | 2,648,152 | |
| | 988,290 | | | | 2,508,820 | | | | 146,137 | | | | 7,816 | | | | 1,762,722 | |
| | 2,546,184 | | | | 5,797,941 | | | | 208,117 | | | | 29,573 | | | | 3,316,154 | |
| | 56,295 | | | | 51,817 | | | | 16,864 | | | | 7,855 | | | | 53,003 | |
| | | | | | | | | | | | | | | | | | |
| | 1,565,264,048 | | | | 1,131,832,352 | | | | 216,050,845 | | | | 130,470,587 | | | | 1,664,767,921 | |
| | | | | | | | | | | | | | | | | | |
| | | | | | | | | | | | | | | | | | |
| | 8,655,892 | | | | 5,484,142 | | | | — | | | | — | | | | 6,422,281 | |
| | 3,127,308 | | | | 281,381 | | | | 212,619 | | | | 41,019 | | | | 1,156,750 | |
| | 2,194,851 | | | | 1,599,002 | | | | 277,197 | | | | 78,551 | | | | 1,719,223 | |
| | 37,202 | | | | 24,289 | | | | 5,072 | | | | 3,018 | | | | 36,880 | |
| | 788,441 | | | | 492,385 | | | | 91,517 | | | | 56,913 | | | | 359,388 | |
| | — | | | | 3,119,088 | | | | 184,428 | | | | — | | | | — | |
| | — | | | | — | | | | 79,395 | | | | — | | | | — | |
| | | | | | | | | | | | | | | | | | |
| | 14,803,694 | | | | 11,000,287 | | | | 850,228 | | | | 179,501 | | | | 9,694,522 | |
| | | | | | | | | | | | | | | | | | |
| $ | 1,550,460,354 | | | $ | 1,120,832,065 | | | $ | 215,200,617 | | | $ | 130,291,086 | | | $ | 1,655,073,399 | |
| | | | | | | | | | | | | | | | | | |
| | | | | | | | | | | | | | | | | | |
| $ | 6,032,292 | | | $ | 3,533,711 | | | $ | 502,776 | | | $ | 80,168 | | | $ | 579,757 | |
| | 1,469,076,137 | | | | 1,014,547,027 | | | | 147,493,510 | | | | 77,343,723 | | | | 1,386,180,123 | |
| | (16,955,299 | ) | | | 3,762,645 | | | | (2,733,586 | ) | | | (272,758 | ) | | | (3,646,035 | ) |
| | (55,385,458 | ) | | | (5,485,460 | ) | | | 6,904,867 | | | | 672,462 | | | | 3,533,721 | |
| | 147,692,682 | | | | 104,474,142 | | | | 63,033,050 | | | | 52,467,491 | | | | 268,425,833 | |
| | | | | | | | | | | | | | | | | | |
| $ | 1,550,460,354 | | | $ | 1,120,832,065 | | | $ | 215,200,617 | | | $ | 130,291,086 | | | $ | 1,655,073,399 | |
| | | | | | | | | | | | | | | | | | |
| | | | | | | | | | | | | | | | | | |
| | 1,550,460,354 | | | | 1,120,832,065 | | | | 215,200,617 | | | | 130,291,086 | | | | 1,655,073,399 | |
| | — | | | | — | | | | — | | | | — | | | | — | |
| | | | |
| | | | | | | | | | | | | | | | | | |
| | 603,229,227 | | | | 353,371,146 | | | | 50,277,609 | | | | 8,016,843 | | | | 57,975,650 | |
| | — | | | | — | | | | — | | | | — | | | | — | |
| | | | |
| | | | | | | | | | | | | | | | | | |
| $ | 2.57 | | | $ | 3.17 | | | $ | 4.28 | | | $ | 16.25 | | | $ | 28.55 | |
| | | | | | | | | | | | | | | | | | |
| $ | — | | | $ | — | | | $ | — | | | $ | — | | | $ | — | |
| | | | | | | | | | | | | | | | | | |
93
| | |
| WASATCH FUNDS — Statements of Assets and Liabilities (continued) | | |
|
|
|
| | | | | | | | | | | | |
| | | INTERNATIONAL
OPPORTUNITIES
FUND | | | LARGE CAP
VALUE FUND | | | LONG/SHORT
FUND | |
| | | | | | | | | | | | |
Assets: | | | | | | | | | | | | |
Investments, at cost | | | | | | | | | | | | |
Unaffiliated issuers | | $ | 242,158,397 | | | $ | 498,562,600 | | | $ | 1,853,167,484 | |
Affiliated issuers1 | | | — | | | | — | | | | 68,217,034 | |
Repurchase agreements | | | 21,206,478 | | | | 676,944 | | | | 447,207,058 | |
| | | | | | | | | | | | |
| | $ | 263,364,875 | | | $ | 499,239,544 | | | $ | 2,368,591,576 | |
| | | | | | | | | | | | |
Investments, at market value | | | | | | | | | | | | |
Unaffiliated issuers | | $ | 310,471,371 | | | $ | 583,619,507 | | | $ | 2,205,045,043 | |
Affiliated issuers1 | | | — | | | | — | | | | 69,000,209 | |
Repurchase agreements | | | 21,206,478 | | | | 676,944 | | | | 447,207,058 | |
| | | | | | | | | | | | |
| | | 331,677,849 | | | | 584,296,451 | | | | 2,721,252,310 | |
Cash | | | — | | | | — | | | | — | |
Foreign currency on deposit (cost of $330,532, $0, $0, $0, $0, $5, $0 and $9,722, respectively) | | | 330,547 | | | | — | | | | — | |
Receivable for investment securities sold | | | 66,827 | | | | 2,880,921 | | | | 49,796,439 | |
Receivable from broker for securities sold short | | | — | | | | — | | | | 244,326,438 | |
Capital shares receivable | | | 326,662 | | | | 360,766 | | | | 4,642,280 | |
Interest and dividends receivable | | | 655,557 | | | | 753,366 | | | | 3,313,815 | |
Prepaid expenses and other assets | | | 20,970 | | | | 31,560 | | | | 74,150 | |
| | | | | | | | | | | | |
Total Assets | | | 333,078,412 | | | | 588,323,064 | | | | 3,023,405,432 | |
| | | | | | | | | | | | |
Liabilities: | | | | | | | | | | | | |
Call options written at value (premiums of $0, $0, $0, $0, $455,854, $0, $0 and $0, respectively) | | | — | | | | — | | | | — | |
Securities sold short, at value (proceeds of $0, $0, $261,574,051, $0, $0, $0, $0 and $0, respectively) | | | — | | | | — | | | | 277,889,247 | |
Payable for securities purchased | | | 309,506 | | | | — | | | | 912,196 | |
Capital shares payable | | | 115,177 | | | | 4,293,953 | | | | 2,392,801 | |
Dividends payable to shareholders | | | — | | | | 34,174 | | | | — | |
Payable to Advisor | | | 493,815 | | | | 437,986 | | | | 2,508,280 | |
Accrued fund administration fees | | | 7,500 | | | | 13,960 | | | | 63,574 | |
Accrued expenses and other liabilities | | | 170,555 | | | | 420,218 | | | | 389,304 | |
Foreign capital gains taxes payable | | | — | | | | — | | | | — | |
Dividends payable on securities sold short | | | — | | | | — | | | | 139,310 | |
| | | | | | | | | | | | |
Total Liabilities | | | 1,096,553 | | | | 5,200,291 | | | | 284,294,712 | |
| | | | | | | | | | | | |
Net Assets | | $ | 331,981,859 | | | $ | 583,122,773 | | | $ | 2,739,110,720 | |
| | | | | | | | | | | | |
Net Assets Consist of: | | | | | | | | | | | | |
Capital stock | | $ | 1,117,486 | | | $ | 470,427 | | | $ | 1,678,196 | |
Paid-in-capital in excess of par | | | 250,502,479 | | | | 401,529,590 | | | | 2,306,138,204 | |
Undistributed net investment income (loss) | | | (1,601,954 | ) | | | 29,696 | | | | 17,017,753 | |
Undistributed net realized gain (loss) on investments and foreign currency translations | | | 13,656,203 | | | | 96,035,216 | | | | 77,931,029 | |
Net unrealized appreciation on investments and foreign currency translations | | | 68,307,645 | | | | 85,057,844 | | | | 336,345,538 | |
| | | | | | | | | | | | |
Net Assets | | $ | 331,981,859 | | | $ | 583,122,773 | | | $ | 2,739,110,720 | |
| | | | | | | | | | | | |
Net Assets | | | | | | | | | | | | |
Investor Class | | | 331,981,859 | | | | 573,766,110 | | | | 1,793,797,445 | |
Institutional Class | | | — | | | | 9,356,663 | | | | 945,313,275 | |
| | | |
Capital Stock Issued and Outstanding (Unlimited number of shares authorized,
$.01 par value) | | | | | | | | | | | | |
Investor Class | | | 111,748,602 | | | | 46,287,480 | | | | 109,945,413 | |
Institutional Class | | | — | | | | 755,203 | | | | 57,874,216 | |
| | | |
NET ASSET VALUE, REDEMPTION PRICE AND OFFERING
PRICE PER SHARE | | | | | | | | | | | | |
Investor Class | | $ | 2.97 | | | $ | 12.40 | | | $ | 16.32 | |
| | | | | | | | | | | | |
Institutional Class | | $ | — | | | $ | 12.39 | | | $ | 16.33 | |
| | | | | | | | | | | | |
| 1See | Note 9 for information on affiliated issuers. |
See Notes to Financial Statements.
94
| | |
| | MARCH 31, 2014 (UNAUDITED) |
|
|
|
| | | | | | | | | | | | | | | | | | |
MICRO
CAP
FUND | | | MICRO CAP
VALUE FUND | | | SMALL CAP
GROWTH
FUND | | | SMALL CAP
VALUE
FUND | | | STRATEGIC
INCOME
FUND | |
| | | | | | | | | | | | | | | | | | |
| | | | | | | | | | | | | | | | | | |
| | | | | | | | | | | | | | | | | | |
| $ | 189,282,574 | | | $ | 128,384,697 | | | $ | 1,302,350,912 | | | $ | 151,231,506 | | | $ | 53,114,165 | |
| | 1,540,000 | | | | — | | | | 209,916,910 | | | | — | | | | — | |
| | 8,388,106 | | | | 17,805,103 | | | | 83,209,145 | | | | 15,729,661 | | | | 7,498,799 | |
| | | | | | | | | | | | | | | | | | |
| $ | 199,210,680 | | | $ | 146,189,800 | | | $ | 1,595,476,967 | | | $ | 166,961,167 | | | $ | 60,612,964 | |
| | | | | | | | | | | | | | | | | | |
| | | | | | | | | | | | | | | | | | |
| $ | 331,297,497 | | | $ | 174,337,954 | | | $ | 2,284,750,511 | | | $ | 217,747,583 | | | $ | 64,575,530 | |
| | 47,740 | | | | — | | | | 252,110,996 | | | | — | | | | — | |
| | 8,388,106 | | | | 17,805,103 | | | | 83,209,145 | | | | 15,729,661 | | | | 7,498,799 | |
| | | | | | | | | | | | | | | | | | |
| | 339,733,343 | | | | 192,143,057 | | | | 2,620,070,652 | | | | 233,477,244 | | | | 72,074,329 | |
| | — | | | | 66,330 | | | | 39,196 | | | | — | | | | — | |
| — | | | | — | | | | 5 | | | | — | | | | 9,772 | |
| | 902,463 | | | | 972,503 | | | | — | | | | 1,791,833 | | | | 314,603 | |
| | — | | | | — | | | | — | | | | — | | | | — | |
| | 20,250 | | | | 192,278 | | | | 1,242,722 | | | | 13,516 | | | | 26,803 | |
| | 51,140 | | | | 109,274 | | | | 300,547 | | | | 19,405 | | | | 332,506 | |
| | 13,031 | | | | 8,233 | | | | 60,362 | | | | 19,412 | | | | 16,504 | |
| | | | | | | | | | | | | | | | | | |
| | 340,720,227 | | | | 193,491,675 | | | | 2,621,713,484 | | | | 235,321,410 | | | | 72,774,517 | |
| | | | | | | | | | | | | | | | | | |
| | | | | | | | | | | | | | | | | | |
| — | | | | 378,150 | | | | — | | | | — | | | | — | |
| — | | | | — | | | | — | | | | — | | | | — | |
| | 694,828 | | | | 2,022,126 | | | | 2,515,302 | | | | — | | | | — | |
| | 384,328 | | | | 132,904 | | | | 1,727,122 | | | | 169,626 | | | | 211,925 | |
| | — | | | | — | | | | — | | | | — | | | | 9,084 | |
| | 519,239 | | | | 279,204 | | | | 2,256,206 | | | | 196,204 | | | | 42,785 | |
| | 8,111 | | | | 4,396 | | | | 61,610 | | | | 5,344 | | | | 1,667 | |
| | 86,903 | | | | 66,641 | | | | 809,596 | | | | 97,338 | | | | 24,767 | |
| | 49,238 | | | | — | | | | 798,665 | | | | 54,810 | | | | — | |
| | — | | | | — | | | | — | | | | — | | | | — | |
| | | | | | | | | | | | | | | | | | |
| | 1,742,647 | | | | 2,883,421 | | | | 8,168,501 | | | | 523,322 | | | | 290,228 | |
| | | | | | | | | | | | | | | | | | |
| $ | 338,977,580 | | | $ | 190,608,254 | | | $ | 2,613,544,983 | | | $ | 234,798,088 | | | $ | 72,484,289 | |
| | | | | | | | | | | | | | | | | | |
| | | | | | | | | | | | | | | | | | |
| $ | 419,727 | | | $ | 586,873 | | | $ | 493,769 | | | $ | 403,858 | | | $ | 59,936 | |
| | 205,641,211 | | | | 129,386,427 | | | | 1,574,882,635 | | | | 224,152,755 | | | | 58,666,208 | |
| | (6,046,183 | ) | | | (1,007,985 | ) | | | (6,619,196 | ) | | | (1,520,943 | ) | | | 147,822 | |
| | (1,510,900 | ) | | | 15,621,441 | | | | 21,444,888 | | | | (54,698,850 | ) | | | 2,148,956 | |
| | 140,473,725 | | | | 46,021,498 | | | | 1,023,342,887 | | | | 66,461,268 | | | | 11,461,367 | |
| | | | | | | | | | | | | | | | | | |
| $ | 338,977,580 | | | $ | 190,608,254 | | | $ | 2,613,544,983 | | | $ | 234,798,088 | | | $ | 72,484,289 | |
| | | | | | | | | | | | | | | | | | |
| | | | | | | | | | | | | | | | | | |
| | 338,977,580 | | | | 190,608,254 | | | | 2,613,544,983 | | | | 224,312,229 | | | | 72,484,289 | |
| | — | | | | — | | | | — | | | | 10,485,859 | | | | — | |
| | | | |
| | | | | | | | | | | | | | | | | | |
| | 41,972,715 | | | | 58,687,268 | | | | 49,376,850 | | | | 38,589,072 | | | | 5,993,617 | |
| | — | | | | — | | | | — | | | | 1,796,708 | | | | — | |
| | | | |
| | | | | | | | | | | | | | | | | | |
| $ | 8.08 | | | $ | 3.25 | | | $ | 52.93 | | | $ | 5.81 | | | $ | 12.09 | |
| | | | | | | | | | | | | | | | | | |
| $ | — | | | $ | — | | | $ | — | | | $ | 5.84 | | | $ | — | |
| | | | | | | | | | | | | | | | | | |
95
| | |
| WASATCH FUNDS — Statements of Assets and Liabilities (continued) | | MARCH 31, 2014 (UNAUDITED) |
|
|
|
| | | | | | | | | | | | | | | | |
| | | ULTRA
GROWTH
FUND | | | WORLD
INNOVATORS
FUND | | | INCOME
FUND | | | U.S. TREASURY
FUND | |
| | | | | | | | | | | | | | | | |
Assets: | | | | | | | | | | | | | | | | |
Investments, at cost | | | | | | | | | | | | | | | | |
Unaffiliated issuers | | $ | 88,479,252 | | | $ | 239,073,865 | | | $ | 117,488,339 | | | $ | 182,866,314 | |
Repurchase agreements | | | — | | | | 30,982,646 | | | | 3,974,123 | | | | 1,946,875 | |
| | | | | | | | | | | | | | | | |
| | $ | 88,479,252 | | | $ | 270,056,511 | | | $ | 121,462,462 | | | $ | 184,813,189 | |
| | | | | | | | | | | | | | | | |
Investments, at market value | | | | | | | | | | | | | | | | |
Unaffiliated issuers | | $ | 117,598,533 | | | $ | 291,507,190 | | | $ | 118,535,279 | | | $ | 190,102,883 | |
Repurchase agreements | | | — | | | | 30,982,646 | | | | 3,974,123 | | | | 1,946,875 | |
| | | | | | | | | | | | | | | | |
| | | 117,598,533 | | | | 322,489,836 | | | | 122,509,402 | | | | 192,049,758 | |
Cash | | | 39,195 | | | | — | | | | — | | | | — | |
Foreign currency on deposit (cost of $830,197, $10,056, $0 and $0, respectively) | | | 830,197 | | | | 10,029 | | | | — | | | | — | |
Receivable for investment securities sold | | | 474,675 | | | | 2,014,108 | | | | — | | | | — | |
Capital shares receivable | | | 36,081 | | | | 650,191 | | | | 101,211 | | | | 75,027 | |
Interest and dividends receivable | | | 27,089 | | | | 311,919 | | | | 815,000 | | | | 877,344 | |
Prepaid expenses and other assets | | | 11,449 | | | | 18,934 | | | | 10,718 | | | | 18,344 | |
| | | | | | | | | | | | | | | | |
Total Assets | | | 119,017,219 | | | | 325,495,017 | | | | 123,436,331 | | | | 193,020,473 | |
| | | | | | | | | | | | | | | | |
Liabilities: | | | | | | | | | | | | | | | | |
Payable for securities purchased | | | — | | | | 8,191,994 | | | | 1,000,000 | | | | — | |
Capital shares payable | | | 90,781 | | | | 411,376 | | | | 47,265 | | | | 738,411 | |
Dividends payable to shareholders | | | — | | | | — | | | | 2,849 | | | | 69,673 | |
Payable to Advisor | | | 131,569 | | | | 400,732 | | | | 57,170 | | | | 80,910 | |
Accrued fund administration fees | | | 3,715 | | | | 7,223 | | | | 2,839 | | | | 4,431 | |
Accrued expenses and other liabilities | | | 70,036 | | | | 82,214 | | | | 40,883 | | | | 66,752 | |
Line of credit payable | | | 435,824 | | | | — | | | | — | | | | — | |
| | | | | | | | | | | | | | | | |
Total Liabilities | | | 731,925 | | | | 9,093,539 | | | | 1,151,006 | | | | 960,177 | |
| | | | | | | | | | | | | | | | |
Net Assets | | $ | 118,285,294 | | | $ | 316,401,478 | | | $ | 122,285,325 | | | $ | 192,060,296 | |
| | | | | | | | | | | | | | | | |
Net Assets Consist of: | | | | | | | | | | | | | | | | |
Capital stock | | $ | 45,457 | | | $ | 133,407 | | | $ | 120,580 | | | $ | 121,440 | |
Paid-in-capital in excess of par | | | 59,876,222 | | | | 253,016,942 | | | | 121,721,129 | | | | 195,659,441 | |
Undistributed net investment income (loss) | | | 2,819,541 | | | | (3,402,202 | ) | | | 27,670 | | | | 14,838 | |
Undistributed net realized gain (loss) on investments and foreign
currency translations | | | 26,818,748 | | | | 14,284,846 | | | | (630,994 | ) | | | (10,971,992 | ) |
Net unrealized appreciation on investments and foreign currency translations | | | 28,725,326 | | | | 52,368,485 | | | | 1,046,940 | | | | 7,236,569 | |
| | | | | | | | | | | | | | | | |
Net Assets | | $ | 118,285,294 | | | $ | 316,401,478 | | | $ | 122,285,325 | | | $ | 192,060,296 | |
| | | | | | | | | | | | | | | | |
Net Assets | | | | | | | | | | | | | | | | |
Investor Class | | | 118,285,294 | | | | 316,401,478 | | | | 122,285,325 | | | | 192,060,296 | |
| | | | |
Capital Stock Issued and Outstanding (Unlimited number of shares authorized, $.01 par value) | | | | | | | | | | | | | | | | |
Investor Class | | | 4,545,677 | | | | 13,340,660 | | | | 12,058,003 | | | | 12,144,047 | |
| | | | |
NET ASSET VALUE, REDEMPTION PRICE AND OFFERING
PRICE PER SHARE | | | | | | | | | | | | | | | | |
Investor Class | | $ | 26.02 | | | $ | 23.72 | | | $ | 10.14 | | | $ | 15.82 | |
| | | | | | | | | | | | | | | | |
See Notes to Financial Statements.
96
(This page intentionally left blank.)
97
| | |
| WASATCH FUNDS — Statements of Operations | | |
|
|
|
| | | | | | | | | | | | |
| | | CORE
GROWTH
FUND | | | EMERGING
INDIA
FUND | | | EMERGING
MARKETS
SELECT
FUND | |
| | | | | | | | | | | | |
Investment Income: | | | | | | | | | | | | |
Interest | | $ | — | | | $ | — | | | $ | — | |
Dividends1 | | | | | | | | | | | | |
Unaffiliated issuers | | | 2,702,524 | | | | 54,732 | | | | 301,545 | |
| | | | | | | | | | | | |
Total investment income | | | 2,702,524 | | | | 54,732 | | | | 301,545 | |
| | | | | | | | | | | | |
Expenses: | | | | | | | | | | | | |
Investment advisory fees | | | 4,855,101 | | | | 131,174 | | | | 388,043 | |
Shareholder servicing fees — Investor Class | | | 551,391 | | | | 26,183 | | | | 38,361 | |
Shareholder servicing fees — Institutional Class | | | 5,620 | | | | — | | | | 7,019 | |
Fund administration fees | | | 65,434 | | | | 1,181 | | | | 4,185 | |
Fund accounting fees | | | 42,916 | | | | 11,278 | | | | 9,651 | |
Reports to shareholders — Investor Class | | | 40,421 | | | | 1,939 | | | | 1,501 | |
Reports to shareholders — Institutional Class | | | 3,786 | | | | — | | | | 2,615 | |
Custody fees | | | 50,004 | | | | 26,084 | | | | 39,266 | |
Federal and state registration fees — Investor Class | | | 46,303 | | | | 10,692 | | | | 7,769 | |
Federal and state registration fees — Institutional Class | | | 5,564 | | | | — | | | | 3,599 | |
Legal fees | | | 18,824 | | | | 170 | | | | 1,137 | |
Trustees’ fees | | | 31,829 | | | | 493 | | | | 1,994 | |
Interest | | | 2,464 | | | | 179 | | | | 908 | |
Offering and organization costs | | | — | | | | — | | | | 19,006 | |
Audit fees | | | 13,128 | | | | 12,101 | | | | 13,119 | |
Other expenses | | | 21,040 | | | | 5,558 | | | | 4,240 | |
| | | | | | | | | | | | |
Total expenses before reimbursement | | | 5,753,825 | | | | 227,032 | | | | 542,413 | |
Reimbursement of expenses by Advisor | | | (7,653 | ) | | | (56,328 | ) | | | (45,719 | ) |
| | | | | | | | | | | | |
Net Expenses | | | 5,746,172 | | | | 170,704 | | | | 496,694 | |
| | | | | | | | | | | | |
Net Investment Income (Loss) | | | (3,043,648 | ) | | | (115,972 | ) | | | (195,149 | ) |
| | | | | | | | | | | | |
Realized and Unrealized Gain (Loss): | | | | | | | | | | | | |
Net realized gain (loss) on investments and foreign currency translations | | | | | | | | | | | | |
Unaffiliated issuers | | | 12,922,718 | | | | (21,612 | ) | | | (1,968,950 | ) |
Realized foreign capital gains taxes | | | — | | | | — | | | | — | |
Change in unrealized appreciation on investments, options and
foreign currency translations | | | 44,389,520 | | | | 3,763,656 | | | | 4,018,902 | |
Change in deferred foreign capital gains taxes | | | (695,106 | ) | | | (46,490 | ) | | | (11,665 | ) |
| | | | | | | | | | | | |
Net gain (loss) on investments | | | 56,617,132 | | | | 3,695,554 | | | | 2,038,287 | |
| | | | | | | | | | | | |
Net Increase (Decrease) in Net Assets Resulting from Operations | | $ | 53,573,484 | | | $ | 3,579,582 | | | $ | 1,843,138 | |
| | | | | | | | | | | | |
| 1 | Net of $55,563, $0, $44,183, $1,430,347, $1,144,998, $28,043, $6,753 and $488,572 in foreign withholding taxes, respectively. |
See Notes to Financial Statements.
98
| | |
| | FOR THE SIX MONTHS ENDED MARCH 31, 2014 (UNAUDITED) |
|
|
|
| | | | | | | | | | | | | | | | | | |
EMERGING
MARKETS
SMALL CAP
FUND | | | FRONTIER
EMERGING
SMALL COUNTRIES
FUND | | | GLOBAL
OPPORTUNITIES
FUND | | | HERITAGE
GROWTH
FUND | | | INTERNATIONAL
GROWTH
FUND | |
| | | | | | | | | | | | | | | | | | |
| | | | | | | | | | | | | | | | | | |
| $ | — | | | $ | 118 | | | $ | — | | | $ | — | | | $ | — | |
| | | | | | | | | | | | | | | | | | |
| | 10,029,961 | | | | 14,039,249 | | | | 785,576 | | | | 538,512 | | | | 6,652,451 | |
| | | | | | | | | | | | | | | | | | |
| | 10,029,961 | | | | 14,039,367 | | | | 785,576 | | | | 538,512 | | | | 6,652,451 | |
| | | | | | | | | | | | | | | | | | |
| | | | | | | | | | | | | | | | | | |
| | 15,290,271 | | | | 8,046,117 | | | | 1,676,567 | | | | 444,908 | | | | 9,198,814 | |
| | 1,121,487 | | | | 891,541 | | | | 134,927 | | | | 96,900 | | | | 734,542 | |
| | — | | | | — | | | | — | | | | — | | | | — | |
| | 117,299 | | | | 62,194 | | | | 15,030 | | | | 8,573 | | | | 99,489 | |
| | 78,184 | | | | 50,760 | | | | 19,927 | | | | 10,685 | | | | 67,243 | |
| | 89,911 | | | | 57,982 | | | | 17,873 | | | | 5,887 | | | | 52,691 | |
| | — | | | | — | | | | — | | | | — | | | | — | |
| | 936,880 | | | | 954,027 | | | | 44,494 | | | | 2,520 | | | | 244,057 | |
| | 72,090 | | | | 79,449 | | | | 18,417 | | | | 9,655 | | | | 86,370 | |
| | — | | | | — | | | | — | | | | — | | | | — | |
| | 24,132 | | | | 11,132 | | | | 3,001 | | | | 1,639 | | | | 19,035 | |
| | 60,936 | | | | 25,985 | | | | 7,458 | | | | 4,112 | | | | 45,569 | |
| | 7,985 | | | | 2,198 | | | | 1,582 | | | | 318 | | | | 3,920 | |
| | — | | | | — | | | | — | | | | — | | | | — | |
| | 12,101 | | | | 12,165 | | | | 12,166 | | | | 12,157 | | | | 12,092 | |
| | 39,514 | | | | 12,667 | | | | 12,513 | | | | 7,190 | | | | 24,071 | |
| | | | | | | | | | | | | | | | | | |
| | 17,850,790 | | | | 10,206,217 | | | | 1,963,955 | | | | 604,544 | | | | 10,587,893 | |
| | (805,075 | ) | | | — | | | | — | | | | (422 | ) | | | — | |
| | | | | | | | | | | | | | | | | | |
| | 17,045,715 | | | | 10,206,217 | | | | 1,963,955 | | | | 604,122 | | | | 10,587,893 | |
| | | | | | | | | | | | | | | | | | |
| | (7,015,754 | ) | | | 3,833,150 | | | | (1,178,379 | ) | | | (65,610 | ) | | | (3,935,442 | ) |
| | | | | | | | | | | | | | | | | | |
| | | | | | | | | | | | | | | | | | |
| | | | | | | | | | | | | | | | | | |
| | (40,638,655 | ) | | | (3,554,498 | ) | | | 7,599,302 | | | | 2,057,527 | | | | 17,159,053 | |
| | (1,180,585 | ) | | | — | | | | — | | | | — | | | | — | |
| 16,887,602 | | | | 62,140,962 | | | | 2,056,136 | | | | 11,880,263 | | | | 8,568,362 | |
| | 4,861,275 | | | | (2,049,097 | ) | | | (184,428 | ) | | | — | | | | — | |
| | | | | | | | | | | | | | | | | | |
| | (20,070,363 | ) | | | 56,537,367 | | | | 9,471,010 | | | | 13,937,790 | | | | 25,727,415 | |
| | | | | | | | | | | | | | | | | | |
| $ | (27,086,117 | ) | | $ | 60,370,517 | | | $ | 8,292,631 | | | $ | 13,872,180 | | | $ | 21,791,973 | |
| | | | | | | | | | | | | | | | | | |
99
| | |
| WASATCH FUNDS — Statements of Operations (continued) | | |
|
|
|
| | | | | | | | | | | | |
| | | INTERNATIONAL
OPPORTUNITIES
FUND | | | LARGE CAP
VALUE FUND | | | LONG/SHORT
FUND | |
| | | | | | | | | | | | |
Investment Income: | | | | | | | | | | | | |
Interest | | $ | — | | | $ | — | | | $ | — | |
Dividends1 | | | | | | | | | | | | |
Unaffiliated issuers | | | 2,063,674 | | | | 8,924,300 | | | | 36,329,715 | |
Affiliated issuers2 | | | — | | | | — | | | | — | |
| | | | | | | | | | | | |
Total investment income | | | 2,063,674 | | | | 8,924,300 | | | | 36,329,715 | |
| | | | | | | | | | | | |
Expenses: | | | | | | | | | | | | |
Investment advisory fees | | | 3,070,697 | | | | 3,130,304 | | | | 13,930,872 | |
Shareholder servicing fees — Investor Class | | | 411,068 | | | | 571,717 | | | | 900,566 | |
Shareholder servicing fees — Institutional Class | | | — | | | | 5,455 | | | | 8,310 | |
Fund administration fees | | | 21,240 | | | | 46,680 | | | | 176,052 | |
Fund accounting fees | | | 26,983 | | | | 30,457 | | | | 100,901 | |
Reports to shareholders — Investor Class | | | 33,353 | | | | 43,244 | | | | 64,704 | |
Reports to shareholders — Institutional Class | | | — | | | | 2,116 | | | | 44,472 | |
Custody fees | | | 126,343 | | | | 12,459 | | | | 44,404 | |
Federal and state registration fees — Investor Class | | | 24,442 | | | | 33,331 | | | | 58,008 | |
Federal and state registration fees — Institutional Class | | | — | | | | 5,423 | | | | 32,243 | |
Legal fees | | | 3,986 | | | | 17,451 | | | | 45,418 | |
Trustees’ fees | | | 9,898 | | | | 26,097 | | | | 79,063 | |
Dividends on securities sold short | | | — | | | | — | | | | 3,240,991 | |
Interest | | | 1,287 | | | | 6,539 | | | | 526,938 | |
Audit fees | | | 12,092 | | | | 13,458 | | | | 14,210 | |
Other expenses | | | 11,432 | | | | 96,301 | | | | 44,810 | |
| | | | | | | | | | | | |
Total expenses before reimbursement | | | 3,752,821 | | | | 4,041,032 | | | | 19,311,962 | |
Reimbursement of expenses by Advisor | | | (208,421 | ) | | | (140,705 | ) | | | — | |
| | | | | | | | | | | | |
Net Expenses | | | 3,544,400 | | | | 3,900,327 | | | | 19,311,962 | |
| | | | | | | | | | | | |
Net Investment Income (Loss) | | | (1,480,726 | ) | | | 5,023,973 | | | | 17,017,753 | |
| | | | | | | | | | | | |
Realized and Unrealized Gain (Loss): | | | | | | | | | | | | |
Net realized gain on investments and foreign currency translations | | | | | | | | | | | | |
Unaffiliated issuers | | | 14,893,397 | | | | 107,588,675 | | | | 106,540,330 | |
Net realized gain on options | | | — | | | | — | | | | 9,229,620 | |
Net realized loss on short positions | | | — | | | | — | | | | (14,395,638 | ) |
Change in unrealized appreciation (depreciation) on investments, options and
foreign currency translations | | | 8,031,064 | | | | (53,475,239 | ) | | | 10,857,526 | |
Change in deferred foreign capital gains taxes | | | 50,645 | | | | — | | | | — | |
| | | | | | | | | | | | |
Net gain on investments | | | 22,975,106 | | | | 54,113,436 | | | | 112,231,838 | |
| | | | | | | | | | | | |
Net Increase in Net Assets Resulting from Operations | | $ | 21,494,380 | | | $ | 59,137,409 | | | $ | 129,249,591 | |
| | | | | | | | | | | | |
| 1 | Net of $223,167, $86,069, $379,337, $25,129, $12,789, $94,587, $0 and $9,667 in foreign withholding taxes, respectively. |
| 2 | See Note 9 for information on affiliated issuers. |
See Notes to Financial Statements.
100
| | |
| | FORTHESIXMONTHSENDED MARCH 31, 2014 (UNAUDITED) |
|
|
|
| | | | | | | | | | | | | | | | | | |
MICRO CAP FUND | | | MICRO CAP
VALUE
FUND | | | SMALL CAP
GROWTH
FUND | | | SMALL CAP
VALUE
FUND | | | STRATEGIC
INCOME
FUND | |
| | | | | | | | | | | | | | | | | | |
| | | | | | | | | | | | | | | | | | |
| $ | — | | | $ | — | | | $ | 5,080 | | | $ | 7 | | | $ | — | |
| | | | | | | | | | | | | | | | | | |
| | 585,767 | | | | 890,526 | | | | 3,915,885 | | | | 714,486 | | | | 1,740,352 | |
| | — | | | | — | | | | 583,330 | | | | — | | | | — | |
| | | | | | | | | | | | | | | | | | |
| | 585,767 | | | | 890,526 | | | | 4,504,295 | | | | 714,493 | | | | 1,740,352 | |
| | | | | | | | | | | | | | | | | | |
| | | | | | | | | | | | | | | | | | |
| | 3,210,317 | | | | 1,693,312 | | | | 12,884,361 | | | | 1,110,082 | | | | 243,814 | |
| | 114,924 | | | | 115,532 | | | | 1,708,663 | | | | 124,671 | | | | 41,734 | |
| | — | | | | — | | | | — | | | | 5,327 | | | | — | |
| | 22,950 | | | | 12,140 | | | | 173,807 | | | | 14,983 | | | | 4,698 | |
| | 20,795 | | | | 17,395 | | | | 104,434 | | | | 14,984 | | | | 6,209 | |
| | 12,867 | | | | 9,463 | | | | 126,723 | | | | 9,470 | | | | 2,630 | |
| | — | | | | — | | | | — | | | | 382 | | | | — | |
| | 15,568 | | | | 18,311 | | | | 207,584 | | | | 12,173 | | | | 1,248 | |
| | 13,947 | | | | 11,428 | | | | 59,512 | | | | 10,995 | | | | 11,205 | |
| | — | | | | — | | | | — | | | | 5,131 | | | | — | |
| | 4,352 | | | | 2,263 | | | | 33,536 | | | | 5,454 | | | | 899 | |
| | 10,978 | | | | 5,663 | | | | 83,094 | | | | 7,144 | | | | 2,225 | |
| | — | | | | — | | | | — | | | | — | | | | — | |
| | 835 | | | | 346 | | | | 6,414 | | | | 568 | | | | 174 | |
| | 12,091 | | | | 12,842 | | | | 12,333 | | | | 13,256 | | | | 12,248 | |
| | 12,233 | | | | 9,706 | | | | 44,081 | | | | 10,715 | | | | 2,641 | |
| | | | | | | | | | | | | | | | | | |
| | 3,451,857 | | | | 1,908,401 | | | | 15,444,542 | | | | 1,345,335 | | | | 329,725 | |
| | — | | | | (9,890 | ) | | | — | | | | (10,074 | ) | | | (275 | ) |
| | | | | | | | | | | | | | | | | | |
| | 3,451,857 | | | | 1,898,511 | | | | 15,444,542 | | | | 1,335,261 | | | | 329,450 | |
| | | | | | | | | | | | | | | | | | |
| | (2,866,090 | ) | | | (1,007,985 | ) | | | (10,940,247 | ) | | | (620,768 | ) | | | 1,410,902 | |
| | | | | | | | | | | | | | | | | | |
| | | | | | | | | | | | | | | | | | |
| | | | | | | | | | | | | | | | | | |
| | 23,471,078 | | | | 16,620,148 | | | | 72,822,872 | | | | 13,214,184 | | | | 2,969,137 | |
| | — | | | | 253,747 | | | | — | | | | — | | | | — | |
| | — | | | | — | | | | — | | | | — | | | | — | |
| | | | |
| | 7,747,182 | | | | 2,806,857 | | | | 100,745,558 | | | | 15,643,524 | | | | 3,686,928 | |
| | 49,115 | | | | 33,241 | | | | (557,749 | ) | | | (54,809 | ) | | | — | |
| | | | | | | | | | | | | | | | | | |
| | 31,267,375 | | | | 19,713,993 | | | | 173,010,681 | | | | 28,802,899 | | | | 6,656,065 | |
| | | | | | | | | | | | | | | | | | |
| $ | 28,401,285 | | | $ | 18,706,008 | | | $ | 162,070,434 | | | $ | 28,182,131 | | | $ | 8,066,967 | |
| | | | | | | | | | | | | | | | | | |
101
| | |
| WASATCH FUNDS — Statements of Operations (continued) | | FOR THE SIX MONTHS ENDED MARCH 31, 2014 (UNAUDITED) |
|
|
|
| | | | | | | | | | | | | | | | |
| | | ULTRA
GROWTH
FUND | | | WORLD
INNOVATORS
FUND | | | INCOME
FUND | | | U.S.
TREASURY
FUND | |
| | | | | | | | | | | | | | | | |
Investment Income: | | | | | | | | | | | | | | | | |
Interest | | $ | 4,702 | | | $ | 243 | | | $ | 1,375,332 | | | $ | 3,277,225 | |
Dividends1 | | | | | | | | | | | | | | | | |
Unaffiliated issuers | | | 210,166 | | | | 984,389 | | | | 127,428 | | | | — | |
| | | | | | | | | | | | | | | | |
Total investment income | | | 214,868 | | | | 984,632 | | | | 1,502,760 | | | | 3,277,225 | |
| | | | | | | | | | | | | | | | |
Expenses: | | | | | | | | | | | | | | | | |
Investment advisory fees | | | 788,374 | | | | 2,226,009 | | | | 338,387 | | | | 457,248 | |
Shareholder servicing fees — Investor Class | | | 93,903 | | | | 191,483 | | | | 24,949 | | | | 121,924 | |
Fund administration fees | | | 10,627 | | | | 20,037 | | | | 8,283 | | | | 12,331 | |
Fund accounting fees | | | 15,177 | | | | 20,106 | | | | 19,867 | | | | 9,753 | |
Reports to shareholders — Investor Class | | | 8,154 | | | | 14,900 | | | | 2,109 | | | | 7,765 | |
Custody fees | | | 13,924 | | | | 15,025 | | | | 7,553 | | | | 2,825 | |
Federal and state registration fees — Investor Class | | | 10,706 | | | | 20,122 | | | | 9,635 | | | | 19,596 | |
Legal fees | | | 2,011 | | | | 3,753 | | | | 1,617 | | | | 2,324 | |
Trustees’ fees | | | 5,134 | | | | 9,238 | | | | 4,242 | | | | 6,274 | |
Interest | | | 1,390 | | | | 741 | | | | 326 | | | | 435 | |
Audit fees | | | 13,097 | | | | 12,165 | | | | 12,092 | | | | 12,092 | |
Other expenses | | | 9,651 | | | | 7,773 | | | | 4,149 | | | | 6,014 | |
| | | | | | | | | | | | | | | | |
Total Expenses | | | 972,148 | | | | 2,541,352 | | | | 433,209 | | | | 658,581 | |
| | | | | | | | | | | | | | | | |
Net Investment Income (Loss) | | | (757,280 | ) | | | (1,556,720 | ) | | | 1,069,551 | | | | 2,618,644 | |
| | | | | | | | | | | | | | | | |
Realized and Unrealized Gain (Loss): | | | | | | | | | | | | | | | | |
Net realized gain (loss) on investments and foreign currency translations | | | | | | | | | | | | | | | | |
Unaffiliated issuers | | | 28,760,308 | | | | 18,858,133 | | | | (94,013 | ) | | | (4,160,241 | ) |
Change in unrealized appreciation (depreciation) on
investments, options and foreign currency translations | | | (8,876,301 | ) | | | 3,879,937 | | | | 217,789 | | | | 8,911,040 | |
| | | | | | | | | | | | | | | | |
Net gain on investments | | | 19,884,007 | | | | 22,738,070 | | | | 123,776 | | | | 4,750,799 | |
| | | | | | | | | | | | | | | | |
Net Increase in Net Assets Resulting from Operations | | $ | 19,126,727 | | | $ | 21,181,350 | | | $ | 1,193,327 | | | $ | 7,369,443 | |
| | | | | | | | | | | | | | | | |
| 1 | Net of $0, $47,511, $0 and $0 in foreign withholding taxes, respectively. |
See Notes to Financial Statements.
102
(This page intentionally left blank.)
103
| | |
| WASATCH FUNDS — Statements of Changes in Net Assets | | |
|
|
|
| | | | | | | | | | | | | | | | |
| | |
CORE GROWTH FUND | | | EMERGING INDIA FUND | |
| | | Six Months
Ended
March 31, 2014
(Unaudited) | | | Year Ended
September 30, 2013 | | | Six Months
Ended
March 31, 2014
(Unaudited) | | | Year Ended
September 30, 2013 | |
| | | | | | | | | | | | | | | | |
Operations: | | | | | | | | | | | | | | | | |
Net investment income (loss) | | $ | (3,043,648 | ) | | $ | (2,930,250 | ) | | $ | (115,972 | ) | | $ | (140,984 | ) |
Net realized gain (loss) on investments, foreign
currency translations and foreign capital gains taxes | | | 12,922,718 | | | | 45,779,034 | | | | (21,612 | ) | | | (239,097 | ) |
Net realized gain on options written | | | — | | | | 150,916 | | | | — | | | | — | |
Change in unrealized appreciation (depreciation) on
investments, options, foreign currency translations
and deferred foreign capital gains taxes | | | 43,694,414 | | | | 138,151,941 | | | | 3,717,166 | | | | (1,190,934 | ) |
| | | | | | | | | | | | | | | | |
Net increase (decrease) in net assets resulting from operations | | | 53,573,484 | | | | 181,151,641 | | | | 3,579,582 | | | | (1,571,015 | ) |
| | | | |
Dividends paid from: | | | | | | | | | | | | | | | | |
Investor Class | | | | | | | | | | | | | | | | |
Net investment income | | | — | | | | — | | | | — | | | | — | |
Net realized gains | | | (13,292,735 | ) | | | — | | | | — | | | | — | |
| | | | | | | | | | | | | | | | |
| | | (13,292,735 | ) | | | — | | | | — | | | | — | |
Institutional Class | | | | | | | | | | | | | | | | |
Net investment income | | | — | | | | — | | | | — | | | | — | |
Net realized gains | | | (446,532 | ) | | | — | | | | — | | | | — | |
| | | | | | | | | | | | | | | | |
| | | (446,532 | ) | | | — | | | | — | | | | — | |
| | | | |
Capital share transactions: | | | | | | | | | | | | | | | | |
Investor Class | | | | | | | | | | | | | | | | |
Shares sold | | | 77,161,198 | | | | 326,823,384 | | | | 2,544,942 | | | | 13,107,026 | |
Shares issued to holders in reinvestment of dividends | | | 12,976,194 | | | | — | | | | — | | | | — | |
Shares redeemed | | | (109,818,475 | ) | | | (161,818,652 | ) | | | (1,900,172 | ) | | | (9,258,122 | ) |
Redemption fees | | | 19,171 | | | | 122,280 | | | | 444 | | | | 1,805 | |
| | | | | | | | | | | | | | | | |
Net increase (decrease) | | | (19,661,912 | ) | | | 165,127,012 | | | | 645,214 | | | | 3,850,709 | |
| | | | | | | | | | | | | | | | |
Institutional Class | | | | | | | | | | | | | | | | |
Shares sold | | | 29,188,902 | | | | 10,765,192 | | | | — | | | | — | |
Shares issued to holders in reinvestment of dividends | | | 440,938 | | | | — | | | | — | | | | — | |
Shares redeemed | | | (1,758,898 | ) | | | (3,240,376 | ) | | | — | | | | — | |
Redemption fees | | | 1,248 | | | | 413 | | | | — | | | | — | |
| | | | | | | | | | | | | | | | |
Net increase | | | 27,872,190 | | | | 7,525,229 | | | | — | | | | — | |
| | | | | | | | | | | | | | | | |
Total increase (decrease) in net assets | | | 48,044,495 | | | | 353,803,882 | | | | 4,224,796 | | | | 2,279,694 | |
| | | | |
Net assets: | | | | | | | | | | | | | | | | |
Beginning of period | | | 944,275,486 | | | | 590,471,604 | | | | 15,937,580 | | | | 13,657,886 | |
| | | | | | | | | | | | | | | | |
End of period | | $ | 992,319,981 | | | $ | 944,275,486 | | | $ | 20,162,376 | | | $ | 15,937,580 | |
| | | | | | | | | | | | | | | | |
Undistributed net investment income (loss) included
in net assets at end of period | | $ | (6,409,372 | ) | | $ | (3,365,724 | ) | | $ | (321,849 | ) | | $ | (205,877 | ) |
| | | | | | | | | | | | | | | | |
| | | | |
Capital share transactions — shares: | | | | | | | | | | | | | | | | |
Investor Class | | | | | | | | | | | | | | | | |
Shares sold | | | 1,433,059 | | | | 7,068,806 | | | | 1,263,725 | | | | 6,861,871 | |
Shares issued to holders in reinvestment of dividends | | | 235,867 | | | | — | | | | — | | | | — | |
Shares redeemed | | | (2,046,972 | ) | | | (3,496,679 | ) | | | (981,439 | ) | | | (4,673,888 | ) |
| | | | | | | | | | | | | | | | |
Net increase (decrease) in shares outstanding | | | (378,046 | ) | | | 3,572,127 | | | | 282,286 | | | | 2,187,983 | |
| | | | | | | | | | | | | | | | |
Institutional Class | | | | | | | | | | | | | | | | |
Shares sold | | | 543,378 | | | | 231,435 | | | | — | | | | — | |
Shares issued to holders in reinvestment of dividends | | | 7,998 | | | | — | | | | — | | | | — | |
Shares redeemed | | | (32,547 | ) | | | (71,098 | ) | | | — | | | | — | |
| | | | | | | | | | | | | | | | |
Net increase in shares outstanding | | | 518,829 | | | | 160,337 | | | | — | | | | — | |
| | | | | | | | | | | | | | | | |
| 1 | Fund inception date was December 13, 2012. |
See Notes to Financial Statements.
104
| | |
| | MARCH 31, 2014 (UNAUDITED) |
|
|
|
| | | | | | | | | | | | | | | | | | | | | | |
EMERGING MARKETS
SELECT FUND | | | EMERGING MARKETS
SMALL CAP FUND | | |
FRONTIER EMERGING SMALL COUNTRIES FUND | |
Six Months
Ended
March 31, 2014
(Unaudited) | | | Year Ended
September 30, 20131 | | | Six Months
Ended
March 31, 2014
(Unaudited) | | | Year Ended
September 30, 2013 | | | Six Months
Ended
March 31, 2014
(Unaudited) | | | Year Ended
September 30, 2013 | |
| | | | | | | | | | | | | | | | | | | | | | |
| | | | | | | | | | | | | | | | | | | | | | |
| $ | (195,149 | ) | | $ | (5,823 | ) | | $ | (7,015,754 | ) | | $ | 3,589,995 | | | $ | 3,833,150 | | | $ | 3,159,406 | |
| (1,968,950 | ) | | | (1,799,840 | ) | | | (41,819,240 | ) | | | 81,959,238 | | | | (3,554,498 | ) | | | (3,559,143 | ) |
| | — | | | | — | | | | — | | | | — | | | | — | | | | — | |
| 4,007,237 | | | | (1,164,441 | ) | | | 21,748,877 | | | | (107,088,486 | ) | | | 60,091,865 | | | | 40,805,380 | |
| | | | | | | | | | | | | | | | | | | | | | |
| | 1,843,138 | | | | (2,970,104 | ) | | | (27,086,117 | ) | | | (21,539,253 | ) | | | 60,370,517 | | | | 40,405,643 | |
| | | | | |
| | | | | | | | | | | | | | | | | | | | | | |
| | | | | | | | | | | | | | | | | | | | | | |
| | (21,719 | ) | | | — | | | | — | | | | (7,553,551 | ) | | | (1,526,061 | ) | | | (141,701 | ) |
| | — | | | | — | | | | (38,681,435 | ) | | | — | | | | — | | | | (57,117 | ) |
| | | | | | | | | | | | | | | | | | | | | | |
| | (21,719 | ) | | | — | | | | (38,681,435 | ) | | | (7,553,551 | ) | | | (1,526,061 | ) | | | (198,818 | ) |
| | | | | | | | | | | | | | | | | | | | | | |
| | (64,529 | ) | | | — | | | | — | | | | — | | | | — | | | | — | |
| | — | | | | — | | | | — | | | | — | | | | — | | | | — | |
| | | | | | | | | | | | | | | | | | | | | | |
| | (64,529 | ) | | | — | | | | — | | | | — | | | | — | | | | — | |
| | | | | |
| | | | | | | | | | | | | | | | | | | | | | |
| | | | | | | | | | | | | | | | | | | | | | |
| | 8,153,352 | | | | 43,112,331 | | | | 239,122,499 | | | | 846,342,710 | | | | 465,709,972 | | | | 776,774,213 | |
| | 21,418 | | | | — | | | | 32,124,819 | | | | 6,807,788 | | | | 1,410,893 | | | | 197,269 | |
| | (5,703,600 | ) | | | (11,933,841 | ) | | | (440,799,056 | ) | | | (520,777,701 | ) | | | (135,886,234 | ) | | | (120,031,663 | ) |
| | 966 | | | | 8,654 | | | | 98,519 | | | | 136,439 | | | | 58,670 | | | | 502,415 | |
| | | | | | | | | | | | | | | | | | | | | | |
| | 2,472,136 | | | | 31,187,144 | | | | (169,453,219 | ) | | | 332,509,236 | | | | 331,293,301 | | | | 657,442,234 | |
| | | | | | | | | | | | | | | | | | | | | | |
| | | | | | | | | | | | | | | | | | | | | | |
| | 3,228,901 | | | | 31,112,673 | | | | — | | | | — | | | | — | | | | — | |
| | 63,952 | | | | — | | | | — | | | | — | | | | — | | | | — | |
| | (1,232,076 | ) | | | (1,106,309 | ) | | | — | | | | — | | | | — | | | | — | |
| | 82 | | | | 12,247 | | | | — | | | | — | | | | — | | | | — | |
| | | | | | | | | | | | | | | | | | | | | | |
| | 2,060,859 | | | | 30,018,611 | | | | — | | | | — | | | | — | | | | — | |
| | | | | | | | | | | | | | | | | | | | | | |
| | 6,289,885 | | | | 58,235,651 | | | | (235,220,771 | ) | | | 303,416,432 | | | | 390,137,757 | | | | 697,649,059 | |
| | | | | |
| | | | | | | | | | | | | | | | | | | | | | |
| | 58,235,651 | | | | — | | | | 1,785,681,125 | | | | 1,482,264,693 | | | | 730,694,308 | | | | 33,045,249 | |
| | | | | | | | | | | | | | | | | | | | | | |
| $ | 64,525,536 | | | $ | 58,235,651 | | | $ | 1,550,460,354 | | | $ | 1,785,681,125 | | | $ | 1,120,832,065 | | | $ | 730,694,308 | |
| | | | | | | | | | | | | | | | | | | | | | |
$ | (284,993 | ) | | $ | (3,596 | ) | | $ | (16,955,299 | ) | | $ | (9,939,545 | ) | | $ | 3,762,645 | | | $ | 1,455,556 | |
| | | | | | | | | | | | | | | | | | | | | | |
| | | | | |
| | | | | | | | | | | | | | | | | | | | | | |
| | | | | | | | | | | | | | | | | | | | | | |
| | 832,119 | | | | 4,284,448 | | | | 89,819,398 | | | | 297,277,493 | | | | 150,652,170 | | | | 273,661,192 | |
| | 2,201 | | | | — | | | | 12,214,760 | | | | 2,431,353 | | | | 458,082 | | | | 75,293 | |
| | (590,412 | ) | | | (1,210,383 | ) | | | (168,588,185 | ) | | | (186,339,071 | ) | | | (44,029,050 | ) | | | (41,133,732 | ) |
| | | | | | | | | | | | | | | | | | | | | | |
| | 243,908 | | | | 3,074,065 | | | | (66,554,027 | ) | | | 113,369,775 | | | | 107,081,202 | | | | 232,602,753 | |
| | | | | | | | | | | | | | | | | | | | | | |
| | | | | | | | | | | | | | | | | | | | | | |
| | 332,526 | | | | 3,114,333 | | | | — | | | | — | | | | — | | | | — | |
| | 6,539 | | | | — | | | | — | | | | — | | | | — | | | | — | |
| | (126,662 | ) | | | (112,181 | ) | | | — | | | | — | | | | — | | | | — | |
| | | | | | | | | | | | | | | | | | | | | | |
| | 212,403 | | | | 3,002,152 | | | | — | | | | — | | | | — | | | | — | |
| | | | | | | | | | | | | | | | | | | | | | |
105
| | |
| WASATCH FUNDS — Statements of Changes in Net Assets (continued) | | |
|
|
|
| | | | | | | | | | | | | | | | |
| | | GLOBAL OPPORTUNITIES FUND | | | HERITAGE GROWTH FUND | |
| | | Six Months
Ended
March 31, 2014
(Unaudited) | | | Year Ended
September 30, 2013 | | | Six Months
Ended
March 31, 2014
(Unaudited) | | | Year Ended
September 30, 2013 | |
| | | | | | | | | | | | | | | | |
Operations: | | | | | | | | | | | | | | | | |
Net investment income (loss) | | $ | (1,178,379 | ) | | $ | (1,309,369 | ) | | $ | (65,610 | ) | | $ | 176,407 | |
Net realized gain on investments and foreign currency translations | | | 7,599,302 | | | | 22,471,421 | | | | 2,057,527 | | | | 2,396,739 | |
Change in unrealized appreciation (depreciation) on investments, foreign currency translations
and deferred foreign capital gains taxes | | | 1,871,708 | | | | 19,772,020 | | | | 11,880,263 | | | | 20,188,006 | |
| | | | | | | | | | | | | | | | |
Net increase in net assets resulting from operations | | | 8,292,631 | | | | 40,934,072 | | | | 13,872,180 | | | | 22,761,152 | |
| | | | |
Dividends paid from: | | | | | | | | | | | | | | | | |
Investor Class | | | | | | | | | | | | | | | | |
Net investment income | | | (189,507 | ) | | | — | | | | (3 | ) | | | (106,546 | ) |
Net realized gains | | | (23,360,745 | ) | | | (17,635,551 | ) | | | (3,055,839 | ) | | | (4,555,183 | ) |
| | | | | | | | | | | | | | | | |
| | | (23,550,252 | ) | | | (17,635,551 | ) | | | (3,055,842 | ) | | | (4,661,729 | ) |
Institutional Class | | | | | | | | | | | | | | | | |
Net investment income | | | — | | | | — | | | | — | | | | — | |
Net realized gains | | | — | | | | — | | | | — | | | | — | |
| | | | | | | | | | | | | | | | |
| | | — | | | | — | | | | — | | | | — | |
| | | | |
Capital share transactions: | | | | | | | | | | | | | | | | |
Investor Class | | | | | | | | | | | | | | | | |
Shares sold | | | 28,177,868 | | | | 78,951,413 | | | | 6,453,096 | | | | 15,718,322 | |
Shares issued to holders in reinvestment of dividends | | | 23,300,598 | | | | 17,450,564 | | | | 3,008,392 | | | | 4,582,284 | |
Shares redeemed | | | (41,493,447 | ) | | | (52,836,034 | ) | | | (10,862,879 | ) | | | (29,485,119 | ) |
Redemption fees | | | 12,982 | | | | 13,811 | | | | 5,468 | | | | 3,459 | |
| | | | | | | | | | | | | | | | |
Net increase (decrease) | | | 9,998,001 | | | | 43,579,754 | | | | (1,395,923 | ) | | | (9,181,054 | ) |
| | | | | | | | | | | | | | | | |
Institutional Class | | | | | | | | | | | | | | | | |
Shares sold | | | — | | | | — | | | | — | | | | — | |
Shares issued to holders in reinvestment of dividends | | | — | | | | — | | | | — | | | | — | |
Shares redeemed | | | — | | | | — | | | | — | | | | — | |
Redemption fees | | | — | | | | — | | | | — | | | | — | |
| | | | | | | | | | | | | | | | |
Net decrease | | | — | | | | — | | | | — | | | | — | |
| | | | | | | | | | | | | | | | |
Total increase (decrease) in net assets | | | (5,259,620 | ) | | | 66,878,275 | | | | 9,420,415 | | | | 8,918,369 | |
| | | | |
Net assets: | | | | | | | | | | | | | | | | |
Beginning of period | | | 220,460,237 | | | | 153,581,962 | | | | 120,870,671 | | | | 111,952,302 | |
| | | | | | | | | | | | | | | | |
End of period | | $ | 215,200,617 | | | $ | 220,460,237 | | | $ | 130,291,086 | | | $ | 120,870,671 | |
| | | | | | | | | | | | | | | | |
Undistributed net investment income (loss) included in net assets at end of period | | $ | (2,733,586 | ) | | $ | (1,365,700 | ) | | $ | (272,758 | ) | | $ | (207,145 | ) |
| | | | | | | | | | | | | | | | |
| | | | |
Capital share transactions — shares: | | | | | | | | | | | | | | | | |
Investor Class | | | | | | | | | | | | | | | | |
Shares sold | | | 6,289,157 | | | | 19,093,276 | | | | 408,890 | | | | 1,188,222 | |
Shares issued to holders in reinvestment of dividends | | | 5,368,812 | | | | 4,544,418 | | | | 188,734 | | | | 370,136 | |
Shares redeemed | | | (9,464,927 | ) | | | (12,600,673 | ) | | | (686,790 | ) | | | (2,196,100 | ) |
| | | | | | | | | | | | | | | | |
Net increase (decrease) in shares outstanding | | | 2,193,042 | | | | 11,037,021 | | | | (89,166 | ) | | | (637,742 | ) |
| | | | | | | | | | | | | | | | |
Institutional Class | | | | | | | | | | | | | | | | |
Shares sold | | | — | | | | — | | | | — | | | | — | |
Shares issued to holders in reinvestment of dividends | | | — | | | | — | | | | — | | | | — | |
Shares redeemed | | | — | | | | — | | | | — | | | | — | |
| | | | | | | | | | | | | | | | |
Net decrease in shares outstanding | | | — | | | | — | | | | — | | | | — | |
| | | | | | | | | | | | | | | | |
See Notes to Financial Statements.
106
| | |
| | MARCH 31, 2014 (UNAUDITED) |
|
|
|
| | | | | | | | | | | | | | | | | | | | | | |
INTERNATIONAL GROWTH FUND | | | INTERNATIONAL OPPORTUNITIES FUND | | | LARGE CAP VALUE FUND | |
Six Months
Ended
March 31, 2014
(Unaudited) | | | Year Ended
September 30, 2013 | | | Six Months
Ended
March 31, 2014
(Unaudited) | | | Year Ended
September 30, 2013 | | | Six Months
Ended
March 31, 2014
(Unaudited) | | | Year Ended
September 30, 2013 | |
| | | | | | | | | | | | | | | | | | | | | | |
| | | | | | | | | | | | | | | | | | | | | | |
| $ | (3,935,442 | ) | | $ | 2,133,946 | | | $ | (1,480,726 | ) | | $ | (67,017 | ) | | $ | 5,023,973 | | | $ | 15,555,783 | |
|
17,159,053 |
| | | 53,101,393 | | | | 14,893,397 | | | | 23,650,919 | | | | 107,588,675 | | | | 323,383,090 | |
|
8,568,362 |
| | | 158,495,032 | | | | 8,081,709 | | | | 20,421,755 | | | | (53,475,239 | ) | | | (122,155,005 | ) |
| | | | | | | | | | | | | | | | | | | | | | |
| | 21,791,973 | | | | 213,730,371 | | | | 21,494,380 | | | | 44,005,657 | | | | 59,137,409 | | | | 216,783,868 | |
| | | | | |
| | | | | | | | | | | | | | | | | | | | | | | |
| | | | | | | | | | | | | | | | | | | | | | |
| | — | | | | (2,056,223 | ) | | | — | | | | — | | | | (5,305,459 | ) | | | (14,580,839 | ) |
| | (35,584,097 | ) | | | — | | | | (18,321,459 | ) | | | — | | | | (220,160,713 | ) | | | (10,767,081 | ) |
| | | | | | | | | | | | | | | | | | | | | | |
| | (35,584,097 | ) | | | (2,056,223 | ) | | | (18,321,459 | ) | | | — | | | | (225,466,172 | ) | | | (25,347,920 | ) |
| | | | | | | | | | | | | | | | | | | | | | |
| | — | | | | — | | | | — | | | | — | | | | (100,529 | ) | | | (204,325 | ) |
| | — | | | | — | | | | — | | | | — | | | | (3,657,318 | ) | | | (115,116 | ) |
| | | | | | | | | | | | | | | | | | | | | | |
| | — | | | | — | | | | — | | | | — | | | | (3,757,847 | ) | | | (319,441 | ) |
| | | | | |
| | | | | | | | | | | | | | | | | | | | | | | |
| | | | | | | | | | | | | | | | | | | | | | |
| | 613,982,680 | | | | 898,513,811 | | | | 65,126,479 | | | | 96,890,115 | | | | 25,291,608 | | | | 176,799,999 | |
| | 32,446,727 | | | | 1,885,302 | | | | 17,919,622 | | | | — | | | | 221,192,195 | | | | 24,998,559 | |
| | (304,561,740 | ) | | | (220,198,846 | ) | | | (32,467,387 | ) | | | (57,437,199 | ) | | | (292,161,569 | ) | | | (902,102,981 | ) |
| | 66,585 | | | | 232,539 | | | | 14,419 | | | | 194,004 | | | | 13,741 | | | | 15,701 | |
| | | | | | | | | | | | | | | | | | | | | | |
| | 341,934,252 | | | | 680,432,806 | | | | 50,593,133 | | | | 39,646,920 | | | | (45,664,025 | ) | | | (700,288,722 | ) |
| | | | | | | | | | | | | | | | | | | | | | |
| | | | | | | | | | | | | | | | | | | | | | |
| | — | | | | — | | | | — | | | | — | | | | 496,972 | | | | 5,558,942 | |
| | — | | | | — | | | | — | | | | — | | | | 3,741,035 | | | | 318,359 | |
| | — | | | | — | | | | — | | | | — | | | | (7,718,619 | ) | | | (8,226,847 | ) |
| | — | | | | — | | | | — | | | | — | | | | 27 | | | | 75 | |
| | | | | | | | | | | | | | | | | | | | | | |
| | — | | | | — | | | | — | | | | — | | | | (3,480,585 | ) | | | (2,349,471 | ) |
| | | | | | | | | | | | | | | | | | | | | | |
| | 328,142,128 | | | | 892,106,954 | | | | 53,766,054 | | | | 83,652,577 | | | | (219,231,220 | ) | | | (511,521,686 | ) |
| | | | | |
| | | | | | | | | | | | | | | | | | | | | | |
| | 1,326,931,271 | | | | 434,824,317 | | | | 278,215,805 | | | | 194,563,228 | | | | 802,353,993 | | | | 1,313,875,679 | |
| | | | | | | | | | | | | | | | | | | | | | |
| $ | 1,655,073,399 | | | $ | 1,326,931,271 | | | $ | 331,981,859 | | | $ | 278,215,805 | | | $ | 583,122,773 | | | $ | 802,353,993 | |
| | | | | | | | | | | | | | | | | | | | | | |
$ |
(3,646,035 |
) | | $ | 289,407 | | | $ | (1,601,954 | ) | | $ | (121,228 | ) | | $ | 29,696 | | | $ | 411,711 | |
| | | | | | | | | | | | | | | | | | | | | | |
| | | | | |
| | | | | | | | | | | | | | | | | | | | | | |
| | | | | | | | | | | | | | | | | | | | | | |
| | 21,293,378 | | | | 35,121,573 | | | | 22,048,794 | | | | 34,640,370 | | | | 1,720,202 | | | | 11,459,468 | |
| | 1,128,975 | | | | 80,810 | | | | 6,265,602 | | | | — | | | | 18,010,297 | | | | 1,681,933 | |
| | (10,579,944 | ) | | | (8,445,699 | ) | | | (11,044,339 | ) | | | (20,779,253 | ) | | | (20,928,414 | ) | | | (56,362,465 | ) |
| | | | | | | | | | | | | | | | | | | | | | |
| | 11,842,409 | | | | 26,756,684 | | | | 17,270,057 | | | | 13,861,117 | | | | (1,197,915 | ) | | | (43,221,064 | ) |
| | | | | | | | | | | | | | | | | | | | | | |
| | | | | | | | | | | | | | | | | | | | | | |
| | — | | | | — | | | | — | | | | — | | | | 34,764 | | | | 378,007 | |
| | — | | | | — | | | | — | | | | — | | | | 304,851 | | | | 21,178 | |
| | — | | | | — | | | | — | | | | — | | | | (516,564 | ) | | | (550,843 | ) |
| | | | | | | | | | | | | | | | | | | | | | |
| | — | | | | — | | | | — | | | | — | | | | (176,949 | ) | | | (151,658 | ) |
| | | | | | | | | | | | | | | | | | | | | | |
107
| | |
| WASATCH FUNDS — Statements of Changes in Net Assets (continued) | | |
|
|
|
| | | | | | | | | | | | | | | | |
| | | LONG/SHORT FUND | | | MICRO CAP FUND | |
| | | Six Months
Ended
March 31, 2014
(Unaudited) | | | Year Ended
September 30, 20131 | | | Six Months
Ended
March 31, 2014
(Unaudited) | | | Year Ended
September 30, 2013 | |
| | | | | | | | | | | | | | | | |
Operations: | | | | | | | | | | | | | | | | |
Net investment income (loss) | | $ | 17,017,753 | | | $ | (3,856,379 | ) | | $ | (2,866,090 | ) | | $ | (3,679,572 | ) |
Net realized gain on investments and foreign
currency translations | | | 106,540,330 | | | | 83,026,876 | | | | 23,471,078 | | | | 16,739,208 | |
Net realized gain (loss) on options | | | 9,229,620 | | | | 1,309,436 | | | | — | | | | — | |
Net realized (loss) on short positions | | | (14,395,638 | ) | | | (42,360,180 | ) | | | — | | | | — | |
Change in unrealized appreciation on investments,
options, foreign currency translations and deferred foreign capital gains taxes | | | 10,857,526 | | | | 227,943,560 | | | | 7,796,297 | | | | 63,205,416 | |
| | | | | | | | | | | | | | | | |
Net increase in net assets resulting from operations | | | 129,249,591 | | | | 266,063,313 | | | | 28,401,285 | | | | 76,265,052 | |
| | | | |
Dividends paid from: | | | | | | | | | | | | | | | | |
Investor Class | | | | | | | | | | | | | | | | |
Net investment income | | | — | | | | — | | | | — | | | | — | |
Net realized gains | | | (35,737,283 | ) | | | (3,814,682 | ) | | | — | | | | — | |
| | | | | | | | | | | | | | | | |
| | | (35,737,283 | ) | | | (3,814,682 | ) | | | — | | | | — | |
Institutional Class | | | | | | | | | | | | | | | | |
Net investment income | | | — | | | | — | | | | — | | | | — | |
Net realized gains | | | (19,002,705 | ) | | | (37 | ) | | | — | | | | — | |
| | | | | | | | | | | | | | | | |
| | | (19,002,705 | ) | | | (37 | ) | | | — | | | | — | |
| | | | |
Capital share transactions: | | | | | | | | | | | | | | | | |
Investor Class | | | | | | | | | | | | | | | | |
Shares sold | | | 510,641,353 | | | | 839,239,541 | | | | 13,501,502 | | | | 18,549,509 | |
Shares issued to holders in reinvestment of dividends | | | 32,545,875 | | | | 3,533,082 | | | | — | | | | — | |
Shares redeemed | | | (276,206,040 | ) | | | (1,124,141,469 | ) | | | (26,103,928 | ) | | | (61,092,571 | ) |
Redemption fees | | | (14,667 | ) | | | 214,286 | | | | 3,996 | | | | 3,686 | |
| | | | | | | | | | | | | | | | |
Net increase (decrease) | | | 266,966,521 | | | | (281,154,560 | ) | | | (12,598,430 | ) | | | (42,539,376 | ) |
| | | | | | | | | | | | | | | | |
Institutional Class | | | | | | | | | | | | | | | | |
Shares sold | | | 156,949,469 | | | | 833,136,129 | | | | — | | | | — | |
Shares issued to holders in reinvestment of dividends | | | 18,483,416 | | | | 36 | | | | — | | | | — | |
Shares redeemed | | | (81,968,418 | ) | | | (47,303,233 | ) | | | — | | | | — | |
Redemption fees | | | 19,733 | | | | 3,745 | | | | — | | | | — | |
| | | | | | | | | | | | | | | | |
Net increase (decrease) | | | 93,484,200 | | | | 785,836,677 | | | | — | | | | — | |
| | | | | | | | | | | | | | | | |
Total increase in net assets | | | 434,960,324 | | | | 766,930,711 | | | | 15,802,855 | | | | 33,725,676 | |
| | | | |
Net assets: | | | | | | | | | | | | | | | | |
Beginning of period | | | 2,304,150,396 | | | | 1,537,219,685 | | | | 323,174,725 | | | | 289,449,049 | |
| | | | | | | | | | | | | | | | |
End of period | | $ | 2,739,110,720 | | | $ | 2,304,150,396 | | | $ | 338,977,580 | | | $ | 323,174,725 | |
| | | | | | | | | | | | | | | | |
Undistributed net investment income (loss) included
in net assets at end of period | | $ | 17,017,753 | | | $ | — | | | $ | (6,046,183 | ) | | $ | (3,180,093 | ) |
| | | | | | | | | | | | | | | | |
| | | | |
Capital share transactions — shares: | | | | | | | | | | | | | | | | |
Investor Class | | | | | | | | | | | | | | | | |
Shares sold | | | 31,590,167 | | | | 56,185,020 | | | | 1,716,207 | | | | 3,008,503 | |
Shares issued to holders in reinvestment of dividends | | | 2,006,527 | | | | 255,281 | | | | — | | | | — | |
Shares redeemed | | | (17,145,295 | ) | | | (75,441,028 | ) | | | (3,297,054 | ) | | | (10,173,311 | ) |
| | | | | | | | | | | | | | | | |
Net increase (decrease) in shares outstanding | | | 16,451,399 | | | | (19,000,727 | ) | | | (1,580,847 | ) | | | (7,164,808 | ) |
| | | | | | | | | | | | | | | | |
Institutional Class | | | | | | | | | | | | | | | | |
Shares sold | | | 9,705,611 | | | | 55,159,278 | | | | — | | | | — | |
Shares issued to holders in reinvestment of dividends | | | 1,138,141 | | | | 3 | | | | — | | | | — | |
Shares redeemed | | | (5,064,281 | ) | | | (3,064,536 | ) | | | — | | | | — | |
| | | | | | | | | | | | | | | | |
Net increase (decrease) in shares outstanding | | | 5,779,471 | | | | 52,094,745 | | | | — | | | | — | |
| | | | | | | | | | | | | | | | |
| 1 | Institutional Class inception date was December 13, 2012. |
See Notes to Financial Statements.
108
| | |
| | MARCH 31, 2014 (UNAUDITED) |
|
|
|
| | | | | | | | | | | | | | | | | | | | | | |
MICRO CAP VALUE FUND | | | SMALL CAP GROWTH FUND | | | SMALL CAP VALUE FUND | |
Six Months
Ended March 31, 2014
(Unaudited) | | | Year Ended
September 30, 2013 | | | Six Months Ended March 31, 2014
(Unaudited) | | | Year Ended
September 30, 2013 | | | Six Months
Ended March 31, 2014
(Unaudited) | | | Year Ended
September 30, 2013 | |
| | | | | | | | | | | | | | | | | | | | | | |
| | | | | | | | | | | | | | | | | | | | | | |
| $ | (1,007,985 | ) | | $ | (1,339,035 | ) | | $ | (10,940,247 | ) | | $ | (8,773,760 | ) | | $ | (620,768 | ) | | $ | (385,158 | ) |
| 16,620,148 | | | | 31,812,229 | | | | 72,822,872 | | | | 72,201,171 | | | | 13,214,184 | | | | 29,980,517 | |
| | 253,747 | | | | (402,253 | ) | | | — | | | | — | | | | — | | | | 134,261 | |
| | — | | | | — | | | | — | | | | — | | | | — | | | | — | |
| 2,840,098 | | | | 12,551,496 | | | | 100,187,809 | | | | 418,940,746 | | | | 15,588,715 | | | | 25,781,113 | |
| | | | | | | | | | | | | | | | | | | | | | |
| | 18,706,008 | | | | 42,622,437 | | | | 162,070,434 | | | | 482,368,157 | | | | 28,182,131 | | | | 55,510,733 | |
| | | | | |
| | | | | | | | | | | | | | | | | | | | | | |
| | | | | | | | | | | | | | | | | | | | | | |
| | — | | | | — | | | | — | | | | — | | | | — | | | | — | |
| | (28,293,837 | ) | | | (12,598,831 | ) | | | (82,224,931 | ) | | | (120,513,937 | ) | | | — | | | | — | |
| | | | | | | | | | | | | | | | | | | | | | |
| | (28,293,837 | ) | | | (12,598,831 | ) | | | (82,224,931 | ) | | | (120,513,937 | ) | | | — | | | | — | |
| | | | | | | | | | | | | | | | | | | | | | |
| | — | | | | — | | | | — | | | | — | | | | — | | | | — | |
| | — | | | | — | | | | — | | | | — | | | | — | | | | — | |
| | | | | | | | | | | | | | | | | | | | | | |
| | — | | | | — | | | | — | | | | — | | | | — | | | | — | |
| | | | | |
| | | | | | | | | | | | | | | | | | | | | | |
| | | | | | | | | | | | | | | | | | | | | | |
| | 19,522,662 | | | | 17,228,162 | | | | 224,231,312 | | | | 526,165,138 | | | | 8,169,699 | | | | 13,743,085 | |
| | 27,559,024 | | | | 12,236,099 | | | | 77,677,537 | | | | 113,588,148 | | | | — | | | | — | |
| | (13,383,088 | ) | | | (31,306,629 | ) | | | (255,274,563 | ) | | | (339,431,007 | ) | | | (12,361,624 | ) | | | (31,535,450 | ) |
| | 10,061 | | | | 6,833 | | | | 34,432 | | | | 72,964 | | | | 1,196 | | | | 2,643 | |
| | | | | | | | | | | | | | | | | | | | | | |
| | 33,708,659 | | | | (1,835,535 | ) | | | 46,668,718 | | | | 300,395,243 | | | | (4,190,729 | ) | | | (17,789,722 | ) |
| | | | | | | | | | | | | | | | | | | | | | |
| | | | | | | | | | | | | | | | | | | | | | |
| | — | | | | — | | | | — | | | | — | | | | 20,486 | | | | 114,779 | |
| | — | | | | — | | | | — | | | | — | | | | — | | | | — | |
| | — | | | | — | | | | — | | | | — | | | | (153,871 | ) | | | (469,262 | ) |
| | — | | | | — | | | | — | | | | — | | | | — | | | | 9 | |
| | | | | | | | | | | | | | | | | | | | | | |
| | — | | | | — | | | | — | | | | — | | | | (133,385 | ) | | | (354,474 | ) |
| | | | | | | | | | | | | | | | | | | | | | |
| | 24,120,830 | | | | 28,188,071 | | | | 126,514,221 | | | | 662,249,463 | | | | 23,858,017 | | | | 37,366,537 | |
| | | | | |
| | | | | | | | | | | | | | | | | | | | | | |
| | 166,487,424 | | | | 138,299,353 | | | | 2,487,030,762 | | | | 1,824,781,299 | | | | 210,940,071 | | | | 173,573,534 | |
| | | | | | | | | | | | | | | | | | | | | | |
| $ | 190,608,254 | | | $ | 166,487,424 | | | $ | 2,613,544,983 | | | $ | 2,487,030,762 | | | $ | 234,798,088 | | | $ | 210,940,071 | |
| | | | | | | | | | | | | | | | | | | | | | |
$ | (1,007,985 | ) | | $ | — | | | $ | (6,619,196 | ) | | $ | 4,321,051 | | | $ | (1,520,943 | ) | | $ | (900,175 | ) |
| | | | | | | | | | | | | | | | | | | | | | |
| | | | | |
| | | | | | | | | | | | | | | | | | | | | | |
| | | | | | | | | | | | | | | | | | | | | | |
| | 5,836,831 | | | | 5,667,705 | | | | 4,278,692 | | | | 11,553,173 | | | | 1,491,054 | | | | 3,038,390 | |
| | 8,612,195 | | | | 4,652,509 | | | | 1,486,367 | | | | 2,786,072 | | | | — | | | | — | |
| | (4,058,834 | ) | | | (10,622,742 | ) | | | (4,854,311 | ) | | | (7,512,395 | ) | | | (2,269,925 | ) | | | (7,381,311 | ) |
| | | | | | | | | | | | | | | | | | | | | | |
| | 10,390,192 | | | | (302,528 | ) | | | 910,748 | | | | 6,826,850 | | | | (778,871 | ) | | | (4,342,921 | ) |
| | | | | | | | | | | | | | | | | | | | | | |
| | | | | | | | | | | | | | | | | | | | | | |
| | — | | | | — | | | | — | | | | — | | | | 3,746 | | | | 27,062 | |
| | — | | | | — | | | | — | | | | — | | | | — | | | | — | |
| | — | | | | — | | | | — | | | | — | | | | (28,004 | ) | | | (104,640 | ) |
| | | | | | | | | | | | | | | | | | | | | | |
| | — | | | | — | | | | — | | | | — | | | | (24,258 | ) | | | (77,578 | ) |
| | | | | | | | | | | | | | | | | | | | | | |
109
| | |
| WASATCH FUNDS — Statements of Changes in Net Assets (continued) | | |
|
|
|
| | | | | | | | | | | | | | | | |
| | | STRATEGIC INCOME FUND | | | ULTRA GROWTH FUND | |
| | | Six Months
Ended
March 31, 2014
(Unaudited) | | | Year Ended
September 30, 2013 | | | Six Months
Ended
March 31, 2014
(Unaudited) | | | Year Ended
September 30, 2013 | |
| | | | | | | | | | | | | | | | |
Operations: | | | | | | | | | | | | | | | | |
Net investment income (loss) | | $ | 1,410,902 | | | $ | 1,746,049 | | | $ | (757,280 | ) | | $ | (903,738 | ) |
Net realized gain (loss) on investments and foreign currency translations | | | 2,969,137 | | | | 5,445,411 | | | | 28,760,308 | | | | 13,638,860 | |
Change in unrealized appreciation (depreciation) on investments and foreign currency translations | | | 3,686,928 | | | | 4,158,601 | | | | (8,876,301 | ) | | | 18,080,625 | |
| | | | | | | | | | | | | | | | |
Net increase (decrease) in net assets resulting from operations | | | 8,066,967 | | | | 11,350,061 | | | | 19,126,727 | | | | 30,815,747 | |
| | | | |
Dividends paid from: | | | | | | | | | | | | | | | | |
Investor Class | | | | | | | | | | | | | | | | |
Net investment income | | | (1,099,137 | ) | | | (1,783,475 | ) | | | — | | | | — | |
Net realized gains | | | (993,476 | ) | | | — | | | | (10,009,711 | ) | | | (18,153,849 | ) |
| | | | | | | | | | | | | | | | |
| | | (2,092,613 | ) | | | (1,783,475 | ) | | | (10,009,711 | ) | | | (18,153,849 | ) |
| | | | |
Capital share transactions: | | | | | | | | | | | | | | | | |
Investor Class | | | | | | | | | | | | | | | | |
Shares sold | | | 8,787,700 | | | | 29,412,047 | | | | 5,806,953 | | | | 7,412,958 | |
Shares issued to holders in reinvestment of dividends | | | 2,069,534 | | | | 1,753,848 | | | | 9,777,591 | | | | 17,764,371 | |
Shares redeemed | | | (10,928,589 | ) | | | (18,796,760 | ) | | | (58,115,595 | ) | | | (29,401,210 | ) |
Redemption fees | | | 2,268 | | | | 7,879 | | | | 1,841 | | | | 788 | |
| | | | | | | | | | | | | | | | |
Net increase (decrease) | | | (69,087 | ) | | | 12,377,014 | | | | (42,529,210 | ) | | | (4,223,093 | ) |
| | | | | | | | | | | | | | | | |
Total increase (decrease) in net assets | | | 5,905,267 | | | | 21,943,600 | | | | (33,412,194 | ) | | | 8,438,805 | |
| | | | |
Net assets: | | | | | | | | | | | | | | | | |
Beginning of period | | | 66,579,022 | | | | 44,635,422 | | | | 151,697,488 | | | | 143,258,683 | |
| | | | | | | | | | | | | | | | |
End of period | | $ | 72,484,289 | | | $ | 66,579,022 | | | $ | 118,285,294 | | | $ | 151,697,488 | |
| | | | | | | | | | | | | | | | |
Undistributed net investment income (loss) included in net assets at end of period | | $ | 147,822 | | | $ | (163,943 | ) | | $ | 2,819,541 | | | $ | 3,576,821 | |
| | | | | | | | | | | | | | | | |
| | | | |
Capital share transactions — shares: | | | | | | | | | | | | | | | | |
Investor Class | | | | | | | | | | | | | | | | |
Shares sold | | | 747,561 | | | | 2,875,259 | | | | 229,441 | | | | 338,575 | |
Shares issued to holders in reinvestment of dividends | | | 175,074 | | | | 171,622 | | | | 391,103 | | | | 909,129 | |
Shares redeemed | | | (939,576 | ) | | | (1,835,606 | ) | | | (2,249,443 | ) | | | (1,347,071 | ) |
| | | | | | | | | | | | | | | | |
Net increase (decrease) in shares outstanding | | | (16,941 | ) | | | 1,211,275 | | | | (1,628,899 | ) | | | (99,367 | ) |
| | | | | | | | | | | | | | | | |
See Notes to Financial Statements.
110
| | |
| | MARCH 31, 2014 (UNAUDITED) |
|
|
|
| | | | | | | | | | | | | | | | | | | | | | |
WORLD INNOVATORS FUND | | | INCOME FUND | | | U.S. TREASURY FUND | |
Six Months
Ended March 31, 2014
(Unaudited) | | | Year Ended
September 30, 2013 | | | Six Months
Ended March 31, 2014
(Unaudited) | | | Year Ended
September 30, 2013 | | | Six Months
Ended March 31, 2014
(Unaudited) | | | Year Ended
September 30, 2013 | |
| | | | | | | | | | | | | | | | | | | | | | |
| | | | | | | | | | | | | | | | | | | | | | |
| $ | (1,556,720 | ) | | $ | (1,694,953 | ) | | $ | 1,069,551 | | | $ | 2,265,597 | | | $ | 2,618,644 | | | $ | 6,006,729 | |
| 18,858,133 | | | | 18,170,206 | | | | (94,013 | ) | | | 248,661 | | | | (4,160,241 | ) | | �� | (6,304,627 | ) |
| 3,879,937 | | | | 29,296,909 | | | | 217,789 | | | | (4,397,565 | ) | | | 8,911,040 | | | | (40,377,202 | ) |
| | | | | | | | | | | | | | | | | | | | | | |
| | 21,181,350 | | | | 45,772,162 | | | | 1,193,327 | | | | (1,883,307 | ) | | | 7,369,443 | | | | (40,675,100 | ) |
| | | | | |
| | | | | | | | | | | | | | | | | | | | | | |
| | | | | | | | | | | | | | | | | | | | | | |
| | — | | | | — | | | | (1,097,405 | ) | | | (2,251,846 | ) | | | (2,619,247 | ) | | | (6,003,335 | ) |
| | (14,888,675 | ) | | | — | | | | — | | | | — | | | | — | | | | (5,092,088 | ) |
| | | | | | | | | | | | | | | | | | | | | | |
| | (14,888,675 | ) | | | — | | | | (1,097,405 | ) | | | (2,251,846 | ) | | | (2,619,247 | ) | | | (11,095,423 | ) |
| | | | | |
| | | | | | | | | | | | | | | | | | | | | | |
| | | | | | | | | | | | | | | | | | | | | | |
| | 67,393,970 | | | | 120,569,904 | | | | 9,396,575 | | | | 34,260,559 | | | | 42,365,004 | | | | 152,652,150 | |
| | 13,963,650 | | | | — | | | | 1,056,401 | | | | 1,874,537 | | | | 2,507,150 | | | | 10,245,647 | |
| | (38,179,090 | ) | | | (67,399,194 | ) | | | (18,548,920 | ) | | | (40,901,921 | ) | | | (50,799,815 | ) | | | (189,555,949 | ) |
| | 19,328 | | | | 34,163 | | | | 39 | | | | 1,107 | | | | 6,864 | | | | 164,702 | |
| | | | | | | | | | | | | | | | | | | | | | |
| | 43,197,858 | | | | 53,204,873 | | | | (8,095,905 | ) | | | (4,765,718 | ) | | | (5,920,797 | ) | | | (26,493,450 | ) |
| | | | | | | | | | | | | | | | | | | | | | |
| | 49,490,533 | | | | 98,977,035 | | | | (7,999,983 | ) | | | (8,900,871 | ) | | | (1,170,601 | ) | | | (78,263,973 | ) |
| | | | | |
| | | | | | | | | | | | | | | | | | | | | | |
| | 266,910,945 | | | | 167,933,910 | | | | 130,285,308 | | | | 139,186,179 | | | | 193,230,897 | | | | 271,494,870 | |
| | | | | | | | | | | | | | | | | | | | | | |
| $ | 316,401,478 | | | $ | 266,910,945 | | | $ | 122,285,325 | | | $ | 130,285,308 | | | $ | 192,060,296 | | | $ | 193,230,897 | |
| | | | | | | | | | | | | | | | | | | | | | |
$ | (3,402,202 | ) | | $ | (1,845,482 | ) | | $ | 27,670 | | | $ | 55,524 | | | $ | 14,838 | | | $ | 15,441 | |
| | | | | | | | | | | | | | | | | | | | | | |
| | | | | |
| | | | | | | | | | | | | | | | | | | | | | |
| | | | | | | | | | | | | | | | | | | | | | |
| | 2,845,321 | | | | 5,820,787 | | | | 924,804 | | | | 3,315,362 | | | | 2,735,258 | | | | 8,727,694 | |
| | 595,465 | | | | — | | | | 104,190 | | | | 182,048 | | | | 163,286 | | | | 591,684 | |
| | (1,629,826 | ) | | | (3,342,001 | ) | | | (1,828,326 | ) | | | (3,970,892 | ) | | | (3,361,697 | ) | | | (11,188,977 | ) |
| | | | | | | | | | | | | | | | | | | | | | |
| | 1,810,960 | | | | 2,478,786 | | | | (799,332 | ) | | | (473,482 | ) | | | (463,153 | ) | | | (1,869,599 | ) |
| | | | | | | | | | | | | | | | | | | | | | |
111
| | |
| WASATCH FUNDS — Financial Highlights | | |
|
|
|
| | | | | | | | | | | | | | | | | | | | | | | | | | | | | | | | |
| | | | | | Income (Loss) from
Investment Operations | | | | | | | | | Less Distributions | | | | |
| | | Net Asset
Value
Beginning
of Period | | | Net
Investment
Income (Loss) | | | Net Realized
and Unrealized
Gains (Losses)
on Investments | | | Total from
Investment
Operations | | | Redemption
Fees
(See Note 2) | | | Dividends
from Net
Investment
Income | | | Distributions
from Net
Realized
Gains | | | Total
Distributions | |
Core Growth Fund — Investor Class | | | | | | | | | | | | | | | | | | | | | | | | | | | | | | | | |
Six Months ended 3/31/14 (unaudited) | | $ | 52.49 | | | | (0.18 | ) | | | 3.18 | | | | 3.00 | | | | — | 4 | | | — | | | | (0.76 | ) | | | (0.76 | ) |
Year ended 9/30/13 | | $ | 41.41 | | | | (0.12 | ) | | | 11.19 | | | | 11.07 | | | | 0.01 | | | | — | | | | — | | | | — | |
Year ended 9/30/12 | | $ | 32.63 | | | | (0.26 | ) | | | 9.04 | | | | 8.78 | | | | — | 4 | | | — | | | | — | | | | — | |
Year ended 9/30/11 | | $ | 29.95 | | | | (0.19 | ) | | | 2.87 | | | | 2.68 | | | | — | 4 | | | — | | | | — | | | | — | |
Year ended 9/30/10 | | $ | 25.88 | | | | 0.03 | | | | 4.05 | | | | 4.08 | | | | — | 4 | | | (0.01 | ) | | | — | | | | (0.01 | ) |
Year ended 9/30/09 | | $ | 26.38 | | | | — | 4 | | | (0.23 | ) | | | (0.23 | ) | | | — | 4 | | | (0.27 | ) | | | — | | | | (0.27 | ) |
Core Growth Fund — Institutional Class | | | | | | | | | | | | | | | | | | | | | | | | | | | | | | | | |
Six Months ended 3/31/14 (unaudited) | | $ | 52.57 | | | | (0.08 | ) | | | 3.10 | | | | 3.02 | | | | — | 4 | | | — | | | | (0.76 | ) | | | (0.76 | ) |
Year ended 9/30/13 | | $ | 41.44 | | | | (0.07 | ) | | | 11.20 | | | | 11.13 | | | | — | 4 | | | — | | | | — | | | | — | |
Period ended 9/30/128 | | $ | 38.32 | | | | (0.16 | ) | | | 3.28 | | | | 3.12 | | | | — | | | | — | | | | — | | | | — | |
Emerging India Fund | | | | | | | | | | | | | | | | | | | | | | | | | | | | | | | | |
Six Months ended 3/31/14 (unaudited) | | $ | 1.78 | | | | (0.01 | ) | | | 0.41 | | | | 0.40 | | | | — | 4 | | | — | | | | — | | | | — | |
Year ended 9/30/13 | | $ | 2.02 | | | | (0.01 | ) | | | (0.23 | ) | | | (0.24 | ) | | | — | 4 | | | — | | | | — | | | | — | |
Year ended 9/30/12 | | $ | 1.83 | | | | (0.01 | ) | | | 0.21 | | | | 0.20 | | | | — | 4 | | | (0.01 | ) | | | — | | | | (0.01 | ) |
Period ended 9/30/1110 | | $ | 2.00 | | | | — | 4 | | | (0.17 | ) | | | (0.17 | ) | | | — | 4 | | | — | | | | — | | | | — | |
Emerging Markets Select Fund — Investor Class | | | | | | | | | | | | | | | | | | | | | | | | | | | | | |
Six Months ended 3/31/14 (unaudited) | | $ | 9.56 | | | | (0.03 | ) | | | 0.33 | | | | 0.30 | | | | — | 4 | | | (0.01 | ) | | | — | | | | (0.01 | ) |
Period ended 9/30/1314 | | $ | 10.00 | | | | — | 4 | | | (0.44 | ) | | | (0.44 | ) | | | — | 4 | | | — | | | | — | | | | — | |
Emerging Markets Select Fund — Institutional Class | | | | | | | | | | | | | | | | | | | | | | | | | | | | | |
Six Months ended 3/31/14 (unaudited) | | $ | 9.61 | | | | (0.03 | ) | | | 0.35 | | | | 0.32 | | | | — | 4 | | | (0.02 | ) | | | — | | | | (0.02 | ) |
Period ended 9/30/1315 | | $ | 10.00 | | | | (— | )4 | | | (0.39 | ) | | | (0.39 | ) | | | — | 4 | | | — | | | | — | | | | — | |
Emerging Markets Small Cap Fund | | | | | | | | | | | | | | | | | | | | | | | | | | | | | | | | |
Six Months ended 3/31/14 (unaudited) | | $ | 2.67 | | | | (0.01 | ) | | | (0.03 | ) | | | (0.04 | ) | | | — | 4 | | | — | | | | (0.06 | ) | | | (0.06 | ) |
Year ended 9/30/13 | | $ | 2.66 | | | | 0.01 | | | | 0.01 | | | | 0.02 | | | | — | 4 | | | (0.01 | ) | | | — | | | | (0.01 | ) |
Year ended 9/30/12 | | $ | 2.16 | | | | 0.01 | | | | 0.49 | | | | 0.50 | | | | — | 4 | | | — | | | | — | | | | — | |
Year ended 9/30/11 | | $ | 2.37 | | | | — | 4 | | | (0.21 | ) | | | (0.21 | ) | | | — | 4 | | | — | 4 | | | — | | | | — | 4 |
Year ended 9/30/10 | | $ | 1.57 | | | | 0.01 | | | | 0.80 | | | | 0.81 | | | | — | 4 | | | (0.01 | ) | | | — | | | | (0.01 | ) |
Year ended 9/30/09 | | $ | 1.24 | | | | — | 4 | | | 0.33 | | | | 0.33 | | | | — | 4 | | | — | 4 | | | — | | | | — | 4 |
Frontier Emerging Small Countries Fund | | | | | | | | | | | | | | | | | | | | | | | | | | | | | | | | |
Six Months ended 3/31/14 (unaudited) | | $ | 2.97 | | | | 0.01 | | | | 0.20 | | | | 0.21 | | | | — | 4 | | | (0.01 | ) | | | — | | | | (0.01 | ) |
Year ended 9/30/13 | | $ | 2.41 | | | | 0.01 | | | | 0.55 | | | | 0.56 | | | | — | 4 | | | — | 4 | | | — | 4 | | | — | 4 |
Period ended 9/30/129 | | $ | 2.00 | | | | 0.01 | | | | 0.40 | | | | 0.41 | | | | — | 4 | | | — | | | | — | | | | — | |
Global Opportunities Fund | | | | | | | | | | | | | | | | | | | | | | | | | | | | | | | | |
Six Months ended 3/31/14 (unaudited) | | $ | 4.58 | | | | (0.03 | ) | | | 0.21 | | | | 0.18 | | | | — | 4 | | | — | 4 | | | (0.48 | ) | | | (0.48 | ) |
Year ended 9/30/13 | | $ | 4.15 | | | | (0.02 | ) | | | 0.93 | | | | 0.91 | | | | — | 4 | | | — | | | | (0.48 | ) | | | (0.48 | ) |
Year ended 9/30/12 | | $ | 3.68 | | | | (0.03 | ) | | | 0.93 | | | | 0.90 | | | | — | 4 | | | — | | | | (0.43 | ) | | | (0.43 | ) |
Year ended 9/30/11 | | $ | 3.97 | | | | (0.02 | ) | | | (0.13 | ) | | | (0.15 | ) | | | — | 4 | | | — | | | | (0.14 | ) | | | (0.14 | ) |
Year ended 9/30/10 | | $ | 3.38 | | | | (0.02 | ) | | | 0.70 | | | | 0.68 | | | | — | 4 | | | (0.01 | ) | | | (0.08 | ) | | | (0.09 | ) |
Period ended 9/30/0913 | | $ | 2.00 | | | | (0.01 | ) | | | 1.39 | | | | 1.38 | | | | — | 4 | | | — | | | | — | | | | — | |
Heritage Growth Fund | | | | | | | | | | | | | | | | | | | | | | | | | | | | | | | | |
Six Months ended 3/31/14 (unaudited) | | $ | 14.91 | | | | (0.01 | ) | | | 1.73 | | | | 1.72 | | | | — | 4 | | | — | | | | (0.38 | ) | | | (0.38 | ) |
Year ended 9/30/13 | | $ | 12.80 | | | | 0.02 | | | | 2.64 | | | | 2.66 | | | | — | 4 | | | (0.01 | ) | | | (0.54 | ) | | | (0.55 | ) |
Year ended 9/30/12 | | $ | 10.83 | | | | (0.03 | ) | | | 2.16 | | | | 2.13 | | | | — | 4 | | | (0.02 | ) | | | (0.14 | ) | | | (0.16 | ) |
Year ended 9/30/11 | | $ | 10.70 | | | | — | 4 | | | 0.22 | | | | 0.22 | | | | — | 4 | | | (0.09 | ) | | | — | | | | (0.09 | ) |
Year ended 9/30/10 | | $ | 9.28 | | | | 0.09 | | | | 1.39 | | | | 1.48 | | | | — | 4 | | | (0.06 | ) | | | — | | | | (0.06 | ) |
Year ended 9/30/09 | | $ | 9.00 | | | | 0.06 | | | | 0.26 | | | | 0.32 | | | | — | 4 | | | (0.02 | ) | | | (0.02 | ) | | | (0.04 | ) |
International Growth Fund | | | | | | | | | | | | | | | | | | | | | | | | | | | | | | | | |
Six Months ended 3/31/14 (unaudited) | | $ | 28.76 | | | | (0.07 | ) | | | 0.58 | | | | 0.51 | | | | — | 4 | | | — | | | | (0.72 | ) | | | (0.72 | ) |
Year ended 9/30/13 | | $ | 22.44 | | | | 0.07 | | | | 6.32 | | | | 6.39 | | | | 0.01 | | | | (0.08 | ) | | | — | | | | (0.08 | ) |
Year ended 9/30/12 | | $ | 17.21 | | | | 0.09 | | | | 5.14 | | | | 5.23 | | | | — | 4 | | | — | | | | — | | | | — | |
Year ended 9/30/11 | | $ | 18.66 | | | | — | 4 | | | (1.46 | ) | | | (1.46 | ) | | | 0.01 | | | | — | | | | — | | | | — | |
Year ended 9/30/10 | | $ | 13.91 | | | | 0.02 | | | | 4.73 | | | | 4.75 | | | | — | 4 | | | — | | | | — | | | | — | |
Year ended 9/30/09 | | $ | 11.83 | | | | (0.13 | ) | | | 2.24 | | | | 2.11 | | | | — | 4 | | | (0.03 | ) | | | — | | | | (0.03 | ) |
International Opportunities Fund | | | | | | | | | | | | | | | | | | | | | | | | | | | | | | | | |
Six Months ended 3/31/14 (unaudited) | | $ | 2.94 | | | | (0.01 | ) | | | 0.21 | | | | 0.20 | | | | — | 4 | | | — | | | | (0.17 | ) | | | (0.17 | ) |
Year ended 9/30/13 | | $ | 2.41 | | | | (— | )4 | | | 0.53 | | | | 0.53 | | | | — | 4 | | | — | | | | — | | | | — | |
Year ended 9/30/12 | | $ | 2.24 | | | | — | 4 | | | 0.44 | | | | 0.44 | | | | — | 4 | | | — | | | | (0.27 | ) | | | (0.27 | ) |
Year ended 9/30/11 | | $ | 2.57 | | | | (0.01 | ) | | | (0.25 | ) | | | (0.26 | ) | | | — | 4 | | | — | | | | (0.07 | ) | | | (0.07 | ) |
Year ended 9/30/10 | | $ | 1.97 | | | | (0.01 | ) | | | 0.63 | | | | 0.62 | | | | — | 4 | | | (0.02 | ) | | | — | | | | (0.02 | ) |
Year ended 9/30/09 | | $ | 1.60 | | | | 0.01 | | | | 0.36 | | | | 0.37 | | | | — | 4 | | | — | 4 | | | — | | | | — | 4 |
See Notes to Financial Highlights and Notes to Financial Statements.
112
| | |
| | (for a share outstanding throughout each period) |
|
|
|
| | | | | | | | | | | | | | | | | | | | | | | | | | | | | | |
| | | | | | |
Ratios to Average Net Assets | | | Supplemental Data | |
Net Asset
Value
End of
Period | | | Total Return (%)1 | | | Expenses
Net of
Waivers and
Reimbursements (%)2 | | | Expenses
Before
Waivers and
Reimbursements (%)2 | | | Net Investment
Income Net of
Waivers and
Reimbursements (%)2 | | | Net Investment
Income Before
Waivers and
Reimbursements (%)2 | | | Net Assets
End of
Period
(000’s) | | | Portfolio
Turnover
Rate1 3 | |
| | | | | | | | | | | | | | | | | | | | | | | | | | | | | | |
| $ | 54.73 | | | | 5.71 | | | | 1.18 | 5 | | | 1.18 | 5 | | | (0.63 | ) | | | (0.63 | ) | | $ | 943,043 | | | | 5% | |
| $ | 52.49 | | | | 26.76 | | | | 1.21 | 5 | | | 1.21 | 5 | | | (0.39 | ) | | | (0.39 | ) | | $ | 924,304 | | | | 16% | |
| $ | 41.41 | | | | 26.91 | | | | 1.23 | 5 | | | 1.23 | 5 | | | (0.70 | ) | | | (0.70 | ) | | $ | 581,371 | | | | 28% | |
| $ | 32.63 | | | | 8.95 | | | | 1.22 | | | | 1.22 | | | | (0.57 | ) | | | (0.57 | ) | | $ | 433,294 | | | | 27% | |
| $ | 29.95 | | | | 15.75 | | | | 1.29 | 11 | | | 1.29 | 11 | | | 0.02 | | | | 0.02 | | | $ | 418,642 | | | | 19% | |
| $ | 25.88 | | | | (0.45 | ) | | | 1.34 | | | | 1.34 | | | | 0.24 | | | | 0.24 | | | $ | 409,949 | | | | 30% | |
| | | | | | | | | | | | | | | | | | | | | | | | | | | | | | |
| $ | 54.83 | | | | 5.74 | | | | 1.12 | 5 | | | 1.17 | 5 | | | (0.58 | ) | | | (0.63 | ) | | $ | 49,277 | | | | 5% | |
| $ | 52.57 | | | | 26.86 | | | | 1.12 | 5 | | | 1.32 | 5 | | | (0.32 | ) | | | (0.52 | )5 | | $ | 19,971 | | | | 16% | |
| $ | 41.44 | | | | 8.14 | | | | 1.12 | 5 | | | 1.55 | 5 | | | (0.62 | ) | | | (1.05 | ) | | $ | 9,101 | | | | 28% | |
| | | | | | | | | | | | | | | | | | | | | | | | | | | | | | |
| $ | 2.18 | | | | 22.47 | | | | 1.95 | 5 | | | 2.59 | 5 | | | (1.32 | ) | | | (1.96 | ) | | $ | 20,162 | | | | 9% | |
| $ | 1.78 | | | | (11.88 | ) | | | 1.95 | 5 | | | 2.99 | 5 | | | (0.99 | ) | | | (2.03 | ) | | $ | 15,938 | | | | 40% | |
| $ | 2.02 | | | | 11.42 | | | | 1.95 | 5 | | | 3.41 | 5 | | | (0.65 | ) | | | (2.11 | ) | | $ | 13,658 | | | | 17% | |
| $ | 1.83 | | | | (8.50 | ) | | | 1.95 | | | | 4.85 | | | | (0.07 | ) | | | (2.97 | ) | | $ | 10,580 | | | | 2% | |
| | | | | | | | | | | | | | | | | | | | | | | | | | | | | | |
| $ | 9.85 | | | | 3.10 | | | | 1.69 | 5 | | | 1.85 | 5 | | | (0.72 | ) | | | (0.88 | ) | | $ | 32,684 | | | | 29% | |
| $ | 9.56 | | | | (4.40 | ) | | | 1.69 | 5 | | | 2.40 | 5 | | | 0.04 | | | | (0.67 | ) | | $ | 29,374 | | | | 43% | |
| | | | | | | | | | | | | | | | | | | | | | | | | | | | | | |
| $ | 9.91 | | | | 3.34 | | | | 1.50 | 5 | | | 1.63 | 5 | | | (0.53 | ) | | | (0.66 | ) | | $ | 31,842 | | | | 29% | |
| $ | 9.61 | | | | (3.90 | ) | | | 1.50 | 5 | | | 2.21 | 5 | | | (0.18 | ) | | | (0.89 | ) | | $ | 28,861 | | | | 43% | |
| | | | | | | | | | | | | | | | | | | | | | | | | | | | | | |
| $ | 2.57 | | | | (1.61 | ) | | | 1.95 | 5 | | | 2.04 | 5 | | | (0.80 | ) | | | (0.89 | ) | | $ | 1,550,460 | | | | 22% | |
| $ | 2.67 | | | | 0.85 | | | | 1.95 | 5 | | | 2.06 | 5 | | | 0.21 | | | | 0.09 | | | $ | 1,785,681 | | | | 41% | |
| $ | 2.66 | | | | 23.15 | | | | 1.95 | 5 | | | 2.13 | 5 | | | 0.29 | | | | 0.11 | | | $ | 1,482,265 | | | | 39% | |
| $ | 2.16 | | | | (8.85 | ) | | | 1.96 | | | | 2.19 | | | | 0.22 | | | | (0.01 | ) | | $ | 774,198 | | | | 48% | |
| $ | 2.37 | | | | 51.69 | | | | 2.06 | 12 | | | 2.39 | 12 | | | 0.82 | | | | 0.49 | | | $ | 446,751 | | | | 23% | |
| $ | 1.57 | | | | 26.80 | | | | 2.10 | | | | 3.03 | | | | 0.12 | | | | (0.81 | ) | | $ | 50,489 | | | | 78% | |
| | | | | | | | | | | | | | | | | | | | | | | | | | | | | | |
| $ | 3.17 | | | | 6.92 | | | | 2.22 | 5 | | | 2.22 | 5 | | | 0.83 | | | | 0.83 | | | $ | 1,120,832 | | | | 3% | |
| $ | 2.97 | | | | 22.88 | | | | 2.25 | 5 | | | 2.43 | 5 | | | 0.81 | | | | 0.63 | | | $ | 730,694 | | | | 13% | |
| $ | 2.41 | | | | 20.50 | | | | 2.25 | 5 | | | 3.64 | 5 | | | 1.31 | | | | (0.08 | ) | | $ | 33,045 | | | | 5% | |
| | | | | | | | | | | | | | | | | | | | | | | | | | | | | | |
| $ | 4.28 | | | | 3.94 | | | �� | 1.76 | 5 | | | 1.76 | 5 | | | (1.06 | ) | | | (1.06 | ) | | $ | 215,201 | | | | 20% | |
| $ | 4.58 | | | | 24.23 | | | | 1.80 | 5 | | | 1.80 | 5 | | | (0.70 | ) | | | (0.70 | ) | | $ | 220,460 | | | | 43% | |
| $ | 4.15 | | | | 26.69 | | | | 1.84 | 5 | | | 1.84 | 5 | | | (0.61 | ) | | | (0.61 | ) | | $ | 153,582 | | | | 38% | |
| $ | 3.68 | | | | (4.21 | ) | | | 1.94 | | | | 1.94 | | | | (0.41 | ) | | | (0.41 | ) | | $ | 199,855 | | | | 59% | |
| $ | 3.97 | | | | 20.41 | | | | 2.25 | 12 | | | 2.33 | 12 | | | (0.73 | ) | | | (0.81 | ) | | $ | 234,904 | | | | 23% | |
| $ | 3.38 | | | | 69.00 | | | | 2.25 | | | | 2.61 | | | | (0.67 | ) | | | (1.03 | ) | | $ | 117,385 | | | | 22% | |
| | | | | | | | | | | | | | | | | | | | | | | | | | | | | | |
| $ | 16.25 | | | | 11.60 | | | | 0.95 | 5 | | | 0.95 | 5 | | | (0.10 | ) | | | (0.10 | ) | | $ | 130,291 | | | | 6% | |
| $ | 14.91 | | | | 21.67 | | | | 0.95 | 5 | | | 0.99 | 5 | | | 0.15 | | | | 0.11 | | | $ | 120,871 | | | | 19% | |
| $ | 12.80 | | | | 19.76 | | | | 0.95 | 5 | | | 1.03 | 5 | | | (0.28 | ) | | | (0.37 | ) | | $ | 111,952 | | | | 26% | |
| $ | 10.83 | | | | 2.01 | | | | 0.95 | | | | 1.04 | | | | (0.02 | ) | | | (0.11 | ) | | $ | 72,561 | | | | 35% | |
| $ | 10.70 | | | | 16.06 | | | | 0.96 | 11 | | | 1.11 | 11 | | | 0.81 | | | | 0.66 | | | $ | 78,274 | | | | 36% | |
| $ | 9.28 | | | | 3.74 | | | | 0.95 | | | | 1.21 | | | | 0.74 | | | | 0.48 | | | $ | 77,194 | | | | 33% | |
| | | | | | | | | | | | | | | | | | | | | | | | | | | | | | |
| $ | 28.55 | | | | 1.74 | | | | 1.44 | 5 | | | 1.44 | 5 | | | (0.53 | ) | | | (0.53 | ) | | $ | 1,655,073 | | | | 14% | |
| $ | 28.76 | | | | 28.63 | | | | 1.49 | 5 | | | 1.49 | 5 | | | 0.25 | | | | 0.25 | | | $ | 1,326,931 | | | | 44% | |
| $ | 22.44 | | | | 30.39 | | | | 1.57 | 6 | | | 1.57 | 6 | | | 0.51 | | | | 0.51 | | | $ | 434,824 | | | | 44% | |
| $ | 17.21 | | | | (7.77 | ) | | | 1.66 | | | | 1.66 | | | | (0.01 | ) | | | (0.01 | ) | | $ | 281,481 | | | | 70% | |
| $ | 18.66 | | | | 34.15 | | | | 1.86 | 12 | | | 1.86 | 12 | | | 0.10 | | | | 0.10 | | | $ | 285,446 | | | | 44% | |
| $ | 13.91 | | | | 18.03 | | | | 1.94 | | | | 1.94 | | | | 0.03 | | | | 0.03 | | | $ | 173,226 | | | | 56% | |
| | | | | | | | | | | | | | | | | | | | | | | | | | | | | | |
| $ | 2.97 | | | | 7.20 | | | | 2.25 | 5 | | | 2.38 | 5 | | | (0.94 | ) | | | (1.07 | ) | | $ | 331,982 | | | | 14% | |
| $ | 2.94 | | | | 21.99 | | | | 2.25 | 5 | | | 2.42 | 5 | | | (0.03 | ) | | | (0.20 | ) | | $ | 278,216 | | | | 49% | |
| $ | 2.41 | | | | 22.33 | | | | 2.25 | 5 | | | 2.48 | 5 | | | (0.16 | ) | | | (0.39 | ) | | $ | 194,563 | | | | 41% | |
| $ | 2.24 | | | | (10.49 | ) | | | 2.25 | | | | 2.55 | | | | (0.58 | ) | | | (0.88 | ) | | $ | 151,569 | | | | 108% | |
| $ | 2.57 | | | | 31.71 | | | | 2.26 | 11 | | | 2.62 | 11 | | | (0.60 | ) | | | (0.96 | ) | | $ | 152,178 | | | | 51% | |
| $ | 1.97 | | | | 23.60 | | | | 2.26 | 6 | | | 2.79 | 6 | | | (0.28 | ) | | | (0.81 | ) | | $ | 93,856 | | | | 69% | |
113
| | |
| WASATCH FUNDS — Financial Highlights (continued) | | |
|
|
|
| | | | | | | | | | | | | | | | | | | | | | | | | | | | | | | | |
| | | | | | Income (Loss) from
Investment Operations | | | | | | | | | Less Distributions | | | | |
| | | Net Asset
Value
Beginning
of Period | | | Net
Investment
Income (Loss) | | | Net Realized
and Unrealized
Gains (Losses)
on Investments | | | Total from
Investment
Operations | | | Redemption
Fees
(See Note 2) | | | Dividends
from Net
Investment
Income | | | Distributions
from Net
Realized
Gains | | | Total
Distributions | |
Large Cap Value Fund — Investor Class | | | | | | | | | | | | | | | | | | | | | | | | | | | | | | | | |
Six Months ended 3/31/14 (unaudited) | | $ | 16.57 | | | | 0.12 | | | | 1.19 | | | | 1.31 | | | | — | 4 | | | (0.12 | ) | | | (5.36 | ) | | | (5.48 | ) |
Year ended 9/30/13 | | $ | 14.31 | | | | 0.22 | | | | 2.37 | | | | 2.59 | | | | — | 4 | | | (0.20 | ) | | | (0.13 | ) | | | (0.33 | ) |
Year ended 9/30/12 | | $ | 11.85 | | | | 0.20 | | | | 2.46 | | | | 2.66 | | | | — | 4 | | | (0.20 | ) | | | — | | | | (0.20 | ) |
Year ended 9/30/11 | | $ | 12.64 | | | | 0.17 | | | | (0.79 | ) | | | (0.62 | ) | | | — | 4 | | | (0.17 | ) | | | — | | | | (0.17 | ) |
Year ended 9/30/10 | | $ | 11.97 | | | | 0.17 | | | | 0.67 | | | | 0.84 | | | | — | 4 | | | (0.17 | ) | | | — | | | | (0.17 | ) |
Year ended 9/30/09 | | $ | 12.93 | | | | 0.20 | | | | (0.96 | ) | | | (0.76 | ) | | | — | 4 | | | (0.20 | ) | | | — | | | | (0.20 | ) |
Large Cap Value Fund — Institutional Class | | | | | | | | | | | | | | | | | | | | | | | | | | | | | |
Six Months ended 3/31/14 (unaudited) | | $ | 16.57 | | | | 0.11 | | | | 1.20 | | | | 1.31 | | | | — | 4 | | | (0.13 | ) | | | (5.36 | ) | | | (5.49 | ) |
Year ended 9/30/13 | | $ | 14.31 | | | | 0.22 | | | | 2.39 | | | | 2.61 | | | | — | 4 | | | (0.22 | ) | | | (0.13 | ) | | | (0.35 | ) |
Period ended 9/30/128 | | $ | 13.77 | | | | 0.12 | | | | 0.57 | | | | 0.69 | | | | — | 4 | | | (0.15 | ) | | | — | | | | (0.15 | ) |
Long/Short Fund — Investor Class | | | | | | | | | | | | | | | | | | | | | | | | | | | | | | | | |
Six Months ended 3/31/14 (unaudited) | | $ | 15.82 | | | | 0.10 | | | | 0.75 | | | | 0.85 | | | | — | 4 | | | — | | | | (0.35 | ) | | | (0.35 | ) |
Year ended 9/30/13 | | $ | 13.66 | | | | (0.04 | ) | | | 2.23 | | | | 2.19 | | | | — | 4 | | | — | | | | (0.03 | ) | | | (0.03 | ) |
Year ended 9/30/12 | | $ | 11.85 | | | | (0.02 | ) | | | 1.83 | | | | 1.81 | | | | — | 4 | | | — | | | | — | | | | — | |
Year ended 9/30/11 | | $ | 11.74 | | | | (0.04 | ) | | | 0.16 | | | | 0.12 | | | | — | 4 | | | (0.01 | ) | | | — | | | | (0.01 | ) |
Year ended 9/30/10 | | $ | 11.13 | | | | (0.01 | ) | | | 0.62 | | | | 0.61 | | | | — | 4 | | | — | 4 | | | — | | | | — | 4 |
Year ended 9/30/09 | | $ | 10.81 | | | | 0.02 | | | | 0.50 | | | | 0.52 | | | | — | 4 | | | (0.05 | ) | | | (0.15 | ) | | | (0.20 | ) |
Long/Short Fund — Institutional Class | | | | | | | | | | | | | | | | | | | | | | | | | | | | | | | | |
Six Months ended 3/31/14 (unaudited) | | $ | 15.83 | | | | 0.11 | | | | 0.74 | | | | 0.85 | | | | — | 4 | | | — | | | | (0.35 | ) | | | (0.35 | ) |
Period ended 9/30/1315 | | $ | 13.80 | | | | (0.01 | ) | | | 2.07 | | | | 2.06 | | | | — | 4 | | | — | | | | (0.03 | ) | | | (0.03 | ) |
Micro Cap Fund | | | | | | | | | | | | | | | | | | | | | | | | | | | | | | | | |
Six Months ended 3/31/14 (unaudited) | | $ | 7.42 | | | | (0.07 | ) | | | 0.73 | | | | 0.66 | | | | — | 4 | | | — | | | | — | | | | — | |
Year ended 9/30/13 | | $ | 5.71 | | | | (0.10 | ) | | | 1.81 | | | | 1.71 | | | | — | 4 | | | — | | | | — | | | | — | |
Year ended 9/30/12 | | $ | 4.40 | | | | (0.09 | ) | | | 1.40 | | | | 1.31 | | | | — | 4 | | | — | | | | — | | | | — | |
Year ended 9/30/11 | | $ | 4.44 | | | | (0.06 | ) | | | 0.02 | | | | (0.04 | ) | | | — | 4 | | | — | | | | — | | | | — | |
Year ended 9/30/10 | | $ | 3.89 | | | | (0.05 | ) | | | 0.60 | | | | 0.55 | | | | — | 4 | | | — | | | | — | | | | — | |
Year ended 9/30/09 | | $ | 4.14 | | | | (0.03 | ) | | | (0.21 | ) | | | (0.24 | ) | | | — | 4 | | | (0.01 | ) | | | — | | | | (0.01 | ) |
Micro Cap Value Fund | | | | | | | | | | | | | | | | | | | | | | | | | | | | | | | | |
Six Months ended 3/31/14 (unaudited) | | $ | 3.45 | | | | (0.02 | ) | | | 0.39 | | | | 0.37 | | | | — | 4 | | | — | | | | (0.57 | ) | | | (0.57 | ) |
Year ended 9/30/13 | | $ | 2.85 | | | | (0.03 | ) | | | 0.91 | | | | 0.88 | | | | — | 4 | | | — | | | | (0.28 | ) | | | (0.28 | ) |
Year ended 9/30/12 | | $ | 2.24 | | | | (0.04 | ) | | | 0.65 | | | | 0.61 | | | | — | 4 | | | — | | | | — | | | | — | |
Year ended 9/30/11 | | $ | 2.38 | | | | (0.04 | ) | | | (0.10 | ) | | | (0.14 | ) | | | — | 4 | | | — | | | | — | | | | — | |
Year ended 9/30/10 | | $ | 2.11 | | | | (0.02 | ) | | | 0.30 | | | | 0.28 | | | | — | 4 | | | (0.01 | ) | | | — | | | | (0.01 | ) |
Year ended 9/30/09 | | $ | 1.80 | | | | (0.02 | ) | | | 0.33 | | | | 0.31 | | | | — | 4 | | | — | | | | — | | | | — | |
Small Cap Growth Fund | | | | | | | | | | | | | | | | | | | | | | | | | | | | | | | | |
Six Months ended 3/31/14 (unaudited) | | $ | 51.31 | | | | (0.22 | ) | | | 3.52 | | | | 3.30 | | | | — | 4 | | | — | | | | (1.68 | ) | | | (1.68 | ) |
Year ended 9/30/13 | | $ | 43.82 | | | | (0.15 | ) | | | 10.53 | | | | 10.38 | | | | — | 4 | | | — | | | | (2.89 | ) | | | (2.89 | ) |
Year ended 9/30/12 | | $ | 35.37 | | | | (0.29 | ) | | | 10.40 | | | | 10.11 | | | | — | 4 | | | — | | | | (1.66 | ) | | | (1.66 | ) |
Year ended 9/30/11 | | $ | 34.24 | | | | (0.13 | ) | | | 1.26 | | | | 1.13 | | | | — | 4 | | | — | | | | — | | | | — | |
Year ended 9/30/10 | | $ | 28.59 | | | | (0.22 | ) | | | 5.87 | | | | 5.65 | | | | — | 4 | | | — | | | | — | | | | — | |
Year ended 9/30/09 | | $ | 26.50 | | | | (0.12 | ) | | | 2.27 | | | | 2.15 | | | | — | 4 | | | — | | | | (0.06 | ) | | | (0.06 | ) |
Small Cap Value Fund — Investor Class | | | | | | | | | | | | | | | | | | | | | | | | | | | | | | | | |
Six Months ended 3/31/14 (unaudited) | | $ | 5.12 | | | | (0.02 | ) | | | 0.71 | | | | 0.69 | | | | — | 4 | | | — | | | | — | | | | — | |
Year ended 9/30/13 | | $ | 3.81 | | | | (0.01 | ) | | | 1.32 | | | | 1.31 | | | | — | 4 | | | — | | | | — | | | | — | |
Year ended 9/30/12 | | $ | 3.12 | | | | (0.03 | ) | | | 0.72 | | | | 0.69 | | | | — | 4 | | | — | | | | — | | | | — | |
Year ended 9/30/11 | | $ | 3.08 | | | | (0.02 | ) | | | 0.06 | | | | 0.04 | | | | — | 4 | | | — | | | | — | | | | — | |
Year ended 9/30/10 | | $ | 2.75 | | | | (0.01 | ) | | | 0.34 | | | | 0.33 | | | | — | 4 | | | — | | | | — | | | | — | |
Year ended 9/30/09 | | $ | 2.82 | | | | (0.01 | ) | | | (0.06 | ) | | | (0.07 | ) | | | — | 4 | | | — | | | | — | | | | — | |
Small Cap Value Fund — Institutional Class | | | | | | | | | | | | | | | | | | | | | | | | | | | | | |
Six Months ended 3/31/14 (unaudited) | | $ | 5.14 | | | | (0.01 | ) | | | 0.71 | | | | 0.70 | | | | — | | | | — | | | | — | | | | — | |
Year ended 9/30/13 | | $ | 3.82 | | | | (0.01 | ) | | | 1.33 | | | | 1.32 | | | | — | 4 | | | — | | | | — | | | | — | |
Period ended 9/30/128 | | $ | 3.68 | | | | (0.01 | ) | | | 0.15 | | | | 0.14 | | | | — | | | | — | | | | — | | | | — | |
Strategic Income Fund | | | | | | | | | | | | | | | | | | | | | | | | | | | | | | | | |
Six Months ended 3/31/14 (unaudited) | | $ | 11.08 | | | | 0.23 | | | | 1.12 | | | | 1.35 | | | | — | 4 | | | (0.18 | ) | | | (0.16 | ) | | | (0.34 | ) |
Year ended 9/30/13 | | $ | 9.30 | | | | 0.33 | | | | 1.78 | | | | 2.11 | | | | — | 4 | | | (0.33 | ) | | | — | | | | (0.33 | ) |
Year ended 9/30/12 | | $ | 7.57 | | | | 0.16 | | | | 1.77 | | | | 1.93 | | | | — | 4 | | | (0.20 | ) | | | — | | | | (0.20 | ) |
Year ended 9/30/11 | | $ | 7.51 | | | | 0.25 | | | | 0.06 | | | | 0.31 | | | | — | 4 | | | (0.25 | ) | | | — | | | | (0.25 | ) |
Year ended 9/30/10 | | $ | 6.77 | | | | 0.31 | | | | 0.70 | | | | 1.01 | | | | — | 4 | | | (0.27 | ) | | | — | | | | (0.27 | ) |
Year ended 9/30/09 | | $ | 7.62 | | | | 0.29 | | | | (0.85 | ) | | | (0.56 | ) | | | — | 4 | | | (0.29 | ) | | | — | | | | (0.29 | ) |
See Notes to Financial Highlights and Notes to Financial Statements.
114
| | |
| | (for a share outstanding throughout each period) |
|
|
|
| | | | | | | | | | | | | | | | | | | | | | | | | | | | | | |
| | | | | | |
Ratios to Average Net Assets | | | Supplemental Data | |
Net Asset
Value
End of
Period | | | Total Return (%)1 | | | Expenses
Net of
Waivers and
Reimbursements (%)2 | | | Expenses
Before
Waivers and
Reimbursements (%)2 | | | Net Investment
Income Net of
Waivers and
Reimbursements (%)2 | | | Net Investment
Income Before
Waivers and
Reimbursements (%)2 | | | Net Assets
End of
Period
(000’s) | | | Portfolio
Turnover
Rate1 3 | |
| | | | | | | | | | | | | | | | | | | | | | | | | | | | | | |
| | $12.40 | | | | 8.39 | | | | 1.12 | 16 | | | 1.16 | 16 | | | 1.44 | | | | 1.40 | | | $ | 573,766 | | | | 30% | |
| | $16.57 | | | | 18.40 | | | | 1.10 | 5 | | | 1.16 | 5 | | | 1.27 | | | | 1.21 | | | $ | 786,910 | | | | 47% | |
| | $14.31 | | | | 22.50 | | | | 1.10 | 5 | | | 1.15 | 5 | | | 1.42 | | | | 1.37 | | | $ | 1,298,365 | | | | 14% | |
| | $11.85 | | | | (5.08 | ) | | | 1.10 | | | | 1.11 | | | | 1.24 | | | | 1.23 | | | $ | 1,546,471 | | | | 26% | |
| | $12.64 | | | | 7.07 | | | | 1.11 | 11 | | | 1.14 | 11 | | | 1.36 | | | | 1.33 | | | $ | 1,621,113 | | | | 17% | |
| | $11.97 | | | | (5.63 | ) | | | 1.10 | | | | 1.22 | | | | 1.93 | | | | 1.81 | | | $ | 1,385,508 | | | | 16% | |
| | | | | | | | | | | | | | | | | | | | | | | | | | | | | | |
| | $12.39 | | | | 8.39 | | | | 0.98 | 5 | | | 1.24 | 5 | | | 1.60 | | | | 1.34 | | | $ | 9,357 | | | | 30% | |
| | $16.57 | | | | 18.54 | | | | 0.98 | 5 | | | 1.35 | 5 | | | 1.37 | | | | 1.00 | | | $ | 15,444 | | | | 47% | |
| | $14.31 | | | | 5.02 | | | | 0.98 | 5 | | | 1.31 | 5 | | | 1.44 | | | | 1.11 | | | $ | 15,511 | | | | 14% | |
| | | | | | | | | | | | | | | | | | | | | | | | | | | | | | |
| | $16.32 | | | | 5.40 | | | | 1.56 | 7 12 | | | 1.56 | 7 12 | | | 1.31 | | | | 1.31 | | | $ | 1,793,797 | | | | 23% | |
| | $15.82 | | | | 16.09 | | | | 1.51 | 7 | | | 1.51 | 7 | | | (0.22 | ) | | | (0.22 | ) | | $ | 1,479,371 | | | | 47% | |
| | $13.66 | | | | 15.27 | | | | 1.51 | 7 | | | 1.51 | 7 | | | (0.20 | ) | | | (0.20 | ) | | $ | 1,537,220 | | | | 71% | |
| | $11.85 | | | | 0.98 | | | | 1.63 | 7 | | | 1.63 | 7 | | | (0.44 | ) | | | (0.44 | ) | | $ | 833,298 | | | | 82% | |
| | $11.74 | | | | 5.52 | | | | 1.71 | 7 12 | | | 1.71 | 7 12 | | | 0.03 | | | | 0.03 | | | $ | 300,255 | | | | 60% | |
| | $11.13 | | | | 5.35 | | | | 1.91 | 7 | | | 1.96 | 7 | | | 0.24 | | | | 0.19 | | | $ | 146,127 | | | | 167% | |
| | | | | | | | | | | | | | | | | | | | | | | | | | | | | | |
| | $16.33 | | | | 5.40 | | | | 1.46 | 7 | | | 1.46 | 7 | | | 1.40 | | | | 1.40 | | | $ | 945,313 | | | | 23% | |
| | $15.83 | | | | 14.99 | | | | 1.39 | 7 | | | 1.40 | 7 | | | (0.16 | ) | | | (0.17 | ) | | $ | 824,780 | | | | 47% | |
| | | | | | | | | | | | | | | | | | | | | | | | | | | | | | |
| | $ 8.08 | | | | 8.89 | | | | 2.03 | 5 | | | 2.03 | 5 | | | (1.68 | ) | | | (1.68 | ) | | $ | 338,978 | | | | 13% | |
| | $ 7.42 | | | | 29.95 | | | | 2.13 | 5 | | | 2.13 | 5 | | | (1.28 | ) | | | (1.28 | ) | | $ | 323,175 | | | | 17% | |
| | $ 5.71 | | | | 29.77 | | | | 2.14 | 5 | | | 2.14 | 5 | | | (1.50 | ) | | | (1.50 | ) | | $ | 289,449 | | | | 25% | |
| | $ 4.40 | | | | (0.90 | ) | | | 2.14 | | | | 2.14 | | | | (1.05 | ) | | | (1.05 | ) | | $ | 253,415 | | | | 30% | |
| | $ 4.44 | | | | 14.14 | | | | 2.18 | 5 | | | 2.18 | 5 | | | (1.10 | ) | | | (1.10 | ) | | $ | 283,551 | | | | 34% | |
| | $ 3.89 | | | | (5.70 | ) | | | 2.24 | | | | 2.24 | | | | (0.96 | ) | | | (0.96 | ) | | $ | 272,537 | | | | 46% | |
| | | | | | | | | | | | | | | | | | | | | | | | | | | | | | |
| | $ 3.25 | | | | 11.12 | | | | 2.11 | 5 | | | 2.12 | 5 | | | (1.12 | ) | | | (1.13 | ) | | $ | 190,608 | | | | 37% | |
| | $ 3.45 | | | | 33.92 | | | | 2.25 | 5 | | | 2.25 | 5 | | | (0.92 | ) | | | (0.92 | ) | | $ | 166,487 | | | | 66% | |
| | $ 2.85 | | | | 27.23 | | | | 2.25 | 5 | | | 2.31 | 5 | | | (1.27 | ) | | | (1.33 | ) | | $ | 138,299 | | | | 78% | |
| | $ 2.24 | | | | (5.88 | ) | | | 2.25 | | | | 2.28 | | | | (1.21 | ) | | | (1.24 | ) | | $ | 142,795 | | | | 94% | |
| | $ 2.38 | | | | 13.26 | | | | 2.26 | 11 | | | 2.37 | 11 | | | (1.32 | ) | | | (1.43 | ) | | $ | 185,587 | | | | 88% | |
| | $ 2.11 | | | | 17.22 | | | | 2.26 | 7 | | | 2.46 | 7 | | | (1.36 | ) | | | (1.56 | ) | | $ | 115,216 | | | | 145% | |
| | | | | | | | | | | | | | | | | | | | | | | | | | | | | | |
| | $52.93 | | | | 6.48 | | | | 1.20 | 5 | | | 1.20 | 5 | | | (0.85 | ) | | | (0.85 | ) | | $ | 2,613,545 | | | | 8% | |
| | $51.31 | | | | 25.34 | | | | 1.23 | 5 | | | 1.23 | 5 | | | (0.42 | ) | | | (0.42 | ) | | $ | 2,487,031 | | | | 10% | |
| | $43.82 | | | | 29.41 | | | | 1.24 | 5 | | | 1.24 | 5 | | | (0.73 | ) | | | (0.73 | ) | | $ | 1,824,781 | | | | 20% | |
| | $35.37 | | | | 3.30 | | | | 1.23 | | | | 1.23 | | | | (0.32 | ) | | | (0.32 | ) | | $ | 1,297,982 | | | | 23% | |
| | $34.24 | | | | 19.76 | | | | 1.27 | 11 | | | 1.27 | 11 | | | (0.74 | ) | | | (0.74 | ) | | $ | 1,110,087 | | | | 17% | |
| | $28.59 | | | | 8.20 | | | | 1.29 | | | | 1.29 | | | | (0.60 | ) | | | (0.60 | ) | | $ | 809,318 | | | | 52% | |
| | | | | | | | | | | | | | | | | | | | | | | | | | | | | | |
| | $ 5.81 | | | | 13.48 | | | | 1.20 | 5 | | | 1.20 | 5 | | | (0.56 | ) | | | (0.56 | ) | | $ | 224,312 | | | | 20% | |
| | $ 5.12 | | | | 34.38 | | | | 1.26 | 5 | | | 1.27 | 5 | | | (0.21 | ) | | | (0.22 | ) | | $ | 201,581 | | | | 40% | |
| | $ 3.81 | | | | 22.12 | | | | 1.46 | 5 | | | 1.46 | 5 | | | (0.73 | ) | | | (0.73 | ) | | $ | 166,330 | | | | 55% | |
| | $ 3.12 | | | | 1.30 | | | | 1.78 | | | | 1.78 | | | | (0.65 | ) | | | (0.65 | ) | | $ | 169,401 | | | | 46% | |
| | $ 3.08 | | | | 12.00 | | | | 1.85 | 11 | | | 1.85 | 11 | | | (0.23 | ) | | | (0.23 | ) | | $ | 211,571 | | | | 62% | |
| | $ 2.75 | | | | (2.48 | ) | | | 1.92 | | | | 1.92 | | | | (0.33 | ) | | | (0.33 | ) | | $ | 218,358 | | | | 89% | |
| | | | | | | | | | | | | | | | | | | | | | | | | | | | | | |
| | $ 5.84 | | | | 13.62 | | | | 1.15 | 5 | | | 1.35 | 5 | | | (0.51 | ) | | | (0.71 | ) | | $ | 10,486 | | | | 20% | |
| | $ 5.14 | | | | 34.55 | | | | 1.15 | 5 | | | 1.46 | 5 | | | (0.11 | ) | | | (0.42 | ) | | $ | 9,359 | | | | 40% | |
| | $ 3.82 | | | | 3.80 | | | | 1.15 | 5 | | | 1.66 | 5 | | | (0.42 | ) | | | (0.93 | ) | | $ | 7,243 | | | | 55% | |
| | | | | | | | | | | | | | | | | | | | | | | | | | | | | | |
| | $12.09 | | | | 12.35 | | | | 0.95 | 5 | | | 0.95 | 5 | | | 4.05 | | | | 4.05 | | | $ | 72,484 | | | | 33% | |
| | $11.08 | | | | 23.01 | | | | 0.95 | 5 | | | 1.06 | 5 | | | 3.16 | | | | 3.05 | | | $ | 66,579 | | | | 54% | |
| | $ 9.30 | | | | 25.61 | | | | 0.95 | 5 | | | 1.14 | 5 | | | 1.74 | | | | 1.55 | | | $ | 44,635 | | | | 57% | |
| | $ 7.57 | | | | 3.94 | | | | 0.95 | | | | 1.21 | | | | 2.99 | | | | 2.73 | | | $ | 24,057 | | | | 62% | |
| | $ 7.51 | | | | 15.18 | | | | 0.99 | 7 12 | | | 1.33 | 7 12 | | | 4.35 | | | | 4.01 | | | $ | 19,517 | | | | 73% | |
| | $ 6.77 | | | | (6.49 | ) | | | 1.05 | 7 | | | 1.71 | 7 | | | 4.93 | | | | 4.27 | | | $ | 17,710 | | | | 84% | |
115
| | |
| WASATCH FUNDS — Financial Highlights (continued) | | |
|
|
|
| | | | | | | | | | | | | | | | | | | | | | | | | | | | | | | | |
| | | | | | Income (Loss) from
Investment Operations | | | | | | | | | Less Distributions | | | | |
| | | Net Asset
Value
Beginning
of Period | | | Net
Investment
Income (Loss) | | | Net Realized
and Unrealized
Gains (Losses)
on Investments | | | Total from
Investment
Operations | | | Redemption
Fees
(See Note 2) | | | Dividends
from Net
Investment
Income | | | Distributions
from Net
Realized
Gains | | | Total
Distributions | |
Ultra Growth Fund | | | | | | | | | | | | | | | | | | | | | | | | | | | | | | | | |
Six Months ended 3/31/14 (unaudited) | | $ | 24.57 | | | | 0.04 | | | | 3.05 | | | | 3.09 | | | | — | 4 | | | — | | | | (1.64 | ) | | | (1.64 | ) |
Year ended 9/30/13 | | $ | 22.83 | | | | (0.15 | ) | | | 4.96 | | | | 4.81 | | | | — | 4 | | | — | | | | (3.07 | ) | | | (3.07 | ) |
Year ended 9/30/12 | | $ | 20.11 | | | | (0.08 | ) | | | 3.98 | | | | 3.90 | | | | — | 4 | | | — | | | | (1.18 | ) | | | (1.18 | ) |
Year ended 9/30/11 | | $ | 19.80 | | | | (0.17 | ) | | | 0.48 | | | | 0.31 | | | | — | 4 | | | — | | | | — | | | | — | |
Year ended 9/30/10 | | $ | 15.66 | | | | (0.15 | ) | | | 4.29 | | | | 4.14 | | | | — | 4 | | | — | | | | — | | | | — | |
Year ended 9/30/09 | | $ | 15.76 | | | | (0.14 | ) | | | 0.04 | | | | (0.10 | ) | | | — | 4 | | | — | | | | — | | | | — | |
World Innovators Fund | | | | | | | | | | | | | | | | | | | | | | | | | | | | | | | | |
Six Months ended 3/31/14 (unaudited) | | $ | 23.15 | | | | (0.09 | ) | | | 1.86 | | | | 1.77 | | | | — | 4 | | | — | | | | (1.20 | ) | | | (1.20 | ) |
Year ended 9/30/13 | | $ | 18.55 | | | | (0.12 | ) | | | 4.72 | | | | 4.60 | | | | — | 4 | | | — | | | | — | | | | — | |
Year ended 9/30/12 | | $ | 14.71 | | | | (0.12 | ) | | | 3.96 | | | | 3.84 | | | | — | 4 | | | — | | | | — | | | | — | |
Year ended 9/30/11 | | $ | 13.65 | | | | (0.13 | ) | | | 1.19 | | | | 1.06 | | | | — | 4 | | | — | | | | — | | | | — | |
Year ended 9/30/10 | | $ | 11.12 | | | | (0.10 | ) | | | 2.65 | | | | 2.55 | | | | — | 4 | | | (0.02 | ) | | | — | | | | (0.02 | ) |
Year ended 9/30/09 | | $ | 10.31 | | | | (0.12 | ) | | | 0.93 | | | | 0.81 | | | | — | 4 | | | — | | | | — | | | | — | |
Income Fund | | | | | | | | | | | | | | | | | | | | | | | | | | | | | | | | |
Six Months ended 3/31/14 (unaudited) | | $ | 10.13 | | | | 0.09 | | | | 0.01 | | | | 0.10 | | | | — | 4 | | | (0.09 | ) | | | — | | | | (0.09 | ) |
Year ended 9/30/13 | | $ | 10.44 | | | | 0.17 | | | | (0.31 | ) | | | (0.14 | ) | | | — | | | | (0.17 | ) | | | — | | | | (0.17 | ) |
Year ended 9/30/12 | | $ | 10.32 | | | | 0.20 | | | | 0.12 | | | | 0.32 | | | | — | 4 | | | (0.20 | ) | | | — | | | | (0.20 | ) |
Year ended 9/30/11 | | $ | 10.34 | | | | 0.25 | | | | (0.02 | ) | | | 0.23 | | | | — | 4 | | | (0.25 | ) | | | — | | | | (0.25 | ) |
Year ended 9/30/10 | | $ | 10.04 | | | | 0.29 | | | | 0.30 | | | | 0.59 | | | | — | 4 | | | (0.29 | ) | | | — | | | | (0.29 | ) |
Year ended 9/30/09 | | $ | 9.59 | | | | 0.33 | | | | 0.46 | | | | 0.79 | | | | — | 4 | | | (0.34 | ) | | | — | | | | (0.34 | ) |
U.S. Treasury Fund | | | | | | | | | | | | | | | | | | | | | | | | | | | | | | | | |
Six Months ended 3/31/14 (unaudited) | | $ | 15.33 | | | | 0.23 | | | | 0.49 | | | | 0.72 | | | | — | 4 | | | (0.23 | ) | | | — | | | | (0.23 | ) |
Year ended 9/30/13 | | $ | 18.75 | | | | 0.44 | | | | (3.08 | ) | | | (2.64 | ) | | | 0.01 | | | | (0.44 | ) | | | (0.35 | ) | | | (0.79 | ) |
Year ended 9/30/12 | | $ | 18.75 | | | | 0.42 | | | | 0.77 | | | | 1.19 | | | | 0.01 | | | | (0.42 | ) | | | (0.78 | ) | | | (1.20 | ) |
Year ended 9/30/11 | | $ | 17.17 | | | | 0.52 | | | | 2.63 | | | | 3.15 | | | | 0.02 | | | | (0.52 | ) | | | (1.07 | ) | | | (1.59 | ) |
Year ended 9/30/10 | | $ | 16.29 | | | | 0.54 | | | | 1.35 | | | | 1.89 | | | | 0.01 | | | | (0.54 | ) | | | (0.48 | ) | | | (1.02 | ) |
Year ended 9/30/09 | | $ | 14.95 | | | | 0.55 | | | | 1.29 | | | | 1.84 | | | | 0.05 | | | | (0.55 | ) | | | — | | | | (0.55 | ) |
See Notes to Financial Highlights and Notes to Financial Statements.
116
| | |
| | (for a share outstanding throughout each period) |
|
|
|
| | | | | | | | | | | | | | | | | | | | | | | | | | | | |
| | | | | |
Ratios to Average Net Assets | | | Supplemental Data | |
Net Asset
Value
End of
Period | | Total Return (%)1 | | | Expenses
Net of
Waivers and
Reimbursements (%)2 | | | Expenses
Before
Waivers and
Reimbursements (%)2 | | | Net Investment
Income Net of
Waivers and
Reimbursements (%)2 | | | Net Investment
Income Before
Waivers and
Reimbursements (%)2 | | | Net Assets
End of
Period
(000’s) | | | Portfolio
Turnover
Rate1 3 | |
| | | | | | | | | | | | | | | | | | | | | | | | | | | | |
| $26.02 | | | 12.85 | | | | 1.23 | 5 | | | 1.23 | 5 | | | (0.96 | ) | | | (0.96 | ) | | $ | 118,285 | | | | 17% | |
| $24.57 | | | 24.52 | | | | 1.29 | 5 | | | 1.29 | 5 | | | (0.64 | ) | | | (0.64 | ) | | $ | 151,697 | | | | 25% | |
| $22.83 | | | 20.13 | | | | 1.32 | 5 | | | 1.32 | 5 | | | (0.35 | ) | | | (0.35 | ) | | $ | 143,259 | | | | 43% | |
| $20.11 | | | 1.57 | | | | 1.42 | | | | 1.42 | | | | (0.51 | ) | | | (0.51 | ) | | $ | 134,203 | | | | 60% | |
| $19.80 | | | 26.44 | | | | 1.68 | 11 | | | 1.68 | 11 | | | (1.14 | ) | | | (1.14 | ) | | $ | 178,566 | | | | 45% | |
| $15.66 | | | (0.63 | ) | | | 1.75 | | | | 1.77 | | | | (1.12 | ) | | | (1.14 | ) | | $ | 121,284 | | | | 64% | |
| | | | | | | | | | | | | | | | | | | | | | | | | | | | |
| $23.72 | | | 7.64 | | | | 1.71 | 5 | | | 1.71 | 5 | | | (1.05 | ) | | | (1.05 | ) | | $ | 316,401 | | | | 49% | |
| $23.15 | | | 24.80 | | | | 1.77 | 5 | | | 1.79 | 5 | | | (0.84 | ) | | | (0.86 | ) | | $ | 266,911 | | | | 84% | |
| $18.55 | | | 26.10 | | | | 1.85 | 5 | | | 1.85 | 5 | | | (0.99 | ) | | | (0.99 | ) | | $ | 167,934 | | | | 66% | |
| $14.71 | | | 7.77 | | | | 1.95 | | | | 1.95 | | | | (0.84 | ) | | | (0.84 | ) | | $ | 72,493 | | | | 85% | |
| $13.65 | | | 22.91 | | | | 1.96 | 11 | | | 2.05 | 11 | | | (0.74 | ) | | | (0.83 | ) | | $ | 65,767 | | | | 74% | |
| $11.12 | | | 7.86 | | | | 1.95 | | | | 2.14 | | | | (0.88 | ) | | | (1.07 | ) | | $ | 59,540 | | | | 41% | |
| | | | | | | | | | | | | | | | | | | | | | | | | | | | |
| $10.14 | | | 1.00 | | | | 0.70 | 5 | | | 0.70 | 5 | | | 1.74 | | | | 1.74 | | | $ | 122,285 | | | | 4% | |
| $10.13 | | | (1.34 | ) | | | 0.71 | | | | 0.71 | | | | 1.67 | | | | 1.67 | | | $ | 130,285 | | | | 35% | |
| $10.44 | | | 3.16 | | | | 0.70 | 5 | | | 0.70 | 5 | | | 1.97 | | | | 1.97 | | | $ | 139,186 | | | | 48% | |
| $10.32 | | | 2.26 | | | | 0.71 | | | | 0.71 | | | | 2.42 | | | | 2.42 | | | $ | 135,617 | | | | 43% | |
| $10.34 | | | 5.95 | | | | 0.72 | 12 | | | 0.73 | 12 | | | 2.87 | | | | 2.86 | | | $ | 138,095 | | | | 51% | |
| $10.04 | | | 8.42 | | | | 0.84 | | | | 0.88 | | | | 3.44 | | | | 3.40 | | | $ | 114,496 | | | | 28% | |
| | | | | | | | | | | | | | | | | | | | | | | | | | | | |
| $15.82 | | | 4.72 | | | | 0.72 | 5 | | | 0.72 | 5 | | | 2.87 | | | | 2.87 | | | $ | 192,060 | | | | 13% | |
| $15.33 | | | (14.43 | ) | | | 0.71 | 5 | | | 0.71 | 5 | | | 2.46 | | | | 2.46 | | | $ | 193,231 | | | | 34% | |
| $18.75 | | | 6.66 | | | | 0.72 | 5 | | | 0.72 | 5 | | | 2.33 | | | | 2.33 | | | $ | 271,495 | | | | 13% | |
| $18.75 | | | 22.06 | | | | 0.75 | | | | 0.76 | | | | 3.44 | | | | 3.43 | | | $ | 187,368 | | | | 44% | |
| $17.17 | | | 12.65 | | | | 0.75 | 12 | | | 0.78 | 12 | | | 3.56 | | | | 3.53 | | | $ | 200,855 | | | | 49% | |
| $16.29 | | | 12.49 | | | | 0.75 | | | | 0.79 | | | | 3.34 | | | | 3.30 | | | $ | 154,099 | | | | 62% | |
117
| | |
| WASATCH FUNDS — Notes to Financial Highlights | | MARCH 31, 2014 (UNAUDITED) |
|
|
|
| 1 | Not annualized for periods less than one year. |
| 2 | Annualized for periods less than one year. |
| 3 | Portfolio turnover is calculated on the basis of the Fund as a whole without distinguishing between the classes of shares issued. |
| 4 | Represents amounts less than $.005 per share. |
| 5 | Includes interest expense of less than 0.01%. |
| 6 | Includes interest expenses of 0.01%. |
| 7 | Includes interest expense and dividend payments for securities sold short. The ratios excluding such expenses are listed below: |
| | | | | | | | | | |
| | | Expenses Net of
Waivers and
Reimbursements2 | | Expenses Before
Waivers and
Reimbursements2 |
Long/Short Fund — Investor Class | | | | | | | | | | |
Six Months ended 3/31/14 (unaudited) | | | | 1.26% | | | | | 1.26% | |
Year ended 9/30/13 | | | | 1.28% | | | | | 1.28% | |
Year ended 9/30/12 | | | | 1.27% | | | | | 1.27% | |
Year ended 9/30/11 | | | | 1.30% | | | | | 1.30% | |
Year ended 9/30/10 | | | | 1.34% | 12 | | | | 1.34% | 12 |
Year ended 9/30/09 | | | | 1.47% | | | | | 1.52% | |
| | |
Long/Short Fund — Institutional Class | | | | | | | | | | |
Six Months ended 3/31/14 (unaudited) | | | | 1.16% | | | | | 1.16% | |
Period ended 9/30/1315 | | | | 1.17% | | | | | 1.18% | |
| | |
Micro Cap Value Fund | | | | | | | | | | |
Year ended 9/30/09 | | | | 2.25% | | | | | 2.45% | |
| | |
Strategic Income Fund | | | | | | | | | | |
Year ended 9/30/10 | | | | 0.95% | 12 | | | | 1.29% | 12 |
Year ended 9/30/09 | | | | 0.95% | | | | | 1.61% | |
| 8 | Institutional class inception date was January 31, 2012. |
| 9 | Fund inception date was January 31, 2012. |
| 10 | Fund inception date was April 26, 2011. |
| 11 | Includes extraordinary expenses of 0.01% (see Note 8). |
| 12 | Includes extraordinary expenses of less than 0.01% (see Note 8). |
| 13 | Fund inception date was November 17, 2008. |
| 14 | Fund inception date was December 13, 2012. |
| 15 | Institutional class inception date was December 13, 2012. |
| 16 | Includes extraordinary expenses of 0.02% (see Note 8). |
See Notes to Financial Statements.
118
| | |
| WASATCH FUNDS — Notes to Financial Statements | | MARCH 31, 2014 (UNAUDITED) |
|
|
|
1. ORGANIZATION
Wasatch Funds Trust (the “Trust”) is a Massachusetts business trust registered under the Investment Company Act of 1940, as amended (the “1940 Act”), as an open-end management investment company and consists of 20 series or funds (each a “Fund” and collectively the “Funds”). The Core Growth Fund, Emerging Markets Small Cap Fund, Global Opportunities Fund, Heritage Growth Fund, International Growth Fund, International Opportunities Fund, Large Cap Value Fund, Long/Short Fund, Micro Cap Fund, Micro Cap Value Fund, Small Cap Growth Fund, Small Cap Value Fund, Strategic Income Fund, Ultra Growth Fund, World Innovators Fund, Wasatch-1st Source Income Fund (“Income Fund”) (sub-advised), and Wasatch-Hoisington U.S. Treasury Fund (“U.S. Treasury Fund”) (sub-advised) are each diversified funds. The Emerging India Fund, Emerging Markets Select Fund and Frontier Emerging Small Countries Fund are non-diversified funds. Each Fund maintains its own investment objective.
On November 9, 2011, the Trust re-designated the shares of the Funds into Investor Class shares effective January 31, 2012, and authorized and designated a new Institutional Class of shares in the Funds. Currently, five funds offer Institutional Class shares: Core Growth Fund, Large Cap Value Fund and Small Cap Value Fund, which commenced operations on January 31, 2012, as well as the Emerging Markets Select Fund and Long/Short Fund, which commenced operations on December 13, 2012. Each class of shares for each Fund has identical rights and privileges except with respect to purchase minimums, distribution and service charges, shareholder services, voting rights on matters affecting a single class of shares, and the exchange and conversion features. The Funds have entered into an investment advisory agreement with Wasatch Advisors, Inc. (the “Advisor” or “Wasatch”) as investment advisor.
The Core Growth, Emerging India, Emerging Markets Select, Emerging Markets Small Cap, Frontier Emerging Small Countries, Global Opportunities, Heritage Growth, International Growth, International Opportunities, Large Cap Value, Long/Short, Micro Cap, Micro Cap Value, Small Cap Growth, Small Cap Value, Strategic Income, Ultra Growth and World Innovators Funds are referred to herein as the “Equity Funds.”
2. SIGNIFICANT ACCOUNTING POLICIES
The following is a summary of significant policies related to investments of the Funds held at March 31, 2014. These policies are in conformity with accounting principles generally accepted in the United States of America (“U.S. GAAP”).
Valuation of Securities — All investments in securities are recorded at their estimated fair value as described in Note 14.
Foreign Currency Translations — Values of investments denominated in foreign currencies are converted into U.S. dollars using the current exchange rates each business day. Purchases and sales of investments and dividend income are translated into U.S. dollars using the current prevailing exchange rate on the transaction date. The effect of changes
in foreign exchange rates on realized and unrealized gains or losses on securities is reflected as a component of such gains or losses. Transactions in foreign denominated assets may involve greater risks than domestic transactions.
Investment in Securities and Related Investment Income — Security transactions are accounted for on the trade date. Gains or losses on securities sold are determined on the identified cost basis. Dividend income and distributions to shareholders are recorded on the ex-dividend date, except that certain dividends from foreign securities may be recorded after the ex-dividend date based on when the Fund is informed of the dividend. Interest income and estimated expenses are accrued daily. Bond discount and premiums are amortized using the interest method. To the extent dividends received include return of capital or capital gain distributions; such distributions are recorded as a reduction to cost of the related security or as realized gain/loss.
Expenses — The Funds contract for various services on a collective basis. Most expenses are directly attributable to each Fund and therefore are charged accordingly. Expenses that are not directly attributable to one Fund are allocated among applicable Funds on an equitable and consistent basis considering such things as the nature and type of expense and the relative net assets of the Funds.
Use of Management Estimates — The preparation of financial statements in conformity with U.S. GAAP requires management to make estimates and assumptions that affect the reported amounts of assets and liabilities at the date of the financial statements and the reported changes in net assets during the reporting period. Actual results could differ from those estimates.
Guarantees and Indemnifications — In the normal course of business, the Funds enter into contracts that contain a variety of representations and warranties which provide general indemnifications. The maximum exposure under these arrangements is unknown, as this would involve future claims that may be made against the Funds and/or their affiliates that have not yet occurred. Based on experience, however, the risk of loss is expected to be remote.
Redemption Fees — The Funds deduct a fee of 2.00% from redemption proceeds on shares of the Funds held 60 days or less. Redemption fees retained by the Funds are credited to additional paid-in capital.
New Accounting Pronouncements — In June 2013, FASB issued an update (“ASU 2013-08”) to ASC Topic 946, Financial Services — Investment Companies (“Topic 946”). ASU 2013-08 amends the guidance in Topic 946 for determining whether an entity qualifies as an investment company and requires certain additional disclosures. ASU 2013-08 is effective for interim and annual reporting periods in fiscal years that begin after December 15, 2013. At this time, management is evaluating the implications of ASU 2013-08 and its impact to financial statements.
Other — Income, expenses, and realized and unrealized gains or losses on investments are allocated to each class of shares based on its relative net assets, except that each class separately bears expenses related specifically to that class, such as certain shareholder servicing fees.
119
| | |
| WASATCH FUNDS — Notes to Financial Statements (continued) | | |
|
|
|
3. SECURITIESAND OTHER INVESTMENTS
Repurchase Agreements — The Funds may engage in repurchase transactions. Under the terms of a typical repurchase agreement, a fund takes possession of an underlying debt obligation subject to an obligation of the seller to repurchase and the fund to resell the obligation at an agreed upon price and time. The market value of the collateral must be at least equal at all times to the total amount of the repurchase obligation, including interest. Generally, in the event of counterparty default, the fund has the right to use the collateral to offset losses incurred. Refer to Note 15 (Offsetting) for more information about the offsetting of assets and liabilities.
Short Sales — The Long/Short Fund and to a lesser extent the other Equity Funds may enter into short sales whereby a fund sells a security it generally does not own (the security is borrowed), in anticipation of a decline in the security’s price. The initial amount of a short sale is recorded as a liability which is marked-to-market daily. Fluctuations in the value of the short liability are recorded as unrealized gains or losses. If a Fund shorts a security when also holding a long position in the security (a “short against the box”), as the security’s price declines, the short position increases in value, offsetting the long position’s decrease in value. The opposite effect occurs if the security’s price rises. A Fund realizes a gain or loss upon closing of the short sale (returning the security to the counterparty by way of purchase or delivery of a long position owned). Possible losses from short sales may be unlimited, whereas losses from security purchases cannot exceed the total amount invested. The Funds are liable to the buyer for any dividends payable on securities while those securities are in a short position. These dividends are an expense of the Funds. The Funds designate collateral consisting of cash, U.S. government securities or other liquid assets sufficient to collateralize the market value of short positions. Refer to Note 15 (Offsetting) for more information about the offsetting of assets and liabilities.
Participation Notes — The Frontier Emerging Small Countries and the Global Opportunities Funds invest in Participation Notes (P-Notes). P-Notes are promissory notes that are designed to offer a return linked to the performance of a particular underlying equity security or market. P-Notes are issued by banks or broker-dealers and allow a fund to gain exposure to common stocks in markets where direct investment is not allowed, such as Saudi Arabia. While the holder of a P-Note is entitled to receive from the bank or broker-dealer any dividends or other distributions paid on the underlying securities, the holder is not entitled to the same rights as an owner of the underlying securities, such as voting rights. Income received from P-Notes is recorded as dividend income in the Statement of Operations. P-Notes are considered general unsecured contractual obligations of the bank or broker-dealer. Risks associated with P-Notes include the possible failure of a counterparty (i.e., the issuing bank or broker-dealer) to perform in accordance with the terms of the agreement, inability to transfer or liquidate the notes, potential delays or
an inability to redeem the notes before maturity under certain market conditions, and limited legal recourse against the issuer of the underlying common stock.
4. FINANCIAL DERIVATIVE INSTRUMENTS
Foreign Currency Contracts — The Funds may enter into foreign currency contracts to settle planned purchases or sales of securities or to protect against a possible loss resulting from the adverse change in the relationship between the U.S. dollar and a foreign currency involved in an underlying transaction. Foreign currency contracts are agreements between two parties to buy and sell a currency at a set price on a future date. The market value of a foreign currency contract fluctuates with changes in currency exchange rates. Foreign currency contracts are marked-to-market daily and the change in market value is recorded by a fund as unrealized appreciation or depreciation. When a foreign currency contract is closed, the fund records a realized gain or loss equal to the difference between the value at the time it was opened and the value at the time it was closed. These contracts may involve market risk in excess of the unrealized gain or loss reflected in the Schedule of Investments. In addition, a fund could be exposed to credit risk if a counterparty is unable or unwilling to meet the terms of the contracts or if the value of the currency changes unfavorably. In connection with these contracts, the Funds may segregate cash and/or securities in a sufficient amount as collateral in accordance with the terms of the respective contracts.
Options Transactions — The Equity Funds and the Income Fund may buy and sell put and call options and write covered put and call options, including over-the-counter options, on portfolio securities where the completion of the obligation is dependent upon the credit standing of another party. Options are a type of derivative financial instrument. The Funds may invest in derivative financial instruments, including options, in order to manage risk or gain exposure to various other investments or markets. The risk in writing a call option is that a fund gives up the opportunity for profit if the market price of the security increases. The risk in writing a put option is that a fund may incur a loss if the market price of the security decreases and the option is exercised. The risk in buying an option is that a fund pays a premium whether or not the option is exercised. A fund also has the additional risk of not being able to enter into a closing transaction if a liquid secondary market does not exist. Possible losses from uncovered written options may be unlimited. Option contracts are valued daily and unrealized appreciation or depreciation is recorded. A fund will realize a gain or loss upon expiration or closing of the option transaction. When an option is exercised, the proceeds on sales for a written call option, the purchase cost for a written put option, or the cost of a security for a purchased put or call option is adjusted by the amount of premium received or paid. The Funds designate collateral consisting of cash, U.S. government securities or other liquid assets sufficient to collateralize the market value of written options. Refer to Note 15 (Offsetting) for more information about the offsetting of assets and liabilities.
120
| | |
| | MARCH 31, 2014 (UNAUDITED) |
|
|
|
Options written activity during the period ended March 31, 2014 was as follows:
| | | | | | | | | | | | | | | | | | | | | | | | |
| | | Options
Outstanding at
9/30/2013 | | | Written | | | Closed | | | Exercised | | | Expired | | | Options
Outstanding at
3/31/14 | |
Long/Short Fund | | | | | | | | | | | | | | | | | | | | | | | | |
Premium amount | | $ | 6,528,848 | | | $ | 6,653,123 | | | $ | (8,064,027 | ) | | $ | (3,616,506 | ) | | $ | (1,501,438 | ) | | $ | — | |
Number of contracts | | | 8,031 | | | | 14,353 | | | | (3,257 | ) | | | (11,879 | ) | | | (7,248 | ) | | | — | |
Micro Cap Value Fund | | | | | | | | | | | | | | | | | | | | | | | | |
Premium amount | | $ | 61,910 | | | $ | 1,384,799 | | | $ | (498,954 | ) | | $ | (402,113 | ) | | $ | (89,788 | ) | | $ | 455,854 | |
Number of contracts | | | 150 | | | | 6,945 | | | | (1,550 | ) | | | (2,400 | ) | | | (505 | ) | | | 2,640 | |
5. DISTRIBUTIONS
Dividends from net investment income and net realized gains, if any, are declared and paid at least annually for all Funds, except for dividends from net investment income in four funds. The Income Fund declares and pays dividends monthly. The Large Cap Value, Strategic Income and U.S. Treasury Funds declare and pay dividends quarterly. The amount of dividends and distributions from net investment income and net realized gains are determined in accordance with federal income tax regulations, which may differ from U.S. GAAP. The Funds may utilize earnings and profits distributed to shareholders on redemption of shares as part of the dividends paid deduction (tax equalization).
To the extent these book and tax differences are permanent in nature, such amounts are reclassified at the end of the fiscal year among additional paid-in capital, undistributed net investment income (loss), and undistributed net realized gain (loss) on investments, options and foreign currency translations.
6. PURCHASESAND SALESOF SECURITIES
Cost of investment securities purchased and proceeds from sales of investment securities, excluding U.S. government and short-term securities, for the period ended March 31, 2014 are summarized below:
| | | | | | | | | | | | | | | | | | | | | | | | | | | | |
| | | Core
Growth
Fund | | | Emerging
India
Fund | | | Emerging
Markets
Select
Fund | | | Emerging
Markets
Small Cap
Fund | | | Frontier
Emerging
Small Countries
Fund | | | Global
Opportunities
Fund | | | Heritage
Growth
Fund | |
Purchases | | $ | 78,110,431 | | | $ | 4,444,505 | | | $ | 20,137,339 | | | $ | 374,827,211 | | | $ | 296,919,293 | | | $ | 43,483,793 | | | $ | 6,748,734 | |
Sales | | | 48,754,244 | | | | 1,439,549 | | | | 16,896,674 | | | | 582,387,249 | | | | 26,299,505 | | | | 53,349,287 | | | | 13,965,132 | |
| | | | | | | |
| | | International
Growth
Fund | | | International
Opportunities
Fund | | | Large Cap
Value
Fund | | | Long/Short
Fund | | | Micro
Cap
Fund | | | Micro Cap
Value
Fund | | | Small Cap
Growth
Fund | |
Purchases | | $ | 442,256,160 | | | $ | 60,224,831 | | | $ | 205,668,924 | | | $ | 735,715,462 | | | $ | 42,359,673 | | | $ | 62,108,153 | | | $ | 251,724,560 | |
Sales | | | 194,757,314 | | | | 43,093,969 | | | | 458,361,156 | | | | 484,929,512 | | | | 48,884,024 | | | | 63,848,212 | | | | 198,889,025 | |
| | | | | | | |
| | | Small Cap
Value
Fund | | | Strategic
Income
Fund | | | Ultra
Growth
Fund | | | World
Innovators
Fund | | | Income Fund | | | | | | | |
Purchases | | $ | 42,399,867 | | | $ | 20,958,350 | | | $ | 26,053,906 | | | $ | 155,678,727 | | | $ | 1,829,147 | | | | | | | | | |
Sales | | | 51,134,749 | | | | 25,003,686 | | | | 75,687,046 | | | | 132,152,885 | | | | 8,318,375 | | | | | | | | | |
Purchases and sales of U.S. government securities in the Income Fund were $2,875,813 and $6,087,489, respectively. Purchases and sales of U.S. government securities in the U.S. Treasury Fund were $23,978,780 and $31,927,973, respectively.
7. FEDERAL INCOME TAX INFORMATION
It is each Fund’s policy to comply with the requirements of the Internal Revenue Code applicable to regulated investment companies and to distribute substantially all taxable income to shareholders. The Funds are no longer subject to examination by tax authorities for years prior to 2010. At this time, management believes there are no uncertain tax positions which, based on their technical merit, would not be sustained upon examination and for which it is reasonably possible that the total of amounts of unrecognized tax benefits will significantly change in the next 12 months. Accordingly, no provision for federal income or excise taxes has been made.
121
| | |
| WASATCH FUNDS — Notes to Financial Statements (continued) | | |
|
|
|
As of March 31, 2014 the cost and unrealized appreciation (depreciation) of securities on a tax basis were as follows:
| | | | | | | | | | | | | | | | | | | | | | | | | | | | |
| | | Core
Growth
Fund | | | Emerging
India
Fund | | | Emerging
Markets
Select
Fund | | | Emerging
Markets
Small Cap
Fund | | | Frontier
Emerging
Small
Countries
Fund | | | Global
Opportunities
Fund | | | Heritage
Growth
Fund | |
Cost | | $ | 647,586,470 | | | $ | 16,307,924 | | | $ | 61,668,298 | | | $ | 1,404,344,696 | | | $ | 1,013,145,382 | | | $ | 152,614,760 | | | $ | 78,361,139 | |
| | | | |
Gross appreciation | | $ | 372,735,408 | | | $ | 4,031,287 | | | $ | 5,519,054 | | | $ | 249,954,344 | | | $ | 146,421,125 | | | $ | 66,555,550 | | | $ | 52,690,339 | |
Gross (depreciation) | | | (27,265,357 | ) | | | (301,649 | ) | | | (2,692,544 | ) | | | (103,513,282 | ) | | | (38,962,523 | ) | | | (3,618,842 | ) | | | (626,135 | ) |
| | | | |
Net appreciation | | $ | 345,470,051 | | | $ | 3,729,638 | | | $ | 2,826,510 | | | $ | 146,441,062 | | | $ | 107,458,602 | | | $ | 62,936,708 | | | $ | 52,064,204 | |
| | | | |
| | | | | | | |
| | | International
Growth
Fund | | | International
Opportunities
Fund | | | Large Cap
Value
Fund | | | Long/Short
Fund | | | Micro
Cap
Fund | | | Micro Cap
Value
Fund | | | Small Cap
Growth
Fund | |
Cost | | $ | 1,389,671,237 | | | $ | 263,364,875 | | | $ | 500,051,849 | | | $ | 2,108,717,759 | | | $ | 199,983,876 | | | $ | 145,774,708 | | | $ | 1,600,143,835 | |
| | | | |
Gross appreciation | | $ | 299,735,393 | | | $ | 80,644,464 | | | $ | 89,289,164 | | | $ | 378,365,607 | | | $ | 151,120,763 | | | $ | 50,190,112 | | | $ | 1,055,614,833 | |
Gross (depreciation) | | | (32,418,860 | ) | | | (12,331,490 | ) | | | (5,044,562 | ) | | | (43,720,303 | ) | | | (11,371,296 | ) | | | (4,199,913 | ) | | | (35,688,016 | ) |
| | | | |
Net appreciation | | $ | 267,316,533 | | | $ | 68,312,974 | | | $ | 84,244,602 | | | $ | 334,645,304 | | | $ | 139,749,467 | | | $ | 45,990,199 | | | $ | 1,019,926,817 | |
| | | | |
| | | | | | | |
| | | Small Cap
Value
Fund | | | Strategic
Income
Fund | | | Ultra
Growth
Fund | | | World
Innovators
Fund | | | Income
Fund | | | U.S.
Treasury
Fund | | | | |
Cost | | $ | 168,409,201 | | | $ | 61,093,008 | | | $ | 88,698,956 | | | $ | 271,504,148 | | | $ | 121,462,462 | | | $ | 185,320,302 | | | | | |
| | | | | | | | |
Gross appreciation | | $ | 68,781,910 | | | $ | 11,670,196 | | | $ | 36,155,909 | | | $ | 56,564,921 | | | $ | 2,181,855 | | | $ | 11,674,696 | | | | | |
Gross (depreciation) | | | (3,713,867 | ) | | | (688,875 | ) | | | (7,256,332 | ) | | | (5,579,233 | ) | | | (1,134,915 | ) | | | (4,945,240 | ) | | | | |
| | | | | | | | |
Net appreciation | | $ | 65,068,043 | | | $ | 10,981,321 | | | $ | 28,899,577 | | | $ | 50,985,688 | | | $ | 1,046,940 | | | $ | 6,729,456 | | | | | |
| | | | | | | | |
The difference between book-basis and tax-basis unrealized gains are primarily attributable to the tax deferral of losses on wash sales, unrealized appreciation on passive foreign investment companies and other temporary tax adjustments.
The amount and character of tax-basis distributions and composition of net assets are finalized at fiscal year-end; accordingly, tax basis balances have not been determined as of the date of this report.
Capital loss carryforwards are available through the date specified below to offset future realized net capital gains for federal income tax purposes. Future capital loss carryover utilization in any given year may be subject to Internal Revenue Code limitations. To the extent future gains are offset by capital loss carryforwards, such gains will not be distributed.
On December 22, 2010, The Regulated Investment Company Modernization Act of 2010 (the “Modernization Act”) was signed by the President of the United States of America. Under the Modernization Act, a Fund will be permitted to carry forward capital losses incurred in taxable years beginning after December 22, 2010 for an unlimited period. Post-enactment losses that are carried forward will retain their character as either short-term or long-term capital losses rather than being considered all short-term as under previous law. However, any losses incurred during those future taxable years will be required to be utilized prior to the losses incurred in pre-enactment taxable years, which carry an expiration date. As a result of this ordering rule, pre-enactment capital loss carryforwards may be more likely to expire unused.
Capital loss carryforwards as of September 30, 2013 are as follows:
| | | | | | | | | | | | | | | | | | | | |
| | | | | | | | | | | | Non-expiring | |
| Fund | | 2016 | | | 2017 | | | 2018 | | | Short Term | | | Long Term | |
Emerging India Fund | | $ | — | | | $ | — | | | $ | — | | | $ | 610,632 | | | $ | 303,055 | |
Emerging Markets Select Fund | | | — | | | | — | | | | — | | | | 1,780,133 | | | | — | |
Frontier Emerging Small Countries Fund | | | — | | | | — | | | | — | | | | 1,786,407 | | | | — | |
Micro Cap Fund | | | — | | | | — | | | | 24,405,083 | | | | — | | | | — | |
Small Cap Value Fund | | | — | | | | 2,713,135 | | | | 63,852,620 | | | | — | | | | — | |
Income Fund | | | 471,800 | | | | — | | | | — | | | | — | | | | — | |
122
| | |
| | MARCH 31, 2014 (UNAUDITED) |
|
|
|
The Funds have elected to defer losses incurred from November 1, 2012 through September 30, 2013 in accordance with federal income tax rules. These losses are treated as having arisen on the first day of the following fiscal year. The Funds have elected to defer losses as follows:
| | | | | | | | |
| Fund | | Post-October
Capital Losses | | | Late-year Ordinary
Losses | |
Core Growth Fund | | $ | — | | | $ | 2,843,118 | |
Emerging India Fund | | | 145,741 | | | | 90,999 | |
Emerging Markets Small Cap Fund | | | — | | | | 4,825,729 | |
Global Opportunities Fund | | | — | | | | 1,195,946 | |
International Growth Fund | | | | | | | 8,009,380 | |
International Opportunities Fund | | | — | | | | 441,867 | |
Micro Cap Fund | | | — | | | | 3,180,093 | |
Small Cap Value Fund | | | — | | | | 897,752 | |
Ultra Growth Fund | | | — | | | | 398,483 | |
World Innovators Fund | | | — | | | | 1,847,561 | |
U.S. Treasury Fund | | | 5,745,809 | | | | — | |
During the tax year ended September 30, 2013, the Funds used capital loss carryforwards in the following amounts:
| | | | |
| Fund | | Amount Used | |
Core Growth Fund | | $ | 35,409,803 | |
Emerging Markets Small Cap Fund | | | 22,744,667 | |
International Growth Fund | | | 26,489,129 | |
International Opportunities Fund | | | 6,940,313 | |
Micro Cap Fund | | | 16,967,788 | |
Small Cap Value Fund | | | 28,200,957 | |
Strategic Income Fund | | | 4,928,087 | |
World Innovators Fund | | | 7,263,424 | |
Income Fund | | | 262,968 | |
8. RELATED PARTY TRANSACTIONS
Investment Advisory Fees, Expense Limitations — As the Funds’ investment advisor, the Advisor receives a monthly fee calculated on average daily net assets. The Advisor has contractually agreed to waive its fees and/or reimburse certain Funds should a Fund’s operating expenses exceed a specified annual limitation through at least January 31, 2015. If operating expenses are less than the specified expense limit for the Fund, the Advisor shall be entitled to reimbursement of the fees waived or reduced to the extent that the operating expenses and the amounts reimbursed do not exceed such expense limit for the Fund, under the period of the agreement (currently the 12 months commencing January 31, 2014). Such reimbursement shall be paid only while the expense limitation agreement is in effect and only if such amount paid, together with all other amounts reimbursed under this agreement in the fiscal year, do not cause the Fund to exceed the expense limitation. All amounts not recovered at the end of the period expire on January 31, 2015. Ordinary operating expenses exclude any interest, dividend expense on short sales/interest expense, taxes, brokerage commissions, other investment-related costs and extraordinary expenses, such as litigation and other expenses not incurred in the ordinary course of the Funds’ business. The costs of the Proxy Statement related to the identification and shareholder approval of Trustee Nominees were treated as extraordinary expenses in the 2010 fiscal year. The impact of these payments is reflected in the net expense ratios in the Financial Highlights. In late October of 2013, it was discovered that the Long/Short Fund and Large Cap Value Fund had a 12b-1 receivable on the books which dated back to 2008 prior to the conversion of the 1st Source Funds to Wasatch Funds. It was determined the amount should be written off as an extraordinary expense and posted to other expenses. The balance for the Large Cap Value Fund was $70,993 and the Long/Short Fund was $8,622. The impact of these write-offs is reflected in “Other expenses” on the Statements of Operations and in the Financial Highlights. Investment advisory fees and fees waived, if any, for the period ended March 31, 2014 are disclosed in the Statements of Operations. Investment advisory fee and expense limitation annual rates are shown below.
| | | | | | | | | | | | | | | | | | | | |
| Fund | | Advisory
Fee | | | Expense
Limitation
Investor Class | | | Expense
Limitation
Institutional Class | | | Contractual Expense
Limitation/
Reimbursement
Recoverable
Expiration Date | | | Reimbursement
Recoverable | |
Core Growth Fund | | | 1.00% | | | | 1.50% | | | | 1.12% | | | | 01/31/2015 | | | $ | 2,440 | |
Emerging India Fund | | | 1.50% | | | | 1.95% | | | | N/A | | | | 01/31/2015 | | | | 17,177 | |
Emerging Markets Select Fund | | | 1.25% | | | | 1.69% | | | | 1.50% | | | | 01/31/2015 | | | | 19,066 | |
Emerging Markets Small Cap Fund | | | 1.75% | | | | 1.95% | | | | N/A | | | | 01/31/2015 | | | | 2,188,820 | |
Frontier Emerging Small Countries Fund | | | 1.75% | | | | 2.25% | | | | N/A | | | | 01/31/2015 | | | | — | |
123
| | |
| WASATCH FUNDS — Notes to Financial Statements (continued) | | |
|
|
|
| | | | | | | | | | | | | | | | | | | | |
| Fund | | Advisory
Fee | | | Expense
Limitation
Investor Class | | | Expense
Limitation
Institutional Class | | | Contractual Expense
Limitation/
Reimbursement
Recoverable
Expiration Date | | | Reimbursement
Recoverable | |
Global Opportunities Fund | | | 1.50% | | | | 1.95% | | | | N/A | | | | 01/31/2015 | | | $ | — | |
Heritage Growth Fund | | | 0.70% | | | | 0.95% | | | | N/A | | | | 01/31/2015 | | | | — | |
International Growth Fund | | | 1.25% | | | | 1.75% | | | | N/A | | | | 01/31/2015 | | | | — | |
International Opportunities Fund | | | 1.95% | | | | 2.25% | | | | N/A | | | | 01/31/2015 | | | | 86,608 | |
Large Cap Value Fund | | | 0.90% | | | | 1.10% | | | | 0.98% | | | | 01/31/2015 | | | | 36,072 | |
Long/Short Fund | | | 1.10% | | | | N/A | | | | 1.17% | | | | 01/31/2015 | | | | — | |
Micro Cap Fund | | | 1.75% | | | | 1.95% | | | | N/A | | | | 01/31/2015 | | | | — | |
Micro Cap Value Fund | | | 1.75% | | | | 1.95% | | | | N/A | | | | 01/31/2015 | | | | 9,890 | |
Small Cap Growth Fund | | | 1.00% | | | | 1.50% | | | | N/A | | | | 01/31/2015 | | | | 10,485 | |
Small Cap Value Fund | | | 1.00% | | | | 1.50% | | | | 1.15% | | | | 01/31/2015 | | | | 32,013 | |
Strategic Income Fund | | | 0.70% | | | | 0.95% | | | | N/A | | | | 01/31/2015 | | | | 272 | |
Ultra Growth Fund | | | 1.00% | | | | 1.50% | | | | N/A | | | | 01/31/2015 | | | | — | |
World Innovators Fund | | | 1.50% | | | | 1.95% | | | | N/A | | | | 01/31/2015 | | | | 33,084 | |
Income Fund | | | 0.55% | | | | N/A | | | | N/A | | | | N/A | | | | N/A | |
U.S. Treasury Fund | | | 0.50% | | | | 0.75% | | | | N/A | | | | 01/31/2015 | | | | — | |
Affiliated Trades — Certain Funds are permitted to purchase or sell securities from or to certain related affiliated funds under specified conditions outlined in procedures adopted by the Board of Trustees. The procedures have been designed to ensure that any purchase or sale of securities by the Funds from or to another fund (or funds) that are, or could be, considered an affiliate by virtue of having a common investment advisor (or affiliated investment advisors), common Trustees and/or common officers complies with Rule 17a-7 of the 1940 Act. Further, each transaction is effected at the current market price, as that term is defined under the procedures. During the period ended March 31, 2014, the Funds had no purchases or sales of securities pursuant to Rule 17a-7 of the 1940 Act.
Institutional Class Legal Fees — As disclosed in the annual report dated September 30, 2011, the Board approved a multi-class plan pursuant to which the Board has established and designated two classes for each series known as Institutional Class shares and Investor Class shares. The Advisor paid the legal costs associated with the establishment and designation of the new share classes for existing funds.
Payments by Advisor — During the 2012 fiscal year the Advisor discovered a trade allocation error involving several of the Wasatch Funds. In August 2012, the Advisor reimbursed the Global Opportunities Fund $1,167, the Micro Cap Fund $1,074, the Micro Cap Value Fund $1,282, the Small Cap Growth Fund $46,199, the Ultra Growth Fund $940 and the World Innovators Fund $437 as reimbursement for the error plus interest.
During the 2013 fiscal year the Advisor paid audit, legal and printing fees related to Prospectus changes in the Emerging Markets Small Cap, Small Cap Growth, Small Cap Value and World Innovators Funds. In addition, the Advisor paid the 2012 audit fee of $2,000 per Institutional Class for the Core Growth, Large Cap Value and Small Cap Value Funds. The Advisor also paid PricewaterhouseCoopers’ invoices related to the tax lot matching error in the Strategic Income Fund and the initial legal fees to set up the Long/Short Fund Institutional Class. The Advisor does not intend to be reimbursed for these amounts.
On February 20, 2013, the Advisor discovered a trade error involving the Frontier Emerging Small Countries Fund. The Advisor reimbursed the Fund $4,421.
The impact of the payments detailed above is reflected in the net expense ratios in the Financial Highlights.
10% Shareholders — As of March 31, 2014, the Funds had individual shareholder accounts and/or omnibus shareholder accounts (comprised of a group of individual shareholders), which individually amounted to more than 10% of the total shares outstanding of the Fund as detailed below:
| | | | | | | | |
| | | Number of
Accounts | | | % of Shares
Outstanding | |
Core Growth Fund | | | 2 | | | | 58.13 | % |
Emerging India Fund | | | 1 | | | | 47.59 | % |
Emerging Markets Select Fund | | | 3 | | | | 88.53 | % |
Emerging Markets Small Cap Fund | | | 2 | | | | 60.61 | % |
Frontier Emerging Small Countries Fund | | | 2 | | | | 76.28 | % |
Global Opportunities Fund | | | 2 | | | | 65.05 | % |
Heritage Growth Fund | | | 2 | | | | 47.09 | % |
International Growth Fund | | | 2 | | | | 55.84 | % |
International Opportunities Fund | | | 1 | | | | 56.97 | % |
Large Cap Value Fund | | | 3 | | | | 78.08 | % |
Long/Short Fund | | | 2 | | | | 68.92 | % |
Micro Cap Fund | | | 2 | | | | 27.95 | % |
Micro Cap Value Fund | | | 2 | | | | 50.63 | % |
Small Cap Growth Fund | | | 2 | | | | 53.06 | % |
124
| | |
| | MARCH 31, 2014 (UNAUDITED) |
|
|
|
| | | | | | | | |
| | | Number of
Accounts | | | % of Shares
Outstanding | |
Small Cap Value Fund | | | 2 | | | | 36.65 | % |
Strategic Income Fund | | | 4 | | | | 70.31 | % |
Ultra Growth Fund | | | 2 | | | | 29.16 | % |
World Innovators Fund | | | 2 | | | | 46.53 | % |
Income Fund | | | 3 | | | | 81.41 | % |
U.S. Treasury Fund | | | 3 | | | | 64.24 | % |
Affiliated Interests — As of March 31, 2014, Wasatch Advisors, Inc. and its affiliates, and the retirement plans of Wasatch Advisors, Inc. and its affiliates, held shares which may be redeemed at any time as detailed below:
| | | | | | | | |
| | | Number of
Accounts* | | | % of Shares
Outstanding | |
Core Growth Fund | | | 15 | | | | 0.41 | % |
Emerging India Fund | | | 19 | | | | 27.47 | % |
Emerging Markets Select Fund | | | 15 | | | | 5.22 | % |
Emerging Markets Small Cap Fund | | | 20 | | | | 0.36 | % |
Frontier Emerging Small Countries Fund | | | 29 | | | | 0.71 | % |
Global Opportunities Fund | | | 22 | | | | 1.77 | % |
Heritage Growth Fund | | | 10 | | | | 3.44 | % |
International Growth Fund | | | 15 | | | | 0.37 | % |
International Opportunities Fund | | | 23 | | | | 2.43 | % |
Large Cap Value Fund | | | 12 | | | | 0.21 | % |
Long/Short Fund | | | 15 | | | | 0.17 | % |
Micro Cap Fund | | | 11 | | | | 0.77 | % |
Micro Cap Value Fund | | | 14 | | | | 1.86 | % |
Small Cap Growth Fund | | | 20 | | | | 1.29 | % |
Small Cap Value Fund | | | 8 | | | | 1.70 | % |
Strategic Income Fund | | | 6 | | | | 18.46 | % |
Ultra Growth Fund | | | 8 | | | | 1.71 | % |
World Innovators Fund | | | 9 | | | | 1.26 | % |
Income Fund | | | 2 | | | | 0.01 | % |
U.S. Treasury Fund | | | 6 | | | | 0.83 | % |
| * | Multiple accounts with the same beneficial owner are treated as one account. |
Payments by Former Service Provider — BISYS Fund Services, Inc. (“BISYS”) is a former service provider to the Large Cap Value Fund, Long/Short Fund and Income Fund. In August 2010, these funds received a one-time payment from the BISYS Fair Fund (a fund established pursuant to a settlement between the SEC and BISYS that requires, among other things, a distribution of settlement monies from the Fair Fund to benefit affected mutual funds). The impact of these payments is reflected in the net expense ratios in the Financial Highlights.
9. TRANSACTIONSWITH AFFILIATES
If a Fund’s holding represents ownership of 5% or more of the voting securities of a company, the company is deemed to be an affiliate as defined by the 1940 Act. The following Funds conducted transactions during the period ended March 31, 2014 with an “affiliated company” as so defined:
| | | | | | | | | | | | | | | | | | | | | | | | |
| | | Share Activity | | | Dividends
Credited to
Income for the
period ended
3/31/14 | | | Gain (Loss)
Realized on
Sale of Shares
for the
period ended
3/31/14 | |
| | | Balance
9/30/13 | | | Purchases /
Additions | | | Sales /
Reductions | | | Balance
3/31/14 | | | |
Emerging Markets Small Cap Fund | | | | | | | | | | | | | | | | | | | | | | | | |
KONA I Co. Ltd.* | | | 584,258 | | | | — | | | | 75,400 | | | | 508,858 | | | $ | 86,458 | | | $ | (136,403 | ) |
|
| |
International Growth Fund | | | | | | | | | | | | | | | | | | | | | | | | |
Diligent Board Member Services, Inc. | | | 4,104,359 | | | | 575,000 | | | | — | | | | 4,679,359 | | | $ | — | | | $ | — | |
|
| |
Long/Short Fund | | | | | | | | | | | | | | | | | | | | | | | | |
Silicon Graphics International Corp.** | | | 2,330,509 | | | | 490,429 | | | | — | | | | 2,820,938 | | | $ | — | | | $ | — | |
Swift Energy Co. | | | 1,706,994 | | | | 1,486,230 | | | | — | | | | 3,193,224 | | | | — | | | | — | |
|
| |
Micro Cap Fund | | | | | | | | | | | | | | | | | | | | | | | | |
Goldwater Bank, N.A. | | | 154,000 | | | | — | | | | — | | | | 154,000 | | | $ | — | | | $ | — | |
|
| |
125
| | |
| WASATCH FUNDS — Notes to Financial Statements (continued) | | |
|
|
|
| | | | | | | | | | | | | | | | | | | | | | | | |
| | | Share Activity | | | Dividends
Credited to
Income for the
period ended
3/31/14 | | | Gain (Loss)
Realized on
Sale of Shares
for the
period ended
3/31/14 | |
| | | Balance
9/30/13 | | | Purchases /
Additions | | | Sales /
Reductions | | | Balance
3/31/14 | | | |
Small Cap Growth Fund | | | | | | | | | | | | | | | | | | | | | | | | |
Blue Nile, Inc. | | | 999,639 | | | | — | | | | — | | | | 999,639 | | | $ | — | | | $ | — | |
Chefs’ Warehouse, Inc. (The) | | | 745,076 | | | | 566,072 | | | | — | | | | 1,311,148 | | | | — | | | | — | |
IPC The Hospitalist Co., Inc. | | | 678,732 | | | | 351,001 | | | | — | | | | 1,029,733 | | | | — | | | | — | |
Knight Transportation, Inc. | | | 4,792,398 | | | | 137,370 | | | | — | | | | 4,929,768 | | | | 583,330 | | | | — | |
zooplus AG | | | 308,302 | | | | — | | | | — | | | | 308,302 | | | | — | | | | — | |
| *This | security is no longer an affiliate as of 3/31/2014. |
| **On | March 5, 2014, a Schedule 13D was filed for Silicon Graphics International Corp. (“the Company”) on behalf of the Advisor and the Wasatch Long/Short Fund, including the portfolio managers Michael L. Shinnick and Ralph C. Shive (“Reporting Persons”). |
10. RESTRICTED SECURITIES
The Funds may own investments that were purchased through private placement transactions or under Rule 144A of the Securities Act of 1933 (the “Securities Act”) and cannot be sold without prior registration under the Securities Act or may be limited due to certain restrictions. These securities are generally deemed to be illiquid and are valued at fair value as determined by a designated Pricing Committee of the Advisor (“Pricing Committee”), comprised of personnel of the Advisor, with oversight by the Board of Trustees and in accordance with Board-approved Pricing Policies and Procedures. If and when such securities are registered, the costs of registering such securities are paid by the issuer. At March 31, 2014, the Funds held the following restricted securities:
| | | | | | | | | | | | | | | | |
| | | Security
Type | | Acquisition
Date | | Cost | | | Fair Value | | | Value as %
of Net Assets | |
Global Opportunities Fund | | | | | | | | | | | | | | | | |
Cardica, Inc. | | Warrants | | 9/25/09 | | $ | 5,000 | | | $ | 400 | | | | — | |
|
| |
Micro Cap Fund | | | | | | | | | | | | | | | | |
Cardica, Inc. | | Warrants | | 9/25/09 | | $ | 40,313 | | | $ | 3,225 | | | | — | |
Goldwater Bank, N.A. | | Common Stock | | 2/28/07 | | | 1,540,000 | | | | 47,740 | | | | 0.02 | % |
| | | | | | | | |
| | | | | | $ | 1,580,313 | | | $ | 50,965 | | | | 0.02 | % |
|
| |
Micro Cap Value Fund | | | | | | | | | | | | | | | | |
Acetylon Pharmaceuticals, Inc., Series B | | Preferred Stock | | 2/3/11 - 5/25/12 | | $ | 499,999 | | | $ | 1,366,314 | | | | 0.72 | % |
Cardica, Inc. | | Warrants | | 9/25/09 | | | 13,813 | | | | 1,105 | | | | — | |
Goldwater Bank, N.A. | | Common Stock | | 2/28/07 | | | 419,000 | | | | 12,989 | | | | 0.01 | % |
Idaho Trust Bancorp | | Common Stock | | 8/30/06 | | | 500,004 | | | | 200,557 | | | | 0.11 | % |
| | | | | | | | |
| | | | | | $ | 1,432,816 | | | $ | 1,580,965 | | | | 0.84 | % |
|
| |
Small Cap Growth Fund | | | | | | | | | | | | | | | | |
DocuSign, Inc. Series B Preferred | | Preferred Stock | | 3/3/14 | | $ | 437,256 | | | $ | 437,256 | | | | 0.02 | % |
DocuSign, Inc. Series B-1 Preferred | | Preferred Stock | | 3/3/14 | | | 130,983 | | | | 130,983 | | | | 0.01 | % |
DocuSign, Inc. Series D Preferred | | Preferred Stock | | 3/3/14 | | | 313,930 | | | | 313,930 | | | | 0.01 | % |
DocuSign, Inc. Series E Preferred | | Preferred Stock | | 3/3/14 | | | 8,117,819 | | | | 8,117,819 | | | | 0.31 | % |
Drilling Info Holdings, Inc., Series B | | Preferred Stock | | 9/5/13 | | | 15,350,001 | | | | 15,350,001 | | | | 0.59 | % |
Greenspring Global Partners II-B, L.P. | | LP Interest | | 10/10/03 - 12/16/13 | | | 3,273,929 | | | | 3,119,543 | | | | 0.12 | % |
Greenspring Global Partners III-B, L.P. | | LP Interest | | 3/16/06 - 12/16/13 | | | 1,356,685 | | | | 1,326,583 | | | | 0.05 | % |
Nanosys, Inc., Series D | | Preferred Stock | | 11/8/05 | | | 2,000,000 | | | | 632,475 | | | | 0.02 | % |
Nanosys, Inc., Series E | | Preferred Stock | | 8/13/10 | | | 184,939 | | | | 192,902 | | | | 0.01 | % |
| | | | | | | | |
| | | | | | $ | 31,165,542 | | | $ | 29,621,492 | | | | 1.14 | % |
|
| |
Strategic Income Fund | | | | | | | | | | | | | | | | |
Redcorp Ventures Ltd., 13.00%, 7/11/12 | | Corporate Bonds | | 7/5/07 | | $ | 152,584 | | | $ | 1,215 | | | | — | |
Star Asia Financial Ltd. | | Common Stock | | 2/22/07 - 3/19/10 | | | 305,812 | | | | 231,214 | | | | 0.32 | % |
| | | | | | | | |
| | | | | | $ | 458,396 | | | $ | 232,429 | | | | 0.32 | % |
|
| |
126
| | |
| | MARCH 31, 2014 (UNAUDITED) |
|
|
|
| | | | | | | | | | | | | | | | |
| | | Security
Type | | Acquisition
Date | | Cost | | | Fair Value | | | Value as %
of Net Assets | |
Ultra Growth Fund | | | | | | | | | | | | | | | | |
Cardica, Inc. | | Warrants | | 9/25/09 | | $ | 20,625 | | | $ | 1,650 | | | | 0.00 | % |
Data Sciences International, Inc., Series B | | Preferred Stock | | 1/20/06 | | | 475,001 | | | | 727,559 | | | | 0.62 | % |
Drilling Info Holdings, Inc., Series B | | Preferred Stock | | 9/5/13 | | | 1,150,001 | | | | 1,150,001 | | | | 0.97 | % |
Greenspring Global Partners II-B, L.P. | | LP Interest | | 10/10/03 - 12/16/13 | | | 2,946,531 | | | | 2,807,583 | | | | 2.37 | % |
Greenspring Global Partners III-B, L.P. | | LP Interest | | 3/16/06 - 12/16/13 | | | 1,356,685 | | | | 1,326,583 | | | | 1.12 | % |
Nanosys, Inc., Series D | | Preferred Stock | | 11/8/05 | | | 500,001 | | | | 158,119 | | | | 0.13 | % |
Nanosys, Inc., Series E | | Preferred Stock | | 8/13/10 | | | 46,235 | | | | 48,226 | | | | 0.04 | % |
TherOx, Inc., Series I | | Preferred Stock | | 7/7/05 | | | 1,000,000 | | | | 2,439 | | | | — | |
Xtera Communications, Inc. | | Common Stock | | 9/3/03 | | | 99,065 | | | | 914 | | | | — | |
| | | | | | | | |
| | | | | | $ | 7,594,144 | | | $ | 6,223,074 | | | | 5.25 | % |
|
| |
World Innovators Fund | | | | | | | | | | | | | | | | |
Cardica, Inc. | | Warrants | | 9/25/09 | | $ | 8,937 | | | $ | 715 | | | | — | |
Greenspring Global Partners II-B, L.P. | | LP Interest | | 10/10/03 - 12/16/13 | | | 327,391 | | | | 311,953 | | | | 0.10 | % |
Xtera Communications, Inc. | | Common Stock | | 9/3/03 | | | 7,076 | | | | 65 | | | | — | |
| | | | | | | | |
| | | | | | $ | 343,404 | | | $ | 312,733 | | | | 0.10 | % |
11. PURCHASE COMMITMENTS
In September 2003, the Small Cap Growth, Ultra Growth and World Innovators Funds entered into subscription agreements to acquire limited partnership interests in Greenspring Global Partners II-B, L.P. The remaining commitment amounts at March 31, 2014 were $250,000, $225,000 and $25,000, respectively.
In December 2005, the Small Cap Growth and Ultra Growth Funds entered into subscription agreements to acquire limited partnership interests in Greenspring Global Partners III-B, L.P. The remaining commitment amounts at March 31, 2014 were $105,000, per Fund.
Securities held by the Funds have been designated to meet these purchase commitments as indicated in the Schedules of Investments.
12. LINEOF CREDIT
The Equity Funds opened two lines of credit totaling $75,000,000, one of which is $25,000,000 uncommitted, and the other of which is $50,000,000 committed, with State Street Bank and Trust Company on June 4, 2007 (together, the “Line”). As of May 25, 2012, the Board approved use of the Line by all funds in the Trust. The Line is for temporary or emergency purposes such as to provide liquidity for shareholder redemptions. The Funds incur commitment fees on the undrawn portion of the committed part of the Line, and interest expense to the extent of amounts drawn (borrowed) under the entire Line. Interest is based on the higher of (a) the Federal Funds rate as in effect on the date of borrowing, plus a margin, or (b) the overnight London Interbank Offered Rate (LIBOR) as in effect on the date of borrowing, plus a margin. Commitment fees are pro-rated among the Funds based upon relative average net assets. Interest expense is charged directly to a fund based upon actual amounts borrowed by the Fund.
For the period ended March 31, 2014, the following Funds had borrowings:
| | | | | | | | | | | | | | | | | | | | |
| | | Average Daily
Borrowings | | | Number of
Days
Outstanding | | | Interest
Expense | | | Weighted
Average
Annualized
Interest Rate | | | Balance at
3/31/14 | |
Emerging India Fund | | $ | 151,666 | | | | 32 | | | | 147 | | | | 1.09 | % | | $ | — | |
Emerging Markets Select Fund | | | 1,900,577 | | | | 4 | | | | 230 | | | | 1.09 | % | | | — | |
Emerging Markets Small Cap Fund | | | 6,163,472 | | | | 19 | | | | 3,547 | | | | 1.09 | % | | | — | |
Frontier Emerging Small Countries Fund | | | 520,297 | | | | 4 | | | | 63 | | | | 1.09 | % | | | — | |
Global Opportunities Fund | | | 1,726,635 | | | | 20 | | | | 1,046 | | | | 1.09 | % | | | 79,395 | |
Large Cap Value Fund | | | 9,843,474 | | | | 17 | | | | 5,094 | | | | 1.10 | % | | | — | |
Ultra Growth Fund | | | 2,969,246 | | | | 11 | | | | 989 | | | | 1.09 | % | | | 435,825 | |
127
| | |
| WASATCH FUNDS — Notes to Financial Statements (continued) | | |
|
|
|
13. PRINCIPAL RISKS
Market and Credit Risk — In the normal course of business the Funds trade financial instruments and enter into financial transactions where risk of loss exists due to changes in the market (market risk) or failure of the other party to a transaction to perform (credit risk). Similar to credit risk, the Funds may be exposed to counterparty risk, or the risk that an institution or other entity with which the Funds have unsettled or open transactions will default. The potential loss could exceed the value of the financial assets recorded in the financial statements. Financial assets, which potentially expose the Funds to credit risk, consist principally of cash due from counterparties and investments. The extent of the Funds’ exposure to credit and counterparty risks with respect to these financial assets approximates their carrying value as recorded in the Funds’ Statements of Assets and Liabilities.
Non-Diversification Risk — A non-diversified fund can invest a larger portion of its assets in the stocks of a limited number of companies than a diversified fund, which means it may have more exposure to the price movements of a single security or small group of securities than funds that diversify their investments among many companies. The Emerging India, Emerging Markets Select and Frontier Emerging Small Countries Funds are non-diversified.
Inflation Risk — Inflation risk is the possibility that inflation will reduce the purchasing power of a currency, and subsequently reduce the value of a security or asset, and may result in rising interest rates. Inflation is the overall upward price movement of goods and services in an economy that causes the value of a currency to decline.
Interest Rate Risk — Interest rate risk is the risk that fixed income securities will decline in value because of changes in interest rates. A rise in interest rates typically causes a fall in values. Interest rate risk should be modest for shorter-term securities, moderate for intermediate-term securities and high for longer-term securities. Generally, an increase in the average maturity of a fund will make it more sensitive to interest rate risk. The interest rate is the amount charged, expressed as a percentage of principal, by a lender to a borrower for the use of assets.
Foreign Currency Risk — If a fund invests directly in foreign currencies or in securities that trade in, and receive revenues in, foreign currencies, or in derivatives that provi de exposure to foreign currencies, it will be subject to the risk that those currencies will decline in value relative to the U.S. dollar. This also includes the risk associated with higher transaction costs, delayed settlements, currency controls and adverse economic developments related to foreign investments.
Region Risk — The Funds, except the U.S. Treasury Fund, invest in equity and fixed income securities of non-U.S. issuers. Although the Funds maintain diversified investment portfolios, political or economic developments within a particular country or region may have an adverse effect on the ability of domiciled issuers to meet their obligations. These risks are exaggerated for securities of issuers tied economically to emerging and frontier market countries. Additionally, political or economic developments
may have an adverse effect on the liquidity and volatility of portfolio securities and currency holdings.
Shareholder Concentration Risk — A significant portion of the net assets of the Frontier Emerging Small Countries Fund and International Opportunities Fund are owned by a group of shareholders advised by a common investment advisor. If this group of shareholders simultaneously redeems on the advice of their investment advisor, Fund expenses may increase and performance may be materially affected. However, the Advisor has contractually agreed to waive its fees and/or reimburse both the Frontier Emerging Small Countries Fund and the International Opportunities Fund should their operating expenses exceed 2.25% through at least January 31, 2015. The Emerging Markets Select Fund also has a significant portion of net assets concentrated in relatively few related accounts. The Advisor has contractually agreed to waive its fees and/or reimburse the Emerging Markets Select Fund should operating expenses exceed 1.69% for the Investor Class and 1.50% for the Institutional Class through at least January 31, 2015.
14. FAIR VALUE MEASUREMENTSAND INVESTMENTS
The fair value of a financial instrument is the amount that would be received to sell an asset or paid to transfer a liability in an orderly transaction between market participants at the measurement date. The Funds use various methods to measure the fair value of their investments on a recurring basis. U.S. GAAP established a hierarchy that prioritizes inputs to valuation methods. The three levels of inputs are:
| | Ÿ | | Level 1 — Unadjusted quoted prices in active markets for identical assets or liabilities that the Funds have the ability to access. |
| | Ÿ | | Level 2 — Observable inputs other than quoted prices included in Level 1 that are observable for the asset or liability, either directly or indirectly. The inputs may include quoted prices for the identical investment on an inactive market, prices for similar investments, interest rates, prepayment speeds, credit risk, yield curves, default rates and similar data. |
| | Ÿ | | Level 3 — Unobservable inputs for the asset or liability, to the extent relevant observable inputs are not available, representing the Funds’ own assumptions about the assumptions a market participant would use in valuing the asset or liability, and would be based on the best information available. |
The availability of observable inputs can vary from security to security and is affected by a wide variety of factors, including, for example, the type of security, whether a security is new and not yet established in the marketplace, the liquidity of markets, and other characteristics particular to the security. To the extent that valuation is based on models or inputs that are less observable or unobservable in the market, the determination of fair value requires more
128
| | |
| | MARCH 31, 2014 (UNAUDITED) |
|
|
|
judgment. Accordingly, the degree of judgment exercised in determining fair value is greatest for instruments categorized in Level 3.
Equity Securities (common and preferred stock) — Securities are valued as of the close of the New York Stock Exchange (generally 4:00 p.m. Eastern Time) on the valuation date. Equity securities and listed warrants are valued using a commercial pricing service at the last quoted sales price taken from the primary market in which each security trades and, with respect to equity securities traded on NASDAQ, such securities are valued using the NASDAQ Official Closing Price (“NOCP”) or last sales price if no NOCP is available. If there are no sales on the primary exchange or market on a day, then the security shall be valued at the mean of the last bid and ask price on the primary exchange or market as provided by a pricing service. If the mean cannot be calculated or there is no trade activity on a day, then the security shall be valued at the previous trading day’s price as provided by a pricing service. In some instances, particularly on foreign exchanges, an official close or evaluated price may be used if the pricing service is unable to provide the last trade or most recent mean price. To the extent that these securities are actively traded and valuation adjustments are not applied, they are categorized in Level 1 of the fair value hierarchy. Additionally, a fund’s investments are valued at fair value by the Pricing Committee if the Advisor determines that an event impacting the value of an investment occurred between the closing time of a security’s primary market or exchange (for example, a foreign exchange or market) and the time the fund’s share price is calculated. Significant events include, but are not limited to the following: significant fluctuations in domestic markets, foreign markets or foreign currencies; occurrences not directly tied to the securities markets such as natural disasters, armed conflicts or significant governmental actions; and major announcements affecting a single issuer or an entire market or market sector. In responding to a significant event, the Pricing Committee determines the fair value of affected securities by considering factors including, but not limited to: index options and futures traded subsequent to the close; American Depositary Receipts (“ADRs”), Global Depositary Receipts (“GDRs”) or other related receipts; currency spot or forward markets that trade after pricing of the foreign exchange; other derivative securities traded after the close such as Standard & Poor’s Depositary Receipts (“SPDRs”) and other exchange-traded funds (“ETFs”); and alternative market quotes on the affected securities. When applicable, the Funds use a systematic fair valuation model provided by an independent third party to assist in adjusting the valuation of foreign securities. When a Fund uses this fair value pricing method, the values assigned to the Fund’s foreign securities may not be the quoted or published prices of the investments on their primary markets or exchanges and the securities are categorized in Level 2 of the fair value hierarchy. These valuation procedures apply equally to long or short equity positions in a fund.
Participation Notes — Investments are valued at the market price of the underlying security. Counterparty risk is regularly reviewed and considered for valuation.
Corporate Debt Securities — Investments are valued at current market value by a pricing service, or by using the last sale or bid price based on observable inputs. Observable inputs may include benchmark yields, reported trades, broker/dealer quotes, issuer spreads, two-sided markets, benchmark securities, bids, offers and reference data including market research publications. Although most corporate bonds are categorized in Level 2 of the fair value hierarchy, in instances where observable inputs are not available, they are categorized as Level 3.
Short-term Notes — Investments maturing in 60 days or less at the time of purchase, are generally valued at amortized cost, unless it is determined that the amortized cost method would not represent fair value, in which case the securities are marked-to-market. To the extent the inputs are observable and timely, the values would be categorized in Level 2 of the fair value hierarchy.
Asset-backed Securities — Investments are priced using the closing bid as supplied by a pricing service based on observable inputs. Observable inputs may include benchmark yields, reported trades, broker/dealer quotes, issuer spreads, two-sided markets, benchmark securities, bids, offers and reference data including market research publications, new issue data, monthly payment information and collateral performance. Although most asset-backed securities are categorized in Level 2 of the fair value hierarchy, in instances where observable inputs are not available, they are categorized as Level 3.
U.S. Government Issuers — Investments are priced using the closing bid as supplied by a pricing service based on observable inputs. Observable inputs may include benchmark yields, reported trades, broker/dealer quotes, issuer spreads, two-sided markets, benchmark securities, bids, offers and reference data including market research publications. Although most U.S. government bonds are categorized in Level 2 of the fair value hierarchy, in instances where observable inputs are not available, they are categorized as Level 3.
Derivative Instruments — Listed derivatives that are actively traded are valued based on quoted prices from the exchange and are categorized in Level 1 of the fair value hierarchy. Exchange-traded options are valued at the last sale price on the market where they are principally traded. If there are no sales on the primary exchange or market on a given day, then the option is valued at the mean of the last bid price and ask price on the primary exchange or market as provided by a pricing service. Forward foreign currency contracts are valued at the market rate provided by the pricing service.
Restricted Securities — If market quotations are not readily available for the Funds’ investments in securities such as restricted securities, private placements, securities for which trading has been halted or other illiquid securities, these investments are valued at fair value in accordance with Board-approved Pricing Policies and Procedures by the Pricing Committee with oversight by the Board of Trustees. Fair value is defined as the price that would be received upon the sale of an asset, or paid to transfer a liability, in an orderly transaction between market participants at the measurement date under current market conditions. For
129
| | |
| WASATCH FUNDS — Notes to Financial Statements (continued) | | |
|
|
|
each applicable investment that is fair valued, the Pricing Committee considers, to the extent applicable, various factors including, but not limited to, the financial condition of the company or limited partnership, operating results, prices paid in follow-on rounds, comparable companies in the public market, the nature and duration of the restrictions for holding the securities, a stated net asset value (NAV) for the partnership, if applicable, and other relevant factors. Depending on the relative significance of valuation inputs, these instruments may be classified in either Level 2 or Level 3 of the fair value hierarchy.
When the last day of the reporting period is a non-business day, certain foreign markets may be open on those days that the NYSE is closed, which could result in differences between the value of a Fund’s portfolio securities on the last business day and the last calendar day of the reporting period. Any significant security valuation changes due to an open foreign market are adjusted and reflected by the Fund for financial reporting purposes.
The following is a summary of the fair valuations according to the inputs used as of March 31, 2014 in valuing the Funds’ assets and liabilities:
| | | | | | | | | | | | | | | | | | |
| Fund | | Category | | Quoted Prices
in Active Markets
for Identical
Investments
(Level 1) | | | Significant Other
Observable Inputs
(Level 2) | | | Significant
Unobservable
Inputs
(Level 3) | | | Value at
3/31/14 | |
Core Growth Fund | | | | | | | | | | | | | | | | | | |
Assets | | | | | | | | | | | | | | | | | | |
Common Stocks | | | | $ | 948,434,037 | | | $ | — | | | $ | — | | | $ | 948,434,037 | |
Short-Term Investments | | | | | — | | | | 44,622,484 | | | | — | | | | 44,622,484 | |
| | | | | | |
| | | | $ | 948,434,037 | | | $ | 44,622,484 | | | $ | — | | | $ | 993,056,521 | |
| | | | | | |
Emerging India Fund | | | | | | | | | | | | | | | | | | |
Assets | | | | | | | | | | | | | | | | | | |
Common Stocks | | | | $ | 19,243,473 | | | $ | — | | | $ | — | | | $ | 19,243,473 | |
Short-Term Investments | | | | | — | | | | 794,089 | | | | — | | | | 794,089 | |
| | | | | | |
| | | | $ | 19,243,473 | | | $ | 794,089 | | | $ | — | | | $ | 20,037,562 | |
| | | | | | |
Emerging Markets Select Fund | | | | | | | | | | | | | | | | | | |
Assets | | | | | | | | | | | | | | | | | | |
Common Stocks | | Diversified Banks | | $ | 11,518,560 | | | $ | 1,957,781 | | | $ | — | | | $ | 13,476,341 | |
| | Health Care Facilities | | | 1,946,588 | | | | 1,633,009 | | | | — | | | | 3,579,597 | |
| | Wireless Telecommunication Services | | | 817,805 | | | | 1,533,390 | | | | — | | | | 2,351,195 | |
| | Other | | | 37,767,192 | | | | — | | | | — | | | | 37,767,192 | |
Short-Term Investments | | | | | — | | | | 7,320,483 | | | | — | | | | 7,320,483 | |
| | | | | | |
| | | | $ | 52,050,145 | | | $ | 12,444,663 | | | $ | — | | | $ | 64,494,808 | |
| | | | | | |
Emerging Markets Small Cap Fund | | | | | | | | | | | | | | | | | | |
Assets | | | | | | | | | | | | | | | | | | |
Common Stocks | | Cable & Satellite | | $ | 12,307,626 | | | $ | 9,915,035 | | | $ | — | | | $ | 22,222,661 | |
| | Coal & Consumable Fuels | | | — | | | | 10,696,491 | | | | — | | | | 10,696,491 | |
| | Construction Materials | | | 28,742,240 | | | | 38,744,720 | | | | — | | | | 67,486,960 | |
| | Department Stores | | | 16,675,121 | | | | 5,338,758 | | | | — | | | | 22,013,879 | |
| | Health Care Facilities | | | 34,961,020 | | | | 19,887,134 | | | | — | | | | 54,848,154 | |
| | Home Improvement Retail | | | — | | | | 22,906,628 | | | | — | | | | 22,906,628 | |
| | Hotels, Resorts & Cruise Lines | | | 30,543,600 | | | | 19,656,521 | | | | — | | | | 50,200,121 | |
| | Wireless Telecommunication Services | | | — | | | | 21,221,161 | | | | — | | | | 21,221,161 | |
| | Other | | | 1,209,737,339 | | | | — | | | | — | | | | 1,209,737,339 | |
Preferred Stocks | | | | | 7,189,636 | | | | — | | | | — | | | | 7,189,636 | |
Short-Term Investments | | | | | — | | | | 62,262,728 | | | | — | | | | 62,262,728 | |
| | | | | | |
| | | | $ | 1,340,156,582 | | | $ | 210,629,176 | | | $ | — | | | $ | 1,550,785,758 | |
| | | | | | |
Frontier Emerging Small Countries Fund | | | | | | | | | | | | | | | | | | |
Assets | | | | | | | | | | | | | | | | | | |
Common Stocks | | Packaged Foods & Meats | | $ | 211,830,291 | | | $ | 12,136,102 | | | $ | — | | | $ | 223,966,393 | |
| | Other | | | 737,553,241 | | | | — | | | | — | | | | 737,553,241 | |
Participation Notes | | | | | — | | | | 78,185,292 | | | | — | | | | 78,185,292 | |
Short-Term Investments | | | | | — | | | | 80,899,058 | | | | — | | | | 80,899,058 | |
| | | | | | |
| | | | $ | 949,383,532 | | | $ | 171,220,452 | | | $ | — | | | $ | 1,120,603,984 | |
| | | | | | |
130
| | |
| | MARCH 31, 2014 (UNAUDITED) |
|
|
|
| | | | | | | | | | | | | | | | | | |
| Fund | | Category | | Quoted Prices
in Active Markets
for Identical
Investments
(Level 1) | | | Significant Other
Observable Inputs
(Level 2) | | | Significant
Unobservable
Inputs
(Level 3) | | | Value at
3/31/14 | |
Global Opportunities Fund | | | | | | | | | | | | | | | | | | |
Assets | | | | | | | | | | | | | | | | | | |
Common Stocks | | Wireless Telecommunication Services | | $ | — | | | $ | 1,937,075 | | | $ | — | | | $ | 1,937,075 | |
| | Other | | | 211,197,152 | | | | — | | | | — | | | | 211,197,152 | |
Warrants | | | | | — | | | | — | | | | 400 | | | | 400 | |
Participation Notes | | | | | — | | | | 2,416,841 | | | | — | | | | 2,416,841 | |
| | | | | | |
| | | | $ | 211,197,152 | | | $ | 4,353,916 | | | $ | 400 | | | $ | 215,551,468 | |
| | | | | | |
Heritage Growth Fund | | | | | | | | | | | | | | | | | | |
Assets | | | | | | | | | | | | | | | | | | |
Common Stocks | | | | $ | 122,390,337 | | | $ | — | | | $ | — | | | $ | 122,390,337 | |
Short-Term Investments | | | | | — | | | | 8,035,006 | | | | — | | | | 8,035,006 | |
| | | | | | |
| | | | $ | 122,390,337 | | | $ | 8,035,006 | | | $ | — | | | $ | 130,425,343 | |
| | | | | | |
International Growth Fund | | | | | | | | | | | | | | | | | | |
Assets | | | | | | | | | | | | | | | | | | |
Common Stocks | | Construction Materials | | $ | 21,864,404 | | | $ | 18,589,225 | | | $ | — | | | $ | 40,453,629 | |
| | Other | | | 1,523,979,648 | | | | — | | | | — | | | | 1,523,979,648 | |
Short-Term Investments | | | | | — | | | | 92,554,493 | | | | — | | | | 92,554,493 | |
| | | | | | |
| | | | $ | 1,545,844,052 | | | $ | 111,143,718 | | | $ | — | | | $ | 1,656,987,770 | |
| | | | | | |
International Opportunities Fund | | | | | | | | | | | | | | | | | | |
Assets | | | | | | | | | | | | | | | | | | |
Common Stocks | | Building Products | | $ | 4,439,552 | | | $ | 1,159,161 | | | $ | — | | | $ | 5,598,713 | |
| | Construction Materials | | | — | | | | 2,619,536 | | | | — | | | | 2,619,536 | |
| | Food Distributors | | | — | | | | 2,281,545 | | | | — | | | | 2,281,545 | |
| | Food Retail | | | 18,494,659 | | | | 1,481,527 | | | | — | | | | 19,976,186 | |
| | Home Improvement Retail | | | 1,804,105 | | | | 2,220,086 | | | | — | | | | 4,024,191 | |
| | Household Products | | | 7,837,136 | | | | 2,526,439 | | | | — | | | | 10,363,575 | |
| | Packaged Foods & Meats | | | 45,711,806 | | | | 1,604,353 | | | | — | | | | 47,316,159 | |
| | Other | | | 218,291,466 | | | | — | | | | — | | | | 218,291,466 | |
Short-Term Investments | | | | | — | | | | 21,206,478 | | | | — | | | | 21,206,478 | |
| | | | | | |
| | | | $ | 296,578,724 | | | $ | 35,099,125 | | | $ | — | | | $ | 331,677,849 | |
| | | | | | |
Large Cap Value Fund | | | | | | | | | | | | | | | | | | |
Assets | | | | | | | | | | | | | | | | | | |
Common Stocks | | | | $ | 583,619,507 | | | $ | — | | | $ | — | | | $ | 583,619,507 | |
Short-Term Investments | | | | | — | | | | 676,944 | | | | — | | | | 676,944 | |
| | | | | | |
| | | | $ | 583,619,507 | | | $ | 676,944 | | | $ | — | | | $ | 584,296,451 | |
| | | | | | |
Long/Short Fund | | | | | | | | | | | | | | | | | | |
Assets | | | | | | | | | | | | | | | | | | |
Common Stocks | | | | $ | 2,274,045,252 | | | $ | — | | | $ | — | | | $ | 2,274,045,252 | |
Short-Term Investments | | | | | — | | | | 447,207,058 | | | | — | | | | 447,207,058 | |
| | | | | | |
| | | | $ | 2,274,045,252 | | | $ | 447,207,058 | | | $ | — | | | $ | 2,721,252,310 | |
| | | | | | |
Liabilities | | | | | | | | | | | | | | | | | | |
Securities Sold Short | | | | $ | (277,889,247 | ) | | $ | — | | | $ | — | | | $ | (277,889,247 | ) |
| | | | | | |
| | | | $ | (277,889,247 | ) | | $ | — | | | $ | — | | | $ | (277,889,247 | ) |
| | | | | | |
Micro Cap Fund | | | | | | | | | | | | | | | | | | |
Assets | | | | | | | | | | | | | | | | | | |
Common Stocks | | Specialized Finance | | $ | — | | | $ | — | | | $ | 47,740 | | | $ | 47,740 | |
| | Other | | | 331,294,272 | | | | — | | | | — | | | | 331,294,272 | |
Warrants | | | | | — | | | | — | | | | 3,225 | | | | 3,225 | |
Short-Term Investments | | | | | — | | | | 8,388,106 | | | | — | | | | 8,388,106 | |
| | | | | | |
| | | | $ | 331,294,272 | | | $ | 8,388,106 | | | $ | 50,965 | | | $ | 339,733,343 | |
| | | | | | |
131
| | |
| WASATCH FUNDS — Notes to Financial Statements (continued) | | |
|
|
|
| | | | | | | | | | | | | | | | | | |
| Fund | | Category | | Quoted Prices
in Active Markets
for Identical
Investments
(Level 1) | | | Significant Other
Observable Inputs
(Level 2) | | | Significant
Unobservable
Inputs
(Level 3) | | | Value at
3/31/14 | |
Micro Cap Value Fund | | | | | | | | | | | | | | | | | | |
Assets | | | | | | | | | | | | | | | | | | |
Common Stocks | | Diversified Banks | | $ | 2,253,085 | | | $ | — | | | $ | 200,557 | | | $ | 2,453,642 | |
| | Personal Products | | | 1,506,800 | | | | 960,000 | | | | — | | | | 2,466,800 | |
| | Specialized Finance | | | 1,144,550 | | | | — | | | | 12,989 | | | | 1,157,539 | |
| | Other | | | 166,892,554 | | | | — | | | | — | | | | 166,892,554 | |
Preferred Stocks | | | | | — | | | | — | | | | 1,366,314 | | | | 1,366,314 | |
Warrants | | | | | — | | | | — | | | | 1,105 | | | | 1,105 | |
Short-Term Investments | | | | | — | | | | 17,805,103 | | | | — | | | | 17,805,103 | |
| | | | | | |
| | | | $ | 171,796,989 | | | $ | 18,765,103 | | | $ | 1,580,965 | | | $ | 192,143,057 | |
| | | | | | |
Liabilities | | | | | | | | | | | | | | | | | | |
Equity Contracts | | | | $ | (378,150 | ) | | $ | — | | | $ | — | | | $ | (378,150 | ) |
| | | | | | |
| | | | $ | (378,150 | ) | | $ | — | | | $ | — | | | $ | (378,150 | ) |
| | | | | | |
Small Cap Growth Fund | | | | | | | | | | | | | | | | | | |
Assets | | | | | | | | | | | | | | | | | | |
Common Stocks | | | | $ | 2,507,240,015 | | | $ | — | | | $ | — | | | $ | 2,507,240,015 | |
Preferred Stocks | | | | | — | | | | — | | | | 25,175,366 | | | | 25,175,366 | |
Limited Partnership Interest | | | | | — | | | | — | | | | 4,446,126 | | | | 4,446,126 | |
Short-Term Investments | | | | | — | | | | 83,209,145 | | | | — | | | | 83,209,145 | |
| | | | | | |
| | | | $ | 2,507,240,015 | | | $ | 83,209,145 | | | $ | 29,621,492 | | | $ | 2,620,070,652 | |
| | | | | | |
Small Cap Value Fund | | | | | | | | | | | | | | | | | | |
Assets | | | | | | | | | | | | | | | | | | |
Common Stocks | | | | | $217,747,583 | | | $ | — | | | $ | — | | | $ | 217,747,583 | |
Short-Term Investments | | | | | — | | | | 15,729,661 | | | | — | | | | 15,729,661 | |
| | | | | | |
| | | | | $217,747,583 | | | $ | 15,729,661 | | | $ | — | | | $ | 233,477,244 | |
| | | | | | |
Strategic Income Fund | | | | | | | | | | | | | | | | | | |
Assets | | | | | | | | | | | | | | | | | | |
Common Stocks | | Diversified REITs | | $ | — | | | $ | 231,214 | | | $ | — | | | $ | 231,214 | |
| | Other | | | 59,245,411 | | | | — | | | | — | | | | 59,245,411 | |
Exchange-Traded Funds | | | | | 2,923,140 | | | | — | | | | — | | | | 2,923,140 | |
Limited Partnership Interest | | | | | 2,174,550 | | | | — | | | | — | | | | 2,174,550 | |
Corporate Bonds | | | | | — | | | | — | | | | 1,215 | | | | 1,215 | |
Short-Term Investments | | | | | — | | | | 7,498,799 | | | | — | | | | 7,498,799 | |
| | | | | | |
| | | | $ | 64,343,101 | | | $ | 7,730,013 | | | $ | 1,215 | | | $ | 72,074,329 | |
| | | | | | |
Ultra Growth Fund | | | | | | | | | | | | | | | | | | |
Assets | | | | | | | | | | | | | | | | | | |
Common Stocks | | Internet Software & Services | | $ | 9,763,140 | | | $ | — | | | $ | 914 | | | $ | 9,764,054 | |
| | Other | | | 101,612,319 | | | | — | | | | — | | | | 101,612,319 | |
Preferred Stocks | | | | | — | | | | — | | | | 2,086,344 | | | | 2,086,344 | |
Limited Partnership Interest | | | | | — | | | | — | | | | 4,134,166 | | | | 4,134,166 | |
Warrants | | | | | — | | | | — | | | | 1,650 | | | | 1,650 | |
| | | | | | |
| | | | $ | 111,375,459 | | | $ | — | | | $ | 6,223,074 | | | $ | 117,598,533 | |
| | | | | | |
World Innovators Fund | | | | | | | | | | | | | | | | | | |
Assets | | | | | | | | | | | | | | | | | | |
Common Stocks | | Internet Software & Services | | $ | 36,821,012 | | | $ | — | | | $ | 65 | | | $ | 36,821,077 | |
| | Other | | | 248,855,372 | | | | — | | | | — | | | | 248,855,372 | |
Preferred Stocks | | | | | 5,518,073 | | | | — | | | | — | | | | 5,518,073 | |
Limited Partnership Interest | | | | | — | | | | — | | | | 311,953 | | | | 311,953 | |
Warrants | | | | | — | | | | — | | | | 715 | | | | 715 | |
Short-Term Investments | | | | | — | | | | 30,982,646 | | | | — | | | | 30,982,646 | |
| | | | | | |
| | | | $ | 291,194,457 | | | $ | 30,982,646 | | | $ | 312,733 | | | $ | 322,489,836 | |
| | | | | | |
132
| | |
| | MARCH 31, 2014 (UNAUDITED) |
|
|
|
| | | | | | | | | | | | | | | | | | |
| Fund | | Category | | Quoted Prices
in Active Markets
for Identical
Investments
(Level 1) | | | Significant Other
Observable Inputs
(Level 2) | | | Significant
Unobservable
Inputs
(Level 3) | | | Value at
3/31/14 | |
Income Fund | | | | | | | | | | | | | | | | | | |
Assets | | | | | | | | | | | | | | | | | | |
Asset Backed Securities | | | | $ | — | | | $ | 6,002,112 | | | $ | — | | | $ | 6,002,112 | |
Collateralized Mortgage Obligations | | | | | — | | | | 20,218,191 | | | | — | | �� | | 20,218,191 | |
Corporate Bonds | | | | | — | | | | 49,171,219 | | | | — | | | | 49,171,219 | |
Municipal Bonds | | | | | — | | | | 2,569,170 | | | | — | | | | 2,569,170 | |
Mutual Funds | | | | | 531,650 | | | | — | | | | — | | | | 531,650 | |
Exchange-Traded Funds | | | | | 2,065,800 | | | | — | | | | — | | | | 2,065,800 | |
U.S. Government Agency Securities | | | | | — | | | | 26,627,486 | | | | — | | | | 26,627,486 | |
U.S. Treasury Inflation Protected Bonds | | | | | — | | | | 666,518 | | | | — | | | | 666,518 | |
U.S. Treasury Notes | | | | | — | | | | 9,792,433 | | | | — | | | | 9,792,433 | |
Preferred Stocks | | | | | 890,700 | | | | — | | | | — | | | | 890,700 | |
Short-Term Investments | | | | | — | | | | 3,974,123 | | | | — | | | | 3,974,123 | |
| | | | | | |
| | | | $ | 3,488,150 | | | $ | 119,021,252 | | | $ | — | | | $ | 122,509,402 | |
| | | | | | |
U.S. Treasury Fund | | | | | | | | | | | | | | | | | | |
Assets | | | | | | | | | | | | | | | | | | |
U.S. Government Obligations | | | | $ | — | | | $ | 190,102,883 | | | $ | — | | | $ | 190,102,883 | |
Short-Term Investments | | | | | — | | | | 1,946,875 | | | | — | | | | 1,946,875 | |
| | | | | | |
| | | | $ | — | | | $ | 192,049,758 | | | $ | — | | | $ | 192,049,758 | |
| | | | | | |
If the securities of an Asset Class are all the same level, the asset class is shown in total. If the securities of an Asset Class cross levels, the level with the smallest number of categories and with multiple levels within a category is displayed by category. The remaining categories that do not cross levels are combined into the “Other” category.
The valuation techniques used by the Funds to measure fair value for the period ended March 31, 2014 maximized the use of observable inputs and minimized the use of unobservable inputs.
The Funds’ policy is to recognize transfers between levels at the end of the reporting period. The table below shows the significant transfers between Level 1 and Level 2 due to fair valuation in certain foreign markets.
| | | | | | | | |
| Fund | | Transfers Out
Of Level 1 at
Market Value | | | Transfers Into
Level 2 at
Market Value | |
Emerging Markets Select Fund | | $ | 1,533,389 | | | $ | 1,533,389 | |
Emerging Markets Small Cap Fund | | | 67,615,456 | | | | 67,615,456 | |
Frontier Emerging Small Countries Fund | | | 12,136,102 | | | | 12,136,102 | |
Global Opportunities Fund | | | 1,937,075 | | | | 1,937,075 | |
International Growth Fund | | | 18,589,225 | | | | 18,589,225 | |
International Opportunities Fund | | | 1,481,527 | | | | 1,481,527 | |
| | | | | | | | |
| Fund | | Transfers Out
Of Level 2 at
Market Value | | | Transfers Into
Level 1 at
Market Value | |
Frontier Emerging Small Countries Fund | | $ | 8,685 | | | $ | 8,685 | |
133
| | |
| WASATCH FUNDS — Notes to Financial Statements (continued) | | |
|
|
|
The following is a reconciliation of the fair valuations using significant unobservable inputs (Level 3) for the Funds during the period ended March 31, 2014:
| | | | | | | | | | | | | | | | | | | | | | | | | | | | | | | | | | | | | | | | |
| Fund | | Market Value
Beginning
Balance
9/30/2013 | | | Purchases
at Cost | | | Sales
(Proceeds) | | | Accrued
Discounts
(Premiums) | | | Realized
Gain/
(Loss) | | | Change in
Unrealized
Appreciation
(Depreciation) | | | Transfers
in at
Market
Value | | | Transfers
out at
Market
Value | | | Market
Value
Ending
Balance
3/31/2014 | | | Net Change in
Unrealized
Appreciation
(Depreciation) on
Investments Held
at 3/31/2014 | |
Global Opportunities Fund | | | | | | | | | | | | | | | | | | | | | | | | | | | | | | | | | | | | | | | | |
Warrants | | $ | 2,000 | | | $ | — | | | $ | — | | | $ | — | | | $ | — | | | $ | (1,600 | ) | | $ | — | | | $ | — | | | $ | 400 | | | $ | (1,600 | ) |
| | | | |
Micro Cap Fund | | | | | | | | | | | | | | | | | | | | | | | | | | | | | | | | | | | | | | | | |
Common Stocks | | $ | 63,140 | | | | — | | | | — | | | | — | | | | — | | | | (15,400 | ) | | | — | | | | — | | | | 47,740 | | | | (15,400 | ) |
Warrants | | | 16,125 | | | | — | | | | — | | | | — | | | | — | | | | (12,900 | ) | | | — | | | | — | | | | 3,225 | | | | (12,900 | ) |
| | | | |
| | $ | 79,265 | | | | — | | | | — | | | | — | | | | — | | | | (28,300 | ) | | | — | | | | — | | | | 50,965 | | | | (28,300 | ) |
| | | | |
Micro Cap Value Fund | | | | | | | | | | | | | | | | | | | | | | | | | | | | | | | | | | | | | | | | |
Common Stocks | | $ | 218,709 | | | | — | | | | — | | | | — | | | | — | | | | (5,163 | ) | | | — | | | | — | | | | 213,546 | | | | (5,163 | ) |
Preferred Stocks | | | 1,366,314 | | | | — | | | | — | | | | — | | | | — | | | | — | | | | — | | | | — | | | | 1,366,314 | | | | — | |
Warrants | | | 5,525 | | | | — | | | | — | | | | — | | | | — | | | | (4,420 | ) | | | — | | | | — | | | | 1,105 | | | | (4,420 | ) |
| | | | |
| | $ | 1,590,548 | | | | — | | | | — | | | | — | | | | — | | | | (9,583 | ) | | | — | | | | — | | | | 1,580,965 | | | | (9,583 | ) |
| | | | |
Small Cap Growth Fund | | | | | | | | | | | | | | | | | | | | | | | | | | | | | | | | | | | | | | | | |
Preferred Stocks | | $ | 16,375,768 | | | | 8,999,988 | | | | — | | | | — | | | | — | | | | (200,390 | ) | | | — | | | | — | | | | 25,175,366 | | | | (1,371,983 | ) |
Limited Partnership Interest | | | 4,342,253 | | | | 80,000 | | | | 806,897 | | | | — | | | | (197,354 | ) | | | 1,028,124 | | | | — | | | | — | | | | 4,446,126 | | | | 1,028,124 | |
| | | | |
| | $ | 20,718,021 | | | | 9,079,988 | | | | 806,897 | | | | — | | | | (197,354 | ) | | | 827,734 | | | | — | | | | — | | | | 29,621,492 | | | | (343,859 | ) |
| | | | |
Strategic Income Fund | | | | | | | | | | | | | | | | | | | | | | | | | | | | | | | | | | | | | | | | |
Corporate Bonds | | $ | 1,030 | | | | — | | | | 1,429 | | | | — | | | | 379 | | | | 1,235 | | | | — | | | | — | | | | 1,215 | | | | 192 | |
| | | | |
Ultra Growth Fund | | | | | | | | | | | | | | | | | | | | | | | | | | | | | | | | | | | | | | | | |
Common Stocks | | $ | 914 | | | | — | | | | — | | | | — | | | | — | | | | — | | | | — | | | | — | | | | 914 | | | | — | |
Preferred Stocks | | | 2,063,230 | | | | — | | | | — | | | | — | | | | — | | | | 23,114 | | | | — | | | | — | | | | 2,086,344 | | | | 269,785 | |
Limited Partnership Interest | | | 4,023,003 | | | | 75,000 | | | | 732,184 | | | | — | | | | (189,600 | ) | | | 957,947 | | | | — | | | | — | | | | 4,134,166 | | | | 957,947 | |
Warrants | | | 8,250 | | | | — | | | | — | | | | — | | | | — | | | | (6,600 | ) | | | — | | | | — | | | | 1,650 | | | | (6,600 | ) |
| | | | |
| | $ | 6,095,397 | | | | 75,000 | | | | 732,184 | | | | — | | | | (189,600 | ) | | | 974,461 | | | | — | | | | — | | | | 6,223,074 | | | | 1,221,132 | |
| | | | |
World Innovators Fund | | | | | | | | | | | | | | | | | | | | | | | | | | | | | | | | | | | | | | | | |
Common Stocks | | $ | 65 | | | | — | | | | — | | | | — | | | | — | | | | — | | | | — | | | | — | | | | 65 | | | | — | |
Limited Partnership Interest | | | 319,242 | | | | 5,000 | | | | 74,712 | | | | — | | | | (7,762 | ) | | | 70,185 | | | | — | | | | — | | | | 311,953 | | | | 70,185 | |
Warrants | | | 3,575 | | | | — | | | | — | | | | — | | | | — | | | | (2,860 | ) | | | — | | | | — | | | | 715 | | | | (2,860 | ) |
| | | | |
| | $ | 322,882 | | | $ | 5,000 | | | $ | 74,712 | | | $ | — | | | $ | (7,762 | ) | | $ | 67,325 | | | $ | — | | | $ | — | | | $ | 312,733 | | | $ | 67,325 | |
| | | | |
QUANTITATIVE INFORMATION ABOUT LEVEL 3 FAIR VALUE MEASUREMENTS
| | | | | | | | | | | | | | |
| Fund | | Description | | Fair Value at 3/31/14 | | | Valuation Technique | | Unobservable Input | | Range
(Average) | |
Micro Cap Value | | Direct Venture Capital Investments: Pharmaceuticals | | $ | 1,366,314 | | | Probability of warrant exercise | | Exercise price | | | * | |
| | | | | | | | | Probability of no warrant exercise | | Remaining value | | | | |
Micro Cap Value | | Direct Venture Capital Investments: Diversified Banks | | $ | 200,557 | | | Book value | | Book value multiple | | | 1.0 | |
Small Cap Growth Fund | | Direct Venture Capital Investments: Biotechnology | | $ | 825,377 | | | Market comparable companies | | EV/R** multiple | | | 0.9 - 2.8(2.0 | ) |
| | | | | | | | | | | Discount for lack of marketability | | | 20 | % |
Ultra Growth Fund | | Direct Venture Capital Investments: Health Care Technology | | $ | 727,559 | | | Market comparable companies | | EBITDA*** multiple | | | 4.0 - 18.8(12.9 | ) |
| | | | | | | | | | EV/R** multiple | | | 0.8 - 6.8(2.4 | ) |
| | | | | | | | | | | Discount for lack of marketability | | | 20 | % |
Ultra Growth Fund | | Direct Venture Capital Investments: Biotechnology | | $ | 206,345 | | | Market comparable companies | | EV/R** multiple | | | 0.9 - 2.8(2.0 | ) |
| | | | | | | | | | | Discount for lack of marketability | | | 20 | % |
| *The | exercise price of the warrant will be within a range; the actual price is not set at this time. As such, this valuation is directionally sensitive to the determination of the exercise price within the range. |
| **Enterprise-Value-To-Revenue | Multiple — (“EV/R”) A measure of the value of a stock that compares a company’s enterprise value to its revenue. |
| ***Earnings | Before Interest, Taxes, Depreciation and Amortization (“EBITDA”) is net income with interest, taxes, depreciation, and amortization added back to it. EBITDA can be used to analyze and compare profitability between companies and industries because it eliminates the effects of financing and accounting decisions. |
134
| | |
| | MARCH 31, 2014 (UNAUDITED) |
|
|
|
Changes in book value multiples, EBITDA multiples, and EV/R multiples, each in isolation, may change the fair value of the investment. Generally, a decrease in these multiples will result in a decrease in the fair value of the investment.
The Funds’ other Level 3 investments have been valued using unadjusted third-party transactions and quotations, unadjusted historical third party information or the unadjusted NAV of the investment in private investment companies. No unobservable inputs internally developed by the Funds have been applied to these investments, thus they have been excluded from the above table.
15. OFFSETTING
Each Fund is a party to various netting arrangements. The Financial Accounting Standards Board (“FASB”) requires disclosure about certain netting arrangements and similar agreements to enable users of a Fund’s financial statements to evaluate the effect or potential effect of netting arrangements on the Fund’s financial position. The scope of the disclosure is limited to derivative instruments, repurchase agreements and reverse repurchase agreements, and securities borrowing and securities lending transactions.
The following tables present information about financial instruments that are subject to enforceable netting arrangements as of March 31, 2014:
REPURCHASE AGREEMENTS
| | | | | | | | | | | | | | | | | | |
| | | | | Gross Amounts Not Offset in the Statements of Assets and Liabilities | |
| Fund | | Counterparty | | Gross Asset Amounts
Presented in
Statements of Assets
and Liabilities | | | Financial
Instrument | | | Collateral
Received1 | | | Net Amount
(Not Less Than 0) | |
Core Growth Fund | | State Street Bank and Trust Co. | | $ | 44,622,484 | | | $ | — | | | $ | (44,622,484 | ) | | $ | — | |
Emerging India Fund | | State Street Bank and Trust Co. | | | 794,089 | | | | — | | | | (794,089 | ) | | | — | |
Emerging Markets Select Fund | | State Street Bank and Trust Co. | | | 7,320,483 | | | | — | | | | (7,320,483 | ) | | | — | |
Emerging Markets Small Cap Fund | | State Street Bank and Trust Co. | | | 62,262,728 | | | | — | | | | (62,262,728 | ) | | | — | |
Frontier Emerging Small Countries Fund | | State Street Bank and Trust Co. | | | 80,899,058 | | | | — | | | | (80,899,058 | ) | | | — | |
Heritage Growth Fund | | State Street Bank and Trust Co. | | | 8,035,006 | | | | — | | | | (8,035,006 | ) | | | — | |
International Growth Fund | | State Street Bank and Trust Co. | | | 92,554,493 | | | | — | | | | (92,554,493 | ) | | | — | |
International Opportunities Fund | | State Street Bank and Trust Co. | | | 21,206,478 | | | | — | | | | (21,206,478 | ) | | | — | |
Large Cap Value Fund | | State Street Bank and Trust Co. | | | 676,944 | | | | — | | | | (676,944 | ) | | | — | |
Long/Short Fund | | State Street Bank and Trust Co. | | | 447,207,058 | | | | — | | | | (447,207,058 | ) | | | — | |
Micro Cap Fund | | State Street Bank and Trust Co. | | | 8,388,106 | | | | — | | | | (8,388,106 | ) | | | — | |
Micro Cap Value Fund | | State Street Bank and Trust Co. | | | 17,805,103 | | | | — | | | | (17,805,103 | ) | | | — | |
Small Cap Growth Fund | | State Street Bank and Trust Co. | | | 83,209,145 | | | | — | | | | (83,209,145 | ) | | | — | |
Small Cap Value Fund | | State Street Bank and Trust Co. | | | 15,729,661 | | | | — | | | | (15,729,661 | ) | | | — | |
Strategic Income Fund | | State Street Bank and Trust Co. | | | 7,498,799 | | | | — | | | | (7,498,799 | ) | | | — | |
World Innovators Fund | | State Street Bank and Trust Co. | | | 30,982,646 | | | | — | | | | (30,982,646 | ) | | | — | |
Income Fund | | State Street Bank and Trust Co. | | | 3,974,123 | | | | — | | | | (3,974,123 | ) | | | — | |
U.S. Treasury Fund | | State Street Bank and Trust Co. | | | 1,946,875 | | | | — | | | | (1,946,875 | ) | | | — | |
| | |
| EXCHANGE-TRADED WRITTEN OPTIONS | | | | | | | | | |
| | |
| | | Gross Amounts Not Offset in the Statements of Assets and Liabilities | | | | |
| Fund | | Gross Liability Amounts Presented in Statements of Assets and Liabilities | | Financial Instrument | | | Collateral
Pledged2 | | | Net Amount (Not Less Than 0) | | | | |
Micro Cap Fund | | $378,150 | | $ | — | | | $ | (378,150 | ) | | $ | — | | | | | |
| | |
| SECURITIES BORROWEDFOR SHORT SALES | | | | | | | | | |
| | | | | Gross Amounts Not Offset in the Statements of Assets and Liabilities | |
| Fund | | Counterparty | | Gross Liability
Amounts Presented
in Statements of
Assets and Liabilities | | | Financial
Instrument | | | Collateral
Pledged2 | | | Net Amount
(Not Less Than 0) | |
Long/Short Fund | | JPMorgan Chase | | $ | 277,889,247 | | | $ | — | | | $ | (277,889,247 | ) | | $ | — | |
| 1 | Repurchase agreements are classified as short-term investments in the Statements of Assets and Liabilities. The market value of the collateral received is greater than the amounts indicated in the table. For further information, see Note 3 and the Schedules of Investments. |
| 2 | The market value of the collateral received is greater than the amounts indicated in the table. For further information, see Note 3—Securities and Other Investments “Short Sales,” Note 4—Financial Derivative Instruments “Options Transactions” and the Schedules of Investments. |
135
| | |
| WASATCH FUNDS — Notes to Financial Statements (continued) | | |
|
|
|
16. FAIR VALUEOF DERIVATIVE INSTRUMENTS*
The following is a summary of the fair valuations of the Funds’ derivative instruments categorized by risk exposure:
WASATCH INTERNATIONAL GROWTH FUND
The Effect of Derivative Instruments on the Statement of Operations for the period ended March 31, 2014:
| | | | | | | | | | | | | | | | | | | | | | | | |
| | | Derivatives not accounted for as hedging instruments under Statement 133 | |
| | | Interest Rate
Contracts | | | Foreign Exchange
Contracts | | | Credit
Contracts | | | Equity
Contracts | | | Other
Contracts | | | Total | |
Realized Gain (Loss) on Derivatives Recognized in Income | | | | | | | | | | | | | | | | | | | | | | | | |
Net realized gain (loss) on investments and foreign currency translations | | $ | — | | | $ | (5,306,980 | ) | | $ | — | | | $ | — | | | $ | — | | | $ | (5,306,980 | ) |
| | | | |
Net Change in Unrealized Appreciation (Depreciation) on Derivatives Recognized in Income | | | | | | | | | | | | | | | | | | | | | | | | |
Change in unrealized appreciation (depreciation) on investments, options and foreign currency translations | | $ | — | | | $ | 8,792,817 | | | $ | — | | | $ | — | | | $ | — | | | $ | 8,792,817 | |
| | | | |
WASATCH INTERNATIONAL OPPORTUNITIES FUND
The Effect of Derivative Instruments on the Statement of Operations for the period ended March 31, 2014:
| | | | | | | | | | | | | | | | | | | | | | | | |
| | | Derivatives not accounted for as hedging instruments under Statement 133 | |
| | | Interest Rate
Contracts | | | Foreign Exchange
Contracts | | | Credit
Contracts | | | Equity
Contracts | | | Other
Contracts | | | Total | |
Realized Gain (Loss) on Derivatives Recognized in Income | | | | | | | | | | | | | | | | | | | | | | | | |
Net realized gain on investments and foreign currency translations | | $ | — | | | $ | 1,567,306 | | | $ | — | | | $ | — | | | $ | — | | | $ | 1,567,306 | |
| | | | |
Net Change in Unrealized Appreciation (Depreciation) on Derivatives Recognized in Income | | | | | | | | | | | | | | | | | | | | | | | | |
Change in unrealized appreciation (depreciation) on investments, options and foreign currency translations | | $ | — | | | $ | 335,161 | | | $ | — | | | $ | — | | | $ | — | | | $ | 335,161 | |
| | | | |
WASATCH LONG/SHORT FUND
The Effect of Derivative Instruments on the Statement of Operations for the period ended March 31, 2014:
| | | | | | | | | | | | | | | | | | | | | | | | |
| | | Derivatives not accounted for as hedging instruments under Statement 133 | |
| | | Interest Rate
Contracts | | | Foreign Exchange
Contracts | | | Credit
Contracts | | | Equity
Contracts | | | Other
Contracts | | | Total | |
Realized Gain (Loss) on Derivatives Recognized in Income | | | | | | | | | | | | | | | | | | | | | | | | |
Net realized gain on options | | $ | — | | | $ | — | | | $ | — | | | $ | 9,229,620 | | | $ | — | | | $ | 9,229,620 | |
| | | | |
Net Change in Unrealized Appreciation (Depreciation) on Derivatives Recognized in Income | | | | | | | | | | | | | | | | | | | | | | | | |
Change in unrealized appreciation (depreciation) on investments, options and foreign currency translations | | $ | — | | | $ | — | | | $ | — | | | $ | (3,754,182 | ) | | $ | — | | | $ | (3,754,182 | ) |
| | | | |
136
| | |
| | MARCH 31, 2014 (UNAUDITED) |
|
|
|
WASATCH MICRO CAP VALUE FUND
Fair Values of Derivative Instruments on the Statement of Assets and Liabilities as of March 31, 2014:
| | | | | | | | | | | | | | | | | | | | | | | | |
| | | Derivatives not accounted for as hedging instruments under Statement 133 | |
| | | Interest Rate
Contracts | | | Foreign Exchange
Contracts | | | Credit
Contracts | | | Equity
Contracts | | | Other
Contracts | | | Total | |
Liabilities Derivatives | | | | | | | | | | | | | | | | | | | | | | | | |
Call options written at value | | $ | — | | | $ | — | | | $ | — | | | $ | 378,150 | | | $ | — | | | $ | 378,150 | |
The Effect of Derivative Instruments on the Statement of Operations for the period ended March 31, 2014:
| | | | | | | | | | | | | | | | | | | | | | | | |
| | | Derivatives not accounted for as hedging instruments under Statement 133 | |
| | | Interest Rate
Contracts | | | Foreign Exchange
Contracts | | | Credit
Contracts | | | Equity
Contracts | | | Other
Contracts | | | Total | |
Realized Gain (Loss) on Derivatives Recognized in Income | | | | | | | | | | | | | | | | | | | | | | | | |
Net realized gain on options | | | — | | | | — | | | | — | | | $ | 253,747 | | | | — | | | $ | 253,747 | |
| | | | |
Net Change in Unrealized Appreciation (Depreciation) on Derivatives Recognized in Income | | | | | | | | | | | | | | | | | | | | | | | | |
Change in unrealized appreciation (depreciation) on investments, options and foreign currency translations | | $ | — | | | | — | | | $ | — | | | $ | 111,044 | | | $ | — | | | $ | 111,044 | |
| | | | |
| * | See Note 4 — Financial Derivative Instruments for additional information. |
For the period ended March 31, 2014, the average monthly balance of derivative financial instruments was as follows:
| | | | | | | | | | | | | | | | |
| | | International
Growth
Fund | | | International
Opportunities
Fund | | | Long/Short
Fund | | | Micro Cap
Value Fund | |
Forward foreign currency exchange contracts: | | | | | | | | | | | | | | | | |
Average number of contracts — U.S. dollars purchased | | | 0 | 1 | | | 0 | 1 | | | — | | | | — | |
Average U.S. dollar amounts purchased | | $ | 15,572,433 | | | $ | 2,387,091 | | | $ | — | | | $ | — | |
Option contracts: | | | | | | | | | | | | | | | | |
Average number of call contracts written | | | — | | | | — | | | | 3,938 | | | | 644 | |
Average value of call contracts written | | $ | — | | | $ | — | | | $ | 2,163,486 | | | $ | 165,062 | |
| 1 | Amount represents less than 0.05. |
17. SUBSEQUENT EVENTS
At the Wasatch Funds Board meeting on May 13, 2014, the Board of Trustees approved an Amended and Restated Expense Limitation Agreement dated May 13, 2014 by and between the Trust, on behalf of its series, and the Advisor, which extended all of the expiration dates on limitations for reimbursement of Total Annual Fund Operating Expenses from January 31, 2015 to January 31, 2016.
In addition, the Board of Trustees authorized the Trust to increase the committed line of credit to $200,000,000 and the uncommitted line of credit to $100,000,000 with State Street Bank and Trust Company. The total of the two lines of credit was increased from $75,000,000 to $300,000,000. (See Note 12.)
137
| | |
| WASATCH FUNDS — Supplemental Information | | |
|
|
|
MANAGEMENTOFTHE COMPANY
Management Information. The business affairs of Wasatch Funds are overseen by its Board of Trustees. The Board consists of four Independent Trustees and one Interested Trustee. Three of the Independent Trustees and the Interested Trustee were elected by shareholders to serve until their successors are qualified, appointed or elected in accordance with the Trust’s Declaration of Trust and By-Laws. One Interested Trustee has been appointed by the elected Independent Trustees to serve until his successor is qualified, appointed or elected in accordance with the Trust’s Declaration of Trust and By-Laws.
The trustees and executive officers of Wasatch Funds and their principal occupations for at least the last five years are set forth below.
| | | | | | | | | | |
Name, Address and Age | | Position(s)
Held with
Wasatch Funds | | Term of Office1
and Length of
Time Served | | Principal Occupation(s)
during Past 5 Years | | Number of
Portfolios
in Fund
Complex
Overseen
by Trustee | | Other Directorships
Held by Trustee
during Past 5 Years2 |
Independent Trustees | | | | | | | | | | |
| | | | | |
James U. Jensen, J.D., MBA 505 Wakara Way 3rd Floor Salt Lake City, UT 84108 Age 69 | | Trustee and Chairman of the Board | | Indefinite Served as Chairman of the Board since 2004 and Trustee since 1986 | | Chief Executive Officer of Clearwater Law & Governance Group (an operating law firm board governance consulting company) April 2008 to present; Co-Founder and Chairman of the Board of Intelisum, Inc. (a company pursuing computer and measurement technology and products) 2001 - 2008; Consultant on corporate growth and technology transfer since 2004; Vice President, Corporate Development, Legal Affairs and General Counsel, and Secretary, NPS Pharmaceuticals, Inc. from 1991 to 2004. | | 20 | | Trustee, Northern Lights Fund Trust III (4 portfolios) since 2012 |
| | | | | |
D. James Croft, Ph.D. 505 Wakara Way 3rd Floor Salt Lake City, UT 84108 Age 72 | | Trustee and Chairman of the Governance & Nominating Committee | | Indefinite Served as Trustee since 2005 | | Consultant to the mortgage industry on issues of mortgage quality, identification of mortgage fraud, strategic planning and client development since 2004; Founder & Executive Director, Mortgage Asset Research Institute from 1990 to 2004. | | 20 | | None |
| | | | | |
Miriam M. Allison3 505 Wakara Way 3rd Floor Salt Lake City, UT 84108 Age 66 | | Trustee and Chairman of the Audit Committee | | Indefinite Served as Trustee since 2010 | | Rancher since 2004. From 2001 to 2005, Chairman of UMB Fund Services, Inc. | | 20 | | Director, Northwestern Mutual Series Fund, Inc. (27 portfolios) since 2006. |
| | | | | |
Heikki Rinne, Ph.D. 505 Wakara Way 3rd Floor Salt Lake City, UT 84108 Age 61 | | Trustee | | Indefinite Served as Trustee since October 2012 | | Chief Executive Officer of the Halton Group Ltd. (an indoor environmental control manufacturing and technology company) since 2002 | | 20 | | Director, Touchfon International, through 2009; Director, Infostar Group, through 2009 |
|
|
Interested Trustee | | | | | | | | | | |
| | | | | |
Samuel S. Stewart, Jr. Ph.D., CFA4 505 Wakara Way 3rd Floor Salt Lake City, UT 84108 Age 71 | | President and Trustee | | Indefinite Served as President and Trustee since 1986 | | Chairman of the Board for the Advisor since 1975; Chief Investment Officer of the Advisor from 2004 to June 2009; Director of Research of the Advisor from 1975 to 2004; Chairman of the Board of Wasatch Funds from 1986 to 2004. | | 20 | | None |
|
|
| 1 | A Trustee may serve until his/her death, resignation, removal or retirement. Each Independent Trustee shall retire as Trustee at the end of the calendar year in which he/she attains the age of 75 years. |
| 2 | Directorships are those held by a Trustee in any company with a class of securities registered pursuant to Section 12 of the Securities Exchange Act of 1934 or subject to the requirements of Section 15(d) of the Securities Exchange Act or any company registered as an investment company under the 1940 Act. |
| 3 | Ms. Allison previously owned shares of UMB Financial Corp., the parent company of UMB Fund Services, Inc., the Funds’ transfer agent. Ms. Allison no longer owns such shares. |
| 4 | Dr. Stewart is an Interested Trustee because he serves as the Chairman of the Board of the Advisor. |
138
| | |
| | MARCH 31, 2014 (UNAUDITED) |
|
|
|
| | | | | | |
Name, Address
and Age | | Position(s)
Held with Wasatch Funds | | Term of Office and
Length of Time Served | | Principal Occupation(s)
during Past 5 Years |
Officers | | | | | | |
| | | |
Daniel D. Thurber 505 Wakara Way 3rd Floor Salt Lake City, UT 84108 Age 44 | | Vice President | | Indefinite Served as Vice President since February 2007 | | General Counsel, Chief Compliance Officer and Director of Compliance for the Advisor since 2006. |
| | | |
Russell L. Biles 505 Wakara Way 3rd Floor Salt Lake City, UT 84108 Age 46 | | Chief Compliance Officer, Vice President and Secretary | | Indefinite Served as Chief Compliance Officer and Vice President since February 2007 and Secretary since November 2008 | | Chief Compliance Officer and Vice President for Wasatch Funds since February 2007; Secretary for Wasatch Funds since November 2008; Counsel for the Advisor since October 2006. |
| | | |
Cindy B. Firestone, CPA 505 Wakara Way 3rd Floor Salt Lake City, UT 84108 Age 56 | | Treasurer | | Indefinite Served as Treasurer since May 2009 | | Treasurer for Wasatch Funds since May 2009; Assistant Treasurer for Wasatch Funds from November 2008 to May 2009; Internal Auditor for the Advisor from December 2002 to August 2011. |
| | | |
David Corbett 505 Wakara Way 3rd Floor Salt Lake City, UT 84108 Age 41 | | Assistant Vice President | | Indefinite
Served as Assistant Vice President
since August 2012 | | Assistant Vice President for Wasatch Funds since August 2012; Director of Mutual Fund Services for the Advisor since June 2007. |
|
|
Additional information about the Funds’ trustees is provided in the Statement of Additional Information and is available without charge, upon request, by calling 800.551.1700.
ADDITIONAL TAX INFORMATION:
The Funds hereby designate the following amounts or maximum amounts allowable as long term capital gain dividends for the purpose of the dividends paid deduction. The amounts designated here include the utilization of earnings and profits distributed to shareholders on the redemption of shares.
| | | | |
| Fund | | Amount | |
Emerging Markets Small Cap Fund | | $ | 2,110,376 | |
Global Opportunities Fund | | | 17,635,551 | |
Heritage Growth Fund | | | 4,533,509 | |
International Growth Fund | | | 145,345 | |
Large Cap Value Fund | | | 120,193,502 | |
Long/Short Fund | | | 3,814,719 | |
Micro Cap Value Fund | | | 12,598,831 | |
Small Cap Growth Fund | | | 120,513,937 | |
Strategic Income Fund | | | 647,127 | |
Ultra Growth Fund | | | 18,153,849 | |
U.S. Treasury Fund | | | 5,092,088 | |
139
| | |
| WASATCH FUNDS — Supplemental Information (continued) | | |
|
|
|
PROXY VOTING POLICIES, PROCEDURESAND RECORD
A description of the policies and procedures that Wasatch Advisors uses to vote proxies related to the Funds’ portfolio securities is set forth in the Funds’ Statement of Additional Information which is available without charge, upon request, on the Funds’ website at www.WasatchFunds.com or by calling 800.551.1700 and on the Securities and Exchange Commission’s (SEC) website at www.sec.gov.
Wasatch Funds’ proxy voting record is available on the Funds’ website at www.WasatchFunds.com and the SEC’s website at www.sec.gov no later than August 31 for the prior 12 months ending June 30.
QUARTERLY PORTFOLIO HOLDINGS DISCLOSUREON FORM N-Q
The Funds file their complete schedules of investments with the SEC for their first and third fiscal quarters of each fiscal year, commencing with the quarter ended December 31, 2004, on Form N-Q. The Funds’ Form N-Q is available on the SEC’s website at www.sec.gov.
BOARD CONSIDERATIONSFOR ADVISORY AGREEMENTSOFTHE WASATCH FUNDSFOR 2014
At a meeting held on November 7, 2013 (the “Meeting”), the Board of Trustees (the “Board”) of Wasatch Funds Trust (the “Trust”), including the Independent Trustees, unanimously approved the Advisory and Service Contract (the “Advisory Agreement”) between the Trust and Wasatch Advisors, Inc. (the “Advisor”) on behalf of each series of the Trust (each a “Fund”); the sub-advisory agreement between the Advisor and Hoisington Investment Management Company (“HIMCO”) on behalf of the Wasatch-Hoisington U.S. Treasury Fund (the “U.S. Treasury Fund”); and the sub-advisory agreement between the Advisor and 1st Source Corporation Investment Advisors, Inc. (“1st Source”) on behalf of the Wasatch-1st Source Income Fund (the “Income Fund”) (the foregoing sub-advisory agreements are each a “Sub-Advisory Agreement” and collectively, the “Sub-Advisory Agreements,” and HIMCO and 1st Source are each a “Sub-Advisor”).
In preparation for their role in the evaluation of the Advisory Agreement with the Advisor and the Sub-Advisory Agreements, the Independent Trustees met in executive session on October 29, 2013. In addition to the executive session, the Independent Trustees also met at their quarterly meetings, as well as at other times between the quarterly meetings with management. In evaluating the Advisory Agreement and Sub-Advisory Agreements, the Independent Trustees took into account the information provided and the knowledge gained from these meetings. At their regular Board meetings and executive sessions, the Independent Trustees were joined by independent legal counsel. In advance of the meeting, the Board and independent legal counsel received materials and other information that outlined, among other things:
| Ÿ | | the terms and conditions of the Advisory Agreement and |
| | | Sub-Advisory Agreements, including the nature, extent and quality of services provided by the Advisor and each Sub-Advisor; |
| Ÿ | | the organization and business operations of the Advisor and Sub-Advisors, including the experience of persons who have managed and who will manage each respective Fund; |
| Ÿ | | the profitability of the Advisor from serving as advisor to each respective Fund (plus profitability analysis for advisors to unaffiliated investment companies); |
| Ÿ | | the management fees of the Advisor, including comparisons of such fees with the management fees of comparable, unaffiliated funds prepared by an independent third party and the Advisor’s fees for other clients; |
| Ÿ | | the sub-advisory fees of each Sub-Advisor with respect to the U.S. Treasury Fund and Income Fund (including the respective Sub-Advisor’s fee schedule for other clients); |
| Ÿ | | the expenses of each Fund, including comparisons with the expense ratios of comparable, unaffiliated funds compiled by an independent third party; and |
| Ÿ | | each respective Fund’s past performance plus such Fund’s performance compared to other unaffiliated funds compiled by independent third parties and with recognized benchmarks as described below. |
As the Independent Trustees reviewed the materials, they also requested in writing (through their independent legal counsel) and received supplemental information and responses to various questions. In addition to the material provided by the Advisor, the Independent Trustees also received from independent counsel a legal memorandum outlining, among other things the duties of the Independent Trustees under the Investment Company Act of 1940 (the “1940 Act”), as well as the general principles of relevant state law in reviewing and approving advisory contracts; the requirements of the 1940 Act in such matters; an advisor’s fiduciary duty with respect to advisory agreements and compensation; the standards used by courts in determining whether investment company boards of trustees have fulfilled their duties; and factors to be considered by the Board in voting on advisory agreements.
During the executive session noted above, the Independent Trustees met with independent legal counsel to discuss, among other things, the Advisory and Sub-Advisory Agreements, the information provided, and the Independent Trustees’ duties in reviewing and approving advisory contracts. The Independent Trustees, in consultation with independent counsel, also reviewed the factors set out in judicial decisions and Securities and Exchange Commission (“SEC”) directives relating to the approval of advisory contracts. The information provided for the Meeting supplements the information the Board receives throughout the year regarding the Funds’ performance and operations. The Independent Trustees considered the legal advice provided by legal counsel and the materials provided, and relied upon their own business judgment and the knowledge they gained from their meetings and other interactions throughout the year of the Funds, the Advisor, the Sub-Advisors and the services they provided in determining the factors to be considered and the weight to be given to such factors in evaluating advisory agreements. Each Independent Trustee
140
| | |
| | MARCH 31, 2014 (UNAUDITED) |
|
|
|
may have accorded different weight to the various factors in reaching his or her conclusions with respect to the Advisory Agreement and applicable Sub-Advisory Agreement. The Independent Trustees did not identify any single factor as all-important or controlling. The Independent Trustees’ considerations were instead based on a comprehensive consideration of all the information presented. The principal factors considered by the Board and its conclusions are described below.
| A. | | NATURE, EXTENTAND QUALITYOF SERVICES |
In evaluating the nature, extent and quality of the Advisor’s and Sub-Advisors’ services, the Independent Trustees reviewed information concerning the types of services (advisory and non-advisory or administrative services) that the Advisor and Sub-Advisors provide to the applicable Fund; the performance record of the applicable Fund; and information describing the Advisor’s and Sub-Advisors’ organization, business and financial health. In connection with their service as Independent Trustees of the Trust, the Independent Trustees also periodically have met with the key investment personnel of the Advisor and Sub-Advisors managing the respective Fund’s portfolio and have evaluated their professional experience, qualifications and credentials as well as their investment approach and research process. The Board recognized the depth and quality of the Advisor’s investment management and research capabilities and the research intensive investment process followed by the Advisor. The Independent Trustees considered the compensation arrangements of portfolio managers to evaluate the ability of the Advisor to attract and retain high quality investment personnel, preserve stability, and reward performance without providing an incentive for investing inconsistently with each Fund’s disclosures and without taking undue risks.
In addition to the foregoing, in light of the regulatory emphasis on compliance, in reviewing the services that have been provided to each Fund, the Independent Trustees considered the Advisor’s and Sub-Advisors’ compliance and regulatory history. The Trustees considered the Advisor’s policies and procedures to assure compliance with applicable laws and regulations and its commitment to these programs. The Trustees also considered the Advisor’s approach, activities and procedures toward risk management and its continual efforts to enhance and refine its ability to identify and manage risks.
In their review of services, the Independent Trustees evaluated the quality of administrative or non-advisory services provided. The terms of the Advisory Agreement provide that the Advisor shall administer the Trust’s affairs to the extent requested by and subject to the supervision of the Board for the period and terms of the contract. In this regard, the Advisor oversees the daily operations of the Funds. The Advisor provides business, administrative, compliance, marketing and other services required to operate the Funds, such as assistance with the preparation and filing of regulatory and tax reports, the preparation and distribution of prospectuses and shareholder reports, the provision of information to the Trustees, the analysis to ensure compliance with federal and state laws and regulations, the
valuation of portfolio securities, foreign registrations, cross trade monitoring, insurance renewals and the oversight of the performance of the Funds’ service providers (e.g., administrator, fund accountant, transfer agent and custodian) to help ensure that these service providers continue to provide quality services. The Advisor further oversees the Sub-Advisors to the respective Funds. The Trustees further recognized the Advisor’s efforts to keep the Trustees informed about matters relevant to a Fund and its shareholders. The Advisor also pays for office space and facilities for each Fund.
With respect to the Sub-Advisors, it was noted that the Sub-Advisory Agreements are essentially agreements for portfolio management services only and the Sub-Advisors were not expected to supply other significant administrative services. The Trustees further noted that the Advisor, based on its evaluation of the Sub-Advisors, recommended the renewal of each Sub-Advisory Agreement.
Based on their review, the Independent Trustees found that, overall, the nature, extent and quality of services provided under the Advisory Agreement and the Sub-Advisory Agreements were satisfactory on behalf of each applicable Fund.
| B. | | THE INVESTMENT PERFORMANCEOFTHE FUNDS |
In evaluating each Fund’s performance, the Trustees reviewed both short-term and long-term performance of each Fund relative to its peers and relevant benchmarks. More specifically, the Independent Trustees reviewed, among other things, a report prepared by an unaffiliated third party comparing the respective Fund’s total return for the one-, two-, three-, four-, five-, and 10-year periods ended August 31, 2013 (or for the periods available for Funds that did not exist for part of the foregoing timeframe) compared to the performance of unaffiliated funds with similar investment objectives or classifications (a “Peer Universe”), to a more focused subset thereof, if any (a “Peer Group”) and a benchmark assigned by the unaffiliated third party (the “Benchmark”) for the prescribed periods. The Independent Trustees also reviewed materials reflecting the respective Fund’s historic performance for the quarter, one-, three-, five-, and 10-year periods ended September 30, 2013 (or for the periods available for Funds that did not exist for part of the foregoing timeframe together with the average annual return since inception for Funds with the shorter duration) compared to additional benchmark(s) and unaffiliated funds in its investment category. In addition, the Independent Trustees received analyst reports provided by an unaffiliated party for the following Funds: Core Growth Fund, Emerging Markets Small Cap Fund, Global Opportunities Fund, International Growth Fund, Small Cap Growth Fund and Long/Short Fund. This information supplemented the performance information provided to the Board at each of its quarterly meetings as well as at other meetings or executive sessions during the year.
The Board evaluated Fund performance in light of the respective Fund’s investment objectives, investment parameters and guidelines and recognized that the objectives, investment parameters and guidelines of peers
141
| | |
| WASATCH FUNDS — Supplemental Information (continued) | | |
|
|
|
and/or Benchmarks may differ from that of the Funds, and therefore, the performance results may also differ. In this regard, the Independent Trustees recognized the limitations on some of the usefulness of the performance comparison information as the closest Peer Group for a Fund may not adequately reflect the Wasatch Fund’s investment strategies and may be invested in sectors or industries in which the applicable Fund has limited or no exposure, including the Micro Cap Fund, the Micro Cap Value Fund (collectively, the “Micro Cap Funds”) and the Small Cap Value Fund. As the Peer Group assigned to the Micro Cap Funds appeared to generally focus on companies with larger market capitalizations than those sought by the Micro Cap Funds, the Independent Trustees also reviewed the Micro Cap Funds’ performance compared to a custom peer group provided by the Advisor. As the performance data for the Small Cap Value Fund included small cap growth funds, the Independent Trustees also reviewed the annualized total return performance history of the Small Cap Value Fund for the one-, three-, five- and 10-year periods ended September 30, 2013 compared to the Russell 2000 Value Index and its peer ranking in the one-, three- and five-year periods ended September 31, 2013 in the small cap value fund category.
In addition to the limitations on some of the comparative performance data, the Independent Trustees also recognized that the investment experience of a particular shareholder in the Wasatch Funds will vary depending on when such shareholder invests in the applicable Fund and that a Fund’s performance results may differ significantly based on the time period being measured. Accordingly, although the performance below reflects the performance results for the time periods ended August 31, 2013, the Board recognized that selecting a different ending time period may derive different results. The Board noted that certain Funds offer two classes, and the performance of the classes of a particular Fund should be substantially similar on a relative basis because all of the classes are invested in the same portfolio of securities and that differences in performance among classes could be principally attributed to the variations in servicing expenses of each class. In addition, with respect to any Funds for which the Board has identified performance concerns, the Board monitors such Funds closely until performance improves, discusses with the Advisor the reasons for such results, considers those steps necessary or appropriate to address such issues, and reviews the results of any efforts undertaken. Based on their review of performance, the Independent Board Members determined the following:
Certain Funds demonstrated generally favorable performance, outperforming their respective Benchmarks and the median of their Peer Group over various periods. In this regard, excluding the one-year period, the Emerging Markets Small Cap Fund outperformed the median of its Peer Group and outperformed its Benchmark for the two-, three-, four- and five-year periods. Similarly, excluding the one-year period, the U.S. Treasury Fund outperformed the median of its Peer Group for the two-, three-, four-, five- and 10-year periods and its Benchmark for the two-, three-, four- and five-year periods. The Core Growth Fund outperformed its
Benchmark for the three-, four-, five- and 10-year periods and outperformed or matched the median of its Peer Group for the three-, four- and five-year periods. The Global Opportunities Fund outperformed its Benchmark for the one-, two-, three- and four-year periods and the median of its Peer Group for the two-, three- and four-year periods. The Strategic Income Fund similarly outperformed the median of its Peer Group and its Benchmark for the one-, two-, three-, four- and five-year periods. The Long/Short Fund outperformed the median of its Peer Group for the one-, two-, three-, four-, five- and 10-year periods and its Benchmark for the one-, two-, three-, four- and five-year periods. Similarly, the International Growth Fund and the World Innovators Fund outperformed their Benchmarks and the median of their Peer Groups for the one-, two-, three-, four-, five- and 10-year periods.
The Independent Trustees further determined that the investment performance over time of the following Funds also was satisfactory. The performance of the International Opportunities Fund was generally satisfactory. The Fund outperformed its Benchmark for the one-, four- and five-year periods and the median of its Peer Group in the one-, two-, four- and five-year periods. Although the Small Cap Growth Fund underperformed its Benchmark for the one- and two-year periods, the Fund outperformed its Benchmark for the longer three-, four-, five- and 10-year periods and provided generally comparable performance or outperformed the median of its Peer Group in the two-, three-, four-, five- and 10-year periods. With respect to the Small Cap Value Fund, the Board recognized that the Fund outperformed its Benchmark in the one-, two-, three- and four-year periods and outperformed or matched the performance of the median of its Peer Group for the one-, two-, three-, four- and five-year periods. Although the Income Fund underperformed its Benchmark and the median of its Peer Group over various periods, the Board considered the objectives of the Fund and the factors underlying performance and considered its performance satisfactory. The Board also noted that the Micro Cap Fund provided performance generally comparable to the performance of its Benchmark and the median of its Peer Group over the one-, two-, three-, four-, five- and 10-year periods and had provided favorable absolute returns for the year-to-date period ended September 30, 2013. The Micro Cap Value Fund also outperformed its Benchmark for the one-, two-, five- and 10-year periods as well as the median of its Peer Group in the one-, four-, five- and 10-year periods and had favorable absolute performance for the year-to-date period ended September 30, 2013.
The Independent Trustees noted that the Emerging India Fund, Emerging Market Select Fund and Frontier Emerging Small Countries Fund were new funds with shorter performance histories available thereby limiting the ability to make a meaningful assessment of performance. Nevertheless, the Independent Trustees noted that the Emerging India Fund demonstrated generally favorable performance compared to its peers, performing in the first quintile of its Peer Group and outperforming the median of its Peer Group for the one- and two- year periods, and the Frontier Emerging Small Countries Fund was in the first quintile of its Peer Group,
142
| | |
| | MARCH 31, 2014 (UNAUDITED) |
|
|
|
outperforming its Benchmark and the median of its Peer Group for the one-year period.
Although the Large Cap Value Fund outperformed its Benchmark and the median of its Peer Group for the 10-year period, the Fund has experienced more challenged performance in the shorter periods. The Board considered the steps taken to address performance issues, including portfolio management changes. The Board is encouraged by these steps and will continue to monitor the Fund. The Board also recognized that the Ultra Growth Fund experienced challenged performance, underperforming its Benchmark and the median of its Peer Group over various periods, including the most recent one-year period. In addition, although the Heritage Growth Fund outperformed its Benchmark and the median of its Peer Group in the five-year period, the Fund underperformed its Benchmark and the median in shorter periods. The Board considered the factors contributing to the performance of the Funds and will continue to monitor the Funds and any steps taken by the Advisor to address performance issues.
| C. | | FEES, EXPENSESAND PROFITABILITY |
The Independent Trustees considered the fees of the Advisor and Sub-Advisors. In their evaluation of fees and expenses, the Independent Trustees considered the Advisor’s management fees and the expense ratios for each Fund in absolute terms as well as compared to the fees and expenses of funds with similar objectives. In this regard, the Independent Trustees reviewed and considered, among other things, comparisons of each respective Fund’s gross and net management fees, total expenses (including and excluding 12b-1/ non-12b-1 service fees), and non-management expenses (such as transfer agency, custodian, administrative and accounting fees) with those of unaffiliated funds in its Peer Group, compiled by an independent third party, subject to the following: With respect to the Micro Cap Funds, the Independent Trustees recognized certain limitations with the Peer Group as described above and therefore also reviewed comparisons of each respective Fund’s management fee and net expense ratio with those of a custom peer group provided by the Advisor. In reviewing fees, the Independent Trustees also considered the expense limitation agreement with the Advisor for the Funds and the amounts the Advisor has reimbursed to the Funds for the last three fiscal years (if any). The Independent Trustees also considered a Fund’s fees in light of its performance. In their evaluation of the fees, the Independent Trustees considered, among other things, the following factors: With respect to the Investor Class shares of the Micro Cap Fund, Micro Cap Value Fund, and Small Cap Growth Fund, such Funds had gross advisory fees and net expense ratios above the median of their respective Peer Group. With respect to the Investor Class and Institutional Class shares of the Small Cap Value Fund, such Fund had gross advisory fees and a net expense ratio below the median of its Peer Group. The Independent Trustees, however, noted the proposed reduction in the advisory fees and expense cap limitations for the Micro Cap and Micro Cap Value Funds.
The Trustees further recognized the historic advisory fee reduction of the Small Cap Value Fund that was effective in January 2012. In evaluating the fees for these Funds, the Independent Trustees also considered, among other things, the nature of the asset class (small or micro-cap), the Advisor’s expertise in this asset class, the due diligence needed to evaluate these small companies and the capacity constraints of the asset class. In their considerations, the Independent Trustees recognized the Advisor’s expertise in the small cap and micro cap arena and the research intensive approach the Advisor follows in evaluating companies in these categories and the related costs incurred. The Independent Trustees also recognized the capacity constraints associated with investing in small and micro cap stocks which limit the revenue potential for the Advisor. More specifically, the Trustees recognized that it is generally difficult to replicate the performance of small cap and micro cap funds at higher asset levels, and, therefore, it is beneficial to maintain such funds at levels that maintain the integrity of the investment strategies for the benefit of shareholders. To limit the size of the Funds, the Advisor has had a practice of closing or restricting investments in the Funds as necessary or appropriate. The Funds that have been closed to new and sometimes existing investors in the past include: the Core Growth Fund, World Innovators Fund, International Growth Fund, Emerging Markets Small Cap Fund, International Opportunities Fund, Micro Cap Fund, Micro Cap Value Fund, Small Cap Growth Fund, Small Cap Value Fund and Ultra Growth Fund. This practice, however, also limits the Advisor’s ability to earn fees on a larger asset base, and exposes the Advisor to reduced revenues from asset outflows if a Fund is closed to, or is otherwise limited in, permitting new investments. In light of the foregoing, the Independent Trustees, when reviewing fees, also seek to encourage the Advisor’s practice of closing Funds when necessary or appropriate to maintain or enhance performance and to compensate the Advisor for the loss revenue potential resulting from this practice. Given the foregoing factors, among others, the Independent Trustees determined the advisory fees for the foregoing Funds were acceptable.
With respect to the Investor Class shares of the Emerging Markets Small Cap Fund, Frontier Emerging Small Countries Fund, Global Opportunities Fund, International Opportunities Fund, and World Innovators Fund, the Independent Trustees recognized that the gross advisory fees and net expense ratios were above the median of each Fund’s respective Peer Group. With respect to the Investor Class and Institutional Class shares of the Emerging Markets Select Fund, the gross advisory fees and net expense ratio were above the median of its Peer Group although the net advisory fees, after fee waivers and expense reimbursements, were below the median. The Independent Trustees noted that with respect to the Investor Class of the Emerging India Fund and the International Growth Fund, the gross advisory fees were above the median of their Peer Groups and the total expense ratios were below or matched the median of their Peer Groups. As with the above Funds, the Independent Trustees also considered any capacity constraints of these Funds that limit their asset size, the uniqueness of the Fund, and the expertise of the Advisor. The Independent
143
| | |
| WASATCH FUNDS — Supplemental Information (continued) | | |
|
|
|
Trustees also noted that the international aspect of these Funds adds an additional cost to the Advisor’s research-intensive investment program to cover an international landscape and to invest in countries outside of the U.S. Given the foregoing factors, among others, the Independent Trustees determined the advisory fees for the foregoing Funds are acceptable.
With respect to the Core Growth Fund, the Independent Trustees noted that the gross advisory fee of the Investor Class and Institutional Class shares was above the median for its Peer Group, but the net expense ratio for each class was below the median of its Peer Group. The Trustees also considered the capacity constraints of the Fund and the research-intensive approach of the Advisor. Given the foregoing factors, among others, the Independent Trustees determined that the advisory fee for the foregoing Fund was acceptable.
With respect to the Heritage Growth Fund and the Strategic Income Fund, the Independent Trustees noted that the gross advisory fees and net expense ratios of the Investor Class shares of these Funds were below the median of their respective Peer Group. With respect to the Investor Class and Institutional Class shares of the Long/Short Fund, the Independent Trustees also noted that the gross advisory fee was above the median of its respective Peer Group, but the total expense ratio was below the median. Given their investment strategies, the Independent Trustees recognized that these Funds generally are not subject to capacity constraints limiting the size of these Funds upon which advisory fees are calculated as are other Funds in the complex. Based on the foregoing factors, among others, the Independent Trustees determined that the advisory fees for the foregoing Funds were acceptable.
With respect to the Ultra Growth Fund, the Independent Trustees noted that the gross advisory fee and net expense ratio of the Investor Class shares were above the median for its Peer Group. The Trustees considered any capacity constraints applicable to the Fund. The Trustees further noted that the advisory fee and expense limitation of the Fund previously had been reduced in 2011. Given the foregoing factors, among others, the Independent Trustees determined that the advisory fee for the foregoing Fund was acceptable.
With respect to the Investor Class and Institutional Class shares of the Large Cap Value Fund and the Investor Class shares of the U.S. Treasury Fund, the Funds’ gross advisory fees and net expense ratios were above the median for their respective Peer Group. With respect to the Investor Class of the Income Fund, the Fund’s gross advisory fee was above the median of its Peer Group, but the net total expense ratio was below the median. Although the Trustees recognized that such Funds should not experience capacity constraints, the Independent Trustees determined that the fees were acceptable with respect to the Funds.
Given the foregoing factors, among others, the Independent Trustees determined that the advisory fee for the foregoing Funds were acceptable.
| 2. | Fees Charged to Other Advisor and Sub-Advisor Clients |
In reviewing fees, the Independent Trustees also compared the advisory fees to the fees the Advisor assesses other types of clients, including institutional and high net worth separate accounts, wrap accounts, collective trusts and funds sponsored by other sponsors. Currently, the Advisor manages separate account client assets in styles similar to those used for certain Funds, including the Core Growth Fund, Emerging Markets Small Cap Fund, Emerging Markets Select Fund, Frontier Emerging Small Countries Fund, Heritage Growth Fund, International Growth Fund, Large Cap Value Fund, Long/Short Fund, Micro Cap Fund, Small Cap Growth Fund, Small Cap Value Fund and Ultra Growth Fund. With respect to separate accounts, the weighted average fees for these accounts are generally lower than the comparable Fund (except in the case of the Heritage Growth Fund and Ultra Growth Fund). The Independent Trustees considered the differences in the product types, including the services provided, noting that the Advisor seeks to charge a higher fee to clients who require a higher degree of service. In this regard, the Independent Trustees noted that the range of services provided to a Fund in managing and operating a registered investment company is more extensive, requiring more time, personnel and resources, than the services required of a separately managed account. The Advisor provides services to each Fund that extend beyond the portfolio management services provided to its separate account clients. As described in more detail above, these services include administrative services, operational expertise (such as portfolio accounting, pricing, foreign registrations and foreign filings), oversight of third party service providers (including sub-advisors), Trustee support, monitoring daily purchases and redemptions, shareholder services and communications, tax administration, marketing and other services required to operate a Fund. Further, the Independent Trustees recognized that each Fund operates in a highly regulated industry requiring extensive compliance. Such responsibilities generally are not required to the same extent for separate accounts. In addition, the Trustees considered the fees the Advisor assesses for other types of clients, including wrap accounts, collective investment trusts and sub-advisory accounts in which the fees may be lower but the services provided are also reduced. In light of the foregoing, the Independent Trustees determined that the nature and number of services provided to operate a Fund merit higher fees than those of separate and other accounts.
In considering the fees of the Sub-Advisors for the Income Fund and U.S. Treasury Fund, the Independent Trustees also considered the pricing schedule the respective Sub-Advisor charges for investment management services for other clients. In this regard, the sub-advisory fee for the U.S. Treasury Fund was approximately in the middle of HIMCO’s fee schedule. Similarly, the sub-advisory fee for the Income Fund was at the low end of fees 1st Source assesses for institutional accounts. The Independent Trustees also noted that the sub-advisory fees were established through arm’s length negotiations between the Advisor and the Sub-Advisors, which are unaffiliated with the Advisor.
144
| | |
| | MARCH 31, 2014 (UNAUDITED) |
|
|
|
| 3. | Profitability of the Advisor |
The Independent Trustees reviewed profitability information for the Advisor derived from its relationship with each Fund for the calendar year ended December 31, 2012 and pro forma profitability for the calendar year ended December 31, 2013. In reviewing profitability, the Independent Trustees reviewed the methodology utilized to allocate revenue and expenses of the Advisor among the Funds. In considering profitability, the Independent Trustees recognized the inherent limitations in determining profitability, which may be affected by many factors, including the allocation of expenses across multiple investment products served by the Advisor. The allocation of research and personnel expenses among the Funds and other products is also particularly difficult given the Advisor’s shared research culture. The Independent Trustees also noted that the Advisor is privately held and is taxed as a Subchapter S corporation, thus certain expenses had to be attributed and/or estimated. The Independent Trustees further reviewed Wasatch’s consolidated balance sheet as of December 31, 2012.
In addition to reviewing the Advisor’s profitability, the Trustees also reviewed the Advisor’s revenues and margins compared to publicly available information concerning unaffiliated publicly traded investment managers. However, the Independent Trustees recognized the difficulties in comparing the profitability of various advisors given that, among other things, many of these managers are much larger than the Advisor, have different lines of business, provide different services, may employ different expense allocations and charges, may not be representative of the industry and may not disclose profitability information per fund or product line. Notwithstanding the foregoing, the Independent Trustees noted that the Advisor’s profitability is within a reasonable range compared to the peer group of unaffiliated advisors. Based on their review, the Independent Trustees were satisfied that the Advisor’s level of profitability from its relationship with each Fund was not unreasonable in light of the services provided.
With respect to the Sub-Advisors, although a profitability analysis was not available, the Independent Trustees received certain financial statements of the Sub-Advisors. The Trustees reviewed HIMCO’s balance sheet as of December 31, 2012 and 2011 and 1st Source’s balance sheet as of June 30, 2013. Considering the Sub-Advisors’ fee schedules and the fact that the sub-advisory fees were established through arm’s length negotiations, the Independent Trustees concluded that HIMCO’s and 1st Source’s profitability from the Sub-Advisor’s relationship with the U.S. Treasury Fund and Income Fund, respectively, was not unreasonable.
In addition to the above, the Independent Trustees also considered that the Advisor benefits from soft dollar arrangements whereby it receives brokerage and research services from brokers that execute a Fund’s purchases and sales of securities, as described in further detail below.
| D. | | ECONOMIESOF SCALEAND WHETHER FEE LEVELS REFLECT THESE ECONOMIESOF SCALE |
With respect to economies of scale, the Independent Trustees recognized the potential benefits resulting from the costs of a Fund being spread over a larger asset base, although economies of scale are difficult to measure and predict with precision. One method to help shareholders share in these benefits is to include breakpoints in the advisory fee schedule. The advisory fee schedules of the Funds, however, do not have breakpoints. In this regard, the Independent Trustees, as noted above, recognized the capacity constraints of Funds investing in small-and micro-cap companies. Because the Advisor generally seeks to maintain the assets of such Funds at a level that management believes can be managed effectively, the potential for the assets to grow beyond these levels to achieve economies of scale is limited. Further, with respect to the Funds without such capacity constraints, the Independent Trustees also reviewed the factors the Advisor considered in proposing a fee level and recognized the Advisor’s position that to the extent economies of scale exist, the current level of advisory fees reflects such economies of scale. Considering the factors above, the Independent Trustees concluded that the absence of breakpoints was acceptable and that such economies as exist are adequately reflected in the Advisor’s fee structure.
In evaluating fees, the Independent Trustees also considered any indirect benefits or profits the Advisor or its affiliates may receive as a result of its relationship with the Funds. In this regard, the Independent Trustees considered that the Advisor benefits from soft dollar arrangements pursuant to which it receives research from brokers that execute an applicable Fund’s brokerage transactions. The Advisor may receive soft dollar benefits from each Fund, subject to the exceptions noted below for the sub-advised Funds. The Independent Trustees reviewed information regarding the soft dollar arrangements including, among other things, the commissions paid, the research credits earned and the services provided. Further, the Independent Trustees at prior meetings have had extensive discussions regarding the soft dollar arrangements. The Independent Trustees recognized that soft dollar arrangements provide benefits to the Advisor derived from a Fund’s brokerage transactions by obtaining research that it would otherwise have to acquire with hard dollars. Accordingly, the Advisor’s profitability would be somewhat lower if it did not receive the research services pursuant to soft dollar arrangements. The Independent Trustees took these “fall out” benefits, if any, into account when reviewing the level of advisory fees. With respect to the Sub-Advisors, the Independent Trustees recognized that the Sub-Advisors currently do not have soft dollar arrangements on behalf of their respective Funds.
| F. | | ANNUAL APPROVALOF ADVISORYAND SUB-ADVISORY AGREEMENTS |
The Independent Trustees did not identify any single factor discussed previously as all-important or controlling. The
145
| | |
| WASATCH FUNDS — Supplemental Information (continued) | | MARCH 31, 2014 (UNAUDITED) |
|
|
|
Independent Trustees, including a majority of Independent Trustees, concluded that the terms of the Advisory Agreement for each Fund, the HIMCO Sub-Advisory Agreement for the U.S. Treasury Fund, and the 1st Source Sub-Advisory Agreement for the Income Fund were fair and reasonable, that the Advisor’s and Sub-Advisors’ fees are reasonable in
light of the services provided to each respective Fund, and that the Advisory Agreement should be approved on behalf of each Fund and the Sub-Advisory Agreements should be approved on behalf of the U.S. Treasury Fund and the Income Fund, respectively.
146
| | |
| WASATCH FUNDS — SERVICE PROVIDERS | | MARCH 31, 2014 (UNAUDITED) |
|
|
|
INVESTMENT ADVISOR
Wasatch Advisors, Inc.
505 Wakara Way, 3rd Floor
Salt Lake City, UT 84108
SUB-ADVISORFORTHE WASATCH-1ST SOURCE INCOME FUND
1st Source Corporation Investment Advisors, Inc.
100 North Michigan Street
South Bend, IN 46601
SUB-ADVISORFORTHE U.S. TREASURY FUND
Hoisington Investment Management Co.
6836 Bee Caves Rd.
Building 2, Suite 100
Austin, TX 78746
ADMINISTRATORAND FUND ACCOUNTANT
State Street Bank and Trust Company
801 Pennsylvania Avenue
Kansas City, MO 64105
DISTRIBUTOR
ALPS Distributors, Inc.
1290 Broadway, Suite 1100
Denver, CO 80203
TRANSFER AGENT
UMB Fund Services, Inc.
803 West Michigan Street, Suite A
Milwaukee, WI 53233-2301
CUSTODIAN
State Street Bank and Trust Company
801 Pennsylvania Avenue
Kansas City, MO 64105
LEGAL COUNSELTO WASATCH FUNDSANDINDEPENDENT TRUSTEES
Chapman and Cutler, LLP
111 West Monroe Street
Chicago, IL 60603
INDEPENDENT REGISTERED PUBLIC ACCOUNTING FIRM
PricewaterhouseCoopers LLP
1100 Walnut, Suite 1300
Kansas City, MO 64106
147
| | |
| WASATCH FUNDS — Guide to Understanding Financial Statements | | |
|
|
|
Wasatch Funds provides reports to shareholders twice a year. The annual report is for the Funds’ fiscal year which ends September 30. The semi-annual report is for the six months or period ending March 31. Additionally, the Funds’ schedules of investments for the first and third quarters of each fiscal year are available to shareholders as described on page 140. These reports provide shareholders with important information that will help them evaluate the management and performance of their investments. It is the desire of Wasatch Funds to help shareholders stay in tune with their investments. If you have any questions about the information in this report, a shareholder services representative will be happy to assist you when you call 800.551.1700.
SCHEDULEOF INVESTMENTS
The holdings of each Wasatch Fund are detailed in the “Schedule of Investments.” This section provides a snapshot of the securities each Fund was invested in on the last day of the reporting period. The Wasatch Equity Funds invest primarily in Common Stocks of companies which are grouped together by industry. The Wasatch-1st Source Income Fund invests primarily in fixed income securities. The U.S. Treasury Fund invests primarily in U.S. Treasury securities. The Equity Funds will typically have only minor holdings in Short-Term Investments. At times the Funds may take temporary defensive positions by increasing cash or holdings in Short-Term Investments. Please see the prospectus under “Additional Information about the Funds.”
STATEMENTSOF ASSETSAND LIABILITIES
These financial statements show the Assets and Liabilities of a Fund on the last day of the reporting period. A Fund’s Assets include the value of securities owned, amounts receivable for purchases of Fund shares (capital shares receivable), securities sold, interest and dividends, prepaid expenses and other assets. Liabilities are amounts owed for shareholder redemptions (capital shares payable), securities purchased, investment advisory fees (payable to Advisor) and other payables. Totaling up the assets and subtracting the liabilities results in a Fund’s Net Assets.
Net Assets consist of capital stock, paid-in capital in excess of par, undistributed net investment income or loss, undistributed net realized gain or loss on investments and net unrealized appreciation or depreciation on investments. Capital stock is stock authorized by a company’s charter and having par value, stated value or no par value. Par value is set by the company issuing the shares and has no relation to Net Asset Value. The par value of one share of each Wasatch Fund is $.01. Paid-in capital in excess of par is capital received from shareholders in exchange for Fund shares that exceeds the par value of the shares. For example, if you bought one share of a Fund for $10, $.01 would show as “Capital stock” on the books of the Fund, and $9.99 would be accounted for under “Paid-in capital in excess of par.” Undistributed net investment income or loss is the amount of net investment income or loss of a Fund since inception that has not been paid to shareholders as a dividend.
Undistributed net realized gain (loss) on investments is the amount of net realized gains or losses generated by a Fund since inception that have not been distributed to shareholders in the form of a capital gain distribution. A gain or loss is realized when a security is sold by a Fund. Net unrealized appreciation (depreciation) on investments is the change in value from the purchase price of securities a Fund continues to hold.
The number of shares a Fund is authorized to sell can be found under Capital Stock Issued and Outstanding. Issued and outstanding indicates the number of shares owned by shareholders.
Net Asset Value (NAV), Redemption Price and Offering Price Per Share shows the value of one outstanding share of a Fund on the date of the report. A Fund’s share price (NAV) is calculated by dividing the value of all securities and other assets owned by a Fund, less the liabilities charged to that Fund, by the number of Fund shares outstanding. The share price is calculated at the close of business of the New York Stock Exchange on each day the Exchange is open for trading. Please see Wasatch Funds’ prospectus for more information about how share prices are calculated. Information about how the share price is affected by a Fund’s operation can be found under “Financial Highlights” on page 149.
STATEMENTSOF OPERATIONS
Statements of Operations show investment income and expenses for each Fund as well as realized gains or losses from securities sold and the appreciation or depreciation in the value of a Fund’s holdings during the reporting period.
Investment Income shows Interest and Dividends earned from interest-bearing and dividend-paying securities in a Fund’s portfolio.
Expenses show the various fees and expenses paid out of a Fund’s assets such as the fee paid to Wasatch Advisors, the Funds’ investment advisor. Additional fees include shareholder servicing, fund administration and accounting, custody of fund assets, federal and state registration, legal counsel, auditing and trustees’ fees and other expenses. The Funds pay for printing and mailing statements, prospectuses, annual reports and semi-annual reports to shareholders.
Net Investment Income (Loss) is the amount of dividends and interest income earned on securities held by a Fund, less the Fund’s expenses.
Net realized gain (loss) on investments and foreign currency translations is the net gain or loss on securities a Fund has sold. Change in unrealized appreciation (depreciation) on investments and foreign currency translations is the change in value of securities a Fund continues to hold.
Net gain (loss) on investments is the result of changes in the market value of securities a Fund has sold and securities it continues to hold.
STATEMENTSOF CHANGESIN NET ASSETS
Net Assets are a Fund’s remaining assets after taking into consideration any liabilities. Statements of Changes in Net
148
| | |
| | MARCH 31, 2014 (UNAUDITED) |
|
|
|
Assets show the increase or decrease in a Fund’s net assets during the reporting period. Investment operations, dividends and capital share transactions affect a Fund’s net assets. Operations is a summary of the Statements of Operations. It includes investment income or loss, net realized gain or loss on investments and foreign currency translations a Fund has sold as well as appreciation or depreciation in the value of investments a Fund continues to hold.
Dividends are distributed by Wasatch Funds to sharehold-ers when Fund investments have earned income in excess of net expenses or when capital gains in excess of capital losses are realized from the sale of securities. Most shareholders choose to reinvest their dividends and capital gain distribu- tions. Each Fund is required by Internal Revenue Code regulations to distribute substantially all of its net investment income and capital gains to shareholders in order to retain its status as a “regulated investment company.”
Capital share transactions are any transactions involving shares of a Fund, including the selling of Fund shares, shares issued by a Fund to shareholders for the reinvestment of dividends, and share redemptions.
FINANCIAL HIGHLIGHTS
The Financial Highlights contain important historical operating information that you may find useful in making decisions or understanding the performance of your investment.
Net Asset Value (NAV) is defined under “Statements of Assets and Liabilities” on page 148. The difference between the Net asset value, beginning of period and the Net asset value, end of period in the Financial Highlights is the change in value of a Fund’s shares over the reporting period, but not its total return.
Income (loss) from investment operations shows how the share price was affected by a Fund’s operations on a per share basis. Net investment income (loss) is the per share
amount of dividends and interest income earned on securities held by a Fund, less the Fund’s expenses. Net realized and unrealized gains (losses) on investments is the per share increase or decrease in the value of securities a Fund holds or has sold during the reporting period. Gains or (losses) are realized when securities are sold. Gains or (losses) are unrealized when securities increase or decrease in value but are not sold.
Distributions are the per share amount a Fund paid to shareholders from net investment income and net realized gains.
Total return is the percentage increase or decrease in the value of an investment over a stated period of time. A total return percentage includes both changes in unrealized and realized gains and income. For the purposes of calculating total return, it is assumed that dividends and distributions are reinvested at the share price on the ex-dividend date of the distribution. A FUND’S TOTAL RETURN CANNOT BE COMPUTED DIRECTLY FROM THE FINANCIAL HIGHLIGHTS.
Ratios to Average Net Assets and Supplemental Data are provided to help you better understand your investment. Net assets, end of period, are the net assets of a Fund on the reporting date. Ratio of expenses to average net assets shows the total of a Fund’s operating expenses divided by its average net assets for the stated period before and after waivers and reimbursements by the Advisor, if any. Ratio of net investment income (loss) to average net assets shows a Fund’s net investment income (loss) divided by its average net assets for the stated period before and after waivers and reimbursements by the Advisor, if any. Portfolio turnover rate measures a Fund’s buying and selling activity during the reporting period. It is computed by dividing total purchases or sales, whichever is less, by the average monthly market value of a Fund’s portfolio securities. This calculation does not include securities with a maturity date of less than 12 months.
TELEPHONE
800.551.1700
M - F, 7:00 a.m. to 7:00 p.m. CT
Automated Line, 24 Hours
U.S. MAIL
Wasatch Funds
P.O. Box 2172
Milwaukee, WI 53201-2172
OVERNIGHT MAIL
Wasatch Funds
803 West Michigan Street, Suite A
Milwaukee, WI 53233-2301
ONLINE
www.WasatchFunds.com
shareholderservice@wasatchfunds.com
149

Not required.
| Item 3: | Audit Committee Financial Expert. |
Not required.
| Item 4. | Principal Accountant Fees and Services. |
Not required.
| Item 5. | Audit Committee of Listed Registrants. |
Not applicable.
| Item 6. | Schedule of Investments. |
(a) Schedule of Investments is included as a part of the report to shareholders filed under Item 1 of this Form N-CSR.
(b) Not applicable.
| Item 7. | Disclosure of Proxy Voting Policies and Procedures for Closed-End Management Investment Companies. |
Not applicable.
| Item 8. | Portfolio Managers of Closed-End Investment Companies. |
Not applicable.
| Item 9. | Purchases of Equity Securities by Closed-End Management Investment Company and Affiliated Purchasers. |
Not applicable.
| Item 10. | Submission of Matters to a Vote of Security Holders. |
There have been no material changes to the procedures by which shareholders may recommend nominees to the Registrant’s board of trustees, where those changes were implemented after the Registrant last provided disclosure in response to this item.
| Item 11. | Controls and Procedures. |
| (a) | The Registrant’s principal executive and principal financial officers have concluded that the Registrant’s disclosure controls and procedures (as defined in Rule 30a-3(c) under the Investment Company Act of 1940, as amended (the “1940 Act”)) are effective, as of a date within 90 days of the filing date of this Form N-CSR based on their evaluation of these controls and procedures required by Rule 30a-3(b) under the 1940 Act) and Rules 13a-15(b) or 15d-15(b) under the Securities Exchange Act of 1934). |
| (b) | There were no changes in the Registrant’s internal control over financial reporting (as defined in Rule 30a-3(d) under the 1940 Act) that occurred during the Registrant’s second fiscal quarter of the period covered by this report that has materially affected, or is reasonably likely to materially affect, the Registrant’s internal control over financial reporting. |
| | |
| |
| (a)(1) | | Not required. |
| |
| (a)(2) | | The certifications required by Rule 30a-2(a) of the 1940 Act are attached hereto. |
| |
| (a)(3) | | Not applicable. |
| |
| (b) | | The certifications required by Rule 30a-2(b) of the 1940 Act and Section 906 of the Sarbanes-Oxley Act of 2002 are attached hereto. |
SIGNATURES
Pursuant to the requirements of the Securities Exchange Act of 1934 and the Investment Company Act of 1940, the Registrant has duly caused this report to be signed on its behalf by the undersigned, thereunto duly authorized.
| | |
| WASATCH FUNDS TRUST |
| |
| By: | | /s/ Samuel S. Stewart, Jr. |
| | Samuel S. Stewart, Jr. President (principal executive officer) of Wasatch Funds Trust |
Date: June 5, 2014
Pursuant to the requirements of the Securities Exchange Act of 1934 and the Investment Company Act of 1940, this report has been signed below by the following persons on behalf of the Registrant and in the capacities and on the dates indicated.
| | |
| |
| By: | | /s/ Samuel S. Stewart, Jr. |
| | Samuel S. Stewart, Jr. President (principal executive officer) of Wasatch Funds Trust |
Date: June 5, 2014
| | |
| |
| By: | | /s/ Cindy B. Firestone |
| | Cindy B. Firestone Treasurer (principal financial officer) of Wasatch Funds Trust |
Date: June 5, 2014