0000806633wasatchadvisors:C000166041Member2017-11-300000806633wasatchadvisors:WasatchIndexMSCIACWorldIndex10348BroadBasedIndexMember2024-05-310000806633wasatchadvisors:WasatchIndexMSCIWorldexUSASmallCapIndex10343AdditionalIndexMember2015-08-310000806633wasatchadvisors:WasatchIndexFTSEUS3MinusMonthTreasuryBillIndex15190AdditionalIndexMember2024-02-290000806633wasatchadvisors:WasatchIndexRussell3000Index12888BroadBasedIndexMember2018-01-310000806633wasatchadvisors:C000166038Memberwasatchadvisors:FR72346Q104CTIMember2024-09-300000806633wasatchadvisors:WasatchIndexRussell2000Index10338AdditionalIndexMember2016-09-300000806633wasatchadvisors:WasatchIndexRussell3000Index10340BroadBasedIndexMember2015-12-31
UNITED STATES
SECURITIES AND EXCHANGE COMMISSION
Washington, D.C. 20549
FORM N-CSR
CERTIFIED SHAREHOLDER REPORT OF REGISTERED
MANAGEMENT INVESTMENT COMPANIES
Investment Company Act file number: 811-04920
WASATCH FUNDS TRUST
(Exact name of registrant as specified in charter)
505 Wakara Way, 3rd Floor
Salt Lake City, UT 84108
(Address of principal executive offices) (Zip code)
| | |
| (Name and Address of Agent for Service) | | Copy to: |
| |
Eric S. Bergeson Wasatch Advisors, LP 505 Wakara Way, 3rd Floor Salt Lake City, UT 84108 | | Eric F. Fess, Esq. Chapman & Cutler LLP 320 S. Canal Street Chicago, IL 60606 |
Registrant’s telephone number, including area code: (801) 533-0777
Date of fiscal year end: September 30
Date of reporting period: September 30, 2024
| Item 1. | Report to Shareholders. |
| (a) | Report to Shareholders is filed herewith. |
Institutional Class WIGRX
Annual Shareholder Report
September 30, 2024
This Annual shareholder report contains important information about Wasatch Core Growth Fund for the period of October 1, 2023 to September 30, 2024. You can find additional information about the Fund at www.wasatchglobal.com. You can also request this information by contacting us at 800-551-1700.
What were the Fund costs for last year?
Annual Fund Operating Expenses
(based on a hypothetical $10,000 investment)
| Class Name | Costs of a $10,000 investment | Costs paid as a percentage of a $10,000 investment |
|---|
| Institutional Class | $122 | 1.05% |
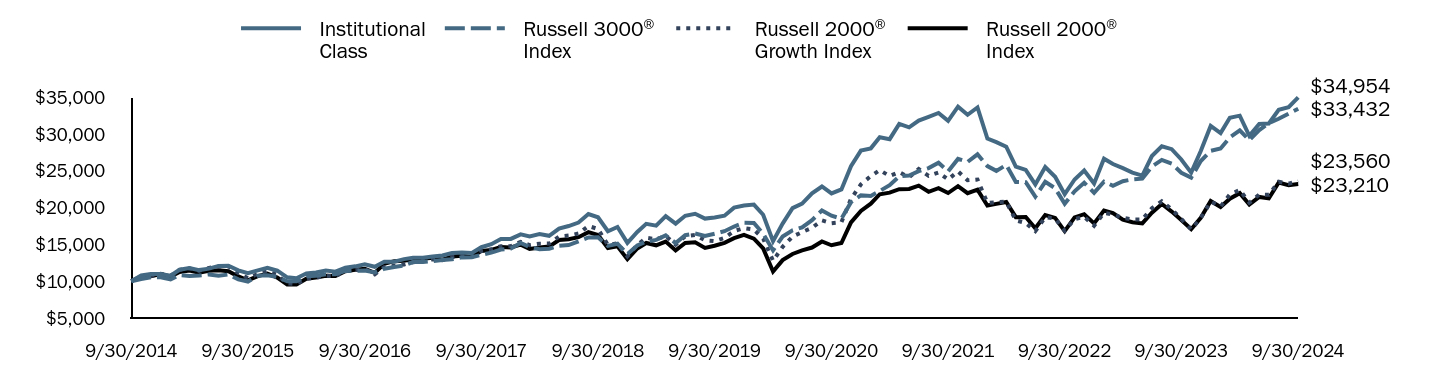
How did the fund perform last year and what affected its performance?
During the 12 months ended September 30, 2024, U.S. small-cap stocks gained ground broadly, fueled by optimism that the Federal Reserve may be able to end its interest-rate hiking cycle without tipping the economy into recession. In this environment, we felt investors began to recognize company-specific fundamentals. These market conditions were favorable for the Fund and our investment approach. Our guiding investment principle is that over longer time horizons, stock prices tend to follow earnings growth.
As such, the primary investment technique the Fund employs is to conduct deep, fundamental research to find high-quality, durable growth companies within the small-cap universe. Over the period, many of our companies produced strong operating results, and the market seemingly recognized those fundamentals. The Fund outperformed the benchmark Russell 2000® Growth Index in all sectors except consumer discretionary, where the performance of our holdings was positive but significantly lagged that of the benchmark. Stock selection in financials and information-technology drove much of the Fund’s relative outperformance. The Fund’s lack of exposure to energy, the only benchmark sector to post a negative return for the period, was also beneficial.
Total return based on a $10,000 investment.
| Institutional Class | Russell 3000® Index | Russell 2000® Growth Index | Russell 2000® Index |
|---|
| 9/30/2014 | $10,000 | $10,000 | $10,000 | $10,000 |
| 10/31/2014 | $10,775 | $10,275 | $10,620 | $10,659 |
| 11/30/2014 | $10,984 | $10,524 | $10,689 | $10,669 |
| 12/31/2014 | $10,987 | $10,524 | $11,006 | $10,973 |
| 1/31/2015 | $10,750 | $10,231 | $10,755 | $10,620 |
| 2/28/2015 | $11,555 | $10,824 | $11,529 | $11,250 |
| 3/31/2015 | $11,791 | $10,713 | $11,736 | $11,446 |
| 4/30/2015 | $11,506 | $10,762 | $11,390 | $11,154 |
| 5/31/2015 | $11,708 | $10,911 | $11,809 | $11,409 |
| 6/30/2015 | $12,078 | $10,728 | $11,968 | $11,494 |
| 7/31/2015 | $12,097 | $10,908 | $12,016 | $11,361 |
| 8/31/2015 | $11,477 | $10,249 | $11,106 | $10,647 |
| 9/30/2015 | $11,094 | $9,951 | $10,404 | $10,125 |
| 10/31/2015 | $11,477 | $10,736 | $10,995 | $10,695 |
| 11/30/2015 | $11,810 | $10,796 | $11,398 | $11,043 |
| 12/31/2015 | $11,424 | $10,574 | $10,854 | $10,488 |
| 1/31/2016 | $10,525 | $9,978 | $9,678 | $9,566 |
| 2/29/2016 | $10,404 | $9,975 | $9,609 | $9,566 |
| 3/31/2016 | $11,063 | $10,677 | $10,346 | $10,329 |
| 4/30/2016 | $11,196 | $10,743 | $10,449 | $10,491 |
| 5/31/2016 | $11,439 | $10,935 | $10,730 | $10,728 |
| 6/30/2016 | $11,295 | $10,958 | $10,681 | $10,721 |
| 7/31/2016 | $11,835 | $11,393 | $11,379 | $11,361 |
| 8/31/2016 | $12,016 | $11,422 | $11,500 | $11,562 |
| 9/30/2016 | $12,295 | $11,440 | $11,666 | $11,691 |
| 10/31/2016 | $11,955 | $11,192 | $10,941 | $11,135 |
| 11/30/2016 | $12,635 | $11,693 | $11,920 | $12,377 |
| 12/31/2016 | $12,648 | $11,921 | $12,082 | $12,723 |
| 1/31/2017 | $12,999 | $12,145 | $12,278 | $12,773 |
| 2/28/2017 | $13,189 | $12,597 | $12,579 | $13,020 |
| 3/31/2017 | $13,184 | $12,606 | $12,728 | $13,037 |
| 4/30/2017 | $13,352 | $12,739 | $12,963 | $13,180 |
| 5/31/2017 | $13,495 | $12,870 | $12,845 | $12,912 |
| 6/30/2017 | $13,824 | $12,986 | $13,287 | $13,358 |
| 7/31/2017 | $13,887 | $13,231 | $13,400 | $13,457 |
| 8/31/2017 | $13,842 | $13,256 | $13,385 | $13,286 |
| 9/30/2017 | $14,615 | $13,579 | $14,113 | $14,115 |
| 10/31/2017 | $15,018 | $13,876 | $14,332 | $14,236 |
| 11/30/2017 | $15,723 | $14,297 | $14,743 | $14,646 |
| 12/31/2017 | $15,743 | $14,440 | $14,760 | $14,587 |
| 1/31/2018 | $16,366 | $15,201 | $15,336 | $14,968 |
| 2/28/2018 | $16,075 | $14,641 | $14,899 | $14,389 |
| 3/31/2018 | $16,398 | $14,347 | $15,100 | $14,575 |
| 4/30/2018 | $16,160 | $14,402 | $15,115 | $14,701 |
| 5/31/2018 | $17,146 | $14,808 | $16,066 | $15,593 |
| 6/30/2018 | $17,492 | $14,905 | $16,192 | $15,705 |
| 7/31/2018 | $17,959 | $15,400 | $16,470 | $15,978 |
| 8/31/2018 | $19,117 | $15,940 | $17,496 | $16,667 |
| 9/30/2018 | $18,682 | $15,967 | $17,086 | $16,266 |
| 10/31/2018 | $16,780 | $14,791 | $14,924 | $14,500 |
| 11/30/2018 | $17,368 | $15,087 | $15,158 | $14,730 |
| 12/31/2018 | $15,199 | $13,683 | $13,387 | $12,980 |
| 1/31/2019 | $16,680 | $14,858 | $14,933 | $14,441 |
| 2/28/2019 | $17,788 | $15,380 | $15,897 | $15,191 |
| 3/31/2019 | $17,541 | $15,605 | $15,682 | $14,873 |
| 4/30/2019 | $18,831 | $16,228 | $16,159 | $15,379 |
| 5/31/2019 | $17,816 | $15,178 | $14,960 | $14,183 |
| 6/30/2019 | $18,881 | $16,244 | $16,113 | $15,185 |
| 7/31/2019 | $19,161 | $16,485 | $16,270 | $15,272 |
| 8/31/2019 | $18,502 | $16,149 | $15,568 | $14,518 |
| 9/30/2019 | $18,641 | $16,433 | $15,440 | $14,820 |
| 10/31/2019 | $18,891 | $16,786 | $15,880 | $15,211 |
| 11/30/2019 | $19,991 | $17,424 | $16,814 | $15,837 |
| 12/31/2019 | $20,280 | $17,928 | $17,200 | $16,294 |
| 1/31/2020 | $20,411 | $17,908 | $17,010 | $15,771 |
| 2/29/2020 | $19,032 | $16,442 | $15,782 | $14,443 |
| 3/31/2020 | $15,432 | $14,181 | $12,768 | $11,305 |
| 4/30/2020 | $17,829 | $16,059 | $14,670 | $12,858 |
| 5/31/2020 | $19,931 | $16,918 | $16,056 | $13,695 |
| 6/30/2020 | $20,550 | $17,304 | $16,673 | $14,179 |
| 7/31/2020 | $21,943 | $18,287 | $17,246 | $14,571 |
| 8/31/2020 | $22,861 | $19,612 | $18,258 | $15,392 |
| 9/30/2020 | $21,918 | $18,898 | $17,867 | $14,878 |
| 10/31/2020 | $22,462 | $18,490 | $18,002 | $15,190 |
| 11/30/2020 | $25,625 | $20,739 | $21,177 | $17,990 |
| 12/31/2020 | $27,734 | $21,672 | $23,156 | $19,546 |
| 1/31/2021 | $28,042 | $21,576 | $24,273 | $20,529 |
| 2/28/2021 | $29,547 | $22,250 | $25,074 | $21,809 |
| 3/31/2021 | $29,290 | $23,048 | $24,285 | $22,028 |
| 4/30/2021 | $31,372 | $24,236 | $24,815 | $22,491 |
| 5/31/2021 | $30,902 | $24,346 | $24,106 | $22,537 |
| 6/30/2021 | $31,818 | $24,947 | $25,237 | $22,974 |
| 7/31/2021 | $32,321 | $25,369 | $24,317 | $22,144 |
| 8/31/2021 | $32,853 | $26,092 | $24,759 | $22,639 |
| 9/30/2021 | $31,779 | $24,921 | $23,810 | $21,972 |
| 10/31/2021 | $33,709 | $26,607 | $24,925 | $22,906 |
| 11/30/2021 | $32,602 | $26,202 | $23,708 | $21,952 |
| 12/31/2021 | $33,604 | $27,234 | $23,813 | $22,442 |
| 1/31/2022 | $29,366 | $25,631 | $20,621 | $20,282 |
| 2/28/2022 | $28,878 | $24,986 | $20,711 | $20,498 |
| 3/31/2022 | $28,260 | $25,796 | $20,806 | $20,753 |
| 4/30/2022 | $25,575 | $23,481 | $18,253 | $18,697 |
| 5/31/2022 | $25,118 | $23,450 | $17,908 | $18,725 |
| 6/30/2022 | $23,145 | $21,488 | $16,800 | $17,185 |
| 7/31/2022 | $25,508 | $23,504 | $18,681 | $18,979 |
| 8/31/2022 | $24,185 | $22,627 | $18,505 | $18,591 |
| 9/30/2022 | $21,811 | $20,528 | $16,840 | $16,809 |
| 10/31/2022 | $23,819 | $22,212 | $18,439 | $18,659 |
| 11/30/2022 | $25,024 | $23,371 | $18,739 | $19,095 |
| 12/31/2022 | $23,275 | $22,003 | $17,536 | $17,856 |
| 1/31/2023 | $26,640 | $23,518 | $19,281 | $19,596 |
| 2/28/2023 | $25,912 | $22,968 | $19,072 | $19,265 |
| 3/31/2023 | $25,350 | $23,583 | $18,601 | $18,345 |
| 4/30/2023 | $24,746 | $23,834 | $18,385 | $18,015 |
| 5/31/2023 | $24,346 | $23,927 | $18,388 | $17,849 |
| 6/30/2023 | $27,001 | $25,560 | $19,913 | $19,300 |
| 7/31/2023 | $28,319 | $26,477 | $20,844 | $20,480 |
| 8/31/2023 | $27,934 | $25,966 | $19,759 | $19,455 |
| 9/30/2023 | $26,531 | $24,729 | $18,456 | $18,310 |
| 10/31/2023 | $24,749 | $24,073 | $17,032 | $17,061 |
| 11/30/2023 | $27,672 | $26,318 | $18,583 | $18,606 |
| 12/31/2023 | $31,090 | $27,714 | $20,808 | $20,879 |
| 1/31/2024 | $30,108 | $28,021 | $20,141 | $20,067 |
| 2/29/2024 | $32,204 | $29,538 | $21,777 | $21,201 |
| 3/31/2024 | $32,483 | $30,491 | $22,386 | $21,960 |
| 4/30/2024 | $29,737 | $29,149 | $20,662 | $20,415 |
| 5/31/2024 | $31,363 | $30,526 | $21,769 | $21,439 |
| 6/30/2024 | $31,416 | $31,471 | $21,732 | $21,241 |
| 7/31/2024 | $33,282 | $32,056 | $23,512 | $23,399 |
| 8/31/2024 | $33,628 | $32,754 | $23,251 | $23,049 |
| 9/30/2024 | $34,954 | $33,432 | $23,560 | $23,210 |
Fund performance shown in this graph represents past performance, which is not necessarily indicative of how the Fund will perform in the future.
Average Total Returns (%)
| Fund | Wasatch Core Growth Fund |
|---|
| Total Net Assets | $4,847,227,842 |
| # of Portfolio Holdings | 54 |
| Portfolio Turnover Rate | 36% |
| Total Advisory Fees Paid | $40,343,145 |
| Fund | 1 Year | 5 Years | 10 Years |
|---|
| Institutional Class | 31.75% | 13.40% | 13.33% |
Russell 3000® Index | 35.19% | 15.26% | 12.83% |
Russell 2000® Growth Index | 27.66% | 8.82% | 8.95% |
Russell 2000® Index | 26.76% | 9.39% | 8.78% |
The performance graph and total returns table do not reflect the deduction of taxes a shareholder would pay on Fund distributions or the redemption of Fund shares.
What did the Fund invest in?
The Fund invested in a variety of equity and debt securities. Opportunities continue to fluctuate with the volatility of the market and as banks continue to encounter risks.
| Top 10 | Value |
| HealthEquity, Inc. | 3.6% |
| Shift4 Payments, Inc. A | 3.5% |
| Guidewire Software, Inc. | 3.2% |
| Clearwater Analytics Holdings, Inc. A | 3.1% |
| Kadant, Inc. | 3.1% |
| Morningstar, Inc. | 2.7% |
| RBC Bearings, Inc. | 2.6% |
| Cohen & Steers, Inc. | 2.6% |
| Paylocity Holding Corp. | 2.5% |
| Hamilton Lane, Inc. A | 2.5% |
| Industry | Value |
| Application Software | 11.4% |
| Industrial Machinery & Supplies & Components | 6.8% |
| Building Products | 5.2% |
| Asset Management & Custody Banks | 5.1% |
| Financial Exchanges & Data | 4.7% |
| Specialty Chemicals | 3.7% |
| Managed Health Care | 3.6% |
| Transaction & Payment Processing Services | 3.5% |
| Health Care Facilities | 3.0% |
| Regional Banks | 2.6% |
Portfolio Compositions (%)
| Asset Type | Value |
| Common Stocks | 99.1% |
| Other Assets and Liabilities, Net | 0.9% |
| Total | 100.0% |
In order to reduce expenses, we will deliver a single copy of prospectuses, proxies, financial reports and other communication to shareholders with the same residential address. If you would like to receive individual mailings, please call [800-551-1700] and we will begin sending you separate copies of these materials within 30 days after receiving your request.
ALPS Distributors, Inc. serves as the Fund’s distributor.
If you wish to view additional information about the Fund; including but not limited to financial statements or holdings, please visit www.wasatchglobal.com.
Phone: 800-551-1700
Email: shareholderservice@wasatchfunds.com
Annual Shareholder Report
September 30, 2024
Annual Shareholder Report
September 30, 2024
This Annual shareholder report contains important information about Wasatch Core Growth Fund for the period of October 1, 2023 to September 30, 2024. You can find additional information about the Fund at www.wasatchglobal.com. You can also request this information by contacting us at 800-551-1700.
What were the Fund costs for last year?
Annual Fund Operating Expenses
(based on a hypothetical $10,000 investment)
| Class Name | Costs of a $10,000 investment | Costs paid as a percentage of a $10,000 investment |
|---|
| Investor Class | $135 | 1.17% |
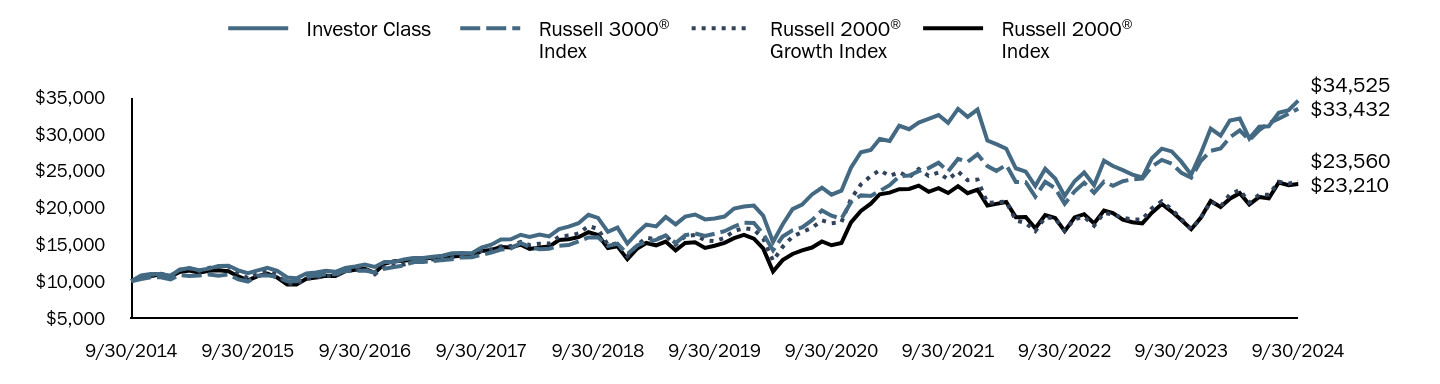
How did the fund perform last year and what affected its performance?
During the 12 months ended September 30, 2024, U.S. small-cap stocks gained ground broadly, fueled by optimism that the Federal Reserve may be able to end its interest-rate hiking cycle without tipping the economy into recession. In this environment, we felt investors began to recognize company-specific fundamentals. These market conditions were favorable for the Fund and our investment approach. Our guiding investment principle is that over longer time horizons, stock prices tend to follow earnings growth.
As such, the primary investment technique the Fund employs is to conduct deep, fundamental research to find high-quality, durable growth companies within the small-cap universe. Over the period, many of our companies produced strong operating results, and the market seemingly recognized those fundamentals. The Fund outperformed the benchmark Russell 2000® Growth Index in all sectors except consumer discretionary, where the performance of our holdings was positive but significantly lagged that of the benchmark. Stock selection in financials and information-technology drove much of the Fund’s relative outperformance. The Fund’s lack of exposure to energy, the only benchmark sector to post a negative return for the period, was also beneficial.
Total return based on a $10,000 investment.
| Investor Class | Russell 3000® Index | Russell 2000® Growth Index | Russell 2000® Index |
|---|
| 9/30/2014 | $10,000 | $10,000 | $10,000 | $10,000 |
| 10/31/2014 | $10,773 | $10,275 | $10,620 | $10,659 |
| 11/30/2014 | $10,982 | $10,524 | $10,689 | $10,669 |
| 12/31/2014 | $10,983 | $10,524 | $11,006 | $10,973 |
| 1/31/2015 | $10,746 | $10,231 | $10,755 | $10,620 |
| 2/28/2015 | $11,551 | $10,824 | $11,529 | $11,250 |
| 3/31/2015 | $11,785 | $10,713 | $11,736 | $11,446 |
| 4/30/2015 | $11,501 | $10,762 | $11,390 | $11,154 |
| 5/31/2015 | $11,704 | $10,911 | $11,809 | $11,409 |
| 6/30/2015 | $12,070 | $10,728 | $11,968 | $11,494 |
| 7/31/2015 | $12,092 | $10,908 | $12,016 | $11,361 |
| 8/31/2015 | $11,468 | $10,249 | $11,106 | $10,647 |
| 9/30/2015 | $11,087 | $9,951 | $10,404 | $10,125 |
| 10/31/2015 | $11,468 | $10,736 | $10,995 | $10,695 |
| 11/30/2015 | $11,800 | $10,796 | $11,398 | $11,043 |
| 12/31/2015 | $11,414 | $10,574 | $10,854 | $10,488 |
| 1/31/2016 | $10,514 | $9,978 | $9,678 | $9,566 |
| 2/29/2016 | $10,394 | $9,975 | $9,609 | $9,566 |
| 3/31/2016 | $11,049 | $10,677 | $10,346 | $10,329 |
| 4/30/2016 | $11,183 | $10,743 | $10,449 | $10,491 |
| 5/31/2016 | $11,422 | $10,935 | $10,730 | $10,728 |
| 6/30/2016 | $11,278 | $10,958 | $10,681 | $10,721 |
| 7/31/2016 | $11,815 | $11,393 | $11,379 | $11,361 |
| 8/31/2016 | $11,992 | $11,422 | $11,500 | $11,562 |
| 9/30/2016 | $12,272 | $11,440 | $11,666 | $11,691 |
| 10/31/2016 | $11,929 | $11,192 | $10,941 | $11,135 |
| 11/30/2016 | $12,606 | $11,693 | $11,920 | $12,377 |
| 12/31/2016 | $12,617 | $11,921 | $12,082 | $12,723 |
| 1/31/2017 | $12,967 | $12,145 | $12,278 | $12,773 |
| 2/28/2017 | $13,155 | $12,597 | $12,579 | $13,020 |
| 3/31/2017 | $13,148 | $12,606 | $12,728 | $13,037 |
| 4/30/2017 | $13,314 | $12,739 | $12,963 | $13,180 |
| 5/31/2017 | $13,455 | $12,870 | $12,845 | $12,912 |
| 6/30/2017 | $13,783 | $12,986 | $13,287 | $13,358 |
| 7/31/2017 | $13,841 | $13,231 | $13,400 | $13,457 |
| 8/31/2017 | $13,794 | $13,256 | $13,385 | $13,286 |
| 9/30/2017 | $14,565 | $13,579 | $14,113 | $14,115 |
| 10/31/2017 | $14,964 | $13,876 | $14,332 | $14,236 |
| 11/30/2017 | $15,664 | $14,297 | $14,743 | $14,646 |
| 12/31/2017 | $15,682 | $14,440 | $14,760 | $14,587 |
| 1/31/2018 | $16,301 | $15,201 | $15,336 | $14,968 |
| 2/28/2018 | $16,010 | $14,641 | $14,899 | $14,389 |
| 3/31/2018 | $16,329 | $14,347 | $15,100 | $14,575 |
| 4/30/2018 | $16,090 | $14,402 | $15,115 | $14,701 |
| 5/31/2018 | $17,070 | $14,808 | $16,066 | $15,593 |
| 6/30/2018 | $17,414 | $14,905 | $16,192 | $15,705 |
| 7/31/2018 | $17,875 | $15,400 | $16,470 | $15,978 |
| 8/31/2018 | $19,027 | $15,940 | $17,496 | $16,667 |
| 9/30/2018 | $18,593 | $15,967 | $17,086 | $16,266 |
| 10/31/2018 | $16,698 | $14,791 | $14,924 | $14,500 |
| 11/30/2018 | $17,281 | $15,087 | $15,158 | $14,730 |
| 12/31/2018 | $15,120 | $13,683 | $13,387 | $12,980 |
| 1/31/2019 | $16,593 | $14,858 | $14,933 | $14,441 |
| 2/28/2019 | $17,695 | $15,380 | $15,897 | $15,191 |
| 3/31/2019 | $17,444 | $15,605 | $15,682 | $14,873 |
| 4/30/2019 | $18,725 | $16,228 | $16,159 | $15,379 |
| 5/31/2019 | $17,715 | $15,178 | $14,960 | $14,183 |
| 6/30/2019 | $18,771 | $16,244 | $16,113 | $15,185 |
| 7/31/2019 | $19,049 | $16,485 | $16,270 | $15,272 |
| 8/31/2019 | $18,391 | $16,149 | $15,568 | $14,518 |
| 9/30/2019 | $18,525 | $16,433 | $15,440 | $14,820 |
| 10/31/2019 | $18,776 | $16,786 | $15,880 | $15,211 |
| 11/30/2019 | $19,865 | $17,424 | $16,814 | $15,837 |
| 12/31/2019 | $20,148 | $17,928 | $17,200 | $16,294 |
| 1/31/2020 | $20,277 | $17,908 | $17,010 | $15,771 |
| 2/29/2020 | $18,907 | $16,442 | $15,782 | $14,443 |
| 3/31/2020 | $15,328 | $14,181 | $12,768 | $11,305 |
| 4/30/2020 | $17,707 | $16,059 | $14,670 | $12,858 |
| 5/31/2020 | $19,792 | $16,918 | $16,056 | $13,695 |
| 6/30/2020 | $20,403 | $17,304 | $16,673 | $14,179 |
| 7/31/2020 | $21,785 | $18,287 | $17,246 | $14,571 |
| 8/31/2020 | $22,693 | $19,612 | $18,258 | $15,392 |
| 9/30/2020 | $21,751 | $18,898 | $17,867 | $14,878 |
| 10/31/2020 | $22,289 | $18,490 | $18,002 | $15,190 |
| 11/30/2020 | $25,426 | $20,739 | $21,177 | $17,990 |
| 12/31/2020 | $27,515 | $21,672 | $23,156 | $19,546 |
| 1/31/2021 | $27,819 | $21,576 | $24,273 | $20,529 |
| 2/28/2021 | $29,311 | $22,250 | $25,074 | $21,809 |
| 3/31/2021 | $29,052 | $23,048 | $24,285 | $22,028 |
| 4/30/2021 | $31,112 | $24,236 | $24,815 | $22,491 |
| 5/31/2021 | $30,646 | $24,346 | $24,106 | $22,537 |
| 6/30/2021 | $31,551 | $24,947 | $25,237 | $22,974 |
| 7/31/2021 | $32,044 | $25,369 | $24,317 | $22,144 |
| 8/31/2021 | $32,570 | $26,092 | $24,759 | $22,639 |
| 9/30/2021 | $31,503 | $24,921 | $23,810 | $21,972 |
| 10/31/2021 | $33,412 | $26,607 | $24,925 | $22,906 |
| 11/30/2021 | $32,315 | $26,202 | $23,708 | $21,952 |
| 12/31/2021 | $33,303 | $27,234 | $23,813 | $22,442 |
| 1/31/2022 | $29,101 | $25,631 | $20,621 | $20,282 |
| 2/28/2022 | $28,613 | $24,986 | $20,711 | $20,498 |
| 3/31/2022 | $28,001 | $25,796 | $20,806 | $20,753 |
| 4/30/2022 | $25,338 | $23,481 | $18,253 | $18,697 |
| 5/31/2022 | $24,882 | $23,450 | $17,908 | $18,725 |
| 6/30/2022 | $22,922 | $21,488 | $16,800 | $17,185 |
| 7/31/2022 | $25,260 | $23,504 | $18,681 | $18,979 |
| 8/31/2022 | $23,944 | $22,627 | $18,505 | $18,591 |
| 9/30/2022 | $21,589 | $20,528 | $16,840 | $16,809 |
| 10/31/2022 | $23,577 | $22,212 | $18,439 | $18,659 |
| 11/30/2022 | $24,765 | $23,371 | $18,739 | $19,095 |
| 12/31/2022 | $23,032 | $22,003 | $17,536 | $17,856 |
| 1/31/2023 | $26,358 | $23,518 | $19,281 | $19,596 |
| 2/28/2023 | $25,635 | $22,968 | $19,072 | $19,265 |
| 3/31/2023 | $25,080 | $23,583 | $18,601 | $18,345 |
| 4/30/2023 | $24,478 | $23,834 | $18,385 | $18,015 |
| 5/31/2023 | $24,079 | $23,927 | $18,388 | $17,849 |
| 6/30/2023 | $26,704 | $25,560 | $19,913 | $19,300 |
| 7/31/2023 | $28,004 | $26,477 | $20,844 | $20,480 |
| 8/31/2023 | $27,623 | $25,966 | $19,759 | $19,455 |
| 9/30/2023 | $26,234 | $24,729 | $18,456 | $18,310 |
| 10/31/2023 | $24,471 | $24,073 | $17,032 | $17,061 |
| 11/30/2023 | $27,359 | $26,318 | $18,583 | $18,606 |
| 12/31/2023 | $30,732 | $27,714 | $20,808 | $20,879 |
| 1/31/2024 | $29,759 | $28,021 | $20,141 | $20,067 |
| 2/29/2024 | $31,829 | $29,538 | $21,777 | $21,201 |
| 3/31/2024 | $32,103 | $30,491 | $22,386 | $21,960 |
| 4/30/2024 | $29,386 | $29,149 | $20,662 | $20,415 |
| 5/31/2024 | $30,992 | $30,526 | $21,769 | $21,439 |
| 6/30/2024 | $31,038 | $31,471 | $21,732 | $21,241 |
| 7/31/2024 | $32,879 | $32,056 | $23,512 | $23,399 |
| 8/31/2024 | $33,218 | $32,754 | $23,251 | $23,049 |
| 9/30/2024 | $34,525 | $33,432 | $23,560 | $23,210 |
Fund performance shown in this graph represents past performance, which is not necessarily indicative of how the Fund will perform in the future.
Average Total Returns (%)
| Fund | Wasatch Core Growth Fund |
|---|
| Total Net Assets | $4,847,227,842 |
| # of Portfolio Holdings | 54 |
| Portfolio Turnover Rate | 36% |
| Total Advisory Fees Paid | $40,343,145 |
| Fund | 1 Year | 5 Years | 10 Years |
|---|
| Investor Class | 31.60% | 13.26% | 13.19% |
Russell 3000® Index | 35.19% | 15.26% | 12.83% |
Russell 2000® Growth Index | 27.66% | 8.82% | 8.95% |
Russell 2000® Index | 26.76% | 9.39% | 8.78% |
The performance graph and total returns table do not reflect the deduction of taxes a shareholder would pay on Fund distributions or the redemption of Fund shares.
What did the Fund invest in?
The Fund invested in a variety of equity and debt securities. Opportunities continue to fluctuate with the volatility of the market and as banks continue to encounter risks.
| Top 10 | Value |
| HealthEquity, Inc. | 3.6% |
| Shift4 Payments, Inc. A | 3.5% |
| Guidewire Software, Inc. | 3.2% |
| Clearwater Analytics Holdings, Inc. A | 3.1% |
| Kadant, Inc. | 3.1% |
| Morningstar, Inc. | 2.7% |
| RBC Bearings, Inc. | 2.6% |
| Cohen & Steers, Inc. | 2.6% |
| Paylocity Holding Corp. | 2.5% |
| Hamilton Lane, Inc. A | 2.5% |
| Industry | Value |
| Application Software | 11.4% |
| Industrial Machinery & Supplies & Components | 6.8% |
| Building Products | 5.2% |
| Asset Management & Custody Banks | 5.1% |
| Financial Exchanges & Data | 4.7% |
| Specialty Chemicals | 3.7% |
| Managed Health Care | 3.6% |
| Transaction & Payment Processing Services | 3.5% |
| Health Care Facilities | 3.0% |
| Regional Banks | 2.6% |
Portfolio Compositions (%)
| Asset Type | Value |
| Common Stocks | 99.1% |
| Other Assets and Liabilities, Net | 0.9% |
| Total | 100.0% |
In order to reduce expenses, we will deliver a single copy of prospectuses, proxies, financial reports and other communication to shareholders with the same residential address. If you would like to receive individual mailings, please call [800-551-1700] and we will begin sending you separate copies of these materials within 30 days after receiving your request.
ALPS Distributors, Inc. serves as the Fund’s distributor.
If you wish to view additional information about the Fund; including but not limited to financial statements or holdings, please visit www.wasatchglobal.com.
Phone: 800-551-1700
Email: shareholderservice@wasatchfunds.com
Annual Shareholder Report
September 30, 2024
Wasatch Emerging India Fund
Institutional Class WIINX
Annual Shareholder Report
September 30, 2024
This Annual shareholder report contains important information about Wasatch Emerging India Fund for the period of October 1, 2023 to September 30, 2024. You can find additional information about the Fund at www.wasatchglobal.com. You can also request this information by contacting us at 800-551-1700.
What were the Fund costs for last year?
Annual Fund Operating Expenses
(based on a hypothetical $10,000 investment)
| Class Name | Costs of a $10,000 investment | Costs paid as a percentage of a $10,000 investment |
|---|
| Institutional Class | $158 | 1.37% |
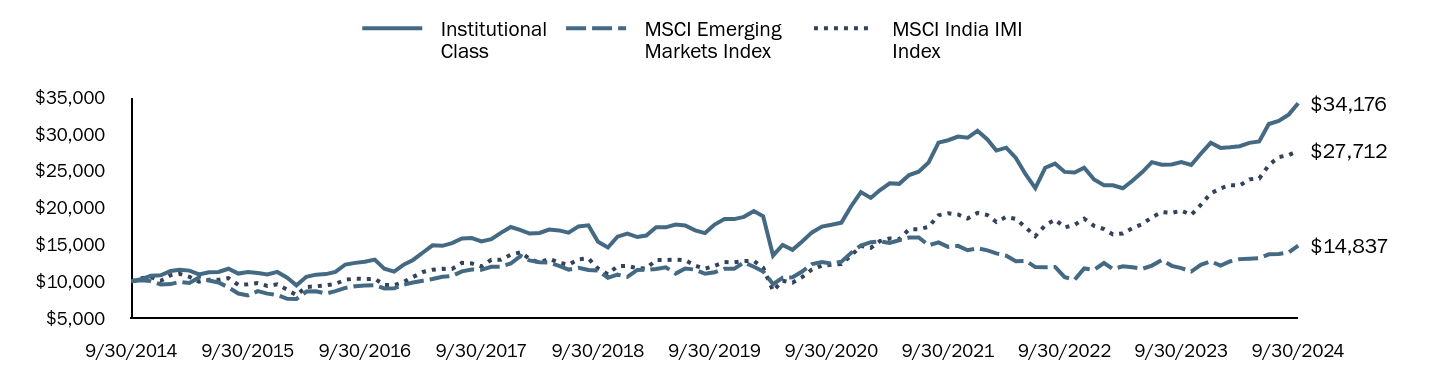
How did the fund perform last year and what affected its performance?
During the 12 months ended September 30, 2024, India’s economy remained one of the strongest in the world, and enthusiasm about economic growth drove India’s major stock indexes to record highs. A growing consensus that central banks were nearing or reaching the end of their tightening cycles also created a favorable backdrop for financial markets.
While the Fund had a significant gain during the period, it underperformed the benchmark MSCI India Investable Market Index (IMI). Our holdings in the consumer-discretionary sector were a bright spot, substantially outperforming the benchmark’s holdings in the sector. An overweight to health care was also beneficial to relative results. Underperformance was largely due to stock selection within the financial sector. High interest rates and increased capital requirements made lending more costly, in part pressuring profit margins. This weighed on some financials stocks, which remain a significant part of our portfolio. Additionally, our holdings in the materials and industrials sectors generally had solid gains but trailed the benchmark’s positions. Many of the benchmark’s holdings in those sectors tend to be more cyclical than our own. Given the strength of India’s economy, some of the more cyclical stocks outperformed.
Total return based on a $10,000 investment.
| Institutional Class | MSCI Emerging Markets Index | MSCI India IMI Index |
|---|
| 9/30/2014 | $10,000 | $10,000 | $10,000 |
| 10/31/2014 | $10,256 | $10,118 | $10,393 |
| 11/30/2014 | $10,733 | $10,011 | $10,586 |
| 12/31/2014 | $10,812 | $9,550 | $10,039 |
| 1/31/2015 | $11,398 | $9,607 | $10,814 |
| 2/28/2015 | $11,545 | $9,904 | $11,013 |
| 3/31/2015 | $11,435 | $9,763 | $10,593 |
| 4/30/2015 | $10,922 | $10,514 | $9,924 |
| 5/31/2015 | $11,215 | $10,093 | $10,199 |
| 6/30/2015 | $11,251 | $9,831 | $10,177 |
| 7/31/2015 | $11,691 | $9,150 | $10,430 |
| 8/31/2015 | $11,032 | $8,322 | $9,501 |
| 9/30/2015 | $11,251 | $8,072 | $9,571 |
| 10/31/2015 | $11,105 | $8,647 | $9,744 |
| 11/30/2015 | $10,922 | $8,310 | $9,351 |
| 12/31/2015 | $11,261 | $8,125 | $9,568 |
| 1/31/2016 | $10,481 | $7,598 | $8,847 |
| 2/29/2016 | $9,440 | $7,585 | $8,114 |
| 3/31/2016 | $10,592 | $8,589 | $9,211 |
| 4/30/2016 | $10,889 | $8,636 | $9,301 |
| 5/31/2016 | $10,964 | $8,314 | $9,449 |
| 6/30/2016 | $11,261 | $8,646 | $9,636 |
| 7/31/2016 | $12,264 | $9,081 | $10,190 |
| 8/31/2016 | $12,487 | $9,307 | $10,350 |
| 9/30/2016 | $12,636 | $9,426 | $10,289 |
| 10/31/2016 | $12,933 | $9,449 | $10,328 |
| 11/30/2016 | $11,707 | $9,014 | $9,494 |
| 12/31/2016 | $11,307 | $9,034 | $9,465 |
| 1/31/2017 | $12,284 | $9,528 | $9,920 |
| 2/28/2017 | $12,885 | $9,820 | $10,572 |
| 3/31/2017 | $13,899 | $10,068 | $11,249 |
| 4/30/2017 | $14,876 | $10,288 | $11,565 |
| 5/31/2017 | $14,801 | $10,592 | $11,677 |
| 6/30/2017 | $15,176 | $10,699 | $11,661 |
| 7/31/2017 | $15,815 | $11,337 | $12,486 |
| 8/31/2017 | $15,853 | $11,590 | $12,414 |
| 9/30/2017 | $15,402 | $11,544 | $11,995 |
| 10/31/2017 | $15,702 | $11,948 | $12,913 |
| 11/30/2017 | $16,566 | $11,972 | $12,918 |
| 12/31/2017 | $17,362 | $12,402 | $13,603 |
| 1/31/2018 | $16,936 | $13,436 | $13,924 |
| 2/28/2018 | $16,472 | $12,816 | $13,026 |
| 3/31/2018 | $16,550 | $12,578 | $12,511 |
| 4/30/2018 | $17,014 | $12,522 | $13,058 |
| 5/31/2018 | $16,898 | $12,078 | $12,500 |
| 6/30/2018 | $16,588 | $11,576 | $12,232 |
| 7/31/2018 | $17,439 | $11,831 | $12,970 |
| 8/31/2018 | $17,594 | $11,511 | $13,092 |
| 9/30/2018 | $15,351 | $11,450 | $11,707 |
| 10/31/2018 | $14,578 | $10,453 | $10,958 |
| 11/30/2018 | $16,047 | $10,883 | $12,051 |
| 12/31/2018 | $16,449 | $10,595 | $12,081 |
| 1/31/2019 | $15,994 | $11,523 | $11,752 |
| 2/28/2019 | $16,201 | $11,549 | $11,731 |
| 3/31/2019 | $17,317 | $11,646 | $12,885 |
| 4/30/2019 | $17,317 | $11,891 | $12,875 |
| 5/31/2019 | $17,689 | $11,028 | $12,937 |
| 6/30/2019 | $17,565 | $11,716 | $12,858 |
| 7/31/2019 | $16,903 | $11,573 | $12,105 |
| 8/31/2019 | $16,532 | $11,009 | $11,709 |
| 9/30/2019 | $17,689 | $11,219 | $12,088 |
| 10/31/2019 | $18,433 | $11,692 | $12,602 |
| 11/30/2019 | $18,433 | $11,676 | $12,560 |
| 12/31/2019 | $18,741 | $12,547 | $12,725 |
| 1/31/2020 | $19,528 | $11,962 | $12,754 |
| 2/29/2020 | $18,824 | $11,331 | $11,834 |
| 3/31/2020 | $13,475 | $9,586 | $8,680 |
| 4/30/2020 | $14,926 | $10,464 | $10,071 |
| 5/31/2020 | $14,263 | $10,544 | $9,797 |
| 6/30/2020 | $15,382 | $11,319 | $10,547 |
| 7/31/2020 | $16,626 | $12,331 | $11,599 |
| 8/31/2020 | $17,414 | $12,603 | $12,110 |
| 9/30/2020 | $17,663 | $12,401 | $12,221 |
| 10/31/2020 | $17,953 | $12,657 | $12,328 |
| 11/30/2020 | $20,150 | $13,827 | $13,476 |
| 12/31/2020 | $22,099 | $14,844 | $14,780 |
| 1/31/2021 | $21,311 | $15,299 | $14,515 |
| 2/28/2021 | $22,348 | $15,416 | $15,436 |
| 3/31/2021 | $23,301 | $15,183 | $15,802 |
| 4/30/2021 | $23,219 | $15,561 | $15,702 |
| 5/31/2021 | $24,421 | $15,922 | $17,056 |
| 6/30/2021 | $24,877 | $15,949 | $17,069 |
| 7/31/2021 | $26,121 | $14,876 | $17,361 |
| 8/31/2021 | $28,816 | $15,265 | $18,960 |
| 9/30/2021 | $29,148 | $14,659 | $19,226 |
| 10/31/2021 | $29,645 | $14,803 | $19,056 |
| 11/30/2021 | $29,479 | $14,200 | $18,523 |
| 12/31/2021 | $30,427 | $14,467 | $19,268 |
| 1/31/2022 | $29,258 | $14,193 | $18,980 |
| 2/28/2022 | $27,743 | $13,769 | $18,038 |
| 3/31/2022 | $28,133 | $13,458 | $18,730 |
| 4/30/2022 | $26,748 | $12,709 | $18,464 |
| 5/31/2022 | $24,497 | $12,765 | $17,295 |
| 6/30/2022 | $22,636 | $11,917 | $16,117 |
| 7/31/2022 | $25,406 | $11,887 | $17,600 |
| 8/31/2022 | $25,969 | $11,937 | $18,358 |
| 9/30/2022 | $24,844 | $10,538 | $17,312 |
| 10/31/2022 | $24,757 | $10,210 | $17,646 |
| 11/30/2022 | $25,406 | $11,725 | $18,483 |
| 12/31/2022 | $23,807 | $11,560 | $17,520 |
| 1/31/2023 | $23,020 | $12,473 | $17,081 |
| 2/28/2023 | $23,020 | $11,664 | $16,357 |
| 3/31/2023 | $22,626 | $12,017 | $16,479 |
| 4/30/2023 | $23,632 | $11,881 | $17,210 |
| 5/31/2023 | $24,814 | $11,682 | $17,757 |
| 6/30/2023 | $26,171 | $12,125 | $18,690 |
| 7/31/2023 | $25,820 | $12,880 | $19,380 |
| 8/31/2023 | $25,864 | $12,087 | $19,281 |
| 9/30/2023 | $26,171 | $11,770 | $19,575 |
| 10/31/2023 | $25,777 | $11,313 | $19,003 |
| 11/30/2023 | $27,308 | $12,219 | $20,363 |
| 12/31/2023 | $28,792 | $12,696 | $21,923 |
| 1/31/2024 | $28,107 | $12,107 | $22,602 |
| 2/29/2024 | $28,199 | $12,683 | $23,051 |
| 3/31/2024 | $28,335 | $12,997 | $22,997 |
| 4/30/2024 | $28,792 | $13,055 | $23,834 |
| 5/31/2024 | $28,974 | $13,129 | $23,952 |
| 6/30/2024 | $31,347 | $13,647 | $25,759 |
| 7/31/2024 | $31,758 | $13,687 | $26,857 |
| 8/31/2024 | $32,625 | $13,908 | $27,122 |
| 9/30/2024 | $34,176 | $14,837 | $27,712 |
Fund performance shown in this graph represents past performance, which is not necessarily indicative of how the Fund will perform in the future.
Average Total Returns (%)
| Fund | Wasatch Emerging India Fund |
|---|
| Total Net Assets | $722,714,913 |
| # of Portfolio Holdings | 33 |
| Portfolio Turnover Rate | 29% |
| Total Advisory Fees Paid | $7,617,376 |
| Fund | 1 Year | 5 Years | 10 Years |
|---|
| Institutional Class | 30.59% | 14.08% | 13.08% |
| MSCI Emerging Markets Index | 26.05% | 5.75% | 4.02% |
| MSCI India IMI Index | 41.57% | 18.05% | 10.73% |
The performance graph and total returns table do not reflect the deduction of taxes a shareholder would pay on Fund distributions or the redemption of Fund shares.
What did the Fund invest in?
The Fund invested in a variety of equity and debt securities. Opportunities continue to fluctuate with the volatility of the market and as banks continue to encounter risks.
| Top 10 | Value |
| Bajaj Finance Ltd. | 9.8% |
| Trent Ltd. | 9.2% |
| Cholamandalam Investment & Finance Co. Ltd. | 7.8% |
| Divi's Laboratories Ltd. | 7.2% |
| HDFC Bank Ltd. | 7.1% |
| AU Small Finance Bank Ltd. | 5.5% |
| Vijaya Diagnostic Centre Pvt Ltd. | 5.1% |
| Max Healthcare Institute Ltd. | 5.1% |
| Elgi Equipments Ltd. | 4.9% |
| Dr. Lal PathLabs Ltd. | 4.3% |
| Industry | Value |
| Consumer Finance | 19.5% |
| Diversified Banks | 9.5% |
| Health Care Services | 9.5% |
| Apparel Retail | 9.2% |
| Life Sciences Tools & Services | 7.2% |
| Health Care Facilities | 6.6% |
| Regional Banks | 5.5% |
| Industrial Machinery & Supplies & Components | 4.9% |
| Interactive Media & Services | 4.4% |
| Commodity Chemicals | 4.3% |
Portfolio Compositions (%)
| Asset Type | Value |
| Common Stocks | 105.2% |
| Other Assets and Liabilities, Net | (5.2%) |
| Total | 100.0% |
In order to reduce expenses, we will deliver a single copy of prospectuses, proxies, financial reports and other communication to shareholders with the same residential address. If you would like to receive individual mailings, please call [800-551-1700] and we will begin sending you separate copies of these materials within 30 days after receiving your request.
ALPS Distributors, Inc. serves as the Fund’s distributor.
If you wish to view additional information about the Fund; including but not limited to financial statements or holdings, please visit www.wasatchglobal.com.
Phone: 800-551-1700
Email: shareholderservice@wasatchfunds.com
Wasatch Emerging India Fund
Annual Shareholder Report
September 30, 2024
Wasatch Emerging India Fund
Annual Shareholder Report
September 30, 2024
This Annual shareholder report contains important information about Wasatch Emerging India Fund for the period of October 1, 2023 to September 30, 2024. You can find additional information about the Fund at www.wasatchglobal.com. You can also request this information by contacting us at 800-551-1700.
What were the Fund costs for last year?
Annual Fund Operating Expenses
(based on a hypothetical $10,000 investment)
| Class Name | Costs of a $10,000 investment | Costs paid as a percentage of a $10,000 investment |
|---|
| Investor Class | $173 | 1.50% |
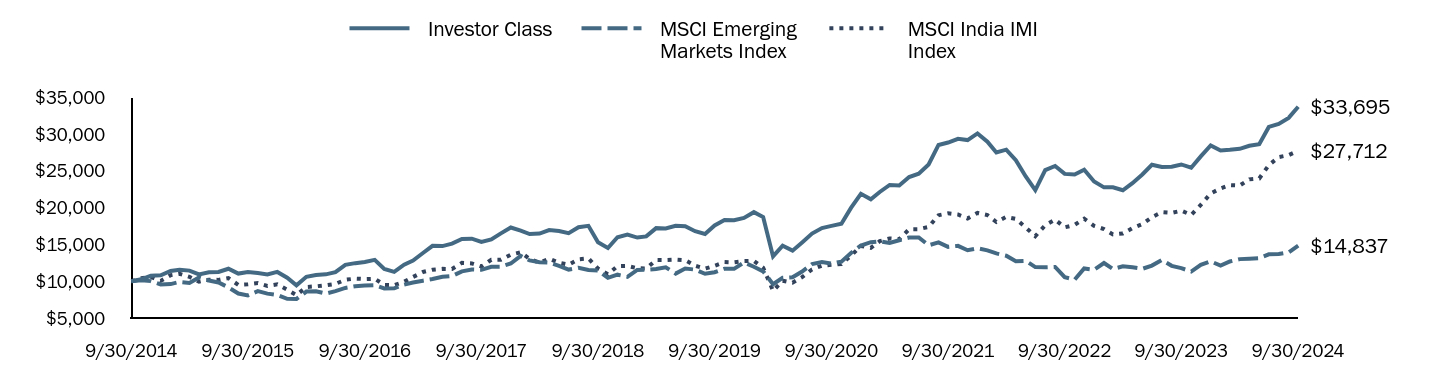
How did the fund perform last year and what affected its performance?
During the 12 months ended September 30, 2024, India’s economy remained one of the strongest in the world, and enthusiasm about economic growth drove India’s major stock indexes to record highs. A growing consensus that central banks were nearing or reaching the end of their tightening cycles also created a favorable backdrop for financial markets.
While the Fund had a significant gain during the period, it underperformed the benchmark MSCI India Investable Market Index (IMI). Our holdings in the consumer-discretionary sector were a bright spot, substantially outperforming the benchmark’s holdings in the sector. An overweight to health care was also beneficial to relative results. Underperformance was largely due to stock selection within the financial sector. High interest rates and increased capital requirements made lending more costly, in part pressuring profit margins. This weighed on some financials stocks, which remain a significant part of our portfolio. Additionally, our holdings in the materials and industrials sectors generally had solid gains but trailed the benchmark’s positions. Many of the benchmark’s holdings in those sectors tend to be more cyclical than our own. Given the strength of India’s economy, some of the more cyclical stocks outperformed.
Total return based on a $10,000 investment.
| Investor Class | MSCI Emerging Markets Index | MSCI India IMI Index |
|---|
| 9/30/2014 | $10,000 | $10,000 | $10,000 |
| 10/31/2014 | $10,256 | $10,118 | $10,393 |
| 11/30/2014 | $10,733 | $10,011 | $10,586 |
| 12/31/2014 | $10,812 | $9,550 | $10,039 |
| 1/31/2015 | $11,398 | $9,607 | $10,814 |
| 2/28/2015 | $11,545 | $9,904 | $11,013 |
| 3/31/2015 | $11,435 | $9,763 | $10,593 |
| 4/30/2015 | $10,922 | $10,514 | $9,924 |
| 5/31/2015 | $11,215 | $10,093 | $10,199 |
| 6/30/2015 | $11,251 | $9,831 | $10,177 |
| 7/31/2015 | $11,691 | $9,150 | $10,430 |
| 8/31/2015 | $11,032 | $8,322 | $9,501 |
| 9/30/2015 | $11,251 | $8,072 | $9,571 |
| 10/31/2015 | $11,105 | $8,647 | $9,744 |
| 11/30/2015 | $10,922 | $8,310 | $9,351 |
| 12/31/2015 | $11,261 | $8,125 | $9,568 |
| 1/31/2016 | $10,481 | $7,598 | $8,847 |
| 2/29/2016 | $9,440 | $7,585 | $8,114 |
| 3/31/2016 | $10,592 | $8,589 | $9,211 |
| 4/30/2016 | $10,852 | $8,636 | $9,301 |
| 5/31/2016 | $10,926 | $8,314 | $9,449 |
| 6/30/2016 | $11,224 | $8,646 | $9,636 |
| 7/31/2016 | $12,227 | $9,081 | $10,190 |
| 8/31/2016 | $12,450 | $9,307 | $10,350 |
| 9/30/2016 | $12,599 | $9,426 | $10,289 |
| 10/31/2016 | $12,896 | $9,449 | $10,328 |
| 11/30/2016 | $11,670 | $9,014 | $9,494 |
| 12/31/2016 | $11,270 | $9,034 | $9,465 |
| 1/31/2017 | $12,247 | $9,528 | $9,920 |
| 2/28/2017 | $12,810 | $9,820 | $10,572 |
| 3/31/2017 | $13,825 | $10,068 | $11,249 |
| 4/30/2017 | $14,801 | $10,288 | $11,565 |
| 5/31/2017 | $14,764 | $10,592 | $11,677 |
| 6/30/2017 | $15,102 | $10,699 | $11,661 |
| 7/31/2017 | $15,740 | $11,337 | $12,486 |
| 8/31/2017 | $15,778 | $11,590 | $12,414 |
| 9/30/2017 | $15,327 | $11,544 | $11,995 |
| 10/31/2017 | $15,665 | $11,948 | $12,913 |
| 11/30/2017 | $16,492 | $11,972 | $12,918 |
| 12/31/2017 | $17,288 | $12,402 | $13,603 |
| 1/31/2018 | $16,863 | $13,436 | $13,924 |
| 2/28/2018 | $16,399 | $12,816 | $13,026 |
| 3/31/2018 | $16,476 | $12,578 | $12,511 |
| 4/30/2018 | $16,940 | $12,522 | $13,058 |
| 5/31/2018 | $16,824 | $12,078 | $12,500 |
| 6/30/2018 | $16,515 | $11,576 | $12,232 |
| 7/31/2018 | $17,327 | $11,831 | $12,970 |
| 8/31/2018 | $17,520 | $11,511 | $13,092 |
| 9/30/2018 | $15,277 | $11,450 | $11,707 |
| 10/31/2018 | $14,504 | $10,453 | $10,958 |
| 11/30/2018 | $15,973 | $10,883 | $12,051 |
| 12/31/2018 | $16,337 | $10,595 | $12,081 |
| 1/31/2019 | $15,923 | $11,523 | $11,752 |
| 2/28/2019 | $16,088 | $11,549 | $11,731 |
| 3/31/2019 | $17,205 | $11,646 | $12,885 |
| 4/30/2019 | $17,164 | $11,891 | $12,875 |
| 5/31/2019 | $17,536 | $11,028 | $12,937 |
| 6/30/2019 | $17,453 | $11,716 | $12,858 |
| 7/31/2019 | $16,792 | $11,573 | $12,105 |
| 8/31/2019 | $16,419 | $11,009 | $11,709 |
| 9/30/2019 | $17,577 | $11,219 | $12,088 |
| 10/31/2019 | $18,322 | $11,692 | $12,602 |
| 11/30/2019 | $18,280 | $11,676 | $12,560 |
| 12/31/2019 | $18,589 | $12,547 | $12,725 |
| 1/31/2020 | $19,377 | $11,962 | $12,754 |
| 2/29/2020 | $18,713 | $11,331 | $11,834 |
| 3/31/2020 | $13,361 | $9,586 | $8,680 |
| 4/30/2020 | $14,813 | $10,464 | $10,071 |
| 5/31/2020 | $14,149 | $10,544 | $9,797 |
| 6/30/2020 | $15,269 | $11,319 | $10,547 |
| 7/31/2020 | $16,472 | $12,331 | $11,599 |
| 8/31/2020 | $17,219 | $12,603 | $12,110 |
| 9/30/2020 | $17,510 | $12,401 | $12,221 |
| 10/31/2020 | $17,800 | $12,657 | $12,328 |
| 11/30/2020 | $19,958 | $13,827 | $13,476 |
| 12/31/2020 | $21,866 | $14,844 | $14,780 |
| 1/31/2021 | $21,120 | $15,299 | $14,515 |
| 2/28/2021 | $22,115 | $15,416 | $15,436 |
| 3/31/2021 | $23,070 | $15,183 | $15,802 |
| 4/30/2021 | $22,987 | $15,561 | $15,702 |
| 5/31/2021 | $24,149 | $15,922 | $17,056 |
| 6/30/2021 | $24,605 | $15,949 | $17,069 |
| 7/31/2021 | $25,850 | $14,876 | $17,361 |
| 8/31/2021 | $28,505 | $15,265 | $18,960 |
| 9/30/2021 | $28,837 | $14,659 | $19,226 |
| 10/31/2021 | $29,335 | $14,803 | $19,056 |
| 11/30/2021 | $29,169 | $14,200 | $18,523 |
| 12/31/2021 | $30,075 | $14,467 | $19,268 |
| 1/31/2022 | $28,948 | $14,193 | $18,980 |
| 2/28/2022 | $27,474 | $13,769 | $18,038 |
| 3/31/2022 | $27,865 | $13,458 | $18,730 |
| 4/30/2022 | $26,434 | $12,709 | $18,464 |
| 5/31/2022 | $24,224 | $12,765 | $17,295 |
| 6/30/2022 | $22,361 | $11,917 | $16,117 |
| 7/31/2022 | $25,091 | $11,887 | $17,600 |
| 8/31/2022 | $25,654 | $11,937 | $18,358 |
| 9/30/2022 | $24,571 | $10,538 | $17,312 |
| 10/31/2022 | $24,484 | $10,210 | $17,646 |
| 11/30/2022 | $25,134 | $11,725 | $18,483 |
| 12/31/2022 | $23,533 | $11,560 | $17,520 |
| 1/31/2023 | $22,745 | $12,473 | $17,081 |
| 2/28/2023 | $22,745 | $11,664 | $16,357 |
| 3/31/2023 | $22,350 | $12,017 | $16,479 |
| 4/30/2023 | $23,314 | $11,881 | $17,210 |
| 5/31/2023 | $24,498 | $11,682 | $17,757 |
| 6/30/2023 | $25,812 | $12,125 | $18,690 |
| 7/31/2023 | $25,505 | $12,880 | $19,380 |
| 8/31/2023 | $25,549 | $12,087 | $19,281 |
| 9/30/2023 | $25,856 | $11,770 | $19,575 |
| 10/31/2023 | $25,418 | $11,313 | $19,003 |
| 11/30/2023 | $26,952 | $12,219 | $20,363 |
| 12/31/2023 | $28,437 | $12,696 | $21,923 |
| 1/31/2024 | $27,752 | $12,107 | $22,602 |
| 2/29/2024 | $27,843 | $12,683 | $23,051 |
| 3/31/2024 | $27,980 | $12,997 | $22,997 |
| 4/30/2024 | $28,392 | $13,055 | $23,834 |
| 5/31/2024 | $28,620 | $13,129 | $23,952 |
| 6/30/2024 | $30,952 | $13,647 | $25,759 |
| 7/31/2024 | $31,364 | $13,687 | $26,857 |
| 8/31/2024 | $32,186 | $13,908 | $27,122 |
| 9/30/2024 | $33,695 | $14,837 | $27,712 |
Fund performance shown in this graph represents past performance, which is not necessarily indicative of how the Fund will perform in the future.
Average Total Returns (%)
| Fund | Wasatch Emerging India Fund |
|---|
| Total Net Assets | $722,714,913 |
| # of Portfolio Holdings | 33 |
| Portfolio Turnover Rate | 29% |
| Total Advisory Fees Paid | $7,617,376 |
| Fund | 1 Year | 5 Years | 10 Years |
|---|
| Investor Class | 30.32% | 13.90% | 12.92% |
| MSCI Emerging Markets Index | 26.05% | 5.75% | 4.02% |
| MSCI India IMI Index | 41.57% | 18.05% | 10.73% |
The performance graph and total returns table do not reflect the deduction of taxes a shareholder would pay on Fund distributions or the redemption of Fund shares.
What did the Fund invest in?
The Fund invested in a variety of equity and debt securities. Opportunities continue to fluctuate with the volatility of the market and as banks continue to encounter risks.
| Top 10 | Value |
| Bajaj Finance Ltd. | 9.8% |
| Trent Ltd. | 9.2% |
| Cholamandalam Investment & Finance Co. Ltd. | 7.8% |
| Divi's Laboratories Ltd. | 7.2% |
| HDFC Bank Ltd. | 7.1% |
| AU Small Finance Bank Ltd. | 5.5% |
| Vijaya Diagnostic Centre Pvt Ltd. | 5.1% |
| Max Healthcare Institute Ltd. | 5.1% |
| Elgi Equipments Ltd. | 4.9% |
| Dr. Lal PathLabs Ltd. | 4.3% |
| Industry | Value |
| Consumer Finance | 19.5% |
| Diversified Banks | 9.5% |
| Health Care Services | 9.5% |
| Apparel Retail | 9.2% |
| Life Sciences Tools & Services | 7.2% |
| Health Care Facilities | 6.6% |
| Regional Banks | 5.5% |
| Industrial Machinery & Supplies & Components | 4.9% |
| Interactive Media & Services | 4.4% |
| Commodity Chemicals | 4.3% |
Portfolio Compositions (%)
| Asset Type | Value |
| Common Stocks | 105.2% |
| Other Assets and Liabilities, Net | (5.2%) |
| Total | 100.0% |
In order to reduce expenses, we will deliver a single copy of prospectuses, proxies, financial reports and other communication to shareholders with the same residential address. If you would like to receive individual mailings, please call [800-551-1700] and we will begin sending you separate copies of these materials within 30 days after receiving your request.
ALPS Distributors, Inc. serves as the Fund’s distributor.
If you wish to view additional information about the Fund; including but not limited to financial statements or holdings, please visit www.wasatchglobal.com.
Phone: 800-551-1700
Email: shareholderservice@wasatchfunds.com
Wasatch Emerging India Fund
Annual Shareholder Report
September 30, 2024
Wasatch Emerging Markets Select Fund
Institutional Class WIESX
Annual Shareholder Report
September 30, 2024
This Annual shareholder report contains important information about Wasatch Emerging Markets Select Fund for the period of October 1, 2023 to September 30, 2024. You can find additional information about the Fund at www.wasatchglobal.com. You can also request this information by contacting us at 800-551-1700.
What were the Fund costs for last year?
Annual Fund Operating Expenses
(based on a hypothetical $10,000 investment)
| Class Name | Costs of a $10,000 investment | Costs paid as a percentage of a $10,000 investment |
|---|
| Institutional Class | $125 | 1.12% |
How did the fund perform last year and what affected its performance?
During the 12 months ended September 30, 2024, enthusiasm about India’s economy helped drive emerging-market indexes higher. A growing consensus that central banks were near the end of their tightening cycles was also favorable for markets.
While the Fund had significant gains, it underperformed the benchmark MSCI Emerging Markets Index. Much of the underperformance was due to stock selection in Taiwan, where the Fund didn’t hold some of the higher-returning stocks in the benchmark. Additionally, given the concentrated nature of the portfolio, the Fund’s performance relative to its benchmark came down to a few stocks. The Fund’s largest detractors included Wuxi Biologics Cayman, Inc., a China-based contract research, development and manufacturing organization; DLocal Ltd., a Uruguay-based fintech firm; and Yifeng Pharmacy Chain Co. Ltd., a retail drugstore operator in China. While those stocks negatively impacted performance, we were pleased with the results of many of our other companies. Top contributors included Nu Holdings Ltd., a Brazilian company operating a fintech bank in Latin America; MercadoLibre, Inc., which operates a Latin American e-commerce platform; and Trent Ltd., an Indian retailer.
Total return based on a $10,000 investment.
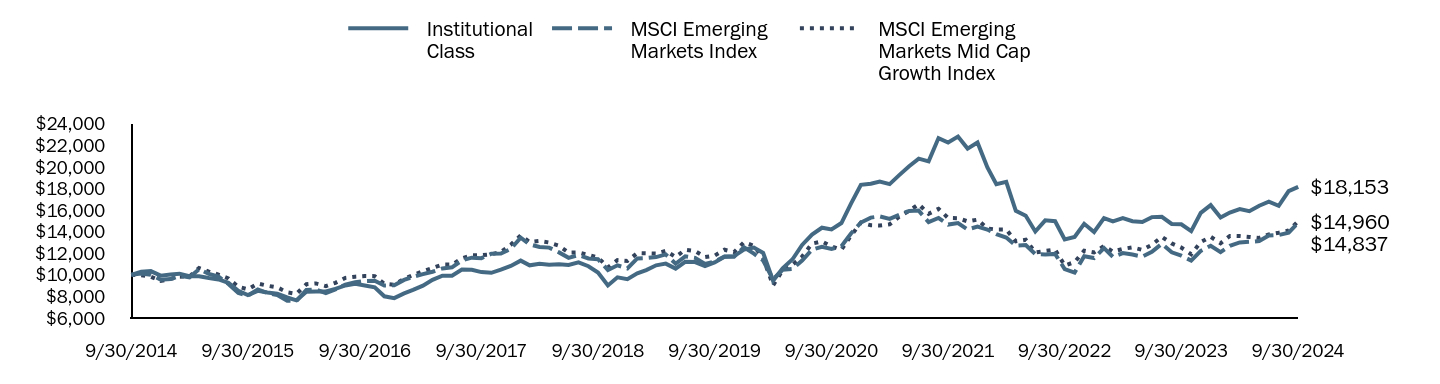
| Institutional Class | MSCI Emerging Markets Index | MSCI Emerging Markets Mid Cap Growth Index |
|---|
| 9/30/2014 | $10,000 | $10,000 | $10,000 |
| 10/31/2014 | $10,289 | $10,118 | $9,970 |
| 11/30/2014 | $10,346 | $10,011 | $9,821 |
| 12/31/2014 | $9,923 | $9,550 | $9,439 |
| 1/31/2015 | $10,029 | $9,607 | $9,621 |
| 2/28/2015 | $10,106 | $9,904 | $9,827 |
| 3/31/2015 | $9,874 | $9,763 | $9,851 |
| 4/30/2015 | $9,874 | $10,514 | $10,629 |
| 5/31/2015 | $9,710 | $10,093 | $10,298 |
| 6/30/2015 | $9,574 | $9,831 | $10,018 |
| 7/31/2015 | $9,265 | $9,150 | $9,669 |
| 8/31/2015 | $8,520 | $8,322 | $8,891 |
| 9/30/2015 | $8,133 | $8,072 | $8,659 |
| 10/31/2015 | $8,511 | $8,647 | $9,191 |
| 11/30/2015 | $8,366 | $8,310 | $8,990 |
| 12/31/2015 | $8,240 | $8,125 | $8,837 |
| 1/31/2016 | $7,901 | $7,598 | $8,383 |
| 2/29/2016 | $7,640 | $7,585 | $8,238 |
| 3/31/2016 | $8,424 | $8,589 | $9,129 |
| 4/30/2016 | $8,462 | $8,636 | $9,203 |
| 5/31/2016 | $8,462 | $8,314 | $8,956 |
| 6/30/2016 | $8,704 | $8,646 | $9,262 |
| 7/31/2016 | $9,013 | $9,081 | $9,719 |
| 8/31/2016 | $9,159 | $9,307 | $9,829 |
| 9/30/2016 | $9,013 | $9,426 | $9,886 |
| 10/31/2016 | $8,849 | $9,449 | $9,879 |
| 11/30/2016 | $8,008 | $9,014 | $9,168 |
| 12/31/2016 | $7,843 | $9,034 | $9,081 |
| 1/31/2017 | $8,278 | $9,528 | $9,629 |
| 2/28/2017 | $8,598 | $9,820 | $9,984 |
| 3/31/2017 | $8,994 | $10,068 | $10,332 |
| 4/30/2017 | $9,536 | $10,288 | $10,640 |
| 5/31/2017 | $9,923 | $10,592 | $10,950 |
| 6/30/2017 | $9,913 | $10,699 | $10,944 |
| 7/31/2017 | $10,483 | $11,337 | $11,527 |
| 8/31/2017 | $10,464 | $11,590 | $11,802 |
| 9/30/2017 | $10,251 | $11,544 | $11,818 |
| 10/31/2017 | $10,184 | $11,948 | $11,908 |
| 11/30/2017 | $10,474 | $11,972 | $12,122 |
| 12/31/2017 | $10,822 | $12,402 | $12,785 |
| 1/31/2018 | $11,315 | $13,436 | $13,654 |
| 2/28/2018 | $10,880 | $12,816 | $13,043 |
| 3/31/2018 | $11,025 | $12,578 | $13,134 |
| 4/30/2018 | $10,938 | $12,522 | $12,992 |
| 5/31/2018 | $10,977 | $12,078 | $12,694 |
| 6/30/2018 | $10,909 | $11,576 | $12,059 |
| 7/31/2018 | $11,151 | $11,831 | $12,075 |
| 8/31/2018 | $10,793 | $11,511 | $11,835 |
| 9/30/2018 | $10,213 | $11,450 | $11,596 |
| 10/31/2018 | $9,013 | $10,453 | $10,691 |
| 11/30/2018 | $9,768 | $10,883 | $11,366 |
| 12/31/2018 | $9,603 | $10,595 | $11,287 |
| 1/31/2019 | $10,135 | $11,523 | $12,015 |
| 2/28/2019 | $10,435 | $11,549 | $11,996 |
| 3/31/2019 | $10,880 | $11,646 | $11,969 |
| 4/30/2019 | $11,035 | $11,891 | $12,222 |
| 5/31/2019 | $10,580 | $11,028 | $11,648 |
| 6/30/2019 | $11,209 | $11,716 | $12,326 |
| 7/31/2019 | $11,180 | $11,573 | $12,209 |
| 8/31/2019 | $10,812 | $11,009 | $11,645 |
| 9/30/2019 | $11,151 | $11,219 | $11,776 |
| 10/31/2019 | $11,673 | $11,692 | $12,325 |
| 11/30/2019 | $11,731 | $11,676 | $12,105 |
| 12/31/2019 | $12,331 | $12,547 | $13,018 |
| 1/31/2020 | $12,524 | $11,962 | $12,684 |
| 2/29/2020 | $12,031 | $11,331 | $11,546 |
| 3/31/2020 | $9,449 | $9,586 | $9,029 |
| 4/30/2020 | $10,609 | $10,464 | $10,413 |
| 5/31/2020 | $11,441 | $10,544 | $10,934 |
| 6/30/2020 | $12,766 | $11,319 | $11,696 |
| 7/31/2020 | $13,733 | $12,331 | $12,887 |
| 8/31/2020 | $14,362 | $12,603 | $13,092 |
| 9/30/2020 | $14,207 | $12,401 | $12,638 |
| 10/31/2020 | $14,797 | $12,657 | $12,324 |
| 11/30/2020 | $16,596 | $13,827 | $13,618 |
| 12/31/2020 | $18,336 | $14,844 | $14,834 |
| 1/31/2021 | $18,443 | $15,299 | $14,587 |
| 2/28/2021 | $18,646 | $15,416 | $14,563 |
| 3/31/2021 | $18,404 | $15,183 | $14,678 |
| 4/30/2021 | $19,236 | $15,561 | $15,384 |
| 5/31/2021 | $20,058 | $15,922 | $15,925 |
| 6/30/2021 | $20,764 | $15,949 | $16,539 |
| 7/31/2021 | $20,512 | $14,876 | $15,653 |
| 8/31/2021 | $22,669 | $15,265 | $16,116 |
| 9/30/2021 | $22,263 | $14,659 | $15,264 |
| 10/31/2021 | $22,804 | $14,803 | $15,241 |
| 11/30/2021 | $21,692 | $14,200 | $14,952 |
| 12/31/2021 | $22,262 | $14,467 | $15,112 |
| 1/31/2022 | $19,940 | $14,193 | $14,296 |
| 2/28/2022 | $18,386 | $13,769 | $14,192 |
| 3/31/2022 | $18,619 | $13,458 | $14,199 |
| 4/30/2022 | $15,929 | $12,709 | $13,102 |
| 5/31/2022 | $15,472 | $12,765 | $13,251 |
| 6/30/2022 | $14,015 | $11,917 | $12,069 |
| 7/31/2022 | $15,045 | $11,887 | $12,213 |
| 8/31/2022 | $14,967 | $11,937 | $12,334 |
| 9/30/2022 | $13,268 | $10,538 | $10,866 |
| 10/31/2022 | $13,501 | $10,210 | $11,177 |
| 11/30/2022 | $14,724 | $11,725 | $12,232 |
| 12/31/2022 | $13,967 | $11,560 | $12,074 |
| 1/31/2023 | $15,259 | $12,473 | $12,675 |
| 2/28/2023 | $14,948 | $11,664 | $12,155 |
| 3/31/2023 | $15,259 | $12,017 | $12,402 |
| 4/30/2023 | $14,967 | $11,881 | $12,542 |
| 5/31/2023 | $14,899 | $11,682 | $12,308 |
| 6/30/2023 | $15,346 | $12,125 | $12,788 |
| 7/31/2023 | $15,375 | $12,880 | $13,521 |
| 8/31/2023 | $14,715 | $12,087 | $12,906 |
| 9/30/2023 | $14,676 | $11,770 | $12,521 |
| 10/31/2023 | $14,045 | $11,313 | $11,909 |
| 11/30/2023 | $15,735 | $12,219 | $13,036 |
| 12/31/2023 | $16,453 | $12,696 | $13,520 |
| 1/31/2024 | $15,307 | $12,107 | $12,929 |
| 2/29/2024 | $15,773 | $12,683 | $13,604 |
| 3/31/2024 | $16,084 | $12,997 | $13,592 |
| 4/30/2024 | $15,890 | $13,055 | $13,513 |
| 5/31/2024 | $16,405 | $13,129 | $13,418 |
| 6/30/2024 | $16,774 | $13,647 | $13,737 |
| 7/31/2024 | $16,395 | $13,687 | $13,904 |
| 8/31/2024 | $17,755 | $13,908 | $14,104 |
| 9/30/2024 | $18,153 | $14,837 | $14,960 |
Fund performance shown in this graph represents past performance, which is not necessarily indicative of how the Fund will perform in the future.
Average Total Returns (%)
| Fund | Wasatch Emerging Markets Select Fund |
|---|
| Total Net Assets | $451,048,964 |
| # of Portfolio Holdings | 33 |
| Portfolio Turnover Rate | 34% |
| Total Advisory Fees Paid | $4,468,496 |
| Fund | 1 Year | 5 Years | 10 Years |
|---|
| Institutional Class | 23.69% | 10.24% | 6.14% |
| MSCI Emerging Markets Index | 26.05% | 5.75% | 4.02% |
| MSCI Emerging Markets Mid Cap Growth Index | 19.48% | 4.90% | 4.11% |
The performance graph and total returns table do not reflect the deduction of taxes a shareholder would pay on Fund distributions or the redemption of Fund shares.
What did the Fund invest in?
The Fund invested in a variety of equity and debt securities. Opportunities continue to fluctuate with the volatility of the market and as banks continue to encounter risks.
| Top 10 | Value |
| Bajaj Finance Ltd. | 7.9% |
| MercadoLibre, Inc. | 7.2% |
| NU Holdings Ltd. A | 5.9% |
| Voltronic Power Technology Corp. | 5.7% |
| ASPEED Technology, Inc. | 4.9% |
| Globant SA | 4.8% |
| Divi's Laboratories Ltd. | 4.8% |
| WEG SA | 4.8% |
| Silergy Corp. | 4.3% |
| HDFC Bank Ltd. | 3.8% |
| Industry | Value |
| Semiconductors | 11.7% |
| Electrical Components & Equipment | 10.5% |
| Consumer Finance | 10.0% |
| Diversified Banks | 9.8% |
| Broadline Retail | 8.2% |
| Industrial Machinery & Supplies & Components | 4.9% |
| IT Consulting & Other Services | 4.8% |
| Life Sciences Tools & Services | 4.8% |
| Apparel Retail | 3.5% |
| Hotels, Resorts & Cruise Lines | 3.5% |
Portfolio Compositions (%)
| Asset Type | Value |
| Common Stocks | 101.1% |
| Other Assets and Liabilities, Net | (1.1%) |
| Total | 100.0% |
In order to reduce expenses, we will deliver a single copy of prospectuses, proxies, financial reports and other communication to shareholders with the same residential address. If you would like to receive individual mailings, please call [800-551-1700] and we will begin sending you separate copies of these materials within 30 days after receiving your request.
ALPS Distributors, Inc. serves as the Fund’s distributor.
If you wish to view additional information about the Fund; including but not limited to financial statements or holdings, please visit www.wasatchglobal.com.
Phone: 800-551-1700
Email: shareholderservice@wasatchfunds.com
Wasatch Emerging Markets Select Fund
Annual Shareholder Report
September 30, 2024
Wasatch Emerging Markets Select Fund
Annual Shareholder Report
September 30, 2024
This Annual shareholder report contains important information about Wasatch Emerging Markets Select Fund for the period of October 1, 2023 to September 30, 2024. You can find additional information about the Fund at www.wasatchglobal.com. You can also request this information by contacting us at 800-551-1700.
What were the Fund costs for last year?
Annual Fund Operating Expenses
(based on a hypothetical $10,000 investment)
| Class Name | Costs of a $10,000 investment | Costs paid as a percentage of a $10,000 investment |
|---|
| Investor Class | $153 | 1.37% |
How did the fund perform last year and what affected its performance?
During the 12 months ended September 30, 2024, enthusiasm about India’s economy helped drive emerging-market indexes higher. A growing consensus that central banks were near the end of their tightening cycles was also favorable for markets.
While the Fund had significant gains, it underperformed the benchmark MSCI Emerging Markets Index. Much of the underperformance was due to stock selection in Taiwan, where the Fund didn’t hold some of the higher-returning stocks in the benchmark. Additionally, given the concentrated nature of the portfolio, the Fund’s performance relative to its benchmark came down to a few stocks. The Fund’s largest detractors included Wuxi Biologics Cayman, Inc., a China-based contract research, development and manufacturing organization; DLocal Ltd., a Uruguay-based fintech firm; and Yifeng Pharmacy Chain Co. Ltd., a retail drugstore operator in China. While those stocks negatively impacted performance, we were pleased with the results of many of our other companies. Top contributors included Nu Holdings Ltd., a Brazilian company operating a fintech bank in Latin America; MercadoLibre, Inc., which operates a Latin American e-commerce platform; and Trent Ltd., an Indian retailer.
Total return based on a $10,000 investment.
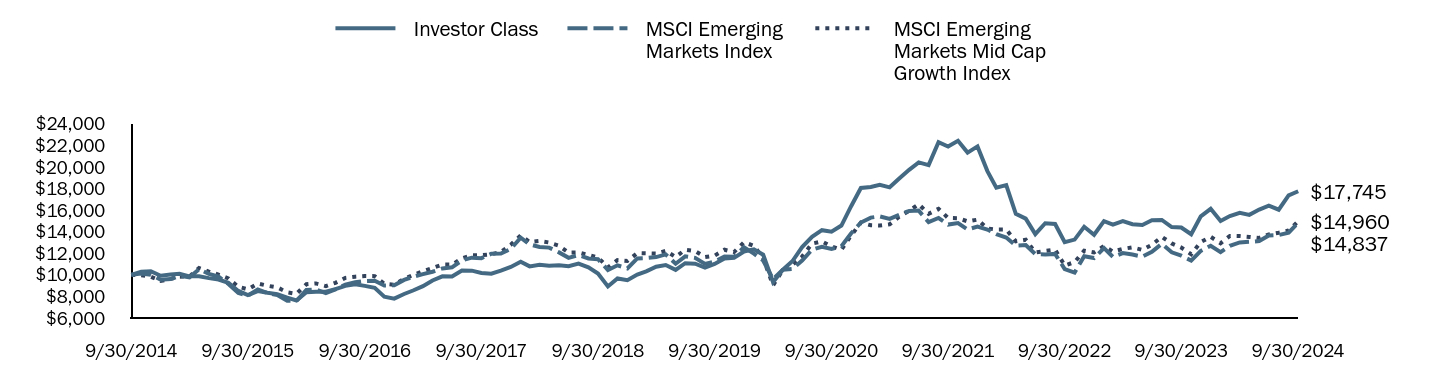
| Investor Class | MSCI Emerging Markets Index | MSCI Emerging Markets Mid Cap Growth Index |
|---|
| 9/30/2014 | $10,000 | $10,000 | $10,000 |
| 10/31/2014 | $10,291 | $10,118 | $9,970 |
| 11/30/2014 | $10,339 | $10,011 | $9,821 |
| 12/31/2014 | $9,918 | $9,550 | $9,439 |
| 1/31/2015 | $10,025 | $9,607 | $9,621 |
| 2/28/2015 | $10,102 | $9,904 | $9,827 |
| 3/31/2015 | $9,859 | $9,763 | $9,851 |
| 4/30/2015 | $9,859 | $10,514 | $10,629 |
| 5/31/2015 | $9,694 | $10,093 | $10,298 |
| 6/30/2015 | $9,568 | $9,831 | $10,018 |
| 7/31/2015 | $9,256 | $9,150 | $9,669 |
| 8/31/2015 | $8,508 | $8,322 | $8,891 |
| 9/30/2015 | $8,119 | $8,072 | $8,659 |
| 10/31/2015 | $8,488 | $8,647 | $9,191 |
| 11/30/2015 | $8,342 | $8,310 | $8,990 |
| 12/31/2015 | $8,216 | $8,125 | $8,837 |
| 1/31/2016 | $7,885 | $7,598 | $8,383 |
| 2/29/2016 | $7,623 | $7,585 | $8,238 |
| 3/31/2016 | $8,391 | $8,589 | $9,129 |
| 4/30/2016 | $8,440 | $8,636 | $9,203 |
| 5/31/2016 | $8,430 | $8,314 | $8,956 |
| 6/30/2016 | $8,673 | $8,646 | $9,262 |
| 7/31/2016 | $8,974 | $9,081 | $9,719 |
| 8/31/2016 | $9,120 | $9,307 | $9,829 |
| 9/30/2016 | $8,974 | $9,426 | $9,886 |
| 10/31/2016 | $8,799 | $9,449 | $9,879 |
| 11/30/2016 | $7,973 | $9,014 | $9,168 |
| 12/31/2016 | $7,798 | $9,034 | $9,081 |
| 1/31/2017 | $8,226 | $9,528 | $9,629 |
| 2/28/2017 | $8,547 | $9,820 | $9,984 |
| 3/31/2017 | $8,945 | $10,068 | $10,332 |
| 4/30/2017 | $9,480 | $10,288 | $10,640 |
| 5/31/2017 | $9,859 | $10,592 | $10,950 |
| 6/30/2017 | $9,850 | $10,699 | $10,944 |
| 7/31/2017 | $10,404 | $11,337 | $11,527 |
| 8/31/2017 | $10,384 | $11,590 | $11,802 |
| 9/30/2017 | $10,170 | $11,544 | $11,818 |
| 10/31/2017 | $10,102 | $11,948 | $11,908 |
| 11/30/2017 | $10,394 | $11,972 | $12,122 |
| 12/31/2017 | $10,734 | $12,402 | $12,785 |
| 1/31/2018 | $11,221 | $13,436 | $13,654 |
| 2/28/2018 | $10,783 | $12,816 | $13,043 |
| 3/31/2018 | $10,929 | $12,578 | $13,134 |
| 4/30/2018 | $10,841 | $12,522 | $12,992 |
| 5/31/2018 | $10,880 | $12,078 | $12,694 |
| 6/30/2018 | $10,802 | $11,576 | $12,059 |
| 7/31/2018 | $11,036 | $11,831 | $12,075 |
| 8/31/2018 | $10,686 | $11,511 | $11,835 |
| 9/30/2018 | $10,112 | $11,450 | $11,596 |
| 10/31/2018 | $8,926 | $10,453 | $10,691 |
| 11/30/2018 | $9,665 | $10,883 | $11,366 |
| 12/31/2018 | $9,500 | $10,595 | $11,287 |
| 1/31/2019 | $10,025 | $11,523 | $12,015 |
| 2/28/2019 | $10,326 | $11,549 | $11,996 |
| 3/31/2019 | $10,754 | $11,646 | $11,969 |
| 4/30/2019 | $10,909 | $11,891 | $12,222 |
| 5/31/2019 | $10,462 | $11,028 | $11,648 |
| 6/30/2019 | $11,075 | $11,716 | $12,326 |
| 7/31/2019 | $11,036 | $11,573 | $12,209 |
| 8/31/2019 | $10,676 | $11,009 | $11,645 |
| 9/30/2019 | $11,007 | $11,219 | $11,776 |
| 10/31/2019 | $11,522 | $11,692 | $12,325 |
| 11/30/2019 | $11,571 | $11,676 | $12,105 |
| 12/31/2019 | $12,164 | $12,547 | $13,018 |
| 1/31/2020 | $12,358 | $11,962 | $12,684 |
| 2/29/2020 | $11,862 | $11,331 | $11,546 |
| 3/31/2020 | $9,315 | $9,586 | $9,029 |
| 4/30/2020 | $10,452 | $10,464 | $10,413 |
| 5/31/2020 | $11,279 | $10,544 | $10,934 |
| 6/30/2020 | $12,572 | $11,319 | $11,696 |
| 7/31/2020 | $13,525 | $12,331 | $12,887 |
| 8/31/2020 | $14,137 | $12,603 | $13,092 |
| 9/30/2020 | $13,992 | $12,401 | $12,638 |
| 10/31/2020 | $14,565 | $12,657 | $12,324 |
| 11/30/2020 | $16,335 | $13,827 | $13,618 |
| 12/31/2020 | $18,046 | $14,844 | $14,834 |
| 1/31/2021 | $18,143 | $15,299 | $14,587 |
| 2/28/2021 | $18,338 | $15,416 | $14,563 |
| 3/31/2021 | $18,105 | $15,183 | $14,678 |
| 4/30/2021 | $18,921 | $15,561 | $15,384 |
| 5/31/2021 | $19,728 | $15,922 | $15,925 |
| 6/30/2021 | $20,419 | $15,949 | $16,539 |
| 7/31/2021 | $20,166 | $14,876 | $15,653 |
| 8/31/2021 | $22,285 | $15,265 | $16,116 |
| 9/30/2021 | $21,887 | $14,659 | $15,264 |
| 10/31/2021 | $22,422 | $14,803 | $15,241 |
| 11/30/2021 | $21,323 | $14,200 | $14,952 |
| 12/31/2021 | $21,895 | $14,467 | $15,112 |
| 1/31/2022 | $19,610 | $14,193 | $14,296 |
| 2/28/2022 | $18,077 | $13,769 | $14,192 |
| 3/31/2022 | $18,311 | $13,458 | $14,199 |
| 4/30/2022 | $15,655 | $12,709 | $13,102 |
| 5/31/2022 | $15,206 | $12,765 | $13,251 |
| 6/30/2022 | $13,770 | $11,917 | $12,069 |
| 7/31/2022 | $14,776 | $11,887 | $12,213 |
| 8/31/2022 | $14,708 | $11,937 | $12,334 |
| 9/30/2022 | $13,028 | $10,538 | $10,866 |
| 10/31/2022 | $13,262 | $10,210 | $11,177 |
| 11/30/2022 | $14,454 | $11,725 | $12,232 |
| 12/31/2022 | $13,711 | $11,560 | $12,074 |
| 1/31/2023 | $14,971 | $12,473 | $12,675 |
| 2/28/2023 | $14,659 | $11,664 | $12,155 |
| 3/31/2023 | $14,971 | $12,017 | $12,402 |
| 4/30/2023 | $14,688 | $11,881 | $12,542 |
| 5/31/2023 | $14,620 | $11,682 | $12,308 |
| 6/30/2023 | $15,049 | $12,125 | $12,788 |
| 7/31/2023 | $15,079 | $12,880 | $13,521 |
| 8/31/2023 | $14,424 | $12,087 | $12,906 |
| 9/30/2023 | $14,385 | $11,770 | $12,521 |
| 10/31/2023 | $13,760 | $11,313 | $11,909 |
| 11/30/2023 | $15,420 | $12,219 | $13,036 |
| 12/31/2023 | $16,114 | $12,696 | $13,520 |
| 1/31/2024 | $14,991 | $12,107 | $12,929 |
| 2/29/2024 | $15,450 | $12,683 | $13,604 |
| 3/31/2024 | $15,752 | $12,997 | $13,592 |
| 4/30/2024 | $15,557 | $13,055 | $13,513 |
| 5/31/2024 | $16,045 | $13,129 | $13,418 |
| 6/30/2024 | $16,417 | $13,647 | $13,737 |
| 7/31/2024 | $16,036 | $13,687 | $13,904 |
| 8/31/2024 | $17,364 | $13,908 | $14,104 |
| 9/30/2024 | $17,745 | $14,837 | $14,960 |
Fund performance shown in this graph represents past performance, which is not necessarily indicative of how the Fund will perform in the future.
Average Total Returns (%)
| Fund | Wasatch Emerging Markets Select Fund |
|---|
| Total Net Assets | $451,048,964 |
| # of Portfolio Holdings | 33 |
| Portfolio Turnover Rate | 34% |
| Total Advisory Fees Paid | $4,468,496 |
| Fund | 1 Year | 5 Years | 10 Years |
|---|
| Investor Class | 23.35% | 10.02% | 5.90% |
| MSCI Emerging Markets Index | 26.05% | 5.75% | 4.02% |
| MSCI Emerging Markets Mid Cap Growth Index | 19.48% | 4.90% | 4.11% |
The performance graph and total returns table do not reflect the deduction of taxes a shareholder would pay on Fund distributions or the redemption of Fund shares.
What did the Fund invest in?
The Fund invested in a variety of equity and debt securities. Opportunities continue to fluctuate with the volatility of the market and as banks continue to encounter risks.
| Top 10 | Value |
| Bajaj Finance Ltd. | 7.9% |
| MercadoLibre, Inc. | 7.2% |
| NU Holdings Ltd. A | 5.9% |
| Voltronic Power Technology Corp. | 5.7% |
| ASPEED Technology, Inc. | 4.9% |
| Globant SA | 4.8% |
| Divi's Laboratories Ltd. | 4.8% |
| WEG SA | 4.8% |
| Silergy Corp. | 4.3% |
| HDFC Bank Ltd. | 3.8% |
| Industry | Value |
| Semiconductors | 11.7% |
| Electrical Components & Equipment | 10.5% |
| Consumer Finance | 10.0% |
| Diversified Banks | 9.8% |
| Broadline Retail | 8.2% |
| Industrial Machinery & Supplies & Components | 4.9% |
| IT Consulting & Other Services | 4.8% |
| Life Sciences Tools & Services | 4.8% |
| Apparel Retail | 3.5% |
| Hotels, Resorts & Cruise Lines | 3.5% |
Portfolio Compositions (%)
| Asset Type | Value |
| Common Stocks | 101.1% |
| Other Assets and Liabilities, Net | (1.1%) |
| Total | 100.0% |
In order to reduce expenses, we will deliver a single copy of prospectuses, proxies, financial reports and other communication to shareholders with the same residential address. If you would like to receive individual mailings, please call [800-551-1700] and we will begin sending you separate copies of these materials within 30 days after receiving your request.
ALPS Distributors, Inc. serves as the Fund’s distributor.
If you wish to view additional information about the Fund; including but not limited to financial statements or holdings, please visit www.wasatchglobal.com.
Phone: 800-551-1700
Email: shareholderservice@wasatchfunds.com
Wasatch Emerging Markets Select Fund
Annual Shareholder Report
September 30, 2024
Wasatch Emerging Markets Small Cap Fund
Institutional Class WIEMX
Annual Shareholder Report
September 30, 2024
This Annual shareholder report contains important information about Wasatch Emerging Markets Small Cap Fund for the period of October 1, 2023 to September 30, 2024. You can find additional information about the Fund at www.wasatchglobal.com. You can also request this information by contacting us at 800-551-1700.
What were the Fund costs for last year?
Annual Fund Operating Expenses
(based on a hypothetical $10,000 investment)
| Class Name | Costs of a $10,000 investment | Costs paid as a percentage of a $10,000 investment |
|---|
| Institutional Class | $201 | 1.81% |
How did the fund perform last year and what affected its performance?
During the 12 months ended September 30, 2024, enthusiasm about the strength of India’s economy played a role in driving emerging-market indexes higher. A growing consensus that central banks were nearing or reaching the end of their tightening cycles also created a favorable backdrop for financial markets.
While the Fund had a significant gain during the period, it modestly underperformed the benchmark MSCI Emerging Markets Small Cap Index. The Fund’s return came in part from a number of Indian companies that demonstrated strong fundamentals, which were well received by the market. Stock selection in India was a bright spot for relative performance as well. Overweight positioning in Mexico was the Fund’s biggest source of underperformance. In the latter half of the period, stocks in Mexico sold off broadly as investors reacted to the Morena Party’s resounding victory in national elections. Investors were concerned the winning party could use its mandate to brush aside some checks on presidential power. Among sectors, stock selection in the financials sector weighed on relative results, while stock selection in the consumer-discretionary sector contributed.
Total return based on a $10,000 investment.
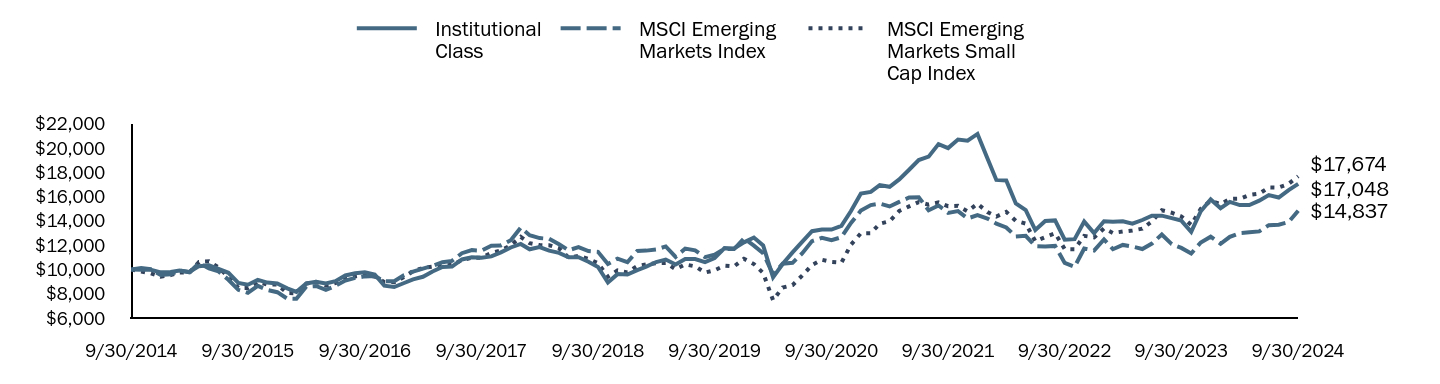
| Institutional Class | MSCI Emerging Markets Index | MSCI Emerging Markets Small Cap Index |
|---|
| 9/30/2014 | $10,000 | $10,000 | $10,000 |
| 10/31/2014 | $9,964 | $10,118 | $9,824 |
| 11/30/2014 | $9,964 | $10,011 | $9,673 |
| 12/31/2014 | $9,758 | $9,550 | $9,398 |
| 1/31/2015 | $9,794 | $9,607 | $9,533 |
| 2/28/2015 | $9,904 | $9,904 | $9,748 |
| 3/31/2015 | $9,794 | $9,763 | $9,735 |
| 4/30/2015 | $10,270 | $10,514 | $10,617 |
| 5/31/2015 | $10,343 | $10,093 | $10,661 |
| 6/30/2015 | $10,050 | $9,831 | $10,173 |
| 7/31/2015 | $9,721 | $9,150 | $9,383 |
| 8/31/2015 | $8,881 | $8,322 | $8,477 |
| 9/30/2015 | $8,735 | $8,072 | $8,477 |
| 10/31/2015 | $9,137 | $8,647 | $8,978 |
| 11/30/2015 | $8,917 | $8,310 | $8,747 |
| 12/31/2015 | $8,846 | $8,125 | $8,754 |
| 1/31/2016 | $8,444 | $7,598 | $8,065 |
| 2/29/2016 | $8,151 | $7,585 | $8,036 |
| 3/31/2016 | $8,846 | $8,589 | $8,839 |
| 4/30/2016 | $8,992 | $8,636 | $8,971 |
| 5/31/2016 | $8,846 | $8,314 | $8,655 |
| 6/30/2016 | $9,028 | $8,646 | $8,875 |
| 7/31/2016 | $9,504 | $9,081 | $9,254 |
| 8/31/2016 | $9,686 | $9,307 | $9,425 |
| 9/30/2016 | $9,759 | $9,426 | $9,549 |
| 10/31/2016 | $9,577 | $9,449 | $9,407 |
| 11/30/2016 | $8,663 | $9,014 | $8,969 |
| 12/31/2016 | $8,553 | $9,034 | $8,954 |
| 1/31/2017 | $8,882 | $9,528 | $9,373 |
| 2/28/2017 | $9,175 | $9,820 | $9,861 |
| 3/31/2017 | $9,394 | $10,068 | $10,120 |
| 4/30/2017 | $9,832 | $10,288 | $10,234 |
| 5/31/2017 | $10,198 | $10,592 | $10,305 |
| 6/30/2017 | $10,235 | $10,699 | $10,386 |
| 7/31/2017 | $10,819 | $11,337 | $10,757 |
| 8/31/2017 | $11,002 | $11,590 | $10,966 |
| 9/30/2017 | $10,966 | $11,544 | $10,971 |
| 10/31/2017 | $11,075 | $11,948 | $11,356 |
| 11/30/2017 | $11,404 | $11,972 | $11,556 |
| 12/31/2017 | $11,806 | $12,402 | $11,984 |
| 1/31/2018 | $12,099 | $13,436 | $12,678 |
| 2/28/2018 | $11,660 | $12,816 | $12,158 |
| 3/31/2018 | $11,843 | $12,578 | $12,004 |
| 4/30/2018 | $11,550 | $12,522 | $11,990 |
| 5/31/2018 | $11,368 | $12,078 | $11,741 |
| 6/30/2018 | $11,002 | $11,576 | $10,971 |
| 7/31/2018 | $11,002 | $11,831 | $11,105 |
| 8/31/2018 | $10,637 | $11,511 | $10,871 |
| 9/30/2018 | $10,198 | $11,450 | $10,510 |
| 10/31/2018 | $8,919 | $10,453 | $9,401 |
| 11/30/2018 | $9,613 | $10,883 | $9,915 |
| 12/31/2018 | $9,576 | $10,595 | $9,756 |
| 1/31/2019 | $9,947 | $11,523 | $10,281 |
| 2/28/2019 | $10,236 | $11,549 | $10,414 |
| 3/31/2019 | $10,607 | $11,646 | $10,513 |
| 4/30/2019 | $10,814 | $11,891 | $10,535 |
| 5/31/2019 | $10,401 | $11,028 | $10,017 |
| 6/30/2019 | $10,855 | $11,716 | $10,410 |
| 7/31/2019 | $10,855 | $11,573 | $10,255 |
| 8/31/2019 | $10,607 | $11,009 | $9,741 |
| 9/30/2019 | $10,938 | $11,219 | $9,933 |
| 10/31/2019 | $11,763 | $11,692 | $10,312 |
| 11/30/2019 | $11,722 | $11,676 | $10,252 |
| 12/31/2019 | $12,231 | $12,547 | $10,878 |
| 1/31/2020 | $12,625 | $11,962 | $10,444 |
| 2/29/2020 | $11,969 | $11,331 | $9,707 |
| 3/31/2020 | $9,348 | $9,586 | $7,466 |
| 4/30/2020 | $10,440 | $10,464 | $8,506 |
| 5/31/2020 | $11,401 | $10,544 | $8,708 |
| 6/30/2020 | $12,275 | $11,319 | $9,492 |
| 7/31/2020 | $13,149 | $12,331 | $10,369 |
| 8/31/2020 | $13,280 | $12,603 | $10,794 |
| 9/30/2020 | $13,280 | $12,401 | $10,617 |
| 10/31/2020 | $13,586 | $12,657 | $10,559 |
| 11/30/2020 | $14,809 | $13,827 | $12,046 |
| 12/31/2020 | $16,245 | $14,844 | $12,976 |
| 1/31/2021 | $16,386 | $15,299 | $12,987 |
| 2/28/2021 | $16,947 | $15,416 | $13,760 |
| 3/31/2021 | $16,807 | $15,183 | $13,971 |
| 4/30/2021 | $17,415 | $15,561 | $14,814 |
| 5/31/2021 | $18,211 | $15,922 | $15,188 |
| 6/30/2021 | $19,007 | $15,949 | $15,543 |
| 7/31/2021 | $19,288 | $14,876 | $15,339 |
| 8/31/2021 | $20,318 | $15,265 | $15,516 |
| 9/30/2021 | $19,990 | $14,659 | $15,208 |
| 10/31/2021 | $20,693 | $14,803 | $15,235 |
| 11/30/2021 | $20,599 | $14,200 | $14,788 |
| 12/31/2021 | $21,154 | $14,467 | $15,409 |
| 1/31/2022 | $19,163 | $14,193 | $14,728 |
| 2/28/2022 | $17,371 | $13,769 | $14,360 |
| 3/31/2022 | $17,322 | $13,458 | $14,742 |
| 4/30/2022 | $15,430 | $12,709 | $14,002 |
| 5/31/2022 | $14,883 | $12,765 | $13,773 |
| 6/30/2022 | $13,240 | $11,917 | $12,322 |
| 7/31/2022 | $13,987 | $11,887 | $12,663 |
| 8/31/2022 | $14,037 | $11,937 | $12,976 |
| 9/30/2022 | $12,444 | $10,538 | $11,675 |
| 10/31/2022 | $12,493 | $10,210 | $11,667 |
| 11/30/2022 | $13,937 | $11,725 | $12,764 |
| 12/31/2022 | $12,992 | $11,560 | $12,632 |
| 1/31/2023 | $13,967 | $12,473 | $13,381 |
| 2/28/2023 | $13,916 | $11,664 | $12,999 |
| 3/31/2023 | $13,967 | $12,017 | $13,121 |
| 4/30/2023 | $13,762 | $11,881 | $13,208 |
| 5/31/2023 | $14,070 | $11,682 | $13,355 |
| 6/30/2023 | $14,429 | $12,125 | $13,959 |
| 7/31/2023 | $14,429 | $12,880 | $14,870 |
| 8/31/2023 | $14,224 | $12,087 | $14,669 |
| 9/30/2023 | $14,019 | $11,770 | $14,368 |
| 10/31/2023 | $13,094 | $11,313 | $13,673 |
| 11/30/2023 | $14,789 | $12,219 | $14,991 |
| 12/31/2023 | $15,764 | $12,696 | $15,654 |
| 1/31/2024 | $15,046 | $12,107 | $15,383 |
| 2/29/2024 | $15,559 | $12,683 | $15,806 |
| 3/31/2024 | $15,302 | $12,997 | $15,818 |
| 4/30/2024 | $15,302 | $13,055 | $16,131 |
| 5/31/2024 | $15,662 | $13,129 | $16,237 |
| 6/30/2024 | $16,124 | $13,647 | $16,756 |
| 7/31/2024 | $15,919 | $13,687 | $16,748 |
| 8/31/2024 | $16,535 | $13,908 | $17,046 |
| 9/30/2024 | $17,048 | $14,837 | $17,674 |
Fund performance shown in this graph represents past performance, which is not necessarily indicative of how the Fund will perform in the future.
Average Total Returns (%)
| Fund | Wasatch Emerging Markets Small Cap Fund |
|---|
| Total Net Assets | $354,713,613 |
| # of Portfolio Holdings | 50 |
| Portfolio Turnover Rate | 27% |
| Total Advisory Fees Paid | $5,551,544 |
| Fund | 1 Year | 5 Years | 10 Years |
|---|
| Institutional Class | 21.61% | 9.28% | 5.48% |
| MSCI Emerging Markets Index | 26.05% | 5.75% | 4.02% |
| MSCI Emerging Markets Small Cap Index | 23.01% | 12.22% | 5.86% |
The performance graph and total returns table do not reflect the deduction of taxes a shareholder would pay on Fund distributions or the redemption of Fund shares.
What did the Fund invest in?
The Fund invested in a variety of equity and debt securities. Opportunities continue to fluctuate with the volatility of the market and as banks continue to encounter risks.
| Top 10 | Value |
| Voltronic Power Technology Corp. | 7.1% |
| Trent Ltd. | 6.8% |
| Globant SA | 5.4% |
| Cholamandalam Financial Holdings Ltd. | 5.3% |
| Silergy Corp. | 4.4% |
| Persistent Systems Ltd. | 4.2% |
| AU Small Finance Bank Ltd. | 4.1% |
| Baltic Classifieds Group PLC | 3.9% |
| ASPEED Technology, Inc. | 3.7% |
| Elgi Equipments Ltd. | 3.2% |
| Industry | Value |
| IT Consulting & Other Services | 11.3% |
| Semiconductors | 11.0% |
| Consumer Finance | 7.6% |
| Electrical Components & Equipment | 7.1% |
| Apparel Retail | 6.8% |
| Interactive Media & Services | 5.2% |
| Industrial Machinery & Supplies & Components | 4.4% |
| Regional Banks | 4.1% |
| Health Care Services | 3.7% |
| Drug Retail | 3.7% |
Portfolio Compositions (%)
| Asset Type | Value |
| Common Stocks | 101.5% |
| Other Assets and Liabilities, Net | (1.5%) |
| Total | 100.0% |
In order to reduce expenses, we will deliver a single copy of prospectuses, proxies, financial reports and other communication to shareholders with the same residential address. If you would like to receive individual mailings, please call [800-551-1700] and we will begin sending you separate copies of these materials within 30 days after receiving your request.
ALPS Distributors, Inc. serves as the Fund’s distributor.
If you wish to view additional information about the Fund; including but not limited to financial statements or holdings, please visit www.wasatchglobal.com.
Phone: 800-551-1700
Email: shareholderservice@wasatchfunds.com
Wasatch Emerging Markets Small Cap Fund
Annual Shareholder Report
September 30, 2024
Wasatch Emerging Markets Small Cap Fund
Annual Shareholder Report
September 30, 2024
This Annual shareholder report contains important information about Wasatch Emerging Markets Small Cap Fund for the period of October 1, 2023 to September 30, 2024. You can find additional information about the Fund at www.wasatchglobal.com. You can also request this information by contacting us at 800-551-1700.
What were the Fund costs for last year?
Annual Fund Operating Expenses
(based on a hypothetical $10,000 investment)
| Class Name | Costs of a $10,000 investment | Costs paid as a percentage of a $10,000 investment |
|---|
| Investor Class | $217 | 1.96% |
How did the fund perform last year and what affected its performance?
During the 12 months ended September 30, 2024, enthusiasm about the strength of India’s economy played a role in driving emerging-market indexes higher. A growing consensus that central banks were nearing or reaching the end of their tightening cycles also created a favorable backdrop for financial markets.
While the Fund had a significant gain during the period, it modestly underperformed the benchmark MSCI Emerging Markets Small Cap Index. The Fund’s return came in part from a number of Indian companies that demonstrated strong fundamentals, which were well received by the market. Stock selection in India was a bright spot for relative performance as well. Overweight positioning in Mexico was the Fund’s biggest source of underperformance. In the latter half of the period, stocks in Mexico sold off broadly as investors reacted to the Morena Party’s resounding victory in national elections. Investors were concerned the winning party could use its mandate to brush aside some checks on presidential power. Among sectors, stock selection in the financials sector weighed on relative results, while stock selection in the consumer-discretionary sector contributed.
Total return based on a $10,000 investment.
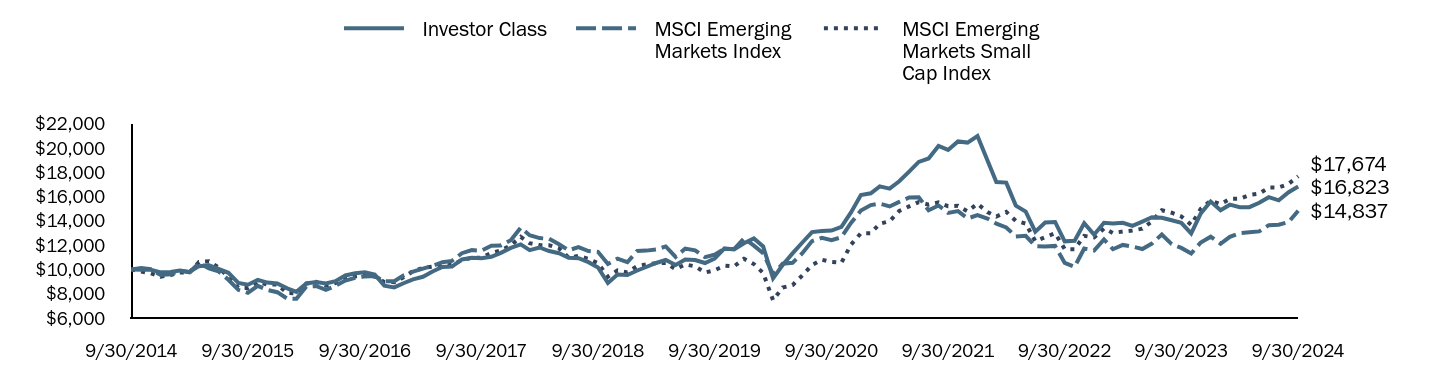
| Investor Class | MSCI Emerging Markets Index | MSCI Emerging Markets Small Cap Index |
|---|
| 9/30/2014 | $10,000 | $10,000 | $10,000 |
| 10/31/2014 | $9,964 | $10,118 | $9,824 |
| 11/30/2014 | $9,964 | $10,011 | $9,673 |
| 12/31/2014 | $9,758 | $9,550 | $9,398 |
| 1/31/2015 | $9,794 | $9,607 | $9,533 |
| 2/28/2015 | $9,904 | $9,904 | $9,748 |
| 3/31/2015 | $9,794 | $9,763 | $9,735 |
| 4/30/2015 | $10,270 | $10,514 | $10,617 |
| 5/31/2015 | $10,343 | $10,093 | $10,661 |
| 6/30/2015 | $10,050 | $9,831 | $10,173 |
| 7/31/2015 | $9,721 | $9,150 | $9,383 |
| 8/31/2015 | $8,881 | $8,322 | $8,477 |
| 9/30/2015 | $8,735 | $8,072 | $8,477 |
| 10/31/2015 | $9,137 | $8,647 | $8,978 |
| 11/30/2015 | $8,917 | $8,310 | $8,747 |
| 12/31/2015 | $8,846 | $8,125 | $8,754 |
| 1/31/2016 | $8,444 | $7,598 | $8,065 |
| 2/29/2016 | $8,151 | $7,585 | $8,036 |
| 3/31/2016 | $8,846 | $8,589 | $8,839 |
| 4/30/2016 | $8,955 | $8,636 | $8,971 |
| 5/31/2016 | $8,846 | $8,314 | $8,655 |
| 6/30/2016 | $9,028 | $8,646 | $8,875 |
| 7/31/2016 | $9,504 | $9,081 | $9,254 |
| 8/31/2016 | $9,686 | $9,307 | $9,425 |
| 9/30/2016 | $9,759 | $9,426 | $9,549 |
| 10/31/2016 | $9,577 | $9,449 | $9,407 |
| 11/30/2016 | $8,663 | $9,014 | $8,969 |
| 12/31/2016 | $8,517 | $9,034 | $8,954 |
| 1/31/2017 | $8,882 | $9,528 | $9,373 |
| 2/28/2017 | $9,175 | $9,820 | $9,861 |
| 3/31/2017 | $9,394 | $10,068 | $10,120 |
| 4/30/2017 | $9,832 | $10,288 | $10,234 |
| 5/31/2017 | $10,198 | $10,592 | $10,305 |
| 6/30/2017 | $10,235 | $10,699 | $10,386 |
| 7/31/2017 | $10,819 | $11,337 | $10,757 |
| 8/31/2017 | $10,966 | $11,590 | $10,966 |
| 9/30/2017 | $10,929 | $11,544 | $10,971 |
| 10/31/2017 | $11,039 | $11,948 | $11,356 |
| 11/30/2017 | $11,368 | $11,972 | $11,556 |
| 12/31/2017 | $11,770 | $12,402 | $11,984 |
| 1/31/2018 | $12,062 | $13,436 | $12,678 |
| 2/28/2018 | $11,587 | $12,816 | $12,158 |
| 3/31/2018 | $11,806 | $12,578 | $12,004 |
| 4/30/2018 | $11,514 | $12,522 | $11,990 |
| 5/31/2018 | $11,331 | $12,078 | $11,741 |
| 6/30/2018 | $10,966 | $11,576 | $10,971 |
| 7/31/2018 | $10,929 | $11,831 | $11,105 |
| 8/31/2018 | $10,600 | $11,511 | $10,871 |
| 9/30/2018 | $10,161 | $11,450 | $10,510 |
| 10/31/2018 | $8,882 | $10,453 | $9,401 |
| 11/30/2018 | $9,577 | $10,883 | $9,915 |
| 12/31/2018 | $9,539 | $10,595 | $9,756 |
| 1/31/2019 | $9,911 | $11,523 | $10,281 |
| 2/28/2019 | $10,200 | $11,549 | $10,414 |
| 3/31/2019 | $10,530 | $11,646 | $10,513 |
| 4/30/2019 | $10,778 | $11,891 | $10,535 |
| 5/31/2019 | $10,365 | $11,028 | $10,017 |
| 6/30/2019 | $10,819 | $11,716 | $10,410 |
| 7/31/2019 | $10,778 | $11,573 | $10,255 |
| 8/31/2019 | $10,530 | $11,009 | $9,741 |
| 9/30/2019 | $10,902 | $11,219 | $9,933 |
| 10/31/2019 | $11,728 | $11,692 | $10,312 |
| 11/30/2019 | $11,645 | $11,676 | $10,252 |
| 12/31/2019 | $12,155 | $12,547 | $10,878 |
| 1/31/2020 | $12,549 | $11,962 | $10,444 |
| 2/29/2020 | $11,893 | $11,331 | $9,707 |
| 3/31/2020 | $9,269 | $9,586 | $7,466 |
| 4/30/2020 | $10,362 | $10,464 | $8,506 |
| 5/31/2020 | $11,324 | $10,544 | $8,708 |
| 6/30/2020 | $12,199 | $11,319 | $9,492 |
| 7/31/2020 | $13,073 | $12,331 | $10,369 |
| 8/31/2020 | $13,161 | $12,603 | $10,794 |
| 9/30/2020 | $13,204 | $12,401 | $10,617 |
| 10/31/2020 | $13,510 | $12,657 | $10,559 |
| 11/30/2020 | $14,691 | $13,827 | $12,046 |
| 12/31/2020 | $16,132 | $14,844 | $12,976 |
| 1/31/2021 | $16,273 | $15,299 | $12,987 |
| 2/28/2021 | $16,835 | $15,416 | $13,760 |
| 3/31/2021 | $16,648 | $15,183 | $13,971 |
| 4/30/2021 | $17,257 | $15,561 | $14,814 |
| 5/31/2021 | $18,055 | $15,922 | $15,188 |
| 6/30/2021 | $18,852 | $15,949 | $15,543 |
| 7/31/2021 | $19,133 | $14,876 | $15,339 |
| 8/31/2021 | $20,165 | $15,265 | $15,516 |
| 9/30/2021 | $19,837 | $14,659 | $15,208 |
| 10/31/2021 | $20,540 | $14,803 | $15,235 |
| 11/30/2021 | $20,446 | $14,200 | $14,788 |
| 12/31/2021 | $20,987 | $14,467 | $15,409 |
| 1/31/2022 | $18,993 | $14,193 | $14,728 |
| 2/28/2022 | $17,199 | $13,769 | $14,360 |
| 3/31/2022 | $17,149 | $13,458 | $14,742 |
| 4/30/2022 | $15,255 | $12,709 | $14,002 |
| 5/31/2022 | $14,756 | $12,765 | $13,773 |
| 6/30/2022 | $13,111 | $11,917 | $12,322 |
| 7/31/2022 | $13,859 | $11,887 | $12,663 |
| 8/31/2022 | $13,909 | $11,937 | $12,976 |
| 9/30/2022 | $12,313 | $10,538 | $11,675 |
| 10/31/2022 | $12,363 | $10,210 | $11,667 |
| 11/30/2022 | $13,809 | $11,725 | $12,764 |
| 12/31/2022 | $12,862 | $11,560 | $12,632 |
| 1/31/2023 | $13,839 | $12,473 | $13,381 |
| 2/28/2023 | $13,788 | $11,664 | $12,999 |
| 3/31/2023 | $13,839 | $12,017 | $13,121 |
| 4/30/2023 | $13,582 | $11,881 | $13,208 |
| 5/31/2023 | $13,942 | $11,682 | $13,355 |
| 6/30/2023 | $14,302 | $12,125 | $13,959 |
| 7/31/2023 | $14,251 | $12,880 | $14,870 |
| 8/31/2023 | $14,045 | $12,087 | $14,669 |
| 9/30/2023 | $13,839 | $11,770 | $14,368 |
| 10/31/2023 | $12,965 | $11,313 | $13,673 |
| 11/30/2023 | $14,611 | $12,219 | $14,991 |
| 12/31/2023 | $15,589 | $12,696 | $15,654 |
| 1/31/2024 | $14,868 | $12,107 | $15,383 |
| 2/29/2024 | $15,331 | $12,683 | $15,806 |
| 3/31/2024 | $15,125 | $12,997 | $15,818 |
| 4/30/2024 | $15,125 | $13,055 | $16,131 |
| 5/31/2024 | $15,486 | $13,129 | $16,237 |
| 6/30/2024 | $15,949 | $13,647 | $16,756 |
| 7/31/2024 | $15,691 | $13,687 | $16,748 |
| 8/31/2024 | $16,360 | $13,908 | $17,046 |
| 9/30/2024 | $16,823 | $14,837 | $17,674 |
Fund performance shown in this graph represents past performance, which is not necessarily indicative of how the Fund will perform in the future.
Average Total Returns (%)
| Fund | Wasatch Emerging Markets Small Cap Fund |
|---|
| Total Net Assets | $354,713,613 |
| # of Portfolio Holdings | 50 |
| Portfolio Turnover Rate | 27% |
| Total Advisory Fees Paid | $5,551,544 |
| Fund | 1 Year | 5 Years | 10 Years |
|---|
| Investor Class | 21.56% | 9.06% | 5.34% |
| MSCI Emerging Markets Index | 26.05% | 5.75% | 4.02% |
| MSCI Emerging Markets Small Cap Index | 23.01% | 12.22% | 5.86% |
The performance graph and total returns table do not reflect the deduction of taxes a shareholder would pay on Fund distributions or the redemption of Fund shares.
What did the Fund invest in?
The Fund invested in a variety of equity and debt securities. Opportunities continue to fluctuate with the volatility of the market and as banks continue to encounter risks.
| Top 10 | Value |
| Voltronic Power Technology Corp. | 7.1% |
| Trent Ltd. | 6.8% |
| Globant SA | 5.4% |
| Cholamandalam Financial Holdings Ltd. | 5.3% |
| Silergy Corp. | 4.4% |
| Persistent Systems Ltd. | 4.2% |
| AU Small Finance Bank Ltd. | 4.1% |
| Baltic Classifieds Group PLC | 3.9% |
| ASPEED Technology, Inc. | 3.7% |
| Elgi Equipments Ltd. | 3.2% |
| Industry | Value |
| IT Consulting & Other Services | 11.3% |
| Semiconductors | 11.0% |
| Consumer Finance | 7.6% |
| Electrical Components & Equipment | 7.1% |
| Apparel Retail | 6.8% |
| Interactive Media & Services | 5.2% |
| Industrial Machinery & Supplies & Components | 4.4% |
| Regional Banks | 4.1% |
| Health Care Services | 3.7% |
| Drug Retail | 3.7% |
Portfolio Compositions (%)
| Asset Type | Value |
| Common Stocks | 101.5% |
| Other Assets and Liabilities, Net | (1.5%) |
| Total | 100.0% |
In order to reduce expenses, we will deliver a single copy of prospectuses, proxies, financial reports and other communication to shareholders with the same residential address. If you would like to receive individual mailings, please call [800-551-1700] and we will begin sending you separate copies of these materials within 30 days after receiving your request.
ALPS Distributors, Inc. serves as the Fund’s distributor.
If you wish to view additional information about the Fund; including but not limited to financial statements or holdings, please visit www.wasatchglobal.com.
Phone: 800-551-1700
Email: shareholderservice@wasatchfunds.com
Wasatch Emerging Markets Small Cap Fund
Annual Shareholder Report
September 30, 2024
Wasatch Frontier Emerging Small Countries Fund
Institutional Class WIFMX
Annual Shareholder Report
September 30, 2024
This Annual shareholder report contains important information about Wasatch Frontier Emerging Small Countries Fund for the period of October 1, 2023 to September 30, 2024. You can find additional information about the Fund at www.wasatchglobal.com. You can also request this information by contacting us at 800-551-1700.
What were the Fund costs for last year?
Annual Fund Operating Expenses
(based on a hypothetical $10,000 investment)
| Class Name | Costs of a $10,000 investment | Costs paid as a percentage of a $10,000 investment |
|---|
| Institutional Class | $227 | 1.96% |
How did the fund perform last year and what affected its performance?
During the 12 months ended September 30, 2024, a growing consensus that central banks were nearing or reaching the end of their monetary tightening cycles created a favorable backdrop for financial markets. In that environment, investors stepped out on the risk spectrum and embraced stocks in frontier and emerging markets, driving these markets higher.
The Fund outperformed the benchmark MSCI Frontier Emerging Markets Index. Many of our companies produced strong fundamentals during the year, and their stock prices were up significantly as investors began to appreciate the strong earnings growth these companies produced. Stock selection in Vietnam was a large driver of outperformance relative to the benchmark. While we were generally pleased with the Fund’s performance relative to the benchmark, our underweight to Peru detracted from relative results. Peru was one of the top-performing components within the benchmark during the period. We have a small weight in Peru because we’ve found what we believe are better growth opportunities elsewhere.
Total return based on a $10,000 investment.
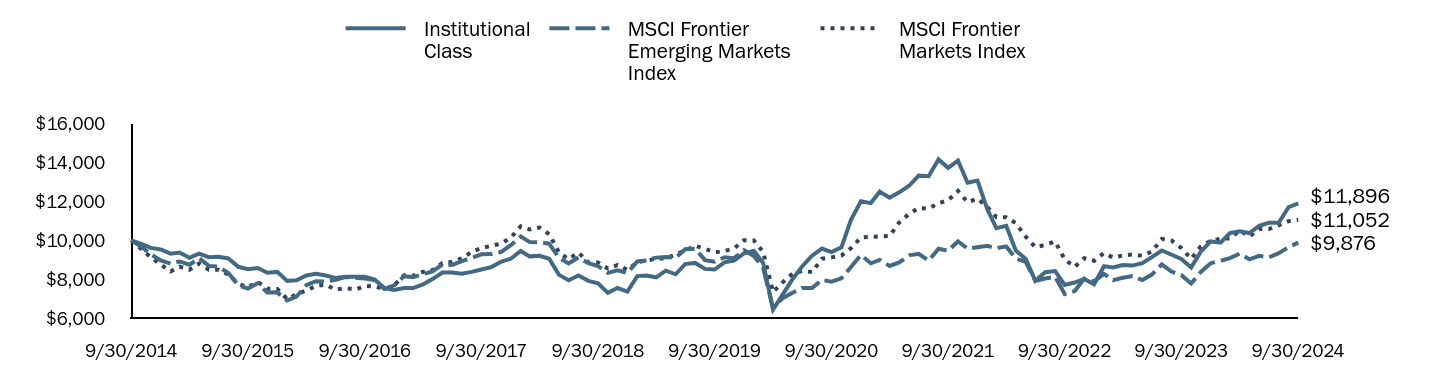
| Institutional Class | MSCI Frontier Emerging Markets Index | MSCI Frontier Markets Index |
|---|
| 9/30/2014 | $10,000 | $10,000 | $10,000 |
| 10/31/2014 | $9,819 | $9,672 | $9,558 |
| 11/30/2014 | $9,608 | $9,288 | $9,121 |
| 12/31/2014 | $9,526 | $8,958 | $8,754 |
| 1/31/2015 | $9,311 | $8,796 | $8,397 |
| 2/28/2015 | $9,372 | $8,910 | $8,643 |
| 3/31/2015 | $9,096 | $8,742 | $8,482 |
| 4/30/2015 | $9,311 | $9,074 | $8,800 |
| 5/31/2015 | $9,127 | $8,682 | $8,486 |
| 6/30/2015 | $9,157 | $8,638 | $8,478 |
| 7/31/2015 | $9,065 | $8,311 | $8,229 |
| 8/31/2015 | $8,635 | $7,677 | $7,757 |
| 9/30/2015 | $8,512 | $7,518 | $7,581 |
| 10/31/2015 | $8,573 | $7,793 | $7,859 |
| 11/30/2015 | $8,328 | $7,308 | $7,511 |
| 12/31/2015 | $8,373 | $7,319 | $7,488 |
| 1/31/2016 | $7,911 | $6,900 | $6,976 |
| 2/29/2016 | $7,942 | $7,101 | $7,220 |
| 3/31/2016 | $8,188 | $7,687 | $7,418 |
| 4/30/2016 | $8,281 | $7,895 | $7,644 |
| 5/31/2016 | $8,188 | $7,880 | $7,721 |
| 6/30/2016 | $8,065 | $7,967 | $7,453 |
| 7/31/2016 | $8,127 | $8,111 | $7,545 |
| 8/31/2016 | $8,127 | $8,069 | $7,459 |
| 9/30/2016 | $8,127 | $8,029 | $7,650 |
| 10/31/2016 | $7,973 | $7,960 | $7,620 |
| 11/30/2016 | $7,542 | $7,490 | $7,484 |
| 12/31/2016 | $7,449 | $7,685 | $7,688 |
| 1/31/2017 | $7,542 | $8,152 | $8,200 |
| 2/28/2017 | $7,542 | $8,103 | $8,170 |
| 3/31/2017 | $7,726 | $8,254 | $8,371 |
| 4/30/2017 | $8,004 | $8,394 | $8,469 |
| 5/31/2017 | $8,342 | $8,745 | $8,831 |
| 6/30/2017 | $8,342 | $8,732 | $8,885 |
| 7/31/2017 | $8,281 | $8,931 | $9,072 |
| 8/31/2017 | $8,373 | $9,102 | $9,406 |
| 9/30/2017 | $8,496 | $9,276 | $9,599 |
| 10/31/2017 | $8,619 | $9,288 | $9,716 |
| 11/30/2017 | $8,896 | $9,394 | $9,829 |
| 12/31/2017 | $9,050 | $9,744 | $10,137 |
| 1/31/2018 | $9,450 | $10,199 | $10,718 |
| 2/28/2018 | $9,173 | $9,907 | $10,558 |
| 3/31/2018 | $9,204 | $9,899 | $10,654 |
| 4/30/2018 | $9,050 | $9,824 | $10,318 |
| 5/31/2018 | $8,219 | $9,099 | $9,367 |
| 6/30/2018 | $7,942 | $8,807 | $9,035 |
| 7/31/2018 | $8,188 | $9,116 | $9,367 |
| 8/31/2018 | $7,911 | $8,821 | $8,862 |
| 9/30/2018 | $7,788 | $8,667 | $8,857 |
| 10/31/2018 | $7,296 | $8,319 | $8,544 |
| 11/30/2018 | $7,542 | $8,450 | $8,729 |
| 12/31/2018 | $7,357 | $8,321 | $8,473 |
| 1/31/2019 | $8,157 | $8,910 | $8,876 |
| 2/28/2019 | $8,188 | $8,958 | $8,947 |
| 3/31/2019 | $8,096 | $9,107 | $9,056 |
| 4/30/2019 | $8,435 | $9,144 | $9,071 |
| 5/31/2019 | $8,250 | $9,096 | $9,267 |
| 6/30/2019 | $8,773 | $9,537 | $9,480 |
| 7/31/2019 | $8,835 | $9,571 | $9,718 |
| 8/31/2019 | $8,527 | $8,979 | $9,563 |
| 9/30/2019 | $8,496 | $8,894 | $9,376 |
| 10/31/2019 | $8,865 | $9,126 | $9,453 |
| 11/30/2019 | $8,958 | $9,079 | $9,582 |
| 12/31/2019 | $9,327 | $9,494 | $9,998 |
| 1/31/2020 | $9,450 | $9,190 | $9,992 |
| 2/29/2020 | $8,835 | $8,580 | $9,404 |
| 3/31/2020 | $6,434 | $6,498 | $7,339 |
| 4/30/2020 | $7,203 | $7,019 | $7,834 |
| 5/31/2020 | $8,004 | $7,297 | $8,282 |
| 6/30/2020 | $8,650 | $7,542 | $8,421 |
| 7/31/2020 | $9,204 | $7,540 | $8,363 |
| 8/31/2020 | $9,573 | $7,960 | $9,052 |
| 9/30/2020 | $9,389 | $7,870 | $9,119 |
| 10/31/2020 | $9,635 | $8,041 | $9,215 |
| 11/30/2020 | $11,051 | $8,629 | $9,592 |
| 12/31/2020 | $12,005 | $9,241 | $10,140 |
| 1/31/2021 | $11,913 | $8,817 | $10,179 |
| 2/28/2021 | $12,498 | $8,989 | $10,192 |
| 3/31/2021 | $12,190 | $8,679 | $10,222 |
| 4/30/2021 | $12,467 | $8,863 | $10,922 |
| 5/31/2021 | $12,806 | $9,225 | $11,360 |
| 6/30/2021 | $13,329 | $9,303 | $11,663 |
| 7/31/2021 | $13,298 | $8,947 | $11,626 |
| 8/31/2021 | $14,160 | $9,564 | $11,915 |
| 9/30/2021 | $13,729 | $9,454 | $12,056 |
| 10/31/2021 | $14,099 | $9,949 | $12,540 |
| 11/30/2021 | $12,960 | $9,571 | $11,962 |
| 12/31/2021 | $13,076 | $9,638 | $12,141 |
| 1/31/2022 | $11,585 | $9,711 | $11,713 |
| 2/28/2022 | $10,622 | $9,587 | $11,198 |
| 3/31/2022 | $10,747 | $9,685 | $11,182 |
| 4/30/2022 | $9,473 | $9,059 | $10,879 |
| 5/31/2022 | $9,038 | $8,886 | $10,186 |
| 6/30/2022 | $7,920 | $7,912 | $9,642 |
| 7/31/2022 | $8,355 | $8,032 | $9,762 |
| 8/31/2022 | $8,417 | $8,127 | $9,938 |
| 9/30/2022 | $7,703 | $7,224 | $9,018 |
| 10/31/2022 | $7,827 | $7,381 | $8,629 |
| 11/30/2022 | $8,013 | $8,035 | $9,077 |
| 12/31/2022 | $7,734 | $7,886 | $8,943 |
| 1/31/2023 | $8,666 | $8,272 | $9,346 |
| 2/28/2023 | $8,604 | $7,952 | $9,114 |
| 3/31/2023 | $8,728 | $8,074 | $9,220 |
| 4/30/2023 | $8,697 | $8,159 | $9,267 |
| 5/31/2023 | $8,821 | $7,956 | $9,207 |
| 6/30/2023 | $9,132 | $8,236 | $9,416 |
| 7/31/2023 | $9,473 | $8,762 | $10,072 |
| 8/31/2023 | $9,256 | $8,381 | $9,981 |
| 9/30/2023 | $9,038 | $8,207 | $9,602 |
| 10/31/2023 | $8,604 | $7,778 | $9,045 |
| 11/30/2023 | $9,411 | $8,368 | $9,688 |
| 12/31/2023 | $9,939 | $8,819 | $9,983 |
| 1/31/2024 | $9,877 | $8,943 | $10,083 |
| 2/29/2024 | $10,374 | $9,079 | $10,089 |
| 3/31/2024 | $10,467 | $9,311 | $10,507 |
| 4/30/2024 | $10,374 | $9,022 | $10,194 |
| 5/31/2024 | $10,747 | $9,197 | $10,577 |
| 6/30/2024 | $10,902 | $9,116 | $10,576 |
| 7/31/2024 | $10,902 | $9,337 | $10,772 |
| 8/31/2024 | $11,710 | $9,651 | $10,987 |
| 9/30/2024 | $11,896 | $9,876 | $11,052 |
Fund performance shown in this graph represents past performance, which is not necessarily indicative of how the Fund will perform in the future.
Average Total Returns (%)
| Fund | Wasatch Frontier Emerging Small Countries Fund |
|---|
| Total Net Assets | $39,598,873 |
| # of Portfolio Holdings | 38 |
| Portfolio Turnover Rate | 28% |
| Total Advisory Fees Paid | $514,673 |
| Fund | 1 Year | 5 Years | 10 Years |
|---|
| Institutional Class | 31.62% | 6.96% | 1.75% |
| MSCI Frontier Emerging Markets Index | 20.34% | 2.12% | (0.13%) |
| MSCI Frontier Markets Index | 15.09% | 3.34% | 1.01% |
The performance graph and total returns table do not reflect the deduction of taxes a shareholder would pay on Fund distributions or the redemption of Fund shares.
What did the Fund invest in?
The Fund invested in a variety of equity and debt securities. Opportunities continue to fluctuate with the volatility of the market and as banks continue to encounter risks.
| Top 10 | Value |
| FPT Corp. | 10.1% |
| MercadoLibre, Inc. | 8.7% |
| Bajaj Finance Ltd. | 8.6% |
| NU Holdings Ltd. A | 6.3% |
| Cholamandalam Investment & Finance Co. Ltd. | 5.0% |
| DCVFMVN Diamond ETF | 4.7% |
| Bank for Foreign Trade of Vietnam JSC | 4.6% |
| Globant SA | 4.5% |
| Philippine Seven Corp. | 4.4% |
| Baltic Classifieds Group PLC | 4.0% |
| Industry | Value |
| Consumer Finance | 16.9% |
| Diversified Banks | 16.6% |
| IT Consulting & Other Services | 15.9% |
| Broadline Retail | 8.7% |
| Asset Management & Custody Banks | 5.4% |
| Food Retail | 4.7% |
| Interactive Media & Services | 4.0% |
| Life & Health Insurance | 3.6% |
| Health Care Facilities | 3.5% |
| Interactive Home Entertainment | 2.8% |
Portfolio Compositions (%)
| Asset Type | Value |
| Common Stocks | 101.3% |
| Other Assets and Liabilities, Net | (1.3%) |
| Total | 100.0% |
In order to reduce expenses, we will deliver a single copy of prospectuses, proxies, financial reports and other communication to shareholders with the same residential address. If you would like to receive individual mailings, please call [800-551-1700] and we will begin sending you separate copies of these materials within 30 days after receiving your request.
ALPS Distributors, Inc. serves as the Fund’s distributor.
If you wish to view additional information about the Fund; including but not limited to financial statements or holdings, please visit www.wasatchglobal.com.
Phone: 800-551-1700
Email: shareholderservice@wasatchfunds.com
Wasatch Frontier Emerging Small Countries Fund
Annual Shareholder Report
September 30, 2024
Wasatch Frontier Emerging Small Countries Fund
Annual Shareholder Report
September 30, 2024
This Annual shareholder report contains important information about Wasatch Frontier Emerging Small Countries Fund for the period of October 1, 2023 to September 30, 2024. You can find additional information about the Fund at www.wasatchglobal.com. You can also request this information by contacting us at 800-551-1700.
What were the Fund costs for last year?
Annual Fund Operating Expenses
(based on a hypothetical $10,000 investment)
| Class Name | Costs of a $10,000 investment | Costs paid as a percentage of a $10,000 investment |
|---|
| Investor Class | $250 | 2.16% |
How did the fund perform last year and what affected its performance?
During the 12 months ended September 30, 2024, a growing consensus that central banks were nearing or reaching the end of their monetary tightening cycles created a favorable backdrop for financial markets. In that environment, investors stepped out on the risk spectrum and embraced stocks in frontier and emerging markets, driving these markets higher.
The Fund outperformed the benchmark MSCI Frontier Emerging Markets Index. Many of our companies produced strong fundamentals during the year, and their stock prices were up significantly as investors began to appreciate the strong earnings growth these companies produced. Stock selection in Vietnam was a large driver of outperformance relative to the benchmark. While we were generally pleased with the Fund’s performance relative to the benchmark, our underweight to Peru detracted from relative results. Peru was one of the top-performing components within the benchmark during the period. We have a small weight in Peru because we’ve found what we believe are better growth opportunities elsewhere.
Total return based on a $10,000 investment.
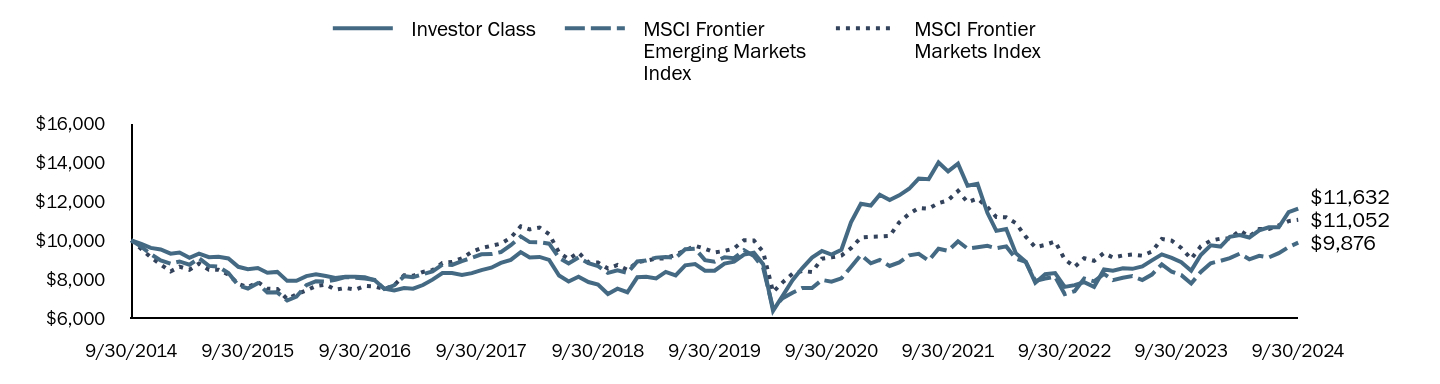
| Investor Class | MSCI Frontier Emerging Markets Index | MSCI Frontier Markets Index |
|---|
| 9/30/2014 | $10,000 | $10,000 | $10,000 |
| 10/31/2014 | $9,819 | $9,672 | $9,558 |
| 11/30/2014 | $9,608 | $9,288 | $9,121 |
| 12/31/2014 | $9,526 | $8,958 | $8,754 |
| 1/31/2015 | $9,311 | $8,796 | $8,397 |
| 2/28/2015 | $9,372 | $8,910 | $8,643 |
| 3/31/2015 | $9,096 | $8,742 | $8,482 |
| 4/30/2015 | $9,311 | $9,074 | $8,800 |
| 5/31/2015 | $9,127 | $8,682 | $8,486 |
| 6/30/2015 | $9,157 | $8,638 | $8,478 |
| 7/31/2015 | $9,065 | $8,311 | $8,229 |
| 8/31/2015 | $8,635 | $7,677 | $7,757 |
| 9/30/2015 | $8,512 | $7,518 | $7,581 |
| 10/31/2015 | $8,573 | $7,793 | $7,859 |
| 11/30/2015 | $8,328 | $7,308 | $7,511 |
| 12/31/2015 | $8,373 | $7,319 | $7,488 |
| 1/31/2016 | $7,911 | $6,900 | $6,976 |
| 2/29/2016 | $7,911 | $7,101 | $7,220 |
| 3/31/2016 | $8,157 | $7,687 | $7,418 |
| 4/30/2016 | $8,250 | $7,895 | $7,644 |
| 5/31/2016 | $8,157 | $7,880 | $7,721 |
| 6/30/2016 | $8,065 | $7,967 | $7,453 |
| 7/31/2016 | $8,127 | $8,111 | $7,545 |
| 8/31/2016 | $8,127 | $8,069 | $7,459 |
| 9/30/2016 | $8,096 | $8,029 | $7,650 |
| 10/31/2016 | $7,942 | $7,960 | $7,620 |
| 11/30/2016 | $7,511 | $7,490 | $7,484 |
| 12/31/2016 | $7,419 | $7,685 | $7,688 |
| 1/31/2017 | $7,542 | $8,152 | $8,200 |
| 2/28/2017 | $7,511 | $8,103 | $8,170 |
| 3/31/2017 | $7,696 | $8,254 | $8,371 |
| 4/30/2017 | $7,973 | $8,394 | $8,469 |
| 5/31/2017 | $8,311 | $8,745 | $8,831 |
| 6/30/2017 | $8,311 | $8,732 | $8,885 |
| 7/31/2017 | $8,219 | $8,931 | $9,072 |
| 8/31/2017 | $8,311 | $9,102 | $9,406 |
| 9/30/2017 | $8,465 | $9,276 | $9,599 |
| 10/31/2017 | $8,588 | $9,288 | $9,716 |
| 11/30/2017 | $8,835 | $9,394 | $9,829 |
| 12/31/2017 | $8,989 | $9,744 | $10,137 |
| 1/31/2018 | $9,389 | $10,199 | $10,718 |
| 2/28/2018 | $9,112 | $9,907 | $10,558 |
| 3/31/2018 | $9,143 | $9,899 | $10,654 |
| 4/30/2018 | $8,989 | $9,824 | $10,318 |
| 5/31/2018 | $8,188 | $9,099 | $9,367 |
| 6/30/2018 | $7,880 | $8,807 | $9,035 |
| 7/31/2018 | $8,127 | $9,116 | $9,367 |
| 8/31/2018 | $7,850 | $8,821 | $8,862 |
| 9/30/2018 | $7,726 | $8,667 | $8,857 |
| 10/31/2018 | $7,234 | $8,319 | $8,544 |
| 11/30/2018 | $7,511 | $8,450 | $8,729 |
| 12/31/2018 | $7,326 | $8,321 | $8,473 |
| 1/31/2019 | $8,096 | $8,910 | $8,876 |
| 2/28/2019 | $8,127 | $8,958 | $8,947 |
| 3/31/2019 | $8,034 | $9,107 | $9,056 |
| 4/30/2019 | $8,373 | $9,144 | $9,071 |
| 5/31/2019 | $8,188 | $9,096 | $9,267 |
| 6/30/2019 | $8,712 | $9,537 | $9,480 |
| 7/31/2019 | $8,773 | $9,571 | $9,718 |
| 8/31/2019 | $8,435 | $8,979 | $9,563 |
| 9/30/2019 | $8,435 | $8,894 | $9,376 |
| 10/31/2019 | $8,804 | $9,126 | $9,453 |
| 11/30/2019 | $8,896 | $9,079 | $9,582 |
| 12/31/2019 | $9,266 | $9,494 | $9,998 |
| 1/31/2020 | $9,358 | $9,190 | $9,992 |
| 2/29/2020 | $8,773 | $8,580 | $9,404 |
| 3/31/2020 | $6,372 | $6,498 | $7,339 |
| 4/30/2020 | $7,142 | $7,019 | $7,834 |
| 5/31/2020 | $7,942 | $7,297 | $8,282 |
| 6/30/2020 | $8,558 | $7,542 | $8,421 |
| 7/31/2020 | $9,112 | $7,540 | $8,363 |
| 8/31/2020 | $9,450 | $7,960 | $9,052 |
| 9/30/2020 | $9,266 | $7,870 | $9,119 |
| 10/31/2020 | $9,512 | $8,041 | $9,215 |
| 11/30/2020 | $10,928 | $8,629 | $9,592 |
| 12/31/2020 | $11,882 | $9,241 | $10,140 |
| 1/31/2021 | $11,790 | $8,817 | $10,179 |
| 2/28/2021 | $12,344 | $8,989 | $10,192 |
| 3/31/2021 | $12,067 | $8,679 | $10,222 |
| 4/30/2021 | $12,313 | $8,863 | $10,922 |
| 5/31/2021 | $12,652 | $9,225 | $11,360 |
| 6/30/2021 | $13,175 | $9,303 | $11,663 |
| 7/31/2021 | $13,144 | $8,947 | $11,626 |
| 8/31/2021 | $14,006 | $9,564 | $11,915 |
| 9/30/2021 | $13,544 | $9,454 | $12,056 |
| 10/31/2021 | $13,945 | $9,949 | $12,540 |
| 11/30/2021 | $12,806 | $9,571 | $11,962 |
| 12/31/2021 | $12,904 | $9,638 | $12,141 |
| 1/31/2022 | $11,415 | $9,711 | $11,713 |
| 2/28/2022 | $10,484 | $9,587 | $11,198 |
| 3/31/2022 | $10,577 | $9,685 | $11,182 |
| 4/30/2022 | $9,337 | $9,059 | $10,879 |
| 5/31/2022 | $8,902 | $8,886 | $10,186 |
| 6/30/2022 | $7,817 | $7,912 | $9,642 |
| 7/31/2022 | $8,251 | $8,032 | $9,762 |
| 8/31/2022 | $8,313 | $8,127 | $9,938 |
| 9/30/2022 | $7,600 | $7,224 | $9,018 |
| 10/31/2022 | $7,693 | $7,381 | $8,629 |
| 11/30/2022 | $7,848 | $8,035 | $9,077 |
| 12/31/2022 | $7,600 | $7,886 | $8,943 |
| 1/31/2023 | $8,499 | $8,272 | $9,346 |
| 2/28/2023 | $8,437 | $7,952 | $9,114 |
| 3/31/2023 | $8,561 | $8,074 | $9,220 |
| 4/30/2023 | $8,530 | $8,159 | $9,267 |
| 5/31/2023 | $8,654 | $7,956 | $9,207 |
| 6/30/2023 | $8,965 | $8,236 | $9,416 |
| 7/31/2023 | $9,275 | $8,762 | $10,072 |
| 8/31/2023 | $9,089 | $8,381 | $9,981 |
| 9/30/2023 | $8,871 | $8,207 | $9,602 |
| 10/31/2023 | $8,437 | $7,778 | $9,045 |
| 11/30/2023 | $9,244 | $8,368 | $9,688 |
| 12/31/2023 | $9,740 | $8,819 | $9,983 |
| 1/31/2024 | $9,678 | $8,943 | $10,083 |
| 2/29/2024 | $10,174 | $9,079 | $10,089 |
| 3/31/2024 | $10,267 | $9,311 | $10,507 |
| 4/30/2024 | $10,143 | $9,022 | $10,194 |
| 5/31/2024 | $10,515 | $9,197 | $10,577 |
| 6/30/2024 | $10,671 | $9,116 | $10,576 |
| 7/31/2024 | $10,671 | $9,337 | $10,772 |
| 8/31/2024 | $11,446 | $9,651 | $10,987 |
| 9/30/2024 | $11,632 | $9,876 | $11,052 |
Fund performance shown in this graph represents past performance, which is not necessarily indicative of how the Fund will perform in the future.
Average Total Returns (%)
| Fund | Wasatch Frontier Emerging Small Countries Fund |
|---|
| Total Net Assets | $39,598,873 |
| # of Portfolio Holdings | 38 |
| Portfolio Turnover Rate | 28% |
| Total Advisory Fees Paid | $514,673 |
| Fund | 1 Year | 5 Years | 10 Years |
|---|
| Investor Class | 31.12% | 6.64% | 1.52% |
| MSCI Frontier Emerging Markets Index | 20.34% | 2.12% | (0.13%) |
| MSCI Frontier Markets Index | 15.09% | 3.34% | 1.01% |
The performance graph and total returns table do not reflect the deduction of taxes a shareholder would pay on Fund distributions or the redemption of Fund shares.
What did the Fund invest in?
The Fund invested in a variety of equity and debt securities. Opportunities continue to fluctuate with the volatility of the market and as banks continue to encounter risks.
| Top 10 | Value |
| FPT Corp. | 10.1% |
| MercadoLibre, Inc. | 8.7% |
| Bajaj Finance Ltd. | 8.6% |
| NU Holdings Ltd. A | 6.3% |
| Cholamandalam Investment & Finance Co. Ltd. | 5.0% |
| DCVFMVN Diamond ETF | 4.7% |
| Bank for Foreign Trade of Vietnam JSC | 4.6% |
| Globant SA | 4.5% |
| Philippine Seven Corp. | 4.4% |
| Baltic Classifieds Group PLC | 4.0% |
| Industry | Value |
| Consumer Finance | 16.9% |
| Diversified Banks | 16.6% |
| IT Consulting & Other Services | 15.9% |
| Broadline Retail | 8.7% |
| Asset Management & Custody Banks | 5.4% |
| Food Retail | 4.7% |
| Interactive Media & Services | 4.0% |
| Life & Health Insurance | 3.6% |
| Health Care Facilities | 3.5% |
| Interactive Home Entertainment | 2.8% |
Portfolio Compositions (%)
| Asset Type | Value |
| Common Stocks | 101.3% |
| Other Assets and Liabilities, Net | (1.3%) |
| Total | 100.0% |
In order to reduce expenses, we will deliver a single copy of prospectuses, proxies, financial reports and other communication to shareholders with the same residential address. If you would like to receive individual mailings, please call [800-551-1700] and we will begin sending you separate copies of these materials within 30 days after receiving your request.
ALPS Distributors, Inc. serves as the Fund’s distributor.
If you wish to view additional information about the Fund; including but not limited to financial statements or holdings, please visit www.wasatchglobal.com.
Phone: 800-551-1700
Email: shareholderservice@wasatchfunds.com
Wasatch Frontier Emerging Small Countries Fund
Annual Shareholder Report
September 30, 2024
Wasatch Global Opportunities Fund
Institutional Class WIGOX
Annual Shareholder Report
September 30, 2024
This Annual shareholder report contains important information about Wasatch Global Opportunities Fund for the period of October 1, 2023 to September 30, 2024. You can find additional information about the Fund at www.wasatchglobal.com. You can also request this information by contacting us at 800-551-1700.
What were the Fund costs for last year?
Annual Fund Operating Expenses
(based on a hypothetical $10,000 investment)
| Class Name | Costs of a $10,000 investment | Costs paid as a percentage of a $10,000 investment |
|---|
| Institutional Class | $154 | 1.35% |
How did the fund perform last year and what affected its performance?
During the 12 months ended September 30, 2024, the period was marked by some uncertainty about geopolitical tensions, elections in several key countries and mixed economic data. But the period overall was buoyed by an increasingly optimistic view that the U.S. Federal Reserve (Fed) and other central banks were at or near the end of their monetary tightening cycles. In September, the Fed followed through on investor expectations, lowering its benchmark interest rate for the first time since 2020. Late in the period, China’s government announced a series of stimulus measures to revive its struggling economy, and those measures were well received by the market.
In this environment, the Fund outperformed the benchmark MSCI AC (All Country) World Small Cap Index. Among the Fund’s high-quality, high-conviction companies, its holdings in the U.S.—its largest portfolio weight—contributed the most to performance relative to the benchmark, followed by Israel and Taiwan. On the other end of the spectrum, the Fund’s holdings in the United Kingdom and India were notably weaker than those of the benchmark and detracted from performance.
Total return based on a $10,000 investment.

| Institutional Class | MSCI AC World Index | MSCI AC World Small Cap Index |
|---|
| 9/30/2014 | $10,000 | $10,000 | $10,000 |
| 10/31/2014 | $10,280 | $10,070 | $10,133 |
| 11/30/2014 | $10,304 | $10,239 | $10,157 |
| 12/31/2014 | $10,160 | $10,041 | $10,178 |
| 1/31/2015 | $10,160 | $9,884 | $10,028 |
| 2/28/2015 | $10,708 | $10,435 | $10,605 |
| 3/31/2015 | $10,571 | $10,273 | $10,622 |
| 4/30/2015 | $10,352 | $10,571 | $10,808 |
| 5/31/2015 | $10,379 | $10,557 | $10,952 |
| 6/30/2015 | $10,735 | $10,309 | $10,807 |
| 7/31/2015 | $10,762 | $10,398 | $10,673 |
| 8/31/2015 | $9,968 | $9,685 | $10,059 |
| 9/30/2015 | $9,612 | $9,334 | $9,672 |
| 10/31/2015 | $10,160 | $10,067 | $10,228 |
| 11/30/2015 | $10,461 | $9,984 | $10,305 |
| 12/31/2015 | $10,497 | $9,804 | $10,072 |
| 1/31/2016 | $9,503 | $9,213 | $9,288 |
| 2/29/2016 | $9,223 | $9,149 | $9,342 |
| 3/31/2016 | $9,938 | $9,827 | $10,143 |
| 4/30/2016 | $9,969 | $9,972 | $10,372 |
| 5/31/2016 | $10,217 | $9,985 | $10,445 |
| 6/30/2016 | $10,093 | $9,924 | $10,296 |
| 7/31/2016 | $10,714 | $10,352 | $10,850 |
| 8/31/2016 | $10,683 | $10,387 | $10,885 |
| 9/30/2016 | $10,931 | $10,451 | $11,046 |
| 10/31/2016 | $10,497 | $10,273 | $10,666 |
| 11/30/2016 | $10,217 | $10,351 | $11,006 |
| 12/31/2016 | $10,028 | $10,575 | $11,240 |
| 1/31/2017 | $10,674 | $10,864 | $11,525 |
| 2/28/2017 | $10,878 | $11,169 | $11,807 |
| 3/31/2017 | $11,218 | $11,305 | $11,918 |
| 4/30/2017 | $11,660 | $11,482 | $12,146 |
| 5/31/2017 | $12,000 | $11,735 | $12,224 |
| 6/30/2017 | $12,204 | $11,789 | $12,404 |
| 7/31/2017 | $12,476 | $12,118 | $12,703 |
| 8/31/2017 | $12,340 | $12,164 | $12,723 |
| 9/30/2017 | $12,782 | $12,399 | $13,169 |
| 10/31/2017 | $12,986 | $12,657 | $13,390 |
| 11/30/2017 | $13,631 | $12,902 | $13,676 |
| 12/31/2017 | $13,849 | $13,110 | $13,916 |
| 1/31/2018 | $14,603 | $13,850 | $14,444 |
| 2/28/2018 | $14,453 | $13,268 | $13,864 |
| 3/31/2018 | $14,679 | $12,984 | $13,850 |
| 4/30/2018 | $14,377 | $13,108 | $13,961 |
| 5/31/2018 | $14,792 | $13,124 | $14,257 |
| 6/30/2018 | $14,905 | $13,053 | $14,119 |
| 7/31/2018 | $15,207 | $13,447 | $14,290 |
| 8/31/2018 | $15,849 | $13,552 | $14,545 |
| 9/30/2018 | $15,471 | $13,611 | $14,311 |
| 10/31/2018 | $13,660 | $12,591 | $12,885 |
| 11/30/2018 | $14,339 | $12,776 | $13,023 |
| 12/31/2018 | $12,899 | $11,876 | $11,913 |
| 1/31/2019 | $14,068 | $12,813 | $13,079 |
| 2/28/2019 | $14,967 | $13,156 | $13,538 |
| 3/31/2019 | $15,056 | $13,322 | $13,474 |
| 4/30/2019 | $15,955 | $13,771 | $13,856 |
| 5/31/2019 | $15,461 | $12,954 | $12,972 |
| 6/30/2019 | $16,225 | $13,803 | $13,701 |
| 7/31/2019 | $16,180 | $13,843 | $13,751 |
| 8/31/2019 | $15,686 | $13,515 | $13,260 |
| 9/30/2019 | $15,641 | $13,799 | $13,531 |
| 10/31/2019 | $16,000 | $14,177 | $13,919 |
| 11/30/2019 | $16,764 | $14,523 | $14,316 |
| 12/31/2019 | $17,199 | $15,034 | $14,850 |
| 1/31/2020 | $17,297 | $14,868 | $14,419 |
| 2/29/2020 | $16,075 | $13,667 | $13,125 |
| 3/31/2020 | $12,802 | $11,822 | $10,366 |
| 4/30/2020 | $14,854 | $13,089 | $11,764 |
| 5/31/2020 | $16,760 | $13,658 | $12,539 |
| 6/30/2020 | $17,346 | $14,094 | $12,942 |
| 7/31/2020 | $18,274 | $14,840 | $13,521 |
| 8/31/2020 | $19,251 | $15,748 | $14,268 |
| 9/30/2020 | $19,251 | $15,240 | $13,967 |
| 10/31/2020 | $19,984 | $14,870 | $13,956 |
| 11/30/2020 | $22,672 | $16,703 | $16,083 |
| 12/31/2020 | $24,518 | $17,478 | $17,274 |
| 1/31/2021 | $24,518 | $17,399 | $17,592 |
| 2/28/2021 | $25,665 | $17,802 | $18,490 |
| 3/31/2021 | $25,116 | $18,277 | $18,868 |
| 4/30/2021 | $26,462 | $19,076 | $19,646 |
| 5/31/2021 | $26,562 | $19,373 | $19,850 |
| 6/30/2021 | $27,608 | $19,628 | $19,940 |
| 7/31/2021 | $28,106 | $19,764 | $19,790 |
| 8/31/2021 | $29,452 | $20,258 | $20,241 |
| 9/30/2021 | $29,302 | $19,421 | $19,638 |
| 10/31/2021 | $30,548 | $20,413 | $20,268 |
| 11/30/2021 | $29,552 | $19,921 | $19,328 |
| 12/31/2021 | $29,768 | $20,718 | $20,055 |
| 1/31/2022 | $25,554 | $19,701 | $18,613 |
| 2/28/2022 | $24,960 | $19,192 | $18,592 |
| 3/31/2022 | $24,960 | $19,607 | $18,802 |
| 4/30/2022 | $22,150 | $18,038 | $17,398 |
| 5/31/2022 | $21,178 | $18,059 | $17,331 |
| 6/30/2022 | $19,233 | $16,537 | $15,589 |
| 7/31/2022 | $21,070 | $17,692 | $16,887 |
| 8/31/2022 | $20,584 | $17,040 | $16,451 |
| 9/30/2022 | $18,477 | $15,409 | $14,767 |
| 10/31/2022 | $19,233 | $16,339 | $15,805 |
| 11/30/2022 | $20,692 | $17,606 | $16,838 |
| 12/31/2022 | $19,378 | $16,913 | $16,311 |
| 1/31/2023 | $21,586 | $18,126 | $17,753 |
| 2/28/2023 | $21,034 | $17,606 | $17,374 |
| 3/31/2023 | $20,648 | $18,149 | $17,003 |
| 4/30/2023 | $20,537 | $18,410 | $17,002 |
| 5/31/2023 | $20,537 | $18,213 | $16,615 |
| 6/30/2023 | $22,193 | $19,270 | $17,619 |
| 7/31/2023 | $22,580 | $19,976 | $18,522 |
| 8/31/2023 | $21,973 | $19,417 | $17,878 |
| 9/30/2023 | $20,868 | $18,615 | $17,019 |
| 10/31/2023 | $19,157 | $18,055 | $16,006 |
| 11/30/2023 | $21,917 | $19,721 | $17,504 |
| 12/31/2023 | $24,402 | $20,669 | $19,057 |
| 1/31/2024 | $23,077 | $20,790 | $18,557 |
| 2/29/2024 | $24,347 | $21,682 | $19,161 |
| 3/31/2024 | $24,236 | $22,363 | $19,802 |
| 4/30/2024 | $22,525 | $21,625 | $18,976 |
| 5/31/2024 | $23,463 | $22,503 | $19,730 |
| 6/30/2024 | $24,181 | $23,004 | $19,493 |
| 7/31/2024 | $25,009 | $23,375 | $20,626 |
| 8/31/2024 | $25,782 | $23,969 | $20,765 |
| 9/30/2024 | $26,665 | $24,526 | $21,208 |
Fund performance shown in this graph represents past performance, which is not necessarily indicative of how the Fund will perform in the future.
Average Total Returns (%)
| Fund | Wasatch Global Opportunities Fund |
|---|
| Total Net Assets | $208,387,646 |
| # of Portfolio Holdings | 64 |
| Portfolio Turnover Rate | 32% |
| Total Advisory Fees Paid | $2,410,022 |
| Fund | 1 Year | 5 Years | 10 Years |
|---|
| Institutional Class | 27.78% | 11.26% | 10.30% |
| MSCI AC World Index | 31.76% | 12.18% | 9.39% |
| MSCI AC World Small Cap Index | 24.62% | 9.40% | 7.81% |
The performance graph and total returns table do not reflect the deduction of taxes a shareholder would pay on Fund distributions or the redemption of Fund shares.
What did the Fund invest in?
The Fund invested in a variety of equity and debt securities. Opportunities continue to fluctuate with the volatility of the market and as banks continue to encounter risks.
| Top 10 | Value |
| Voltronic Power Technology Corp. | 3.7% |
| HealthEquity, Inc. | 3.6% |
| BayCurrent, Inc. | 3.2% |
| AU Small Finance Bank Ltd. | 3.1% |
| Shift4 Payments, Inc. A | 3.0% |
| Guidewire Software, Inc. | 2.9% |
| Globant SA | 2.8% |
| MonotaRO Co. Ltd. | 2.7% |
| RBC Bearings, Inc. | 2.7% |
| Ensign Group, Inc. | 2.6% |
| Industry | Value |
| Application Software | 9.4% |
| Semiconductors | 6.9% |
| Industrial Machinery & Supplies & Components | 5.8% |
| IT Consulting & Other Services | 5.7% |
| Trading Companies & Distributors | 4.6% |
| Health Care Facilities | 4.5% |
| Regional Banks | 4.5% |
| Transaction & Payment Processing Services | 4.4% |
| Electrical Components & Equipment | 3.7% |
| Managed Health Care | 3.6% |
Portfolio Compositions (%)
| Asset Type | Value |
| Common Stocks | 98.5% |
| Other Assets and Liabilities, Net | 1.5% |
| Total | 100.0% |
In order to reduce expenses, we will deliver a single copy of prospectuses, proxies, financial reports and other communication to shareholders with the same residential address. If you would like to receive individual mailings, please call [800-551-1700] and we will begin sending you separate copies of these materials within 30 days after receiving your request.
ALPS Distributors, Inc. serves as the Fund’s distributor.
If you wish to view additional information about the Fund; including but not limited to financial statements or holdings, please visit www.wasatchglobal.com.
Phone: 800-551-1700
Email: shareholderservice@wasatchfunds.com
Wasatch Global Opportunities Fund
Annual Shareholder Report
September 30, 2024
Wasatch Global Opportunities Fund
Annual Shareholder Report
September 30, 2024
This Annual shareholder report contains important information about Wasatch Global Opportunities Fund for the period of October 1, 2023 to September 30, 2024. You can find additional information about the Fund at www.wasatchglobal.com. You can also request this information by contacting us at 800-551-1700.
What were the Fund costs for last year?
Annual Fund Operating Expenses
(based on a hypothetical $10,000 investment)
| Class Name | Costs of a $10,000 investment | Costs paid as a percentage of a $10,000 investment |
|---|
| Investor Class | $171 | 1.50% |
How did the fund perform last year and what affected its performance?
During the 12 months ended September 30, 2024, the period was marked by some uncertainty about geopolitical tensions, elections in several key countries and mixed economic data. But the period overall was buoyed by an increasingly optimistic view that the U.S. Federal Reserve (Fed) and other central banks were at or near the end of their monetary tightening cycles. In September, the Fed followed through on investor expectations, lowering its benchmark interest rate for the first time since 2020. Late in the period, China’s government announced a series of stimulus measures to revive its struggling economy, and those measures were well received by the market.
In this environment, the Fund outperformed the benchmark MSCI AC (All Country) World Small Cap Index. Among the Fund’s high-quality, high-conviction companies, its holdings in the U.S.—its largest portfolio weight—contributed the most to performance relative to the benchmark, followed by Israel and Taiwan. On the other end of the spectrum, the Fund’s holdings in the United Kingdom and India were notably weaker than those of the benchmark and detracted from performance.
Total return based on a $10,000 investment.
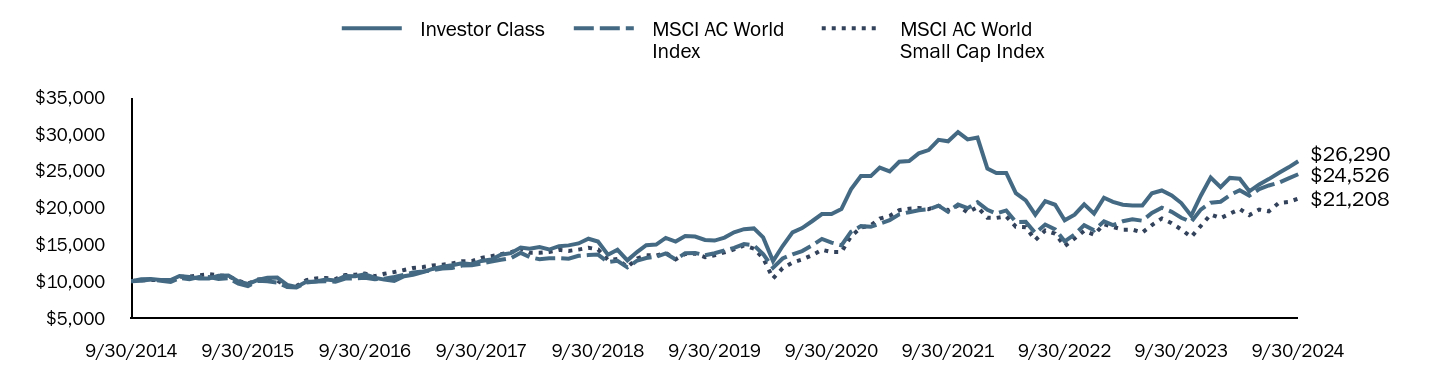
| Investor Class | MSCI AC World Index | MSCI AC World Small Cap Index |
|---|
| 9/30/2014 | $10,000 | $10,000 | $10,000 |
| 10/31/2014 | $10,280 | $10,070 | $10,133 |
| 11/30/2014 | $10,304 | $10,239 | $10,157 |
| 12/31/2014 | $10,160 | $10,041 | $10,178 |
| 1/31/2015 | $10,160 | $9,884 | $10,028 |
| 2/28/2015 | $10,708 | $10,435 | $10,605 |
| 3/31/2015 | $10,571 | $10,273 | $10,622 |
| 4/30/2015 | $10,352 | $10,571 | $10,808 |
| 5/31/2015 | $10,379 | $10,557 | $10,952 |
| 6/30/2015 | $10,735 | $10,309 | $10,807 |
| 7/31/2015 | $10,762 | $10,398 | $10,673 |
| 8/31/2015 | $9,968 | $9,685 | $10,059 |
| 9/30/2015 | $9,612 | $9,334 | $9,672 |
| 10/31/2015 | $10,160 | $10,067 | $10,228 |
| 11/30/2015 | $10,461 | $9,984 | $10,305 |
| 12/31/2015 | $10,497 | $9,804 | $10,072 |
| 1/31/2016 | $9,503 | $9,213 | $9,288 |
| 2/29/2016 | $9,223 | $9,149 | $9,342 |
| 3/31/2016 | $9,938 | $9,827 | $10,143 |
| 4/30/2016 | $9,969 | $9,972 | $10,372 |
| 5/31/2016 | $10,217 | $9,985 | $10,445 |
| 6/30/2016 | $10,093 | $9,924 | $10,296 |
| 7/31/2016 | $10,714 | $10,352 | $10,850 |
| 8/31/2016 | $10,683 | $10,387 | $10,885 |
| 9/30/2016 | $10,931 | $10,451 | $11,046 |
| 10/31/2016 | $10,466 | $10,273 | $10,666 |
| 11/30/2016 | $10,217 | $10,351 | $11,006 |
| 12/31/2016 | $10,035 | $10,575 | $11,240 |
| 1/31/2017 | $10,679 | $10,864 | $11,525 |
| 2/28/2017 | $10,882 | $11,169 | $11,807 |
| 3/31/2017 | $11,221 | $11,305 | $11,918 |
| 4/30/2017 | $11,662 | $11,482 | $12,146 |
| 5/31/2017 | $11,967 | $11,735 | $12,224 |
| 6/30/2017 | $12,171 | $11,789 | $12,404 |
| 7/31/2017 | $12,442 | $12,118 | $12,703 |
| 8/31/2017 | $12,306 | $12,164 | $12,723 |
| 9/30/2017 | $12,747 | $12,399 | $13,169 |
| 10/31/2017 | $12,950 | $12,657 | $13,390 |
| 11/30/2017 | $13,594 | $12,902 | $13,676 |
| 12/31/2017 | $13,811 | $13,110 | $13,916 |
| 1/31/2018 | $14,564 | $13,850 | $14,444 |
| 2/28/2018 | $14,413 | $13,268 | $13,864 |
| 3/31/2018 | $14,639 | $12,984 | $13,850 |
| 4/30/2018 | $14,300 | $13,108 | $13,961 |
| 5/31/2018 | $14,752 | $13,124 | $14,257 |
| 6/30/2018 | $14,865 | $13,053 | $14,119 |
| 7/31/2018 | $15,128 | $13,447 | $14,290 |
| 8/31/2018 | $15,768 | $13,552 | $14,545 |
| 9/30/2018 | $15,392 | $13,611 | $14,311 |
| 10/31/2018 | $13,585 | $12,591 | $12,885 |
| 11/30/2018 | $14,263 | $12,776 | $13,023 |
| 12/31/2018 | $12,827 | $11,876 | $11,913 |
| 1/31/2019 | $13,993 | $12,813 | $13,079 |
| 2/28/2019 | $14,890 | $13,156 | $13,538 |
| 3/31/2019 | $14,979 | $13,322 | $13,474 |
| 4/30/2019 | $15,876 | $13,771 | $13,856 |
| 5/31/2019 | $15,383 | $12,954 | $12,972 |
| 6/30/2019 | $16,145 | $13,803 | $13,701 |
| 7/31/2019 | $16,056 | $13,843 | $13,751 |
| 8/31/2019 | $15,607 | $13,515 | $13,260 |
| 9/30/2019 | $15,518 | $13,799 | $13,531 |
| 10/31/2019 | $15,921 | $14,177 | $13,919 |
| 11/30/2019 | $16,639 | $14,523 | $14,316 |
| 12/31/2019 | $17,069 | $15,034 | $14,850 |
| 1/31/2020 | $17,166 | $14,868 | $14,419 |
| 2/29/2020 | $15,947 | $13,667 | $13,125 |
| 3/31/2020 | $12,729 | $11,822 | $10,366 |
| 4/30/2020 | $14,777 | $13,089 | $11,764 |
| 5/31/2020 | $16,630 | $13,658 | $12,539 |
| 6/30/2020 | $17,215 | $14,094 | $12,942 |
| 7/31/2020 | $18,142 | $14,840 | $13,521 |
| 8/31/2020 | $19,117 | $15,748 | $14,268 |
| 9/30/2020 | $19,117 | $15,240 | $13,967 |
| 10/31/2020 | $19,800 | $14,870 | $13,956 |
| 11/30/2020 | $22,482 | $16,703 | $16,083 |
| 12/31/2020 | $24,276 | $17,478 | $17,274 |
| 1/31/2021 | $24,276 | $17,399 | $17,592 |
| 2/28/2021 | $25,420 | $17,802 | $18,490 |
| 3/31/2021 | $24,922 | $18,277 | $18,868 |
| 4/30/2021 | $26,216 | $19,076 | $19,646 |
| 5/31/2021 | $26,315 | $19,373 | $19,850 |
| 6/30/2021 | $27,360 | $19,628 | $19,940 |
| 7/31/2021 | $27,807 | $19,764 | $19,790 |
| 8/31/2021 | $29,200 | $20,258 | $20,241 |
| 9/30/2021 | $29,001 | $19,421 | $19,638 |
| 10/31/2021 | $30,245 | $20,413 | $20,268 |
| 11/30/2021 | $29,250 | $19,921 | $19,328 |
| 12/31/2021 | $29,496 | $20,718 | $20,055 |
| 1/31/2022 | $25,290 | $19,701 | $18,613 |
| 2/28/2022 | $24,697 | $19,192 | $18,592 |
| 3/31/2022 | $24,697 | $19,607 | $18,802 |
| 4/30/2022 | $21,947 | $18,038 | $17,398 |
| 5/31/2022 | $20,976 | $18,059 | $17,331 |
| 6/30/2022 | $19,035 | $16,537 | $15,589 |
| 7/31/2022 | $20,868 | $17,692 | $16,887 |
| 8/31/2022 | $20,383 | $17,040 | $16,451 |
| 9/30/2022 | $18,280 | $15,409 | $14,767 |
| 10/31/2022 | $19,035 | $16,339 | $15,805 |
| 11/30/2022 | $20,437 | $17,606 | $16,838 |
| 12/31/2022 | $19,180 | $16,913 | $16,311 |
| 1/31/2023 | $21,330 | $18,126 | $17,753 |
| 2/28/2023 | $20,779 | $17,606 | $17,374 |
| 3/31/2023 | $20,393 | $18,149 | $17,003 |
| 4/30/2023 | $20,283 | $18,410 | $17,002 |
| 5/31/2023 | $20,283 | $18,213 | $16,615 |
| 6/30/2023 | $21,936 | $19,270 | $17,619 |
| 7/31/2023 | $22,322 | $19,976 | $18,522 |
| 8/31/2023 | $21,661 | $19,417 | $17,878 |
| 9/30/2023 | $20,613 | $18,615 | $17,019 |
| 10/31/2023 | $18,905 | $18,055 | $16,006 |
| 11/30/2023 | $21,605 | $19,721 | $17,504 |
| 12/31/2023 | $24,086 | $20,669 | $19,057 |
| 1/31/2024 | $22,763 | $20,790 | $18,557 |
| 2/29/2024 | $24,031 | $21,682 | $19,161 |
| 3/31/2024 | $23,920 | $22,363 | $19,802 |
| 4/30/2024 | $22,212 | $21,625 | $18,976 |
| 5/31/2024 | $23,149 | $22,503 | $19,730 |
| 6/30/2024 | $23,865 | $23,004 | $19,493 |
| 7/31/2024 | $24,692 | $23,375 | $20,626 |
| 8/31/2024 | $25,464 | $23,969 | $20,765 |
| 9/30/2024 | $26,290 | $24,526 | $21,208 |
Fund performance shown in this graph represents past performance, which is not necessarily indicative of how the Fund will perform in the future.
Average Total Returns (%)
| Fund | Wasatch Global Opportunities Fund |
|---|
| Total Net Assets | $208,387,646 |
| # of Portfolio Holdings | 64 |
| Portfolio Turnover Rate | 32% |
| Total Advisory Fees Paid | $2,410,022 |
| Fund | 1 Year | 5 Years | 10 Years |
|---|
| Investor Class | 27.54% | 11.12% | 10.15% |
| MSCI AC World Index | 31.76% | 12.18% | 9.39% |
| MSCI AC World Small Cap Index | 24.62% | 9.40% | 7.81% |
The performance graph and total returns table do not reflect the deduction of taxes a shareholder would pay on Fund distributions or the redemption of Fund shares.
What did the Fund invest in?
The Fund invested in a variety of equity and debt securities. Opportunities continue to fluctuate with the volatility of the market and as banks continue to encounter risks.
| Top 10 | Value |
| Voltronic Power Technology Corp. | 3.7% |
| HealthEquity, Inc. | 3.6% |
| BayCurrent, Inc. | 3.2% |
| AU Small Finance Bank Ltd. | 3.1% |
| Shift4 Payments, Inc. A | 3.0% |
| Guidewire Software, Inc. | 2.9% |
| Globant SA | 2.8% |
| MonotaRO Co. Ltd. | 2.7% |
| RBC Bearings, Inc. | 2.7% |
| Ensign Group, Inc. | 2.6% |
| Industry | Value |
| Application Software | 9.4% |
| Semiconductors | 6.9% |
| Industrial Machinery & Supplies & Components | 5.8% |
| IT Consulting & Other Services | 5.7% |
| Trading Companies & Distributors | 4.6% |
| Health Care Facilities | 4.5% |
| Regional Banks | 4.5% |
| Transaction & Payment Processing Services | 4.4% |
| Electrical Components & Equipment | 3.7% |
| Managed Health Care | 3.6% |
Portfolio Compositions (%)
| Asset Type | Value |
| Common Stocks | 98.5% |
| Other Assets and Liabilities, Net | 1.5% |
| Total | 100.0% |
In order to reduce expenses, we will deliver a single copy of prospectuses, proxies, financial reports and other communication to shareholders with the same residential address. If you would like to receive individual mailings, please call [800-551-1700] and we will begin sending you separate copies of these materials within 30 days after receiving your request.
ALPS Distributors, Inc. serves as the Fund’s distributor.
If you wish to view additional information about the Fund; including but not limited to financial statements or holdings, please visit www.wasatchglobal.com.
Phone: 800-551-1700
Email: shareholderservice@wasatchfunds.com
Wasatch Global Opportunities Fund
Annual Shareholder Report
September 30, 2024
Wasatch Global Select Fund
Institutional Class WGGSX
Annual Shareholder Report
September 30, 2024
This Annual shareholder report contains important information about Wasatch Global Select Fund for the period of October 1, 2023 to September 30, 2024. You can find additional information about the Fund at www.wasatchglobal.com. You can also request this information by contacting us at 800-551-1700.
What were the Fund costs for last year?
Annual Fund Operating Expenses
(based on a hypothetical $10,000 investment)
| Class Name | Costs of a $10,000 investment | Costs paid as a percentage of a $10,000 investment |
|---|
| Institutional Class | $107 | 0.96% |
How did the fund perform last year and what affected its performance?
During the 12 months ended September 30, 2024, global equities experienced large gains. Hopes that many central banks may be at or nearing the end of their monetary tightening cycles helped drive stocks higher.
While the Fund had substantial gains during the period, it underperformed the benchmark MSCI AC (All Country) World Index. Much of the underperformance was due to stock selection in the U.S. While many of the Fund’s U.S. holdings had what we considered solid returns, the Fund’s U.S. component lagged the benchmark’s. Additionally, given the Fund’s concentrated nature, its performance relative to the benchmark can often be attributable to just a few stocks. The Fund’s largest detractors included Five Below. Inc., a U.S. retailer; JMDC, Inc., a Japan-based medical-data provider; and Bajaj Finance Ltd., an Indian financial company. While those stocks negatively impacted performance, we were pleased with the results of other holdings. Top contributors included Amphenol Corp., a U.S. manufacturer of connectors and sensors; MercadoLibre, Inc., which operates a Latin American e-commerce platform; and Monolithic Power Systems, Inc., which designs and manufactures power-management solutions, including power-conversion devices.
Total return based on a $10,000 investment.
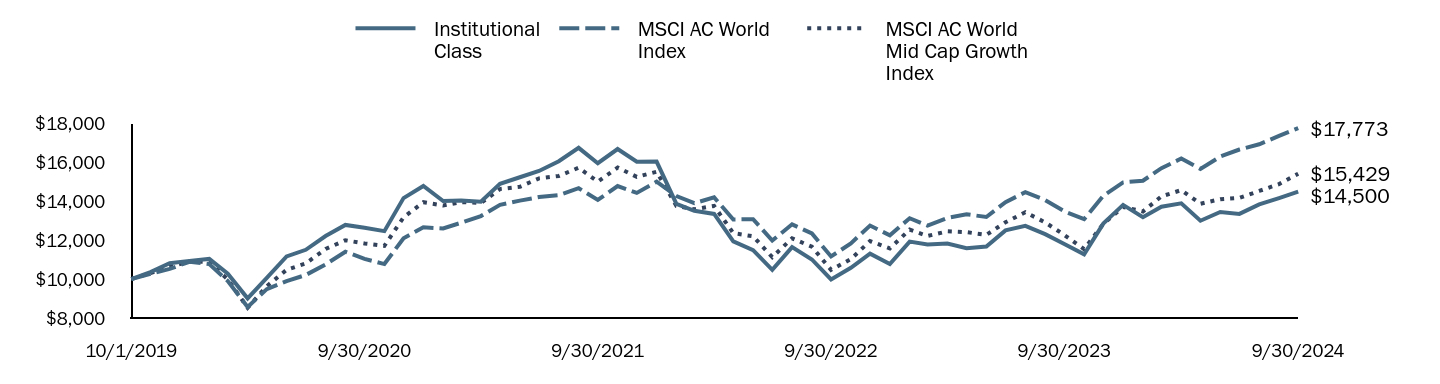
| Institutional Class | MSCI AC World Index | MSCI AC World Mid Cap Growth Index |
|---|
| 10/1/2019 | $10,000 | $10,000 | $10,000 |
| 10/31/2019 | $10,360 | $10,274 | $10,310 |
| 11/30/2019 | $10,820 | $10,524 | $10,645 |
| 12/31/2019 | $10,940 | $10,895 | $10,908 |
| 1/31/2020 | $11,040 | $10,775 | $10,891 |
| 2/29/2020 | $10,280 | $9,904 | $9,984 |
| 3/31/2020 | $9,010 | $8,567 | $8,526 |
| 4/30/2020 | $10,060 | $9,485 | $9,636 |
| 5/31/2020 | $11,170 | $9,898 | $10,480 |
| 6/30/2020 | $11,510 | $10,214 | $10,807 |
| 7/31/2020 | $12,220 | $10,754 | $11,552 |
| 8/31/2020 | $12,790 | $11,412 | $12,002 |
| 9/30/2020 | $12,640 | $11,044 | $11,837 |
| 10/31/2020 | $12,470 | $10,776 | $11,711 |
| 11/30/2020 | $14,170 | $12,104 | $13,179 |
| 12/31/2020 | $14,794 | $12,666 | $13,958 |
| 1/31/2021 | $14,022 | $12,608 | $13,790 |
| 2/28/2021 | $14,052 | $12,901 | $13,966 |
| 3/31/2021 | $13,982 | $13,245 | $13,918 |
| 4/30/2021 | $14,904 | $13,824 | $14,636 |
| 5/31/2021 | $15,244 | $14,039 | $14,754 |
| 6/30/2021 | $15,565 | $14,224 | $15,186 |
| 7/31/2021 | $16,066 | $14,322 | $15,311 |
| 8/31/2021 | $16,757 | $14,681 | $15,733 |
| 9/30/2021 | $15,966 | $14,074 | $15,014 |
| 10/31/2021 | $16,697 | $14,793 | $15,745 |
| 11/30/2021 | $16,046 | $14,437 | $15,262 |
| 12/31/2021 | $16,050 | $15,014 | $15,527 |
| 1/31/2022 | $13,877 | $14,277 | $13,765 |
| 2/28/2022 | $13,515 | $13,908 | $13,595 |
| 3/31/2022 | $13,357 | $14,209 | $13,766 |
| 4/30/2022 | $11,942 | $13,072 | $12,367 |
| 5/31/2022 | $11,489 | $13,087 | $12,206 |
| 6/30/2022 | $10,481 | $11,984 | $11,129 |
| 7/31/2022 | $11,647 | $12,821 | $12,102 |
| 8/31/2022 | $11,013 | $12,349 | $11,666 |
| 9/30/2022 | $9,983 | $11,167 | $10,478 |
| 10/31/2022 | $10,583 | $11,841 | $11,029 |
| 11/30/2022 | $11,308 | $12,759 | $11,959 |
| 12/31/2022 | $10,776 | $12,257 | $11,581 |
| 1/31/2023 | $11,930 | $13,135 | $12,547 |
| 2/28/2023 | $11,783 | $12,759 | $12,220 |
| 3/31/2023 | $11,828 | $13,152 | $12,460 |
| 4/30/2023 | $11,591 | $13,341 | $12,417 |
| 5/31/2023 | $11,681 | $13,198 | $12,277 |
| 6/30/2023 | $12,508 | $13,965 | $12,927 |
| 7/31/2023 | $12,745 | $14,476 | $13,441 |
| 8/31/2023 | $12,315 | $14,071 | $12,922 |
| 9/30/2023 | $11,806 | $13,490 | $12,274 |
| 10/31/2023 | $11,274 | $13,084 | $11,540 |
| 11/30/2023 | $12,859 | $14,292 | $12,843 |
| 12/31/2023 | $13,821 | $14,978 | $13,712 |
| 1/31/2024 | $13,187 | $15,066 | $13,483 |
| 2/29/2024 | $13,730 | $15,712 | $14,259 |
| 3/31/2024 | $13,900 | $16,206 | $14,583 |
| 4/30/2024 | $13,006 | $15,671 | $13,879 |
| 5/31/2024 | $13,458 | $16,308 | $14,114 |
| 6/30/2024 | $13,357 | $16,671 | $14,183 |
| 7/31/2024 | $13,843 | $16,940 | $14,538 |
| 8/31/2024 | $14,172 | $17,370 | $14,891 |
| 9/30/2024 | $14,500 | $17,773 | $15,429 |
Fund performance shown in this graph represents past performance, which is not necessarily indicative of how the Fund will perform in the future.
Average Total Returns (%)
| Fund | Wasatch Global Select Fund |
|---|
| Total Net Assets | $15,145,422 |
| # of Portfolio Holdings | 33 |
| Portfolio Turnover Rate | 21% |
| Total Advisory Fees Paid | $0 |
| Fund | 1 Year | Since Inception 10/1/19 |
|---|
| Institutional Class | 22.82% | 7.71% |
| MSCI AC World Index | 31.76% | 12.18% |
| MSCI AC World Mid Cap Growth Index | 25.70% | 9.06% |
The performance graph and total returns table do not reflect the deduction of taxes a shareholder would pay on Fund distributions or the redemption of Fund shares.
What did the Fund invest in?
The Fund invested in a variety of equity and debt securities. Opportunities continue to fluctuate with the volatility of the market and as banks continue to encounter risks.
| Top 10 | Value |
| MercadoLibre, Inc. | 4.6% |
| Copart, Inc. | 4.2% |
| Roper Technologies, Inc. | 4.1% |
| Bajaj Finance Ltd. | 4.0% |
| HDFC Bank Ltd. | 3.9% |
| HealthEquity, Inc. | 3.9% |
| BayCurrent, Inc. | 3.9% |
| Descartes Systems Group, Inc. | 3.9% |
| Assa Abloy AB B | 3.7% |
| RBC Bearings, Inc. | 3.7% |
| Industry | Value |
| Application Software | 17.3% |
| Building Products | 6.1% |
| Transaction & Payment Processing Services | 5.5% |
| Broadline Retail | 4.6% |
| Semiconductors | 4.3% |
| Diversified Support Services | 4.2% |
| Consumer Finance | 4.0% |
| Diversified Banks | 3.9% |
| Managed Health Care | 3.9% |
| Research & Consulting Services | 3.9% |
Portfolio Compositions (%)
| Asset Type | Value |
| Common Stocks | 98.9% |
| Other Assets and Liabilities, Net | 1.1% |
| Total | 100.0% |
In order to reduce expenses, we will deliver a single copy of prospectuses, proxies, financial reports and other communication to shareholders with the same residential address. If you would like to receive individual mailings, please call [800-551-1700] and we will begin sending you separate copies of these materials within 30 days after receiving your request.
ALPS Distributors, Inc. serves as the Fund’s distributor.
If you wish to view additional information about the Fund; including but not limited to financial statements or holdings, please visit www.wasatchglobal.com.
Phone: 800-551-1700
Email: shareholderservice@wasatchfunds.com
Wasatch Global Select Fund
Annual Shareholder Report
September 30, 2024
Wasatch Global Select Fund
Annual Shareholder Report
September 30, 2024
This Annual shareholder report contains important information about Wasatch Global Select Fund for the period of October 1, 2023 to September 30, 2024. You can find additional information about the Fund at www.wasatchglobal.com. You can also request this information by contacting us at 800-551-1700.
What were the Fund costs for last year?
Annual Fund Operating Expenses
(based on a hypothetical $10,000 investment)
| Class Name | Costs of a $10,000 investment | Costs paid as a percentage of a $10,000 investment |
|---|
| Investor Class | $151 | 1.36% |
How did the fund perform last year and what affected its performance?
During the 12 months ended September 30, 2024, global equities experienced large gains. Hopes that many central banks may be at or nearing the end of their monetary tightening cycles helped drive stocks higher.
While the Fund had substantial gains during the period, it underperformed the benchmark MSCI AC (All Country) World Index. Much of the underperformance was due to stock selection in the U.S. While many of the Fund’s U.S. holdings had what we considered solid returns, the Fund’s U.S. component lagged the benchmark’s. Additionally, given the Fund’s concentrated nature, its performance relative to the benchmark can often be attributable to just a few stocks. The Fund’s largest detractors included Five Below. Inc., a U.S. retailer; JMDC, Inc., a Japan-based medical-data provider; and Bajaj Finance Ltd., an Indian financial company. While those stocks negatively impacted performance, we were pleased with the results of other holdings. Top contributors included Amphenol Corp., a U.S. manufacturer of connectors and sensors; MercadoLibre, Inc., which operates a Latin American e-commerce platform; and Monolithic Power Systems, Inc., which designs and manufactures power-management solutions, including power-conversion devices.
Total return based on a $10,000 investment.
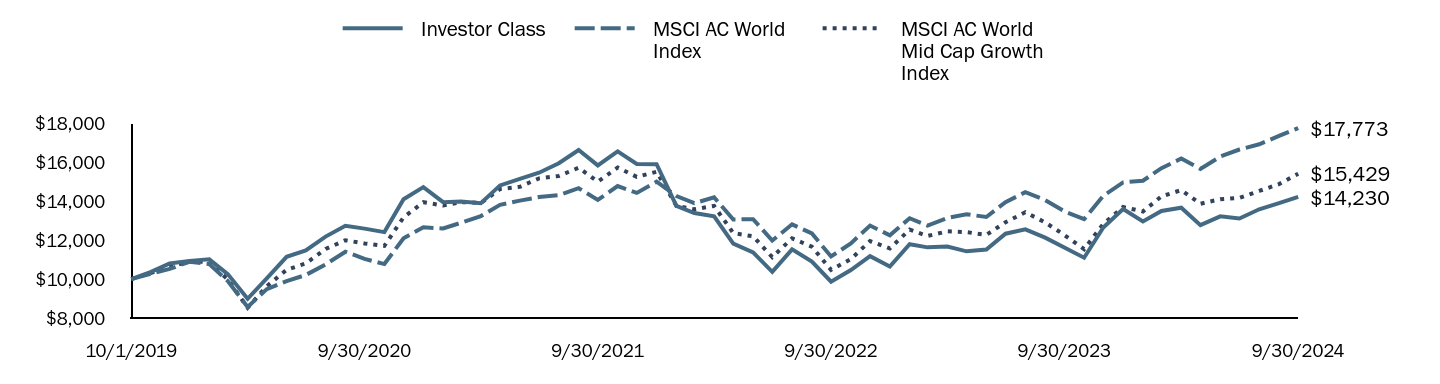
| Investor Class | MSCI AC World Index | MSCI AC World Mid Cap Growth Index |
|---|
| 10/1/2019 | $10,000 | $10,000 | $10,000 |
| 10/31/2019 | $10,360 | $10,274 | $10,310 |
| 11/30/2019 | $10,810 | $10,524 | $10,645 |
| 12/31/2019 | $10,940 | $10,895 | $10,908 |
| 1/31/2020 | $11,020 | $10,775 | $10,891 |
| 2/29/2020 | $10,260 | $9,904 | $9,984 |
| 3/31/2020 | $8,990 | $8,567 | $8,526 |
| 4/30/2020 | $10,040 | $9,485 | $9,636 |
| 5/31/2020 | $11,150 | $9,898 | $10,480 |
| 6/30/2020 | $11,480 | $10,214 | $10,807 |
| 7/31/2020 | $12,190 | $10,754 | $11,552 |
| 8/31/2020 | $12,750 | $11,412 | $12,002 |
| 9/30/2020 | $12,600 | $11,044 | $11,837 |
| 10/31/2020 | $12,420 | $10,776 | $11,711 |
| 11/30/2020 | $14,110 | $12,104 | $13,179 |
| 12/31/2020 | $14,734 | $12,666 | $13,958 |
| 1/31/2021 | $13,962 | $12,608 | $13,790 |
| 2/28/2021 | $13,992 | $12,901 | $13,966 |
| 3/31/2021 | $13,912 | $13,245 | $13,918 |
| 4/30/2021 | $14,824 | $13,824 | $14,636 |
| 5/31/2021 | $15,164 | $14,039 | $14,754 |
| 6/30/2021 | $15,475 | $14,224 | $15,186 |
| 7/31/2021 | $15,966 | $14,322 | $15,311 |
| 8/31/2021 | $16,647 | $14,681 | $15,733 |
| 9/30/2021 | $15,855 | $14,074 | $15,014 |
| 10/31/2021 | $16,577 | $14,793 | $15,745 |
| 11/30/2021 | $15,926 | $14,437 | $15,262 |
| 12/31/2021 | $15,918 | $15,014 | $15,527 |
| 1/31/2022 | $13,766 | $14,277 | $13,765 |
| 2/28/2022 | $13,403 | $13,908 | $13,595 |
| 3/31/2022 | $13,233 | $14,209 | $13,766 |
| 4/30/2022 | $11,828 | $13,072 | $12,367 |
| 5/31/2022 | $11,375 | $13,087 | $12,206 |
| 6/30/2022 | $10,378 | $11,984 | $11,129 |
| 7/31/2022 | $11,534 | $12,821 | $12,102 |
| 8/31/2022 | $10,899 | $12,349 | $11,666 |
| 9/30/2022 | $9,868 | $11,167 | $10,478 |
| 10/31/2022 | $10,469 | $11,841 | $11,029 |
| 11/30/2022 | $11,182 | $12,759 | $11,959 |
| 12/31/2022 | $10,650 | $12,257 | $11,581 |
| 1/31/2023 | $11,794 | $13,135 | $12,547 |
| 2/28/2023 | $11,636 | $12,759 | $12,220 |
| 3/31/2023 | $11,681 | $13,152 | $12,460 |
| 4/30/2023 | $11,432 | $13,341 | $12,417 |
| 5/31/2023 | $11,522 | $13,198 | $12,277 |
| 6/30/2023 | $12,338 | $13,965 | $12,927 |
| 7/31/2023 | $12,565 | $14,476 | $13,441 |
| 8/31/2023 | $12,134 | $14,071 | $12,922 |
| 9/30/2023 | $11,624 | $13,490 | $12,274 |
| 10/31/2023 | $11,103 | $13,084 | $11,540 |
| 11/30/2023 | $12,655 | $14,292 | $12,843 |
| 12/31/2023 | $13,607 | $14,978 | $13,712 |
| 1/31/2024 | $12,973 | $15,066 | $13,483 |
| 2/29/2024 | $13,505 | $15,712 | $14,259 |
| 3/31/2024 | $13,675 | $16,206 | $14,583 |
| 4/30/2024 | $12,780 | $15,671 | $13,879 |
| 5/31/2024 | $13,233 | $16,308 | $14,114 |
| 6/30/2024 | $13,120 | $16,671 | $14,183 |
| 7/31/2024 | $13,596 | $16,940 | $14,538 |
| 8/31/2024 | $13,913 | $17,370 | $14,891 |
| 9/30/2024 | $14,230 | $17,773 | $15,429 |
Fund performance shown in this graph represents past performance, which is not necessarily indicative of how the Fund will perform in the future.
Average Total Returns (%)
| Fund | Wasatch Global Select Fund |
|---|
| Total Net Assets | $15,145,422 |
| # of Portfolio Holdings | 33 |
| Portfolio Turnover Rate | 21% |
| Total Advisory Fees Paid | $0 |
| Fund | 1 Year | Since Inception 10/1/19 |
|---|
| Investor Class | 22.42% | 7.31% |
| MSCI AC World Index | 31.76% | 12.18% |
| MSCI AC World Mid Cap Growth Index | 25.70% | 9.06% |
The performance graph and total returns table do not reflect the deduction of taxes a shareholder would pay on Fund distributions or the redemption of Fund shares.
What did the Fund invest in?
The Fund invested in a variety of equity and debt securities. Opportunities continue to fluctuate with the volatility of the market and as banks continue to encounter risks.
| Top 10 | Value |
| MercadoLibre, Inc. | 4.6% |
| Copart, Inc. | 4.2% |
| Roper Technologies, Inc. | 4.1% |
| Bajaj Finance Ltd. | 4.0% |
| HDFC Bank Ltd. | 3.9% |
| HealthEquity, Inc. | 3.9% |
| BayCurrent, Inc. | 3.9% |
| Descartes Systems Group, Inc. | 3.9% |
| Assa Abloy AB B | 3.7% |
| RBC Bearings, Inc. | 3.7% |
| Industry | Value |
| Application Software | 17.3% |
| Building Products | 6.1% |
| Transaction & Payment Processing Services | 5.5% |
| Broadline Retail | 4.6% |
| Semiconductors | 4.3% |
| Diversified Support Services | 4.2% |
| Consumer Finance | 4.0% |
| Diversified Banks | 3.9% |
| Managed Health Care | 3.9% |
| Research & Consulting Services | 3.9% |
Portfolio Compositions (%)
| Asset Type | Value |
| Common Stocks | 98.9% |
| Other Assets and Liabilities, Net | 1.1% |
| Total | 100.0% |
In order to reduce expenses, we will deliver a single copy of prospectuses, proxies, financial reports and other communication to shareholders with the same residential address. If you would like to receive individual mailings, please call [800-551-1700] and we will begin sending you separate copies of these materials within 30 days after receiving your request.
ALPS Distributors, Inc. serves as the Fund’s distributor.
If you wish to view additional information about the Fund; including but not limited to financial statements or holdings, please visit www.wasatchglobal.com.
Phone: 800-551-1700
Email: shareholderservice@wasatchfunds.com
Wasatch Global Select Fund
Annual Shareholder Report
September 30, 2024
Wasatch Global Value Fund
Institutional Class WILCX
Annual Shareholder Report
September 30, 2024
This Annual shareholder report contains important information about Wasatch Global Value Fund for the period of October 1, 2023 to September 30, 2024. You can find additional information about the Fund at www.wasatchglobal.com. You can also request this information by contacting us at 800-551-1700.
What were the Fund costs for last year?
Annual Fund Operating Expenses
(based on a hypothetical $10,000 investment)
| Class Name | Costs of a $10,000 investment | Costs paid as a percentage of a $10,000 investment |
|---|
| Institutional Class | $106 | 0.95% |
How did the fund perform last year and what affected its performance?
During the 12 months ended September 30, 2024, the world economy continued to expand despite the past interest-rate hikes from leading central banks. In addition, the U.S. Federal Reserve (Fed) continued to signal that it could begin cutting rates in 2024, bolstering hopes of avoiding a recession. In September, the Fed joined other major central banks in loosening policy, enacting a half-point rate cut. Not long after, China announced plans for massive monetary stimulus to kick-start its economy, further boosting equities.
Overall, the Fund’s defensive, quality-focused positioning was a headwind in a market where investors focused on growth stocks. We remain focused on relatively inexpensive, lower-volatility stocks of larger-cap companies with high free cash flows, strong balance sheets and attractive dividend yields. During the period, the Fund’s U.S. holdings detracted most from performance relative to the benchmark MSCI AC (All Country) World Value Index, while our Taiwan names contributed the most. Health care and information technology were also relatively weak performers for the Fund, while consumer discretionary and communication services were beneficial.
Total return based on a $10,000 investment.
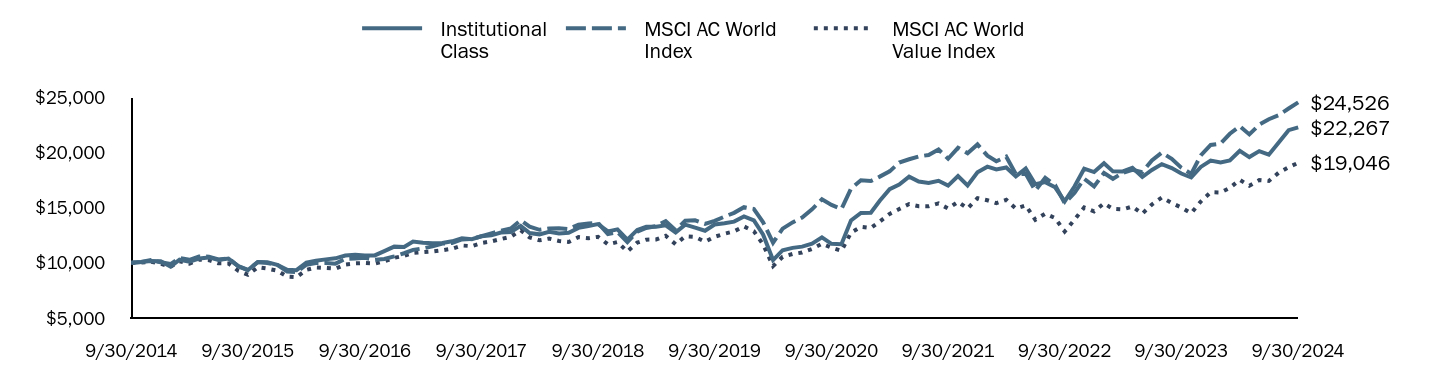
| Institutional Class | MSCI AC World Index | MSCI AC World Value Index |
|---|
| 9/30/2014 | $10,000 | $10,000 | $10,000 |
| 10/31/2014 | $10,063 | $10,070 | $10,014 |
| 11/30/2014 | $10,165 | $10,239 | $10,098 |
| 12/31/2014 | $10,136 | $10,041 | $9,904 |
| 1/31/2015 | $9,656 | $9,884 | $9,641 |
| 2/28/2015 | $10,282 | $10,435 | $10,144 |
| 3/31/2015 | $10,107 | $10,273 | $9,923 |
| 4/30/2015 | $10,380 | $10,571 | $10,297 |
| 5/31/2015 | $10,485 | $10,557 | $10,235 |
| 6/30/2015 | $10,252 | $10,309 | $9,949 |
| 7/31/2015 | $10,379 | $10,398 | $9,945 |
| 8/31/2015 | $9,694 | $9,685 | $9,270 |
| 9/30/2015 | $9,350 | $9,334 | $8,921 |
| 10/31/2015 | $10,059 | $10,067 | $9,600 |
| 11/30/2015 | $10,048 | $9,984 | $9,476 |
| 12/31/2015 | $9,821 | $9,804 | $9,284 |
| 1/31/2016 | $9,366 | $9,213 | $8,745 |
| 2/29/2016 | $9,331 | $9,149 | $8,695 |
| 3/31/2016 | $10,015 | $9,827 | $9,357 |
| 4/30/2016 | $10,191 | $9,972 | $9,578 |
| 5/31/2016 | $10,308 | $9,985 | $9,536 |
| 6/30/2016 | $10,404 | $9,924 | $9,473 |
| 7/31/2016 | $10,663 | $10,352 | $9,843 |
| 8/31/2016 | $10,734 | $10,387 | $9,945 |
| 9/30/2016 | $10,656 | $10,451 | $9,977 |
| 10/31/2016 | $10,668 | $10,273 | $9,924 |
| 11/30/2016 | $11,058 | $10,351 | $10,132 |
| 12/31/2016 | $11,462 | $10,575 | $10,451 |
| 1/31/2017 | $11,425 | $10,864 | $10,626 |
| 2/28/2017 | $11,930 | $11,169 | $10,888 |
| 3/31/2017 | $11,823 | $11,305 | $10,959 |
| 4/30/2017 | $11,761 | $11,482 | $11,023 |
| 5/31/2017 | $11,786 | $11,735 | $11,136 |
| 6/30/2017 | $11,946 | $11,789 | $11,271 |
| 7/31/2017 | $12,219 | $12,118 | $11,563 |
| 8/31/2017 | $12,132 | $12,164 | $11,508 |
| 9/30/2017 | $12,395 | $12,399 | $11,789 |
| 10/31/2017 | $12,482 | $12,657 | $11,938 |
| 11/30/2017 | $12,744 | $12,902 | $12,148 |
| 12/31/2017 | $12,781 | $13,110 | $12,360 |
| 1/31/2018 | $13,341 | $13,850 | $12,952 |
| 2/28/2018 | $12,695 | $13,268 | $12,301 |
| 3/31/2018 | $12,575 | $12,984 | $12,036 |
| 4/30/2018 | $12,807 | $13,108 | $12,190 |
| 5/31/2018 | $12,648 | $13,124 | $11,971 |
| 6/30/2018 | $12,725 | $13,053 | $11,880 |
| 7/31/2018 | $13,162 | $13,447 | $12,320 |
| 8/31/2018 | $13,337 | $13,552 | $12,229 |
| 9/30/2018 | $13,499 | $13,611 | $12,353 |
| 10/31/2018 | $12,840 | $12,591 | $11,670 |
| 11/30/2018 | $13,030 | $12,776 | $11,877 |
| 12/31/2018 | $12,093 | $11,876 | $11,027 |
| 1/31/2019 | $12,979 | $12,813 | $11,831 |
| 2/28/2019 | $13,268 | $13,156 | $12,093 |
| 3/31/2019 | $13,266 | $13,322 | $12,118 |
| 4/30/2019 | $13,386 | $13,771 | $12,444 |
| 5/31/2019 | $12,751 | $12,954 | $11,677 |
| 6/30/2019 | $13,456 | $13,803 | $12,395 |
| 7/31/2019 | $13,179 | $13,843 | $12,337 |
| 8/31/2019 | $12,902 | $13,515 | $11,909 |
| 9/30/2019 | $13,465 | $13,799 | $12,354 |
| 10/31/2019 | $13,587 | $14,177 | $12,629 |
| 11/30/2019 | $13,727 | $14,523 | $12,845 |
| 12/31/2019 | $14,203 | $15,034 | $13,296 |
| 1/31/2020 | $13,831 | $14,868 | $12,846 |
| 2/29/2020 | $12,536 | $13,667 | $11,660 |
| 3/31/2020 | $10,246 | $11,822 | $9,694 |
| 4/30/2020 | $11,137 | $13,089 | $10,540 |
| 5/31/2020 | $11,351 | $13,658 | $10,795 |
| 6/30/2020 | $11,460 | $14,094 | $10,929 |
| 7/31/2020 | $11,730 | $14,840 | $11,258 |
| 8/31/2020 | $12,305 | $15,748 | $11,725 |
| 9/30/2020 | $11,715 | $15,240 | $11,362 |
| 10/31/2020 | $11,679 | $14,870 | $11,086 |
| 11/30/2020 | $13,830 | $16,703 | $12,720 |
| 12/31/2020 | $14,513 | $17,478 | $13,252 |
| 1/31/2021 | $14,531 | $17,399 | $13,149 |
| 2/28/2021 | $15,619 | $17,802 | $13,734 |
| 3/31/2021 | $16,669 | $18,277 | $14,427 |
| 4/30/2021 | $17,088 | $19,076 | $14,866 |
| 5/31/2021 | $17,799 | $19,373 | $15,321 |
| 6/30/2021 | $17,356 | $19,628 | $15,124 |
| 7/31/2021 | $17,228 | $19,764 | $15,112 |
| 8/31/2021 | $17,429 | $20,258 | $15,379 |
| 9/30/2021 | $16,990 | $19,421 | $14,915 |
| 10/31/2021 | $17,855 | $20,413 | $15,515 |
| 11/30/2021 | $17,009 | $19,921 | $14,921 |
| 12/31/2021 | $18,188 | $20,718 | $15,852 |
| 1/31/2022 | $18,701 | $19,701 | $15,661 |
| 2/28/2022 | $18,454 | $19,192 | $15,405 |
| 3/31/2022 | $18,628 | $19,607 | $15,701 |
| 4/30/2022 | $17,824 | $18,038 | $14,908 |
| 5/31/2022 | $18,532 | $18,059 | $15,198 |
| 6/30/2022 | $17,109 | $16,537 | $13,896 |
| 7/31/2022 | $17,303 | $17,692 | $14,447 |
| 8/31/2022 | $16,839 | $17,040 | $14,050 |
| 9/30/2022 | $15,560 | $15,409 | $12,832 |
| 10/31/2022 | $16,923 | $16,339 | $13,919 |
| 11/30/2022 | $18,520 | $17,606 | $15,009 |
| 12/31/2022 | $18,215 | $16,913 | $14,655 |
| 1/31/2023 | $19,021 | $18,126 | $15,379 |
| 2/28/2023 | $18,277 | $17,606 | $14,888 |
| 3/31/2023 | $18,269 | $18,149 | $14,837 |
| 4/30/2023 | $18,604 | $18,410 | $15,096 |
| 5/31/2023 | $17,767 | $18,213 | $14,448 |
| 6/30/2023 | $18,404 | $19,270 | $15,279 |
| 7/31/2023 | $18,932 | $19,976 | $15,910 |
| 8/31/2023 | $18,573 | $19,417 | $15,415 |
| 9/30/2023 | $18,086 | $18,615 | $15,010 |
| 10/31/2023 | $17,724 | $18,055 | $14,488 |
| 11/30/2023 | $18,681 | $19,721 | $15,548 |
| 12/31/2023 | $19,260 | $20,669 | $16,386 |
| 1/31/2024 | $19,089 | $20,790 | $16,362 |
| 2/29/2024 | $19,260 | $21,682 | $16,784 |
| 3/31/2024 | $20,133 | $22,363 | $17,508 |
| 4/30/2024 | $19,571 | $21,625 | $16,983 |
| 5/31/2024 | $20,111 | $22,503 | $17,485 |
| 6/30/2024 | $19,784 | $23,004 | $17,406 |
| 7/31/2024 | $20,898 | $23,375 | $18,162 |
| 8/31/2024 | $22,012 | $23,969 | $18,654 |
| 9/30/2024 | $22,267 | $24,526 | $19,046 |
Fund performance shown in this graph represents past performance, which is not necessarily indicative of how the Fund will perform in the future.
Average Total Returns (%)
| Fund | Wasatch Global Value Fund |
|---|
| Total Net Assets | $132,031,304 |
| # of Portfolio Holdings | 36 |
| Portfolio Turnover Rate | 25% |
| Total Advisory Fees Paid | $1,119,851 |
| Fund | 1 Year | 5 Years | 10 Years |
|---|
| Institutional Class | 23.12% | 10.58% | 8.33% |
| MSCI AC World Index | 31.76% | 12.18% | 9.39% |
| MSCI AC World Value Index | 26.89% | 9.04% | 6.65% |
The performance graph and total returns table do not reflect the deduction of taxes a shareholder would pay on Fund distributions or the redemption of Fund shares.
What did the Fund invest in?
The Fund invested in a variety of equity and debt securities. Opportunities continue to fluctuate with the volatility of the market and as banks continue to encounter risks.
| Top 10 | Value |
| Duke Energy Corp. | 4.8% |
| Johnson & Johnson | 4.8% |
| Novartis AG | 4.2% |
| Exelon Corp. | 4.1% |
| KT&G Corp. | 3.8% |
| Quest Diagnostics, Inc. | 3.8% |
| TotalEnergies SE | 3.7% |
| United Overseas Bank Ltd. | 3.3% |
| Koninklijke Ahold Delhaize NV | 3.3% |
| Union Pacific Corp. | 3.3% |
| Industry | Value |
| Diversified Banks | 12.7% |
| Electric Utilities | 11.9% |
| Pharmaceuticals | 9.0% |
| Integrated Telecommunication Services | 8.3% |
| Integrated Oil & Gas | 8.0% |
| Food Retail | 5.2% |
| Tobacco | 3.8% |
| Health Care Services | 3.8% |
| Rail Transportation | 3.3% |
| Reinsurance | 2.8% |
Portfolio Compositions (%)
| Asset Type | Value |
| Common Stocks | 97.7% |
| Other Assets and Liabilities, Net | 2.3% |
| Total | 100.0% |
In order to reduce expenses, we will deliver a single copy of prospectuses, proxies, financial reports and other communication to shareholders with the same residential address. If you would like to receive individual mailings, please call [800-551-1700] and we will begin sending you separate copies of these materials within 30 days after receiving your request.
ALPS Distributors, Inc. serves as the Fund’s distributor.
If you wish to view additional information about the Fund; including but not limited to financial statements or holdings, please visit www.wasatchglobal.com.
Phone: 800-551-1700
Email: shareholderservice@wasatchfunds.com
Wasatch Global Value Fund
Annual Shareholder Report
September 30, 2024
Wasatch Global Value Fund
Annual Shareholder Report
September 30, 2024
This Annual shareholder report contains important information about Wasatch Global Value Fund for the period of October 1, 2023 to September 30, 2024. You can find additional information about the Fund at www.wasatchglobal.com. You can also request this information by contacting us at 800-551-1700.
What were the Fund costs for last year?
Annual Fund Operating Expenses
(based on a hypothetical $10,000 investment)
| Class Name | Costs of a $10,000 investment | Costs paid as a percentage of a $10,000 investment |
|---|
| Investor Class | $124 | 1.11% |
How did the fund perform last year and what affected its performance?
During the 12 months ended September 30, 2024, the world economy continued to expand despite the past interest-rate hikes from leading central banks. In addition, the U.S. Federal Reserve (Fed) continued to signal that it could begin cutting rates in 2024, bolstering hopes of avoiding a recession. In September, the Fed joined other major central banks in loosening policy, enacting a half-point rate cut. Not long after, China announced plans for massive monetary stimulus to kick-start its economy, further boosting equities.
Overall, the Fund’s defensive, quality-focused positioning was a headwind in a market where investors focused on growth stocks. We remain focused on relatively inexpensive, lower-volatility stocks of larger-cap companies with high free cash flows, strong balance sheets and attractive dividend yields. During the period, the Fund’s U.S. holdings detracted most from performance relative to the benchmark MSCI AC (All Country) World Value Index, while our Taiwan names contributed the most. Health care and information technology were also relatively weak performers for the Fund, while consumer discretionary and communication services were beneficial.
Total return based on a $10,000 investment.

| Investor Class | MSCI AC World Index | MSCI AC World Value Index |
|---|
| 9/30/2014 | $10,000 | $10,000 | $10,000 |
| 10/31/2014 | $10,063 | $10,070 | $10,014 |
| 11/30/2014 | $10,165 | $10,239 | $10,098 |
| 12/31/2014 | $10,133 | $10,041 | $9,904 |
| 1/31/2015 | $9,653 | $9,884 | $9,641 |
| 2/28/2015 | $10,279 | $10,435 | $10,144 |
| 3/31/2015 | $10,101 | $10,273 | $9,923 |
| 4/30/2015 | $10,384 | $10,571 | $10,297 |
| 5/31/2015 | $10,489 | $10,557 | $10,235 |
| 6/30/2015 | $10,243 | $10,309 | $9,949 |
| 7/31/2015 | $10,380 | $10,398 | $9,945 |
| 8/31/2015 | $9,696 | $9,685 | $9,270 |
| 9/30/2015 | $9,339 | $9,334 | $8,921 |
| 10/31/2015 | $10,057 | $10,067 | $9,600 |
| 11/30/2015 | $10,036 | $9,984 | $9,476 |
| 12/31/2015 | $9,815 | $9,804 | $9,284 |
| 1/31/2016 | $9,361 | $9,213 | $8,745 |
| 2/29/2016 | $9,326 | $9,149 | $8,695 |
| 3/31/2016 | $10,006 | $9,827 | $9,357 |
| 4/30/2016 | $10,182 | $9,972 | $9,578 |
| 5/31/2016 | $10,299 | $9,985 | $9,536 |
| 6/30/2016 | $10,403 | $9,924 | $9,473 |
| 7/31/2016 | $10,649 | $10,352 | $9,843 |
| 8/31/2016 | $10,720 | $10,387 | $9,945 |
| 9/30/2016 | $10,639 | $10,451 | $9,977 |
| 10/31/2016 | $10,662 | $10,273 | $9,924 |
| 11/30/2016 | $11,040 | $10,351 | $10,132 |
| 12/31/2016 | $11,450 | $10,575 | $10,451 |
| 1/31/2017 | $11,413 | $10,864 | $10,626 |
| 2/28/2017 | $11,904 | $11,169 | $10,888 |
| 3/31/2017 | $11,805 | $11,305 | $10,959 |
| 4/30/2017 | $11,744 | $11,482 | $11,023 |
| 5/31/2017 | $11,756 | $11,735 | $11,136 |
| 6/30/2017 | $11,911 | $11,789 | $11,271 |
| 7/31/2017 | $12,183 | $12,118 | $11,563 |
| 8/31/2017 | $12,097 | $12,164 | $11,508 |
| 9/30/2017 | $12,353 | $12,399 | $11,789 |
| 10/31/2017 | $12,440 | $12,657 | $11,938 |
| 11/30/2017 | $12,701 | $12,902 | $12,148 |
| 12/31/2017 | $12,733 | $13,110 | $12,360 |
| 1/31/2018 | $13,291 | $13,850 | $12,952 |
| 2/28/2018 | $12,648 | $13,268 | $12,301 |
| 3/31/2018 | $12,524 | $12,984 | $12,036 |
| 4/30/2018 | $12,754 | $13,108 | $12,190 |
| 5/31/2018 | $12,596 | $13,124 | $11,971 |
| 6/30/2018 | $12,668 | $13,053 | $11,880 |
| 7/31/2018 | $13,103 | $13,447 | $12,320 |
| 8/31/2018 | $13,277 | $13,552 | $12,229 |
| 9/30/2018 | $13,432 | $13,611 | $12,353 |
| 10/31/2018 | $12,778 | $12,591 | $11,670 |
| 11/30/2018 | $12,967 | $12,776 | $11,877 |
| 12/31/2018 | $12,031 | $11,876 | $11,027 |
| 1/31/2019 | $12,911 | $12,813 | $11,831 |
| 2/28/2019 | $13,198 | $13,156 | $12,093 |
| 3/31/2019 | $13,191 | $13,322 | $12,118 |
| 4/30/2019 | $13,310 | $13,771 | $12,444 |
| 5/31/2019 | $12,680 | $12,954 | $11,677 |
| 6/30/2019 | $13,374 | $13,803 | $12,395 |
| 7/31/2019 | $13,099 | $13,843 | $12,337 |
| 8/31/2019 | $12,824 | $13,515 | $11,909 |
| 9/30/2019 | $13,379 | $13,799 | $12,354 |
| 10/31/2019 | $13,500 | $14,177 | $12,629 |
| 11/30/2019 | $13,655 | $14,523 | $12,845 |
| 12/31/2019 | $14,107 | $15,034 | $13,296 |
| 1/31/2020 | $13,737 | $14,868 | $12,846 |
| 2/29/2020 | $12,436 | $13,667 | $11,660 |
| 3/31/2020 | $10,177 | $11,822 | $9,694 |
| 4/30/2020 | $11,060 | $13,089 | $10,540 |
| 5/31/2020 | $11,272 | $13,658 | $10,795 |
| 6/30/2020 | $11,377 | $14,094 | $10,929 |
| 7/31/2020 | $11,644 | $14,840 | $11,258 |
| 8/31/2020 | $12,214 | $15,748 | $11,725 |
| 9/30/2020 | $11,625 | $15,240 | $11,362 |
| 10/31/2020 | $11,589 | $14,870 | $11,086 |
| 11/30/2020 | $13,720 | $16,703 | $12,720 |
| 12/31/2020 | $14,392 | $17,478 | $13,252 |
| 1/31/2021 | $14,410 | $17,399 | $13,149 |
| 2/28/2021 | $15,488 | $17,802 | $13,734 |
| 3/31/2021 | $16,538 | $18,277 | $14,427 |
| 4/30/2021 | $16,935 | $19,076 | $14,866 |
| 5/31/2021 | $17,640 | $19,373 | $15,321 |
| 6/30/2021 | $17,212 | $19,628 | $15,124 |
| 7/31/2021 | $17,067 | $19,764 | $15,112 |
| 8/31/2021 | $17,266 | $20,258 | $15,379 |
| 9/30/2021 | $16,826 | $19,421 | $14,915 |
| 10/31/2021 | $17,700 | $20,413 | $15,515 |
| 11/30/2021 | $16,844 | $19,921 | $14,921 |
| 12/31/2021 | $18,005 | $20,718 | $15,852 |
| 1/31/2022 | $18,531 | $19,701 | $15,661 |
| 2/28/2022 | $18,268 | $19,192 | $15,405 |
| 3/31/2022 | $18,431 | $19,607 | $15,701 |
| 4/30/2022 | $17,637 | $18,038 | $14,908 |
| 5/31/2022 | $18,337 | $18,059 | $15,198 |
| 6/30/2022 | $16,943 | $16,537 | $13,896 |
| 7/31/2022 | $17,115 | $17,692 | $14,447 |
| 8/31/2022 | $16,657 | $17,040 | $14,050 |
| 9/30/2022 | $15,388 | $15,409 | $12,832 |
| 10/31/2022 | $16,734 | $16,339 | $13,919 |
| 11/30/2022 | $18,311 | $17,606 | $15,009 |
| 12/31/2022 | $18,008 | $16,913 | $14,655 |
| 1/31/2023 | $18,804 | $18,126 | $15,379 |
| 2/28/2023 | $18,069 | $17,606 | $14,888 |
| 3/31/2023 | $18,069 | $18,149 | $14,837 |
| 4/30/2023 | $18,379 | $18,410 | $15,096 |
| 5/31/2023 | $17,553 | $18,213 | $14,448 |
| 6/30/2023 | $18,196 | $19,270 | $15,279 |
| 7/31/2023 | $18,716 | $19,976 | $15,910 |
| 8/31/2023 | $18,362 | $19,417 | $15,415 |
| 9/30/2023 | $17,874 | $18,615 | $15,010 |
| 10/31/2023 | $17,518 | $18,055 | $14,488 |
| 11/30/2023 | $18,441 | $19,721 | $15,548 |
| 12/31/2023 | $19,026 | $20,669 | $16,386 |
| 1/31/2024 | $18,836 | $20,790 | $16,362 |
| 2/29/2024 | $19,005 | $21,682 | $16,784 |
| 3/31/2024 | $19,857 | $22,363 | $17,508 |
| 4/30/2024 | $19,304 | $21,625 | $16,983 |
| 5/31/2024 | $19,857 | $22,503 | $17,485 |
| 6/30/2024 | $19,528 | $23,004 | $17,406 |
| 7/31/2024 | $20,624 | $23,375 | $18,162 |
| 8/31/2024 | $21,700 | $23,969 | $18,654 |
| 9/30/2024 | $21,964 | $24,526 | $19,046 |
Fund performance shown in this graph represents past performance, which is not necessarily indicative of how the Fund will perform in the future.
Average Total Returns (%)
| Fund | Wasatch Global Value Fund |
|---|
| Total Net Assets | $132,031,304 |
| # of Portfolio Holdings | 36 |
| Portfolio Turnover Rate | 25% |
| Total Advisory Fees Paid | $1,119,851 |
| Fund | 1 Year | 5 Years | 10 Years |
|---|
| Investor Class | 22.88% | 10.42% | 8.19% |
| MSCI AC World Index | 31.76% | 12.18% | 9.39% |
| MSCI AC World Value Index | 26.89% | 9.04% | 6.65% |
The performance graph and total returns table do not reflect the deduction of taxes a shareholder would pay on Fund distributions or the redemption of Fund shares.
What did the Fund invest in?
The Fund invested in a variety of equity and debt securities. Opportunities continue to fluctuate with the volatility of the market and as banks continue to encounter risks.
| Top 10 | Value |
| Duke Energy Corp. | 4.8% |
| Johnson & Johnson | 4.8% |
| Novartis AG | 4.2% |
| Exelon Corp. | 4.1% |
| KT&G Corp. | 3.8% |
| Quest Diagnostics, Inc. | 3.8% |
| TotalEnergies SE | 3.7% |
| United Overseas Bank Ltd. | 3.3% |
| Koninklijke Ahold Delhaize NV | 3.3% |
| Union Pacific Corp. | 3.3% |
| Industry | Value |
| Diversified Banks | 12.7% |
| Electric Utilities | 11.9% |
| Pharmaceuticals | 9.0% |
| Integrated Telecommunication Services | 8.3% |
| Integrated Oil & Gas | 8.0% |
| Food Retail | 5.2% |
| Tobacco | 3.8% |
| Health Care Services | 3.8% |
| Rail Transportation | 3.3% |
| Reinsurance | 2.8% |
Portfolio Compositions (%)
| Asset Type | Value |
| Common Stocks | 97.7% |
| Other Assets and Liabilities, Net | 2.3% |
| Total | 100.0% |
In order to reduce expenses, we will deliver a single copy of prospectuses, proxies, financial reports and other communication to shareholders with the same residential address. If you would like to receive individual mailings, please call [800-551-1700] and we will begin sending you separate copies of these materials within 30 days after receiving your request.
ALPS Distributors, Inc. serves as the Fund’s distributor.
If you wish to view additional information about the Fund; including but not limited to financial statements or holdings, please visit www.wasatchglobal.com.
Phone: 800-551-1700
Email: shareholderservice@wasatchfunds.com
Wasatch Global Value Fund
Annual Shareholder Report
September 30, 2024
Wasatch Greater China Fund
Institutional Class WGGCX
Annual Shareholder Report
September 30, 2024
This Annual shareholder report contains important information about Wasatch Greater China Fund for the period of October 1, 2023 to September 30, 2024. You can find additional information about the Fund at www.wasatchglobal.com. You can also request this information by contacting us at 800-551-1700. This report describes changes to the Fund that occurred during the reporting period.
What were the Fund costs for last year?
Annual Fund Operating Expenses
(based on a hypothetical $10,000 investment)
| Class Name | Costs of a $10,000 investment | Costs paid as a percentage of a $10,000 investment |
|---|
| Institutional Class | $128 | 1.25% |
How did the fund perform last year and what affected its performance?
During the 12 months ended September 30, 2024, investor sentiment toward China remained low for much of the period due to concerns about a real-estate bubble and a softening economy. However, in September, government leaders and central-bank officials announced economic-stimulus measures designed to stabilize China’s real-estate market. Their moves ignited broad gains in Chinese equities. For much of the period, China was a value-driven market. Investors generally favored inexpensive stocks, which tend to be lower-quality companies and don’t appeal to us as quality growth investors. Additionally, large-caps also outperformed for much of the period. This too was a headwind for our strategy, which primarily focuses on small- and mid-cap companies. We seek businesses with strong balance sheets and earnings growth greater than their sector and industry. Over time, we expect the superior earnings growth of our companies to drive greater returns compared to the benchmark MSCI China Index. Our approach didn’t result in outperformance this period, as the market generally rewarded the largest, lowest-priced stocks, not those with the strongest fundamentals.
On November 13, 2024, the Board of Trustees of the Wasatch Funds Trust approved a plan of liquidation for the Wasatch Greater China Fund to close the Fund and redeem all of its outstanding shares on or about January 15, 2025.
Total return based on a $10,000 investment.
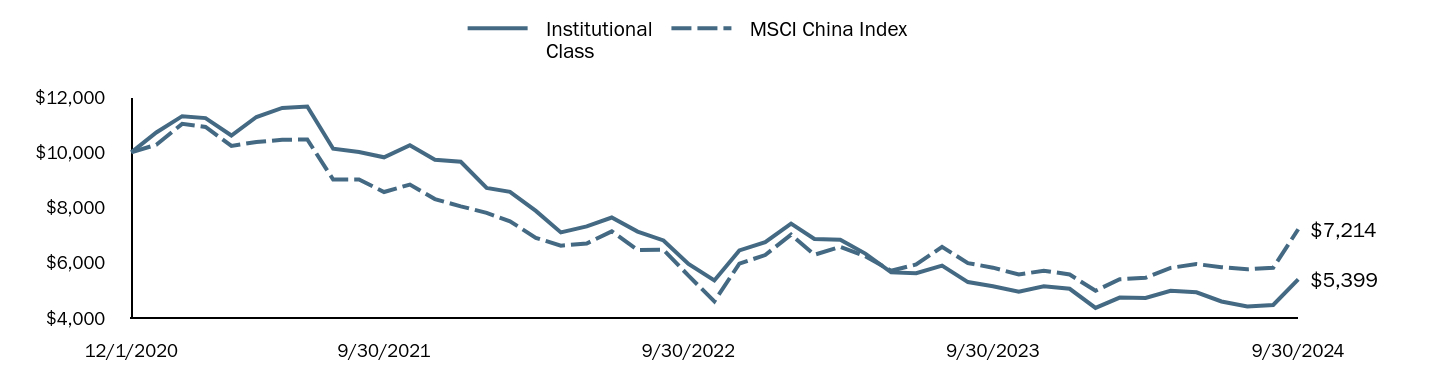
| Institutional Class | MSCI China Index |
|---|
| 12/1/2020 | $10,000 | $10,000 |
| 12/31/2020 | $10,720 | $10,277 |
| 1/31/2021 | $11,310 | $11,033 |
| 2/28/2021 | $11,240 | $10,919 |
| 3/31/2021 | $10,610 | $10,233 |
| 4/30/2021 | $11,280 | $10,375 |
| 5/31/2021 | $11,610 | $10,455 |
| 6/30/2021 | $11,660 | $10,465 |
| 7/31/2021 | $10,130 | $9,016 |
| 8/31/2021 | $10,010 | $9,017 |
| 9/30/2021 | $9,820 | $8,564 |
| 10/31/2021 | $10,260 | $8,834 |
| 11/30/2021 | $9,730 | $8,307 |
| 12/31/2021 | $9,660 | $8,045 |
| 1/31/2022 | $8,710 | $7,807 |
| 2/28/2022 | $8,570 | $7,503 |
| 3/31/2022 | $7,880 | $6,903 |
| 4/30/2022 | $7,100 | $6,621 |
| 5/31/2022 | $7,320 | $6,699 |
| 6/30/2022 | $7,640 | $7,139 |
| 7/31/2022 | $7,130 | $6,461 |
| 8/31/2022 | $6,810 | $6,475 |
| 9/30/2022 | $5,960 | $5,533 |
| 10/31/2022 | $5,360 | $4,603 |
| 11/30/2022 | $6,450 | $5,970 |
| 12/31/2022 | $6,748 | $6,280 |
| 1/31/2023 | $7,419 | $7,020 |
| 2/28/2023 | $6,865 | $6,292 |
| 3/31/2023 | $6,833 | $6,576 |
| 4/30/2023 | $6,333 | $6,237 |
| 5/31/2023 | $5,652 | $5,711 |
| 6/30/2023 | $5,620 | $5,938 |
| 7/31/2023 | $5,897 | $6,577 |
| 8/31/2023 | $5,301 | $5,988 |
| 9/30/2023 | $5,152 | $5,823 |
| 10/31/2023 | $4,949 | $5,574 |
| 11/30/2023 | $5,152 | $5,715 |
| 12/31/2023 | $5,058 | $5,577 |
| 1/31/2024 | $4,364 | $4,985 |
| 2/29/2024 | $4,738 | $5,404 |
| 3/31/2024 | $4,727 | $5,455 |
| 4/30/2024 | $4,983 | $5,815 |
| 5/31/2024 | $4,930 | $5,954 |
| 6/30/2024 | $4,599 | $5,842 |
| 7/31/2024 | $4,418 | $5,764 |
| 8/31/2024 | $4,471 | $5,822 |
| 9/30/2024 | $5,399 | $7,214 |
Fund performance shown in this graph represents past performance, which is not necessarily indicative of how the Fund will perform in the future.
Average Total Returns (%)
| Fund | Wasatch Greater China Fund |
|---|
| Total Net Assets | $4,584,403 |
| # of Portfolio Holdings | 33 |
| Portfolio Turnover Rate | 24% |
| Total Advisory Fees Paid | $0 |
| Fund | 1 Year | Since Inception 12/1/20 |
|---|
| Institutional Class | 4.81% | (14.85%) |
| MSCI China Index | 23.89% | (8.17%) |
The performance graph and total returns table do not reflect the deduction of taxes a shareholder would pay on Fund distributions or the redemption of Fund shares.
What did the Fund invest in?
The Fund invested in a variety of equity and debt securities. Opportunities continue to fluctuate with the volatility of the market and as banks continue to encounter risks.
| Top 10 | Value |
| Tencent Holdings Ltd. | 8.1% |
| Techtronic Industries Co. Ltd. | 6.9% |
| Meituan B | 6.8% |
| Silergy Corp. | 6.6% |
| Kweichow Moutai Co. Ltd. A | 5.9% |
| Yifeng Pharmacy Chain Co. Ltd. A | 3.8% |
| Shenzhou International Group Holdings Ltd. | 3.6% |
| Wuliangye Yibin Co. Ltd. A | 3.4% |
| Proya Cosmetics Co. Ltd. A | 3.4% |
| Contemporary Amperex Technology Co. Ltd. A | 3.4% |
| Industry | Value |
| Industrial Machinery & Supplies & Components | 14.7% |
| Semiconductors | 10.2% |
| Distillers & Vintners | 9.3% |
| Interactive Media & Services | 8.1% |
| Restaurants | 6.8% |
| Hotels, Resorts & Cruise Lines | 4.8% |
| Life & Health Insurance | 4.0% |
| Drug Retail | 3.8% |
| Apparel, Accessories & Luxury Goods | 3.6% |
| Personal Care Products | 3.4% |
Portfolio Compositions (%)
| Asset Type | Value |
| Common Stocks | 97.1% |
| Other Assets and Liabilities, Net | 2.9% |
| Total | 100.0% |
On November 13, 2024, the Board of Trustees of the Wasatch Funds Trust (the “Board”) approved the liquidation of the Wasatch Greater China Fund as soon as practicable. Accordingly, on November 13, 2024, the Board approved a plan of liquidation for the Wasatch Greater China Fund to close the Fund and redeem all of its outstanding shares on or about January 15, 2025 (the “Liquidation Date”).
In order to reduce expenses, we will deliver a single copy of prospectuses, proxies, financial reports and other communication to shareholders with the same residential address. If you would like to receive individual mailings, please call [800-551-1700] and we will begin sending you separate copies of these materials within 30 days after receiving your request.
ALPS Distributors, Inc. serves as the Fund’s distributor.
If you wish to view additional information about the Fund; including but not limited to financial statements or holdings, please visit www.wasatchglobal.com.
Phone: 800-551-1700
Email: shareholderservice@wasatchfunds.com
Wasatch Greater China Fund
Annual Shareholder Report
September 30, 2024
Wasatch Greater China Fund
Annual Shareholder Report
September 30, 2024
This Annual shareholder report contains important information about Wasatch Greater China Fund for the period of October 1, 2023 to September 30, 2024. You can find additional information about the Fund at www.wasatchglobal.com. You can also request this information by contacting us at 800-551-1700. This report describes changes to the Fund that occurred during the reporting period.
What were the Fund costs for last year?
Annual Fund Operating Expenses
(based on a hypothetical $10,000 investment)
| Class Name | Costs of a $10,000 investment | Costs paid as a percentage of a $10,000 investment |
|---|
| Investor Class | $153 | 1.50% |
How did the fund perform last year and what affected its performance?
During the 12 months ended September 30, 2024, investor sentiment toward China remained low for much of the period due to concerns about a real-estate bubble and a softening economy. However, in September, government leaders and central-bank officials announced economic-stimulus measures designed to stabilize China’s real-estate market. Their moves ignited broad gains in Chinese equities. For much of the period, China was a value-driven market. Investors generally favored inexpensive stocks, which tend to be lower-quality companies and don’t appeal to us as quality growth investors. Additionally, large-caps also outperformed for much of the period. This too was a headwind for our strategy, which primarily focuses on small- and mid-cap companies. We seek businesses with strong balance sheets and earnings growth greater than their sector and industry. Over time, we expect the superior earnings growth of our companies to drive greater returns compared to the benchmark MSCI China Index. Our approach didn’t result in outperformance this period, as the market generally rewarded the largest, lowest-priced stocks, not those with the strongest fundamentals.
On November 13, 2024, the Board of Trustees of the Wasatch Funds Trust approved a plan of liquidation for the Wasatch Greater China Fund to close the Fund and redeem all of its outstanding shares on or about January 15, 2025.
Total return based on a $10,000 investment.
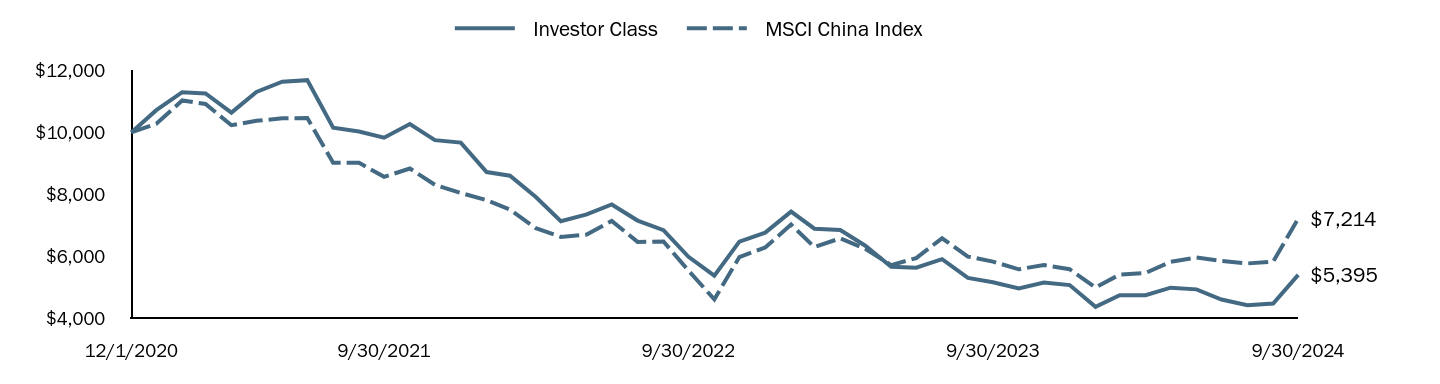
| Investor Class | MSCI China Index |
|---|
| 12/1/2020 | $10,000 | $10,000 |
| 12/31/2020 | $10,720 | $10,277 |
| 1/31/2021 | $11,300 | $11,033 |
| 2/28/2021 | $11,260 | $10,919 |
| 3/31/2021 | $10,640 | $10,233 |
| 4/30/2021 | $11,310 | $10,375 |
| 5/31/2021 | $11,640 | $10,455 |
| 6/30/2021 | $11,690 | $10,465 |
| 7/31/2021 | $10,150 | $9,016 |
| 8/31/2021 | $10,030 | $9,017 |
| 9/30/2021 | $9,830 | $8,564 |
| 10/31/2021 | $10,270 | $8,834 |
| 11/30/2021 | $9,750 | $8,307 |
| 12/31/2021 | $9,670 | $8,045 |
| 1/31/2022 | $8,720 | $7,807 |
| 2/28/2022 | $8,600 | $7,503 |
| 3/31/2022 | $7,910 | $6,903 |
| 4/30/2022 | $7,130 | $6,621 |
| 5/31/2022 | $7,350 | $6,699 |
| 6/30/2022 | $7,670 | $7,139 |
| 7/31/2022 | $7,150 | $6,461 |
| 8/31/2022 | $6,840 | $6,475 |
| 9/30/2022 | $5,980 | $5,533 |
| 10/31/2022 | $5,370 | $4,603 |
| 11/30/2022 | $6,470 | $5,970 |
| 12/31/2022 | $6,761 | $6,280 |
| 1/31/2023 | $7,440 | $7,020 |
| 2/28/2023 | $6,888 | $6,292 |
| 3/31/2023 | $6,846 | $6,576 |
| 4/30/2023 | $6,336 | $6,237 |
| 5/31/2023 | $5,657 | $5,711 |
| 6/30/2023 | $5,625 | $5,938 |
| 7/31/2023 | $5,901 | $6,577 |
| 8/31/2023 | $5,296 | $5,988 |
| 9/30/2023 | $5,158 | $5,823 |
| 10/31/2023 | $4,956 | $5,574 |
| 11/30/2023 | $5,147 | $5,715 |
| 12/31/2023 | $5,065 | $5,577 |
| 1/31/2024 | $4,362 | $4,985 |
| 2/29/2024 | $4,735 | $5,404 |
| 3/31/2024 | $4,735 | $5,455 |
| 4/30/2024 | $4,980 | $5,815 |
| 5/31/2024 | $4,926 | $5,954 |
| 6/30/2024 | $4,597 | $5,842 |
| 7/31/2024 | $4,416 | $5,764 |
| 8/31/2024 | $4,469 | $5,822 |
| 9/30/2024 | $5,395 | $7,214 |
Fund performance shown in this graph represents past performance, which is not necessarily indicative of how the Fund will perform in the future.
Average Total Returns (%)
| Fund | Wasatch Greater China Fund |
|---|
| Total Net Assets | $4,584,403 |
| # of Portfolio Holdings | 33 |
| Portfolio Turnover Rate | 24% |
| Total Advisory Fees Paid | $0 |
| Fund | 1 Year | Since Inception 12/1/20 |
|---|
| Investor Class | 4.59% | (14.87%) |
| MSCI China Index | 23.89% | (8.17%) |
The performance graph and total returns table do not reflect the deduction of taxes a shareholder would pay on Fund distributions or the redemption of Fund shares.
What did the Fund invest in?
The Fund invested in a variety of equity and debt securities. Opportunities continue to fluctuate with the volatility of the market and as banks continue to encounter risks.
| Top 10 | Value |
| Tencent Holdings Ltd. | 8.1% |
| Techtronic Industries Co. Ltd. | 6.9% |
| Meituan B | 6.8% |
| Silergy Corp. | 6.6% |
| Kweichow Moutai Co. Ltd. A | 5.9% |
| Yifeng Pharmacy Chain Co. Ltd. A | 3.8% |
| Shenzhou International Group Holdings Ltd. | 3.6% |
| Wuliangye Yibin Co. Ltd. A | 3.4% |
| Proya Cosmetics Co. Ltd. A | 3.4% |
| Contemporary Amperex Technology Co. Ltd. A | 3.4% |
| Industry | Value |
| Industrial Machinery & Supplies & Components | 14.7% |
| Semiconductors | 10.2% |
| Distillers & Vintners | 9.3% |
| Interactive Media & Services | 8.1% |
| Restaurants | 6.8% |
| Hotels, Resorts & Cruise Lines | 4.8% |
| Life & Health Insurance | 4.0% |
| Drug Retail | 3.8% |
| Apparel, Accessories & Luxury Goods | 3.6% |
| Personal Care Products | 3.4% |
Portfolio Compositions (%)
| Asset Type | Value |
| Common Stocks | 97.1% |
| Other Assets and Liabilities, Net | 2.9% |
| Total | 100.0% |
On November 13, 2024, the Board of Trustees of the Wasatch Funds Trust (the “Board”) approved the liquidation of the Wasatch Greater China Fund as soon as practicable. Accordingly, on November 13, 2024, the Board approved a plan of liquidation for the Wasatch Greater China Fund to close the Fund and redeem all of its outstanding shares on or about January 15, 2025 (the “Liquidation Date”).
In order to reduce expenses, we will deliver a single copy of prospectuses, proxies, financial reports and other communication to shareholders with the same residential address. If you would like to receive individual mailings, please call [800-551-1700] and we will begin sending you separate copies of these materials within 30 days after receiving your request.
ALPS Distributors, Inc. serves as the Fund’s distributor.
If you wish to view additional information about the Fund; including but not limited to financial statements or holdings, please visit www.wasatchglobal.com.
Phone: 800-551-1700
Email: shareholderservice@wasatchfunds.com
Wasatch Greater China Fund
Annual Shareholder Report
September 30, 2024
Wasatch International Growth Fund
Institutional Class WIIGX
Annual Shareholder Report
September 30, 2024
This Annual shareholder report contains important information about Wasatch International Growth Fund for the period of October 1, 2023 to September 30, 2024. You can find additional information about the Fund at www.wasatchglobal.com. You can also request this information by contacting us at 800-551-1700.
What were the Fund costs for last year?
Annual Fund Operating Expenses
(based on a hypothetical $10,000 investment)
| Class Name | Costs of a $10,000 investment | Costs paid as a percentage of a $10,000 investment |
|---|
| Institutional Class | $151 | 1.36% |
How did the fund perform last year and what affected its performance?
During the 12 months ended September 30, 2024, international equities experienced large gains. Hopes that many central banks may be nearing the end of their monetary tightening cycles helped drive stocks higher.
While the Fund had significant gains, it underperformed the benchmark MSCI AC (All Country) World ex USA Small Cap Index. The underperformance was largely due to our stocks in India and Japan. Within India, most of our stocks had solid gains, but we didn’t hold some higher-returning Indian stocks in the benchmark index. Within Japan, a value-oriented market that also favored large-cap stocks presented style headwinds for our small-cap growth strategy. While those stylistic trends in Japan were a headwind for our relative performance during much of the period, those headwinds began to abate in the third quarter of 2024. Given the strong fundamentals many of our Japanese businesses have produced, we like the return potential of these stocks going forward, particularly if stylistic trends are no longer a headwind.
Total return based on a $10,000 investment.
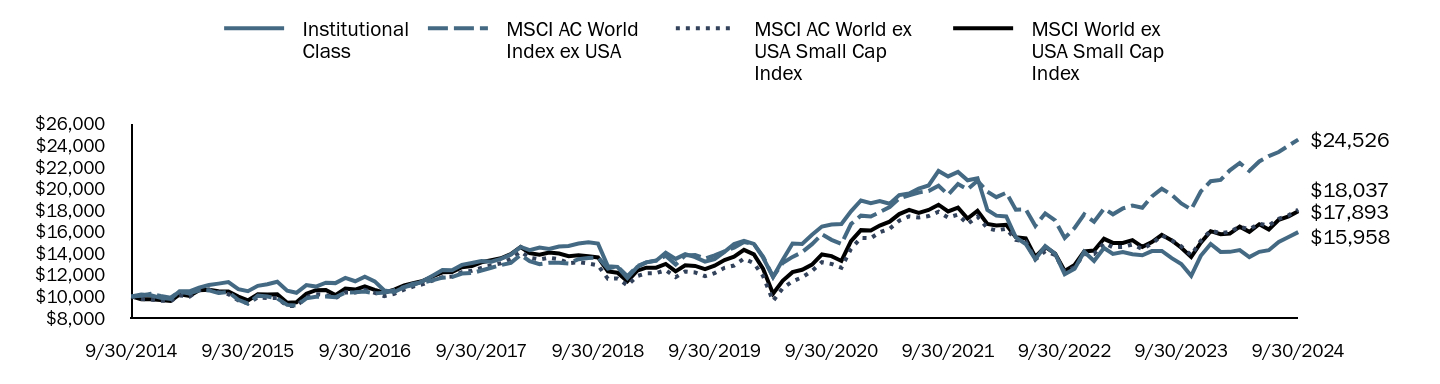
| Institutional Class | MSCI AC World Index ex USA | MSCI AC World ex USA Small Cap Index | MSCI World ex USA Small Cap Index |
|---|
| 9/30/2014 | $10,000 | $10,000 | $10,000 | $10,000 |
| 10/31/2014 | $10,179 | $10,070 | $9,764 | $9,747 |
| 11/30/2014 | $10,105 | $10,239 | $9,723 | $9,737 |
| 12/31/2014 | $9,863 | $10,041 | $9,602 | $9,662 |
| 1/31/2015 | $9,776 | $9,884 | $9,567 | $9,576 |
| 2/28/2015 | $10,475 | $10,435 | $10,089 | $10,189 |
| 3/31/2015 | $10,475 | $10,273 | $9,980 | $10,051 |
| 4/30/2015 | $10,818 | $10,571 | $10,576 | $10,563 |
| 5/31/2015 | $11,062 | $10,557 | $10,635 | $10,626 |
| 6/30/2015 | $11,186 | $10,309 | $10,401 | $10,470 |
| 7/31/2015 | $11,322 | $10,398 | $10,203 | $10,454 |
| 8/31/2015 | $10,671 | $9,685 | $9,634 | $9,988 |
| 9/30/2015 | $10,483 | $9,334 | $9,359 | $9,629 |
| 10/31/2015 | $10,979 | $10,067 | $9,913 | $10,201 |
| 11/30/2015 | $11,134 | $9,984 | $9,842 | $10,179 |
| 12/31/2015 | $11,363 | $9,804 | $9,852 | $10,190 |
| 1/31/2016 | $10,532 | $9,213 | $9,097 | $9,414 |
| 2/29/2016 | $10,336 | $9,149 | $9,128 | $9,464 |
| 3/31/2016 | $11,051 | $9,827 | $9,920 | $10,251 |
| 4/30/2016 | $10,912 | $9,972 | $10,197 | $10,575 |
| 5/31/2016 | $11,269 | $9,985 | $10,130 | $10,588 |
| 6/30/2016 | $11,231 | $9,924 | $9,833 | $10,119 |
| 7/31/2016 | $11,716 | $10,352 | $10,380 | $10,721 |
| 8/31/2016 | $11,404 | $10,387 | $10,355 | $10,631 |
| 9/30/2016 | $11,829 | $10,451 | $10,611 | $10,929 |
| 10/31/2016 | $11,397 | $10,273 | $10,331 | $10,605 |
| 11/30/2016 | $10,547 | $10,351 | $10,025 | $10,343 |
| 12/31/2016 | $10,414 | $10,575 | $10,237 | $10,629 |
| 1/31/2017 | $10,856 | $10,864 | $10,630 | $11,012 |
| 2/28/2017 | $11,040 | $11,169 | $10,910 | $11,223 |
| 3/31/2017 | $11,420 | $11,305 | $11,136 | $11,438 |
| 4/30/2017 | $11,913 | $11,482 | $11,470 | $11,843 |
| 5/31/2017 | $12,442 | $11,735 | $11,781 | $12,232 |
| 6/30/2017 | $12,422 | $11,789 | $11,831 | $12,271 |
| 7/31/2017 | $12,919 | $12,118 | $12,248 | $12,703 |
| 8/31/2017 | $13,095 | $12,164 | $12,381 | $12,810 |
| 9/30/2017 | $13,268 | $12,399 | $12,647 | $13,161 |
| 10/31/2017 | $13,213 | $12,657 | $12,883 | $13,347 |
| 11/30/2017 | $13,479 | $12,902 | $13,075 | $13,536 |
| 12/31/2017 | $13,866 | $13,110 | $13,477 | $13,928 |
| 1/31/2018 | $14,581 | $13,850 | $14,140 | $14,578 |
| 2/28/2018 | $14,280 | $13,268 | $13,583 | $14,012 |
| 3/31/2018 | $14,529 | $12,984 | $13,429 | $13,858 |
| 4/30/2018 | $14,405 | $13,108 | $13,585 | $14,069 |
| 5/31/2018 | $14,626 | $13,124 | $13,447 | $13,970 |
| 6/30/2018 | $14,678 | $13,053 | $13,081 | $13,728 |
| 7/31/2018 | $14,899 | $13,447 | $13,172 | $13,806 |
| 8/31/2018 | $15,008 | $13,552 | $13,044 | $13,711 |
| 9/30/2018 | $14,891 | $13,611 | $12,883 | $13,611 |
| 10/31/2018 | $12,796 | $12,591 | $11,630 | $12,314 |
| 11/30/2018 | $12,740 | $12,776 | $11,659 | $12,193 |
| 12/31/2018 | $11,699 | $11,876 | $11,024 | $11,411 |
| 1/31/2019 | $12,734 | $12,813 | $11,888 | $12,379 |
| 2/28/2019 | $13,152 | $13,156 | $12,137 | $12,664 |
| 3/31/2019 | $13,308 | $13,322 | $12,156 | $12,658 |
| 4/30/2019 | $14,040 | $13,771 | $12,424 | $13,004 |
| 5/31/2019 | $13,479 | $12,954 | $11,783 | $12,321 |
| 6/30/2019 | $13,911 | $13,803 | $12,303 | $12,881 |
| 7/31/2019 | $13,641 | $13,843 | $12,221 | $12,824 |
| 8/31/2019 | $13,228 | $13,515 | $11,869 | $12,527 |
| 9/30/2019 | $13,451 | $13,799 | $12,157 | $12,846 |
| 10/31/2019 | $14,125 | $14,177 | $12,649 | $13,374 |
| 11/30/2019 | $14,851 | $14,523 | $12,861 | $13,678 |
| 12/31/2019 | $15,156 | $15,034 | $13,496 | $14,311 |
| 1/31/2020 | $14,864 | $14,868 | $13,075 | $13,897 |
| 2/29/2020 | $13,584 | $13,667 | $11,872 | $12,541 |
| 3/31/2020 | $11,798 | $11,822 | $9,581 | $10,248 |
| 4/30/2020 | $13,375 | $13,089 | $10,746 | $11,448 |
| 5/31/2020 | $14,903 | $13,658 | $11,397 | $12,250 |
| 6/30/2020 | $14,849 | $14,094 | $11,769 | $12,468 |
| 7/31/2020 | $15,716 | $14,840 | $12,357 | $12,947 |
| 8/31/2020 | $16,470 | $15,748 | $13,170 | $13,891 |
| 9/30/2020 | $16,665 | $15,240 | $13,003 | $13,730 |
| 10/31/2020 | $16,704 | $14,870 | $12,659 | $13,287 |
| 11/30/2020 | $17,886 | $16,703 | $14,410 | $15,116 |
| 12/31/2020 | $18,886 | $17,478 | $15,418 | $16,140 |
| 1/31/2021 | $18,637 | $17,399 | $15,391 | $16,099 |
| 2/28/2021 | $18,842 | $17,802 | $15,948 | $16,565 |
| 3/31/2021 | $18,588 | $18,277 | $16,271 | $16,927 |
| 4/30/2021 | $19,383 | $19,076 | $17,018 | $17,628 |
| 5/31/2021 | $19,535 | $19,373 | $17,412 | $18,024 |
| 6/30/2021 | $19,994 | $19,628 | $17,304 | $17,740 |
| 7/31/2021 | $20,281 | $19,764 | $17,443 | $18,009 |
| 8/31/2021 | $21,622 | $20,258 | $17,846 | $18,493 |
| 9/30/2021 | $21,114 | $19,421 | $17,304 | $17,868 |
| 10/31/2021 | $21,530 | $20,413 | $17,574 | $18,228 |
| 11/30/2021 | $20,762 | $19,921 | $16,704 | $17,208 |
| 12/31/2021 | $20,947 | $20,718 | $17,411 | $17,937 |
| 1/31/2022 | $18,005 | $19,701 | $16,324 | $16,711 |
| 2/28/2022 | $17,480 | $19,192 | $16,112 | $16,562 |
| 3/31/2022 | $17,408 | $19,607 | $16,276 | $16,641 |
| 4/30/2022 | $15,475 | $18,038 | $15,226 | $15,485 |
| 5/31/2022 | $14,854 | $18,059 | $15,085 | $15,381 |
| 6/30/2022 | $13,451 | $16,537 | $13,420 | $13,656 |
| 7/31/2022 | $14,657 | $17,692 | $14,196 | $14,588 |
| 8/31/2022 | $13,953 | $17,040 | $13,823 | $13,957 |
| 9/30/2022 | $12,055 | $15,409 | $12,297 | $12,365 |
| 10/31/2022 | $12,550 | $16,339 | $12,697 | $12,919 |
| 11/30/2022 | $14,138 | $17,606 | $13,910 | $14,160 |
| 12/31/2022 | $13,284 | $16,913 | $13,933 | $14,245 |
| 1/31/2023 | $14,484 | $18,126 | $14,937 | $15,335 |
| 2/28/2023 | $13,929 | $17,606 | $14,555 | $14,959 |
| 3/31/2023 | $14,102 | $18,149 | $14,588 | $14,956 |
| 4/30/2023 | $13,899 | $18,410 | $14,803 | $15,219 |
| 5/31/2023 | $13,810 | $18,213 | $14,392 | $14,587 |
| 6/30/2023 | $14,197 | $19,270 | $14,887 | $15,028 |
| 7/31/2023 | $14,209 | $19,976 | $15,643 | $15,708 |
| 8/31/2023 | $13,547 | $19,417 | $15,207 | $15,181 |
| 9/30/2023 | $13,010 | $18,615 | $14,634 | $14,506 |
| 10/31/2023 | $11,912 | $18,055 | $13,816 | $13,649 |
| 11/30/2023 | $13,762 | $19,721 | $15,153 | $14,972 |
| 12/31/2023 | $14,854 | $20,669 | $16,115 | $16,043 |
| 1/31/2024 | $14,120 | $20,790 | $15,839 | $15,769 |
| 2/29/2024 | $14,126 | $21,682 | $15,997 | $15,815 |
| 3/31/2024 | $14,293 | $22,363 | $16,455 | $16,457 |
| 4/30/2024 | $13,642 | $21,625 | $16,216 | $15,982 |
| 5/31/2024 | $14,132 | $22,503 | $16,741 | $16,682 |
| 6/30/2024 | $14,281 | $23,004 | $16,563 | $16,201 |
| 7/31/2024 | $15,045 | $23,375 | $17,194 | $17,102 |
| 8/31/2024 | $15,504 | $23,969 | $17,511 | $17,421 |
| 9/30/2024 | $15,958 | $24,526 | $18,037 | $17,893 |
Fund performance shown in this graph represents past performance, which is not necessarily indicative of how the Fund will perform in the future.
Average Total Returns (%)
| Fund | Wasatch International Growth Fund |
|---|
| Total Net Assets | $298,071,746 |
| # of Portfolio Holdings | 60 |
| Portfolio Turnover Rate | 34% |
| Total Advisory Fees Paid | $4,605,068 |
| Fund | 1 Year | 5 Years | 10 Years |
|---|
| Institutional Class | 22.66% | 3.48% | 4.78% |
| MSCI AC World Index ex USA | 25.35% | 7.58% | 5.22% |
| MSCI AC World ex USA Small Cap Index | 23.25% | 8.21% | 6.08% |
| MSCI World ex USA Small Cap Index | 23.36% | 6.85% | 5.99% |
The performance graph and total returns table do not reflect the deduction of taxes a shareholder would pay on Fund distributions or the redemption of Fund shares.
What did the Fund invest in?
The Fund invested in a variety of equity and debt securities. Opportunities continue to fluctuate with the volatility of the market and as banks continue to encounter risks.
| Top 10 | Value |
| Diploma PLC | 4.1% |
| MonotaRO Co. Ltd. | 3.7% |
| Japan Elevator Service Holdings Co. Ltd. | 3.5% |
| Technology One Ltd. | 3.4% |
| Voltronic Power Technology Corp. | 3.4% |
| BayCurrent, Inc. | 3.3% |
| Halma PLC | 3.2% |
| Descartes Systems Group, Inc. | 3.1% |
| Scout24 SE | 2.9% |
| Definity Financial Corp. | 2.8% |
| Industry | Value |
| Application Software | 9.1% |
| Trading Companies & Distributors | 9.0% |
| Semiconductors | 6.9% |
| IT Consulting & Other Services | 6.2% |
| Interactive Media & Services | 4.9% |
| Property & Casualty Insurance | 4.3% |
| Asset Management & Custody Banks | 4.2% |
| Diversified Support Services | 3.5% |
| Drug Retail | 3.4% |
| Electrical Components & Equipment | 3.4% |
Portfolio Compositions (%)
| Asset Type | Value |
| Common Stocks | 97.8% |
| Other Assets and Liabilities, Net | 2.2% |
| Total | 100.0% |
In order to reduce expenses, we will deliver a single copy of prospectuses, proxies, financial reports and other communication to shareholders with the same residential address. If you would like to receive individual mailings, please call [800-551-1700] and we will begin sending you separate copies of these materials within 30 days after receiving your request.
ALPS Distributors, Inc. serves as the Fund’s distributor.
If you wish to view additional information about the Fund; including but not limited to financial statements or holdings, please visit www.wasatchglobal.com.
Phone: 800-551-1700
Email: shareholderservice@wasatchfunds.com
Wasatch International Growth Fund
Annual Shareholder Report
September 30, 2024
Wasatch International Growth Fund
Annual Shareholder Report
September 30, 2024
This Annual shareholder report contains important information about Wasatch International Growth Fund for the period of October 1, 2023 to September 30, 2024. You can find additional information about the Fund at www.wasatchglobal.com. You can also request this information by contacting us at 800-551-1700.
What were the Fund costs for last year?
Annual Fund Operating Expenses
(based on a hypothetical $10,000 investment)
| Class Name | Costs of a $10,000 investment | Costs paid as a percentage of a $10,000 investment |
|---|
| Investor Class | $166 | 1.49% |
How did the fund perform last year and what affected its performance?
During the 12 months ended September 30, 2024, international equities experienced large gains. Hopes that many central banks may be nearing the end of their monetary tightening cycles helped drive stocks higher.
While the Fund had significant gains, it underperformed the benchmark MSCI AC (All Country) World ex USA Small Cap Index. The underperformance was largely due to our stocks in India and Japan. Within India, most of our stocks had solid gains, but we didn’t hold some higher-returning Indian stocks in the benchmark index. Within Japan, a value-oriented market that also favored large-cap stocks presented style headwinds for our small-cap growth strategy. While those stylistic trends in Japan were a headwind for our relative performance during much of the period, those headwinds began to abate in the third quarter of 2024. Given the strong fundamentals many of our Japanese businesses have produced, we like the return potential of these stocks going forward, particularly if stylistic trends are no longer a headwind.
Total return based on a $10,000 investment.
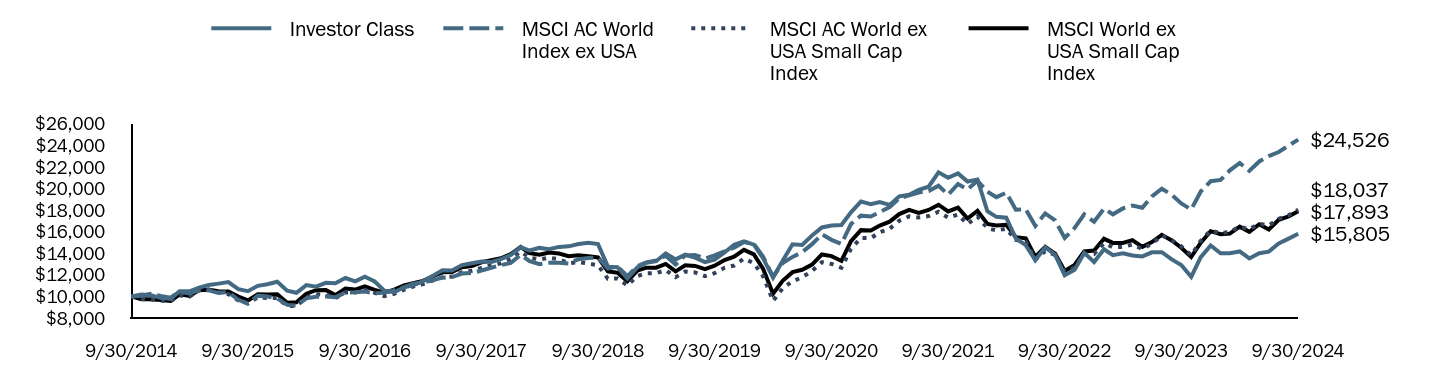
| Investor Class | MSCI AC World Index ex USA | MSCI AC World ex USA Small Cap Index | MSCI World ex USA Small Cap Index |
|---|
| 9/30/2014 | $10,000 | $10,000 | $10,000 | $10,000 |
| 10/31/2014 | $10,179 | $10,070 | $9,764 | $9,747 |
| 11/30/2014 | $10,105 | $10,239 | $9,723 | $9,737 |
| 12/31/2014 | $9,863 | $10,041 | $9,602 | $9,662 |
| 1/31/2015 | $9,776 | $9,884 | $9,567 | $9,576 |
| 2/28/2015 | $10,475 | $10,435 | $10,089 | $10,189 |
| 3/31/2015 | $10,475 | $10,273 | $9,980 | $10,051 |
| 4/30/2015 | $10,818 | $10,571 | $10,576 | $10,563 |
| 5/31/2015 | $11,062 | $10,557 | $10,635 | $10,626 |
| 6/30/2015 | $11,186 | $10,309 | $10,401 | $10,470 |
| 7/31/2015 | $11,322 | $10,398 | $10,203 | $10,454 |
| 8/31/2015 | $10,671 | $9,685 | $9,634 | $9,988 |
| 9/30/2015 | $10,483 | $9,334 | $9,359 | $9,629 |
| 10/31/2015 | $10,979 | $10,067 | $9,913 | $10,201 |
| 11/30/2015 | $11,134 | $9,984 | $9,842 | $10,179 |
| 12/31/2015 | $11,363 | $9,804 | $9,852 | $10,190 |
| 1/31/2016 | $10,532 | $9,213 | $9,097 | $9,414 |
| 2/29/2016 | $10,333 | $9,149 | $9,128 | $9,464 |
| 3/31/2016 | $11,047 | $9,827 | $9,920 | $10,251 |
| 4/30/2016 | $10,904 | $9,972 | $10,197 | $10,575 |
| 5/31/2016 | $11,261 | $9,985 | $10,130 | $10,588 |
| 6/30/2016 | $11,224 | $9,924 | $9,833 | $10,119 |
| 7/31/2016 | $11,705 | $10,352 | $10,380 | $10,721 |
| 8/31/2016 | $11,389 | $10,387 | $10,355 | $10,631 |
| 9/30/2016 | $11,818 | $10,451 | $10,611 | $10,929 |
| 10/31/2016 | $11,385 | $10,273 | $10,331 | $10,605 |
| 11/30/2016 | $10,532 | $10,351 | $10,025 | $10,343 |
| 12/31/2016 | $10,401 | $10,575 | $10,237 | $10,629 |
| 1/31/2017 | $10,843 | $10,864 | $10,630 | $11,012 |
| 2/28/2017 | $11,023 | $11,169 | $10,910 | $11,223 |
| 3/31/2017 | $11,402 | $11,305 | $11,136 | $11,438 |
| 4/30/2017 | $11,891 | $11,482 | $11,470 | $11,843 |
| 5/31/2017 | $12,419 | $11,735 | $11,781 | $12,232 |
| 6/30/2017 | $12,400 | $11,789 | $11,831 | $12,271 |
| 7/31/2017 | $12,892 | $12,118 | $12,248 | $12,703 |
| 8/31/2017 | $13,068 | $12,164 | $12,381 | $12,810 |
| 9/30/2017 | $13,241 | $12,399 | $12,647 | $13,161 |
| 10/31/2017 | $13,186 | $12,657 | $12,883 | $13,347 |
| 11/30/2017 | $13,452 | $12,902 | $13,075 | $13,536 |
| 12/31/2017 | $13,834 | $13,110 | $13,477 | $13,928 |
| 1/31/2018 | $14,545 | $13,850 | $14,140 | $14,578 |
| 2/28/2018 | $14,248 | $13,268 | $13,583 | $14,012 |
| 3/31/2018 | $14,493 | $12,984 | $13,429 | $13,858 |
| 4/30/2018 | $14,369 | $13,108 | $13,585 | $14,069 |
| 5/31/2018 | $14,585 | $13,124 | $13,447 | $13,970 |
| 6/30/2018 | $14,638 | $13,053 | $13,081 | $13,728 |
| 7/31/2018 | $14,855 | $13,447 | $13,172 | $13,806 |
| 8/31/2018 | $14,963 | $13,552 | $13,044 | $13,711 |
| 9/30/2018 | $14,847 | $13,611 | $12,883 | $13,611 |
| 10/31/2018 | $12,757 | $12,591 | $11,630 | $12,314 |
| 11/30/2018 | $12,701 | $12,776 | $11,659 | $12,193 |
| 12/31/2018 | $11,660 | $11,876 | $11,024 | $11,411 |
| 1/31/2019 | $12,695 | $12,813 | $11,888 | $12,379 |
| 2/28/2019 | $13,108 | $13,156 | $12,137 | $12,664 |
| 3/31/2019 | $13,260 | $13,322 | $12,156 | $12,658 |
| 4/30/2019 | $13,991 | $13,771 | $12,424 | $13,004 |
| 5/31/2019 | $13,431 | $12,954 | $11,783 | $12,321 |
| 6/30/2019 | $13,862 | $13,803 | $12,303 | $12,881 |
| 7/31/2019 | $13,592 | $13,843 | $12,221 | $12,824 |
| 8/31/2019 | $13,174 | $13,515 | $11,869 | $12,527 |
| 9/30/2019 | $13,397 | $13,799 | $12,157 | $12,846 |
| 10/31/2019 | $14,066 | $14,177 | $12,649 | $13,374 |
| 11/30/2019 | $14,788 | $14,523 | $12,861 | $13,678 |
| 12/31/2019 | $15,092 | $15,034 | $13,496 | $14,311 |
| 1/31/2020 | $14,795 | $14,868 | $13,075 | $13,897 |
| 2/29/2020 | $13,521 | $13,667 | $11,872 | $12,541 |
| 3/31/2020 | $11,745 | $11,822 | $9,581 | $10,248 |
| 4/30/2020 | $13,312 | $13,089 | $10,746 | $11,448 |
| 5/31/2020 | $14,830 | $13,658 | $11,397 | $12,250 |
| 6/30/2020 | $14,771 | $14,094 | $11,769 | $12,468 |
| 7/31/2020 | $15,637 | $14,840 | $12,357 | $12,947 |
| 8/31/2020 | $16,386 | $15,748 | $13,170 | $13,891 |
| 9/30/2020 | $16,576 | $15,240 | $13,003 | $13,730 |
| 10/31/2020 | $16,615 | $14,870 | $12,659 | $13,287 |
| 11/30/2020 | $17,793 | $16,703 | $14,410 | $15,116 |
| 12/31/2020 | $18,782 | $17,478 | $15,418 | $16,140 |
| 1/31/2021 | $18,533 | $17,399 | $15,391 | $16,099 |
| 2/28/2021 | $18,739 | $17,802 | $15,948 | $16,565 |
| 3/31/2021 | $18,479 | $18,277 | $16,271 | $16,927 |
| 4/30/2021 | $19,269 | $19,076 | $17,018 | $17,628 |
| 5/31/2021 | $19,420 | $19,373 | $17,412 | $18,024 |
| 6/30/2021 | $19,875 | $19,628 | $17,304 | $17,740 |
| 7/31/2021 | $20,162 | $19,764 | $17,443 | $18,009 |
| 8/31/2021 | $21,492 | $20,258 | $17,846 | $18,493 |
| 9/30/2021 | $20,984 | $19,421 | $17,304 | $17,868 |
| 10/31/2021 | $21,395 | $20,413 | $17,574 | $18,228 |
| 11/30/2021 | $20,638 | $19,921 | $16,704 | $17,208 |
| 12/31/2021 | $20,817 | $20,718 | $17,411 | $17,937 |
| 1/31/2022 | $17,890 | $19,701 | $16,324 | $16,711 |
| 2/28/2022 | $17,370 | $19,192 | $16,112 | $16,562 |
| 3/31/2022 | $17,293 | $19,607 | $16,276 | $16,641 |
| 4/30/2022 | $15,375 | $18,038 | $15,226 | $15,485 |
| 5/31/2022 | $14,754 | $18,059 | $15,085 | $15,381 |
| 6/30/2022 | $13,356 | $16,537 | $13,420 | $13,656 |
| 7/31/2022 | $14,551 | $17,692 | $14,196 | $14,588 |
| 8/31/2022 | $13,852 | $17,040 | $13,823 | $13,957 |
| 9/30/2022 | $11,964 | $15,409 | $12,297 | $12,365 |
| 10/31/2022 | $12,460 | $16,339 | $12,697 | $12,919 |
| 11/30/2022 | $14,031 | $17,606 | $13,910 | $14,160 |
| 12/31/2022 | $13,189 | $16,913 | $13,933 | $14,245 |
| 1/31/2023 | $14,372 | $18,126 | $14,937 | $15,335 |
| 2/28/2023 | $13,822 | $17,606 | $14,555 | $14,959 |
| 3/31/2023 | $13,989 | $18,149 | $14,588 | $14,956 |
| 4/30/2023 | $13,786 | $18,410 | $14,803 | $15,219 |
| 5/31/2023 | $13,703 | $18,213 | $14,392 | $14,587 |
| 6/30/2023 | $14,085 | $19,270 | $14,887 | $15,028 |
| 7/31/2023 | $14,097 | $19,976 | $15,643 | $15,708 |
| 8/31/2023 | $13,434 | $19,417 | $15,207 | $15,181 |
| 9/30/2023 | $12,902 | $18,615 | $14,634 | $14,506 |
| 10/31/2023 | $11,809 | $18,055 | $13,816 | $13,649 |
| 11/30/2023 | $13,643 | $19,721 | $15,153 | $14,972 |
| 12/31/2023 | $14,724 | $20,669 | $16,115 | $16,043 |
| 1/31/2024 | $13,995 | $20,790 | $15,839 | $15,769 |
| 2/29/2024 | $14,001 | $21,682 | $15,997 | $15,815 |
| 3/31/2024 | $14,163 | $22,363 | $16,455 | $16,457 |
| 4/30/2024 | $13,517 | $21,625 | $16,216 | $15,982 |
| 5/31/2024 | $14,001 | $22,503 | $16,741 | $16,682 |
| 6/30/2024 | $14,145 | $23,004 | $16,563 | $16,201 |
| 7/31/2024 | $14,903 | $23,375 | $17,194 | $17,102 |
| 8/31/2024 | $15,351 | $23,969 | $17,511 | $17,421 |
| 9/30/2024 | $15,805 | $24,526 | $18,037 | $17,893 |
Fund performance shown in this graph represents past performance, which is not necessarily indicative of how the Fund will perform in the future.
Average Total Returns (%)
| Fund | Wasatch International Growth Fund |
|---|
| Total Net Assets | $298,071,746 |
| # of Portfolio Holdings | 60 |
| Portfolio Turnover Rate | 34% |
| Total Advisory Fees Paid | $4,605,068 |
| Fund | 1 Year | 5 Years | 10 Years |
|---|
| Investor Class | 22.50% | 3.36% | 4.68% |
| MSCI AC World Index ex USA | 25.35% | 7.58% | 5.22% |
| MSCI AC World ex USA Small Cap Index | 23.25% | 8.21% | 6.08% |
| MSCI World ex USA Small Cap Index | 23.36% | 6.85% | 5.99% |
The performance graph and total returns table do not reflect the deduction of taxes a shareholder would pay on Fund distributions or the redemption of Fund shares.
What did the Fund invest in?
The Fund invested in a variety of equity and debt securities. Opportunities continue to fluctuate with the volatility of the market and as banks continue to encounter risks.
| Top 10 | Value |
| Diploma PLC | 4.1% |
| MonotaRO Co. Ltd. | 3.7% |
| Japan Elevator Service Holdings Co. Ltd. | 3.5% |
| Technology One Ltd. | 3.4% |
| Voltronic Power Technology Corp. | 3.4% |
| BayCurrent, Inc. | 3.3% |
| Halma PLC | 3.2% |
| Descartes Systems Group, Inc. | 3.1% |
| Scout24 SE | 2.9% |
| Definity Financial Corp. | 2.8% |
| Industry | Value |
| Application Software | 9.1% |
| Trading Companies & Distributors | 9.0% |
| Semiconductors | 6.9% |
| IT Consulting & Other Services | 6.2% |
| Interactive Media & Services | 4.9% |
| Property & Casualty Insurance | 4.3% |
| Asset Management & Custody Banks | 4.2% |
| Diversified Support Services | 3.5% |
| Drug Retail | 3.4% |
| Electrical Components & Equipment | 3.4% |
Portfolio Compositions (%)
| Asset Type | Value |
| Common Stocks | 97.8% |
| Other Assets and Liabilities, Net | 2.2% |
| Total | 100.0% |
In order to reduce expenses, we will deliver a single copy of prospectuses, proxies, financial reports and other communication to shareholders with the same residential address. If you would like to receive individual mailings, please call [800-551-1700] and we will begin sending you separate copies of these materials within 30 days after receiving your request.
ALPS Distributors, Inc. serves as the Fund’s distributor.
If you wish to view additional information about the Fund; including but not limited to financial statements or holdings, please visit www.wasatchglobal.com.
Phone: 800-551-1700
Email: shareholderservice@wasatchfunds.com
Wasatch International Growth Fund
Annual Shareholder Report
September 30, 2024
Wasatch International Opportunities Fund
Institutional Class WIIOX
Annual Shareholder Report
September 30, 2024
This Annual shareholder report contains important information about Wasatch International Opportunities Fund for the period of October 1, 2023 to September 30, 2024. You can find additional information about the Fund at www.wasatchglobal.com. You can also request this information by contacting us at 800-551-1700.
What were the Fund costs for last year?
Annual Fund Operating Expenses
(based on a hypothetical $10,000 investment)
| Class Name | Costs of a $10,000 investment | Costs paid as a percentage of a $10,000 investment |
|---|
| Institutional Class | $216 | 1.96% |
How did the fund perform last year and what affected its performance?
During the 12 months ended September 30, 2024, international equities experienced large gains. Hopes that many central banks may be nearing the end of their monetary tightening cycles helped drive stocks higher.
While the Fund had significant gains during the period, it underperformed the benchmark MSCI AC (All Country) World ex USA Small Cap Index. The underperformance was largely due to our stocks in India and Japan. Within India, we didn’t hold some higher-returning Indian stocks in the benchmark index. Within Japan, a value-oriented market that also favored large-cap stocks presented style headwinds for our micro-cap growth strategy. While those stylistic trends in Japan were a headwind for our relative performance during much of the period, those headwinds began to abate in the third quarter of 2024. Given the strong fundamentals many of our Japanese businesses have produced, we like the return potential of these stocks going forward, particularly if stylistic trends are no longer a headwind.
Total return based on a $10,000 investment.
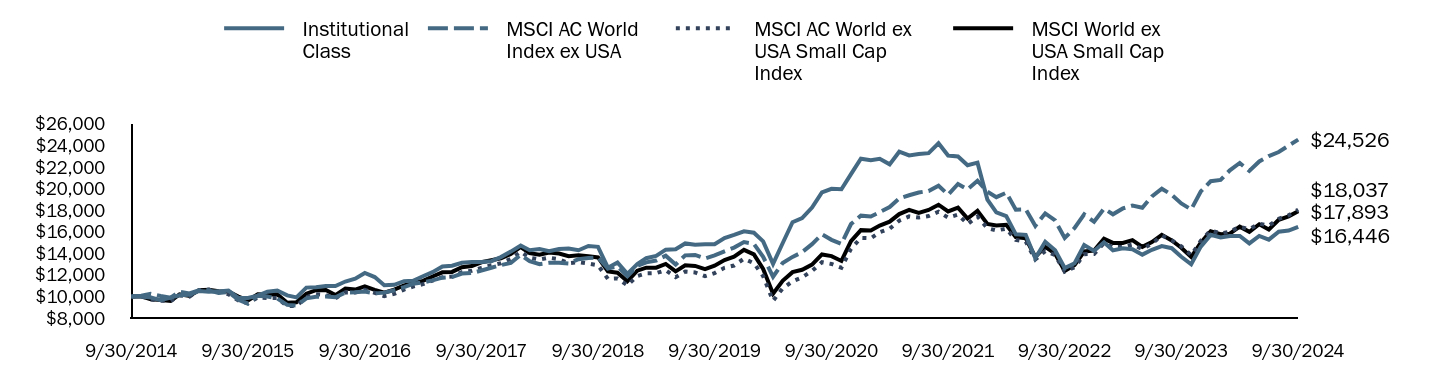
| Institutional Class | MSCI AC World Index ex USA | MSCI AC World ex USA Small Cap Index | MSCI World ex USA Small Cap Index |
|---|
| 9/30/2014 | $10,000 | $10,000 | $10,000 | $10,000 |
| 10/31/2014 | $10,000 | $10,070 | $10,000 | $10,000 |
| 11/30/2014 | $9,903 | $10,239 | $9,723 | $9,737 |
| 12/31/2014 | $9,640 | $10,041 | $9,602 | $9,662 |
| 1/31/2015 | $9,892 | $9,884 | $9,567 | $9,576 |
| 2/28/2015 | $10,107 | $10,435 | $10,089 | $10,189 |
| 3/31/2015 | $10,143 | $10,273 | $9,980 | $10,051 |
| 4/30/2015 | $10,503 | $10,571 | $10,576 | $10,563 |
| 5/31/2015 | $10,431 | $10,557 | $10,635 | $10,626 |
| 6/30/2015 | $10,467 | $10,309 | $10,401 | $10,470 |
| 7/31/2015 | $10,539 | $10,398 | $10,203 | $10,454 |
| 8/31/2015 | $9,856 | $9,685 | $9,634 | $9,988 |
| 9/30/2015 | $9,856 | $9,334 | $9,359 | $9,629 |
| 10/31/2015 | $10,071 | $10,067 | $9,913 | $10,201 |
| 11/30/2015 | $10,431 | $9,984 | $9,842 | $10,179 |
| 12/31/2015 | $10,550 | $9,804 | $9,852 | $10,190 |
| 1/31/2016 | $10,098 | $9,213 | $9,097 | $9,414 |
| 2/29/2016 | $9,910 | $9,149 | $9,128 | $9,464 |
| 3/31/2016 | $10,814 | $9,827 | $9,920 | $10,251 |
| 4/30/2016 | $10,852 | $9,972 | $10,197 | $10,575 |
| 5/31/2016 | $10,965 | $9,985 | $10,130 | $10,588 |
| 6/30/2016 | $10,965 | $9,924 | $9,833 | $10,119 |
| 7/31/2016 | $11,379 | $10,352 | $10,380 | $10,721 |
| 8/31/2016 | $11,643 | $10,387 | $10,355 | $10,631 |
| 9/30/2016 | $12,171 | $10,451 | $10,611 | $10,929 |
| 10/31/2016 | $11,794 | $10,273 | $10,331 | $10,605 |
| 11/30/2016 | $11,040 | $10,351 | $10,025 | $10,343 |
| 12/31/2016 | $11,078 | $10,575 | $10,237 | $10,629 |
| 1/31/2017 | $11,417 | $10,864 | $10,630 | $11,012 |
| 2/28/2017 | $11,455 | $11,169 | $10,910 | $11,223 |
| 3/31/2017 | $11,869 | $11,305 | $11,136 | $11,438 |
| 4/30/2017 | $12,246 | $11,482 | $11,470 | $11,843 |
| 5/31/2017 | $12,773 | $11,735 | $11,781 | $12,232 |
| 6/30/2017 | $12,849 | $11,789 | $11,831 | $12,271 |
| 7/31/2017 | $13,113 | $12,118 | $12,248 | $12,703 |
| 8/31/2017 | $13,188 | $12,164 | $12,381 | $12,810 |
| 9/30/2017 | $13,188 | $12,399 | $12,647 | $13,161 |
| 10/31/2017 | $13,263 | $12,657 | $12,883 | $13,347 |
| 11/30/2017 | $13,640 | $12,902 | $13,075 | $13,536 |
| 12/31/2017 | $14,151 | $13,110 | $13,477 | $13,928 |
| 1/31/2018 | $14,715 | $13,850 | $14,140 | $14,578 |
| 2/28/2018 | $14,272 | $13,268 | $13,583 | $14,012 |
| 3/31/2018 | $14,393 | $12,984 | $13,429 | $13,858 |
| 4/30/2018 | $14,191 | $13,108 | $13,585 | $14,069 |
| 5/31/2018 | $14,393 | $13,124 | $13,447 | $13,970 |
| 6/30/2018 | $14,433 | $13,053 | $13,081 | $13,728 |
| 7/31/2018 | $14,272 | $13,447 | $13,172 | $13,806 |
| 8/31/2018 | $14,675 | $13,552 | $13,044 | $13,711 |
| 9/30/2018 | $14,594 | $13,611 | $12,883 | $13,611 |
| 10/31/2018 | $12,659 | $12,591 | $11,630 | $12,314 |
| 11/30/2018 | $13,143 | $12,776 | $11,659 | $12,193 |
| 12/31/2018 | $12,093 | $11,876 | $11,024 | $11,411 |
| 1/31/2019 | $13,004 | $12,813 | $11,888 | $12,379 |
| 2/28/2019 | $13,542 | $13,156 | $12,137 | $12,664 |
| 3/31/2019 | $13,749 | $13,322 | $12,156 | $12,658 |
| 4/30/2019 | $14,329 | $13,771 | $12,424 | $13,004 |
| 5/31/2019 | $14,370 | $12,954 | $11,783 | $12,321 |
| 6/30/2019 | $14,909 | $13,803 | $12,303 | $12,881 |
| 7/31/2019 | $14,785 | $13,843 | $12,221 | $12,824 |
| 8/31/2019 | $14,826 | $13,515 | $11,869 | $12,527 |
| 9/30/2019 | $14,826 | $13,799 | $12,157 | $12,846 |
| 10/31/2019 | $15,406 | $14,177 | $12,649 | $13,374 |
| 11/30/2019 | $15,696 | $14,523 | $12,861 | $13,678 |
| 12/31/2019 | $16,028 | $15,034 | $13,496 | $14,311 |
| 1/31/2020 | $15,901 | $14,868 | $13,075 | $13,897 |
| 2/29/2020 | $15,095 | $13,667 | $11,872 | $12,541 |
| 3/31/2020 | $13,018 | $11,822 | $9,581 | $10,248 |
| 4/30/2020 | $14,926 | $13,089 | $10,746 | $11,448 |
| 5/31/2020 | $16,876 | $13,658 | $11,397 | $12,250 |
| 6/30/2020 | $17,258 | $14,094 | $11,769 | $12,468 |
| 7/31/2020 | $18,233 | $14,840 | $12,357 | $12,947 |
| 8/31/2020 | $19,632 | $15,748 | $13,170 | $13,891 |
| 9/30/2020 | $19,972 | $15,240 | $13,003 | $13,730 |
| 10/31/2020 | $19,929 | $14,870 | $12,659 | $13,287 |
| 11/30/2020 | $21,328 | $16,703 | $14,410 | $15,116 |
| 12/31/2020 | $22,753 | $17,478 | $15,418 | $16,140 |
| 1/31/2021 | $22,623 | $17,399 | $15,391 | $16,099 |
| 2/28/2021 | $22,753 | $17,802 | $15,948 | $16,565 |
| 3/31/2021 | $22,234 | $18,277 | $16,271 | $16,927 |
| 4/30/2021 | $23,402 | $19,076 | $17,018 | $17,628 |
| 5/31/2021 | $23,056 | $19,373 | $17,412 | $18,024 |
| 6/30/2021 | $23,186 | $19,628 | $17,304 | $17,740 |
| 7/31/2021 | $23,272 | $19,764 | $17,443 | $18,009 |
| 8/31/2021 | $24,181 | $20,258 | $17,846 | $18,493 |
| 9/30/2021 | $23,056 | $19,421 | $17,304 | $17,868 |
| 10/31/2021 | $22,969 | $20,413 | $17,574 | $18,228 |
| 11/30/2021 | $22,148 | $19,921 | $16,704 | $17,208 |
| 12/31/2021 | $22,391 | $20,718 | $17,411 | $17,937 |
| 1/31/2022 | $18,973 | $19,701 | $16,324 | $16,711 |
| 2/28/2022 | $17,784 | $19,192 | $16,112 | $16,562 |
| 3/31/2022 | $17,437 | $19,607 | $16,276 | $16,641 |
| 4/30/2022 | $15,753 | $18,038 | $15,226 | $15,485 |
| 5/31/2022 | $15,703 | $18,059 | $15,085 | $15,381 |
| 6/30/2022 | $13,524 | $16,537 | $13,420 | $13,656 |
| 7/31/2022 | $15,059 | $17,692 | $14,196 | $14,588 |
| 8/31/2022 | $14,267 | $17,040 | $13,823 | $13,957 |
| 9/30/2022 | $12,632 | $15,409 | $12,297 | $12,365 |
| 10/31/2022 | $13,078 | $16,339 | $12,697 | $12,919 |
| 11/30/2022 | $14,762 | $17,606 | $13,910 | $14,160 |
| 12/31/2022 | $14,217 | $16,913 | $13,933 | $14,245 |
| 1/31/2023 | $15,010 | $18,126 | $14,937 | $15,335 |
| 2/28/2023 | $14,267 | $17,606 | $14,555 | $14,959 |
| 3/31/2023 | $14,465 | $18,149 | $14,588 | $14,956 |
| 4/30/2023 | $14,366 | $18,410 | $14,803 | $15,219 |
| 5/31/2023 | $13,870 | $18,213 | $14,392 | $14,587 |
| 6/30/2023 | $14,316 | $19,270 | $14,887 | $15,028 |
| 7/31/2023 | $14,663 | $19,976 | $15,643 | $15,708 |
| 8/31/2023 | $14,465 | $19,417 | $15,207 | $15,181 |
| 9/30/2023 | $13,672 | $18,615 | $14,634 | $14,506 |
| 10/31/2023 | $12,979 | $18,055 | $13,816 | $13,649 |
| 11/30/2023 | $14,613 | $19,721 | $15,153 | $14,972 |
| 12/31/2023 | $15,703 | $20,669 | $16,115 | $16,043 |
| 1/31/2024 | $15,456 | $20,790 | $15,839 | $15,769 |
| 2/29/2024 | $15,604 | $21,682 | $15,997 | $15,815 |
| 3/31/2024 | $15,604 | $22,363 | $16,455 | $16,457 |
| 4/30/2024 | $14,911 | $21,625 | $16,216 | $15,982 |
| 5/31/2024 | $15,604 | $22,503 | $16,741 | $16,682 |
| 6/30/2024 | $15,257 | $23,004 | $16,563 | $16,201 |
| 7/31/2024 | $16,000 | $23,375 | $17,194 | $17,102 |
| 8/31/2024 | $16,100 | $23,969 | $17,511 | $17,421 |
| 9/30/2024 | $16,446 | $24,526 | $18,037 | $17,893 |
Fund performance shown in this graph represents past performance, which is not necessarily indicative of how the Fund will perform in the future.
Average Total Returns (%)
| Fund | Wasatch International Opportunities Fund |
|---|
| Total Net Assets | $146,374,403 |
| # of Portfolio Holdings | 66 |
| Portfolio Turnover Rate | 25% |
| Total Advisory Fees Paid | $4,514,920 |
| Fund | 1 Year | 5 Years | 10 Years |
|---|
| Institutional Class | 20.29% | 2.10% | 5.10% |
| MSCI AC World Index ex USA | 25.35% | 7.58% | 5.22% |
| MSCI AC World ex USA Small Cap Index | 23.25% | 8.21% | 6.08% |
| MSCI World ex USA Small Cap Index | 23.36% | 6.85% | 5.99% |
The performance graph and total returns table do not reflect the deduction of taxes a shareholder would pay on Fund distributions or the redemption of Fund shares.
What did the Fund invest in?
The Fund invested in a variety of equity and debt securities. Opportunities continue to fluctuate with the volatility of the market and as banks continue to encounter risks.
| Top 10 | Value |
| Japan Elevator Service Holdings Co. Ltd. | 4.5% |
| Vijaya Diagnostic Centre Pvt Ltd. | 3.8% |
| Hemnet Group AB | 3.8% |
| Nexus AG | 3.4% |
| Pro Medicus Ltd. | 3.4% |
| JTC PLC | 3.2% |
| Baltic Classifieds Group PLC | 3.0% |
| Mortgage Advice Bureau Holdings Ltd. | 2.7% |
| AJ Bell PLC | 2.5% |
| baudroie, Inc. | 2.5% |
| Industry | Value |
| Application Software | 12.1% |
| Diversified Support Services | 10.0% |
| Interactive Media & Services | 7.7% |
| Health Care Technology | 6.8% |
| Asset Management & Custody Banks | 6.5% |
| IT Consulting & Other Services | 4.4% |
| Commercial & Residential Mortgage Finance | 4.4% |
| Investment Banking & Brokerage | 4.2% |
| Research & Consulting Services | 4.0% |
| Human Resource & Employment Services | 3.9% |
Portfolio Compositions (%)
| Asset Type | Value |
| Common Stocks | 99.0% |
| Exchange-Traded Funds | 1.5% |
| Other Assets and Liabilities, Net | (0.5%) |
| Total | 100.0% |
In order to reduce expenses, we will deliver a single copy of prospectuses, proxies, financial reports and other communication to shareholders with the same residential address. If you would like to receive individual mailings, please call [800-551-1700] and we will begin sending you separate copies of these materials within 30 days after receiving your request.
ALPS Distributors, Inc. serves as the Fund’s distributor.
If you wish to view additional information about the Fund; including but not limited to financial statements or holdings, please visit www.wasatchglobal.com.
Phone: 800-551-1700
Email: shareholderservice@wasatchfunds.com
Wasatch International Opportunities Fund
Annual Shareholder Report
September 30, 2024
Wasatch International Opportunities Fund
Annual Shareholder Report
September 30, 2024
This Annual shareholder report contains important information about Wasatch International Opportunities Fund for the period of October 1, 2023 to September 30, 2024. You can find additional information about the Fund at www.wasatchglobal.com. You can also request this information by contacting us at 800-551-1700.
What were the Fund costs for last year?
Annual Fund Operating Expenses
(based on a hypothetical $10,000 investment)
| Class Name | Costs of a $10,000 investment | Costs paid as a percentage of a $10,000 investment |
|---|
| Investor Class | $225 | 2.04% |
How did the fund perform last year and what affected its performance?
During the 12 months ended September 30, 2024, international equities experienced large gains. Hopes that many central banks may be nearing the end of their monetary tightening cycles helped drive stocks higher.
While the Fund had significant gains during the period, it underperformed the benchmark MSCI AC (All Country) World ex USA Small Cap Index. The underperformance was largely due to our stocks in India and Japan. Within India, we didn’t hold some higher-returning Indian stocks in the benchmark index. Within Japan, a value-oriented market that also favored large-cap stocks presented style headwinds for our micro-cap growth strategy. While those stylistic trends in Japan were a headwind for our relative performance during much of the period, those headwinds began to abate in the third quarter of 2024. Given the strong fundamentals many of our Japanese businesses have produced, we like the return potential of these stocks going forward, particularly if stylistic trends are no longer a headwind.
Total return based on a $10,000 investment.
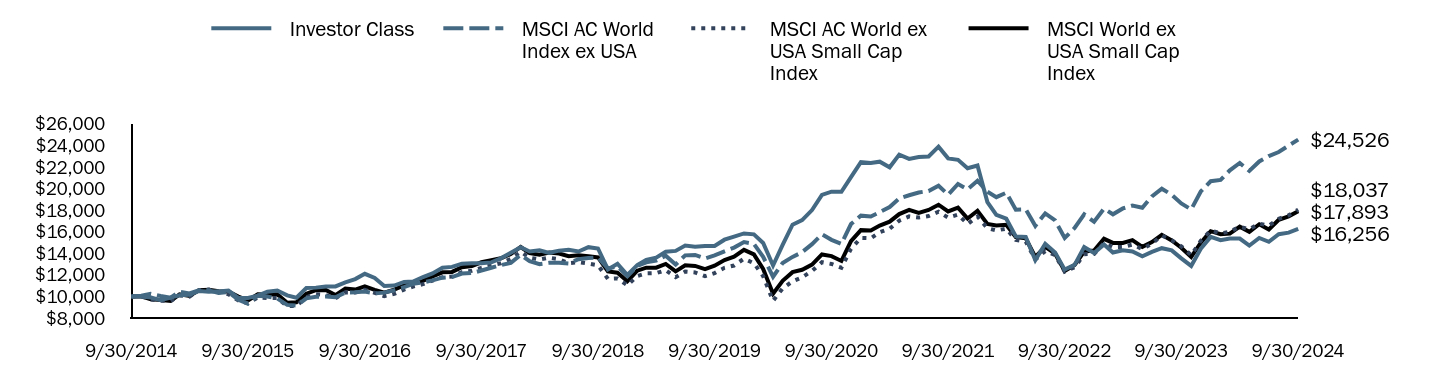
| Investor Class | MSCI AC World Index ex USA | MSCI AC World ex USA Small Cap Index | MSCI World ex USA Small Cap Index |
|---|
| 9/30/2014 | $10,000 | $10,000 | $10,000 | $10,000 |
| 10/31/2014 | $10,000 | $10,070 | $10,000 | $10,000 |
| 11/30/2014 | $9,903 | $10,239 | $9,723 | $9,737 |
| 12/31/2014 | $9,640 | $10,041 | $9,602 | $9,662 |
| 1/31/2015 | $9,892 | $9,884 | $9,567 | $9,576 |
| 2/28/2015 | $10,107 | $10,435 | $10,089 | $10,189 |
| 3/31/2015 | $10,143 | $10,273 | $9,980 | $10,051 |
| 4/30/2015 | $10,503 | $10,571 | $10,576 | $10,563 |
| 5/31/2015 | $10,431 | $10,557 | $10,635 | $10,626 |
| 6/30/2015 | $10,467 | $10,309 | $10,401 | $10,470 |
| 7/31/2015 | $10,539 | $10,398 | $10,203 | $10,454 |
| 8/31/2015 | $9,856 | $9,685 | $9,634 | $9,988 |
| 9/30/2015 | $9,856 | $9,334 | $9,359 | $9,629 |
| 10/31/2015 | $10,071 | $10,067 | $9,913 | $10,201 |
| 11/30/2015 | $10,431 | $9,984 | $9,842 | $10,179 |
| 12/31/2015 | $10,550 | $9,804 | $9,852 | $10,190 |
| 1/31/2016 | $10,098 | $9,213 | $9,097 | $9,414 |
| 2/29/2016 | $9,872 | $9,149 | $9,128 | $9,464 |
| 3/31/2016 | $10,776 | $9,827 | $9,920 | $10,251 |
| 4/30/2016 | $10,814 | $9,972 | $10,197 | $10,575 |
| 5/31/2016 | $10,927 | $9,985 | $10,130 | $10,588 |
| 6/30/2016 | $10,927 | $9,924 | $9,833 | $10,119 |
| 7/31/2016 | $11,304 | $10,352 | $10,380 | $10,721 |
| 8/31/2016 | $11,605 | $10,387 | $10,355 | $10,631 |
| 9/30/2016 | $12,095 | $10,451 | $10,611 | $10,929 |
| 10/31/2016 | $11,718 | $10,273 | $10,331 | $10,605 |
| 11/30/2016 | $10,965 | $10,351 | $10,025 | $10,343 |
| 12/31/2016 | $11,002 | $10,575 | $10,237 | $10,629 |
| 1/31/2017 | $11,342 | $10,864 | $10,630 | $11,012 |
| 2/28/2017 | $11,379 | $11,169 | $10,910 | $11,223 |
| 3/31/2017 | $11,794 | $11,305 | $11,136 | $11,438 |
| 4/30/2017 | $12,133 | $11,482 | $11,470 | $11,843 |
| 5/31/2017 | $12,660 | $11,735 | $11,781 | $12,232 |
| 6/30/2017 | $12,736 | $11,789 | $11,831 | $12,271 |
| 7/31/2017 | $13,037 | $12,118 | $12,248 | $12,703 |
| 8/31/2017 | $13,075 | $12,164 | $12,381 | $12,810 |
| 9/30/2017 | $13,075 | $12,399 | $12,647 | $13,161 |
| 10/31/2017 | $13,150 | $12,657 | $12,883 | $13,347 |
| 11/30/2017 | $13,527 | $12,902 | $13,075 | $13,536 |
| 12/31/2017 | $14,038 | $13,110 | $13,477 | $13,928 |
| 1/31/2018 | $14,562 | $13,850 | $14,140 | $14,578 |
| 2/28/2018 | $14,159 | $13,268 | $13,583 | $14,012 |
| 3/31/2018 | $14,280 | $12,984 | $13,429 | $13,858 |
| 4/30/2018 | $14,038 | $13,108 | $13,585 | $14,069 |
| 5/31/2018 | $14,239 | $13,124 | $13,447 | $13,970 |
| 6/30/2018 | $14,320 | $13,053 | $13,081 | $13,728 |
| 7/31/2018 | $14,159 | $13,447 | $13,172 | $13,806 |
| 8/31/2018 | $14,562 | $13,552 | $13,044 | $13,711 |
| 9/30/2018 | $14,441 | $13,611 | $12,883 | $13,611 |
| 10/31/2018 | $12,505 | $12,591 | $11,630 | $12,314 |
| 11/30/2018 | $13,029 | $12,776 | $11,659 | $12,193 |
| 12/31/2018 | $11,980 | $11,876 | $11,024 | $11,411 |
| 1/31/2019 | $12,892 | $12,813 | $11,888 | $12,379 |
| 2/28/2019 | $13,389 | $13,156 | $12,137 | $12,664 |
| 3/31/2019 | $13,596 | $13,322 | $12,156 | $12,658 |
| 4/30/2019 | $14,135 | $13,771 | $12,424 | $13,004 |
| 5/31/2019 | $14,218 | $12,954 | $11,783 | $12,321 |
| 6/30/2019 | $14,716 | $13,803 | $12,303 | $12,881 |
| 7/31/2019 | $14,591 | $13,843 | $12,221 | $12,824 |
| 8/31/2019 | $14,674 | $13,515 | $11,869 | $12,527 |
| 9/30/2019 | $14,674 | $13,799 | $12,157 | $12,846 |
| 10/31/2019 | $15,254 | $14,177 | $12,649 | $13,374 |
| 11/30/2019 | $15,545 | $14,523 | $12,861 | $13,678 |
| 12/31/2019 | $15,835 | $15,034 | $13,496 | $14,311 |
| 1/31/2020 | $15,750 | $14,868 | $13,075 | $13,897 |
| 2/29/2020 | $14,943 | $13,667 | $11,872 | $12,541 |
| 3/31/2020 | $12,863 | $11,822 | $9,581 | $10,248 |
| 4/30/2020 | $14,774 | $13,089 | $10,746 | $11,448 |
| 5/31/2020 | $16,642 | $13,658 | $11,397 | $12,250 |
| 6/30/2020 | $17,066 | $14,094 | $11,769 | $12,468 |
| 7/31/2020 | $18,000 | $14,840 | $12,357 | $12,947 |
| 8/31/2020 | $19,401 | $15,748 | $13,170 | $13,891 |
| 9/30/2020 | $19,698 | $15,240 | $13,003 | $13,730 |
| 10/31/2020 | $19,698 | $14,870 | $12,659 | $13,287 |
| 11/30/2020 | $21,057 | $16,703 | $14,410 | $15,116 |
| 12/31/2020 | $22,440 | $17,478 | $15,418 | $16,140 |
| 1/31/2021 | $22,353 | $17,399 | $15,391 | $16,099 |
| 2/28/2021 | $22,483 | $17,802 | $15,948 | $16,565 |
| 3/31/2021 | $21,963 | $18,277 | $16,271 | $16,927 |
| 4/30/2021 | $23,133 | $19,076 | $17,018 | $17,628 |
| 5/31/2021 | $22,743 | $19,373 | $17,412 | $18,024 |
| 6/30/2021 | $22,917 | $19,628 | $17,304 | $17,740 |
| 7/31/2021 | $22,960 | $19,764 | $17,443 | $18,009 |
| 8/31/2021 | $23,870 | $20,258 | $17,846 | $18,493 |
| 9/30/2021 | $22,787 | $19,421 | $17,304 | $17,868 |
| 10/31/2021 | $22,657 | $20,413 | $17,574 | $18,228 |
| 11/30/2021 | $21,877 | $19,921 | $16,704 | $17,208 |
| 12/31/2021 | $22,122 | $20,718 | $17,411 | $17,937 |
| 1/31/2022 | $18,741 | $19,701 | $16,324 | $16,711 |
| 2/28/2022 | $17,548 | $19,192 | $16,112 | $16,562 |
| 3/31/2022 | $17,200 | $19,607 | $16,276 | $16,641 |
| 4/30/2022 | $15,560 | $18,038 | $15,226 | $15,485 |
| 5/31/2022 | $15,510 | $18,059 | $15,085 | $15,381 |
| 6/30/2022 | $13,372 | $16,537 | $13,420 | $13,656 |
| 7/31/2022 | $14,864 | $17,692 | $14,196 | $14,588 |
| 8/31/2022 | $14,068 | $17,040 | $13,823 | $13,957 |
| 9/30/2022 | $12,478 | $15,409 | $12,297 | $12,365 |
| 10/31/2022 | $12,925 | $16,339 | $12,697 | $12,919 |
| 11/30/2022 | $14,565 | $17,606 | $13,910 | $14,160 |
| 12/31/2022 | $14,019 | $16,913 | $13,933 | $14,245 |
| 1/31/2023 | $14,814 | $18,126 | $14,937 | $15,335 |
| 2/28/2023 | $14,068 | $17,606 | $14,555 | $14,959 |
| 3/31/2023 | $14,267 | $18,149 | $14,588 | $14,956 |
| 4/30/2023 | $14,168 | $18,410 | $14,803 | $15,219 |
| 5/31/2023 | $13,720 | $18,213 | $14,392 | $14,587 |
| 6/30/2023 | $14,118 | $19,270 | $14,887 | $15,028 |
| 7/31/2023 | $14,466 | $19,976 | $15,643 | $15,708 |
| 8/31/2023 | $14,267 | $19,417 | $15,207 | $15,181 |
| 9/30/2023 | $13,522 | $18,615 | $14,634 | $14,506 |
| 10/31/2023 | $12,826 | $18,055 | $13,816 | $13,649 |
| 11/30/2023 | $14,416 | $19,721 | $15,153 | $14,972 |
| 12/31/2023 | $15,510 | $20,669 | $16,115 | $16,043 |
| 1/31/2024 | $15,212 | $20,790 | $15,839 | $15,769 |
| 2/29/2024 | $15,361 | $21,682 | $15,997 | $15,815 |
| 3/31/2024 | $15,361 | $22,363 | $16,455 | $16,457 |
| 4/30/2024 | $14,715 | $21,625 | $16,216 | $15,982 |
| 5/31/2024 | $15,411 | $22,503 | $16,741 | $16,682 |
| 6/30/2024 | $15,063 | $23,004 | $16,563 | $16,201 |
| 7/31/2024 | $15,759 | $23,375 | $17,194 | $17,102 |
| 8/31/2024 | $15,908 | $23,969 | $17,511 | $17,421 |
| 9/30/2024 | $16,256 | $24,526 | $18,037 | $17,893 |
Fund performance shown in this graph represents past performance, which is not necessarily indicative of how the Fund will perform in the future.
Average Total Returns (%)
| Fund | Wasatch International Opportunities Fund |
|---|
| Total Net Assets | $146,374,403 |
| # of Portfolio Holdings | 66 |
| Portfolio Turnover Rate | 25% |
| Total Advisory Fees Paid | $4,514,920 |
| Fund | 1 Year | 5 Years | 10 Years |
|---|
| Investor Class | 20.22% | 2.07% | 4.98% |
| MSCI AC World Index ex USA | 25.35% | 7.58% | 5.22% |
| MSCI AC World ex USA Small Cap Index | 23.25% | 8.21% | 6.08% |
| MSCI World ex USA Small Cap Index | 23.36% | 6.85% | 5.99% |
The performance graph and total returns table do not reflect the deduction of taxes a shareholder would pay on Fund distributions or the redemption of Fund shares.
What did the Fund invest in?
The Fund invested in a variety of equity and debt securities. Opportunities continue to fluctuate with the volatility of the market and as banks continue to encounter risks.
| Top 10 | Value |
| Japan Elevator Service Holdings Co. Ltd. | 4.5% |
| Vijaya Diagnostic Centre Pvt Ltd. | 3.8% |
| Hemnet Group AB | 3.8% |
| Nexus AG | 3.4% |
| Pro Medicus Ltd. | 3.4% |
| JTC PLC | 3.2% |
| Baltic Classifieds Group PLC | 3.0% |
| Mortgage Advice Bureau Holdings Ltd. | 2.7% |
| AJ Bell PLC | 2.5% |
| baudroie, Inc. | 2.5% |
| Industry | Value |
| Application Software | 12.1% |
| Diversified Support Services | 10.0% |
| Interactive Media & Services | 7.7% |
| Health Care Technology | 6.8% |
| Asset Management & Custody Banks | 6.5% |
| IT Consulting & Other Services | 4.4% |
| Commercial & Residential Mortgage Finance | 4.4% |
| Investment Banking & Brokerage | 4.2% |
| Research & Consulting Services | 4.0% |
| Human Resource & Employment Services | 3.9% |
Portfolio Compositions (%)
| Asset Type | Value |
| Common Stocks | 99.0% |
| Exchange-Traded Funds | 1.5% |
| Other Assets and Liabilities, Net | (0.5%) |
| Total | 100.0% |
In order to reduce expenses, we will deliver a single copy of prospectuses, proxies, financial reports and other communication to shareholders with the same residential address. If you would like to receive individual mailings, please call [800-551-1700] and we will begin sending you separate copies of these materials within 30 days after receiving your request.
ALPS Distributors, Inc. serves as the Fund’s distributor.
If you wish to view additional information about the Fund; including but not limited to financial statements or holdings, please visit www.wasatchglobal.com.
Phone: 800-551-1700
Email: shareholderservice@wasatchfunds.com
Wasatch International Opportunities Fund
Annual Shareholder Report
September 30, 2024
Wasatch International Select Fund
Institutional Class WGISX
Annual Shareholder Report
September 30, 2024
This Annual shareholder report contains important information about Wasatch International Select Fund for the period of October 1, 2023 to September 30, 2024. You can find additional information about the Fund at www.wasatchglobal.com. You can also request this information by contacting us at 800-551-1700.
What were the Fund costs for last year?
Annual Fund Operating Expenses
(based on a hypothetical $10,000 investment)
| Class Name | Costs of a $10,000 investment | Costs paid as a percentage of a $10,000 investment |
|---|
| Institutional Class | $100 | 0.90% |
How did the fund perform last year and what affected its performance?
During the 12 months ended September 30, 2024, international equities experienced large gains. Hopes that many central banks may be nearing the end of their monetary tightening cycles helped drive stocks higher.
While the Fund had significant gains, it still underperformed the benchmark MSCI EAFE Index. The underperformance was largely due to our stock selection in Japan. Within Japan, a value-oriented market also favored large-cap stocks for much of the period. This presented style headwinds for the Fund, which tends to focus on growth companies that are further down the market-cap spectrum. While those stylistic trends in Japan were a headwind for our relative performance during much of the period, those headwinds began to abate in the third quarter of 2024. Given the strong fundamentals many of our Japanese businesses have produced, we like the return potential of these stocks going forward, particularly if stylistic trends are no longer a headwind.
Total return based on a $10,000 investment.
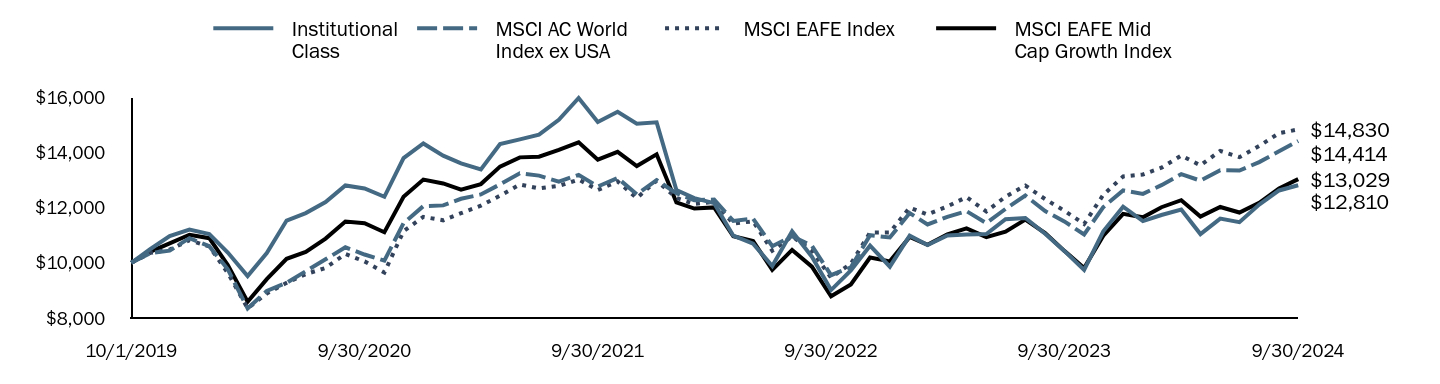
| Institutional Class | MSCI AC World Index ex USA | MSCI EAFE Index | MSCI EAFE Mid Cap Growth Index |
|---|
| 10/1/2019 | $10,000 | $10,000 | $10,000 | $10,000 |
| 10/31/2019 | $10,500 | $10,349 | $10,359 | $10,407 |
| 11/30/2019 | $10,970 | $10,440 | $10,476 | $10,705 |
| 12/31/2019 | $11,200 | $10,892 | $10,817 | $11,016 |
| 1/31/2020 | $11,040 | $10,600 | $10,591 | $10,891 |
| 2/29/2020 | $10,370 | $9,762 | $9,633 | $9,915 |
| 3/31/2020 | $9,520 | $8,348 | $8,348 | $8,589 |
| 4/30/2020 | $10,350 | $8,981 | $8,887 | $9,408 |
| 5/31/2020 | $11,530 | $9,275 | $9,274 | $10,143 |
| 6/30/2020 | $11,800 | $9,694 | $9,590 | $10,394 |
| 7/31/2020 | $12,200 | $10,126 | $9,813 | $10,876 |
| 8/31/2020 | $12,800 | $10,560 | $10,318 | $11,494 |
| 9/30/2020 | $12,690 | $10,300 | $10,049 | $11,435 |
| 10/31/2020 | $12,390 | $10,079 | $9,648 | $11,106 |
| 11/30/2020 | $13,790 | $11,434 | $11,144 | $12,389 |
| 12/31/2020 | $14,320 | $12,053 | $11,662 | $13,015 |
| 1/31/2021 | $13,880 | $12,079 | $11,538 | $12,873 |
| 2/28/2021 | $13,600 | $12,318 | $11,796 | $12,650 |
| 3/31/2021 | $13,380 | $12,474 | $12,068 | $12,850 |
| 4/30/2021 | $14,300 | $12,841 | $12,431 | $13,483 |
| 5/31/2021 | $14,470 | $13,242 | $12,836 | $13,818 |
| 6/30/2021 | $14,640 | $13,157 | $12,692 | $13,841 |
| 7/31/2021 | $15,180 | $12,940 | $12,787 | $14,088 |
| 8/31/2021 | $15,970 | $13,186 | $13,013 | $14,362 |
| 9/30/2021 | $15,100 | $12,764 | $12,635 | $13,736 |
| 10/31/2021 | $15,470 | $13,068 | $12,946 | $14,017 |
| 11/30/2021 | $15,040 | $12,480 | $12,343 | $13,504 |
| 12/31/2021 | $15,090 | $12,996 | $12,975 | $13,928 |
| 1/31/2022 | $12,630 | $12,517 | $12,348 | $12,185 |
| 2/28/2022 | $12,340 | $12,269 | $12,130 | $11,964 |
| 3/31/2022 | $12,160 | $12,288 | $12,208 | $12,005 |
| 4/30/2022 | $10,980 | $11,517 | $11,418 | $10,959 |
| 5/31/2022 | $10,690 | $11,599 | $11,504 | $10,789 |
| 6/30/2022 | $9,880 | $10,602 | $10,436 | $9,746 |
| 7/31/2022 | $11,140 | $10,965 | $10,957 | $10,467 |
| 8/31/2022 | $10,220 | $10,612 | $10,436 | $9,860 |
| 9/30/2022 | $9,010 | $9,551 | $9,460 | $8,785 |
| 10/31/2022 | $9,720 | $9,837 | $9,969 | $9,217 |
| 11/30/2022 | $10,620 | $10,998 | $11,091 | $10,192 |
| 12/31/2022 | $9,860 | $10,916 | $11,100 | $10,051 |
| 1/31/2023 | $10,980 | $11,801 | $11,999 | $10,938 |
| 2/28/2023 | $10,640 | $11,387 | $11,749 | $10,651 |
| 3/31/2023 | $10,990 | $11,665 | $12,040 | $11,034 |
| 4/30/2023 | $11,020 | $11,868 | $12,380 | $11,245 |
| 5/31/2023 | $11,040 | $11,436 | $11,856 | $10,927 |
| 6/30/2023 | $11,580 | $11,950 | $12,396 | $11,129 |
| 7/31/2023 | $11,620 | $12,435 | $12,797 | $11,567 |
| 8/31/2023 | $11,050 | $11,874 | $12,306 | $11,076 |
| 9/30/2023 | $10,430 | $11,499 | $11,886 | $10,431 |
| 10/31/2023 | $9,740 | $11,024 | $11,404 | $9,812 |
| 11/30/2023 | $11,140 | $12,017 | $12,463 | $10,983 |
| 12/31/2023 | $12,030 | $12,620 | $13,125 | $11,773 |
| 1/31/2024 | $11,510 | $12,495 | $13,200 | $11,647 |
| 2/29/2024 | $11,730 | $12,811 | $13,442 | $12,012 |
| 3/31/2024 | $11,930 | $13,212 | $13,884 | $12,266 |
| 4/30/2024 | $11,040 | $12,975 | $13,528 | $11,673 |
| 5/31/2024 | $11,600 | $13,351 | $14,052 | $12,022 |
| 6/30/2024 | $11,470 | $13,339 | $13,826 | $11,820 |
| 7/31/2024 | $12,110 | $13,647 | $14,231 | $12,173 |
| 8/31/2024 | $12,620 | $14,036 | $14,694 | $12,688 |
| 9/30/2024 | $12,810 | $14,414 | $14,830 | $13,029 |
Fund performance shown in this graph represents past performance, which is not necessarily indicative of how the Fund will perform in the future.
Average Total Returns (%)
| Fund | Wasatch International Select Fund |
|---|
| Total Net Assets | $3,967,335 |
| # of Portfolio Holdings | 31 |
| Portfolio Turnover Rate | 43% |
| Total Advisory Fees Paid | $0 |
| Fund | 1 Year | Since Inception 10/1/19 |
|---|
| Institutional Class | 22.82% | 5.08% |
| MSCI AC World Index ex USA | 25.35% | 7.58% |
| MSCI EAFE Index | 24.77% | 8.20% |
| MSCI EAFE Mid Cap Growth Index | 24.90% | 5.43% |
The performance graph and total returns table do not reflect the deduction of taxes a shareholder would pay on Fund distributions or the redemption of Fund shares.
What did the Fund invest in?
The Fund invested in a variety of equity and debt securities. Opportunities continue to fluctuate with the volatility of the market and as banks continue to encounter risks.
| Top 10 | Value |
| Dollarama, Inc. | 6.1% |
| Halma PLC | 6.0% |
| Definity Financial Corp. | 5.3% |
| REA Group Ltd. | 5.0% |
| Assa Abloy AB B | 5.0% |
| FirstService Corp. | 4.7% |
| Scout24 SE | 4.6% |
| Spotify Technology SA | 4.2% |
| Descartes Systems Group, Inc. | 4.2% |
| BayCurrent, Inc. | 3.9% |
| Industry | Value |
| Application Software | 11.5% |
| Interactive Media & Services | 9.6% |
| Building Products | 7.3% |
| Broadline Retail | 6.1% |
| Research & Consulting Services | 6.1% |
| Electronic Equipment & Instruments | 6.0% |
| Property & Casualty Insurance | 5.3% |
| Real Estate Services | 4.7% |
| Movies & Entertainment | 4.2% |
| Asset Management & Custody Banks | 3.9% |
Portfolio Compositions (%)
| Asset Type | Value |
| Common Stocks | 96.8% |
| Other Assets and Liabilities, Net | 3.2% |
| Total | 100.0% |
In order to reduce expenses, we will deliver a single copy of prospectuses, proxies, financial reports and other communication to shareholders with the same residential address. If you would like to receive individual mailings, please call [800-551-1700] and we will begin sending you separate copies of these materials within 30 days after receiving your request.
ALPS Distributors, Inc. serves as the Fund’s distributor.
If you wish to view additional information about the Fund; including but not limited to financial statements or holdings, please visit www.wasatchglobal.com.
Phone: 800-551-1700
Email: shareholderservice@wasatchfunds.com
Wasatch International Select Fund
Annual Shareholder Report
September 30, 2024
Wasatch International Select Fund
Annual Shareholder Report
September 30, 2024
This Annual shareholder report contains important information about Wasatch International Select Fund for the period of October 1, 2023 to September 30, 2024. You can find additional information about the Fund at www.wasatchglobal.com. You can also request this information by contacting us at 800-551-1700.
What were the Fund costs for last year?
Annual Fund Operating Expenses
(based on a hypothetical $10,000 investment)
| Class Name | Costs of a $10,000 investment | Costs paid as a percentage of a $10,000 investment |
|---|
| Investor Class | $145 | 1.30% |
How did the fund perform last year and what affected its performance?
During the 12 months ended September 30, 2024, international equities experienced large gains. Hopes that many central banks may be nearing the end of their monetary tightening cycles helped drive stocks higher.
While the Fund had significant gains, it still underperformed the benchmark MSCI EAFE Index. The underperformance was largely due to our stock selection in Japan. Within Japan, a value-oriented market also favored large-cap stocks for much of the period. This presented style headwinds for the Fund, which tends to focus on growth companies that are further down the market-cap spectrum. While those stylistic trends in Japan were a headwind for our relative performance during much of the period, those headwinds began to abate in the third quarter of 2024. Given the strong fundamentals many of our Japanese businesses have produced, we like the return potential of these stocks going forward, particularly if stylistic trends are no longer a headwind.
Total return based on a $10,000 investment.
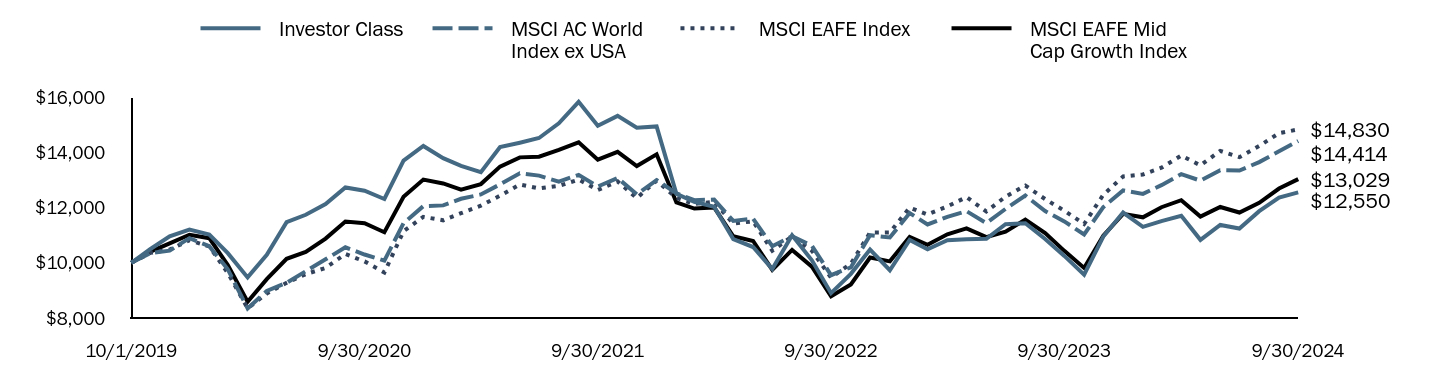
| Investor Class | MSCI AC World Index ex USA | MSCI EAFE Index | MSCI EAFE Mid Cap Growth Index |
|---|
| 10/1/2019 | $10,000 | $10,000 | $10,000 | $10,000 |
| 10/31/2019 | $10,500 | $10,349 | $10,359 | $10,407 |
| 11/30/2019 | $10,960 | $10,440 | $10,476 | $10,705 |
| 12/31/2019 | $11,200 | $10,892 | $10,817 | $11,016 |
| 1/31/2020 | $11,020 | $10,600 | $10,591 | $10,891 |
| 2/29/2020 | $10,350 | $9,762 | $9,633 | $9,915 |
| 3/31/2020 | $9,470 | $8,348 | $8,348 | $8,589 |
| 4/30/2020 | $10,290 | $8,981 | $8,887 | $9,408 |
| 5/31/2020 | $11,470 | $9,275 | $9,274 | $10,143 |
| 6/30/2020 | $11,740 | $9,694 | $9,590 | $10,394 |
| 7/31/2020 | $12,130 | $10,126 | $9,813 | $10,876 |
| 8/31/2020 | $12,730 | $10,560 | $10,318 | $11,494 |
| 9/30/2020 | $12,610 | $10,300 | $10,049 | $11,435 |
| 10/31/2020 | $12,310 | $10,079 | $9,648 | $11,106 |
| 11/30/2020 | $13,700 | $11,434 | $11,144 | $12,389 |
| 12/31/2020 | $14,230 | $12,053 | $11,662 | $13,015 |
| 1/31/2021 | $13,790 | $12,079 | $11,538 | $12,873 |
| 2/28/2021 | $13,510 | $12,318 | $11,796 | $12,650 |
| 3/31/2021 | $13,280 | $12,474 | $12,068 | $12,850 |
| 4/30/2021 | $14,190 | $12,841 | $12,431 | $13,483 |
| 5/31/2021 | $14,350 | $13,242 | $12,836 | $13,818 |
| 6/30/2021 | $14,520 | $13,157 | $12,692 | $13,841 |
| 7/31/2021 | $15,050 | $12,940 | $12,787 | $14,088 |
| 8/31/2021 | $15,830 | $13,186 | $13,013 | $14,362 |
| 9/30/2021 | $14,960 | $12,764 | $12,635 | $13,736 |
| 10/31/2021 | $15,320 | $13,068 | $12,946 | $14,017 |
| 11/30/2021 | $14,890 | $12,480 | $12,343 | $13,504 |
| 12/31/2021 | $14,940 | $12,996 | $12,975 | $13,928 |
| 1/31/2022 | $12,500 | $12,517 | $12,348 | $12,185 |
| 2/28/2022 | $12,210 | $12,269 | $12,130 | $11,964 |
| 3/31/2022 | $12,030 | $12,288 | $12,208 | $12,005 |
| 4/30/2022 | $10,860 | $11,517 | $11,418 | $10,959 |
| 5/31/2022 | $10,570 | $11,599 | $11,504 | $10,789 |
| 6/30/2022 | $9,770 | $10,602 | $10,436 | $9,746 |
| 7/31/2022 | $11,000 | $10,965 | $10,957 | $10,467 |
| 8/31/2022 | $10,090 | $10,612 | $10,436 | $9,860 |
| 9/30/2022 | $8,900 | $9,551 | $9,460 | $8,785 |
| 10/31/2022 | $9,600 | $9,837 | $9,969 | $9,217 |
| 11/30/2022 | $10,480 | $10,998 | $11,091 | $10,192 |
| 12/31/2022 | $9,730 | $10,916 | $11,100 | $10,051 |
| 1/31/2023 | $10,830 | $11,801 | $11,999 | $10,938 |
| 2/28/2023 | $10,490 | $11,387 | $11,749 | $10,651 |
| 3/31/2023 | $10,820 | $11,665 | $12,040 | $11,034 |
| 4/30/2023 | $10,850 | $11,868 | $12,380 | $11,245 |
| 5/31/2023 | $10,870 | $11,436 | $11,856 | $10,927 |
| 6/30/2023 | $11,400 | $11,950 | $12,396 | $11,129 |
| 7/31/2023 | $11,430 | $12,435 | $12,797 | $11,567 |
| 8/31/2023 | $10,860 | $11,874 | $12,306 | $11,076 |
| 9/30/2023 | $10,250 | $11,499 | $11,886 | $10,431 |
| 10/31/2023 | $9,570 | $11,024 | $11,404 | $9,812 |
| 11/30/2023 | $10,950 | $12,017 | $12,463 | $10,983 |
| 12/31/2023 | $11,820 | $12,620 | $13,125 | $11,773 |
| 1/31/2024 | $11,300 | $12,495 | $13,200 | $11,647 |
| 2/29/2024 | $11,510 | $12,811 | $13,442 | $12,012 |
| 3/31/2024 | $11,700 | $13,212 | $13,884 | $12,266 |
| 4/30/2024 | $10,830 | $12,975 | $13,528 | $11,673 |
| 5/31/2024 | $11,370 | $13,351 | $14,052 | $12,022 |
| 6/30/2024 | $11,240 | $13,339 | $13,826 | $11,820 |
| 7/31/2024 | $11,870 | $13,647 | $14,231 | $12,173 |
| 8/31/2024 | $12,360 | $14,036 | $14,694 | $12,688 |
| 9/30/2024 | $12,550 | $14,414 | $14,830 | $13,029 |
Fund performance shown in this graph represents past performance, which is not necessarily indicative of how the Fund will perform in the future.
Average Total Returns (%)
| Fund | Wasatch International Select Fund |
|---|
| Total Net Assets | $3,967,335 |
| # of Portfolio Holdings | 31 |
| Portfolio Turnover Rate | 43% |
| Total Advisory Fees Paid | $0 |
| Fund | 1 Year | Since Inception 10/1/19 |
|---|
| Investor Class | 22.44% | 4.65% |
| MSCI AC World Index ex USA | 25.35% | 7.58% |
| MSCI EAFE Index | 24.77% | 8.20% |
| MSCI EAFE Mid Cap Growth Index | 24.90% | 5.43% |
The performance graph and total returns table do not reflect the deduction of taxes a shareholder would pay on Fund distributions or the redemption of Fund shares.
What did the Fund invest in?
The Fund invested in a variety of equity and debt securities. Opportunities continue to fluctuate with the volatility of the market and as banks continue to encounter risks.
| Top 10 | Value |
| Dollarama, Inc. | 6.1% |
| Halma PLC | 6.0% |
| Definity Financial Corp. | 5.3% |
| REA Group Ltd. | 5.0% |
| Assa Abloy AB B | 5.0% |
| FirstService Corp. | 4.7% |
| Scout24 SE | 4.6% |
| Spotify Technology SA | 4.2% |
| Descartes Systems Group, Inc. | 4.2% |
| BayCurrent, Inc. | 3.9% |
| Industry | Value |
| Application Software | 11.5% |
| Interactive Media & Services | 9.6% |
| Building Products | 7.3% |
| Broadline Retail | 6.1% |
| Research & Consulting Services | 6.1% |
| Electronic Equipment & Instruments | 6.0% |
| Property & Casualty Insurance | 5.3% |
| Real Estate Services | 4.7% |
| Movies & Entertainment | 4.2% |
| Asset Management & Custody Banks | 3.9% |
Portfolio Compositions (%)
| Asset Type | Value |
| Common Stocks | 96.8% |
| Other Assets and Liabilities, Net | 3.2% |
| Total | 100.0% |
In order to reduce expenses, we will deliver a single copy of prospectuses, proxies, financial reports and other communication to shareholders with the same residential address. If you would like to receive individual mailings, please call [800-551-1700] and we will begin sending you separate copies of these materials within 30 days after receiving your request.
ALPS Distributors, Inc. serves as the Fund’s distributor.
If you wish to view additional information about the Fund; including but not limited to financial statements or holdings, please visit www.wasatchglobal.com.
Phone: 800-551-1700
Email: shareholderservice@wasatchfunds.com
Wasatch International Select Fund
Annual Shareholder Report
September 30, 2024
Wasatch Long/Short Alpha Fund
Institutional Class WGLSX
Annual Shareholder Report
September 30, 2024
This Annual shareholder report contains important information about Wasatch Long/Short Alpha Fund for the period of October 1, 2023 to September 30, 2024. You can find additional information about the Fund at www.wasatchglobal.com. You can also request this information by contacting us at 800-551-1700.
What were the Fund costs for last year?
Annual Fund Operating Expenses
(based on a hypothetical $10,000 investment)
| Class Name | Costs of a $10,000 investment | Costs paid as a percentage of a $10,000 investment |
|---|
| Institutional Class | $242 | 2.07% |
How did the fund perform last year and what affected its performance?
During the 12 months ended September 30, 2024, small-caps were up sharply, supported by a consensus view that the U.S. economy may achieve a soft landing and that interest-rate cuts could soon be on the way. The Federal Reserve eventually met those expectations when it lowered its benchmark federal-funds rate in September.
We seek to invest in a carefully considered combination of longs and shorts, aiming to reduce risk and keep the Fund’s volatility lower than that of the benchmark. As might be expected in the period’s strong up market, the Fund’s long positions drove its return, and it outperformed the benchmark Russell 2500™ Index—despite an overall loss from the portfolio’s short positions. Among industry groups, the Fund’s long positions posted gains in all but two segments, with the highest contributions coming from pharmaceuticals biotechnology & life sciences and health care equipment & services. On the short side, performance among industry groups was mixed, with capital goods and consumer services detracting the most.
Total return based on a $10,000 investment.
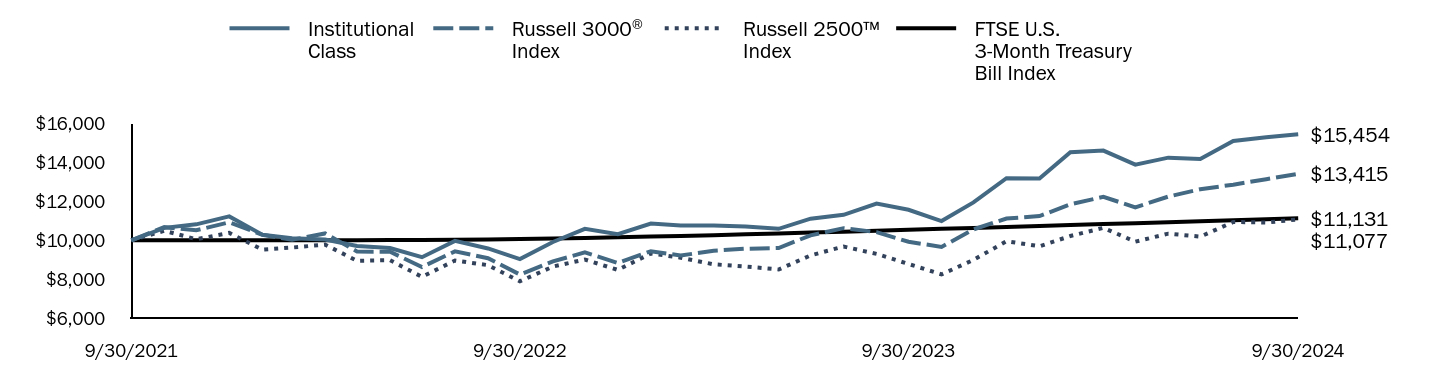
| Institutional Class | Russell 3000® Index | Russell 2500™ Index | FTSE U.S. 3-Month Treasury Bill Index |
|---|
| 9/30/2021 | $10,000 | $10,000 | $10,000 | $10,000 |
| 10/31/2021 | $10,640 | $10,676 | $10,490 | $10,000 |
| 11/30/2021 | $10,820 | $10,514 | $10,053 | $10,001 |
| 12/31/2021 | $11,230 | $10,928 | $10,382 | $10,001 |
| 1/31/2022 | $10,290 | $10,285 | $9,518 | $10,002 |
| 2/28/2022 | $10,110 | $10,026 | $9,625 | $10,002 |
| 3/31/2022 | $10,040 | $10,351 | $9,778 | $10,004 |
| 4/30/2022 | $9,710 | $9,422 | $8,945 | $10,007 |
| 5/31/2022 | $9,600 | $9,409 | $8,976 | $10,012 |
| 6/30/2022 | $9,130 | $8,622 | $8,118 | $10,018 |
| 7/31/2022 | $9,970 | $9,431 | $8,958 | $10,029 |
| 8/31/2022 | $9,580 | $9,079 | $8,720 | $10,044 |
| 9/30/2022 | $9,030 | $8,237 | $7,889 | $10,063 |
| 10/31/2022 | $9,910 | $8,913 | $8,646 | $10,088 |
| 11/30/2022 | $10,590 | $9,378 | $9,011 | $10,117 |
| 12/31/2022 | $10,310 | $8,829 | $8,475 | $10,151 |
| 1/31/2023 | $10,860 | $9,437 | $9,323 | $10,189 |
| 2/28/2023 | $10,760 | $9,216 | $9,104 | $10,224 |
| 3/31/2023 | $10,760 | $9,463 | $8,763 | $10,265 |
| 4/30/2023 | $10,710 | $9,564 | $8,648 | $10,306 |
| 5/31/2023 | $10,590 | $9,601 | $8,497 | $10,350 |
| 6/30/2023 | $11,110 | $10,256 | $9,220 | $10,394 |
| 7/31/2023 | $11,311 | $10,624 | $9,679 | $10,441 |
| 8/31/2023 | $11,891 | $10,419 | $9,299 | $10,490 |
| 9/30/2023 | $11,571 | $9,923 | $8,779 | $10,537 |
| 10/31/2023 | $10,990 | $9,660 | $8,246 | $10,587 |
| 11/30/2023 | $11,951 | $10,560 | $8,989 | $10,635 |
| 12/31/2023 | $13,192 | $11,121 | $9,952 | $10,685 |
| 1/31/2024 | $13,182 | $11,244 | $9,692 | $10,735 |
| 2/29/2024 | $14,534 | $11,852 | $10,219 | $10,782 |
| 3/31/2024 | $14,614 | $12,235 | $10,640 | $10,832 |
| 4/30/2024 | $13,893 | $11,696 | $9,928 | $10,880 |
| 5/31/2024 | $14,253 | $12,249 | $10,341 | $10,931 |
| 6/30/2024 | $14,183 | $12,628 | $10,186 | $10,980 |
| 7/31/2024 | $15,114 | $12,863 | $10,942 | $11,031 |
| 8/31/2024 | $15,304 | $13,143 | $10,914 | $11,082 |
| 9/30/2024 | $15,454 | $13,415 | $11,077 | $11,131 |
Fund performance shown in this graph represents past performance, which is not necessarily indicative of how the Fund will perform in the future.
Average Total Returns (%)
| Fund | Wasatch Long/Short Alpha Fund |
|---|
| Total Net Assets | $78,870,114 |
| # of Portfolio Holdings | 56 |
| Portfolio Turnover Rate | 41% |
| Total Advisory Fees Paid | $726,519 |
| Fund | 1 Year | Since Inception 10/1/21 |
|---|
| Institutional Class | 33.56% | 15.62% |
Russell 3000® Index | 35.19% | 10.29% |
| Russell 2500™ Index | 26.17% | 3.47% |
| FTSE U.S. 3-Month Treasury Bill Index | 5.63% | 3.63% |
The performance graph and total returns table do not reflect the deduction of taxes a shareholder would pay on Fund distributions or the redemption of Fund shares.
What did the Fund invest in?
The Fund invested in a variety of equity and debt securities. Opportunities continue to fluctuate with the volatility of the market and as banks continue to encounter risks.
| Top 10 | Value |
| Ensign Group, Inc. | 4.0% |
| Guidewire Software, Inc. | 3.9% |
| Kadant, Inc. | 3.7% |
| Floor & Decor Holdings, Inc. A | 3.2% |
| HealthEquity, Inc. | 3.2% |
| Hamilton Lane, Inc. A | 3.1% |
| Roper Technologies, Inc. | 2.9% |
| National Storage Affiliates Trust | 2.9% |
| RBC Bearings, Inc. | 2.9% |
| Morningstar, Inc. | 2.8% |
| Industry | Value |
| Application Software | 14.8% |
| Industrial Machinery & Supplies & Components | 6.5% |
| Financial Exchanges & Data | 5.0% |
| Health Care Facilities | 4.0% |
| Health Care Services | 4.0% |
| Electronic Manufacturing Services | 3.4% |
| Home Improvement Retail | 3.2% |
| Biotechnology | 3.2% |
| Managed Health Care | 3.2% |
| Pharmaceuticals | 3.2% |
Portfolio Compositions (%)
| Asset Type | Value |
| Common Stocks | 109.8% |
| Warrants | 0.1% |
| Other Assets and Liabilities, Net | (9.9%) |
| Total | 100.0% |
All tables above exclude securities sold short.
In order to reduce expenses, we will deliver a single copy of prospectuses, proxies, financial reports and other communication to shareholders with the same residential address. If you would like to receive individual mailings, please call [800-551-1700] and we will begin sending you separate copies of these materials within 30 days after receiving your request.
ALPS Distributors, Inc. serves as the Fund’s distributor.
If you wish to view additional information about the Fund; including but not limited to financial statements or holdings, please visit www.wasatchglobal.com.
Phone: 800-551-1700
Email: shareholderservice@wasatchfunds.com
Wasatch Long/Short Alpha Fund
Annual Shareholder Report
September 30, 2024
Wasatch Long/Short Alpha Fund
Annual Shareholder Report
September 30, 2024
This Annual shareholder report contains important information about Wasatch Long/Short Alpha Fund for the period of October 1, 2023 to September 30, 2024. You can find additional information about the Fund at www.wasatchglobal.com. You can also request this information by contacting us at 800-551-1700.
What were the Fund costs for last year?
Annual Fund Operating Expenses
(based on a hypothetical $10,000 investment)
| Class Name | Costs of a $10,000 investment | Costs paid as a percentage of a $10,000 investment |
|---|
| Investor Class | $258 | 2.21% |
How did the fund perform last year and what affected its performance?
During the 12 months ended September 30, 2024, small-caps were up sharply, supported by a consensus view that the U.S. economy may achieve a soft landing and that interest-rate cuts could soon be on the way. The Federal Reserve eventually met those expectations when it lowered its benchmark federal-funds rate in September.
We seek to invest in a carefully considered combination of longs and shorts, aiming to reduce risk and keep the Fund’s volatility lower than that of the benchmark. As might be expected in the period’s strong up market, the Fund’s long positions drove its return, and it outperformed the benchmark Russell 2500™ Index—despite an overall loss from the portfolio’s short positions. Among industry groups, the Fund’s long positions posted gains in all but two segments, with the highest contributions coming from pharmaceuticals biotechnology & life sciences and health care equipment & services. On the short side, performance among industry groups was mixed, with capital goods and consumer services detracting the most.
Total return based on a $10,000 investment.
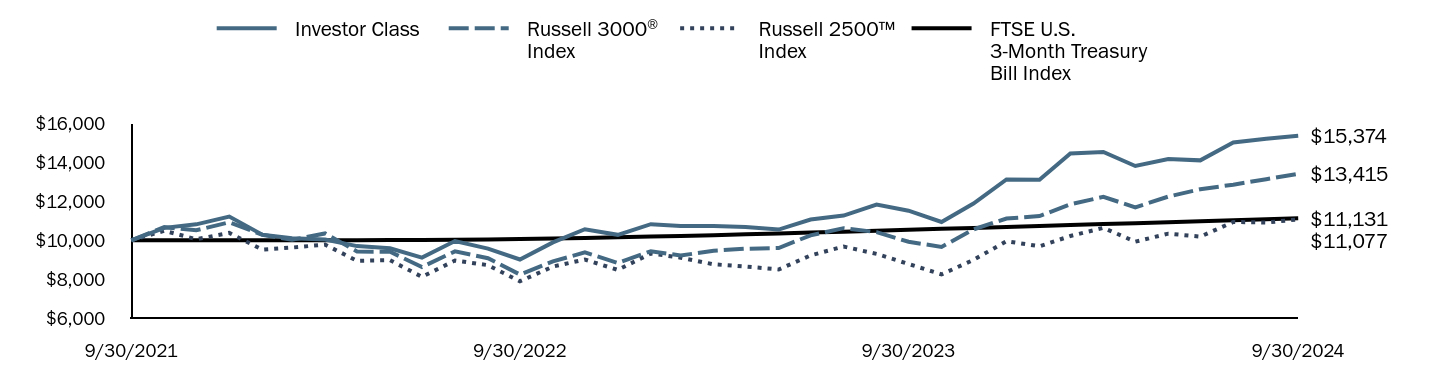
| Investor Class | Russell 3000® Index | Russell 2500™ Index | FTSE U.S. 3-Month Treasury Bill Index |
|---|
| 9/30/2021 | $10,000 | $10,000 | $10,000 | $10,000 |
| 10/31/2021 | $10,640 | $10,676 | $10,490 | $10,000 |
| 11/30/2021 | $10,820 | $10,514 | $10,053 | $10,001 |
| 12/31/2021 | $11,220 | $10,928 | $10,382 | $10,001 |
| 1/31/2022 | $10,290 | $10,285 | $9,518 | $10,002 |
| 2/28/2022 | $10,110 | $10,026 | $9,625 | $10,002 |
| 3/31/2022 | $10,040 | $10,351 | $9,778 | $10,004 |
| 4/30/2022 | $9,700 | $9,422 | $8,945 | $10,007 |
| 5/31/2022 | $9,590 | $9,409 | $8,976 | $10,012 |
| 6/30/2022 | $9,110 | $8,622 | $8,118 | $10,018 |
| 7/31/2022 | $9,960 | $9,431 | $8,958 | $10,029 |
| 8/31/2022 | $9,570 | $9,079 | $8,720 | $10,044 |
| 9/30/2022 | $9,010 | $8,237 | $7,889 | $10,063 |
| 10/31/2022 | $9,890 | $8,913 | $8,646 | $10,088 |
| 11/30/2022 | $10,570 | $9,378 | $9,011 | $10,117 |
| 12/31/2022 | $10,280 | $8,829 | $8,475 | $10,151 |
| 1/31/2023 | $10,830 | $9,437 | $9,323 | $10,189 |
| 2/28/2023 | $10,730 | $9,216 | $9,104 | $10,224 |
| 3/31/2023 | $10,730 | $9,463 | $8,763 | $10,265 |
| 4/30/2023 | $10,680 | $9,564 | $8,648 | $10,306 |
| 5/31/2023 | $10,550 | $9,601 | $8,497 | $10,350 |
| 6/30/2023 | $11,070 | $10,256 | $9,220 | $10,394 |
| 7/31/2023 | $11,271 | $10,624 | $9,679 | $10,441 |
| 8/31/2023 | $11,841 | $10,419 | $9,299 | $10,490 |
| 9/30/2023 | $11,521 | $9,923 | $8,779 | $10,537 |
| 10/31/2023 | $10,940 | $9,660 | $8,246 | $10,587 |
| 11/30/2023 | $11,891 | $10,560 | $8,989 | $10,635 |
| 12/31/2023 | $13,132 | $11,121 | $9,952 | $10,685 |
| 1/31/2024 | $13,112 | $11,244 | $9,692 | $10,735 |
| 2/29/2024 | $14,464 | $11,852 | $10,219 | $10,782 |
| 3/31/2024 | $14,544 | $12,235 | $10,640 | $10,832 |
| 4/30/2024 | $13,823 | $11,696 | $9,928 | $10,880 |
| 5/31/2024 | $14,183 | $12,249 | $10,341 | $10,931 |
| 6/30/2024 | $14,113 | $12,628 | $10,186 | $10,980 |
| 7/31/2024 | $15,034 | $12,863 | $10,942 | $11,031 |
| 8/31/2024 | $15,224 | $13,143 | $10,914 | $11,082 |
| 9/30/2024 | $15,374 | $13,415 | $11,077 | $11,131 |
Fund performance shown in this graph represents past performance, which is not necessarily indicative of how the Fund will perform in the future.
Average Total Returns (%)
| Fund | Wasatch Long/Short Alpha Fund |
|---|
| Total Net Assets | $78,870,114 |
| # of Portfolio Holdings | 56 |
| Portfolio Turnover Rate | 41% |
Total Advisory Fees Paid | $726,519 |
| Fund | 1 Year | Since Inception 10/1/21 |
|---|
| Investor Class | 33.45% | 15.42% |
Russell 3000® Index | 35.19% | 10.29% |
| Russell 2500™ Index | 26.17% | 3.47% |
| FTSE U.S. 3-Month Treasury Bill Index | 5.63% | 3.63% |
The performance graph and total returns table do not reflect the deduction of taxes a shareholder would pay on Fund distributions or the redemption of Fund shares.
What did the Fund invest in?
The Fund invested in a variety of equity and debt securities. Opportunities continue to fluctuate with the volatility of the market and as banks continue to encounter risks.
| Top 10 | Value |
| Ensign Group, Inc. | 4.0% |
| Guidewire Software, Inc. | 3.9% |
| Kadant, Inc. | 3.7% |
| Floor & Decor Holdings, Inc. A | 3.2% |
| HealthEquity, Inc. | 3.2% |
| Hamilton Lane, Inc. A | 3.1% |
| Roper Technologies, Inc. | 2.9% |
| National Storage Affiliates Trust | 2.9% |
| RBC Bearings, Inc. | 2.9% |
| Morningstar, Inc. | 2.8% |
| Industry | Value |
| Application Software | 14.8% |
| Industrial Machinery & Supplies & Components | 6.5% |
| Financial Exchanges & Data | 5.0% |
| Health Care Facilities | 4.0% |
| Health Care Services | 4.0% |
| Electronic Manufacturing Services | 3.4% |
| Home Improvement Retail | 3.2% |
| Biotechnology | 3.2% |
| Managed Health Care | 3.2% |
| Pharmaceuticals | 3.2% |
Portfolio Compositions (%)
| Asset Type | Value |
| Common Stocks | 109.8% |
| Warrants | 0.1% |
| Other Assets and Liabilities, Net | (9.9%) |
| Total | 100.0% |
All tables above exclude securities sold short.
In order to reduce expenses, we will deliver a single copy of prospectuses, proxies, financial reports and other communication to shareholders with the same residential address. If you would like to receive individual mailings, please call [800-551-1700] and we will begin sending you separate copies of these materials within 30 days after receiving your request.
ALPS Distributors, Inc. serves as the Fund’s distributor.
If you wish to view additional information about the Fund; including but not limited to financial statements or holdings, please visit www.wasatchglobal.com.
Phone: 800-551-1700
Email: shareholderservice@wasatchfunds.com
Wasatch Long/Short Alpha Fund
Annual Shareholder Report
September 30, 2024
Institutional Class WGICX
Annual Shareholder Report
September 30, 2024
This Annual shareholder report contains important information about Wasatch Micro Cap Fund for the period of October 1, 2023 to September 30, 2024. You can find additional information about the Fund at www.wasatchglobal.com. You can also request this information by contacting us at 800-551-1700.
What were the Fund costs for last year?
Annual Fund Operating Expenses
(based on a hypothetical $10,000 investment)
| Class Name | Costs of a $10,000 investment | Costs paid as a percentage of a $10,000 investment |
|---|
| Institutional Class | $185 | 1.59% |
How did the fund perform last year and what affected its performance?
During the 12 months ended September 30, 2024, micro-cap equities performed well amid rebounds in health care, signs of a still-robust economy and growing expectations that the Federal Reserve would cut interest rates toward the end of 2024, which it eventually did in September.
Amid this backdrop, the Fund outperformed the benchmark Russell Microcap® Growth Index, due in part to maintaining a balanced and diversified portfolio positioned for various economic outcomes—for example, balancing defensive health-care companies with more cyclical consumer and industrial names. Our goal is not to force our investments to fit any macro theme. Instead, we let our company-specific research drive our investments. During the period, the Fund’s stock selection in the information-technology and health-care sectors provided the largest source of outperformance compared to the benchmark, while its holdings in consumer discretionary and industrials didn’t keep pace and detracted.
Total return based on a $10,000 investment.
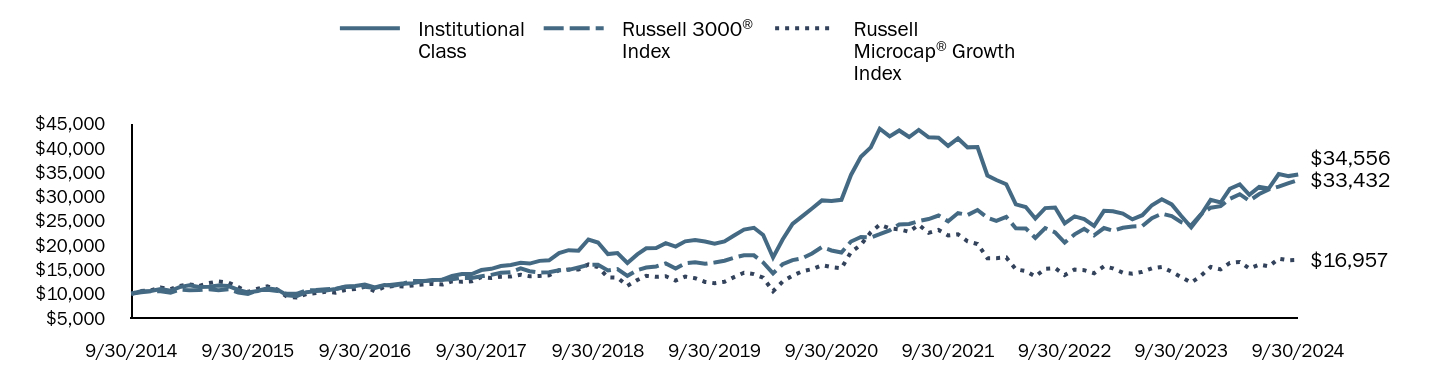
| Institutional Class | Russell 3000® Index | Russell Microcap® Growth Index |
|---|
| 9/30/2014 | $10,000 | $10,000 | $10,000 |
| 10/31/2014 | $10,516 | $10,275 | $10,569 |
| 11/30/2014 | $10,571 | $10,524 | $10,665 |
| 12/31/2014 | $10,970 | $10,524 | $11,291 |
| 1/31/2015 | $10,601 | $10,231 | $10,920 |
| 2/28/2015 | $11,368 | $10,824 | $11,595 |
| 3/31/2015 | $11,723 | $10,713 | $11,923 |
| 4/30/2015 | $11,368 | $10,762 | $11,584 |
| 5/31/2015 | $11,453 | $10,911 | $12,188 |
| 6/30/2015 | $11,666 | $10,728 | $12,530 |
| 7/31/2015 | $11,567 | $10,908 | $12,290 |
| 8/31/2015 | $10,771 | $10,249 | $11,349 |
| 9/30/2015 | $10,245 | $9,951 | $10,368 |
| 10/31/2015 | $10,572 | $10,736 | $11,017 |
| 11/30/2015 | $11,112 | $10,796 | $11,535 |
| 12/31/2015 | $10,847 | $10,574 | $10,856 |
| 1/31/2016 | $9,689 | $9,978 | $9,333 |
| 2/29/2016 | $9,508 | $9,975 | $9,243 |
| 3/31/2016 | $10,301 | $10,677 | $9,902 |
| 4/30/2016 | $10,533 | $10,743 | $10,143 |
| 5/31/2016 | $10,681 | $10,935 | $10,409 |
| 6/30/2016 | $10,963 | $10,958 | $10,216 |
| 7/31/2016 | $11,475 | $11,393 | $10,769 |
| 8/31/2016 | $11,591 | $11,422 | $10,982 |
| 9/30/2016 | $11,889 | $11,440 | $11,433 |
| 10/31/2016 | $11,310 | $11,192 | $10,507 |
| 11/30/2016 | $11,806 | $11,693 | $11,377 |
| 12/31/2016 | $11,692 | $11,921 | $11,600 |
| 1/31/2017 | $12,053 | $12,145 | $11,473 |
| 2/28/2017 | $12,180 | $12,597 | $11,709 |
| 3/31/2017 | $12,541 | $12,606 | $11,906 |
| 4/30/2017 | $12,848 | $12,739 | $12,037 |
| 5/31/2017 | $12,884 | $12,870 | $11,884 |
| 6/30/2017 | $13,661 | $12,986 | $12,536 |
| 7/31/2017 | $14,041 | $13,231 | $12,467 |
| 8/31/2017 | $14,041 | $13,256 | $12,566 |
| 9/30/2017 | $14,872 | $13,579 | $13,408 |
| 10/31/2017 | $15,125 | $13,876 | $13,234 |
| 11/30/2017 | $15,703 | $14,297 | $13,498 |
| 12/31/2017 | $15,908 | $14,440 | $13,532 |
| 1/31/2018 | $16,366 | $15,201 | $13,918 |
| 2/28/2018 | $16,199 | $14,641 | $13,597 |
| 3/31/2018 | $16,761 | $14,347 | $13,666 |
| 4/30/2018 | $16,865 | $14,402 | $13,788 |
| 5/31/2018 | $18,364 | $14,808 | $14,834 |
| 6/30/2018 | $18,968 | $14,905 | $14,997 |
| 7/31/2018 | $18,864 | $15,400 | $14,990 |
| 8/31/2018 | $21,155 | $15,940 | $16,041 |
| 9/30/2018 | $20,530 | $15,967 | $15,470 |
| 10/31/2018 | $18,156 | $14,791 | $13,378 |
| 11/30/2018 | $18,364 | $15,087 | $13,313 |
| 12/31/2018 | $16,317 | $13,683 | $11,613 |
| 1/31/2019 | $18,087 | $14,858 | $12,821 |
| 2/28/2019 | $19,340 | $15,380 | $13,672 |
| 3/31/2019 | $19,395 | $15,605 | $13,471 |
| 4/30/2019 | $20,403 | $16,228 | $13,591 |
| 5/31/2019 | $19,695 | $15,178 | $12,721 |
| 6/30/2019 | $20,784 | $16,244 | $13,529 |
| 7/31/2019 | $21,057 | $16,485 | $13,197 |
| 8/31/2019 | $20,730 | $16,149 | $12,426 |
| 9/30/2019 | $20,294 | $16,433 | $12,169 |
| 10/31/2019 | $20,757 | $16,786 | $12,465 |
| 11/30/2019 | $21,983 | $17,424 | $13,415 |
| 12/31/2019 | $23,207 | $17,928 | $14,322 |
| 1/31/2020 | $23,573 | $17,908 | $14,040 |
| 2/29/2020 | $22,080 | $16,442 | $13,298 |
| 3/31/2020 | $17,451 | $14,181 | $10,513 |
| 4/30/2020 | $21,167 | $16,059 | $12,500 |
| 5/31/2020 | $24,365 | $16,918 | $13,717 |
| 6/30/2020 | $25,918 | $17,304 | $14,596 |
| 7/31/2020 | $27,532 | $18,287 | $15,052 |
| 8/31/2020 | $29,207 | $19,612 | $15,871 |
| 9/30/2020 | $29,085 | $18,898 | $15,480 |
| 10/31/2020 | $29,329 | $18,490 | $15,251 |
| 11/30/2020 | $34,446 | $20,739 | $18,544 |
| 12/31/2020 | $38,196 | $21,672 | $20,069 |
| 1/31/2021 | $40,128 | $21,576 | $22,651 |
| 2/28/2021 | $43,961 | $22,250 | $24,212 |
| 3/31/2021 | $42,383 | $23,048 | $23,453 |
| 4/30/2021 | $43,607 | $24,236 | $23,245 |
| 5/31/2021 | $42,254 | $24,346 | $22,752 |
| 6/30/2021 | $43,703 | $24,947 | $24,198 |
| 7/31/2021 | $42,190 | $25,369 | $22,531 |
| 8/31/2021 | $42,093 | $26,092 | $23,135 |
| 9/30/2021 | $40,418 | $24,921 | $21,999 |
| 10/31/2021 | $41,964 | $26,607 | $22,221 |
| 11/30/2021 | $40,128 | $26,202 | $20,780 |
| 12/31/2021 | $40,208 | $27,234 | $20,246 |
| 1/31/2022 | $34,342 | $25,631 | $17,308 |
| 2/28/2022 | $33,400 | $24,986 | $17,325 |
| 3/31/2022 | $32,544 | $25,796 | $17,471 |
| 4/30/2022 | $28,390 | $23,481 | $15,022 |
| 5/31/2022 | $27,833 | $23,450 | $14,661 |
| 6/30/2022 | $25,478 | $21,488 | $13,557 |
| 7/31/2022 | $27,619 | $23,504 | $15,149 |
| 8/31/2022 | $27,748 | $22,627 | $15,273 |
| 9/30/2022 | $24,493 | $20,528 | $13,848 |
| 10/31/2022 | $25,906 | $22,212 | $14,975 |
| 11/30/2022 | $25,350 | $23,371 | $14,845 |
| 12/31/2022 | $23,937 | $22,003 | $14,221 |
| 1/31/2023 | $27,063 | $23,518 | $15,651 |
| 2/28/2023 | $26,977 | $22,968 | $15,220 |
| 3/31/2023 | $26,506 | $23,583 | $14,329 |
| 4/30/2023 | $25,307 | $23,834 | $14,134 |
| 5/31/2023 | $26,163 | $23,927 | $14,490 |
| 6/30/2023 | $28,219 | $25,560 | $15,239 |
| 7/31/2023 | $29,461 | $26,477 | $15,497 |
| 8/31/2023 | $28,390 | $25,966 | $14,517 |
| 9/30/2023 | $25,992 | $24,729 | $13,418 |
| 10/31/2023 | $23,680 | $24,073 | $12,287 |
| 11/30/2023 | $26,206 | $26,318 | $13,649 |
| 12/31/2023 | $29,332 | $27,714 | $15,516 |
| 1/31/2024 | $28,775 | $28,021 | $15,011 |
| 2/29/2024 | $31,602 | $29,538 | $16,335 |
| 3/31/2024 | $32,501 | $30,491 | $16,541 |
| 4/30/2024 | $30,360 | $29,149 | $15,205 |
| 5/31/2024 | $31,987 | $30,526 | $15,999 |
| 6/30/2024 | $31,687 | $31,471 | $15,619 |
| 7/31/2024 | $34,642 | $32,056 | $17,212 |
| 8/31/2024 | $34,214 | $32,754 | $16,885 |
| 9/30/2024 | $34,556 | $33,432 | $16,957 |
Fund performance shown in this graph represents past performance, which is not necessarily indicative of how the Fund will perform in the future.
Average Total Returns (%)
| Fund | Wasatch Micro Cap Fund |
|---|
| Total Net Assets | $681,895,383 |
| # of Portfolio Holdings | 73 |
| Portfolio Turnover Rate | 51% |
| Total Advisory Fees Paid | $9,345,940 |
| Fund | 1 Year | 5 Years | 10 Years |
|---|
| Institutional Class | 32.95% | 11.23% | 13.20% |
Russell 3000® Index | 35.19% | 15.26% | 12.83% |
Russell Microcap® Growth Index | 26.38% | 6.86% | 5.42% |
The performance graph and total returns table do not reflect the deduction of taxes a shareholder would pay on Fund distributions or the redemption of Fund shares.
What did the Fund invest in?
The Fund invested in a variety of equity and debt securities. Opportunities continue to fluctuate with the volatility of the market and as banks continue to encounter risks.
| Top 10 | Value |
| Esquire Financial Holdings, Inc. | 3.6% |
| Pennant Group, Inc. | 3.2% |
| Addus HomeCare Corp. | 3.1% |
| GCM Grosvenor, Inc. A | 3.1% |
| Agilysys, Inc. | 2.4% |
| Weave Communications, Inc. | 2.3% |
| Grid Dynamics Holdings, Inc. | 2.3% |
| Mama's Creations, Inc. | 2.3% |
| UFP Technologies, Inc. | 2.2% |
| Veeco Instruments, Inc. | 2.1% |
| Industry | Value |
| Application Software | 7.4% |
| Health Care Services | 7.3% |
| Biotechnology | 5.7% |
| Industrial Machinery & Supplies & Components | 5.0% |
| Packaged Foods & Meats | 4.8% |
| Construction & Engineering | 4.0% |
| Electronic Equipment & Instruments | 3.8% |
| Semiconductor Materials & Equipment | 3.6% |
| Regional Banks | 3.6% |
| Health Care Supplies | 3.2% |
Portfolio Compositions (%)
| Asset Type | Value |
| Common Stocks | 96.7% |
| Preferred Stocks | 1.3% |
| Warrants | 0.1% |
| Other Assets and Liabilities, Net | 1.9% |
| Total | 100.0% |
In order to reduce expenses, we will deliver a single copy of prospectuses, proxies, financial reports and other communication to shareholders with the same residential address. If you would like to receive individual mailings, please call [800-551-1700] and we will begin sending you separate copies of these materials within 30 days after receiving your request.
ALPS Distributors, Inc. serves as the Fund’s distributor.
If you wish to view additional information about the Fund; including but not limited to financial statements or holdings, please visit www.wasatchglobal.com.
Phone: 800-551-1700
Email: shareholderservice@wasatchfunds.com
Annual Shareholder Report
September 30, 2024
Annual Shareholder Report
September 30, 2024
This Annual shareholder report contains important information about Wasatch Micro Cap Fund for the period of October 1, 2023 to September 30, 2024. You can find additional information about the Fund at www.wasatchglobal.com. You can also request this information by contacting us at 800-551-1700.
What were the Fund costs for last year?
Annual Fund Operating Expenses
(based on a hypothetical $10,000 investment)
| Class Name | Costs of a $10,000 investment | Costs paid as a percentage of a $10,000 investment |
|---|
| Investor Class | $193 | 1.66% |
How did the fund perform last year and what affected its performance?
During the 12 months ended September 30, 2024, micro-cap equities performed well amid rebounds in health care, signs of a still-robust economy and growing expectations that the Federal Reserve would cut interest rates toward the end of 2024, which it eventually did in September.
Amid this backdrop, the Fund outperformed the benchmark Russell Microcap® Growth Index, due in part to maintaining a balanced and diversified portfolio positioned for various economic outcomes—for example, balancing defensive health-care companies with more cyclical consumer and industrial names. Our goal is not to force our investments to fit any macro theme. Instead, we let our company-specific research drive our investments. During the period, the Fund’s stock selection in the information-technology and health-care sectors provided the largest source of outperformance compared to the benchmark, while its holdings in consumer discretionary and industrials didn’t keep pace and detracted.
Total return based on a $10,000 investment.
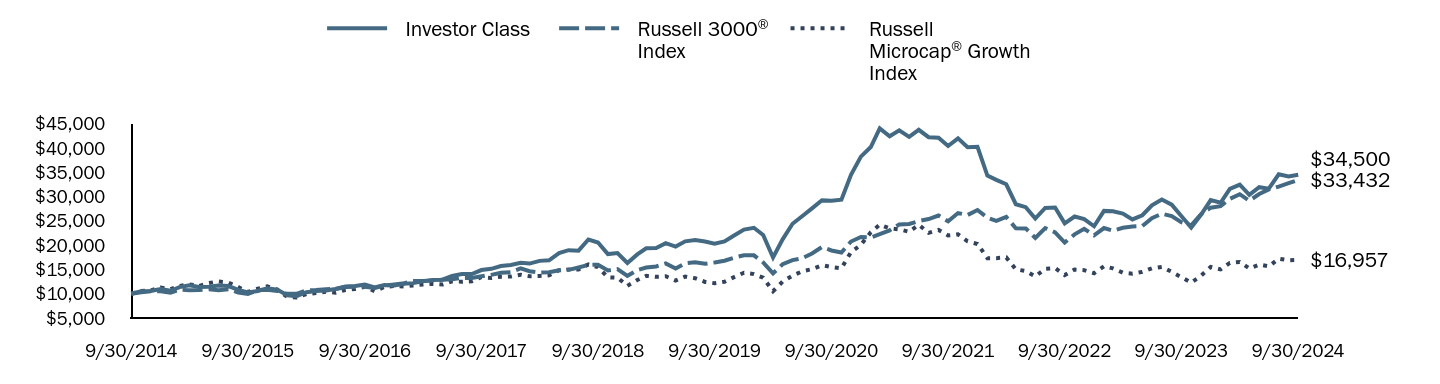
| Investor Class | Russell 3000® Index | Russell Microcap® Growth Index |
|---|
| 9/30/2014 | $10,000 | $10,000 | $10,000 |
| 10/31/2014 | $10,516 | $10,275 | $10,569 |
| 11/30/2014 | $10,571 | $10,524 | $10,665 |
| 12/31/2014 | $10,970 | $10,524 | $11,291 |
| 1/31/2015 | $10,601 | $10,231 | $10,920 |
| 2/28/2015 | $11,368 | $10,824 | $11,595 |
| 3/31/2015 | $11,723 | $10,713 | $11,923 |
| 4/30/2015 | $11,368 | $10,762 | $11,584 |
| 5/31/2015 | $11,453 | $10,911 | $12,188 |
| 6/30/2015 | $11,666 | $10,728 | $12,530 |
| 7/31/2015 | $11,567 | $10,908 | $12,290 |
| 8/31/2015 | $10,771 | $10,249 | $11,349 |
| 9/30/2015 | $10,245 | $9,951 | $10,368 |
| 10/31/2015 | $10,572 | $10,736 | $11,017 |
| 11/30/2015 | $11,112 | $10,796 | $11,535 |
| 12/31/2015 | $10,847 | $10,574 | $10,856 |
| 1/31/2016 | $9,689 | $9,978 | $9,333 |
| 2/29/2016 | $9,508 | $9,975 | $9,243 |
| 3/31/2016 | $10,301 | $10,677 | $9,902 |
| 4/30/2016 | $10,533 | $10,743 | $10,143 |
| 5/31/2016 | $10,681 | $10,935 | $10,409 |
| 6/30/2016 | $10,963 | $10,958 | $10,216 |
| 7/31/2016 | $11,475 | $11,393 | $10,769 |
| 8/31/2016 | $11,591 | $11,422 | $10,982 |
| 9/30/2016 | $11,889 | $11,440 | $11,433 |
| 10/31/2016 | $11,310 | $11,192 | $10,507 |
| 11/30/2016 | $11,806 | $11,693 | $11,377 |
| 12/31/2016 | $11,692 | $11,921 | $11,600 |
| 1/31/2017 | $12,053 | $12,145 | $11,473 |
| 2/28/2017 | $12,180 | $12,597 | $11,709 |
| 3/31/2017 | $12,541 | $12,606 | $11,906 |
| 4/30/2017 | $12,848 | $12,739 | $12,037 |
| 5/31/2017 | $12,884 | $12,870 | $11,884 |
| 6/30/2017 | $13,661 | $12,986 | $12,536 |
| 7/31/2017 | $14,041 | $13,231 | $12,467 |
| 8/31/2017 | $14,041 | $13,256 | $12,566 |
| 9/30/2017 | $14,872 | $13,579 | $13,408 |
| 10/31/2017 | $15,125 | $13,876 | $13,234 |
| 11/30/2017 | $15,703 | $14,297 | $13,498 |
| 12/31/2017 | $15,908 | $14,440 | $13,532 |
| 1/31/2018 | $16,366 | $15,201 | $13,918 |
| 2/28/2018 | $16,199 | $14,641 | $13,597 |
| 3/31/2018 | $16,761 | $14,347 | $13,666 |
| 4/30/2018 | $16,865 | $14,402 | $13,788 |
| 5/31/2018 | $18,364 | $14,808 | $14,834 |
| 6/30/2018 | $18,968 | $14,905 | $14,997 |
| 7/31/2018 | $18,864 | $15,400 | $14,990 |
| 8/31/2018 | $21,155 | $15,940 | $16,041 |
| 9/30/2018 | $20,530 | $15,967 | $15,470 |
| 10/31/2018 | $18,156 | $14,791 | $13,378 |
| 11/30/2018 | $18,364 | $15,087 | $13,313 |
| 12/31/2018 | $16,317 | $13,683 | $11,613 |
| 1/31/2019 | $18,087 | $14,858 | $12,821 |
| 2/28/2019 | $19,340 | $15,380 | $13,672 |
| 3/31/2019 | $19,395 | $15,605 | $13,471 |
| 4/30/2019 | $20,403 | $16,228 | $13,591 |
| 5/31/2019 | $19,695 | $15,178 | $12,721 |
| 6/30/2019 | $20,784 | $16,244 | $13,529 |
| 7/31/2019 | $21,057 | $16,485 | $13,197 |
| 8/31/2019 | $20,730 | $16,149 | $12,426 |
| 9/30/2019 | $20,294 | $16,433 | $12,169 |
| 10/31/2019 | $20,757 | $16,786 | $12,465 |
| 11/30/2019 | $21,983 | $17,424 | $13,415 |
| 12/31/2019 | $23,207 | $17,928 | $14,322 |
| 1/31/2020 | $23,573 | $17,908 | $14,040 |
| 2/29/2020 | $22,080 | $16,442 | $13,298 |
| 3/31/2020 | $17,451 | $14,181 | $10,513 |
| 4/30/2020 | $21,197 | $16,059 | $12,500 |
| 5/31/2020 | $24,395 | $16,918 | $13,717 |
| 6/30/2020 | $25,948 | $17,304 | $14,596 |
| 7/31/2020 | $27,563 | $18,287 | $15,052 |
| 8/31/2020 | $29,238 | $19,612 | $15,871 |
| 9/30/2020 | $29,116 | $18,898 | $15,480 |
| 10/31/2020 | $29,359 | $18,490 | $15,251 |
| 11/30/2020 | $34,476 | $20,739 | $18,544 |
| 12/31/2020 | $38,225 | $21,672 | $20,069 |
| 1/31/2021 | $40,189 | $21,576 | $22,651 |
| 2/28/2021 | $44,021 | $22,250 | $24,212 |
| 3/31/2021 | $42,411 | $23,048 | $23,453 |
| 4/30/2021 | $43,635 | $24,236 | $23,245 |
| 5/31/2021 | $42,282 | $24,346 | $22,752 |
| 6/30/2021 | $43,731 | $24,947 | $24,198 |
| 7/31/2021 | $42,218 | $25,369 | $22,531 |
| 8/31/2021 | $42,121 | $26,092 | $23,135 |
| 9/30/2021 | $40,415 | $24,921 | $21,999 |
| 10/31/2021 | $41,992 | $26,607 | $22,221 |
| 11/30/2021 | $40,157 | $26,202 | $20,780 |
| 12/31/2021 | $40,236 | $27,234 | $20,246 |
| 1/31/2022 | $34,329 | $25,631 | $17,308 |
| 2/28/2022 | $33,430 | $24,986 | $17,325 |
| 3/31/2022 | $32,531 | $25,796 | $17,471 |
| 4/30/2022 | $28,422 | $23,481 | $15,022 |
| 5/31/2022 | $27,823 | $23,450 | $14,661 |
| 6/30/2022 | $25,469 | $21,488 | $13,557 |
| 7/31/2022 | $27,652 | $23,504 | $15,149 |
| 8/31/2022 | $27,737 | $22,627 | $15,273 |
| 9/30/2022 | $24,484 | $20,528 | $13,848 |
| 10/31/2022 | $25,897 | $22,212 | $14,975 |
| 11/30/2022 | $25,340 | $23,371 | $14,845 |
| 12/31/2022 | $23,885 | $22,003 | $14,221 |
| 1/31/2023 | $27,052 | $23,518 | $15,651 |
| 2/28/2023 | $26,967 | $22,968 | $15,220 |
| 3/31/2023 | $26,496 | $23,583 | $14,329 |
| 4/30/2023 | $25,297 | $23,834 | $14,134 |
| 5/31/2023 | $26,154 | $23,927 | $14,490 |
| 6/30/2023 | $28,208 | $25,560 | $15,239 |
| 7/31/2023 | $29,407 | $26,477 | $15,497 |
| 8/31/2023 | $28,337 | $25,966 | $14,517 |
| 9/30/2023 | $25,982 | $24,729 | $13,418 |
| 10/31/2023 | $23,628 | $24,073 | $12,287 |
| 11/30/2023 | $26,196 | $26,318 | $13,649 |
| 12/31/2023 | $29,278 | $27,714 | $15,516 |
| 1/31/2024 | $28,722 | $28,021 | $15,011 |
| 2/29/2024 | $31,590 | $29,538 | $16,335 |
| 3/31/2024 | $32,446 | $30,491 | $16,541 |
| 4/30/2024 | $30,348 | $29,149 | $15,205 |
| 5/31/2024 | $31,932 | $30,526 | $15,999 |
| 6/30/2024 | $31,633 | $31,471 | $15,619 |
| 7/31/2024 | $34,586 | $32,056 | $17,212 |
| 8/31/2024 | $34,158 | $32,754 | $16,885 |
| 9/30/2024 | $34,500 | $33,432 | $16,957 |
Fund performance shown in this graph represents past performance, which is not necessarily indicative of how the Fund will perform in the future.
Average Total Returns (%)
| Fund | Wasatch Micro Cap Fund |
|---|
| Total Net Assets | $681,895,383 |
| # of Portfolio Holdings | 73 |
| Portfolio Turnover Rate | 51% |
| Total Advisory Fees Paid | $9,345,940 |
| Fund | 1 Year | 5 Years | 10 Years |
|---|
| Investor Class | 32.78% | 11.20% | 13.18% |
Russell 3000® Index | 35.19% | 15.26% | 12.83% |
Russell Microcap® Growth Index | 26.38% | 6.86% | 5.42% |
The performance graph and total returns table do not reflect the deduction of taxes a shareholder would pay on Fund distributions or the redemption of Fund shares.
What did the Fund invest in?
The Fund invested in a variety of equity and debt securities. Opportunities continue to fluctuate with the volatility of the market and as banks continue to encounter risks.
| Top 10 | Value |
| Esquire Financial Holdings, Inc. | 3.6% |
| Pennant Group, Inc. | 3.2% |
| Addus HomeCare Corp. | 3.1% |
| GCM Grosvenor, Inc. A | 3.1% |
| Agilysys, Inc. | 2.4% |
| Weave Communications, Inc. | 2.3% |
| Grid Dynamics Holdings, Inc. | 2.3% |
| Mama's Creations, Inc. | 2.3% |
| UFP Technologies, Inc. | 2.2% |
| Veeco Instruments, Inc. | 2.1% |
| Industry | Value |
| Application Software | 7.4% |
| Health Care Services | 7.3% |
| Biotechnology | 5.7% |
| Industrial Machinery & Supplies & Components | 5.0% |
| Packaged Foods & Meats | 4.8% |
| Construction & Engineering | 4.0% |
| Electronic Equipment & Instruments | 3.8% |
| Semiconductor Materials & Equipment | 3.6% |
| Regional Banks | 3.6% |
| Health Care Supplies | 3.2% |
Portfolio Compositions (%)
| Asset Type | Value |
| Common Stocks | 96.7% |
| Preferred Stocks | 1.3% |
| Warrants | 0.1% |
| Other Assets and Liabilities, Net | 1.9% |
| Total | 100.0% |
In order to reduce expenses, we will deliver a single copy of prospectuses, proxies, financial reports and other communication to shareholders with the same residential address. If you would like to receive individual mailings, please call [800-551-1700] and we will begin sending you separate copies of these materials within 30 days after receiving your request.
ALPS Distributors, Inc. serves as the Fund’s distributor.
If you wish to view additional information about the Fund; including but not limited to financial statements or holdings, please visit www.wasatchglobal.com.
Phone: 800-551-1700
Email: shareholderservice@wasatchfunds.com
Annual Shareholder Report
September 30, 2024
Wasatch Micro Cap Value Fund
Institutional Class WGMVX
Annual Shareholder Report
September 30, 2024
This Annual shareholder report contains important information about Wasatch Micro Cap Value Fund for the period of October 1, 2023 to September 30, 2024. You can find additional information about the Fund at www.wasatchglobal.com. You can also request this information by contacting us at 800-551-1700.
What were the Fund costs for last year?
Annual Fund Operating Expenses
(based on a hypothetical $10,000 investment)
| Class Name | Costs of a $10,000 investment | Costs paid as a percentage of a $10,000 investment |
|---|
| Institutional Class | $186 | 1.60% |
How did the fund perform last year and what affected its performance?
During the 12 months ended September 30, 2024, market conditions were characterized by ongoing speculation about the direction of interest rates, inflation and the possibility of a recession. Though interest rates were at their highest level in more than two decades, the economy remained resilient, and the Federal Reserve enacted a much-anticipated rate cut in September. While the micro-cap space saw some volatility during the period, investor sentiment improved as the year progressed.
In this environment, the Fund outperformed the benchmark Russell Microcap® Index, maintaining its long-term approach and focus on high-quality companies with strong fundamentals, cash flows, and reasonable valuations—even when the market temporarily favored lower-quality names. The Fund also maintained some international exposure for diversification and potential buyout opportunities, which contributed to overall performance. Among sectors, the Fund outperformed the benchmark in all but two sectors. Stock selection in industrials, financials and consumer staples provided the largest source of outperformance during the period. The Fund underperformed in health care and real estate.
Total return based on a $10,000 investment.
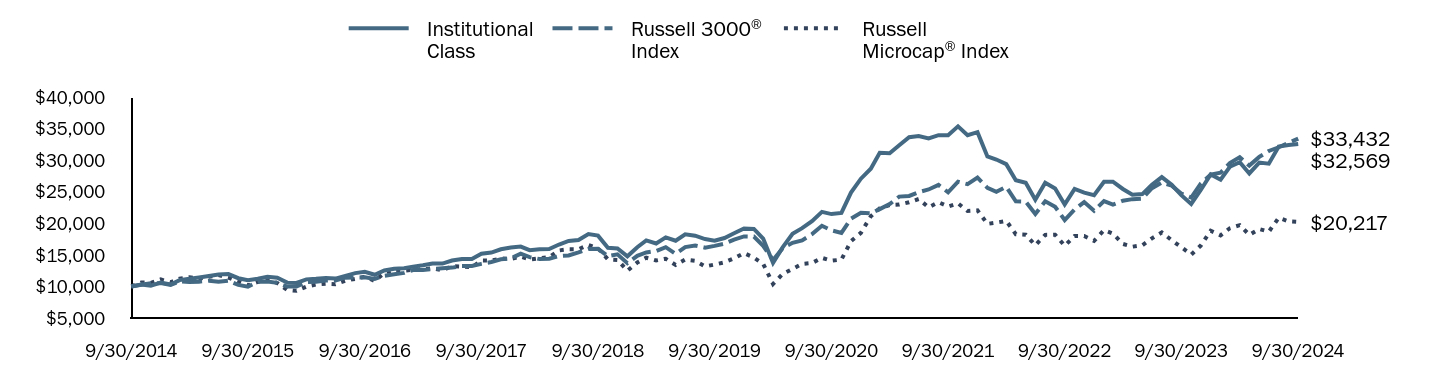
| Institutional Class | Russell 3000® Index | Russell Microcap® Index |
|---|
| 9/30/2014 | $10,000 | $10,000 | $10,000 |
| 10/31/2014 | $10,298 | $10,275 | $10,625 |
| 11/30/2014 | $10,132 | $10,524 | $10,579 |
| 12/31/2014 | $10,615 | $10,524 | $11,119 |
| 1/31/2015 | $10,309 | $10,231 | $10,660 |
| 2/28/2015 | $10,999 | $10,824 | $11,230 |
| 3/31/2015 | $11,229 | $10,713 | $11,468 |
| 4/30/2015 | $11,420 | $10,762 | $11,200 |
| 5/31/2015 | $11,650 | $10,911 | $11,538 |
| 6/30/2015 | $11,880 | $10,728 | $11,789 |
| 7/31/2015 | $11,957 | $10,908 | $11,413 |
| 8/31/2015 | $11,305 | $10,249 | $10,796 |
| 9/30/2015 | $10,999 | $9,951 | $10,165 |
| 10/31/2015 | $11,229 | $10,736 | $10,712 |
| 11/30/2015 | $11,535 | $10,796 | $11,119 |
| 12/31/2015 | $11,378 | $10,574 | $10,545 |
| 1/31/2016 | $10,605 | $9,978 | $9,454 |
| 2/29/2016 | $10,562 | $9,975 | $9,312 |
| 3/31/2016 | $11,121 | $10,677 | $9,972 |
| 4/30/2016 | $11,206 | $10,743 | $10,295 |
| 5/31/2016 | $11,335 | $10,935 | $10,429 |
| 6/30/2016 | $11,249 | $10,958 | $10,368 |
| 7/31/2016 | $11,679 | $11,393 | $10,911 |
| 8/31/2016 | $12,108 | $11,422 | $11,205 |
| 9/30/2016 | $12,323 | $11,440 | $11,534 |
| 10/31/2016 | $11,851 | $11,192 | $10,877 |
| 11/30/2016 | $12,537 | $11,693 | $12,140 |
| 12/31/2016 | $12,791 | $11,921 | $12,693 |
| 1/31/2017 | $12,879 | $12,145 | $12,502 |
| 2/28/2017 | $13,141 | $12,597 | $12,632 |
| 3/31/2017 | $13,359 | $12,606 | $12,741 |
| 4/30/2017 | $13,621 | $12,739 | $12,872 |
| 5/31/2017 | $13,621 | $12,870 | $12,577 |
| 6/30/2017 | $14,101 | $12,986 | $13,230 |
| 7/31/2017 | $14,363 | $13,231 | $13,156 |
| 8/31/2017 | $14,363 | $13,256 | $13,047 |
| 9/30/2017 | $15,192 | $13,579 | $14,110 |
| 10/31/2017 | $15,367 | $13,876 | $14,087 |
| 11/30/2017 | $15,891 | $14,297 | $14,433 |
| 12/31/2017 | $16,169 | $14,440 | $14,364 |
| 1/31/2018 | $16,311 | $15,201 | $14,717 |
| 2/28/2018 | $15,745 | $14,641 | $14,251 |
| 3/31/2018 | $15,886 | $14,347 | $14,462 |
| 4/30/2018 | $15,933 | $14,402 | $14,643 |
| 5/31/2018 | $16,640 | $14,808 | $15,700 |
| 6/30/2018 | $17,206 | $14,905 | $15,903 |
| 7/31/2018 | $17,348 | $15,400 | $15,893 |
| 8/31/2018 | $18,290 | $15,940 | $16,576 |
| 9/30/2018 | $18,055 | $15,967 | $16,036 |
| 10/31/2018 | $16,122 | $14,791 | $14,287 |
| 11/30/2018 | $16,028 | $15,087 | $14,196 |
| 12/31/2018 | $14,771 | $13,683 | $12,485 |
| 1/31/2019 | $16,221 | $14,858 | $13,795 |
| 2/28/2019 | $17,295 | $15,380 | $14,551 |
| 3/31/2019 | $16,812 | $15,605 | $14,121 |
| 4/30/2019 | $17,779 | $16,228 | $14,391 |
| 5/31/2019 | $17,242 | $15,178 | $13,415 |
| 6/30/2019 | $18,262 | $16,244 | $14,252 |
| 7/31/2019 | $18,047 | $16,485 | $14,057 |
| 8/31/2019 | $17,510 | $16,149 | $13,173 |
| 9/30/2019 | $17,242 | $16,433 | $13,474 |
| 10/31/2019 | $17,671 | $16,786 | $13,820 |
| 11/30/2019 | $18,423 | $17,424 | $14,461 |
| 12/31/2019 | $19,180 | $17,928 | $15,286 |
| 1/31/2020 | $19,121 | $17,908 | $14,574 |
| 2/29/2020 | $17,596 | $16,442 | $13,578 |
| 3/31/2020 | $13,725 | $14,181 | $10,396 |
| 4/30/2020 | $16,188 | $16,059 | $11,980 |
| 5/31/2020 | $18,358 | $16,918 | $12,774 |
| 6/30/2020 | $19,238 | $17,304 | $13,572 |
| 7/31/2020 | $20,353 | $18,287 | $13,717 |
| 8/31/2020 | $21,819 | $19,612 | $14,533 |
| 9/30/2020 | $21,467 | $18,898 | $14,073 |
| 10/31/2020 | $21,643 | $18,490 | $14,255 |
| 11/30/2020 | $24,869 | $20,739 | $17,168 |
| 12/31/2020 | $27,072 | $21,672 | $18,490 |
| 1/31/2021 | $28,664 | $21,576 | $21,119 |
| 2/28/2021 | $31,186 | $22,250 | $22,390 |
| 3/31/2021 | $31,119 | $23,048 | $22,907 |
| 4/30/2021 | $32,380 | $24,236 | $22,967 |
| 5/31/2021 | $33,641 | $24,346 | $23,344 |
| 6/30/2021 | $33,840 | $24,947 | $23,855 |
| 7/31/2021 | $33,442 | $25,369 | $22,540 |
| 8/31/2021 | $33,973 | $26,092 | $23,348 |
| 9/30/2021 | $33,973 | $24,921 | $22,667 |
| 10/31/2021 | $35,366 | $26,607 | $23,170 |
| 11/30/2021 | $33,973 | $26,202 | $21,955 |
| 12/31/2021 | $34,451 | $27,234 | $22,065 |
| 1/31/2022 | $30,605 | $25,631 | $19,909 |
| 2/28/2022 | $30,114 | $24,986 | $20,112 |
| 3/31/2022 | $29,377 | $25,796 | $20,389 |
| 4/30/2022 | $26,841 | $23,481 | $18,275 |
| 5/31/2022 | $26,431 | $23,450 | $18,203 |
| 6/30/2022 | $23,731 | $21,488 | $16,524 |
| 7/31/2022 | $26,431 | $23,504 | $18,170 |
| 8/31/2022 | $25,531 | $22,627 | $18,199 |
| 9/30/2022 | $22,994 | $20,528 | $16,444 |
| 10/31/2022 | $25,449 | $22,212 | $18,004 |
| 11/30/2022 | $24,877 | $23,371 | $17,989 |
| 12/31/2022 | $24,467 | $22,003 | $17,221 |
| 1/31/2023 | $26,595 | $23,518 | $18,918 |
| 2/28/2023 | $26,595 | $22,968 | $18,368 |
| 3/31/2023 | $25,449 | $23,583 | $16,734 |
| 4/30/2023 | $24,549 | $23,834 | $16,301 |
| 5/31/2023 | $24,631 | $23,927 | $16,531 |
| 6/30/2023 | $26,104 | $25,560 | $17,620 |
| 7/31/2023 | $27,331 | $26,477 | $18,561 |
| 8/31/2023 | $26,104 | $25,966 | $17,327 |
| 9/30/2023 | $24,467 | $24,729 | $16,222 |
| 10/31/2023 | $23,076 | $24,073 | $15,051 |
| 11/30/2023 | $25,286 | $26,318 | $16,476 |
| 12/31/2023 | $27,741 | $27,714 | $18,828 |
| 1/31/2024 | $26,922 | $28,021 | $18,098 |
| 2/29/2024 | $28,968 | $29,538 | $19,224 |
| 3/31/2024 | $29,705 | $30,491 | $19,710 |
| 4/30/2024 | $27,904 | $29,149 | $18,179 |
| 5/31/2024 | $29,623 | $30,526 | $19,100 |
| 6/30/2024 | $29,459 | $31,471 | $18,670 |
| 7/31/2024 | $32,160 | $32,056 | $20,886 |
| 8/31/2024 | $32,405 | $32,754 | $20,312 |
| 9/30/2024 | $32,569 | $33,432 | $20,217 |
Fund performance shown in this graph represents past performance, which is not necessarily indicative of how the Fund will perform in the future.
Average Total Returns (%)
| Fund | Wasatch Micro Cap Value Fund |
|---|
| Total Net Assets | $328,269,524 |
| # of Portfolio Holdings | 73 |
| Portfolio Turnover Rate | 54% |
| Total Advisory Fees Paid | $4,468,312 |
| Fund | 1 Year | 5 Years | 10 Years |
|---|
| Institutional Class | 33.11% | 13.56% | 12.53% |
Russell 3000® Index | 35.19% | 15.26% | 12.83% |
Russell Microcap® Index | 24.63% | 8.45% | 7.29% |
The performance graph and total returns table do not reflect the deduction of taxes a shareholder would pay on Fund distributions or the redemption of Fund shares.
What did the Fund invest in?
The Fund invested in a variety of equity and debt securities. Opportunities continue to fluctuate with the volatility of the market and as banks continue to encounter risks.
| Top 10 | Value |
| Champion Homes, Inc. | 3.6% |
| Weave Communications, Inc. | 2.9% |
| Granite Construction, Inc. | 2.2% |
| Red Violet, Inc. | 2.1% |
| Addus HomeCare Corp. | 2.0% |
| GCM Grosvenor, Inc. A | 2.0% |
| ICF International, Inc. | 2.0% |
| Limbach Holdings, Inc. | 1.9% |
| JDC Group AG | 1.9% |
| Perella Weinberg Partners | 1.9% |
| Industry | Value |
| Construction & Engineering | 7.9% |
| Health Care Services | 5.6% |
| Regional Banks | 5.6% |
| Homebuilding | 5.1% |
| Application Software | 5.0% |
| Property & Casualty Insurance | 4.0% |
| Industrial Machinery & Supplies & Components | 3.9% |
| Investment Banking & Brokerage | 3.8% |
| Trading Companies & Distributors | 3.5% |
| Health Care Equipment | 3.4% |
Portfolio Compositions (%)
| Asset Type | Value |
| Common Stocks | 95.8% |
| Warrants | -% |
| Other Assets and Liabilities, Net | 4.2% |
| Total | 100.0% |
In order to reduce expenses, we will deliver a single copy of prospectuses, proxies, financial reports and other communication to shareholders with the same residential address. If you would like to receive individual mailings, please call [800-551-1700] and we will begin sending you separate copies of these materials within 30 days after receiving your request.
ALPS Distributors, Inc. serves as the Fund’s distributor.
If you wish to view additional information about the Fund; including but not limited to financial statements or holdings, please visit www.wasatchglobal.com.
Phone: 800-551-1700
Email: shareholderservice@wasatchfunds.com
Wasatch Micro Cap Value Fund
Annual Shareholder Report
September 30, 2024
Wasatch Micro Cap Value Fund
Annual Shareholder Report
September 30, 2024
This Annual shareholder report contains important information about Wasatch Micro Cap Value Fund for the period of October 1, 2023 to September 30, 2024. You can find additional information about the Fund at www.wasatchglobal.com. You can also request this information by contacting us at 800-551-1700.
What were the Fund costs for last year?
Annual Fund Operating Expenses
(based on a hypothetical $10,000 investment)
| Class Name | Costs of a $10,000 investment | Costs paid as a percentage of a $10,000 investment |
|---|
| Investor Class | $199 | 1.71% |
How did the fund perform last year and what affected its performance?
During the 12 months ended September 30, 2024, market conditions were characterized by ongoing speculation about the direction of interest rates, inflation and the possibility of a recession. Though interest rates were at their highest level in more than two decades, the economy remained resilient, and the Federal Reserve enacted a much-anticipated rate cut in September. While the micro-cap space saw some volatility during the period, investor sentiment improved as the year progressed.
In this environment, the Fund outperformed the benchmark Russell Microcap® Index, maintaining its long-term approach and focus on high-quality companies with strong fundamentals, cash flows, and reasonable valuations—even when the market temporarily favored lower-quality names. The Fund also maintained some international exposure for diversification and potential buyout opportunities, which contributed to overall performance. Among sectors, the Fund outperformed the benchmark in all but two sectors. Stock selection in industrials, financials and consumer staples provided the largest source of outperformance during the period. The Fund underperformed in health care and real estate.
Total return based on a $10,000 investment.
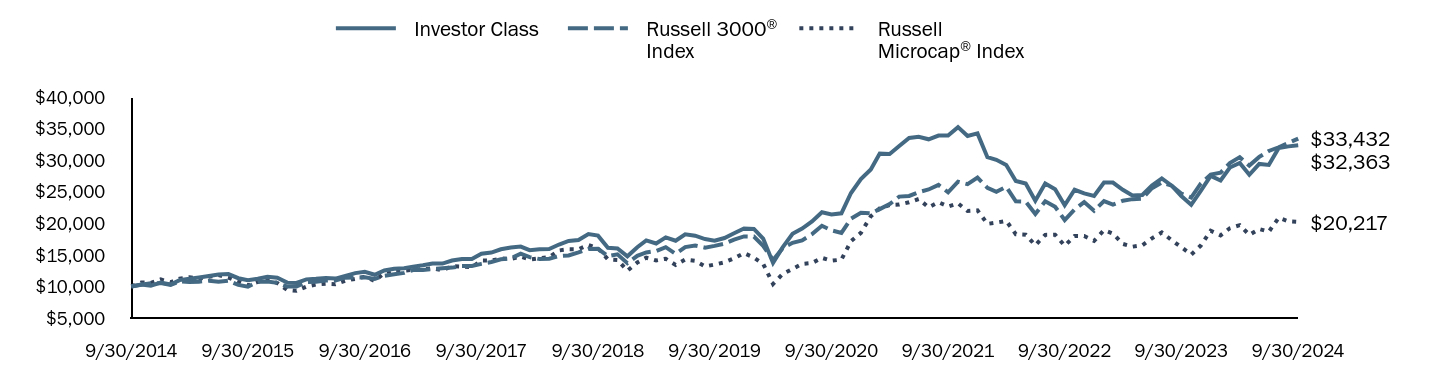
| Investor Class | Russell 3000® Index | Russell Microcap® Index |
|---|
| 9/30/2014 | $10,000 | $10,000 | $10,000 |
| 10/31/2014 | $10,298 | $10,275 | $10,625 |
| 11/30/2014 | $10,132 | $10,524 | $10,579 |
| 12/31/2014 | $10,615 | $10,524 | $11,119 |
| 1/31/2015 | $10,309 | $10,231 | $10,660 |
| 2/28/2015 | $10,999 | $10,824 | $11,230 |
| 3/31/2015 | $11,229 | $10,713 | $11,468 |
| 4/30/2015 | $11,420 | $10,762 | $11,200 |
| 5/31/2015 | $11,650 | $10,911 | $11,538 |
| 6/30/2015 | $11,880 | $10,728 | $11,789 |
| 7/31/2015 | $11,957 | $10,908 | $11,413 |
| 8/31/2015 | $11,305 | $10,249 | $10,796 |
| 9/30/2015 | $10,999 | $9,951 | $10,165 |
| 10/31/2015 | $11,229 | $10,736 | $10,712 |
| 11/30/2015 | $11,535 | $10,796 | $11,119 |
| 12/31/2015 | $11,378 | $10,574 | $10,545 |
| 1/31/2016 | $10,605 | $9,978 | $9,454 |
| 2/29/2016 | $10,562 | $9,975 | $9,312 |
| 3/31/2016 | $11,121 | $10,677 | $9,972 |
| 4/30/2016 | $11,206 | $10,743 | $10,295 |
| 5/31/2016 | $11,335 | $10,935 | $10,429 |
| 6/30/2016 | $11,249 | $10,958 | $10,368 |
| 7/31/2016 | $11,679 | $11,393 | $10,911 |
| 8/31/2016 | $12,108 | $11,422 | $11,205 |
| 9/30/2016 | $12,323 | $11,440 | $11,534 |
| 10/31/2016 | $11,851 | $11,192 | $10,877 |
| 11/30/2016 | $12,537 | $11,693 | $12,140 |
| 12/31/2016 | $12,791 | $11,921 | $12,693 |
| 1/31/2017 | $12,879 | $12,145 | $12,502 |
| 2/28/2017 | $13,141 | $12,597 | $12,632 |
| 3/31/2017 | $13,359 | $12,606 | $12,741 |
| 4/30/2017 | $13,621 | $12,739 | $12,872 |
| 5/31/2017 | $13,621 | $12,870 | $12,577 |
| 6/30/2017 | $14,101 | $12,986 | $13,230 |
| 7/31/2017 | $14,363 | $13,231 | $13,156 |
| 8/31/2017 | $14,363 | $13,256 | $13,047 |
| 9/30/2017 | $15,192 | $13,579 | $14,110 |
| 10/31/2017 | $15,367 | $13,876 | $14,087 |
| 11/30/2017 | $15,891 | $14,297 | $14,433 |
| 12/31/2017 | $16,169 | $14,440 | $14,364 |
| 1/31/2018 | $16,311 | $15,201 | $14,717 |
| 2/28/2018 | $15,745 | $14,641 | $14,251 |
| 3/31/2018 | $15,886 | $14,347 | $14,462 |
| 4/30/2018 | $15,933 | $14,402 | $14,643 |
| 5/31/2018 | $16,640 | $14,808 | $15,700 |
| 6/30/2018 | $17,206 | $14,905 | $15,903 |
| 7/31/2018 | $17,348 | $15,400 | $15,893 |
| 8/31/2018 | $18,290 | $15,940 | $16,576 |
| 9/30/2018 | $18,055 | $15,967 | $16,036 |
| 10/31/2018 | $16,122 | $14,791 | $14,287 |
| 11/30/2018 | $16,028 | $15,087 | $14,196 |
| 12/31/2018 | $14,771 | $13,683 | $12,485 |
| 1/31/2019 | $16,221 | $14,858 | $13,795 |
| 2/28/2019 | $17,295 | $15,380 | $14,551 |
| 3/31/2019 | $16,812 | $15,605 | $14,121 |
| 4/30/2019 | $17,779 | $16,228 | $14,391 |
| 5/31/2019 | $17,242 | $15,178 | $13,415 |
| 6/30/2019 | $18,262 | $16,244 | $14,252 |
| 7/31/2019 | $18,047 | $16,485 | $14,057 |
| 8/31/2019 | $17,510 | $16,149 | $13,173 |
| 9/30/2019 | $17,242 | $16,433 | $13,474 |
| 10/31/2019 | $17,671 | $16,786 | $13,820 |
| 11/30/2019 | $18,423 | $17,424 | $14,461 |
| 12/31/2019 | $19,180 | $17,928 | $15,286 |
| 1/31/2020 | $19,121 | $17,908 | $14,574 |
| 2/29/2020 | $17,596 | $16,442 | $13,578 |
| 3/31/2020 | $13,725 | $14,181 | $10,396 |
| 4/30/2020 | $16,188 | $16,059 | $11,980 |
| 5/31/2020 | $18,358 | $16,918 | $12,774 |
| 6/30/2020 | $19,180 | $17,304 | $13,572 |
| 7/31/2020 | $20,294 | $18,287 | $13,717 |
| 8/31/2020 | $21,760 | $19,612 | $14,533 |
| 9/30/2020 | $21,408 | $18,898 | $14,073 |
| 10/31/2020 | $21,584 | $18,490 | $14,255 |
| 11/30/2020 | $24,810 | $20,739 | $17,168 |
| 12/31/2020 | $27,013 | $21,672 | $18,490 |
| 1/31/2021 | $28,540 | $21,576 | $21,119 |
| 2/28/2021 | $31,062 | $22,250 | $22,390 |
| 3/31/2021 | $30,996 | $23,048 | $22,907 |
| 4/30/2021 | $32,257 | $24,236 | $22,967 |
| 5/31/2021 | $33,518 | $24,346 | $23,344 |
| 6/30/2021 | $33,717 | $24,947 | $23,855 |
| 7/31/2021 | $33,319 | $25,369 | $22,540 |
| 8/31/2021 | $33,916 | $26,092 | $23,348 |
| 9/30/2021 | $33,916 | $24,921 | $22,667 |
| 10/31/2021 | $35,243 | $26,607 | $23,170 |
| 11/30/2021 | $33,850 | $26,202 | $21,955 |
| 12/31/2021 | $34,248 | $27,234 | $22,065 |
| 1/31/2022 | $30,479 | $25,631 | $19,909 |
| 2/28/2022 | $30,069 | $24,986 | $20,112 |
| 3/31/2022 | $29,250 | $25,796 | $20,389 |
| 4/30/2022 | $26,710 | $23,481 | $18,275 |
| 5/31/2022 | $26,300 | $23,450 | $18,203 |
| 6/30/2022 | $23,596 | $21,488 | $16,524 |
| 7/31/2022 | $26,300 | $23,504 | $18,170 |
| 8/31/2022 | $25,399 | $22,627 | $18,199 |
| 9/30/2022 | $22,859 | $20,528 | $16,444 |
| 10/31/2022 | $25,317 | $22,212 | $18,004 |
| 11/30/2022 | $24,743 | $23,371 | $17,989 |
| 12/31/2022 | $24,334 | $22,003 | $17,221 |
| 1/31/2023 | $26,464 | $23,518 | $18,918 |
| 2/28/2023 | $26,464 | $22,968 | $18,368 |
| 3/31/2023 | $25,317 | $23,583 | $16,734 |
| 4/30/2023 | $24,416 | $23,834 | $16,301 |
| 5/31/2023 | $24,498 | $23,927 | $16,531 |
| 6/30/2023 | $25,972 | $25,560 | $17,620 |
| 7/31/2023 | $27,119 | $26,477 | $18,561 |
| 8/31/2023 | $25,972 | $25,966 | $17,327 |
| 9/30/2023 | $24,334 | $24,729 | $16,222 |
| 10/31/2023 | $22,941 | $24,073 | $15,051 |
| 11/30/2023 | $25,153 | $26,318 | $16,476 |
| 12/31/2023 | $27,529 | $27,714 | $18,828 |
| 1/31/2024 | $26,792 | $28,021 | $18,098 |
| 2/29/2024 | $28,840 | $29,538 | $19,224 |
| 3/31/2024 | $29,577 | $30,491 | $19,710 |
| 4/30/2024 | $27,693 | $29,149 | $18,179 |
| 5/31/2024 | $29,414 | $30,526 | $19,100 |
| 6/30/2024 | $29,250 | $31,471 | $18,670 |
| 7/31/2024 | $31,953 | $32,056 | $20,886 |
| 8/31/2024 | $32,199 | $32,754 | $20,312 |
| 9/30/2024 | $32,363 | $33,432 | $20,217 |
Fund performance shown in this graph represents past performance, which is not necessarily indicative of how the Fund will perform in the future.
Average Total Returns (%)
| Fund | Wasatch Micro Cap Value Fund |
|---|
| Total Net Assets | $328,269,524 |
| # of Portfolio Holdings | 73 |
| Portfolio Turnover Rate | 54% |
| Total Advisory Fees Paid | $4,468,312 |
| Fund | 1 Year | 5 Years | 10 Years |
|---|
| Investor Class | 33.00% | 13.42% | 12.46% |
Russell 3000® Index | 35.19% | 15.26% | 12.83% |
Russell Microcap® Index | 24.63% | 8.45% | 7.29% |
The performance graph and total returns table do not reflect the deduction of taxes a shareholder would pay on Fund distributions or the redemption of Fund shares.
What did the Fund invest in?
The Fund invested in a variety of equity and debt securities. Opportunities continue to fluctuate with the volatility of the market and as banks continue to encounter risks.
| Top 10 | Value |
| Champion Homes, Inc. | 3.6% |
| Weave Communications, Inc. | 2.9% |
| Granite Construction, Inc. | 2.2% |
| Red Violet, Inc. | 2.1% |
| Addus HomeCare Corp. | 2.0% |
| GCM Grosvenor, Inc. A | 2.0% |
| ICF International, Inc. | 2.0% |
| Limbach Holdings, Inc. | 1.9% |
| JDC Group AG | 1.9% |
| Perella Weinberg Partners | 1.9% |
| Industry | Value |
| Construction & Engineering | 7.9% |
| Health Care Services | 5.6% |
| Regional Banks | 5.6% |
| Homebuilding | 5.1% |
| Application Software | 5.0% |
| Property & Casualty Insurance | 4.0% |
| Industrial Machinery & Supplies & Components | 3.9% |
| Investment Banking & Brokerage | 3.8% |
| Trading Companies & Distributors | 3.5% |
| Health Care Equipment | 3.4% |
Portfolio Compositions (%)
| Asset Type | Value |
| Common Stocks | 95.8% |
| Warrants | -% |
| Other Assets and Liabilities, Net | 4.2% |
| Total | 100.0% |
In order to reduce expenses, we will deliver a single copy of prospectuses, proxies, financial reports and other communication to shareholders with the same residential address. If you would like to receive individual mailings, please call [800-551-1700] and we will begin sending you separate copies of these materials within 30 days after receiving your request.
ALPS Distributors, Inc. serves as the Fund’s distributor.
If you wish to view additional information about the Fund; including but not limited to financial statements or holdings, please visit www.wasatchglobal.com.
Phone: 800-551-1700
Email: shareholderservice@wasatchfunds.com
Wasatch Micro Cap Value Fund
Annual Shareholder Report
September 30, 2024
Wasatch Small Cap Growth Fund
Institutional Class WIAEX
Annual Shareholder Report
September 30, 2024
This Annual shareholder report contains important information about Wasatch Small Cap Growth Fund for the period of October 1, 2023 to September 30, 2024. You can find additional information about the Fund at www.wasatchglobal.com. You can also request this information by contacting us at 800-551-1700.
What were the Fund costs for last year?
Annual Fund Operating Expenses
(based on a hypothetical $10,000 investment)
| Class Name | Costs of a $10,000 investment | Costs paid as a percentage of a $10,000 investment |
|---|
| Institutional Class | $117 | 1.05% |
How did the fund perform last year and what affected its performance?
During the 12 months ended September 30, 2024, investors’ interest-rate expectations fluctuated, with markets anticipating rate cuts in some quarters and grappling with stubborn inflation in others. But optimism largely prevailed as the period progressed and the likelihood of rate cuts grew stronger, creating a favorable environment for U.S. equities.
While the Fund achieved substantial gains, it underperformed the benchmark Russell 2000® Growth Index. Underperformance was largely due to stock selection in the consumer-discretionary and information-technology sectors. Within the consumer-discretionary sector, we owned a couple of stocks that were hurt by a tougher spending environment for consumers with lower incomes. Within the technology sector, the best-performing stocks were typically those of companies that benefit from the advent of artificial intelligence (AI). We own some companies tied to the theme but have more exposure to software companies, IT consultants and other technology firms. Those stocks tended to underperform as companies pared back spending on consulting and software to concentrate on new AI projects. However, we continue to like the long-term growth potential of all our technology companies.
Total return based on a $10,000 investment.
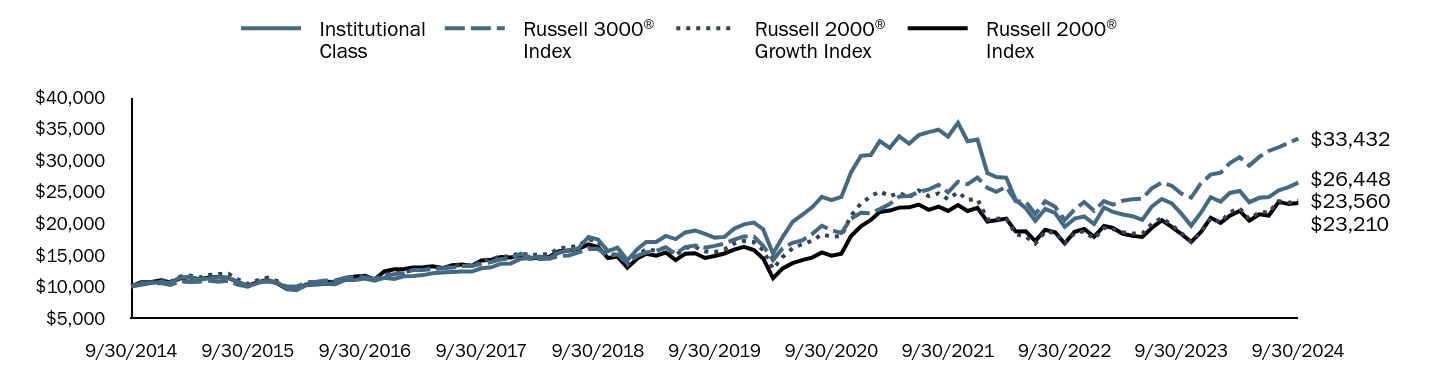
| Institutional Class | Russell 3000® Index | Russell 2000® Growth Index | Russell 2000® Index |
|---|
| 9/30/2014 | $10,000 | $10,000 | $10,000 | $10,000 |
| 10/31/2014 | $10,450 | $10,275 | $10,620 | $10,659 |
| 11/30/2014 | $10,539 | $10,524 | $10,689 | $10,669 |
| 12/31/2014 | $10,714 | $10,524 | $11,006 | $10,973 |
| 1/31/2015 | $10,541 | $10,231 | $10,755 | $10,620 |
| 2/28/2015 | $11,376 | $10,824 | $11,529 | $11,250 |
| 3/31/2015 | $11,526 | $10,713 | $11,736 | $11,446 |
| 4/30/2015 | $11,111 | $10,762 | $11,390 | $11,154 |
| 5/31/2015 | $11,273 | $10,911 | $11,809 | $11,409 |
| 6/30/2015 | $11,465 | $10,728 | $11,968 | $11,494 |
| 7/31/2015 | $11,378 | $10,908 | $12,016 | $11,361 |
| 8/31/2015 | $10,648 | $10,249 | $11,106 | $10,647 |
| 9/30/2015 | $10,039 | $9,951 | $10,404 | $10,125 |
| 10/31/2015 | $10,524 | $10,736 | $10,995 | $10,695 |
| 11/30/2015 | $10,952 | $10,796 | $11,398 | $11,043 |
| 12/31/2015 | $10,655 | $10,574 | $10,854 | $10,488 |
| 1/31/2016 | $9,628 | $9,978 | $9,678 | $9,566 |
| 2/29/2016 | $9,427 | $9,975 | $9,609 | $9,566 |
| 3/31/2016 | $10,191 | $10,677 | $10,346 | $10,329 |
| 4/30/2016 | $10,250 | $10,743 | $10,449 | $10,491 |
| 5/31/2016 | $10,415 | $10,935 | $10,730 | $10,728 |
| 6/30/2016 | $10,345 | $10,958 | $10,681 | $10,721 |
| 7/31/2016 | $11,040 | $11,393 | $11,379 | $11,361 |
| 8/31/2016 | $11,024 | $11,422 | $11,500 | $11,562 |
| 9/30/2016 | $11,246 | $11,440 | $11,666 | $11,691 |
| 10/31/2016 | $10,923 | $11,192 | $10,941 | $11,135 |
| 11/30/2016 | $11,378 | $11,693 | $11,920 | $12,377 |
| 12/31/2016 | $11,191 | $11,921 | $12,082 | $12,723 |
| 1/31/2017 | $11,612 | $12,145 | $12,278 | $12,773 |
| 2/28/2017 | $11,671 | $12,597 | $12,579 | $13,020 |
| 3/31/2017 | $11,798 | $12,606 | $12,728 | $13,037 |
| 4/30/2017 | $12,095 | $12,739 | $12,963 | $13,180 |
| 5/31/2017 | $12,196 | $12,870 | $12,845 | $12,912 |
| 6/30/2017 | $12,303 | $12,986 | $13,287 | $13,358 |
| 7/31/2017 | $12,356 | $13,231 | $13,400 | $13,457 |
| 8/31/2017 | $12,359 | $13,256 | $13,385 | $13,286 |
| 9/30/2017 | $12,881 | $13,579 | $14,113 | $14,115 |
| 10/31/2017 | $13,041 | $13,876 | $14,332 | $14,236 |
| 11/30/2017 | $13,611 | $14,297 | $14,743 | $14,646 |
| 12/31/2017 | $13,649 | $14,440 | $14,760 | $14,587 |
| 1/31/2018 | $14,398 | $15,201 | $15,336 | $14,968 |
| 2/28/2018 | $14,479 | $14,641 | $14,899 | $14,389 |
| 3/31/2018 | $14,730 | $14,347 | $15,100 | $14,575 |
| 4/30/2018 | $14,476 | $14,402 | $15,115 | $14,701 |
| 5/31/2018 | $15,347 | $14,808 | $16,066 | $15,593 |
| 6/30/2018 | $15,761 | $14,905 | $16,192 | $15,705 |
| 7/31/2018 | $16,055 | $15,400 | $16,470 | $15,978 |
| 8/31/2018 | $17,826 | $15,940 | $17,496 | $16,667 |
| 9/30/2018 | $17,425 | $15,967 | $17,086 | $16,266 |
| 10/31/2018 | $15,591 | $14,791 | $14,924 | $14,500 |
| 11/30/2018 | $16,146 | $15,087 | $15,158 | $14,730 |
| 12/31/2018 | $14,142 | $13,683 | $13,387 | $12,980 |
| 1/31/2019 | $15,920 | $14,858 | $14,933 | $14,441 |
| 2/28/2019 | $17,052 | $15,380 | $15,897 | $15,191 |
| 3/31/2019 | $17,052 | $15,605 | $15,682 | $14,873 |
| 4/30/2019 | $18,000 | $16,228 | $16,159 | $15,379 |
| 5/31/2019 | $17,506 | $15,178 | $14,960 | $14,183 |
| 6/30/2019 | $18,559 | $16,244 | $16,113 | $15,185 |
| 7/31/2019 | $18,874 | $16,485 | $16,270 | $15,272 |
| 8/31/2019 | $18,314 | $16,149 | $15,568 | $14,518 |
| 9/30/2019 | $17,738 | $16,433 | $15,440 | $14,820 |
| 10/31/2019 | $17,856 | $16,786 | $15,880 | $15,211 |
| 11/30/2019 | $19,158 | $17,424 | $16,814 | $15,837 |
| 12/31/2019 | $19,844 | $17,928 | $17,200 | $16,294 |
| 1/31/2020 | $20,130 | $17,908 | $17,010 | $15,771 |
| 2/29/2020 | $19,067 | $16,442 | $15,782 | $14,443 |
| 3/31/2020 | $15,180 | $14,181 | $12,768 | $11,305 |
| 4/30/2020 | $17,828 | $16,059 | $14,670 | $12,858 |
| 5/31/2020 | $20,245 | $16,918 | $16,056 | $13,695 |
| 6/30/2020 | $21,324 | $17,304 | $16,673 | $14,179 |
| 7/31/2020 | $22,547 | $18,287 | $17,246 | $14,571 |
| 8/31/2020 | $24,187 | $19,612 | $18,258 | $15,392 |
| 9/30/2020 | $23,660 | $18,898 | $17,867 | $14,878 |
| 10/31/2020 | $24,187 | $18,490 | $18,002 | $15,190 |
| 11/30/2020 | $28,079 | $20,739 | $21,177 | $17,990 |
| 12/31/2020 | $30,690 | $21,672 | $23,156 | $19,546 |
| 1/31/2021 | $30,834 | $21,576 | $24,273 | $20,529 |
| 2/28/2021 | $33,026 | $22,250 | $25,074 | $21,809 |
| 3/31/2021 | $31,949 | $23,048 | $24,285 | $22,028 |
| 4/30/2021 | $33,783 | $24,236 | $24,815 | $22,491 |
| 5/31/2021 | $32,610 | $24,346 | $24,106 | $22,537 |
| 6/30/2021 | $33,975 | $24,947 | $25,237 | $22,974 |
| 7/31/2021 | $34,465 | $25,369 | $24,317 | $22,144 |
| 8/31/2021 | $34,833 | $26,092 | $24,759 | $22,639 |
| 9/30/2021 | $33,745 | $24,921 | $23,810 | $21,972 |
| 10/31/2021 | $35,926 | $26,607 | $24,925 | $22,906 |
| 11/30/2021 | $33,004 | $26,202 | $23,708 | $21,952 |
| 12/31/2021 | $33,267 | $27,234 | $23,813 | $22,442 |
| 1/31/2022 | $27,968 | $25,631 | $20,621 | $20,282 |
| 2/28/2022 | $27,346 | $24,986 | $20,711 | $20,498 |
| 3/31/2022 | $27,234 | $25,796 | $20,806 | $20,753 |
| 4/30/2022 | $23,704 | $23,481 | $18,253 | $18,697 |
| 5/31/2022 | $22,401 | $23,450 | $17,908 | $18,725 |
| 6/30/2022 | $20,416 | $21,488 | $16,800 | $17,185 |
| 7/31/2022 | $22,283 | $23,504 | $18,681 | $18,979 |
| 8/31/2022 | $21,641 | $22,627 | $18,505 | $18,591 |
| 9/30/2022 | $19,453 | $20,528 | $16,840 | $16,809 |
| 10/31/2022 | $20,750 | $22,212 | $18,439 | $18,659 |
| 11/30/2022 | $21,091 | $23,371 | $18,739 | $19,095 |
| 12/31/2022 | $19,899 | $22,003 | $17,536 | $17,856 |
| 1/31/2023 | $22,505 | $23,518 | $19,281 | $19,596 |
| 2/28/2023 | $21,805 | $22,968 | $19,072 | $19,265 |
| 3/31/2023 | $21,392 | $23,583 | $18,601 | $18,345 |
| 4/30/2023 | $21,136 | $23,834 | $18,385 | $18,015 |
| 5/31/2023 | $20,554 | $23,927 | $18,388 | $17,849 |
| 6/30/2023 | $22,695 | $25,560 | $19,913 | $19,300 |
| 7/31/2023 | $23,855 | $26,477 | $20,844 | $20,480 |
| 8/31/2023 | $23,154 | $25,966 | $19,759 | $19,455 |
| 9/30/2023 | $21,536 | $24,729 | $18,456 | $18,310 |
| 10/31/2023 | $19,610 | $24,073 | $17,032 | $17,061 |
| 11/30/2023 | $21,641 | $26,318 | $18,583 | $18,606 |
| 12/31/2023 | $24,143 | $27,714 | $20,808 | $20,879 |
| 1/31/2024 | $23,455 | $28,021 | $20,141 | $20,067 |
| 2/29/2024 | $24,817 | $29,538 | $21,777 | $21,201 |
| 3/31/2024 | $25,125 | $30,491 | $22,386 | $21,960 |
| 4/30/2024 | $23,350 | $29,149 | $20,662 | $20,415 |
| 5/31/2024 | $24,045 | $30,526 | $21,769 | $21,439 |
| 6/30/2024 | $24,163 | $31,471 | $21,732 | $21,241 |
| 7/31/2024 | $25,243 | $32,056 | $23,512 | $23,399 |
| 8/31/2024 | $25,748 | $32,754 | $23,251 | $23,049 |
| 9/30/2024 | $26,448 | $33,432 | $23,560 | $23,210 |
Fund performance shown in this graph represents past performance, which is not necessarily indicative of how the Fund will perform in the future.
Average Total Returns (%)
| Fund | Wasatch Small Cap Growth Fund |
|---|
| Total Net Assets | $2,150,491,470 |
| # of Portfolio Holdings | 49 |
| Portfolio Turnover Rate | 28% |
| Total Advisory Fees Paid | $21,337,058 |
| Fund | 1 Year | 5 Years | 10 Years |
|---|
| Institutional Class | 22.81% | 8.32% | 10.21% |
Russell 3000® Index | 35.19% | 15.26% | 12.83% |
Russell 2000® Growth Index | 27.66% | 8.82% | 8.95% |
Russell 2000® Index | 26.76% | 9.39% | 8.78% |
The performance graph and total returns table do not reflect the deduction of taxes a shareholder would pay on Fund distributions or the redemption of Fund shares.
What did the Fund invest in?
The Fund invested in a variety of equity and debt securities. Opportunities continue to fluctuate with the volatility of the market and as banks continue to encounter risks.
| Top 10 | Value |
| Clearwater Analytics Holdings, Inc. A | 4.0% |
| HealthEquity, Inc. | 3.9% |
| RBC Bearings, Inc. | 3.8% |
| BellRing Brands, Inc. | 3.7% |
| Ensign Group, Inc. | 3.5% |
| AAON, Inc. | 3.2% |
| Paylocity Holding Corp. | 3.1% |
| Pinnacle Financial Partners, Inc. | 3.0% |
| Ollie's Bargain Outlet Holdings, Inc. | 2.9% |
| Globant SA | 2.9% |
| Industry | Value |
| Application Software | 10.3% |
| Building Products | 5.7% |
| IT Consulting & Other Services | 4.9% |
| Trading Companies & Distributors | 4.4% |
| Broadline Retail | 4.4% |
| Health Care Facilities | 4.2% |
| Managed Health Care | 3.9% |
| Industrial Machinery & Supplies & Components | 3.8% |
| Systems Software | 3.7% |
| Personal Care Products | 3.7% |
Portfolio Compositions (%)
| Asset Type | Value |
| Common Stocks | 98.2% |
| Preferred Stocks | 1.2% |
| Other Assets and Liabilities, Net | 0.6% |
| Total | 100.0% |
In order to reduce expenses, we will deliver a single copy of prospectuses, proxies, financial reports and other communication to shareholders with the same residential address. If you would like to receive individual mailings, please call [800-551-1700] and we will begin sending you separate copies of these materials within 30 days after receiving your request.
ALPS Distributors, Inc. serves as the Fund’s distributor.
If you wish to view additional information about the Fund; including but not limited to financial statements or holdings, please visit www.wasatchglobal.com.
Phone: 800-551-1700
Email: shareholderservice@wasatchfunds.com
Wasatch Small Cap Growth Fund
Annual Shareholder Report
September 30, 2024
Wasatch Small Cap Growth Fund
Annual Shareholder Report
September 30, 2024
This Annual shareholder report contains important information about Wasatch Small Cap Growth Fund for the period of October 1, 2023 to September 30, 2024. You can find additional information about the Fund at www.wasatchglobal.com. You can also request this information by contacting us at 800-551-1700.
What were the Fund costs for last year?
Annual Fund Operating Expenses
(based on a hypothetical $10,000 investment)
| Class Name | Costs of a $10,000 investment | Costs paid as a percentage of a $10,000 investment |
|---|
| Investor Class | $128 | 1.15% |
How did the fund perform last year and what affected its performance?
During the 12 months ended September 30, 2024, investors’ interest-rate expectations fluctuated, with markets anticipating rate cuts in some quarters and grappling with stubborn inflation in others. But optimism largely prevailed as the period progressed and the likelihood of rate cuts grew stronger, creating a favorable environment for U.S. equities.
While the Fund achieved substantial gains, it underperformed the benchmark Russell 2000® Growth Index. Underperformance was largely due to stock selection in the consumer-discretionary and information-technology sectors. Within the consumer-discretionary sector, we owned a couple of stocks that were hurt by a tougher spending environment for consumers with lower incomes. Within the technology sector, the best-performing stocks were typically those of companies that benefit from the advent of artificial intelligence (AI). We own some companies tied to the theme but have more exposure to software companies, IT consultants and other technology firms. Those stocks tended to underperform as companies pared back spending on consulting and software to concentrate on new AI projects. However, we continue to like the long-term growth potential of all our technology companies.
Total return based on a $10,000 investment.

| Investor Class | Russell 3000® Index | Russell 2000® Growth Index | Russell 2000® Index |
|---|
| 9/30/2014 | $10,000 | $10,000 | $10,000 | $10,000 |
| 10/31/2014 | $10,450 | $10,275 | $10,620 | $10,659 |
| 11/30/2014 | $10,539 | $10,524 | $10,689 | $10,669 |
| 12/31/2014 | $10,714 | $10,524 | $11,006 | $10,973 |
| 1/31/2015 | $10,541 | $10,231 | $10,755 | $10,620 |
| 2/28/2015 | $11,376 | $10,824 | $11,529 | $11,250 |
| 3/31/2015 | $11,526 | $10,713 | $11,736 | $11,446 |
| 4/30/2015 | $11,111 | $10,762 | $11,390 | $11,154 |
| 5/31/2015 | $11,273 | $10,911 | $11,809 | $11,409 |
| 6/30/2015 | $11,465 | $10,728 | $11,968 | $11,494 |
| 7/31/2015 | $11,378 | $10,908 | $12,016 | $11,361 |
| 8/31/2015 | $10,648 | $10,249 | $11,106 | $10,647 |
| 9/30/2015 | $10,039 | $9,951 | $10,404 | $10,125 |
| 10/31/2015 | $10,524 | $10,736 | $10,995 | $10,695 |
| 11/30/2015 | $10,952 | $10,796 | $11,398 | $11,043 |
| 12/31/2015 | $10,655 | $10,574 | $10,854 | $10,488 |
| 1/31/2016 | $9,628 | $9,978 | $9,678 | $9,566 |
| 2/29/2016 | $9,427 | $9,975 | $9,609 | $9,566 |
| 3/31/2016 | $10,191 | $10,677 | $10,346 | $10,329 |
| 4/30/2016 | $10,247 | $10,743 | $10,449 | $10,491 |
| 5/31/2016 | $10,410 | $10,935 | $10,730 | $10,728 |
| 6/30/2016 | $10,338 | $10,958 | $10,681 | $10,721 |
| 7/31/2016 | $11,029 | $11,393 | $11,379 | $11,361 |
| 8/31/2016 | $11,009 | $11,422 | $11,500 | $11,562 |
| 9/30/2016 | $11,231 | $11,440 | $11,666 | $11,691 |
| 10/31/2016 | $10,905 | $11,192 | $10,941 | $11,135 |
| 11/30/2016 | $11,357 | $11,693 | $11,920 | $12,377 |
| 12/31/2016 | $11,168 | $11,921 | $12,082 | $12,723 |
| 1/31/2017 | $11,584 | $12,145 | $12,278 | $12,773 |
| 2/28/2017 | $11,643 | $12,597 | $12,579 | $13,020 |
| 3/31/2017 | $11,766 | $12,606 | $12,728 | $13,037 |
| 4/30/2017 | $12,061 | $12,739 | $12,963 | $13,180 |
| 5/31/2017 | $12,159 | $12,870 | $12,845 | $12,912 |
| 6/30/2017 | $12,266 | $12,986 | $13,287 | $13,358 |
| 7/31/2017 | $12,316 | $13,231 | $13,400 | $13,457 |
| 8/31/2017 | $12,316 | $13,256 | $13,385 | $13,286 |
| 9/30/2017 | $12,836 | $13,579 | $14,113 | $14,115 |
| 10/31/2017 | $12,993 | $13,876 | $14,332 | $14,236 |
| 11/30/2017 | $13,557 | $14,297 | $14,743 | $14,646 |
| 12/31/2017 | $13,595 | $14,440 | $14,760 | $14,587 |
| 1/31/2018 | $14,338 | $15,201 | $15,336 | $14,968 |
| 2/28/2018 | $14,417 | $14,641 | $14,899 | $14,389 |
| 3/31/2018 | $14,664 | $14,347 | $15,100 | $14,575 |
| 4/30/2018 | $14,413 | $14,402 | $15,115 | $14,701 |
| 5/31/2018 | $15,276 | $14,808 | $16,066 | $15,593 |
| 6/30/2018 | $15,686 | $14,905 | $16,192 | $15,705 |
| 7/31/2018 | $15,978 | $15,400 | $16,470 | $15,978 |
| 8/31/2018 | $17,737 | $15,940 | $17,496 | $16,667 |
| 9/30/2018 | $17,339 | $15,967 | $17,086 | $16,266 |
| 10/31/2018 | $15,514 | $14,791 | $14,924 | $14,500 |
| 11/30/2018 | $16,063 | $15,087 | $15,158 | $14,730 |
| 12/31/2018 | $14,071 | $13,683 | $13,387 | $12,980 |
| 1/31/2019 | $15,837 | $14,858 | $14,933 | $14,441 |
| 2/28/2019 | $16,959 | $15,380 | $15,897 | $15,191 |
| 3/31/2019 | $16,954 | $15,605 | $15,682 | $14,873 |
| 4/30/2019 | $17,896 | $16,228 | $16,159 | $15,379 |
| 5/31/2019 | $17,406 | $15,178 | $14,960 | $14,183 |
| 6/30/2019 | $18,448 | $16,244 | $16,113 | $15,185 |
| 7/31/2019 | $18,760 | $16,485 | $16,270 | $15,272 |
| 8/31/2019 | $18,203 | $16,149 | $15,568 | $14,518 |
| 9/30/2019 | $17,629 | $16,433 | $15,440 | $14,820 |
| 10/31/2019 | $17,747 | $16,786 | $15,880 | $15,211 |
| 11/30/2019 | $19,036 | $17,424 | $16,814 | $15,837 |
| 12/31/2019 | $19,720 | $17,928 | $17,200 | $16,294 |
| 1/31/2020 | $19,997 | $17,908 | $17,010 | $15,771 |
| 2/29/2020 | $18,939 | $16,442 | $15,782 | $14,443 |
| 3/31/2020 | $15,076 | $14,181 | $12,768 | $11,305 |
| 4/30/2020 | $17,710 | $16,059 | $14,670 | $12,858 |
| 5/31/2020 | $20,108 | $16,918 | $16,056 | $13,695 |
| 6/30/2020 | $21,176 | $17,304 | $16,673 | $14,179 |
| 7/31/2020 | $22,390 | $18,287 | $17,246 | $14,571 |
| 8/31/2020 | $24,012 | $19,612 | $18,258 | $15,392 |
| 9/30/2020 | $23,493 | $18,898 | $17,867 | $14,878 |
| 10/31/2020 | $24,012 | $18,490 | $18,002 | $15,190 |
| 11/30/2020 | $27,870 | $20,739 | $21,177 | $17,990 |
| 12/31/2020 | $30,463 | $21,672 | $23,156 | $19,546 |
| 1/31/2021 | $30,607 | $21,576 | $24,273 | $20,529 |
| 2/28/2021 | $32,778 | $22,250 | $25,074 | $21,809 |
| 3/31/2021 | $31,706 | $23,048 | $24,285 | $22,028 |
| 4/30/2021 | $33,523 | $24,236 | $24,815 | $22,491 |
| 5/31/2021 | $32,355 | $24,346 | $24,106 | $22,537 |
| 6/30/2021 | $33,711 | $24,947 | $25,237 | $22,974 |
| 7/31/2021 | $34,193 | $25,369 | $24,317 | $22,144 |
| 8/31/2021 | $34,563 | $26,092 | $24,759 | $22,639 |
| 9/30/2021 | $33,475 | $24,921 | $23,810 | $21,972 |
| 10/31/2021 | $35,640 | $26,607 | $24,925 | $22,906 |
| 11/30/2021 | $32,741 | $26,202 | $23,708 | $21,952 |
| 12/31/2021 | $32,998 | $27,234 | $23,813 | $22,442 |
| 1/31/2022 | $27,742 | $25,631 | $20,621 | $20,282 |
| 2/28/2022 | $27,121 | $24,986 | $20,711 | $20,498 |
| 3/31/2022 | $27,002 | $25,796 | $20,806 | $20,753 |
| 4/30/2022 | $23,502 | $23,481 | $18,253 | $18,697 |
| 5/31/2022 | $22,208 | $23,450 | $17,908 | $18,725 |
| 6/30/2022 | $20,234 | $21,488 | $16,800 | $17,185 |
| 7/31/2022 | $22,089 | $23,504 | $18,681 | $18,979 |
| 8/31/2022 | $21,442 | $22,627 | $18,505 | $18,591 |
| 9/30/2022 | $19,276 | $20,528 | $16,840 | $16,809 |
| 10/31/2022 | $20,564 | $22,212 | $18,439 | $18,659 |
| 11/30/2022 | $20,901 | $23,371 | $18,739 | $19,095 |
| 12/31/2022 | $19,712 | $22,003 | $17,536 | $17,856 |
| 1/31/2023 | $22,294 | $23,518 | $19,281 | $19,596 |
| 2/28/2023 | $21,601 | $22,968 | $19,072 | $19,265 |
| 3/31/2023 | $21,185 | $23,583 | $18,601 | $18,345 |
| 4/30/2023 | $20,934 | $23,834 | $18,385 | $18,015 |
| 5/31/2023 | $20,352 | $23,927 | $18,388 | $17,849 |
| 6/30/2023 | $22,472 | $25,560 | $19,913 | $19,300 |
| 7/31/2023 | $23,621 | $26,477 | $20,844 | $20,480 |
| 8/31/2023 | $22,928 | $25,966 | $19,759 | $19,455 |
| 9/30/2023 | $21,323 | $24,729 | $18,456 | $18,310 |
| 10/31/2023 | $19,415 | $24,073 | $17,032 | $17,061 |
| 11/30/2023 | $21,422 | $26,318 | $18,583 | $18,606 |
| 12/31/2023 | $23,899 | $27,714 | $20,808 | $20,879 |
| 1/31/2024 | $23,218 | $28,021 | $20,141 | $20,067 |
| 2/29/2024 | $24,559 | $29,538 | $21,777 | $21,201 |
| 3/31/2024 | $24,863 | $30,491 | $22,386 | $21,960 |
| 4/30/2024 | $23,106 | $29,149 | $20,662 | $20,415 |
| 5/31/2024 | $23,786 | $30,526 | $21,769 | $21,439 |
| 6/30/2024 | $23,905 | $31,471 | $21,732 | $21,241 |
| 7/31/2024 | $24,968 | $32,056 | $23,512 | $23,399 |
| 8/31/2024 | $25,470 | $32,754 | $23,251 | $23,049 |
| 9/30/2024 | $26,164 | $33,432 | $23,560 | $23,210 |
Fund performance shown in this graph represents past performance, which is not necessarily indicative of how the Fund will perform in the future.
Average Total Returns (%)
| Fund | Wasatch Small Cap Growth Fund |
|---|
| Total Net Assets | $2,150,491,470 |
| # of Portfolio Holdings | 49 |
| Portfolio Turnover Rate | 28% |
| Total Advisory Fees Paid | $21,337,058 |
| Fund | 1 Year | 5 Years | 10 Years |
|---|
| Investor Class | 22.70% | 8.22% | 10.10% |
Russell 3000® Index | 35.19% | 15.26% | 12.83% |
Russell 2000® Growth Index | 27.66% | 8.82% | 8.95% |
Russell 2000® Index | 26.76% | 9.39% | 8.78% |
The performance graph and total returns table do not reflect the deduction of taxes a shareholder would pay on Fund distributions or the redemption of Fund shares.
What did the Fund invest in?
The Fund invested in a variety of equity and debt securities. Opportunities continue to fluctuate with the volatility of the market and as banks continue to encounter risks.
| Top 10 | Value |
| Clearwater Analytics Holdings, Inc. A | 4.0% |
| HealthEquity, Inc. | 3.9% |
| RBC Bearings, Inc. | 3.8% |
| BellRing Brands, Inc. | 3.7% |
| Ensign Group, Inc. | 3.5% |
| AAON, Inc. | 3.2% |
| Paylocity Holding Corp. | 3.1% |
| Pinnacle Financial Partners, Inc. | 3.0% |
| Ollie's Bargain Outlet Holdings, Inc. | 2.9% |
| Globant SA | 2.9% |
| Industry | Value |
| Application Software | 10.3% |
| Building Products | 5.7% |
| IT Consulting & Other Services | 4.9% |
| Trading Companies & Distributors | 4.4% |
| Broadline Retail | 4.4% |
| Health Care Facilities | 4.2% |
| Managed Health Care | 3.9% |
| Industrial Machinery & Supplies & Components | 3.8% |
| Systems Software | 3.7% |
| Personal Care Products | 3.7% |
Portfolio Compositions (%)
| Asset Type | Value |
| Common Stocks | 98.2% |
| Preferred Stocks | 1.2% |
| Other Assets and Liabilities, Net | 0.6% |
| Total | 100.0% |
In order to reduce expenses, we will deliver a single copy of prospectuses, proxies, financial reports and other communication to shareholders with the same residential address. If you would like to receive individual mailings, please call [800-551-1700] and we will begin sending you separate copies of these materials within 30 days after receiving your request.
ALPS Distributors, Inc. serves as the Fund’s distributor.
If you wish to view additional information about the Fund; including but not limited to financial statements or holdings, please visit www.wasatchglobal.com.
Phone: 800-551-1700
Email: shareholderservice@wasatchfunds.com
Wasatch Small Cap Growth Fund
Annual Shareholder Report
September 30, 2024
Wasatch Small Cap Value Fund
Institutional Class WICVX
Annual Shareholder Report
September 30, 2024
This Annual shareholder report contains important information about Wasatch Small Cap Value Fund for the period of October 1, 2023 to September 30, 2024. You can find additional information about the Fund at www.wasatchglobal.com. You can also request this information by contacting us at 800-551-1700.
What were the Fund costs for last year?
Annual Fund Operating Expenses
(based on a hypothetical $10,000 investment)
| Class Name | Costs of a $10,000 investment | Costs paid as a percentage of a $10,000 investment |
|---|
| Institutional Class | $124 | 1.06% |
How did the fund perform last year and what affected its performance?
During the 12 months ended September 30, 2024, market conditions were characterized by an increasingly optimistic outlook, influenced by expectations of a pause in rate increases and potential rate cuts in 2024. The performance of small-cap value stocks was mixed, with the category initially trailing larger equities but later benefiting from increasing optimism about a potential economic “soft landing.” When the Federal Reserve enacted its first rate cut in September—the first rate cut in more than four years—it was favorable for smaller companies in general and small-cap value stocks in particular.
Our health-care and information-technology companies added most to performance relative to the benchmark Russell 2000® Value Index, while materials and consumer discretionary were the largest detractors. Our tilt toward the higher-growth end of the value category was a key factor in the Fund’s relative strength. One reason for the portfolio’s “growthier” bent is our emphasis on “Fallen Angels,” our term for growth stocks that have fallen into value territory. We believe this approach helps position the Fund for a range of outcomes in the economy and markets, rather than being solely tied to the direction of the broader value style.
Total return based on a $10,000 investment.
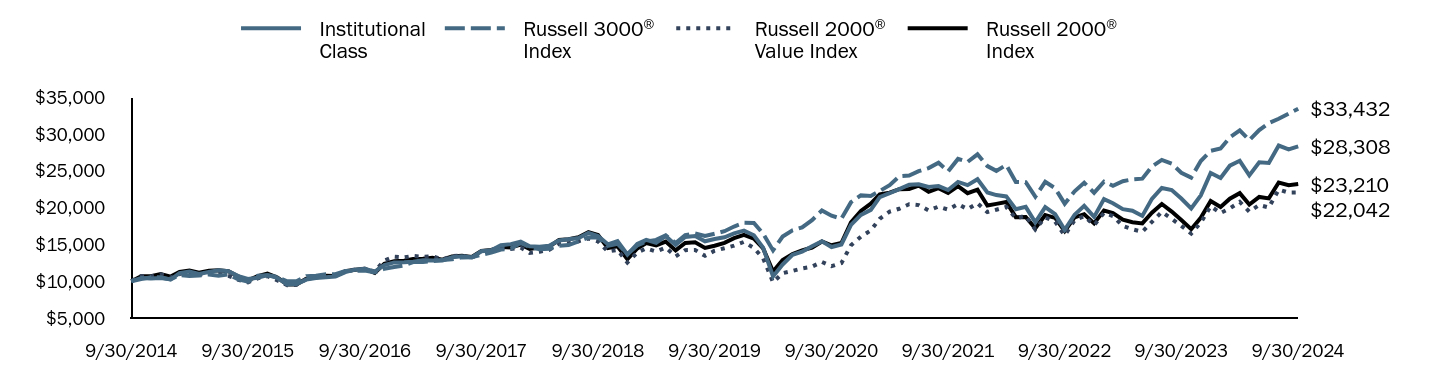
| Institutional Class | Russell 3000® Index | Russell 2000® Value Index | Russell 2000® Index |
|---|
| 9/30/2014 | $10,000 | $10,000 | $10,000 | $10,000 |
| 10/31/2014 | $10,437 | $10,275 | $10,699 | $10,659 |
| 11/30/2014 | $10,350 | $10,524 | $10,649 | $10,669 |
| 12/31/2014 | $10,437 | $10,524 | $10,940 | $10,973 |
| 1/31/2015 | $10,227 | $10,231 | $10,484 | $10,620 |
| 2/28/2015 | $11,084 | $10,824 | $10,971 | $11,250 |
| 3/31/2015 | $11,311 | $10,713 | $11,156 | $11,446 |
| 4/30/2015 | $10,997 | $10,762 | $10,918 | $11,154 |
| 5/31/2015 | $11,241 | $10,911 | $11,009 | $11,409 |
| 6/30/2015 | $11,486 | $10,728 | $11,023 | $11,494 |
| 7/31/2015 | $11,364 | $10,908 | $10,719 | $11,361 |
| 8/31/2015 | $10,699 | $10,249 | $10,193 | $10,647 |
| 9/30/2015 | $10,297 | $9,951 | $9,840 | $10,125 |
| 10/31/2015 | $10,472 | $10,736 | $10,391 | $10,695 |
| 11/30/2015 | $10,839 | $10,796 | $10,686 | $11,043 |
| 12/31/2015 | $10,461 | $10,574 | $10,123 | $10,488 |
| 1/31/2016 | $9,564 | $9,978 | $9,443 | $9,566 |
| 2/29/2016 | $9,617 | $9,975 | $9,507 | $9,566 |
| 3/31/2016 | $10,215 | $10,677 | $10,295 | $10,329 |
| 4/30/2016 | $10,426 | $10,743 | $10,513 | $10,491 |
| 5/31/2016 | $10,531 | $10,935 | $10,706 | $10,728 |
| 6/30/2016 | $10,637 | $10,958 | $10,738 | $10,721 |
| 7/31/2016 | $11,235 | $11,393 | $11,318 | $11,361 |
| 8/31/2016 | $11,569 | $11,422 | $11,599 | $11,562 |
| 9/30/2016 | $11,692 | $11,440 | $11,691 | $11,691 |
| 10/31/2016 | $11,305 | $11,192 | $11,306 | $11,135 |
| 11/30/2016 | $12,202 | $11,693 | $12,807 | $12,377 |
| 12/31/2016 | $12,547 | $11,921 | $13,336 | $12,723 |
| 1/31/2017 | $12,582 | $12,145 | $13,241 | $12,773 |
| 2/28/2017 | $12,653 | $12,597 | $13,432 | $13,020 |
| 3/31/2017 | $12,847 | $12,606 | $13,318 | $13,037 |
| 4/30/2017 | $12,811 | $12,739 | $13,371 | $13,180 |
| 5/31/2017 | $12,794 | $12,870 | $12,955 | $12,912 |
| 6/30/2017 | $13,252 | $12,986 | $13,408 | $13,358 |
| 7/31/2017 | $13,375 | $13,231 | $13,493 | $13,457 |
| 8/31/2017 | $13,217 | $13,256 | $13,161 | $13,286 |
| 9/30/2017 | $14,063 | $13,579 | $14,093 | $14,115 |
| 10/31/2017 | $14,204 | $13,876 | $14,111 | $14,236 |
| 11/30/2017 | $14,891 | $14,297 | $14,520 | $14,646 |
| 12/31/2017 | $15,032 | $14,440 | $14,381 | $14,587 |
| 1/31/2018 | $15,370 | $15,201 | $14,558 | $14,968 |
| 2/28/2018 | $14,731 | $14,641 | $13,830 | $14,389 |
| 3/31/2018 | $14,693 | $14,347 | $14,001 | $14,575 |
| 4/30/2018 | $14,806 | $14,402 | $14,244 | $14,701 |
| 5/31/2018 | $15,540 | $14,808 | $15,073 | $15,593 |
| 6/30/2018 | $15,709 | $14,905 | $15,164 | $15,705 |
| 7/31/2018 | $15,859 | $15,400 | $15,432 | $15,978 |
| 8/31/2018 | $16,555 | $15,940 | $15,799 | $16,667 |
| 9/30/2018 | $16,142 | $15,967 | $15,407 | $16,266 |
| 10/31/2018 | $15,013 | $14,791 | $14,028 | $14,500 |
| 11/30/2018 | $15,445 | $15,087 | $14,254 | $14,730 |
| 12/31/2018 | $13,618 | $13,683 | $12,531 | $12,980 |
| 1/31/2019 | $15,054 | $14,858 | $13,902 | $14,441 |
| 2/28/2019 | $15,608 | $15,380 | $14,442 | $15,191 |
| 3/31/2019 | $15,218 | $15,605 | $14,026 | $14,873 |
| 4/30/2019 | $16,120 | $16,228 | $14,556 | $15,379 |
| 5/31/2019 | $14,931 | $15,178 | $13,367 | $14,183 |
| 6/30/2019 | $15,997 | $16,244 | $14,218 | $15,185 |
| 7/31/2019 | $16,141 | $16,485 | $14,241 | $15,272 |
| 8/31/2019 | $15,423 | $16,149 | $13,447 | $14,518 |
| 9/30/2019 | $15,731 | $16,433 | $14,137 | $14,820 |
| 10/31/2019 | $15,956 | $16,786 | $14,479 | $15,211 |
| 11/30/2019 | $16,490 | $17,424 | $14,818 | $15,837 |
| 12/31/2019 | $16,861 | $17,928 | $15,337 | $16,294 |
| 1/31/2020 | $16,239 | $17,908 | $14,510 | $15,771 |
| 2/29/2020 | $14,536 | $16,442 | $13,100 | $14,443 |
| 3/31/2020 | $10,653 | $14,181 | $9,868 | $11,305 |
| 4/30/2020 | $12,272 | $16,059 | $11,085 | $12,858 |
| 5/31/2020 | $13,581 | $16,918 | $11,403 | $13,695 |
| 6/30/2020 | $13,996 | $17,304 | $11,734 | $14,179 |
| 7/31/2020 | $14,743 | $18,287 | $11,976 | $14,571 |
| 8/31/2020 | $15,408 | $19,612 | $12,621 | $15,392 |
| 9/30/2020 | $14,640 | $18,898 | $12,033 | $14,878 |
| 10/31/2020 | $14,993 | $18,490 | $12,464 | $15,190 |
| 11/30/2020 | $17,651 | $20,739 | $14,870 | $17,990 |
| 12/31/2020 | $19,000 | $21,672 | $16,048 | $19,546 |
| 1/31/2021 | $19,686 | $21,576 | $16,892 | $20,529 |
| 2/28/2021 | $21,430 | $22,250 | $18,479 | $21,809 |
| 3/31/2021 | $21,949 | $23,048 | $19,445 | $22,028 |
| 4/30/2021 | $22,510 | $24,236 | $19,838 | $22,491 |
| 5/31/2021 | $23,112 | $24,346 | $20,456 | $22,537 |
| 6/30/2021 | $23,153 | $24,947 | $20,332 | $22,974 |
| 7/31/2021 | $22,800 | $25,369 | $19,604 | $22,144 |
| 8/31/2021 | $22,925 | $26,092 | $20,129 | $22,639 |
| 9/30/2021 | $22,385 | $24,921 | $19,726 | $21,972 |
| 10/31/2021 | $23,486 | $26,607 | $20,478 | $22,906 |
| 11/30/2021 | $23,050 | $26,202 | $19,778 | $21,952 |
| 12/31/2021 | $23,851 | $27,234 | $20,585 | $22,442 |
| 1/31/2022 | $22,054 | $25,631 | $19,385 | $20,282 |
| 2/28/2022 | $21,695 | $24,986 | $19,705 | $20,498 |
| 3/31/2022 | $21,515 | $25,796 | $20,091 | $20,753 |
| 4/30/2022 | $19,763 | $23,481 | $18,532 | $18,697 |
| 5/31/2022 | $20,100 | $23,450 | $18,888 | $18,725 |
| 6/30/2022 | $17,989 | $21,488 | $17,022 | $17,185 |
| 7/31/2022 | $20,055 | $23,504 | $18,670 | $18,979 |
| 8/31/2022 | $19,112 | $22,627 | $18,079 | $18,591 |
| 9/30/2022 | $16,978 | $20,528 | $16,237 | $16,809 |
| 10/31/2022 | $19,022 | $22,212 | $18,281 | $18,659 |
| 11/30/2022 | $20,235 | $23,371 | $18,840 | $19,095 |
| 12/31/2022 | $18,730 | $22,003 | $17,604 | $17,856 |
| 1/31/2023 | $21,143 | $23,518 | $19,283 | $19,596 |
| 2/28/2023 | $20,592 | $22,968 | $18,839 | $19,265 |
| 3/31/2023 | $19,787 | $23,583 | $17,488 | $18,345 |
| 4/30/2023 | $19,581 | $23,834 | $17,052 | $18,015 |
| 5/31/2023 | $18,868 | $23,927 | $16,716 | $17,849 |
| 6/30/2023 | $21,189 | $25,560 | $18,044 | $19,300 |
| 7/31/2023 | $22,660 | $26,477 | $19,406 | $20,480 |
| 8/31/2023 | $22,384 | $25,966 | $18,472 | $19,455 |
| 9/30/2023 | $21,235 | $24,729 | $17,510 | $18,310 |
| 10/31/2023 | $19,879 | $24,073 | $16,466 | $17,061 |
| 11/30/2023 | $21,649 | $26,318 | $17,948 | $18,606 |
| 12/31/2023 | $24,686 | $27,714 | $20,182 | $20,879 |
| 1/31/2024 | $24,019 | $28,021 | $19,265 | $20,067 |
| 2/29/2024 | $25,687 | $29,538 | $19,895 | $21,201 |
| 3/31/2024 | $26,354 | $30,491 | $20,767 | $21,960 |
| 4/30/2024 | $24,376 | $29,149 | $19,444 | $20,415 |
| 5/31/2024 | $26,139 | $30,526 | $20,353 | $21,439 |
| 6/30/2024 | $26,068 | $31,471 | $20,010 | $21,241 |
| 7/31/2024 | $28,427 | $32,056 | $22,449 | $23,399 |
| 8/31/2024 | $27,903 | $32,754 | $22,028 | $23,049 |
| 9/30/2024 | $28,308 | $33,432 | $22,042 | $23,210 |
Fund performance shown in this graph represents past performance, which is not necessarily indicative of how the Fund will perform in the future.
Average Total Returns (%)
| Fund | Wasatch Small Cap Value Fund |
|---|
| Total Net Assets | $1,662,793,827 |
| # of Portfolio Holdings | 57 |
| Portfolio Turnover Rate | 69% |
| Total Advisory Fees Paid | $14,209,650 |
| Fund | 1 Year | 5 Years | 10 Years |
|---|
| Institutional Class | 33.31% | 12.47% | 10.97% |
Russell 3000® Index | 35.19% | 15.26% | 12.83% |
Russell 2000® Value Index | 25.88% | 9.29% | 8.22% |
Russell 2000® Index | 26.76% | 9.39% | 8.78% |
The performance graph and total returns table do not reflect the deduction of taxes a shareholder would pay on Fund distributions or the redemption of Fund shares.
What did the Fund invest in?
The Fund invested in a variety of equity and debt securities. Opportunities continue to fluctuate with the volatility of the market and as banks continue to encounter risks.
| Top 10 | Value |
| National Storage Affiliates Trust | 3.1% |
| Kadant, Inc. | 2.7% |
| Artisan Partners Asset Management, Inc. A | 2.6% |
| UFP Industries, Inc. | 2.6% |
| Pinnacle Financial Partners, Inc. | 2.6% |
| ICF International, Inc. | 2.4% |
| Valvoline, Inc. | 2.4% |
| Cohen & Steers, Inc. | 2.4% |
| Grand Canyon Education, Inc. | 2.4% |
| CTS Corp. | 2.3% |
| Industry | Value |
| Regional Banks | 11.2% |
| Asset Management & Custody Banks | 6.7% |
| Industrial Machinery & Supplies & Components | 5.8% |
| Electronic Manufacturing Services | 4.9% |
| Building Products | 3.8% |
| Homebuilding | 3.8% |
| Construction Machinery & Heavy Transportation Equipment | 3.5% |
| Oil & Gas Exploration & Production | 3.3% |
| Other Specialty Retail | 3.1% |
| Self-Storage REITs | 3.1% |
Portfolio Compositions (%)
| Asset Type | Value |
| Common Stocks | 98.1% |
| Other Assets and Liabilities, Net | 1.9% |
| Total | 100.0% |
In order to reduce expenses, we will deliver a single copy of prospectuses, proxies, financial reports and other communication to shareholders with the same residential address. If you would like to receive individual mailings, please call [800-551-1700] and we will begin sending you separate copies of these materials within 30 days after receiving your request.
ALPS Distributors, Inc. serves as the Fund’s distributor.
If you wish to view additional information about the Fund; including but not limited to financial statements or holdings, please visit www.wasatchglobal.com.
Phone: 800-551-1700
Email: shareholderservice@wasatchfunds.com
Wasatch Small Cap Value Fund
Annual Shareholder Report
September 30, 2024
Wasatch Small Cap Value Fund
Annual Shareholder Report
September 30, 2024
This Annual shareholder report contains important information about Wasatch Small Cap Value Fund for the period of October 1, 2023 to September 30, 2024. You can find additional information about the Fund at www.wasatchglobal.com. You can also request this information by contacting us at 800-551-1700.
What were the Fund costs for last year?
Annual Fund Operating Expenses
(based on a hypothetical $10,000 investment)
| Class Name | Costs of a $10,000 investment | Costs paid as a percentage of a $10,000 investment |
|---|
| Investor Class | $138 | 1.18% |
How did the fund perform last year and what affected its performance?
During the 12 months ended September 30, 2024, market conditions were characterized by an increasingly optimistic outlook, influenced by expectations of a pause in rate increases and potential rate cuts in 2024. The performance of small-cap value stocks was mixed, with the category initially trailing larger equities but later benefiting from increasing optimism about a potential economic “soft landing.” When the Federal Reserve enacted its first rate cut in September—the first rate cut in more than four years—it was favorable for smaller companies in general and small-cap value stocks in particular.
Our health-care and information-technology companies added most to performance relative to the benchmark Russell 2000® Value Index, while materials and consumer discretionary were the largest detractors. Our tilt toward the higher-growth end of the value category was a key factor in the Fund’s relative strength. One reason for the portfolio’s “growthier” bent is our emphasis on “Fallen Angels,” our term for growth stocks that have fallen into value territory. We believe this approach helps position the Fund for a range of outcomes in the economy and markets, rather than being solely tied to the direction of the broader value style.
Total return based on a $10,000 investment.
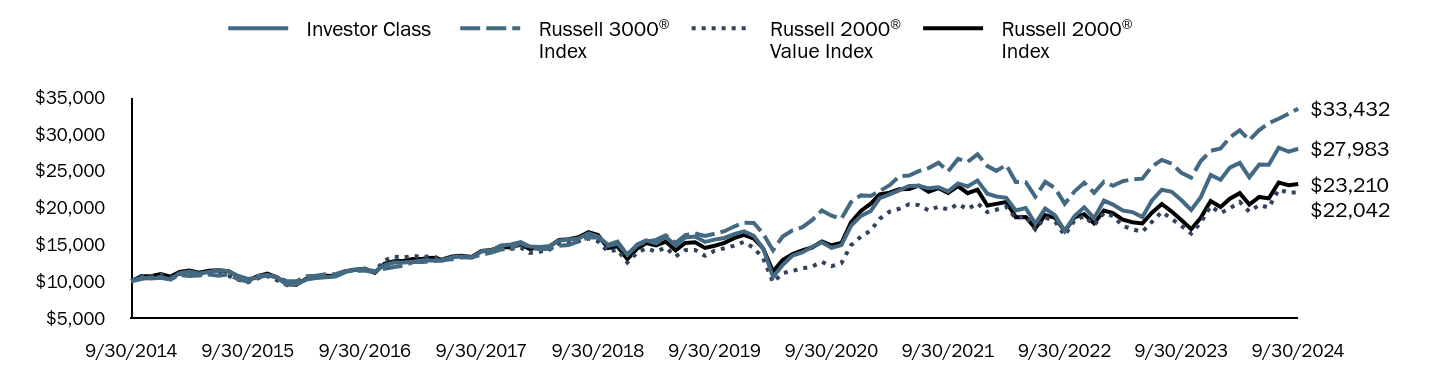
| Investor Class | Russell 3000® Index | Russell 2000® Value Index | Russell 2000® Index |
|---|
| 9/30/2014 | $10,000 | $10,000 | $10,000 | $10,000 |
| 10/31/2014 | $10,457 | $10,275 | $10,699 | $10,659 |
| 11/30/2014 | $10,369 | $10,524 | $10,649 | $10,669 |
| 12/31/2014 | $10,457 | $10,524 | $10,940 | $10,973 |
| 1/31/2015 | $10,246 | $10,231 | $10,484 | $10,620 |
| 2/28/2015 | $11,107 | $10,824 | $10,971 | $11,250 |
| 3/31/2015 | $11,318 | $10,713 | $11,156 | $11,446 |
| 4/30/2015 | $11,002 | $10,762 | $10,918 | $11,154 |
| 5/31/2015 | $11,248 | $10,911 | $11,009 | $11,409 |
| 6/30/2015 | $11,494 | $10,728 | $11,023 | $11,494 |
| 7/31/2015 | $11,371 | $10,908 | $10,719 | $11,361 |
| 8/31/2015 | $10,703 | $10,249 | $10,193 | $10,647 |
| 9/30/2015 | $10,299 | $9,951 | $9,840 | $10,125 |
| 10/31/2015 | $10,475 | $10,736 | $10,391 | $10,695 |
| 11/30/2015 | $10,844 | $10,796 | $10,686 | $11,043 |
| 12/31/2015 | $10,457 | $10,574 | $10,123 | $10,488 |
| 1/31/2016 | $9,574 | $9,978 | $9,443 | $9,566 |
| 2/29/2016 | $9,627 | $9,975 | $9,507 | $9,566 |
| 3/31/2016 | $10,210 | $10,677 | $10,295 | $10,329 |
| 4/30/2016 | $10,422 | $10,743 | $10,513 | $10,491 |
| 5/31/2016 | $10,528 | $10,935 | $10,706 | $10,728 |
| 6/30/2016 | $10,634 | $10,958 | $10,738 | $10,721 |
| 7/31/2016 | $11,235 | $11,393 | $11,318 | $11,361 |
| 8/31/2016 | $11,552 | $11,422 | $11,599 | $11,562 |
| 9/30/2016 | $11,676 | $11,440 | $11,691 | $11,691 |
| 10/31/2016 | $11,288 | $11,192 | $11,306 | $11,135 |
| 11/30/2016 | $12,188 | $11,693 | $12,807 | $12,377 |
| 12/31/2016 | $12,533 | $11,921 | $13,336 | $12,723 |
| 1/31/2017 | $12,550 | $12,145 | $13,241 | $12,773 |
| 2/28/2017 | $12,639 | $12,597 | $13,432 | $13,020 |
| 3/31/2017 | $12,833 | $12,606 | $13,318 | $13,037 |
| 4/30/2017 | $12,798 | $12,739 | $13,371 | $13,180 |
| 5/31/2017 | $12,762 | $12,870 | $12,955 | $12,912 |
| 6/30/2017 | $13,240 | $12,986 | $13,408 | $13,358 |
| 7/31/2017 | $13,346 | $13,231 | $13,493 | $13,457 |
| 8/31/2017 | $13,187 | $13,256 | $13,161 | $13,286 |
| 9/30/2017 | $14,035 | $13,579 | $14,093 | $14,115 |
| 10/31/2017 | $14,159 | $13,876 | $14,111 | $14,236 |
| 11/30/2017 | $14,848 | $14,297 | $14,520 | $14,646 |
| 12/31/2017 | $14,983 | $14,440 | $14,381 | $14,587 |
| 1/31/2018 | $15,322 | $15,201 | $14,558 | $14,968 |
| 2/28/2018 | $14,701 | $14,641 | $13,830 | $14,389 |
| 3/31/2018 | $14,644 | $14,347 | $14,001 | $14,575 |
| 4/30/2018 | $14,757 | $14,402 | $14,244 | $14,701 |
| 5/31/2018 | $15,492 | $14,808 | $15,073 | $15,593 |
| 6/30/2018 | $15,662 | $14,905 | $15,164 | $15,705 |
| 7/31/2018 | $15,794 | $15,400 | $15,432 | $15,978 |
| 8/31/2018 | $16,491 | $15,940 | $15,799 | $16,667 |
| 9/30/2018 | $16,076 | $15,967 | $15,407 | $16,266 |
| 10/31/2018 | $14,946 | $14,791 | $14,028 | $14,500 |
| 11/30/2018 | $15,379 | $15,087 | $14,254 | $14,730 |
| 12/31/2018 | $13,567 | $13,683 | $12,531 | $12,980 |
| 1/31/2019 | $14,986 | $14,858 | $13,902 | $14,441 |
| 2/28/2019 | $15,541 | $15,380 | $14,442 | $15,191 |
| 3/31/2019 | $15,150 | $15,605 | $14,026 | $14,873 |
| 4/30/2019 | $16,034 | $16,228 | $14,556 | $15,379 |
| 5/31/2019 | $14,863 | $15,178 | $13,367 | $14,183 |
| 6/30/2019 | $15,931 | $16,244 | $14,218 | $15,185 |
| 7/31/2019 | $16,055 | $16,485 | $14,241 | $15,272 |
| 8/31/2019 | $15,335 | $16,149 | $13,447 | $14,518 |
| 9/30/2019 | $15,644 | $16,433 | $14,137 | $14,820 |
| 10/31/2019 | $15,870 | $16,786 | $14,479 | $15,211 |
| 11/30/2019 | $16,384 | $17,424 | $14,818 | $15,837 |
| 12/31/2019 | $16,772 | $17,928 | $15,337 | $16,294 |
| 1/31/2020 | $16,149 | $17,908 | $14,510 | $15,771 |
| 2/29/2020 | $14,445 | $16,442 | $13,100 | $14,443 |
| 3/31/2020 | $10,579 | $14,181 | $9,868 | $11,305 |
| 4/30/2020 | $12,200 | $16,059 | $11,085 | $12,858 |
| 5/31/2020 | $13,489 | $16,918 | $11,403 | $13,695 |
| 6/30/2020 | $13,904 | $17,304 | $11,734 | $14,179 |
| 7/31/2020 | $14,652 | $18,287 | $11,976 | $14,571 |
| 8/31/2020 | $15,297 | $19,612 | $12,621 | $15,392 |
| 9/30/2020 | $14,528 | $18,898 | $12,033 | $14,878 |
| 10/31/2020 | $14,902 | $18,490 | $12,464 | $15,190 |
| 11/30/2020 | $17,521 | $20,739 | $14,870 | $17,990 |
| 12/31/2020 | $18,872 | $21,672 | $16,048 | $19,546 |
| 1/31/2021 | $19,537 | $21,576 | $16,892 | $20,529 |
| 2/28/2021 | $21,282 | $22,250 | $18,479 | $21,809 |
| 3/31/2021 | $21,781 | $23,048 | $19,445 | $22,028 |
| 4/30/2021 | $22,342 | $24,236 | $19,838 | $22,491 |
| 5/31/2021 | $22,945 | $24,346 | $20,456 | $22,537 |
| 6/30/2021 | $22,966 | $24,947 | $20,332 | $22,974 |
| 7/31/2021 | $22,613 | $25,369 | $19,604 | $22,144 |
| 8/31/2021 | $22,758 | $26,092 | $20,129 | $22,639 |
| 9/30/2021 | $22,197 | $24,921 | $19,726 | $21,972 |
| 10/31/2021 | $23,278 | $26,607 | $20,478 | $22,906 |
| 11/30/2021 | $22,862 | $26,202 | $19,778 | $21,952 |
| 12/31/2021 | $23,661 | $27,234 | $20,585 | $22,442 |
| 1/31/2022 | $21,886 | $25,631 | $19,385 | $20,282 |
| 2/28/2022 | $21,504 | $24,986 | $19,705 | $20,498 |
| 3/31/2022 | $21,324 | $25,796 | $20,091 | $20,753 |
| 4/30/2022 | $19,594 | $23,481 | $18,532 | $18,697 |
| 5/31/2022 | $19,931 | $23,450 | $18,888 | $18,725 |
| 6/30/2022 | $17,819 | $21,488 | $17,022 | $17,185 |
| 7/31/2022 | $19,864 | $23,504 | $18,670 | $18,979 |
| 8/31/2022 | $18,943 | $22,627 | $18,079 | $18,591 |
| 9/30/2022 | $16,830 | $20,528 | $16,237 | $16,809 |
| 10/31/2022 | $18,853 | $22,212 | $18,281 | $18,659 |
| 11/30/2022 | $20,044 | $23,371 | $18,840 | $19,095 |
| 12/31/2022 | $18,561 | $22,003 | $17,604 | $17,856 |
| 1/31/2023 | $20,952 | $23,518 | $19,283 | $19,596 |
| 2/28/2023 | $20,400 | $22,968 | $18,839 | $19,265 |
| 3/31/2023 | $19,596 | $23,583 | $17,488 | $18,345 |
| 4/30/2023 | $19,389 | $23,834 | $17,052 | $18,015 |
| 5/31/2023 | $18,699 | $23,927 | $16,716 | $17,849 |
| 6/30/2023 | $20,975 | $25,560 | $18,044 | $19,300 |
| 7/31/2023 | $22,424 | $26,477 | $19,406 | $20,480 |
| 8/31/2023 | $22,148 | $25,966 | $18,472 | $19,455 |
| 9/30/2023 | $21,021 | $24,729 | $17,510 | $18,310 |
| 10/31/2023 | $19,665 | $24,073 | $16,466 | $17,061 |
| 11/30/2023 | $21,412 | $26,318 | $17,948 | $18,606 |
| 12/31/2023 | $24,429 | $27,714 | $20,182 | $20,879 |
| 1/31/2024 | $23,785 | $28,021 | $19,265 | $20,067 |
| 2/29/2024 | $25,431 | $29,538 | $19,895 | $21,201 |
| 3/31/2024 | $26,075 | $30,491 | $20,767 | $21,960 |
| 4/30/2024 | $24,119 | $29,149 | $19,444 | $20,415 |
| 5/31/2024 | $25,860 | $30,526 | $20,353 | $21,439 |
| 6/30/2024 | $25,813 | $31,471 | $20,010 | $21,241 |
| 7/31/2024 | $28,127 | $32,056 | $22,449 | $23,399 |
| 8/31/2024 | $27,602 | $32,754 | $22,028 | $23,049 |
| 9/30/2024 | $27,983 | $33,432 | $22,042 | $23,210 |
Fund performance shown in this graph represents past performance, which is not necessarily indicative of how the Fund will perform in the future.
Average Total Returns (%)
| Fund | Wasatch Small Cap Value Fund |
|---|
| Total Net Assets | $1,662,793,827 |
| # of Portfolio Holdings | 57 |
| Portfolio Turnover Rate | 69% |
| Total Advisory Fees Paid | $14,209,650 |
| Fund | 1 Year | 5 Years | 10 Years |
|---|
| Investor Class | 33.12% | 12.33% | 10.84% |
Russell 3000® Index | 35.19% | 15.26% | 12.83% |
Russell 2000® Value Index | 25.88% | 9.29% | 8.22% |
Russell 2000® Index | 26.76% | 9.39% | 8.78% |
The performance graph and total returns table do not reflect the deduction of taxes a shareholder would pay on Fund distributions or the redemption of Fund shares.
What did the Fund invest in?
The Fund invested in a variety of equity and debt securities. Opportunities continue to fluctuate with the volatility of the market and as banks continue to encounter risks.
| Top 10 | Value |
| National Storage Affiliates Trust | 3.1% |
| Kadant, Inc. | 2.7% |
| Artisan Partners Asset Management, Inc. A | 2.6% |
| UFP Industries, Inc. | 2.6% |
| Pinnacle Financial Partners, Inc. | 2.6% |
| ICF International, Inc. | 2.4% |
| Valvoline, Inc. | 2.4% |
| Cohen & Steers, Inc. | 2.4% |
| Grand Canyon Education, Inc. | 2.4% |
| CTS Corp. | 2.3% |
| Industry | Value |
| Regional Banks | 11.2% |
| Asset Management & Custody Banks | 6.7% |
| Industrial Machinery & Supplies & Components | 5.8% |
| Electronic Manufacturing Services | 4.9% |
| Building Products | 3.8% |
| Homebuilding | 3.8% |
| Construction Machinery & Heavy Transportation Equipment | 3.5% |
| Oil & Gas Exploration & Production | 3.3% |
| Other Specialty Retail | 3.1% |
| Self-Storage REITs | 3.1% |
Portfolio Compositions (%)
| Asset Type | Value |
| Common Stocks | 98.1% |
| Other Assets and Liabilities, Net | 1.9% |
| Total | 100.0% |
In order to reduce expenses, we will deliver a single copy of prospectuses, proxies, financial reports and other communication to shareholders with the same residential address. If you would like to receive individual mailings, please call [800-551-1700] and we will begin sending you separate copies of these materials within 30 days after receiving your request.
ALPS Distributors, Inc. serves as the Fund’s distributor.
If you wish to view additional information about the Fund; including but not limited to financial statements or holdings, please visit www.wasatchglobal.com.
Phone: 800-551-1700
Email: shareholderservice@wasatchfunds.com
Wasatch Small Cap Value Fund
Annual Shareholder Report
September 30, 2024
Institutional Class WGUSX
Annual Shareholder Report
September 30, 2024
This Annual shareholder report contains important information about Wasatch U.S. Select Fund for the period of October 1, 2023 to September 30, 2024. You can find additional information about the Fund at www.wasatchglobal.com. You can also request this information by contacting us at 800-551-1700.
What were the Fund costs for last year?
Annual Fund Operating Expenses
(based on a hypothetical $10,000 investment)
| Class Name | Costs of a $10,000 investment | Costs paid as a percentage of a $10,000 investment |
|---|
| Institutional Class | $98 | 0.86% |
How did the fund perform last year and what affected its performance?
During the 12 months ended September 30, 2024, U.S. equities experienced sharp gains, fueled by optimism that the Federal Reserve may be able to end its interest-rate hiking cycle without tipping the economy into recession.
While the Fund experienced substantial gains during the period, it still underperformed the benchmark Russell 3000® Growth Index. Market leaders within the benchmark consisted of a narrow set of mega-cap stocks that are perceived to benefit from the advent of artificial intelligence. Our Fund tends to focus on small- and mid-cap stocks, which is where Wasatch has concentrated its research efforts over the firm’s nearly 50-year history, and did not hold these mega-cap companies. Our lack of exposure to those mega-cap firms was a headwind to our performance relative to the benchmark. While lack of exposure to a few mega-cap companies hurt performance from a relative standpoint, our companies generally produced strong fundamentals during the year, and we continue to like their long-term return potential.
Total return based on a $10,000 investment.
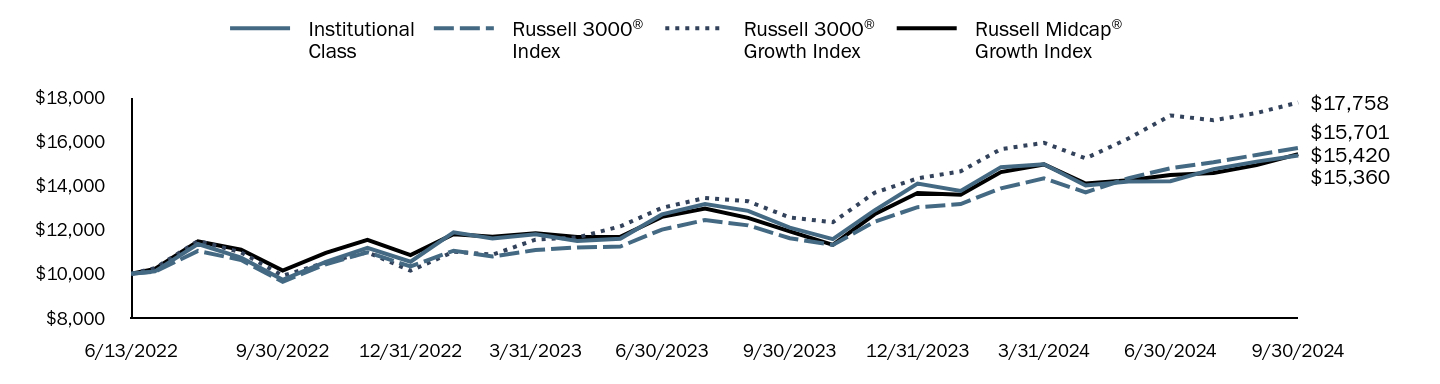
| Institutional Class | Russell 3000® Index | Russell 3000® Growth Index | Russell Midcap® Growth Index |
|---|
| 6/13/2022 | $10,000 | $10,000 | $10,000 | $10,000 |
| 6/30/2022 | $10,110 | $10,092 | $10,258 | $10,216 |
| 7/31/2022 | $11,350 | $11,038 | $11,485 | $11,467 |
| 8/31/2022 | $10,730 | $10,626 | $10,975 | $11,091 |
| 9/30/2022 | $9,730 | $9,641 | $9,913 | $10,150 |
| 10/31/2022 | $10,540 | $10,432 | $10,514 | $10,947 |
| 11/30/2022 | $11,180 | $10,976 | $10,974 | $11,543 |
| 12/31/2022 | $10,550 | $10,333 | $10,142 | $10,850 |
| 1/31/2023 | $11,880 | $11,045 | $10,998 | $11,797 |
| 2/28/2023 | $11,600 | $10,787 | $10,868 | $11,681 |
| 3/31/2023 | $11,790 | $11,075 | $11,547 | $11,841 |
| 4/30/2023 | $11,490 | $11,193 | $11,647 | $11,670 |
| 5/31/2023 | $11,590 | $11,237 | $12,147 | $11,677 |
| 6/30/2023 | $12,690 | $12,004 | $12,987 | $12,580 |
| 7/31/2023 | $13,160 | $12,435 | $13,434 | $12,960 |
| 8/31/2023 | $12,850 | $12,195 | $13,283 | $12,533 |
| 9/30/2023 | $12,090 | $11,614 | $12,553 | $11,923 |
| 10/31/2023 | $11,570 | $11,306 | $12,335 | $11,314 |
| 11/30/2023 | $12,870 | $12,360 | $13,670 | $12,694 |
| 12/31/2023 | $14,090 | $13,016 | $14,322 | $13,657 |
| 1/31/2024 | $13,750 | $13,160 | $14,639 | $13,583 |
| 2/29/2024 | $14,830 | $13,872 | $15,646 | $14,605 |
| 3/31/2024 | $14,960 | $14,320 | $15,930 | $14,954 |
| 4/30/2024 | $14,000 | $13,690 | $15,227 | $14,085 |
| 5/31/2024 | $14,180 | $14,336 | $16,135 | $14,235 |
| 6/30/2024 | $14,190 | $14,780 | $17,171 | $14,473 |
| 7/31/2024 | $14,740 | $15,055 | $16,954 | $14,561 |
| 8/31/2024 | $15,080 | $15,383 | $17,281 | $14,923 |
| 9/30/2024 | $15,360 | $15,701 | $17,758 | $15,420 |
Fund performance shown in this graph represents past performance, which is not necessarily indicative of how the Fund will perform in the future.
Average Total Returns (%)
| Fund | Wasatch U.S. Select Fund |
|---|
| Total Net Assets | $26,590,849 |
| # of Portfolio Holdings | 35 |
| Portfolio Turnover Rate | 36% |
| Total Advisory Fees Paid | $49,701 |
| Fund | 1 Year | Since Inception 6/13/22 |
|---|
| Institutional Class | 27.05% | 20.53% |
Russell 3000® Index | 35.19% | 21.67% |
Russell 3000® Growth Index | 41.47% | 28.36% |
Russell Midcap® Growth Index | 29.33% | 20.72% |
The performance graph and total returns table do not reflect the deduction of taxes a shareholder would pay on Fund distributions or the redemption of Fund shares.
What did the Fund invest in?
The Fund invested in a variety of equity and debt securities. Opportunities continue to fluctuate with the volatility of the market and as banks continue to encounter risks.
| Top 10 | Value |
| HealthEquity, Inc. | 4.0% |
| Workday, Inc. A | 3.9% |
| AMETEK, Inc. | 3.8% |
| HEICO Corp. A | 3.7% |
| Shift4 Payments, Inc. A | 3.7% |
| Roper Technologies, Inc. | 3.7% |
| Copart, Inc. | 3.6% |
| Ensign Group, Inc. | 3.3% |
| Morningstar, Inc. | 3.2% |
| Balchem Corp. | 3.2% |
| Industry | Value |
| Application Software | 22.4% |
| Transaction & Payment Processing Services | 5.7% |
| Financial Exchanges & Data | 5.4% |
| Life Sciences Tools & Services | 5.2% |
| Managed Health Care | 4.0% |
| Electrical Components & Equipment | 3.8% |
| Aerospace & Defense | 3.7% |
| Diversified Support Services | 3.6% |
| Health Care Facilities | 3.3% |
| Specialty Chemicals | 3.2% |
Portfolio Compositions (%)
| Asset Type | Value |
| Common Stocks | 98.4% |
| Other Assets and Liabilities, Net | 1.6% |
| Total | 100.0% |
In order to reduce expenses, we will deliver a single copy of prospectuses, proxies, financial reports and other communication to shareholders with the same residential address. If you would like to receive individual mailings, please call [800-551-1700] and we will begin sending you separate copies of these materials within 30 days after receiving your request.
ALPS Distributors, Inc. serves as the Fund’s distributor.
If you wish to view additional information about the Fund; including but not limited to financial statements or holdings, please visit www.wasatchglobal.com.
Phone: 800-551-1700
Email: shareholderservice@wasatchfunds.com
Annual Shareholder Report
September 30, 2024
Annual Shareholder Report
September 30, 2024
This Annual shareholder report contains important information about Wasatch U.S. Select Fund for the period of October 1, 2023 to September 30, 2024. You can find additional information about the Fund at www.wasatchglobal.com. You can also request this information by contacting us at 800-551-1700.
What were the Fund costs for last year?
Annual Fund Operating Expenses
(based on a hypothetical $10,000 investment)
| Class Name | Costs of a $10,000 investment | Costs paid as a percentage of a $10,000 investment |
|---|
| Investor Class | $115 | 1.01% |
How did the fund perform last year and what affected its performance?
During the 12 months ended September 30, 2024, U.S. equities experienced sharp gains, fueled by optimism that the Federal Reserve may be able to end its interest-rate hiking cycle without tipping the economy into recession.
While the Fund experienced substantial gains during the period, it still underperformed the benchmark Russell 3000® Growth Index. Market leaders within the benchmark consisted of a narrow set of mega-cap stocks that are perceived to benefit from the advent of artificial intelligence. Our Fund tends to focus on small- and mid-cap stocks, which is where Wasatch has concentrated its research efforts over the firm’s nearly 50-year history, and did not hold these mega-cap companies. Our lack of exposure to those mega-cap firms was a headwind to our performance relative to the benchmark. While lack of exposure to a few mega-cap companies hurt performance from a relative standpoint, our companies generally produced strong fundamentals during the year, and we continue to like their long-term return potential.
Total return based on a $10,000 investment.

| Investor Class | Russell 3000® Index | Russell 3000® Growth Index | Russell Midcap® Growth Index |
|---|
| 6/13/2022 | $10,000 | $10,000 | $10,000 | $10,000 |
| 6/30/2022 | $10,110 | $10,092 | $10,258 | $10,216 |
| 7/31/2022 | $11,350 | $11,038 | $11,485 | $11,467 |
| 8/31/2022 | $10,730 | $10,626 | $10,975 | $11,091 |
| 9/30/2022 | $9,740 | $9,641 | $9,913 | $10,150 |
| 10/31/2022 | $10,540 | $10,432 | $10,514 | $10,947 |
| 11/30/2022 | $11,180 | $10,976 | $10,974 | $11,543 |
| 12/31/2022 | $10,550 | $10,333 | $10,142 | $10,850 |
| 1/31/2023 | $11,880 | $11,045 | $10,998 | $11,797 |
| 2/28/2023 | $11,600 | $10,787 | $10,868 | $11,681 |
| 3/31/2023 | $11,780 | $11,075 | $11,547 | $11,841 |
| 4/30/2023 | $11,480 | $11,193 | $11,647 | $11,670 |
| 5/31/2023 | $11,580 | $11,237 | $12,147 | $11,677 |
| 6/30/2023 | $12,680 | $12,004 | $12,987 | $12,580 |
| 7/31/2023 | $13,140 | $12,435 | $13,434 | $12,960 |
| 8/31/2023 | $12,840 | $12,195 | $13,283 | $12,533 |
| 9/30/2023 | $12,070 | $11,614 | $12,553 | $11,923 |
| 10/31/2023 | $11,550 | $11,306 | $12,335 | $11,314 |
| 11/30/2023 | $12,850 | $12,360 | $13,670 | $12,694 |
| 12/31/2023 | $14,070 | $13,016 | $14,322 | $13,657 |
| 1/31/2024 | $13,720 | $13,160 | $14,639 | $13,583 |
| 2/29/2024 | $14,800 | $13,872 | $15,646 | $14,605 |
| 3/31/2024 | $14,930 | $14,320 | $15,930 | $14,954 |
| 4/30/2024 | $13,970 | $13,690 | $15,227 | $14,085 |
| 5/31/2024 | $14,150 | $14,336 | $16,135 | $14,235 |
| 6/30/2024 | $14,160 | $14,780 | $17,171 | $14,473 |
| 7/31/2024 | $14,710 | $15,055 | $16,954 | $14,561 |
| 8/31/2024 | $15,040 | $15,383 | $17,281 | $14,923 |
| 9/30/2024 | $15,320 | $15,701 | $17,758 | $15,420 |
Fund performance shown in this graph represents past performance, which is not necessarily indicative of how the Fund will perform in the future.
Average Total Returns (%)
| Fund | Wasatch U.S. Select Fund |
|---|
| Total Net Assets | $26,590,849 |
| # of Portfolio Holdings | 35 |
| Portfolio Turnover Rate | 36% |
| Total Advisory Fees Paid | $49,701 |
| Fund | 1 Year | Since Inception 6/13/22 |
|---|
| Investor Class | 26.93% | 20.39% |
Russell 3000® Index | 35.19% | 21.67% |
Russell 3000® Growth Index | 41.47% | 28.36% |
Russell Midcap® Growth Index | 29.33% | 20.72% |
The performance graph and total returns table do not reflect the deduction of taxes a shareholder would pay on Fund distributions or the redemption of Fund shares.
What did the Fund invest in?
The Fund invested in a variety of equity and debt securities. Opportunities continue to fluctuate with the volatility of the market and as banks continue to encounter risks.
| Top 10 | Value |
| HealthEquity, Inc. | 4.0% |
| Workday, Inc. A | 3.9% |
| AMETEK, Inc. | 3.8% |
| HEICO Corp. A | 3.7% |
| Shift4 Payments, Inc. A | 3.7% |
| Roper Technologies, Inc. | 3.7% |
| Copart, Inc. | 3.6% |
| Ensign Group, Inc. | 3.3% |
| Morningstar, Inc. | 3.2% |
| Balchem Corp. | 3.2% |
| Industry | Value |
| Application Software | 22.4% |
| Transaction & Payment Processing Services | 5.7% |
| Financial Exchanges & Data | 5.4% |
| Life Sciences Tools & Services | 5.2% |
| Managed Health Care | 4.0% |
| Electrical Components & Equipment | 3.8% |
| Aerospace & Defense | 3.7% |
| Diversified Support Services | 3.6% |
| Health Care Facilities | 3.3% |
| Specialty Chemicals | 3.2% |
Portfolio Compositions (%)
| Asset Type | Value |
| Common Stocks | 98.4% |
| Other Assets and Liabilities, Net | 1.6% |
| Total | 100.0% |
In order to reduce expenses, we will deliver a single copy of prospectuses, proxies, financial reports and other communication to shareholders with the same residential address. If you would like to receive individual mailings, please call [800-551-1700] and we will begin sending you separate copies of these materials within 30 days after receiving your request.
ALPS Distributors, Inc. serves as the Fund’s distributor.
If you wish to view additional information about the Fund; including but not limited to financial statements or holdings, please visit www.wasatchglobal.com.
Phone: 800-551-1700
Email: shareholderservice@wasatchfunds.com
Annual Shareholder Report
September 30, 2024
Wasatch Ultra Growth Fund
Institutional Class WGMCX
Annual Shareholder Report
September 30, 2024
This Annual shareholder report contains important information about Wasatch Ultra Growth Fund for the period of October 1, 2023 to September 30, 2024. You can find additional information about the Fund at www.wasatchglobal.com. You can also request this information by contacting us at 800-551-1700.
What were the Fund costs for last year?
Annual Fund Operating Expenses
(based on a hypothetical $10,000 investment)
| Class Name | Costs of a $10,000 investment | Costs paid as a percentage of a $10,000 investment |
|---|
| Institutional Class | $121 | 1.06% |
How did the fund perform last year and what affected its performance?
During the 12 months ended September 30, 2024, investors’ interest-rate expectations fluctuated, with markets anticipating rate cuts in some quarters and grappling with stubborn inflation in others. But optimism largely prevailed as the period progressed and the likelihood of rate cuts grew stronger, creating a favorable environment for U.S. equities.
The Fund focuses on identifying high-quality small companies with strong growth prospects and solid fundamentals. We also seek companies with innovative products or services, or those that utilize new technologies to do things better, faster and cheaper. Some of these companies accounted for our strong stock selection in health care—particularly in pharmaceuticals and biotechnology—which contributed the most, by a wide margin, to the Fund’s performance relative to the benchmark Russell 2000® Growth Index. Consumer staples was another area of strength for the Fund, and its underweight to energy, which was the only sector in the benchmark with a negative return, was beneficial. Conversely, our holdings in the information-technology, industrials and consumer-discretionary sectors underperformed and detracted from relative results.
Total return based on a $10,000 investment.
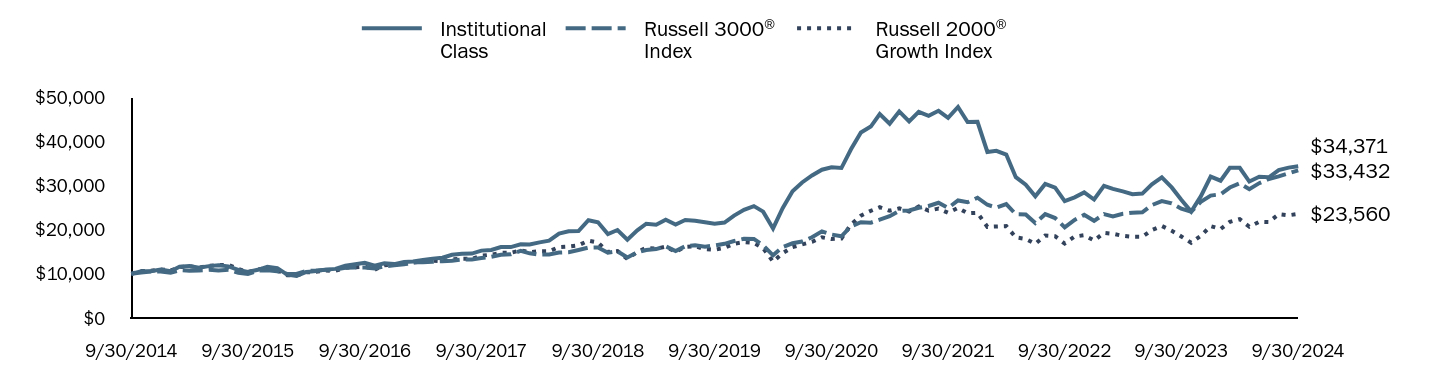
| Institutional Class | Russell 3000® Index | Russell 2000® Growth Index |
|---|
| 9/30/2014 | $10,000 | $10,000 | $10,000 |
| 10/31/2014 | $10,600 | $10,275 | $10,620 |
| 11/30/2014 | $10,587 | $10,524 | $10,689 |
| 12/31/2014 | $10,978 | $10,524 | $11,006 |
| 1/31/2015 | $10,598 | $10,231 | $10,755 |
| 2/28/2015 | $11,606 | $10,824 | $11,529 |
| 3/31/2015 | $11,767 | $10,713 | $11,736 |
| 4/30/2015 | $11,399 | $10,762 | $11,390 |
| 5/31/2015 | $11,744 | $10,911 | $11,809 |
| 6/30/2015 | $11,952 | $10,728 | $11,968 |
| 7/31/2015 | $11,687 | $10,908 | $12,016 |
| 8/31/2015 | $10,892 | $10,249 | $11,106 |
| 9/30/2015 | $10,402 | $9,951 | $10,404 |
| 10/31/2015 | $10,915 | $10,736 | $10,995 |
| 11/30/2015 | $11,618 | $10,796 | $11,398 |
| 12/31/2015 | $11,291 | $10,574 | $10,854 |
| 1/31/2016 | $9,816 | $9,978 | $9,678 |
| 2/29/2016 | $9,520 | $9,975 | $9,609 |
| 3/31/2016 | $10,425 | $10,677 | $10,346 |
| 4/30/2016 | $10,613 | $10,743 | $10,449 |
| 5/31/2016 | $10,952 | $10,935 | $10,730 |
| 6/30/2016 | $11,116 | $10,958 | $10,681 |
| 7/31/2016 | $11,850 | $11,393 | $11,379 |
| 8/31/2016 | $12,158 | $11,422 | $11,500 |
| 9/30/2016 | $12,491 | $11,440 | $11,666 |
| 10/31/2016 | $11,850 | $11,192 | $10,941 |
| 11/30/2016 | $12,397 | $11,693 | $11,920 |
| 12/31/2016 | $12,198 | $11,921 | $12,082 |
| 1/31/2017 | $12,674 | $12,145 | $12,278 |
| 2/28/2017 | $12,786 | $12,597 | $12,579 |
| 3/31/2017 | $13,136 | $12,606 | $12,728 |
| 4/30/2017 | $13,443 | $12,739 | $12,963 |
| 5/31/2017 | $13,653 | $12,870 | $12,845 |
| 6/30/2017 | $14,318 | $12,986 | $13,287 |
| 7/31/2017 | $14,548 | $13,231 | $13,400 |
| 8/31/2017 | $14,576 | $13,256 | $13,385 |
| 9/30/2017 | $15,255 | $13,579 | $14,113 |
| 10/31/2017 | $15,409 | $13,876 | $14,332 |
| 11/30/2017 | $16,045 | $14,297 | $14,743 |
| 12/31/2017 | $16,048 | $14,440 | $14,760 |
| 1/31/2018 | $16,697 | $15,201 | $15,336 |
| 2/28/2018 | $16,643 | $14,641 | $14,899 |
| 3/31/2018 | $17,128 | $14,347 | $15,100 |
| 4/30/2018 | $17,519 | $14,402 | $15,115 |
| 5/31/2018 | $19,115 | $14,808 | $16,066 |
| 6/30/2018 | $19,624 | $14,905 | $16,192 |
| 7/31/2018 | $19,679 | $15,400 | $16,470 |
| 8/31/2018 | $22,128 | $15,940 | $17,496 |
| 9/30/2018 | $21,658 | $15,967 | $17,086 |
| 10/31/2018 | $18,998 | $14,791 | $14,924 |
| 11/30/2018 | $19,921 | $15,087 | $15,158 |
| 12/31/2018 | $17,743 | $13,683 | $13,387 |
| 1/31/2019 | $19,829 | $14,858 | $14,933 |
| 2/28/2019 | $21,332 | $15,380 | $15,897 |
| 3/31/2019 | $21,096 | $15,605 | $15,682 |
| 4/30/2019 | $22,236 | $16,228 | $16,159 |
| 5/31/2019 | $21,172 | $15,178 | $14,960 |
| 6/30/2019 | $22,177 | $16,244 | $16,113 |
| 7/31/2019 | $21,991 | $16,485 | $16,270 |
| 8/31/2019 | $21,653 | $16,149 | $15,568 |
| 9/30/2019 | $21,366 | $16,433 | $15,440 |
| 10/31/2019 | $21,594 | $16,786 | $15,880 |
| 11/30/2019 | $23,190 | $17,424 | $16,814 |
| 12/31/2019 | $24,496 | $17,928 | $17,200 |
| 1/31/2020 | $25,323 | $17,908 | $17,010 |
| 2/29/2020 | $24,083 | $16,442 | $15,782 |
| 3/31/2020 | $20,274 | $14,181 | $12,768 |
| 4/30/2020 | $24,867 | $16,059 | $14,670 |
| 5/31/2020 | $28,692 | $16,918 | $16,056 |
| 6/30/2020 | $30,683 | $17,304 | $16,673 |
| 7/31/2020 | $32,268 | $18,287 | $17,246 |
| 8/31/2020 | $33,569 | $19,612 | $18,258 |
| 9/30/2020 | $34,104 | $18,898 | $17,867 |
| 10/31/2020 | $33,948 | $18,490 | $18,002 |
| 11/30/2020 | $38,188 | $20,739 | $21,177 |
| 12/31/2020 | $42,009 | $21,672 | $23,156 |
| 1/31/2021 | $43,340 | $21,576 | $24,273 |
| 2/28/2021 | $46,163 | $22,250 | $25,074 |
| 3/31/2021 | $43,997 | $23,048 | $24,285 |
| 4/30/2021 | $46,767 | $24,236 | $24,815 |
| 5/31/2021 | $44,485 | $24,346 | $24,106 |
| 6/30/2021 | $46,660 | $24,947 | $25,237 |
| 7/31/2021 | $45,755 | $25,369 | $24,317 |
| 8/31/2021 | $46,900 | $26,092 | $24,759 |
| 9/30/2021 | $45,320 | $24,921 | $23,810 |
| 10/31/2021 | $47,770 | $26,607 | $24,925 |
| 11/30/2021 | $44,352 | $26,202 | $23,708 |
| 12/31/2021 | $44,395 | $27,234 | $23,813 |
| 1/31/2022 | $37,583 | $25,631 | $20,621 |
| 2/28/2022 | $37,834 | $24,986 | $20,711 |
| 3/31/2022 | $37,001 | $25,796 | $20,806 |
| 4/30/2022 | $31,874 | $23,481 | $18,253 |
| 5/31/2022 | $30,169 | $23,450 | $17,908 |
| 6/30/2022 | $27,550 | $21,488 | $16,800 |
| 7/31/2022 | $30,339 | $23,504 | $18,681 |
| 8/31/2022 | $29,496 | $22,627 | $18,505 |
| 9/30/2022 | $26,456 | $20,528 | $16,840 |
| 10/31/2022 | $27,319 | $22,212 | $18,439 |
| 11/30/2022 | $28,423 | $23,371 | $18,739 |
| 12/31/2022 | $26,815 | $22,003 | $17,536 |
| 1/31/2023 | $29,900 | $23,518 | $19,281 |
| 2/28/2023 | $29,226 | $22,968 | $19,072 |
| 3/31/2023 | $28,664 | $23,583 | $18,601 |
| 4/30/2023 | $28,021 | $23,834 | $18,385 |
| 5/31/2023 | $28,162 | $23,927 | $18,388 |
| 6/30/2023 | $30,271 | $25,560 | $19,913 |
| 7/31/2023 | $31,819 | $26,477 | $20,844 |
| 8/31/2023 | $29,558 | $25,966 | $19,759 |
| 9/30/2023 | $26,755 | $24,729 | $18,456 |
| 10/31/2023 | $24,093 | $24,073 | $17,032 |
| 11/30/2023 | $27,529 | $26,318 | $18,583 |
| 12/31/2023 | $32,020 | $27,714 | $20,808 |
| 1/31/2024 | $31,085 | $28,021 | $20,141 |
| 2/29/2024 | $34,009 | $29,538 | $21,777 |
| 3/31/2024 | $33,989 | $30,491 | $22,386 |
| 4/30/2024 | $30,894 | $29,149 | $20,662 |
| 5/31/2024 | $31,969 | $30,526 | $21,769 |
| 6/30/2024 | $31,859 | $31,471 | $21,732 |
| 7/31/2024 | $33,466 | $32,056 | $23,512 |
| 8/31/2024 | $34,039 | $32,754 | $23,251 |
| 9/30/2024 | $34,371 | $33,432 | $23,560 |
Fund performance shown in this graph represents past performance, which is not necessarily indicative of how the Fund will perform in the future.
Average Total Returns (%)
| Fund | Wasatch Ultra Growth Fund |
|---|
| Total Net Assets | $966,113,516 |
| # of Portfolio Holdings | 64 |
| Portfolio Turnover Rate | 25% |
| Total Advisory Fees Paid | $10,520,014 |
| Fund | 1 Year | 5 Years | 10 Years |
|---|
| Institutional Class | 28.46% | 9.97% | 13.14% |
Russell 3000® Index | 35.19% | 15.26% | 12.83% |
Russell 2000® Growth Index | 27.66% | 8.82% | 8.95% |
The performance graph and total returns table do not reflect the deduction of taxes a shareholder would pay on Fund distributions or the redemption of Fund shares.
What did the Fund invest in?
The Fund invested in a variety of equity and debt securities. Opportunities continue to fluctuate with the volatility of the market and as banks continue to encounter risks.
| Top 10 | Value |
| Freshpet, Inc. | 4.3% |
| HealthEquity, Inc. | 3.4% |
| Shift4 Payments, Inc. A | 3.2% |
| Intra-Cellular Therapies, Inc. | 3.1% |
| Inspire Medical Systems, Inc. | 3.0% |
| Paylocity Holding Corp. | 3.0% |
| Exact Sciences Corp. | 2.9% |
| PDF Solutions, Inc. | 2.8% |
| Monday.com Ltd. | 2.6% |
| Globant SA | 2.5% |
| Industry | Value |
| Biotechnology | 10.2% |
| Semiconductor Materials & Equipment | 8.2% |
| Systems Software | 6.6% |
| Health Care Equipment | 6.1% |
| Application Software | 5.8% |
| Pharmaceuticals | 5.7% |
| Packaged Foods & Meats | 4.3% |
| IT Consulting & Other Services | 3.6% |
| Managed Health Care | 3.4% |
| Transaction & Payment Processing Services | 3.2% |
Portfolio Compositions (%)
| Asset Type | Value |
| Common Stocks | 98.0% |
| Preferred Stocks | 1.5% |
| Warrants | 0.1% |
| Other Assets and Liabilities, Net | 0.4% |
| Total | 100.0% |
In order to reduce expenses, we will deliver a single copy of prospectuses, proxies, financial reports and other communication to shareholders with the same residential address. If you would like to receive individual mailings, please call [800-551-1700] and we will begin sending you separate copies of these materials within 30 days after receiving your request.
ALPS Distributors, Inc. serves as the Fund’s distributor.
If you wish to view additional information about the Fund; including but not limited to financial statements or holdings, please visit www.wasatchglobal.com.
Phone: 800-551-1700
Email: shareholderservice@wasatchfunds.com
Wasatch Ultra Growth Fund
Annual Shareholder Report
September 30, 2024
Wasatch Ultra Growth Fund
Annual Shareholder Report
September 30, 2024
This Annual shareholder report contains important information about Wasatch Ultra Growth Fund for the period of October 1, 2023 to September 30, 2024. You can find additional information about the Fund at www.wasatchglobal.com. You can also request this information by contacting us at 800-551-1700.
What were the Fund costs for last year?
Annual Fund Operating Expenses
(based on a hypothetical $10,000 investment)
| Class Name | Costs of a $10,000 investment | Costs paid as a percentage of a $10,000 investment |
|---|
| Investor Class | $139 | 1.22% |
How did the fund perform last year and what affected its performance?
During the 12 months ended September 30, 2024, investors’ interest-rate expectations fluctuated, with markets anticipating rate cuts in some quarters and grappling with stubborn inflation in others. But optimism largely prevailed as the period progressed and the likelihood of rate cuts grew stronger, creating a favorable environment for U.S. equities.
The Fund focuses on identifying high-quality small companies with strong growth prospects and solid fundamentals. We also seek companies with innovative products or services, or those that utilize new technologies to do things better, faster and cheaper. Some of these companies accounted for our strong stock selection in health care—particularly in pharmaceuticals and biotechnology—which contributed the most, by a wide margin, to the Fund’s performance relative to the benchmark Russell 2000® Growth Index. Consumer staples was another area of strength for the Fund, and its underweight to energy, which was the only sector in the benchmark with a negative return, was beneficial. Conversely, our holdings in the information-technology, industrials and consumer-discretionary sectors underperformed and detracted from relative results.
Total return based on a $10,000 investment.
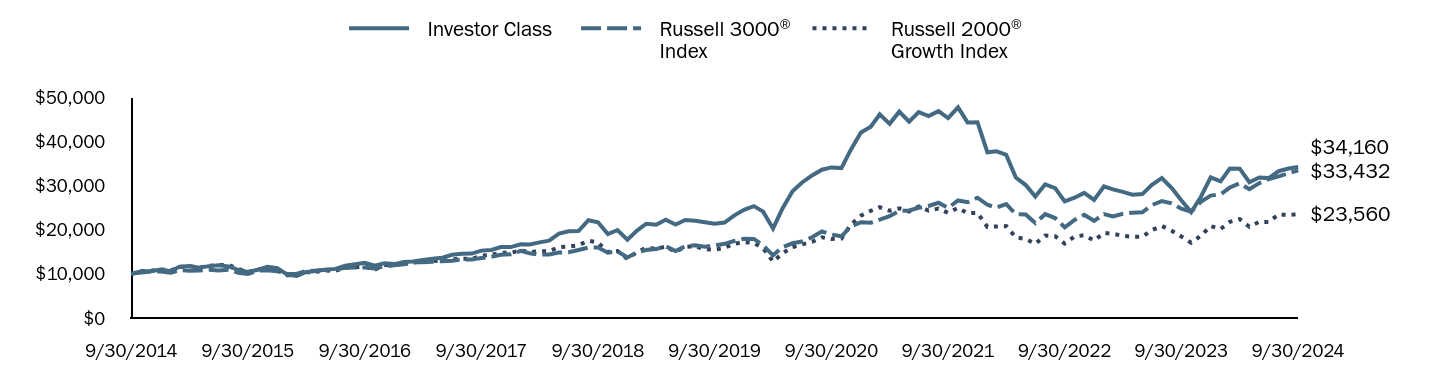
| Investor Class | Russell 3000® Index | Russell 2000® Growth Index |
|---|
| 9/30/2014 | $10,000 | $10,000 | $10,000 |
| 10/31/2014 | $10,600 | $10,275 | $10,620 |
| 11/30/2014 | $10,587 | $10,524 | $10,689 |
| 12/31/2014 | $10,978 | $10,524 | $11,006 |
| 1/31/2015 | $10,598 | $10,231 | $10,755 |
| 2/28/2015 | $11,606 | $10,824 | $11,529 |
| 3/31/2015 | $11,767 | $10,713 | $11,736 |
| 4/30/2015 | $11,399 | $10,762 | $11,390 |
| 5/31/2015 | $11,744 | $10,911 | $11,809 |
| 6/30/2015 | $11,952 | $10,728 | $11,968 |
| 7/31/2015 | $11,687 | $10,908 | $12,016 |
| 8/31/2015 | $10,892 | $10,249 | $11,106 |
| 9/30/2015 | $10,402 | $9,951 | $10,404 |
| 10/31/2015 | $10,915 | $10,736 | $10,995 |
| 11/30/2015 | $11,618 | $10,796 | $11,398 |
| 12/31/2015 | $11,291 | $10,574 | $10,854 |
| 1/31/2016 | $9,816 | $9,978 | $9,678 |
| 2/29/2016 | $9,520 | $9,975 | $9,609 |
| 3/31/2016 | $10,425 | $10,677 | $10,346 |
| 4/30/2016 | $10,613 | $10,743 | $10,449 |
| 5/31/2016 | $10,952 | $10,935 | $10,730 |
| 6/30/2016 | $11,116 | $10,958 | $10,681 |
| 7/31/2016 | $11,850 | $11,393 | $11,379 |
| 8/31/2016 | $12,158 | $11,422 | $11,500 |
| 9/30/2016 | $12,491 | $11,440 | $11,666 |
| 10/31/2016 | $11,850 | $11,192 | $10,941 |
| 11/30/2016 | $12,397 | $11,693 | $11,920 |
| 12/31/2016 | $12,198 | $11,921 | $12,082 |
| 1/31/2017 | $12,674 | $12,145 | $12,278 |
| 2/28/2017 | $12,786 | $12,597 | $12,579 |
| 3/31/2017 | $13,136 | $12,606 | $12,728 |
| 4/30/2017 | $13,443 | $12,739 | $12,963 |
| 5/31/2017 | $13,653 | $12,870 | $12,845 |
| 6/30/2017 | $14,318 | $12,986 | $13,287 |
| 7/31/2017 | $14,548 | $13,231 | $13,400 |
| 8/31/2017 | $14,576 | $13,256 | $13,385 |
| 9/30/2017 | $15,255 | $13,579 | $14,113 |
| 10/31/2017 | $15,409 | $13,876 | $14,332 |
| 11/30/2017 | $16,045 | $14,297 | $14,743 |
| 12/31/2017 | $16,048 | $14,440 | $14,760 |
| 1/31/2018 | $16,697 | $15,201 | $15,336 |
| 2/28/2018 | $16,643 | $14,641 | $14,899 |
| 3/31/2018 | $17,128 | $14,347 | $15,100 |
| 4/30/2018 | $17,519 | $14,402 | $15,115 |
| 5/31/2018 | $19,115 | $14,808 | $16,066 |
| 6/30/2018 | $19,624 | $14,905 | $16,192 |
| 7/31/2018 | $19,679 | $15,400 | $16,470 |
| 8/31/2018 | $22,128 | $15,940 | $17,496 |
| 9/30/2018 | $21,658 | $15,967 | $17,086 |
| 10/31/2018 | $18,998 | $14,791 | $14,924 |
| 11/30/2018 | $19,921 | $15,087 | $15,158 |
| 12/31/2018 | $17,743 | $13,683 | $13,387 |
| 1/31/2019 | $19,829 | $14,858 | $14,933 |
| 2/28/2019 | $21,332 | $15,380 | $15,897 |
| 3/31/2019 | $21,096 | $15,605 | $15,682 |
| 4/30/2019 | $22,236 | $16,228 | $16,159 |
| 5/31/2019 | $21,172 | $15,178 | $14,960 |
| 6/30/2019 | $22,177 | $16,244 | $16,113 |
| 7/31/2019 | $21,991 | $16,485 | $16,270 |
| 8/31/2019 | $21,653 | $16,149 | $15,568 |
| 9/30/2019 | $21,366 | $16,433 | $15,440 |
| 10/31/2019 | $21,594 | $16,786 | $15,880 |
| 11/30/2019 | $23,190 | $17,424 | $16,814 |
| 12/31/2019 | $24,496 | $17,928 | $17,200 |
| 1/31/2020 | $25,323 | $17,908 | $17,010 |
| 2/29/2020 | $24,083 | $16,442 | $15,782 |
| 3/31/2020 | $20,274 | $14,181 | $12,768 |
| 4/30/2020 | $24,867 | $16,059 | $14,670 |
| 5/31/2020 | $28,684 | $16,918 | $16,056 |
| 6/30/2020 | $30,683 | $17,304 | $16,673 |
| 7/31/2020 | $32,268 | $18,287 | $17,246 |
| 8/31/2020 | $33,561 | $19,612 | $18,258 |
| 9/30/2020 | $34,086 | $18,898 | $17,867 |
| 10/31/2020 | $33,940 | $18,490 | $18,002 |
| 11/30/2020 | $38,170 | $20,739 | $21,177 |
| 12/31/2020 | $41,983 | $21,672 | $23,156 |
| 1/31/2021 | $43,306 | $21,576 | $24,273 |
| 2/28/2021 | $46,120 | $22,250 | $25,074 |
| 3/31/2021 | $43,954 | $23,048 | $24,285 |
| 4/30/2021 | $46,715 | $24,236 | $24,815 |
| 5/31/2021 | $44,433 | $24,346 | $24,106 |
| 6/30/2021 | $46,599 | $24,947 | $25,237 |
| 7/31/2021 | $45,694 | $25,369 | $24,317 |
| 8/31/2021 | $46,830 | $26,092 | $24,759 |
| 9/30/2021 | $45,250 | $24,921 | $23,810 |
| 10/31/2021 | $47,691 | $26,607 | $24,925 |
| 11/30/2021 | $44,273 | $26,202 | $23,708 |
| 12/31/2021 | $44,326 | $27,234 | $23,813 |
| 1/31/2022 | $37,512 | $25,631 | $20,621 |
| 2/28/2022 | $37,763 | $24,986 | $20,711 |
| 3/31/2022 | $36,930 | $25,796 | $20,806 |
| 4/30/2022 | $31,802 | $23,481 | $18,253 |
| 5/31/2022 | $30,096 | $23,450 | $17,908 |
| 6/30/2022 | $27,477 | $21,488 | $16,800 |
| 7/31/2022 | $30,256 | $23,504 | $18,681 |
| 8/31/2022 | $29,413 | $22,627 | $18,505 |
| 9/30/2022 | $26,383 | $20,528 | $16,840 |
| 10/31/2022 | $27,236 | $22,212 | $18,439 |
| 11/30/2022 | $28,330 | $23,371 | $18,739 |
| 12/31/2022 | $26,724 | $22,003 | $17,536 |
| 1/31/2023 | $29,795 | $23,518 | $19,281 |
| 2/28/2023 | $29,112 | $22,968 | $19,072 |
| 3/31/2023 | $28,560 | $23,583 | $18,601 |
| 4/30/2023 | $27,908 | $23,834 | $18,385 |
| 5/31/2023 | $28,049 | $23,927 | $18,388 |
| 6/30/2023 | $30,146 | $25,560 | $19,913 |
| 7/31/2023 | $31,681 | $26,477 | $20,844 |
| 8/31/2023 | $29,423 | $25,966 | $19,759 |
| 9/30/2023 | $26,634 | $24,729 | $18,456 |
| 10/31/2023 | $23,974 | $24,073 | $17,032 |
| 11/30/2023 | $27,396 | $26,318 | $18,583 |
| 12/31/2023 | $31,852 | $27,714 | $20,808 |
| 1/31/2024 | $30,919 | $28,021 | $20,141 |
| 2/29/2024 | $33,829 | $29,538 | $21,777 |
| 3/31/2024 | $33,809 | $30,491 | $22,386 |
| 4/30/2024 | $30,728 | $29,149 | $20,662 |
| 5/31/2024 | $31,792 | $30,526 | $21,769 |
| 6/30/2024 | $31,671 | $31,471 | $21,732 |
| 7/31/2024 | $33,267 | $32,056 | $23,512 |
| 8/31/2024 | $33,839 | $32,754 | $23,251 |
| 9/30/2024 | $34,160 | $33,432 | $23,560 |
Fund performance shown in this graph represents past performance, which is not necessarily indicative of how the Fund will perform in the future.
Average Total Returns (%)
| Fund | Wasatch Ultra Growth Fund |
|---|
| Total Net Assets | $966,113,516 |
| # of Portfolio Holdings | 64 |
| Portfolio Turnover Rate | 25% |
| Total Advisory Fees Paid | $10,520,014 |
| Fund | 1 Year | 5 Years | 10 Years |
|---|
| Investor Class | 28.26% | 9.84% | 13.07% |
Russell 3000® Index | 35.19% | 15.26% | 12.83% |
Russell 2000® Growth Index | 27.66% | 8.82% | 8.95% |
The performance graph and total returns table do not reflect the deduction of taxes a shareholder would pay on Fund distributions or the redemption of Fund shares.
What did the Fund invest in?
The Fund invested in a variety of equity and debt securities. Opportunities continue to fluctuate with the volatility of the market and as banks continue to encounter risks.
| Top 10 | Value |
| Freshpet, Inc. | 4.3% |
| HealthEquity, Inc. | 3.4% |
| Shift4 Payments, Inc. A | 3.2% |
| Intra-Cellular Therapies, Inc. | 3.1% |
| Inspire Medical Systems, Inc. | 3.0% |
| Paylocity Holding Corp. | 3.0% |
| Exact Sciences Corp. | 2.9% |
| PDF Solutions, Inc. | 2.8% |
| Monday.com Ltd. | 2.6% |
| Globant SA | 2.5% |
| Industry | Value |
| Biotechnology | 10.2% |
| Semiconductor Materials & Equipment | 8.2% |
| Systems Software | 6.6% |
| Health Care Equipment | 6.1% |
| Application Software | 5.8% |
| Pharmaceuticals | 5.7% |
| Packaged Foods & Meats | 4.3% |
| IT Consulting & Other Services | 3.6% |
| Managed Health Care | 3.4% |
| Transaction & Payment Processing Services | 3.2% |
Portfolio Compositions (%)
| Asset Type | Value |
| Common Stocks | 98.0% |
| Preferred Stocks | 1.5% |
| Warrants | 0.1% |
| Other Assets and Liabilities, Net | 0.4% |
| Total | 100.0% |
In order to reduce expenses, we will deliver a single copy of prospectuses, proxies, financial reports and other communication to shareholders with the same residential address. If you would like to receive individual mailings, please call [800-551-1700] and we will begin sending you separate copies of these materials within 30 days after receiving your request.
ALPS Distributors, Inc. serves as the Fund’s distributor.
If you wish to view additional information about the Fund; including but not limited to financial statements or holdings, please visit www.wasatchglobal.com.
Phone: 800-551-1700
Email: shareholderservice@wasatchfunds.com
Wasatch Ultra Growth Fund
Annual Shareholder Report
September 30, 2024
Wasatch-Hoisington U.S. Treasury Fund
Annual Shareholder Report
September 30, 2024
This Annual shareholder report contains important information about Wasatch-Hoisington U.S. Treasury Fund for the period of October 1, 2023 to September 30, 2024. You can find additional information about the Fund at www.wasatchglobal.com. You can also request this information by contacting us at 800-551-1700.
What were the Fund costs for last year?
Annual Fund Operating Expenses
(based on a hypothetical $10,000 investment)
| Fund Name | Costs of a $10,000 investment | Costs paid as a percentage of a $10,000 investment |
|---|
| Wasatch-Hoisington U.S. Treasury Fund | $78 | 0.73% |
How did the fund perform last year and what affected its performance?
Invested in long-dated U.S. Treasury securities, the Fund benefited from lower yields during the 12 months ended September 30, 2024, and outperformed the benchmark Bloomberg U.S. Aggregate Bond Index. Thirty-year Treasury bond yields closed at 4.13% at the end of September, down from 4.71% a year ago. The Fund’s managers position it in long-dated bonds when they expect inflation to fall, which happened over the period. Treasury yields decreased over the Fund’s fiscal year as three significant measures of inflation decreased during the period. Over the 12-month period, the overall Consumer Price Index (commonly called “headline CPI”), core CPI (which excludes volatile food and energy prices) and headline CPI excluding shelter increased by 2.4%, 3.3% and 1.1%, respectively. These levels were substantially below their respective numbers of 3.7%, 4.2%, and 2.0% for the twelve months ended September 30, 2023. Shelter is widely considered to lag current changes in inflation, and thus, its exclusion provides a far better indication of actual inflation.
Inflationary expectations are the primary fundamental determinant of long-term Treasury bond yields. Inflation receded since the real and detrended broad money supply has declined over the last four years, and the rise of inventory investment in the first half of 2024 indicated an increased supply of goods.
Total return based on a $10,000 investment.
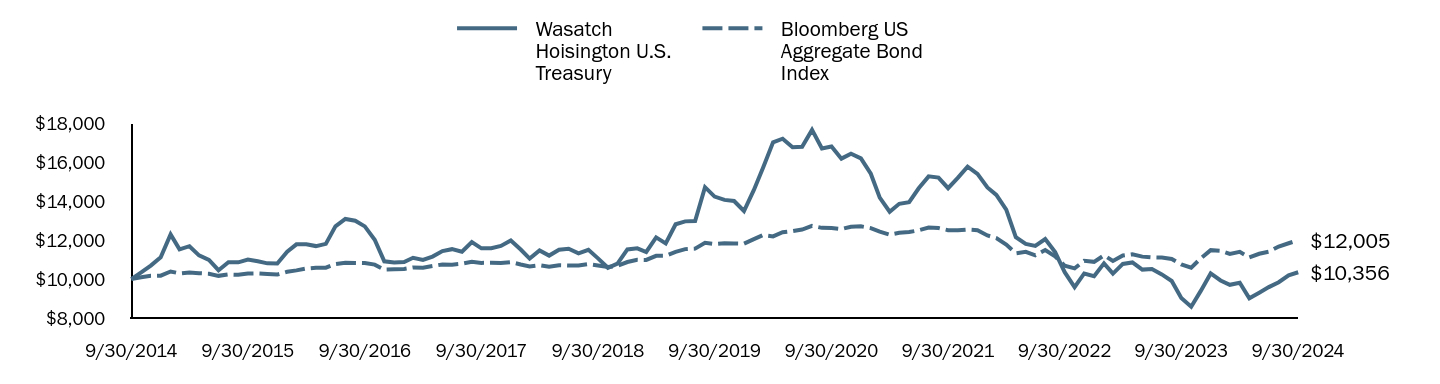
| Wasatch Hoisington U.S. Treasury | Bloomberg US Aggregate Bond Index |
|---|
| 9/30/2014 | $10,000 | $10,000 |
| 10/31/2014 | $10,345 | $10,098 |
| 11/30/2014 | $10,697 | $10,170 |
| 12/31/2014 | $11,121 | $10,180 |
| 1/31/2015 | $12,304 | $10,393 |
| 2/28/2015 | $11,533 | $10,295 |
| 3/31/2015 | $11,695 | $10,343 |
| 4/30/2015 | $11,222 | $10,306 |
| 5/31/2015 | $10,985 | $10,281 |
| 6/30/2015 | $10,459 | $10,169 |
| 7/31/2015 | $10,869 | $10,240 |
| 8/31/2015 | $10,863 | $10,225 |
| 9/30/2015 | $11,009 | $10,294 |
| 10/31/2015 | $10,919 | $10,296 |
| 11/30/2015 | $10,812 | $10,269 |
| 12/31/2015 | $10,805 | $10,235 |
| 1/31/2016 | $11,411 | $10,376 |
| 2/29/2016 | $11,790 | $10,450 |
| 3/31/2016 | $11,797 | $10,546 |
| 4/30/2016 | $11,701 | $10,586 |
| 5/31/2016 | $11,816 | $10,589 |
| 6/30/2016 | $12,714 | $10,779 |
| 7/31/2016 | $13,096 | $10,847 |
| 8/31/2016 | $13,007 | $10,835 |
| 9/30/2016 | $12,714 | $10,829 |
| 10/31/2016 | $12,029 | $10,746 |
| 11/30/2016 | $10,915 | $10,492 |
| 12/31/2016 | $10,855 | $10,506 |
| 1/31/2017 | $10,883 | $10,527 |
| 2/28/2017 | $11,100 | $10,598 |
| 3/31/2017 | $10,985 | $10,592 |
| 4/30/2017 | $11,161 | $10,674 |
| 5/31/2017 | $11,442 | $10,756 |
| 6/30/2017 | $11,542 | $10,745 |
| 7/31/2017 | $11,408 | $10,792 |
| 8/31/2017 | $11,910 | $10,888 |
| 9/30/2017 | $11,587 | $10,837 |
| 10/31/2017 | $11,587 | $10,843 |
| 11/30/2017 | $11,708 | $10,829 |
| 12/31/2017 | $11,990 | $10,879 |
| 1/31/2018 | $11,526 | $10,753 |
| 2/28/2018 | $11,055 | $10,651 |
| 3/31/2018 | $11,477 | $10,720 |
| 4/30/2018 | $11,212 | $10,640 |
| 5/31/2018 | $11,513 | $10,716 |
| 6/30/2018 | $11,562 | $10,703 |
| 7/31/2018 | $11,324 | $10,705 |
| 8/31/2018 | $11,512 | $10,774 |
| 9/30/2018 | $11,069 | $10,705 |
| 10/31/2018 | $10,583 | $10,620 |
| 11/30/2018 | $10,801 | $10,684 |
| 12/31/2018 | $11,530 | $10,880 |
| 1/31/2019 | $11,588 | $10,995 |
| 2/28/2019 | $11,398 | $10,989 |
| 3/31/2019 | $12,148 | $11,200 |
| 4/30/2019 | $11,840 | $11,203 |
| 5/31/2019 | $12,823 | $11,402 |
| 6/30/2019 | $12,973 | $11,545 |
| 7/31/2019 | $12,995 | $11,570 |
| 8/31/2019 | $14,734 | $11,870 |
| 9/30/2019 | $14,250 | $11,807 |
| 10/31/2019 | $14,080 | $11,842 |
| 11/30/2019 | $14,021 | $11,836 |
| 12/31/2019 | $13,507 | $11,828 |
| 1/31/2020 | $14,592 | $12,056 |
| 2/29/2020 | $15,744 | $12,273 |
| 3/31/2020 | $17,040 | $12,201 |
| 4/30/2020 | $17,227 | $12,417 |
| 5/31/2020 | $16,786 | $12,475 |
| 6/30/2020 | $16,812 | $12,554 |
| 7/31/2020 | $17,680 | $12,741 |
| 8/31/2020 | $16,722 | $12,639 |
| 9/30/2020 | $16,824 | $12,632 |
| 10/31/2020 | $16,201 | $12,575 |
| 11/30/2020 | $16,456 | $12,699 |
| 12/31/2020 | $16,218 | $12,716 |
| 1/31/2021 | $15,423 | $12,625 |
| 2/28/2021 | $14,195 | $12,443 |
| 3/31/2021 | $13,469 | $12,287 |
| 4/30/2021 | $13,879 | $12,384 |
| 5/31/2021 | $13,960 | $12,425 |
| 6/30/2021 | $14,674 | $12,512 |
| 7/31/2021 | $15,289 | $12,652 |
| 8/31/2021 | $15,224 | $12,628 |
| 9/30/2021 | $14,681 | $12,519 |
| 10/31/2021 | $15,224 | $12,515 |
| 11/30/2021 | $15,792 | $12,552 |
| 12/31/2021 | $15,417 | $12,520 |
| 1/31/2022 | $14,717 | $12,250 |
| 2/28/2022 | $14,334 | $12,114 |
| 3/31/2022 | $13,573 | $11,777 |
| 4/30/2022 | $12,159 | $11,330 |
| 5/31/2022 | $11,816 | $11,403 |
| 6/30/2022 | $11,709 | $11,224 |
| 7/31/2022 | $12,063 | $11,499 |
| 8/31/2022 | $11,389 | $11,174 |
| 9/30/2022 | $10,359 | $10,691 |
| 10/31/2022 | $9,590 | $10,552 |
| 11/30/2022 | $10,292 | $10,940 |
| 12/31/2022 | $10,154 | $10,891 |
| 1/31/2023 | $10,811 | $11,226 |
| 2/28/2023 | $10,287 | $10,936 |
| 3/31/2023 | $10,783 | $11,214 |
| 4/30/2023 | $10,858 | $11,282 |
| 5/31/2023 | $10,490 | $11,159 |
| 6/30/2023 | $10,521 | $11,119 |
| 7/31/2023 | $10,243 | $11,111 |
| 8/31/2023 | $9,905 | $11,040 |
| 9/30/2023 | $9,031 | $10,760 |
| 10/31/2023 | $8,581 | $10,590 |
| 11/30/2023 | $9,396 | $11,070 |
| 12/31/2023 | $10,291 | $11,493 |
| 1/31/2024 | $9,932 | $11,462 |
| 2/29/2024 | $9,709 | $11,300 |
| 3/31/2024 | $9,816 | $11,404 |
| 4/30/2024 | $9,014 | $11,116 |
| 5/31/2024 | $9,299 | $11,305 |
| 6/30/2024 | $9,589 | $11,412 |
| 7/31/2024 | $9,842 | $11,678 |
| 8/31/2024 | $10,199 | $11,846 |
| 9/30/2024 | $10,356 | $12,005 |
Fund performance shown in this graph represents past performance, which is not necessarily indicative of how the Fund will perform in the future.
Average Total Returns (%)
| Fund | Wasatch-Hoisington U.S. Treasury Fund |
|---|
| Total Net Assets | $185,134,797 |
| # of Portfolio Holdings | 6 |
| Portfolio Turnover Rate | 83% |
| Total Advisory Fees Paid | $963,676 |
| Fund | 1 Year | 5 Years | 10 Years |
|---|
| Wasatch Hoisington U.S. Treasury | 14.68% | (6.18%) | 0.35% |
| Bloomberg US Aggregate Bond Index | 11.57% | 0.33% | 1.84% |
The performance graph and total returns table do not reflect the deduction of taxes a shareholder would pay on Fund distributions or the redemption of Fund shares.
What did the Fund invest in?
The Fund invested in a variety of equity and debt securities. Opportunities continue to fluctuate with the volatility of the market and as banks continue to encounter risks.
| Top 10 | Value |
| U.S. Treasury STRIPS Principal –% due 08/15/47 | 32.6% |
| U.S. Treasury Bonds 1.875% due 11/15/51 | 24.3% |
| U.S. Treasury Bonds 1.250% due 05/15/50 | 16.0% |
| U.S. Treasury Bonds 1.375% due 08/15/50 | 14.2% |
| U.S. Treasury STRIPS Principal 3.625% due 05/15/53 | 5.9% |
| U.S. Treasury STRIPS Principal 2.000% due 08/15/51 | 5.9% |
| Industry | Value |
| Sovereign | 98.8% |
Portfolio Compositions (%)
| Asset Type | Value |
| U.S. Government Obligations | 98.8% |
| Other Assets and Liabilities, Net | 1.2% |
| Total | 100.0% |
In order to reduce expenses, we will deliver a single copy of prospectuses, proxies, financial reports and other communication to shareholders with the same residential address. If you would like to receive individual mailings, please call [800-551-1700] and we will begin sending you separate copies of these materials within 30 days after receiving your request.
ALPS Distributors, Inc. serves as the Fund’s distributor.
If you wish to view additional information about the Fund; including but not limited to financial statements or holdings, please visit www.wasatchglobal.com.
Phone: 800-551-1700
Email: shareholderservice@wasatchfunds.com
Wasatch-Hoisington U.S. Treasury Fund
Annual Shareholder Report
September 30, 2024
| (a) | Wasatch Funds Trust (the “Registrant”) has adopted a Code of Ethics that applies to the Registrant’s principal executive officer and principal financial officer. |
| (b) | No disclosures are required by this Item 2(b). |
| (c) | There have been no amendments to the Registrant’s Code of Ethics during the reporting period for this Form N-CSR. |
| (d) | There have been no waivers granted by the Registrant to individuals covered by the Registrant’s Code of Ethics during the reporting period for this Form N-CSR. |
| (f) | A copy of the Registrant’s Code of Ethics is attached as an exhibit to this Form N-CSR. |
| Item 3. | Audit Committee Financial Expert. |
| (1) | The Board of Trustees of the Registrant has determined that the Registrant has at least one member serving on the Registrant’s Audit Committee that possesses the attributes identified in Instruction 2(b) of Item 3 to Form N-CSR to qualify as an “audit committee financial expert.” |
| (2) | The name of the audit committee financial experts are Kate Fleming, Kristen Fletcher, and Mark Robinson. Each is deemed to be “independent” as that term is defined in Item 3(a)(2) of Form N-CSR. |
| Item 4. | Principal Accountant Fees and Services. |
| (a) | Audit Fees - The aggregate fees billed for professional services rendered by the independent registered public accounting firm for the audit of the Registrant’s annual financial statements or services normally provided in connection with statutory and regulatory filings or engagements for the last two fiscal years ended September 30, 2024 and 2023 were $657,800 and $692,384, respectively. |
| (b) | Audit Related Fees – During the fiscal years ended September 30, 2024 and 2023, the Registrant was not billed any fees by the independent registered public accounting firm for assurance and related services rendered by the independent registered public accounting firm to the Registrant that are reasonably related to the performance of the audit of the Registrant’s financial statements and are not reported under paragraph (a) of this Item 4. |
During the fiscal years ended September 30, 2024 and 2023, no fees for assurance and related services that relate directly to the operations and financial reporting of the Registrant were billed by the independent registered public accounting firm to the Registrant’s investment adviser (the “Advisor”) or any other entity controlling, controlled by, or under common control with the Advisor that provides ongoing services to the Registrant.
| (c) | Tax Fees - The aggregate fees billed for professional services rendered by the independent registered public accounting firm to the Registrant for tax compliance, tax advice, tax planning, and tax return preparation for the last two fiscal years ended September 30, 2024 and 2023 were $143,700 and $142,250, respectively. These services consisted of the independent registered public accounting firm reviewing the Registrant’s excise tax returns, distribution requirements and RIC tax returns. |
During the fiscal years ended September 30, 2024 and 2023, no fees for tax compliance, tax advice or tax planning services that relate directly to the operations and financial reporting of the Registrant were billed by the independent registered public accounting firm to the Advisor or any other entity controlling, controlled by, or under common control with the Advisor that provides ongoing services to the Registrant.
| (d) | All Other Fees – The aggregate fees billed for products and services provided by the independent registered public accounting firm to the Registrant, other than the services reported in paragraphs (a) – (c) of this Item 4, for the fiscal years ended September 30, 2024 and 2023 were $0 and $0, respectively. |
During the fiscal years ended September 30, 2024 and 2023, no fees for other services that relate directly to the operations and financial reporting of the Registrant were billed by the independent registered public accounting firm to the Advisor or any other entity controlling, controlled by, or under common control with the Advisor that provides ongoing services to the Registrant.
| (e) | Pre-Approval Policies and Procedures |
(1) Pursuant to the registrant’s Audit Committee Charter, the Audit Committee shall evaluate the independence of the independent public accountants, including evaluating whether the independent public accountants provide audit services or consulting services to the Registrant or consulting services to the Advisor, and to receive the specific representations of the independent registered public accounting firm as to their independence. Specifically, the Audit Committee will be responsible for evaluating the provision of non-audit services to the Registrant as required by Section 201 of the Sarbanes-Oxley Act, any pre-approval requests submitted by the independent registered public accounting firm as required by Section 202 of the Sarbanes-Oxley Act or as otherwise required under Section 2-01 of Regulation S-X, and shall monitor the conflict of interest requirements in Section 206 of the Sarbanes-Oxley Act, and the prohibitions on improper influence on the conduct of audits in Section 303 of the Sarbanes-Oxley Act. The Audit Committee shall pre-approve any engagement of the independent registered public accounting firm to provide any services (other than prohibited non-audit services) including the fees and other compensation to be paid to the independent registered public accounting firm.
The independent registered public accounting firm is authorized by the Audit Committee to provide non-audit services to the extent allowable under the Sarbanes-Oxley Act of 2002 for the Registrant provided that (i) the fees payable with respect to such services do not exceed $5,000 in any calendar quarter and (ii) such fees are ratified by the Audit Committee at its next meeting. The fees payable with respect to non-audit services may be increased by the affirmative vote of a majority of the members of the Audit Committee.
(2) There were no pre-approval requirements waived for the services provided to the Registrant described in paragraphs (b)-(d) of Item 4 by the Audit Committee pursuant to paragraph (c)(7)(i)(C) of Rule 2-01 of Regulation S-X (the “De Minimis Rule”). There were no fees billed for services provided to the Advisor described in paragraphs (b)-(d) of Item 4 that were required to be pre-approved by the Audit Committee as described in paragraph (e)(1) of Item 4.
| (f) | No disclosures are required by this Item 4(f). |
| (g) | For the fiscal years ended September 30, 2024 and 2023, the aggregate non-audit fees billed by the independent registered public accounting firm for services rendered to the Registrant and the Advisor and any entity controlling, controlled by, or under common control with the Advisor that provided ongoing services to the Registrant were approximately $0 and $0, respectively. |
| (h) | No disclosures are required by this Item 4(h). |
| Item 5. | Audit Committee of Listed Registrants. |
Not applicable.
| (a) | Schedule of Investments is included as a part of the Financial Statements filed under Item 7(a) of this Form N-CSR. |
| Item 7. | Financial Statements and Financial Highlights for Open-End Management Investment Companies. |
| (a) | The registrant’s Financial Statements are attached herewith. |
| | |
 | | WASATCHGLOBAL.COM |
SEPTEMBER 30, 2024
2024 Financial Statements and Supplemental Information
| | | | |
| | | |
Fund Name | | Investor Class | | Institutional Class |
| | |
| Wasatch Core Growth Fund | | WGROX | | WIGRX |
| | |
| Wasatch Emerging India Fund | | WAINX | | WIINX |
| | |
| Wasatch Emerging Markets Select Fund | | WAESX | | WIESX |
| | |
| Wasatch Emerging Markets Small Cap Fund | | WAEMX | | WIEMX |
| | |
| Wasatch Frontier Emerging Small Countries Fund | | WAFMX | | WIFMX |
| | |
| Wasatch Global Opportunities Fund | | WAGOX | | WIGOX |
| | |
| Wasatch Global Select Fund | | WAGSX | | WGGSX |
| | |
| Wasatch Global Value Fund | | FMIEX | | WILCX |
| | |
| Wasatch Greater China Fund | | WAGCX | | WGGCX |
| | |
| Wasatch International Growth Fund | | WAIGX | | WIIGX |
| | | | |
| | | |
Fund Name | | Investor Class | | Institutional Class |
| | |
| Wasatch International Opportunities Fund | | WAIOX | | WIIOX |
| | |
| Wasatch International Select Fund | | WAISX | | WGISX |
| | |
| Wasatch Long/Short Alpha Fund | | WALSX | | WGLSX |
| | |
| Wasatch Micro Cap Fund | | WMICX | | WGICX |
| | |
| Wasatch Micro Cap Value Fund | | WAMVX | | WGMVX |
| | |
| Wasatch Small Cap Growth Fund | | WAAEX | | WIAEX |
| | |
| Wasatch Small Cap Value Fund | | WMCVX | | WICVX |
| | |
| Wasatch Ultra Growth Fund | | WAMCX | | WGMCX |
| | |
| Wasatch U.S. Select Fund | | WAUSX | | WGUSX |
| | |
| Wasatch-Hoisington U.S. Treasury Fund | | WHOSX | | — |
Wasatch Funds
Salt Lake City, Utah
wasatchglobal.com
800.551.1700
This material must be accompanied or preceded by a prospectus.
Please read the prospectus carefully before you invest.
Wasatch Funds are distributed by ALPS Distributors, Inc.
1
| | |
| Wasatch Core Growth Fund (WGROX / WIGRX) | | SEPTEMBER 30, 2024 |
Schedule of Investments
| | | | | | | | |
| Shares | | | | | Value | |
| | | | | | | |
| |
| | | | COMMON STOCKS 99.1% | |
| | |
| | | | Apparel Retail 1.0% | | | |
| | 278,530 | | | Boot Barn Holdings, Inc.* | | $ | 46,592,498 | |
| | | | | | | | |
| | |
| | | | Application Software 11.4% | | | |
| | 8,445,250 | | | CCC Intelligent Solutions Holdings, Inc.* | | | 93,320,012 | |
| | 5,982,980 | | | Clearwater Analytics Holdings, Inc., Class A* | | | 151,070,245 | |
| | 840,764 | | | Guidewire Software, Inc.* | | | 153,809,366 | |
| | 831,633 | | | Procore Technologies, Inc.* | | | 51,328,389 | |
| | 1,311,113 | | | Q2 Holdings, Inc.* | | | 104,587,484 | |
| | | | | | | | |
| | | | 554,115,496 | |
| | | | | | | | |
| | |
| | | | Asset Management & Custody
Banks 5.1% | | | |
| | 1,326,638 | | | Cohen & Steers, Inc. | | | 127,290,916 | |
| | 710,275 | | | Hamilton Lane, Inc., Class A | | | 119,603,207 | |
| | | | | | | | |
| | | | 246,894,123 | |
| | | | | | | | |
| | |
| | | | Automotive Parts & Equipment 2.1% | | | |
| | 404,311 | | | Modine Manufacturing Co.* | | | 53,688,458 | |
| | 1,154,698 | | | XPEL, Inc.* | | | 50,079,252 | |
| | | | | | | | |
| | | | 103,767,710 | |
| | | | | | | | |
| | |
| | | | Automotive Retail 2.3% | | | |
| | 2,603,985 | | | Valvoline, Inc.* | | | 108,976,772 | |
| | | | | | | | |
| | |
| | | | Broadline Retail 2.0% | | | |
| | 1,010,507 | | | Ollie’s Bargain Outlet Holdings, Inc.* | | | 98,221,280 | |
| | | | | | | | |
| | |
| | | | Building Products 5.2% | | | |
| | 489,077 | | | AAON, Inc. | | | 52,742,064 | |
| | 258,318 | | | CSW Industrials, Inc. | | | 94,645,132 | |
| | 1,596,893 | | | Trex Co., Inc.* | | | 106,321,136 | |
| | | | | | | | |
| | | | 253,708,332 | |
| | | | | | | | |
| | |
| | | | Cargo Ground Transportation 2.3% | | | |
| | 250,297 | | | Saia, Inc.* | | | 109,444,866 | |
| | | | | | | | |
| | |
| | | | Distributors 2.3% | | | |
| | 297,375 | | | Pool Corp. | | | 112,050,900 | |
| | | | | | | | |
| | |
| | | | Electronic Equipment &
Instruments 2.2% | | | |
| | 584,034 | | | Novanta, Inc.* | | | 104,495,363 | |
| | | | | | | | |
| | |
| | | | Electronic Manufacturing
Services 1.3% | | | |
| | 261,427 | | | Fabrinet* | | | 61,811,800 | |
| | | | | | | | |
| | |
| | | | Environmental & Facilities
Services 1.8% | | | |
| | 891,928 | | | Casella Waste Systems, Inc., Class A* | | | 88,737,917 | |
| | | | | | | | |
| | |
| | | | Financial Exchanges & Data 4.7% | | | |
| | 278,369 | | | MarketAxess Holdings, Inc. | | | 71,318,138 | |
| | 410,475 | | | Morningstar, Inc. | | | 130,990,782 | |
| | 4,171,907 | | | Open Lending Corp.* | | | 25,532,071 | |
| | | | | | | | |
| | | | 227,840,991 | |
| | | | | | | | |
| | |
| | | | Health Care Equipment 1.6% | | | |
| | 374,009 | | | Inspire Medical Systems, Inc.* | | | 78,934,600 | |
| | | | | | | | |
| | | | | | | | |
| Shares | | | | | Value | |
| | | | | | | |
| | |
| | | | Health Care Facilities 3.0% | | | |
| | 802,079 | | | Ensign Group, Inc. | | $ | 115,355,002 | |
| | 787,822 | | | PACS Group, Inc.* | | | 31,489,245 | |
| | | | | | | | |
| | | | 146,844,247 | |
| | | | | | | | |
| | |
| | | | Health Care Technology 1.3% | | | |
| | 5,321,544 | | | Certara, Inc.* | | | 62,315,280 | |
| | | | | | | | |
| | |
| | | | Home Furnishing Retail 1.1% | | | |
| | 4,368,594 | | | Arhaus, Inc.‡‡ | | | 53,777,392 | |
| | | | | | | | |
| | |
| | | | Home Improvement Retail 1.6% | | | |
| | 624,443 | | | Floor & Decor Holdings, Inc., Class A* | | | 77,537,087 | |
| | | | | | | | |
| | |
| | | | Human Resource & Employment
Services 2.5% | | | |
| | 733,774 | | | Paylocity Holding Corp.* | | | 121,050,697 | |
| | | | | | | | |
| | |
| | | | Industrial Machinery & Supplies &
Components 6.8% | | | |
| | 1,141,254 | | | Helios Technologies, Inc. | | | 54,437,816 | |
| | 440,026 | | | Kadant, Inc. | | | 148,728,788 | |
| | 428,489 | | | RBC Bearings, Inc.* | | | 128,281,037 | |
| | | | | | | | |
| | | | 331,447,641 | |
| | | | | | | | |
| | |
| | | | Insurance Brokers 1.7% | | | |
| | 905,133 | | | Goosehead Insurance, Inc., Class A* | | | 80,828,377 | |
| | | | | | | | |
| | |
| | | | Investment Banking & Brokerage 1.7% | | | |
| | 1,188,821 | | | Moelis & Co., Class A | | | 81,446,127 | |
| | | | | | | | |
| | |
| | | | IT Consulting & Other Services 2.3% | | | |
| | 567,468 | | | Globant SA* | | | 112,438,110 | |
| | | | | | | | |
| | |
| | | | Leisure Products 1.0% | | | |
| | 1,194,083 | | | YETI Holdings, Inc.* | | | 48,993,226 | |
| | | | | | | | |
| | |
| | | | Life Sciences Tools & Services 1.6% | | | |
| | 234,687 | | | Medpace Holdings, Inc.* | | | 78,338,521 | |
| | | | | | | | |
| | |
| | | | Managed Health Care 3.6% | | | |
| | 2,121,723 | | | HealthEquity, Inc.* | | | 173,663,028 | |
| | | | | | | | |
| | |
| | | | Other Specialty Retail 1.0% | | | |
| | 530,594 | | | Five Below, Inc.* | | | 46,877,980 | |
| | | | | | | | |
| | |
| | | | Packaged Foods & Meats 1.5% | | | |
| | 516,580 | | | Freshpet, Inc.* | | | 70,652,647 | |
| | | | | | | | |
| | |
| | | | Personal Care Products 2.3% | | | |
| | 1,817,768 | | | BellRing Brands, Inc.* | | | 110,374,873 | |
| | | | | | | | |
| | |
| | | | Pharmaceuticals 1.3% | | | |
| | 863,458 | | | Intra-Cellular Therapies, Inc.* | | | 63,179,222 | |
| | | | | | | | |
| | |
| | | | Regional Banks 2.6% | | | |
| | 1,619,669 | | | Bank OZK | | | 69,629,570 | |
| | 586,617 | | | Pinnacle Financial Partners, Inc. | | | 57,470,868 | |
| | | | | | | | |
| | | | 127,100,438 | |
| | | | | | | | |
| | |
| | | | Research & Consulting Services 1.9% | | | |
| | 536,714 | | | ICF International, Inc. | | | 89,518,528 | |
| | | | | | | | |
2
| | |
| Wasatch Core Growth Fund (WGROX / WIGRX) | | SEPTEMBER 30, 2024 |
Schedule of Investments (continued)
| | | | | | | | |
| Shares | | | | | Value | |
| | | | | | | |
| | |
| | | | Restaurants 1.0% | | | |
| | 1,432,979 | | | Dutch Bros, Inc., Class A* | | $ | 45,898,317 | |
| | | | | | | | |
| | |
| | | | Self-Storage REITs 2.4% | | | |
| | 2,423,166 | | | National Storage Affiliates Trust | | | 116,796,601 | |
| | | | | | | | |
| | |
| | | | Semiconductor Materials &
Equipment 1.3% | | | |
| | 296,307 | | | Nova Ltd.* | | | 61,732,600 | |
| | | | | | | | |
| | |
| | | | Specialty Chemicals 3.7% | | | |
| | 564,446 | | | Balchem Corp. | | | 99,342,496 | |
| | 718,516 | | | Innospec, Inc. | | | 81,256,974 | |
| | | | | | | | |
| | | | 180,599,470 | |
| | | | | | | | |
| | |
| | | | Systems Software 1.5% | | | |
| | 256,894 | | | CyberArk Software Ltd.* | | | 74,912,859 | |
| | | | | | | | |
| | |
| | | | Trading Companies &
Distributors 1.6% | | | |
| | 516,973 | | | SiteOne Landscape Supply, Inc.* | | | 78,016,395 | |
| | | | | | | | |
| | |
| | | | Transaction & Payment Processing
Services 3.5% | | | |
| | 1,939,435 | | | Shift4 Payments, Inc., Class A* | | | 171,833,941 | |
| | | | | | | | |
| | |
| | | | Total Common Stocks
(cost $3,277,472,375) | | | 4,801,766,252 | |
| | | | | | | | |
| | |
| | | | Total Investments
(cost $3,277,472,375) 99.1% | | | 4,801,766,252 | |
| | |
| | | | Other Assets less Liabilities 0.9% | | | 45,461,590 | |
| | | | | | | | |
| | |
| | | | Net Assets 100.0% | | $ | 4,847,227,842 | |
| | | | | | | | |
| |
| | | | *Non-income producing. ‡‡Affiliated company (see Note 8). REIT Real Estate Investment Trust. | |
| |
| | | | See Notes to Financial Statements. | |
At September 30, 2024, the Wasatch Core Growth Fund’s investments were in the following countries (unaudited):
| | | | | |
| Country | | % |
Israel | | | | 2.8 | |
United States | | | | 97.2 | |
| | | | | |
TOTAL | | | | 100.0 | % |
| | | | | |
3
| | |
| Wasatch Emerging India Fund (WAINX / WIINX) | | SEPTEMBER 30, 2024 |
Schedule of Investments
| | | | | | | | |
| Shares | | | | | Value | |
| | | | | | | |
| |
| | | | COMMON STOCKS 105.2% | |
| | |
| | | | Apparel Retail 9.2% | | | |
| | 734,266 | | | Trent Ltd. | | $ | 66,430,226 | |
| | | | | | | | |
| | |
| | | | Asset Management & Custody
Banks 1.1% | | | |
| | 247,039 | | | Prudent Corporate Advisory Services Ltd. | | | 7,671,464 | |
| | | | | | | | |
| | |
| | | | Automotive Parts & Equipment 2.5% | | | |
| | 347,937 | | | Tube Investments of India Ltd. | | | 18,009,803 | |
| | | | | | | | |
| | |
| | | | Commodity Chemicals 4.3% | | | |
| | 2,183,037 | | | Berger Paints India Ltd. | | | 16,206,613 | |
| | 235,298 | | | Supreme Industries Ltd. | | | 14,943,811 | |
| | | | | | | | |
| | | | 31,150,424 | |
| | | | | | | | |
| | |
| | | | Construction Machinery & Heavy
Transportation Equipment 1.1% | | | |
| | 464,679 | | | Action Construction Equipment Ltd. | | | 7,702,970 | |
| | | | | | | | |
| | |
| | | | Consumer Finance 19.5% | | | |
| | 769,735 | | | Bajaj Finance Ltd. | | | 70,721,677 | |
| | 2,922,947 | | | Cholamandalam Investment & Finance Co. Ltd. | | | 56,105,499 | |
| | 1,481,115 | | | Five-Star Business Finance Ltd.* | | | 13,784,042 | |
| | | | | | | | |
| | | | 140,611,218 | |
| | | | | | | | |
| | |
| | | | Diversified Banks 9.5% | | | |
| | 2,487,174 | | | HDFC Bank Ltd. | | | 51,221,671 | |
| | 797,718 | | | Kotak Mahindra Bank Ltd. | | | 17,633,233 | |
| | | | | | | | |
| | | | 68,854,904 | |
| | | | | | | | |
| | |
| | | | Diversified Chemicals 0.8% | | | |
| | 153,633 | | | Pidilite Industries Ltd. | | | 6,164,886 | |
| | | | | | | | |
| | |
| | | | Diversified Support Services 3.5% | | | |
| | 3,535,200 | | | CMS Info Systems Ltd. | | | 25,199,448 | |
| | | | | | | | |
| | |
| | | | Electrical Components &
Equipment 1.0% | | | |
| | 86,826 | | | Polycab India Ltd. | | | 7,205,624 | |
| | | | | | | | |
| | |
| | | | Food Retail 4.2% | | | |
| | 499,615 | | | Avenue Supermarts Ltd.* | | | 30,380,217 | |
| | | | | | | | |
| | |
| | | | Health Care Facilities 6.6% | | | |
| | 3,131,221 | | | Max Healthcare Institute Ltd. | | | 36,779,176 | |
| | 655,496 | | | Rainbow Children’s Medicare Ltd. | | | 10,949,671 | |
| | | | | | | | |
| | | | 47,728,847 | |
| | | | | | | | |
| | |
| | | | Health Care Services 9.5% | | | |
| | 790,928 | | | Dr. Lal PathLabs Ltd. | | | 31,190,923 | |
| | 3,245,700 | | | Vijaya Diagnostic Centre Pvt. Ltd. | | | 37,190,252 | |
| | | | | | | | |
| | | | 68,381,175 | |
| | | | | | | | |
| | |
| | | | Heavy Electrical Equipment 0.7% | | | |
| | 620,892 | | | Elecon Engineering Co. Ltd. | | | 5,188,199 | |
| | | | | | | | |
| | |
| | | | Hotels, Resorts & Cruise Lines 1.0% | | | |
| | 81,361 | | | MakeMyTrip Ltd.* | | | 7,562,505 | |
| | | | | | | | |
| | | | | | | | |
| Shares | | | | | Value | |
| | | | | | | |
| | |
| | | | Industrial Machinery & Supplies &
Components 4.9% | | | |
| | 4,332,906 | | | Elgi Equipments Ltd. | | $ | 35,160,241 | |
| | | | | | | | |
| | |
| | | | Interactive Media & Services 4.4% | | | |
| | 253,535 | | | Info Edge India Ltd. | | | 24,496,796 | |
| | 545,718 | | | Just Dial Ltd.* | | | 7,513,114 | |
| | | | | | | | |
| | | | 32,009,910 | |
| | | | | | | | |
| | |
| | | | IT Consulting & Other Services 2.6% | | | |
| | 286,818 | | | Persistent Systems Ltd. | | | 18,647,384 | |
| | | | | | | | |
| | |
| | | | Life Sciences Tools & Services 7.2% | | | |
| | 803,380 | | | Divi’s Laboratories Ltd. | | | 52,191,966 | |
| | | | | | | | |
| | |
| | | | Metal, Glass & Plastic
Containers 0.4% | | | |
| | 302,395 | | | Mold-Tek Packaging Ltd. | | | 2,729,146 | |
| | | | | | | | |
| | |
| | | | Regional Banks 5.5% | | | |
| | 4,510,234 | | | AU Small Finance Bank Ltd. | | | 39,765,347 | |
| | | | | | | | |
| | |
| | | | Research & Consulting Services 1.0% | | | |
| | 111,007 | | | L&T Technology Services Ltd. | | | 7,079,410 | |
| | | | | | | | |
| | |
| | | | Restaurants 0.9% | | | |
| | 2,805,761 | | | Devyani International Ltd.* | | | 6,541,709 | |
| | | | | | | | |
| | |
| | | | Specialty Chemicals 3.4% | | | |
| | 518,165 | | | Asian Paints Ltd. | | | 20,600,709 | |
| | 64,234 | | | Fine Organic Industries Ltd. | | | 4,019,239 | |
| | | | | | | | |
| | | | 24,619,948 | |
| | | | | | | | |
| | |
| | | | Systems Software 0.4% | | | |
| | 35,072 | | | Tata Elxsi Ltd. | | | 3,230,916 | |
| | | | | | | | |
| | |
| | | | Total Common Stocks
(cost $445,049,167) | | | 760,217,887 | |
| | | | | | | | |
| | |
| | | | Total Investments
(cost $445,049,167) 105.2%§ | | | 760,217,887 | |
| | |
| | | | Liabilities less Other Assets (5.2%) | | | (37,502,974 | ) |
| | | | | | | | |
| | |
| | | | Net Assets 100.0% | | $ | 722,714,913 | |
| | | | | | | | |
| |
| | | | *Non-income producing. §The aggregate amount of foreign securities fair valued pursuant to a systematic valuation model as a percent of net assets was 102.63%. | |
| |
| | | | See Notes to Financial Statements. | |
At September 30, 2024, the Wasatch Emerging India Fund’s investments were in the following countries (unaudited):
| | | | | |
| Country | | % |
India | | | | 100.0 | |
| | | | | |
TOTAL | | | | 100.0 | % |
| | | | | |
4
| | |
| Wasatch Emerging Markets Select Fund (WAESX / WIESX) | | SEPTEMBER 30, 2024 |
Schedule of Investments
| | | | | | | | |
| Shares | | | | | Value | |
| | | | | | | |
| |
| | | | COMMON STOCKS 101.1% | |
| | |
| | | | Airport Services 2.7% | | | |
| | 689,375 | | | Grupo Aeroportuario del Pacifico
SAB de CV, Class B | | $ | 11,970,407 | |
| | | | | | | | |
| | |
| | | | Apparel Retail 3.5% | | | |
| | 176,228 | | | Trent Ltd. | | | 15,943,630 | |
| | | | | | | | |
| | |
| | | | Broadline Retail 8.2% | | | |
| | 15,795 | | | MercadoLibre, Inc.* | | | 32,410,708 | |
| | 34,005 | | | PDD Holdings, Inc., ADR* | | | 4,584,214 | |
| | | | | | | | |
| | | | 36,994,922 | |
| | | | | | | | |
| | |
| | | | Consumer Finance 10.0% | | | |
| | 388,161 | | | Bajaj Finance Ltd. | | | 35,663,439 | |
| | 480,134 | | | Cholamandalam Investment & Finance Co. Ltd. | | | 9,216,095 | |
| | | | | | | | |
| | | | 44,879,534 | |
| | | | | | | | |
| | |
| | | | Diversified Banks 9.8% | | | |
| | 839,959 | | | HDFC Bank Ltd. | | | 17,298,389 | |
| | 1,965,815 | | | NU Holdings Ltd., Class A* | | | 26,833,375 | |
| | | | | | | | |
| | | | 44,131,764 | |
| | | | | | | | |
| | |
| | | | Drug Retail 2.5% | | | |
| | 2,377,463 | | | Raia Drogasil SA | | | 11,124,242 | |
| | | | | | | | |
| | |
| | | | Electrical Components &
Equipment 10.5% | | | |
| | 399,707 | | | Voltronic Power Technology Corp. | | | 25,548,825 | |
| | 2,174,102 | | | WEG SA | | | 21,706,300 | |
| | | | | | | | |
| | | | 47,255,125 | |
| | | | | | | | |
| | |
| | | | Electronic Equipment &
Instruments 1.4% | | | |
| | 217,086 | | | Shanghai BOCHU Electronic Technology Corp. Ltd., Class A | | | 6,478,758 | |
| | | | | | | | |
| | |
| | | | Health Care Facilities 2.6% | | | |
| | 988,517 | | | Max Healthcare Institute Ltd. | | | 11,611,075 | |
| | | | | | | | |
| | |
| | | | Health Care Services 1.9% | | | |
| | 215,026 | | | Dr. Lal PathLabs Ltd. | | | 8,479,735 | |
| | | | | | | | |
| | |
| | | | Hotels, Resorts & Cruise Lines 3.5% | | | |
| | 43,717 | | | MakeMyTrip Ltd.* | | | 4,063,495 | |
| | 194,470 | | | Trip.com Group Ltd., ADR* | | | 11,557,352 | |
| | | | | | | | |
| | | | 15,620,847 | |
| | | | | | | | |
| | |
| | | | Industrial Machinery & Supplies &
Components 4.9% | | | |
| | 164,016 | | | Airtac International Group | | | 4,697,591 | |
| | 1,252,386 | | | Elgi Equipments Ltd. | | | 10,162,739 | |
| | 494,178 | | | Techtronic Industries Co. Ltd. | | | 7,377,298 | |
| | | | | | | | |
| | | | 22,237,628 | |
| | | | | | | | |
| | |
| | | | Interactive Home Entertainment 3.4% | | | |
| | 164,374 | | | Sea Ltd., ADR* | | | 15,497,181 | |
| | | | | | | | |
| | |
| | | | Interactive Media & Services 1.6% | | | |
| | 128,600 | | | Tencent Holdings Ltd. | | | 7,150,782 | |
| | | | | | | | |
| | | | | | | | |
| Shares | | | | | Value | |
| | | | | | | |
| | |
| | | | IT Consulting & Other Services 4.8% | | | |
| | 110,146 | | | Globant SA* | | $ | 21,824,328 | |
| | | | | | | | |
| | |
| | | | Life Sciences Tools & Services 4.8% | | | |
| | 334,976 | | | Divi’s Laboratories Ltd. | | | 21,761,876 | |
| | | | | | | | |
| | |
| | | | Property & Casualty Insurance 1.5% | | | |
| | 870,819 | | | Qualitas Controladora SAB de CV | | | 6,809,548 | |
| | | | | | | | |
| | |
| | | | Regional Banks 2.6% | | | |
| | 1,353,683 | | | AU Small Finance Bank Ltd. | | | 11,935,007 | |
| | | | | | | | |
| | |
| | | | Restaurants 3.0% | | | |
| | 639,400 | | | Meituan, Class B* | | | 13,577,898 | |
| | | | | | | | |
| | |
| | | | Semiconductor Materials &
Equipment 3.3% | | | |
| | 543,325 | | | Gudeng Precision Industrial Co. Ltd. | | | 9,680,063 | |
| | 31,650 | | | Lasertec Corp. | | | 5,276,897 | |
| | | | | | | | |
| | | | 14,956,960 | |
| | | | | | | | |
| | |
| | | | Semiconductors 11.7% | | | |
| | 162,816 | | | ASPEED Technology, Inc. | | | 22,016,551 | |
| | 78,920 | | | LEENO Industrial, Inc. | | | 11,366,614 | |
| | 1,321,836 | | | Silergy Corp. | | | 19,466,690 | |
| | | | | | | | |
| | | | 52,849,855 | |
| | | | | | | | |
| | |
| | | | Specialized Finance 1.0% | | | |
| | 859,402 | | | Chailease Holding Co. Ltd. | | | 4,420,298 | |
| | | | | | | | |
| | |
| | | | Specialty Chemicals 1.9% | | | |
| | 209,901 | | | Asian Paints Ltd. | | | 8,345,043 | |
| | | | | | | | |
| | |
| | | | Total Common Stocks
(cost $348,678,649) | | | 455,856,443 | |
| | | | | | | | |
| | |
| | | | Total Investments
(cost $348,678,649) 101.1%§ | | | 455,856,443 | |
| | |
| | | | Liabilities less Other Assets (1.1%) | | | (4,807,479 | ) |
| | | | | | | | |
| | |
| | | | Net Assets 100.0% | | $ | 451,048,964 | |
| | | | | | | | |
| |
| | | | *Non-income producing. §The aggregate amount of foreign securities fair valued pursuant to a systematic valuation model as a percent of net assets was 63.73%. ADR American Depositary Receipt. | |
| |
| | | | See Notes to Financial Statements. | |
5
| | |
| Wasatch Emerging Markets Select Fund (WAESX / WIESX) | | SEPTEMBER 30, 2024 |
Schedule of Investments (continued)
At September 30, 2024, the Wasatch Emerging Markets Select Fund’s investments were in the following countries (unaudited):
| | | | | |
| Country | | % |
Brazil | | | | 13.1 | |
China | | | | 9.5 | |
Hong Kong | | | | 1.6 | |
India | | | | 33.9 | |
Japan | | | | 1.2 | |
Mexico | | | | 4.1 | |
Singapore | | | | 3.4 | |
South Korea | | | | 2.5 | |
Taiwan | | | | 18.8 | |
United States | | | | 11.9 | |
| | | | | |
TOTAL | | | | 100.0 | % |
| | | | | |
6
| | |
| Wasatch Emerging Markets Small Cap Fund (WAEMX / WIEMX) | | SEPTEMBER 30, 2024 |
Schedule of Investments
| | | | | | | | |
| Shares | | | | | Value | |
| | | | | | | |
| |
| | | | COMMON STOCKS 101.5% | |
| | |
| | | | Airport Services 0.9% | | | |
| | 397,425 | | | Grupo Aeroportuario del Centro Norte SAB de CV | | $ | 3,358,029 | |
| | | | | | | | |
| | |
| | | | Apparel Retail 6.8% | | | |
| | 265,267 | | | Trent Ltd. | | | 23,999,132 | |
| | | | | | | | |
| | |
| | | | Asset Management & Custody
Banks 1.0% | | | |
| | 115,642 | | | Prudent Corporate Advisory Services Ltd. | | | 3,591,107 | |
| | | | | | | | |
| | |
| | | | Automotive Retail 1.1% | | | |
| | 113,257 | | | Aldrees Petroleum & Transport Services Co. | | | 4,035,339 | |
| | | | | | | | |
| | |
| | | | Commercial & Residential Mortgage
Finance 1.8% | | | |
| | 289,094 | | | Aavas Financiers Ltd.* | | | 6,262,734 | |
| | | | | | | | |
| | |
| | | | Commodity Chemicals 1.1% | | | |
| | 529,436 | | | Berger Paints India Ltd. | | | 3,930,471 | |
| | | | | | | | |
| | |
| | | | Communications Equipment 0.7% | | | |
| | 159,000 | | | Accton Technology Corp. | | | 2,660,332 | |
| | | | | | | | |
| | |
| | | | Construction Machinery & Heavy
Transportation Equipment 1.2% | | | |
| | 259,724 | | | Action Construction Equipment Ltd. | | | 4,305,437 | |
| | | | | | | | |
| | |
| | | | Consumer Finance 7.6% | | | |
| | 775,099 | | | Cholamandalam Financial Holdings Ltd. | | | 18,902,340 | |
| | 586,770 | | | Five-Star Business Finance Ltd.* | | | 5,460,793 | |
| | 4,279,450 | | | Ngern Tid Lor PCL | | | 2,447,110 | |
| | | | | | | | |
| | | | 26,810,243 | |
| | | | | | | | |
| | |
| | | | Diversified Banks 0.9% | | | |
| | 86,500 | | | TBC Bank Group PLC | | | 3,064,624 | |
| | | | | | | | |
| | |
| | | | Diversified Support Services 3.6% | | | |
| | 651,470 | | | CMS Info Systems Ltd. | | | 4,643,778 | |
| | 9,045,400 | | | Frontken Corp. Bhd. | | | 8,037,220 | |
| | | | | | | | |
| | | | 12,680,998 | |
| | | | | | | | |
| | |
| | | | Drug Retail 3.7% | | | |
| | 156,008 | | | Clicks Group Ltd. | | | 3,584,459 | |
| | 32,685 | | | Corporativo Fragua SAB de CV | | | 1,493,733 | |
| | 1,722,768 | | | Raia Drogasil SA | | | 8,060,898 | |
| | | | | | | | |
| | | | 13,139,090 | |
| | | | | | | | |
| | |
| | | | Electrical Components &
Equipment 7.1% | | | |
| | 395,863 | | | Voltronic Power Technology Corp. | | | 25,303,121 | |
| | | | | | | | |
| | |
| | | | Electronic Components 1.0% | | | |
| | 384,850 | | | Sinbon Electronics Co. Ltd. | | | 3,645,577 | |
| | | | | | | | |
| | |
| | | | Electronic Equipment &
Instruments 2.2% | | | |
| | 657,616 | | | Chroma ATE, Inc. | | | 7,721,030 | |
| | | | | | | | |
| | | | | | | | |
| Shares | | | | | Value | |
| | | | | | | |
| | |
| | | | Electronic Manufacturing
Services 1.9% | | | |
| | 28,266 | | | Fabrinet* | | $ | 6,683,213 | |
| | | | | | | | |
| | |
| | | | Food Retail 0.3% | | | |
| | 730,633 | | | Philippine Seven Corp. | | | 949,839 | |
| | | | | | | | |
| | |
| | | | Health Care Facilities 2.4% | | | |
| | 17,943,400 | | | Mitra Keluarga Karyasehat Tbk. PT | | | 3,756,974 | |
| | 281,821 | | | Rainbow Children’s Medicare Ltd. | | | 4,707,652 | |
| | | | | | | | |
| | | | 8,464,626 | |
| | | | | | | | |
| | |
| | | | Health Care Services 3.7% | | | |
| | 181,655 | | | Dr. Lal PathLabs Ltd. | | | 7,163,721 | |
| | 527,147 | | | Vijaya Diagnostic Centre Pvt. Ltd. | | | 6,040,216 | |
| | | | | | | | |
| | | | 13,203,937 | |
| | | | | | | | |
| | |
| | | | Heavy Electrical Equipment 1.6% | | | |
| | 670,464 | | | Elecon Engineering Co. Ltd. | | | 5,602,425 | |
| | | | | | | | |
| | |
| | | | Home Improvement Retail 0.8% | | | |
| | 8,200,387 | | | Wilcon Depot, Inc. | | | 2,676,254 | |
| | | | | | | | |
| | |
| | | | Human Resource & Employment
Services 1.3% | | | |
| | 6,899 | | | Benefit Systems SA | | | 4,723,010 | |
| | | | | | | | |
| | |
| | | | Industrial Machinery & Supplies &
Components 4.4% | | | |
| | 155,500 | | | Airtac International Group | | | 4,453,683 | |
| | 1,378,725 | | | Elgi Equipments Ltd. | | | 11,187,943 | |
| | | | | | | | |
| | | | 15,641,626 | |
| | | | | | | | |
| | |
| | | | Interactive Media & Services 5.2% | | | |
| | 3,416,426 | | | Baltic Classifieds Group PLC | | | 13,839,803 | |
| | 47,024 | | | Info Edge India Ltd. | | | 4,543,504 | |
| | | | | | | | |
| | | | 18,383,307 | |
| | | | | | | | |
| | |
| | | | IT Consulting & Other Services 11.3% | | | |
| | 1,150,115 | | | FPT Corp. | | | 6,296,944 | |
| | 95,972 | | | Globant SA* | | | 19,015,892 | |
| | 227,168 | | | Persistent Systems Ltd. | | | 14,769,258 | |
| | | | | | | | |
| | | | 40,082,094 | |
| | | | | | | | |
| | |
| | | | Life & Health Insurance 1.4% | | | |
| | 87,190 | | | Co. for Cooperative Insurance | | | 3,440,401 | |
| | 145,665 | | | Discovery Ltd. | | | 1,450,513 | |
| | | | | | | | |
| | | | 4,890,914 | |
| | | | | | | | |
| | |
| | | | Metal, Glass & Plastic Containers 0.4% | | | |
| | 164,244 | | | Mold-Tek Packaging Ltd. | | | 1,482,319 | |
| | | | | | | | |
| | |
| | | | Packaged Foods & Meats 0.8% | | | |
| | 7,658,957 | | | Cisarua Mountain Dairy Tbk. PT | | | 2,858,197 | |
| | | | | | | | |
| | |
| | | | Personal Care Products 2.3% | | | |
| | 514,667 | | | Proya Cosmetics Co. Ltd., Class A | | | 8,022,683 | |
| | | | | | | | |
| | |
| | | | Property & Casualty Insurance 2.6% | | | |
| | 1,156,952 | | | Qualitas Controladora SAB de CV | | | 9,047,024 | |
| | | | | | | | |
7
| | |
| Wasatch Emerging Markets Small Cap Fund (WAEMX / WIEMX) | | SEPTEMBER 30, 2024 |
Schedule of Investments (continued)
| | | | | | | | |
| Shares | | | | | Value | |
| | | | | | | |
| | |
| | | | Regional Banks 4.1% | | | |
| | 1,655,072 | | | AU Small Finance Bank Ltd. | | $ | 14,592,261 | |
| | | | | | | | |
| | |
| | | | Research & Consulting
Services 2.0% | | | |
| | 15,120,800 | | | CTOS Digital Bhd. | | | 4,474,950 | |
| | 41,600 | | | L&T Technology Services Ltd. | | | 2,653,017 | |
| | | | | | | | |
| | | | 7,127,967 | |
| | | | | | | | |
| | |
| | | | Semiconductor Materials &
Equipment 2.8% | | | |
| | 555,312 | | | Gudeng Precision Industrial Co. Ltd. | | | 9,893,627 | |
| | | | | | | | |
| | |
| | | | Semiconductors 11.0% | | | |
| | 95,983 | | | ASPEED Technology, Inc. | | | 12,979,158 | |
| | 73,431 | | | LEENO Industrial, Inc. | | | 10,576,050 | |
| | 1,057,728 | | | Silergy Corp. | | | 15,577,169 | |
| | | | | | | | |
| | | | 39,132,377 | |
| | | | | | | | |
| | |
| | | | Specialized Finance 0.5% | | | |
| | 376,482 | | | Chailease Holding Co. Ltd. | | | 1,936,419 | |
| | | | | | | | |
| | |
| | | | Total Common Stocks
(cost $196,220,132) | | | 359,901,383 | |
| | | | | | | | |
| | |
| | | | Total Investments
(cost $196,220,132) 101.5%§ | | | 359,901,383 | |
| | |
| | | | Liabilities less Other Assets (1.5%) | | | (5,187,770 | ) |
| | | | | | | | |
| | |
| | | | Net Assets 100.0% | | $ | 354,713,613 | |
| | | | | | | | |
| |
| | | | *Non-income producing. §The aggregate amount of foreign securities fair valued pursuant to a systematic valuation model as a percent of net assets was 76.77%. | |
| |
| | | | See Notes to Financial Statements. | |
At September 30, 2024, the Wasatch Emerging Markets Small Cap Fund’s investments were in the following countries (unaudited):
| | | | | |
| Country | | % |
Brazil | | | | 2.2 | |
China | | | | 2.2 | |
India | | | | 40.0 | |
Indonesia | | | | 1.8 | |
Malaysia | | | | 3.5 | |
Mexico | | | | 3.9 | |
Philippines | | | | 1.0 | |
Poland | | | | 1.3 | |
Saudi Arabia | | | | 2.1 | |
South Africa | | | | 1.4 | |
South Korea | | | | 2.9 | |
Taiwan | | | | 23.4 | |
Thailand | | | | 0.7 | |
United Kingdom | | | | 4.7 | |
United States | | | | 7.1 | |
Vietnam | | | | 1.8 | |
| | | | | |
TOTAL | | | | 100.0 | % |
| | | | | |
8
| | |
| Wasatch Frontier Emerging Small Countries Fund (WAFMX / WIFMX) | | SEPTEMBER 30, 2024 |
Schedule of Investments
| | | | | | | | |
| Shares | | | | | Value | |
| | | | | | | |
| | |
| | | | COMMON STOCKS 96.6% | | | | |
| | |
| | | | Asset Management & Custody
Banks 0.7% | | | |
| | 1,166,289 | | | VEF AB* | | $ | 290,543 | |
| | | | | | | | |
| | |
| | | | Automotive Retail 2.1% | | | |
| | 23,148 | | | Aldrees Petroleum & Transport Services Co. | | | 824,762 | |
| | | | | | | | |
| | |
| | | | Broadline Retail 8.7% | | | |
| | 1,672 | | | MercadoLibre, Inc.* | | | 3,430,877 | |
| | | | | | | | |
| | |
| | | | Consumer Finance 16.9% | | | |
| | 37,086 | | | Bajaj Finance Ltd. | | | 3,407,386 | |
| | 39,227 | | | Cholamandalam Financial Holdings Ltd. | | | 956,629 | |
| | 103,173 | | | Cholamandalam Investment & Finance Co. Ltd. | | | 1,980,389 | |
| | 634,411 | | | Ngern Tid Lor PCL | | | 362,774 | |
| | | | | | | | |
| | | | 6,707,178 | |
| | | | | | | | |
| | |
| | | | Distillers & Vintners 2.2% | | | |
| | 187,575 | | | Ginebra San Miguel, Inc. | | | 886,368 | |
| | | | | | | | |
| | |
| | | | Diversified Banks 16.6% | | | |
| | 780,700 | | | Bank Central Asia Tbk. PT | | | 532,413 | |
| | 485,789 | | | Bank for Foreign Trade of Vietnam JSC* | | | 1,820,119 | |
| | 4,419 | | | Credicorp Ltd. | | | 799,706 | |
| | 193,800 | | | Military Commercial Joint Stock Bank | | | 202,707 | |
| | 183,628 | | | NU Holdings Ltd., Class A* | | | 2,506,522 | |
| | 20,099 | | | TBC Bank Group PLC | | | 712,091 | |
| | | | | | | | |
| | | | 6,573,558 | |
| | | | | | | | |
| | |
| | | | Diversified Support Services 1.8% | | | |
| | 780,400 | | | Frontken Corp. Bhd. | | | 693,418 | |
| | | | | | | | |
| | |
| | | | Drug Retail 2.1% | | | |
| | 18,245 | | | Corporativo Fragua SAB de CV | | | 833,812 | |
| | | | | | | | |
| | |
| | | | Electrical Components &
Equipment 1.8% | | | |
| | 73,300 | | | WEG SA | | | 731,829 | |
| | | | | | | | |
| | |
| | | | Electronic Manufacturing Services 2.1% | | | |
| | 3,519 | | | Fabrinet* | | | 832,032 | |
| | | | | | | | |
| | |
| | | | Food Retail 4.7% | | | |
| | 1,348,609 | | | Philippine Seven Corp. | | | 1,753,222 | |
| | 468,800 | | | Sumber Alfaria Trijaya Tbk. | | | 97,847 | |
| | | | | | | | |
| | | | 1,851,069 | |
| | | | | | | | |
| | |
| | | | Health Care Facilities 3.5% | | | |
| | 9,258 | | | Akdital Holding | | | 1,019,413 | |
| | 4,859 | | | Dr. Sulaiman Al Habib Medical Services Group Co. | | | 384,171 | |
| | | | | | | | |
| | | | 1,403,584 | |
| | | | | | | | |
| | |
| | | | Home Improvement Retail 0.3% | | | |
| | 316,400 | | | Wilcon Depot, Inc. | | | 103,259 | |
| | | | | | | | |
| | |
| | | | Human Resource & Employment
Services 0.8% | | | |
| | 453 | | | Benefit Systems SA | | | 310,121 | |
| | | | | | | | |
| | | | | | | | |
| Shares | | | | | Value | |
| | | | | | | |
| | |
| | | | Interactive Home Entertainment 2.8% | | | |
| | 11,738 | | | Sea Ltd., ADR* | | $ | 1,106,659 | |
| | | | | | | | |
| | |
| | | | Interactive Media & Services 4.0% | | | |
| | 386,403 | | | Baltic Classifieds Group PLC | | | 1,565,303 | |
| | | | | | | | |
| | |
| | | | IT Consulting & Other Services 15.9% | | | |
| | 1,637 | | | Elm Co. | | | 508,206 | |
| | 730,225 | | | FPT Corp. | | | 3,998,023 | |
| | 9,081 | | | Globant SA* | | | 1,799,309 | |
| | | | | | | | |
| | | | 6,305,538 | |
| | | | | | | | |
| | |
| | | | Life & Health Insurance 3.6% | | | |
| | 6,124 | | | Bupa Arabia for Cooperative Insurance Co. | | | 338,245 | |
| | 15,587 | | | Co. for Cooperative Insurance | | | 615,042 | |
| | 46,737 | | | Discovery Ltd. | | | 465,401 | |
| | | | | | | | |
| | | | 1,418,688 | |
| | | | | | | | |
| | |
| | | | Property & Casualty Insurance 2.3% | | | |
| | 116,922 | | | Qualitas Controladora SAB de CV | | | 914,296 | |
| | | | | | | | |
| | |
| | | | Regional Banks 0.2% | | | |
| | 10,200 | | | Regional SAB de CV | | | 59,216 | |
| | | | | | | | |
| | |
| | | | Research & Consulting Services 0.5% | | | |
| | 694,700 | | | CTOS Digital Bhd. | | | 205,594 | |
| | | | | | | | |
| | |
| | | | Semiconductors 1.9% | | | |
| | 52,000 | | | Silergy Corp. | | | 765,805 | |
| | | | | | | | |
| | |
| | | | Soft Drinks & Non-Alcoholic
Beverages 1.1% | | | |
| | 4,766,700 | | | Sariguna Primatirta Tbk. PT | | | 423,462 | |
| | | | | | | | |
| | |
| | | | Total Common Stocks
(cost $27,056,518) | | | 38,236,971 | |
| | | | | | | | |
| |
| | | | EXCHANGE-TRADED FUNDS 4.7% | |
| | |
| | | | Asset Management & Custody
Banks 4.7% | | | |
| | 1,348,300 | | | DCVFMVN Diamond ETF | | | 1,867,348 | |
| | | | | | | | |
| | |
| | | | Total Exchange-Traded Funds
(cost $1,583,298) | | | 1,867,348 | |
| | | | | | | | |
| | |
| | | | Total Investments
(cost $28,639,816) 101.3%§ | | | 40,104,319 | |
| | |
| | | | Liabilities less Other Assets (1.3%) | | | (505,446 | ) |
| | | | | | | | |
| | |
| | | | Net Assets 100.0% | | $ | 39,598,873 | |
| | | | | | | | |
| | | | *Non-income producing. §The aggregate amount of foreign securities fair valued pursuant to a systematic valuation model as a percent of net assets was 46.50%. ADR American Depositary Receipt. ETF Exchange-Traded Fund. | |
| |
| | | | See Notes to Financial Statements. | |
9
| | |
| Wasatch Frontier Emerging Small Countries Fund (WAFMX / WIFMX) | | SEPTEMBER 30, 2024 |
Schedule of Investments (continued)
At September 30, 2024, the Wasatch Frontier Emerging Small Countries Fund’s investments were in the following countries (unaudited):
| | | | | |
| Country | | % |
Brazil | | | | 8.1 | |
India | | | | 15.8 | |
Indonesia | | | | 2.6 | |
Malaysia | | | | 2.2 | |
Mexico | | | | 4.5 | |
Morocco | | | | 2.5 | |
Peru | | | | 2.0 | |
Philippines | | | | 6.8 | |
Poland | | | | 0.8 | |
Saudi Arabia | | | | 6.7 | |
Singapore | | | | 2.8 | |
South Africa | | | | 1.2 | |
Sweden | | | | 0.7 | |
Taiwan | | | | 1.9 | |
Thailand | | | | 0.9 | |
United Kingdom | | | | 5.7 | |
United States | | | | 15.1 | |
Vietnam | | | | 19.7 | |
| | | | | |
TOTAL | | | | 100.0 | % |
| | | | | |
10
| | |
| Wasatch Global Opportunities Fund (WAGOX / WIGOX) | | SEPTEMBER 30, 2024 |
Schedule of Investments
| | | | | | | | |
| Shares | | | | | Value | |
| | | | | | | |
| | |
| | | | COMMON STOCKS 98.5% | | | | |
| | |
| | | | Apparel Retail 1.1% | | | |
| | 13,382 | | | Boot Barn Holdings, Inc.* | | $ | 2,238,541 | |
| | | | | | | | |
| | |
| | | | Application Software 9.4% | | | |
| | 141,044 | | | Clearwater Analytics Holdings, Inc., Class A* | | | 3,561,361 | |
| | 32,775 | | | Guidewire Software, Inc.* | | | 5,995,858 | |
| | 64,496 | | | Q2 Holdings, Inc.* | | | 5,144,846 | |
| | 127,500 | | | Rakus Co. Ltd. | | | 1,985,910 | |
| | 174,993 | | | Technology One Ltd. | | | 2,879,952 | |
| | | | | | | | |
| | | | | | | 19,567,927 | |
| | | | | | | | |
| | |
| | | | Asset Management & Custody
Banks 2.8% | | | |
| | 23,959 | | | Hamilton Lane, Inc., Class A | | | 4,034,456 | |
| | 107,588 | | | Netwealth Group Ltd. | | | 1,841,042 | |
| | | | | | | | |
| | | | | | | 5,875,498 | |
| | | | | | | | |
| | |
| | | | Automotive Parts & Equipment 0.7% | | | |
| | 31,759 | | | XPEL, Inc.* | | | 1,377,388 | |
| | | | | | | | |
| | |
| | | | Automotive Retail 1.4% | | | |
| | 70,845 | | | Valvoline, Inc.* | | | 2,964,863 | |
| | | | | | | | |
| | |
| | | | Biotechnology 0.4% | | | |
| | 122,045 | | | C4 Therapeutics, Inc.* | | | 695,657 | |
| | 119,482 | | | Sangamo Therapeutics, Inc.* | | | 103,483 | |
| | | | | | | | |
| | | | | | | 799,140 | |
| | | | | | | | |
| | |
| | | | Broadline Retail 1.5% | | | |
| | 32,137 | | | Ollie’s Bargain Outlet Holdings, Inc.* | | | 3,123,716 | |
| | | | | | | | |
| | |
| | | | Building Products 2.1% | | | |
| | 65,881 | | | Trex Co., Inc.* | | | 4,386,357 | |
| | | | | | | | |
| | |
| | | | Cargo Ground Transportation 2.2% | | | |
| | 10,646 | | | Saia, Inc.* | | | 4,655,070 | |
| | | | | | | | |
| | |
| | | | Consumer Finance 1.0% | | | |
| | 220,735 | | | Five-Star Business Finance Ltd.* | | | 2,054,277 | |
| | | | | | | | |
| | |
| | | | Diversified Support Services 1.4% | | | |
| | 132,900 | | | Japan Elevator Service Holdings Co. Ltd. | | | 2,896,244 | |
| | | | | | | | |
| | |
| | | | Drug Retail 1.5% | | | |
| | 167,800 | | | Sugi Holdings Co. Ltd. | | | 3,098,871 | |
| | | | | | | | |
| | |
| | | | Electrical Components &
Equipment 3.7% | | | |
| | 121,896 | | | Voltronic Power Technology Corp. | | | 7,791,456 | |
| | | | | | | | |
| | |
| | | | Financial Exchanges & Data 0.6% | | | |
| | 212,332 | | | Open Lending Corp.* | | | 1,299,472 | |
| | | | | | | | |
| | |
| | | | Health Care Equipment 1.9% | | | |
| | 10,280 | | | DiaSorin SpA | | | 1,202,004 | |
| | 13,262 | | | Inspire Medical Systems, Inc.* | | | 2,798,945 | |
| | | | | | | | |
| | | | | | | 4,000,949 | |
| | | | | | | | |
| | |
| | | | Health Care Facilities 4.5% | | | |
| | 37,313 | | | Ensign Group, Inc. | | | 5,366,356 | |
| | 349,775 | | | Max Healthcare Institute Ltd. | | | 4,108,441 | |
| | | | | | | | |
| | | | | | | 9,474,797 | |
| | | | | | | | |
| | | | | | | | |
| Shares | | | | | Value | |
| | | | | | | |
| | |
| | | | Health Care Services 1.3% | | | |
| | 69,843 | | | Dr. Lal PathLabs Ltd. | | $ | 2,754,319 | |
| | | | | | | | |
| | |
| | | | Health Care Technology 0.7% | | | |
| | 48,050 | | | JMDC, Inc. | | | 1,564,448 | |
| | | | | | | | |
| | |
| | | | Home Furnishing Retail 1.1% | | | |
| | 188,237 | | | Arhaus, Inc. | | | 2,317,197 | |
| | | | | | | | |
| | |
| | | | Home Improvement Retail 0.9% | | | |
| | 14,499 | | | Floor & Decor Holdings, Inc., Class A* | | | 1,800,341 | |
| | | | | | | | |
| | |
| | | | Homebuilding 1.2% | | | |
| | 20,764 | | | LGI Homes, Inc.* | | | 2,460,949 | |
| | | | | | | | |
| | |
| | | | Human Resource & Employment
Services 3.2% | | | |
| | 22,145 | | | Paylocity Holding Corp.* | | | 3,653,261 | |
| | 197,700 | | | SMS Co. Ltd. | | | 2,970,776 | |
| | | | | | | | |
| | | | | | | 6,624,037 | |
| | | | | | | | |
| | |
| | | | Industrial Machinery & Supplies &
Components 5.8% | | | |
| | 235,964 | | | Elgi Equipments Ltd. | | | 1,914,778 | |
| | 36,810 | | | Helios Technologies, Inc. | | | 1,755,837 | |
| | 8,165 | | | Kadant, Inc. | | | 2,759,770 | |
| | 18,651 | | | RBC Bearings, Inc.* | | | 5,583,736 | |
| | | | | | | | |
| | | | | | | 12,014,121 | |
| | | | | | | | |
| | |
| | | | IT Consulting & Other Services 5.7% | | | |
| | 50,051 | | | Endava PLC, ADR* | | | 1,278,302 | |
| | 29,476 | | | Globant SA* | | | 5,840,375 | |
| | 52,247 | | | Persistent Systems Ltd. | | | 3,396,823 | |
| | 62,401 | | | Softcat PLC | | | 1,294,787 | |
| | | | | | | | |
| | | | | | | 11,810,287 | |
| | | | | | | | |
| | |
| | | | Leisure Products 0.8% | | | |
| | 41,782 | | | YETI Holdings, Inc.* | | | 1,714,315 | |
| | | | | | | | |
| | |
| | | | Life Sciences Tools & Services 3.1% | | | |
| | 53,730 | | | Divi’s Laboratories Ltd. | | | 3,490,595 | |
| | 8,882 | | | Medpace Holdings, Inc.* | | | 2,964,812 | |
| | | | | | | | |
| | | | | | | 6,455,407 | |
| | | | | | | | |
| | |
| | | | Managed Health Care 3.6% | | | |
| | 91,593 | | | HealthEquity, Inc.* | | | 7,496,887 | |
| | | | | | | | |
| | |
| | | | Other Specialty Retail 0.7% | | | |
| | 17,054 | | | Five Below, Inc.* | | | 1,506,721 | |
| | | | | | | | |
| | |
| | | | Packaged Foods & Meats 1.5% | | | |
| | 22,868 | | | Freshpet, Inc.* | | | 3,127,656 | |
| | | | | | | | |
| | |
| | | | Personal Care Products 2.0% | | | |
| | 67,143 | | | BellRing Brands, Inc.* | | | 4,076,923 | |
| | | | | | | | |
| | |
| | | | Pharmaceuticals 1.4% | | | |
| | 139,387 | | | Esperion Therapeutics, Inc.* | | | 229,988 | |
| | 36,010 | | | Intra-Cellular Therapies, Inc.* | | | 2,634,852 | |
| | | | | | | | |
| | | | | | | 2,864,840 | |
| | | | | | | | |
11
| | |
| Wasatch Global Opportunities Fund (WAGOX / WIGOX) | | SEPTEMBER 30, 2024 |
Schedule of Investments (continued)
| | | | | | | | |
| Shares | | | | | Value | |
| | | | | | | |
| | |
| | | | Regional Banks 4.5% | | | |
| | 733,626 | | | AU Small Finance Bank Ltd. | | $ | 6,468,155 | |
| | 68,234 | | | Bank OZK | | | 2,933,380 | |
| | | | | | | | |
| | | | | | | 9,401,535 | |
| | | | | | | | |
| | |
| | | | Research & Consulting Services 3.2% | | | |
| | 181,858 | | | BayCurrent, Inc. | | | 6,678,140 | |
| | | | | | | | |
| | |
| | | | Restaurants 0.5% | | | |
| | 31,322 | | | Dutch Bros, Inc., Class A* | | | 1,003,244 | |
| | | | | | | | |
| | |
| | | | Semiconductor Materials &
Equipment 2.3% | | | |
| | 87,000 | | | Gudeng Precision Industrial Co. Ltd. | | | 1,550,022 | |
| | 16,039 | | | Nova Ltd.* | | | 3,341,565 | |
| | | | | | | | |
| | | | | | | 4,891,587 | |
| | | | | | | | |
| | |
| | | | Semiconductors 6.9% | | | |
| | 38,347 | | | ASPEED Technology, Inc. | | | 5,185,416 | |
| | 17,536 | | | LEENO Industrial, Inc. | | | 2,525,658 | |
| | 25,904 | | | Melexis NV | | | 2,143,302 | |
| | 305,448 | | | Silergy Corp. | | | 4,498,335 | |
| | | | | | | | |
| | | | | | | 14,352,711 | |
| | | | | | | | |
| | |
| | | | Specialty Chemicals 1.3% | | | |
| | 15,561 | | | Balchem Corp. | | | 2,738,736 | |
| | | | | | | | |
| | |
| | | | Systems Software 1.6% | | | |
| | 11,188 | | | CyberArk Software Ltd.* | | | 3,262,533 | |
| | | | | | | | |
| | |
| | | | Trading Companies &
Distributors 4.6% | | | |
| | 64,752 | | | Diploma PLC | | | 3,849,171 | |
| | 341,500 | | | MonotaRO Co. Ltd. | | | 5,694,509 | |
| | | | | | | | |
| | | | | | | 9,543,680 | |
| | | | | | | | |
| | |
| | | | Transaction & Payment Processing
Services 4.4% | | | |
| | 49,400 | | | GMO Payment Gateway, Inc. | | | 3,006,157 | |
| | 69,670 | | | Shift4 Payments, Inc., Class A* | | | 6,172,762 | |
| | | | | | | | |
| | | | | | | 9,178,919 | |
| | | | | | | | |
| | |
| | | | Total Common Stocks
(cost $135,493,426) | | | 205,244,099 | |
| | | | | | | | |
| | |
| | | | Total Investments
(cost $135,493,426) 98.5%§ | | | 205,244,099 | |
| | |
| | | | Other Assets less Liabilities 1.5% | | | 3,143,547 | |
| | | | | | | | |
| | |
| | | | Net Assets 100.0% | | $ | 208,387,646 | |
| | | | | | | | |
| |
| | | | *Non-income producing. §The aggregate amount of foreign securities fair valued pursuant to a systematic valuation model as a percent of net assets was 41.05%. ADR American Depositary Receipt. | |
| |
| | | | See Notes to Financial Statements. | |
At September 30, 2024, the Wasatch Global Opportunities Fund’s investments were in the following countries (unaudited):
| | | | | |
| Country | | % |
Australia | | | | 2.3 | |
Belgium | | | | 1.0 | |
India | | | | 11.8 | |
Israel | | | | 3.2 | |
Italy | | | | 0.6 | |
Japan | | | | 13.6 | |
South Korea | | | | 1.2 | |
Taiwan | | | | 9.3 | |
United Kingdom | | | | 3.1 | |
United States | | | | 53.9 | |
| | | | | |
TOTAL | | | | 100.0 | % |
| | | | | |
12
| | |
| Wasatch Global Select Fund (WAGSX / WGGSX) | | SEPTEMBER 30, 2024 |
Schedule of Investments
| | | | | | | | |
| Shares | | | | | Value | |
| | | | | | | |
| |
| | | | COMMON STOCKS 98.9% | |
| | |
| | | | Application Software 17.3% | | | |
| | 6,716 | | | Dassault Systemes SE | | $ | 266,765 | |
| | 5,675 | | | Descartes Systems Group, Inc.* | | | 583,970 | |
| | 602 | | | HubSpot, Inc.* | | | 320,023 | |
| | 1,107 | | | Roper Technologies, Inc. | | | 615,979 | |
| | 855 | | | Tyler Technologies, Inc.* | | | 499,081 | |
| | 3,229 | | | Xero Ltd.* | | | 333,768 | |
| | | | | | | | |
| | | | | | | 2,619,586 | |
| | | | | | | | |
| | |
| | | | Broadline Retail 4.6% | | | |
| | 341 | | | MercadoLibre, Inc.* | | | 699,718 | |
| | | | | | | | |
| | |
| | | | Building Products 6.1% | | | |
| | 16,799 | | | Assa Abloy AB, Class B | | | 565,957 | |
| | 5,360 | | | Trex Co., Inc.* | | | 356,869 | |
| | | | | | | | |
| | | | | | | 922,826 | |
| | | | | | | | |
| | |
| | | | Cargo Ground Transportation 3.1% | | | |
| | 2,353 | | | Old Dominion Freight Line, Inc. | | | 467,400 | |
| | | | | | | | |
| | |
| | | | Consumer Finance 4.0% | | | |
| | 6,647 | | | Bajaj Finance Ltd. | | | 610,713 | |
| | | | | | | | |
| | |
| | | | Distributors 3.2% | | | |
| | 1,269 | | | Pool Corp. | | | 478,159 | |
| | | | | | | | |
| | |
| | | | Diversified Banks 3.9% | | | |
| | 28,929 | | | HDFC Bank Ltd. | | | 595,773 | |
| | | | | | | | |
| | |
| | | | Diversified Support Services 4.2% | | | |
| | 12,053 | | | Copart, Inc.* | | | 631,577 | |
| | | | | | | | |
| | |
| | | | Drug Retail 3.0% | | | |
| | 24,900 | | | Sugi Holdings Co. Ltd. | | | 459,844 | |
| | | | | | | | |
| | |
| | | | Electrical Components & Equipment 2.8% | | | |
| | 42,000 | | | WEG SA | | | 419,329 | |
| | | | | | | | |
| | |
| | | | Electronic Components 3.0% | | | |
| | 6,932 | | | Amphenol Corp., Class A | | | 451,689 | |
| | | | | | | | |
| | |
| | | | Electronic Equipment & Instruments 2.9% | | | |
| | 12,672 | | | Halma PLC | | | 443,083 | |
| | | | | | | | |
| | |
| | | | Financial Exchanges & Data 3.5% | | | |
| | 1,660 | | | Morningstar, Inc. | | | 529,739 | |
| | | | | | | | |
| | |
| | | | Health Care Equipment 1.9% | | | |
| | 2,461 | | | DiaSorin SpA | | | 287,756 | |
| | | | | | | | |
| | |
| | | | Industrial Machinery & Supplies &
Components 3.7% | | | |
| | 1,858 | | | RBC Bearings, Inc.* | | | 556,248 | |
| | | | | | | | |
| | |
| | | | Interactive Media & Services 3.5% | | | |
| | 6,256 | | | Scout24 SE | | | 538,628 | |
| | | | | | | | |
| | |
| | | | IT Consulting & Other Services 2.2% | | | |
| | 1,665 | | | Globant SA* | | | 329,903 | |
| | | | | | | | |
| | |
| | | | Life Sciences Tools & Services 3.6% | | | |
| | 1,914 | | | ICON PLC* | | | 549,911 | |
| | | | | | | | |
| | | | | | | | |
| Shares | | | | | Value | |
| | | | | | | |
| | |
| | | | Managed Health Care 3.9% | | | |
| | 7,218 | | | HealthEquity, Inc.* | | $ | 590,793 | |
| | | | | | | | |
| | |
| | | | Research & Consulting Services 3.9% | | | |
| | 15,980 | | | BayCurrent, Inc. | | | 586,813 | |
| | | | | | | | |
| | |
| | | | Semiconductor Materials &
Equipment 1.5% | | | |
| | 1,336 | | | Lasertec Corp. | | | 222,747 | |
| | | | | | | | |
| | |
| | | | Semiconductors 4.3% | | | |
| | 370 | | | Monolithic Power Systems, Inc. | | | 342,065 | |
| | 21,419 | | | Silergy Corp. | | | 315,438 | |
| | | | | | | | |
| | | | | | | 657,503 | |
| | | | | | | | |
| | |
| | | | Trading Companies & Distributors 3.3% | | | |
| | 29,876 | | | MonotaRO Co. Ltd. | | | 498,182 | |
| | | | | | | | |
| | |
| | | | Transaction & Payment Processing
Services 5.5% | | | |
| | 3,460 | | | Block, Inc.* | | | 232,270 | |
| | 3,938 | | | GMO Payment Gateway, Inc. | | | 239,641 | |
| | 4,074 | | | Shift4 Payments, Inc., Class A* | | | 360,956 | |
| | | | | | | | |
| | | | | | | 832,867 | |
| | | | | | | | |
| | |
| | | | Total Common Stocks
(cost $11,143,121) | | | 14,980,787 | |
| | | | | | | | |
| | |
| | | | Total Investments
(cost $11,143,121) 98.9%§ | | | 14,980,787 | |
| | |
| | | | Other Assets less Liabilities 1.1% | | | 164,635 | |
| | | | | | | | |
| | |
| | | | Net Assets 100.0% | | $ | 15,145,422 | |
| | | | | | | | |
| |
| | | | *Non-income producing. §The aggregate amount of foreign securities fair valued pursuant to a systematic valuation model as a percent of net assets was 39.39%. | |
| |
| | | | See Notes to Financial Statements. | |
At September 30, 2024, the Wasatch Global Select Fund’s investments were in the following countries (unaudited):
| | | | | |
| Country | | % |
Australia | | | | 2.2 | |
Brazil | | | | 2.8 | |
Canada | | | | 3.9 | |
France | | | | 1.8 | |
Germany | | | | 3.6 | |
India | | | | 8.0 | |
Ireland | | | | 3.7 | |
Italy | | | | 1.9 | |
Japan | | | | 13.4 | |
Sweden | | | | 3.8 | |
Taiwan | | | | 2.1 | |
United Kingdom | | | | 3.0 | |
United States | | | | 49.8 | |
| | | | | |
TOTAL | | | | 100.0 | % |
| | | | | |
13
| | |
| Wasatch Global Value Fund (FMIEX / WILCX) | | SEPTEMBER 30, 2024 |
Schedule of Investments
| | | | | | | | |
| Shares | | | | | Value | |
| | | | | | | |
| |
| | | | COMMON STOCKS 97.7% | |
| | |
| | | | Broadline Retail 1.8% | | | |
| | 183,000 | | | Alibaba Group Holding Ltd. | | $ | 2,431,846 | |
| | | | | | | | |
| | |
| | | | Diversified Banks 12.7% | | | |
| | 42,000 | | | Citigroup, Inc. | | | 2,629,200 | |
| | 173,800 | | | ING Groep NV, ADR | | | 3,156,208 | |
| | 19,700 | | | JPMorgan Chase & Co. | | | 4,153,942 | |
| | 38,000 | | | Toronto-Dominion Bank | | | 2,402,869 | |
| | 175,000 | | | United Overseas Bank Ltd. | | | 4,368,344 | |
| | | | | | | | |
| | | | | | | 16,710,563 | |
| | | | | | | | |
| | |
| | | | Diversified Metals & Mining 2.5% | | | |
| | 105,000 | | | BHP Group Ltd. | | | 3,259,846 | |
| | | | | | | | |
| | |
| | | | Electric Utilities 11.9% | | | |
| | 55,000 | | | Duke Energy Corp. | | | 6,341,500 | |
| | 64,000 | | | Evergy, Inc. | | | 3,968,640 | |
| | 134,000 | | | Exelon Corp. | | | 5,433,700 | |
| | | | | | | | |
| | | | | | | 15,743,840 | |
| | | | | | | | |
| | |
| | | | Food Retail 5.2% | | | |
| | 125,000 | | | Koninklijke Ahold Delhaize NV | | | 4,317,628 | |
| | 167,000 | | | Seven & i Holdings Co. Ltd. | | | 2,514,628 | |
| | | | | | | | |
| | | | | | | 6,832,256 | |
| | | | | | | | |
| | |
| | | | Health Care Services 3.8% | | | |
| | 32,000 | | | Quest Diagnostics, Inc. | | | 4,968,000 | |
| | | | | | | | |
| | |
| | | | Industrial Machinery & Supplies &
Components 1.2% | | | |
| | 44,000 | | | Hoshizaki Corp. | | | 1,532,336 | |
| | | | | | | | |
| | |
| | | | Industrial REITs 2.3% | | | |
| | 1,582,900 | | | Mapletree Industrial Trust | | | 2,991,151 | |
| | | | | | | | |
| | |
| | | | Integrated Oil & Gas 8.0% | | | |
| | 20,000 | | | Chevron Corp. | | | 2,945,400 | |
| | 76,000 | | | Suncor Energy, Inc. | | | 2,805,220 | |
| | 75,000 | | | TotalEnergies SE | | | 4,870,146 | |
| | | | | | | | |
| | | | | | | 10,620,766 | |
| | | | | | | | |
| | |
| | | | Integrated Telecommunication
Services 8.3% | | | |
| | 180,000 | | | AT&T, Inc. | | | 3,960,000 | |
| | 14,365,300 | | | Telkom Indonesia Persero Tbk. PT | | | 2,844,531 | |
| | 93,000 | | | Verizon Communications, Inc. | | | 4,176,630 | |
| | | | | | | | |
| | | | | | | 10,981,161 | |
| | | | | | | | |
| | |
| | | | IT Consulting & Other Services 2.5% | | | |
| | 38,000 | | | Amdocs Ltd. | | | 3,324,240 | |
| | | | | | | | |
| | |
| | | | Managed Health Care 2.2% | | | |
| | 38,000 | | | Centene Corp.* | | | 2,860,640 | |
| | | | | | | | |
| | |
| | | | Multi-Line Insurance 2.7% | | | |
| | 91,500 | | | AXA SA | | | 3,522,459 | |
| | | | | | | | |
| | |
| | | | Other Specialized REITs 2.7% | | | |
| | 109,000 | | | VICI Properties, Inc. | | | 3,630,790 | |
| | | | | | | | |
| | | | | | | | |
| Shares | | | | | Value | |
| | | | | | | |
| | |
| | | | Packaged Foods & Meats 1.9% | | | |
| | 71,000 | | | Kraft Heinz Co. | | $ | 2,492,810 | |
| | | | | | | | |
| | |
| | | | Personal Care Products 2.3% | | | |
| | 132,700 | | | Kenvue, Inc. | | | 3,069,351 | |
| | | | | | | | |
| | |
| | | | Pharmaceuticals 9.0% | | | |
| | 38,900 | | | Johnson & Johnson | | | 6,304,134 | |
| | 48,500 | | | Novartis AG | | | 5,584,401 | |
| | | | | | | | |
| | | | | | | 11,888,535 | |
| | | | | | | | |
| | |
| | | | Property & Casualty Insurance 2.3% | | | |
| | 39,000 | | | Axis Capital Holdings Ltd. | | | 3,104,790 | |
| | | | | | | | |
| | |
| | | | Rail Transportation 3.3% | | | |
| | 17,500 | | | Union Pacific Corp. | | | 4,313,400 | |
| | | | | | | | |
| | |
| | | | Reinsurance 2.7% | | | |
| | 6,600 | | | Muenchener Rueckversicherungs-Gesellschaft AG in Muenchen | | | 3,636,891 | |
| | | | | | | | |
| | |
| | | | Retail REITs 2.0% | | | |
| | 113,000 | | | Kimco Realty Corp. | | | 2,623,860 | |
| | | | | | | | |
| | |
| | | | Semiconductors 0.4% | | | |
| | 24,000 | | | Intel Corp. | | | 563,040 | |
| | | | | | | | |
| | |
| | | | Technology Hardware, Storage &
Peripherals 2.2% | | | |
| | 63,500 | | | Samsung Electronics Co. Ltd. | | | 2,967,913 | |
| | | | | | | | |
| | |
| | | | Tobacco 3.8% | | | |
| | 60,000 | | | KT&G Corp. | | | 4,974,229 | |
| | | | | | | | |
| | |
| | | | Total Common Stocks
(cost $99,666,710) | | | 129,044,713 | |
| | | | | | | | |
| | |
| | | | Total Investments
(cost $99,666,710) 97.7%§ | | | 129,044,713 | |
| | |
| | | | Other Assets less Liabilities 2.3% | | | 2,986,591 | |
| | | | | | | | |
| | |
| | | | Net Assets 100.0% | | $ | 132,031,304 | |
| | | | | | | | |
| |
| | | | *Non-income producing. §The aggregate amount of foreign securities fair valued pursuant to a systematic valuation model as a percent of net assets was 34.46%. ADR American Depositary Receipt. | |
| |
| | | | See Notes to Financial Statements. | |
14
| | |
| Wasatch Global Value Fund (FMIEX / WILCX) | | SEPTEMBER 30, 2024 |
Schedule of Investments (continued)
At September 30, 2024, the Wasatch Global Value Fund’s investments were in the following countries (unaudited):
| | | | | |
| Country | | % |
Australia | | | | 2.5 | |
Canada | | | | 4.0 | |
China | | | | 1.9 | |
France | | | | 6.5 | |
Germany | | | | 2.8 | |
Indonesia | | | | 2.2 | |
Japan | | | | 3.2 | |
Netherlands | | | | 5.8 | |
Singapore | | | | 5.7 | |
South Korea | | | | 6.2 | |
Switzerland | | | | 4.3 | |
United States | | | | 54.9 | |
| | | | | |
TOTAL | | | | 100.0 | % |
| | | | | |
15
| | |
| Wasatch Greater China Fund (WAGCX / WGGCX) | | SEPTEMBER 30, 2024 |
Schedule of Investments
| | | | | | | | |
| Shares | | | | | Value | |
| | | | | | | |
| |
| | | | COMMON STOCKS 97.1% | |
| | |
| | | | Apparel, Accessories & Luxury Goods 3.6% | | | |
| | 18,500 | | | Shenzhou International Group Holdings Ltd. | | $ | 163,780 | |
| | | | | | | | |
| | |
| | | | Broadline Retail 3.3% | | | |
| | 1,121 | | | PDD Holdings, Inc., ADR* | | | 151,122 | |
| | | | | | | | |
| | |
| | | | Distillers & Vintners 9.3% | | | |
| | 1,100 | | | Kweichow Moutai Co. Ltd., Class A | | | 269,551 | |
| | 6,900 | | | Wuliangye Yibin Co. Ltd., Class A | | | 157,877 | |
| | | | | | | | |
| | | | | | | 427,428 | |
| | | | | | | | |
| | |
| | | | Diversified Banks 1.2% | | | |
| | 11,500 | | | China Merchants Bank Co. Ltd., Class H | | | 55,727 | |
| | | | | | | | |
| | |
| | | | Drug Retail 3.8% | | | |
| | 48,717 | | | Yifeng Pharmacy Chain Co. Ltd., Class A | | | 175,664 | |
| | | | | | | | |
| | |
| | | | Electrical Components & Equipment 3.4% | | | |
| | 4,440 | | | Contemporary Amperex Technology Co. Ltd., Class A | | | 156,039 | |
| | | | | | | | |
| | |
| | | | Electronic Components 2.9% | | | |
| | 36,100 | | | Shenzhen H&T Intelligent Control Co. Ltd., Class A | | | 58,258 | |
| | 8,000 | | | Sinbon Electronics Co. Ltd. | | | 75,782 | |
| | | | | | | | |
| | | | | | | 134,040 | |
| | | | | | | | |
| | |
| | | | Electronic Equipment & Instruments 2.7% | | | |
| | 4,200 | | | Shanghai BOCHU Electronic Technology Corp. Ltd., Class A | | | 125,346 | |
| | | | | | | | |
| | |
| | | | Health Care Equipment 3.1% | | | |
| | 3,400 | | | Shenzhen Mindray Bio-Medical Electronics Co. Ltd., Class A | | | 140,207 | |
| | | | | | | | |
| | |
| | | | Hotels, Resorts & Cruise Lines 4.9% | | | |
| | 35,800 | | | H World Group Ltd. | | | 134,762 | |
| | 1,469 | | | Trip.com Group Ltd., ADR* | | | 87,302 | |
| | | | | | | | |
| | | | | | | 222,064 | |
| | | | | | | | |
| | |
| | | | Industrial Machinery & Supplies &
Components 14.7% | | | |
| | 4,100 | | | Airtac International Group | | | 117,428 | |
| | 37,350 | | | Shenzhen Envicool Technology Co. Ltd., Class A | | | 137,672 | |
| | 11,363 | | | Shenzhen Inovance Technology Co. Ltd., Class A | | | 100,135 | |
| | 21,278 | | | Techtronic Industries Co. Ltd. | | | 317,647 | |
| | | | | | | | |
| | | | | | | 672,882 | |
| | | | | | | | |
| | |
| | | | Interactive Media & Services 8.1% | | | |
| | 6,700 | | | Tencent Holdings Ltd. | | | 372,552 | |
| | | | | | | | |
| | |
| | | | Life & Health Insurance 4.0% | | | |
| | 10,100 | | | AIA Group Ltd. | | | 88,202 | |
| | 15,000 | | | Ping An Insurance Group Co. of China Ltd., Class H | | | 94,193 | |
| | | | | | | | |
| | | | | | | 182,395 | |
| | | | | | | | |
| | |
| | | | Life Sciences Tools & Services 2.8% | | | |
| | 6,100 | | | Hangzhou Tigermed Consulting Co. Ltd., Class A | | | 59,417 | |
| | 30,687 | | | Wuxi Biologics Cayman, Inc.* | | | 67,844 | |
| | | | | | | | |
| | | | | | | 127,261 | |
| | | | | | | | |
| | | | | | | | |
| Shares | | | | | Value | |
| | | | | | | |
| | |
| | | | Other Specialty Retail 1.0% | | | |
| | 4,200 | | | China Tourism Group Duty Free Corp. Ltd., Class A | | $ | 45,482 | |
| | | | | | | | |
| | |
| | | | Personal Care Products 3.4% | | | |
| | 10,037 | | | Proya Cosmetics Co. Ltd., Class A | | | 156,458 | |
| | | | | | | | |
| | |
| | | | Regional Banks 1.5% | | | |
| | 18,500 | | | Bank of Ningbo Co. Ltd., Class A | | | 66,996 | |
| | | | | | | | |
| | |
| | | | Restaurants 6.8% | | | |
| | 14,700 | | | Meituan, Class B* | | | 312,160 | |
| | | | | | | | |
| | |
| | | | Semiconductor Materials &
Equipment 2.7% | | | |
| | 6,997 | | | Gudeng Precision Industrial Co. Ltd. | | | 124,661 | |
| | | | | | | | |
| | |
| | | | Semiconductors 10.2% | | | |
| | 1,814 | | | 3peak, Inc., Class A* | | | 25,904 | |
| | 20,700 | | | Silergy Corp. | | | 304,849 | |
| | 41,256 | | | Sino Wealth Electronic Ltd., Class A | | | 137,793 | |
| | | | | | | | |
| | | | | | | 468,546 | |
| | | | | | | | |
| | |
| | | | Specialized Finance 0.9% | | | |
| | 8,000 | | | Chailease Holding Co. Ltd. | | | 41,148 | |
| | | | | | | | |
| | |
| | | | Systems Software 2.8% | | | |
| | 34,700 | | | Hangzhou Dptech Technologies Co. Ltd., Class A | | | 79,543 | |
| | 5,000 | | | Sangfor Technologies, Inc., Class A | | | 49,627 | |
| | | | | | | | |
| | | | | | | 129,170 | |
| | | | | | | | |
| | |
| | | | Total Common Stocks
(cost $5,935,759) | | | 4,451,128 | |
| | | | | | | | |
| | |
| | | | Total Investments
(cost $5,935,759) 97.1%§ | | | 4,451,128 | |
| | |
| | | | Other Assets less Liabilities 2.9% | | | 133,275 | |
| | | | | | | | |
| | |
| | | | Net Assets 100.0% | | $ | 4,584,403 | |
| | | | | | | | |
| |
| | | | *Non-income producing. §The aggregate amount of foreign securities fair valued pursuant to a systematic valuation model as a percent of net assets was 91.89%. ADR American Depositary Receipt. | |
| |
| | | | See Notes to Financial Statements. | |
At September 30, 2024, the Wasatch Greater China Fund’s investments were in the following countries (unaudited):
| | | | | |
| Country | | % |
China | | | | 76.0 | |
Hong Kong | | | | 9.1 | |
Taiwan | | | | 14.9 | |
| | | | | |
TOTAL | | | | 100.0 | % |
| | | | | |
16
| | |
| Wasatch International Growth Fund (WAIGX / WIIGX) | | SEPTEMBER 30, 2024 |
Schedule of Investments
| | | | | | | | |
| Shares | | | | | Value | |
| | | | | | | |
| |
| | | | COMMON STOCKS 97.8% | |
| | |
| | | | Application Software 9.1% | | | |
| | 143,262 | | | Bytes Technology Group PLC | | $ | 995,173 | |
| | 89,761 | | | Descartes Systems Group, Inc.* | | | 9,236,599 | |
| | 48,887 | | | Planisware SA* | | | 1,514,196 | |
| | 327,200 | | | Rakus Co. Ltd. | | | 5,096,390 | |
| | 616,530 | | | Technology One Ltd. | | | 10,146,559 | |
| | | | | | | | |
| | | | | | | 26,988,917 | |
| | | | | | | | |
| | |
| | | | Asset Management & Custody
Banks 4.2% | | | |
| | 340,210 | | | JTC PLC | | | 4,812,248 | |
| | 442,634 | | | Netwealth Group Ltd. | | | 7,574,335 | |
| | | | | | | | |
| | | | | | | 12,386,583 | |
| | | | | | | | |
| | |
| | | | Brewers 1.1% | | | |
| | 40,503 | | | Royal Unibrew AS* | | | 3,398,087 | |
| | | | | | | | |
| | |
| | | | Broadline Retail 1.8% | | | |
| | 293,100 | | | Ryohin Keikaku Co. Ltd. | | | 5,382,133 | |
| | | | | | | | |
| | |
| | | | Building Products 2.7% | | | |
| | 72,877 | | | Carel Industries S.p.A. | | | 1,591,633 | |
| | 285,296 | | | Munters Group AB | | | 6,521,542 | |
| | | | | | | | |
| | | | | | | 8,113,175 | |
| | | | | | | | |
| | |
| | | | Commercial & Residential Mortgage
Finance 0.9% | | | |
| | 499,027 | | | OSB Group PLC | | | 2,611,435 | |
| | | | | | | | |
| | |
| | | | Commodity Chemicals 0.6% | | | |
| | 252,378 | | | Berger Paints India Ltd. | | | 1,873,625 | |
| | | | | | | | |
| | |
| | | | Consumer Finance 2.0% | | | |
| | 172,261 | | | Cholamandalam Financial Holdings Ltd. | | | 4,200,929 | |
| | 188,825 | | | Five-Star Business Finance Ltd.* | | | 1,757,306 | |
| | | | | | | | |
| | | | | | | 5,958,235 | |
| | | | | | | | |
| | |
| | | | Diversified Banks 0.6% | | | |
| | 75,300 | | | Rakuten Bank Ltd.* | | | 1,715,153 | |
| | | | | | | | |
| | |
| | | | Diversified Real Estate Activities 1.3% | | | |
| | 394,102 | | | Patrizia SE | | | 3,924,995 | |
| | | | | | | | |
| | |
| | | | Diversified Support Services 3.5% | | | |
| | 475,393 | | | Japan Elevator Service Holdings Co. Ltd. | | | 10,360,076 | |
| | | | | | | | |
| | |
| | | | Drug Retail 3.4% | | | |
| | 538,432 | | | Raia Drogasil SA | | | 2,519,344 | |
| | 411,800 | | | Sugi Holdings Co. Ltd. | | | 7,604,976 | |
| | | | | | | | |
| | | | | | | 10,124,320 | |
| | | | | | | | |
| | |
| | | | Electrical Components &
Equipment 3.4% | | | |
| | 156,969 | | | Voltronic Power Technology Corp. | | | 10,033,283 | |
| | | | | | | | |
| | |
| | | | Electronic Equipment &
Instruments 3.2% | | | |
| | 269,566 | | | Halma PLC | | | 9,425,501 | |
| | | | | | | | |
| | | | | | | | |
| Shares | | | | | Value | |
| | | | | | | |
| | |
| | | | Health Care Equipment 2.1% | | | |
| | 53,298 | | | DiaSorin SpA | | $ | 6,231,945 | |
| | | | | | | | |
| | |
| | | | Health Care Facilities 1.4% | | | |
| | 347,567 | | | Max Healthcare Institute Ltd. | | | 4,082,506 | |
| | | | | | | | |
| | |
| | | | Health Care Services 0.9% | | | |
| | 71,657 | | | Dr. Lal PathLabs Ltd. | | | 2,825,855 | |
| | | | | | | | |
| | |
| | | | Health Care Technology 2.8% | | | |
| | 100,827 | | | JMDC, Inc. | | | 3,282,802 | |
| | 42,146 | | | Pro Medicus Ltd. | | | 5,187,522 | |
| | | | | | | | |
| | | | | | | 8,470,324 | |
| | | | | | | | |
| | |
| | | | Human Resource & Employment
Services 3.4% | | | |
| | 517,105 | | | SMS Co. Ltd. | | | 7,770,377 | |
| | 40,400 | | | Visional, Inc.* | | | 2,232,018 | |
| | | | | | | | |
| | | | | | | 10,002,395 | |
| | | | | | | | |
| | |
| | | | Industrial Machinery & Supplies &
Components 1.5% | | | |
| | 496,687 | | | Elgi Equipments Ltd. | | | 4,030,467 | |
| | 12,972 | | | Stabilus SE | | | 530,613 | |
| | | | | | | | |
| | | | | | | 4,561,080 | |
| | | | | | | | |
| | |
| | | | Interactive Media & Services 4.9% | | | |
| | 117,207 | | | Hemnet Group AB | | | 4,313,964 | |
| | 187,588 | | | Rightmove PLC | | | 1,550,691 | |
| | 101,958 | | | Scout24 SE | | | 8,778,356 | |
| | | | | | | | |
| | | | | | | 14,643,011 | |
| | | | | | | | |
| | |
| | | | Investment Banking & Brokerage 2.1% | | | |
| | 1,030,559 | | | AJ Bell PLC | | | 6,193,238 | |
| | | | | | | | |
| | |
| | | | IT Consulting & Other Services 6.2% | | | |
| | 93,803 | | | Endava PLC, ADR* | | | 2,395,729 | |
| | 24,403 | | | Globant SA* | | | 4,835,210 | |
| | 21,324 | | | Persistent Systems Ltd. | | | 1,386,373 | |
| | 17,032 | | | Reply SpA | | | 2,568,413 | |
| | 356,423 | | | Softcat PLC | | | 7,395,588 | |
| | | | | | | | |
| | | | | | | 18,581,313 | |
| | | | | | | | |
| | |
| | | | Life Sciences Tools & Services 0.5% | | | |
| | 16,797 | | | Gerresheimer AG | | | 1,499,310 | |
| | | | | | | | |
| | |
| | | | Movies & Entertainment 2.1% | | | |
| | 58,754 | | | CTS Eventim AG & Co. KGaA | | | 6,117,791 | |
| | | | | | | | |
| | |
| | | | Property & Casualty Insurance 4.3% | | | |
| | 209,014 | | | Definity Financial Corp. | | | 8,424,233 | |
| | 578,618 | | | Qualitas Controladora SAB de CV | | | 4,524,622 | |
| | | | | | | | |
| | | | | | | 12,948,855 | |
| | | | | | | | |
| | |
| | | | Regional Banks 3.2% | | | |
| | 566,477 | | | AU Small Finance Bank Ltd. | | | 4,994,454 | |
| | 59,676 | | | EQB, Inc. | | | 4,599,965 | |
| | | | | | | | |
| | | | | | | 9,594,419 | |
| | | | | | | | |
| | |
| | | | Research & Consulting Services 3.3% | | | |
| | 271,700 | | | BayCurrent, Inc. | | | 9,977,293 | |
| | | | | | | | |
17
| | |
| Wasatch International Growth Fund (WAIGX / WIIGX) | | SEPTEMBER 30, 2024 |
Schedule of Investments (continued)
| | | | | | | | |
| Shares | | | | | Value | |
| | | | | | | |
| | |
| | | | Semiconductor Materials &
Equipment 1.2% | | | |
| | 141,993 | | | Gudeng Precision Industrial Co. Ltd. | | $ | 2,529,795 | |
| | 88,300 | | | Japan Material Co. Ltd. | | | 1,149,160 | |
| | | | | | | | |
| | | | | | | 3,678,955 | |
| | | | | | | | |
| | |
| | | | Semiconductors 6.9% | | | |
| | 39,479 | | | ASPEED Technology, Inc. | | | 5,338,489 | |
| | 39,014 | | | LEENO Industrial, Inc. | | | 5,619,071 | |
| | 25,212 | | | Melexis NV | | | 2,086,046 | |
| | 501,768 | | | Silergy Corp. | | | 7,389,541 | |
| | | | | | | | |
| | | | | | | 20,433,147 | |
| | | | | | | | |
| | |
| | | | Soft Drinks & Non-Alcoholic
Beverages 0.2% | | | |
| | 52,481 | | | Fevertree Drinks PLC | | | 578,857 | |
| | | | | | | | |
| | |
| | | | Specialty Chemicals 0.4% | | | |
| | 103,541 | | | Hexpol AB | | | 1,070,788 | |
| | | | | | | | |
| | |
| | | | Systems Software 1.7% | | | |
| | 17,566 | | | CyberArk Software Ltd.* | | | 5,122,421 | |
| | | | | | | | |
| | |
| | | | Trading Companies &
Distributors 9.0% | | | |
| | 204,180 | | | Diploma PLC | | | 12,137,443 | |
| | 313,914 | | | Howden Joinery Group PLC | | | 3,814,775 | |
| | 659,248 | | | MonotaRO Co. Ltd. | | | 10,992,954 | |
| | | | | | | | |
| | | | | | | 26,945,172 | |
| | | | | | | | |
| | |
| | | | Transaction & Payment Processing
Services 1.9% | | | |
| | 93,400 | | | GMO Payment Gateway, Inc. | | | 5,683,706 | |
| | | | | | | | |
| | |
| | | | Total Common Stocks
(cost $176,002,130) | | | 291,537,899 | |
| | | | | | | | |
| | |
| | | | Total Investments
(cost $176,002,130) 97.8%§ | | | 291,537,899 | |
| | |
| | | | Other Assets less Liabilities 2.2% | | | 6,533,847 | |
| | | | | | | | |
| | |
| | | | Net Assets 100.0% | | $ | 298,071,746 | |
| | | | | | | | |
| |
| | | | *Non-income producing. §The aggregate amount of foreign securities fair valued pursuant to a systematic valuation model as a percent of net assets was 74.98%. ADR American Depositary Receipt. | |
| |
| | | | See Notes to Financial Statements. | |
At September 30, 2024, the Wasatch International Growth Fund’s investments were in the following countries (unaudited):
| | | | | |
| Country | | % |
Australia | | | | 7.9 | |
Belgium | | | | 0.7 | |
Brazil | | | | 0.9 | |
Canada | | | | 7.6 | |
Denmark | | | | 1.2 | |
France | | | | 0.5 | |
Germany | | | | 7.1 | |
India | | | | 8.6 | |
Israel | | | | 1.8 | |
Italy | | | | 3.6 | |
Japan | | | | 24.4 | |
Mexico | | | | 1.5 | |
South Korea | | | | 1.9 | |
Sweden | | | | 4.1 | |
Taiwan | | | | 8.7 | |
United Kingdom | | | | 17.8 | |
United States | | | | 1.7 | |
| | | | | |
TOTAL | | | | 100.0 | % |
| | | | | |
18
| | |
| Wasatch International Opportunities Fund (WAIOX / WIIOX) | | SEPTEMBER 30, 2024 |
Schedule of Investments
| | | | | | | | |
| Shares | | | | | Value | |
| | | | | | | |
| |
| | | | COMMON STOCKS 99.0% | |
| | |
| | | | Advertising 0.5% | | | |
| | 120,718 | | | YouGov PLC | | $ | 708,740 | |
| | | | | | | | |
| | |
| | | | Alternative Carriers 1.5% | | | |
| | 150,307 | | | Chief Telecom, Inc. | | | 2,260,049 | |
| | | | | | | | |
| | |
| | | | Application Software 12.1% | | | |
| | 23,267 | | | Atoss Software SE | | | 3,367,930 | |
| | 389,381 | | | Bytes Technology Group PLC | | | 2,704,844 | |
| | 9,439 | | | Esker SA | | | 2,782,136 | |
| | 145,724 | | | Fortnox AB | | | 905,640 | |
| | 192,618 | | | m-up Holdings, Inc. | | | 1,785,522 | |
| | 32,966 | | | Mensch und Maschine Software SE | | | 1,992,597 | |
| | 136,632 | | | Rakus Co. Ltd. | | | 2,128,148 | |
| | 39,220 | | | Vitec Software Group AB, Class B | | | 2,031,314 | |
| | | | | | | | |
| | | | 17,698,131 | |
| | | | | | | | |
| | |
| | | | Asset Management & Custody
Banks 4.9% | | | |
| | 333,731 | | | JTC PLC | | | 4,720,603 | |
| | 79,822 | | | Prudent Corporate Advisory Services Ltd. | | | 2,478,765 | |
| | | | | | | | |
| | | | 7,199,368 | |
| | | | | | | | |
| | |
| | | | Commercial & Residential Mortgage
Finance 4.3% | | | |
| | 113,570 | | | Aavas Financiers Ltd.* | | | 2,460,303 | |
| | 456,989 | | | Mortgage Advice Bureau Holdings Ltd. | | | 3,910,218 | |
| | | | | | | | |
| | | | 6,370,521 | |
| | | | | | | | |
| | |
| | | | Commodity Chemicals 2.5% | | | |
| | 235,369 | | | Berger Paints India Ltd. | | | 1,747,352 | |
| | 29,569 | | | Supreme Industries Ltd. | | | 1,877,932 | |
| | | | | | | | |
| | | | 3,625,284 | |
| | | | | | | | |
| | |
| | | | Consumer Finance 2.8% | | | |
| | 53,247 | | | Moltiply Group SpA | | | 1,969,227 | |
| | 143,650 | | | Premium Group Co. Ltd. | | | 2,129,452 | |
| | | | | | | | |
| | | | 4,098,679 | |
| | | | | | | | |
| | |
| | | | Data Processing & Outsourced
Services 0.6% | | | |
| | 367,100 | | | Infomart Corp. | | | 843,295 | |
| | | | | | | | |
| | |
| | | | Diversified Support Services 10.0% | | | |
| | 262,561 | | | CMS Info Systems Ltd. | | | 1,871,575 | |
| | 764,731 | | | Frontken Corp. Bhd. | | | 679,496 | |
| | 305,600 | | | Japan Elevator Service Holdings Co. Ltd. | | | 6,659,836 | |
| | 1,662,308 | | | Johnson Service Group PLC | | | 3,462,535 | |
| | 387,797 | | | Prestige International, Inc. | | | 1,904,783 | |
| | | | | | | | |
| | | | 14,578,225 | |
| | | | | | | | |
| | |
| | | | Electrical Components &
Equipment 2.4% | | | |
| | 55,631 | | | Voltronic Power Technology Corp. | | | 3,555,871 | |
| | | | | | | | |
| | |
| | | | Electronic Equipment &
Instruments 1.3% | | | |
| | 72,287 | | | Nayax Ltd.* | | | 1,882,353 | |
| | | | | | | | |
| | | | | | | | |
| Shares | | | | | Value | |
| | | | | | | |
| | |
| | | | Food Retail 2.2% | | | |
| | 27,485 | | | Rami Levy Chain Stores Hashikma
Marketing 2006 Ltd. | | $ | 1,534,769 | |
| | 1,402,500 | | | Sheng Siong Group Ltd. | | | 1,669,384 | |
| | | | | | | | |
| | | | 3,204,153 | |
| | | | | | | | |
| | |
| | | | Health Care Facilities 0.6% | | | |
| | 56,444 | | | Rainbow Children’s Medicare Ltd. | | | 942,863 | |
| | | | | | | | |
| | |
| | | | Health Care Services 3.8% | | | |
| | 488,124 | | | Vijaya Diagnostic Centre Pvt. Ltd. | | | 5,593,078 | |
| | | | | | | | |
| | |
| | | | Health Care Technology 6.8% | | | |
| | 80,518 | | | Nexus AG | | | 4,974,385 | |
| | 40,139 | | | Pro Medicus Ltd. | | | 4,940,491 | |
| | | | | | | | |
| | | | 9,914,876 | |
| | | | | | | | |
| | |
| | | | Heavy Electrical Equipment 1.2% | | | |
| | 219,392 | | | Elecon Engineering Co. Ltd. | | | 1,833,249 | |
| | | | | | | | |
| | |
| | | | Human Resource & Employment
Services 3.9% | | | |
| | 4,464 | | | Benefit Systems SA | | | 3,056,025 | |
| | 180,162 | | | SMS Co. Ltd. | | | 2,707,238 | |
| | | | | | | | |
| | | | 5,763,263 | |
| | | | | | | | |
| | |
| | | | Industrial Machinery & Supplies &
Components 1.5% | | | |
| | 270,026 | | | Elgi Equipments Ltd. | | | 2,191,181 | |
| | | | | | | | |
| | |
| | | | Interactive Media & Services 7.7% | | | |
| | 1,074,756 | | | Baltic Classifieds Group PLC | | | 4,353,793 | |
| | 23,800 | | | Bengo4.com, Inc.* | | | 497,265 | |
| | 150,201 | | | Hemnet Group AB | | | 5,528,354 | |
| | 41,739 | | | MarkLines Co. Ltd. | | | 855,095 | |
| | | | | | | | |
| | | | 11,234,507 | |
| | | | | | | | |
| | |
| | | | Investment Banking & Brokerage 4.2% | | | |
| | 606,738 | | | AJ Bell PLC | | | 3,646,247 | |
| | 80,400 | | | Strike Co. Ltd. | | | 2,456,349 | |
| | | | | | | | |
| | | | 6,102,596 | |
| | | | | | | | |
| | |
| | | | IT Consulting & Other Services 4.4% | | | |
| | 91,079 | | | baudroie, Inc.* | | | 3,603,527 | |
| | 29,623 | | | Digital Value SpA | | | 1,721,286 | |
| | 140,644 | | | R Systems International Ltd. | | | 801,777 | |
| | 20,200 | | | Simplex Holdings, Inc. | | | 341,228 | |
| | | | | | | | |
| | | | 6,467,818 | |
| | | | | | | | |
| | |
| | | | Metal, Glass & Plastic Containers 0.6% | | | |
| | 89,723 | | | Mold-Tek Packaging Ltd. | | | 809,759 | |
| | | | | | | | |
| | |
| | | | Personal Care Products 2.6% | | | |
| | 203,205 | | | Sarantis SA | | | 2,464,583 | |
| | 183,425 | | | Warpaint London PLC | | | 1,402,716 | |
| | | | | | | | |
| | | | 3,867,299 | |
| | | | | | | | |
| | |
| | | | Property & Casualty Insurance 1.6% | | | |
| | 303,198 | | | Qualitas Controladora SAB de CV | | | 2,370,919 | |
| | | | | | | | |
19
| | |
| Wasatch International Opportunities Fund (WAIOX / WIIOX) | | SEPTEMBER 30, 2024 |
Schedule of Investments (continued)
| | | | | | | | |
| Shares | | | | | Value | |
| | | | | | | |
| | |
| | | | Real Estate Services 0.8% | | | |
| | 25,644 | | | AZOOM Co. Ltd. | | $ | 1,131,629 | |
| | | | | | | | |
| | |
| | | | Regional Banks 1.9% | | | |
| | 36,700 | | | EQB, Inc. | | | 2,828,922 | |
| | | | | | | | |
| | |
| | | | Research & Consulting Services 4.0% | | | |
| | 5,844,518 | | | CTOS Digital Bhd. | | | 1,729,666 | |
| | 42,915 | | | Funai Soken Holdings, Inc. | | | 724,639 | |
| | 226,600 | | | SIGMAXYZ Holdings, Inc. | | | 2,680,404 | |
| | 95,000 | | | Sporton International, Inc. | | | 657,344 | |
| | | | | | | | |
| | | | 5,792,053 | |
| | | | | | | | |
| | |
| | | | Restaurants 0.3% | | | |
| | 18,800 | | | Gift Holdings, Inc. | | | 371,844 | |
| | | | | | | | |
| | |
| | | | Semiconductor Materials &
Equipment 3.6% | | | |
| | 164,424 | | | Gudeng Precision Industrial Co. Ltd. | | | 2,929,434 | |
| | 27,100 | | | Japan Material Co. Ltd. | | | 352,687 | |
| | 75,059 | | | Materials Analysis Technology, Inc. | | | 638,276 | |
| | 18,324 | | | Tokai Carbon Korea Co. Ltd. | | | 1,294,076 | |
| | | | | | | | |
| | | | 5,214,473 | |
| | | | | | | | |
| | |
| | | | Semiconductors 3.0% | | | |
| | 18,703 | | | Elmos Semiconductor SE | | | 1,382,348 | |
| | 21,048 | | | LEENO Industrial, Inc. | | | 3,031,481 | |
| | | | | | | | |
| | | | 4,413,829 | |
| | | | | | | | |
| | |
| | | | Trading Companies &
Distributors 1.4% | | | |
| | 185,636 | | | Ashtead Technology Holdings PLC | | | 1,409,697 | |
| | 181,520 | | | IPD Group Ltd. | | | 636,790 | |
| | | | | | | | |
| | | | 2,046,487 | |
| | | | | | | | |
| | |
| | | | Total Common Stocks
(cost $85,089,373) | | | 144,915,314 | |
| | | | | | | | |
| |
| | | | EXCHANGE-TRADED FUNDS 1.5% | |
| | |
| | | | Asset Management & Custody
Banks 1.5% | | | |
| | 17,961 | | | Vanguard FTSE All World ex-US Small-Cap ETF | | | 2,262,368 | |
| | | | | | | | |
| | |
| | | | Total Exchange-Traded Funds
(cost $2,217,824) | | | 2,262,368 | |
| | | | | | | | |
| | |
| | | | Total Investments
(cost $87,307,197) 100.5%§ | | | 147,177,682 | |
| | |
| | | | Liabilities less Other Assets (0.5%) | | | (803,279 | ) |
| | | | | | | | |
| | |
| | | | Net Assets 100.0% | | $ | 146,374,403 | |
| | | | | | | | |
| |
| | | | *Non-income producing. §The aggregate amount of foreign securities fair valued pursuant to a systematic valuation model as a percent of net assets was 65.97%. ETF Exchange-Traded Fund. | |
| |
| | | | See Notes to Financial Statements. | |
At September 30, 2024, the Wasatch International Opportunities Fund’s investments were in the following countries (unaudited):
| | | | | |
| Country | | % |
Australia | | | | 3.8 | |
Canada | | | | 1.9 | |
France | | | | 1.9 | |
Germany | | | | 8.0 | |
Greece | | | | 1.7 | |
India | | | | 15.4 | |
Israel | | | | 2.3 | |
Italy | | | | 2.5 | |
Japan | | | | 21.2 | |
Malaysia | | | | 1.6 | |
Mexico | | | | 1.6 | |
Poland | | | | 2.1 | |
Singapore | | | | 1.1 | |
South Korea | | | | 2.9 | |
Sweden | | | | 5.8 | |
Taiwan | | | | 6.8 | |
United Kingdom | | | | 17.9 | |
United States | | | | 1.5 | |
| | | | | |
TOTAL | | | | 100.0 | % |
| | | | | |
20
| | |
| Wasatch International Select Fund (WAISX / WGISX) | | SEPTEMBER 30, 2024 |
Schedule of Investments
| | | | | | | | |
| Shares | | | | | Value | |
| | | | | | | |
| |
| | | | COMMON STOCKS 96.8% | |
| | |
| | | | Apparel, Accessories & Luxury Goods 1.8% | | | |
| | 29 | | | Hermes International SCA | | $ | 71,408 | |
| | | | | | | | |
| | |
| | | | Application Software 11.5% | | | |
| | 36 | | | Constellation Software, Inc. | | | 117,121 | |
| | 1,598 | | | Dassault Systemes SE | | | 63,474 | |
| | 1,629 | | | Descartes Systems Group, Inc.* | | | 167,628 | |
| | 1,064 | | | Xero Ltd.* | | | 109,981 | |
| | | | | | | | |
| | | | 458,204 | |
| | | | | | | | |
| | |
| | | | Asset Management & Custody Banks 3.9% | | | |
| | 102 | | | Partners Group Holding AG | | | 153,783 | |
| | | | | | | | |
| | |
| | | | Automobile Manufacturers 3.8% | | | |
| | 326 | | | Ferrari NV | | | 152,764 | |
| | | | | | | | |
| | |
| | | | Broadline Retail 6.1% | | | |
| | 2,379 | | | Dollarama, Inc. | | | 243,696 | |
| | | | | | | | |
| | |
| | | | Building Products 7.2% | | | |
| | 5,860 | | | Assa Abloy AB, Class B | | | 197,423 | |
| | 963 | | | Kingspan Group PLC | | | 90,319 | |
| | | | | | | | |
| | | | 287,742 | |
| | | | | | | | |
| | |
| | | | Diversified Banks 1.2% | | | |
| | 2,100 | | | Rakuten Bank Ltd.* | | | 47,833 | |
| | | | | | | | |
| | |
| | | | Diversified Real Estate Activities 2.0% | | | |
| | 2,300 | | | Sumitomo Realty & Development Co. Ltd. | | | 77,856 | |
| | | | | | | | |
| | |
| | | | Drug Retail 3.2% | | | |
| | 6,900 | | | Sugi Holdings Co. Ltd. | | | 127,427 | |
| | | | | | | | |
| | |
| | | | Electrical Components & Equipment 1.6% | | | |
| | 866 | | | Prysmian SpA | | | 63,009 | |
| | | | | | | | |
| | |
| | | | Electronic Equipment & Instruments 6.0% | | | |
| | 6,813 | | | Halma PLC | | | 238,220 | |
| | | | | | | | |
| | |
| | | | Health Care Equipment 3.3% | | | |
| | 1,115 | | | DiaSorin SpA | | | 130,373 | |
| | | | | | | | |
| | |
| | | | Industrial Machinery & Supplies &
Components 2.6% | | | |
| | 199 | | | VAT Group AG | | | 101,768 | |
| | | | | | | | |
| | |
| | | | Interactive Media & Services 9.6% | | | |
| | 1,433 | | | REA Group Ltd. | | | 198,301 | |
| | 2,108 | | | Scout24 SE | | | 181,494 | |
| | | | | | | | |
| | | | 379,795 | |
| | | | | | | | |
| | |
| | | | IT Consulting & Other Services 1.7% | | | |
| | 1,217 | | | Endava PLC, ADR* | | | 31,082 | |
| | 1,000 | | | Obic Co. Ltd. | | | 35,084 | |
| | | | | | | | |
| | | | 66,166 | |
| | | | | | | | |
| | |
| | | | Life Sciences Tools & Services 3.4% | | | |
| | 466 | | | ICON PLC* | | | 133,886 | |
| | | | | | | | |
| | |
| | | | Movies & Entertainment 4.2% | | | |
| | 456 | | | Spotify Technology SA* | | | 168,050 | |
| | | | | | | | |
| | | | | | | | |
| Shares | | | | | Value | |
| | | | | | | |
| | |
| | | | Property & Casualty Insurance 5.3% | | | |
| | 5,230 | | | Definity Financial Corp. | | $ | 210,793 | |
| | | | | | | | |
| | |
| | | | Real Estate Services 4.7% | | | |
| | 1,026 | | | FirstService Corp. | | | 187,463 | |
| | | | | | | | |
| | |
| | | | Research & Consulting Services 6.1% | | | |
| | 4,250 | | | BayCurrent, Inc. | | | 156,067 | |
| | 500 | | | Wolters Kluwer NV | | | 84,336 | |
| | | | | | | | |
| | | | 240,403 | |
| | | | | | | | |
| | |
| | | | Semiconductor Materials &
Equipment 1.8% | | | |
| | 108 | | | ASM International NV | | | 71,254 | |
| | | | | | | | |
| | |
| | | | Trading Companies & Distributors 2.6% | | | |
| | 6,200 | | | MonotaRO Co. Ltd. | | | 103,385 | |
| | | | | | | | |
| | |
| | | | Transaction & Payment Processing
Services 3.2% | | | |
| | 57 | | | Adyen NV* | | | 89,240 | |
| | 600 | | | GMO Payment Gateway, Inc. | | | 36,512 | |
| | | | | | | | |
| | | | 125,752 | |
| | | | | | | | |
| | |
| | | | Total Common Stocks
(cost $3,057,438) | | | 3,841,030 | |
| | | | | | | | |
| | |
| | | | Total Investments
(cost $3,057,438) 96.8%§ | | | 3,841,030 | |
| | |
| | | | Other Assets less Liabilities 3.2% | | | 126,305 | |
| | | | | | | | |
| | |
| | | | Net Assets 100.0% | | $ | 3,967,335 | |
| | | | | | | | |
| |
| | | | *Non-income producing. §The aggregate amount of foreign securities fair valued pursuant to a systematic valuation model as a percent of net assets was 65.06%. ADR American Depositary Receipt. | |
| |
| | | | See Notes to Financial Statements. | |
At September 30, 2024, the Wasatch International Select Fund’s investments were in the following countries (unaudited):
| | | | | |
| Country | | % |
Australia | | | | 8.0 | |
Canada | | | | 24.1 | |
France | | | | 3.5 | |
Germany | | | | 4.7 | |
Ireland | | | | 5.9 | |
Italy | | | | 9.0 | |
Japan | | | | 15.2 | |
Netherlands | | | | 6.4 | |
Sweden | | | | 9.5 | |
Switzerland | | | | 6.7 | |
United Kingdom | | | | 7.0 | |
| | | | | |
TOTAL | | | | 100.0 | % |
| | | | | |
21
| | |
| Wasatch Long/Short Alpha Fund (WALSX / WGLSX) | | SEPTEMBER 30, 2024 |
Schedule of Investments
| | | | | | | | |
| Shares | | | | | Value | |
| | | | | | | |
| |
| | | | COMMON STOCKS 109.8% | |
| | |
| | | | Apparel, Accessories & Luxury
Goods 0.7% | | | |
| | 8,673 | | | Carter’s, Inc. | | $ | 563,572 | |
| | | | | | | | |
| | |
| | | | Application Software 14.8% | | | |
| | 68,310 | | | Clearwater Analytics Holdings, Inc., Class A* †† | | | 1,724,828 | |
| | 16,650 | | | Guidewire Software, Inc.* †† | | | 3,045,951 | |
| | 3,184 | | | HubSpot, Inc.* †† | | | 1,692,614 | |
| | 4,174 | | | Roper Technologies, Inc.†† | | | 2,322,581 | |
| | 37,300 | | | Sprout Social, Inc., Class A* †† | | | 1,084,311 | |
| | 7,413 | | | Workday, Inc., Class A* †† | | | 1,811,811 | |
| | | | | | | | |
| | | | 11,682,096 | |
| | | | | | | | |
| | |
| | | | Asset Management & Custody
Banks 3.1% | | | |
| | 14,465 | | | Hamilton Lane, Inc., Class A†† | | | 2,435,761 | |
| | | | | | | | |
| | |
| | | | Automotive Parts & Equipment 1.2% | | | |
| | 20,893 | | | XPEL, Inc.* †† | | | 906,129 | |
| | | | | | | | |
| | |
| | | | Automotive Retail 3.1% | | | |
| | 35,140 | | | Monro, Inc. | | | 1,014,140 | |
| | 33,588 | | | Valvoline, Inc.* †† | | | 1,405,658 | |
| | | | | | | | |
| | | | 2,419,798 | |
| | | | | | | | |
| | |
| | | | Biotechnology 3.1% | | | |
| | 144,769 | | | C4 Therapeutics, Inc.* | | | 825,183 | |
| | 57,441 | | | Nkarta, Inc.* | | | 259,633 | |
| | 25,452 | | | Nurix Therapeutics, Inc.* †† | | | 571,907 | |
| | 352,021 | | | Sangamo Therapeutics, Inc.* | | | 304,886 | |
| | 8,133 | | | Viking Therapeutics, Inc.* †† | | | 514,900 | |
| | | | | | | | |
| | | | 2,476,509 | |
| | | | | | | | |
| | |
| | | | Building Products 1.9% | | | |
| | 22,815 | | | Trex Co., Inc.* †† | | | 1,519,023 | |
| | | | | | | | |
| | |
| | | | Consumer Finance 1.6% | | | |
| | 113,828 | | | EZCORP, Inc., Class A* | | | 1,276,012 | |
| | | | | | | | |
| | |
| | | | Distributors 2.3% | | | |
| | 4,767 | | | Pool Corp.†† | | | 1,796,206 | |
| | | | | | | | |
| | |
| | | | Electronic Equipment &
Instruments 2.2% | | | |
| | 9,814 | | | Novanta, Inc.* †† | | | 1,755,921 | |
| | | | | | | | |
| | |
| | | | Electronic Manufacturing Services 3.4% | | | |
| | 24,097 | | | Benchmark Electronics, Inc.†† | | | 1,067,979 | |
| | 6,735 | | | Fabrinet* | | | 1,592,423 | |
| | | | | | | | |
| | | | 2,660,402 | |
| | | | | | | | |
| | |
| | | | Financial Exchanges & Data 5.0% | | | |
| | 6,865 | | | MarketAxess Holdings, Inc.†† | | | 1,758,813 | |
| | 6,894 | | | Morningstar, Inc.†† | | | 2,200,013 | |
| | | | | | | | |
| | | | 3,958,826 | |
| | | | | | | | |
| | |
| | | | Health Care Equipment 1.6% | | | |
| | 6,051 | | | Inspire Medical Systems, Inc.* †† | | | 1,277,064 | |
| | | | | | | | |
| | | | | | | | |
| Shares | | | | | Value | |
| | | | | | | |
| | |
| | | | Health Care Facilities 4.0% | | | |
| | 22,172 | | | Ensign Group, Inc.†† | | $ | 3,188,777 | |
| | | | | | | | |
| | |
| | | | Health Care Services 4.0% | | | |
| | 12,973 | | | Addus HomeCare Corp.* †† | | | 1,725,798 | |
| | 39,034 | | | Pennant Group, Inc.* | | | 1,393,514 | |
| | | | | | | | |
| | | | 3,119,312 | |
| | | | | | | | |
| | |
| | | | Health Care Supplies 1.7% | | | |
| | 4,298 | | | UFP Technologies, Inc.* †† | | | 1,361,177 | |
| | | | | | | | |
| | |
| | | | Home Improvement Retail 3.2% | | | |
| | 20,405 | | | Floor & Decor Holdings, Inc., Class A* †† | | | 2,533,689 | |
| | | | | | | | |
| | |
| | | | Homebuilding 2.1% | | | |
| | 17,728 | | | Champion Homes, Inc.* †† | | | 1,681,501 | |
| | | | | | | | |
| | |
| | | | Human Resource & Employment
Services 2.8% | | | |
| | 13,231 | | | Paylocity Holding Corp.* †† | | | 2,182,718 | |
| | | | | | | | |
| | |
| | | | Industrial Machinery & Supplies &
Components 6.5% | | | |
| | 8,571 | | | Kadant, Inc.†† | | | 2,896,998 | |
| | 7,571 | | | RBC Bearings, Inc.* †† | | | 2,266,606 | |
| | | | | | | | |
| | | | 5,163,604 | |
| | | | | | | | |
| | |
| | | | Investment Banking & Brokerage 1.8% | | | |
| | 20,918 | | | Moelis & Co., Class A†† | | | 1,433,092 | |
| | | | | | | | |
| | |
| | | | IT Consulting & Other Services 2.6% | | | |
| | 10,293 | | | Globant SA* †† | | | 2,039,455 | |
| | | | | | | | |
| | |
| | | | Leisure Products 1.4% | | | |
| | 26,407 | | | YETI Holdings, Inc.* †† | | | 1,083,479 | |
| | | | | | | | |
| | |
| | | | Life Sciences Tools & Services 2.0% | | | |
| | 4,677 | | | Medpace Holdings, Inc.* †† | | | 1,561,183 | |
| | | | | | | | |
| | |
| | | | Managed Health Care 3.2% | | | |
| | 30,827 | | | HealthEquity, Inc.* †† | | | 2,523,190 | |
| | | | | | | | |
| | |
| | | | Oil & Gas Equipment & Services 2.4% | | | |
| | 32,146 | | | Cactus, Inc., Class A†† | | | 1,918,152 | |
| | | | | | | | |
| | |
| | | | Oil & Gas Storage & Transportation 1.9% | | | |
| | 133,607 | | | DHT Holdings, Inc.†† | | | 1,473,685 | |
| | | | | | | | |
| | |
| | | | Other Specialty Retail 0.7% | | | |
| | 6,488 | | | Five Below, Inc.* | | | 573,215 | |
| | | | | | | | |
| | |
| | | | Packaged Foods & Meats 1.9% | | | |
| | 11,100 | | | Freshpet, Inc.* †† | | | 1,518,147 | |
| | | | | | | | |
| | |
| | | | Personal Care Products 1.8% | | | |
| | 102,213 | | | Nature’s Sunshine Products, Inc.* | | | 1,392,141 | |
| | | | | | | | |
| | |
| | | | Pharmaceuticals 3.2% | | | |
| | 440,597 | | | Esperion Therapeutics, Inc.* | | | 726,985 | |
| | 24,490 | | | Intra-Cellular Therapies, Inc.* †† | | | 1,791,933 | |
| | | | | | | | |
| | | | 2,518,918 | |
| | | | | | | | |
22
| | |
| Wasatch Long/Short Alpha Fund (WALSX / WGLSX) | | SEPTEMBER 30, 2024 |
Schedule of Investments (continued)
| | | | | | | | |
| Shares | | | | | Value | |
| | | | | | | |
| | |
| | | | Property & Casualty Insurance 2.3% | | | |
| | 22,997 | | | Axis Capital Holdings Ltd.†† | | $ | 1,830,791 | |
| | | | | | | | |
| | |
| | | | Regional Banks 2.4% | | | |
| | 43,432 | | | Bank OZK†† | | | 1,867,142 | |
| | | | | | | | |
| | |
| | | | Research & Consulting Services 2.8% | | | |
| | 13,184 | | | ICF International, Inc.†† | | | 2,198,959 | |
| | | | | | | | |
| | |
| | | | Self-Storage REITs 2.9% | | | |
| | 47,741 | | | National Storage Affiliates Trust†† | | | 2,301,116 | |
| | | | | | | | |
| | |
| | | | Semiconductors 2.4% | | | |
| | 2,009 | | | Monolithic Power Systems, Inc.†† | | | 1,857,320 | |
| | | | | | | | |
| | |
| | | | Specialty Chemicals 1.7% | | | |
| | 11,903 | | | Innospec, Inc.†† | | | 1,346,110 | |
| | | | | | | | |
| | |
| | | | Technology Distributors 1.3% | | | |
| | 20,768 | | | ScanSource, Inc.* †† | | | 997,487 | |
| | | | | | | | |
| | |
| | | | Trading Companies & Distributors 1.2% | | | |
| | 7,967 | | | Transcat, Inc.* †† | | | 962,175 | |
| | | | | | | | |
| | |
| | | | Transaction & Payment Processing
Services 1.6% | | | |
| | 18,738 | | | Block, Inc.* †† | | | 1,257,882 | |
| | | | | | | | |
| | |
| | | | Total Common Stocks
(cost $69,257,389) | | | 86,611,736 | |
| | | | | | | | |
| |
| | | | WARRANTS 0.1% | |
| | |
| | | | Biotechnology 0.1% | | | |
| | 178,571 | | | Sangamo Therapeutics, Inc., expiring 9/26/2029 * *** † | | | 55,357 | |
| | | | | | | | |
| | |
| | | | Total Warrants
(cost $36,978) | | | 55,357 | |
| | | | | | | | |
| |
| | | | COMMON STOCKS SOLD SHORT (35.5%) | |
| | |
| | | | Advertising 0.6% | | | |
| | (29,517 | ) | | Thryv Holdings, Inc.* | | | (508,578 | ) |
| | | | | | | | |
| | |
| | | | Aerospace & Defense 0.8% | | | |
| | (61,658 | ) | | Rocket Lab USA, Inc.* | | | (599,932 | ) |
| | | | | | | | |
| | |
| | | | Alternative Carriers 0.7% | | | |
| | (425,630 | ) | | Globalstar, Inc.* | | | (527,781 | ) |
| | | | | | | | |
| | |
| | | | Apparel Retail 0.6% | | | |
| | (18,519 | ) | | Revolve Group, Inc.* | | | (458,901 | ) |
| | | | | | | | |
| | |
| | | | Application Software 5.6% | | | |
| | (48,185 | ) | | Asana, Inc., Class A* | | | (558,464 | ) |
| | (30,732 | ) | | Confluent, Inc., Class A* | | | (626,318 | ) |
| | (104,429 | ) | | CS Disco, Inc.* | | | (614,043 | ) |
| | (77,040 | ) | | Domo, Inc., Class B* | | | (578,570 | ) |
| | (24,377 | ) | | Informatica, Inc., Class A* | | | (616,251 | ) |
| | | | | | | | |
| Shares | | | | | Value | |
| | | | | | | |
| | |
| | | | Application Software 5.6% (continued) | | | |
| | (5,962 | ) | | Nutanix, Inc., Class A* | | $ | (353,249 | ) |
| | (56,910 | ) | | Sprinklr, Inc., Class A* | | | (439,914 | ) |
| | (87,995 | ) | | Yext, Inc.* | | | (608,925 | ) |
| | | | | | | | |
| | | | (4,395,734 | ) |
| | | | | | | | |
| | |
| | | | Asset Management & Custody
Banks 0.3% | | | |
| | (1,589 | ) | | ARES Management Corp., Class A | | | (247,630 | ) |
| | | | | | | | |
| | |
| | | | Biotechnology 0.7% | | | |
| | (11,845 | ) | | CRISPR Therapeutics AG* | | | (556,478 | ) |
| | | | | | | | |
| | |
| | | | Broadcasting 0.6% | | | |
| | (265,203 | ) | | iHeartMedia, Inc., Class A* | | | (490,626 | ) |
| | | | | | | | |
| | |
| | | | Communications Equipment 0.5% | | | |
| | (1,930 | ) | | Ubiquiti, Inc. | | | (427,920 | ) |
| | | | | | | | |
| | |
| | | | Consumer Finance 0.5% | | | |
| | (8,753 | ) | | Moneylion, Inc.* | | | (363,687 | ) |
| | | | | | | | |
| | |
| | | | Electrical Components &
Equipment 0.7% | | | |
| | (29,177 | ) | | Sunrun, Inc.* | | | (526,937 | ) |
| | | | | | | | |
| | |
| | | | Electronic Equipment &
Instruments 0.7% | | | |
| | (308,257 | ) | | SmartRent, Inc.* | | | (533,285 | ) |
| | | | | | | | |
| | |
| | | | Health Care Equipment 1.6% | | | |
| | (77,278 | ) | | Alphatec Holdings, Inc.* | | | (429,666 | ) |
| | (57,121 | ) | | Nevro Corp.* | | | (319,306 | ) |
| | (64,583 | ) | | Pulmonx Corp.* | | | (535,393 | ) |
| | | | | | | | |
| | | | (1,284,365 | ) |
| | | | | | | | |
| | |
| | | | Health Care Facilities 1.1% | | | |
| | (7,895 | ) | | Acadia Healthcare Co., Inc.* | | | (500,622 | ) |
| | (2,787 | ) | | National HealthCare Corp. | | | (350,521 | ) |
| | | | | | | | |
| | | | (851,143 | ) |
| | | | | | | | |
| | |
| | | | Health Care REITs 0.6% | | | |
| | (3,810 | ) | | Welltower, Inc. | | | (487,794 | ) |
| | | | | | | | |
| | |
| | | | Heavy Electrical Equipment 0.4% | | | |
| | (27,988 | ) | | Bloom Energy Corp., Class A* | | | (295,553 | ) |
| | | | | | | | |
| | |
| | | | Homebuilding 0.5% | | | |
| | (13,023 | ) | | Legacy Housing Corp.* | | | (356,179 | ) |
| | | | | | | | |
| | |
| | | | Hotels, Resorts & Cruise Lines 1.5% | | | |
| | (3,006 | ) | | Hyatt Hotels Corp., Class A | | | (457,513 | ) |
| | (76,617 | ) | | Lindblad Expeditions Holdings, Inc.* | | | (708,707 | ) |
| | | | | | | | |
| | | | (1,166,220 | ) |
| | | | | | | | |
| | |
| | | | Human Resource & Employment
Services 1.0% | | | |
| | (12,695 | ) | | Dayforce, Inc.* | | | (777,569 | ) |
| | | | | | | | |
| | |
| | | | Interactive Home Entertainment 0.7% | | | |
| | (12,182 | ) | | ROBLOX Corp., Class A* | | | (539,175 | ) |
| | | | | | | | |
23
| | |
| Wasatch Long/Short Alpha Fund (WALSX / WGLSX) | | SEPTEMBER 30, 2024 |
Schedule of Investments (continued)
| | | | | | | | |
| Shares | | | | | Value | |
| | | | | | | |
| | |
| | | | Interactive Media & Services 1.4% | | | |
| | (172,699 | ) | | Angi, Inc.* | | $ | (445,564 | ) |
| | (35,905 | ) | | Getty Images Holdings, Inc.* | | | (136,798 | ) |
| | (207,134 | ) | | Nextdoor Holdings, Inc.* | | | (513,692 | ) |
| | | | | | | | |
| | | | (1,096,054 | ) |
| | | | | | | | |
| | |
| | | | Internet Services & Infrastructure 0.5% | | | |
| | (6,388 | ) | | Twilio, Inc., Class A* | | | (416,625 | ) |
| | | | | | | | |
| | |
| | | | Leisure Facilities 0.3% | | | |
| | (9,321 | ) | | Life Time Group Holdings, Inc.* | | | (227,619 | ) |
| | | | | | | | |
| | |
| | | | Life Sciences Tools & Services 0.7% | | | |
| | (4,158 | ) | | Revvity, Inc. | | | (531,185 | ) |
| | | | | | | | |
| | |
| | | | Multi-Family Residential REITs 0.4% | | | |
| | (19,394 | ) | | Elme Communities | | | (341,140 | ) |
| | | | | | | | |
| | |
| | | | Other Specialty Retail 0.7% | | | |
| | (173,254 | ) | | Leslie’s, Inc.* | | | (547,483 | ) |
| | | | | | | | |
| | |
| | | | Packaged Foods & Meats 0.7% | | | |
| | (1,823 | ) | | J.M. Smucker Co. | | | (220,765 | ) |
| | (2,031 | ) | | Lancaster Colony Corp. | | | (358,614 | ) |
| | | | | | | | |
| | | | (579,379 | ) |
| | | | | | | | |
| | |
| | | | Passenger Airlines 0.9% | | | |
| | (89,934 | ) | | Frontier Group Holdings, Inc.* | | | (481,147 | ) |
| | (49,001 | ) | | Joby Aviation, Inc.* | | | (246,475 | ) |
| | | | | | | | |
| | | | (727,622 | ) |
| | | | | | | | |
| | |
| | | | Personal Care Products 0.7% | | | |
| | (62,668 | ) | | Coty, Inc., Class A* | | | (588,453 | ) |
| | | | | | | | |
| | |
| | | | Real Estate Development 0.8% | | | |
| | (8,524 | ) | | Howard Hughes Holdings, Inc.* | | | (660,013 | ) |
| | | | | | | | |
| | |
| | | | Real Estate Services 1.5% | | | |
| | (282,531 | ) | | Opendoor Technologies, Inc.* | | | (565,062 | ) |
| | (9,268 | ) | | Zillow Group, Inc., Class C* | | | (591,762 | ) |
| | | | | | | | |
| | | | (1,156,824 | ) |
| | | | | | | | |
| | |
| | | | Restaurants 1.6% | | | |
| | (58,608 | ) | | Portillo’s, Inc., Class A* | | | (789,450 | ) |
| | (13,206 | ) | | Sweetgreen, Inc., Class A* | | | (468,152 | ) |
| | | | | | | | |
| | | | (1,257,602 | ) |
| | | | | | | | |
| | |
| | | | Semiconductors 0.5% | | | |
| | (45,654 | ) | | SkyWater Technology, Inc.* | | | (414,538 | ) |
| | | | | | | | |
| | |
| | | | Specialty Chemicals 0.9% | | | |
| | (7,548 | ) | | Albemarle Corp. | | | (714,871 | ) |
| | | | | | | | |
| | |
| | | | Technology Hardware, Storage &
Peripherals 0.4% | | | |
| | (40,074 | ) | | IonQ, Inc.* | | | (350,247 | ) |
| | | | | | | | |
| | |
| | | | Telecom Tower REITs 0.5% | | | |
| | (1,794 | ) | | SBA Communications Corp. | | | (431,816 | ) |
| | | | | | | | |
| | |
| | | | Trading Companies & Distributors 0.7% | | | |
| | (28,774 | ) | | Xometry, Inc., Class A* | | | (528,578 | ) |
| | | | | | | | |
| | | | | | | | |
| Shares | | | | | Value | |
| | | | | | | |
| | |
| | | | Transaction & Payment Processing
Services 2.0% | | | |
| | (9,488 | ) | | Affirm Holdings, Inc.* | | $ | (387,300 | ) |
| | (63,269 | ) | | Payoneer Global, Inc.* | | | (476,416 | ) |
| | (51,539 | ) | | Remitly Global, Inc.* | | | (690,107 | ) |
| | | | | | | | |
| | | | (1,553,823 | ) |
| | | | | | | | |
| | |
| | | | Water Utilities 0.6% | | | |
| | (9,141 | ) | | California Water Service Group | | | (495,625 | ) |
| | | | | | | | |
| | |
| | | | Total Investments Sold Short
(proceeds $28,924,420) (35.5%) | | | (28,014,984 | ) |
| | | | | | | | |
| | |
| | | | Total Investments, Net of Investments Sold Short
(cost $40,369,947) 74.4% | | | 58,652,109 | |
| | | | | | | | |
| | |
| | | | Other Assets less Liabilities 25.6% | | | 20,218,005 | |
| | | | | | | | |
| | |
| | | | Net Assets 100.0% | | $ | 78,870,114 | |
| | | | | | | | |
| |
| | | | *Non-income producing. ***Security was fair valued under procedures adopted by the Board of Trustees using unobservable inputs as described in Note 12, as applicable. †Security purchased in a private placement transaction or under Rule 144A of the Securities Act of 1933 (see Note 9). The aggregate value of securities purchased in a private placement transaction or under Rule 144A of the Securities Act of 1933 at September 30, 2024 amounted to approximately $55,357 and represented 0.07% of net assets. ††All or a portion of this security has been designated as collateral for short sales. REIT Real Estate Investment Trust. | |
| |
| | | | See Notes to Financial Statements. | |
At September 30, 2024, the Wasatch Long/Short Alpha Fund’s investments, excluding securities sold short, were in the following countries (unaudited):
| | | | | |
| Country | | % |
Norway | | | | 1.7 | |
United States | | | | 98.3 | |
| | | | | |
TOTAL | | | | 100.0 | % |
| | | | | |
24
| | |
| Wasatch Micro Cap Fund (WMICX / WGICX) | | SEPTEMBER 30, 2024 |
Schedule of Investments
| | | | | | | | |
| Shares | | | | | Value | |
| | | | | | | |
| |
| | | | COMMON STOCKS 96.7% | |
| | |
| | | | Apparel Retail 1.8% | | | |
| | 73,652 | | | Boot Barn Holdings, Inc.* | | $ | 12,320,507 | |
| | | | | | | | |
| | |
| | | | Application Software 7.4% | | | |
| | 147,327 | | | Agilysys, Inc.* | | | 16,054,223 | |
| | 139,558 | | | Q2 Holdings, Inc.* | | | 11,132,541 | |
| | 247,241 | | | Sprout Social, Inc., Class A* | | | 7,187,296 | |
| | 1,232,611 | | | Weave Communications, Inc.* | | | 15,777,421 | |
| | | | | | | | |
| | | | 50,151,481 | |
| | | | | | | | |
| | |
| | | | Asset Management & Custody
Banks 3.1% | | | |
| | 1,844,930 | | | GCM Grosvenor, Inc., Class A | | | 20,884,608 | |
| | | | | | | | |
| | |
| | | | Automotive Parts & Equipment 2.9% | | | |
| | 61,205 | | | Patrick Industries, Inc. | | | 8,713,756 | |
| | 249,775 | | | XPEL, Inc.* | | | 10,832,742 | |
| | | | | | | | |
| | | | 19,546,498 | |
| | | | | | | | |
| | |
| | | | Biotechnology 5.7% | | | |
| | 609,978 | | | BriaPro Therapeutics Corp.* *** † | | | 6,100 | |
| | 1,242,144 | | | C4 Therapeutics, Inc.* | | | 7,080,221 | |
| | 82,140 | | | Denali Therapeutics, Inc.* | | | 2,392,738 | |
| | 127,538 | | | Dyne Therapeutics, Inc.* | | | 4,581,165 | |
| | 376,916 | | | Immatics NV* | | | 4,300,612 | |
| | 773,757 | | | MacroGenics, Inc.* | | | 2,545,660 | |
| | 668,362 | | | Nkarta, Inc.* | | | 3,020,996 | |
| | 233,158 | | | Nurix Therapeutics, Inc.* | | | 5,239,060 | |
| | 5,649,243 | | | Sangamo Therapeutics, Inc.* | | | 4,892,809 | |
| | 72,305 | | | Viking Therapeutics, Inc.* | | | 4,577,630 | |
| | | | | | | | |
| | | | 38,636,991 | |
| | | | | | | | |
| | |
| | | | Building Products 1.7% | | | |
| | 1,157,722 | | | Janus International Group, Inc.* | | | 11,704,569 | |
| | | | | | | | |
| | |
| | | | Communications Equipment 1.6% | | | |
| | 748,831 | | | Harmonic, Inc.* | | | 10,910,468 | |
| | | | | | | | |
| | |
| | | | Construction & Engineering 4.0% | | | |
| | 192,438 | | | Construction Partners, Inc., Class A* | | | 13,432,172 | |
| | 181,404 | | | Limbach Holdings, Inc.* | | | 13,743,167 | |
| | | | | | | | |
| | | | 27,175,339 | |
| | | | | | | | |
| | |
| | | | Consumer Finance 1.8% | | | |
| | 1,119,534 | | | EZCORP, Inc., Class A* | | | 12,549,976 | |
| | | | | | | | |
| | |
| | | | Electrical Components &
Equipment 0.9% | | | |
| | 319,647 | | | Allient, Inc. | | | 6,070,097 | |
| | | | | | | | |
| | |
| | | | Electronic Equipment &
Instruments 3.8% | | | |
| | 106,565 | | | Napco Security Technologies, Inc. | | | 4,311,620 | |
| | 343,760 | | | nLight, Inc.* | | | 3,674,794 | |
| | 45,756 | | | OSI Systems, Inc.* | | | 6,947,134 | |
| | 212,636 | | | PAR Technology Corp.* | | | 11,074,083 | |
| | | | | | | | |
| | | | 26,007,631 | |
| | | | | | | | |
| | |
| | | | Electronic Manufacturing Services 2.1% | | | |
| | 291,584 | | | CTS Corp. | | | 14,106,834 | |
| | | | | | | | |
| | | | | | | | |
| Shares | | | | | Value | |
| | | | | | | |
| | |
| | | | Financial Exchanges & Data 0.9% | | | |
| | 1,034,525 | | | Open Lending Corp.* | | $ | 6,331,293 | |
| | | | | | | | |
| | |
| | | | Health Care Equipment 1.6% | | | |
| | 413,323 | | | Artivion, Inc.* | | | 11,002,658 | |
| | | | | | | | |
| | |
| | | | Health Care Services 7.3% | | | |
| | 158,726 | | | Addus HomeCare Corp.* | | | 21,115,320 | |
| | 241,020 | | | Castle Biosciences, Inc.* | | | 6,873,890 | |
| | 617,704 | | | Pennant Group, Inc.* | | | 22,052,033 | |
| | | | | | | | |
| | | | 50,041,243 | |
| | | | | | | | |
| | |
| | | | Health Care Supplies 3.2% | | | |
| | 260,076 | | | OrthoPediatrics Corp.* | | | 7,050,661 | |
| | 46,386 | | | UFP Technologies, Inc.* | | | 14,690,446 | |
| | | | | | | | |
| | | | 21,741,107 | |
| | | | | | | | |
| | |
| | | | Health Care Technology 1.1% | | | |
| | 227,268 | | | Simulations Plus, Inc. | | | 7,277,121 | |
| | | | | | | | |
| | |
| | | | Home Furnishing Retail 1.4% | | | |
| | 762,568 | | | Arhaus, Inc. | | | 9,387,212 | |
| | | | | | | | |
| | |
| | | | Home Furnishings 0.4% | | | |
| | 2,781,975 | | | Purple Innovation, Inc.* | | | 2,750,539 | |
| | | | | | | | |
| | |
| | | | Homebuilding 2.4% | | | |
| | 238,949 | | | Dream Finders Homes, Inc., Class A* | | | 8,652,343 | |
| | 213,114 | | | Smith Douglas Homes Corp.* | | | 8,051,447 | |
| | | | | | | | |
| | | | 16,703,790 | |
| | | | | | | | |
| | |
| | | | Human Resource & Employment
Services 0.6% | | | |
| | 409,181 | | | DLH Holdings Corp.* | | | 3,829,934 | |
| | | | | | | | |
| | |
| | | | Industrial Machinery & Supplies &
Components 5.0% | | | |
| | 190,158 | | | Helios Technologies, Inc. | | | 9,070,536 | |
| | 423,073 | | | Kornit Digital Ltd.* | | | 10,930,091 | |
| | 77,629 | | | Standex International Corp. | | | 14,189,029 | |
| | | | | | | | |
| | | | 34,189,656 | |
| | | | | | | | |
| | |
| | | | Insurance Brokers 1.4% | | | |
| | 108,251 | | | Goosehead Insurance, Inc., Class A* | | | 9,666,814 | |
| | | | | | | | |
| | |
| | | | Internet Services & Infrastructure 0.7% | | | |
| | 295,859 | | | Couchbase, Inc.* | | | 4,769,247 | |
| | | | | | | | |
| | |
| | | | Investment Banking & Brokerage 2.1% | | | |
| | 744,348 | | | Perella Weinberg Partners | | | 14,373,360 | |
| | | | | | | | |
| | |
| | | | IT Consulting & Other Services 2.3% | | | |
| | 1,126,478 | | | Grid Dynamics Holdings, Inc.* | | | 15,770,692 | |
| | | | | | | | |
| | |
| | | | Leisure Facilities 1.1% | | | |
| | 583,447 | | | Xponential Fitness, Inc., Class A* | | | 7,234,743 | |
| | | | | | | | |
| | |
| | | | Leisure Products 0.9% | | | |
| | 347,667 | | | MasterCraft Boat Holdings, Inc.* | | | 6,331,016 | |
| | | | | | | | |
| | |
| | | | Packaged Foods & Meats 4.8% | | | |
| | 55,178 | | | Freshpet, Inc.* | | | 7,546,695 | |
| | 2,135,537 | | | Mama’s Creations, Inc.* ‡‡ | | | 15,589,420 | |
| | 280,063 | | | Vital Farms, Inc.* | | | 9,821,810 | |
| | | | | | | | |
| | | | 32,957,925 | |
| | | | | | | | |
25
| | |
| Wasatch Micro Cap Fund (WMICX / WGICX) | | SEPTEMBER 30, 2024 |
Schedule of Investments (continued)
| | | | | | | | |
| Shares | | | | | Value | |
| | | | | | | |
| | |
| | | | Personal Care Products 1.2% | | | |
| | 586,638 | | | Nature’s Sunshine Products, Inc.* | | $ | 7,990,010 | |
| | | | | | | | |
| | |
| | | | Pharmaceuticals 2.0% | | | |
| | 168,363 | | | Arvinas, Inc.* | | | 4,146,781 | |
| | 66,574 | | | BioAge Labs, Inc.* | | | 1,384,739 | |
| | 4,211,030 | | | Esperion Therapeutics, Inc.* | | | 6,948,199 | |
| | 7,715,671 | | | PharmaCielo Ltd.* | | | 1,026,893 | |
| | | | | | | | |
| | | | 13,506,612 | |
| | | | | | | | |
| | |
| | | | Regional Banks 3.6% | | | |
| | 372,402 | | | Esquire Financial Holdings, Inc. | | | 24,284,334 | |
| | | | | | | | |
| | |
| | | | Research & Consulting Services 1.9% | | | |
| | 77,135 | | | ICF International, Inc. | | | 12,865,347 | |
| | | | | | | | |
| | |
| | | | Restaurants 1.3% | | | |
| | 110,565 | | | Kura Sushi USA, Inc., Class A* | | | 8,907,116 | |
| | | | | | | | |
| | |
| | | | Semiconductor Materials &
Equipment 3.6% | | | |
| | 318,875 | | | PDF Solutions, Inc.* | | | 10,101,960 | |
| | 434,194 | | | Veeco Instruments, Inc.* | | | 14,384,847 | |
| | | | | | | | |
| | | | 24,486,807 | |
| | | | | | | | |
| | |
| | | | Semiconductors 2.8% | | | |
| | 44,013 | | | Impinj, Inc.* | | | 9,529,695 | |
| | 57,716 | | | SiTime Corp.* | | | 9,898,871 | |
| | | | | | | | |
| | | | 19,428,566 | |
| | | | | | | | |
| | |
| | | | Soft Drinks & Non-Alcoholic
Beverages 2.0% | | | |
| | 490,969 | | | Vita Coco Co., Inc.* | | | 13,899,332 | |
| | | | | | | | |
| | |
| | | | Systems Software 1.0% | | | |
| | 228,752 | | | TECSYS, Inc. | | | 6,799,387 | |
| | | | | | | | |
| | |
| | | | Trading Companies &
Distributors 1.6% | | | |
| | 90,585 | | | Transcat, Inc.* | | | 10,939,950 | |
| | | | | | | | |
| | |
| | | | Transaction & Payment Processing
Services 1.7% | | | |
| | 1,601,997 | | | Cantaloupe, Inc.* | | | 11,854,778 | |
| | | | | | | | |
| | |
| | | | Total Common Stocks
(cost $503,648,381) | | | 659,385,588 | |
| | | | | | | | |
| | |
| | | | PREFERRED STOCKS 1.3% | | | | |
| | |
| | | | Textiles 1.3% | | | |
| | 339,559 | | | Johnnie-O Holdings, Inc., Series A Pfd.* *** † | | | 9,276,752 | |
| | | | | | | | |
| | |
| | | | Total Preferred Stocks
(cost $10,000,013) | | | 9,276,752 | |
| | | | | | | | |
| | | | | | | | |
| Shares | | | | | Value | |
| | | | | | | |
| |
| | | | WARRANTS 0.1% | |
| | |
| | | | Biotechnology 0.1% | | | |
| | 1,556,949 | | | Sangamo Therapeutics, Inc., expiring 9/26/2029* *** † | | $ | 482,654 | |
| | | | | | | | |
| | |
| | | | Pharmaceuticals 0.0% | | | |
| | 7,500 | | | IM Cannabis Corp., expiring 5/7/2026* *** † | | | — | |
| | | | | | | | |
| | |
| | | | Total Warrants
(cost $939,374) | | | 482,654 | |
| | | | | | | | |
| | |
| | | | Total Investments
(cost $514,587,768) 98.1% | | | 669,144,994 | |
| | |
| | | | Other Assets less Liabilities 1.9% | | | 12,750,389 | |
| | | | | | | | |
| | |
| | | | Net Assets 100.0% | | $ | 681,895,383 | |
| | | | | | | | |
| |
| | | | * Non-income producing. ***Security was fair valued under procedures adopted by the Board of Trustees using unobservable inputs as described in Note 12, as applicable. †Security purchased in a private placement transaction or under Rule 144A of the Securities Act of 1933 (see Note 9). The aggregate value of securities purchased in a private placement transaction or under Rule 144A of the Securities Act of 1933 at September 30, 2024 amounted to approximately $9,765,506 and represented 1.43% of net assets. ‡‡Affiliated company (see Note 8). | |
| |
| | | | See Notes to Financial Statements. | |
At September 30, 2024, the Wasatch Micro Cap Fund’s investments were in the following countries (unaudited):
| | | | | |
| Country | | % |
Canada | | | | 1.2 | |
Germany | | | | 0.6 | |
Israel | | | | 1.6 | |
United States | | | | 96.6 | |
| | | | | |
TOTAL | | | | 100.0 | % |
| | | | | |
26
| | |
| Wasatch Micro Cap Value Fund (WAMVX / WGMVX) | | SEPTEMBER 30, 2024 |
Schedule of Investments
| | | | | | | | |
| Shares | | | | | Value | |
| | | | | | | |
| |
| | | | COMMON STOCKS 95.8% | |
| | |
| | | | Air Freight & Logistics 0.9% | | | |
| | 452,000 | | | Radiant Logistics, Inc.* | | $ | 2,906,360 | |
| | | | | | | | |
| | |
| | | | Apparel Retail 1.6% | | | |
| | 120,200 | | | Shoe Carnival, Inc. | | | 5,270,770 | |
| | | | | | | | |
| | |
| | | | Application Software 5.0% | | | |
| | 242,000 | | | Red Violet, Inc.* | | | 6,884,900 | |
| | 738,275 | | | Weave Communications, Inc.* | | | 9,449,920 | |
| | | | | | | | |
| | | | 16,334,820 | |
| | | | | | | | |
| | |
| | | | Asset Management & Custody
Banks 2.0% | | | |
| | 586,895 | | | GCM Grosvenor, Inc., Class A | | | 6,643,651 | |
| | | | | | | | |
| | |
| | | | Automotive Parts & Equipment 1.3% | | | |
| | 29,000 | | | Patrick Industries, Inc. | | | 4,128,730 | |
| | | | | | | | |
| | |
| | | | Commercial & Residential Mortgage
Finance 1.1% | | | |
| | 410,715 | | | Mortgage Advice Bureau Holdings Ltd. | | | 3,514,275 | |
| | | | | | | | |
| | |
| | | | Communications Equipment 2.8% | | | |
| | 116,672 | | | Digi International, Inc.* | | | 3,211,980 | |
| | 402,000 | | | Harmonic, Inc.* | | | 5,857,140 | |
| | | | | | | | |
| | | | 9,069,120 | |
| | | | | | | | |
| | |
| | | | Construction & Engineering 7.9% | | | |
| | 108,000 | | | Bowman Consulting Group Ltd.* | | | 2,600,640 | |
| | 67,200 | | | Construction Partners, Inc., Class A* | | | 4,690,560 | |
| | 89,650 | | | Granite Construction, Inc. | | | 7,107,452 | |
| | 84,000 | | | Limbach Holdings, Inc.* | | | 6,363,840 | |
| | 35,300 | | | Sterling Infrastructure, Inc.* | | | 5,119,206 | |
| | | | | | | | |
| | | | 25,881,698 | |
| | | | | | | | |
| | |
| | | | Consumer Finance 1.9% | | | |
| | 551,000 | | | EZCORP, Inc., Class A* | | | 6,176,710 | |
| | | | | | | | |
| | |
| | | | Diversified Support Services 2.6% | | | |
| | 2,370,000 | | | Johnson Service Group PLC | | | 4,936,635 | |
| | 45,000 | | | VSE Corp. | | | 3,722,850 | |
| | | | | | | | |
| | | | 8,659,485 | |
| | | | | | | | |
| | |
| | | | Education Services 0.4% | | | |
| | 102,711 | | | Lincoln Educational Services Corp.* | | | 1,226,369 | |
| | | | | | | | |
| | |
| | | | Electrical Components &
Equipment 0.4% | | | |
| | 73,000 | | | Allient, Inc. | | | 1,386,270 | |
| | | | | | | | |
| | |
| | | | Electronic Equipment &
Instruments 2.8% | | | |
| | 1,051,000 | | | Luna Innovations, Inc.* | | | 2,469,850 | |
| | 83,000 | | | Napco Security Technologies, Inc. | | | 3,358,180 | |
| | 66,000 | | | PAR Technology Corp.* | | | 3,437,280 | |
| | | | | | | | |
| | | | 9,265,310 | |
| | | | | | | | |
| | |
| | | | Electronic Manufacturing Services 1.1% | | | |
| | 75,000 | | | CTS Corp. | | | 3,628,500 | |
| | | | | | | | |
| | | | | | | | |
| Shares | | | | | Value | |
| | | | | | | |
| | |
| | | | Environmental & Facilities
Services 1.2% | | | |
| | 233,792 | | | Aris Water Solutions, Inc., Class A | | $ | 3,944,071 | |
| | | | | | | | |
| | |
| | | | Food Distributors 1.3% | | | |
| | 103,000 | | | Chefs’ Warehouse, Inc.* | | | 4,327,030 | |
| | | | | | | | |
| | |
| | | | Food Retail 1.2% | | | |
| | 138,800 | | | Halows Co. Ltd. | | | 4,058,796 | |
| | | | | | | | |
| | |
| | | | Health Care Equipment 3.4% | | | |
| | 1,795,794 | | | AOTI, Inc.* | | | 3,241,198 | |
| | 188,673 | | | Inmode Ltd.* | | | 3,198,007 | |
| | 330,207 | | | Tactile Systems Technology, Inc.* | | | 4,824,324 | |
| | | | | | | | |
| | | | 11,263,529 | |
| | | | | | | | |
| | |
| | | | Health Care Services 5.6% | | | |
| | 50,059 | | | Addus HomeCare Corp.* | | | 6,659,349 | |
| | 168,000 | | | Pennant Group, Inc.* | | | 5,997,600 | |
| | 797,000 | | | Viemed Healthcare, Inc.* | | | 5,842,010 | |
| | | | | | | | |
| | | | 18,498,959 | |
| | | | | | | | |
| | |
| | | | Health Care Supplies 1.9% | | | |
| | 92,000 | | | OrthoPediatrics Corp.* | | | 2,494,120 | |
| | 12,000 | | | UFP Technologies, Inc.* | | | 3,800,400 | |
| | | | | | | | |
| | | | 6,294,520 | |
| | | | | | | | |
| | |
| | | | Health Care Technology 1.2% | | | |
| | 61,000 | | | Nexus AG | | | 3,768,567 | |
| | | | | | | | |
| | |
| | | | Home Furnishing Retail 1.2% | | | |
| | 313,000 | | | Arhaus, Inc. | | | 3,853,030 | |
| | | | | | | | |
| | |
| | | | Homebuilding 5.1% | | | |
| | 124,800 | | | Champion Homes, Inc.* | | | 11,837,280 | |
| | 391,000 | | | Landsea Homes Corp.* | | | 4,828,850 | |
| | | | | | | | |
| | | | 16,666,130 | |
| | | | | | | | |
| | |
| | | | Industrial Machinery & Supplies &
Components 3.9% | | | |
| | 149,000 | | | Graham Corp.* | | | 4,408,910 | |
| | 10,000 | | | Kadant, Inc. | | | 3,380,000 | |
| | 28,000 | | | Standex International Corp. | | | 5,117,840 | |
| | | | | | | | |
| | | | 12,906,750 | |
| | | | | | | | |
| | |
| | | | Internet Services & Infrastructure 1.8% | | | |
| | 409,000 | | | BigCommerce Holdings, Inc., Series 1* | | | 2,392,650 | |
| | 221,441 | | | Couchbase, Inc.* | | | 3,569,629 | |
| | | | | | | | |
| | | | 5,962,279 | |
| | | | | | | | |
| | |
| | | | Investment Banking & Brokerage 3.8% | | | |
| | 242,000 | | | JDC Group AG* | | | 6,303,543 | |
| | 322,000 | | | Perella Weinberg Partners | | | 6,217,820 | |
| | | | | | | | |
| | | | 12,521,363 | |
| | | | | | | | |
| | |
| | | | IT Consulting & Other Services 1.5% | | | |
| | 356,000 | | | Grid Dynamics Holdings, Inc.* | | | 4,984,000 | |
| | | | | | | | |
| | |
| | | | Leisure Facilities 0.9% | | | |
| | 250,721 | | | Xponential Fitness, Inc., Class A* | | | 3,108,940 | |
| | | | | | | | |
27
| | |
| Wasatch Micro Cap Value Fund (WAMVX / WGMVX) | | SEPTEMBER 30, 2024 |
Schedule of Investments (continued)
| | | | | | | | |
| Shares | | | | | Value | |
| | | | | | | |
| | |
| | | | Mortgage REITs 1.2% | | | |
| | 272,103 | | | Sunrise Realty Trust, Inc. | | $ | 3,915,562 | |
| | | | | | | | |
| | |
| | | | Oil & Gas Exploration &
Production 0.9% | | | |
| | 221,641 | | | HighPeak Energy, Inc. | | | 3,076,377 | |
| | | | | | | | |
| | |
| | | | Packaged Foods & Meats 3.3% | | | |
| | 1,307,000 | | | LT Foods Ltd. | | | 6,213,693 | |
| | 624,000 | | | Mama’s Creations, Inc.* | | | 4,555,200 | |
| | | | | | | | |
| | | | 10,768,893 | |
| | | | | | | | |
| | |
| | | | Pharmaceuticals 1.6% | | | |
| | 613,010 | | | Biote Corp., Class A* | | | 3,420,596 | |
| | 641,755 | | | Esperion Therapeutics, Inc.* | | | 1,058,896 | |
| | 105,101 | | | Eton Pharmaceuticals, Inc.* | | | 630,606 | |
| | | | | | | | |
| | | | 5,110,098 | |
| | | | | | | | |
| | |
| | | | Property & Casualty Insurance 4.0% | | | |
| | 156,000 | | | Bowhead Specialty Holdings, Inc.* | | | 4,369,560 | |
| | 31,800 | | | HCI Group, Inc. | | | 3,404,508 | |
| | 128,000 | | | Skyward Specialty Insurance Group, Inc.* | | | 5,213,440 | |
| | | | | | | | |
| | | | 12,987,508 | |
| | | | | | | | |
| | |
| | | | Regional Banks 5.6% | | | |
| | 54,000 | | | Axos Financial, Inc.* | | | 3,395,520 | |
| | 83,000 | | | Esquire Financial Holdings, Inc. | | | 5,412,430 | |
| | 169,009 | | | Finwise Bancorp* | | | 2,636,541 | |
| | 194,024 | | | First Western Financial, Inc.* | | | 3,880,480 | |
| | 112,000 | | | Third Coast Bancshares, Inc.* | | | 2,998,240 | |
| | | | | | | | |
| | | | 18,323,211 | |
| | | | | | | | |
| | |
| | | | Research & Consulting Services 3.1% | | | |
| | 39,528 | | | ICF International, Inc. | | | 6,592,875 | |
| | 2,186,000 | | | Knights Group Holdings PLC | | | 3,711,668 | |
| | | | | | | | |
| | | | 10,304,543 | |
| | | | | | | | |
| | |
| | | | Restaurants 0.9% | | | |
| | 366,442 | | | GEN Restaurant Group, Inc.* ‡‡ | | | 3,092,771 | |
| | | | | | | | |
| | |
| | | | Semiconductor Materials &
Equipment 1.8% | | | |
| | 180,000 | | | Veeco Instruments, Inc.* | | | 5,963,400 | |
| | | | | | | | |
| | |
| | | | Semiconductors 1.2% | | | |
| | 23,000 | | | SiTime Corp.* | | | 3,944,730 | |
| | | | | | | | |
| | |
| | | | Soft Drinks & Non-Alcoholic
Beverages 1.3% | | | |
| | 146,000 | | | Vita Coco Co., Inc.* | | | 4,133,260 | |
| | | | | | | | |
| | |
| | | | Technology Distributors 1.6% | | | |
| | 53,000 | | | Climb Global Solutions, Inc. | | | 5,275,620 | |
| | | | | | | | |
| | |
| | | | Trading Companies &
Distributors 3.5% | | | |
| | 174,000 | | | ADENTRA, Inc. | | | 5,456,276 | |
| | 79,000 | | | Global Industrial Co. | | | 2,683,630 | |
| | 125,000 | | | Karat Packaging, Inc. | | | 3,236,250 | |
| | | | | | | | |
| | | | 11,376,156 | |
| | | | | | | | |
| | |
| | | | Total Common Stocks
(cost $207,647,675) | | | 314,522,161 | |
| | | | | | | | |
| | | | | | | | |
| Shares | | | | | Value | |
| | | | | | | |
| |
| | | | WARRANTS 0.0% | |
| | |
| | | | Trading Companies & Distributors 0.0% | | | |
| | 131 | | | Greenlane Holdings, Inc., expiring
2/24/2026* *** † | | $ | — | |
| | | | | | | | |
| | |
| | | | Total Warrants
(cost $396,902) | | | — | |
| | | | | | | | |
| | |
| | | | Total Investments
(cost $208,044,577) 95.8%§ | | | 314,522,161 | |
| | |
| | | | Other Assets less Liabilities 4.2% | | | 13,747,363 | |
| | | | | | | | |
| | |
| | | | Net Assets 100.0% | | $ | 328,269,524 | |
| | | | | | | | |
| |
| | | | *Non-income producing. ***Security was fair valued under procedures adopted by the Board of Trustees using unobservable inputs as described in Note 12, as applicable. †Security purchased in a private placement transaction or under Rule 144A of the Securities Act of 1933 (see Note 9). The aggregate value of securities purchased in a private placement transaction or under Rule 144A of the Securities Act of 1933 at September 30, 2024 amounted to approximately $0 and represented 0.00% of net assets. ‡‡Affiliated company (see Note 8). §The aggregate amount of foreign securities fair valued pursuant to a systematic valuation model as a percent of net assets was 3.13%. | |
| |
| | | | See Notes to Financial Statements. | |
At September 30, 2024, the Wasatch Micro Cap Value Fund’s investments were in the following countries (unaudited):
| | | | | |
| Country | | % |
Canada | | | | 1.7 | |
Germany | | | | 3.2 | |
India | | | | 2.0 | |
Israel | | | | 1.0 | |
Japan | | | | 1.3 | |
United Kingdom | | | | 3.9 | |
United States | | | | 86.9 | |
| | | | | |
TOTAL | | | | 100.0 | % |
| | | | | |
28
| | |
| Wasatch Small Cap Growth Fund (WAAEX / WIAEX) | | SEPTEMBER 30, 2024 |
Schedule of Investments
| | | | | | | | |
| Shares | | | | | Value | |
| | | | | | | |
| | |
| | | | COMMON STOCKS 98.2% | | | | |
| | |
| | | | Apparel Retail 1.5% | | | |
| | 195,108 | | | Boot Barn Holdings, Inc.* | | $ | 32,637,666 | |
| | | | | | | | |
| | |
| | | | Application Software 10.3% | | | |
| | 493,875 | | | Agilysys, Inc.* | | | 53,817,559 | |
| | 795,356 | | | Alkami Technology, Inc.* | | | 25,085,528 | |
| | 3,442,913 | | | Clearwater Analytics Holdings, Inc., Class A* | | | 86,933,553 | |
| | 1,132,865 | | | nCino, Inc.* | | | 35,787,205 | |
| | 710,020 | | | Sprout Social, Inc., Class A* | | | 20,640,282 | |
| | | | | | | | |
| | | | 222,264,127 | |
| | | | | | | | |
| | |
| | | | Asset Management & Custody
Banks 1.8% | | | |
| | 661,882 | | | StepStone Group, Inc., Class A | | | 37,614,754 | |
| | | | | | | | |
| | |
| | | | Automotive Parts & Equipment 1.4% | | | |
| | 700,064 | | | XPEL, Inc.* | | | 30,361,776 | |
| | | | | | | | |
| | |
| | | | Automotive Retail 2.5% | | | |
| | 1,275,727 | | | Valvoline, Inc.* | | | 53,389,175 | |
| | | | | | | | |
| | |
| | | | Broadline Retail 4.4% | | | |
| | 790,425 | | | Global-e Online Ltd.* | | | 30,383,937 | |
| | 649,983 | | | Ollie’s Bargain Outlet Holdings, Inc.* | | | 63,178,348 | |
| | | | | | | | |
| | | | 93,562,285 | |
| | | | | | | | |
| | |
| | | | Building Products 5.7% | | | |
| | 637,976 | | | AAON, Inc. | | | 68,799,332 | |
| | 1,134,280 | | | AZEK Co., Inc.* | | | 53,084,304 | |
| | | | | | | | |
| | | | 121,883,636 | |
| | | | | | | | |
| | |
| | | | Construction & Engineering 2.7% | | | |
| | 839,753 | | | Construction Partners, Inc., Class A* | | | 58,614,759 | |
| | | | | | | | |
| | |
| | | | Health Care Equipment 3.0% | | | |
| | 203,392 | | | Inspire Medical Systems, Inc.* | | | 42,925,882 | |
| | 142,353 | | | TransMedics Group, Inc.* | | | 22,349,421 | |
| | | | | | | | |
| | | | 65,275,303 | |
| | | | | | | | |
| | |
| | | | Health Care Facilities 4.2% | | | |
| | 530,208 | | | Ensign Group, Inc. | | | 76,254,515 | |
| | 373,688 | | | PACS Group, Inc.* | | | 14,936,309 | |
| | | | | | | | |
| | | | 91,190,824 | |
| | | | | | | | |
| | |
| | | | Health Care Services 3.7% | | | |
| | 447,257 | | | Addus HomeCare Corp.* | | | 59,498,599 | |
| | 689,533 | | | Castle Biosciences, Inc.* | | | 19,665,481 | |
| | | | | | | | |
| | | | 79,164,080 | |
| | | | | | | | |
| | |
| | | | Health Care Supplies 1.4% | | | |
| | 94,378 | | | UFP Technologies, Inc.* | | | 29,889,513 | |
| | | | | | | | |
| | |
| | | | Home Improvement Retail 2.6% | | | |
| | 457,044 | | | Floor & Decor Holdings, Inc., Class A* | | | 56,751,154 | |
| | | | | | | | |
| | |
| | | | Homebuilding 1.6% | | | |
| | 288,905 | | | LGI Homes, Inc.* | | | 34,241,021 | |
| | | | | | | | |
| | |
| | | | Human Resource & Employment
Services 3.1% | | | |
| | 402,919 | | | Paylocity Holding Corp.* | | | 66,469,547 | |
| | | | | | | | |
| | | | | | | | |
| Shares | | | | | Value | |
| | | | | | | |
| | |
| | | | Industrial Machinery & Supplies &
Components 3.8% | | | |
| | 269,785 | | | RBC Bearings, Inc.* | | $ | 80,768,233 | |
| | | | | | | | |
| | |
| | | | Insurance Brokers 1.8% | | | |
| | 427,227 | | | Goosehead Insurance, Inc., Class A* | | | 38,151,371 | |
| | | | | | | | |
| | |
| | | | IT Consulting & Other Services 4.9% | | | |
| | 317,820 | | | Globant SA* | | | 62,972,855 | |
| | 3,008,293 | | | Grid Dynamics Holdings, Inc.* | | | 42,116,102 | |
| | | | | | | | |
| | | | 105,088,957 | |
| | | | | | | | |
| | |
| | | | Leisure Products 1.6% | | | |
| | 838,001 | | | YETI Holdings, Inc.* | | | 34,383,181 | |
| | | | | | | | |
| | |
| | | | Life Sciences Tools & Services 2.3% | | | |
| | 150,803 | | | Medpace Holdings, Inc.* | | | 50,338,041 | |
| | | | | | | | |
| | |
| | | | Managed Health Care 3.9% | | | |
| | 1,022,375 | | | HealthEquity, Inc.* | | | 83,681,394 | |
| | | | | | | | |
| | |
| | | | Other Specialty Retail 1.2% | | | |
| | 283,821 | | | Five Below, Inc.* | | | 25,075,585 | |
| | | | | | | | |
| | |
| | | | Packaged Foods & Meats 1.9% | | | |
| | 291,564 | | | Freshpet, Inc.* | | | 39,877,208 | |
| | | | | | | | |
| | |
| | | | Personal Care Products 3.7% | | | |
| | 1,314,478 | | | BellRing Brands, Inc.* | | | 79,815,104 | |
| | | | | | | | |
| | |
| | | | Pharmaceuticals 2.3% | | | |
| | 4,397,143 | | | Esperion Therapeutics, Inc.* | | | 7,255,286 | |
| | 580,858 | | | Intra-Cellular Therapies, Inc.* | | | 42,501,380 | |
| | | | | | | | |
| | | | 49,756,666 | |
| | | | | | | | |
| | |
| | | | Regional Banks 3.0% | | | |
| | 669,096 | | | Pinnacle Financial Partners, Inc. | | | 65,551,335 | |
| | | | | | | | |
| | |
| | | | Restaurants 2.7% | | | |
| | 739,192 | | | Dutch Bros, Inc., Class A* | | | 23,676,320 | |
| | 338,159 | | | Shake Shack, Inc., Class A* | | | 34,901,390 | |
| | | | | | | | |
| | | | 58,577,710 | |
| | | | | | | | |
| | |
| | | | Semiconductor Materials &
Equipment 2.5% | | | |
| | 262,902 | | | Nova Ltd.* | | | 54,773,003 | |
| | | | | | | | |
| | |
| | | | Semiconductors 1.5% | | | |
| | 191,148 | | | SiTime Corp.* | | | 32,783,793 | |
| | | | | | | | |
| | |
| | | | Systems Software 3.3% | | | |
| | 150,242 | | | CyberArk Software Ltd.* | | | 43,812,070 | |
| | 922,013 | | | JFrog Ltd.* | | | 26,775,257 | |
| | | | | | | | |
| | | | 70,587,327 | |
| | | | | | | | |
| | |
| | | | Trading Companies &
Distributors 4.4% | | | |
| | 361,203 | | | SiteOne Landscape Supply, Inc.* | | | 54,509,145 | |
| | 335,473 | | | Transcat, Inc.* | | | 40,515,074 | |
| | | | | | | | |
| | | | 95,024,219 | |
| | | | | | | | |
29
| | |
| Wasatch Small Cap Growth Fund (WAAEX / WIAEX) | | SEPTEMBER 30, 2024 |
Schedule of Investments (continued)
| | | | | | | | |
| Shares | | | | | Value | |
| | | | | | | |
| | |
| | | | Transaction & Payment Processing
Services 3.5% | | | |
| | 1,003,194 | | | Flywire Corp.* | | $ | 16,442,349 | |
| | 659,458 | | | Shift4 Payments, Inc., Class A* | | | 58,427,979 | |
| | | | | | | | |
| | | | 74,870,328 | |
| | | | | | | | |
| | |
| | | | Total Common Stocks
(cost $1,309,791,694) | | | 2,112,413,075 | |
| | | | | | | | |
| |
| | | | PREFERRED STOCKS 1.2% | |
| | |
| | | | Systems Software 0.4% | | | |
| | 1,114,610 | | | DataStax, Inc., Series E Pfd.* *** † | | | 9,362,724 | |
| | | | | | | | |
| | |
| | | | Textiles 0.8% | | | |
| | 611,205 | | | Johnnie-O Holdings, Inc., Series A
Pfd.* *** † ‡‡ | | | 16,698,121 | |
| | | | | | | | |
| | |
| | | | Total Preferred Stocks
(cost $25,999,989) | | | 26,060,845 | |
| | | | | | | | |
| | |
| | | | Total Investments
(cost $1,335,791,683) 99.4% | | | 2,138,473,920 | |
| | |
| | | | Other Assets less Liabilities 0.6% | | | 12,017,550 | |
| | | | | | | | |
| | |
| | | | Net Assets 100.0% | | $ | 2,150,491,470 | |
| | | | | | | | |
| |
| | | | *Non-income producing. ***Security was fair valued under procedures adopted by the Board of Trustees using unobservable inputs as described in Note 12, as applicable. †Security purchased in a private placement transaction or under Rule 144A of the Securities Act of 1933 (see Note 9). The aggregate value of securities purchased in a private placement transaction or under Rule 144A of the Securities Act of 1933 at September 30, 2024 amounted to approximately $26,060,845 and represented 1.21% of net assets. ‡‡Affiliated company (see Note 8). | |
| |
| | | | See Notes to Financial Statements. | |
At September 30, 2024, the Wasatch Small Cap Growth Fund’s investments were in the following countries (unaudited):
| | | | | |
| Country | | % |
Israel | | | | 6.0 | |
United States | | | | 94.0 | |
| | | | | |
TOTAL | | | | 100.0 | % |
| | | | | |
30
| | |
| Wasatch Small Cap Value Fund (WMCVX / WICVX) | | SEPTEMBER 30, 2024 |
Schedule of Investments
| | | | | | | | |
| Shares | | | | | Value | |
| | | | | | | |
| | |
| | | | COMMON STOCKS 98.1% | | | | |
| | |
| | | | Apparel Retail 1.5% | | | |
| | 152,511 | | | Boot Barn Holdings, Inc.* | | $ | 25,512,040 | |
| | | | | | | | |
| | |
| | | | Apparel, Accessories & Luxury
Goods 1.4% | | | |
| | 345,303 | | | Carter’s, Inc. | | | 22,437,789 | |
| | | | | | | | |
| | |
| | | | Application Software 0.4% | | | |
| | 473,725 | | | Weave Communications, Inc.* | | | 6,063,680 | |
| | | | | | | | |
| | |
| | | | Asset Management & Custody
Banks 6.7% | | | |
| | 1,006,040 | | | Artisan Partners Asset Management, Inc., Class A | | | 43,581,653 | |
| | 413,250 | | | Cohen & Steers, Inc. | | | 39,651,337 | |
| | 167,664 | | | Hamilton Lane, Inc., Class A | | | 28,232,941 | |
| | | | | | | | |
| | | | 111,465,931 | |
| | | | | | | | |
| | |
| | | | Automotive Retail 2.4% | | | |
| | 965,826 | | | Valvoline, Inc.* | | | 40,419,818 | |
| | | | | | | | |
| | |
| | | | Broadline Retail 1.8% | | | |
| | 313,859 | | | Ollie’s Bargain Outlet Holdings, Inc.* | | | 30,507,095 | |
| | | | | | | | |
| | |
| | | | Building Products 3.8% | | | |
| | 1,911,303 | | | Janus International Group, Inc.* | | | 19,323,273 | |
| | 330,453 | | | UFP Industries, Inc. | | | 43,358,738 | |
| | | | | | | | |
| | | | 62,682,011 | |
| | | | | | | | |
| | |
| | | | Cargo Ground Transportation 1.4% | | | |
| | 53,902 | | | Saia, Inc.* | | | 23,569,189 | |
| | | | | | | | |
| | |
| | | | Construction & Engineering 2.1% | | | |
| | 444,558 | | | Granite Construction, Inc. | | | 35,244,558 | |
| | | | | | | | |
| | |
| | | | Construction Machinery & Heavy
Transportation Equipment 3.5% | | | |
| | 401,845 | | | Allison Transmission Holdings, Inc. | | | 38,605,249 | |
| | 991,629 | | | Wabash National Corp. | | | 19,029,361 | |
| | | | | | | | |
| | | | 57,634,610 | |
| | | | | | | | |
| | |
| | | | Education Services 2.4% | | | |
| | 279,099 | | | Grand Canyon Education, Inc.* | | | 39,590,193 | |
| | | | | | | | |
| | |
| | | | Electronic Equipment &
Instruments 1.4% | | | |
| | 1,958,319 | | | Arlo Technologies, Inc.* | | | 23,715,243 | |
| | | | | | | | |
| | |
| | | | Electronic Manufacturing
Services 4.9% | | | |
| | 427,749 | | | Benchmark Electronics, Inc. | | | 18,957,836 | |
| | 807,265 | | | CTS Corp. | | | 39,055,481 | |
| | 101,385 | | | Fabrinet* | | | 23,971,469 | |
| | | | | | | | |
| | | | 81,984,786 | |
| | | | | | | | |
| | |
| | | | Financial Exchanges & Data 0.6% | | | |
| | 1,703,877 | | | Open Lending Corp.* | | | 10,427,727 | |
| | | | | | | | |
| | |
| | | | Health Care Facilities 2.1% | | | |
| | 242,568 | | | Ensign Group, Inc. | | | 34,886,130 | |
| | | | | | | | |
| | | | | | | | |
| Shares | | | | | Value | |
| | | | | | | |
| | |
| | | | Health Care Supplies 1.8% | | | |
| | 92,589 | | | UFP Technologies, Inc.* | | $ | 29,322,936 | |
| | | | | | | | |
| | |
| | | | Homebuilding 3.8% | | | |
| | 365,946 | | | Champion Homes, Inc.* | | | 34,709,978 | |
| | 233,622 | | | LGI Homes, Inc.* | | | 27,688,880 | |
| | | | | | | | |
| | | | 62,398,858 | |
| | | | | | | | |
| | |
| | | | Industrial Machinery & Supplies &
Components 5.8% | | | |
| | 425,042 | | | Helios Technologies, Inc. | | | 20,274,504 | |
| | 131,795 | | | Kadant, Inc. | | | 44,546,710 | |
| | 174,367 | | | Standex International Corp. | | | 31,870,800 | |
| | | | | | | | |
| | | | 96,692,014 | |
| | | | | | | | |
| | |
| | | | Investment Banking & Brokerage 1.8% | | | |
| | 435,896 | | | Moelis & Co., Class A | | | 29,863,235 | |
| | | | | | | | |
| | |
| | | | Leisure Products 1.9% | | | |
| | 771,700 | | | YETI Holdings, Inc.* | | | 31,662,851 | |
| | | | | | | | |
| | |
| | | | Life Sciences Tools & Services 1.2% | | | |
| | 61,971 | | | Medpace Holdings, Inc.* | | | 20,685,920 | |
| | | | | | | | |
| | |
| | | | Managed Health Care 1.6% | | | |
| | 326,591 | | | HealthEquity, Inc.* | | | 26,731,473 | |
| | | | | | | | |
| | |
| | | | Mortgage REITs 1.8% | | | |
| | 1,920,050 | | | Arbor Realty Trust, Inc. | | | 29,875,978 | |
| | | | | | | | |
| | |
| | | | Oil & Gas Equipment & Services 0.9% | | | |
| | 263,445 | | | Cactus, Inc., Class A | | | 15,719,763 | |
| | | | | | | | |
| | |
| | | | Oil & Gas Exploration &
Production 3.3% | | | |
| | 996,459 | | | Magnolia Oil & Gas Corp., Class A | | | 24,333,529 | |
| | 606,504 | | | Matador Resources Co. | | | 29,973,427 | |
| | | | | | | | |
| | | | 54,306,956 | |
| | | | | | | | |
| | |
| | | | Oil & Gas Storage &
Transportation 1.8% | | | |
| | 2,700,221 | | | DHT Holdings, Inc. | | | 29,783,438 | |
| | | | | | | | |
| | |
| | | | Other Specialty Retail 3.1% | | | |
| | 140,757 | | | Five Below, Inc.* | | | 12,435,881 | |
| | 1,121,416 | | | Sally Beauty Holdings, Inc.* | | | 15,217,615 | |
| | 237,444 | | | Signet Jewelers Ltd. | | | 24,489,974 | |
| | | | | | | | |
| | | | 52,143,470 | |
| | | | | | | | |
| | |
| | | | Pharmaceuticals 0.8% | | | |
| | 177,549 | | | Intra-Cellular Therapies, Inc.* | | | 12,991,260 | |
| | | | | | | | |
| | |
| | | | Property & Casualty Insurance 1.8% | | | |
| | 372,223 | | | Axis Capital Holdings Ltd. | | | 29,632,673 | |
| | | | | | | | |
| | |
| | | | Regional Banks 11.2% | | | |
| | 570,532 | | | Axos Financial, Inc.* | | | 35,875,052 | |
| | 808,023 | | | Bank OZK | | | 34,736,909 | |
| | 636,919 | | | FB Financial Corp. | | | 29,890,609 | |
| | 235,456 | | | Hancock Whitney Corp. | | | 12,048,283 | |
| | 434,278 | | | Pinnacle Financial Partners, Inc. | | | 42,546,216 | |
| | 376,687 | | | ServisFirst Bancshares, Inc. | | | 30,304,469 | |
| | | | | | | | |
| | | | 185,401,538 | |
| | | | | | | | |
31
| | |
| Wasatch Small Cap Value Fund (WMCVX / WICVX) | | SEPTEMBER 30, 2024 |
Schedule of Investments (continued)
| | | | | | | | |
| Shares | | | | | Value | |
| | | | | | | |
| | |
| | | | Research & Consulting
Services 2.4% | | | |
| | 244,081 | | | ICF International, Inc. | | $ | 40,710,270 | |
| | | | | | | | |
| | |
| | | | Security & Alarm Services 1.9% | | | |
| | 278,022 | | | Brink’s Co. | | | 32,150,464 | |
| | | | | | | | |
| | |
| | | | Self-Storage REITs 3.1% | | | |
| | 1,059,956 | | | National Storage Affiliates Trust | | | 51,089,879 | |
| | | | | | | | |
| | |
| | | | Semiconductor Materials &
Equipment 2.9% | | | |
| | 117,725 | | | Nova Ltd.* | | | 24,526,827 | |
| | 737,800 | | | Veeco Instruments, Inc.* | | | 24,443,314 | |
| | | | | | | | |
| | | | 48,970,141 | |
| | | | | | | | |
| | |
| | | | Soft Drinks & Non-Alcoholic
Beverages 1.4% | | | |
| | 840,226 | | | Vita Coco Co., Inc.* | | | 23,786,798 | |
| | | | | | | | |
| | |
| | | | Specialty Chemicals 2.1% | | | |
| | 311,567 | | | Innospec, Inc. | | | 35,235,112 | |
| | | | | | | | |
| | |
| | | | Steel 1.2% | | | |
| | 348,545 | | | Commercial Metals Co. | | | 19,156,033 | |
| | | | | | | | |
| | |
| | | | Technology Distributors 1.8% | | | |
| | 610,858 | | | ScanSource, Inc.* | | | 29,339,510 | |
| | | | | | | | |
| | | | | | | | |
| Shares | | | | | Value | |
| | | | | | | |
| | |
| | | | Transaction & Payment Processing
Services 2.3% | | | |
| | 383,463 | | | Euronet Worldwide, Inc.* | | $ | 38,051,034 | |
| | | | | | | | |
| | |
| | | | Total Common Stocks
(cost $1,218,389,778) | | | 1,631,842,404 | |
| | | | | | | | |
| | |
| | | | Total Investments
(cost $1,218,389,778) 98.1% | | | 1,631,842,404 | |
| | |
| | | | Other Assets less Liabilities 1.9% | | | 30,951,423 | |
| | | | | | | | |
| | |
| | | | Net Assets 100.0% | | $ | 1,662,793,827 | |
| | | | | | | | |
| |
| | | | *Non-income producing. REIT Real Estate Investment Trust. | |
| |
| | | | See Notes to Financial Statements. | |
At September 30, 2024, the Wasatch Small Cap Value Fund’s investments were in the following countries (unaudited):
| | | | | |
| Country | | % |
Israel | | | | 1.5 | |
Norway | | | | 1.8 | |
United States | | | | 96.7 | |
| | | | | |
TOTAL | | | | 100.0 | % |
| | | | | |
32
| | |
| Wasatch Ultra Growth Fund (WAMCX / WGMCX) | | SEPTEMBER 30, 2024 |
Schedule of Investments
| | | | | | | | |
| Shares | | | | | Value | |
| | | | | | | |
| |
| | | | COMMON STOCKS 98.0% | |
| | |
| | | | Application Software 5.8% | | | |
| | 371,447 | | | nCino, Inc.* | | $ | 11,734,011 | |
| | 148,498 | | | Procore Technologies, Inc.* | | | 9,165,296 | |
| | 286,118 | | | Q2 Holdings, Inc.* | | | 22,823,633 | |
| | 435,226 | | | Sprout Social, Inc., Class A* | | | 12,652,020 | |
| | | | | | | | |
| | | | 56,374,960 | |
| | | | | | | | |
| | |
| | | | Biotechnology 10.1% | | | |
| | 2,609,942 | | | C4 Therapeutics, Inc.* | | | 14,876,670 | |
| | 144,303 | | | Denali Therapeutics, Inc.* | | | 4,203,546 | |
| | 182,105 | | | Dyne Therapeutics, Inc.* | | | 6,541,212 | |
| | 405,146 | | | Exact Sciences Corp.* | | | 27,598,546 | |
| | 458,159 | | | Exagen, Inc.* | | | 1,415,711 | |
| | 461,258 | | | Immatics NV* | | | 5,262,954 | |
| | 1,633,873 | | | MacroGenics, Inc.* | | | 5,375,442 | |
| | 1,024,570 | | | Nkarta, Inc.* | | | 4,631,056 | |
| | 413,850 | | | Nurix Therapeutics, Inc.* | | | 9,299,210 | |
| | 10,973,844 | | | Sangamo Therapeutics, Inc.* ‡‡ | | | 9,504,446 | |
| | 135,707 | | | Viking Therapeutics, Inc.* | | | 8,591,610 | |
| | | | | | | | |
| | | | 97,300,403 | |
| | | | | | | | |
| | |
| | | | Broadline Retail 1.5% | | | |
| | 152,149 | | | Ollie’s Bargain Outlet Holdings, Inc.* | | | 14,788,883 | |
| | | | | | | | |
| | |
| | | | Building Products 1.8% | | | |
| | 258,149 | | | Trex Co., Inc.* | | | 17,187,560 | |
| | | | | | | | |
| | |
| | | | Distributors 1.9% | | | |
| | 49,298 | | | Pool Corp. | | | 18,575,486 | |
| | | | | | | | |
| | |
| | | | Environmental & Facilities
Services 2.1% | | | |
| | 205,725 | | | Casella Waste Systems, Inc., Class A* | | | 20,467,580 | |
| | | | | | | | |
| | |
| | | | Financial Exchanges & Data 3.0% | | | |
| | 67,130 | | | MarketAxess Holdings, Inc. | | | 17,198,706 | |
| | 1,879,778 | | | Open Lending Corp.* | | | 11,504,241 | |
| | | | | | | | |
| | | | 28,702,947 | |
| | | | | | | | |
| | |
| | | | Footwear 2.0% | | | |
| | 388,184 | | | On Holding AG, Class A* | | | 19,467,428 | |
| | | | | | | | |
| | |
| | | | Health Care Equipment 6.1% | | | |
| | 365,243 | | | Artivion, Inc.* | | | 9,722,769 | |
| | 710,328 | | | AtriCure, Inc.* | | | 19,917,597 | |
| | 138,975 | | | Inspire Medical Systems, Inc.* | | | 29,330,674 | |
| | | | | | | | |
| | | | 58,971,040 | |
| | | | | | | | |
| | |
| | | | Health Care Services 1.1% | | | |
| | 369,684 | | | Castle Biosciences, Inc.* | | | 10,543,388 | |
| | | | | | | | |
| | |
| | | | Health Care Supplies 2.2% | | | |
| | 6,849,908 | | | Cerus Corp.* | | | 11,918,840 | |
| | 191,897 | | | RxSight, Inc.* | | | 9,485,469 | |
| | | | | | | | |
| | | | 21,404,309 | |
| | | | | | | | |
| | |
| | | | Home Improvement Retail 2.4% | | | |
| | 189,964 | | | Floor & Decor Holdings, Inc., Class A* | | | 23,587,830 | |
| | | | | | | | |
| | | | | | | | |
| Shares | | | | | Value | |
| | | | | | | |
| | |
| | | | Homebuilding 2.5% | | | |
| | 148,914 | | | Champion Homes, Inc.* | | $ | 14,124,493 | |
| | 88,127 | | | LGI Homes, Inc.* | | | 10,444,812 | |
| | | | | | | | |
| | | | 24,569,305 | |
| | | | | | | | |
| | |
| | | | Human Resource & Employment
Services 3.0% | | | |
| | 177,126 | | | Paylocity Holding Corp.* | | | 29,220,476 | |
| | | | | | | | |
| | |
| | | | Industrial Machinery & Supplies &
Components 1.8% | | | |
| | 58,471 | | | RBC Bearings, Inc.* | | | 17,505,048 | |
| | | | | | | | |
| | |
| | | | Insurance Brokers 2.1% | | | |
| | 222,020 | | | Goosehead Insurance, Inc., Class A* | | | 19,826,386 | |
| | | | | | | | |
| | |
| | | | Internet Services & Infrastructure 1.0% | | | |
| | 1,175,943 | | | BigCommerce Holdings, Inc., Series 1* | | | 6,879,266 | |
| | 175,523 | | | Couchbase, Inc.* | | | 2,829,431 | |
| | | | | | | | |
| | | | 9,708,697 | |
| | | | | | | | |
| | |
| | | | IT Consulting & Other Services 3.6% | | | |
| | 433,755 | | | Endava PLC, ADR* | | | 11,078,102 | |
| | 121,498 | | | Globant SA* | | | 24,073,614 | |
| | | | | | | | |
| | | | 35,151,716 | |
| | | | | | | | |
| | |
| | | | Managed Health Care 3.4% | | | |
| | 404,336 | | | HealthEquity, Inc.* | | | 33,094,902 | |
| | | | | | | | |
| | |
| | | | Oil & Gas Exploration &
Production 1.9% | | | |
| | 427,740 | | | Magnolia Oil & Gas Corp., Class A | | | 10,445,411 | |
| | 168,655 | | | Matador Resources Co. | | | 8,334,930 | |
| | | | | | | | |
| | | | 18,780,341 | |
| | | | | | | | |
| | |
| | | | Other Specialty Retail 1.8% | | | |
| | 193,833 | | | Five Below, Inc.* | | | 17,125,146 | |
| | | | | | | | |
| | |
| | | | Packaged Foods & Meats 4.3% | | | |
| | 304,388 | | | Freshpet, Inc.* | | | 41,631,147 | |
| | | | | | | | |
| | |
| | | | Personal Care Products 1.9% | | | |
| | 296,829 | | | BellRing Brands, Inc.* | | | 18,023,457 | |
| | | | | | | | |
| | |
| | | | Pharmaceuticals 5.7% | | | |
| | 246,361 | | | Arvinas, Inc.* | | | 6,067,872 | |
| | 174,083 | | | BioAge Labs, Inc.* | | | 3,620,926 | |
| | 6,675,165 | | | Esperion Therapeutics, Inc.* | | | 11,014,022 | |
| | 409,535 | | | Intra-Cellular Therapies, Inc.* | | | 29,965,676 | |
| | 227,003 | | | Phathom Pharmaceuticals, Inc.* | | | 4,104,214 | |
| | | | | | | | |
| | | | 54,772,710 | |
| | | | | | | | |
| | |
| | | | Regional Banks 1.9% | | | |
| | 415,459 | | | Bank OZK | | | 17,860,582 | |
| | | | | | | | |
| | |
| | | | Semiconductor Materials &
Equipment 8.2% | | | |
| | 68,857 | | | BE Semiconductor Industries NV | | | 8,782,056 | |
| | 368,916 | | | Kulicke & Soffa Industries, Inc. | | | 16,649,179 | |
| | 80,027 | | | Nova Ltd.* | | | 16,672,825 | |
| | 862,250 | | | PDF Solutions, Inc.* | | | 27,316,080 | |
| | 296,423 | | | Veeco Instruments, Inc.* | | | 9,820,494 | |
| | | | | | | | |
| | | | 79,240,634 | |
| | | | | | | | |
33
| | |
| Wasatch Ultra Growth Fund (WAMCX / WGMCX) | | SEPTEMBER 30, 2024 |
Schedule of Investments (continued)
| | | | | | | | |
| Shares | | | | | Value | |
| | | | | | | |
| | |
| | | | Semiconductors 3.1% | | | |
| | 164,394 | | | Power Integrations, Inc. | | $ | 10,540,943 | |
| | 111,173 | | | SiTime Corp.* | | | 19,067,281 | |
| | | | | | | | |
| | | | 29,608,224 | |
| | | | | | | | |
| | |
| | | | Specialty Chemicals 2.0% | | | |
| | 109,769 | | | Balchem Corp. | | | 19,319,344 | |
| | | | | | | | |
| | |
| | | | Systems Software 6.6% | | | |
| | 76,041 | | | CyberArk Software Ltd.* | | | 22,174,316 | |
| | 552,550 | | | JFrog Ltd.* | | | 16,046,052 | |
| | 90,053 | | | Monday.com Ltd.* | | | 25,014,022 | |
| | | | | | | | |
| | | | 63,234,390 | |
| | | | | | | | |
| | |
| | | | Transaction & Payment Processing
Services 3.2% | | | |
| | 348,447 | | | Shift4 Payments, Inc., Class A* | | | 30,872,404 | |
| | | | | | | | |
| | |
| | | | Total Common Stocks
(cost $744,864,234) | | | 946,916,723 | |
| | | | | | | | |
| |
| | | | PREFERRED STOCKS 1.5% | |
| | |
| | | | Textiles 1.5% | | | |
| | 509,338 | | | Johnnie-O Holdings, Inc., Series A Pfd.* *** † ‡‡ | | | 13,915,114 | |
| | | | | | | | |
| | |
| | | | Total Preferred Stocks
(cost $15,000,004) | | | 13,915,114 | |
| | | | | | | | |
| | |
| | | | WARRANTS 0.1% | | | | |
| | |
| | | | Biotechnology 0.1% | | | |
| | 3,026,385 | | | Sangamo Therapeutics, Inc.,
expiring 9/26/2029* *** † ‡‡ | | | 938,180 | |
| | | | | | | | |
| | |
| | | | Total Warrants
(cost $626,686) | | | 938,180 | |
| | | | | | | | |
| | |
| | | | Total Investments
(cost $760,490,924) 99.6%§ | | | 961,770,017 | |
| | |
| | | | Other Assets less Liabilities 0.4% | | | 4,343,499 | |
| | | | | | | | |
| | |
| | | | Net Assets 100.0% | | $ | 966,113,516 | |
| | | | | | | | |
| |
| | | | | *Non-income producing. ***Security was fair valued under procedures adopted by the Board of Trustees using unobservable inputs as described in Note 12, as applicable. †Security purchased in a private placement transaction or under Rule 144A of the Securities Act of 1933 (see Note 9). The aggregate value of securities purchased in a private placement transaction or under Rule 144A of the Securities Act of 1933 at September 30, 2024 amounted to approximately $14,853,294 and represented 1.54% of net assets. ‡‡Affiliated company (see Note 8). §The aggregate amount of foreign securities fair valued pursuant to a systematic valuation model as a percent of net assets was 0.91%. ADR American Depositary Receipt. | |
| |
| | | | See Notes to Financial Statements. | |
At September 30, 2024, the Wasatch Ultra Growth Fund’s investments were in the following countries (unaudited):
| | | | | |
| Country | | % |
Germany | | | | 0.6 | |
Israel | | | | 6.6 | |
Netherlands | | | | 0.9 | |
Switzerland | | | | 2.0 | |
United Kingdom | | | | 1.2 | |
United States | | | | 88.7 | |
| | | | | |
TOTAL | | | | 100.0 | % |
| | | | | |
34
| | |
| Wasatch U.S. Select Fund (WAUSX / WGUSX) | | SEPTEMBER 30, 2024 |
Schedule of Investments
| | | | | | | | |
| Shares | | | | | Value | |
| | | | | | | |
| | |
| | | | COMMON STOCKS 98.4% | | | | |
| | |
| | | | Aerospace & Defense 3.7% | | | |
| | 4,810 | | | HEICO Corp., Class A | | $ | 980,086 | |
| | | | | | | | |
| | |
| | | | Application Software 22.4% | | | |
| | 2,614 | | | ANSYS, Inc.* | | | 832,899 | |
| | 25,967 | | | Clearwater Analytics Holdings, Inc., Class A* | | | 655,667 | |
| | 4,175 | | | Guidewire Software, Inc.* | | | 763,774 | |
| | 1,037 | | | HubSpot, Inc.* | | | 551,269 | |
| | 8,268 | | | Procore Technologies, Inc.* | | | 510,301 | |
| | 1,754 | | | Roper Technologies, Inc. | | | 975,996 | |
| | 1,072 | | | Tyler Technologies, Inc.* | | | 625,748 | |
| | 4,274 | | | Workday, Inc., Class A* | | | 1,044,608 | |
| | | | | | | | |
| | | | 5,960,262 | |
| | | | | | | | |
| | |
| | | | Asset Management & Custody Banks 3.1% | | | |
| | 4,947 | | | Hamilton Lane, Inc., Class A | | | 833,025 | |
| | | | | | | | |
| | |
| | | | Automotive Retail 2.5% | | | |
| | 15,813 | | | Valvoline, Inc.* | | | 661,774 | |
| | | | | | | | |
| | |
| | | | Building Products 2.1% | | | |
| | 8,216 | | | Trex Co., Inc.* | | | 547,021 | |
| | | | | | | | |
| | |
| | | | Cargo Ground Transportation 3.0% | | | |
| | 4,053 | | | Old Dominion Freight Line, Inc. | | | 805,088 | |
| | | | | | | | |
| | |
| | | | Distributors 2.9% | | | |
| | 2,056 | | | Pool Corp. | | | 774,701 | |
| | | | | | | | |
| | |
| | | | Diversified Support Services 3.6% | | | |
| | 18,269 | | | Copart, Inc.* | | | 957,296 | |
| | | | | | | | |
| | |
| | | | Electrical Components & Equipment 3.8% | | | |
| | 5,891 | | | AMETEK, Inc. | | | 1,011,544 | |
| | | | | | | | |
| | |
| | | | Electronic Components 2.2% | | | |
| | 9,096 | | | Amphenol Corp., Class A | | | 592,695 | |
| | | | | | | | |
| | |
| | | | Electronic Equipment & Instruments 2.6% | | | |
| | 3,857 | | | Novanta, Inc.* | | | 690,094 | |
| | | | | | | | |
| | |
| | | | Electronic Manufacturing Services 2.5% | | | |
| | 2,776 | | | Fabrinet* | | | 656,357 | |
| | | | | | | | |
| | |
| | | | Financial Exchanges & Data 5.4% | | | |
| | 2,289 | | | MarketAxess Holdings, Inc. | | | 586,442 | |
| | 2,664 | | | Morningstar, Inc. | | | 850,135 | |
| | | | | | | | |
| | | | 1,436,577 | |
| | | | | | | | |
| | |
| | | | Health Care Equipment 1.4% | | | |
| | 1,819 | | | Inspire Medical Systems, Inc.* | | | 383,900 | |
| | | | | | | | |
| | |
| | | | Health Care Facilities 3.3% | | | |
| | 6,075 | | | Ensign Group, Inc. | | | 873,706 | |
| | | | | | | | |
| | |
| | | | Home Improvement Retail 2.5% | | | |
| | 5,343 | | | Floor & Decor Holdings, Inc., Class A* | | | 663,440 | |
| | | | | | | | |
| | |
| | | | Human Resource & Employment
Services 2.6% | | | |
| | 4,147 | | | Paylocity Holding Corp.* | | | 684,131 | |
| | | | | | | | |
| | | | | | | | |
| Shares | | | | | Value | |
| | | | | | | |
| | |
| | | | Industrial Machinery & Supplies &
Components 3.0% | | | |
| | 2,656 | | | RBC Bearings, Inc.* | | $ | 795,153 | |
| | | | | | | | |
| | |
| | | | IT Consulting & Other Services 2.3% | | | |
| | 3,119 | | | Globant SA* | | | 617,999 | |
| | | | | | | | |
| | |
| | | | Life Sciences Tools & Services 5.1% | | | |
| | 2,820 | | | ICON PLC* | | | 810,214 | |
| | 1,680 | | | Medpace Holdings, Inc.* | | | 560,784 | |
| | | | | | | | |
| | | | 1,370,998 | |
| | | | | | | | |
| | |
| | | | Managed Health Care 4.0% | | | |
| | 12,986 | | | HealthEquity, Inc.* | | | 1,062,904 | |
| | | | | | | | |
| | |
| | | | Personal Care Products 3.0% | | | |
| | 13,123 | | | BellRing Brands, Inc.* | | | 796,829 | |
| | | | | | | | |
| | |
| | | | Semiconductors 2.5% | | | |
| | 715 | | | Monolithic Power Systems, Inc. | | | 661,018 | |
| | | | | | | | |
| | |
| | | | Specialty Chemicals 3.2% | | | |
| | 4,819 | | | Balchem Corp. | | | 848,144 | |
| | | | | | | | |
| | |
| | | | Transaction & Payment Processing
Services 5.7% | | | |
| | 7,870 | | | Block, Inc.* | | | 528,313 | |
| | 11,051 | | | Shift4 Payments, Inc., Class A* | | | 979,119 | |
| | | | | | | | |
| | | | 1,507,432 | |
| | | | | | | | |
| | |
| | | | Total Common Stocks
(cost $21,649,839) | | | 26,172,174 | |
| | | | | | | | |
| | |
| | | | Total Investments
(cost $21,649,839) 98.4% | | | 26,172,174 | |
| | |
| | | | Other Assets less Liabilities 1.6% | | | 418,675 | |
| | | | | | | | |
| | |
| | | | Net Assets 100.0% | | $ | 26,590,849 | |
| | | | | | | | |
| | |
| | | | *Non-income producing. | | | | |
| |
| | | | See Notes to Financial Statements. | |
At September 30, 2024, the Wasatch U.S. Select Fund’s investments were in the following countries (unaudited):
| | | | | |
| Country | | % |
Ireland | | | | 3.1 | |
United States | | | | 96.9 | |
| | | | | |
TOTAL | | | | 100.0 | % |
| | | | | |
35
| | |
| Wasatch-Hoisington U.S. Treasury Fund (WHOSX) | | SEPTEMBER 30, 2024 |
Schedule of Investments
| | | | | | | | |
Principal
Amount | | | | | Value | |
| | | | | | | |
| |
| | | | U.S. GOVERNMENT
OBLIGATIONS 98.8% | |
| $ | 55,300,000 | | | U.S. Treasury Bond, 1.25%, 5/15/50 | | $ | 29,542,297 | |
| | 47,700,000 | | | U.S. Treasury Bond, 1.375%, 8/15/50 | | | 26,236,863 | |
| | 72,200,000 | | | U.S. Treasury Bond, 1.875%, 11/15/51 | | | 44,899,375 | |
| | 160,000,000 | | | U.S. Treasury STRIPS Principal, 0.00%, 8/15/47 | | | 60,354,990 | |
| | 33,700,000 | | | U.S. Treasury STRIPS Principal, 2.00%, 8/15/51 | | | 10,932,914 | |
| | 35,200,000 | | | U.S. Treasury STRIPS Principal, 3.625%, 5/15/53 | | | 10,949,484 | |
| | | | | | | | |
| | |
| | | | Total U.S. Government
Obligations
(cost $204,749,595) | | | 182,915,923 | |
| | | | | | | | |
| | |
| | | | Total Investments
(cost $204,749,595) 98.8% | | | 182,915,923 | |
| | |
| | | | Other Assets less Liabilities 1.2% | | | 2,218,874 | |
| | | | | | | | |
| | |
| | | | Net Assets 100.0% | | $ | 185,134,797 | |
| | | | | | | | |
| |
| | | | See Notes to Financial Statements. | |
36
(This page intentionally left blank.)
37
Statements of Assets and Liabilities
| | | | | | | | | | | | | | | |
| | | Core
Growth
Fund | | Emerging
India
Fund | | Emerging
Markets
Select
Fund |
| | | | | | | | | | | | | | | |
Assets: | | | | | | | | | | | | | | | |
Investments, at cost | | | | | | | | | | | | | | | |
Unaffiliated issuers | | | $ | 3,224,835,523 | | | | $ | 445,049,167 | | | | $ | 348,678,649 | |
Affiliated issuers1 | | | | 52,636,852 | | | | | — | | | | | — | |
| | | | | | | | | | | | | | | |
| | | $ | 3,277,472,375 | | | | $ | 445,049,167 | | | | $ | 348,678,649 | |
| | | | | | | | | | | | | | | |
Investments, at market value | | | | | | | | | | | | | | | |
Unaffiliated issuers | | | $ | 4,747,988,860 | | | | $ | 760,217,887 | | | | $ | 455,856,443 | |
Affiliated issuers1 | | | | 53,777,392 | | | | | — | | | | | — | |
| | | | | | | | | | | | | | | |
| | | | 4,801,766,252 | | | | | 760,217,887 | | | | | 455,856,443 | |
Cash | | | | 49,060,121 | | | | | 1,865,652 | | | | | 8,180 | |
Foreign currency on deposit (cost of $0, $15,396, $1, $37,292, $3,218, $0, $1,305 and $10,818, respectively) | | | | — | | | | | 15,360 | | | | | 1 | |
Receivable for investment securities sold | | | | — | | | | | — | | | | | 10,292,174 | |
Capital shares receivable | | | | 2,464,882 | | | | | 108,122 | | | | | 109,881 | |
Interest and dividends receivable | | | | 461,373 | | | | | 380,832 | | | | | 329,851 | |
Receivable from Investment Advisor | | | | — | | | | | — | | | | | — | |
Prepaid expenses and other assets | | | | 129,146 | | | | | 29,135 | | | | | 20,339 | |
| | | | | | | | | | | | | | | |
Total Assets | | | | 4,853,881,774 | | | | | 762,616,988 | | | | | 466,616,869 | |
| | | | | | | | | | | | | | | |
Liabilities: | | | | | | | | | | | | | | | |
Payable for securities purchased | | | | — | | | | | — | | | | | — | |
Capital shares payable | | | | 2,149,739 | | | | | 164,594 | | | | | 418,214 | |
Dividends payable to shareholders | | | | — | | | | | — | | | | | — | |
Payable to Advisor | | | | 3,763,922 | | | | | 727,710 | | | | | 365,048 | |
Accrued fund administration fees | | | | 113,878 | | | | | 17,742 | | | | | 13,288 | |
Accrued expenses and other liabilities | | | | 626,393 | | | | | 215,869 | | | | | 130,859 | |
Foreign capital gains taxes payable | | | | — | | | | | 38,776,160 | | | | | 6,748,923 | |
Line of credit payable | | | | — | | | | | — | | | | | 7,891,573 | |
| | | | | | | | | | | | | | | |
Total Liabilities | | | | 6,653,932 | | | | | 39,902,075 | | | | | 15,567,905 | |
| | | | | | | | | | | | | | | |
| | | |
Commitments and contingent liabilities | | | | | | | | | | | | | | | |
Net Assets | | | $ | 4,847,227,842 | | | | $ | 722,714,913 | | | | $ | 451,048,964 | |
| | | | | | | | | | | | | | | |
Net Assets Consist of: | | | | | | | | | | | | | | | |
Capital stock | | | $ | 494,438 | | | | $ | 971,723 | | | | $ | 242,291 | |
Paid-in-capital in excess of par | | | | 3,018,529,236 | | | | | 393,825,139 | | | | | 473,551,775 | |
Distributable earnings (accumulated loss) | | | | 1,828,204,168 | | | | | 327,918,051 | | | | | (22,745,102 | ) |
| | | | | | | | | | | | | | | |
Net Assets | | | $ | 4,847,227,842 | | | | $ | 722,714,913 | | | | $ | 451,048,964 | |
| | | | | | | | | | | | | | | |
Net Assets | | | | | | | | | | | | | | | |
Investor Class | | | | 2,112,156,207 | | | | | 318,081,593 | | | | | 63,062,026 | |
Institutional Class | | | | 2,735,071,635 | | | | | 404,633,320 | | | | | 387,986,938 | |
| | | |
Capital Stock Issued and Outstanding (Unlimited number of
shares authorized, $0.01 par value) | | | | | | | | | | | | | | | |
Investor Class | | | | 21,787,590 | | | | | 43,145,303 | | | | | 3,470,290 | |
Institutional Class | | | | 27,656,257 | | | | | 54,027,036 | | | | | 20,758,819 | |
| | | |
Net Asset Value, Redemption Price and Offering Price Per Share | | | | | | | | | | | | | | | |
Investor Class | | | $ | 96.94 | | | | $ | 7.37 | | | | $ | 18.17 | |
| | | | | | | | | | | | | | | |
Institutional Class | | | $ | 98.90 | | | | $ | 7.49 | | | | $ | 18.69 | |
| | | | | | | | | | | | | | | |
| 1 | See Note 8 for information on affiliated issuers. |
See Notes to Financial Statements.
38
| | | | | | | | | | | | | | | | | | | | | | | |
Emerging
Markets
Small Cap
Fund | | Frontier
Emerging
Small Countries
Fund | | Global
Opportunities
Fund | | Global
Select
Fund | | Global
Value
Fund |
| | | | | | | | | | | | | | | | | | | | | | | | |
| | | | | | | | | | | | | | | | | | | | | | | | |
| | | | | | | | | | | | | | | | | | | | | | | | |
| | $ | 196,220,132 | | | | $ | 28,639,816 | | | | $ | 135,493,426 | | | | $ | 11,143,121 | | | | $ | 99,666,710 | |
| | | — | | | | | — | | | | | — | | | | | — | | | | | — | |
| | | | | | | | | | | | | | | | | | | | | | | | |
| | $ | 196,220,132 | | | | $ | 28,639,816 | | | | $ | 135,493,426 | | | | $ | 11,143,121 | | | | $ | 99,666,710 | |
| | | | | | | | | | | | | | | | | | | | | | | | |
| | | | | | | | | | | | | | | | | | | | | | | | |
| | $ | 359,901,383 | | | | $ | 40,104,319 | | | | $ | 205,244,099 | | | | $ | 14,980,787 | | | | $ | 129,044,713 | |
| | | — | | | | | — | | | | | — | | | | | — | | | | | — | |
| | | | | | | | | | | | | | | | | | | | | | | | |
| | | 359,901,383 | | | | | 40,104,319 | | | | | 205,244,099 | | | | | 14,980,787 | | | | | 129,044,713 | |
| | | 6,064,057 | | | | | 386,124 | | | | | 4,768,731 | | | | | 221,150 | | | | | 2,412,076 | |
| | | 37,292 | | | | | 3,219 | | | | | — | | | | | 1,314 | | | | | 10,983 | |
| | | 473,181 | | | | | 185,436 | | | | | — | | | | | — | | | | | 558,298 | |
| | | 30,920 | | | | | 3,978 | | | | | 16,145 | | | | | — | | | | | 5,511 | |
| | | 306,159 | | | | | 31,866 | | | | | 134,425 | | | | | 13,164 | | | | | 553,105 | |
| | | — | | | | | — | | | | | — | | | | | 364 | | | | | — | |
| | | 27,251 | | | | | 13,071 | | | | | 12,756 | | | | | 24,876 | | | | | 14,135 | |
| | | | | | | | | | | | | | | | | | | | | | | | |
| | | 366,840,243 | | | | | 40,728,013 | | | | | 210,176,156 | | | | | 15,241,655 | | | | | 132,598,821 | |
| | | | | | | | | | | | | | | | | | | | | | | | |
| | | | | | | | | | | | | | | | | | | | | | | | |
| | | 1,622,058 | | | | | 317,684 | | | | | — | | | | | — | | | | | 104,629 | |
| | | 127,063 | | | | | 171 | | | | | 106,296 | | | | | — | | | | | 191,531 | |
| | | — | | | | | — | | | | | — | | | | | — | | | | | 25,111 | |
| | | 461,373 | | | | | 55,383 | | | | | 202,885 | | | | | — | | | | | 90,445 | |
| | | 10,482 | | | | | 1,963 | | | | | 5,986 | | | | | — | | | | | 4,158 | |
| | | 183,171 | | | | | 72,515 | | | | | 83,585 | | | | | 45,474 | | | | | 151,643 | |
| | | 9,722,483 | | | | | 681,424 | | | | | 1,389,758 | | | | | 50,759 | | | | | — | |
| | | — | | | | | — | | | | | — | | | | | — | | | | | — | |
| | | | | | | | | | | | | | | | | | | | | | | | |
| | | 12,126,630 | | | | | 1,129,140 | | | | | 1,788,510 | | | | | 96,233 | | | | | 567,517 | |
| | | | | | | | | | | | | | | | | | | | | | | | |
| | | | |
| | | | | | | | | | | | | | | | | | | | | | | | |
| | $ | 354,713,613 | | | | $ | 39,598,873 | | | | $ | 208,387,646 | | | | $ | 15,145,422 | | | | $ | 132,031,304 | |
| | | | | | | | | | | | | | | | | | | | | | | | |
| | | | | | | | | | | | | | | | | | | | | | | | |
| | $ | 1,075,893 | | | | $ | 105,170 | | | | $ | 434,440 | | | | $ | 11,887 | | | | $ | 130,168 | |
| | | 191,016,549 | | | | | 128,507,971 | | | | | 127,759,916 | | | | | 13,543,325 | | | | | 255,236,556 | |
| | | 162,621,171 | | | | | (89,014,268 | ) | | | | 80,193,290 | | | | | 1,590,210 | | | | | (123,335,420 | ) |
| | | | | | | | | | | | | | | | | | | | | | | | |
| | $ | 354,713,613 | | | | $ | 39,598,873 | | | | $ | 208,387,646 | | | | $ | 15,145,422 | | | | $ | 132,031,304 | |
| | | | | | | | | | | | | | | | | | | | | | | | |
| | | | | | | | | | | | | | | | | | | | | | | | |
| | | 135,893,462 | | | | | 31,993,931 | | | | | 126,784,012 | | | | | 4,098,223 | | | | | 115,168,807 | |
| | | 218,820,151 | | | | | 7,604,942 | | | | | 81,603,634 | | | | | 11,047,199 | | | | | 16,862,497 | |
| | | | |
| | | | | | | | | | | | | | | | | | | | | | | | |
| | | 41,597,968 | | | | | 8,530,237 | | | | | 26,559,829 | | | | | 326,327 | | | | | 11,351,617 | |
| | | 65,991,367 | | | | | 1,986,779 | | | | | 16,884,160 | | | | | 862,412 | | | | | 1,665,169 | |
| | | | |
| | | | | | | | | | | | | | | | | | | | | | | | |
| | $ | 3.27 | | | | $ | 3.75 | | | | $ | 4.77 | | | | $ | 12.56 | | | | $ | 10.15 | |
| | | | | | | | | | | | | | | | | | | | | | | | |
| | $ | 3.32 | | | | $ | 3.83 | | | | $ | 4.83 | | | | $ | 12.81 | | | | $ | 10.13 | |
| | | | | | | | | | | | | | | | | | | | | | | | |
39
Statements of Assets and Liabilities (continued)
| | | | | | | | | | | | | | | |
| | | Greater
China
Fund | | International
Growth
Fund | | International
Opportunities
Fund |
| | | | | | | | | | | | | | | |
Assets: | | | | | | | | | | | | | | | |
Investments, at cost | | | | | | | | | | | | | | | |
Unaffiliated issuers | | | $ | 5,935,759 | | | | $ | 176,002,130 | | | | $ | 87,307,197 | |
Affiliated issuers1 | | | | — | | | | | — | | | | | — | |
| | | | | | | | | | | | | | | |
| | | $ | 5,935,759 | | | | $ | 176,002,130 | | | | $ | 87,307,197 | |
| | | | | | | | | | | | | | | |
Investments, at market value | | | | | | | | | | | | | | | |
Unaffiliated issuers | | | $ | 4,451,128 | | | | $ | 291,537,899 | | | | $ | 147,177,682 | |
Affiliated issuers1 | | | | — | | | | | — | | | | | — | |
| | | | | | | | | | | | | | | |
| | | | 4,451,128 | | | | | 291,537,899 | | | | | 147,177,682 | |
Cash | | | | 153,568 | | | | | 7,120,010 | | | | | 512,007 | |
Foreign currency on deposit (cost of $3,550, $62,059, $16,704, $490, $0, $0, $0 and $0, respectively) | | | | 3,552 | | | | | 61,872 | | | | | 16,646 | |
Receivable for investment securities sold | | | | — | | | | | 559,293 | | | | | 24,205 | |
Capital shares receivable | | | | 30,300 | | | | | 24,559 | | | | | 31,575 | |
Interest and dividends receivable | | | | 4,064 | | | | | 815,082 | | | | | 506,480 | |
Receivable from Investment Advisor | | | | 9,094 | | | | | — | | | | | — | |
Prepaid expenses and other assets | | | | 8,541 | | | | | 24,785 | | | | | 16,961 | |
| | | | | | | | | | | | | | | |
Total Assets | | | | 4,660,247 | | | | | 300,143,500 | | | | | 148,285,556 | |
| | | | | | | | | | | | | | | |
Liabilities: | | | | | | | | | | | | | | | |
Securities sold short, at value (proceeds of $0, $0, $0, $0, $28,924,420, $0, $0 and $0, respectively) | | | | — | | | | | — | | | | | — | |
Payable for securities purchased | | | | 33,018 | | | | | — | | | | | — | |
Capital shares payable | | | | — | | | | | 125,523 | | | | | 299,242 | |
Payable to Advisor | | | | — | | | | | 304,461 | | | | | 181,918 | |
Accrued fund administration fees | | | | 1,157 | | | | | 10,942 | | | | | 9,112 | |
Accrued expenses and other liabilities | | | | 41,669 | | | | | 155,271 | | | | | 158,179 | |
Foreign capital gains taxes payable | | | | — | | | | | 1,475,557 | | | | | 1,262,702 | |
Dividends payable on securities sold short | | | | — | | | | | — | | | | | — | |
| | | | | | | | | | | | | | | |
Total Liabilities | | | | 75,844 | | | | | 2,071,754 | | | | | 1,911,153 | |
| | | | | | | | | | | | | | | |
| | | |
Commitments and contingent liabilities | | | | | | | | | | | | | | | |
Net Assets | | | $ | 4,584,403 | | | | $ | 298,071,746 | | | | $ | 146,374,403 | |
| | | | | | | | | | | | | | | |
Net Assets Consist of: | | | | | | | | | | | | | | | |
Capital stock | | | $ | 9,056 | | | | $ | 112,333 | | | | $ | 442,965 | |
Paid-in-capital in excess of par | | | | 10,950,811 | | | | | 148,537,335 | | | | | 106,363,321 | |
Distributable earnings (accumulated loss) | | | | (6,375,464 | ) | | | | 149,422,078 | | | | | 39,568,117 | |
| | | | | | | | | | | | | | | |
Net Assets | | | $ | 4,584,403 | | | | $ | 298,071,746 | | | | $ | 146,374,403 | |
| | | | | | | | | | | | | | | |
Net Assets | | | | | | | | | | | | | | | |
Investor Class | | | | 2,060,392 | | | | | 211,932,303 | | | | | 51,744,739 | |
Institutional Class | | | | 2,524,011 | | | | | 86,139,443 | | | | | 94,629,664 | |
| | | |
Capital Stock Issued and Outstanding (Unlimited number of
shares authorized, $0.01 par value) | | | | | | | | | | | | | | | |
Investor Class | | | | 406,676 | | | | | 8,011,416 | | | | | 15,830,519 | |
Institutional Class | | | | 498,921 | | | | | 3,221,903 | | | | | 28,466,019 | |
| | | |
Net Asset Value, Redemption Price and Offering Price Per Share | | | | | | | | | | | | | | | |
Investor Class | | | $ | 5.07 | | | | $ | 26.45 | | | | $ | 3.27 | |
| | | | | | | | | | | | | | | |
Institutional Class | | | $ | 5.06 | | | | $ | 26.74 | | | | $ | 3.32 | |
| | | | | | | | | | | | | | | |
| 1 | See Note 8 for information on affiliated issuers. |
See Notes to Financial Statements.
40
| | | | | | | | | | | | | | | | | | | | | | | |
International
Select
Fund | | Long/Short
Alpha
Fund | | Micro
Cap
Fund | | Micro Cap
Value
Fund | | Small Cap
Growth
Fund |
| | | | | | | | | | | | | | | | | | | | | | | | |
| | | | | | | | | | | | | | | | | | | | | | | | |
| | | | | | | | | | | | | | | | | | | | | | | | |
| | $ | 3,057,438 | | | | $ | 69,294,367 | | | | $ | 505,008,108 | | | | $ | 204,271,781 | | | | $ | 1,317,791,696 | |
| | | — | | | | | — | | | | | 9,579,660 | | | | | 3,772,796 | | | | | 17,999,987 | |
| | | | | | | | | | | | | | | | | | | | | | | | |
| | $ | 3,057,438 | | | | $ | 69,294,367 | | | | $ | 514,587,768 | | | | $ | 208,044,577 | | | | $ | 1,335,791,683 | |
| | | | | | | | | | | | | | | | | | | | | | | | |
| | | | | | | | | | | | | | | | | | | | | | | | |
| | $ | 3,841,030 | | | | $ | 86,667,093 | | | | $ | 653,555,574 | | | | $ | 311,429,390 | | | | $ | 2,121,775,799 | |
| | | — | | | | | — | | | | | 15,589,420 | | | | | 3,092,771 | | | | | 16,698,121 | |
| | | | | | | | | | | | | | | | | | | | | | | | |
| | | 3,841,030 | | | | | 86,667,093 | | | | | 669,144,994 | | | | | 314,522,161 | | | | | 2,138,473,920 | |
| | | 73,535 | | | | | 20,736,495 | | | | | 13,436,615 | | | | | 14,583,208 | | | | | 18,643,224 | |
| | | 488 | | | | | — | | | | | — | | | | | — | | | | | — | |
| | | 122,496 | | | | | — | | | | | — | | | | | 639,456 | | | | | — | |
| | | — | | | | | 5,786 | | | | | 370,512 | | | | | 66,196 | | | | | 525,147 | |
| | | 10,118 | | | | | 26,990 | | | | | 47,284 | | | | | 137,618 | | | | | 31,812 | |
| | | 9,982 | | | | | — | | | | | — | | | | | — | | | | | — | |
| | | 24,334 | | | | | 26,639 | | | | | 27,793 | | | | | 22,857 | | | | | 63,200 | |
| | | | | | | | | | | | | | | | | | | | | | | | |
| | | 4,081,983 | | | | | 107,463,003 | | | | | 683,027,198 | | | | | 329,971,496 | | | | | 2,157,737,303 | |
| | | | | | | | | | | | | | | | | | | | | | | | |
| | | | | | | | | | | | | | | | | | | | | | | | |
| | | — | | | | | 28,014,984 | | | | | — | | | | | — | | | | | — | |
| | | 57,937 | | | | | 405,105 | | | | | — | | | | | 489,806 | | | | | — | |
| | | 17,446 | | | | | 16,331 | | | | | 143,582 | | | | | 122,664 | | | | | 5,162,705 | |
| | | — | | | | | 79,129 | | | | | 817,566 | | | | | 394,170 | | | | | 1,711,506 | |
| | | 930 | | | | | 1,844 | | | | | 16,623 | | | | | 8,369 | | | | | 55,907 | |
| | | 38,335 | | | | | 67,248 | | | | | 154,044 | | | | | 108,443 | | | | | 315,715 | |
| | | — | | | | | — | | | | | — | | | | | 578,520 | | | | | — | |
| | | — | | | | | 8,248 | | | | | — | | | | | — | | | | | — | |
| | | | | | | | | | | | | | | | | | | | | | | | |
| | | 114,648 | | | | | 28,592,889 | | | | | 1,131,815 | | | | | 1,701,972 | | | | | 7,245,833 | |
| | | | | | | | | | | | | | | | | | | | | | | | |
| | | | |
| | | | | | | | | | | | | | | | | | | | | | | | |
| | $ | 3,967,335 | | | | $ | 78,870,114 | | | | $ | 681,895,383 | | | | $ | 328,269,524 | | | | $ | 2,150,491,470 | |
| | | | | | | | | | | | | | | | | | | | | | | | |
| | | | | | | | | | | | | | | | | | | | | | | | |
| | $ | 3,140 | | | | $ | 51,235 | | | | $ | 846,185 | | | | $ | 829,839 | | | | $ | 536,688 | |
| | | 4,217,399 | | | | | 61,229,640 | | | | | 632,513,557 | | | | | 243,973,918 | | | | | 1,641,496,374 | |
| | | (253,204 | ) | | | | 17,589,239 | | | | | 48,535,641 | | | | | 83,465,767 | | | | | 508,458,408 | |
| | | | | | | | | | | | | | | | | | | | | | | | |
| | $ | 3,967,335 | | | | $ | 78,870,114 | | | | $ | 681,895,383 | | | | $ | 328,269,524 | | | | $ | 2,150,491,470 | |
| | | | | | | | | | | | | | | | | | | | | | | | |
| | | | | | | | | | | | | | | | | | | | | | | | |
| | | 2,626,895 | | | | | 44,488,402 | | | | | 591,440,180 | | | | | 265,555,264 | | | | | 869,767,829 | |
| | | 1,340,440 | | | | | 34,381,712 | | | | | 90,455,203 | | | | | 62,714,260 | | | | | 1,280,723,641 | |
| | | | |
| |
|
|
| | | | | | | | | | | | | | | | | | | | |
| | | 209,378 | | | | | 2,896,638 | | | | | 73,405,874 | | | | | 67,231,860 | | | | | 21,954,014 | |
| | | 104,618 | | | | | 2,226,828 | | | | | 11,212,594 | | | | | 15,752,002 | | | | | 31,714,759 | |
| | | | |
| | | | | | | | | | | | | | | | | | | | | | | | |
| | $ | 12.55 | | | | $ | 15.36 | | | | $ | 8.06 | | | | $ | 3.95 | | | | $ | 39.62 | |
| | | | | | | | | | | | | | | | | | | | | | | | |
| | $ | 12.81 | | | | $ | 15.44 | | | | $ | 8.07 | | | | $ | 3.98 | | | | $ | 40.38 | |
| | | | | | | | | | | | | | | | | | | | | | | | |
41
Statements of Assets and Liabilities (continued)
| | | | | | | | | | | | | | | |
| | | Small Cap
Value
Fund | | Ultra
Growth
Fund | | U.S.
Select
Fund |
| | | | | | | | | | | | | | | |
Assets: | | | | | | | | | | | | | | | |
Investments, at cost | | | | | | | | | | | | | | | |
Unaffiliated issuers | | | $ | 1,218,389,778 | | | | $ | 701,887,010 | | | | $ | 21,649,839 | |
Affiliated issuers1 | | | | — | | | | | 58,603,914 | | | | | — | |
| | | | | | | | | | | | | | | |
| | | $ | 1,218,389,778 | | | | $ | 760,490,924 | | | | $ | 21,649,839 | |
| | | | | | | | | | | | | | | |
Investments, at market value | | | | | | | | | | | | | | | |
Unaffiliated issuers | | | $ | 1,631,842,404 | | | | $ | 937,412,277 | | | | $ | 26,172,174 | |
Affiliated issuers1 | | | | — | | | | | 24,357,740 | | | | | — | |
| | | | | | | | | | | | | | | |
| | | | 1,631,842,404 | | | | | 961,770,017 | | | | | 26,172,174 | |
Cash | | | | 32,007,276 | | | | | 1,343,787 | | | | | 421,712 | |
Receivable for investment securities sold | | | | — | | | | | 8,196,270 | | | | | — | |
Capital shares receivable | | | | 2,980,166 | | | | | 268,282 | | | | | 18,150 | |
Interest and dividends receivable | | | | 462,619 | | | | | 73,783 | | | | | 5,183 | |
Prepaid expenses and other assets | | | | 51,006 | | | | | 41,169 | | | | | 19,203 | |
| | | | | | | | | | | | | | | |
Total Assets | | | | 1,667,343,471 | | | | | 971,693,308 | | | | | 26,636,422 | |
| | | | | | | | | | | | | | | |
Liabilities: | | | | | | | | | | | | | | | |
Payable for securities purchased | | | | 1,804,430 | | | | | 2,906,483 | | | | | — | |
Capital shares payable | | | | 1,128,366 | | | | | 1,599,152 | | | | | — | |
Dividends payable to shareholders | | | | — | | | | | — | | | | | — | |
Payable to Advisor | | | | 1,323,638 | | | | | 783,850 | | | | | 4,389 | |
Accrued fund administration fees | | | | 37,934 | | | | | 26,159 | | | | | 694 | |
Accrued expenses and other liabilities | | | | 255,276 | | | | | 264,148 | | | | | 40,490 | |
| | | | | | | | | | | | | | | |
Total Liabilities | | | | 4,549,644 | | | | | 5,579,792 | | | | | 45,573 | |
| | | | | | | | | | | | | | | |
| | | |
Commitments and contingent liabilities | | | | | | | | | | | | | | | |
Net Assets | | | $ | 1,662,793,827 | | | | $ | 966,113,516 | | | | $ | 26,590,849 | |
| | | | | | | | | | | | | | | |
Net Assets Consist of: | | | | | | | | | | | | | | | |
Capital stock | | | $ | 1,406,460 | | | | $ | 283,322 | | | | $ | 17,327 | |
Paid-in-capital in excess of par | | | | 1,043,171,779 | | | | | 847,123,091 | | | | | 21,443,603 | |
Distributable earnings (accumulated loss) | | | | 618,215,588 | | | | | 118,707,103 | | | | | 5,129,919 | |
| | | | | | | | | | | | | | | |
Net Assets | | | $ | 1,662,793,827 | | | | $ | 966,113,516 | | | | $ | 26,590,849 | |
| | | | | | | | | | | | | | | |
Net Assets | | | | | | | | | | | | | | | |
Investor Class | | | | 607,696,671 | | | | | 642,151,704 | | | | | 9,829,741 | |
Institutional Class | | | | 1,055,097,156 | | | | | 323,961,812 | | | | | 16,761,108 | |
| | | |
Capital Stock Issued and Outstanding (Unlimited number of
shares authorized, $0.01 par value) | | | | | | | | | | | | | | | |
Investor Class | | | | 51,796,399 | | | | | 18,862,692 | | | | | 641,600 | |
Institutional Class | | | | 88,849,631 | | | | | 9,469,527 | | | | | 1,091,149 | |
| | | |
Net Asset Value, Redemption Price and Offering Price Per Share | | | | | | | | | | | | | | | |
Investor Class | | | $ | 11.73 | | | | $ | 34.04 | | | | $ | 15.32 | |
| | | | | | | | | | | | | | | |
Institutional Class | | | $ | 11.88 | | | | $ | 34.21 | | | | $ | 15.36 | |
| | | | | | | | | | | | | | | |
| 1 | See Note 8 for information on affiliated issuers. |
See Notes to Financial Statements.
42
| | | |
U.S.
Treasury
Fund |
| | | | |
| | | | |
| | | | |
| | $ | 204,749,595 | |
| | | — | |
| | | | |
| | $ | 204,749,595 | |
| | | | |
| | | | |
| | $ | 182,915,923 | |
| | | — | |
| | | | |
| | | 182,915,923 | |
| | | 1,877,187 | |
| | | — | |
| | | 33,071 | |
| | | 856,199 | |
| | | 15,408 | |
| | | | |
| | | 185,697,788 | |
| | | | |
| | | | |
| | | — | |
| | | 321,610 | |
| | | 82,718 | |
| | | 77,846 | |
| | | 4,652 | |
| | | 76,165 | |
| | | | |
| | | 562,991 | |
| | | | |
|
| | | | |
| | $ | 185,134,797 | |
| | | | |
| | | | |
| | $ | 157,020 | |
| | | 369,607,622 | |
| | | (184,629,845 | ) |
| | | | |
| | $ | 185,134,797 | |
| | | | |
| | | | |
| | | 185,134,797 | |
| | | — | |
|
| |
|
|
|
| | | 15,701,974 | |
| | | — | |
|
| | | | |
| | $ | 11.79 | |
| | | | |
| | $ | — | |
| | | | |
43
Statements of Operations
| | | | | | | | | | | | | | | |
| | | Core
Growth
Fund | | Emerging
India
Fund | | Emerging
Markets
Select
Fund |
| | | | | | | | | | | | | | | |
Investment Income: | |
Interest | | | $ | 2,740,321 | | | | $ | 790,993 | | | | $ | 273,653 | |
Dividends1 | | | | | | | | | | | | | | | |
Unaffiliated issuers | | | | 20,223,640 | | | | | 2,334,393 | | | | | 3,372,479 | |
Affiliated issuers | | | | 1,556,849 | | | | | — | | | | | — | |
| | | | | | | | | | | | | | | |
Total investment income | | | | 24,520,810 | | | | | 3,125,386 | | | | | 3,646,132 | |
| | | | | | | | | | | | | | | |
Expenses: | |
Investment advisory fees | | | | 40,492,781 | | | | | 7,617,376 | | | | | 4,468,496 | |
Shareholder servicing fees — Investor Class | | | | 2,059,733 | | | | | 358,004 | | | | | 131,034 | |
Shareholder servicing fees — Institutional Class | | | | 47,204 | | | | | 26,551 | | | | | 8,417 | |
Fund administration fees | | | | 427,316 | | | | | 70,573 | | | | | 54,018 | |
Fund accounting fees | | | | 300,929 | | | | | 55,989 | | | | | 44,194 | |
Reports to shareholders — Investor Class | | | | 180,660 | | | | | 34,373 | | | | | 11,819 | |
Reports to shareholders — Institutional Class | | | | 195,651 | | | | | — | | | | | 25,832 | |
Custody fees | | | | 52,991 | | | | | 288,379 | | | | | 128,384 | |
Federal and state registration fees — Investor Class | | | | 56,352 | | | | | 26,672 | | | | | 19,966 | |
Federal and state registration fees — Institutional Class | | | | 74,193 | | | | | 24,224 | | | | | 28,433 | |
Legal fees | | | | 229,115 | | | | | 35,598 | | | | | 27,292 | |
Trustees’ fees | | | | 467,439 | | | | | 75,483 | | | | | 58,919 | |
Interest | | | | 76,429 | | | | | 16,814 | | | | | 59,385 | |
Audit fees | | | | 42,764 | | | | | 42,764 | | | | | 42,764 | |
Other expenses | | | | 187,870 | | | | | 59,139 | | | | | 44,446 | |
| | | | | | | | | | | | | | | |
Total expenses before reimbursement | | | | 44,891,427 | | | | | 8,731,939 | | | | | 5,153,399 | |
Reimbursement of expenses by Advisor | | | | (149,636 | ) | | | | — | | | | | — | |
| | | | | | | | | | | | | | | |
Net Expenses | | | | 44,741,791 | | | | | 8,731,939 | | | | | 5,153,399 | |
| | | | | | | | | | | | | | | |
Net Investment Income (Loss) | | | | (20,220,981 | ) | | | | (5,606,553 | ) | | | | (1,507,267 | ) |
| | | | | | | | | | | | | | | |
Realized Gain (Loss): | |
Investments sold | | | | 368,457,766 | | | | | 78,257,321 | | | | | (64,457,237 | ) |
Foreign currency transactions | | | | — | | | | | (469,713 | ) | | | | (269,075 | ) |
Foreign capital gains taxes | | | | — | | | | | (8,763,536 | ) | | | | (618,044 | ) |
| | | | | | | | | | | | | | | |
Net realized gain (loss) | | | | 368,457,766 | | | | | 69,024,072 | | | | | (65,344,356 | ) |
| | | | | | | | | | | | | | | |
Change in Unrealized Appreciation (Depreciation): | |
Investments | | | | 755,351,079 | | | | | 126,204,255 | | | | | 164,517,962 | |
Investments in affiliates | | | | 1,140,540 | | | | | — | | | | | — | |
Foreign currency translations | | | | — | | | | | (2,688 | ) | | | | 723 | |
Deferred foreign capital gains taxes | | | | — | | | | | (23,788,144 | ) | | | | (5,706,830 | ) |
| | | | | | | | | | | | | | | |
Net change in unrealized appreciation | | | | 756,491,619 | | | | | 102,413,423 | | | | | 158,811,855 | |
| | | | | | | | | | | | | | | |
Net gain on investments | | | | 1,124,949,385 | | | | | 171,437,495 | | | | | 93,467,499 | |
| | | | | | | | | | | | | | | |
Net Increase in Net Assets Resulting from Operations | | | $ | 1,104,728,404 | | | | $ | 165,830,942 | | | | $ | 91,960,232 | |
| | | | | | | | | | | | | | | |
| 1 | Net of $0, $616,493, $468,574, $580,314, $46,105, $98,683, $7,962, and $394,548 in foreign withholding taxes, respectively. |
See Notes to Financial Statements.
44
| | |
| | | YEAR ENDED SEPTEMBER 30, 2024 |
| | | | | | | | | | | | | | | | | | | | | | | |
Emerging
Markets
Small Cap
Fund | | Frontier
Emerging Small
Countries
Fund | | Global
Opportunities
Fund | | Global
Select
Fund | | Global
Value
Fund |
| | | | | | | | | | | | | | | | | | | | | | | | |
| | | | | | | | | | | | | | | | | | | | | | | | |
| | $ | 125,185 | | | | $ | 22,240 | | | | $ | 84,347 | | | | $ | 4,101 | | | | $ | 133,804 | |
| | | | | | | | | | | | | | | | | | | | | | | | |
| | | 3,863,587 | | | | | 437,761 | | | | | 965,988 | | | | | 80,096 | | | | | 5,481,377 | |
| | | — | | | | | — | | | | | — | | | | | — | | | | | — | |
| | | | | | | | | | | | | | | | | | | | | | | | |
| | | 3,988,772 | | | | | 460,001 | | | | | 1,050,335 | | | | | 84,197 | | | | | 5,615,181 | |
| | | | | | | | | | | | | | | | | | | | | | | | |
| | | | | | | | | | | | | | | | | | | | | | | | |
| | | 5,607,905 | | | | | 603,317 | | | | | 2,447,106 | | | | | 127,656 | | | | | 1,259,596 | |
| | | 239,402 | | | | | 68,231 | | | | | 144,104 | | | | | 20,482 | | | | | 154,755 | |
| | | 3,166 | | | | | 4,028 | | | | | 3,633 | | | | | 6,782 | | | | | 3,128 | |
| | | 44,501 | | | | | 9,790 | | | | | 26,297 | | | | | 5,323 | | | | | 18,305 | |
| | | 36,135 | | | | | 15,044 | | | | | 26,576 | | | | | 13,516 | | | | | 23,695 | |
| | | 22,782 | | | | | 9,585 | | | | | 16,059 | | | | | 11,936 | | | | | 21,227 | |
| | | 20,058 | | | | | 2,486 | | | | | 11,759 | | | | | 3,369 | | | | | 5,888 | |
| | | 180,368 | | | | | 59,563 | | | | | 42,143 | | | | | 6,070 | | | | | 23,712 | |
| | | 21,098 | | | | | 16,914 | | | | | 13,456 | | | | | 20,545 | | | | | 17,873 | |
| | | 22,952 | | | | | 16,155 | | | | | 18,821 | | | | | 16,893 | | | | | 23,554 | |
| | | 20,685 | | | | | 2,319 | | | | | 11,991 | | | | | 1,070 | | | | | 8,809 | |
| | | 44,764 | | | | | 4,698 | | | | | 25,230 | | | | | 1,971 | | | | | 19,102 | |
| | | 31,734 | | | | | 2,150 | | | | | 4,994 | | | | | 1,872 | | | | | 7,865 | |
| | | 42,764 | | | | | 42,764 | | | | | 42,764 | | | | | 42,765 | | | | | 42,764 | |
| | | 53,076 | | | | | 8,566 | | | | | 21,829 | | | | | 10,584 | | | | | 13,503 | |
| | | | | | | | | | | | | | | | | | | | | | | | |
| | | 6,391,390 | | | | | 865,610 | | | | | 2,856,762 | | | | | 290,834 | | | | | 1,643,776 | |
| | | (56,361 | ) | | | | (88,644 | ) | | | | (37,084 | ) | | | | (128,457 | ) | | | | (139,745 | ) |
| | | | | | | | | | | | | | | | | | | | | | | | |
| | | 6,335,029 | | | | | 776,966 | | | | | 2,819,678 | | | | | 162,377 | | | | | 1,504,031 | |
| | | | | | | | | | | | | | | | | | | | | | | | |
| | | (2,346,257 | ) | | | | (316,965 | ) | | | | (1,769,343 | ) | | | | (78,180 | ) | | | | 4,111,150 | |
| | | | | | | | | | | | | | | | | | | | | | | | |
| | | | | | | | | | | | | | | | | | | | | | | | |
| | | 13,710,283 | | | | | 4,234,774 | | | | | 14,972,901 | | | | | (383,578 | ) | | | | 7,743,329 | |
| | | (131,402 | ) | | | | (7,533 | ) | | | | (69,033 | ) | | | | (141 | ) | | | | (34,980 | ) |
| | | (1,864,630 | ) | | | | (7,337 | ) | | | | (371,210 | ) | | | | — | | | | | — | |
| | | | | | | | | | | | | | | | | | | | | | | | |
| | | 11,714,251 | | | | | 4,219,904 | | | | | 14,532,658 | | | | | (383,719 | ) | | | | 7,708,349 | |
| | | | | | | | | | | | | | | | | | | | | | | | |
| | | | | | | | | | | | | | | | | | | | | | | | |
| | | 63,589,871 | | | | | 6,218,478 | | | | | 35,752,393 | | | | | 3,499,532 | | | | | 15,986,818 | |
| | | — | | | | | — | | | | | — | | | | | — | | | | | — | |
| | | 4,786 | | | | | 168 | | | | | 1,337 | | | | | 386 | | | | | 18,394 | |
| | | (6,549,527 | ) | | | | (153,153 | ) | | | | (625,013 | ) | | | | (18,776 | ) | | | | — | |
| | | | | | | | | | | | | | | | | | | | | | | | |
| | | 57,045,130 | | | | | 6,065,493 | | | | | 35,128,717 | | | | | 3,481,142 | | | | | 16,005,212 | |
| | | | | | | | | | | | | | | | | | | | | | | | |
| | | 68,759,381 | | | | | 10,285,397 | | | | | 49,661,375 | | | | | 3,097,423 | | | | | 23,713,561 | |
| | | | | | | | | | | | | | | | | | | | | | | | |
| | $ | 66,413,124 | | | | $ | 9,968,432 | | | | $ | 47,892,032 | | | | $ | 3,019,243 | | | | $ | 27,824,711 | |
| | | | | | | | | | | | | | | | | | | | | | | | |
45
Statements of Operations (continued)
| | | | | | | | | | | | | | | |
| | | Greater
China
Fund | | International
Growth
Fund | | International
Opportunities
Fund |
| | | | | | | | | | | | | | | |
Investment Income: | |
Interest | | | $ | 9,738 | | | | $ | 567,832 | | | | $ | 160,969 | |
Dividends1 | | | | | | | | | | | | | | | |
Unaffiliated issuers | | | | 72,417 | | | | | 4,538,746 | | | | | 3,432,077 | |
| | | | | | | | | | | | | | | |
Total investment income | | | | 82,155 | | | | | 5,106,578 | | | | | 3,593,046 | |
| | | | | | | | | | | | | | | |
Expenses: | |
Investment advisory fees | | | | 40,165 | | | | | 4,630,420 | | | | | 4,634,182 | |
Shareholder servicing fees — Investor Class | | | | 22,906 | | | | | 242,957 | | | | | 62,447 | |
Shareholder servicing fees — Institutional Class | | | | 4,033 | | | | | 6,133 | | | | | 237,698 | |
Fund administration fees | | | | 8,046 | | | | | 49,793 | | | | | 41,522 | |
Fund accounting fees | | | | 12,671 | | | | | 40,356 | | | | | 31,894 | |
Reports to shareholders — Investor Class | | | | 12,698 | | | | | 21,546 | | | | | 4,782 | |
Reports to shareholders — Institutional Class | | | | 2,488 | | | | | — | | | | | 40,243 | |
Custody fees | | | | 2,396 | | | | | 102,524 | | | | | 81,619 | |
Federal and state registration fees — Investor Class | | | | 15,739 | | | | | 20,778 | | | | | 16,797 | |
Federal and state registration fees — Institutional Class | | | | 15,813 | | | | | 20,908 | | | | | 22,266 | |
Legal fees | | | | 392 | | | | | 24,207 | | | | | 16,897 | |
Trustees’ fees | | | | 541 | | | | | 55,320 | | | | | 37,189 | |
Dividends on securities sold short | | | | — | | | | | — | | | | | — | |
Interest | | | | — | | | | | 50,643 | | | | | 34,798 | |
Audit fees | | | | 42,764 | | | | | 42,764 | | | | | 42,764 | |
Other expenses | | | | 9,398 | | | | | 46,931 | | | | | 53,588 | |
| | | | | | | | | | | | | | | |
Total expenses before reimbursement | | | | 190,050 | | | | | 5,355,280 | | | | | 5,358,686 | |
Reimbursement of expenses by Advisor | | | | (135,659 | ) | | | | (25,352 | ) | | | | (119,262 | ) |
| | | | | | | | | | | | | | | |
Net Expenses | | | | 54,391 | | | | | 5,329,928 | | | | | 5,239,424 | |
| | | | | | | | | | | | | | | |
Net Investment Income (Loss) | | | | 27,764 | | | | | (223,350 | ) | | | | (1,646,378 | ) |
| | | | | | | | | | | | | | | |
Realized Gain (Loss): | |
Investments sold | | | | (746,034 | ) | | | | 43,299,388 | | | | | 24,389,410 | |
Investments in affiliates | | | | — | | | | | — | | | | | — | |
Foreign currency transactions | | | | (770 | ) | | | | (131,005 | ) | | | | (10,387 | ) |
Net realized loss on short positions | | | | — | | | | | — | | | | | — | |
Foreign capital gains taxes | | | | — | | | | | (925,197 | ) | | | | (1,236,637 | ) |
| | | | | | | | | | | | | | | |
Net realized gain (loss) | | | | (746,804 | ) | | | | 42,243,186 | | | | | 23,142,386 | |
| | | | | | | | | | | | | | | |
Change in Unrealized Appreciation (Depreciation): | | | | | | | | | | | | | | | |
Investments | | | | 924,396 | | | | | 29,403,028 | | | | | 25,976,334 | |
Investments in affiliates | | | | — | | | | | — | | | | | — | |
Foreign currency translations | | | | 35 | | | | | 36,521 | | | | | 18,314 | |
Short positions | | | | — | | | | | — | | | | | — | |
Deferred foreign capital gains taxes | | | | — | | | | | (90,702 | ) | | | | (95,081 | ) |
| | | | | | | | | | | | | | | |
Net change in unrealized appreciation | | | | 924,431 | | | | | 29,348,847 | | | | | 25,899,567 | |
| | | | | | | | | | | | | | | |
Net gain on investments | | | | 177,627 | | | | | 71,592,033 | | | | | 49,041,953 | |
| | | | | | | | | | | | | | | |
Net Increase in Net Assets Resulting from Operations | | | $ | 205,391 | | | | $ | 71,368,683 | | | | $ | 47,395,575 | |
| | | | | | | | | | | | | | | |
| 1 | Net of $4,788, $530,743, $402,203, $6,975, $0, $2,440, $16,786 and $0 in foreign withholding taxes, respectively. |
See Notes to Financial Statements.
46
| | |
| | | YEAR ENDED SEPTEMBER 30, 2024 |
| | | | | | | | | | | | | | | | | | | | | | | |
International
Select
Fund | | Long/Short
Alpha
Fund | | Micro
Cap
Fund | | Micro Cap
Value
Fund | | Small Cap
Growth
Fund |
| | | | | | | | | | | | | | | | | | | | | | | | |
| | | | | | | | | | | | | | | | | | | | | | | | |
| | $ | 5,714 | | | | $ | 689,568 | | | | $ | 436,725 | | | | $ | 372,362 | | | | $ | 1,211,695 | |
| | | | | | | | | | | | | | | | | | | | | | | | |
| | | 30,032 | | | | | 392,901 | | | | | 1,233,256 | | | | | 3,340,307 | | | | | 2,863,777 | |
| | | | | | | | | | | | | | | | | | | | | | | | |
| | | 35,746 | | | | | 1,082,469 | | | | | 1,669,981 | | | | | 3,712,669 | | | | | 4,075,472 | |
| | | | | | | | | | | | | | | | | | | | | | | | |
| | | | | | | | | | | | | | | | | | | | | | | | |
| | | 32,144 | | | | | 727,086 | | | | | 9,345,940 | | | | | 4,483,104 | | | | | 21,518,465 | |
| | | 21,450 | | | | | 44,833 | | | | | 486,264 | | | | | 295,856 | | | | | 806,715 | |
| | | 4,841 | | | | | 6,052 | | | | | 2,716 | | | | | 2,977 | | | | | 24,394 | |
| | | 5,506 | | | | | 6,370 | | | | | 63,836 | | | | | 33,008 | | | | | 224,975 | |
| | | 12,621 | | | | | 17,520 | | | | | 56,180 | | | | | 33,427 | | | | | 165,744 | |
| | | 12,762 | | | | | 16,910 | | | | | 41,886 | | | | | 30,762 | | | | | 49,137 | |
| | | 2,365 | | | | | — | | | | | 5,870 | | | | | 3,901 | | | | | 151,950 | |
| | | 4,816 | | | | | 4,971 | | | | | 13,972 | | | | | 24,925 | | | | | 29,332 | |
| | | 16,788 | | | | | 17,397 | | | | | 22,581 | | | | | 22,064 | | | | | 31,963 | |
| | | 16,674 | | | | | 17,827 | | | | | 17,472 | | | | | 17,610 | | | | | 53,992 | |
| | | 400 | | | | | 3,073 | | | | | 36,630 | | | | | 17,613 | | | | | 130,379 | |
| | | 537 | | | | | 5,725 | | | | | 77,728 | | | | | 37,367 | | | | | 279,269 | |
| | | — | | | | | 144,092 | | | | | — | | | | | — | | | | | — | |
| | | — | | | | | 192,981 | | | | | 12,554 | | | | | 7,543 | | | | | 78,988 | |
| | | 42,765 | | | | | 42,764 | | | | | 42,764 | | | | | 42,764 | | | | | 42,764 | |
| | | 5,947 | | | | | 7,783 | | | | | 44,224 | | | | | 26,992 | | | | | 120,998 | |
| | | | | | | | | | | | | | | | | | | | | | | | |
| | | 179,616 | | | | | 1,255,384 | | | | | 10,270,617 | | | | | 5,079,913 | | | | | 23,709,065 | |
| | | (133,313 | ) | | | | (567 | ) | | | | — | | | | | (14,792 | ) | | | | (181,407 | ) |
| | | | | | | | | | | | | | | | | | | | | | | | |
| | | 46,303 | | | | | 1,254,817 | | | | | 10,270,617 | | | | | 5,065,121 | | | | | 23,527,658 | |
| | | | | | | | | | | | | | | | | | | | | | | | |
| | | (10,557 | ) | | | | (172,348 | ) | | | | (8,600,636 | ) | | | | (1,352,452 | ) | | | | (19,452,186 | ) |
| | | | | | | | | | | | | | | | | | | | | | | | |
| | | | | | | | | | | | | | | | | | | | | | | | |
| | | (9,345 | ) | | | | 674,487 | | | | | 50,655,450 | | | | | 25,149,248 | | | | | (11,567,701 | ) |
| | | — | | | | | — | | | | | (6,184 | ) | | | | (320,484 | ) | | | | — | |
| | | (550 | ) | | | | — | | | | | (923 | ) | | | | 10,745 | | | | | — | |
| | | — | | | | | (986,116 | ) | | | | — | | | | | — | | | | | — | |
| | | — | | | | | — | | | | | — | | | | | (4,166 | ) | | | | — | |
| | | | | | | | | | | | | | | | | | | | | | | | |
| | | (9,895 | ) | | | | (311,629 | ) | | | | 50,648,343 | | | | | 24,835,343 | | | | | (11,567,701 | ) |
| | | | | | | | | | | | | | | | | | | | | | | | |
| | | | | | | | | | | | | | | | | | | | | | | | |
| | | 830,316 | | | | | 17,340,746 | | | | | 127,214,883 | | | | | 62,444,518 | | | | | 440,042,907 | |
| | | — | | | | | — | | | | | 6,009,760 | | | | | (326,119 | ) | | | | 30,511,921 | |
| | | 849 | | | | | — | | | | | 33 | | | | | 1,099 | | | | | — | |
| | | — | | | | | (2,153,079 | ) | | | | — | | | | | — | | | | | — | |
| | | — | | | | | — | | | | | — | | | | | (578,520 | ) | | | | — | |
| | | | | | | | | | | | | | | | | | | | | | | | |
| | | 831,165 | | | | | 15,187,667 | | | | | 133,224,676 | | | | | 61,540,978 | | | | | 470,554,828 | |
| | | | | | | | | | | | | | | | | | | | | | | | |
| | | 821,270 | | | | | 14,876,038 | | | | | 183,873,019 | | | | | 86,376,321 | | | | | 458,987,127 | |
| | | | | | | | | | | | | | | | | | | | | | | | |
| | $ | 810,713 | | | | $ | 14,703,690 | | | | $ | 175,272,383 | | | | $ | 85,023,869 | | | | $ | 439,534,941 | |
| | | | | | | | | | | | | | | | | | | | | | | | |
47
Statements of Operations (continued)
| | | | | | | | | | | | | | | |
| | | Small Cap
Value
Fund | | Ultra
Growth
Fund | | U.S.
Select
Fund |
| | | | | | | | | | | | | | | |
Investment Income: | |
Interest | | | $ | 1,092,824 | | | | $ | 221,681 | | | | $ | 14,793 | |
Dividends1 | | | | | | | | | | | | | | | |
Unaffiliated issuers | | | | 15,701,161 | | | | | 2,786,179 | | | | | 60,244 | |
| | | | | | | | | | | | | | | |
Total investment income | | | | 16,793,985 | | | | | 3,007,860 | | | | | 75,037 | |
| | | | | | | | | | | | | | | |
Expenses: | |
Investment advisory fees | | | | 14,263,159 | | | | | 10,599,527 | | | | | 166,182 | |
Shareholder servicing fees — Investor Class | | | | 585,687 | | | | | 1,057,675 | | | | | 29,312 | |
Shareholder servicing fees — Institutional Class | | | | 13,400 | | | | | 4,246 | | | | | 3,354 | |
Fund administration fees | | | | 142,612 | | | | | 107,010 | | | | | 2,724 | |
Fund accounting fees | | | | 109,431 | | | | | 86,602 | | | | | 14,075 | |
Reports to shareholders — Investor Class | | | | 77,293 | | | | | 76,524 | | | | | 10,335 | |
Reports to shareholders — Institutional Class | | | | 32,672 | | | | | 41,597 | | | | | 4,515 | |
Custody fees | | | | 23,522 | | | | | 23,508 | | | | | 3,315 | |
Federal and state registration fees — Investor Class | | | | 41,916 | | | | | 29,641 | | | | | 16,398 | |
Federal and state registration fees — Institutional Class | | | | 43,878 | | | | | 24,329 | | | | | 17,573 | |
Legal fees | | | | 82,025 | | | | | 66,180 | | | | | 1,375 | |
Trustees’ fees | | | | 172,774 | | | | | 146,528 | | | | | 2,265 | |
Interest | | | | 90,242 | | | | | 77,129 | | | | | 1,211 | |
Audit fees | | | | 42,764 | | | | | 42,764 | | | | | 42,764 | |
Other expenses | | | | 77,547 | | | | | 77,378 | | | | | 2,817 | |
| | | | | | | | | | | | | | | |
Total expenses before reimbursement | | | | 15,798,922 | | | | | 12,460,638 | | | | | 318,215 | |
Reimbursement of expenses by Advisor | | | | (53,509 | ) | | | | (79,513 | ) | | | | (116,481 | ) |
| | | | | | | | | | | | | | | |
Net Expenses | | | | 15,745,413 | | | | | 12,381,125 | | | | | 201,734 | |
| | | | | | | | | | | | | | | |
Net Investment Income (Loss) | | | | 1,048,572 | | | | | (9,373,265 | ) | | | | (126,697 | ) |
| | | | | | | | | | | | | | | |
Realized Gain (Loss): | |
Investments sold | | | | 224,280,302 | | | | | 55,893,943 | | | | | 930,009 | |
Investments in affiliates | | | | — | | | | | (5,971,207 | ) | | | | — | |
Foreign currency transactions | | | | — | | | | | (5,214 | ) | | | | — | |
| | | | | | | | | | | | | | | |
Net realized gain (loss) | | | | 224,280,302 | | | | | 49,917,522 | | | | | 930,009 | |
| | | | | | | | | | | | | | | |
Change in Unrealized Appreciation (Depreciation): | | | | | | | | | | | | | | | |
Investments | | | | 177,777,367 | | | | | 192,608,058 | | | | | 3,601,209 | |
Investments in affiliates | | | | — | | | | | 30,544,725 | | | | | — | |
| | | | | | | | | | | | | | | |
Net change in unrealized appreciation | | | | 177,777,367 | | | | | 223,152,783 | | | | | 3,601,209 | |
| | | | | | | | | | | | | | | |
Net gain on investments | | | | 402,057,669 | | | | | 273,070,305 | | | | | 4,531,218 | |
| | | | | | | | | | | | | | | |
Net Increase in Net Assets Resulting from Operations | | | $ | 403,106,241 | | | | $ | 263,697,040 | | | | $ | 4,404,521 | |
| | | | | | | | | | | | | | | |
| 1 | Net of $0, $28,307, $0 and $0 in foreign withholding taxes, respectively. |
See Notes to Financial Statements.
48
| | |
| | | YEAR ENDED SEPTEMBER 30, 2024 |
| | | |
U.S.
Treasury
Fund |
| | | | |
| | | | |
| | $ | 7,753,389 | |
| | | | |
| | | — | |
| | | | |
| | | 7,753,389 | |
| | | | |
| | | | |
| | | 963,676 | |
| | | 229,105 | |
| | | — | |
| | | 18,215 | |
| | | 19,068 | |
| | | 28,174 | |
| | | — | |
| | | 3,356 | |
| | | 35,402 | |
| | | — | |
| | | 12,212 | |
| | | 27,867 | |
| | | 5,055 | |
| | | 42,764 | |
| | | 15,847 | |
| | | | |
| | | 1,400,741 | |
| | | — | |
| | | | |
| | | 1,400,741 | |
| | | | |
| | | 6,352,648 | |
| | | | |
| | | | |
| | | (84,009,114 | ) |
| | | — | |
| | | — | |
| | | | |
| | | (84,009,114 | ) |
| | | | |
| | | | |
| | | 104,219,264 | |
| | | — | |
| | | | |
| | | 104,219,264 | |
| | | | |
| | | 20,210,150 | |
| | | | |
| | $ | 26,562,798 | |
| | | | |
49
Statements of Changes in Net Assets
| | | | | | | | | | | | | | | | | | | | |
| | | Core Growth
Fund | | Emerging India
Fund |
| | | Year Ended
September 30, 2024 | | Year Ended
September 30, 2023 | | Year Ended
September 30, 2024 | | Year Ended
September 30, 2023 |
| | | | | | | | | | | | | | | | | | | | |
Operations: | | | | | | | | | | | | | | | | | | | | |
Net investment income (loss) | | | $ | (20,220,981 | ) | | | $ | (14,228,770 | ) | | | $ | (5,606,553 | ) | | | $ | (4,173,349 | ) |
Net realized gain (loss) on investments, foreign currency translations and foreign capital gains taxes | | | | 368,457,766 | | | | | (37,483,618 | ) | | | | 69,024,072 | | | | | 17,288,830 | |
Net realized loss on short positions | | | | — | | | | | — | | | | | — | | | | | — | |
Change in unrealized appreciation (depreciation) on investments, foreign currency translations and deferred foreign capital gains taxes | | | | 756,491,619 | | | | | 599,302,291 | | | | | 102,413,423 | | | | | 8,278,286 | |
| | | | | | | | | | | | | | | | | | | | |
Net increase (decrease) in net assets resulting from operations | | | | 1,104,728,404 | | | | | 547,589,903 | | | | | 165,830,942 | | | | | 21,393,767 | |
| | | | | | | | | | | | | | | | | | | | |
|
Distributions to shareholders from distributable earnings | |
Investor Class | | | | — | | | | | (10,015,380 | ) | | | | (11,365,507 | ) | | | | (2,530,535 | ) |
Institutional Class | | | | — | | | | | (8,797,567 | ) | | | | (12,771,820 | ) | | | | (3,141,875 | ) |
|
Capital share transactions: | |
Investor Class | | | | | | | | | | | | | | | | | | | | |
Shares sold | | | | 409,355,131 | | | | | 205,760,122 | | | | | 72,872,140 | | | | | 70,967,363 | |
Shares issued to holders in reinvestment of dividends | | | | — | | | | | 9,663,297 | | | | | 11,221,774 | | | | | 2,518,483 | |
Shares redeemed | | | | (398,175,281 | ) | | | | (254,416,109 | ) | | | | (83,986,788 | ) | | | | (55,755,585 | ) |
Redemption fees | | | | 61,144 | | | | | 31,821 | | | | | 25,143 | | | | | 58,675 | |
| | | | | | | | | | | | | | | | | | | | |
Net increase (decrease) | | | | 11,240,994 | | | | | (38,960,869 | ) | | | | 132,269 | | | | | 17,788,936 | |
| | | | | | | | | | | | | | | | | | | | |
Institutional Class | | | | | | | | | | | | | | | | | | | | |
Shares sold | | | | 954,587,176 | | | | | 478,434,862 | | | | | 96,686,841 | | | | | 63,515,860 | |
Shares issued to holders in reinvestment of dividends | | | | — | | | | | 8,404,896 | | | | | 11,967,778 | | | | | 2,783,843 | |
Shares redeemed | | | | (442,294,984 | ) | | | | (389,845,088 | ) | | | | (66,808,177 | ) | | | | (102,365,815 | ) |
Redemption fees | | | | 15,160 | | | | | 17,880 | | | | | 1,058 | | | | | 4,896 | |
| | | | | | | | | | | | | | | | | | | | |
Net increase (decrease) | | | | 512,307,352 | | | | | 97,012,550 | | | | | 41,847,500 | | | | | (36,061,216 | ) |
| | | | | | | | | | | | | | | | | | | | |
Total increase (decrease) in net assets | | | | 1,628,276,750 | | | | | 586,828,637 | | | | | 183,673,384 | | | | | (2,550,923 | ) |
|
Net assets: | |
Beginning of period | | | | 3,218,951,092 | | | | | 2,632,122,455 | | | | | 539,041,529 | | | | | 541,592,452 | |
| | | | | | | | | | | | | | | | | | | | |
End of period | | | $ | 4,847,227,842 | | | | $ | 3,218,951,092 | | | | $ | 722,714,913 | | | | $ | 539,041,529 | |
| | | | | | | | | | | | | | | | | | | | |
|
Capital share transactions — shares: | |
Investor Class | | | | | | | | | | | | | | | | | | | | |
Shares sold | | | | 4,870,007 | | | | | 2,896,074 | | | | | 11,604,335 | | | | | 12,661,811 | |
Shares issued to holders in reinvestment of dividends | | | | — | | | | | 146,814 | | | | | 1,842,656 | | | | | 454,600 | |
Shares redeemed | | | | (4,720,438 | ) | | | | (3,629,021 | ) | | | | (13,392,218 | ) | | | | (10,197,681 | ) |
| | | | | | | | | | | | | | | | | | | | |
Net increase (decrease) in shares outstanding | | | | 149,569 | | | | | (586,133 | ) | | | | 54,773 | | | | | 2,918,730 | |
| | | | | | | | | | | | | | | | | | | | |
Institutional Class | | | | | | | | | | | | | | | | | | | | |
Shares sold | | | | 11,022,746 | | | | | 6,582,658 | | | | | 14,815,897 | | | | | 11,006,780 | |
Shares issued to holders in reinvestment of dividends | | | | — | | | | | 125,409 | | | | | 1,936,534 | | | | | 496,229 | |
Shares redeemed | | | | (5,018,951 | ) | | | | (5,586,198 | ) | | | | (10,360,460 | ) | | | | (18,528,379 | ) |
| | | | | | | | | | | | | | | | | | | | |
Net increase (decrease) in shares outstanding | | | | 6,003,795 | | | | | 1,121,869 | | | | | 6,391,971 | | | | | (7,025,370 | ) |
| | | | | | | | | | | | | | | | | | | | |
See Notes to Financial Statements.
50
| | | | | | | | | | | | | | | | | | | | | | | | | | | | |
Emerging Markets Select
Fund | | Emerging Markets Small Cap
Fund | | Frontier Emerging Small Countries
Fund |
Year Ended
September 30, 2024 | | Year Ended
September 30, 2023 | | Year Ended
September 30, 2024 | | Year Ended
September 30, 2023 | | Year Ended
September 30, 2024 | | Year Ended
September 30, 2023 |
| | | | | | | | | | | | | | | | | | | | | | | | | | | | | |
| | | | | | | | | | | | | | | | | | | | | | | | | | | | | |
| | $ | (1,507,267 | ) | | | $ | (407,315 | ) | | | $ | (2,346,257 | ) | | | $ | (2,161,746 | ) | | | $ | (316,965 | ) | | | $ | (317,752 | ) |
| | | (65,344,356 | ) | | | | (12,920,311 | ) | | | | 11,714,251 | | | | | (4,446,610 | ) | | | | 4,219,904 | | | | | (2,404,339 | ) |
| | | — | | | | | — | | | | | — | | | | | — | | | | | — | | | | | — | |
| | | 158,811,855 | | | | | 47,728,781 | | | | | 57,045,130 | | | | | 51,072,192 | | | | | 6,065,493 | | | | | 8,205,014 | |
| | | | | | | | | | | | | | | | | | | | | | | | | | | | | |
| | | 91,960,232 | | | | | 34,401,155 | | | | | 66,413,124 | | | | | 44,463,836 | | | | | 9,968,432 | | | | | 5,482,923 | |
| | | | | | | | | | | | | | | | | | | | | | | | | | | | | |
| | | | | |
| | | | | | | | | | | | | | | | | | | | | | | | | | | | | |
| | | — | | | | | — | | | | | — | | | | | (4,637,409 | ) | | | | — | | | | | — | |
| | | — | | | | | — | | | | | — | | | | | (6,561,216 | ) | | | | — | | | | | — | |
| | | | | |
| | | | | | | | | | | | | | | | | | | | | | | | | | | | | |
| | | | | | | | | | | | | | | | | | | | | | | | | | | | | |
| | | 17,605,556 | | | | | 27,199,931 | | | | | 15,807,054 | | | | | 12,204,101 | | | | | 2,106,230 | | | | | 2,419,428 | |
| | | — | | | | | — | | | | | — | | | | | 4,508,533 | | | | | — | | | | | — | |
| | | (26,625,603 | ) | | | | (25,526,941 | ) | | | | (36,736,394 | ) | | | | (50,862,341 | ) | | | | (9,479,446 | ) | | | | (6,268,489 | ) |
| | | 2,480 | | | | | 14,784 | | | | | 665 | | | | | 1,919 | | | | | 1,975 | | | | | 763 | |
| | | | | | | | | | | | | | | | | | | | | | | | | | | | | |
| | | (9,017,567 | ) | | | | 1,687,774 | | | | | (20,928,675 | ) | | | | (34,147,788 | ) | | | | (7,371,241 | ) | | | | (3,848,298 | ) |
| | | | | | | | | | | | | | | | | | | | | | | | | | | | | |
| | | | | | | | | | | | | | | | | | | | | | | | | | | | | |
| | | 129,828,878 | | | | | 177,284,054 | | | | | 29,843,844 | | | | | 44,585,663 | | | | | 2,822,794 | | | | | 524,186 | |
| | | — | | | | | — | | | | | — | | | | | 6,409,243 | | | | | — | | | | | — | |
| | | (214,010,886 | ) | | | | (104,582,899 | ) | | | | (56,472,410 | ) | | | | (92,152,531 | ) | | | | (828,988 | ) | | | | (7,698,689 | ) |
| | | 4,865 | | | | | 9,515 | | | | | 740 | | | | | 189 | | | | | 237 | | | | | — | |
| | | | | | | | | | | | | | | | | | | | | | | | | | | | | |
| | | (84,177,143 | ) | | | | 72,710,670 | | | | | (26,627,826 | ) | | | | (41,157,436 | ) | | | | 1,994,043 | | | | | (7,174,503 | ) |
| | | | | | | | | | | | | | | | | | | | | | | | | | | | | |
| | | (1,234,478 | ) | | | | 108,799,599 | | | | | 18,856,623 | | | | | (42,040,013 | ) | | | | 4,591,234 | | | | | (5,539,878 | ) |
| | | | | |
| | | | | | | | | | | | | | | | | | | | | | | | | | | | | |
| | | 452,283,442 | | | | | 343,483,843 | | | | | 335,856,990 | | | | | 377,897,003 | | | | | 35,007,639 | | | | | 40,547,517 | |
| | | | | | | | | | | | | | | | | | | | | | | | | | | | | |
| | $ | 451,048,964 | | | | $ | 452,283,442 | | | | $ | 354,713,613 | | | | $ | 335,856,990 | | | | $ | 39,598,873 | | | | $ | 35,007,639 | |
| | | | | | | | | | | | | | | | | | | | | | | | | | | | | |
| | | | | |
| | | | | | | | | | | | | | | | | | | | | | | | | | | | | |
| | | | | | | | | | | | | | | | | | | | | | | | | | | | | |
| | | 1,094,036 | | | | | 1,822,227 | | | | | 5,220,365 | | | | | 4,593,516 | | | | | 639,993 | | | | | 887,606 | |
| | | — | | | | | — | | | | | — | | | | | 1,747,493 | | | | | — | | | | | — | |
| | | (1,660,578 | ) | | | | (1,725,509 | ) | | | | (12,633,615 | ) | | | | (19,331,821 | ) | | | | (2,955,723 | ) | | | | (2,363,897 | ) |
| | | | | | | | | | | | | | | | | | | | | | | | | | | | | |
| | | (566,542 | ) | | | | 96,718 | | | | | (7,413,250 | ) | | | | (12,990,812 | ) | | | | (2,315,730 | ) | | | | (1,476,291 | ) |
| | | | | | | | | | | | | | | | | | | | | | | | | | | | | |
| | | | | | | | | | | | | | | | | | | | | | | | | | | | | |
| | | 7,923,787 | | | | | 11,715,079 | | | | | 10,080,000 | | | | | 16,640,314 | | | | | 859,971 | | | | | 182,614 | |
| | | — | | | | | — | | | | | — | | | | | 2,455,649 | | | | | — | | | | | — | |
| | | (13,159,886 | ) | | | | (7,015,055 | ) | | | | (18,940,524 | ) | | | | (34,198,393 | ) | | | | (257,924 | ) | | | | (3,003,418 | ) |
| | | | | | | | | | | | | | | | | | | | | | | | | | | | | |
| | | (5,236,099 | ) | | | | 4,700,024 | | | | | (8,860,524 | ) | | | | (15,102,430 | ) | | | | 602,047 | | | | | (2,820,804 | ) |
| | | | | | | | | | | | | | | | | | | | | | | | | | | | | |
51
Statements of Changes in Net Assets (continued)
| | | | | | | | | | | | | | | | | | | | |
| | | Global Opportunities
Fund | | Global Select
Fund |
| | | Year Ended
September 30, 2024 | | Year Ended
September 30, 2023 | | Year Ended
September 30, 2024 | | Year Ended
September 30, 2023 |
| | | | | | | | | | | | | | | | | | | | |
Operations: | | | | | | | | | | | | | | | | | | | | |
Net investment income (loss) | | | $ | (1,769,343 | ) | | | $ | (1,599,068 | ) | | | $ | (78,180 | ) | | | $ | (43,283 | ) |
Net realized gain (loss) on investments, foreign currency translations and foreign capital gains taxes | | | | 14,532,658 | | | | | (860,699 | ) | | | | (383,719 | ) | | | | (239,898 | ) |
Net realized loss on short positions | | | | — | | | | | — | | | | | — | | | | | — | |
Change in unrealized appreciation (depreciation) on investments, foreign currency translations and deferred foreign capital gains taxes | | | | 35,128,717 | | | | | 22,727,128 | | | | | 3,481,142 | | | | | 2,502,340 | |
| | | | | | | | | | | | | | | | | | | | |
Net increase (decrease) in net assets resulting from operations | | | | 47,892,032 | | | | | 20,267,361 | | | | | 3,019,243 | | | | | 2,219,159 | |
| | | | | | | | | | | | | | | | | | | | |
|
Distributions to shareholders from distributable earnings | |
Investor Class | | | | — | | | | | (2,469,318 | ) | | | | — | | | | | — | |
Institutional Class | | | | — | | | | | (1,256,428 | ) | | | | — | | | | | — | |
|
Capital share transactions: | |
Investor Class | | | | | | | | | | | | | | | | | | | | |
Shares sold | | | | 8,915,951 | | | | | 15,177,039 | | | | | 281,767 | | | | | 742,409 | |
Shares issued to holders in reinvestment of dividends | | | | — | | | | | 2,451,806 | | | | | — | | | | | — | |
Shares redeemed | | | | (28,445,065 | ) | | | | (17,931,633 | ) | | | | (1,669,206 | ) | | | | (657,559 | ) |
Redemption fees | | | | 1,144 | | | | | 16,218 | | | | | 151 | | | | | 44 | |
| | | | | | | | | | | | | | | | | | | | |
Net increase (decrease) | | | | (19,527,970 | ) | | | | (286,570 | ) | | | | (1,387,288 | ) | | | | 84,894 | |
| | | | | | | | | | | | | | | | | | | | |
Institutional Class | | | | | | | | | | | | | | | | | | | | |
Shares sold | | | | 22,536,310 | | | | | 16,220,644 | | | | | 267,572 | | | | | 1,442,045 | |
Shares issued to holders in reinvestment of dividends | | | | — | | | | | 1,232,291 | | | | | — | | | | | — | |
Shares redeemed | | | | (29,282,727 | ) | | | | (9,258,774 | ) | | | | (1,266,441 | ) | | | | (1,941,141 | ) |
Redemption fees | | | | 70 | | | | | 7,159 | | | | | — | | | | | — | |
| | | | | | | | | | | | | | | | | | | | |
Net increase (decrease) | | | | (6,746,347 | ) | | | | 8,201,320 | | | | | (998,869 | ) | | | | (499,096 | ) |
| | | | | | | | | | | | | | | | | | | | |
Total increase (decrease) in net assets | | | | 21,617,715 | | | | | 24,456,365 | | | | | 633,086 | | | | | 1,804,957 | |
|
Net assets: | |
Beginning of period | | | | 186,769,931 | | | | | 162,313,566 | | | | | 14,512,336 | | | | | 12,707,379 | |
| | | | | | | | | | | | | | | | | | | | |
End of period | | | $ | 208,387,646 | | | | $ | 186,769,931 | | | | $ | 15,145,422 | | | | $ | 14,512,336 | |
| | | | | | | | | | | | | | | | | | | | |
|
Capital share transactions — shares: | |
Investor Class | | | | | | | | | | | | | | | | | | | | |
Shares sold | | | | 2,144,745 | | | | | 3,976,976 | | | | | 25,340 | | | | | 71,179 | |
Shares issued to holders in reinvestment of dividends | | | | — | | | | | 681,057 | | | | | — | | | | | — | |
Shares redeemed | | | | (7,006,417 | ) | | | | (4,819,099 | ) | | | | (149,246 | ) | | | | (66,153 | ) |
| | | | | | | | | | | | | | | | | | | | |
Net increase (decrease) in shares outstanding | | | | (4,861,672 | ) | | | | (161,066 | ) | | | | (123,906 | ) | | | | 5,026 | |
| | | | | | | | | | | | | | | | | | | | |
Institutional Class | | | | | | | | | | | | | | | | | | | | |
Shares sold | | | | 5,324,025 | | | | | 4,268,507 | | | | | 23,099 | | | | | 135,077 | |
Shares issued to holders in reinvestment of dividends | | | | — | | | | | 338,542 | | | | | — | | | | | — | |
Shares redeemed | | | | (6,720,824 | ) | | | | (2,481,754 | ) | | | | (109,558 | ) | | | | (187,359 | ) |
| | | | | | | | | | | | | | | | | | | | |
Net increase (decrease) in shares outstanding | | | | (1,396,799 | ) | | | | 2,125,295 | | | | | (86,459 | ) | | | | (52,282 | ) |
| | | | | | | | | | | | | | | | | | | | |
See Notes to Financial Statements.
52
| | | | | | | | | | | | | | | | | | | | | | | | | | | | |
Global Value
Fund | | Greater China
Fund | | International Growth
Fund |
Year Ended
September 30, 2024 | | Year Ended
September 30, 2023 | | Year Ended
September 30, 2024 | | Year Ended
September 30, 2023 | | Year Ended
September 30, 2024 | | Year Ended
September 30, 2023 |
| | | | | | | | | | | | | | | | | | | | | | | | | | | | | |
| | | | | | | | | | | | | | | | | | | | | | | | | | | | | |
| | $ | 4,111,150 | | | | $ | 4,098,242 | | | | $ | 27,764 | | | | $ | (11,855 | ) | | | $ | (223,350 | ) | | | $ | 663,600 | |
| | | 7,708,349 | | | | | 1,253,797 | | | | | (746,804 | ) | | | | (866,240 | ) | | | | 42,243,186 | | | | | 8,973,171 | |
| | | — | | | | | — | | | | | — | | | | | — | | | | | — | | | | | — | |
| | | 16,005,212 | | | | | 13,375,794 | | | | | 924,431 | | | | | 22,225 | | | | | 29,348,847 | | | | | 45,406,451 | |
| | | | | | | | | | | | | | | | | | | | | | | | | | | | | |
| | | 27,824,711 | | | | | 18,727,833 | | | | | 205,391 | | | | | (855,870 | ) | | | | 71,368,683 | | | | | 55,043,222 | |
| | | | | | | | | | | | | | | | | | | | | | | | | | | | | |
| | | | | |
| | | | | | | | | | | | | | | | | | | | | | | | | | | | | |
| | | (3,461,516 | ) | | | | (10,067,943 | ) | | | | (4,125 | ) | | | | (141,340 | ) | | | | — | | | | | — | |
| | | (933,930 | ) | | | | (1,984,214 | ) | | | | (6,031 | ) | | | | (182,828 | ) | | | | — | | | | | — | |
| | | | | |
| | | | | | | | | | | | | | | | | | | | | | | | | | | | | |
| | | | | | | | | | | | | | | | | | | | | | | | | | | | | |
| | | 3,536,036 | | | | | 14,508,523 | | | | | 746,601 | | | | | 2,706,778 | | | | | 11,667,220 | | | | | 21,529,056 | |
| | | 3,341,952 | | | | | 9,793,517 | | | | | 4,122 | | | | | 136,465 | | | | | — | | | | | — | |
| | | (23,626,912 | ) | | | | (21,196,441 | ) | | | | (550,295 | ) | | | | (2,569,096 | ) | | | | (74,156,160 | ) | | | | (94,366,997 | ) |
| | | 1,637 | | | | | 1,465 | | | | | 1,086 | | | | | 735 | | | | | 478 | | | | | 4,094 | |
| | | | | | | | | | | | | | | | | | | | | | | | | | | | | |
| | | (16,747,287 | ) | | | | 3,107,064 | | | | | 201,514 | | | | | 274,882 | | | | | (62,488,462 | ) | | | | (72,833,847 | ) |
| | | | | | | | | | | | | | | | | | | | | | | | | | | | | |
| | | | | | | | | | | | | | | | | | | | | | | | | | | | | |
| | | 8,093,577 | | | | | 27,828,434 | | | | | 516,074 | | | | | 221,271 | | | | | 14,716,613 | | | | | 50,417,754 | |
| | | 932,998 | | | | | 1,981,574 | | | | | 6,031 | | | | | 182,828 | | | | | — | | | | | — | |
| | | (27,916,990 | ) | | | | (13,918,802 | ) | | | | (404,382 | ) | | | | (244,872 | ) | | | | (180,179,807 | ) | | | | (177,515,926 | ) |
| | | — | | | | | — | | | | | — | | | | | — | | | | | — | | | | | 288 | |
| | | | | | | | | | | | | | | | | | | | | | | | | | | | | |
| | | (18,890,415 | ) | | | | 15,891,206 | | | | | 117,723 | | | | | 159,227 | | | | | (165,463,194 | ) | | | | (127,097,884 | ) |
| | | | | | | | | | | | | | | | | | | | | | | | | | | | | |
| | | (12,208,437 | ) | | | | 25,673,946 | | | | | 514,472 | | | | | (745,929 | ) | | | | (156,582,973 | ) | | | | (144,888,509 | ) |
| | | | | |
| | | | | | | | | | | | | | | | | | | | | | | | | | | | | |
| | | 144,239,741 | | | | | 118,565,795 | | | | | 4,069,931 | | | | | 4,815,860 | | | | | 454,654,719 | | | | | 599,543,228 | |
| | | | | | | | | | | | | | | | | | | | | | | | | | | | | |
| | $ | 132,031,304 | | | | $ | 144,239,741 | | | | $ | 4,584,403 | | | | $ | 4,069,931 | | | | $ | 298,071,746 | | | | $ | 454,654,719 | |
| | | | | | | | | | | | | | | | | | | | | | | | | | | | | |
| | | | | |
| | | | | | | | | | | | | | | | | | | | | | | | | | | | | |
| | | | | | | | | | | | | | | | | | | | | | | | | | | | | |
| | | 387,626 | | | | | 1,623,915 | | | | | 166,747 | | | | | 385,915 | | | | | 499,146 | | | | | 941,753 | |
| | | 358,956 | | | | | 1,121,963 | | | | | 894 | | | | | 21,457 | | | | | — | | | | | — | |
| | | (2,609,353 | ) | | | | (2,402,888 | ) | | | | (122,009 | ) | | | | (401,094 | ) | | | | (3,186,863 | ) | | | | (4,199,293 | ) |
| | | | | | | | | | | | | | | | | | | | | | | | | | | | | |
| | | (1,862,771 | ) | | | | 342,990 | | | | | 45,632 | | | | | 6,278 | | | | | (2,687,717 | ) | | | | (3,257,540 | ) |
| | | | | | | | | | | | | | | | | | | | | | | | | | | | | |
| | | | | | | | | | | | | | | | | | | | | | | | | | | | | |
| | | 911,475 | | | | | 3,119,622 | | | | | 113,863 | | | | | 36,679 | | | | | 629,153 | | | | | 2,174,266 | |
| | | 101,262 | | | | | 227,804 | | | | | 1,311 | | | | | 28,929 | | | | | — | | | | | — | |
| | | (3,069,196 | ) | | | | (1,576,669 | ) | | | | (94,246 | ) | | | | (39,340 | ) | | | | (7,662,183 | ) | | | | (7,760,428 | ) |
| | | | | | | | | | | | | | | | | | | | | | | | | | | | | |
| | | (2,056,459 | ) | | | | 1,770,757 | | | | | 20,928 | | | | | 26,268 | | | | | (7,033,030 | ) | | | | (5,586,162 | ) |
| | | | | | | | | | | | | | | | | | | | | | | | | | | | | |
53
Statements of Changes in Net Assets (continued)
| | | | | | | | | | | | | | | | | | | | |
| | | International Opportunities
Fund | | International Select
Fund |
| | | Year Ended
September 30, 2024 | | Year Ended
September 30, 2023 | | Year Ended
September 30, 2024 | | Year Ended
September 30, 2023 |
| | | | | | | | | | | | | | | | | | | | |
Operations: | | | | | | | | | | | | | | | | | | | | |
Net investment income (loss) | | | $ | (1,646,378 | ) | | | $ | (1,850,491 | ) | | | $ | (10,557 | ) | | | $ | (13,326 | ) |
Net realized gain (loss) on investments, foreign currency translations and foreign capital gains taxes | | | | 23,142,386 | | | | | (2,911,427 | ) | | | | (9,895 | ) | | | | (372,603 | ) |
Net realized loss on short positions | | | | — | | | | | — | | | | | — | | | | | — | |
Change in unrealized appreciation (depreciation) on investments, foreign currency translations and deferred foreign capital gains taxes | | | | 25,899,567 | | | | | 43,633,629 | | | | | 831,165 | | | | | 1,212,499 | |
| | | | | | | | | | | | | | | | | | | | |
Net increase (decrease) in net assets resulting from operations | | | | 47,395,575 | | | | | 38,871,711 | | | | | 810,713 | | | | | 826,570 | |
| | | | | | | | | | | | | | | | | | | | |
|
Distributions to shareholders from distributable earnings | |
Investor Class | | | | — | | | | | — | | | | | — | | | | | — | |
Institutional Class | | | | — | | | | | — | | | | | — | | | | | — | |
|
Capital share transactions: | |
Investor Class | | | | | | | | | | | | | | | | | | | | |
Shares sold | | | | 1,006,399 | | | | | 3,030,199 | | | | | 444,971 | | | | | 567,929 | |
Shares issued to holders in reinvestment of dividends | | | | — | | | | | — | | | | | — | | | | | — | |
Shares redeemed | | | | (14,200,148 | ) | | | | (18,226,908 | ) | | | | (802,412 | ) | | | | (1,002,772 | ) |
Redemption fees | | | | 28 | | | | | 278 | | | | | 46 | | | | | 66 | |
| | | | | | | | | | | | | | | | | | | | |
Net increase (decrease) | | | | (13,193,721 | ) | | | | (15,196,431 | ) | | | | (357,395 | ) | | | | (434,777 | ) |
| | | | | | | | | | | | | | | | | | | | |
Institutional Class | | | | | | | | | | | | | | | | | | | | |
Shares sold | | | | 25,855,981 | | | | | 101,667,560 | | | | | 50,099 | | | | | 234,204 | |
Shares issued to holders in reinvestment of dividends | | | | — | | | | | — | | | | | — | | | | | — | |
Shares redeemed | | | | (194,952,279 | ) | | | | (262,755,106 | ) | | | | (542,426 | ) | | | | (1,920,874 | ) |
Redemption fees | | | | 582 | | | | | 1,755 | | | | | — | | | | | — | |
| | | | | | | | | | | | | | | | | | | | |
Net increase (decrease) | | | | (169,095,716 | ) | | | | (161,085,791 | ) | | | | (492,327 | ) | | | | (1,686,670 | ) |
| | | | | | | | | | | | | | | | | | | | |
Total increase (decrease) in net assets | | | | (134,893,862 | ) | | | | (137,410,511 | ) | | | | (39,009 | ) | | | | (1,294,877 | ) |
|
Net assets: | |
Beginning of period | | | | 281,268,265 | | | | | 418,678,776 | | | | | 4,006,344 | | | | | 5,301,221 | |
| | | | | | | | | | | | | | | | | | | | |
End of period | | | $ | 146,374,403 | | | | $ | 281,268,265 | | | | $ | 3,967,335 | | | | $ | 4,006,344 | |
| | | | | | | | | | | | | | | | | | | | |
|
Capital share transactions — shares: | |
Investor Class | | | | | | | | | | | | | | | | | | | | |
Shares sold | | | | 338,277 | | | | | 1,082,959 | | | | | 39,097 | | | | | 53,173 | |
Shares issued to holders in reinvestment of dividends | | | | — | | | | | — | | | | | — | | | | | — | |
Shares redeemed | | | | (4,744,307 | ) | | | | (6,444,150 | ) | | | | (71,617 | ) | | | | (93,757 | ) |
| | | | | | | | | | | | | | | | | | | | |
Net increase (decrease) in shares outstanding | | | | (4,406,030 | ) | | | | (5,361,191 | ) | | | | (32,520 | ) | | | | (40,584 | ) |
| | | | | | | | | | | | | | | | | | | | |
Institutional Class | | | | | | | | | | | | | | | | | | | | |
Shares sold | | | | 8,556,176 | | | | | 35,611,451 | | | | | 4,887 | | | | | 21,420 | |
Shares issued to holders in reinvestment of dividends | | | | — | | | | | — | | | | | — | | | | | — | |
Shares redeemed | | | | (62,020,991 | ) | | | | (92,719,054 | ) | | | | (46,543 | ) | | | | (184,467 | ) |
| | | | | | | | | | | | | | | | | | | | |
Net increase (decrease) in shares outstanding | | | | (53,464,815 | ) | | | | (57,107,603 | ) | | | | (41,656 | ) | | | | (163,047 | ) |
| | | | | | | | | | | | | | | | | | | | |
See Notes to Financial Statements.
54
| | | | | | | | | | | | | | | | | | | | | | | | | | | | |
Long/Short Alpha
Fund | | Micro Cap
Fund | | Micro Cap Value
Fund |
Year Ended
September 30, 2024 | | Year Ended
September 30, 2023 | | Year Ended
September 30, 2024 | | Year Ended
September 30, 2023 | | Year Ended
September 30, 2024 | | Year Ended
September 30, 2023 |
| | | | | | | | | | | | | | | | | | | | | | | | | | | | | |
| | | | | | | | | | | | | | | | | | | | | | | | | | | | | |
| | $ | (172,348 | ) | | | $ | (295,964 | ) | | | $ | (8,600,636 | ) | | | $ | (9,114,351 | ) | | | $ | (1,352,452 | ) | | | $ | (2,402,010 | ) |
| | | 674,487 | | | | | (515,353 | ) | | | | 50,648,343 | | | | | (56,168,678 | ) | | | | 24,835,343 | | | | | (28,265,474 | ) |
| | | (986,116 | ) | | | | 423,719 | | | | | — | | | | | — | | | | | — | | | | | — | |
| | | 15,187,667 | | | | | 6,713,109 | | | | | 133,224,676 | | | | | 102,856,642 | | | | | 61,540,978 | | | | | 49,970,315 | |
| | | | | | | | | | | | | | | | | | | | | | | | | | | | | |
| | | 14,703,690 | | | | | 6,325,511 | | | | | 175,272,383 | | | | | 37,573,613 | | | | | 85,023,869 | | | | | 19,302,831 | |
| | | | | | | | | | | | | | | | | | | | | | | | | | | | | |
| | | | | |
| | | | | | | | | | | | | | | | | | | | | | | | | | | | | |
| | | — | | | | | (8,767 | ) | | | | — | | | | | — | | | | | — | | | | | — | |
| | | — | | | | | (15,251 | ) | | | | — | | | | | — | | | | | — | | | | | — | |
| | | | | |
| | | | | | | | | | | | | | | | | | | | | | | | | | | | | |
| | | | | | | | | | | | | | | | | | | | | | | | | | | | | |
| | | 17,321,162 | | | | | 13,168,964 | | | | | 42,879,566 | | | | | 33,463,338 | | | | | 29,192,386 | | | | | 22,857,756 | |
| | | — | | | | | 8,767 | | | | | — | | | | | — | | | | | — | | | | | — | |
| | | (4,918,404 | ) | | | | (1,261,633 | ) | | | | (114,456,828 | ) | | | | (116,465,408 | ) | | | | (69,346,071 | ) | | | | (54,114,071 | ) |
| | | 12,196 | | | | | 1,573 | | | | | 20,313 | | | | | 14,068 | | | | | 11,331 | | | | | 10,095 | |
| | | | | | | | | | | | | | | | | | | | | | | | | | | | | |
| | | 12,414,954 | | | | | 11,917,671 | | | | | (71,556,949 | ) | | | | (82,988,002 | ) | | | | (40,142,354 | ) | | | | (31,246,220 | ) |
| | | | | | | | | | | | | | | | | | | | | | | | | | | | | |
| | | | | | | | | | | | | | | | | | | | | | | | | | | | | |
| | | 22,361,984 | | | | | 2,056,609 | | | | | 23,716,143 | | | | | 27,199,923 | | | | | 17,342,523 | | | | | 7,176,101 | |
| | | — | | | | | 15,251 | | | | | — | | | | | — | | | | | — | | | | | — | |
| | | (5,085,032 | ) | | | | (7,783,134 | ) | | | | (29,491,200 | ) | | | | (32,492,270 | ) | | | | (10,947,881 | ) | | | | (10,481,824 | ) |
| | | 247 | | | | | 112 | | | | | 22 | | | | | 10,699 | | | | | 3 | | | | | 28 | |
| | | | | | | | | | | | | | | | | | | | | | | | | | | | | |
| | | 17,277,199 | | | | | (5,711,162 | ) | | | | (5,775,035 | ) | | | | (5,281,648 | ) | | | | 6,394,645 | | | | | (3,305,695 | ) |
| | | | | | | | | | | | | | | | | | | | | | | | | | | | | |
| | | 44,395,843 | | | | | 12,508,002 | | | | | 97,940,399 | | | | | (50,696,037 | ) | | | | 51,276,160 | | | | | (15,249,084 | ) |
| | | | | |
| | | | | | | | | | | | | | | | | | | | | | | | | | | | | |
| | | 34,474,271 | | | | | 21,966,269 | | | | | 583,954,984 | | | | | 634,651,021 | | | | | 276,993,364 | | | | | 292,242,448 | |
| | | | | | | | | | | | | | | | | | | | | | | | | | | | | |
| | $ | 78,870,114 | | | | $ | 34,474,271 | | | | $ | 681,895,383 | | | | $ | 583,954,984 | | | | $ | 328,269,524 | | | | $ | 276,993,364 | |
| | | | | | | | | | | | | | | | | | | | | | | | | | | | | |
| | | | | |
| | | | | | | | | | | | | | | | | | | | | | | | | | | | | |
| | | | | | | | | | | | | | | | | | | | | | | | | | | | | |
| | | 1,264,303 | | | | | 1,197,021 | | | | | 6,014,495 | | | | | 5,437,121 | | | | | 8,514,560 | | | | | 7,480,974 | |
| | | — | | | | | 853 | | | | | — | | | | | — | | | | | — | | | | | — | |
| | | (356,616 | ) | | | | (117,061 | ) | | | | (16,490,471 | ) | | | | (19,188,011 | ) | | | | (20,314,338 | ) | | | | (17,802,001 | ) |
| | | | | | | | | | | | | | | | | | | | | | | | | | | | | |
| | | 907,687 | | | | | 1,080,813 | | | | | (10,475,976 | ) | | | | (13,750,890 | ) | | | | (11,799,778 | ) | | | | (10,321,027 | ) |
| | | | | | | | | | | | | | | | | | | | | | | | | | | | | |
| | | | | | | | | | | | | | | | | | | | | | | | | | | | | |
| | | 1,584,313 | | | | | 195,782 | | | | | 3,332,582 | | | | | 4,428,333 | | | | | 4,748,377 | | | | | 2,319,222 | |
| | | — | | | | | 1,479 | | | | | — | | | | | — | | | | | — | | | | | — | |
| | | (359,196 | ) | | | | (721,914 | ) | | | | (4,443,462 | ) | | | | (5,498,652 | ) | | | | (3,198,450 | ) | | | | (3,424,390 | ) |
| | | | | | | | | | | | | | | | | | | | | | | | | | | | | |
| | | 1,225,117 | | | | | (524,653 | ) | | | | (1,110,880 | ) | | | | (1,070,319 | ) | | | | 1,549,927 | | | | | (1,105,168 | ) |
| | | | | | | | | | | | | | | | | | | | | | | | | | | | | |
55
Statements of Changes in Net Assets (continued)
| | | | | | | | | | | | | | | | | | | | |
| | | Small Cap Growth
Fund | | Small Cap Value
Fund |
| | | Year Ended
September 30, 2024 | | Year Ended
September 30, 2023 | | Year Ended
September 30, 2024 | | Year Ended
September 30, 2023 |
| | | | | | | | | | | | | | | | | | | | |
Operations: | | | | | | | | | | | | | | | | | | | | |
Net investment income (loss) | | | $ | (19,452,186 | ) | | | $ | (18,867,658 | ) | | | $ | 1,048,572 | | | | $ | (1,297,202 | ) |
Net realized gain (loss) on investments, foreign currency translations and foreign capital gains taxes | | | | (11,567,701 | ) | | | | (245,908,515 | ) | | | | 224,280,302 | | | | | 41,102,032 | |
Net realized loss on short positions | | | | — | | | | | — | | | | | — | | | | | — | |
Change in unrealized appreciation (depreciation) on investments, foreign currency translations and deferred foreign capital gains taxes | | | | 470,554,828 | | | | | 474,280,895 | | | | | 177,777,367 | | | | | 240,858,243 | |
| | | | | | | | | | | | | | | | | | | | |
Net increase (decrease) in net assets resulting from operations | | | | 439,534,941 | | | | | 209,504,722 | | | | | 403,106,241 | | | | | 280,663,073 | |
| | | | | | | | | | | | | | | | | | | | |
|
Distributions to shareholders from distributable earnings | |
Investor Class | | | | — | | | | | — | | | | | (21,366,448 | ) | | | | (14,251,795 | ) |
Institutional Class | | | | — | | | | | — | | | | | (29,326,831 | ) | | | | (16,822,096 | ) |
|
Capital share transactions: | |
Investor Class | | | | | | | | | | | | | | | | | | | | |
Shares sold | | | | 55,961,450 | | | | | 79,618,700 | | | | | 125,806,693 | | | | | 116,447,228 | |
Shares issued to holders in reinvestment of dividends | | | | — | | | | | — | | | | | 20,731,145 | | | | | 13,955,521 | |
Shares redeemed | | | | (195,396,129 | ) | | | | (178,994,414 | ) | | | | (213,541,277 | ) | | | | (282,576,107 | ) |
Redemption fees | | | | 14,578 | | | | | 18,999 | | | | | 32,797 | | | | | 13,475 | |
| | | | | | | | | | | | | | | | | | | | |
Net increase (decrease) | | | | (139,420,101 | ) | | | | (99,356,715 | ) | | | | (66,970,642 | ) | | | | (152,159,883 | ) |
| | | | | | | | | | | | | | | | | | | | |
Institutional Class | | | | | | | | | | | | | | | | | | | | |
Shares sold | | | | 213,947,021 | | | | | 286,077,811 | | | | | 280,181,042 | | | | | 190,194,138 | |
Shares issued to holders in reinvestment of dividends | | | | — | | | | | — | | | | | 28,015,241 | | | | | 16,171,156 | |
Shares redeemed | | | | (462,607,801 | ) | | | | (284,170,719 | ) | | | | (163,876,254 | ) | | | | (304,139,627 | ) |
Redemption fees | | | | 21,938 | | | | | 26,249 | | | | | 6,126 | | | | | 2,402 | |
| | | | | | | | | | | | | | | | | | | | |
Net increase (decrease) | | | | (248,638,842 | ) | | | | 1,933,341 | | | | | 144,326,155 | | | | | (97,771,931 | ) |
| | | | | | | | | | | | | | | | | | | | |
Total increase (decrease) in net assets | | | | 51,475,998 | | | | | 112,081,348 | | | | | 429,768,475 | | | | | (342,632 | ) |
|
Net assets: | |
Beginning of period | | | | 2,099,015,472 | | | | | 1,986,934,124 | | | | | 1,233,025,352 | | | | | 1,233,367,984 | |
| | | | | | | | | | | | | | | | | | | | |
End of period | | | $ | 2,150,491,470 | | | | $ | 2,099,015,472 | | | | $ | 1,662,793,827 | | | | $ | 1,233,025,352 | |
| | | | | | | | | | | | | | | | | | | | |
|
Capital share transactions — shares: | |
Investor Class | | | | | | | | | | | | | | | | | | | | |
Shares sold | | | | 1,585,340 | | | | | 2,525,103 | | | | | 12,028,537 | | | | | 13,547,910 | |
Shares issued to holders in reinvestment of dividends | | | | — | | | | | — | | | | | 2,056,661 | | | | | 1,703,971 | |
Shares redeemed | | | | (5,555,837 | ) | | | | (5,649,071 | ) | | | | (21,091,956 | ) | | | | (32,584,605 | ) |
| | | | | | | | | | | | | | | | | | | | |
Net increase (decrease) in shares outstanding | | | | (3,970,497 | ) | | | | (3,123,968 | ) | | | | (7,006,758 | ) | | | | (17,332,724 | ) |
| | | | | | | | | | | | | | | | | | | | |
Institutional Class | | | | | | | | | | | | | | | | | | | | |
Shares sold | | | | 6,014,600 | | | | | 8,823,826 | | | | | 26,628,392 | | | | | 21,364,303 | |
Shares issued to holders in reinvestment of dividends | | | | — | | | | | — | | | | | 2,746,592 | | | | | 1,955,400 | |
Shares redeemed | | | | (12,674,580 | ) | | | | (8,796,106 | ) | | | | (15,805,756 | ) | | | | (35,737,259 | ) |
| | | | | | | | | | | | | | | | | | | | |
Net increase (decrease) in shares outstanding | | | | (6,659,980 | ) | | | | 27,720 | | | | | 13,569,228 | | | | | (12,417,556 | ) |
| | | | | | | | | | | | | | | | | | | | |
See Notes to Financial Statements.
56
| | | | | | | | | | | | | | | | | | | | | | | | | | | | |
Ultra Growth
Fund | | U.S. Select
Fund | | U.S. Treasury
Fund |
Year Ended
September 30, 2024 | | Year Ended
September 30, 2023 | | Year Ended
September 30, 2024 | | Year Ended
September 30, 2023 | | Year Ended
September 30, 2024 | | Year Ended
September 30, 2023 |
| | | | | | | | | | | | | | | | | | | | | | | | | | | | | |
| | | | | | | | | | | | | | | | | | | | | | | | | | | | | |
| | $ | (9,373,265 | ) | | | $ | (12,426,841 | ) | | | $ | (126,697 | ) | | | $ | (38,164 | ) | | | $ | 6,352,648 | | | | $ | 7,554,438 | |
| | | 49,917,522 | | | | | (94,388,374 | ) | | | | 930,009 | | | | | (209,723 | ) | | | | (84,009,114 | ) | | | | (10,525,742 | ) |
| | | — | | | | | — | | | | | — | | | | | — | | | | | — | | | | | — | |
| | | 223,152,783 | | | | | 129,515,436 | | | | | 3,601,209 | | | | | 1,484,893 | | | | | 104,219,264 | | | | | (31,741,954 | ) |
| | | | | | | | | | | | | | | | | | | | | | | | | | | | | |
| | | 263,697,040 | | | | | 22,700,221 | | | | | 4,404,521 | | | | | 1,237,006 | | | | | 26,562,798 | | | | | (34,713,258 | ) |
| | | | | | | | | | | | | | | | | | | | | | | | | | | | | |
| | | | | |
| | | | | | | | | | | | | | | | | | | | | | | | | | | | | |
| | | — | | | | | — | | | | | — | | | | | — | | | | | (6,385,147 | ) | | | | (7,520,379 | ) |
| | | — | | | | | (556,115 | ) | | | | — | | | | | — | | | | | — | | | | | — | |
| | | | | |
| | | | | | | | | | | | | | | | | | | | | | | | | | | | | |
| | | 68,817,925 | | | | | 140,857,739 | | | | | 7,197,299 | | | | | 3,363,172 | | | | | 35,134,728 | | | | | 104,573,763 | |
| | | — | | | | | — | | | | | — | | | | | — | | | | | 5,983,323 | | | | | 7,116,523 | |
| | | (409,931,728 | ) | | | | (343,414,222 | ) | | | | (3,374,002 | ) | | | | (1,123,085 | ) | | | | (113,364,949 | ) | | | | (119,870,843 | ) |
| | | 22,710 | | | | | 70,675 | | | | | 1,586 | | | | | 214 | | | | | 17,553 | | | | | 77,856 | |
| | | | | | | | | | | | | | | | | | | | | | | | | | | | | |
| | | (341,091,093 | ) | | | | (202,485,808 | ) | | | | 3,824,883 | | | | | 2,240,301 | | | | | (72,229,345 | ) | | | | (8,102,701 | ) |
| | | | | | | | | | | | | | | | | | | | | | | | | | | | | |
| | | | | | | | | | | | | | | | | | | | | | | | | | | | | |
| | | 88,891,343 | | | | | 119,499,535 | | | | | 10,450,783 | | | | | 5,630,616 | | | | | — | | | | | — | |
| | | — | | | | | 542,074 | | | | | — | | | | | — | | | | | — | | | | | — | |
| | | (224,001,931 | ) | | | | (134,959,357 | ) | | | | (4,558,508 | ) | | | | (1,984,494 | ) | | | | — | | | | | — | |
| | | 929 | | | | | 3,547 | | | | | 10 | | | | | 583 | | | | | — | | | | | — | |
| | | | | | | | | | | | | | | | | | | | | | | | | | | | | |
| | | (135,109,659 | ) | | | | (14,914,201 | ) | | | | 5,892,285 | | | | | 3,646,705 | | | | | — | | | | | — | |
| | | | | | | | | | | | | | | | | | | | | | | | | | | | | |
| | | (212,503,712 | ) | | | | (195,255,903 | ) | | | | 14,121,689 | | | | | 7,124,012 | | | | | (52,051,694 | ) | | | | (50,336,338 | ) |
| | | | | |
| | | | | | | | | | | | | | | | | | | | | | | | | | | | | |
| | | 1,178,617,228 | | | | | 1,373,873,131 | | | | | 12,469,160 | | | | | 5,345,148 | | | | | 237,186,491 | | | | | 287,522,829 | |
| | | | | | | | | | | | | | | | | | | | | | | | | | | | | |
| | $ | 966,113,516 | | | | $ | 1,178,617,228 | | | | $ | 26,590,849 | | | | $ | 12,469,160 | | | | $ | 185,134,797 | | | | $ | 237,186,491 | |
| | | | | | | | | | | | | | | | | | | | | | | | | | | | | |
| | | | | |
| | | | | | | | | | | | | | | | | | | | | | | | | | | | | |
| | | 2,294,140 | | | | | 4,960,624 | | | | | 517,916 | | | | | 281,732 | | | | | 3,129,556 | | | | | 8,465,746 | |
| | | — | | | | | — | | | | | — | | | | | — | | | | | 519,477 | | | | | 581,305 | |
| | | (13,594,935 | ) | | | | (12,258,146 | ) | | | | (236,696 | ) | | | | (104,083 | ) | | | | (10,254,526 | ) | | | | (9,678,169 | ) |
| | | | | | | | | | | | | | | | | | | | | | | | | | | | | |
| | | (11,300,795 | ) | | | | (7,297,522 | ) | | | | 281,220 | | | | | 177,649 | | | | | (6,605,493 | ) | | | | (631,118 | ) |
| | | | | | | | | | | | | | | | | | | | | | | | | | | | | |
| | | | | | | | | | | | | | | | | | | | | | | | | | | | | |
| | | 2,895,023 | | | | | 4,213,786 | | | | | 735,817 | | | | | 476,235 | | | | | — | | | | | — | |
| | | — | | | | | 19,784 | | | | | — | | | | | — | | | | | — | | | | | — | |
| | | (7,626,513 | ) | | | | (4,783,978 | ) | | | | (315,996 | ) | | | | (171,254 | ) | | | | — | | | | | — | |
| | | | | | | | | | | | | | | | | | | | | | | | | | | | | |
| | | (4,731,490 | ) | | | | (550,408 | ) | | | | 419,821 | | | | | 304,981 | | | | | — | | | | | — | |
| | | | | | | | | | | | | | | | | | | | | | | | | | | | | |
57
Statement of Cash Flows
| | | | | |
| | | Long/Short
Alpha Fund
Year Ended
September 30, 2024 |
| | | | | |
Cash flows from operating activities: | |
Net increase in net assets resulting from operations | | | $ | 14,703,690 | |
Adjustments to reconcile net increase in net assets resulting from operations | | | | | |
Long-term investments purchased | | | | (56,386,151 | ) |
Long-term investments sold | | | | 26,253,918 | |
Purchases to cover securities sold short | | | | (13,235,266 | ) |
Securities sold short | | | | 26,926,138 | |
Decrease in dividends and interest receivable | | | | (8,810 | ) |
Decrease in prepaid expenses and other assets | | | | (2,509 | ) |
Decrease in investment securities purchased payable | | | | (271,682 | ) |
Decrease in dividend payable on securities sold short | | | | (6,410 | ) |
Increase in accrued fund administration fees | | | | 1,150 | |
Increase in payable to Advisor | | | | 63,070 | |
Increase in accrued expenses and other liabilities | | | | 22,927 | |
Net realized gain from unaffiliated investments | | | | (674,487 | ) |
Net realized loss from securities sold short | | | | 986,116 | |
Net change in unrealized appreciation on unaffiliated investments | | | | (17,340,746 | ) |
Net change in unrealized depreciation on securities sold short | | | | 2,153,079 | |
| | | | | |
Net cash from operating activities | | | | (16,815,973 | ) |
| | | | | |
Cash flows from financing activities: | |
Proceeds from shares sold | | | | 39,677,610 | |
Payment on shares redeemed | | | | (9,991,717 | ) |
Redemption fees | | | | 12,443 | |
| | | | | |
Net cash from financing activities | | | | 29,698,336 | |
| | | | | |
Net increase in cash | | | | 12,882,363 | |
Cash at beginning of year | | | | 7,854,132 | |
| | | | | |
Cash at end of year | | | $ | 20,736,495 | |
| | | | | |
Supplemental Disclosure of Cash Flow Information: | |
Dividend on securities sold short during the year | | | $ | 144,092 | |
Interest expense paid during the year | | | | 192,981 | |
See Notes to Financial Statements.
58
(This page intentionally left blank.)
59
Financial Highlights
| | | | | | | | | | | | | | | | | | | | | | | | | | | | | | | | | | | | | | | | |
| | | | | Income (Loss) from
Investment Operations | | | | | | Less Distributions | | |
| | | Net Asset
Value
Beginning
of Period | | Net
Investment
Income (Loss) | | Net Realized
and Unrealized
Gains (Losses)
on Investments | | Total from
Investment
Operations | | Redemption
Fees
(See Note 2) | | Dividends
from Net
Investment
Income | | Distributions
from Net
Realized
Gains | | Total
Distributions |
| Core Growth Fund — Investor Class | | | | | | | | | | | | | | | | | | | | | | | | | | | | | | | | | | | | | | | | |
| Year ended 9/30/24 | | | $ | 73.66 | | | | | (0.47 | ) | | | | 23.75 | | | | | 23.28 | | | | | — | 4 | | | | — | | | | | — | | | | | — | |
| Year ended 9/30/23 | | | $ | 61.04 | | | | | (0.39 | ) | | | | 13.47 | | | | | 13.08 | | | | | — | 4 | | | | — | | | | | (0.46 | ) | | | | (0.46 | ) |
| Year ended 9/30/22 | | | $ | 104.75 | | | | | (0.48 | ) | | | | (27.40 | ) | | | | (27.88 | ) | | | | — | 4 | | | | — | | | | | (15.83 | ) | | | | (15.83 | ) |
| Year ended 9/30/21 | | | $ | 77.61 | | | | | (0.63 | ) | | | | 34.37 | | | | | 33.74 | | | | | — | 4 | | | | — | | | | | (6.60 | ) | | | | (6.60 | ) |
| Year ended 9/30/20 | | | $ | 73.17 | | | | | (0.32 | ) | | | | 12.47 | | | | | 12.15 | | | | | — | 4 | | | | — | | | | | (7.71 | ) | | | | (7.71 | ) |
| Core Growth Fund — Institutional Class | | | | | | | | | | | | | | | | | | | | | | | | | | | | | | | | | | | | | | | | |
| Year ended 9/30/24 | | | $ | 75.06 | | | | | (0.37 | ) | | | | 24.21 | | | | | 23.84 | | | | | — | 4 | | | | — | | | | | — | | | | | — | |
| Year ended 9/30/23 | | | $ | 62.13 | | | | | (0.28 | ) | | | | 13.67 | | | | | 13.39 | | | | | — | 4 | | | | — | | | | | (0.46 | ) | | | | (0.46 | ) |
| Year ended 9/30/22 | | | $ | 106.20 | | | | | (0.41 | ) | | | | (27.83 | ) | | | | (28.24 | ) | | | | — | 4 | | | | — | | | | | (15.83 | ) | | | | (15.83 | ) |
| Year ended 9/30/21 | | | $ | 78.53 | | | | | (0.50 | ) | | | | 34.77 | | | | | 34.27 | | | | | — | 4 | | | | — | | | | | (6.60 | ) | | | | (6.60 | ) |
| Year ended 9/30/20 | | | $ | 73.86 | | | | | (0.29 | ) | | | | 12.67 | | | | | 12.38 | | | | | — | 4 | | | | — | | | | | (7.71 | ) | | | | (7.71 | ) |
| Emerging India Fund — Investor Class | | | | | | | | | | | | | | | | | | | | | | | | | | | | | | | | | | | | | | | | |
| Year ended 9/30/24 | | | $ | 5.90 | | | | | (0.06 | ) | | | | 1.79 | | | | | 1.73 | | | | | — | 4 | | | | — | | | | | (0.26 | ) | | | | (0.26 | ) |
| Year ended 9/30/23 | | | $ | 5.67 | | | | | (0.04 | ) | | | | 0.33 | | | | | 0.29 | | | | | — | 4 | | | | — | | | | | (0.06 | ) | | | | (0.06 | ) |
| Year ended 9/30/22 | | | $ | 6.95 | | | | | (0.06 | ) | | | | (0.92 | ) | | | | (0.98 | ) | | | | — | 4 | | | | — | | | | | (0.30 | ) | | | | (0.30 | ) |
| Year ended 9/30/21 | | | $ | 4.22 | | | | | (0.05 | ) | | | | 2.78 | | | | | 2.73 | | | | | — | 4 | | | | — | | | | | — | | | | | — | |
| Year ended 9/30/20 | | | $ | 4.25 | | | | | (0.06 | ) | | | | 0.04 | | | | | (0.02 | ) | | | | — | 4 | | | | — | | | | | (0.01 | ) | | | | (0.01 | ) |
| Emerging India Fund — Institutional Class | | | | | | | | | | | | | | | | | | | | | | | | | | | | | | | | | | | | | | | | |
| Year ended 9/30/24 | | | $ | 5.98 | | | | | (0.04 | ) | | | | 1.81 | | | | | 1.77 | | | | | — | 4 | | | | — | | | | | (0.26 | ) | | | | (0.26 | ) |
| Year ended 9/30/23 | | | $ | 5.74 | | | | | (0.05 | ) | | | | 0.35 | | | | | 0.30 | | | | | — | 4 | | | | — | | | | | (0.06 | ) | | | | (0.06 | ) |
| Year ended 9/30/22 | | | $ | 7.03 | | | | | (0.06 | ) | | | | (0.93 | ) | | | | (0.99 | ) | | | | — | 4 | | | | — | | | | | (0.30 | ) | | | | (0.30 | ) |
| Year ended 9/30/21 | | | $ | 4.26 | | | | | (0.05 | ) | | | | 2.82 | | | | | 2.77 | | | | | — | 4 | | | | — | | | | | — | | | | | — | |
| Year ended 9/30/20 | | | $ | 4.28 | | | | | (0.02 | ) | | | | 0.01 | | | | | (0.01 | ) | | | | — | 4 | | | | — | | | | | (0.01 | ) | | | | (0.01 | ) |
| Emerging Markets Select Fund — Investor Class | | | | | | | | | | | | | | | | | | | | | | | | | | | | | | | | | | | | | | | | |
| Year ended 9/30/24 | | | $ | 14.73 | | | | | (0.14 | ) | | | | 3.58 | | | | | 3.44 | | | | | — | 4 | | | | — | | | | | — | | | | | — | |
| Year ended 9/30/23 | | | $ | 13.34 | | | | | (0.04 | ) | | | | 1.43 | | | | | 1.39 | | | | | — | 4 | | | | — | | | | | — | | | | | — | |
| Year ended 9/30/22 | | | $ | 22.49 | | | | | (0.17 | ) | | | | (8.93 | ) | | | | (9.10 | ) | | | | 0.04 | | | | | — | | | | | (0.09 | ) | | | | (0.09 | ) |
| Year ended 9/30/21 | | | $ | 14.40 | | | | | 0.11 | | | | | 7.97 | | | | | 8.08 | | | | | 0.01 | | | | | — | | | | | — | | | | | — | |
| Year ended 9/30/20 | | | $ | 11.32 | | | | | (0.04 | ) | | | | 3.12 | | | | | 3.08 | | | | | — | 4 | | | | — | | | | | — | | | | | — | |
| Emerging Markets Select Fund — Institutional Class | | | | | | | | | | | | | | | | | | | | | | | | | | | | | | | | | | | | | | | | |
| Year ended 9/30/24 | | | $ | 15.11 | | | | | (0.06 | ) | | | | 3.64 | | | | | 3.58 | | | | | — | 4 | | | | — | | | | | — | | | | | — | |
| Year ended 9/30/23 | | | $ | 13.66 | | | | | — | | | | | 1.45 | | | | | 1.45 | | | | | — | 4 | | | | — | | | | | — | | | | | — | |
| Year ended 9/30/22 | | | $ | 23.01 | | | | | (0.04 | ) | | | | (9.22 | ) | | | | (9.26 | ) | | | | — | 4 | | | | — | | | | | (0.09 | ) | | | | (0.09 | ) |
| Year ended 9/30/21 | | | $ | 14.71 | | | | | (0.03 | ) | | | | 8.33 | | | | | 8.30 | | | | | — | 4 | | | | — | | | | | — | | | | | — | |
| Year ended 9/30/20 | | | $ | 11.53 | | | | | (0.05 | ) | | | | 3.23 | | | | | 3.18 | | | | | — | 4 | | | | — | | | | | — | | | | | — | |
| Emerging Markets Small Cap Fund — Investor Class | | | | | | | | | | | | | | | | | | | | | | | | | | | | | | | | | | | | | | | | |
| Year ended 9/30/24 | | | $ | 2.69 | | | | | (0.04 | ) | | | | 0.62 | | | | | 0.58 | | | | | — | 4 | | | | — | | | | | — | | | | | — | |
| Year ended 9/30/23 | | | $ | 2.47 | | | | | (0.05 | ) | | | | 0.35 | | | | | 0.30 | | | | | — | 4 | | | | — | | | | | (0.08 | ) | | | | (0.08 | ) |
| Year ended 9/30/22 | | | $ | 4.23 | | | | | (0.05 | ) | | | | (1.46 | ) | | | | (1.51 | ) | | | | — | 4 | | | | (0.01 | ) | | | | (0.24 | ) | | | | (0.25 | ) |
| Year ended 9/30/21 | | | $ | 3.02 | | | | | (0.03 | ) | | | | 1.49 | | | | | 1.46 | | | | | — | 4 | | | | — | | | | | (0.25 | ) | | | | (0.25 | ) |
| Year ended 9/30/20 | | | $ | 2.64 | | | | | (0.04 | ) | | | | 0.58 | | | | | 0.54 | | | | | — | 4 | | | | — | | | | | (0.16 | ) | | | | (0.16 | ) |
| Emerging Markets Small Cap Fund — Institutional Class | | | | | | | | | | | | | | | | | | | | | | | | | | | | | | | | | | | | | | | | |
| Year ended 9/30/24 | | | $ | 2.73 | | | | | (0.02 | ) | | | | 0.61 | | | | | 0.59 | | | | | — | 4 | | | | — | | | | | — | | | | | — | |
| Year ended 9/30/23 | | | $ | 2.50 | | | | | (0.02 | ) | | | | 0.33 | | | | | 0.31 | | | | | — | 4 | | | | — | | | | | (0.08 | ) | | | | (0.08 | ) |
| Year ended 9/30/22 | | | $ | 4.27 | | | | | (0.02 | ) | | | | (1.49 | ) | | | | (1.51 | ) | | | | — | 4 | | | | (0.01 | ) | | | | (0.25 | ) | | | | (0.26 | ) |
| Year ended 9/30/21 | | | $ | 3.04 | | | | | (0.03 | ) | | | | 1.51 | | | | | 1.48 | | | | | — | 4 | | | | — | | | | | (0.25 | ) | | | | (0.25 | ) |
| Year ended 9/30/20 | | | $ | 2.65 | | | | | (0.02 | ) | | | | 0.57 | | | | | 0.55 | | | | | — | 4 | | | | — | | | | | (0.16 | ) | | | | (0.16 | ) |
| Frontier Emerging Small Countries Fund — Investor Class | | | | | | | | | | | | | | | | | | | | | | | | | | | | | | | | | | | | | | | | |
| Year ended 9/30/24 | | | $ | 2.86 | | | | | (0.04 | ) | | | | 0.93 | | | | | 0.89 | | | | | — | 4 | | | | — | | | | | — | | | | | — | |
| Year ended 9/30/23 | | | $ | 2.45 | | | | | (0.05 | ) | | | | 0.46 | | | | | 0.41 | | | | | — | 4 | | | | — | | | | | — | | | | | — | |
| Year ended 9/30/22 | | | $ | 4.40 | | | | | (0.03 | ) | | | | (1.89 | ) | | | | (1.92 | ) | | | | — | 4 | | | | (0.03 | ) | | | | — | | | | | (0.03 | ) |
| Year ended 9/30/21 | | | $ | 3.02 | | | | | (0.07 | ) | | | | 1.45 | | | | | 1.38 | | | | | — | 4 | | | | — | | | | | — | | | | | — | |
| Year ended 9/30/20 | | | $ | 2.74 | | | | | (0.07 | ) | | | | 0.35 | | | | | 0.28 | | | | | — | 4 | | | | — | | | | | — | | | | | — | |
See Notes to Financial Highlights and Notes to Financial Statements.
60
| | |
| | | (for a share outstanding throughout each period) |
| | | | | | | | | | | | | | | | | | | | | | | | | | | | | | |
| | | | | | |
Ratios to Average Net Assets | | | Supplemental Data | |
Net Asset
Value
End of
Period | | | Total Return (%)1 | | | Expenses
Net of
Waivers and
Reimbursements (%)2 | | | Expenses
Before
Waivers and
Reimbursements (%)2 | | | Net Investment
Income (Loss)
Net of Waivers and
Reimbursements (%)2 | | | Net Investment
Income (Loss)
Before Waivers and
Reimbursements (%)2 | | | Net Assets
End of Period
(000s) | | | Portfolio
Turnover
Rate1 3 | |
| | | | | | | | | | | | | | | | | | | | | | | | | | | | | | |
| $ | 96.94 | | | | 31.60 | | | | 1.17 | 5 | | | 1.17 | 5 | | | (0.56 | ) | | | (0.56 | ) | | $ | 2,112,156 | | | | 36% | |
| $ | 73.66 | | | | 21.51 | | | | 1.17 | 5 8 | | | 1.17 | 5 8 | | | (0.53 | ) | | | (0.53 | ) | | $ | 1,593,801 | | | | 33% | |
| $ | 61.04 | | | | (31.47 | ) | | | 1.19 | 5 8 | | | 1.19 | 5 8 | | | (0.59 | ) | | | (0.59 | ) | | $ | 1,356,653 | | | | 29% | |
| $ | 104.75 | | | | 44.82 | | | | 1.17 | 5 | | | 1.17 | 5 | | | (0.65 | ) | | | (0.65 | ) | | $ | 2,174,178 | | | | 35% | |
| $ | 77.61 | | | | 17.41 | | | | 1.19 | 5 | | | 1.19 | 5 | | | (0.48 | ) | | | (0.48 | ) | | $ | 1,595,920 | | | | 38% | |
| | | | | | | | | | | | | | | | | | | | | | | | | | | | | | |
| $ | 98.90 | | | | 31.75 | | | | 1.05 | 5 | | | 1.06 | 5 | | | (0.45 | ) | | | (0.46 | ) | | $ | 2,735,072 | | | | 36% | |
| $ | 75.06 | | | | 21.64 | | | | 1.06 | 5 8 | | | 1.06 | 5 8 | | | (0.42 | ) | | | (0.42 | ) | | $ | 1,625,150 | | | | 33% | |
| $ | 62.13 | | | | (31.37 | ) | | | 1.05 | 5 8 | | | 1.06 | 5 8 | | | (0.46 | ) | | | (0.46 | ) | | $ | 1,275,470 | | | | 29% | |
| $ | 106.20 | | | | 44.98 | | | | 1.05 | 5 | | | 1.05 | 5 | | | (0.54 | ) | | | (0.55 | ) | | $ | 1,865,201 | | | | 35% | |
| $ | 78.53 | | | | 17.58 | | | | 1.05 | 5 | | | 1.08 | 5 | | | (0.45 | ) | | | (0.48 | ) | | $ | 1,134,229 | | | | 38% | |
| | | | | | | | | | | | | | | | | | | | | | | | | | | | | | |
| $ | 7.37 | | | | 30.32 | | | | 1.50 | 5 8 | | | 1.50 | 5 8 | | | (1.00 | ) | | | (1.00 | ) | | $ | 318,082 | | | | 29% | |
| $ | 5.90 | | | | 5.23 | | | | 1.50 | 5 8 | | | 1.50 | 5 8 | | | (0.92 | ) | | | (0.92 | ) | | $ | 254,155 | | | | 26% | |
| $ | 5.67 | | | | (14.79 | ) | | | 1.51 | 5 8 | | | 1.51 | 5 8 | | | (1.13 | ) | | | (1.13 | ) | | $ | 227,767 | | | | 25% | |
| $ | 6.95 | | | | 64.69 | | | | 1.52 | 5 | | | 1.52 | 5 | | | (1.15 | ) | | | (1.15 | ) | | $ | 258,617 | | | | 21% | |
| $ | 4.22 | | | | (0.38 | ) | | | 1.64 | 6 | | | 1.64 | 6 | | | (0.89 | ) | | | (0.89 | ) | | $ | 136,415 | | | | 44% | |
| | | | | | | | | | | | | | | | | | | | | | | | | | | | | | |
| $ | 7.49 | | | | 30.59 | | | | 1.37 | 5 8 | | | 1.37 | 5 8 | | | (0.86 | ) | | | (0.86 | ) | | $ | 404,633 | | | | 29% | |
| $ | 5.98 | | | | 5.34 | | | | 1.36 | 5 8 | | | 1.36 | 5 8 | | | (0.79 | ) | | | (0.79 | ) | | $ | 284,887 | | | | 26% | |
| $ | 5.74 | | | | (14.77 | ) | | | 1.38 | 5 8 | | | 1.38 | 5 8 | | | (1.01 | ) | | | (1.01 | ) | | $ | 313,825 | | | | 25% | |
| $ | 7.03 | | | | 65.02 | | | | 1.37 | 5 | | | 1.37 | 5 | | | (0.97 | ) | | | (0.97 | ) | | $ | 358,401 | | | | 21% | |
| $ | 4.26 | | | | (0.15 | ) | | | 1.45 | 6 | | | 1.45 | 6 | | | (0.69 | ) | | | (0.69 | ) | | $ | 145,981 | | | | 44% | |
| | | | | | | | | | | | | | | | | | | | | | | | | | | | | | |
| $ | 18.17 | | | | 23.35 | | | | 1.37 | 6 7 | | | 1.37 | 6 7 | | | (0.56 | ) | | | (0.56 | ) | | $ | 63,062 | | | | 34% | |
| $ | 14.73 | | | | 10.42 | | | | 1.36 | 5 8 | | | 1.36 | 5 8 | | | (0.31 | ) | | | (0.31 | ) | | $ | 59,458 | | | | 14% | |
| $ | 13.34 | | | | (40.42 | ) | | | 1.32 | 5 8 | | | 1.32 | 5 8 | | | (0.73 | ) | | | (0.73 | ) | | $ | 52,571 | | | | 31% | |
| $ | 22.49 | | | | 56.18 | | | | 1.37 | 5 | | | 1.37 | 5 | | | (0.55 | ) | | | (0.55 | ) | | $ | 93,932 | | | | 20% | |
| $ | 14.40 | | | | 27.21 | | | | 1.51 | 6 | | | 1.80 | 6 | | | (0.69 | ) | | | (0.99 | ) | | $ | 14,984 | | | | 35% | |
| | | | | | | | | | | | | | | | | | | | | | | | | | | | | | |
| $ | 18.69 | | | | 23.69 | | | | 1.12 | 6 7 | | | 1.12 | 6 7 | | | (0.30 | ) | | | (0.30 | ) | | $ | 387,987 | | | | 34% | |
| $ | 15.11 | | | | 10.61 | | | | 1.13 | 5 8 | | | 1.13 | 5 8 | | | (0.06 | ) | | | (0.06 | ) | | $ | 392,825 | | | | 14% | |
| $ | 13.66 | | | | (40.40 | ) | | | 1.14 | 5 8 | | | 1.14 | 5 8 | | | (0.40 | ) | | | (0.40 | ) | | $ | 290,912 | | | | 31% | |
| $ | 23.01 | | | | 56.42 | | | | 1.18 | 5 | | | 1.18 | 5 | | | (0.44 | ) | | | (0.44 | ) | | $ | 170,294 | | | | 20% | |
| $ | 14.71 | | | | 27.58 | | | | 1.21 | 6 | | | 1.41 | 6 | | | (0.40 | ) | | | (0.59 | ) | | $ | 43,682 | | | | 35% | |
| | | | | | | | | | | | | | | | | | | | | | | | | | | | | | |
| $ | 3.27 | | | | 21.56 | | | | 1.96 | 6 7 | | | 2.00 | 6 7 | | | (0.79 | ) | | | (0.83 | ) | | $ | 135,893 | | | | 27% | |
| $ | 2.69 | | | | 12.39 | | | | 1.96 | 6 7 | | | 1.96 | 6 7 | | | (0.72 | ) | | | (0.72 | ) | | $ | 131,823 | | | | 21% | |
| $ | 2.47 | | | | (37.93 | ) | | | 1.91 | 6 7 | | | 1.91 | 6 7 | | | (0.74 | ) | | | (0.74 | ) | | $ | 153,161 | | | | 36% | |
| $ | 4.23 | | | | 50.23 | | | | 1.88 | 5 | | | 1.88 | 5 | | | (1.07 | ) | | | (1.07 | ) | | $ | 322,350 | | | | 22% | |
| $ | 3.02 | | | | 21.12 | | | | 1.95 | 6 | | | 1.95 | 6 | | | (1.02 | ) | | | (1.02 | ) | | $ | 197,524 | | | | 20% | |
| | | | | | | | | | | | | | | | | | | | | | | | | | | | | | |
| $ | 3.32 | | | | 21.61 | | | | 1.81 | 6 7 | | | 1.81 | 6 7 | | | (0.63 | ) | | | (0.63 | ) | | $ | 218,820 | | | | 27% | |
| $ | 2.73 | | | | 12.66 | | | | 1.78 | 6 7 | | | 1.78 | 6 7 | | | (0.51 | ) | | | (0.51 | ) | | $ | 204,034 | | | | 21% | |
| $ | 2.50 | | | | (37.75 | ) | | | 1.78 | 6 7 | | | 1.78 | 6 7 | | | (0.58 | ) | | | (0.58 | ) | | $ | 224,736 | | | | 36% | |
| $ | 4.27 | | | | 50.53 | | | | 1.76 | 5 | | | 1.76 | 5 | | | (0.94 | ) | | | (0.94 | ) | | $ | 321,008 | | | | 22% | |
| $ | 3.04 | | | | 21.41 | | | | 1.81 | 6 | | | 1.81 | 6 | | | (0.88 | ) | | | (0.88 | ) | | $ | 176,548 | | | | 20% | |
| | | | | | | | | | | | | | | | | | | | | | | | | | | | | | |
| $ | 3.75 | | | | 31.12 | | | | 2.16 | 6 7 | | | 2.34 | 6 7 | | | (0.90 | ) | | | (1.09 | ) | | $ | 31,994 | | | | 28% | |
| $ | 2.86 | | | | 16.73 | | | | 2.16 | 6 7 | | | 2.31 | 6 7 | | | (0.91 | ) | | | (1.05 | ) | | $ | 30,980 | | | | 29% | |
| $ | 2.45 | | | | (43.89 | ) | | | 2.15 | 5 8 | | | 2.29 | 5 8 | | | (1.13 | ) | | | (1.26 | ) | | $ | 30,132 | | | | 44% | |
| $ | 4.40 | | | | 45.70 | | | | 2.12 | 5 | | | 2.12 | 5 | | | (1.33 | ) | | | (1.33 | ) | | $ | 52,307 | | | | 39% | |
| $ | 3.02 | | | | 10.22 | | | | 2.15 | 5 | | | 2.38 | 5 | | | (1.12 | ) | | | (1.34 | ) | | $ | 39,899 | | | | 33% | |
61
Financial Highlights (continued)
| | | | | | | | | | | | | | | | | | | | | | | | | | | | | | | | | | | | | | | | |
| | | | | Income (Loss) from
Investment Operations | | | | | | Less Distributions | | |
| | | Net Asset
Value
Beginning
of Period | | Net
Investment
Income (Loss) | | Net Realized
and Unrealized
Gains (Losses)
on Investments | | Total from
Investment
Operations | | Redemption
Fees
(See Note 2) | | Dividends
from Net
Investment
Income | | Distributions
from Net
Realized
Gains | | Total
Distributions |
| Frontier Emerging Small Countries Fund — Institutional Class | | | | | | | | | | | | | | | | | | | | | | | | | | | | | | | | | | | | | | | | |
| Year ended 9/30/24 | | | $ | 2.91 | | | | | (0.01 | ) | | | | 0.93 | | | | | 0.92 | | | | | — | 4 | | | | — | | | | | — | | | | | — | |
| Year ended 9/30/23 | | | $ | 2.48 | | | | | (0.19 | ) | | | | 0.62 | | | | | 0.43 | | | | | — | | | | | — | | | | | — | | | | | — | |
| Year ended 9/30/22 | | | $ | 4.46 | | | | | (0.03 | ) | | | | (1.91 | ) | | | | (1.94 | ) | | | | — | 4 | | | | (0.04 | ) | | | | — | | | | | (0.04 | ) |
| Year ended 9/30/21 | | | $ | 3.05 | | | | | (0.04 | ) | | | | 1.45 | | | | | 1.41 | | | | | — | 4 | | | | — | | | | | — | | | | | — | |
| Year ended 9/30/20 | | | $ | 2.76 | | | | | (0.08 | ) | | | | 0.37 | | | | | 0.29 | | | | | — | 4 | | | | — | | | | | — | | | | | — | |
| Global Opportunities Fund — Investor Class | | | | | | | | | | | | | | | | | | | | | | | | | | | | | | | | | | | | | | | | |
| Year ended 9/30/24 | | | $ | 3.74 | | | | | (0.05 | ) | | | | 1.08 | | | | | 1.03 | | | | | — | 4 | | | | — | | | | | — | | | | | — | |
| Year ended 9/30/23 | | | $ | 3.39 | | | | | (0.04 | ) | | | | 0.47 | | | | | 0.43 | | | | | — | 4 | | | | — | | | | | (0.08 | ) | | | | (0.08 | ) |
| Year ended 9/30/22 | | | $ | 5.83 | | | | | (0.04 | ) | | | | (1.96 | ) | | | | (2.00 | ) | | | | — | 4 | | | | (0.01 | ) | | | | (0.43 | ) | | | | (0.44 | ) |
| Year ended 9/30/21 | | | $ | 3.92 | | | | | (0.04 | ) | | | | 2.05 | | | | | 2.01 | | | | | — | 4 | | | | — | | | | | (0.10 | ) | | | | (0.10 | ) |
| Year ended 9/30/20 | | | $ | 3.46 | | | | | (0.05 | ) | | | | 0.81 | | | | | 0.76 | | | | | — | 4 | | | | — | | | | | (0.30 | ) | | | | (0.30 | ) |
| Global Opportunities Fund — Institutional Class | | | | | | | | | | | | | | | | | | | | | | | | | | | | | | | | | | | | | | | | |
| Year ended 9/30/24 | | | $ | 3.78 | | | | | (0.04 | ) | | | | 1.09 | | | | | 1.05 | | | | | — | 4 | | | | — | | | | | — | | | | | — | |
| Year ended 9/30/23 | | | $ | 3.42 | | | | | (0.02 | ) | | | | 0.46 | | | | | 0.44 | | | | | — | 4 | | | | — | | | | | (0.08 | ) | | | | (0.08 | ) |
| Year ended 9/30/22 | | | $ | 5.88 | | | | | (0.03 | ) | | | | (1.99 | ) | | | | (2.02 | ) | | | | — | 4 | | | | (0.01 | ) | | | | (0.43 | ) | | | | (0.44 | ) |
| Year ended 9/30/21 | | | $ | 3.94 | | | | | (0.05 | ) | | | | 2.09 | | | | | 2.04 | | | | | — | 4 | | | | — | | | | | (0.10 | ) | | | | (0.10 | ) |
| Year ended 9/30/20 | | | $ | 3.48 | | | | | (0.03 | ) | | | | 0.79 | | | | | 0.76 | | | | | — | 4 | | | | — | | | | | (0.30 | ) | | | | (0.30 | ) |
| Global Select Fund — Investor Class | | | | | | | | | | | | | | | | | | | | | | | | | | | | | | | | | | | | | | | | |
| Year ended 9/30/24 | | | $ | 10.26 | | | | | (0.16 | ) | | | | 2.46 | | | | | 2.30 | | | | | — | 4 | | | | — | | | | | — | | | | | — | |
| Year ended 9/30/23 | | | $ | 8.71 | | | | | (0.06 | ) | | | | 1.61 | | | | | 1.55 | | | | | — | 4 | | | | — | | | | | — | | | | | — | |
| Year ended 9/30/22 | | | $ | 15.83 | | | | | (0.10 | ) | | | | (5.24 | ) | | | | (5.34 | ) | | | | — | 4 | | | | — | | | | | (1.78 | ) | | | | (1.78 | ) |
| Year ended 9/30/21 | | | $ | 12.60 | | | | | (0.12 | ) | | | | 3.36 | | | | | 3.24 | | | | | 0.01 | | | | | — | | | | | (0.02 | ) | | | | (0.02 | ) |
| Year ended 9/30/2010 | | | $ | 10.00 | | | | | (0.06 | ) | | | | 2.65 | | | | | 2.59 | | | | | 0.01 | | | | | — | | | | | — | | | | | — | |
| Global Select Fund — Institutional Class | | | | | | | | | | | | | | | | | | | | | | | | | | | | | | | | | | | | | | | | |
| Year ended 9/30/24 | | | $ | 10.43 | | | | | (0.05 | ) | | | | 2.43 | | | | | 2.38 | | | | | — | | | | | — | | | | | — | | | | | — | |
| Year ended 9/30/23 | | | $ | 8.82 | | | | | (0.02 | ) | | | | 1.63 | | | | | 1.61 | | | | | — | | | | | — | | | | | — | | | | | — | |
| Year ended 9/30/22 | | | $ | 15.94 | | | | | (0.05 | ) | | | | (5.29 | ) | | | | (5.34 | ) | | | | — | 4 | | | | — | | | | | (1.78 | ) | | | | (1.78 | ) |
| Year ended 9/30/21 | | | $ | 12.64 | | | | | (0.07 | ) | | | | 3.39 | | | | | 3.32 | | | | | — | 4 | | | | — | | | | | (0.02 | ) | | | | (0.02 | ) |
| Year ended 9/30/2010 | | | $ | 10.00 | | | | | (0.04 | ) | | | | 2.68 | | | | | 2.64 | | | | | — | 4 | | | | — | | | | | — | | | | | — | |
| Global Value Fund — Investor Class | | | | | | | | | | | | | | | | | | | | | | | | | | | | | | | | | | | | | | | | |
| Year ended 9/30/24 | | | $ | 8.52 | | | | | 0.27 | | | | | 1.65 | | | | | 1.92 | | | | | — | 4 | | | | (0.29 | ) | | | | — | | | | | (0.29 | ) |
| Year ended 9/30/23 | | | $ | 8.00 | | | | | 0.25 | | | | | 1.05 | | | | | 1.30 | | | | | — | 4 | | | | (0.24 | ) | | | | (0.54 | ) | | | | (0.78 | ) |
| Year ended 9/30/22 | | | $ | 9.24 | | | | | 0.23 | | | | | (0.96 | ) | | | | (0.73 | ) | | | | — | 4 | | | | (0.23 | ) | | | | (0.28 | ) | | | | (0.51 | ) |
| Year ended 9/30/21 | | | $ | 6.56 | | | | | 0.18 | | | | | 2.65 | | | | | 2.83 | | | | | — | 4 | | | | (0.15 | ) | | | | — | | | | | (0.15 | ) |
| Year ended 9/30/20 | | | $ | 7.74 | | | | | 0.16 | | | | | (1.09 | )11 | | | | (0.93 | ) | | | | — | 4 | | | | (0.21 | ) | | | | (0.04 | ) | | | | (0.25 | ) |
| Global Value Fund — Institutional Class | | | | | | | | | | | | | | | | | | | | | | | | | | | | | | | | | | | | | | | | |
| Year ended 9/30/24 | | | $ | 8.50 | | | | | 0.25 | | | | | 1.68 | | | | | 1.93 | | | | | — | | | | | (0.30 | ) | | | | — | | | | | (0.30 | ) |
| Year ended 9/30/23 | | | $ | 7.99 | | | | | 0.25 | | | | | 1.05 | | | | | 1.30 | | | | | — | | | | | (0.25 | ) | | | | (0.54 | ) | | | | (0.79 | ) |
| Year ended 9/30/22 | | | $ | 9.23 | | | | | 0.25 | | | | | (0.97 | ) | | | | (0.72 | ) | | | | — | 4 | | | | (0.24 | ) | | | | (0.28 | ) | | | | (0.52 | ) |
| Year ended 9/30/21 | | | $ | 6.56 | | | | | 0.19 | | | | | 2.63 | | | | | 2.82 | | | | | 0.01 | | | | | (0.16 | ) | | | | — | | | | | (0.16 | ) |
| Year ended 9/30/20 | | | $ | 7.73 | | | | | 0.16 | | | | | (1.07 | )11 | | | | (0.91 | ) | | | | — | 4 | | | | (0.22 | ) | | | | (0.04 | ) | | | | (0.26 | ) |
| Greater China Fund — Investor Class | | | | | | | | | | | | | | | | | | | | | | | | | | | | | | | | | | | | | | | | |
| Year ended 9/30/24 | | | $ | 4.86 | | | | | 0.03 | | | | | 0.19 | | | | | 0.22 | | | | | — | 4 | | | | (0.01 | ) | | | | — | | | | | (0.01 | ) |
| Year ended 9/30/23 | | | $ | 5.98 | | | | | (0.04 | ) | | | | (0.69 | ) | | | | (0.73 | ) | | | | — | 4 | | | | (0.39 | ) | | | | — | | | | | (0.39 | ) |
| Year ended 9/30/22 | | | $ | 9.83 | | | | | (0.05 | ) | | | | (3.83 | )9 | | | | (3.88 | ) | | | | 0.03 | | | | | — | | | | | — | | | | | — | |
| Period ended 9/30/2113 | | | $ | 10.00 | | | | | (0.05 | ) | | | | (0.17 | ) | | | | (0.22 | ) | | | | 0.05 | | | | | — | | | | | — | | | | | — | |
| Greater China Fund — Institutional Class | | | | | | | | | | | | | | | | | | | | | | | | | | | | | | | | | | | | | | | | |
| Year ended 9/30/24 | | | $ | 4.84 | | | | | 0.04 | | | | | 0.19 | | | | | 0.23 | | | | | — | | | | | (0.01 | ) | | | | — | | | | | (0.01 | ) |
| Year ended 9/30/23 | | | $ | 5.96 | | | | | — | 4 | | | | (0.71 | ) | | | | (0.71 | ) | | | | — | | | | | (0.41 | ) | | | | — | | | | | (0.41 | ) |
| Year ended 9/30/22 | | | $ | 9.82 | | | | | (0.07 | ) | | | | (3.79 | )9 | | | | (3.86 | ) | | | | — | 4 | | | | — | | | | | — | | | | | — | |
| Period ended 9/30/2113 | | | $ | 10.00 | | | | | (0.03 | ) | | | | (0.15 | ) | | | | (0.18 | ) | | | | — | 4 | | | | — | | | | | — | | | | | — | |
See Notes to Financial Highlights and Notes to Financial Statements.
62
| | |
| | | (for a share outstanding throughout each period) |
| | | | | | | | | | | | | | | | | | | | | | | | | | | | | | |
| | | | | | |
Ratios to Average Net Assets | | | Supplemental Data | |
Net Asset
Value
End of
Period | | | Total Return (%)1 | | | Expenses
Net of
Waivers and
Reimbursements (%)2 | | | Expenses
Before
Waivers and
Reimbursements (%)2 | | | Net Investment
Income (Loss)
Net of Waivers and
Reimbursements (%)2 | | | Net Investment
Income (Loss)
Before Waivers and
Reimbursements (%)2 | | | Net Assets
End of Period
(000s) | | | Portfolio
Turnover
Rate1 3 | |
| | | | | | | | | | | | | | | | | | | | | | | | | | | | | | |
| $ | 3.83 | | | | 31.62 | | | | 1.96 | 6 7 | | | 2.52 | 6 7 | | | (0.67 | ) | | | (1.23 | ) | | $ | 7,605 | | | | 28% | |
| $ | 2.91 | | | | 17.34 | | | | 1.96 | 6 7 | | | 2.61 | 6 7 | | | (0.83 | ) | | | (1.47 | ) | | $ | 4,027 | | | | 29% | |
| $ | 2.48 | | | | (43.89 | ) | | | 1.95 | 5 8 | | | 2.08 | 5 8 | | | (0.88 | ) | | | (1.00 | ) | | $ | 10,416 | | | | 44% | |
| $ | 4.46 | | | | 46.23 | | | | 1.95 | 5 | | | 2.08 | 5 | | | (1.13 | ) | | | (1.26 | ) | | $ | 17,490 | | | | 39% | |
| $ | 3.05 | | | | 10.51 | | | | 1.96 | 5 | | | 2.18 | 5 | | | (0.98 | ) | | | (1.20 | ) | | $ | 10,560 | | | | 33% | |
| | | | | | | | | | | | | | | | | | | | | | | | | | | | | | |
| $ | 4.77 | | | | 27.54 | | | | 1.50 | 5 8 | | | 1.50 | 5 8 | | | (0.96 | ) | | | (0.96 | ) | | $ | 126,784 | | | | 32% | |
| $ | 3.74 | | | | 12.76 | | | | 1.50 | 6 7 | | | 1.50 | 6 7 | | | (0.93 | ) | | | (0.93 | ) | | $ | 117,596 | | | | 30% | |
| $ | 3.39 | | | | (36.97 | ) | | | 1.50 | 5 8 | | | 1.50 | 5 8 | | | (1.00 | ) | | | (1.00 | ) | | $ | 107,048 | | | | 33% | |
| $ | 5.83 | | | | 51.70 | | | | 1.46 | 5 | | | 1.46 | 5 | | | (1.08 | ) | | | (1.08 | ) | | $ | 181,563 | | | | 22% | |
| $ | 3.92 | | | | 23.20 | | | | 1.53 | 5 | | | 1.53 | 5 | | | (1.03 | ) | | | (1.03 | ) | | $ | 100,698 | | | | 20% | |
| | | | | | | | | | | | | | | | | | | | | | | | | | | | | | |
| $ | 4.83 | | | | 27.78 | | | | 1.35 | 5 8 | | | 1.40 | 5 8 | | | (0.82 | ) | | | (0.86 | ) | | $ | 81,604 | | | | 32% | |
| $ | 3.78 | | | | 12.94 | | | | 1.36 | 6 7 | | | 1.40 | 6 7 | | | (0.79 | ) | | | (0.83 | ) | | $ | 69,174 | | | | 30% | |
| $ | 3.42 | | | | (36.94 | ) | | | 1.35 | 5 8 | | | 1.38 | 5 8 | | | (0.85 | ) | | | (0.87 | ) | | $ | 55,266 | | | | 33% | |
| $ | 5.88 | | | | 52.21 | | | | 1.35 | 5 | | | 1.40 | 5 | | | (0.96 | ) | | | (1.01 | ) | | $ | 74,144 | | | | 22% | |
| $ | 3.94 | | | | 23.09 | | | | 1.35 | 5 | | | 1.48 | 5 | | | (0.83 | ) | | | (0.96 | ) | | $ | 38,795 | | | | 20% | |
| | | | | | | | | | | | | | | | | | | | | | | | | | | | | | |
| $ | 12.56 | | | | 22.42 | | | | 1.36 | 6 7 | | | 2.57 | 6 7 | | | (0.81 | ) | | | (2.02 | ) | | $ | 4,098 | | | | 21% | |
| $ | 10.26 | | | | 17.80 | | | | 1.36 | 5 8 | | | 2.57 | 5 8 | | | (0.58 | ) | | | (1.79 | ) | | $ | 4,620 | | | | 24% | |
| $ | 8.71 | | | | (37.76 | ) | | | 1.35 | 5 8 | | | 2.35 | 5 8 | | | (0.77 | ) | | | (1.77 | ) | | $ | 3,879 | | | | 30% | |
| $ | 15.83 | | | | 25.84 | | | | 1.35 | 5 | | | 2.17 | 5 | | | (0.86 | ) | | | (1.68 | ) | | $ | 7,054 | | | | 58% | |
| $ | 12.60 | | | | 26.00 | | | | 1.36 | 6 | | | 4.70 | 6 | | | (0.81 | ) | | | (4.16 | ) | | $ | 4,306 | | | | 35% | |
| | | | | | | | | | | | | | | | | | | | | | | | | | | | | | |
| $ | 12.81 | | | | 22.82 | | | | 0.96 | 6 7 | | | 1.67 | 6 7 | | | (0.40 | ) | | | (1.11 | ) | | $ | 11,047 | | | | 21% | |
| $ | 10.43 | | | | 18.25 | | | | 0.96 | 5 8 | | | 1.74 | 5 8 | | | (0.18 | ) | | | (0.96 | ) | | $ | 9,892 | | | | 24% | |
| $ | 8.82 | | | | (37.47 | ) | | | 0.95 | 5 8 | | | 1.53 | 5 8 | | | (0.35 | ) | | | (0.93 | ) | | $ | 8,828 | | | | 30% | |
| $ | 15.94 | | | | 26.31 | | | | 0.95 | 5 | | | 1.56 | 5 | | | (0.46 | ) | | | (1.07 | ) | | $ | 12,385 | | | | 58% | |
| $ | 12.64 | | | | 26.40 | | | | 0.96 | 6 | | | 2.79 | 6 | | | (0.42 | ) | | | (2.25 | ) | | $ | 9,065 | | | | 35% | |
| | | | | | | | | | | | | | | | | | | | | | | | | | | | | | |
| $ | 10.15 | | | | 22.88 | | | | 1.11 | 6 7 | | | 1.18 | 6 7 | | | 2.89 | | | | 2.81 | | | $ | 115,169 | | | | 25% | |
| $ | 8.52 | | | | 16.16 | | | | 1.11 | 5 8 | | | 1.18 | 5 8 | | | 2.80 | | | | 2.73 | | | $ | 112,591 | | | | 43% | |
| $ | 8.00 | | | | (8.55 | ) | | | 1.10 | 5 8 | | | 1.20 | 5 8 | | | 2.46 | | | | 2.36 | | | $ | 102,983 | | | | 47% | |
| $ | 9.24 | | | | 43.20 | | | | 1.10 | 5 | | | 1.18 | 5 | | | 1.97 | | | | 1.89 | | | $ | 119,966 | | | | 41% | |
| $ | 6.56 | | | | (12.18 | )12 | | | 1.10 | 5 | | | 1.30 | 5 | | | 2.04 | | | | 1.84 | | | $ | 96,323 | | | | 76% | |
| | | | | | | | | | | | | | | | | | | | | | | | | | | | | | |
| $ | 10.13 | | | | 23.12 | | | | 0.95 | 6 7 | | | 1.14 | 6 7 | | | 3.11 | | | | 2.93 | | | $ | 16,862 | | | | 25% | |
| $ | 8.50 | | | | 16.23 | | | | 0.96 | 5 8 | | | 1.12 | 5 8 | | | 3.00 | | | | 2.84 | | | $ | 31,649 | | | | 43% | |
| $ | 7.99 | | | | (8.42 | ) | | | 0.95 | 5 8 | | | 1.14 | 5 8 | | | 2.89 | | | | 2.71 | | | $ | 15,583 | | | | 47% | |
| $ | 9.23 | | | | 43.26 | | | | 0.99 | 5 | | | 1.43 | 5 | | | 2.04 | | | | 1.60 | | | $ | 7,163 | | | | 41% | |
| $ | 6.56 | | | | (11.93 | )12 | | | 0.95 | 5 | | | 1.38 | 5 | | | 2.21 | | | | 1.78 | | | $ | 6,449 | | | | 76% | |
| | | | | | | | | | | | | | | | | | | | | | | | | | | | | | |
| $ | 5.07 | | | | 4.59 | | | | 1.50 | 5 8 | | | 5.87 | 5 8 | | | 0.55 | | | | (3.82 | ) | | $ | 2,060 | | | | 24% | |
| $ | 4.86 | | | | (13.75 | ) | | | 1.53 | 6 7 | | | 4.77 | 6 7 | | | (0.41 | ) | | | (3.65 | ) | | $ | 1,755 | | | | 57% | |
| $ | 5.98 | | | | (39.17 | )16 | | | 1.62 | 6 7 18 | | | 3.56 | 6 7 18 | | | (0.56 | ) | | | (2.50 | ) | | $ | 2,122 | | | | 109% | |
| $ | 9.83 | | | | (1.70 | ) | | | 1.51 | 6 | | | 3.76 | 6 | | | (0.60 | ) | | | (2.85 | ) | | $ | 3,795 | | | | 43% | |
| | | | | | | | | | | | | | | | | | | | | | | | | | | | | | |
| $ | 5.06 | | | | 4.81 | | | | 1.25 | 5 8 | | | 3.92 | 5 8 | | | 0.79 | | | | (1.87 | ) | | $ | 2,524 | | | | 24% | |
| $ | 4.84 | | | | (13.56 | ) | | | 1.27 | 6 7 | | | 3.39 | 6 7 | | | (0.06 | ) | | | (2.18 | ) | | $ | 2,315 | | | | 57% | |
| $ | 5.96 | | | | (39.31 | )16 | | | 1.36 | 6 7 18 | | | 2.61 | 6 7 18 | | | (0.47 | ) | | | (1.72 | ) | | $ | 2,694 | | | | 109% | |
| $ | 9.82 | | | | (1.80 | ) | | | 1.26 | 6 | | | 3.09 | 6 | | | (0.34 | ) | | | (2.17 | ) | | $ | 6,779 | | | | 43% | |
63
Financial Highlights (continued)
| | | | | | | | | | | | | | | | | | | | | | | | | | | | | | | | | | | | | | | | |
| | | | | Income (Loss) from
Investment Operations | | | | | | Less Distributions | | |
| | | Net Asset
Value
Beginning
of Period | | Net
Investment
Income (Loss) | | Net Realized
and Unrealized
Gains (Losses)
on Investments | | Total from
Investment
Operations | | Redemption
Fees
(See Note 2) | | Dividends
from Net
Investment
Income | | Distributions
from Net
Realized
Gains | | Total
Distributions |
| International Growth Fund — Investor Class | | | | | | | | | | | | | | | | | | | | | | | | | | | | | | | | | | | | | | | | |
| Year ended 9/30/24 | | | $ | 21.60 | | | | | (0.09 | ) | | | | 4.94 | | | | | 4.85 | | | | | — | 4 | | | | — | | | | | — | | | | | — | |
| Year ended 9/30/23 | | | $ | 20.03 | | | | | (0.03 | ) | | | | 1.60 | | | | | 1.57 | | | | | — | 4 | | | | — | | | | | — | | | | | — | |
| Year ended 9/30/22 | | | $ | 38.79 | | | | | (0.07 | ) | | | | (15.16 | ) | | | | (15.23 | ) | | | | — | 4 | | | | — | | | | | (3.53 | ) | | | | (3.53 | ) |
| Year ended 9/30/21 | | | $ | 34.07 | | | | | (0.17 | ) | | | | 8.68 | | | | | 8.51 | | | | | — | 4 | | | | — | | | | | (3.79 | ) | | | | (3.79 | ) |
| Year ended 9/30/20 | | | $ | 28.23 | | | | | (0.20 | ) | | | | 6.82 | | | | | 6.62 | | | | | — | 4 | | | | — | | | | | (0.78 | ) | | | | (0.78 | ) |
| International Growth Fund — Institutional Class | | | | | | | | | | | | | | | | | | | | | | | | | | | | | | | | | | | | | | | | |
| Year ended 9/30/24 | | | $ | 21.80 | | | | | 0.43 | | | | | 4.51 | | | | | 4.94 | | | | | — | | | | | — | | | | | — | | | | | — | |
| Year ended 9/30/23 | | | $ | 20.20 | | | | | 0.08 | | | | | 1.52 | | | | | 1.60 | | | | | — | 4 | | | | — | | | | | — | | | | | — | |
| Year ended 9/30/22 | | | $ | 39.04 | | | | | (0.02 | ) | | | | (15.29 | ) | | | | (15.31 | ) | | | | — | 4 | | | | — | | | | | (3.53 | ) | | | | (3.53 | ) |
| Year ended 9/30/21 | | | $ | 34.24 | | | | | (0.13 | ) | | | | 8.72 | | | | | 8.59 | | | | | — | 4 | | | | — | | | | | (3.79 | ) | | | | (3.79 | ) |
| Year ended 9/30/20 | | | $ | 28.33 | | | | | (0.12 | ) | | | | 6.81 | | | | | 6.69 | | | | | — | 4 | | | | — | | | | | (0.78 | ) | | | | (0.78 | ) |
| International Opportunities Fund — Investor Class | | | | | | | | | | | | | | | | | | | | | | | | | | | | | | | | | | | | | | | | |
| Year ended 9/30/24 | | | $ | 2.72 | | | | | (0.08 | ) | | | | 0.63 | | | | | 0.55 | | | | | — | 4 | | | | — | | | | | — | | | | | — | |
| Year ended 9/30/23 | | | $ | 2.51 | | | | | (0.06 | ) | | | | 0.27 | | | | | 0.21 | | | | | — | 4 | | | | — | | | | | — | | | | | — | |
| Year ended 9/30/22 | | | $ | 5.26 | | | | | (0.05 | ) | | | | (2.06 | ) | | | | (2.11 | ) | | | | — | 4 | | | | — | | | | | (0.64 | ) | | | | (0.64 | ) |
| Year ended 9/30/21 | | | $ | 4.64 | | | | | (0.07 | ) | | | | 0.79 | | | | | 0.72 | | | | | — | 4 | | | | — | | | | | (0.10 | ) | | | | (0.10 | ) |
| Year ended 9/30/20 | | | $ | 3.54 | | | | | (0.09 | ) | | | | 1.28 | | | | | 1.19 | | | | | — | | | | | — | | | | | (0.09 | ) | | | | (0.09 | ) |
| International Opportunities Fund — Institutional Class | | | | | | | | | | | | | | | | | | | | | | | | | | | | | | | | | | | | | | | | |
| Year ended 9/30/24 | | | $ | 2.76 | | | | | — | | | | | 0.56 | | | | | 0.56 | | | | | — | 4 | | | | — | | | | | — | | | | | — | |
| Year ended 9/30/23 | | | $ | 2.55 | | | | | (0.02 | ) | | | | 0.23 | | | | | 0.21 | | | | | — | 4 | | | | — | | | | | — | | | | | — | |
| Year ended 9/30/22 | | | $ | 5.33 | | | | | (0.03 | ) | | | | (2.11 | ) | | | | (2.14 | ) | | | | — | 4 | | | | — | | | | | (0.64 | ) | | | | (0.64 | ) |
| Year ended 9/30/21 | | | $ | 4.71 | | | | | (0.05 | ) | | | | 0.77 | | | | | 0.72 | | | | | — | 4 | | | | — | | | | | (0.10 | ) | | | | (0.10 | ) |
| Year ended 9/30/20 | | | $ | 3.58 | | | | | (0.04 | ) | | | | 1.26 | | | | | 1.22 | | | | | — | | | | | — | | | | | (0.09 | ) | | | | (0.09 | ) |
| International Select Fund — Investor Class | | | | | | | | | | | | | | | | | | | | | | | | | | | | | | | | | | | | | | | | |
| Year ended 9/30/24 | | | $ | 10.25 | | | | | (0.06 | ) | | | | 2.36 | | | | | 2.30 | | | | | — | 4 | | | | — | | | | | — | | | | | — | |
| Year ended 9/30/23 | | | $ | 8.90 | | | | | (0.07 | ) | | | | 1.42 | | | | | 1.35 | | | | | — | 4 | | | | — | | | | | — | | | | | — | |
| Year ended 9/30/22 | | | $ | 14.96 | | | | | (0.10 | ) | | | | (5.97 | ) | | | | (6.07 | ) | | | | 0.01 | | | | | — | | | | | — | | | | | — | |
| Year ended 9/30/21 | | | $ | 12.61 | | | | | (0.07 | ) | | | | 2.41 | | | | | 2.34 | | | | | 0.01 | | | | | — | | | | | — | | | | | — | |
| Year ended 9/30/2010 | | | $ | 10.00 | | | | | (0.04 | ) | | | | 2.64 | | | | | 2.60 | | | | | 0.01 | | | | | — | | | | | — | | | | | — | |
| International Select Fund — Institutional Class | | | | | | | | | | | | | | | | | | | | | | | | | | | | | | | | | | | | | | | | |
| Year ended 9/30/24 | | | $ | 10.43 | | | | | 0.05 | | | | | 2.33 | | | | | 2.38 | | | | | — | | | | | — | | | | | — | | | | | — | |
| Year ended 9/30/23 | | | $ | 9.01 | | | | | 0.03 | | | | | 1.39 | | | | | 1.42 | | | | | — | | | | | — | | | | | — | | | | | — | |
| Year ended 9/30/22 | | | $ | 15.10 | | | | | (0.04 | ) | | | | (6.05 | ) | | | | (6.09 | ) | | | | — | | | | | — | | | | | — | | | | | — | |
| Year ended 9/30/21 | | | $ | 12.69 | | | | | — | 4 | | | | 2.41 | | | | | 2.41 | | | | | — | | | | | — | | | | | — | | | | | — | |
| Year ended 9/30/2010 | | | $ | 10.00 | | | | | (0.02 | ) | | | | 2.68 | | | | | 2.66 | | | | | 0.03 | | | | | — | | | | | — | | | | | — | |
| Long/Short Alpha Fund — Investor Class | | | | | | | | | | | | | | | | | | | | | | | | | | | | | | | | | | | | | | | | |
| Year ended 9/30/24 | | | $ | 11.51 | | | | | (0.02 | ) | | | | 3.87 | | | | | 3.85 | | | | | — | 4 | | | | — | | | | | — | | | | | — | |
| Year ended 9/30/23 | | | $ | 9.01 | | | | | (0.08 | ) | | | | 2.59 | | | | | 2.51 | | | | | — | 4 | | | | — | | | | | (0.01 | ) | | | | (0.01 | ) |
| Year ended 9/30/2214 | | | $ | 10.00 | | | | | (0.16 | ) | | | | (0.83 | ) | | | | (0.99 | ) | | | | — | 4 | | | | — | | | | | — | | | | | — | |
| Long/Short Alpha Fund — Institutional Class | | | | | | | | | | | | | | | | | | | | | | | | | | | | | | | | | | | | | | | | |
| Year ended 9/30/24 | | | $ | 11.56 | | | | | 0.02 | | | | | 3.86 | | | | | 3.88 | | | | | — | 4 | | | | — | | | | | — | | | | | — | |
| Year ended 9/30/23 | | | $ | 9.03 | | | | | (0.12 | ) | | | | 2.66 | | | | | 2.54 | | | | | — | 4 | | | | — | | | | | (0.01 | ) | | | | (0.01 | ) |
| Year ended 9/30/2214 | | | $ | 10.00 | | | | | (0.13 | ) | | | | (0.84 | ) | | | | (0.97 | ) | | | | — | 4 | | | | — | | | | | — | | | | | — | |
| Micro Cap Fund — Investor Class | | | | | | | | | | | | | | | | | | | | | | | | | | | | | | | | | | | | | | | | |
| Year ended 9/30/24 | | | $ | 6.07 | | | | | (0.11 | ) | | | | 2.10 | | | | | 1.99 | | | | | — | 4 | | | | — | | | | | — | | | | | — | |
| Year ended 9/30/23 | | | $ | 5.72 | | | | | (0.11 | ) | | | | 0.46 | | | | | 0.35 | | | | | — | 4 | | | | — | | | | | — | | | | | — | |
| Year ended 9/30/22 | | | $ | 12.55 | | | | | (0.13 | ) | | | | (3.80 | ) | | | | (3.93 | ) | | | | — | 4 | | | | — | | | | | (2.90 | ) | | | | (2.90 | ) |
| Year ended 9/30/21 | | | $ | 9.56 | | | | | (0.19 | ) | | | | 3.85 | | | | | 3.66 | | | | | — | 4 | | | | — | | | | | (0.67 | ) | | | | (0.67 | ) |
| Year ended 9/30/20 | | | $ | 7.45 | | | | | (0.10 | ) | | | | 3.08 | | | | | 2.98 | | | | | — | | | | | — | | | | | (0.87 | ) | | | | (0.87 | ) |
| Micro Cap Fund — Institutional Class | | | | | | | | | | | | | | | | | | | | | | | | | | | | | | | | | | | | | | | | |
| Year ended 9/30/24 | | | $ | 6.07 | | | | | (0.09 | ) | | | | 2.09 | | | | | 2.00 | | | | | — | 4 | | | | — | | | | | — | | | | | — | |
| Year ended 9/30/23 | | | $ | 5.72 | | | | | (0.09 | ) | | | | 0.44 | | | | | 0.35 | | | | | — | 4 | | | | — | | | | | — | | | | | — | |
| Year ended 9/30/22 | | | $ | 12.55 | | | | | (0.13 | ) | | | | (3.80 | ) | | | | (3.93 | ) | | | | — | 4 | | | | — | | | | | (2.90 | ) | | | | (2.90 | ) |
| Year ended 9/30/21 | | | $ | 9.55 | | | | | (0.19 | ) | | | | 3.86 | | | | | 3.67 | | | | | — | 4 | | | | — | | | | | (0.67 | ) | | | | (0.67 | ) |
| Period ended 9/30/2011 | | | $ | 7.74 | | | | | (0.05 | ) | | | | 1.86 | | | | | 1.81 | | | | | — | | | | | — | | | | | — | | | | | — | |
See Notes to Financial Highlights and Notes to Financial Statements.
64
| | |
| | | (for a share outstanding throughout each period) |
| | | | | | | | | | | | | | | | | | | | | | | | | | | | | | |
| | | | | | |
Ratios to Average Net Assets | | | Supplemental Data | |
Net Asset
Value
End of
Period | | | Total Return (%)1 | | | Expenses
Net of
Waivers and
Reimbursements (%)2 | | | Expenses
Before
Waivers and
Reimbursements (%)2 | | | Net Investment
Income (Loss)
Net of Waivers and
Reimbursements (%)2 | | | Net Investment
Income (Loss)
Before Waivers and
Reimbursements (%)2 | | | Net Assets
End of Period
(000s) | | | Portfolio
Turnover
Rate1 3 | |
| | | | | | | | | | | | | | | | | | | | | | | | | | | | | | |
| $ | 26.45 | | | | 22.50 | | | | 1.49 | 6 7 | | | 1.49 | 6 7 | | | (0.11 | ) | | | (0.11 | ) | | $ | 211,932 | | | | 34% | |
| $ | 21.60 | | | | 7.84 | | | | 1.41 | 5 8 | | | 1.41 | 5 8 | | | 0.08 | | | | 0.08 | | | $ | 231,089 | | | | 31% | |
| $ | 20.03 | | | | (42.98 | ) | | | 1.44 | 5 8 | | | 1.44 | 5 8 | | | (0.14 | ) | | | (0.14 | ) | | $ | 279,608 | | | | 20% | |
| $ | 38.79 | | | | 26.59 | | | | 1.41 | 5 | | | 1.41 | 5 | | | (0.47 | ) | | | (0.47 | ) | | $ | 579,102 | | | | 25% | |
| $ | 34.07 | | | | 23.73 | | | | 1.47 | 5 | | | 1.47 | 5 | | | (0.50 | ) | | | (0.50 | ) | | $ | 497,104 | | | | 45% | |
| | | | | | | | | | | | | | | | | | | | | | | | | | | | | | |
| $ | 26.74 | | | | 22.66 | | | | 1.36 | 6 7 | | | 1.38 | 6 7 | | | 0.01 | | | | (0.01 | ) | | $ | 86,139 | | | | 34% | |
| $ | 21.80 | | | | 7.92 | | | | 1.29 | 5 8 | | | 1.29 | 5 8 | | | 0.16 | | | | 0.16 | | | $ | 223,565 | | | | 31% | |
| $ | 20.20 | | | | (42.90 | ) | | | 1.33 | 5 8 | | | 1.33 | 5 8 | | | (0.03 | ) | | | (0.03 | ) | | $ | 319,936 | | | | 20% | |
| $ | 39.04 | | | | 26.70 | | | | 1.32 | 5 | | | 1.32 | 5 | | | (0.38 | ) | | | (0.38 | ) | | $ | 699,377 | | | | 25% | |
| $ | 34.24 | | | | 23.89 | | | | 1.35 | 5 | | | 1.36 | 5 | | | (0.38 | ) | | | (0.38 | ) | | $ | 569,068 | | | | 45% | |
| | | | | | | | | | | | | | | | | | | | | | | | | | | | | | |
| $ | 3.27 | | | | 20.22 | | | | 2.04 | 6 7 | | | 2.04 | 6 7 | | | (0.64 | ) | | | (0.64 | ) | | $ | 51,745 | | | | 25% | |
| $ | 2.72 | | | | 8.37 | | | | 1.97 | 6 7 | | | 1.97 | 6 7 | | | (0.52 | ) | | | (0.52 | ) | | $ | 54,964 | | | | 20% | |
| $ | 2.51 | | | | (45.24 | ) | | | 1.96 | 5 8 | | | 1.96 | 5 8 | | | (1.05 | ) | | | (1.05 | ) | | $ | 64,198 | | | | 39% | |
| $ | 5.26 | | | | 15.68 | | | | 1.91 | 5 | | | 1.91 | 5 | | | (1.14 | ) | | | (1.14 | ) | | $ | 139,189 | | | | 35% | |
| $ | 4.64 | | | | 34.24 | | | | 2.02 | 6 | | | 2.02 | 6 | | | (1.20 | ) | | | (1.20 | ) | | $ | 129,071 | | | | 35% | |
| | | | | | | | | | | | | | | | | | | | | | | | | | | | | | |
| $ | 3.32 | | | | 20.29 | | | | 1.96 | 6 7 | | | 2.02 | 6 7 | | | (0.62 | ) | | | (0.67 | ) | | $ | 94,630 | | | | 25% | |
| $ | 2.76 | | | | 8.24 | | | | 1.92 | 6 7 | | | 1.92 | 6 7 | | | (0.51 | ) | | | (0.51 | ) | | $ | 226,305 | | | | 20% | |
| $ | 2.55 | | | | (45.21 | ) | | | 1.91 | 5 8 | | | 1.91 | 5 8 | | | (0.97 | ) | | | (0.97 | ) | | $ | 354,481 | | | | 39% | |
| $ | 5.33 | | | | 15.44 | | | | 1.89 | 5 | | | 1.89 | 5 | | | (1.10 | ) | | | (1.10 | ) | | $ | 675,768 | | | | 35% | |
| $ | 4.71 | | | | 34.71 | | | | 1.93 | 5 | | | 1.93 | 5 | | | (1.06 | ) | | | (1.06 | ) | | $ | 544,914 | | | | 35% | |
| | | | | | | | | | | | | | | | | | | | | | | | | | | | | | |
| $ | 12.55 | | | | 22.44 | | | | 1.30 | 5 8 | | | 4.53 | 5 8 | | | (0.40 | ) | | | (3.62 | ) | | $ | 2,627 | | | | 43% | |
| $ | 10.25 | | | | 15.17 | | | | 1.35 | 6 7 | | | 3.88 | 6 7 | | | (0.41 | ) | | | (2.95 | ) | | $ | 2,481 | | | | 22% | |
| $ | 8.90 | | | | (40.51 | ) | | | 1.30 | 5 8 | | | 3.34 | 5 8 | | | (0.72 | ) | | | (2.76 | ) | | $ | 2,514 | | | | 27% | |
| $ | 14.96 | | | | 18.64 | | | | 1.30 | 5 | | | 3.09 | 5 | | | (0.68 | ) | | | (2.46 | ) | | $ | 4,763 | | | | 35% | |
| $ | 12.61 | | | | 26.10 | | | | 1.30 | 5 | | | 6.96 | 5 | | | (0.55 | ) | | | (6.20 | ) | | $ | 2,861 | | | | 36% | |
| | | | | | | | | | | | | | | | | | | | | | | | | | | | | | |
| $ | 12.81 | | | | 22.82 | | | | 0.90 | 5 8 | | | 4.38 | 5 8 | | | (0.04 | ) | | | (3.51 | ) | | $ | 1,340 | | | | 43% | |
| $ | 10.43 | | | | 15.76 | | | | 0.94 | 6 7 | | | 3.19 | 6 7 | | | (0.05 | ) | | | (2.30 | ) | | $ | 1,526 | | | | 22% | |
| $ | 9.01 | | | | (40.33 | ) | | | 0.90 | 5 8 | | | 2.37 | 5 8 | | | (0.30 | ) | | | (1.76 | ) | | $ | 2,788 | | | | 27% | |
| $ | 15.10 | | | | 18.99 | | | | 0.90 | 5 | | | 3.03 | 5 | | | (0.27 | ) | | | (2.40 | ) | | $ | 4,746 | | | | 35% | |
| $ | 12.69 | | | | 26.90 | | | | 0.90 | 6 | | | 7.68 | 6 | | | (0.19 | ) | | | (6.96 | ) | | $ | 2,069 | | | | 36% | |
| | | | | | | | | | | | | | | | | | | | | | | | | | | | | | |
| $ | 15.36 | | | | 33.45 | | | | 2.21 | 6 7 17 | | | 2.21 | 6 7 17 | | | (0.37 | ) | | | (0.37 | ) | | $ | 44,488 | | | | 41% | |
| $ | 11.51 | | | | 27.87 | | | | 2.67 | 6 7 17 | | | 2.85 | 6 7 17 | | | (1.16 | ) | | | (1.34 | ) | | $ | 22,895 | | | | 75% | |
| $ | 9.01 | | | | (9.90 | ) | | | 2.41 | 6 7 17 | | | 3.14 | 6 7 17 | | | (1.62 | ) | | | (2.35 | ) | | $ | 8,184 | | | | 55% | |
| | | | | | | | | | | | | | | | | | | | | | | | | | | | | | |
| $ | 15.44 | | | | 33.56 | | | | 2.07 | 6 7 17 | | | 2.09 | 6 7 17 | | | (0.19 | ) | | | (0.20 | ) | | $ | 34,382 | | | | 41% | |
| $ | 11.56 | | | | 28.14 | | | | 2.34 | 6 7 17 | | | 2.71 | 6 7 17 | | | (0.99 | ) | | | (1.37 | ) | | $ | 11,579 | | | | 75% | |
| $ | 9.03 | | | | (9.70 | ) | | | 2.20 | 6 7 17 | | | 3.10 | 6 7 17 | | | (1.47 | ) | | | (2.37 | ) | | $ | 13,782 | | | | 55% | |
| | | | | | | | | | | | | | | | | | | | | | | | | | | | | | |
| $ | 8.06 | | | | 32.78 | | | | 1.66 | 5 8 | | | 1.66 | 5 8 | | | (1.39 | ) | | | (1.39 | ) | | $ | 591,440 | | | | 51% | |
| $ | 6.07 | | | | 6.12 | | | | 1.66 | 5 8 | | | 1.66 | 5 8 | | | (1.46 | ) | | | (1.46 | ) | | $ | 509,106 | | | | 57% | |
| $ | 5.72 | | | | (39.42 | ) | | | 1.66 | 5 8 | | | 1.66 | 5 8 | | | (1.54 | ) | | | (1.54 | ) | | $ | 558,093 | | | | 59% | |
| $ | 12.55 | | | | 38.81 | | | | 1.63 | 5 | | | 1.63 | 5 | | | (1.52 | ) | | | (1.52 | ) | | $ | 1,155,133 | | | | 63% | |
| $ | 9.56 | | | | 43.47 | | | | 1.66 | 5 | | | 1.66 | 5 | | | (1.48 | ) | | | (1.48 | ) | | $ | 746,749 | | | | 75% | |
| | | | | | | | | | | | | | | | | | | | | | | | | | | | | | |
| $ | 8.07 | | | | 32.95 | | | | 1.59 | 5 8 | | | 1.59 | 5 8 | | | (1.33 | ) | | | (1.33 | ) | | $ | 90,455 | | | | 51% | |
| $ | 6.07 | | | | 6.12 | | | | 1.59 | 5 8 | | | 1.59 | 5 8 | | | (1.39 | ) | | | (1.39 | ) | | $ | 74,849 | | | | 57% | |
| $ | 5.72 | | | | (39.40 | ) | | | 1.59 | 5 8 | | | 1.59 | 5 8 | | | (1.47 | ) | | | (1.47 | ) | | $ | 76,558 | | | | 59% | |
| $ | 12.55 | | | | 38.96 | | | | 1.56 | 5 | | | 1.56 | 5 | | | (1.45 | ) | | | (1.45 | ) | | $ | 198,477 | | | | 63% | |
| $ | 9.55 | | | | 23.39 | | | | 1.60 | 5 | | | 1.62 | 5 | | | (1.43 | ) | | | (1.45 | ) | | $ | 59,124 | | | | 75% | |
65
Financial Highlights (continued)
| | | | | | | | | | | | | | | | | | | | | | | | | | | | | | | | | | | | | | | | |
| | | | | Income (Loss) from
Investment Operations | | | | | | Less Distributions | | |
| | | Net Asset
Value
Beginning
of Period | | Net
Investment
Income (Loss) | | Net Realized
and Unrealized
Gains (Losses)
on Investments | | Total from
Investment
Operations | | Redemption
Fees
(See Note 2) | | Dividends
from Net
Investment
Income | | Distributions
from Net
Realized
Gains | | Total
Distributions |
| Micro Cap Value Fund — Investor Class | | | | | | | | | | | | | | | | | | | | | | | | | | | | | | | | | | | | | | | | |
| Year ended 9/30/24 | | | $ | 2.97 | | | | | (0.02 | ) | | | | 1.00 | | | | | 0.98 | | | | | — | 4 | | | | — | | | | | — | | | | | — | |
| Year ended 9/30/23 | | | $ | 2.79 | | | | | (0.03 | ) | | | | 0.21 | | | | | 0.18 | | | | | — | 4 | | | | — | | | | | — | | | | | — | |
| Year ended 9/30/22 | | | $ | 5.10 | | | | | (0.04 | ) | | | | (1.33 | ) | | | | (1.37 | ) | | | | — | 4 | | | | — | | | | | (0.94 | ) | | | | (0.94 | ) |
| Year ended 9/30/21 | | | $ | 3.65 | | | | | (0.04 | ) | | | | 2.02 | | | | | 1.98 | | | | | — | 4 | | | | — | | | | | (0.53 | ) | | | | (0.53 | ) |
| Year ended 9/30/20 | | | $ | 3.21 | | | | | (0.04 | ) | | | | 0.78 | | | | | 0.74 | | | | | — | | | | | — | | | | | (0.30 | ) | | | | (0.30 | ) |
| Micro Cap Value Fund — Institutional Class | | | | | | | | | | | | | | | | | | | | | | | | | | | | | | | | | | | | | | | | |
| Year ended 9/30/24 | | | $ | 2.99 | | | | | (0.01 | ) | | | | 1.00 | | | | | 0.99 | | | | | — | 4 | | | | — | | | | | — | | | | | — | |
| Year ended 9/30/23 | | | $ | 2.81 | | | | | (0.02 | ) | | | | 0.20 | | | | | 0.18 | | | | | — | 4 | | | | — | | | | | — | | | | | — | |
| Year ended 9/30/22 | | | $ | 5.12 | | | | | (0.04 | ) | | | | (1.33 | ) | | | | (1.37 | ) | | | | — | 4 | | | | — | | | | | (0.94 | ) | | | | (0.94 | ) |
| Year ended 9/30/21 | | | $ | 3.66 | | | | | (0.05 | ) | | | | 2.04 | | | | | 1.99 | | | | | — | 4 | | | | — | | | | | (0.53 | ) | | | | (0.53 | ) |
| Period ended 9/30/2011 | | | $ | 3.26 | | | | | (0.01 | ) | | | | 0.41 | | | | | 0.40 | | | | | — | | | | | — | | | | | — | | | | | — | |
| Small Cap Growth Fund — Investor Class | | | | | | | | | | | | | | | | | | | | | | | | | | | | | | | | | | | | | | | | |
| Year ended 9/30/24 | | | $ | 32.29 | | | | | (0.47 | ) | | | | 7.80 | | | | | 7.33 | | | | | — | 4 | | | | — | | | | | — | | | | | — | |
| Year ended 9/30/23 | | | $ | 29.19 | | | | | (0.38 | ) | | | | 3.48 | | | | | 3.10 | | | | | — | 4 | | | | — | | | | | — | | | | | — | |
| Year ended 9/30/22 | | | $ | 62.46 | | | | | (0.46 | ) | | | | (21.99 | ) | | | | (22.45 | ) | | | | — | 4 | | | | — | | | | | (10.82 | ) | | | | (10.82 | ) |
| Year ended 9/30/21 | | | $ | 46.64 | | | | | (0.57 | ) | | | | 19.94 | | | | | 19.37 | | | | | — | 4 | | | | — | | | | | (3.55 | ) | | | | (3.55 | ) |
| Year ended 9/30/20 | | | $ | 40.23 | | | | | (0.32 | ) | | | | 12.52 | | | | | 12.20 | | | | | — | | | | | — | | | | | (5.79 | ) | | | | (5.79 | ) |
| Small Cap Growth Fund — Institutional Class | | | | | | | | | | | | | | | | | | | | | | | | | | | | | | | | | | | | | | | | |
| Year ended 9/30/24 | | | $ | 32.88 | | | | | (0.36 | ) | | | | 7.86 | | | | | 7.50 | | | | | — | 4 | | | | — | | | | | — | | | | | — | |
| Year ended 9/30/23 | | | $ | 29.70 | | | | | (0.28 | ) | | | | 3.46 | | | | | 3.18 | | | | | — | 4 | | | | — | | | | | — | | | | | — | |
| Year ended 9/30/22 | | | $ | 63.29 | | | | | (0.42 | ) | | | | (22.35 | ) | | | | (22.77 | ) | | | | — | 4 | | | | — | | | | | (10.82 | ) | | | | (10.82 | ) |
| Year ended 9/30/21 | | | $ | 47.18 | | | | | (0.51 | ) | | | | 20.17 | | | | | 19.66 | | | | | — | 4 | | | | — | | | | | (3.55 | ) | | | | (3.55 | ) |
| Year ended 9/30/20 | | | $ | 40.60 | | | | | (0.28 | ) | | | | 12.65 | | | | | 12.37 | | | | | — | | | | | — | | | | | (5.79 | ) | | | | (5.79 | ) |
| Small Cap Value Fund — Investor Class | | | | | | | | | | | | | | | | | | | | | | | | | | | | | | | | | | | | | | | | |
| Year ended 9/30/24 | | | $ | 9.14 | | | | | (— | ) | | | | 2.97 | | | | | 2.97 | | | | | — | 4 | | | | — | | | | | (0.38 | ) | | | | (0.38 | ) |
| Year ended 9/30/23 | | | $ | 7.49 | | | | | (0.02 | ) | | | | 1.86 | | | | | 1.84 | | | | | — | 4 | | | | — | | | | | (0.19 | ) | | | | (0.19 | ) |
| Year ended 9/30/22 | | | $ | 10.68 | | | | | — | 4 | | | | (2.38 | ) | | | | (2.38 | ) | | | | — | 4 | | | | — | 4 | | | | (0.81 | ) | | | | (0.81 | ) |
| Year ended 9/30/21 | | | $ | 6.99 | | | | | (0.02 | ) | | | | 3.71 | | | | | 3.69 | | | | | — | 4 | | | | — | | | | | — | | | | | — | |
| Year ended 9/30/20 | | | $ | 7.61 | | | | | 0.01 | | | | | (0.54 | ) | | | | (0.53 | ) | | | | — | | | | | (0.04 | ) | | | | (0.05 | ) | | | | (0.09 | ) |
| Small Cap Value Fund — Institutional Class | | | | | | | | | | | | | | | | | | | | | | | | | | | | | | | | | | | | | | | | |
| Year ended 9/30/24 | | | $ | 9.24 | | | | | 0.01 | | | | | 3.01 | | | | | 3.02 | | | | | — | 4 | | | | — | | | | | (0.38 | ) | | | | (0.38 | ) |
| Year ended 9/30/23 | | | $ | 7.56 | | | | | — | | | | | 1.87 | | | | | 1.87 | | | | | — | 4 | | | | — | | | | | (0.19 | ) | | | | (0.19 | ) |
| Year ended 9/30/22 | | | $ | 10.78 | | | | | 0.01 | | | | | (2.41 | ) | | | | (2.40 | ) | | | | — | 4 | | | | (0.01 | ) | | | | (0.81 | ) | | | | (0.82 | ) |
| Year ended 9/30/21 | | | $ | 7.05 | | | | | — | 4 | | | | 3.73 | | | | | 3.73 | | | | | — | 4 | | | | — | | | | | — | | | | | — | |
| Year ended 9/30/20 | | | $ | 7.67 | | | | | 0.03 | | | | | (0.55 | ) | | | | (0.52 | ) | | | | — | | | | | (0.05 | ) | | | | (0.05 | ) | | | | (0.10 | ) |
| Ultra Growth Fund — Investor Class | | | | | | | | | | | | | | | | | | | | | | | | | | | | | | | | | | | | | | | | |
| Year ended 9/30/24 | | | $ | 26.54 | | | | | (0.54 | ) | | | | 8.04 | | | | | 7.50 | | | | | — | 4 | | | | — | | | | | — | | | | | — | |
| Year ended 9/30/23 | | | $ | 26.29 | | | | | (0.38 | ) | | | | 0.63 | | | | | 0.25 | | | | | — | 4 | | | | — | | | | | — | | | | | — | |
| Year ended 9/30/22 | | | $ | 50.98 | | | | | (0.43 | ) | | | | (18.93 | ) | | | | (19.36 | ) | | | | — | 4 | | | | — | | | | | (5.33 | ) | | | | (5.33 | ) |
| Year ended 9/30/21 | | | $ | 39.56 | | | | | (0.48 | ) | | | | 13.30 | | | | | 12.82 | | | | | 0.01 | | | | | — | | | | | (1.41 | ) | | | | (1.41 | ) |
| Year ended 9/30/20 | | | $ | 25.30 | | | | | (0.17 | ) | | | | 14.98 | | | | | 14.81 | | | | | 0.01 | | | | | — | | | | | (0.56 | ) | | | | (0.56 | ) |
| Ultra Growth Fund — Institutional Class | | | | | | | | | | | | | | | | | | | | | | | | | | | | | | | | | | | | | | | | |
| Year ended 9/30/24 | | | $ | 26.63 | | | | | (0.29 | ) | | | | 7.87 | | | | | 7.58 | | | | | — | 4 | | | | — | | | | | — | | | | | — | |
| Year ended 9/30/23 | | | $ | 26.37 | | | | | (0.23 | ) | | | | 0.53 | | | | | 0.30 | | | | | — | 4 | | | | (0.04 | ) | | | | — | | | | | (0.04 | ) |
| Year ended 9/30/22 | | | $ | 51.05 | | | | | (0.34 | ) | | | | (19.01 | ) | | | | (19.35 | ) | | | | — | 4 | | | | — | | | | | (5.33 | ) | | | | (5.33 | ) |
| Year ended 9/30/21 | | | $ | 39.58 | | | | | (0.41 | ) | | | | 13.28 | | | | | 12.87 | | | | | 0.01 | | | | | — | | | | | (1.41 | ) | | | | (1.41 | ) |
| Period ended 9/30/2011 | | | $ | 29.39 | | | | | (0.09 | ) | | | | 10.28 | | | | | 10.19 | | | | | — | 4 | | | | — | | | | | — | | | | | — | |
| U.S. Select Fund — Investor Class | | | | | | | | | | | | | | | | | | | | | | | | | | | | | | | | | | | | | | | | |
| Year ended 9/30/24 | | | $ | 12.07 | | | | | (0.07 | ) | | | | 3.32 | | | | | 3.25 | | | | | — | 4 | | | | — | | | | | — | | | | | — | |
| Year ended 9/30/23 | | | $ | 9.74 | | | | | (0.03 | ) | | | | 2.36 | | | | | 2.33 | | | | | — | 4 | | | | — | | | | | — | | | | | — | |
| Year ended 9/30/2215 | | | $ | 10.00 | | | | | (0.01 | ) | | | | (0.26 | ) | | | | (0.27 | ) | | | | 0.01 | | | | | — | | | | | — | | | | | — | |
See Notes to Financial Highlights and Notes to Financial Statements.
66
| | |
| | | (for a share outstanding throughout each period) |
| | | | | | | | | | | | | | | | | | | | | | | | | | | | | | |
| | | | | | |
Ratios to Average Net Assets | | | Supplemental Data | |
Net Asset
Value
End of
Period | | | Total Return (%)1 | | | Expenses
Net of
Waivers and
Reimbursements (%)2 | | | Expenses
Before
Waivers and
Reimbursements (%)2 | | | Net Investment
Income (Loss)
Net of Waivers and
Reimbursements (%)2 | | | Net Investment
Income (Loss)
Before Waivers and
Reimbursements (%)2 | | | Net Assets
End of Period
(000s) | | | Portfolio
Turnover
Rate1 3 | |
| | | | | | | | | | | | | | | | | | | | | | | | | | | | | | |
| $ | 3.95 | | | | 33.00 | | | | 1.71 | 5 8 | | | 1.71 | 5 8 | | | (0.47 | ) | | | (0.47 | ) | | $ | 265,555 | | | | 54% | |
| $ | 2.97 | | | | 6.45 | | | | 1.73 | 5 8 | | | 1.73 | 5 8 | | | (0.82 | ) | | | (0.82 | ) | | $ | 234,553 | | | | 59% | |
| $ | 2.79 | | | | (32.47 | ) | | | 1.70 | 5 8 | | | 1.70 | 5 | | | (1.13 | ) | | | (1.13 | ) | | $ | 249,290 | | | | 50% | |
| $ | 5.10 | | | | 58.11 | | | | 1.66 | 5 | | | 1.66 | 5 | | | (1.15 | ) | | | (1.15 | ) | | $ | 387,236 | | | | 82% | |
| $ | 3.65 | | | | 24.17 | | | | 1.74 | 5 | | | 1.74 | | | | (1.01 | ) | | | (1.01 | ) | | $ | 222,963 | | | | 63% | |
| | | | | | | | | | | | | | | | | | | | | | | | | | | | | | |
| $ | 3.98 | | | | 33.11 | | | | 1.60 | 5 8 | | | 1.63 | 5 8 | | | (0.34 | ) | | | (0.37 | ) | | $ | 62,714 | | | | 54% | |
| $ | 2.99 | | | | 6.41 | | | | 1.61 | 5 8 | | | 1.65 | 5 8 | | | (0.69 | ) | | | (0.74 | ) | | $ | 42,440 | | | | 59% | |
| $ | 2.81 | | | | (32.31 | ) | | | 1.60 | 5 8 | | | 1.63 | 5 8 | | | (1.03 | ) | | | (1.06 | ) | | $ | 42,952 | | | | 50% | |
| $ | 5.12 | | | | 58.25 | | | | 1.60 | 5 | | | 1.61 | 5 | | | (1.10 | ) | | | (1.10 | ) | | $ | 56,381 | | | | 82% | |
| $ | 3.66 | | | | 12.27 | | | | 1.60 | 5 | | | 1.84 | 5 | | | (0.99 | ) | | | (1.23 | ) | | $ | 25,317 | | | | 63% | |
| | | | | | | | | | | | | | | | | | | | | | | | | | | | | | |
| $ | 39.62 | | | | 22.70 | | | | 1.15 | 5 | | | 1.15 | 5 | | | (0.97 | ) | | | (0.97 | ) | | $ | 869,768 | | | | 28% | |
| $ | 32.29 | | | | 10.62 | | | | 1.15 | 5 8 | | | 1.15 | 5 8 | | | (0.94 | ) | | | (0.94 | ) | | $ | 837,158 | | | | 27% | |
| $ | 29.19 | | | | (42.42 | ) | | | 1.15 | 5 8 | | | 1.15 | 5 8 | | | (1.05 | ) | | | (1.05 | ) | | $ | 848,033 | | | | 32% | |
| $ | 62.46 | | | | 42.49 | | | | 1.12 | 5 | | | 1.12 | 5 | | | (1.00 | ) | | | (1.00 | ) | | $ | 1,744,187 | | | | 40% | |
| $ | 46.64 | | | | 33.26 | | | | 1.16 | 5 | | | 1.16 | 5 | | | (0.89 | ) | | | (0.89 | ) | | $ | 1,247,871 | | | | 37% | |
| | | | | | | | | | | | | | | | | | | | | | | | | | | | | | |
| $ | 40.38 | | | | 22.81 | | | | 1.05 | 5 | | | 1.07 | 5 | | | (0.86 | ) | | | (0.88 | ) | | $ | 1,280,724 | | | | 28% | |
| $ | 32.88 | | | | 10.71 | | | | 1.06 | 5 8 | | | 1.07 | 5 8 | | | (0.85 | ) | | | (0.85 | ) | | $ | 1,261,857 | | | | 27% | |
| $ | 29.70 | | | | (42.35 | ) | | | 1.05 | 5 8 | | | 1.06 | 5 8 | | | (0.94 | ) | | | (0.95 | ) | | $ | 1,138,901 | | | | 32% | |
| $ | 63.29 | | | | 42.62 | | | | 1.05 | 5 | | | 1.06 | 5 | | | (0.92 | ) | | | (0.93 | ) | | $ | 1,898,152 | | | | 40% | |
| $ | 47.18 | | | | 33.39 | | | | 1.05 | 5 | | | 1.08 | 5 | | | (0.78 | ) | | | (0.81 | ) | | $ | 1,233,331 | | | | 37% | |
| | | | | | | | | | | | | | | | | | | | | | | | | | | | | | |
| $ | 11.73 | | | | 33.12 | | | | 1.18 | 6 | | | 1.18 | 6 | | | — | | | | — | | | $ | 607,697 | | | | 69% | |
| $ | 9.14 | | | | 24.90 | | | | 1.18 | 6 7 | | | 1.18 | 6 7 | | | (0.15 | ) | | | (0.15 | ) | | $ | 537,439 | | | | 61% | |
| $ | 7.49 | | | | (24.18 | ) | | | 1.16 | 5 8 | | | 1.16 | 5 8 | | | 0.04 | | | | 0.04 | | | $ | 570,201 | | | | 61% | |
| $ | 10.68 | | | | 52.79 | | | | 1.16 | 5 | | | 1.16 | 5 | | | (0.16 | ) | | | (0.16 | ) | | $ | 840,022 | | | | 50% | |
| $ | 6.99 | | | | (7.13 | ) | | | 1.21 | 5 | | | 1.21 | 5 | | | 0.22 | | | | 0.22 | | | $ | 525,957 | | | | 58% | |
| | | | | | | | | | | | | | | | | | | | | | | | | | | | | | |
| $ | 11.88 | | | | 33.31 | | | | 1.06 | 6 | | | 1.06 | 6 | | | 0.12 | | | | 0.12 | | | $ | 1,055,097 | | | | 69% | |
| $ | 9.24 | | | | 25.07 | | | | 1.07 | 6 7 | | | 1.07 | 6 7 | | | (0.06 | ) | | | (0.06 | ) | | $ | 695,586 | | | | 61% | |
| $ | 7.56 | | | | (24.15 | ) | | | 1.05 | 5 8 | | | 1.06 | 5 8 | | | 0.14 | | | | 0.14 | | | $ | 663,167 | | | | 61% | |
| $ | 10.78 | | | | 52.91 | | | | 1.05 | 5 | | | 1.06 | 5 | | | (0.05 | ) | | | (0.06 | ) | | $ | 849,537 | | | | 50% | |
| $ | 7.05 | | | | (6.94 | ) | | | 1.05 | 5 | | | 1.08 | 5 | | | 0.38 | | | | 0.34 | | | $ | 472,331 | | | | 58% | |
| | | | | | | | | | | | | | | | | | | | | | | | | | | | | | |
| $ | 34.04 | | | | 28.26 | | | | 1.22 | 6 7 | | | 1.22 | 6 7 | | | (0.93 | ) | | | (0.93 | ) | | $ | 642,152 | | | | 25% | |
| $ | 26.54 | | | | 0.95 | | | | 1.23 | 5 8 | | | 1.23 | 5 8 | | | (0.96 | ) | | | (0.96 | ) | | $ | 800,490 | | | | 25% | |
| $ | 26.29 | | | | (41.70 | ) | | | 1.18 | 5 8 | | | 1.18 | 5 8 | | | (1.00 | ) | | | (1.00 | ) | | $ | 984,853 | | | | 34% | |
| $ | 50.98 | | | | 32.78 | | | | 1.16 | 5 | | | 1.16 | 5 | | | (0.96 | ) | | | (0.96 | ) | | $ | 2,255,327 | | | | 35% | |
| $ | 39.56 | | | | 59.54 | | | | 1.19 | 5 | | | 1.19 | 5 | | | (0.95 | ) | | | (0.95 | ) | | $ | 1,733,280 | | | | 37% | |
| | | | | | | | | | | | | | | | | | | | | | | | | | | | | | |
| $ | 34.21 | | | | 28.46 | | | | 1.06 | 6 7 | | | 1.08 | 6 7 | | | (0.77 | ) | | | (0.80 | ) | | $ | 323,962 | | | | 25% | |
| $ | 26.63 | | | | 1.13 | | | | 1.06 | 5 8 | | | 1.08 | 5 8 | | | (0.79 | ) | | | (0.81 | ) | | $ | 378,127 | | | | 25% | |
| $ | 26.37 | | | | (41.62 | ) | | | 1.05 | 5 8 | | | 1.06 | 5 8 | | | (0.87 | ) | | | (0.88 | ) | | $ | 389,020 | | | | 34% | |
| $ | 51.05 | | | | 32.89 | | | | 1.05 | 5 | | | 1.06 | 5 | | | (0.86 | ) | | | (0.87 | ) | | $ | 717,666 | | | | 35% | |
| $ | 39.58 | | | | 34.67 | | | | 1.05 | 5 | | | 1.07 | 5 | | | (0.97 | ) | | | (0.98 | ) | | $ | 348,388 | | | | 37% | |
| | | | | | | | | | | | | | | | | | | | | | | | | | | | | | |
| $ | 15.32 | | | | 26.93 | | | | 1.01 | 6 | | | 1.75 | 6 | | | (0.67 | ) | | | (1.41 | ) | | $ | 9,830 | | | | 36% | |
| $ | 12.07 | | | | 23.92 | | | | 1.02 | 6 7 | | | 4.56 | 6 7 | | | (0.53 | ) | | | (4.07 | ) | | $ | 4,352 | | | | 31% | |
| $ | 9.74 | | | | (2.60 | ) | | | 1.01 | 6 7 | | | 11.81 | 6 7 | | | (0.59 | ) | | | (11.39 | ) | | $ | 1,779 | | | | 4% | |
67
Financial Highlights (continued)
| | | | | | | | | | | | | | | | | | | | | | | | | | | | | | | | | | | | | | | | |
| | | | | Income (Loss) from
Investment Operations | | | | | | Less Distributions | | |
| | | Net Asset
Value
Beginning
of Period | | Net
Investment
Income (Loss) | | Net Realized
and Unrealized
Gains (Losses)
on Investments | | Total from
Investment
Operations | | Redemption
Fees
(See Note 2) | | Dividends
from Net
Investment
Income | | Distributions
from Net
Realized
Gains | | Total
Distributions |
| U.S. Select Fund — Institutional Class | | | | | | | | | | | | | | | | | | | | | | | | | | | | | | | | | | | | | | | | |
| Year ended 9/30/24 | | | $ | 12.09 | | | | | (0.06 | ) | | | | 3.33 | | | | | 3.27 | | | | | — | 4 | | | | — | | | | | — | | | | | — | |
| Year ended 9/30/23 | | | $ | 9.73 | | | | | (0.03 | ) | | | | 2.39 | | | | | 2.36 | | | | | — | 4 | | | | — | | | | | — | | | | | — | |
| Year ended 9/30/2215 | | | $ | 10.00 | | | | | (0.01 | ) | | | | (0.26 | ) | | | | (0.27 | ) | | | | — | | | | | — | | | | | — | | | | | — | |
| U.S. Treasury Fund — Investor Class | | | | | | | | | | | | | | | | | | | | | | | | | | | | | | | | | | | | | | | | |
| Year ended 9/30/24 | | | $ | 10.63 | | | | | 0.38 | | | | | 1.17 | | | | | 1.55 | | | | | — | 4 | | | | (0.39 | ) | | | | — | | | | | (0.39 | ) |
| Year ended 9/30/23 | | | $ | 12.53 | | | | | 0.34 | | | | | (1.91 | ) | | | | (1.57 | ) | | | | — | 4 | | | | (0.33 | ) | | | | — | | | | | (0.33 | ) |
| Year ended 9/30/22 | | | $ | 18.10 | | | | | 0.28 | | | | | (5.57 | ) | | | | (5.29 | ) | | | | 0.01 | | | | | (0.29 | ) | | | | — | | | | | (0.29 | ) |
| Year ended 9/30/21 | | | $ | 22.42 | | | | | 0.25 | | | | | (3.00 | ) | | | | (2.75 | ) | | | | 0.01 | | | | | (0.24 | ) | | | | (1.34 | ) | | | | (1.58 | ) |
| Year ended 9/30/20 | | | $ | 19.26 | | | | | 0.30 | | | | | 3.13 | | | | | 3.43 | | | | | 0.03 | | | | | (0.30 | ) | | | | — | | | | | (0.30 | ) |
See Notes to Financial Highlights and Notes to Financial Statements.
68
| | |
| | | (for a share outstanding throughout each period) |
| | | | | | | | | | | | | | | | | | | | | | | | | | | | | | |
| | | | | | |
Ratios to Average Net Assets | | | Supplemental Data | |
Net Asset
Value
End of
Period | | | Total Return (%)1 | | | Expenses
Net of
Waivers and
Reimbursements (%)2 | | | Expenses
Before
Waivers and
Reimbursements (%)2 | | | Net Investment
Income (Loss)
Net of Waivers and
Reimbursements (%)2 | | | Net Investment
Income (Loss)
Before Waivers and
Reimbursements (%)2 | | | Net Assets
End of Period
(000s) | | | Portfolio
Turnover
Rate1 3 | |
| | | | | | | | | | | | | | | | | | | | | | | | | | | | | | |
| $ | 15.36 | | | | 27.05 | | | | 0.86 | 6 | | | 1.26 | 6 | | | (0.52 | ) | | | (0.92 | ) | | $ | 16,761 | | | | 36% | |
| $ | 12.09 | | | | 24.25 | | | | 0.87 | 6 7 | | | 2.46 | 6 7 | | | (0.38 | ) | | | (1.98 | ) | | $ | 8,118 | | | | 31% | |
| $ | 9.73 | | | | (2.70 | ) | | | 0.86 | 6 7 | | | 10.54 | 6 7 | | | (0.43 | ) | | | (10.11 | ) | | $ | 3,566 | | | | 4% | |
| | | | | | | | | | | | | | | | | | | | | | | | | | | | | | |
| $ | 11.79 | | | | 14.68 | | | | 0.73 | 5 | | | 0.73 | 5 | | | 3.30 | | | | 3.30 | | | $ | 185,135 | | | | 83% | |
| $ | 10.63 | | | | (12.82 | ) | | | 0.70 | 5 8 | | | 0.70 | 5 8 | | | 2.67 | | | | 2.67 | | | $ | 237,186 | | | | 13% | |
| $ | 12.53 | | | | (29.44 | ) | | | 0.67 | 5 8 | | | 0.67 | 5 8 | | | 1.70 | | | | 1.70 | | | $ | 287,523 | | | | 47% | |
| $ | 18.10 | | | | (12.74 | ) | | | 0.66 | 5 | | | 0.66 | 5 | | | 1.30 | | | | 1.30 | | | $ | 462,949 | | | | 50% | |
| $ | 22.42 | | | | 18.06 | | | | 0.66 | 5 | | | 0.66 | 5 | | | 1.41 | | | | 1.41 | | | $ | 545,586 | | | | 13% | |
69
| | |
| Wasatch Funds | | SEPTEMBER 30, 2024 |
Notes to Financial Highlights
| 1 | Not annualized for periods less than one year. |
| 2 | Annualized for periods less than one year. |
| 3 | Portfolio turnover is calculated on the basis of the Fund as a whole without distinguishing between the classes of shares issued. |
| 4 | Represents amounts less than $0.005 per share. |
| 5 | Includes interest expenses of less than 0.005%. |
| 6 | Includes interest expenses of more than 0.005%. |
| 7 | Includes extraordinary expenses greater than or equal to 0.01% (see Note 7 in “Notes to Financial Statements”). |
| 8 | Includes extraordinary expenses of less than 0.01% (see Note 7 in “Notes to Financial Statements”). |
| 9 | The Advisor reimbursed the Greater China Fund $258,290 for losses from a trade error. The reimbursement reduced the Net Realized and Unrealized Losses on Investments by $0.24 per share. |
| 10 | Fund inception date was October 1, 2019. |
| 11 | Institutional Class inception date was January 31, 2020. |
| 12 | Net Realized and Unrealized Gains (Losses) on Investments per share reflects a large, non-recurring receivable for security litigation which amounted to $0.07 and $0.07 per share for the Investor Class and Institutional Class, respectively. Excluding this non-recurring receivable, Net Realized and Unrealized Gains (Losses) on Investments would have been $(1.16) and $(1.14) per share for the Investor Class and Institutional Class, respectively. Excluding this non-recurring receivable, Total Return would have been (13.11)% and (13.00)% for the Investor Class and Institutional Class, respectively. |
| 13 | Fund inception date was November 30, 2020. |
| 14 | Fund inception date was October 1, 2021. |
| 15 | Fund inception date was June 13, 2022. |
| 16 | The Advisor reimbursed the Greater China Fund $258,290 for losses from a trade error. The reimbursement increased the total return by 3.54%. |
| 17 | Includes interest expense and dividend payments for securities sold short. The ratios excluding such expenses are listed below: |
| | | | | | | | | | | | |
| | | Expenses Net of
Waivers and
Reimbursements(%)2 | | Expenses Before
Waivers and
Reimbursements(%)2 | | |
Long/Short Alpha Fund — Investor Class | | | | | | | | | | | | |
Year ended 9/30/24 | | | | 1.63 | | | | | 1.62 | | | |
Year ended 9/30/23 | | | | 1.76 | | | | | 1.93 | | | |
Year ended 9/30/22 | | | | 1.75 | | | | | 2.48 | | | |
| | | |
Long/Short Alpha Fund — Institutional Class | | | | | | | | | | | | |
Year ended 9/30/24 | | | | 1.50 | | | | | 1.51 | | | |
Year ended 9/30/23 | | | | 1.50 | | | | | 1.87 | | | |
Year ended 9/30/22 | | | | 1.50 | | | | | 2.40 | | | |
| 18 | Includes interest expense and dividend payments for securities sold short. The ratios excluding such expenses are listed below: |
| | | | | | | | | | | | |
| | | Expenses Net of
Waivers and
Reimbursements(%)2 | | Expenses Before
Waivers and
Reimbursements(%)2 | | |
Greater China Fund — Investor Class | | | | | | | | | | | | |
Year ended 9/30/22 | | | | 1.51 | | | | | 3.46 | | | |
| | | |
Greater China Fund — Institutional Class | | | | | | | | | | | | |
Year ended 9/30/22 | | | | 1.26 | | | | | 2.51 | | | |
70
| | |
| Wasatch Funds | | SEPTEMBER 30, 2024 |
Notes to Financial Statements
1. ORGANIZATION
Wasatch Funds Trust (the “Trust”) is a Massachusetts business trust registered under the Investment Company Act of 1940, as amended (the “1940 Act”), as an open-end management investment company and consists of 20 series or funds (each a “Fund” and collectively the “Funds”). The Core Growth Fund, Global Opportunities Fund, Global Select Fund, Global Value Fund, International Growth Fund, International Opportunities Fund, Micro Cap Fund, Micro Cap Value Fund, Small Cap Growth Fund, Small Cap Value Fund, Ultra Growth Fund and Wasatch-Hoisington U.S. Treasury Fund (“U.S. Treasury Fund”) (sub-advised) are each classified as a diversified fund. The Emerging India Fund, Emerging Markets Select Fund, Emerging Markets Small Cap Fund, Frontier Emerging Small Countries Fund, Greater China Fund, International Select Fund, Long/Short Alpha Fund and U.S. Select Fund are each classified as a non-diversified fund. Each Fund maintains its own investment objective(s). The investment objective(s) adopted by each Fund are included in each Fund’s summary description in the Fund’s Statutory Prospectus and each Fund’s Summary Prospectus.
On November 9, 2011, the Trust redesignated the shares of the Funds into Investor Class shares effective January 31, 2012, and authorized and designated a new Institutional Class of shares in the Funds. Currently 19 funds offer Institutional Class shares: Core Growth Fund, Global Value Fund and Small Cap Value Fund, which commenced operations on January 31, 2012; Emerging Markets Select Fund, which commenced operations on December 13, 2012; Emerging India Fund, Emerging Markets Small Cap Fund, Frontier Emerging Small Countries Fund, Global Opportunities Fund, International Growth Fund, International Opportunities Fund and Small Cap Growth Fund, which commenced operations on February 1, 2016; Global Select Fund and International Select Fund, which commenced operations on October 1, 2019; Micro Cap Fund, Micro Cap Value Fund and Ultra Growth Fund, which commenced operations on January 31, 2020; Greater China Fund, which commenced operations on November 30, 2020; Long/Short Alpha Fund, which commenced operations on October 1, 2021; and U.S. Select Fund, which commenced operations on June 13, 2022. Each class of shares for each Fund has identical rights and privileges except with respect to purchase minimums, distribution and service charges, shareholder services, voting rights on matters affecting a single class of shares, and the exchange and conversion features. The Funds have entered into an investment advisory agreement with Wasatch Advisors LP, d/b/a Wasatch Global Investors, as investment advisor (the “Advisor” or “Wasatch”).
The Core Growth, Emerging India, Emerging Markets Select, Emerging Markets Small Cap, Frontier Emerging Small Countries, Global Opportunities, Global Select,
Global Value, Greater China, International Growth, International Opportunities, International Select, Long/Short Alpha, Micro Cap, Micro Cap Value, Small Cap Growth, Small Cap Value, Ultra Growth and U.S. Select Funds are referred to herein as the “Equity Funds.”
2. SIGNIFICANT ACCOUNTING POLICIES
The following is a summary of significant policies related to investments of the Funds held at September 30, 2024. These policies are in conformity with accounting principles generally accepted in the United States of America (“U.S. GAAP”).
The Funds are investment companies and accordingly they follow the investment company accounting and reporting guidance in accordance with the Financial Accounting Standards Board Accounting Standards Codification Topic 946, Financial Services — Investment Companies.
Valuation of Securities — All investments in securities are recorded at their estimated fair value as described in Note 12.
Foreign Currency Translations — Values of investments denominated in foreign currencies are converted into U.S. dollars using the current spot exchange rates each business day (generally 4:00 p.m. Eastern Time). Purchases and sales of investments and dividend income are translated into U.S. dollars using the current prevailing spot exchange rate on the transaction date. The effect of changes in foreign exchange rates on realized and unrealized gains or losses on securities is reflected as a component of such gains or losses. Transactions in foreign denominated assets may involve greater risks than domestic transactions.
Investment in Securities and Related Investment Income — Security transactions are accounted for on the trade date. Gains or losses on securities sold are determined on the identified cost basis. Dividend income and distributions to shareholders are recorded on the ex-dividend date except that certain dividends from foreign securities may be recorded after the ex-dividend date based on when the Fund is informed of the dividend. Interest income and estimated expenses are accrued daily. Bond discount and premiums are amortized using the interest method. To the extent dividends received include return of capital or capital gain distributions, such distributions are recorded as a reduction to cost of the related security or as a realized gain or loss.
For financial reporting purposes, estimates on all real estate investment trust (REIT) rates are based on prior year average rates made public by the REITs. To obtain these rates Wasatch utilizes a service through Wall Street Concepts, which gathers and disseminates the information. Prior to filing tax returns, REIT rates are trued up for actual rates. The differences between the actual versus the trued-up rates are captured in the next fiscal year’s financial reporting process.
71
Notes to Financial Statements (continued)
Expenses — The Funds contract for various services on a collective basis. Most expenses are directly attributable to each Fund and therefore are charged accordingly. Expenses not directly attributable to one or more Funds are allocated among applicable Funds on an equitable and consistent basis considering such things as the nature and type of expense and the relative net assets of the Funds.
Use of Management Estimates — The preparation of financial statements in conformity with U.S. GAAP requires management to make estimates and assumptions that affect the reported amounts of assets and liabilities at the date of the financial statements and the reported changes in net assets during the reporting period. Actual results could differ from those estimates.
Guarantees and Indemnifications — In the normal course of business, the Funds enter into contracts that contain a variety of representations and warranties which provide general indemnifications. The maximum exposure under these arrangements is unknown, as this would involve future claims that may be made against the Funds and/or their affiliates that have not yet occurred. Based on experience, however, the risk of loss is expected to be remote.
Redemption Fees — The Funds deduct a fee of 2.00% from redemption proceeds on shares of the Funds held 60 days or less. Redemption fees retained by the Funds are credited to additional paid-in capital.
Other — Income, expenses, and realized and unrealized gains or losses on investments are generally allocated to each class of shares based on its relative net assets, except that each class separately bears expenses related specifically to that class, such as certain shareholder servicing fees.
3. SECURITIES AND OTHER INVESTMENTS
Repurchase Agreements — The Funds may engage in repurchase transactions. Under the terms of a typical repurchase agreement, a fund takes possession of an underlying debt obligation subject to an obligation of the seller to repurchase and the fund to resell the obligation at an agreed upon price and time. The market value of the collateral must be at least equal at all times to the total amount of the repurchase obligation, including interest. Generally, in the event of counterparty default, the fund has the right to use the collateral to offset losses incurred.
Short Sales — The Equity Funds, (the Long/Short Alpha Fund in particular) may enter into short sales whereby a fund sells a security it generally does not own (the security is borrowed) in anticipation of a decline in the security’s price. The initial amount of a short sale is recorded as a liability which is marked-to-market daily. Fluctuations in the value of the short liability are recorded as unrealized gains or losses. If a Fund shorts a security when also holding a long position in the security (a “short against the
box”), as the security’s price declines, the short position increases in value, offsetting the long position’s decrease in value. The opposite effect occurs if the security’s price rises. A Fund realizes a gain or loss upon closing of the short sale (returning the security to the counterparty by way of purchase or delivery of a long position owned). Possible losses from short sales may be unlimited, whereas losses from security purchases cannot exceed the total amount invested. The Funds are liable to the lender for any dividends payable on securities while those securities are in a short position. These dividends are an expense of the Funds. The Funds designate collateral consisting of cash, U.S. government securities or other liquid assets sufficient to collateralize the market value of short positions.
Participation Notes — Certain Funds may invest in Participation Notes (P-Notes). P-Notes are promissory notes designed to offer a return linked to the performance of a particular underlying equity security or market. P-Notes are issued by banks or broker-dealers and allow a fund to gain exposure to common stocks in markets in which the fund is currently not approved to directly invest, or in markets that prohibit direct investment by foreign purchasers. While the holder of a P-Note is entitled to receive from the bank or broker-dealer any dividends or other distributions paid on the underlying securities, the holder is not entitled to the same rights as an owner of the underlying securities, such as voting rights. Income received from P-Notes is recorded as dividend income in the Statements of Operations. P-Notes are considered general unsecured contractual obligations of the bank or broker-dealer. Risks associated with P-Notes include the possible failure of a counterparty (i.e., the issuing bank or broker-dealer) to perform in accordance with the terms of the agreement, inability to transfer or liquidate the notes, potential delays or an inability to redeem the notes before maturity under certain market conditions, and limited legal recourse against the issuer of the underlying common stock.
4. FINANCIAL DERIVATIVE INSTRUMENTS
Foreign Currency Contracts — The Funds may enter into foreign currency contracts to settle planned purchases or sales of securities or to protect against a possible loss resulting from an adverse change in the relationship between the U.S. dollar and a foreign currency involved in an underlying transaction. Foreign currency contracts are agreements between two parties to buy and sell a currency at a set price on a future date. The market value of a foreign currency contract fluctuates with changes in currency exchange rates. Foreign currency contracts are marked-to-market daily and the change in market value is recorded by a fund as unrealized appreciation or depreciation. When a foreign currency contract is closed, the fund records a realized gain or loss equal to the difference between the value at the time the contract was opened
72
and the value at the time it was closed. These contracts may involve market risk in excess of the unrealized gain or loss reflected in the Schedule of Investments. In addition, a fund could be exposed to credit risk if a counterparty is unable or unwilling to meet the terms of the contracts or if the value of the currency changes unfavorably. In
connection with these contracts, the Funds may segregate cash and/or securities in a sufficient amount as collateral in accordance with the terms of the respective contracts. None of the Funds entered into foreign currency contracts transactions during the fiscal year ended September 30, 2024.
5. PURCHASES AND SALES OF SECURITIES
The cost of investment securities purchased and proceeds from sales of investment securities, excluding U.S. government and short-term securities, for the year ended September 30, 2024 are summarized below:
| | | | | | | | | | | | | | | | | | | | | | | | | |
| | | Core
Growth
Fund | | Emerging
India
Fund | | Emerging Markets
Select
Fund | | Emerging
Markets
Small Cap
Fund | | Frontier
Emerging
Small Countries
Fund |
Purchases | | | $ | 1,921,371,424 | | | | $ | 211,591,781 | | | | $ | 148,463,460 | | | | $ | 91,366,646 | | | | $ | 10,211,990 | |
Sales | | | | 1,427,839,414 | | | | | 181,271,420 | | | | | 240,909,524 | | | | | 157,958,133 | | | | | 16,132,673 | |
| | | | | |
| | | Global
Opportunities
Fund | | Global
Select
Fund | | Global
Value
Fund | | Greater
China
Fund | | International
Growth
Fund |
Purchases | | | $ | 62,405,293 | | | | $ | 3,130,326 | | | | $ | 34,655,986 | | | | $ | 1,242,320 | | | | $ | 124,471,005 | |
Sales | | | | 90,206,541 | | | | | 5,805,255 | | | | | 69,292,967 | | | | | 928,884 | | | | | 358,565,872 | |
| | | | | |
| | | International
Opportunities
Fund | | International
Select
Fund | | Long/Short
Alpha
Fund | | Micro
Cap
Fund | | Micro Cap
Value
Fund |
Purchases | | | $ | 65,451,685 | | | | $ | 1,691,049 | | | | $ | 56,415,041 | | | | $ | 317,281,477 | | | | $ | 158,064,892 | |
Sales | | | | 246,094,872 | | | | | 2,622,957 | | | | | 26,253,918 | | | | | 397,521,304 | | | | | 196,401,664 | |
| | | | | |
| | | Small Cap
Growth
Fund | | Small Cap
Value
Fund | | Ultra
Growth
Fund | | U.S.
Select
Fund | | |
Purchases | | | $ | 600,745,776 | | | | $ | 995,601,139 | | | | $ | 269,391,683 | | | | $ | 17,377,099 | | | | | | |
Sales | | | | 983,784,005 | | | | | 970,660,534 | | | | | 760,510,361 | | | | | 7,984,844 | | | | | | |
Purchases and sales of U.S. government securities in the U.S. Treasury Fund were $159,588,676, and $234,006,751, respectively.
6. FEDERAL INCOME TAX INFORMATION
It is the Funds’ policy to qualify as regulated investment companies and distribute substantially all of their taxable income to shareholders. The Funds’ tax returns are open to examination by the relevant tax authorities until expiration of the applicable statute of limitations, which is generally three years after the filing of the tax return.
Management has analyzed the Funds’ tax positions taken for all open federal and state income tax years, and has concluded that no provision for income tax is required in the Funds’ financial statements.
As of September 30, 2024, the cost and unrealized appreciation (depreciation) of securities on a tax basis were as follows:
| | | | | | | | | | | | | | | | | | | | | | | | | |
| | | Core
Growth
Fund | | Emerging
India
Fund | | Emerging
Markets
Select
Fund | | Emerging Markets
Small Cap
Fund | | Frontier
Emerging
Small Countries
Fund |
Cost | | | $ | 3,289,194,767 | | | | $ | 464,358,501 | | | | $ | 354,997,761 | | | | $ | 196,705,058 | | | | $ | 29,783,873 | |
| | | | | |
Gross appreciation | | | $ | 1,654,034,906 | | | | $ | 316,571,948 | | | | $ | 119,494,311 | | | | $ | 169,680,577 | | | | $ | 13,449,796 | |
Gross (depreciation) | | | | (141,463,421 | ) | | | | (20,712,562 | ) | | | | (18,635,629 | ) | | | | (6,484,252 | ) | | | | (3,129,350 | ) |
| | | | | |
Net appreciation | | | $ | 1,512,571,485 | | | | $ | 295,859,386 | | | | $ | 100,858,682 | | | | $ | 163,196,325 | | | | $ | 10,320,446 | |
| | | | | |
73
Notes to Financial Statements (continued)
| | | | | | | | | | | | | | | | | | | | | | | | | |
| | | Global
Opportunities
Fund | | Global Select Fund | | Global
Value
Fund | | Greater China Fund | | International
Growth
Fund |
Cost | | | $ | 136,286,654 | | | | $ | 11,290,241 | | | | $ | 100,914,097 | | | | $ | 5,973,372 | | | | $ | 179,902,818 | |
| | | | | |
Gross appreciation | | | $ | 80,004,105 | | | | $ | 4,360,797 | | | | $ | 30,519,976 | | | | $ | 189,186 | | | | $ | 118,560,508 | |
Gross (depreciation) | | | | (11,046,660 | ) | | | | (670,251 | ) | | | | (2,389,360 | ) | | | | (1,711,430 | ) | | | | (6,925,427 | ) |
| | | | | |
Net appreciation (depreciation) | | | $ | 68,957,445 | | | | $ | 3,690,546 | | | | $ | 28,130,616 | | | | $ | (1,522,244 | ) | | | $ | 111,635,081 | |
| | | | | |
| | | | | |
| | | International Opportunities Fund | | International Select Fund | | Long/Short Alpha Fund | | Micro Cap
Fund | | Micro Cap
Value
Fund |
Cost | | | $ | 91,324,870 | | | | $ | 3,066,584 | | | | $ | 69,579,103 | | | | $ | 525,857,425 | | | | $ | 209,290,536 | |
| | | | | |
Gross appreciation | | | $ | 64,822,860 | | | | $ | 965,674 | | | | $ | 18,904,810 | | | | $ | 199,475,494 | | | | $ | 115,539,667 | |
Gross (depreciation) | | | | (8,970,048 | ) | | | | (191,228 | ) | | | | (1,816,820 | ) | | | | (56,187,925 | ) | | | | (10,308,042 | ) |
| | | | | |
Net appreciation | | | $ | 55,852,812 | | | | $ | 774,446 | | | | $ | 17,087,990 | | | | $ | 143,287,569 | | | | $ | 105,231,625 | |
| | | | | |
| | | | | |
| | | Small Cap
Growth
Fund | | Small Cap
Value
Fund | | Ultra
Growth
Fund | | U.S.
Select
Fund | | U.S.
Treasury
Fund |
Cost | | | $ | 1,341,818,236 | | | | $ | 1,226,481,645 | | | | $ | 773,380,790 | | | | $ | 21,819,659 | | | | $ | 204,749,595 | |
| | | | | |
Gross appreciation | | | $ | 885,418,719 | | | | $ | 459,223,662 | | | | $ | 349,964,189 | | | | $ | 4,566,898 | | | | $ | 6,159,812 | |
Gross (depreciation) | | | | (88,763,035 | ) | | | | (53,862,903 | ) | | | | (161,574,962 | ) | | | | (214,383 | ) | | | | (27,993,484 | ) |
| | | | | |
Net appreciation (depreciation) | | | $ | 796,655,684 | | | | $ | 405,360,759 | | | | $ | 188,389,227 | | | | $ | 4,352,515 | | | | $ | (21,833,672 | ) |
| | | | | |
The difference between book-basis and tax-basis unrealized gains (losses) is primarily attributable to the tax deferral of losses on wash sales, unrealized appreciation (depreciation) on passive foreign investment companies (PFICs) and other temporary tax adjustments.
The components of accumulated earnings on a tax basis as of September 30, 2024 were as follows:
| | | | | | | | | | | | | | | | | | | | | | | | | | | | | | |
| | | Core
Growth
Fund | | Emerging
India
Fund | | Emerging
Markets
Select
Fund | | Emerging
Markets
Small Cap
Fund | | Frontier
Emerging
Small Countries
Fund | | Global
Opportunities
Fund |
Undistributed ordinary income | | | $ | — | | | | $ | — | | | | $ | — | | | | $ | — | | | | $ | 287,949 | | | | $ | — | |
Undistributed capital gains | | | | 331,295,205 | | | | | 78,017,764 | | | | | — | | | | | 12,551,807 | | | | | — | | | | | 14,302,027 | |
| | | | | |
Accumulated earnings | | | | 331,295,205 | | | | | 78,017,764 | | | | | — | | | | | 12,551,807 | | | | | 287,949 | | | | | 14,302,027 | |
Accumulated capital and other losses | | | | (15,662,522 | ) | | | | (7,144,105 | ) | | | | (116,833,075 | ) | | | | (3,489,938 | ) | | | | (99,253,631 | ) | | | | (1,676,387 | ) |
Other undistributed ordinary losses | | | | — | | | | | (9,489 | ) | | | | (20,042 | ) | | | | — | | | | | (12,330 | ) | | | | — | |
Net unrealized appreciation | | | | 1,512,571,485 | | | | | 257,053,881 | | | | | 94,108,015 | | | | | 153,559,302 | | | | | 9,963,744 | | | | | 67,567,650 | |
| | | | | |
Total accumulated earnings (accumulated losses) | | | $ | 1,828,204,168 | | | | $ | 327,918,051 | | | | $ | (22,745,102 | ) | | | $ | 162,621,171 | | | | $ | (89,014,268 | ) | | | $ | 80,193,290 | |
| | | | | |
| | | | | | |
| | | Global
Select
Fund | | Global
Value
Fund | | Greater
China
Fund | | International
Growth
Fund | | International
Opportunities
Fund | | International
Select Fund |
Undistributed ordinary income | | | $ | — | | | | $ | 62,250 | | | | $ | 12,634 | | | | $ | — | | | | $ | — | | | | $ | — | |
Undistributed capital gains | | | | — | | | | | 6,719,842 | | | | | — | | | | | 39,368,393 | | | | | — | | | | | — | |
| | | | | |
Accumulated earnings | | | | — | | | | | 6,782,092 | | | | | 12,634 | | | | | 39,368,393 | | | | | — | | | | | — | |
Accumulated capital and other losses | | | | (2,049,541 | ) | | | | (158,243,801 | ) | | | | (4,865,880 | ) | | | | (108,096 | ) | | | | (15,021,884 | ) | | | | (1,028,400 | ) |
Net unrealized appreciation (depreciation) | | | | 3,639,751 | | | | | 28,126,289 | | | | | (1,522,218 | ) | | | | 110,161,781 | | | | | 54,590,001 | | | | | 775,196 | |
| | | | | |
Total accumulated earnings (accumulated losses) | | | $ | 1,590,210 | | | | $ | (123,335,420 | ) | | | $ | (6,375,464 | ) | | | $ | 149,422,078 | | | | $ | 39,568,117 | | | | $ | (253,204 | ) |
| | | | | |
74
| | | | | | | | | | | | | | | | | | | | | | | | | | | | | | |
| | | Long/Short Alpha Fund | | Micro Cap Fund | | Micro Cap Value Fund | | Small Cap
Growth
Fund | | Small Cap
Value
Fund | | Ultra
Growth
Fund |
Undistributed ordinary income | | | $ | — | | | | $ | — | | | | $ | — | | | | $ | — | | | | $ | 19,705,050 | | | | $ | — | |
Undistributed capital gains | | | | — | | | | | — | | | | | — | | | | | — | | | | | 193,149,779 | | | | | — | |
| | | | | |
Accumulated earnings | | | | — | | | | | — | | | | | — | | | | | — | | | | | 212,854,829 | | | | | — | |
Accumulated capital and other losses | | | | (408,187 | ) | | | | (94,751,960 | ) | | | | (21,187,385 | ) | | | | (288,197,279 | ) | | | | — | | | | | (69,682,124 | ) |
Net unrealized appreciation | | | | 17,997,426 | | | | | 143,287,601 | | | | | 104,653,152 | | | | | 796,655,687 | | | | | 405,360,759 | | | | | 188,389,227 | |
| | | | | |
Total accumulated earnings | | | $ | 17,589,239 | | | | $ | 48,535,641 | | | | $ | 83,465,767 | | | | $ | 508,458,408 | | | | $ | 618,215,588 | | | | $ | 118,707,103 | |
| | | | | |
| | | | | | |
| | | U.S.
Select
Fund | | U.S.
Treasury
Fund | | | | | | | | |
Undistributed ordinary income | | | $ | — | | | | $ | 103,657 | | | | | | | | | | | | | | | | | | | | | |
Undistributed capital gains | | | | 890,106 | | | | | — | | | | | | | | | | | | | | | | | | | | | |
| | | | | | | | | | | | | | | | | | | | | | | | | |
Accumulated earnings | | | | 890,106 | | | | | 103,657 | | | | | | | | | | | | | | | | | | | | | |
Accumulated capital and other losses | | | | (112,702 | ) | | | | (162,817,112 | ) | | | | | | | | | | | | | | | | | | | | |
Other undistributed ordinary losses | | | | — | | | | | (82,718 | ) | | | | | | | | | | | | | | | | | | | | |
Net unrealized appreciation (depreciation) | | | | 4,352,515 | | | | | (21,833,672 | ) | | | | | | | | | | | | | | | | | | | | |
| | | | | | | | | | | | | | | | | | | | | | | | | |
Total accumulated earnings (accumulated losses) | | | $ | 5,129,919 | | | | $ | (184,629,845 | ) | | | | | | | | | | | | | | | | | | | | |
| | | | | | | | | | | | | | | | | | | | | | | | | |
Distributions to shareholders are recorded on the ex-dividend date. Distributions are determined on a tax basis at the fiscal year-end and may differ from ordinary income and realized capital gains for financial reporting purposes. The Funds may utilize earnings and profits distributed to shareholders on redemption of shares as part of the dividends-paid deduction (tax equalization).
Differences between income and/or capital gains as determined on a book basis and a tax basis are primarily due to passive foreign investment company shares, foreign capital gains taxes, foreign currency transactions, corporate actions, wash sales and investments in REITs. These reclassifications have no effect on net assets or net asset value (“NAV”) per share.
The Funds are permitted to carry forward capital losses for an unlimited period. The losses that are carried forward retain their character as either short-term or long-term capital losses.
Capital loss carryforwards as of September 30, 2024 are as follows:
| | | | | | | | | | |
| | | Non-expiring |
| Fund | | Short Term | | Long Term |
Emerging Markets Select Fund | | | $ | 59,667,951 | | | | $ | 56,656,256 | |
Frontier Emerging Small Countries Fund | | | | 96,248,435 | | | | | 3,005,196 | |
Global Select Fund | | | | 1,609,490 | | | | | 388,517 | |
Global Value Fund* | | | | 23,474,545 | | | | | 134,769,256 | |
Greater China Fund | | | | 2,847,075 | | | | | 2,018,805 | |
International Opportunities Fund | | | | 14,984,320 | | | | | — | |
International Select Fund | | | | 554,477 | | | | | 470,833 | |
Long/Short Alpha Fund | | | | 331,152 | | | | | — | |
Micro Cap Fund | | | | 88,264,499 | | | | | — | |
Micro Cap Value Fund | | | | 20,336,386 | | | | | — | |
Small Cap Growth Fund | | | | 169,720,880 | | | | | 103,582,578 | |
Ultra Growth Fund | | | | 62,708,771 | | | | | — | |
U.S. Treasury Fund | | | | 27,193,868 | | | | | 135,623,244 | |
| * | The Fund’s capital loss carryforward is subject to an annual limitation under the Internal Revenue Code and related regulations. |
75
Notes to Financial Statements (continued)
During the tax year ended September 30, 2024, the Funds used capital loss carryforwards in the following amounts:
| | | | | |
| Fund | | Amount Used |
Core Growth Fund | | | $ | 32,007,795 | |
Emerging Markets Small Cap Fund | | | | 1,490,760 | |
Frontier Emerging Small Countries Fund | | | | 4,349,046 | |
Global Opportunities Fund | | | | 917,211 | |
Global Value Fund | | | | 1,200,687 | |
International Growth Fund | | | | 960,145 | |
International Opportunities Fund | | | | 22,370,535 | |
International Select Fund | | | | 30,996 | |
Long/Short Alpha Fund | | | | 86,525 | |
Micro Cap Fund | | | | 35,304,895 | |
Micro Cap Value Fund | | | | 23,215,469 | |
Small Cap Growth Fund | | | | 7,965,172 | |
Ultra Growth Fund | | | | 54,193,415 | |
U.S. Select Fund | | | | 45,685 | |
Under current tax law, Post-October Capital Losses and Late-Year Ordinary Losses may be deferred and treated as occurring on the first business day of the following fiscal year for tax purposes. The Funds have elected to defer losses as follows:
| | | | | | | | | | |
| Fund | | Post-October
Capital Losses | | Late-Year
Ordinary Losses |
Core Growth Fund | | | $ | — | | | | $ | (15,662,522 | ) |
Emerging India Fund | | | | — | | | | | (7,144,105 | ) |
Emerging Markets Select Fund | | | | — | | | | | (508,868 | ) |
Emerging Markets Small Cap Fund | | | | — | | | | | (3,489,938 | ) |
Global Opportunities Fund | | | | — | | | | | (1,676,387 | ) |
Global Select Fund | | | | — | | | | | (51,534 | ) |
International Growth Fund | | | | — | | | | | (108,096 | ) |
International Opportunities Fund | | | | — | | | | | (37,564 | ) |
International Select Fund | | | | — | | | | | (3,090 | ) |
Long/Short Alpha Fund | | | | — | | | | | (77,035 | ) |
Micro Cap Fund | | | | — | | | | | (6,487,461 | ) |
Micro Cap Value Fund | | | | — | | | | | (850,999 | ) |
Small Cap Growth Fund | | | | — | | | | | (14,893,821 | ) |
Ultra Growth Fund | | | | — | | | | | (6,973,353 | ) |
U.S. Select Fund | | | | — | | | | | (112,702 | ) |
The tax character of distributions paid during the year ended September 30, 2024 were as follows:
| | | | | | | | | | | | | | | | | | | | | | | | | |
| 2024 | | Core
Growth
Fund | | Emerging
India
Fund | | Emerging
Markets
Select
Fund | | Emerging Markets
Small Cap
Fund | | Frontier
Emerging
Small Countries
Fund |
Ordinary Income | | | $ | — | | | | $ | — | | | | $ | — | | | | $ | — | | | | $ | — | |
Capital Gain | | | | — | | | | | 24,137,327 | | | | | — | | | | | — | | | | | — | |
| | | | | |
Total | | | $ | — | | | | $ | 24,137,327 | | | | $ | — | | | | $ | — | | | | $ | — | |
| | | | | |
| | | | | |
| 2024 | | Global
Opportunities
Fund | | Global
Select
Fund | | Global
Value
Fund | | Greater
China
Fund | | International
Growth
Fund |
Ordinary Income | | | $ | — | | | | $ | — | | | | $ | 4,395,446 | | | | $ | 10,156 | | | | $ | — | |
Capital Gain | | | | — | | | | | — | | | | | — | | | | | — | | | | | — | |
| | | | | |
Total | | | $ | — | | | | $ | — | | | | $ | 4,395,446 | | | | $ | 10,156 | | | | $ | — | |
| | | | | |
| | | | | |
| 2024 | | International
Opportunities
Fund | | International
Select
Fund | | Long/Short
Alpha
Fund | | Micro
Cap
Fund | | Micro Cap
Value
Fund |
Ordinary Income | | | $ | — | | | | $ | — | | | | $ | — | | | | $ | — | | | | $ | — | |
Capital Gain | | | | — | | | | | — | | | | | — | | | | | — | | | | | — | |
| | | | | |
Total | | | $ | — | | | | $ | — | | | | $ | — | | | | $ | — | | | | $ | — | |
| | | | | |
76
| | | | | | | | | | | | | | | | | | | | | | | | | |
| 2024 | | Small Cap
Growth
Fund | | Small Cap
Value
Fund | | Ultra
Growth
Fund | | U.S. Select
Fund | | U.S.
Treasury
Fund |
Ordinary Income | | | $ | — | | | | $ | — | | | | $ | — | | | | $ | — | | | | $ | 6,385,147 | |
Capital Gain | | | | — | | | | | 50,693,279 | | | | | — | | | | | — | | | | | — | |
| | | | | |
Total | | | $ | — | | | | $ | 50,693,279 | | | | $ | — | | | | $ | — | | | | $ | 6,385,147 | |
| | | | | |
The tax character of distributions paid during the year ended September 30, 2023 were as follows:
| | | | | | | | | | | | | | | | | | | | | | | | | |
| 2023 | | Core
Growth
Fund | | Emerging
India
Fund | | Emerging
Markets
Select
Fund | | Emerging Markets
Small Cap
Fund | | Frontier
Emerging
Small Countries
Fund |
Ordinary Income | | | $ | — | | | | $ | — | | | | $ | — | | | | $ | — | | | | $ | — | |
Capital Gains | | | | 18,812,947 | | | | | 5,672,410 | | | | | — | | | | | 11,198,625 | | | | | — | |
| | | | | |
Total | | | $ | 18,812,947 | | | | $ | 5,672,410 | | | | $ | — | | | | $ | 11,198,625 | | | | $ | — | |
| | | | | |
| | | | | |
| 2023 | | Global
Opportunities
Fund | | Global
Select
Fund | | Global
Value
Fund | | Greater
China
Fund | | International
Growth
Fund |
Ordinary Income | | | $ | — | | | | $ | — | | | | $ | 4,022,313 | | | | $ | 324,168 | | | | $ | — | |
Capital Gains | | | | 3,725,746 | | | | | — | | | | | 8,029,844 | | | | | — | | | | | — | |
| | | | | |
Total | | | $ | 3,725,746 | | | | $ | — | | | | $ | 12,052,157 | | | | $ | 324,168 | | | | $ | — | |
| | | | | |
| | | | | |
| 2023 | | International
Opportunities
Fund | | International
Select
Fund | | Long/Short
Alpha
Fund | | Micro
Cap
Fund | | Micro Cap
Value
Fund |
Ordinary Income | | | $ | — | | | | $ | — | | | | $ | 24,018 | | | | $ | — | | | | $ | — | |
Capital Gains | | | | — | | | | | — | | | | | — | | | | | — | | | | | — | |
| | | | | |
Total | | | $ | — | | | | $ | — | | | | $ | 24,018 | | | | $ | — | | | | $ | — | |
| | | | | |
| | | | | |
| 2023 | | Small Cap
Growth
Fund | | Small Cap
Value
Fund | | Ultra
Growth
Fund | | U.S. Select
Fund | | U.S.
Treasury
Fund |
Ordinary Income | | | $ | — | | | | $ | — | | | | $ | 556,115 | | | | $ | — | | | | $ | 7,520,379 | |
Capital Gains | | | | — | | | | | 31,073,891 | | | | | — | | | | | — | | | | | — | |
| | | | | |
Total | | | $ | — | | | | $ | 31,073,891 | | | | $ | 556,115 | | | | $ | — | | | | $ | 7,520,379 | |
| | | | | |
The tax character of distributions paid may differ from that shown in the Statements of Changes in Net Assets due to short-term gains being treated as ordinary income for tax purposes.
EU Reclaims — Withholding taxes on foreign dividends and capital gains have been provided for in accordance with the Funds’ understanding of the applicable countries’ tax rules and rates. Several Wasatch Funds have filed tax reclaims for previously withheld taxes on dividends earned in certain European Union (“EU”) countries. These filings are subject to various administrative and judicial proceedings within these countries. Such tax reclaims received during the year, if any, are included in dividend income in the Statements of Operations and any related receivable, if any, is reflected as interest and dividends
receivable in the Statements of Assets and Liabilities. When uncertainty exists as to the ultimate resolution of these proceedings, the likelihood of receipt of these EU reclaims, and the potential timing of payment, no amounts are reflected in the financial statements. For U.S. income tax purposes, EU reclaims received by the Funds, if any, reduce the amounts of foreign taxes Fund shareholders can use as tax credits in their individual income tax returns. In the event that EU reclaims received by the Funds during the fiscal year exceed foreign withholding taxes paid, and the Funds had previously passed foreign tax credits on to their shareholders, the Funds may enter into a closing agreement with the Internal Revenue Service (IRS) in order to pay the associated tax liability on behalf of the Funds’ shareholders.
77
Notes to Financial Statements (continued)
Foreign Taxes — A Fund may be subject to foreign taxes on income, stock dividends, capital gains on investments, or certain foreign currency transactions. All foreign taxes are recorded in accordance with the applicable foreign tax regulations and rates that exist in the foreign jurisdictions in which each Fund invests. These foreign taxes, if any, are paid by a Fund and are reflected in its Statements of Operations as follows: foreign taxes withheld at source are presented as a reduction of income, foreign taxes on stock dividends are presented as “other foreign taxes”, and foreign taxes on capital gains from sales of investments and foreign taxes on foreign currency transactions are included in their respective net realized gain (loss) categories. Foreign taxes payable as of September 30, 2024, if any, are disclosed in the Statements of Assets and Liabilities.
7. RELATED PARTY TRANSACTIONS
Investment Advisory Fees, Expense Limitations — As the Funds’ investment advisor, the Advisor receives a monthly fee calculated on average daily net assets. The Advisor has contractually agreed to waive its fees and/or reimburse the Investor Class shares and the Institutional Class shares of certain Funds should a Fund’s operating expenses exceed a specified annual limitation through at least January 31, 2025. If operating expenses are less than
the specified expense limit for the Fund, the Advisor shall be entitled to recoup the fees waived or reduced to the extent that the operating expenses and the amounts reimbursed do not exceed such expense limit for the Fund, under the period of the agreement (currently through January 31, 2025). A Fund may only make a repayment to the Advisor for the amount reimbursed if such repayment does not cause the Fund’s expense ratio, after the repayment is taken into account, to exceed both (i) the expense cap in place at the time such amounts were waived; and (ii) the Fund’s current expense cap. All amounts not recovered at the end of the period expire on January 31, 2025. Shareholder expenses will increase if the Advisor does not renew the contractual expense cap after its expiration date. Ordinary operating expenses exclude any interest, dividend expense on short sales/interest expense, taxes, brokerage commissions, other investment-related costs, acquired fund fees and expenses, and extraordinary expenses, such as litigation and other expenses not incurred in the ordinary course of the Funds’ business in excess of such limitations. Investment advisory fees and fees waived, if any, for the year ended September 30, 2024 are disclosed in the Statements of Operations. Investment advisory fee and expense limitation annual rates are shown below.
| | | | | | | | | | | | | | | | | | | | | | | | | |
| Fund | | Advisory
Fee | | Expense
Limitation
Investor Class | | Expense
Limitation
Institutional Class | | Contractual Expense
Limitation/
Reimbursement
Recoverable
Expiration Date | | Reimbursement
Recoverable |
Core Growth Fund | | | | 1.00% | | | | | 1.50% | | | | | 1.05% | | | | | 1/31/2025 | | | | $ | 149,636 | |
Emerging India Fund | | | | 1.25% | | | | | 1.75% | | | | | 1.50% | | | | | 1/31/2025 | | | | | — | |
Emerging Markets Select Fund | | | | 1.00% | | | | | 1.50% | | | | | 1.20% | | | | | 1/31/2025 | | | | | — | |
Emerging Markets Small Cap Fund | | | | 1.65% | | | | | 1.95% | | | | | 1.80% | | | | | 1/31/2025 | | | | | 56,361 | |
Frontier Emerging Small Countries Fund | | | | 1.65% | | | | | 2.15% | | | | | 1.95% | | | | | 1/31/2025 | | | | | 88,644 | |
Global Opportunities Fund | | | | 1.25% | | | | | 1.75% | | | | | 1.35% | | | | | 1/31/2025 | | | | | 37,084 | |
Global Select Fund | | | | 0.85% | | | | | 1.35% | | | | | 0.95% | | | | | 1/31/2025 | | | | | 128,457 | |
Global Value Fund | | | | 0.90% | | | | | 1.10% | | | | | 0.95% | | | | | 1/31/2025 | | | | | 139,745 | |
Greater China Fund | | | | 1.00% | | | | | 1.50% | | | | | 1.25% | | | | | 1/31/2025 | | | | | 135,659 | |
International Growth Fund | | | | 1.25% | | | | | 1.75% | | | | | 1.35% | | | | | 1/31/2025 | | | | | 25,352 | |
International Opportunities Fund | | | | 1.75% | | | | | 2.25% | | | | | 1.95% | | | | | 1/31/2025 | | | | | 119,262 | |
International Select Fund | | | | 0.80% | | | | | 1.30% | | | | | 0.90% | | | | | 1/31/2025 | | | | | 133,313 | |
Long/Short Alpha Fund | | | | 1.25% | | | | | 1.75% | | | | | 1.50% | | | | | 1/31/2025 | | | | | 567 | |
Micro Cap Fund | | | | 1.50% | | | | | 1.95% | | | | | 1.60% | | | | | 1/31/2025 | | | | | — | |
Micro Cap Value Fund | | | | 1.50% | | | | | 1.95% | | | | | 1.60% | | | | | 1/31/2025 | | | | | 14,792 | |
Small Cap Growth Fund | | | | 1.00% | | | | | 1.50% | | | | | 1.05% | | | | | 1/31/2025 | | | | | 181,407 | |
Small Cap Value Fund | | | | 1.00% | | | | | 1.50% | | | | | 1.05% | | | | | 1/31/2025 | | | | | 53,509 | |
Ultra Growth Fund | | | | 1.00% | | | | | 1.50% | | | | | 1.05% | | | | | 1/31/2025 | | | | | 79,513 | |
U.S. Select Fund | | | | 0.75% | | | | | 1.00% | | | | | 0.85% | | | | | 1/31/2025 | | | | | 116,481 | |
U.S. Treasury Fund | | | | 0.50% | | | | | 0.75% | | | | | N/A | | | | | 1/31/2025 | | | | | — | |
Compensation — Beginning in the calendar year 2024, the Funds’ method of compensating Trustees is to pay each Independent Trustee a retainer of $155,000 per year for services rendered and a fee of $31,000 for each regularly scheduled Board of Trustees meeting, including the
executive session held with respect to the investment advisory contract renewal process for the Funds, whether attended in person or telephonically (including any committee meeting attended) (collectively, the “2024 Base Compensation”). Trustees receive an additional $12,000
78
for in-person attendance of any special Board meeting or committee meeting (or any combination thereof), and $6,000 for telephonic attendance of any special Board meeting or committee meeting (or any combination thereof). In addition, the Chair of the Board receives an additional 25% of the 2024 Base Compensation and the Chair of a committee receives an additional 15% of the 2024 Base Compensation. Accordingly, to implement this additional compensation for services as a Chair, the Chair of the Board receives an additional fee of $77,500 a year as Chair and the Chair of the Audit Committee and the Chair of the Governance and Nominating Committee (the “Nominating Committee”) each receives an additional $46,500 per year as Chair.
In the calendar year 2023, the Funds’ method of compensating Trustees was to pay each Independent Trustee a retainer of $150,000 per year for services rendered and a fee of $30,000 for each regularly scheduled Board of Trustees meeting, including the executive session held with respect to the investment advisory contract renewal process for the Funds, whether attended in person or telephonically (including any committee meeting attended) (“2023 Base Compensation”). Trustees received an additional $12,000 for in-person attendance of any special Board meeting or committee meeting (or any combination thereof), and $6,000 for telephonic attendance of any special Board meeting or committee meeting (or any combination thereof). In addition, the Chair of the Board received an additional 25% of the 2023 Base Compensation and the Chair of a committee received an additional 15% of the 2023 Base Compensation. Accordingly, to implement this additional compensation for services as a Chair, the Chair of the Board received an additional fee of $75,000 a year as Chair and the Chair of the Audit Committee and the Chair of the Nominating Committee each received an additional $45,000 per year as Chair.
The Funds also may reimburse the Independent Trustees for travel expenses incurred in order to attend meetings of the Board of Trustees and for continuing education expenses.
Payments by Advisor — During 2022, the Advisor reimbursed the Greater China Fund $258,290 for losses from a trade error. The impact of the payment is reflected in the Total Return and Realized and Unrealized Gains (Losses) on Investments sections in the Financial Highlights.
Payments by Sub-Advisor — Pursuant to a sub-advisory agreement entered into between the Advisor and Hoisington Investment Management Company (“HIMCo”), the Sub-Advisor for the U.S. Treasury Fund, (“HIMCo Sub-Advisory Agreement”), and subject to the supervision
of the Advisor, HIMCo directs the investment of the U.S. Treasury Fund’s assets and is responsible for the continuing management of the Fund’s assets, including the placement of orders to purchase or sell securities on behalf of the Fund. The HIMCo Sub-Advisory Agreement provides that the Advisor shall pay HIMCo a monthly management fee computed at the annual rate of 0.02% of the Fund’s average daily net assets as long as and whenever the Fund has net assets less than $20 million and one-half (1/2) of the monthly fee the Advisor receives from the Fund under the Advisory and Service Contract as long as and whenever the Fund has net assets of $20 million or more. The Advisor retains the remainder of the advisory fee paid under the Advisory and Service Contract. The Sub-Advisor may reimburse the Advisor for certain expenses.
Transfer Agent Intermediary Fees Reimbursed to the Advisor — Each Fund paid fees to, and reimbursed certain out-of-pocket expenses of, the Funds’ transfer agent during the period. In addition, the Advisor and the Funds’ distributor have entered into selling dealer agreements and service agreements with certain financial services companies, broker-dealers, banks, advisors, retirement service providers or other authorized agents or organizations (each an “Intermediary”— together, “Intermediaries”) to accept purchase, exchange and redemption orders on the Funds’ behalf. For Investor Class shares of the Funds, some Intermediaries do not charge investors a direct transaction fee but instead charge a fee for accounting and shareholder services that the agent provided to Fund shareholders on the Funds’ behalf. Those services typically included recordkeeping, transaction processing for shareholders’ accounts, communication of tax information, income distribution and other services. Generally, the fee was either a per account charge based on the number of accounts to which the Intermediary provided such services, or was a percentage (as of September 30, 2024 up to 0.40% annually) of the average value of the Funds’ Investor Class shares held in such accounts. The Advisor paid the Intermediary fees and the Funds reimbursed the Advisor for the portion of such fees, which are intended to compensate the Intermediary for provision of services of the type that would be provided by the Funds’ transfer agent or other service providers if the shares were registered on the books of the Funds’ transfer agent. Institutional Class shares of the Funds do not reimburse the Advisor for payments to Intermediaries. The Funds’ reimbursements of expenses incurred for services provided by Intermediaries are included in “Shareholder servicing fees — Investor Class” in the Statements of Operations.
79
Notes to Financial Statements (continued)
10% Shareholders – As of September 30, 2024, the Funds had individual shareholder accounts and/or omnibus shareholder accounts (comprised of a group of individual shareholders), which individually amounted to more than 10% of the total shares outstanding of each Fund as detailed below:
| | | | | | | | | | |
| Fund | | Number of
Accounts | | Percent of Shares
Outstanding |
Core Growth Fund | | | | 2 | | | | | 49.02 | % |
Emerging India Fund | | | | 3 | | | | | 69.95 | % |
Emerging Markets Select Fund | | | | 3 | | | | | 76.97 | % |
Emerging Markets Small Cap Fund | | | | 2 | | | | | 64.57 | % |
Frontier Emerging Small Countries Fund | | | | 3 | | | | | 64.45 | % |
Global Opportunities Fund | | | | 2 | | | | | 60.90 | % |
Global Select Fund | | | | 2 | | | | | 64.98 | % |
Global Value Fund | | | | 2 | | | | | 71.86 | % |
Greater China Fund | | | | 4 | | | | | 80.50 | % |
International Growth Fund | | | | 2 | | | | | 40.34 | % |
International Opportunities Fund | | | | 2 | | | | | 53.33 | % |
International Select Fund | | | | 3 | | | | | 75.34 | % |
Long/Short Alpha Fund | | | | 3 | | | | | 86.38 | % |
Micro Cap Fund | | | | 2 | | | | | 41.26 | % |
Micro Cap Value Fund | | | | 2 | | | | | 59.59 | % |
Small Cap Growth Fund | | | | 3 | | | | | 63.31 | % |
Small Cap Value Fund | | | | 3 | | | | | 62.55 | % |
Ultra Growth Fund | | | | 2 | | | | | 58.29 | % |
U.S. Select Fund | | | | 2 | | | | | 84.36 | % |
U.S. Treasury Fund | | | | 3 | | | | | 61.23 | % |
Affiliated Interests — As of September 30, 2024, the Advisor and its affiliates, and the retirement plans of the Advisor and its affiliates, held shares of the Funds, which may be redeemed at any time as detailed below:
| | | | | | | | | | |
| Fund | | Number of
Accounts* | | Percent of Shares
Outstanding |
Core Growth Fund | | | | 24 | | | | | 0.95 | % |
Emerging India Fund | | | | 32 | | | | | 5.11 | % |
Emerging Markets Select Fund | | | | 26 | | | | | 2.80 | % |
Emerging Markets Small Cap Fund | | | | 19 | | | | | 2.71 | % |
Frontier Emerging Small Countries Fund | | | | 14 | | | | | 2.68 | % |
Global Opportunities Fund | | | | 17 | | | | | 7.72 | % |
Global Select Fund | | | | 19 | | | | | 77.62 | % |
Global Value Fund | | | | 13 | | | | | 5.62 | % |
Greater China Fund | | | | 13 | | | | | 67.20 | % |
International Growth Fund | | | | 16 | | | | | 1.26 | % |
International Opportunities Fund | | | | 16 | | | | | 4.80 | % |
International Select Fund | | | | 12 | | | | | 71.71 | % |
Long/Short Alpha Fund | | | | 21 | | | | | 36.79 | % |
Micro Cap Fund | | | | 18 | | | | | 2.30 | % |
Micro Cap Value Fund | | | | 16 | | | | | 2.05 | % |
Small Cap Growth Fund | | | | 21 | | | | | 0.55 | % |
Small Cap Value Fund | | | | 20 | | | | | 1.83 | % |
Ultra Growth Fund | | | | 21 | | | | | 2.67 | % |
U.S. Select Fund | | | | 15 | | | | | 32.54 | % |
U.S. Treasury Fund | | | | 10 | | | | | 1.53 | % |
| * | Multiple accounts with the same beneficial owner are treated as one account. |
80
8. TRANSACTIONS WITH AFFILIATES
If a Fund’s holding represents ownership of 5% or more of the voting securities of a company, the company is deemed to be an affiliate as defined by the 1940 Act. The following Funds conducted transactions during the year ended September 30, 2024 with an “affiliated company” as so defined:
| | | | | | | | | | | | | | | | | | | | | | | | | | | | | | | | | | | |
| | | Value,
Beginning
Of the
Year | | Purchases
At Cost | | Proceeds
From Sales | | Value, End
Of the
Year | | Dividends
Credited to
Income for the Year ended
9/30/2024 | | Gain (Loss)
Realized on
Sale of Shares
For the
Year ended
9/30/2024 | | Change in
Unrealized
Appreciation
For the
Year ended
9/30/2024 |
Core Growth Fund | | | | | | | | | | | | | | | | | | | | | | | | | | | | | | | | | | | |
Common Stock | | | | | | | | | | | | | | | | | | | | | | | | | | | | | | | | | | | |
Arhaus, Inc. | | | $ | — | | | | $ | 52,636,852 | | | | $ | — | | | | $ | 53,777,392 | | | | $ | 1,556,849 | | | | $ | — | | | | $ | 1,140,540 | |
| | | | | |
Micro Cap Fund | | | | | | | | | | | | | | | | | | | | | | | | | | | | | | | | | | | |
Common Stock | | | | | | | | | | | | | | | | | | | | | | | | | | | | | | | | | | | |
Mama’s Creations, Inc. | | | $ | — | | | | $ | 9,739,865 | | | | $ | 154,021 | | | | $ | 15,589,420 | | | | $ | — | | | | $ | (6,184 | ) | | | $ | 6,009,760 | |
| | | | | |
Micro Cap Value Fund | | | | | | | | | | | | | | | | | | | | | | | | | | | | | | | | | | | |
Common Stock | | | | | | | | | | | | | | | | | | | | | | | | | | | | | | | | | | | |
Gen Restaurant Group, Inc. | | | $ | 2,933,280 | | | | $ | 1,727,996 | | | | $ | 921,902 | | | | $ | 3,092,771 | | | | $ | — | | | | $ | (320,484 | ) | | | $ | (326,119 | ) |
| | | | | |
Small Cap Growth Fund | | | | | | | | | | | | | | | | | | | | | | | | | | | | | | | | | | | |
Common Stock | | | | | | | | | | | | | | | | | | | | | | | | | | | | | | | | | | | |
Vintage Wine Estates, Inc. — PIPE Shares* | | | $ | 1,733,934 | | | | $ | — | | | | $ | 1,125,974 | | | | $ | — | | | | $ | — | | | | $ | (29,347,386 | ) | | | $ | 28,739,426 | |
Preferred Stock | | | | | | | | | | | | | | | | | | | | | | | | | | | | | | | | | | | |
Johnnie-O Holdings, Inc., Series A Pfd. | | | | 14,925,626 | | | | | — | | | | | — | | | | | 16,698,121 | | | | | — | | | | | — | | | | | 1,772,495 | |
| | | | | |
| | | $ | 16,659,560 | | | | $ | — | | | | $ | 1,125,974 | | | | $ | 16,698,121 | | | | $ | — | | | | $ | (29,347,386 | ) | | | $ | 30,511,921 | |
| | | | | |
Ultra Growth Fund | | | | | | | | | | | | | | | | | | | | | | | | | | | | | | | | | | | |
Common Stock | | | | | | | | | | | | | | | | | | | | | | | | | | | | | | | | | | | |
C4 Therapeutics, Inc.* | | | $ | 5,594,586 | | | | $ | 3,365,897 | | | | $ | 10,936,872 | | | | $ | 14,876,670 | | | | $ | — | | | | $ | (10,865,897 | ) | | | $ | 27,718,956 | |
Sangamo Therapeutics, Inc. | | | | 6,101,595 | | | | | 2,242,097 | | | | | 1,877,777 | | | | | 9,504,446 | | | | | — | | | | | (5,971,207 | ) | | | | 9,009,738 | |
Preferred Stock | | | | | | | | | | | | | | | | | | | | | | | | | | | | | | | | | | | |
Johnnie-O Holdings, Inc., Series A Pfd. | | | | 12,438,034 | | | | | — | | | | | — | | | | | 13,915,114 | | | | | — | | | | | — | | | | | 1,477,080 | |
Warrants | | | | | | | | | | | | | | | | | | | | | | | | | | | | | | | | | | | |
Sangamo Therapeutics, Inc., expiring 9/26/2029 | | | | — | | | | | 626,686 | | | | | — | | | | | 938,180 | | | | | — | | | | | — | | | | | 311,494 | |
| | | | | |
| | | $ | 24,134,215 | | | | $ | 6,234,680 | | | | $ | 12,814,649 | | | | $ | 39,234,410 | | | | $ | — | | | | $ | (16,837,104 | ) | | | $ | 38,517,268 | |
| | | | | |
| | | | | | | | | | | | | | | | | | | | | | | | | | | | | | | | | | | |
| | | Share Activity | | Dividends
Credited to
Income for the
Year ended
9/30/2024 | | Gain (Loss)
Realized on
Sale of Shares
For the
Year ended
9/30/2024 | | Change in
Unrealized
Appreciation
For the
Year ended
9/30/2024 |
| | | Balance
9/30/2023 | | Purchases/
Additions | | Sales/
Reductions | | Balance
9/30/2024 |
Core Growth Fund | | | | | | | | | | | | | | | | | | | | | | | | | | | | | | | | | | | |
Common Stock | | | | | | | | | | | | | | | | | | | | | | | | | | | | | | | | | | | |
Arhaus, Inc. | | | | — | | | | | 4,368,594 | | | | | — | | | | | 4,368,594 | | | | $ | 1,556,849 | | | | $ | — | | | | $ | 1,140,540 | |
| | | | | |
Micro Cap Fund | | | | | | | | | | | | | | | | | | | | | | | | | | | | | | | | | | | |
Mama’s Creations, Inc. | | | | — | | | | | 2,164,634 | | | | | 29,097 | | | | | 2,135,537 | | | | $ | — | | | | $ | (6,184 | ) | | | $ | 6,009,760 | |
| | | | | |
Micro Cap Value Fund | | | | | | | | | | | | | | | | | | | | | | | | | | | | | | | | | | | |
Common Stock | | | | | | | | | | | | | | | | | | | | | | | | | | | | | | | | | | | |
Gen Restaurant Group, Inc. | | | | 252,000 | | | | | 196,042 | | | | | 81,600 | | | | | 366,442 | | | | $ | — | | | | $ | (320,484 | ) | | | $ | (326,119 | ) |
| | | | | |
Small Cap Growth Fund | | | | | | | | | | | | | | | | | | | | | | | | | | | | | | | | | | | |
Common Stock | | | | | | | | | | | | | | | | | | | | | | | | | | | | | | | | | | | |
Vintage Wine Estates, Inc. — PIPE Shares* | | | | 3,047,336 | | | | | — | | | | | 3,047,336 | | | | | — | | | | $ | — | | | | $ | (29,347,386 | ) | | | $ | 28,739,426 | |
Preferred Stock | | | | | | | | | | | | | | | | | | | | | | | | | | | | | | | | | | | |
Johnnie-O Holdings, Inc., Series A Pfd. | | | | 611,205 | | | | | — | | | | | — | | | | | 611,205 | | | | | — | | | | | — | | | | | 1,772,495 | |
| | | | | |
| | | | 3,658,541 | | | | | — | | | | | 3,047,336 | | | | | 611,205 | | | | $ | — | | | | $ | (29,347,386 | ) | | | $ | 30,511,921 | |
| | | | | |
81
Notes to Financial Statements (continued)
| | | | | | | | | | | | | | | | | | | | | | | | | | | | | | | | | | | |
| | | Share Activity | | Dividends
Credited to
Income for the
Year ended
9/30/2024 | | Gain (Loss)
Realized on
Sale of Shares
For the
Year ended
9/30/2024 | | Change in
Unrealized
Appreciation
For the
Year ended
9/30/2024 |
| | | Balance
9/30/2023 | | Purchases/
Additions | | Sales/
Reductions | | Balance
9/30/2024 |
Ultra Growth Fund | |
Common Stock | | | | | | | | | | | | | | | | | | | | | | | | | | | | | | | | | | | |
C4 Therapeutics, Inc.* | | | | 3,007,842 | | | | | 952,381 | | | | | 1,350,281 | | | | | 2,609,942 | | | | $ | — | | | | $ | (10,865,897 | ) | | | $ | 27,718,956 | |
Sangamo Therapeutics, Inc. | | | | 10,172,716 | | | | | 3,603,833 | | | | | 2,802,705 | | | | | 10,973,844 | | | | | — | | | | | (5,971,207 | ) | | | | 9,009,738 | |
Preferred Stock | | | | | | | | | | | | | | | | | | | | | | | | | | | | | | | | | | | |
Johnnie-O Holdings, Inc., Series A Pfd. | | | | 509,338 | | | | | — | | | | | — | | | | | 509,338 | | | | | — | | | | | — | | | | | 1,477,080 | |
Warrants | | | | | | | | | | | | | | | | | | | | | | | | | | | | | | | | | | | |
Sangamo Therapeutics, Inc., expiring 9/26/2029 | | | | — | | | | | 3,026,385 | | | | | — | | | | | 3,026,385 | | | | | — | | | | | — | | | | | 311,494 | |
| | | | | |
| | | | 13,689,896 | | | | | 7,582,599 | | | | | 4,152,986 | | | | | 17,119,509 | | | | $ | — | | | | $ | (16,837,104 | ) | | | $ | 38,517,268 | |
| | | | | |
| * | This security was deemed to no longer meet the criteria of an affiliated company at the reporting date. For financial statement purposes, the total amount of the gain (loss) realized on sale of shares and the total change in unrealized appreciation for the period ended September 30, 2024 is included in the Statements of Operations even though the security was not deemed an affiliated company as of the end of the year end. |
9. RESTRICTED SECURITIES
The Funds may own investments that were purchased through private placement transactions or under Rule 144A of the Securities Act of 1933 (the “Securities Act”) and cannot be sold without prior registration under the Securities Act or may be limited due to certain restrictions. These securities are generally deemed to be illiquid and are valued at fair value as determined by a designated Pricing Committee of the Advisor (“Pricing Committee”), comprised of personnel of the Advisor, with oversight by the Board of Trustees and in accordance with Board-approved Pricing Policies and Procedures. If and when such securities are registered, the costs of registering such securities are paid by the issuer. At September 30, 2024, the Funds held the following restricted securities:
| | | | | | | | | | | | | | | | | | | | | | |
| | | Security
Type | | Acquisition
Date | | Cost | | Fair
Value | | Value as a Percent
Of Net Assets |
Long/Short Alpha Fund | | | | | | | | | | | | | | | | | | | | | | |
Sangamo Therapeutics, Inc., expiring 9/26/2029 | | Warrants | | | | 3/22/2024 | | | | $ | 36,977 | | | | $ | 55,357 | | | | | 0.07 | % |
|
|
Micro Cap Fund | | | | | | | | | | | | | | | | | | | | | | |
BriaPro Therapeutics Corp. | | Common Stocks | | | | 9/5/2023 | | | | $ | 29 | | | | $ | 6,100 | | | | | 0.00 | % |
Johnnie-O Holdings, Inc., Series A Pfd. | | Preferred Stock | | | | 3/16/2022 | | | | | 10,000,013 | | | | | 9,276,752 | | | | | 1.36 | % |
IM Cannabis Corp., expiring 5/7/2026 | | Warrants | | | | 5/5/2021 | | | | | 616,971 | | | | | 0 | | | | | 0.00 | % |
Sangamo Therapeutics, Inc., expiring 9/26/2029 | | Warrants | | | | 3/22/2024 | | | | | 322,404 | | | | | 482,654 | | | | | 0.07 | % |
| | | | | | | | | | | | |
| | | | | | | | | | $ | 10,939,417 | | | | $ | 9,765,506 | | | | | 1.43 | % |
|
|
Micro Cap Value Fund | | | | | | | | | | | | | | | | | | | | | | |
Greenlane Holdings, Inc., expiring 2/24/2026 | | Warrants | | | | 2/22/2021 | | | | $ | 396,902 | | | | $ | 0 | | | | | 0.00 | % |
|
|
Small Cap Growth Fund | | | | | | | | | | | | | | | | | | | | | | |
DataStax, Inc., Series E Pfd. | | Preferred Stock | | | | 8/12/2014 | | | | $ | 8,000,002 | | | | $ | 9,362,724 | | | | | 0.43 | % |
Johnnie-O Holdings, Inc., Series A Pfd. | | Preferred Stock | | | | 3/16/2022 | | | | | 17,999,987 | | | | | 16,698,121 | | | | | 0.78 | % |
| | | | | | | | | | | | | | | | | | | | | | |
| | | | | | | | | | $ | 25,999,989 | | | | $ | 26,060,845 | | | | | 1.21 | % |
|
|
Ultra Growth Fund | | | | | | | | | | | | | | | | | | | | | | |
Johnnie-O Holdings, Inc., Series A Pfd. | | Preferred Stock | | | | 3/16/2022 | | | | $ | 15,000,004 | | | | $ | 13,915,114 | | | | | 1.44 | % |
Sangamo Therapeutics, Inc., expiring 9/26/2029 | | Warrants | | | | 3/22/2024 | | | | | 626,686 | | | | | 938,180 | | | | | 0.10 | % |
| | | | | | | | | | | | | | | | | | | | | | |
| | | | | | | | | | $ | 15,626,690 | | | | $ | 14,853,294 | | | | | 1.54 | % |
|
|
10. LINE OF CREDIT
Effective May 31, 2024, the Trust and each Fund renewed and amended agreements for two open lines of credit totaling $300,000,000, one of which is $100,000,000 committed, and the other of which is $200,000,000 uncommitted, with State Street Bank and Trust Company (together, the “Line”) that mature on May 30, 2025. The agreements, as amended, had no change in the committed, uncommitted and total amounts available on the Line. The Funds incur commitment fees on the undrawn portion of the committed part of the Line, and interest expense to the extent of amounts drawn (borrowed) under the entire Line. Interest is based on the overnight federal-funds rate in effect on the date of borrowing, plus a margin. Commitment fees are pro-rated among the Funds based upon relative average net assets. Interest expense is charged directly to a Fund based upon actual amounts borrowed by that Fund.
82
For the year ended September 30, 2024, the following Funds had borrowings:
| | | | | | | | | | | | | | | | | | | | | | | | | |
| Funds Utilizing the Line of Credit | | Average Daily
Borrowings | | Number of
Days
Outstanding | | Interest
Expense | | Weighted
Average
Annualized
Interest Rate | | Balance at
9/30/2024 |
Emerging India Fund | | | $ | 2,155,121 | | | | | 16 | | | | $ | 6,253 | | | | | 6.53 | % | | | $ | — | |
Emerging Markets Select Fund | | | | 4,515,144 | | | | | 54 | | | | | 44,455 | | | | | 6.56 | % | | | | 7,891,573 | |
Emerging Markets Small Cap Fund | | | | 2,450,636 | | | | | 45 | | | | | 20,156 | | | | | 6.58 | % | | | | — | |
Frontier Emerging Small Countries Fund | | | | 336,467 | | | | | 19 | | | | | 1,168 | | | | | 6.58 | % | | | | — | |
Global Opportunities Fund | | | | 615,802 | | | | | 31 | | | | | 3,489 | | | | | 6.58 | % | | | | — | |
Global Select Fund | | | | 201,257 | | | | | 33 | | | | | 1,214 | | | | | 6.58 | % | | | | — | |
Global Value Fund | | | | 2,961,198 | | | | | 7 | | | | | 3,789 | | | | | 6.58 | % | | | | — | |
International Growth Fund | | | | 5,703,303 | | | | | 37 | | | | | 38,570 | | | | | 6.58 | % | | | | — | |
International Opportunities Fund | | | | 2,679,149 | | | | | 43 | | | | | 21,057 | | | | | 6.58 | % | | | | — | |
International Select Fund | | | | 12,561 | | | | | 100 | | | | | 230 | | | | | 6.58 | % | | | | — | |
Micro Cap Fund | | | | 123,002 | | | | | 1 | | | | | 22 | | | | | 6.58 | % | | | | — | |
Micro Cap Value Fund | | | | 1,069,402 | | | | | 2 | | | | | 391 | | | | | 6.58 | % | | | | — | |
Small Cap Growth Fund | | | | 20,108,810 | | | | | 7 | | | | | 25,728 | | | | | 6.58 | % | | | | — | |
Small Cap Value Fund | | | | 57,699,028 | | | | | 2 | | | | | 21,092 | | | | | 6.58 | % | | | | — | |
Ultra Growth Fund | | | | 623,857 | | | | | 358 | | | | | 40,822 | | | | | 6.58 | % | | | | — | |
U.S. Select Fund | | | | 272,756 | | | | | 24 | | | | | 1,196 | | | | | 6.58 | % | | | | — | |
11. PRINCIPAL RISKS
Market Risk — Market risk is the risk that a particular security, or shares of a Fund in general, may fall in value. Securities are subject to market fluctuations caused by such factors as economic, political, regulatory or market developments, changes in interest rates and perceived trends in securities prices. Shares of a Fund could decline in value or underperform other investments due to short-term market movements or any longer periods during more prolonged market downturns. In addition, local, regional or global events such as war, acts of terrorism, spread of infectious diseases or other public health issues, recessions, or other events could have a significant negative impact on a Fund and its investments. Such events may affect certain geographic regions, countries, sectors and industries more significantly than others. Such events could adversely affect the prices and liquidity of a Fund’s portfolio securities or other instruments and could result in disruptions in the trading markets. Any of such circumstances could have a materially negative impact on the value of a Fund’s shares and result in increased market volatility.
Current Market and Economic Conditions Risk — Current market and economic conditions risk is the risk that a particular investment, or shares of a Fund in general, may fall in value due to current market and economic conditions or events. Economic events historically have resulted, and may in the future result, in an unusually high degree of volatility in the financial markets, both domestic and foreign. Relatively high market volatility and reduced liquidity in credit and fixed-income markets may adversely affect many issuers world wide. Such events have included, among other things, bankruptcies, corporate restructurings, and similar events; measures to address U.S. federal
and state budget deficits; social, political and economic instability in Europe and other countries; dramatic changes in energy prices and currency exchange rates; China’s economic slowdown; and regional armed conflict, such as the wars between Russia and Ukraine and Israel and Hamas.
In this regard, in late February 2022, Russia launched a large scale military attack on Ukraine. The invasion significantly amplified already existing geopolitical tension among Russia, Ukraine, Europe, NATO and the West, including the U.S. In response to the military action by Russia, various countries, including the U.S., the United Kingdom and European Union issued broad-ranging economic sanctions against Russia. Additional sanctions may be imposed in the future. Such sanctions (and any future sanctions) and other actions against Russia may adversely impact, among other things, the Russia economy and various sectors of the economy and companies, the value and liquidity of Russian securities, the value of the ruble, the country’s credit rating and may have other adverse consequences on the Russian government, economy, companies and region.
The ramifications of the hostilities and sanctions, however, may not be limited to Russia and Russian companies but may spill over to and negatively impact other regional and global economic markets of the world (including Europe and the United States), companies in other countries (particularly those that have done business with Russia) and on various sectors, industries and markets for securities and commodities globally, such as oil and natural gas. Accordingly, the actions discussed above and the potential for a wider conflict could increase financial market volatility, cause severe negative effects on regional and global economic markets, industries, and companies and
83
Notes to Financial Statements (continued)
have a negative effect on a Fund’s investments and performance beyond any direct or indirect exposure a Fund may have to Russian issuers or those of adjoining geographic regions. In addition, Russia may take retaliatory actions and other countermeasures, including cyberattacks and espionage against other countries and companies in the world, which may negatively impact such countries and the companies in which a Fund invests. Accordingly, there may be heightened risk of cyberattacks which may result in, among other things, disruptions in the functioning and operations of industries or companies around the world, including in the United States and Europe.
Similarly, in October 2023, Hamas launched an attack on Israel, which touched off a strong military response from Israel that closed borders and airspace, damaged infrastructure and resulted in significant civilian and military casualties in Israel and the Gaza Strip. The conflict has reignited regional tensions that threaten to involve other countries and factions. The continuing conflict and its escalation could have a severe adverse effect on the regional economy, currency and companies. These events may negatively impact other regional and global economic markets of the world (including Europe and the United States), companies in such countries and various sectors, industries and markets for securities and commodities globally, such as oil and natural gas. Accordingly, the hostilities may have a negative effect on a Fund’s investments in issuers of Israeli securities or in Israeli markets and performance, and may extend beyond any direct or indirect exposure a Fund may have to Israeli issuers or those of adjoining geographic regions. The extent and duration of these military actions or future escalations of such hostilities, the extent and impact of any related sanctions, market disruptions and volatility, and the result of any diplomatic negotiations cannot be predicted. If a Fund has investments in a region enduring geopolitical market disruption, it may face higher risk of loss, although the increasing interconnectivity between global economies and financial markets can lead to events or conditions in one country, region or financial market adversely impacting a different country, region or financial market.
Furthermore, the economies of the United States and its trading partners, as well as the financial markets generally, may be adversely impacted by trade disputes and other matters. For example, the United States has imposed trade barriers and restrictions on China. In addition, the Chinese government is engaged in a longstanding dispute with Taiwan, continually threatening an invasion. If the political climate between the United States and China does not improve or continues to deteriorate, if China were to attempt invading Taiwan, or if other geopolitical conflicts develop or worsen, economies, markets and individual securities may be adversely affected, and the value of a Fund’s assets may go down.
These and any related events could have a significant negative impact on a Fund’s investments as well as a Fund’s performance. Aside from the foregoing turbulence, global and domestic regulators have previously responded to serious economic disruptions with ranging fiscal and monetary policy changes, including but not limited to direct capital infusions into companies, new monetary programs and dramatically lower interest rates. Any change in these policies, or the ineffectiveness of these policies, could increase volatility in securities markets, which may adversely impact a Fund’s investments and performance. Actions taken by the U.S. Federal Reserve (Fed) or foreign central banks to stimulate or stabilize economic growth, such as interventions in currency markets, could cause high volatility in the equity and fixed-income markets. Reduced liquidity may result in less money being available to purchase raw materials, goods and services from emerging markets, which may, in turn, bring down the prices of these economic staples. It may also result in emerging-market issuers having more difficulty obtaining financing, which may, in turn, cause a decline in their securities prices.
Political turmoil within the United States and abroad may also impact a Fund. The ongoing adversarial political climate in the United States, as well as political and diplomatic events abroad, such as presidential, congressional and gubernatorial elections in the U.S., global elections and governmental changes and the U.S. government’s failure to agree on a long-term budget and deficit reduction plan, have and may continue to have an adverse impact on the U.S. regulatory landscape, markets and investor behavior, which could have a negative impact on a Fund’s investments and operations. Although the U.S. government has honored its credit obligations, it remains possible that the United States could default on its obligations. While it is impossible to predict the consequences of such an unprecedented event, it is likely that a default by the United States would be highly disruptive to the U.S. and global securities markets and could significantly impair the value of a Fund’s investments. Similarly, political events within the United States at times have resulted, and may in the future result, in a shutdown of government services, which could negatively affect the U.S. economy, decrease the value of a Fund’s investments and increase uncertainty in or impair the operation of the U.S. or other securities markets. In recent years, the U.S. renegotiated many of its global trade relationships and imposed or threatened to impose significant import tariffs. Such actions could lead to price volatility and overall declines in U.S. and global investment markets.
In addition, there is a risk that the present value of assets or income from investments will be less in the future as rising prices (inflation) reduce their purchasing power. Inflation rates may change frequently and drastically as a result of various factors, including unexpected shifts in the
84
domestic or global economy, and a Fund’s investments may be affected, which may reduce a Fund’s performance. While overshadowed by recent rapid inflation, there is also a risk that the prices of goods and services in the United States and many foreign economies may decline over time (deflation). Deflation may have an adverse effect on stock prices and creditworthiness and may make defaults on debt more likely. If a country’s economy slips into a deflationary pattern, it could last for a prolonged period and may be difficult to reverse. Historically, securities issued in emerging and frontier markets have been subject to a greater risk of inflationary or deflationary forces, and more developed markets have been better able to use monetary policy to normalize markets.
The value of a Fund’s investments may be impacted by global health crisis or other events. The COVID-19 global pandemic or any future public health crisis and ensuing policies enacted by governments and central banks have caused and may continue to cause significant volatility and uncertainty in global financial markets, negatively impacting global growth prospects. While vaccines have been developed, there is no guarantee that vaccines will be effective against emerging future variants of the disease or new diseases. As the COVID-19 pandemic illustrated, such events may affect certain geographic regions, countries, sectors and industries more significantly than others.
Advancements in technology may also adversely impact markets and the overall performance of a Fund. For instance, the economy may be significantly impacted by the advanced development and increased regulation of artificial intelligence. These events, and any other future events, may adversely affect the prices and liquidity of a Fund’s portfolio investments and could result in disruptions in the trading markets. Further, the interconnectivity between global economies and financial markets increases the likelihood that events or conditions in one region or financial market may adversely impact issuers in a different country, region or financial market.
These events, and any other future events, may adversely affect the prices and liquidity of a Fund’s portfolio investments and could result in disruptions in the trading markets.
Government and Regulatory Action Risk — Government and regulatory action risks may be considered a principal risk of the Funds. Instability in the financial markets has led many governments, including the U.S. government, to take a number of unprecedented actions designed to support certain financial institutions and segments of the financial markets that have experienced extreme volatility and, in some cases, a lack of liquidity. Federal, state and other governments, and their regulatory agencies or self-regulatory organizations, may take actions that affect the regulation of the instruments in which a Fund invests, or the issuers of such instruments, in ways that are unfore-
seeable. Legislation or regulation may also change the way in which a Fund is regulated or operated. The effects of these actions on the markets generally, and a Fund’s investment program in particular, can be uncertain. Such legislation or regulation could restrict the ability of a Fund to fully implement its investment strategies, either generally or with respect to certain securities, industries or countries and could limit or impede a Fund’s ability to achieve its investment objective. In addition, political events within the United States and abroad could negatively impact financial markets and a Fund’s performance. Volatile financial markets can expose a Fund to greater market and liquidity risk, increased transaction costs, and potential difficulty in valuing portfolio instruments held by the Fund.
Shareholder Concentration Risk — A significant portion of the net assets of several Wasatch Funds are owned by a group of investors advised by a common investment advisor or have a significant portion of net assets in relatively few related accounts. In the event of significant redemption activity by these shareholders, these Funds could experience a loss when selling portfolio securities to meet such redemption requests. The Funds could be forced to sell portfolio securities at unfavorable prices in an effort to generate sufficient cash to pay redeeming shareholders. Fund expenses may increase and performance may be materially affected.
Region Risk — The Funds, except the U.S. Treasury Fund, invest in equity and fixed-income securities of non-U.S. issuers. Because certain foreign markets are illiquid, market prices may not necessarily represent realizable value. Although the Funds maintain diversified investment portfolios, political or economic developments within a particular country or region may have an adverse effect on the ability of domiciled issuers to meet their obligations. These risks are exaggerated for securities of issuers tied economically to emerging- and frontier-market countries. Additionally, political or economic developments may have an adverse effect on the liquidity and volatility of portfolio securities and currency holdings.
Indian Market and India Region Risk — The Emerging India Fund, Emerging Markets Select Fund, Emerging Markets Small Cap Fund, Frontier Emerging Small Countries Fund, Global Opportunities Fund, Global Select Fund, International Growth Fund and International Opportunities Fund may invest a significant portion of their assets in securities of companies tied economically to India (the “India region”). Companies in the India region with economic ties to India may be located in India, Bangladesh, Pakistan and Sri Lanka. The securities markets in the India region are substantially smaller, less liquid and more volatile than the major securities markets in the United States and the securities markets in the India region are comparatively underdeveloped. Financial intermediaries may not perform as well as their counterparts in the United States
85
Notes to Financial Statements (continued)
or in other countries with more developed securities markets. A Fund may be unable to sell securities when the registration process is incomplete and may experience delays in receiving dividends. If a market’s trading volume is limited by operational difficulties, the ability of a Fund to invest may be impaired. A Fund’s ability to buy or sell India region securities may be impaired if the Fund’s ability to transact is denied, delayed, suspended or not renewed by local regulators. In previous years, exchange-listed companies in the information-technology sector and related industries (such as software) have grown so as to represent a significant portion of the total capitalization of the Indian market. The value of these companies will generally fluctuate in response to technological and regulatory developments. In addition, governmental actions, including economic and tax reforms, can have a significant effect on economic conditions in the India region, which could adversely affect the value and liquidity of investments. The government in India has exercised and continues to exercise significant influence over many aspects of the economy. Government actions, bureaucratic obstacles and inconsistent economic reform within the Indian government have had a significant effect on its economy and could adversely affect market conditions, economic growth and the profitability of private enterprises in India. Further, any actions or other factors that may impede the flow of foreign capital to India may also inhibit its growth. Although the governments of India, Bangladesh, Pakistan, and Sri Lanka have begun to institute economic reform policies, there can be no assurance that they will continue to pursue such policies or, if they do, that such policies will succeed. In addition, large portions of many Indian companies remain in the hands of their founders (including members of their families) and the corporate governance of such family-owned companies may be weaker and less transparent. Religious, cultural and military disputes persist in India, and between India and Pakistan (as well as sectarian groups within each country). The longstanding border dispute with Pakistan remains unresolved. Both India and Pakistan have tested nuclear arms, and the threat of deployment of such weapons could hinder development of the Indian economy, and escalating tensions could impact the broader region, including China.
Liquidity Risk — From time to time, the trading market for a particular security or securities or a type of security in which the Funds invest may become less liquid or even illiquid, particularly with respect to emerging-market and frontier-market securities, IPOs and early stage companies. Reduced liquidity will have an adverse impact on a Fund’s ability to sell such securities when necessary to meet a Fund’s liquidity needs or in response to a specific economic event. Market price quotations for such securities may be volatile.
Asia Region Risk — The Emerging Markets Select, Emerging Markets Small Cap, Global Opportunities, Global Select, Global Value, International Growth, International Opportunities and International Select Funds may invest a significant portion of their assets in the securities of companies tied economically to markets in the Asia region, including, among others, Bangladesh, China, Hong Kong, Indonesia, Japan, Malaysia, the Philippines, Singapore, South Korea, Taiwan, Thailand and Vietnam. Similarly, the Frontier Emerging Small Countries Fund may invest a significant portion of its assets in the securities of companies tied economically to frontier and small emerging market countries in the Asia region including, among others, Bangladesh, Indonesia, Malaysia, the Philippines, Singapore, Taiwan, Thailand and Vietnam. The Emerging India Fund invests primarily in securities of companies tied economically to India. The Emerging India Fund considers that companies in the India region with economic ties to India may be located in India, Bangladesh, Pakistan and Sri Lanka. The Greater China Fund invests primarily in the securities of companies tied economically to China, Hong Kong and Taiwan. The value of a Fund’s assets invested in countries in the Asia region may be adversely affected by, among other things, political, economic, social and religious instability, less mature or liquid securities markets, increased price volatility, inadequate investor protection, different financial reporting requirements, different or inadequate accounting standards and practices, limited government oversight and market regulations, expropriation or nationalization of assets, capital controls, less developed or diverse economies, changes in laws or regulations of countries within the Asia region, relations with other nations, natural disasters, corruption, civil unrest and military activity. Countries in the Asia region, particularly China, Japan and South Korea, may be adversely affected by political, military, economic and other factors related to North Korea. In addition, China’s long-running conflict over Taiwan’s sovereignty, border disputes with many neighbors and historically strained relations with Japan could adversely impact economies in the region. The economies of many Asian countries differ from the economies of more developed countries in many respects, such as the rate of growth, inflation, capital reinvestment, resource self-sufficiency, financial system stability and sensitivity to changes in global trade. Certain Asian countries are highly dependent upon and may be affected by developments in the United States and Europe and other Asian economies. Global economic conditions and international trade may affect Asian economies, and companies’ prospects and financials could deteriorate as a result of political instability and uncertainty as well as increased tensions with other nations, the imposition of tariffs and other protectionist trade policies and other similar actions.
86
In addition, the Asian region is comprised of countries in all stages of economic development, some of which may experience overextension of credit, currency devaluation and restrictions, rising unemployment, high inflation, an underdeveloped financials sector, heavy reliance on international trade and prolonged economic recessions. Deflationary factors could also reemerge in certain Asian markets which some countries may not have the capacity to address. Many Asian region countries are dependent on foreign supplies of energy and competition to claim or develop regional supplies of energy or other natural resources could lead to economic, political or military instability or disruption and adversely impact the performance of a Fund. As some countries in the Asian region are less developed and may be considered emerging or frontier markets, the risk to foreign investors of investing in such countries will be magnified and include the risks of investing in emerging or frontier markets, such as increased political and social instability; highly volatile, less mature and less liquid securities markets; lower corporate government standards; limited government oversight and market regulation; differing financial reporting, accounting and auditing standards; capital controls; potential expropriation or nationalization of companies or industries; currency fluctuations; restrictions on foreign ownership; less legal recourse to enforce a Fund’s rights; less publicly available or inaccurate information regarding companies; high taxation; less developed or diverse economies and other political, economic or social developments.
The Asia region includes Japan, China, Hong Kong and Taiwan. The Japanese economy has only recently emerged from a prolonged economic downturn. The Japanese economy may be subject to considerable economic, political and social instability, which could have a negative impact on Japanese securities. Since the year 2000, Japan’s economic growth rate has remained relatively low compared to other advanced economies, and it may remain low in the future. The economy is characterized by an aging and declining population, large government debt and a highly regulated labor market. Economic growth is dependent on domestic consumption, deregulation and consistent government policy. International trade, particularly with the U.S., also impacts growth, and adverse economic conditions in the U.S. or other such trade partners may affect Japan. Japan also has a growing economic relationship with China and other Southeast Asian countries, and thus Japan’s economy may also be affected by economic, political or social instability in those countries (whether resulting from local or global events as well as from any deterioration in its relationship with neighboring countries). In addition, Japan is subject to the risk of natural disasters, such as earthquakes, volcanic eruptions, typhoons and tsunamis, which could negatively affect a Fund that has investments in Japan.
With respect to China, Hong Kong and Taiwan, see the risks of investing described below under “Greater China Region Risk.” In addition, certain securities issued by companies located or operating in China, such as China A-Shares, are subject to trading restrictions, quota limitations and less market liquidity. See “Risks of Investing in Chinese Securities” below for additional information regarding these shares.
Greater China Region Risk — The Greater China Fund is subject to additional risks associated with its investments in the Greater China Region. The Greater China Region includes The People’s Republic of China (“PRC” or “China”), Hong Kong, and Taiwan. The other Equity Funds may also invest in countries in the Asia region, including China, Hong Kong, and Taiwan, and therefore may also be subject to the risks of investing in such countries. Countries in the Greater China Region may be subject to considerable degrees of economic, political or social instability. China and Taiwan are emerging market countries and demonstrate significantly higher volatility from time to time in comparison to developed markets. Chinese governmental actions can have a significant effect on economic conditions in China, Hong Kong, and Taiwan or on a particular issuer or industry, which could adversely affect the value and liquidity of investments. The Chinese government exercises significant control over China’s economy through, among other things, its industrial policies, monetary policies, management of currency exchange rates, and management of the payment of foreign currency-denominated obligations. Changes in these policies may adversely impact industries and companies in China. Although over the years the Chinese government has been reforming economic and market practices, the Chinese government could, at any time, alter or discontinue such economic reform programs adversely affecting industries and companies in China.
Chinese companies are also subject to the risk that Chinese authorities can intervene in their operations and business structure.
After years of steady growth, China’s economy slowed prior to 2020, including in its Chinese real-estate market. Although the trends began to reverse during China’s initial recovery from the pandemic, it is uncertain whether the trends will continue. China’s economy may experience a significant slowdown, an economic recession or periods of substantial inflation which may have a negative effect on its securities market. Economies of countries in the Greater China Region, particularly their export-oriented industries, may be adversely impacted by the developments in the economies and governmental actions of their principal trading partners, including the United States, such as a reduction in spending on their products and services, a downturn in the economies of their key trading partners, and the imposition of trading, restrictions, tariffs or other protectionist trade policies.
87
Notes to Financial Statements (continued)
The United States and China have been engaged in an ongoing trade war with one another, which has led to trade frictions between their economies and negative repercussions for global markets and other nations closely affiliated with those countries. The current political climate has intensified concerns about the ongoing trade war between China and the United States, as each country has imposed tariffs on the other country’s products. These actions may significantly reduce international trade, substantially reduce the price of goods, cause an oversupply of certain manufactured goods and trigger the possible failure of individual companies and/or large segments of China’s export industry which could have a negative impact on a Fund’s performance. In addition, there is a risk that further capital controls and/or sanctions may be imposed, which could include the prohibition of, or restrictions on, the ability to own or transfer currency, securities, derivatives or other assets and may also include retaliatory action such as the seizure of assets. Further, any perceived actions by China to assist Russia in evading sanctions imposed as a result of the Ukraine invasion may result in new or expanded sanctions against China. Any of these actions could severely impair a Fund’s ability to purchase, sell, transfer, receive, deliver or otherwise obtain exposure to Chinese securities and assets, including the ability to transfer the Fund’s assets and income back into the United States, and could negatively impact the value and/or liquidity of such assets or otherwise adversely affect a Fund’s operations, causing the Fund to decline in value. Events such as these and their consequences are difficult to predict, and it is unclear whether further tariffs or escalating actions may be imposed in the future.
In addition, on June 3, 2021, President Biden signed an executive order which, in general terms, prohibits U.S. persons from purchasing or selling publicly traded securities or derivatives of such securities in certain companies with ties to China’s military and related materials sector or surveillance technology industry as listed in the order or as determined by the U.S. Secretary of the Treasury (hereafter, “Chinese Military-Industrial Complex Companies” or “CMICs”). The list of CMICs is subject to change from time to time, which could prevent a Fund from acquiring securities previously deemed suitable investments or result in a forced sale of securities in the portfolio at an inopportune time or price which may result in losses to the Fund. Such government prohibitions may affect the value of the securities held in the portfolio directly or indirectly as well as negatively impact the market for other China-based issuers resulting in reduced liquidity and price declines. The government prohibition also could lead to the inability to transact in the securities of other companies within the Greater China Region as a result of trade tensions between the U.S. and China.
On December 2, 2020, the U.S. Congress also passed the Holding Foreign Companies Accountable Act, which could cause the securities of foreign issuers (including Chinese issuers) to be delisted from U.S. stock exchanges if those companies do not permit U.S. oversight of the auditing of their financial information. To the extent a Fund invests in securities of Chinese companies listed in the U.S., delisting could decrease the Fund‘s ability to transact in such securities and could significantly impact their liquidity and market price. In addition, the Fund would have to seek other markets in which to transact in such securities which would also increase the Fund’s costs. It is difficult to predict the consequences of these actions or whether further tariffs and actions will be taken.
Further, China’s domestically oriented industries may be particularly sensitive and adversely affected by changes in government policy and investment cycles as China’s consumer class continues to grow. China has historically managed its currency in a tight range relative to the U.S. dollar but this may be subject to greater uncertainty as Chinese authorities may change the policies that determine the exchange rate mechanism. In addition, the Chinese government may actively attempt to influence the operation of Chinese markets through, among other things, currency controls, direct investments, limitations on specific types of transactions (such as short selling), limitations or prohibitions on investors (including foreign institutional investors) with regard to selling holdings in Chinese companies, limitations or prohibitions on foreign ownership in certain industries or the repatriation of assets by foreign investors under certain circumstances or similar actions.
Certain securities issued by companies located or operating in China, such as China A-Shares described below, are subject to trading restrictions, quota limitations, and less market liquidity. Chinese authorities may intervene in the Chinese securities markets and halt or suspend trading of securities for short or even longer periods of time. The Chinese securities markets have experienced considerable volatility, and have been subject to relatively frequent and excessive trading halts and suspensions which, among other things, contribute to uncertainty in the markets, reduce the liquidity of securities subject to a trading halt or suspension and lead to greater market execution and valuation risks. Such actions could adversely impact a Fund’s ability to achieve its investment objective(s), its ability to trade China shares during such periods and could result in the Fund’s limiting or suspending shareholder redemption privileges as permitted in accordance with applicable law. The Chinese markets generally continue to experience inefficiencies, volatility and pricing anomalies resulting from governmental influence, lack of publicly available information and/or political or social instability. Under current rules of the PRC, there is a limit as to how many shares a single foreign investor is permitted to hold in a PRC-listed company and a limit as to
88
the maximum combined holdings of all foreign investors in a PRC-listed company. As a result, a Fund may have to sell securities at an inopportune time or price, may not be able to execute its investment strategy and its performance may be hindered.
Additional risks of loss from investing in countries in the Greater China Region include currency fluctuations, interest rate fluctuations, less liquidity, higher rates of inflation, expropriation (the confiscation of assets and property), confiscatory taxation, nationalization, imposition of tariffs, limitations on repatriation of currency, exchange control regulations (including currency blockage), trading halts and differing legal, accounting, auditing, financial and reporting standards. Financial reporting by Chinese companies does not have as much regulatory oversight as in the United States. Frequent intervention by the Chinese government, limits on credible corporate governance standards, limited transparency of market and accounting information, and limited oversight of accounting firms increase the risk of insider dealing, market manipulation, improper accounting and accounting fraud and other corporate misconduct. There may be significant obstacles to obtaining information necessary for investigations into or litigation against Chinese companies.
Internal social unrest or confrontations with neighboring countries, including military conflicts in response to such events, strained international relations and security concerns such as terrorism, may also adversely impact China’s economy, disrupting its economic growth and adversely affecting a Fund’s investments. Any spread of an infectious illness, public health threats or similar issues could reduce consumer demand or economic output, result in market closures, travel restrictions or quarantines, and generally also have a significant impact on the economies of China, Hong Kong, and Taiwan (the Greater China Region), which in turn could adversely affect a Fund’s investments. Additionally, China is alleged to have participated in state-sponsored cyberattacks against foreign companies and foreign governments. Actual and threatened responses to such activity and strained international relations, including purchasing restrictions, sanctions, tariffs or cyberattacks on the Chinese government or Chinese companies, may impact China’s economy and Chinese issuers of securities in which a Fund invests. Incidents involving China’s or the region’s security may cause uncertainty in the Chinese markets and may adversely affect the Chinese economy and a Fund’s investments. Further, China’s strained relationships with certain ethnic groups in China, including Tibetans and Uighurs, have been marked with protests and violence and may adversely affect the Chinese economy.
Risks of Investing in Chinese Securities — The Greater China Fund intends to invest in the securities of Chinese companies through various securities markets and investment vehicles, including China A-Shares through the Stock
Connect Programs — the Shanghai-Hong Kong Stock Connect program and the Shenzhen-Hong Kong Stock Connect program, H-Shares and B-Shares, shares listed on U.S. exchanges, American Depositary Receipts (ADRs), and Variable Interest Entities (“VIEs”) traded on a stock exchange (as described below), and investing in these markets and vehicles is therefore considered a principal risk of the Fund. Other Equity Funds may also invest in Asia countries, including China. Such Equity Funds may also invest in Chinese securities, including China A-Shares, and incur Chinese securities risk.
China A-Shares are the stock shares of mainland China- based companies that trade on the two Chinese stock exchanges, the Shanghai Stock Exchange (SSE) and the Shenzhen Stock Exchange (SZSE). Prices on these exchanges are quoted in renminbi. The Stock Connect Programs (mentioned above) are securities trading and clearing links programs with an aim to achieve mutual stock market access between mainland China and Hong Kong. The Stock Connect Programs were developed by the Stock Exchange of Hong Kong Limited (SEHK), the Hong Kong Exchanges and Clearing Limited, the SSE (in the case of the Shanghai Connect) or the SZSE (in the case of the Shenzhen Connect), and the China Securities Depository and Clearing Corporation (CSDC). Investing in China A-Shares is subject to trading, clearance, settlement and other procedures which could pose risks to a Fund, including illiquidity risk, currency risk, legal and regulatory risk, execution risk, operational risk, tax risk and credit risk. China A-Shares markets have a higher propensity for trading suspensions than many other global equity markets. As a result of differing legal standards, a Fund also faces the risk of being unable to enforce its rights with respect to its China A-Share holdings. Trading through the Stock Connect Programs is currently subject to a daily quota, which limits the maximum net purchases under the Stock Connect Programs each day and, as such, buy orders for China A-Shares would be rejected once the daily quota is exceeded (although a Fund will be permitted to sell China A-Shares regardless of the daily quota). The daily quota may restrict a Fund’s ability to invest in China A-Shares through Stock Connect Programs on a timely basis and could affect the Fund’s ability to effectively pursue its investment strategy. Further, the Stock Connect Programs, which rely on the connectivity of the Shanghai or Shenzhen markets with the Hong Kong market, are subject to operational risk, regulations that are relatively untested and are subject to change, and extended market closures for holidays or otherwise. During an extended market closure, a Fund’s ability to trade in China A-Shares will be impacted which may affect the Fund’s performance.
Trading suspensions in certain stocks and extended market closures could lead to greater market execution risk, valuation risks, liquidity risks and costs for a Fund. The
89
Notes to Financial Statements (continued)
Stock Connect Programs will only operate on days when both the Chinese and Hong Kong markets are open for trading and when banking services are available in both markets on the corresponding settlement days. Accordingly, an investment in China A-Shares though the Stock Connect Programs may subject a Fund to the risk of price fluctuations on days when the Chinese markets are open, but the Stock Connect Programs are not trading. Further, if one or both of the Chinese markets and the Hong Kong market are closed on a U.S. trading day, a Fund may not be able to acquire or dispose of China A-Shares in a timely manner.
The Stock Connect Programs do not have an extensive operating history and there is no certainty as to how current regulations or new regulations that may be adopted will be applied or interpreted in connection with the operations, legal enforcement and cross-border trades under the Stock Connect Programs. In addition, there can be no assurance that the Stock Connect Programs will be continued. A Fund may be adversely affected as a result of such changes. Further, different fees, costs and taxes are imposed on foreign investors acquiring China A-Shares through the Stock Connect Programs. These fees, costs and taxes may be higher than those imposed on other Chinese securities providing similar investment exposure.
In addition to the China A-Shares, a Fund may also invest in other classes of shares, including B-Shares and H-Shares. B-Shares are allocated to both international and domestic investors and are denominated in U.S. dollars on the SSE and Hong Kong dollars on the SZSE. The B-Shares market is generally smaller and less liquid and has a smaller issuer base than the China A-Shares market. H-Shares are issued by companies incorporated in the PRC that derive substantial revenues from or allocate substantial assets in the PRC of issuers that also issue China A-Shares. H-Shares may trade at significant discounts or premiums to their China A-Shares counterparts. These share classes are subject to the political and economic policies of China.
An Equity Fund may also invest its assets in securities of VIEs. In China, direct ownership of companies in certain sectors by foreign individuals and entities (including U.S. persons and entities such as the Funds) is prohibited. In order to facilitate foreign investment in these businesses, many Chinese companies have created VIEs to facilitate indirect foreign ownership. In such an arrangement, a China-based operating company typically establishes an offshore shell company in another jurisdiction such as the Cayman Islands. That shell company enters into service and other contracts with the China-based operating company, then issues shares on a stock exchange such as the New York Stock Exchange or the Hong Kong Stock Exchange. Foreign investors hold stock in the VIE shell company rather than directly in the China-based operating company. The VIE arrangement allows U.S. investors to obtain economic exposure to
the China-based company indirectly through the contractual VIE structure rather than directly through the formal equity ownership structure.
VIEs are a common industry practice and well known to officials and regulators in China. However, VIEs are not formally recognized under Chinese law. Recently, the government of China provided new guidance to and placed restrictions on China-based companies raising capital offshore, including through VIE structures. Investors face uncertainty about future actions by the government of China that could significantly affect an operating company’s financial performance and the enforceability of the VIE shell company’s contractual arrangements. It is uncertain whether Chinese officials or regulators will withdraw their implicit acceptance of the VIE structure, or whether any new laws, rules or regulations relating to these structures will be adopted or, if adopted, what impact they would have on the interests of foreign shareholders. Under extreme circumstances, China might prohibit the existence of VIEs, or limit a VIE’s ability to pass through economic and governance rights to foreign individuals and entities. If the Chinese government takes action affecting VIEs, the market value of a Fund’s associated portfolio holdings would likely suffer significant, detrimental, and possibly permanent effects, which could result in substantial investment losses.
In addition, Chinese companies, including Chinese companies listed on U.S. exchanges, are not subject to the same degree of regulatory requirements, accounting standards or auditor oversight as companies in more developed countries. As a result, information about Chinese securities and VIEs in which a Fund invests may be less reliable or complete. As with other Chinese companies with securities listed on U.S. exchanges, U.S.-listed VIEs and ADRs may be delisted if they do not meet U.S. accounting standards and auditor oversight requirements. Delisting would significantly decrease the liquidity and value of the securities, decrease the ability of a Fund to transact in such securities and may increase the costs of a Fund if it is required to seek other markets in which to transact in such securities. There also may be significant obstacles to obtaining information necessary for investigations into or litigation against Chinese companies, and shareholders may have limited legal remedies.
Europe and United Kingdom Risk — The Global Opportunities Fund, the Global Select Fund, the Global Value Fund, the International Growth Fund, the International Opportunities Fund, the International Select Fund and the Micro Cap Value Fund may invest a significant portion of their assets in securities issued by companies in developed markets, including European countries and the United Kingdom (“U.K.”).
Many countries in Europe are member states of the EU and will be significantly affected by the fiscal and monetary
90
controls of the EU. Changes in regulations on trade, decreasing imports or exports, changes in the exchange rate of the euro and recessions or defaults or threats of defaults among European countries may have a significant adverse effect on the economies of other European countries. The European financial markets have experienced significant volatility, and several European countries have been adversely affected by unemployment, budget deficits and economic downturns.
Responses to financial problems by European governments, central banks and others, including austerity measures and reforms, may not produce the desired results, may result in social unrest, may limit future growth and economic recovery or may have other unintended consequences. Defaults or restructurings by governments and other entities of their debt could have additional adverse effects on economies, financial markets and asset valuations around the world.
Successionist movements as well as governmental or other response to such movements, may also create instability and uncertainty in the region. In addition, the national politics of countries in the EU have been unpredictable and subject to influence by disruptive political groups and ideologies. The governments in EU countries may be subject to change and such countries may experience social and political unrest. Unanticipated or sudden political or social development may result in sudden and significant investment losses. The occurrence of terrorist incidents throughout Europe or war in the region could also impact financial markets. The impact of these events is not clear but could be significant and far-reaching and could adversely affect the value and liquidity of a Fund’s investments. Any of these effects could adversely affect any of the companies to which a Fund has exposure and any other assets in which a Fund invests.
Efforts by the member countries of the EU to continue to unify their economic and monetary policies may increase the potential for similarities in movements of European markets and reduce the potential investment benefits of diversification within the region. Further, while many countries in western Europe are considered to have developed markets, many eastern European countries are less developed, and investments in eastern European countries, even if denominated in euros, may involve special risks associated with investments in emerging markets. As the economies of countries in Europe are in different stages of development, the policies adopted by the EU may not address the needs of all European countries.
Sector and Industry Weightings Risk — The Equity Funds may invest a large percentage of their assets in a few sectors, or industries within a particular sector. A Fund’s investment in a particular sector will fluctuate over time based on the investment opportunities identified by the Advisor. The risks associated with investing in various
sectors and industries are considered principal risks of these Funds. These sectors include communication services, consumer discretionary, consumer staples, energy, financials, health care, industrials, information technology, materials, real estate and utilities. Market conditions, interest rates, and economic, political, regulatory, or financial developments could significantly affect a single sector. If an Equity Fund invests in only a few sectors it will have more exposure to the price movements of securities in those sectors. The Funds may also from time to time make significant investments in an industry or industries within a particular sector. Adverse conditions in such industry or industries could have a correspondingly adverse effect on the financial condition of issuers. These conditions may cause the value of a Fund’s shares to fluctuate more than the values of shares of funds that invest in a greater variety of investments. To the extent an Equity Fund has substantial holdings within a particular sector, or industry therein, the risks to the Fund associated with the sector or industry increase.
12. FAIR VALUE MEASUREMENTS AND INVESTMENTS
The fair value of a financial instrument is the amount that would be received to sell an asset or paid to transfer a liability in an orderly transaction between market participants at the measurement date. The Funds use various methods to measure the fair value of their investments on a recurring basis. U.S. GAAP established a hierarchy that prioritizes inputs to valuation methods. The three levels of inputs are:
| | • | | Level 1 — Unadjusted quoted prices in active markets for identical assets or liabilities that the Funds have the ability to access. |
| | • | | Level 2 — Observable inputs other than quoted prices included in Level 1 that are observable for the asset or liability, either directly or indirectly. The inputs may include quoted prices for the identical investment on an inactive market, prices for similar investments, interest rates, prepayment speeds, credit risk, yield curves, default rates and similar data. |
| | • | | Level 3 — Unobservable inputs for the asset or liability, to the extent relevant observable inputs are not available, represent the Funds’ own assumptions about the assumptions a market participant would use in valuing the asset or liability and would be based on the best information available. |
The availability of observable inputs can vary from security to security and is affected by a wide variety of factors, including, for example, the type of security, whether a security is new and not yet established in the marketplace, the
91
Notes to Financial Statements (continued)
liquidity of markets, and other characteristics particular to the security. To the extent that valuation is based on models or inputs that are less observable or unobservable in the market, the determination of fair value requires more judgment. Accordingly, the degree of judgment exercised in determining fair value is greatest for instruments categorized in Level 3.
Investments for which market quotations are not readily available are valued at fair value as determined in good faith pursuant to Rule 2a-5 under the 1940 Act. As a general principle, the fair value of a security or other asset is the price that would be received to sell an asset or paid to transfer a liability in an orderly transaction between market participants at the measurement date. Pursuant to Rule 2a-5, the Board has designated the Advisor as the valuation designee (“Valuation Designee”) for each Fund to perform the fair value determination relating to all Fund investments. The Advisor may carry out its designated responsibilities as Valuation Designee through various teams and committees. The Valuation Designee’s policies and procedures govern the Valuation Designee’s selection and application of methodologies for determining and calculating the fair value of Fund investments.
Equity Securities (common and preferred stock) — Securities are valued as of the close of the New York Stock Exchange (“NYSE”) (generally 4:00 p.m. Eastern Time) on the valuation date. Equity securities and listed warrants are valued using a commercial pricing service at the official close price or last quoted sales price taken from the primary market in which each security trades and, with respect to equity securities traded on the National Association of Securities Dealers Automated Quotations (“NASDAQ”) system, such securities are valued using the NASDAQ Official Closing Price (“NOCP”) or last sales price if no NOCP is available. If there are no official close or sales on the primary exchange or market on a day, then the security shall be valued at the mean of the last bid and ask price on the primary exchange or market as provided by a pricing service. If the mean cannot be calculated or there is no trade activity on a day, then the security shall be valued at the previous trading day’s price as provided by a pricing service. To the extent that these securities are actively traded and valuation adjustments are not applied, they are categorized in Level 1 of the fair value hierarchy. Additionally, a Fund’s investments are valued at fair value by the Pricing Committee if the Advisor determines that an event impacting the value of an investment occurred between the closing time of a security’s primary market or exchange (for example, a foreign exchange or market) and the time the Fund’s share price is calculated. Significant events include, but are not limited to the following: significant fluctuations in domestic markets, foreign markets or foreign currencies; occurrences not directly tied to the securities markets such as natural disasters, armed conflicts or
significant governmental actions; and major announcements affecting a single issuer or an entire market or market sector. In responding to a significant event, the Pricing Committee determines the fair value of affected securities by considering factors including, but not limited to: index options and futures traded subsequent to the close; American Depositary Receipts (“ADRs”), Global Depositary Receipts (“GDRs”) or other related receipts; currency spot or forward markets that trade after pricing of the foreign exchange; other derivative securities traded after the close such as Standard & Poor’s Depositary Receipts (“SPDRs”) and other exchange-traded funds (“ETFs”); and alternative market quotes on the affected securities. When applicable, the Funds use a systematic fair valuation model provided by an independent third party to assist in adjusting the valuation of foreign securities. When a Fund uses this fair value pricing method, the values assigned to the Fund’s foreign securities may not be the quoted or published prices of the investments on their primary markets or exchanges, and the securities are categorized in Level 2 of the fair value hierarchy. These valuation procedures apply equally to long or short equity positions in a Fund.
Participation Notes — Investments are valued at the market price of the underlying security. Counterparty risk is regularly reviewed and considered for valuation. To the extent the inputs are observable and timely, the values would be categorized in Level 2 of the fair value hierarchy.
Corporate Debt Securities — Investments are valued at current market value by a pricing service, or by using the last sale or bid price based on observable inputs. Observable inputs may include benchmark yields, reported trades, broker/dealer quotes, issuer spreads, two-sided markets, benchmark securities, bids, offers, and reference data (including market research publications). Although most corporate bonds are categorized in Level 2 of the fair value hierarchy, in instances where observable inputs are not available, they are categorized as Level 3.
Short-Term Notes — Investments maturing in 60 days or less at the time of purchase, are generally valued at amortized cost, unless it is determined that the amortized cost method would not represent fair value, in which case the securities are marked-to-market. To the extent the inputs are observable and timely, the values would be categorized in Level 2 of the fair value hierarchy.
Asset-Backed Securities — Investments are priced using the closing bid as supplied by a pricing service based on observable inputs. Observable inputs may include benchmark yields, reported trades, broker/dealer quotes, issuer spreads, two-sided markets, benchmark securities, bids, offers and reference data (including market research publications), new issue data, monthly payment information and collateral performance. Although most asset-backed securities are categorized in Level 2 of the fair
92
value hierarchy, in instances where observable inputs are not available, they are categorized as Level 3.
U.S. Government Issuers — Investments are priced using the closing bid as supplied by a pricing service based on observable inputs. Observable inputs may include benchmark yields, reported trades, broker/dealer quotes, issuer spreads, two-sided markets, benchmark securities, bids, offers, and reference data (including market research publications). Although most U.S. government securities are categorized in Level 2 of the fair value hierarchy, in instances where observable inputs are not available, they are categorized as Level 3.
Derivative Instruments — Listed derivatives that are actively traded are valued based on quoted prices from the exchange and categorized in Level 1 of the fair value hierarchy. Exchange-traded options are valued at the last sale price in the market where they are principally traded. If there are no sales on the primary exchange or market on a given day, then the option is valued at the mean of the last bid price and ask price on the primary exchange or market as provided by a pricing service. Forward foreign currency contracts are valued at the market rate provided by the pricing service and categorized as Level 2.
Restricted Securities — If market quotations are not readily available for the Funds’ investments in securities such as restricted securities, private placements, securities for which trading has been halted or other illiquid securities, these investments are valued at fair value in accordance with Board-approved Pricing Policies and Procedures by the Pricing Committee with oversight by the Board of Trustees. Fair value is defined as the price that would be received upon the sale of an asset, or paid to transfer a liability, in an orderly transaction between market participants at the measurement date under current market conditions. For each applicable investment that is fair valued, the Pricing Committee considers, to the extent applicable, various factors including, but not limited to, the financial condition of the company or limited partnership, operating results, prices paid in follow-on rounds, comparable companies in the public market, the nature and duration of the restrictions for holding the securities, a stated NAV for the partnership, if applicable, and other relevant factors. Depending on the relative significance of valuation inputs, these instruments may be classified in either Level 2 or Level 3 of the fair value hierarchy.
When the last day of the reporting period is a non-business day, certain foreign markets may be open on days the NYSE is closed, which could result in differences between the value of a Fund’s portfolio securities on the last business day and the last calendar day of the reporting period. Any significant security valuation changes due to an open foreign market are adjusted and reflected by the Fund for financial reporting purposes.
93
Notes to Financial Statements (continued)
The following is a summary of the fair valuations according to the inputs used as of September 30, 2024 in valuing the Funds’ assets and liabilities:
| | | | | | | | | | | | | | | | | | | | | | |
| Fund | | Category | | Quoted Prices
In Active Markets
For Identical
Investments
(Level 1) | | Significant Other
Observable Inputs
(Level 2) | | Significant
Unobservable
Inputs
(Level 3) | | Value at
9/30/2024 |
Core Growth Fund | | | | | | | | | | | | | | | | | | | | | | |
Assets | | | | | | | | | | | | | | | | | | | | | | |
Common Stocks | | | | | $ | 4,801,766,252 | | | | $ | — | | | | $ | — | | | | $ | 4,801,766,252 | |
| | | | | | | |
| | | | | $ | 4,801,766,252 | | | | $ | — | | | | $ | — | | | | $ | 4,801,766,252 | |
| | | | | | | |
Emerging India Fund | | | | | | | | | | | | | | | | | | | | | | |
Assets | | | | | | | | | | | | | | | | | | | | | | |
Common Stocks | | | | | | | | | | | | | | | | | | | | | | |
| | Apparel Retail | | | $ | — | | | | $ | 66,430,226 | | | | $ | — | | | | $ | 66,430,226 | |
| | Asset Management & Custody Banks | | | | — | | | | | 7,671,464 | | | | | — | | | | | 7,671,464 | |
| | Automotive Parts & Equipment | | | | — | | | | | 18,009,803 | | | | | — | | | | | 18,009,803 | |
| | Commodity Chemicals | | | | — | | | | | 31,150,424 | | | | | — | | | | | 31,150,424 | |
| | Construction Machinery & Heavy Transportation Equipment | | | | — | | | | | 7,702,970 | | | | | — | | | | | 7,702,970 | |
| | Consumer Finance | | | | — | | | | | 140,611,218 | | | | | — | | | | | 140,611,218 | |
| | Diversified Banks | | | | — | | | | | 68,854,904 | | | | | — | | | | | 68,854,904 | |
| | Diversified Chemicals | | | | — | | | | | 6,164,886 | | | | | — | | | | | 6,164,886 | |
| | Diversified Support Services | | | | — | | | | | 25,199,448 | | | | | — | | | | | 25,199,448 | |
| | Electrical Components & Equipment | | | | — | | | | | 7,205,624 | | | | | — | | | | | 7,205,624 | |
| | Food Retail | | | | — | | | | | 30,380,217 | | | | | — | | | | | 30,380,217 | |
| | Health Care Facilities | | | | 10,949,671 | | | | | 36,779,176 | | | | | — | | | | | 47,728,847 | |
| | Health Care Services | | | | — | | | | | 68,381,175 | | | | | — | | | | | 68,381,175 | |
| | Heavy Electrical Equipment | | | | — | | | | | 5,188,199 | | | | | — | | | | | 5,188,199 | |
| | Industrial Machinery & Supplies & Components | | | | — | | | | | 35,160,241 | | | | | — | | | | | 35,160,241 | |
| | Interactive Media & Services | | | | — | | | | | 32,009,910 | | | | | — | | | | | 32,009,910 | |
| | IT Consulting & Other Services | | | | — | | | | | 18,647,384 | | | | | — | | | | | 18,647,384 | |
| | Life Sciences Tools & Services | | | | — | | | | | 52,191,966 | | | | | — | | | | | 52,191,966 | |
| | Metal, Glass & Plastic Containers | | | | — | | | | | 2,729,146 | | | | | — | | | | | 2,729,146 | |
| | Regional Banks | | | | — | | | | | 39,765,347 | | | | | — | | | | | 39,765,347 | |
| | Research & Consulting Services | | | | — | | | | | 7,079,410 | | | | | — | | | | | 7,079,410 | |
| | Restaurants | | | | — | | | | | 6,541,709 | | | | | — | | | | | 6,541,709 | |
| | Specialty Chemicals | | | | — | | | | | 24,619,948 | | | | | — | | | | | 24,619,948 | |
| | Systems Software | | | | — | | | | | 3,230,916 | | | | | — | | | | | 3,230,916 | |
| | Other | | | | 7,562,505 | | | | | — | | | | | — | | | | | 7,562,505 | |
| | | | | | | |
| | | | | $ | 18,512,176 | | | | $ | 741,705,711 | | | | $ | — | | | | $ | 760,217,887 | |
| | | | | | | |
Emerging Markets Select Fund | | | | | | | | | | | | | | | | | | | | | | |
Assets | | | | | | | | | | | | | | | | | | | | | | |
Common Stocks | | | | | | | | | | | | | | | | | | | | | | |
| | Apparel Retail | | | $ | — | | | | $ | 15,943,630 | | | | $ | — | | | | $ | 15,943,630 | |
| | Consumer Finance | | | | — | | | | | 44,879,534 | | | | | — | | | | | 44,879,534 | |
| | Diversified Banks | | | | 26,833,375 | | | | | 17,298,389 | | | | | — | | | | | 44,131,764 | |
| | Electrical Components & Equipment | | | | 21,706,300 | | | | | 25,548,825 | | | | | — | | | | | 47,255,125 | |
| | Electronic Equipment & Instruments | | | | — | | | | | 6,478,758 | | | | | — | | | | | 6,478,758 | |
| | Health Care Facilities | | | | — | | | | | 11,611,075 | | | | | — | | | | | 11,611,075 | |
| | Health Care Services | | | | — | | | | | 8,479,735 | | | | | — | | | | | 8,479,735 | |
| | Industrial Machinery & Supplies & Components | | | | — | | | | | 22,237,628 | | | | | — | | | | | 22,237,628 | |
| | Interactive Media & Services | | | | — | | | | | 7,150,782 | | | | | — | | | | | 7,150,782 | |
| | Life Sciences Tools & Services | | | | — | | | | | 21,761,876 | | | | | — | | | | | 21,761,876 | |
| | Regional Banks | | | | — | | | | | 11,935,007 | | | | | — | | | | | 11,935,007 | |
| | Restaurants | | | | — | | | | | 13,577,898 | | | | | — | | | | | 13,577,898 | |
| | Semiconductor Materials & Equipment | | | | — | | | | | 14,956,960 | | | | | — | | | | | 14,956,960 | |
| | Semiconductors | | | | — | | | | | 52,849,855 | | | | | — | | | | | 52,849,855 | |
| | Specialized Finance | | | | — | | | | | 4,420,298 | | | | | — | | | | | 4,420,298 | |
| | Specialty Chemicals | | | | — | | | | | 8,345,043 | | | | | — | | | | | 8,345,043 | |
| | Other | | | | 119,841,475 | | | | | — | | | | | — | | | | | 119,841,475 | |
| | | | | | | |
| | | | | $ | 168,381,150 | | | | $ | 287,475,293 | | | | $ | — | | | | $ | 455,856,443 | |
| | | | | | | |
94
| | | | | | | | | | | | | | | | | | | | | | |
| Fund | | Category | | Quoted Prices
In Active Markets
For Identical
Investments
(Level 1) | | Significant Other
Observable Inputs
(Level 2) | | Significant
Unobservable
Inputs
(Level 3) | | Value at
9/30/2024 |
Emerging Markets Small Cap Fund | | | | | | | | | | | | | | | | | | | | | | |
Assets | | | | | | | | | | | | | | | | | | | | | | |
Common Stocks | | | | | | | | | | | | | | | | | | | | | | |
| | Apparel Retail | | | $ | — | | | | $ | 23,999,132 | | | | $ | — | | | | $ | 23,999,132 | |
| | Asset Management & Custody Banks | | | | — | | | | | 3,591,107 | | | | | — | | | | | 3,591,107 | |
| | Automotive Retail | | | | — | | | | | 4,035,339 | | | | | — | | | | | 4,035,339 | |
| | Commercial & Residential Mortgage Finance | | | | — | | | | | 6,262,734 | | | | | — | | | | | 6,262,734 | |
| | Commodity Chemicals | | | | — | | | | | 3,930,471 | | | | | — | | | | | 3,930,471 | |
| | Communications Equipment | | | | — | | | | | 2,660,332 | | | | | — | | | | | 2,660,332 | |
| | Construction Machinery & Heavy Transportation Equipment | | | | — | | | | | 4,305,437 | | | | | — | | | | | 4,305,437 | |
| | Consumer Finance | | | | — | | | | | 26,810,243 | | | | | — | | | | | 26,810,243 | |
| | Diversified Support Services | | | | — | | | | | 12,680,998 | | | | | — | | | | | 12,680,998 | |
| | Electrical Components & Equipment | | | | — | | | | | 25,303,121 | | | | | — | | | | | 25,303,121 | |
| | Electronic Components | | | | — | | | | | 3,645,577 | | | | | — | | | | | 3,645,577 | |
| | Electronic Equipment & Instruments | | | | — | | | | | 7,721,030 | | | | | — | | | | | 7,721,030 | |
| | Health Care Services | | | | — | | | | | 13,203,937 | | | | | — | | | | | 13,203,937 | |
| | Heavy Electrical Equipment | | | | — | | | | | 5,602,425 | | | | | — | | | | | 5,602,425 | |
| | Home Improvement Retail | | | | — | | | | | 2,676,254 | | | | | — | | | | | 2,676,254 | |
| | Industrial Machinery & Supplies & Components | | | | — | | | | | 15,641,626 | | | | | — | | | | | 15,641,626 | |
| | Interactive Media & Services | | | | 13,839,803 | | | | | 4,543,504 | | | | | — | | | | | 18,383,307 | |
| | IT Consulting & Other Services | | | | 19,015,892 | | | | | 21,066,202 | | | | | — | | | | | 40,082,094 | |
| | Life & Health Insurance | | | | — | | | | | 4,890,914 | | | | | — | | | | | 4,890,914 | |
| | Metal, Glass & Plastic Containers | | | | — | | | | | 1,482,319 | | | | | — | | | | | 1,482,319 | |
| | Personal Care Products | | | | — | | | | | 8,022,683 | | | | | — | | | | | 8,022,683 | |
| | Regional Banks | | | | — | | | | | 14,592,261 | | | | | — | | | | | 14,592,261 | |
| | Research & Consulting Services | | | | — | | | | | 7,127,967 | | | | | — | | | | | 7,127,967 | |
| | Semiconductor Materials & Equipment | | | | — | | | | | 9,893,627 | | | | | — | | | | | 9,893,627 | |
| | Semiconductors | | | | — | | | | | 39,132,377 | | | | | — | | | | | 39,132,377 | |
| | Specialized Finance | | | | — | | | | | 1,936,419 | | | | | — | | | | | 1,936,419 | |
| | Other | | | | 52,287,652 | | | | | — | | | | | — | | | | | 52,287,652 | |
| | | | | | | |
| | | | | $ | 85,143,347 | | | | $ | 274,758,036 | | | | $ | — | | | | $ | 359,901,383 | |
| | | | | | | |
Frontier Emerging Small Countries Fund | | | | | | | | | | | | | | | | | | | | | | |
Assets | | | | | | | | | | | | | | | | | | | | | | |
Common Stocks | | | | | | | | | | | | | | | | | | | | | | |
| | Automotive Retail | | | $ | — | | | | $ | 824,762 | | | | $ | — | | | | $ | 824,762 | |
| | Consumer Finance | | | | — | | | | | 6,707,178 | | | | | — | | | | | 6,707,178 | |
| | Diversified Banks | | | | 4,550,732 | | | | | 2,022,826 | | | | | — | | | | | 6,573,558 | |
| | Diversified Support Services | | | | — | | | | | 693,418 | | | | | — | | | | | 693,418 | |
| | Home Improvement Retail | | | | — | | | | | 103,259 | | | | | — | | | | | 103,259 | |
| | IT Consulting & Other Services | | | | 1,799,309 | | | | | 4,506,229 | | | | | — | | | | | 6,305,538 | |
| | Life & Health Insurance | | | | 338,245 | | | | | 1,080,443 | | | | | — | | | | | 1,418,688 | |
| | Research & Consulting Services | | | | — | | | | | 205,594 | | | | | — | | | | | 205,594 | |
| | Semiconductors | | | | — | | | | | 765,805 | | | | | — | | | | | 765,805 | |
| | Other | | | | 14,639,171 | | | | | — | | | | | — | | | | | 14,639,171 | |
Exchange-Traded Funds | | | | | | — | | | | | 1,867,348 | | | | | — | | | | | 1,867,348 | |
| | | | | | | |
| | | | | $ | 21,327,457 | | | | $ | 18,776,862 | | | | $ | — | | | | $ | 40,104,319 | |
| | | | | | | |
Global Opportunities Fund | | | | | | | | | | | | | | | | | | | | | | |
Assets | | | | | | | | | | | | | | | | | | | | | | |
Common Stocks | | | | | | | | | | | | | | | | | | | | | | |
| | Application Software | | | $ | 14,702,065 | | | | $ | 4,865,862 | | | | $ | — | | | | $ | 19,567,927 | |
| | Asset Management & Custody Banks | | | | 4,034,456 | | | | | 1,841,042 | | | | | — | | | | | 5,875,498 | |
| | Consumer Finance | | | | — | | | | | 2,054,277 | | | | | — | | | | | 2,054,277 | |
| | Diversified Support Services | | | | — | | | | | 2,896,244 | | | | | — | | | | | 2,896,244 | |
| | Drug Retail | | | | — | | | | | 3,098,871 | | | | | — | | | | | 3,098,871 | |
| | Electrical Components & Equipment | | | | — | | | | | 7,791,456 | | | | | — | | | | | 7,791,456 | |
| | Health Care Equipment | | | | 2,798,945 | | | | | 1,202,004 | | | | | — | | | | | 4,000,949 | |
95
Notes to Financial Statements (continued)
| | | | | | | | | | | | | | | | | | | | | | |
| Fund | | Category | | Quoted Prices
In Active Markets
For Identical
Investments
(Level 1) | | Significant Other
Observable Inputs
(Level 2) | | Significant
Unobservable
Inputs
(Level 3) | | Value at
9/30/2024 |
| | Health Care Facilities | | | | 5,366,356 | | | | | 4,108,441 | | | | | — | | | | | 9,474,797 | |
| | Health Care Services | | | | — | | | | | 2,754,319 | | | | | — | | | | | 2,754,319 | |
| | Health Care Technology | | | | — | | | | | 1,564,448 | | | | | — | | | | | 1,564,448 | |
| | Human Resource & Employment Services | | | | 3,653,261 | | | | | 2,970,776 | | | | | — | | | | | 6,624,037 | |
| | Industrial Machinery & Supplies & Components | | | | 10,099,343 | | | | | 1,914,778 | | | | | — | | | | | 12,014,121 | |
| | IT Consulting & Other Services | | | | 8,413,464 | | | | | 3,396,823 | | | | | — | | | | | 11,810,287 | |
| | Life Sciences Tools & Services | | | | 2,964,812 | | | | | 3,490,595 | | | | | — | | | | | 6,455,407 | |
| | Regional Banks | | | | 2,933,380 | | | | | 6,468,155 | | | | | — | | | | | 9,401,535 | |
| | Research & Consulting Services | | | | — | | | | | 6,678,140 | | | | | — | | | | | 6,678,140 | |
| | Semiconductor Materials & Equipment | | | | 3,341,565 | | | | | 1,550,022 | | | | | — | | | | | 4,891,587 | |
| | Semiconductors | | | | — | | | | | 14,352,711 | | | | | — | | | | | 14,352,711 | |
| | Trading Companies & Distributors | | | | — | | | | | 9,543,680 | | | | | — | | | | | 9,543,680 | |
| | Transaction & Payment Processing Services | | | | 6,172,762 | | | | | 3,006,157 | | | | | — | | | | | 9,178,919 | |
| | Other | | | | 55,214,889 | | | | | — | | | | | — | | | | | 55,214,889 | |
| | | | | | | |
| | | | | $ | 119,695,298 | | | | $ | 85,548,801 | | | | $ | — | | | | $ | 205,244,099 | |
| | | | | | | |
Global Select Fund | | | | | | | | | | | | | | | | | | | | | | |
Assets | | | | | | | | | | | | | | | | | | | | | | |
Common Stocks | | | | | | | | | | | | | | | | | | | | | | |
| | Application Software | | | $ | 2,019,053 | | | | $ | 600,533 | | | | $ | — | | | | $ | 2,619,586 | |
| | Building Products | | | | 356,869 | | | | | 565,957 | | | | | — | | | | | 922,826 | |
| | Consumer Finance | | | | — | | | | | 610,713 | | | | | — | | | | | 610,713 | |
| | Diversified Banks | | | | — | | | | | 595,773 | | | | | — | | | | | 595,773 | |
| | Drug Retail | | | | — | | | | | 459,844 | | | | | — | | | | | 459,844 | |
| | Electronic Equipment & Instruments | | | | — | | | | | 443,083 | | | | | — | | | | | 443,083 | |
| | Health Care Equipment | | | | — | | | | | 287,756 | | | | | — | | | | | 287,756 | |
| | Interactive Media & Services | | | | — | | | | | 538,628 | | | | | — | | | | | 538,628 | |
| | Research & Consulting Services | | | | — | | | | | 586,813 | | | | | — | | | | | 586,813 | |
| | Semiconductor Materials & Equipment | | | | — | | | | | 222,747 | | | | | — | | | | | 222,747 | |
| | Semiconductors | | | | 342,065 | | | | | 315,438 | | | | | — | | | | | 657,503 | |
| | Trading Companies & Distributors | | | | — | | | | | 498,182 | | | | | — | | | | | 498,182 | |
| | Transaction & Payment Processing Services | | | | 593,226 | | | | | 239,641 | | | | | — | | | | | 832,867 | |
| | Other | | | | 5,704,466 | | | | | — | | | | | — | | | | | 5,704,466 | |
| | | | | | | |
| | | | | $ | 9,015,679 | | | | $ | 5,965,108 | | | | $ | — | | | | $ | 14,980,787 | |
| | | | | | | |
Global Value Fund | | | | | | | | | | | | | | | | | | | | | | |
Assets | | | | | | | | | | | | | | | | | | | | | | |
Common Stocks | | | | | | | | | | | | | | | | | | | | | | |
| | Broadline Retail | | | $ | — | | | | $ | 2,431,846 | | | | $ | — | | | | $ | 2,431,846 | |
| | Diversified Banks | | | | 12,342,219 | | | | | 4,368,344 | | | | | — | | | | | 16,710,563 | |
| | Diversified Metals & Mining | | | | — | | | | | 3,259,846 | | | | | — | | | | | 3,259,846 | |
| | Food Retail | | | | 4,317,628 | | | | | 2,514,628 | | | | | — | | | | | 6,832,256 | |
| | Industrial Machinery & Supplies & Components | | | | — | | | | | 1,532,336 | | | | | — | | | | | 1,532,336 | |
| | Industrial REITs | | | | — | | | | | 2,991,151 | | | | | — | | | | | 2,991,151 | |
| | Integrated Oil & Gas | | | | 5,750,620 | | | | | 4,870,146 | | | | | — | | | | | 10,620,766 | |
| | Integrated Telecommunication Services | | | | 8,136,630 | | | | | 2,844,531 | | | | | — | | | | | 10,981,161 | |
| | Multi-Line Insurance | | | | — | | | | | 3,522,459 | | | | | — | | | | | 3,522,459 | |
| | Pharmaceuticals | | | | 6,304,134 | | | | | 5,584,401 | | | | | — | | | | | 11,888,535 | |
| | Reinsurance | | | | — | | | | | 3,636,891 | | | | | — | | | | | 3,636,891 | |
| | Technology Hardware, Storage & Peripherals | | | | — | | | | | 2,967,913 | | | | | — | | | | | 2,967,913 | |
| | Tobacco | | | | — | | | | | 4,974,229 | | | | | — | | | | | 4,974,229 | |
| | Other | | | | 46,694,761 | | | | | — | | | | | — | | | | | 46,694,761 | |
| | | | | | | |
| | | | | $ | 83,545,992 | | | | $ | 45,498,721 | | | | $ | — | | | | $ | 129,044,713 | |
| | | | | | | |
96
| | | | | | | | | | | | | | | | | | | | | | |
| Fund | | Category | | Quoted Prices
In Active Markets
For Identical
Investments
(Level 1) | | Significant Other
Observable Inputs
(Level 2) | | Significant
Unobservable
Inputs
(Level 3) | | Value at
9/30/2024 |
Greater China Fund | | | | | | | | | | | | | | | | | | | | | | |
Assets | | | | | | | | | | | | | | | | | | | | | | |
Common Stocks | | | | | | | | | | | | | | | | | | | | | | |
| | Apparel, Accessories & Luxury Goods | | | $ | — | | | | $ | 163,780 | | | | $ | — | | | | $ | 163,780 | |
| | Distillers & Vintners | | | | — | | | | | 427,428 | | | | | — | | | | | 427,428 | |
| | Diversified Banks | | | | — | | | | | 55,727 | | | | | — | | | | | 55,727 | |
| | Drug Retail | | | | — | | | | | 175,664 | | | | | — | | | | | 175,664 | |
| | Electrical Components & Equipment | | | | — | | | | | 156,039 | | | | | — | | | | | 156,039 | |
| | Electronic Components | | | | — | | | | | 134,040 | | | | | — | | | | | 134,040 | |
| | Electronic Equipment & Instruments | | | | — | | | | | 125,346 | | | | | — | | | | | 125,346 | |
| | Health Care Equipment | | | | — | | | | | 140,207 | | | | | — | | | | | 140,207 | |
| | Hotels, Resorts & Cruise Lines | | | | 87,302 | | | | | 134,762 | | | | | — | | | | | 222,064 | |
| | Industrial Machinery & Supplies & Components | | | | — | | | | | 672,882 | | | | | — | | | | | 672,882 | |
| | Interactive Media & Services | | | | — | | | | | 372,552 | | | | | — | | | | | 372,552 | |
| | Life & Health Insurance | | | | — | | | | | 182,395 | | | | | — | | | | | 182,395 | |
| | Life Sciences Tools & Services | | | | — | | | | | 127,261 | | | | | — | | | | | 127,261 | |
| | Other Specialty Retail | | | | — | | | | | 45,482 | | | | | — | | | | | 45,482 | |
| | Personal Care Products | | | | — | | | | | 156,458 | | | | | — | | | | | 156,458 | |
| | Regional Banks | | | | — | | | | | 66,996 | | | | | — | | | | | 66,996 | |
| | Restaurants | | | | — | | | | | 312,160 | | | | | — | | | | | 312,160 | |
| | Semiconductor Materials & Equipment | | | | — | | | | | 124,661 | | | | | — | | | | | 124,661 | |
| | Semiconductors | | | | — | | | | | 468,546 | | | | | — | | | | | 468,546 | |
| | Specialized Finance | | | | — | | | | | 41,148 | | | | | — | | | | | 41,148 | |
| | Systems Software | | | | — | | | | | 129,170 | | | | | — | | | | | 129,170 | |
| | Other | | | | 151,122 | | | | | — | | | | | — | | | | | 151,122 | |
| | | | | | | |
| | | | | $ | 238,424 | | | | $ | 4,212,704 | | | | $ | — | | | | $ | 4,451,128 | |
| | | | | | | |
International Growth Fund | | | | | | | | | | | | | | | | | | | | | | |
Assets | | | | | | | | | | | | | | | | | | | | | | |
Common Stocks | | | | | | | | | | | | | | | | | | | | | | |
| | Application Software | | | $ | 10,750,795 | | | | $ | 16,238,122 | | | | $ | — | | | | $ | 26,988,917 | |
| | Asset Management & Custody Banks | | | | 4,812,248 | | | | | 7,574,335 | | | | | — | | | | | 12,386,583 | |
| | Brewers | | | | — | | | | | 3,398,087 | | | | | — | | | | | 3,398,087 | |
| | Broadline Retail | | | | — | | | | | 5,382,133 | | | | | — | | | | | 5,382,133 | |
| | Building Products | | | | 1,591,633 | | | | | 6,521,542 | | | | | — | | | | | 8,113,175 | |
| | Commercial & Residential Mortgage Finance | | | | — | | | | | 2,611,435 | | | | | — | | | | | 2,611,435 | |
| | Commodity Chemicals | | | | — | | | | | 1,873,625 | | | | | — | | | | | 1,873,625 | |
| | Consumer Finance | | | | — | | | | | 5,958,235 | | | | | — | | | | | 5,958,235 | |
| | Diversified Banks | | | | — | | | | | 1,715,153 | | | | | — | | | | | 1,715,153 | |
| | Diversified Real Estate Activities | | | | — | | | | | 3,924,995 | | | | | — | | | | | 3,924,995 | |
| | Diversified Support Services | | | | — | | | | | 10,360,076 | | | | | — | | | | | 10,360,076 | |
| | Drug Retail | | | | 2,519,344 | | | | | 7,604,976 | | | | | — | | | | | 10,124,320 | |
| | Electrical Components & Equipment | | | | — | | | | | 10,033,283 | | | | | — | | | | | 10,033,283 | |
| | Electronic Equipment & Instruments | | | | — | | | | | 9,425,501 | | | | | — | | | | | 9,425,501 | |
| | Health Care Equipment | | | | — | | | | | 6,231,945 | | | | | — | | | | | 6,231,945 | |
| | Health Care Facilities | | | | — | | | | | 4,082,506 | | | | | — | | | | | 4,082,506 | |
| | Health Care Services | | | | — | | | | | 2,825,855 | | | | | — | | | | | 2,825,855 | |
| | Health Care Technology | | | | — | | | | | 8,470,324 | | | | | — | | | | | 8,470,324 | |
| | Human Resource & Employment Services | | | | — | | | | | 10,002,395 | | | | | — | | | | | 10,002,395 | |
| | Industrial Machinery & Supplies & Components | | | | — | | | | | 4,561,080 | | | | | — | | | | | 4,561,080 | |
| | Interactive Media & Services | | | | 4,313,964 | | | | | 10,329,047 | | | | | — | | | | | 14,643,011 | |
| | IT Consulting & Other Services | | | | 14,626,527 | | | | | 3,954,786 | | | | | — | | | | | 18,581,313 | |
| | Life Sciences Tools & Services | | | | — | | | | | 1,499,310 | | | | | — | | | | | 1,499,310 | |
| | Movies & Entertainment | | | | — | | | | | 6,117,791 | | | | | — | | | | | 6,117,791 | |
| | Regional Banks | | | | 4,599,965 | | | | | 4,994,454 | | | | | — | | | | | 9,594,419 | |
| | Research & Consulting Services | | | | — | | | | | 9,977,293 | | | | | — | | | | | 9,977,293 | |
| | Semiconductor Materials & Equipment | | | | — | | | | | 3,678,955 | | | | | — | | | | | 3,678,955 | |
| | Semiconductors | | | | — | | | | | 20,433,147 | | | | | — | | | | | 20,433,147 | |
| | Specialty Chemicals | | | | — | | | | | 1,070,788 | | | | | — | | | | | 1,070,788 | |
| | Trading Companies & Distributors | | | | — | | | | | 26,945,172 | | | | | — | | | | | 26,945,172 | |
| | Transaction & Payment Processing Services | | | | — | | | | | 5,683,706 | | | | | — | | | | | 5,683,706 | |
| | Other | | | | 24,843,371 | | | | | — | | | | | — | | | | | 24,843,371 | |
| | | | | | | |
| | | | | $ | 68,057,847 | | | | $ | 223,480,052 | | | | $ | — | | | | $ | 291,537,899 | |
| | | | | | | |
97
Notes to Financial Statements (continued)
| | | | | | | | | | | | | | | | | | | | | | |
| Fund | | Category | | Quoted Prices
In Active Markets
For Identical
Investments
(Level 1) | | Significant Other
Observable Inputs
(Level 2) | | Significant
Unobservable
Inputs
(Level 3) | | Value at
9/30/2024 |
International Opportunities Fund | | | | | | | | | | | | | | | | | | | | | | |
Assets | | | | | | | | | | | | | | | | | | | | | | |
Common Stocks | | | | | | | | | | | | | | | | | | | | | | |
| | Advertising | | | $ | — | | | | $ | 708,740 | | | | $ | — | | | | $ | 708,740 | |
| | Alternative Carriers | | | | — | | | | | 2,260,049 | | | | | — | | | | | 2,260,049 | |
| | Application Software | | | | 4,023,911 | | | | | 13,674,220 | | | | | — | | | | | 17,698,131 | |
| | Asset Management & Custody Banks | | | | 4,720,603 | | | | | 2,478,765 | | | | | — | | | | | 7,199,368 | |
| | Commercial & Residential Mortgage Finance | | | | 3,910,218 | | | | | 2,460,303 | | | | | — | | | | | 6,370,521 | |
| | Commodity Chemicals | | | | — | | | | | 3,625,284 | | | | | — | | | | | 3,625,284 | |
| | Consumer Finance | | | | — | | | | | 4,098,679 | | | | | — | | | | | 4,098,679 | |
| | Data Processing & Outsourced Services | | | | — | | | | | 843,295 | | | | | — | | | | | 843,295 | |
| | Diversified Support Services | | | | 3,462,535 | | | | | 11,115,690 | | | | | — | | | | | 14,578,225 | |
| | Electrical Components & Equipment | | | | — | | | | | 3,555,871 | | | | | — | | | | | 3,555,871 | |
| | Electronic Equipment & Instruments | | | | — | | | | | 1,882,353 | | | | | — | | | | | 1,882,353 | |
| | Food Retail | | | | — | | | | | 3,204,153 | | | | | — | | | | | 3,204,153 | |
| | Health Care Services | | | | — | | | | | 5,593,078 | | | | | — | | | | | 5,593,078 | |
| | Health Care Technology | | | | 4,974,385 | | | | | 4,940,491 | | | | | — | | | | | 9,914,876 | |
| | Heavy Electrical Equipment | | | | — | | | | | 1,833,249 | | | | | — | | | | | 1,833,249 | |
| | Human Resource & Employment Services | | | | 3,056,025 | | | | | 2,707,238 | | | | | — | | | | | 5,763,263 | |
| | Industrial Machinery & Supplies & Components | | | | — | | | | | 2,191,181 | | | | | — | | | | | 2,191,181 | |
| | Interactive Media & Services | | | | 9,882,147 | | | | | 1,352,360 | | | | | — | | | | | 11,234,507 | |
| | Investment Banking & Brokerage | | | | 3,646,247 | | | | | 2,456,349 | | | | | — | | | | | 6,102,596 | |
| | IT Consulting & Other Services | | | | 1,721,286 | | | | | 4,746,532 | | | | | — | | | | | 6,467,818 | |
| | Metal, Glass & Plastic Containers | | | | — | | | | | 809,759 | | | | | — | | | | | 809,759 | |
| | Personal Care Products | | | | 1,402,716 | | | | | 2,464,583 | | | | | — | | | | | 3,867,299 | |
| | Real Estate Services | | | | — | | | | | 1,131,629 | | | | | — | | | | | 1,131,629 | |
| | Research & Consulting Services | | | | — | | | | | 5,792,053 | | | | | — | | | | | 5,792,053 | |
| | Restaurants | | | | — | | | | | 371,844 | | | | | — | | | | | 371,844 | |
| | Semiconductor Materials & Equipment | | | | — | | | | | 5,214,473 | | | | | — | | | | | 5,214,473 | |
| | Semiconductors | | | | — | | | | | 4,413,829 | | | | | — | | | | | 4,413,829 | |
| | Trading Companies & Distributors | | | | 1,409,697 | | | | | 636,790 | | | | | — | | | | | 2,046,487 | |
| | Other | | | | 6,142,704 | | | | | — | | | | | — | | | | | 6,142,704 | |
Exchange-Traded Funds | | | | | | 2,262,368 | | | | | — | | | | | — | | | | | 2,262,368 | |
| | | | | | | |
| | | | | $ | 50,614,842 | | | | $ | 96,562,840 | | | | $ | — | | | | $ | 147,177,682 | |
| | | | | | | |
International Select Fund | | | | | | | | | | | | | | | | | | | | | | |
Assets | | | | | | | | | | | | | | | | | | | | | | |
Common Stocks | | | | | | | | | | | | | | | | | | | | | | |
| | Apparel, Accessories & Luxury Goods | | | $ | — | | | | $ | 71,408 | | | | $ | — | | | | $ | 71,408 | |
| | Application Software | | | | 284,749 | | | | | 173,455 | | | | | — | | | | | 458,204 | |
| | Asset Management & Custody Banks | | | | — | | | | | 153,783 | | | | | — | | | | | 153,783 | |
| | Automobile Manufacturers | | | | — | | | | | 152,764 | | | | | — | | | | | 152,764 | |
| | Building Products | | | | — | | | | | 287,742 | | | | | — | | | | | 287,742 | |
| | Diversified Banks | | | | — | | | | | 47,833 | | | | | — | | | | | 47,833 | |
| | Diversified Real Estate Activities | | | | — | | | | | 77,856 | | | | | — | | | | | 77,856 | |
| | Drug Retail | | | | — | | | | | 127,427 | | | | | — | | | | | 127,427 | |
| | Electrical Components & Equipment | | | | — | | | | | 63,009 | | | | | — | | | | | 63,009 | |
| | Electronic Equipment & Instruments | | | | — | | | | | 238,220 | | | | | — | | | | | 238,220 | |
| | Health Care Equipment | | | | — | | | | | 130,373 | | | | | — | | | | | 130,373 | |
| | Industrial Machinery & Supplies & Components | | | | — | | | | | 101,768 | | | | | — | | | | | 101,768 | |
| | Interactive Media & Services | | | | — | | | | | 379,795 | | | | | — | | | | | 379,795 | |
| | IT Consulting & Other Services | | | | 31,082 | | | | | 35,084 | | | | | — | | | | | 66,166 | |
| | Research & Consulting Services | | | | — | | | | | 240,403 | | | | | — | | | | | 240,403 | |
| | Semiconductor Materials & Equipment | | | | — | | | | | 71,254 | | | | | — | | | | | 71,254 | |
| | Trading Companies & Distributors | | | | — | | | | | 103,385 | | | | | — | | | | | 103,385 | |
| | Transaction & Payment Processing Services | | | | — | | | | | 125,752 | | | | | — | | | | | 125,752 | |
| | Other | | | | 943,888 | | | | | — | | | | | — | | | | | 943,888 | |
| | | | | | | |
| | | | | $ | 1,259,719 | | | | $ | 2,581,311 | | | | $ | — | | | | $ | 3,841,030 | |
| | | | | | | |
98
| | | | | | | | | | | | | | | | | | | | | | |
| Fund | | Category | | Quoted Prices
In Active Markets
For Identical
Investments
(Level 1) | | Significant Other
Observable Inputs
(Level 2) | | Significant
Unobservable
Inputs
(Level 3) | | Value at
9/30/2024 |
Long/Short Alpha Fund | | | | | | | | | | | | | | | | | | | | | | |
Assets | | | | | | | | | | | | | | | | | | | | | | |
Common Stocks | | | | | $ | 86,611,736 | | | | $ | — | | | | $ | — | | | | $ | 86,611,736 | |
Warrants | | | | | | — | | | | | — | | | | | 55,357 | | | | | 55,357 | |
| | | | | | | |
| | | | | $ | 86,611,736 | | | | $ | — | | | | $ | 55,357 | | | | $ | 86,667,093 | |
| | | | | | | |
Liabilities | | | | | | | | | | | | | | | | | | | | | | |
Securities Sold Short | | | | | $ | (28,014,984 | ) | | | $ | — | | | | $ | — | | | | $ | (28,014,984 | ) |
| | | | | | | |
Micro Cap Fund | | | | | | | | | | | | | | | | | | | | | | |
Assets | | | | | | | | | | | | | | | | | | | | | | |
Common Stocks | | | | | | | | | | | | | | | | | | | | | | |
| | Biotechnology | | | $ | 38,630,891 | | | | $ | — | | | | $ | 6,100 | | | | $ | 38,636,991 | |
| | Other | | | | 620,748,597 | | | | | — | | | | | — | | | | | 620,748,597 | |
Preferred Stocks | | | | | | — | | | | | — | | | | | 9,276,752 | | | | | 9,276,752 | |
Warrants | | | | | | — | | | | | — | | | | | 482,654 | | | | | 482,654 | |
| | | | | | | |
| | | | | $ | 659,379,488 | | | | $ | — | | | | $ | 9,765,506 | | | | $ | 669,144,994 | |
| | | | | | | |
Micro Cap Value Fund | | | | | | | | | | | | | | | | | | | | | | |
Assets | | | | | | | | | | | | | | | | | | | | | | |
Common Stocks | | | | | | | | | | | | | | | | | | | | | | |
| | Food Retail | | | $ | — | | | | $ | 4,058,796 | | | | $ | — | | | | $ | 4,058,796 | |
| | Packaged Foods & Meats | | | | 4,555,200 | | | | | 6,213,693 | | | | | — | | | | | 10,768,893 | |
| | Other | | | | 299,694,472 | | | | | — | | | | | — | | | | | 299,694,472 | |
Warrants | | | | | | — | | | | | — | | | | | 0 | | | | | 0 | |
| | | | | | | |
| | | | | $ | 304,249,672 | | | | $ | 10,272,489 | | | | $ | 0 | | | | $ | 314,522,161 | |
| | | | | | | |
Small Cap Growth Fund | | | | | | | | | | | | | | | | | | | | | | |
Assets | | | | | | | | | | | | | | | | | | | | | | |
Common Stocks | | | | | $ | 2,112,413,075 | | | | $ | — | | | | $ | — | | | | $ | 2,112,413,075 | |
Preferred Stocks | | | | | | — | | | | | — | | | | | 26,060,845 | | | | | 26,060,845 | |
| | | | | | | |
| | | | | $ | 2,112,413,075 | | | | $ | — | | | | $ | 26,060,845 | | | | $ | 2,138,473,920 | |
| | | | | | | |
Small Cap Value Fund | | | | | | | | | | | | | | | | | | | | | | |
Assets | | | | | | | | | | | | | | | | | | | | | | |
Common Stocks | | | | | $ | 1,631,842,404 | | | | $ | — | | | | $ | — | | | | $ | 1,631,842,404 | |
| | | | | | | |
| | | | | $ | 1,631,842,404 | | | | $ | — | | | | $ | — | | | | $ | 1,631,842,404 | |
| | | | | | | |
Ultra Growth Fund | | | | | | | | | | | | | | | | | | | | | | |
Assets | | | | | | | | | | | | | | | | | | | | | | |
Common Stocks | | | | | | | | | | | | | | | | | | | | | | |
| | Semiconductor Materials & Equipment | | | $ | 70,458,578 | | | | $ | 8,782,056 | | | | $ | — | | | | $ | 79,240,634 | |
| | Other | | | | 867,676,089 | | | | | — | | | | | — | | | | | 867,676,089 | |
Preferred Stocks | | | | | | — | | | | | — | | | | | 13,915,114 | | | | | 13,915,114 | |
Warrants | | | | | | — | | | | | — | | | | | 938,180 | | | | | 938,180 | |
| | | | | | | |
| | | | | $ | 938,134,667 | | | | $ | 8,782,056 | | | | $ | 14,853,294 | | | | $ | 961,770,017 | |
| | | | | | | |
U.S. Select Fund | | | | | | | | | | | | | | | | | | | | | | |
Assets | | | | | | | | | | | | | | | | | | | | | | |
Common Stocks | | | | | $ | 26,172,174 | | | | $ | — | | | | $ | — | | | | $ | 26,172,174 | |
| | | | | | | |
| | | | | $ | 26,172,174 | | | | $ | — | | | | $ | — | | | | $ | 26,172,174 | |
| | | | | | | |
U.S. Treasury Fund | | | | | | | | | | | | | | | | | | | | | | |
Assets | | | | | | | | | | | | | | | | | | | | | | |
U.S Government obligations | | | | | $ | — | | | | $ | 182,915,923 | | | | $ | — | | | | $ | 182,915,923 | |
| | | | | | | |
| | | | | $ | — | | | | $ | 182,915,923 | | | | $ | — | | | | $ | 182,915,923 | |
| | | | | | | |
99
Notes to Financial Statements (continued)
If the securities of an Asset Class are all the same level, the asset class is shown in total. If the securities of an Asset Class cross levels, the level with the smallest number of categories and with multiple levels within a category is displayed by category. The remaining categories that do not cross levels are combined into the “Other” category.
The valuation techniques used by the Funds to measure fair value for the year ended September 30, 2024 maximized the use of observable inputs and minimized the use of unobservable inputs.
The following is a reconciliation of the fair valuations using significant unobservable inputs (Level 3) for the Funds during the year ended September 30, 2024:
| | | | | | | | | | | | | | | | | | | | | | | | | | | | | | | | | | | | | | | | | | | | | | | | | | |
| Fund | | Market Value
Beginning
Balance
9/30/2023 | | Purchases
At Cost | | Sales
(Proceeds) | | Accrued
Discounts
(Premiums) | | Realized
Gain/
(Loss) | | Change in
Unrealized
Appreciation
(Depreciation) | | Transfers
In at
Market
Value | | Transfers
Out at
Market
Value | | Market Value
Ending
Balance
9/30/2024 | | Net Change in
Unrealized
Appreciation
(Depreciation)
On Investments
Held at
9/30/2024 |
Core Growth Fund | | | | | | | | | | | | | | | | | | | | | | | | | | | | | | | | | | | | | | | | | | | | | | | | | | |
Warrants | | | $ | 982,800 | | | | $ | — | | | | $ | (1,859,173 | ) | | | $ | — | | | | $ | — | | | | $ | 876,373 | | | | $ | — | | | | $ | — | | | | $ | — | | | | $ | — | |
| | | | | |
| | | $ | 982,800 | | | | $ | — | | | | $ | (1,859,173 | ) | | | $ | — | | | | $ | — | | | | $ | 876,373 | | | | $ | — | | | | $ | — | | | | $ | — | | | | $ | — | |
| | | | | |
International Opportunities Fund | | | | | | | | | | | | | | | | | | | | | | | | | | | | | | | | | | | | | | | | | | | | | | | | | | |
Common Stocks | | | $ | 7,687 | | | | $ | — | | | | $ | — | | | | $ | — | | | | $ | (2,844,249 | ) | | | $ | 2,836,562 | | | | $ | — | | | | $ | — | | | | $ | — | | | | $ | — | |
| | | | | |
| | | $ | 7,687 | | | | $ | — | | | | $ | — | | | | $ | — | | | | $ | (2,844,249 | ) | | | $ | 2,836,562 | | | | $ | — | | | | $ | — | | | | $ | — | | | | $ | — | |
| | | | | |
Long/Short Alpha Fund | | | | | | | | | | | | | | | | | | | | | | | | | | | | | | | | | | | | | | | | | | | | | | | | | | |
Warrants | | | $ | — | | | | $ | 36,977 | | | | $ | — | | | | $ | — | | | | $ | — | | | | $ | 18,380 | | | | $ | — | | | | $ | — | | | | $ | 55,357 | | | | $ | 18,380 | |
| | | | | |
| | | $ | — | | | | $ | 36,977 | | | | $ | — | | | | $ | — | | | | $ | — | | | | $ | 18,380 | | | | $ | — | | | | $ | — | | | | $ | 55,357 | | | | $ | 18,380 | |
| | | | | |
Micro Cap Fund | | | | | | | | | | | | | | | | | | | | | | | | | | | | | | | | | | | | | | | | | | | | | | | | | | |
Common Stocks | | | $ | 24,399 | | | | $ | — | | | | $ | — | | | | $ | — | | | | $ | — | | | | $ | (18,299 | ) | | | $ | — | | | | $ | — | | | | $ | 6,100 | | | | $ | (18,299 | ) |
Preferred Stocks | | | | 8,292,031 | | | | | — | | | | | — | | | | | — | | | | | — | | | | | 984,721 | | | | | — | | | | | — | | | | | 9,276,752 | | | | | 984,721 | |
Warrants | | | | 192,446 | | | | | 322,404 | | | | | (613,226 | ) | | | | — | | | | | — | | | | | 581,030 | | | | | — | | | | | — | | | | | 482,654 | | | | | 160,251 | |
| | | | | |
| | | $ | 8,508,876 | | | | $ | 322,404 | | | | $ | (613,226 | ) | | | $ | — | | | | $ | — | | | | $ | 1,547,452 | | | | $ | — | | | | $ | — | | | | $ | 9,765,506 | | | | $ | 1,126,673 | |
| | | | | |
Micro Cap Value Fund | | | | | | | | | | | | | | | | | | | | | | | | | | | | | | | | | | | | | | | | | | | | | | | | | | |
Common Stocks | | | $ | 505 | | | | $ | — | | | | $ | — | | | | $ | — | | | | $ | (30,001 | ) | | | $ | 29,496 | | | | $ | — | | | | $ | — | | | | $ | — | | | | $ | — | |
Warrants | | | | — | | | | | — | | | | | — | | | | | — | | | | | — | | | | | — | | | | | — | | | | | — | | | | | — | | | | | — | |
| | | | | |
| | | $ | 505 | | | | $ | — | | | | $ | — | | | | $ | — | | | | $ | (30,001 | ) | | | $ | 29,496 | | | | $ | — | | | | $ | — | | | | $ | — | | | | $ | — | |
| | | | | |
Small Cap Growth Fund | | | | | | | | | | | | | | | | | | | | | | | | | | | | | | | | | | | | | | | | | | | | | | | | | | |
Preferred Stocks | | | $ | 23,920,529 | | | | $ | — | | | | $ | — | | | | $ | — | | | | $ | — | | | | $ | 2,140,316 | | | | $ | — | | | | $ | — | | | | $ | 26,060,845 | | | | $ | 2,140,316 | |
Warrants | | | | 465,281 | | | | | — | | | | | (1,411,160 | ) | | | | — | | | | | — | | | | | 945,879 | | | | | — | | | | | — | | | | | — | | | | | — | |
| | | | | |
| | | $ | 24,385,810 | | | | $ | — | | | | $ | (1,411,160 | ) | | | $ | — | | | | $ | — | | | | $ | 3,086,195 | | | | $ | — | | | | $ | — | | | | $ | 26,060,845 | | | | $ | 2,140,316 | |
| | | | | |
Ultra Growth Fund | | | | | | | | | | | | | | | | | | | | | | | | | | | | | | | | | | | | | | | | | | | | | | | | | | |
Preferred Stocks | | | $ | 12,438,034 | | | | $ | — | | | | $ | — | | | | $ | — | | | | $ | — | | | | $ | 1,477,080 | | | | $ | — | | | | $ | — | | | | $ | 13,915,114 | | | | $ | 1,477,080 | |
Warrants | | | | 1,164,918 | | | | | 626,686 | | | | | (2,624,153 | ) | | | | — | | | | | — | | | | | 1,770,729 | | | | | — | | | | | — | | | | | 938,180 | | | | | 311,494 | |
| | | | | |
| | | $ | 13,602,952 | | | | $ | 626,686 | | | | $ | (2,624,153 | ) | | | $ | — | | | | $ | — | | | | $ | 3,247,809 | | | | $ | — | | | | $ | — | | | | $ | 14,853,294 | | | | $ | 1,788,574 | |
| | | | | |
100
QUANTITATIVE INFORMATION ABOUT LEVEL 3 FAIR VALUE MEASUREMENTS
| | | | | | | | | | | | | | |
| Fund | | Description | | Fair Value At 9/30/2024 | | | Valuation Technique | | Unobservable Input | | Range (Average) | |
| Long/Short Alpha Fund | | Warrant: Biotechnology | | $ | 55,357 | | | Black Scholes | | Volatility | | | 40% | |
| Micro Cap Fund | | Direct Venture Capital Investments:
Textiles | | $ | 9,276,752 | | | Market comparable
companies | | EV/R* multiple
Discount for lack of
marketability | |
| 0.8 - 7.2 (2.95)
46% |
|
| Micro Cap Fund | | Warrant: Biotechnology | | $ | 482,654 | | | Black Scholes | | Volatility | | | 40% | |
| Small Cap Growth Fund | | Direct Venture Capital Investments:
Textiles | | $ | 16,698,121 | | | Market comparable
companies | | EV/R* multiple
Discount for lack of
marketability | |
| 0.8 - 7.2 (2.95)
46% |
|
| Small Cap Growth Fund | | Direct Venture Capital Investments:
Systems Software | | $ | 9,362,724 | | | Market comparable
companies | | EV/R* multiple
Discount for lack of
marketability | |
| 2.2 - 35 (10.6)
27% |
|
| Ultra Growth Fund | | Direct Venture Capital Investments:
Textiles | | $ | 13,915,114 | | | Market comparable
companies | | EV/R* multiple
Discount for lack of
marketability | |
| 0.8 - 7.2 (2.95)
46% |
|
| Ultra Growth Fund | | Warrant: Biotechnology | | $ | 938,180 | | | Black Scholes | | Volatility | | | 40% | |
| * | Enterprise-Value-To-Revenue (“EV/R”) multiple is a measure of the value of a stock that compares a company’s enterprise value to its revenue. |
Changes in EV/R multiples may change the fair value of an investment. Generally, a decrease in this multiple will result in a decrease in the fair value of an investment.
The Funds’ other Level 3 investments have been valued using observable inputs, unadjusted third-party transactions and quotations or unadjusted historical third-party information. No unobservable inputs internally developed by the Funds have been applied to these investments, thus they have been excluded from the above table.
Additional information about the Funds’ fair valuation practices is available in the Funds’ most recent Prospectus, Statement of Additional Information (SAI) and Report to Shareholders. This information is available on the Funds’ website at wasatchglobal.com and on the Securities and Exchange Commission’s website at www.sec.gov.
13. OFFSETTING
Each Fund is party to various netting arrangements. The Financial Accounting Standards Board (FASB) requires disclosure about certain netting arrangements and similar agreements to enable users of a Fund’s financial statements to evaluate the effect or potential effect of netting arrangements on the Fund’s financial position. The scope of the disclosure is limited to derivative instruments, repurchase agreements and reverse repurchase agreements, and securities borrowing and securities lending transactions.
The following tables present information about financial instruments that were subject to enforceable netting arrangements as of September 30, 2024:
Securities Borrowed for Short Sales
| | | | | | | | | | | | | | | | | | | | | | |
| | | | | Gross Amounts Not Offset in the Statements of Assets and Liabilities |
| Fund | | Counterparty | | Gross Liability Amounts
Presented in Statements
Of Assets and Liabilities | | Financial
Instrument | | Collateral
Pledged1 | | Net Amount (Not less
Than 0) |
Long/Short Alpha Fund | | Fixed Income Clearing Corp. | | | $ | 28,014,984 | | | | $ | — | | | | $ | (28,014,984 | ) | | | $ | — | |
| 1 | The market value of the collateral pledged is greater than the amounts indicated in the table. For further information, see “Short Sales” under Note 3. Securities and Other Investments and the Schedules of Investments. |
14. SUBSEQUENT EVENTS
On November 13, 2024, the Board of Trustees of the Wasatch Funds Trust (the “Board”) approved the liquidation of the Wasatch Greater China Fund as soon as practicable. Accordingly, on November 13, 2024, the Board approved a plan of liquidation for the Wasatch Greater China Fund to close the Fund and redeem all of its outstanding shares on or about January 15, 2025.
101
| | |
| Wasatch Funds | | SEPTEMBER 30, 2024 |
Report of Independent Registered Public Accounting Firm
To the Board of Trustees of Wasatch Funds Trust and Shareholders of Wasatch Core Growth Fund®, Wasatch Emerging India Fund®, Wasatch Emerging Markets Select Fund®, Wasatch Emerging Markets Small Cap Fund®, Wasatch Frontier Emerging Small Countries Fund®, Wasatch Global Opportunities Fund®, Wasatch Global Select Fund®, Wasatch Global Value Fund®, Wasatch Greater China Fund®, Wasatch International Growth Fund®, Wasatch International Opportunities Fund®, Wasatch International Select Fund®, Wasatch Long/Short Alpha Fund®, Wasatch Micro Cap Fund®, Wasatch Micro Cap Value Fund®, Wasatch Small Cap Growth Fund®, Wasatch Small Cap Value Fund®, Wasatch Ultra Growth Fund®, Wasatch U.S. Select Fund™, Wasatch-Hoisington U.S. Treasury Fund®
OPINIONS ON THE FINANCIAL STATEMENTS
We have audited the accompanying statements of assets and liabilities, including the schedules of investments, of each of the funds listed in the table below (constituting Wasatch Funds Trust, hereafter collectively referred to as the “Funds”) as of September 30, 2024, the related statements of operations, of changes in net assets and, for the fund indicated in the table below, of cash flows, for each of the periods indicated in the table below, including the related notes, and the financial highlights for each of the periods indicated therein (collectively referred to as the “financial statements”). In our opinion, the financial statements present fairly, in all material respects, the financial position of each of the Funds listed in the table below as of September 30, 2024, the results of each of their operations, the changes in each of their net assets and, for the fund indicated in the table below, its cash flows, for the periods indicated in the table below, and each of the financial highlights for each of the periods indicated therein, in conformity with accounting principles generally accepted in the United States of America.
| | |
| Wasatch Core Growth Fund®(1) | | Wasatch Emerging India Fund®(1) |
| Wasatch Emerging Markets Select Fund®(1) | | Wasatch Emerging Markets Small Cap Fund®(1) |
| Wasatch Frontier Emerging Small Countries Fund®(1) | | Wasatch Global Opportunities Fund®(1) |
| Wasatch Global Select Fund®(1) | | Wasatch Global Value Fund®(1) |
| Wasatch Greater China Fund®(1) | | Wasatch International Growth Fund®(1) |
| Wasatch International Opportunities Fund®(1) | | Wasatch International Select Fund®(1) |
| Wasatch Long/Short Alpha Fund®(2) | | Wasatch Micro Cap Fund®(1) |
| Wasatch Micro Cap Value Fund®(1) | | Wasatch Small Cap Growth Fund®(1) |
| Wasatch Small Cap Value Fund®(1) | | Wasatch Ultra Growth Fund®(1) |
| Wasatch U.S. Select Fund™(1) | | Wasatch-Hoisington U.S. Treasury Fund®(1) |
| | (1) | Statement of operations for the year ended September 30, 2024 and statement of changes in net assets for the years ended September 30, 2024 and 2023 |
| | (2) | Statement of operations and statement of cash flows for the year ended September 30, 2024, and statement of changes in net assets for the years ended September 30, 2024 and 2023 |
BASIS FOR OPINIONS
These financial statements are the responsibility of the Funds’ management. Our responsibility is to express an opinion on the Funds’ financial statements based on our audits. We are a public accounting firm registered with the Public Company Accounting Oversight Board (United States) (“PCAOB”) and are required to be independent with respect to the Funds in accordance with the U.S. federal securities laws and the applicable rules and regulations of the Securities and Exchange Commission and the PCAOB.
We conducted our audits of these financial statements in accordance with the standards of the PCAOB. Those standards require that we plan and perform the audit to obtain reasonable assurance about whether the financial statements are free of material misstatement, whether due to error or fraud.
Our audits included performing procedures to assess the risks of material misstatement of the financial statements, whether due to error or fraud, and performing procedures that respond to those risks. Such procedures included examining, on a test basis, evidence regarding the amounts and disclosures in the financial statements. Our audits also included evaluating the accounting principles used and significant estimates made by management, as well as evaluating the overall presentation of the financial statements. Our procedures included confirmation of securities owned as of September 30, 2024 by correspondence with the custodian, transfer agent and brokers; when replies were not received from brokers, we performed other auditing procedures. We believe that our audits provide a reasonable basis for our opinions.
/s/ PricewaterhouseCoopers LLP
Kansas City, Missouri
November 21, 2024
We have served as the auditor of one or more investment companies in Wasatch Funds Trust since 2002.
102
| | |
| Wasatch Funds | | SEPTEMBER 30, 2024 |
Supplemental Information (Unaudited)
ADDITIONAL TAX INFORMATION
The Funds hereby designate the following amounts or maximum amounts allowable as long term capital gain dividends for the purpose of the dividends paid deduction. The amounts designated here may include the utilization of earnings and profits distributed to shareholders on the redemption of shares.
| | | | | |
| Fund | | Amount |
Emerging India Fund | | | $ | 24,137,327 | |
Small Cap Value Fund | | | | 50,693,279 | |
For the fiscal year ended September 30, 2024, certain dividends paid by each Fund may be subject to a maximum tax rate of 20% as provided for by the Jobs and Growth Tax Relief Reconciliation Act of 2003. To the extent dividends are paid during the calendar year 2024, complete information will be reported on shareholders’ 2024 Form 1099-DIV.
The amount designated as qualified dividend income for the year ended September 30, 2024 will be at the highest amount permitted by law.
Corporate shareholders should note that for the year ended September 30, 2024, the percentage of the Funds’ investment income (i.e., net investment income plus short term capital gains) that qualified for the corporate dividends received deductions.
The Funds have made an election under Internal Revenue Code Section 853 to pass through foreign taxes paid by the Funds to their shareholders. For the year ended September 30, 2024, the total amount of foreign taxes paid that was passed through to shareholders for information reporting purposes was as follows:
| | | | | |
| Fund | | Amount |
Emerging India Fund | | | $ | 9,380,029 | |
Emerging Markets Select Fund | | | | 1,081,096 | |
Emerging Markets Small Cap Fund | | | | 2,444,950 | |
Frontier Emerging Small Countries Fund | | | | 46,105 | |
International Growth Fund | | | | 894,934 | |
International Opportunities Fund | | | | 1,621,917 | |
International Select Fund | | | | 6,938 | |
Global Select Fund | | | | 7,962 | |
Greater China Fund | | | | 4,788 | |
103
| | |
| Wasatch Funds | | SEPTEMBER 30, 2024 |
Service Providers
Investment Advisor
Wasatch Advisors LP d/b/a Wasatch Global Investors
505 Wakara Way, 3rd Floor
Salt Lake City, UT 84108
Sub-Advisor for the Wasatch-Hoisington
U.S. Treasury Fund
Hoisington Investment Management Co. (HIMCo)
6836 Bee Caves Road
Building 2, Suite 100
Austin, TX 78746
Administrator and Fund Accountant
State Street Bank and Trust Company
801 Pennsylvania Avenue
Kansas City, MO 64105
Distributor
ALPS Distributors, Inc.
1290 Broadway, Suite 1000
Denver, CO 80203
Transfer Agent
UMB Fund Services, Inc.
235 West Galena Street
Milwaukee, WI 53212
Custodian
State Street Bank and Trust Company
801 Pennsylvania Avenue
Kansas City, MO 64105
Legal Counsel to Wasatch Funds and
Independent Trustees
Chapman and Cutler LLP
320 South Canal Street
Chicago, IL 60606
Independent Registered Public Accounting Firm
PricewaterhouseCoopers LLP
1100 Walnut Street, Suite 1300
Kansas City, MO 64106
ONLINE
wasatchglobal.com
or via email
shareholderservice@wasatchfunds.com
TELEPHONE
800.551.1700
M – F, 7:00 a.m. to 7:00 p.m. Central Time
Automated Line, 24 Hours
MAIL
Regular Mail Delivery
Wasatch Funds
P.O. Box 2172
Milwaukee, WI 53201-2172
Overnight Delivery
Wasatch Funds
235 West Galena Street
Milwaukee, WI 53212
104
| (b) | The registrant’s Financial Highlights are included as part of the Financial Statements filed under Item 7(a) of this Form. |
| Item 8. | Changes in and Disagreements with Accountants for Open-End Management Investment Companies. |
Not applicable.
| Item 9. | Proxy Disclosures for Open-End Management Investment Companies. |
Not applicable.
| Item 10. | Remuneration Paid to Directors, Officers, and Others of Open-End Management Investment Companies. |
Renumeration Paid to Directors, Officers, and Others of Open-End Investment Companies is included as part of the Financial Statements filed under Item 7(a) of this Form.
| Item 11. | Statement Regarding Basis for Approval of Investment Advisory Contract. |
Not applicable.
| Item 12. | Disclosure of Proxy Voting Policies and Procedures for Closed-End Management Investment Companies. |
Not applicable.
| Item 13. | Portfolio Managers of Closed-End Management Investment Companies. |
Not applicable.
| Item 14. | Purchases of Equity Securities by Closed-End Management Investment Company and Affiliated Purchasers. |
Not applicable.
| Item 15. | Submission of Matters to a Vote of Security Holders. |
There have been no material changes to the procedures by which shareholders may recommend nominees to the Registrant’s board of trustees, where those changes were implemented after the Registrant last provided disclosure in response to this item.
| Item 16. | Controls and Procedures. |
| (a) | The Registrant’s principal executive and principal financial officers have concluded that the Registrant’s disclosure controls and procedures (as defined in Rule 30a-3(c) under the 1940 Act) are effective, as of a date within 90 days of the filing date of this Form N-CSR based on their evaluation of these controls and procedures required by Rule 30a-3(b) under the 1940 Act and Rules 13a-15(b) or 15d-15(b) under the Securities Exchange Act of 1934. |
| (b) | There were no changes in the Registrant’s internal control over financial reporting (as defined in Rule 30a-3(d) under the 1940 Act) that occurred during the period covered by this report that has materially affected, or is reasonably likely to materially affect, the Registrant’s internal control over financial reporting. |
| Item 17. | Disclosure of Securities Lending Activities for Closed-End Management Investment Companies. |
| Item 18. | Recovery of Erroneously Awarded Compensation |
Not applicable.
| (101) | Inline Interactive Data File - the instance document does not appear in the Interactive Data File because its XBRL tags are embedded within the inline XBRL document. |
SIGNATURES
Pursuant to the requirements of the Securities Exchange Act of 1934 and the Investment Company Act of 1940, the Registrant has duly caused this report to be signed on its behalf by the undersigned, thereunto duly authorized.
WASATCH FUNDS TRUST
| | |
By: | | /s/ Eric S. Bergeson |
| | Eric S. Bergeson |
| | President (principal executive officer) of Wasatch Funds Trust |
| |
Date: | | December 5, 2024 |
Pursuant to the requirements of the Securities Exchange Act of 1934 and the Investment Company Act of 1940, this report has been signed below by the following persons on behalf of the Registrant and in the capacities and on the dates indicated.
| | |
By: | | /s/ Eric S. Bergeson |
| | Eric S. Bergeson |
| | President (principal executive officer) of Wasatch Funds Trust |
| |
Date: | | December 5, 2024 |
| |
By: | | /s/ Kara Becker |
| | Kara Becker |
| | Treasurer (principal financial officer) of Wasatch Funds Trust |
| |
Date: | | December 5, 2024 |