| | | |
| | |
|
| | | OMB APPROVAL |
| | |
|
| | | OMB Number: 3235-0570 |
| | | Expires: September 31, 2007 |
| | | Estimated average burden |
| | | hours per response: 19.4 |
| | |
|
UNITED STATES
SECURITIES AND EXCHANGE COMMISSION
Washington, D.C. 20549
FORM N-CSR
CERTIFIED SHAREHOLDER REPORT OF REGISTERED MANAGEMENT INVESTMENT COMPANIES
Investment Company Act file number: 811-4923
Longleaf Partners Funds Trust
(Exact name of registrant as specified in charter)
c/o Southeastern Asset Management, Inc.
6410 Poplar Avenue, Suite 900
Memphis, TN 38119
(Address of principal executive offices) (Zip code)
Andrew R. McCarroll, Esq.
Southeastern Asset Management, Inc.
6410 Poplar Ave., Suite 900
Memphis, TN 38119
(Name and address of agent for service)
Registrant’s telephone number, including area code: (901) 761-2474
Date of fiscal year end: December 31
Date of reporting period: December 31, 2006.
TABLE OF CONTENTS
Item 1. Longleaf Partners Funds Annual Report at December 31, 2006.
LONGLEAF PARTNERS FUNDS ®
ANNUAL REPORT
at December 31, 2006
PARTNERS FUND
SMALL-CAP FUND
INTERNATIONAL FUND
MANAGED BY:
SOUTHEASTERN ASSET MANAGEMENT, INC.tm
Memphis, TN
Cautionary Statement
One of Longleaf’s “Governing Principles” is that “we will communicate with our investment partners as candidly as possible,” because we believe our shareholders benefit from understanding our investment philosophy and approach. Our views and opinions regarding the investment prospects of our portfolio holdings and Funds are “forward looking statements” which may or may not be accurate over the long term. While we believe we have a reasonable basis for our appraisals and we have confidence in our opinions, actual results may differ materially from those we anticipate. Information provided in this report should not be considered a recommendation to purchase or sell any particular security.
You can identify forward looking statements by words like “believe,” “expect,” “anticipate,” or similar expressions when discussing prospects for particular portfolio holdings and/or one of the Funds. We cannot assure future results and achievements. You should not place undue reliance on forward looking statements, which speak only as of the date of this report. We disclaim any obligation to update or alter any forward looking statements, whether as a result of new information, future events, or otherwise. This material must be preceded or accompanied by a Prospectus. Please read the Prospectus carefully for a discussion of fees, expenses, and risks. Current performance may be lower or higher than the performance quoted herein. You may obtain a current copy of the Prospectus or more current performance information by calling 1-800-445-9469 or at Longleaf’s website (www.longleafpartners.com).
The price-to-value ratio (“P/V”) is a calculation that compares the prices of the stocks in a portfolio to Southeastern’s appraisal of their intrinsic values. P/V represents a single data point about a Fund, and should not be construed as something more. We caution our shareholders not to give this calculation undue weight. P/V alone tells nothing about:
| |
| • | The quality of the businesses we own or the managements that run them; |
| • | The cash held in the portfolio and when that cash will be invested; |
| • | The range or distribution of individual P/V’s that comprise the average; and |
| • | The sources of and changes in the P/V. |
When all of the above information is considered, the P/V is a useful tool to gauge the attractiveness of a Fund’s potential opportunity. It does not, however, tell when that opportunity will be realized, nor does it guarantee that any particular company’s price will ever reach its value. We remind our shareholders who want to find a single silver bullet of information that investments are rarely that simple. To the extent an investor considers P/V in assessing a Fund’s return opportunity, the limits of this tool should be considered along with other factors relevant to each investor.
© 2007 Longleaf Partners Funds Trust. All Rights Reserved.
LONGLEAF, LONGLEAF PARTNERS FUNDS and the pine cone logo are registered trademarks of Longleaf Partners Funds Trust.
CONTENTS
| | | | |
| Letter to Shareholders | | 1 |
| |
| Longleaf Partners Fund (Partners Fund) | | |
| | Management Discussion | | 4 |
| | Performance History | | 7 |
| | Portfolio Holdings | | 8 |
| | Portfolio Changes | | 9 |
| | Portfolio of Investments | | 10 |
| |
| Longleaf Partners Small-Cap Fund (Small-Cap Fund) | | |
| | Management Discussion | | 13 |
| | Performance History | | 15 |
| | Portfolio Holdings | | 16 |
| | Portfolio Changes | | 17 |
| | Portfolio of Investments | | 18 |
| |
| Longleaf Partners International Fund (International Fund) | | |
| | Management Discussion | | 21 |
| | Performance History | | 24 |
| | Portfolio Summary | | 25 |
| | Portfolio of Investments | | 26 |
| Financial Statements and Footnotes | | 30 |
| Financial Highlights | | 42 |
| Report of Independent Registered Public Accounting Firm | | 44 |
| Statement Regarding Basis for Approval of Investment Advisory Contracts | | 45 |
| Expense Example | | 52 |
| Information on Boards of Trustees | | 54 |
| Fund Information | | 57 |
| Service Directory | | 59 |
Longleaf Partners Funds
LETTER TO SHAREHOLDERS
TO OUR SHAREHOLDERS:
As your investment partners and managers we are pleased to report the results of 2006. For the fourth quarter, the year and the last decade all three Longleaf Funds have met or surpassed our absolute annual goal of inflation plus 10%. Each Fund has also materially outperformed its respective benchmark index over the long term, and the Partners Fund and Small-Cap Fund exceeded their indices over the last three and twelve months.
Returns are presented below:
| | | | | | | | | | | | | |
| | | | | | | 4th | |
| | | 10 Year | | | 2006 | | | Quarter | |
| | | | | | | | | | |
Partners Fund | | | 12.8 | % | | | 21.6 | % | | | 7.8 | % |
| S&P 500 Index | | | 8.4 | | | | 15.8 | | | | 6.7 | |
| |
Small-Cap Fund | | | 14.5 | | | | 22.3 | | | | 9.3 | |
| Russell 2000 Index | | | 9.4 | | | | 18.4 | | | | 8.9 | |
| |
International Fund | | | 15.5 | * | | | 17.1 | | | | 7.8 | |
| EAFE Index | | | 8.0 | * | | | 26.3 | | | | 10.4 | |
| |
| Inflation plus 10% | | | 12.4 | | | | 12.5 | | | | 2.0 | |
| |
| * | Return since inception 10/26/98. In 1998, the EAFE was available at month-end only; therefore, the EAFE value at 10/31/98 was used to calculate performance since inception. Inflation plus 10% for the period since inception was 12.7%. Additional performance information can be found on pages 7, 15 and 24. |
Patience and discipline have been required over the last three years as developed markets around the world have encountered little volatility, and equities have not been particularly cheap. We struggled in 2004 and into 2005 to identify investments that met our criteria. We opted to hold low-returning U.S. Treasury Bills rather than force the Funds’ liquidity into investments that did not meet our qualifications. Fortunately, by the end of 2005, we had invested most of the cash reserves into compelling long-term equity stakes.
In 2006 our patience and commitments began to pay off. Many of the companies that had been the most discounted over the last few years were among the strongest performers during the last twelve months, including Comcast, DirecTV, NewsCorp, Disney, Shaw, General Motors, Fairfax and Level 3. In addition, some of the businesses we purchased more recently in 2005 and 2006 have already contributed to the year’s high returns.
1
Longleaf Partners Funds
LETTER TO SHAREHOLDERS
Over the last twelve months we sold businesses in each Fund when prices approached our appraisals. In addition, we scaled back several large positions to meet I.R.S. diversification requirements and to pay for more attractive names. Each Fund’s cash has risen recently. Given the robust worldwide stock returns and certain extremes in markets today, having some deployable liquidity is welcome. During 2006 only four (Thailand, Japan, Pakistan and South Korea) of 39 major country stock indices did not rise more than 10%. In addition, returns across the globe came from a broad base of industries. In the U.S. margin debt is at its highest level in six years, close to that of March 2000. The volatility index, VIX, is near the record low set thirteen years ago. Bond risk premiums are compressed. Economic and geo-political disruptions are above-average possibilities across the globe, and could lead to larger, interconnected dislocations. As long-term investors, we would welcome more trepidation and mispricing.
We have no view on what markets will do, but this environment presents a challenge as we enter 2007. There are few available bargains as we look for new opportunities to strengthen the foundation for compounding over the next five years. The domestic “on deck” list of potential investments is relatively small, but we are buying several new international companies. The price-to-value ratios (P/Vs) in all three Funds are slightly above their long-term averages. Given the recent strong performance, higher P/Vs are not surprising. The P/Vs will improve as we find new underpriced securities, sell fully valued ones, and as the intrinsic worths of many holdings grow at double-digit rates.
The enclosed Morningstar article announced that your managers were selected as “Domestic Equity Fund Managers of the Year.” We are honored to be chosen, especially in a year when fewer than 20% of U.S. diversified stock funds beat the S&P. The Morningstar recognition is particularly gratifying because it is not solely based on last year’s results — in our twenty years of operating the Funds there have been years when returns were higher than in 2006. Morningstar’s selection considered results over long periods as well as shareholder stewardship. We believe those attributes to be substantially more meaningful than a twelve month return.
Morningstar’s comprehensive approach serves as a reminder that all returns are not created equally. Our long-term success has emanated from several core principles:
| |
| • | Buy businesses with expected value growth. |
| • | Partner with honorable, capable management. |
| • | Pay a significant discount for stocks, lowering the risk of loss and capturing the opportunity to make substantial returns over time. |
2
Longleaf Partners Funds
LETTER TO SHAREHOLDERS
| |
| • | Invest with a minimum five year horizon, deferring taxes and minimizing transaction costs. |
| • | Concentrate in your best ideas, reducing the number of decisions required. |
| • | Maintain financial flexibility. |
| • | Charge reasonable fees. |
This approach provides superior after-tax, risk-adjusted results and contrasts with the significant movement of assets toward much more speculative strategies. Today’s willingness to take on tremendous risk and to chase yield is unprecedented. Many alternative vehicles:
| |
| • | Use huge amounts of leverage. |
| • | Place bets on macro expectations in somewhat unpredictable and potentially volatile areas. |
| • | Forego any margin of safety to follow prices higher. |
| • | Frenetically trade with a 30 day time horizon, creating large transaction costs and big tax liabilities. |
| • | Force multiple decisions within a day’s trading period. |
| • | Charge high fixed fees and take large bites out of investors’ profits as well. |
Most of our liquid net worth is invested in Longleaf Partners Funds, not as a marketing strategy, but because we believe the Funds offer the best way to compound capital at high returns with low risk. We are grateful to have investment partners of like mind.
Please mark your calendars for Longleaf’s annual shareholder presentation. It will be Monday, May 14 in Memphis at 5:30 in the afternoon. We are finalizing the location and will post it on our web site. We hope that many of you will join us to celebrate the results of 2006 and receive an update on 2007.
Happy New Year and thank you for your longstanding support.
Sincerely,
| | | |
| |  |
O. Mason Hawkins, CFA
Chairman & CEO
Southeastern Asset Management, Inc. | | G. Staley Cates, CFA
President
Southeastern Asset Management, Inc. |
3
Partners Fund - MANAGEMENT DISCUSSION
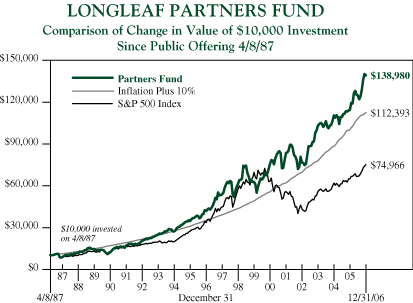
Longleaf Partners ended the year up 21.6%, handily surpassing our inflation plus 10% goal and the S&P 500 Index’s 15.8%. In the fourth quarter the Fund rose 7.8% versus 6.7% for the Index. The results in 2006 added to the Fund’s successful long-term record. In the almost twenty years since inception, Longleaf Partners has achieved an average annual return of 14.3% while the S&P has produced 10.7%. Inflation plus 10% has been 13.0%. The line graph on page 7 demonstrates the tremendous difference a 360 basis point spread makes over a twenty year period, and reminds everyone why focusing on long-term absolute compounding is paramount.
Almost all of the names in the portfolio contributed to the positive return in 2006. The leaders were among those holdings that have been most controversial and most discounted over the last several years. Level 3 almost doubled over the last twelve months. Internet usage has grown with ever-increasing video, voice and data demand. Not only has higher capacity utilization slowed price declines, but the acquisitions that Level 3 has made, including Wiltel, Telcove and most recently, Broadwing, have helped consolidate the industry’s overcapacity while expanding Level 3’s direct reach to customers in metro areas. The stock remains well below our appraisal of corporate value, and that appraisal continues to grow at a fast rate.
The media-related companies that Wall Street despised in 2005 became heroes in 2006, although the business landscape changed very little. DirecTV rose 77%, Comcast was up 63% and Disney rose 44%. DirecTV, which was one of the Fund’s most discounted names at the year’s outset, performed well on every front. They steadily added subscribers while containing acquisition costs. They grew ARPU (revenue per user) with price increases and mix improvements. Free cash flow rapidly grew with higher revenues and lower capital expenditures. Value growth exploded because of the larger cash coupon and significant share repurchases. In the fourth quarter DirecTV’s stock rose 27% as News Corp agreed to swap its stake in DirecTV for Liberty Capital’s shares of News Corp. With John Malone’s oversight and Chase Carey’s operating prowess, the company’s value is likely to continue to grow at good rates, and the stock remains well below our appraisal even after its appreciation.
Comcast grew ARPU at double-digit rates, adding subscribers in digital video, broadband, and voice. They also completed their somewhat complex acquisition of pieces of the Adelphia system. Comcast has room for continued growth, and Brian Roberts’ ownership interest and management skills should help the value to increase as he buys in shares and operates the business effectively. After rising
4
Partners Fund - MANAGEMENT DISCUSSION
14% in the fourth quarter, the stock was overweighted. We trimmed Comcast to a more normal weighting.
Disney reported good results across the company. Movies, ABC and the animation businesses, each of which impacts short-term earnings but are relatively small parts of the company’s value, had a good year. More importantly, ESPN and the theme parks generated strong and growing cash flow. Our appraisal rose during the year, and we expect double-digit value growth in 2007.
Although General Motors gave back 7% in the fourth quarter, the 64% return in 2006 helped reduce the hostility we felt from many shareholders about this position as the year began. Although we never viewed bankruptcy as a likely outcome, talk of this possibility died down as the company made significant progress on several fronts.
Three companies negatively impacted performance: Dell, Pioneer Natural Resources, and Sprint Nextel. Dell which we took to a double position when it traded at half of our appraisal, rose 10% in the fourth quarter, but declined 16% for the full year. Earnings over the last twelve months were disappointing and there is a question of whether some numbers will be restated. However, we believe Dell’s direct sale model is the most competitive over the long run, and that the operating problems related to consumer support and gross margins are less relevant than their strength in the corporate world and their rapid growth in foreign operations. Our corporate partners are both significant owners and smart capital allocators. Although we lowered our appraisal to reflect the last year’s troubles, we think the company’s normal earnings power is much higher than recent numbers, and the true value could be well above the appraisal we use.
Pioneer Natural Resources fell 22% during the year, primarily driven by declining oil and gas prices. Our appraisal is not predicated on high near-term prices, and despite energy’s retreat, our appraisal of Pioneer grew in 2006. The combined value growth and price drop make the stock very cheap.
Sprint Nextel has had a difficult time managing churn. This has also interfered with the speed at which they have been able to integrate the two businesses of Sprint and Nextel post-merger. With revenues lower than expected and costs higher than planned, the market has penalized the company and our appraisal has declined because free cash flow generation has not grown as expected. Gary Forsee, the CEO, is focused on fixing the business’ operating issues, and importantly, he has aggressively begun to buy in shares, which are trading at a substantial discount even against a lowered appraisal.
5
Partners Fund - MANAGEMENT DISCUSSION
No significant activity occurred in the portfolio during the fourth quarter. Earlier in the year we sold the Fund’s stakes in Waste Management, McClatchy (formerly Knight Ridder), and Anheuser-Busch. We purchased a new position in Chesapeake Energy in the second quarter, and began buying eBay and Symantec in the third quarter.
These purchases and sales helped the P/ V stay in the high-60%s at year-end, having begun 2006 in the mid-60%s. The value growth at a number of companies also helped maintain an attractive P/ V in spite of a return over 21% in 2006. In particular, several companies boosted values at especially high rates. Some of these, such as YUM Brands!, DirecTV, and Liberty Interactive, aided the process through meaningful share repurchases.
The quality of the Fund’s holdings and management partners makes the portfolio attractive, even after 2006’s strong performance. We have some cash to allow us to buy the next building block for compounding when we identify it. We have a reasonable P/ V, and believe that values will continue to grow.
6
Partners Fund - PERFORMANCE HISTORY
AVERAGE ANNUAL RETURNS
for the periods ended December 31, 2006
| | | | | | | | | | | | | |
| | | Partners | | | Inflation | | | S&P 500 | |
| | | Fund | | | Plus 10% | | | Index | |
| | | | | | | | | | |
| One Year | | | 21.63 | % | | | 12.54 | % | | | 15.79 | % |
| Five Years | | | 10.78 | | | | 12.69 | | | | 6.19 | |
| Ten Years | | | 12.77 | | | | 12.44 | | | | 8.42 | |
| Since Public Offering 4/8/87 | | | 14.26 | | | | 13.02 | | | | 10.74 | |
Past performance does not predict future performance, Fund prices fluctuate, and the value of an investment at redemption may be worth more or less than the purchase price. The Fund’s performance results in the table shown above do not reflect the deduction of taxes that a shareholder would pay on Fund distributions or the redemption of Fund shares. The S&P 500 Index is shown with all dividends and distributions reinvested. This index is unmanaged and is not hedged for foreign currency risk. Longleaf often hedges its exposure to foreign currencies. The U.S. Bureau of Labor Statistics compiles the monthly CPI-U values used to calculate inflation. Current performance may be lower or higher than the performance quoted. Please call 1-800-445-9469 or view Longleaf’s website (www.longleafpartners.com) for more current performance information.
7
Partners Fund – PORTFOLIO HOLDINGS
TABLE OF PORTFOLIO HOLDINGS
at December 31, 2006
| | | | | | | | | | |
| | | | | Net | |
| | | | | Assets | |
| | | | | | |
| Common Stock | | | | | | | 90.9 | % |
| | Dell Inc. | | | 9.4 | | | | | |
| | The DIRECTV Group, Inc. | | | 5.5 | | | | | |
| | Yum! Brands, Inc. | | | 5.1 | | | | | |
| | The Walt Disney Corporation | | | 4.9 | | | | | |
| | Cemex S.A.B. de C.V. | | | 4.8 | | | | | |
| | Aon Corporation | | | 4.8 | | | | | |
| | The NipponKoa Insurance Company, Ltd. | | | 4.8 | | | | | |
| | Koninklijke Philips Electronics N.V. | | | 4.7 | | | | | |
| | Sprint Nextel Corporation | | | 4.7 | | | | | |
| | Vivendi Universal, S.A. | | | 4.5 | | | | | |
| | Liberty Media Holding Corporation – Interactive | | | 4.5 | | | | | |
| | Level 3 Communications, Inc. | | | 4.2 | | | | | |
| | General Motors Corporation | | | 4.0 | | | | | |
| | FedEx Corporation | | | 4.0 | | | | | |
| | Comcast Corporation | | | 3.9 | | | | | |
| | Chesapeake Energy Corporation | | | 3.8 | | | | | |
| | Liberty Media Holding Corporation – Capital | | | 3.6 | | | | | |
| | Telephone and Data Systems, Inc. | | | 3.3 | | | | | |
| | Pioneer Natural Resources Company | | | 3.2 | | | | | |
| | eBay, Inc. | | | 1.4 | | | | | |
| | Symantec Corporation | | | 1.2 | | | | | |
| | Discovery Holding Company | | | 0.6 | | | | | |
| Corporate Bonds | | | | | | | 3.7 | |
| | Level 3 Communications, Inc. | | | 3.7 | | | | | |
| Cash Reserves | | | | | | | 4.5 | |
| Other Assets and Liabilities, net | | | | | | | 0.9 | |
| | | | | | | |
| | | | | | | | 100.0 | % |
| | | | | | | |
8
Partners Fund – PORTFOLIO CHANGES
PORTFOLIO CHANGES
January 1, 2006 through December 31, 2006
| | | |
| New Holdings | | Eliminations |
| | | |
Chesapeake Energy Corporation
eBay, Inc.
* Embarq Corporation (Sprint Nextel Corporation)
* Liberty Media Holding Corporation – Capital Series A (Liberty Media Corporation – Class A)
* Liberty Media Holding Corporation – Interactive Series A (Liberty Media Corporation – Class A)
* The McClatchy Company – Class A (Knight-Ridder, Inc.)
Symantec Corporation | | Anheuser-Busch Companies, Inc.
Comcast Corporation – Class A
Embarq Corporation
* Knight-Ridder, Inc. (The McClatchy Company – Class A)
* Liberty Media Corporation – Class A (Liberty Media Holding Corporation – Capital Series A and Liberty Media Holding Corporation – Interactive
Series A)
The McClatchy Company – Class A
Nestle S.A.
Vivendi Universal, S.A. ADR
Waste Management, Inc. |
| |
| * | Change due to corporate action (name of related holding) |
9
Partners Fund - PORTFOLIO OF INVESTMENTS
at December 31, 2006
| | | | | | | | | | | | | | | | | |
| | | Shares | | | | | | | | | Value | |
| | | | | | | | | | | | | |
| Common Stock 90.9% | | | | | | | | |
| | | | | | | | | Automobiles 4.0% | | | | |
| | | | 14,240,000 | | | | | General Motors Corporation | | $ | 437,452,800 | |
| | | | | | | | | Broadcasting and Cable 9.4% | | | | |
| | | | 10,055,996 | | | * | | Comcast Corporation – Class A Special | | | 421,145,112 | |
| | | | 24,070,500 | | | * | | The DIRECTV Group, Inc. | | | 600,318,270 | |
| | | | | | | | | | | |
| | | | | | | | | | | | | | | | 1,021,463,382 | |
| | | | | | | | | | | | | | |
| | | | | | | | | Construction Materials 4.8% | | | | | | | | |
| | | | 157,540 | | | | | Cemex S.A.B. de C.V. (Foreign) | | | 533,883 | |
| | | | 15,412,872 | | | | | Cemex S.A.B. de C.V. ADS (Foreign) | | | 521,417,460 | |
| | | | | | | | | | | |
| | | | | | | | | | | | | | | | 521,951,343 | |
| | | | | | | | | | | | | | |
| | | | | | | | | Entertainment 9.1% | | | | | | | | |
| | | | 4,335,344 | | | * | | Discovery Holding Company – Class A | | | 69,755,685 | |
| | | | 4,038,172 | | | * | | Liberty Media Holding Corporation – Capital Series A | | | 395,660,093 | |
| | | | 15,489,800 | | | | | The Walt Disney Corporation | | | 530,835,446 | |
| | | | | | | | | | | |
| | | | | | | | | | | | | | | | 996,251,224 | |
| | | | | | | | | | | | | | |
| | | | | | | | | Insurance Brokerage 4.8% | | | | | | | | |
| | | | 14,627,000 | | | | | Aon Corporation | | | 516,918,180 | |
| | | | | | | | | Internet and Catalog Retail 4.5% | | | | | | | | |
| | | | 22,584,666 | | | * | | Liberty Media Holding Corporation – Interactive Series A | | | 487,151,246 | |
| | | | | | | | | Internet Services 1.4% | | | | | | | | |
| | | | 4,915,100 | | | * | | eBay, Inc. | | | 147,797,057 | |
| | | | | | | | | Multi-Industry 4.5% | | | | | | | | |
| | | | 12,547,570 | | | | | Vivendi Universal, S.A. (Foreign)(c) | | | 490,408,590 | |
| | | | | | | | | Natural Resources 7.0% | | | | | | | | |
| | | | 14,315,500 | | | | | Chesapeake Energy Corporation | | | 415,865,275 | |
| | | | 8,784,400 | | | | | Pioneer Natural Resources Company(b) | | | 348,652,836 | |
| | | | | | | | | | | |
| | | | | | | | | | | | | | | | 764,518,111 | |
| | | | | | | | | | | | | | |
| | | | | | | | | Property & Casualty Insurance 4.8% | | | | |
| | | | 63,701,000 | | | | | The NipponKoa Insurance Company, Ltd. (Foreign)(b)(c) | | | 516,545,229 | |
| | | | | | | | | Restaurants 5.1% | | | | | | | | |
| | | | 9,369,100 | | | | | Yum! Brands, Inc. | | | 550,903,080 | |
| | | | | | | | | Software 1.2% | | | | |
| | | | 6,314,800 | | | * | | Symantec Corporation | | | 131,663,580 | |
See Notes to Financial Statements.
10
Partners Fund - PORTFOLIO OF INVESTMENTS
at December 31, 2006
| | | | | | | | | | | | | | | | | |
| | | Shares | | | | | | | | | Value | |
| | | | | | | | | | | | | |
| | | | | | | | | Technology 14.1% | | | | |
| | | | 40,882,816 | | | * | | Dell Inc. | | $ | 1,025,749,853 | |
| | | | 11,806,035 | | | | | Koninklijke (Royal) Philips Electronics N.V. (Foreign) | | | 445,219,667 | |
| | | | 1,787,165 | | | | | Koninklijke (Royal) Philips Electronics N.V. ADR (Foreign) | | | 67,161,661 | |
| | | | | | | | | | | |
| | | | | | | | | | | | | | | | 1,538,131,181 | |
| | | | | | | | | | | | | | |
| | | | | | | | | Telecommunications 12.2% | | | | | | | | |
| | | | 81,029,000 | | | * | | Level 3 Communications, Inc.(b) | | | 453,762,400 | |
| | | | 26,817,900 | | | | | Sprint Nextel Corporation | | | 506,590,131 | |
| | | | 1,530,800 | | | | | Telephone and Data Systems, Inc. | | | 83,168,364 | |
| | | | 5,666,200 | | | | | Telephone and Data Systems, Inc. – Special | | | 281,043,520 | |
| | | | | | | | | | | |
| | | | | | | | | | | | | | | | 1,324,564,415 | |
| | | | | | | | | | | | | | |
| | | | | | | | | Transportation 4.0% | | | | | | | | |
| | | | 3,998,600 | | | | | FedEx Corporation(c) | | | 434,327,932 | |
| | | | | | | | | | | |
| | | | | | | | | Total Common Stocks (Cost $6,855,986,859) | | | 9,880,047,350 | |
| | | | | | | | | | | |
| | | | | | | | | | | | | | | | | |
| | | Principal | | | | | | | | | |
| | | Amount | | | | | | | | | |
| | | | | | | | | | | | |
| | |
Corporate Bonds 3.7% | | | | |
| | | | | | | | | Telecommunications 3.7% | | | | | | | | |
| | | | 222,079,000 | | | | | Level 3 Communications, Inc. 10% Convertible Senior Notes due 5-1-11 (Cost $222,079,000)(b) | | | 403,628,583 | |
| | |
Short-Term Obligations 4.5% | | | | |
| | | | 342,253,000 | | | | | Repurchase Agreement with State Street Bank, 4.65% due 1/2/07, Repurchase price $342,429,831 (Collateralized by U.S. government securities) | | | 342,253,000 | |
| | | | 150,000,000 | | | | | U.S. Treasury Bill, 4.95% due 3-22-07 | | | 148,393,333 | |
| | | | | | | | | | | |
| | | | | | | | | Total Short-Term Obligations | | | 490,646,333 | |
| | | | | | | | | | | |
| Total Investments (Cost $7,568,712,192)(a) | | | 99.1 | % | | | 10,774,322,266 | |
| Other Assets and Liabilities, Net | | | 0.9 | | | | 97,271,981 | |
| | | | | | | |
| Net Assets | | | 100.0 | % | | $ | 10,871,594,247 | |
| | | | | | | |
| Net asset value per share | | | $34.86 | |
| | | | |
* Non-income producing security.
| |
| (a) | Aggregate cost for federal income tax purposes is $7,589,672,728. Net unrealized appreciation of $3,205,610,074 consists of unrealized appreciation and depreciation of $3,656,244,539 and $(450,634,465), respectively. |
| (b) | Affiliated issuer. See Note 7. |
| (c) | All or a portion designated as collateral. See Note 8. |
| |
| Note: | Companies designated as “Foreign” are headquartered outside the U.S. and represent 19% of net assets. |
See Notes to Financial Statements.
11
Partners Fund - PORTFOLIO OF INVESTMENTS
at December 31, 2006
OPEN FORWARD CURRENCY CONTRACTS
| | | | | | | | | | | | | |
| Currency | | | Currency Sold and | | Currency | | | Unrealized | |
| Units Sold | | | Settlement Date | | Market Value | | | Gain (Loss) | |
| | | | | | | | | | |
| | 271,781,000 | | | Euro 3-28-07 | | $ | 360,154,832 | | | $ | (661,950 | ) |
| | 23,337,000,000 | | | Japanese Yen 3-20-07 | | | 198,151,131 | | | | 7,202,476 | |
| | 13,738,000,000 | | | Japanese Yen 3-28-07 | | | 116,771,017 | | | | 3,346,845 | |
| | 26,498,598,000 | | | Japanese Yen 6-22-07 | | | 227,726,578 | | | | (212,214 | ) |
| | | | | | | | | | |
| | | | | | | $ | 902,803,558 | | | $ | 9,675,157 | |
| | | | | | | | | | |
See Notes to Financial Statements.
12
Small-Cap Fund - MANAGEMENT DISCUSSION
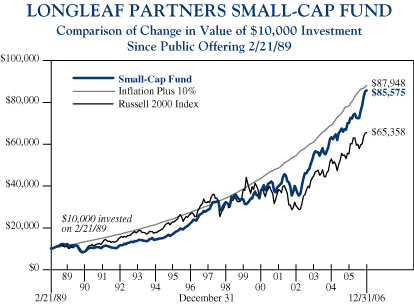
Longleaf Partners Small-Cap Fund rose 22.3% in 2006 following a 9.3% return in the fourth quarter. These results far outpaced our absolute goal of inflation plus 10% as well as the 18.4% return of the Russell 2000 Index for the year and the Index’s 8.9% performance over the last three months. Over the last decade the Fund has compounded at 14.5%, meaningfully ahead of our absolute goal and the Index.
With such significant compounding one would assume that the P/V for the Fund would have risen. Surprisingly, the P/V both began and ended the year in the low/mid-70%s. Three things account for this stability. First, we sold an unusually large number of businesses during the year as they approached our appraisals — Hollinger, Hasbro, Deltic Timber, and Saks in the first half, and Shaw, Molson Coors, U.S.I. Holdings and the Level 3 Bonds in the fourth quarter. Second, we purchased positions in 5 new names — Del Monte Foods, Fair Isaac, IDT, Texas Industries, and Wendy’s — and added to several holdings that sold at substantial discounts. Third, the values of most holdings rose, some at a meaningful rate. The average value growth across the portfolio was 10%. In spite of the strong return, the P/V is as attractive now as at the outset of 2006 and the Fund has almost 14% cash available to lower the P/V when we identify new opportunities.
Level 3 played the biggest part in the Fund’s 2006 results. The equity almost doubled and the bonds also rose. Internet usage has grown with ever-increasing video, voice and data demand. Not only has higher capacity utilization slowed price declines, but the acquisitions that Level 3 has made, including Wiltel, Telcove and most recently, Broadwing, have helped consolidate the industry’s overcapacity while expanding Level 3’s direct reach to customers in metro areas. The stock remains well below our appraisal of corporate value, and that appraisal continues to grow at a fast rate.
Shaw Communications rose over 35% and reached our appraisal. We mentioned in the Third Quarter Report our immense gratitude to Jim Shaw for his management acumen that has now rewarded shareholders for the second time in the Fund’s history.
Jacuzzi’s strong fourth quarter made it one of the Fund’s largest contributors in 2006. Apollo Management has made an offer to take the company private. We have filed a 13D stating our intent to vote against this $12.50 per share deal given our belief that the value is significantly higher and new management can build that value. Texas Industries, purchased in the third quarter, rose 24% over the last three months, and helped the Fund’s full year results as well. The other major contributor in the fourth quarter and for the year was Fairfax. The
13
Small-Cap Fund - MANAGEMENT DISCUSSION
company improved its capital position by selling a portion of its Odyssey Re subsidiary. This sale along with good 2006 underwriting and terrific long-term investing reversed Fairfax’s slide.
Only two names had any meaningful negative impact on Small-Cap’s return. Pioneer Natural Resources fell over 20%, primarily driven by declining oil and gas prices. Our appraisal is not predicated on high near-term prices, and despite energy’s retreat, our appraisal of Pioneer grew in 2006. The combined value growth and price drop make the stock among the cheapest in the portfolio. Pepsi Americas also lost ground during the year because of relatively poor execution.
Small-Cap’s “on-deck” list is limited, but we have started to add a new name since year-end. The run in smaller stocks over the last few years has made finding companies that qualify more difficult. We will continue to be diligent as we look for the next building blocks for the Fund, and are glad to have available liquidity.
14
Small-Cap Fund - PERFORMANCE HISTORY
AVERAGE ANNUAL RETURNS
for the periods ended December 31, 2006
| | | | | | | | | | | | | |
| | | Small-Cap | | | Inflation | | | Russell 2000 | |
| | | Fund | | | Plus 10% | | | Index | |
| | | | | | | | | | |
| One Year | | | 22.33 | % | | | 12.54 | % | | | 18.37 | % |
| Five Years | | | 16.58 | | | | 12.69 | | | | 11.39 | |
| Ten Years | | | 14.51 | | | | 12.44 | | | | 9.44 | |
| Since Public Offering 2/21/89 | | | 12.77 | | | | 12.90 | | | | 11.08 | |
Past performance does not predict future performance, Fund prices fluctuate, and the value of an investment at redemption may be worth more or less than the purchase price. The Fund’s performance results in the table shown above do not reflect the deduction of taxes that a shareholder would pay on Fund distributions or the redemption of Fund shares. The Russell 2000 Index is shown with all dividends and distributions reinvested. This index is unmanaged and is not hedged for foreign currency risk. Longleaf often hedges its exposure to foreign currencies. The U.S. Bureau of Labor Statistics compiles the monthly CPI-U values used to calculate inflation. Current performance may be lower or higher than the performance quoted. Please call 1-800-445-9469 or view Longleaf’s website (www.longleafpartners.com) for more current performance information.
15
Small-Cap Fund - PORTFOLIO HOLDINGS
TABLE OF PORTFOLIO HOLDINGS
at December 31, 2006
| | | | | | | | | | |
| | | | | Net | |
| | | | | Assets | |
| | | | | | |
| Common Stock | | | 87.6 | % |
| | Level 3 Communications, Inc. | | | 7.8 | | | | | |
| | Texas Industries, Inc. | | | 6.1 | | | | | |
| | Discovery Holding Company | | | 5.8 | | | | | |
| | Olympus Corporation | | | 5.6 | | | | | |
| | Jacuzzi Brands, Inc. | | | 5.3 | | | | | |
| | Fairfax Financial Holdings Limited | | | 5.1 | | | | | |
| | Service Corporation International | | | 5.0 | | | | | |
| | Potlatch Corporation | | | 4.7 | | | | | |
| | Pioneer Natural Resources Company | | | 4.6 | | | | | |
| | IHOP Corp. | | | 4.5 | | | | | |
| | Hilb, Rogal & Hobbs Company | | | 4.3 | | | | | |
| | Everest Re Group, Ltd. | | | 4.0 | | | | | |
| | Ruddick Corporation | | | 3.9 | | | | | |
| | IDT Corporation | | | 3.7 | | | | | |
| | Wendy’s International, Inc. | | | 3.5 | | | | | |
| | PepsiAmericas, Inc. | | | 3.2 | | | | | |
| | Willis Group Holdings Limited | | | 2.9 | | | | | |
| | Del Monte Foods Company | | | 2.9 | | | | | |
| | Fair Isaac Corporation | | | 2.2 | | | | | |
| | Vail Resorts, Inc. | | | 1.6 | | | | | |
| | Odyssey Re Holdings Corp. | | | 0.9 | | | | | |
| Cash Reserves | | | | | | | 13.6 | |
| Other Assets and Liabilities, net | | | | | | | (1.2 | ) |
| | | | | | | |
| | | | | | | | 100.0 | % |
| | | | | | | |
16
Small-Cap Fund - PORTFOLIO CHANGES
PORTFOLIO CHANGES
January 1, 2006 through December 31, 2006
| | | |
| New Holdings | | Eliminations |
| | | |
Del Monte Foods Company
Fair Isaac Corporation
IDT Corporation
IDT Corporation – Class B
Level 3 Communications, Inc.,
11.5% Senior Notes due 3-1-10 (a)
Texas Industries, Inc.
* Tim Hortons, Inc. (Wendy’s International, Inc.)
Wendy’s International, Inc. | | Deltic Timber Corporation
Hasbro, Inc.
Hollinger International Inc.
Level 3 Communications, Inc.,
11% Senior Notes due 3-15-08(a)
Level 3 Communications, Inc.,
9.125% Senior Notes due 5-1-08(a)
Level 3 Communications, Inc.,
6% Convertible Subordinated
Notes due 9-15-09
Level 3 Communications, Inc.,
11.5% Senior Notes due 3-1-10
Level 3 Communications, Inc.
6% Convertible Subordinated
Notes due 3-15-10
Molson Coors Brewing
Company
Saks Incorporated
Shaw Communications Inc.–
Class B
Tim Hortons, Inc.
U.S.I. Holdings Corporation |
* Change due to corporate action (name of related holding)
(a) Level 3 2008 Notes exchanged for 2010 maturity.
17
Small-Cap Fund - PORTFOLIO OF INVESTMENTS
at December 31, 2006
| | | | | | | | | | | | | | | | | |
| | | Shares | | | | | | | | | Value | |
| | | | | | | | | | | | | |
| Common Stock 87.6% | | | | | | | | |
| | | | | | | | | Beverages 3.2% | | | | | | | | |
| | | | 5,262,900 | | | | | PepsiAmericas, Inc. | | $ | 110,415,642 | |
| | | | | | | | | Construction Materials 6.1% | | | | | | | | |
| | | | 3,244,800 | | | | | Texas Industries, Inc.(b) | | | 208,413,504 | |
| | | | | | | | | Entertainment 5.8% | | | | | | | | |
| | | | 12,422,000 | | | * | | Discovery Holding Company – Class A | | | 199,869,980 | |
| | | | | | | | | Food 2.9% | | | | | | | | |
| | | | 8,898,600 | | | | | Del Monte Foods Company | | | 98,151,558 | |
| | | | | | | | | Funeral Services 5.0% | | | | | | | | |
| | | | 16,719,400 | | | | | Service Corporation International(b) | | | 171,373,850 | |
| | | | | | | | | Grocery – Retail 3.9% | | | | | | | | |
| | | | 4,823,500 | | | | | Ruddick Corporation(b) | | | 133,852,125 | |
| | | | | | | | | Information Technology 2.2% | | | | | | | | |
| | | | 1,902,400 | | | | | Fair Isaac Corporation | | | 77,332,560 | |
| | | | | | | | | Insurance Brokerage 7.2% | | | | |
| | | | 3,526,400 | | | | | Hilb Rogal & Hobbs Company(b) | | | 148,531,968 | |
| | | | 2,513,000 | | | | | Willis Group Holdings Limited (Foreign) | | | 99,791,230 | |
| | | | | | | | | | | |
| | | | | | | | | | | | | | | | 248,323,198 | |
| | | | | | | | | | | | | | |
| | | | | | | | | Manufacturing 5.3% | | | | | | | | |
| | | | 14,609,800 | | | * | | Jacuzzi Brands, Inc.(b) | | | 181,599,814 | |
| | | | | | | | | Medical and Photo Equipment 5.6% | | | | | | | | |
| | | | 6,149,000 | | | | | Olympus Corporation (Foreign) | | | 193,246,166 | |
| | | | | | | | | Natural Resources 9.3% | | | | | | | | |
| | | | 4,004,300 | | | | | Pioneer Natural Resources Company | | | 158,930,667 | |
| | | | 3,702,022 | | | | | Potlatch Corporation(b) | | | 162,222,604 | |
| | | | | | | | | | | |
| | | | | | | | | | | | | | | | 321,153,271 | |
| | | | | | | | | | | | | | |
| | | | | | | | | Property & Casualty Insurance 10.0% | | | | | | | | |
| | | | 1,421,800 | | | | | Everest Re Group, Ltd. (Foreign) | | | 139,492,798 | |
| | | | 886,000 | | | | | Fairfax Financial Holdings Limited (Foreign) | | | 176,007,220 | |
| | | | 843,800 | | | | | Odyssey Re Holdings Corp. | | | 31,473,740 | |
| | | | | | | | | | | |
| | | | | | | | | | | | | | | | 346,973,758 | |
| | | | | | | | | | | | | | |
| | | | | | | | | Real Estate 1.6% | | | | | | | | |
| | | | 1,211,917 | | | * | | Vail Resorts, Inc. | | | 54,318,120 | |
See Notes to Financial Statements.
18
Small-Cap Fund - PORTFOLIO OF INVESTMENTS
at December 31, 2006
| | | | | | | | | | | | | | | | | |
| | | Shares | | | | | | | | | Value | |
| | | | | | | | | | | | | |
| | | | | | | | | Restaurants 8.0% | | | | | | | | |
| | | | 2,978,100 | | | | | IHOP Corp.(b) | | $ | 156,945,870 | |
| | | | 3,663,800 | | | | | Wendy’s International, Inc. | | | 121,235,142 | |
| | | | | | | | | | | |
| | | | | | | | | | | | | | | | 278,181,012 | |
| | | | | | | | | | | | | | |
| | | | | | | | | Telecommunications 11.5% | | | | | | | | |
| | | | 459,400 | | | * | | IDT Corporation | | | 6,215,682 | |
| | | | 9,288,162 | | | * | | IDT Corporation – Class B | | | 121,489,159 | |
| | | | 48,076,002 | | | * | | Level 3 Communications, Inc. | | | 269,225,611 | |
| | | | | | | | | | | |
| | | | | | | | | | | | | | | | 396,930,452 | |
| | | | | | | | | | | | | | |
| | | | | | | | | Total Common Stocks (Cost $2,281,800,783) | | | 3,020,135,010 | |
| | | | | | | | | | | |
| | | | | | | | | | | | | | | | | |
| | | Principal | | | | | | | | | |
| | | Amount | | | | | | | | | |
| | | | | | | | | | | | |
Short-Term Obligations 13.6% | | | | | | | | |
| | | | 145,584,000 | | | | | Repurchase Agreement with State Street Bank, 4.65% due 1-2-07, Repurchase price $145,659,218 (Collateralized by U.S. government securities) | | | 145,584,000 | |
| | | | 325,000,000 | | | | | U.S. Treasury Bills, 4.93% - 4.99% due 2-22-07 to 3-22-07 | | | 321,952,479 | |
| | | | | | | | | | | |
| | | | | | | | | Total Short-Term Obligations | | | 467,536,479 | |
| | | | | | | | | | | |
| Total Investments (Cost $2,749,337,262)(a) | | | 101.2 | % | | | 3,487,671,489 | |
| Other Assets and Liabilities, Net | | | (1.2 | ) | | | (40,386,864 | ) |
| | | | | | | |
| Net Assets | | | 100.0 | % | | $ | 3,447,284,625 | |
| | | | | | | |
| Net asset value per share | | | $30.12 | |
| | | | |
* Non-income producing security.
| |
| (a) | Aggregate cost for federal tax purposes is $2,749,657,232. Net unrealized appreciation consists entirely of $738,334,227 unrealized appreciation. |
| (b) | Affiliated issuer. See Note 7. |
| |
| Note: | Companies designated as “Foreign” are headquartered outside the U.S. and represent 18% of net assets. |
See Notes to Financial Statements.
19
Small-Cap Fund - PORTFOLIO OF INVESTMENTS
at December 31, 2006
Intentionally Left Blank
20
International Fund - MANAGEMENT DISCUSSION
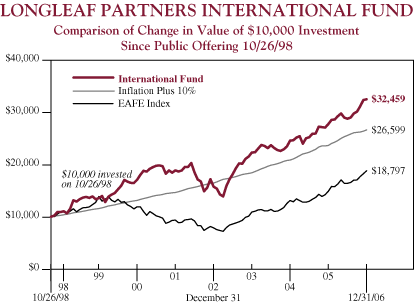
Longleaf Partners International Fund exceeded our absolute goal of inflation plus 10% by over 450 basis points, returning 17.1% in 2006. This performance lagged the 26.3% result posted by the EAFE Index. In the fourth quarter, the Fund gained 7.8% compared to 10.4% for EAFE.
Renault, Shaw, and Fairfax contributed the most to returns during the year. Renault’s price increasingly reflected the value of its disparate parts, thanks largely to CEO Carlos Ghosn’s stewardship. Shaw Communications rose 36% and reached our appraisal. We mentioned in the Third Quarter Report our immense gratitude to Jim Shaw for his management acumen. Fairfax improved its capital position by selling a portion of its Odyssey Re subsidiary. This sale along with good 2006 underwriting and terrific long-term investing reversed Fairfax’s slide. The stock was the Fund’s largest fourth quarter contributor, and rose 39% during the year.
Only two stocks declined last year: Dell and SkyPerfect. In the second quarter we sold the Fund’s remaining SkyPerfect position. Dell rose 10% in the fourth quarter, but declined 16% for the full year. Earnings over the last twelve months were disappointing and there is a question of whether some numbers will be restated. However, we believe Dell’s direct sale model is the most competitive over the long run, and that the operating problems related to consumer support and gross margins are less relevant than their strength in the corporate world and their rapid growth in foreign operations. Our corporate partners are both significant owners and smart capital allocators. Although we lowered our appraisal to reflect the last year’s troubles, we think the company’s normal earnings power is much higher than recent numbers, and the true value could be well above the appraisal we use.
Overall, Longleaf Partners International Fund had a successful 2006:
| |
| • | The 17.1% return handily exceeded our absolute return objective. |
| • | Appraisals of most holdings grew. |
| • | Research productivity accelerated: we added five positions this year and have added seven since the third quarter of 2005. |
| • | We upgraded the portfolio’s quality: never before have we partnered with a better combination of managements and franchises in the International Fund. |
| • | Many of the Fund’s holdings repurchased shares at significant rates. |
| • | Ken Siazon and Scott Cobb joined the research team in our overseas offices and made contributions to new name generation. |
| • | The Fund’s price-to-value ratio (P/ V) remains in the low-70%s where it started the year, high by historical standards, but still attractive. |
21
International Fund - MANAGEMENT DISCUSSION
2006 was particularly active. We sold Molson Coors, Shaw, a large piece of News Corp as well as smaller pieces of other appreciated holdings. We used existing cash and the proceeds of these sales to buy Cheung Kong, more Dell, Ingersoll-Rand, Sankyo, and Nikko Cordial. Making swaps like these and holding cash when nothing qualifies are critical to long-term success and to preservation of capital. Sometimes these disciplines can cause underperformance in a rising market, particularly when the market’s return is driven by speculation and a declining dollar.
We emphasize risk to capital as much as potential returns on capital. As a result, we will generally lag markets that reward the riskiest companies. A comparison between Millea, the only Fund holding that declined during the fourth quarter, and China Life illustrates this disparity. Millea has a AA rated balance sheet, consistently underwrites profitably, holds an attractive portfolio of Japanese equities, and leads the Japanese property and casualty market with over 20% market share. Millea trades at less than 1x book value, about 10x economic earnings, and is steadily repurchasing shares. Government controlled China Life has been one of the hottest stocks of the last few years. Just after the year ended, China Life sold additional shares on the Shanghai exchange. The shares doubled on the day of issue and traded at over 7x book value and approximately 70x earnings, making China Life briefly the third most valuable insurance company in the world.
The preference for risk illustrated in the China Life/ Millea comparison repeated itself around the world in 2006. The best performing stock markets were in China, Venezuela, and Indonesia. The three largest IPOs were two Chinese government controlled banks and a state controlled Russian energy company. We have nothing against either Russia or China and believe that their increasing integration with the West provides an important counterweight to the more publicized risks emanating from the Middle East. However, we have not analyzed a single Chinese or Russian company in which we would feel comfortable investing our net worth even if the markets were to shut down (a theoretical test that has recently become a reality for investors in Thailand.) On the other hand, we have found superb partners with excellent businesses in China, Russia and other emerging markets at Philips, Cheung Kong, Nestle, and Yum!. Each of these companies has exceptional management with large stakes in the same shares we own. Each has a pristine balance sheet. Each has lagged the most exciting markets.
We started the International Fund in 1998 to invest in compelling, mispriced overseas businesses that were limited to 30% of Longleaf’s domestic funds. Since
22
International Fund - MANAGEMENT DISCUSSION
inception the Fund has compounded at 15.5%, while minimizing political, financial, and business risk, and nearly doubled EAFE’s return. We evaluate investments based on business, people, and price. Compared to prior years, the Fund’s P/ V is higher than average, but its businesses and people are the best we have ever had.
23
International Fund - PERFORMANCE HISTORY
AVERAGE ANNUAL RETURNS
for the periods ended December 31, 2006
| | | | | | | | | | | | | |
| | | International | | | Inflation | | | EAFE | |
| | | Fund | | | Plus 10% | | | Index | |
| | | | | | | | | | |
| One Year | | | 17.07 | % | | | 12.54 | % | | | 26.34 | % |
| Five Years | | | 11.47 | | | | 12.69 | | | | 14.98 | |
| Since Public Offering 10/26/98 | | | 15.47 | | | | 12.69 | | | | 8.01 | |
Past performance does not predict future performance, Fund prices fluctuate, and the value of an investment at redemption may be worth more or less than the purchase price. The Fund’s performance results in the table shown above do not reflect the deduction of taxes that a shareholder would pay on Fund distributions or the redemption of Fund shares. The EAFE Index is shown with all dividends and distributions reinvested. In 1998, the EAFE was available at month-end only; therefore, the EAFE value at October 31, 1998 was used to calculate performance since public offering. This index is unmanaged and is not hedged for foreign currency risk. Longleaf often hedges its exposure to foreign currencies. The U.S. Bureau of Labor Statistics compiles the monthly CPI-U values used to calculate inflation. Current performance may be lower or higher than the performance quoted. Please call 1-800-445-9469 or view Longleaf’s website (www.longleafpartners.com) for more current performance information.
24
International Fund - PORTFOLIO SUMMARY
TABLE OF PORTFOLIO HOLDINGS
at December 31, 2006
| | | | | | | | | | |
| | | | | Net | |
| | | | | Assets | |
| | | | | | |
| Common Stock | | | | | | | 92.8 | % |
| | Dell Inc. | | | 8.8 | | | | | |
| | The NipponKoa Insurance Company, Ltd. | | | 7.1 | | | | | |
| | Olympus Corporation | | | 6.2 | | | | | |
| | Renault S.A. | | | 5.9 | | | | | |
| | Fairfax Financial Holdings Limited | | | 5.6 | | | | | |
| | Cemex S.A.B. de C.V. ADS | | | 5.4 | | | | | |
| | Cheung Kong Holdings Limited | | | 5.2 | | | | | |
| | Nestle S.A. | | | 5.0 | | | | | |
| | Vivendi Universal, S.A. | | | 4.9 | | | | | |
| | Koninklijke Philips Electronics N.V. | | | 4.9 | | | | | |
| | Ingersoll-Rand Company Limited | | | 4.7 | | | | | |
| | Yum! Brands, Inc. | | | 4.6 | | | | | |
| | Millea Holdings, Inc. | | | 4.5 | | | | | |
| | Willis Group Holdings Limited | | | 4.4 | | | | | |
| | British Sky Broadcasting Group plc | | | 4.3 | | | | | |
| | KDDI Corporation | | | 3.6 | | | | | |
| | The News Corporation | | | 2.9 | | | | | |
| | Nikko Cordial Corporation | | | 2.5 | | | | | |
| | NTT DoCoMo, Inc. | | | 2.0 | | | | | |
| | Sankyo Co., Ltd. | | | 0.3 | | | | | |
| Cash Reserves | | | | | | | 7.6 | |
| Other Assets and Liabilities, net | | | | | | | (0.4 | ) |
| | | | | | | |
| | | | | | | | 100.0 | % |
| | | | | | | |
PORTFOLIO CHANGES
January 1, 2006 through December 31, 2006
| | | |
| New Holdings | | Eliminations |
| | | |
| Cheung Kong Holdings Limited | | Cemex S.A. de C.V. |
| Dell Inc. | | Molson Coors Brewing Company |
| Ingersoll-Rand Company Limited | | Shaw Communications |
| Nikko Cordial Corporation | | Inc. – Class B |
| Sankyo Co., Ltd. | | SKY Perfect Communications Inc. |
25
International Fund - PORTFOLIO OF INVESTMENTS
at December 31, 2006
| | | | | | | | | | | | | | | | | |
| | | Shares | | | | | | | | | Value | |
| | | | | | | | | | | | | |
| Common Stock 92.8% | | | | | | | | |
| | | | | | | | | Automobiles 5.9% | | | | |
| | | | 1,597,000 | | | | | Renault S.A. (France)(b) | | $ | 191,825,502 | |
| | | | | | | | | Broadcasting and Cable 7.2% | | | | |
| | | | 13,762,000 | | | | | British Sky Broadcasting Group plc (United Kingdom)(b) | | | 140,665,048 | |
| | | | 4,255,140 | | | | | The News Corporation (United States) | | | 94,719,416 | |
| | | | | | | | | | | |
| | | | | | | | | | | | | | | | 235,384,464 | |
| | | | | | | | | | | | | | |
| | | | | | | | | Construction Materials 5.4% | | | | | | | | |
| | | | 5,186,000 | | | | | Cemex S.A.B. de C.V. ADS (Mexico) | | | 175,442,380 | |
| | | | | | | | | Financial Services 2.5% | | | | |
| | | | 6,974,000 | | | | | Nikko Cordial Corporation (Japan) | | | 79,992,521 | |
| | | | | | | | | Food 5.0% | | | | | | | | |
| | | | 454,000 | | | | | Nestle S.A. (Switzerland) | | | 161,331,145 | |
| | | | | | | | | Gaming Machines 0.3% | | | | |
| | | | 152,000 | | | | | Sankyo Co., Ltd. (Japan) | | | 8,417,125 | |
| | | | | | | | | Industrial Machinery 4.7% | | | | | | | | |
| | | | 3,931,000 | | | | | Ingersoll-Rand Company Limited (Bermuda) | | | 153,820,030 | |
| | | | | | | | | Insurance Brokerage 4.4% | | | | |
| | | | 3,586,000 | | | | | Willis Group Holdings Limited (United Kingdom) | | | 142,400,060 | |
| | | | | | | | | Medical and Photo Equipment 6.2% | | | | |
| | | | 6,405,000 | | | | | Olympus Corporation (Japan)(b) | | | 201,291,542 | |
| | | | | | | | | Multi-Industry 10.1% | | | | |
| | | | 13,723,000 | | | | | Cheung Kong Holdings Limited (Hong Kong) | | | 168,928,590 | |
| | | | 4,122,000 | | | | | Vivendi Universal, S.A. (France)(b) | | | 161,104,039 | |
| | | | | | | | | | | |
| | | | | | | | | | | | | | | | 330,032,629 | |
| | | | | | | | | | | | | | |
| | | | | | | | | Property & Casualty Insurance 17.2% | | | | | | | | |
| | | | 910,000 | | | | | Fairfax Financial Holdings Limited (Canada) | | | 180,774,910 | |
| | | | 4,198,000 | | | | | Millea Holdings, Inc. (Japan) | | | 148,158,481 | |
| | | | 28,556,000 | | | | | The NipponKoa Insurance Company, Ltd. (Japan)(b) | | | 231,557,834 | |
| | | | | | | | | | | |
| | | | | | | | | | | | | | | | 560,491,225 | |
| | | | | | | | | | | | | | |
| | | | | | | | | Restaurants 4.6% | | | | | | | | |
| | | | 2,558,000 | | | | | Yum! Brands, Inc. (United States) | | | 150,410,400 | |
See Notes to Financial Statements.
26
International Fund - PORTFOLIO OF INVESTMENTS
at December 31, 2006
| | | | | | | | | | | | | | | | | |
| | | Shares | | | | | | | | | Value | |
| | | | | | | | | | | | | |
| | | | | | | | | Technology 13.7% | | | | | | | | |
| | | | 11,382,751 | | | * | | Dell Inc. (United States) | | $ | 285,593,223 | |
| | | | 1,365,931 | | | | | Koninklijke (Royal) Philips Electronics N.V. (Netherlands) | | | 51,510,888 | |
| | | | 2,889,269 | | | | | Koninklijke (Royal) Philips Electronics N.V. ADR (Netherlands) | | | 108,578,729 | |
| | | | | | | | | | | |
| | | | | | | | | | | | | | | | 445,682,840 | |
| | | | | | | | | | | | | | |
| | | | | | | | | Telecommunications 5.6% | | | | | | | | |
| | | | 17,163 | | | | | KDDI Corporation (Japan) | | | 116,386,211 | |
| | | | 41,647 | | | | | NTT DoCoMo, Inc. (Japan)(b) | | | 65,792,496 | |
| | | | | | | | | | | |
| | | | | | | | | Total Common Stocks (Cost $2,013,659,676) | | | 182,178,707 | |
| | | | | | | | | | | |
| | | | | | | | | | | | | | | | 3,018,700,570 | |
| | | | | | | | | | | | | | |
| | | | | | | | | | | | | | | | | |
| | | Principal | | | | | | | | | |
| | | Amount | | | | | | | | | |
| | | | | | | | | | | | |
| Short-Term Obligations 7.6% | | | | | | | | |
| | | | 149,808,000 | | | | | Repurchase Agreement with State Street Bank, 4.65% due 1/2/07, Repurchase price $149,885,401 (Collateralized by U.S. government securities) | | | 149,808,000 | |
| | | | 100,000,000 | | | | | U.S. Treasury Bills, 4.95%-4.99% due 2-22-07 to 3-22-07 | | | 99,112,722 | |
| | | | | | | | | | | |
| | | | | | | | | Total Short-Term Obligations | | | 248,920,722 | |
| | | | | | | | | | | |
| Total Investments (Cost $2,262,580,398)(a) | | | 100.4 | % | | | 3,267,621,292 | |
| Other Assets and Liabilities, Net | | | (0.4 | ) | | | (13,083,379 | ) |
| | | | | | | |
| Net Assets | | | 100.0 | % | | $ | 3,254,537,913 | |
| | | | | | | |
| Net asset value per share | | | $ 18.91 | |
| | | | | | | | | | | | | | |
* Non-income producing security.
| |
| (a) | Also represents aggregate cost for federal income tax purposes. Net unrealized appreciation of $1,005,040,894 consists of unrealized appreciation and depreciation of $1,043,781,171 and $(38,740,277), respectively. |
| (b) | All or a portion designated as collateral. See Note 8. |
| |
| Note: | Country listed in parenthesis after each company indicates location of headquarters. |
See Notes to Financial Statements.
27
International Fund - PORTFOLIO OF INVESTMENTS
at December 31, 2006
OPEN FORWARD CURRENCY CONTRACTS
| | | | | | | | | | | | | |
| Currency | | | Currency Sold and | | Currency | | | Unrealized | |
| Units Sold | | | Settlement Date | | Market Value | | | Gain(Loss) | |
| | | | | | | | | | |
| | 71,976,000 | | | British Pound 3-23-07 | | $ | 140,968,664 | | | $ | (174,971 | ) |
| | 91,254,000 | | | Euro 3-28-07 | | | 120,926,662 | | | | (222,258 | ) |
| | 5,557,000,000 | | | Japanese Yen 3-20-07 | | | 47,183,693 | | | | 1,715,052 | |
| | 13,892,000,000 | | | Japanese Yen 3-28-07 | | | 118,079,995 | | | | 2,607,713 | |
| | 23,318,901,000 | | | Japanese Yen 5-23-07 | | | 199,614,149 | | | | 4,814,131 | |
| | 34,203,765,000 | | | Japanese Yen 6-22-07 | | | 293,944,093 | | | | (273,921 | ) |
| | | | | | | | | | |
| | | | | | | $ | 920,717,256 | | | $ | 8,465,746 | |
| | | | | | | | | | |
COUNTRY WEIGHTINGS
| | | | | | | | | |
| | | Equity | | | Net | |
| | | Only | | | Assets | |
| | | | | | | |
| Japan | | | 28.2 | % | | | 26.2 | % |
| United States | | | 17.6 | | | | 16.3 | |
| France | | | 11.7 | | | | 10.8 | |
| United Kingdom | | | 9.4 | | | | 8.7 | |
| Canada | | | 6.0 | | | | 5.6 | |
| Mexico | | | 5.8 | | | | 5.4 | |
| Hong Kong | | | 5.6 | | | | 5.2 | |
| Switzerland | | | 5.3 | | | | 5.0 | |
| Netherlands | | | 5.3 | | | | 4.9 | |
| Bermuda | | | 5.1 | | | | 4.7 | |
| | | | | | | |
| | | | 100.0 | % | | | 92.8 | |
| | | | | | | |
| Cash, other assets and liabilities, net | | | | | | | 7.2 | |
| | | | | | | |
| | | | | | | | 100.0 | % |
| | | | | | | |
See Notes to Financial Statements.
28
International Fund - PORTFOLIO OF INVESTMENTS
at December 31, 2006
Intentionally Left Blank
29
Longleaf Partners Funds
STATEMENTS OF ASSETS AND LIABILITIES
at December 31, 2006
| | | | | | | | | | | | | | | |
| | | Partners | | | Small-Cap | | | International | |
| | | Fund | | | Fund | | | Fund | |
| | | | | | | | | | |
| Assets: | | | | | | | | | | | | |
| Investments: | | | | | | | | | | | | |
| | Affiliated securities, at market value (cost $842,484,145, $841,845,310 and $0, respectively) (Note 2 and 7) | | $ | 1,722,589,048 | | | $ | 1,162,939,735 | | | $ | – | |
| | Other securities, at market value (cost $6,726,228,047, $1,907,491,952 and $2,262,580,398, respectively) (Note 2) | | | 9,051,733,218 | | | | 2,324,731,754 | | | | 3,267,621,292 | |
| | | | | | | | | | |
| | | Total Investments | | | 10,774,322,266 | | | | 3,487,671,489 | | | | 3,267,621,292 | |
| Cash | | | 562 | | | | 166 | | | | 350 | |
| Receivable for: | | | | | | | | | | | | |
| | Fund shares sold | | | 24,231,068 | | | | 2,092,504 | | | | 1,774,908 | |
| | Dividends and interest | | | 9,854,582 | | | | 2,182,728 | | | | 1,487,197 | |
| | Securities sold | | | 70,839,618 | | | | 3,536,007 | | | | 38,747,281 | |
| | Forward currency contracts (Note 2) | | | 9,675,157 | | | | – | | | | 8,465,746 | |
| | Foreign tax reclaims | | | 81,247 | | | | – | | | | – | |
| Prepaid assets | | | 178,570 | | | | 70,351 | | | | 67,693 | |
| | | | | | | | | | |
| | | Total Assets | | | 10,889,183,070 | | | | 3,495,553,245 | | | | 3,318,164,467 | |
| | | | | | | | | | |
Liabilities: | | | | | | | | | | | | |
| Payable for: | | | | | | | | | | | | |
| | Securities purchased | | | – | | | | 44,195,939 | | | | 44,448,436 | |
| | Fund shares redeemed | | | 8,869,613 | | | | 1,259,098 | | | | 14,647,907 | |
| | Investment counsel fee (Note 3) | | | 7,055,398 | | | | 2,297,856 | | | | 3,998,314 | |
| | Administration fee (Note 4) | | | 929,396 | | | | 295,057 | | | | 277,399 | |
| Other accrued expenses | | | 734,416 | | | | 220,670 | | | | 254,498 | |
| | | | | | | | | | |
| | | Total Liabilities | | | 17,588,823 | | | | 48,268,620 | | | | 63,626,554 | |
| | | | | | | | | | |
| | | $ | 10,871,594,247 | | | $ | 3,447,284,625 | | | $ | 3,254,537,913 | |
| | | | | | | | | | |
Net Assets: | | | | | | | | | | | | |
| Net assets consist of: | | | | | | | | | | | | |
| | Paid-in capital | | $ | 7,597,616,285 | | | $ | 2,602,918,513 | | | $ | 2,158,723,521 | |
| | Undistributed net investment income | | | 390,177 | | | | – | | | | 137,704 | |
| | Accumulated net realized gain on investments and foreign currency | | | 58,297,525 | | | | 106,031,885 | | | | 82,170,145 | |
| | Unrealized gain on investments and foreign currency | | | 3,215,290,260 | | | | 738,334,227 | | | | 1,013,506,543 | |
| | | | | | | | | | |
| | | Net Assets | | $ | 10,871,594,247 | | | $ | 3,447,284,625 | | | $ | 3,254,537,913 | |
| | | | | | | | | | |
Net asset value per share | | | $34.86 | | | | $30.12 | | | | $18.91 | |
| | | | | | | | | | |
Fund shares issued and outstanding | | | 311,836,665 | | | | 114,450,547 | | | | 172,081,690 | |
See Notes to Financial Statements.
30
Longleaf Partners Funds
STATEMENTS OF OPERATIONS
for the year ended December 31, 2006
| | | | | | | | | | | | | | | | |
| | | Partners | | | Small-Cap | | | International | |
| | | Fund | | | Fund | | | Fund | |
| | | | | | | | | | |
| Investment Income: | | | | | | | | | | | | |
Income: | | | | | | | | | | | | |
| | Dividends from non-affiliates (net of foreign tax withheld of $4,734,894, $388,128 and $3,698,987, respectively) | | $ | 90,861,473 | | | $ | 16,537,847 | | | $ | 42,243,326 | |
| | Dividends from affiliates (net of foreign tax withheld of $283,680, $0, and $0 respectively) (Note 7) | | | 5,964,990 | | | | 16,903,171 | | | | – | |
| | Interest | | | 33,558,586 | | | | 52,604,048 | | | | 9,869,122 | |
| | | | | | | | | | |
| | | | Total income | | | 130,385,049 | | | | 86,045,066 | | | | 52,112,448 | |
| | | | | | | | | | |
Expenses: | | | | | | | | | | | | |
| | Investment counsel fee (Note 3) | | | 73,343,498 | | | | 24,110,700 | | | | 44,680,393 | |
| | Administration fee (Note 4) | | | 9,645,800 | | | | 3,081,427 | | | | 3,074,431 | |
| | Transfer agent fees and expenses | | | 1,983,849 | | | | 586,658 | | | | 633,667 | |
| | Custodian fees and expenses | | | 561,001 | | | | 55,797 | | | | 502,994 | |
| | Prospectus and shareholder reports | | | 641,522 | | | | 141,983 | | | | 153,921 | |
| | Trustees’ fees and expenses | | | 292,665 | | | | 152,665 | | | | 152,665 | |
| | Registration fees | | | 174,057 | | | | 80,677 | | | | 57,554 | |
| | Professional fees | | | 72,103 | | | | 86,978 | | | | 76,103 | |
| | Other | | | 248,864 | | | | 104,281 | | | | 99,888 | |
| | | | | | | | | | |
| | | | Total expenses | | | 86,963,359 | | | | 28,401,166 | | | | 49,431,616 | |
| | | | | | | | | | |
| | | | Net investment income | | | 43,421,690 | | | | 57,643,900 | | | | 2,680,832 | |
| | | | | | | | | | |
Realized and unrealized gain: | | | | | | | | | | | | |
| Net realized gain(loss): | | | | | | | | | | | | |
| | Non-affiliated securities | | | 722,586,329 | | | | 323,099,595 | | | | 244,459,947 | |
| | Affiliated securities (Note 7) | | | – | | | | 33,672,809 | | | | – | |
| | Forward currency contracts | | | (1,943,058 | ) | | | (8,813,560 | ) | | | 4,043,002 | |
| | Foreign currency transactions | | | 14,035 | | | | 29,957 | | | | 147,482 | |
| | | | | | | | | | |
| | | Net gain | | | 720,657,306 | | | | 347,988,801 | | | | 248,650,431 | |
| | | | | | | | | | |
| Change in unrealized appreciation (depreciation): | | | | | | | | |
| | Securities | | | 1,140,423,644 | | | | 233,682,614 | | | | 240,401,949 | |
| | Other assets, liabilities and forwards | | | (2,972,635 | ) | | | 2,119,394 | | | | (5,667,124 | ) |
| | | | | | | | | | |
| | | Change in net unrealized appreciation | | | 1,137,451,009 | | | | 235,802,008 | | | | 234,734,825 | |
| | | | | | | | | | |
| | | Net realized and unrealized gain | | | 1,858,108,315 | | | | 583,790,809 | | | | 483,385,256 | |
| | | | | | | | | | |
Net increase in net assets resulting from operations | | $ | 1,901,530,005 | | | $ | 641,434,709 | | | $ | 486,066,088 | |
| | | | | | | | | | |
See Notes to Financial Statements.
31
Longleaf Partners Funds
STATEMENTS OF CHANGES IN NET ASSETS
| | | | | | | | | | | |
| | | Partners Fund | |
| | | | |
| | | Year ended December 31, | |
| | | | |
| | | 2006 | | | 2005 | |
| | | | | | | |
Operations: | | | | | | | | |
| | Net investment income(loss) | | $ | 43,421,690 | | | $ | 84,075,903 | |
| | Net realized gain from investments and foreign currency transactions | | | 720,657,306 | | | | 243,340,209 | |
| | Net change in unrealized appreciation (depreciation) of securities, other assets, liabilities and forwards | | | 1,137,451,009 | | | | (18,286,831 | ) |
| | | | | | | |
| | | Net increase in net assets resulting from operations | | | 1,901,530,005 | | | | 309,129,281 | |
| | | | | | | |
Distributions to shareholders: | | | | | | | | |
| | From net investment income | | | (44,536,241 | ) | | | (81,831,726 | ) |
| | From net realized gain on investments | | | (755,953,511 | ) | | | (325,057,284 | ) |
| | | | | | | |
| | | Net decrease in net assets resulting from distributions | | | (800,489,752 | ) | | | (406,889,010 | ) |
| | | | | | | |
Capital share transactions (Note 6): | | | | | | | | |
| | Net proceeds from sale of shares | | | 1,396,022,350 | | | | 928,952,979 | |
| | Net asset value of shares issued to shareholders for reinvestment of shareholder distributions | | | 730,065,307 | | | | 370,526,435 | |
| | Cost of shares redeemed | | | (1,134,738,762 | ) | | | (1,421,979,891 | ) |
| | | | | | | |
| | | Net increase(decrease) in net assets from fund share transactions | | | 991,348,895 | | | | (122,500,477 | ) |
| | | | | | | |
| | | Total increase(decrease) in net assets | | | 2,092,389,148 | | | | (220,260,206 | ) |
Net assets: | | | | | | | | |
| | Beginning of year | | | 8,779,205,099 | | | | 8,999,465,305 | |
| | | | | | | |
| | End of year | | $ | 10,871,594,247 | | | $ | 8,779,205,099 | |
| | | | | | | |
| | Undistributed net investment income (loss) included in net assets at end of period | | | $390,177 | | | | $1,490,693 | |
See Notes to Financial Statements.
32
Longleaf Partners Funds
STATEMENTS OF CHANGES IN NET ASSETS
| | | | | | | | | | | | | | | |
| Small-Cap Fund | | | International Fund | |
| | | | | |
| Year ended December 31, | | | Year ended December 31, | |
| | | | | |
| 2006 | | | 2005 | | | 2006 | | | 2005 | |
| | | | | | | | | | | |
| $ | 57,643,900 | | | $ | 58,829,578 | | | $ | 2,680,832 | | | $ | (1,317,734 | ) |
| | 347,988,801 | | | | 243,426,514 | | | | 248,650,431 | | | | 210,717,920 | |
| | 235,802,008 | | | | (28,734,689 | ) | | | 234,734,825 | | | | 115,480,390 | |
| | | | | | | | | | | |
| | 641,434,709 | | | | 273,521,403 | | | | 486,066,088 | | | | 324,880,576 | |
| | | | | | | | | | | |
| | (58,705,003 | ) | | | (58,057,866 | ) | | | (2,515,258 | ) | | | – | |
| | (251,956,686 | ) | | | (450,808,249 | ) | | | (221,996,422 | ) | | | (30,392,470 | ) |
| | | | | | | | | | | |
| | (310,661,689 | ) | | | (508,866,115 | ) | | | (224,511,680 | ) | | | (30,392,470 | ) |
| | | | | | | | | | | |
| | 391,956,726 | | | | 385,120,467 | | | | 458,350,467 | | | | 405,945,388 | |
| | 283,662,236 | | | | 467,477,965 | | | | 206,854,594 | | | | 27,692,238 | |
| | (371,649,902 | ) | | | (478,553,991 | ) | | | (552,951,103 | ) | | | (427,030,964 | ) |
| | | | | | | | | | | |
| | 303,969,060 | | | | 374,044,441 | | | | 112,253,958 | | | | 6,606,662 | |
| | | | | | | | | | | |
| | 634,742,080 | | | | 138,699,729 | | | | 373,808,366 | | | | 301,094,768 | |
| | 2,812,542,545 | | | | 2,673,842,816 | | | | 2,880,729,547 | | | | 2,579,634,779 | |
| | | | | | | | | | | |
| $ | 3,447,284,625 | | | $ | 2,812,542,545 | | | $ | 3,254,537,913 | | | $ | 2,880,729,547 | |
| | | | | | | | | | | |
| | $ – | | | | $1,031,145 | | | | $137,704 | | | | $(175,352 | ) |
| | | | | | | | | | | |
See Notes to Financial Statements.
33
Longleaf Partners Funds
STATEMENTS OF CHANGES IN NET ASSETS
Longleaf Partners Funds
NOTES TO FINANCIAL STATEMENTS
Note 1. Organization
The Longleaf Partners Fund, Longleaf Partners Small-Cap Fund, and Longleaf Partners International Fund (the “Funds”) are non-diversified and each is a series of Longleaf Partners Funds Trust, a Massachusetts business trust, which is registered as an open-end management investment company under the Investment Company Act of 1940, as amended.
Note 2. Significant Accounting Policies
Management Estimates
The accompanying financial statements are prepared in accordance with accounting principles generally accepted in the United States of America; these principles may require the use of estimates by Fund management. Actual results could differ from those estimates.
Security Valuation
Portfolio securities listed or traded on a securities exchange (U.S. or foreign), on the NASDAQ national market, or any representative quotation system providing same day publication of actual prices, are valued at the last sale price. If there are no transactions in the security that day, securities are valued at the midpoint between the closing bid and ask prices or, if there are no such prices, the prior day’s close.
In the case of bonds and other fixed income securities, valuations may be furnished by a pricing service which takes into account factors in addition to quoted prices (such as trading characteristics, yield, quality, coupon rate, maturity, type of issue, and other market data relating to the priced security or other similar securities) where taking such factors into account would lead to a more accurate reflection of the fair market value of such securities.
When market quotations are not readily available, valuations of portfolio securities may be determined in accordance with procedures established by and under the general supervision of the Funds’ Trustees. In determining fair value, the Board considers all relevant qualitative and quantitative information available including news regarding significant market or security specific events. The Board may also utilize a service provided by an independent third party to assist in fair valuation of certain securities. These factors are subject to change over time and are reviewed periodically. Because the utilization of fair value depends on market activity, the frequency with which fair valuation may be used cannot be predicted. Estimated values may differ from the values that would have been used had a ready market for the investment existed.
34
Repurchase agreements are valued at cost which, combined with accrued interest, approximates market value. Short-term U.S. Government obligations are valued at amortized cost which approximates current market value.
The Funds determine net asset values (“NAVs”) once a day, at the close of regular trading on the New York Stock Exchange (usually at 4:00 p.m. Eastern time) on days the Exchange is open for business. The Exchange is closed for specified national holidays and on weekends. Foreign securities are generally priced at the latest market close in the foreign market, which may be at different times or days than the close of the New York Stock Exchange. If events occur which could materially affect the NAV between the close of the foreign market and normal pricing at the close of the New York Stock Exchange, foreign securities may be fair valued as determined by the Board of Trustees, consistent with any regulatory guidelines.
Accounting for Investments
For financial reporting purposes, the Funds record security transactions on trade date. Realized gains and losses on security transactions are determined using the specific identification method. Dividend income is recognized on the ex-dividend date, except that certain dividends from foreign securities are recorded as soon after the ex-dividend date as the Fund is able to obtain information on the dividend. Interest income and Fund expenses are recognized on an accrual basis.
Distributions to Shareholders
Dividends and distributions to shareholders are recorded on the ex-dividend date.
Federal Income Taxes
The Funds’ policy is to comply with the requirements of the Internal Revenue Code that are applicable to regulated investment companies and to distribute substantially all taxable income to shareholders. Accordingly, no federal income tax provision is required. The Funds intend to make any required distributions to avoid the application of a 4% nondeductible excise tax. Distributions are determined in accordance with income tax regulations which may differ from generally accepted accounting principles. Reclassifications are made within the Funds’ capital accounts to reflect income and gains available for distribution under income tax regulations.
Foreign Currency Translations
The books and records of the Funds are maintained in U.S. dollars. Securities denominated in currencies other than U.S. dollars are subject to changes in value due to fluctuations in exchange rates. Purchases and sales of securities and income and expenses are translated into U.S. dollars at the prevailing exchange rate on the respective date of each transaction. The market values of investment securities, assets and liabilities are translated into U.S. dollars daily.
The Funds do not isolate the portion of net realized and unrealized gains or losses in equity security investments which are attributable to changes in foreign
35
exchange rates. Accordingly, the impact of such changes is included in the realized and unrealized gains or losses on the underlying equity securities.
Forward Currency Contracts
Forward currency contracts are commitments to purchase or sell a foreign currency at a future maturity date. The resulting obligation is marked-to-market daily using foreign currency exchange rates supplied by an independent pricing service. An unrealized gain or loss is recorded for the difference between the contract opening value and its current value. When a contract is closed or delivery is taken, this gain or loss is realized. For federal tax purposes, gain or loss on open forward contracts are treated as realized and are subject to distribution at our excise tax year-end date.
Risk of Forward Currency Contracts
The Funds generally use forward currency contracts for hedging purposes to offset currency exposure in portfolio holdings. Each Fund may seek to hedge foreign currency exposure to the full extent of its investment in foreign securities, but there is no requirement that all foreign securities be hedged. Forward contracts may reduce the potential gain from a positive change in the relationship between the U.S. dollar and foreign currencies or, considered separately, may produce a loss. Where a liquid secondary market for forwards does not exist, the Funds may not be able to close their positions and in such an event, the loss is theoretically unlimited.
Repurchase Agreements
The Funds may engage in repurchase agreement transactions. The Funds’ custodian bank sells U.S. government or agency securities to each Fund under agreements to repurchase these securities at a stated repurchase price including interest for the term of the agreement, which is usually overnight or over a weekend. Each Fund, through its custodian, receives delivery of the underlying U.S. government or agency securities as collateral, whose market value is required to be at least equal to the repurchase price. If the custodian becomes bankrupt, the Fund might be delayed, or may incur costs or possible losses of principal and income, in selling the collateral.
New Accounting Pronouncements
On July 13, 2006, the Financial Accounting Standards Board (“FASB”) released FASB Interpretation No. 48, “Accounting for Uncertainty in Income Taxes” (“FIN 48”). FIN 48 provides guidance for how uncertain tax positions should be recognized, measured, presented and disclosed in the financial statements. FIN 48 requires the evaluation of tax positions taken or expected to be taken in the course of preparing the Fund’s tax returns to determine whether the tax positions are “more-likely-than-not” of being sustained by the applicable tax authority. Tax positions not deemed to meet the more-likely-than-not threshold would be recorded as a tax benefit or expense in the current year. Adoption of FIN 48 is
36
required for fiscal years beginning after December 15, 2006 and is to be applied to all open tax years as of the effective date. At this time, management is evaluating the implications of FIN 48. The standard is not expected to materially impact the Funds’ financial statements.
On September 15, 2006, the FASB released Statement of Financial Accounting Standards No. 157 (“FAS 157”) Fair Value Measurements which provides enhanced guidance for using fair value to measure assets and liabilities. The standard requires companies to provide expanded information about the assets and liabilities measured at fair value and the potential effect of these fair valuations on an entity’s financial performance. The standard does not expand the use of fair value in any new circumstances, but provides clarification on acceptable fair valuation methods and applications. Adoption of FAS 157 is required for fiscal years beginning after November 15, 2007. The standard is not expected to materially impact the Funds’ financial statements.
Note 3. Investment Counsel Agreement
Southeastern Asset Management, Inc. (“Southeastern”) serves as Investment Counsel to the Funds and receives annual compensation, computed daily and paid monthly, in accordance with the following schedule for the Partners Fund and Small-Cap Fund:
| | | | | |
| First $400 million of average daily net assets | | | 1.00 | % |
| In excess of $400 million | | | .75 | % |
For the Partners and Small-Cap Funds, Southeastern has agreed to reduce its fees on a pro rata basis to the extent that each Fund’s normal annual operating expenses (excluding taxes, interest, brokerage fees, and extraordinary expenses) exceed 1.5% of average annual net assets. No such reductions were necessary for the current year.
The International Fund fee is calculated in accordance with the following schedule:
| | | | | |
| First $2.5 billion of average daily net assets | | | 1.50 | % |
| In excess of $2.5 billion | | | 1.25 | % |
For this Fund, Southeastern has agreed to reduce its fees on a pro rata basis to the extent that the Fund’s normal annual operating expenses (excluding taxes, interest, brokerage fees, and extraordinary expenses) exceed 1.75% of average annual net assets. No reduction was necessary for the current year.
Note 4. Fund Administrator
Southeastern also serves as the Fund Administrator and in this capacity is responsible for managing, performing or supervising the administrative and business operations of the Funds. Functions include the preparation of all registration statements, prospectuses, proxy statements, daily valuation of the portfolios and calculation of daily net asset values per share. The Funds pay a fee
37
as compensation for these services, accrued daily and paid monthly, of 0.10% per annum of average daily net assets.
Note 5. Investment Transactions
Purchases and sales of equity securities and corporate bonds for the period (excluding short-term obligations) are summarized below:
| | | | | | | | | |
| | | Purchases | | | Sales | |
| | | | | | | |
| Partners Fund | | $ | 1,795,961,775 | | | $ | 2,133,584,917 | |
| Small-Cap Fund | | | 965,712,410 | | | | 1,011,234,931 | |
| International Fund | | | 692,777,449 | | | | 698,810,092 | |
Note 6. Shares of Beneficial Interest
Each Fund is authorized to issue unlimited shares of beneficial interest with no par value. Transactions in shares of beneficial interest were as follows:
| | | | | | | | | | | | | |
| | | Year ended December 31, 2006 | |
| | | | |
| | | Partners | | | Small-Cap | | | International | |
| | | Fund | | | Fund | | | Fund | |
| | | | | | | | | | |
| Shares sold | | | 41,199,929 | | | | 13,734,861 | | | | 25,195,194 | |
| Reinvestment of shareholder distributions | | | 21,037,467 | | | | 9,437,163 | | | | 11,336,092 | |
| Shares redeemed | | | (33,891,867 | ) | | | (12,797,782 | ) | | | (30,402,886 | ) |
| | | | | | | | | | |
| | | | 28,345,529 | | | | 10,374,242 | | | | 6,128,400 | |
| | | | | | | | | | |
| | | | | | | | | | | | | |
| | | Year ended December 31, 2005 | |
| | | | |
| | | Partners | | | Small-Cap | | | International | |
| | | Fund | | | Fund | | | Fund | |
| | | | | | | | | | |
| Shares sold | | | 29,716,877 | | | | 13,109,002 | | | | 25,083,276 | |
| Reinvestment of shareholder distributions | | | 11,980,119 | | | | 17,551,992 | | | | 1,647,367 | |
| Shares redeemed | | | (45,564,127 | ) | | | (16,170,526 | ) | | | (26,645,660 | ) |
| | | | | | | | | | |
| | | | (3,867,131 | ) | | | 14,490,468 | | | | 84,983 | |
| | | | | | | | | | |
38
Note 7. Affiliated Issuer
Under Section 2(a)(3) of the Investment Company Act of 1940, a portfolio company is defined as “affiliated” if a Fund owns five percent or more of its voting stock. Each Fund held at least five percent of the outstanding voting stock of the following companies during the year ended December 31, 2006:
| | | | | | | | | | | | | | |
| | | | | Market Value | |
| | | | | | |
| | | Shares(a) at | | | December 31, | |
| | | December 31, | | | | |
| | | 2006 | | | 2006 | | | 2005 | |
| | | | | | | | | | |
Partners Fund | | | | | | | | | | | | |
| | Level 3 Communications, Inc.* | | | 81,029,000 | | | $ | 453,762,400 | | | $ | 232,553,230 | |
| | Level 3 Communications, Inc.
10% Convertible Senior Notes due 5-1-11 (Note 8) | | | 222,079,000 | (b) | | | 403,628,583 | | | | 235,102,601 | |
| | The NipponKoa Insurance Company, Ltd. | | | 63,701,000 | | | | 516,545,229 | | | | 510,969,144 | |
| | Pioneer Natural Resources Company | | | 8,784,400 | | | | 348,652,836 | | | | 450,376,188 | |
| | | | | | | | | | |
| | | | | | | | 1,722,589,048 | | | | 1,429,001,163 | |
| | | | | | | | | | |
Small-Cap Fund | | | | | | | | | | | | |
| | Deltic Timber Corporation | | | – | | | | – | | | | 55,075,320 | |
| | Hilb Rogal & Hobbs Company | | | 3,526,400 | | | | 148,531,968 | | | | 135,801,664 | |
| | IHOP Corp. | | | 2,978,100 | | | | 156,945,870 | | | | 139,702,671 | |
| | Jacuzzi Brands, Inc.* | | | 14,609,800 | | | | 181,599,814 | | | | 122,722,320 | |
| | Potlatch Corporation | | | 3,702,022 | | | | 162,222,604 | | | | 28,140,960 | |
| | Ruddick Corporation | | | 4,823,500 | | | | 133,852,125 | | | | 86,603,216 | |
| | Service Corporation International | | | 16,719,400 | | | | 171,373,850 | | | | 125,041,934 | |
| | Texas Industries, Inc. | | | 3,244,800 | | | | 208,413,504 | | | | – | |
| | | | | | | | | | |
| | | | | | | $ | 1,162,939,735 | | | $ | 693,088,085 | |
| | | | | | | | | | |
Purchases, sales and income for these affiliates for the year ended December 31, 2006 were as follows:
| | | | | | | | | | | | | | |
| | | | | | | Dividend | |
| | | | | | | or Interest | |
| | | Purchases | | | Sales | | | Income(c) | |
| | | | | | | | | | |
Partners Fund | | | | | | | | | | | | |
| | Level 3 Communications, Inc.* | | $ | – | | | $ | – | | | $ | – | |
| | Level 3 Communications, Inc.
10% Convertible Senior Notes due 5-1-11 (Note 8) | | | – | | | | – | | | | 22,207,900 | (d) |
| | The NipponKoa Insurance Company, Ltd. | | | – | | | | – | | | | 3,768,890 | |
| | Pioneer Natural Resources Company | | | – | | | | – | | | | 2,196,100 | |
| | | | | | | | | | |
| | | $ | – | | | $ | – | | | $ | 28,172,890 | |
| | | | | | | | | | |
39
| | | | | | | | | | | | | | |
| | | | | | | Dividend | |
| | | | | | | or Interest | |
| | | Purchases | | | Sales | | | Income(c) | |
| | | | | | | | | | |
Small-Cap Fund | | | | | | | | | | | | |
| | Deltic Timber Corporation | | $ | – | | | $ | 54,080,423 | | | $ | – | |
| | Hilb Rogal & Hobbs Company | | | – | | | | – | | | | 1,675,040 | |
| | IHOP Corp | | | – | | | | – | | | | 2,978,100 | |
| | Jacuzzi Brands, Inc.* | | | – | | | | – | | | | – | |
| | Potlatch Corporation | | | 118,395,793 | | | | – | | | | 8,362,799 | |
| | Ruddick Corporation | | | 16,966,411 | | | | – | | | | 1,974,874 | |
| | Service Corporation International | | | 15,569,232 | | | | 5,203,376 | | | | 1,668,998 | |
| | Texas Industries, Inc. | | | 149,945,938 | | | | – | | | | 243,360 | |
| | | | | | | | | | |
| | | $ | 300,877,374 | | | $ | 59,283,799 | | | $ | 16,903,171 | |
| | | | | | | | | | |
* Non-income producing
| |
| (a) | Common stock unless otherwise noted. |
| (b) | Principal amount. |
| (c) | Dividend income unless otherwise noted. |
| (d) | Interest income. |
Note 8. Collateral
Securities with the following aggregate value were segregated to collateralize forward currency contracts at December 31, 2006:
| | | | | |
| Partners Fund | | $ | 1,007,372,874 | |
| International Fund | | | 948,384,270 | |
Note 9. Related Ownership
At December 31, 2006, officers, employees of Southeastern and their families, Fund trustees, the Southeastern retirement plan and other affiliates owned more than 5% of the following Funds:
| | | | | | | | | |
| | | Shares Owned | | | Percent of Fund | |
| | | | | | | |
| Small-Cap Fund | | | 8,708,362 | | | | 7.6 | % |
| International Fund | | | 12,250,598 | | | | 7.1 | |
Note 10. Federal Income Taxes
Required fund distributions are based on income and capital gain amounts determined in accordance with federal income tax regulations, which differ from net investment income and realized gains recognized for financial reporting purposes. Accordingly, the character of distributions and composition of net assets for tax purposes differ from those reflected in the accompanying financial statements.
40
Distributions were subject to tax as follows:
| | | | | | | | | | | | | |
| | | Year ended December 31, 2006 | |
| | | | |
| | | Partners | | | Small-Cap | | | International | |
| | | | | | | | | | |
| Long-term capital gains | | $ | 735,213,067 | | | $ | 243,760,334 | | | $ | 216,431,625 | |
| Ordinary income | | | 65,276,685 | | | | 66,901,355 | | | | 8,080,055 | |
| | | | | | | | | | |
| | | $ | 800,489,752 | | | $ | 310,661,689 | | | $ | 224,511,680 | |
| | | | | | | | | | |
| | | | | | | | | | | | | |
| | | Year ended December 31, 2005 | |
| | | | |
| | | Partners | | | Small-Cap | | | International | |
| | | | | | | | | | |
| Long-term capital gains | | $ | 275,472,275 | | | $ | 450,808,249 | | | $ | 30,392,470 | |
| Ordinary income | | | 131,416,735 | | | | 58,057,866 | | | | – | |
| | | | | | | | | | |
| | | $ | 406,889,010 | | | $ | 508,866,115 | | | $ | 30,392,470 | |
| | | | | | | | | | |
The tax-basis components of net assets at December 31, 2006 were as follows:
| | | | | | | | | | | | | |
| | | Partners | | | Small-Cap | | | International | |
| | | | | | | | | | |
| Unrealized appreciation | | $ | 3,656,249,568 | | | $ | 738,334,227 | | | $ | 1,043,781,171 | |
| Unrealized depreciation | | | (471,595,001 | ) | | | (319,969 | ) | | | (38,740,374 | ) |
| | | | | | | | | | |
| Net unrealized appreciation | | | 3,184,654,567 | | | | 738,014,258 | | | | 1,005,040,797 | |
| Undistributed long-term capital gains | | | 87,438,107 | | | | 105,777,223 | | | | 86,966,387 | |
| Undistributed ordinary income | | | 1,885,288 | | | | 574,631 | | | | 3,807,208 | |
| Paid-in capital | | | 7,597,616,285 | | | | 2,602,918,513 | | | | 2,158,723,521 | |
| | | | | | | | | | |
| | | $ | 10,871,594,247 | | | $ | 3,447,284,625 | | | $ | 3,254,537,913 | |
| | | | | | | | | | |
The following permanent reclassifications were made between capital accounts to reflect the tax character of foreign currency transactions. These reclassifications did not affect results of operations or net assets.
| | | | | | | | | | | | | |
| | | Partners | | | Small-Cap | | | International | |
| | | | | | | | | | |
| Undistributed net investment income | | $ | 14,035 | | | $ | 29,958 | | | $ | 147,482 | |
| Accumulated net realized gain on investments and foreign currency | | | (14,035 | ) | | | (29,958 | ) | | | (147,482 | ) |
41
Longleaf Partners Funds
FINANCIAL HIGHLIGHTS
The presentation is for a share outstanding throughout each period.
| | | | | | | | | | | | | | | | | | | | | | | | | | |
| | | | | | | Net | | | | | | | |
| | | | | | | Gains | | | | | | | |
| | | Net | | | | | (Losses) on | | | | | | | Distri- | |
| | | Asset | | | Net | | | Securities | | | Total | | | Dividends | | | butions | |
| | | Value | | | Investment | | | Realized | | | From | | | from Net | | | from | |
| | | Beginning | | | Income | | | and | | | Investment | | | Investment | | | Capital | |
| | | of Period | | | (Loss) | | | Unrealized | | | Operations | | | Income | | | Gains | |
| | | | | | | | | | | | | | | | | | | |
Partners Fund | | | | | | | | | | | | | | | | | | | | | | | | |
| Year ended December 31, | | | | | | | | | | | | | | | | | | | | | | | | |
| | 2006 | | $ | 30.97 | | | $ | .14 | | | $ | 6.53 | | | $ | 6.67 | | | $ | (.14 | ) | | $ | (2.64 | ) |
| | 2005 | | | 31.32 | | | | .29 | | | | .83 | | | | 1.12 | | | | (.29 | ) | | | (1.18 | ) |
| | 2004 | | | 29.98 | | | | .07 | | | | 2.05 | | | | 2.12 | | | | (.15 | ) | | | (.63 | ) |
| | 2003 | | | 22.24 | | | | .08 | | | | 7.66 | | | | 7.74 | | | | – | | | | – | |
| | 2002 | | | 24.51 | | | | .04 | | | | (2.08 | ) | | | (2.04 | ) | | | (.04 | ) | | | (.14 | ) |
Small-Cap Fund | | | | | | | | | | | | | | | | | | | | | | | | |
| Year ended December 31, | | | | | | | | | | | | | | | | | | | | | | | | |
| | 2006 | | | 27.02 | | | | .50 | | | | 5.49 | | | | 5.99 | | | | (.56 | ) | | | (2.33 | ) |
| | 2005 | | | 29.85 | | | | .58 | | | | 2.43 | | | | 3.01 | | | | (.57 | ) | | | (5.27 | ) |
| | 2004 | | | 28.81 | | | | .42 | | | | 3.75 | | | | 4.17 | | | | (.43 | ) | | | (2.70 | ) |
| | 2003 | | | 20.33 | | | | .45 | | | | 8.47 | | | | 8.92 | | | | (.44 | ) | | | – | |
| | 2002 | | | 21.68 | | | | .52 | | | | (1.32 | ) | | | (0.80 | ) | | | (.53 | ) | | | (.02 | ) |
International Fund | | | | | | | | | | | | | | | | | | | | | | | | |
| Year ended December 31, | | | | | | | | | | | | | | | | | | | | | | | | |
| | 2006 | | | 17.36 | | | | .02 | | | | 2.89 | | | | 2.91 | | | | (.01 | ) | | | (1.35 | ) |
| | 2005 | | | 15.55 | | | | (.01 | ) | | | 2.01 | | | | 2.00 | | | | – | | | | (.19 | ) |
| | 2004 | | | 14.11 | | | | (.08 | ) | | | 1.52 | | | | 1.44 | | | | – | | | | – | |
| | 2003 | | | 9.97 | | | | (.07 | ) | | | 4.21 | | | | 4.14 | | | | – | | | | – | |
| | 2002 | | | 12.34 | | | | (.06 | ) | | | (1.99 | ) | | | (2.05 | ) | | | – | | | | (.32 | ) |
| |
| (a) | Total return reflects the rate that an investor would have earned on investment in the Fund during each period, assuming reinvestment of all distributions. |
| |
| (b) | Expenses presented include dividend expense and brokerage fees for short-sales. The operating expense ratio was 1.69% (Note 3). |
42
Longleaf Partners Funds
FINANCIAL HIGHLIGHTS
| | | | | | | | | | | | | | | | | | | | | | | | | | | | | | | |
| | | | | | | | | | | | | Ratio of | | | |
| | | | | | | | | | | Ratio of | | | Net | | | |
| | | | | Net | | | | | | | Expenses | | | Investment | | | |
| | | | | Asset | | | | | Net Assets | | | to | | | Income | | | |
| Return | | | Total | | | Value | | | | | End of | | | Average | | | (Loss) to | | | Portfolio | |
| of | | | Distri- | | | End of | | | Total | | | Period | | | Net | | | Average | | | Turnover | |
| Capital | | | butions | | | Period | | | Return(a) | | | (thousands) | | | Assets | | | Net Assets | | | Rate | |
| | | | | | | | | | | | | | | | | | | | | | | |
| $ | – | | | $ | (2.78 | ) | | $ | 34.86 | | | | 21.63 | % | | $ | 10,871,594 | | | | .90 | % | | | .45 | % | | | 18.98 | % |
| | – | | | | (1.47 | ) | | | 30.97 | | | | 3.62 | | | | 8,779,205 | | | | .91 | | | | .95 | | | | 6.64 | |
| | – | | | | (.78 | ) | | | 31.32 | | | | 7.14 | | | | 8,999,465 | | | | .90 | | | | .28 | | | | 13.38 | |
| | – | | | | – | | | | 29.98 | | | | 34.80 | | | | 7,668,968 | | | | .91 | | | | .32 | | | | 7.37 | |
| | (.05 | ) | | | (.23 | ) | | | 22.24 | | | | (8.34 | ) | | | 4,787,662 | | | | .91 | | | | .17 | | | | 19.57 | |
| | – | | | | (2.89 | ) | | | 30.12 | | | | 22.33 | | | | 3,447,285 | | | | .92 | | | | 1.87 | | | | 34.45 | |
| | – | | | | (5.84 | ) | | | 27.02 | | | | 10.75 | | | | 2,812,543 | | | | .93 | | | | 2.21 | | | | 17.28 | |
| | – | | | | (3.13 | ) | | | 29.85 | | | | 14.78 | | | | 2,673,843 | | | | .93 | | | | 1.52 | | | | 31.04 | |
| | – | | | | (.44 | ) | | | 28.81 | | | | 43.85 | | | | 2,365,085 | | | | .95 | | | | 1.89 | | | | 4.44 | |
| | – | | | | (.55 | ) | | | 20.33 | | | | (3.74 | ) | | | 1,677,194 | | | | .95 | | | | 2.43 | | | | 16.91 | |
| | – | | | | (1.36 | ) | | | 18.91 | | | | 17.07 | | | | 3,254,538 | | | | 1.61 | | | | .09 | | | | 24.30 | |
| | – | | | | (.19 | ) | | | 17.36 | | | | 12.88 | | | | 2,880,730 | | | | 1.64 | | | | (.05 | ) | | | 16.93 | |
| | – | | | | – | | | | 15.55 | | | | 10.21 | | | | 2,579,635 | | | | 1.66 | | | | (.57 | ) | | | 18.86 | |
| | – | | | | – | | | | 14.11 | | | | 41.52 | | | | 1,923,581 | | | | 1.68 | | | | (.68 | ) | | | 10.18 | |
| | – | | | | (.32 | ) | | | 9.97 | | | | (16.51 | ) | | | 1,086,714 | | | | 1.80 | (b) | | | (.68 | ) | | | 15.86 | |
43
Longleaf Partners Funds
REPORT OF INDEPENDENT REGISTERED
PUBLIC ACCOUNTING FIRM
To the Board of Trustees and Shareholders of Longleaf Partners Funds Trust:
In our opinion, the accompanying statements of assets and liabilities, including the portfolios of investments, and the related statements of operations and of changes in net assets and the financial highlights present fairly, in all material respects, the financial position of Longleaf Partners Funds Trust (comprised of Longleaf Partners Fund, Longleaf Partners Small-Cap Fund, and Longleaf Partners International Fund, hereafter referred to as the “Funds”) at December 31, 2006, and the results of each of their operations for the year then ended, and the changes in each of their net assets for each of the two years in the period then ended and the financial highlights for the periods presented, in conformity with accounting principles generally accepted in the United States of America. These financial statements and financial highlights (hereafter referred to as “financial statements”) are the responsibility of the Funds’ management; our responsibility is to express an opinion on these financial statements based on our audits. We conducted our audits of these financial statements in accordance with the standards of the Public Company Accounting Oversight Board (United States.) Those standards require that we plan and perform the audit to obtain reasonable assurance about whether the financial statements are free of material misstatement. An audit includes examining, on a test basis, evidence supporting the amounts and disclosures in the financial statements, assessing the accounting principles used and significant estimates made by management, and evaluating the overall financial statement presentation. We believe that our audits, which included confirmation of securities at December 31, 2006 by correspondence with the custodian and brokers, provide a reasonable basis for our opinion.
PricewaterhouseCoopers LLP
Baltimore, Maryland
February 2, 2007
44
Longleaf Partners Funds
STATEMENT REGARDING BASIS FOR APPROVAL OF
INVESTMENT ADVISORY CONTRACTS
Longleaf Partners Fund, Longleaf Partners Small-Cap Fund, and Longleaf Partners International Fund (the “Funds”) are non-diversified and each is a series of Longleaf Partners Funds Trust, a Massachusetts business trust which is an open-end management investment company registered with the US Securities and Exchange Commission. Southeastern Asset Management, Inc. (“Southeastern”) acts as investment counsel and fund administrator under agreements with each Fund (the “Agreements”). Trustees for each Fund, including Trustees who are not “interested persons” of the Funds as that term is defined under the Investment Company Act of 1940, as amended (the “Independent Trustees”), are responsible for overseeing the performance of Southeastern and meet annually to review information specific to each Fund to determine whether or not the Agreements with Southeastern ought to be approved.
On September 12, 2006, Trustees for each Fund met to determine whether the Agreements with Southeastern should be approved for the period November 1, 2006 to October 31, 2007. In advance of the meeting, the Independent Trustees reviewed materials relating to the existing Agreements, including an independent expense and performance summary prepared by Lipper Inc. The Lipper materials included comparisons of each Fund with other funds in a comparable Lipper universe, as well as additional funds selected for comparison by the Independent Trustees. Trustees reviewed this comparative Lipper data regarding management and non-management fees and expenses, portfolio turnover, brokerage commissions, investment performance and long-term performance in light of total fund expenses (the “Lipper Data”). Other materials reviewed included information concerning the nature, extent and quality of Southeastern’s services, Southeastern’s profitability and financial results, including advisory fee revenue and separate account advisory fee schedules, and whether economies of scale are, or would be, shared with Fund investors as assets under management increase. Based on the information reviewed, as well as information received throughout the year and first-hand interaction with Southeastern’s personnel, the Trustees for each Fund unanimously approved the selection of Southeastern as adviser and administrator, and the amounts to be paid by each Fund under Agreements with Southeastern.
In considering the Agreements, the Trustees did not identify any single factor as all-important or controlling, and each Trustee may have weighed various factors differently. The following summary does not detail all the factors considered, but discusses the material factors and the Trustees’ conclusions.
45
Longleaf Partners Funds
STATEMENT REGARDING BASIS FOR APPROVAL OF
INVESTMENT ADVISORY CONTRACTS
Nature, Extent and Quality of Services Provided
While the investment performance of each Fund and Southeastern (discussed below) is relevant to an evaluation of the nature, extent and quality of services provided, the Trustees also considered Southeastern’s governing principles as significant. These principles are stated at the beginning of the Funds’ Prospectus:
| |
| • | We will treat your investment in Longleaf as if it were our own. |
| • | We will remain significant investors with you in Longleaf. |
| • | We will invest for the long-term, while striving to maximize returns and minimize business, financial, purchasing power, regulatory and market risks. |
| • | We will choose our equity investments based on their discounts from our appraisals of their corporate intrinsic values, their financial strengths, their managements, their competitive positions, and our assessment of their future earnings potential. |
| • | We will concentrate our assets in our best ideas. |
| • | We will not impose loads, exit fees or 12b-1 charges on our investment partners(1). |
| • | We will consider closing the Funds to new investors if closing would benefit existing shareholders. |
| • | We will discourage short-term speculators and market timers from joining us, the long-term investors in Longleaf. |
| • | We will continue our efforts to enhance shareholder services. |
| • | We will communicate with our investment partners as candidly as possible. |
The Trustees concluded that Southeastern had been successful in operating each Fund under these governing principles, and that Longleaf shareholders had significantly benefited from Southeastern’s successful execution of its investment discipline, as well as its shareholder oriented approach. The Trustees looked favorably on Southeastern’s unique Code of Ethics requirement that employees use Longleaf for virtually all public equity investing. The Trustees noted that, as one of the largest shareholder groups, Southeastern and its affiliates’ interests are aligned with other shareholders, facing the same risks, paying the same fees, and sharing the same motivation to achieve positive absolute returns. In addition, significant investment by Southeastern’s personnel has contributed to the economies of scale which have lowered fees and expenses for shareholders over time.
(1) This principle does not preclude a redemption fee (payable to the Funds) for short-term trades if the Funds’ Trustees determine a fee would be necessary or appropriate to discourage short-term speculators and market timers.
46
Longleaf Partners Funds
STATEMENT REGARDING BASIS FOR APPROVAL OF
INVESTMENT ADVISORY CONTRACTS
The Trustees recognized that the Longleaf name possesses significant goodwill because of Southeastern’s consistent implementation of the governing principles, noting that Southeastern and the Funds had continued to receive recognition in the press, and among industry observers and participants, for the quality of its investment process, as well as its shareholder orientation and integrity. The Trustees expressed confidence in the research, analysis, knowledge and 30-years’ experience of Southeastern. The Trustees concluded that shareholders buy the Funds primarily to gain access to Southeastern’s investment expertise and shareholder orientation, and weighed this favorably in approving the Agreements.
Trustees concluded that Southeastern’s administrative services, including fund accounting, legal, trading, shareholder reporting, compliance and oversight of Fund operations, had been high quality, and favored approving Southeastern for another year. Trustees concluded that Southeastern had been open, responsive, timely and cooperative in providing information required to oversee the Funds.
Comparative Investment Performance of the Funds and Adviser
Using the Lipper Data, the Trustees compared each Fund through periods ended June 30, 2006, to other similar funds, as well as the following objective benchmarks: inflation plus 10%, and each Fund’s market index plus 200 basis points. All three Longleaf Partners Funds’ long-term results compared favorably to both objectives. A significant factor to all Trustees was Southeastern’s courage to stand behind its convictions, following strict application of its investment discipline, often buying companies currently out of favor. The Trustees concluded that this approach, even though performance may lag in the short term, is consistent with each Fund’s long-term investment horizon.
The Trustees reviewed after-tax performance information for each Fund and noted that taxable shareholders were significantly benefited by Southeastern’s long-term, low turnover, tax efficient management style as compared to funds with more frequent trading.
The Costs of the Services to be Provided and Profits to be Realized by the Investment Adviser and its Affiliates from the Relationship with the Fund
The Trustees considered each Fund’s management fee rates and expense ratios relative to industry averages, advisory fees charged to Southeastern’s private account clients and similar funds selected by Lipper and the Independent Trustees.
47
Longleaf Partners Funds
STATEMENT REGARDING BASIS FOR APPROVAL OF
INVESTMENT ADVISORY CONTRACTS
While Southeastern’s management fees for each Fund were above average, non-management expenses were below average, due in part to Southeastern’s performance and/or oversight of various operating functions. While the Trustees considered these fees separately, they viewed total expenses borne by shareholders as more important. In addition, the Trustees weighed favorably the fact that Southeastern had foregone additional fee income in each Fund’s early years through application of the expense limitation, and in later years by closing each Fund to protect shareholder interests. The Trustees noted that Longleaf Partners Fund and Longleaf Partners Small-Cap Fund were currently closed. The Trustees also recognized that Southeastern does not have an affiliated entity providing transfer agent, custodian, broker dealer or services other than investment management and fund administration. Accordingly, Southeastern neither generates additional fees for itself through related entities, nor allocates Fund brokerage to pay its expenses. The transparency of Southeastern’s fees and lack of supplemental sources of revenue was a significant factor to the Trustees.
With respect to Longleaf Partners Fund and Longleaf Partners Small-Cap Fund, for the five and ten year periods ended June 30, 2006, each Fund generated above average returns at below average total expenses when compared to their Lipper universes. With respect to Longleaf Partners International Fund, for the five year and since inception periods ended June 30, 2006, the Fund’s total expenses were above the average of the Lipper universe, but the Fund’s performance was significantly above average for the period since inception. The Trustees took into account this significant excess long-term performance, as well as a fee break introduced in 2003, when evaluating the fee level of the International Fund. In light of the qualifications, experience, reputation, and performance of Southeastern with respect to each Fund, as well as the steps taken to limit or reduce receipt of fees over time, the Trustees concluded that fees paid to Southeastern by each Fund are reasonable.
The Trustees compared the fees paid to Southeastern by the Funds with those paid by Southeastern’s private account clients, and noted that the range of services provided to the Funds is more extensive and the risks associated with operating SEC registered, publicly traded mutual funds are greater. Funds are more work because of the complex overlay of regulatory, tax and accounting issues which are unique to mutual funds. In addition, the work required to service shareholders is more extensive because of the significantly greater number. With respect to risk, not only has regulation become more complex and burdensome, but the scrutiny of regulators and shareholders has gotten more intense. The Trustees concluded that reasonable justifications exist for the differences in fee rates between the two lines of business.
48
Longleaf Partners Funds
STATEMENT REGARDING BASIS FOR APPROVAL OF
INVESTMENT ADVISORY CONTRACTS
The Trustees reviewed reports of Southeastern’s financial position, including overall revenues and expenses of the firm, as well as an Investment Manager Profitability Analysis prepared by Lipper Inc. While the Trustees considered the profitability of Southeastern as a whole, they did not evaluate on a Fund-by-Fund basis Southeastern’s profitability and/or costs. Because no generally accepted cost allocation methodology exists, and estimating the cost of providing services on a Fund specific basis is difficult, Southeastern provided its complete financial statements to the Trustees and stipulated conservatively for renewal purposes that its operation of each Fund should be considered highly profitable, at least as profitable as, if not more profitable than, investment managers with similar assets under management. The Trustees concluded that significant profits were not unreasonable given Southeastern’s successful investment management and strong shareholder orientation, as well as steps it had taken to limit or reduce its fees over time. The Trustees also gave weight to the preferences and expectations of individual Fund shareholders and their relative sophistication, noting that the level of assets under management (despite closing often, no sales force, or 12b-1 plan) is a direct result of Southeastern’s successful asset management and strong shareholder orientation. Similarly, if a shareholder wants to redeem, he or she is not constrained by the thought of having to pay a redemption fee or to recoup a front-end load. Thus, in assessing whether the costs of Southeastern’s services and its resulting profits are reasonable, the Trustees considered it relevant that the Funds’ asset base consists of shareholders who have freely chosen to retain access to Southeastern’s services, with full disclosure of advisory fee rates.
The Extent to which Economies of Scale would be Realized as each Fund Grows, and whether Current Fee Levels Reflect these Economies of Scale for the Benefit of Fund Investors
Because Southeastern’s fee structure for each Fund contains a breakpoint, economies of scale will be realized as each Fund grows. The Trustees noted that Southeastern bore costs in excess of each Fund’s expense limitation in early years, and that total expenses of each Fund have declined as a percentage of assets over time. The Trustees recognized that the fee levels for Longleaf Partners Fund and Longleaf Partners Small-Cap Fund currently reflect a greater sharing of economies of scale than the fee for Longleaf Partners International Fund. The Trustees noted that Southeastern had introduced a breakpoint for the International Fund in 2003 at the $2.5 billion asset level, and that the Fund had only recently reached the breakpoint level, due in part to the International Fund’s closing in February 2004. Because Southeastern and the Trustees expect that the International Fund has the capacity to grow significantly larger than $2.5 billion, the
49
Longleaf Partners Funds
STATEMENT REGARDING BASIS FOR APPROVAL OF
INVESTMENT ADVISORY CONTRACTS
Trustees anticipate additional sharing of economies of scale as the Fund grows. The Trustees were satisfied that breakpoints of each Fund were set at appropriate levels, and economies of scale are shared sufficiently with Fund shareholders.
Conclusion
While the material factors that the Trustees considered are summarized above, each individual Trustee considered and weighed in the aggregate all information prior to making a renewal decision. All Trustees, including the Independent Trustees, concluded that Southeastern’s fee structure was fair and reasonable in light of the nature and quality of services provided, and that approval of the Investment Counsel and Fund Administration Agreements was in the best interest of each Fund and its shareholders.
50
Longleaf Partners Funds
STATEMENT REGARDING BASIS FOR APPROVAL OF
INVESTMENT ADVISORY CONTRACTS
Intentionally Left Blank
51
Longleaf Partners Funds
EXPENSE EXAMPLE
Shareholders of mutual funds may incur two types of costs: (1) ongoing costs, including management fees, transfer agent fees, and other fund expenses; and (2) transaction costs, including sale charges (loads) and redemption fees. Longleaf does not charge transaction fees of any sort.
The following examples are intended to show the ongoing costs (in dollars) of investing in the Longleaf Funds and to enable you to compare the costs of investing in other mutual funds. Each example is based on an investment of $1,000 made at July 1, 2006 and held through December 31, 2006.
Actual Expenses
The table below provides information about actual account values and actual expenses using each Fund’s actual return for the period. To estimate the expenses that you paid over the period, divide your account balance by $1,000 (for example, a $12,500 account balance divided by $1,000 = 12.5), then multiply the result by the number in the third line entitled “Expenses Paid During Period.”
Ongoing Expenses and Actual Fund Returns
for the period July 1, 2006 to December 31, 2006
| | | | | | | | | | | | | |
| | | Partners | | | Small-Cap | | | International | |
| | | | | | | | | | |
| Beginning Account Value | | $ | 1,000.00 | | | $ | 1,000.00 | | | $ | 1,000.00 | |
| Ending Account Value | | | 1,116.18 | | | | 1,184.68 | | | | 1,129.12 | |
| Expenses Paid During Period* | | | 4.80 | | | | 5.07 | | | | 8.59 | |
| Annualized Expense Ratio for Period | | | 0.90 | % | | | 0.92 | % | | | 1.60 | % |
| |
| * | Expenses are equal to the Fund’s annualized expense ratio, multiplied by the average account value for the period, multiplied by the number of days in the most recent fiscal half year (184) divided by 365 days in the current year. |
52
Longleaf Partners Funds
EXPENSE EXAMPLE
Hypothetical Example for Comparison Purposes
The table below provides information about hypothetical account values and expenses based on each Fund’s actual expense ratio and assumed returns of 5% per year before expenses, which are not the Funds’ actual returns. Do not use the hypothetical data below to estimate your ending account balance or expenses you paid. This information serves only to compare the ongoing costs of investing in Longleaf with other mutual funds. To do so, examine this 5% hypothetical example against the 5% hypothetical examples found in other funds’ shareholder reports.
The expenses shown in the table highlight only ongoing costs and do not reflect transactional costs that may be charged by other funds. Therefore, the third line of the table does not reveal the total relative costs of owning different funds. Since Longleaf does not charge transactions fees, you should evaluate other funds’ transaction costs to assess the total cost of ownership for comparison purposes.
Ongoing Expenses and Hypothetical 5% Return
for the period July 1, 2006 to December 31, 2006
| | | | | | | | | | | | | |
| | | Partners | | | Small-Cap | | | International | |
| | | | | | | | | | |
| Beginning Account Value | | $ | 1,000.00 | | | $ | 1,000.00 | | | $ | 1,000.00 | |
| Ending Account Value | | | 1,020.67 | | | | 1,020.57 | | | | 1,017.14 | |
| Expenses Paid During Period* | | | 4.58 | | | | 4.69 | | | | 8.13 | |
| Annualized Expense Ratio for Period | | | 0.90 | % | | | 0.92 | % | | | 1.60 | % |
| |
| * | Expenses are equal to the Fund’s annualized expense ratio, multiplied by the average account value for the period, multiplied by the number of days in the most recent fiscal half year (184) divided by 365 days in the current year. |
53
INFORMATION ON BOARDS OF TRUSTEES
Each Fund is served by a separate Board of Trustees composed of eight members. The membership of each Board is the same. There is no stated term of service, and Trustees continue to serve after election until resignation. All Trustees presently serving except for Rex M. Deloach were elected or re-elected at a meeting of shareholders held on September 19, 2001 in Boston, Massachusetts.
| | | | | | | | | | | |
| | | | | Length of Service | |
| Name, Age | | Positions Held | | | as Trustee | |
| And Address | | With Funds | | | (Year Began) | |
| | |
| Affiliated or Interested Trustees* |
| |
O. Mason Hawkins, CFA, (58)
6410 Poplar Ave., Suite 900
Memphis, TN 38119 | | Co-Portfolio Manager | | Partners Fund
Small-Cap Fund
International Fund | | 1987
1989
1998 |
| |
Margaret H. Child (51)
137 Marlborough Street #3
Boston, MA 02116 | | | Trustee | | | Partners Fund
Small-Cap Fund
International Fund | | 2001
2001
2001 |
| |
| Independent or Non-Interested Trustees |
| |
Chadwick H. Carpenter, Jr. (56)
42366 N. 111th Place
Scottsdale, AZ 85262 | | | Trustee | | | Partners Fund
Small-Cap Fund
International Fund | | 1993
1993
1998 |
| |
Daniel W. Connell, Jr. (58)
4016 Alcazar Avenue
Jacksonville, FL 32207 | | | Trustee | | | Partners Fund
Small-Cap Fund
International Fund | | 1997
1997
1998 |
| |
Rex M. Deloach (69)
154 County Road 231
Oxford, MS 38655 | | | Trustee | | | Partners Fund
Small-Cap Fund
International Fund | | 2003
2003
2003 |
| |
Steven N. Melnyk (59)
1535 The Greens Way
Jacksonville Beach FL 32250 | | | Trustee | | | Partners Fund
Small-Cap Fund
International Fund | | 1991
1991
1998 |
| |
C. Barham Ray (60)
6075 Poplar Avenue, Suite 335
Memphis, TN 38119 | | | Trustee | | | Partners Fund
Small-Cap Fund
International Fund | | 1992
1992
1998 |
| |
Perry C. Steger (44)
1978 South Austin Avenue
Georgetown, TX 78626 | | Chairman of
the Board | | Partners Fund
Small-Cap Fund
International Fund | | 2001
2001
2001 |
| |
| |
| * | Mr. Hawkins is a director and officer of Southeastern Asset Management, Inc. and as such is classified as an “interested” Trustee. Ms. Child is not affiliated with Southeastern, but performs certain administration and operational functions for the Funds in Massachusetts, their state of organization, and could be deemed to be an “interested” Trustee. |
54
INFORMATION ON BOARDS OF TRUSTEES
| | | | | |
| | | Number of | | |
| Principal Occupations | | Portfolios | | Other |
| During Past 5 Years | | Overseen | | Directorships |
| |
| Affiliated or Interested Trustees* |
| |
| Chairman of the Board and Chief Executive Officer, Southeastern Asset Management, Inc. | | 3 | | |
| |
| Marketing Consultant since 2005; Chief Marketing Officer, Bingham McCutchen, LLP (1999-2004) (an international law firm); Director of Marketing, Arthur Andersen LLP (accounting firm) Memphis office (1991-98), Atlanta office (1998-99). | | 3 | | |
| |
| Independent or Non-Interested Trustees |
| |
Private Investor and Consultant since 1998;
Senior Executive Officer,
Progress Software Corp. (1983-98) | | 3 | | |
| |
| Private Investor since 2005; President and CEO, Twilight Ventures, LLC (investment holding company) (2004-2005); Senior Vice President-Marketing, Jacksonville Jaguars (NFL franchise) (1994-2004) | | 3 | | |
| |
| President, Financial Insights, Inc. (financial consulting and litigation support) since 2002; Vice President, The Oxford Company (private land and timber, investments) since 1994. | | 3 | | |
| |
| Real Estate Development, The Sea Island Company, since 2005; Private Investor and Consultant since 1997; Golf Commentator, ABC Sports since 1991; President, Riverside Golf Group, Inc. since 1989. | | 3 | | Director, First Coast Community Bank, Fernandina Beach, FL |
| |
| Partner, SSM Corp. (venture capital firm) since 1974. | | 3 | | |
| |
President, Steger & Bizzell Engineering, Inc.
(engineering firm) since 2003; Director of Product Strategy, National Instruments, Inc. (1996-2003) | | 3 | | |
| |
55
Intentionally Left Blank
56
Longleaf Partners Funds
FUND INFORMATION
The following additional information may be obtained without charge, upon request, by calling 1-800-445-9469, Option 1, or on the Funds’ website at www.longleafpartners.com, or on the SEC’s website at www.sec.gov.
Proxy Voting Policies and Procedures
A description of Longleaf’s Proxy Voting Policies and Procedures is included in the Statement of Additional Information (SAI).
Proxy Voting Record
Information regarding how the Funds voted proxies relating to portfolio securities during the most recent 12-month period ended June 30 is contained in Form N-PX.
Quarterly Portfolio Holdings
Longleaf files a complete schedule of portfolio holdings for the first and third quarters of each fiscal year on Form N-Q, which is available on the SEC’s website, and may be reviewed and copied at the SEC’s Public Reference Room in Washington, D.C. (please call 1-800-SEC-0330 for information on the operation of the Public Reference Room).
In addition to Form N-Q, Longleaf publishes reports for each fiscal quarter. These reports include complete schedules of portfolio holdings, as well as performance updates and management discussion. We furnish Longleaf’s Quarterly Reports in lieu of Form N-Q to shareholders who request information about our first and third quarter portfolio holdings, and Semi-Annual and Annual Reports for requests related to the second and fourth quarters, respectively.
Fund Trustees
Additional information about Fund Trustees is included in the Statement of Additional Information (SAI).
57
Intentionally Left Blank
58
Longleaf Partners Funds
SERVICE DIRECTORY
Contact us at www.longleafpartners.com or
(800) 445-9469
To request a Prospectus, Statement of Additional Information (including Longleaf’s Proxy Voting Policies and Procedures), financial report, application or other Fund information from 7:00 a.m. to 7:00 p.m. Eastern time, Monday through Friday.
| |
| DAILY FUND PRICES | OPTION 2 |
For automated reporting 24 hours a day, seven days a week.
| |
| ACCOUNT INFORMATION | OPTION 3 |
For account balance and transaction activity, 24 hours a day, seven days a week. Please have your Fund number (see below) and account number ready to access your investment information.
| |
| SHAREHOLDER INQUIRIES | OPTION 0 |
To request action on your existing account from 9:00 a.m. to 6:00 p.m. Eastern time, Monday through Friday.
CORRESPONDENCE
| | | |
By regular mail: | | By express mail or overnight courier: |
| Longleaf Partners Funds | | Longleaf Partners Funds |
| P.O. Box 9694 | | c/o PFPC |
| Providence, RI 02940-9694 | | 101 Sabin Street |
| | | Pawtucket, RI 02860 |
| | | (508) 871-8800 |
PUBLISHED DAILY PRICE QUOTATIONS
Daily net asset value per share of each Fund is reported in mutual fund quotations tables of major newspapers in alphabetical order under the bold heading Longleaf Partners as follows:
| | | | | | | | | |
| | | | | | | Transfer Agent | | Status to |
| Abbreviation | | Symbol | | Cusip | | Fund Number | | New Investors |
| | | | | | | | | |
| Partners | | LLPFX | | 543069108 | | 133 | | Closed 7-16-04 |
| Sm-Cap | | LLSCX | | 543069207 | | 134 | | Closed 7-31-97 |
| Intl | | LLINX | | 543069405 | | 136 | | Open |
59
Longleaf Partners Funds ®
c/o PFPC
P.O. Box 9694
Providence, RI 02940-9694
(800) 445-9469
www.longleafpartners.com
Item 2. Code of Ethics.
On December 8, 2003, the Boards of Trustees of the Longleaf Partners Funds adopted a Code of Ethics applicable to officers of Southeastern Asset Management, Inc. performing the principal executive function, the principal financial function, and the principal legal function for the Funds. On September 28, 2004, Longleaf’s Trustees amended the Code to include a role for the Fund’s Chief Compliance Officer in addressing issues under the Code. A copy of this Code of Ethics, as amended, is attached as Exhibit 99.CODE ETH. No amendments or waivers occurred during 2005 or 2006.
Item 3. Audit Committee Financial Expert.
On December 8, 2003, the Independent Trustees of the Longleaf Partners Funds selected Rex M. Deloach to replace G. Staley Cates as Trustee, effective upon Mr. Cates resignation from the Boards December 31, 2003. Mr. Deloach is “independent” as defined by Item 3 of Form N-CSR, and serves as chairman of the Audit Committee. The Trustees have determined that Mr. Deloach meets the definition of “audit committee financial expert” as set forth in Item 3 of Form N-CSR.
In accordance with the SEC’s safe harbor rule for “audit committee financial experts,” no member designated as an audit committee financial expert shall (i) be deemed an “expert” for any other purpose or (ii) have any duty, obligation or liability that is greater than the duties, obligations and liabilities imposed on a member of the board or the audit committee not so designated. Additionally, the designation of a member or members as an “audit committee financial expert” shall in no way affect the duties, obligations or liabilities of any member of the audit committee, or the board, not so designated.
Item 4. Principal Accountant Fees and Services.
| | | | | | | | | | | | |
| Services | | 2006 | 2005 |
| |
|
|
| | (a.) | | | Audit Fees | | | | | | | |
| | | | Audits of the Funds | | $ | 94,000 | | $ | 88,000 | |
| | | |
| | |
| |
| | (b.) | | | Audit Related Fees | | | | | | | |
| Quarterly tax diversification review, tax department review of financial statements | | $ | 27,180 | | $ | 32,800 | |
| | | |
| | |
| |
| | (c.) | | | Tax Fees | | | | | | | |
| Preparation of tax returns, tax consultation and research | | $ | 82,000 | | $ | 33,200 | |
| | | |
| | |
| |
| | (d.) | | | All other fees | | $ | 0 | | $ | 0 | |
| | | |
| | |
| |
PricewaterhouseCoopers LLP (PwC) serves as the principal accountant for the Longleaf Partners Funds. With respect to PwC’s 2006 engagement to provide audit, audit-related and tax services to the Funds, the Audit Committee specifically pre-approved the engagement at the March 9, 2006 Meeting of the Boards of Trustees. With respect to PwC’s 2005 engagement to provide audit, audit-related and tax services to the Funds, the Audit Committee specifically pre-approved the engagement by unanimous written consent in April 2005. Under Longleaf’s Audit Committee Charter, the Audit Committee must pre-approve all audit and non-audit services. No additional pre-approval policies and procedures described in paragraph (c)(7) of Rule 2-01 of Regulation S-X have been adopted. No services included in (b.) through (d.) above were approved pursuant to paragraph (c)(7)(i)(C) of Rule 2-01 of Regulation S-X. PWC has not provided any services to Longleaf’s investment adviser or any affiliated entity for the last 2 fiscal years. Accordingly, no consideration was necessary regarding the impact such services might have on PWC’s independence.
Item 5. Audit Committee of Listed Registrants.
Not applicable.
Item 6. Schedule of Investments.
A complete schedule of investments for the period ended December 31, 2006 is included in the Annual Report filed under Part I of this form.
Item 7. Disclosure of Proxy Voting Policies and Procedures for Closed-End Management Investment Companies.
Not applicable.
Item 8. Portfolio Managers of Closed-End Management Investment Companies.
Not applicable.
Item 9. Purchases of Equity Securities by Closed-End Management Investment Company and Affiliated Purchasers.
Not applicable.
Item 10. Submission of Matters to a Vote of Security Holders.
The registrant does not currently have in place procedures by which shareholders may recommend nominees to the registrant’s board or directors.
Item 11. Controls and Procedures.
The registrant’s principal executive officer and principal financial officer have concluded, based on their evaluation of the effectiveness of the design and operation of the registrant’s disclosure controls and procedures as of a date within 90 days of the filing date of this report on Form N-CSR, that the design and operation of such procedures are effective to provide reasonable assurance that information required to be disclosed by the investment company in the reports that it files or submits under the Securities Exchange Act to 1934 is recorded, processed, summarized, and reported within the time periods specified in the Commission’s rules and forms.
At the date of filing this Form N-CSR, the registrant’s principal executive officer and principal financial officer are aware of no changes in the registrant’s internal control over financial reporting during the second fiscal quarter of the period covered by this report (ie, the fourth quarter) that have materially affected, or are reasonably likely to materially affect, the registrant’s internal control over financial reporting.
Item 12. Exhibits.
Exhibit 99. CODE/ETH Code of Ethics required by Item 2.
Exhibit 99. CERT Certification Required by Item 12(a)(2) of Form N-CSR
Exhibit 99.906 CERT Certification Pursuant to Section 906 of the Sarbanes Oxley Act.
SIGNATURES
Pursuant to the requirements of the Securities Exchange Act of 1934 and the Investment Company Act of 1940, the registrant has duly caused this report to be signed on its behalf by the undersigned, thereunto duly authorized.
Longleaf Partners Funds Trust
| | | | | |
| By | | /s/ O. Mason Hawkins | | |
| | |
| | |
| | | O. Mason Hawkins
Trustee
Longleaf Partners Funds Trust | | |
| | | | | |
| Date | | February 23, 2007 | | |
Pursuant to the requirements of the Securities Exchange Act of 1934 and the Investment Company Act of 1940, this report has been signed below by the following persons on behalf of the registrant and in the capacities and on the dates indicated.
| | | | | |
| By | | /s/ O. Mason Hawkins | | |
| | |
| | |
| | | O. Mason Hawkins
Chairman and CEO, Southeastern Asset Management, Inc. Functioning as principal executive officer under agreements with Longleaf Partners Funds Trust and its separate series | | |
| | | | | |
| Date | | February 23, 2007 | | |
| | | | | |
| By | | /s/ Julie M. Douglas | | |
| | |
| | |
| | | Julie M. Douglas
Vice President & CFO – Mutual Funds, Southeastern Asset Management, Inc. Functioning as principal financial officer under agreements with Longleaf Partners Funds Trust and its separate series | | |
| |
| Date | | February 23, 2007 | | |
A signed original of this written statement has been provided to Longleaf Partners Funds Trust and will be retained by Longleaf Partners Funds Trust and furnished to the Securities and Exchange Commission or its staff upon request.