UNITED STATES
SECURITIES AND EXCHANGE COMMISSION
Washington, D.C. 20549
FORM N-CSR
CERTIFIED SHAREHOLDER REPORT OF REGISTERED MANAGEMENT
INVESTMENT COMPANIES
Investment Company Act file number 811-04873
The GAMCO Growth Fund | ||||||
| (Exact name of registrant as specified in charter) | ||||||
One Corporate Center Rye, New York 10580-1422 | ||||||
| (Address of principal executive offices) (Zip code) | ||||||
Bruce N. Alpert Gabelli Funds, LLC One Corporate Center Rye, New York 10580-1422 | ||||||
| (Name and address of agent for service) | ||||||
Registrant’s telephone number, including area code: 1-800-422-3554
Date of fiscal year end: December 31
Date of reporting period: December 31, 2017
Form N-CSR is to be used by management investment companies to file reports with the Commission not later than 10 days after the transmission to stockholders of any report that is required to be transmitted to stockholders under Rule 30e-1 under the Investment Company Act of 1940 (17 CFR 270.30e-1). The Commission may use the information provided on Form N-CSR in its regulatory, disclosure review, inspection, and policymaking roles.
A registrant is required to disclose the information specified by Form N-CSR, and the Commission will make this information public. A registrant is not required to respond to the collection of information contained in Form N-CSR unless the Form displays a currently valid Office of Management and Budget (“OMB”) control number. Please direct comments concerning the accuracy of the information collection burden estimate and any suggestions for reducing the burden to Secretary, Securities and Exchange Commission, 450 Fifth Street, NW, Washington, DC 20549-0609. The OMB has reviewed this collection of information under the clearance requirements of 44 U.S.C. § 3507.
Item 1. Reports to Stockholders.
The Report to Shareholders is attached herewith.
The GAMCO Growth Fund
Annual Report — December 31, 2017 |  | |||
Howard F. Ward, CFA | ||||
| Portfolio Manager |
To Our Shareholders,
For the year ended December 31, 2017, the net asset value (“NAV”) per Class I Share of The GAMCO Growth Fund increased 29.8% compared with increases of 21.8% and 30.2% for the Standard & Poor’s (“S&P”) 500 Index and the Russell 1000 Growth Index, respectively. Other classes of shares are available. See page 3 for performance information for all classes of shares.
Enclosed are the financial statements, including the schedule of investments, as of December 31, 2017.
Performance Discussion (Unaudited)
The Fund’s investment objective is to provide capital appreciation. The Fund’s secondary objective is to produce current income.
The Fund’s investment strategy is to invest in common stocks. The Fund may also invest in foreign securities. The Fund focuses on securities of companies which appear to have favorable, yet undervalued, prospects for earnings growth and price appreciation. The Fund’s investment adviser, Gabelli Funds, LLC (the “Adviser”), invests the Fund’s assets in companies which the portfolio manager believes have above average or expanding market shares, profit margins, and returns on equity.
The Adviser uses fundamental security analysis to develop earnings forecasts for companies and to identify investment opportunities. The Adviser bases its analysis on general economic and industry data provided by the U.S. government, various trade associations and other sources, and published corporate financial data such as annual reports, 10-Ks, and quarterly statements as well as direct interviews with company management. Generally, the Adviser makes investment decisions first by looking at individual companies and then by scrutinizing their growth prospects in relation to their industries and the overall economy. The Adviser seeks to invest in companies with high future earnings potential relative to their current market valuations.
Wall Street’s bull market continued in the first quarter as investors celebrated the installment of a pro-business President. Consumer and CEO confidence soared as President Trump pledged to raise economic growth and create millions of new jobs. Large cap growth stocks were the best performers during the first quarter as the Russell 1000 Growth Index returned 8.9% vs. 6.1% for the S&P 500 and 2.5% for the Russell 2000 Index. The three top performing industry sectors were technology, health care, and consumer discretionary. It was the sixth quarter in a row of positive market returns.
In the second calendar quarter the stock market continued to trend higher, supported by continued low interest rates, better than expected earnings, and reasonably good global economic data. The market’s lack
of volatility was surprising given the escalation in tensions with North Korea and President Trump’s slower than expected attention to important campaign promises. The Federal Reserve was in tightening mode, having raised rates four times since December of 2015, and has expressed interest in beginning the process of shrinking its balance sheet.
The third quarter of 2017 was fueled by low interest rates, improving earnings, and economic expansion in Europe and Asia. The stock market (S&P) continued its near historic advance, having booked gains for eight consecutive quarters. Equity prices were also bid up as investors pivoted their attention from health care to tax reform. Large cap growth stocks suffered from profit taking and sector rotation in September, limiting gains for the quarter. Smaller cap stocks and banks excelled as the so-called reflation trade returned with a vengeance. Investors priced in higher interest rates, which benefits financials, and a corporate tax cut, which benefits smaller companies disproportionately.
Stocks rose in the fourth quarter – the ninth consecutive quarterly gain - on the back of rising earnings, continued low interest rates, and better than expected growth in Europe and Asia. Adding some torque to the market’s advance was enthusiasm over the tax reform package passed just before Christmas. With the loss of the SALT (state and local tax) deduction, not all individual tax payers will benefit, but the boost to earnings, incentives to invest (via full expensing of certain capital expenditures items) and repatriate foreign profits are to elevate the slope of trend line GDP growth, at least for a bit. All of these factors contributed to Fund performance.
A top contributor to performance in 2017 was Microsoft (5.9% of net assets as of December 31, 2017), the world’s largest software company and a developer of software products for computing devices ranging from PCs to servers to its Xbox game console. Microsoft’s Azure is a fast growing public cloud service that competes with Amazon’s Web Services, Inc. The recent acquisition of LinkedIn will allow Microsoft to integrate data from LinkedIn with Microsoft’s professional cloud. Another top performing holding was Amazon (4.8%), the preeminent e-commerce platform. Amazon’s competitive advantage within e-commerce is Amazon Prime, which benefits from a virtuous cycle as the continuously expanding selection of inventory drives traffic, which attracts more sellers, who add yet more selection. Amazon continues to grow and is currently in the process of selecting a location for their second headquarters. Additionally, Apple (6.7%), an American multinational technology company headquartered in Cupertino, California that designs, develops, and sells consumer electronics and computer software, was a top contributor. Apple continues to dominate the mobile space with its iPhone, iPads, and App Store, and remains at the forefront of mobile technology with the Apple Watch 3, Apple Pay, and Apple Music. Perhaps Apple’s greatest innovation has been its integrated ecosystem, which retains customers and produces a “halo effect” for other Apple devices.
Detractors from performance included Celgene (no longer held), an American biotechnology company that discovers, develops, and commercializes medicines for cancer and inflammatory disorders. The biotech industry struggled during the year. First Republic Bank (1.0%), an American bank and wealth management company offering personal banking, business banking, and trust and wealth management services, missed expectations, reporting negative earnings and left investors concerned about higher expenses and a decline in net interest margin. An additional detractor to performance was Charter Communications (0.4%), the second largest cable operator in the United States and a leading broadband communications services company. Charter provides video, Internet, and voice services to over 26 million residential and business customers. The stock underperformed the S&P and suffered from volatility and short selling.
Thank you for your investment in The GAMCO Growth Fund.
We appreciate your confidence and trust.
2
Comparative Results
| Average Annual Returns through December 31, 2017 (a) (Unaudited) | Since (4/10/87) | |||||||||||
1 Year | 3 Year | 5 Year | 10 Year | 15 Year | ||||||||
Class I (GGCIX) | 29.83% | 12.14% | 15.82% | 7.38% | 9.46% | 10.33% | ||||||
S&P 500 Index | 21.83 | 11.41 | 15.79 | 8.50 | 9.92 | 9.91(b) | ||||||
Russell 1000 Growth Index | 30.21 | 13.79 | 17.33 | 10.00 | 10.70 | 9.58(b) | ||||||
Class AAA (GABGX) | 29.49 | 11.86 | 15.54 | 7.12 | 9.29 | 10.25 | ||||||
Class A (GGCAX) | 29.51 | 11.87 | 15.54 | 7.12 | 9.29 | 10.25 | ||||||
With sales charge (c) | 22.06 | 9.68 | 14.18 | 6.49 | 8.88 | 10.04 | ||||||
Class C (GGCCX) | 28.53 | 11.02 | 14.67 | 6.31 | 8.52 | 9.87 | ||||||
With contingent deferred sales charge (d) | 27.53 | 11.02 | 14.67 | 6.31 | 8.52 | 9.87 | ||||||
Class T (GGGTX) | 29.47 | 11.85 | 15.53 | 7.12 | 9.28 | 10.25 | ||||||
With sales charge (e) | 26.24 | 10.91 | 14.95 | 6.85 | 9.10 | 10.13 | ||||||
In the current prospectuses dated April 28, 2017, the expense ratios for Class AAA, A, C, I, and T Shares are 1.44%, 1.44%, 2.19%, 1.19%, and 1.44%, respectively. See page 10 for the expense ratios for the year ended December 31, 2017. Class AAA and Class I Shares do not have a sales charge. The maximum sales charge for Class A, Class C, and Class T Shares is 5.75%, 1.00%, and 2.50%, respectively.
| (a) | Returns represent past performance and do not guarantee future results. Total returns and average annual returns reflect changes in share price, reinvestment of distributions, and are net of expenses. Investment returns and the principal value of an investment will fluctuate. When shares are redeemed, they may be worth more or less than their original cost. Current performance may be lower or higher than the performance data presented. Visit www.gabelli.com for performance information as of the most recent month end. The Fund imposes a 2% redemption fee on shares sold or exchanged within seven days of purchase. Investors should carefully consider the investment objectives, risks, charges, and expenses of the Fund before investing. The prospectuses contain information about these and other matters and should be read carefully before investing. To obtain a prospectus please visit our website at www.gabelli.com. The Class AAA Share NAVs are used to calculate performance for the periods prior to the issuance of Class A Shares and Class C Shares on December 31, 2003, Class I Shares on January 11, 2008, and Class T Shares on July 5, 2017. The actual performance of the Class A Shares, Class C Shares, and Class T Shares would have been lower due to the additional fees and expenses associated with these classes of shares. The actual performance of the Class I Shares would have been higher due to lower expenses related to this class of shares. The S&P 500 Index is a market capitalization weighted index of 500 large capitalization stocks commonly used to represent the U.S. equity market. The Russell 1000 Growth Index measures the performance of the large cap growth segment of the U.S. equity market. Dividends are considered reinvested. You cannot invest directly in an index. |
| (b) | S&P 500 Index and Russell 1000 Growth Index since inception performance results are as of March 31, 1987. |
| (c) | Performance results include the effect of the maximum 5.75% sales charge at the beginning of the period. |
| (d) | Assuming payment of the 1% maximum contingent deferred sales charge imposed on redemptions made within one year of purchase. |
| (e) | Performance results include the effect of the maximum 2.50% sales charge at the beginning of the period. |
3
COMPARISON OF CHANGE IN VALUE OF A $10,000 INVESTMENT IN
THE GAMCO GROWTH FUND (CLASS AAA SHARES) AND S&P 500 INDEX (Unaudited)
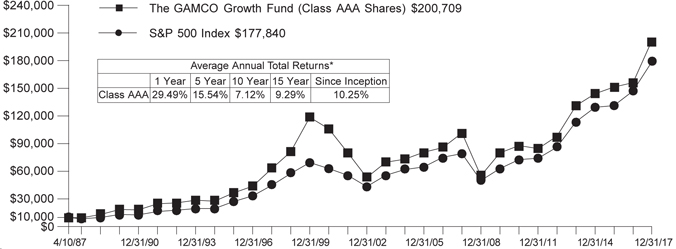
| * | Past performance is not predictive of future results. The performance tables and graph do not reflect the deduction of taxes that a shareholder would pay on Fund distributions or the redemption of Fund shares. |
4
| The GAMCO Growth Fund | ||
| Disclosure of Fund Expenses (Unaudited) | ||
| For the Six Month Period from July 1, 2017 through December 31, 2017 | Expense Table |
We believe it is important for you to understand the impact of fees and expenses regarding your investment. All mutual funds have operating expenses. As a shareholder of a fund, you incur ongoing costs, which include costs for portfolio management, administrative services, and shareholder reports (like this one), among others. Operating expenses, which are deducted from a fund’s gross income, directly reduce the investment return of a fund. When a fund’s expenses are expressed as a percentage of its average net assets, this figure is known as the expense ratio. The following examples are intended to help you understand the ongoing costs (in dollars) of investing in your Fund and to compare these costs with those of other mutual funds. The examples are based on an investment of $1,000 made at the beginning of the period shown and held for the entire period.
The Expense Table below illustrates your Fund’s costs in two ways:
Actual Fund Return: This section provides information about actual account values and actual expenses. You may use this section to help you to estimate the actual expenses that you paid over the period after any fee waivers and expense reimbursements. The “Ending Account Value” shown is derived from the Fund’s actual return during the past six months, and the “Expenses Paid During Period” shows the dollar amount that would have been paid by an investor who started with $1,000 in the Fund. You may use this information, together with the amount you invested, to estimate the expenses that you paid over the period.
To do so, simply divide your account value by $1,000 (for example, an $8,600 account value divided by $1,000 = 8.6), then multiply the result by the number given for your Fund under the heading “Expenses Paid During Period” to estimate the expenses you paid during this period.
Hypothetical 5% Return: This section provides information about hypothetical account values and hypothetical expenses based on the Fund’s actual expense ratio. It assumes a hypothetical annualized return of 5% before expenses during the period shown. In this
case – because the hypothetical return used is not the Fund’s actual return – the results do not apply to your investment and you cannot use the hypothetical account value and expense to estimate the actual ending account balance or expenses you paid for the period. This example is useful in making comparisons of the ongoing costs of investing in the Fund and other funds. To do so, compare this 5% hypothetical example with the 5% hypothetical examples that appear in shareholder reports of other funds.
Please note that the expenses shown in the table are meant to highlight your ongoing costs only and do not reflect any transactional costs such as sales charges (loads), redemption fees, or exchange fees, if any, which are described in the Prospectus. If these costs were applied to your account, your costs would be higher. Therefore, the 5% hypothetical return is useful in comparing ongoing costs only, and will not help you determine the relative total costs of owning different funds. The “Annualized Expense Ratio” represents the actual expenses for the last six months and may be different from the expense ratio in the Financial Highlights which is for the year ended December 31, 2017.
Beginning Account Value 07/01/17 | Ending Account Value 12/31/17 | Annualized Ratio | Expense Period* | |||||
The GAMCO Growth Fund | ||||||||
Actual Fund Return | ||||||||
Class AAA | $1,000.00 | $1,131.60 | 1.40% | $ 7.52 | ||||
Class A | $1,000.00 | $1,131.80 | 1.40% | $ 7.52 | ||||
Class C | $1,000.00 | $1,127.40 | 2.15% | $11.53 | ||||
Class I | $1,000.00 | $1,133.10 | 1.15% | $ 6.18 | ||||
Class T** | $1,000.00 | $1,137.00 | 1.41% | $ 7.43 | ||||
Hypothetical 5% Return | ||||||||
Class AAA | $1,000.00 | $1,018.15 | 1.40% | $ 7.12 | ||||
Class A | $1,000.00 | $1,018.15 | 1.40% | $ 7.12 | ||||
Class C | $1,000.00 | $1,014.37 | 2.15% | $10.92 | ||||
Class I | $1,000.00 | $1,019.41 | 1.15% | $ 5.85 | ||||
Class T | $1,000.00 | $1,018.10 | 1.41% | $ 7.17 | ||||
| * | Expenses are equal to the Fund’s annualized expense ratio for the last six months multiplied by the average account value over the period, multiplied by the number of days in the most recent fiscal half year (184 days), then divided by 365. |
| ** | Class T Shares use a beginning account value date of 07/05/17, and Class T Share expenses are equal to the Fund’s annualized expense ratio for the period since inception multiplied by the number of days since inception (180 days), then divided by 365. |
5
Summary of Portfolio Holdings (Unaudited)
The following table presents portfolio holdings as a percent of net assets as of December 31, 2017:
The GAMCO Growth Fund
Technology - Computer Software and Services | 22.5 | % | ||
Health Care | 19.3 | % | ||
Financial Services | 15.9 | % | ||
Consumer Discretionary - Other | 14.5 | % | ||
Technology - Computer Technology, Semiconductors, and Components | 10.3 | % |
| Producer Durables | 8.7 | % | ||
| Consumer Discretionary - Media | 4.2 | % | ||
| Materials and Processing | 2.3 | % | ||
| Consumer Staples | 2.1 | % | ||
| U.S. Government Obligations | 0.3 | % | ||
Other Assets and Liabilities (Net)
| (0.1 | )% | ||
|
| |||
| 100.0 | % | |||
|
|
The Fund files a complete schedule of portfolio holdings with the Securities and Exchange Commission (the “SEC”) for the first and third quarters of each fiscal year on Form N-Q. Shareholders may obtain this information at www.gabelli.com or by calling the Fund at 800-GABELLI (800-422-3554).The Fund’s Form N-Q is available on the SEC’s website at www.sec.gov and may also be reviewed and copied at the SEC’s Public Reference Room in Washington, DC. Information on the operation of the Public Reference Room may be obtained by calling 800-SEC-0330.
Proxy Voting
The Fund files Form N-PX with its complete proxy voting record for the twelve months ended June 30, no later than August 31 of each year. A description of the Fund’s proxy voting policies, procedures, and how the Fund voted proxies relating to portfolio securities is available without charge, upon request, by (i) calling 800-GABELLI (800-422-3554); (ii) writing to The Gabelli Funds at One Corporate Center, Rye, NY 10580-1422; or (iii) visiting the SEC’s website at www.sec.gov.
6
The GAMCO Growth Fund
Schedule of Investments — December 31, 2017
Shares | Cost | Market Value | ||||||||||
COMMON STOCKS — 99.8% |
| |||||||||||
TECHNOLOGY - COMPUTER SOFTWARE AND SERVICES — 22.5% |
| |||||||||||
| 6,800 | Palo Alto Networks Inc.† | $ | 1,039,596 | $ | 985,592 | |||||||
| 129,400 | Adobe Systems Inc.† | 10,548,498 | 22,676,056 | |||||||||
| 17,100 | Alphabet Inc., Cl. A† | 6,830,730 | 18,013,140 | |||||||||
| 18,735 | Alphabet Inc., Cl. C† | 10,865,131 | 19,604,304 | |||||||||
| 206,500 | Facebook Inc., Cl. A† | 14,503,002 | 36,438,990 | |||||||||
| 420,000 | Microsoft Corp. | 14,486,214 | 35,926,800 | |||||||||
| 30,300 | salesforce.com Inc.† | 2,130,036 | 3,097,569 | |||||||||
|
|
|
| |||||||||
| 60,403,207 | 136,742,451 | |||||||||||
|
|
|
| |||||||||
HEALTH CARE — 19.3% |
| |||||||||||
| 102,400 | Abbott Laboratories | 4,897,636 | 5,843,968 | |||||||||
| 69,200 | AbbVie Inc. | 4,300,378 | 6,692,332 | |||||||||
| 53,900 | Becton, Dickinson and Co. | 7,963,795 | 11,537,834 | |||||||||
| 11,900 | Biogen Inc.† | 2,351,817 | 3,790,983 | |||||||||
| 34,300 | Bristol-Myers Squibb Co. | 2,090,730 | 2,101,904 | |||||||||
| 47,000 | Danaher Corp. | 3,248,114 | 4,362,540 | |||||||||
| 56,100 | Humana Inc. | 13,379,340 | 13,916,727 | |||||||||
| 43,600 | Johnson & Johnson | 4,553,392 | 6,091,792 | |||||||||
| 27,900 | Stryker Corp. | 3,980,809 | 4,320,036 | |||||||||
| 49,300 | Thermo Fisher Scientific Inc. | 6,805,467 | 9,361,084 | |||||||||
| 134,600 | UnitedHealth Group Inc. | 19,303,093 | 29,673,916 | |||||||||
| 275,500 | Zoetis Inc. | 14,142,409 | 19,847,020 | |||||||||
|
|
|
| |||||||||
| 87,016,980 | 117,540,136 | |||||||||||
|
|
|
| |||||||||
FINANCIAL SERVICES — 15.9% |
| |||||||||||
| 107,400 | American Tower Corp. | 12,944,048 | 15,322,758 | |||||||||
| 124,700 | Crown Castle International Corp. | 12,144,428 | 13,842,947 | |||||||||
| 67,000 | First Republic Bank | 5,546,454 | 5,804,880 | |||||||||
| 67,000 | Fiserv Inc.† | 6,941,112 | 8,785,710 | |||||||||
| 156,200 | Mastercard Inc., Cl. A | 5,117,094 | 23,642,432 | |||||||||
| 124,000 | PayPal Holdings Inc.† | 7,566,281 | 9,128,880 | |||||||||
| 13,900 | SBA Communications Corp.† | 1,552,784 | 2,270,704 | |||||||||
| 51,000 | The Charles Schwab Corp. | 1,548,400 | 2,619,870 | |||||||||
| 135,500 | Visa Inc., Cl. A | 3,924,904 | 15,449,710 | |||||||||
|
|
|
| |||||||||
| 57,285,505 | 96,867,891 | |||||||||||
|
|
|
| |||||||||
CONSUMER DISCRETIONARY - OTHER — 14.5% |
| |||||||||||
| 25,000 | Amazon.com Inc.† | 11,093,715 | 29,236,750 | |||||||||
| 36,200 | Costco Wholesale Corp. | 4,117,520 | 6,737,544 | |||||||||
| 73,600 | NIKE Inc., Cl. B | 2,343,260 | 4,603,680 | |||||||||
| 214,200 | Starbucks Corp. | 8,673,097 | 12,301,506 | |||||||||
| 142,200 | The Home Depot Inc. | 15,705,451 | 26,951,166 | |||||||||
| 2,400 | The Priceline Group Inc.† | 2,629,447 | 4,170,576 | |||||||||
| 21,100 | Netflix Inc.† | 3,568,683 | 4,050,356 | |||||||||
|
|
|
| |||||||||
| 48,131,173 | 88,051,578 | |||||||||||
|
|
|
| |||||||||
TECHNOLOGY - COMPUTER TECHNOLOGY, SEMICON- |
| |||||||||||
| 241,500 | Apple Inc. | 13,851,454 | 40,869,045 | |||||||||
Shares | Cost | Market Value | ||||||||||
| 80,000 | Applied Materials Inc. | $ | 3,857,402 | $ | 4,089,600 | |||||||
| 20,700 | Broadcom Ltd. | 5,115,860 | 5,317,830 | |||||||||
| 34,000 | NVIDIA Corp. | 5,627,918 | 6,579,000 | |||||||||
| 53,500 | Texas Instruments Inc. | 3,966,621 | 5,587,540 | |||||||||
|
|
|
| |||||||||
| 32,419,255 | 62,443,015 | |||||||||||
|
|
|
| |||||||||
PRODUCER DURABLES — 8.7% |
| |||||||||||
| 30,500 | 3M Co. | 3,989,218 | 7,178,785 | |||||||||
| 45,000 | Honeywell International Inc. | 4,805,507 | 6,901,200 | |||||||||
| 14,600 | Lockheed Martin Corp. | 4,469,083 | 4,687,330 | |||||||||
| 58,100 | Parker-Hannifin Corp. | 10,175,958 | 11,595,598 | |||||||||
| 17,600 | Rockwell Automation Inc. | 3,356,556 | 3,455,760 | |||||||||
| 24,000 | Roper Technologies Inc. | 5,919,372 | 6,216,000 | |||||||||
| 42,500 | The Boeing Co. | 7,306,783 | 12,533,675 | |||||||||
|
|
|
| |||||||||
| 40,022,477 | 52,568,348 | |||||||||||
|
|
|
| |||||||||
CONSUMER DISCRETIONARY - MEDIA — 4.2% |
| |||||||||||
| 7,200 | Charter Communications Inc., Cl. A† | 2,503,904 | 2,418,912 | |||||||||
| 246,000 | Comcast Corp., Cl. A | 8,016,552 | 9,852,300 | |||||||||
| 123,700 | The Walt Disney Co. | 13,046,499 | 13,298,987 | |||||||||
|
|
|
| |||||||||
| 23,566,955 | 25,570,199 | |||||||||||
|
|
|
| |||||||||
MATERIALS AND PROCESSING — 2.3% |
| |||||||||||
| 30,100 | Ecolab Inc. | 2,641,273 | 4,038,818 | |||||||||
| 24,500 | The Sherwin-Williams Co. | 6,408,557 | 10,045,980 | |||||||||
|
|
|
| |||||||||
| 9,049,830 | 14,084,798 | |||||||||||
|
|
|
| |||||||||
CONSUMER STAPLES — 2.1% |
| |||||||||||
| 102,600 | Blue Buffalo Pet Products Inc.† | 2,595,057 | 3,364,254 | |||||||||
| 80,100 | PepsiCo Inc. | 7,143,952 | 9,605,592 | |||||||||
|
|
|
| |||||||||
| 9,739,009 | 12,969,846 | |||||||||||
|
|
|
| |||||||||
TOTAL COMMON STOCKS | 367,634,391 | 606,838,262 | ||||||||||
|
|
|
| |||||||||
Principal Amount | ||||||||||||
U.S. GOVERNMENT OBLIGATIONS — 0.3% |
| |||||||||||
| $1,772,000 | U.S. Treasury Bills, 1.354%††, 03/29/18 | 1,766,221 | 1,766,227 | |||||||||
|
|
|
| |||||||||
TOTAL INVESTMENTS — 100.1% | $ | 369,400,612 | 608,604,489 | |||||||||
|
| |||||||||||
Other Assets and Liabilities (Net) — (0.1)% |
| (337,045 | ) | |||||||||
|
| |||||||||||
NET ASSETS — 100.0% |
| $ | 608,267,444 | |||||||||
|
| |||||||||||
| † | Non-income producing security. |
| †† | Represents annualized yield at date of purchase. |
See accompanying notes to financial statements.
7
The GAMCO Growth Fund
Statement of Assets and Liabilities
December 31, 2017
| ||||
Assets: | ||||
Investments, at value (cost $369,400,612) | $ | 608,604,489 | ||
Cash | 2,087 | |||
Receivable for Fund shares sold | 565,777 | |||
Dividends receivable | 353,304 | |||
Prepaid expenses | 36,716 | |||
Other receivables | 24,518 | |||
|
| |||
Total Assets | 609,586,891 | |||
|
| |||
Liabilities: | ||||
Payable for Fund shares redeemed | 445,494 | |||
Payable for investment advisory fees | 519,981 | |||
Payable for distribution fees | 120,646 | |||
Payable for accounting fees | 3,750 | |||
Payable for shareholder services fees | 104,953 | |||
Other accrued expenses | 124,623 | |||
|
| |||
Total Liabilities | 1,319,447 | |||
|
| |||
Net Assets | $ | 608,267,444 | ||
|
| |||
Net Assets Consist of: | ||||
Paid-in capital | $ | 367,851,709 | ||
Accumulated net realized gains on investments and foreign currency transactions | 1,210,153 | |||
Net unrealized appreciation on investments | 239,203,877 | |||
Net unrealized appreciation on foreign currency translations | 1,705 | |||
|
| |||
Net Assets | $ | 608,267,444 | ||
|
| |||
Shares of Beneficial Interest, each at $0.01 par value; unlimited number of shares authorized: | ||||||
Class AAA: | ||||||
Net Asset Value, offering, and redemption price per share ($550,300,254 ÷ 9,698,983 shares outstanding) | $56.74 | |||||
|
| |||||
Class A: | ||||||
Net Asset Value and redemption price per share ($3,448,606 ÷ 60,761 shares outstanding) | $56.76 | |||||
|
| |||||
Maximum offering price per share (NAV ÷ 0.9425, based on maximum sales charge of 5.75% of the offering price) | $60.22 | |||||
|
| |||||
Class C: | ||||||
Net Asset Value and offering price per share ($2,714,614 ÷ 54,266 shares outstanding) | $50.02 | (a) | ||||
|
| |||||
Class I: | ||||||
Net Asset Value, offering, and redemption price per share ($51,802,833 ÷ 895,190 shares outstanding) | $57.87 | |||||
|
| |||||
Class T: | ||||||
Net Asset Value and redemption price per share ($1,136.91 ÷ 20.04 shares outstanding; shares authorized) | $56.73 | |||||
|
| |||||
Maximum offering price per share (NAV ÷ 0.975, based on maximum sales charge of 2.50% of the offering price) | $58.18 | |||||
|
|
| (a) | Redemption price varies based on the length of time held. |
Statement of Operations
For the Year Ended December 31, 2017
| ||||
Investment Income: | ||||
Dividends | $ | 7,031,284 | ||
Interest | 52,776 | |||
Other income* | 387 | |||
|
| |||
Total Investment Income | 7,084,447 | |||
|
| |||
Expenses: | ||||
Investment advisory fees | 5,621,350 | |||
Distribution fees - Class AAA | 1,278,484 | |||
Distribution fees - Class A | 8,347 | |||
Distribution fees - Class C | 21,819 | |||
Distribution fees - Class T | 1 | |||
Shareholder services fees | 438,861 | |||
Trustees’ fees | 128,349 | |||
Shareholder communications expenses | 122,422 | |||
Registration expenses | 62,387 | |||
Accounting fees | 45,000 | |||
Legal and audit fees | 41,151 | |||
Custodian fees | 37,595 | |||
Interest expense | 143 | |||
Miscellaneous expenses | 40,913 | |||
|
| |||
Total Expenses | 7,846,822 | |||
|
| |||
Less: | ||||
Expenses paid indirectly by broker (See Note 6) | (4,754 | ) | ||
|
| |||
Net Expenses | 7,842,068 | |||
|
| |||
Net Investment Loss | (757,621 | ) | ||
|
| |||
Net Realized and Unrealized Gain/(Loss) on | ||||
Investments and Foreign Currency: | ||||
Net realized gain on investments | 38,837,420 | |||
Net realized loss on foreign currency transactions | (10,251 | ) | ||
|
| |||
Net realized gain on investments and foreign currency transactions | 38,827,169 | |||
|
| |||
Net change in unrealized appreciation/depreciation: | ||||
on investments | 105,781,710 | |||
on foreign currency translations | 17,329 | |||
|
| |||
Net change in unrealized appreciation/depreciation on investments and foreign currency translations | 105,799,039 | |||
|
| |||
Net Realized and Unrealized Gain/(Loss) on Investments and Foreign Currency | 144,626,208 | |||
|
| |||
Net Increase in Net Assets Resulting from Operations | $ | 143,868,587 | ||
|
| |||
| * | The Fund received a reimbursement of custody expenses paid in prior years. |
See accompanying notes to financial statements.
8
The GAMCO Growth Fund
Statement of Changes in Net Assets
| Year Ended December 31, 2017 | Year Ended December 31, 2016 | |||||||
Operations: | ||||||||
Net investment loss | $ | (757,621 | ) | $ | (106,298 | ) | ||
Net realized gain on investments and foreign currency transactions | 38,827,169 | 25,703,218 | ||||||
Net change in unrealized appreciation/depreciation on investments and foreign currency translations |
| 105,799,039
|
| (11,573,884 | ) | |||
Net Increase in Net Assets Resulting from Operations |
| 143,868,587
|
| 14,023,036 | ||||
Distributions to Shareholders: | ||||||||
Net realized gain | ||||||||
Class AAA | (32,729,163 | ) | (22,539,442 | ) | ||||
Class A | (189,723 | ) | (151,817 | ) | ||||
Class C | (177,657 | ) | (96,726 | ) | ||||
Class I | (3,020,357 | ) | (1,777,606 | ) | ||||
Class T |
| (67
| )
| — | ||||
| (36,116,967 | ) | (24,565,591 | ) | |||||
|
|
|
| |||||
Return of capital | ||||||||
Class AAA | — | (232,833 | ) | |||||
Class A | — | (1,568 | ) | |||||
Class C | — | (999 | ) | |||||
Class I |
| —
|
| (18,363) | ||||
|
| —
|
| (253,763 | ) | ||||
Total Distributions to Shareholders | (36,116,967 | ) | (24,819,354 | ) | ||||
|
|
|
| |||||
Shares of Beneficial Interest Transactions: | ||||||||
Class AAA | (8,339,487 | ) | (13,830,307 | ) | ||||
Class A | (274,737 | ) | (9,624 | ) | ||||
Class C | 580,734 | (645,860 | ) | |||||
Class I | 6,401,302 | 2,028,373 | ||||||
Class T |
| 1,067
|
| — | ||||
Net Decrease in Net Assets from Shares of Beneficial Interest Transactions |
| (1,631,121
| )
| (12,457,418 | ) | |||
Redemption Fees |
| 366
|
| 38 | ||||
Net Increase/(Decrease) in Net Assets | 106,120,865 | (23,253,698 | ) | |||||
Net Assets: | ||||||||
Beginning of year |
| 502,146,579
|
| 525,400,277 | ||||
End of year (including undistributed net investment income of $0 and $0, respectively) |
| $608,267,444
|
| $502,146,579 | ||||
See accompanying notes to financial statements.
9
The GAMCO Growth Fund
Financial Highlights
Selected data for a share of beneficial interest outstanding throughout each period:
| Income (Loss) from Investment Operations | Distributions | Ratios to Average Net Assets/ Supplemental Data | |||||||||||||||||||||||||||||||||||||||||||||||||||||||||||||||||||||||||
Year Ended December 31 | Net Asset Value, Beginning of Year | Net Investment (Loss)(a) | Net Realized and Unrealized Gain (Loss) on Investments | Total from Investment Operations | Net Investment Income | Net Realized Gain on Investments | Return of Capital | Total Distributions | Redemption Fees (a)(b) | Net Asset Value, End of Year | Total Return† | Net Assets End of Year (in 000’s) | Net Investment Income (Loss) | Operating Expenses | Portfolio Turnover Rate | ||||||||||||||||||||||||||||||||||||||||||||||||||||||||||||
Class AAA | |||||||||||||||||||||||||||||||||||||||||||||||||||||||||||||||||||||||||||
2017 | $ | 46.56 | $ | (0.08 | ) | $ | 13.82 | $ | 13.74 | — | $ | (3.56 | ) | — | $ | (3.56 | ) | $ | 0.00 | $ | 56.74 | 29.5 | % | $ | 550,300 | (0.15)% | 1.41%(c) | 50% | |||||||||||||||||||||||||||||||||||||||||||||||
2016 | 47.60 | (0.02 | ) | 1.39 | 1.37 | — | (2.38 | ) | $ | (0.03 | ) | (2.41 | ) | 0.00 | 46.56 | 2.8 | 460,437 | (0.04) | 1.44(c)(d) | 52 | |||||||||||||||||||||||||||||||||||||||||||||||||||||||
2015 | 48.93 | (0.05 | ) | 2.62 | 2.57 | — | (3.90 | ) | — | (3.90 | ) | 0.00 | 47.60 | 5.1 | 484,320 | (0.11) | 1.43(c) | 40 | |||||||||||||||||||||||||||||||||||||||||||||||||||||||||
2014 | 46.62 | (0.06 | ) | 4.66 | 4.60 | — | (2.29 | ) | — | (2.29 | ) | 0.00 | 48.93 | 9.8 | 514,214 | (0.13) | 1.43 | 34 | |||||||||||||||||||||||||||||||||||||||||||||||||||||||||
2013 | 34.81 | 0.01 | 11.81 | 11.82 | $ | (0.01 | ) | — | — | (0.01 | ) | 0.00 | 46.62 | 34.0 | 505,727 | 0.02 | 1.45 | 35 | |||||||||||||||||||||||||||||||||||||||||||||||||||||||||
Class A | |||||||||||||||||||||||||||||||||||||||||||||||||||||||||||||||||||||||||||
2017 | $ | 46.57 | $ | (0.08 | ) | $ | 13.83 | $ | 13.75 | — | $ | (3.56 | ) | — | $ | (3.56 | ) | $ | 0.00 | $ | 56.76 | 29.5 | % | $ | 3,448 | (0.15)% | 1.41%(c) | 50% | |||||||||||||||||||||||||||||||||||||||||||||||
2016 | 47.61 | (0.02 | ) | 1.39 | 1.37 | — | (2.38 | ) | $ | (0.03 | ) | (2.41 | ) | 0.00 | 46.57 | 2.8 | 3,066 | (0.03) | 1.44(c)(d) | 52 | |||||||||||||||||||||||||||||||||||||||||||||||||||||||
2015 | 48.93 | (0.05 | ) | 2.63 | 2.58 | — | (3.90 | ) | — | (3.90 | ) | 0.00 | 47.61 | 5.1 | 3,120 | (0.10) | 1.43(c) | 40 | |||||||||||||||||||||||||||||||||||||||||||||||||||||||||
2014 | 46.62 | (0.06 | ) | 4.66 | 4.60 | — | (2.29 | ) | — | (2.29 | ) | 0.00 | 48.93 | 9.8 | 1,626 | (0.13) | 1.43 | 34 | |||||||||||||||||||||||||||||||||||||||||||||||||||||||||
2013 | 34.82 | 0.01 | 11.82 | 11.83 | $ | (0.02 | ) | — | — | (0.02 | ) | 0.00 | 46.62 | 34.0 | 1,355 | 0.01 | 1.45 | 35 | |||||||||||||||||||||||||||||||||||||||||||||||||||||||||
Class C | |||||||||||||||||||||||||||||||||||||||||||||||||||||||||||||||||||||||||||
2017 | $ | 41.68 | $ | (0.44 | ) | $ | 12.34 | $ | 11.90 | — | $ | (3.56 | ) | — | $ | (3.56 | ) | $ | 0.00 | $ | 50.02 | 28.5 | % | $ | 2,715 | (0.90)% | 2.16%(c) | 50% | |||||||||||||||||||||||||||||||||||||||||||||||
2016 | 43.18 | (0.35 | ) | 1.26 | 0.91 | — | (2.38 | ) | $ | (0.03 | ) | (2.41 | ) | 0.00 | 41.68 | 2.1 | 1,778 | (0.81) | 2.19(c)(d) | 52 | |||||||||||||||||||||||||||||||||||||||||||||||||||||||
2015 | 45.06 | (0.40 | ) | 2.42 | 2.02 | — | (3.90 | ) | — | (3.90 | ) | 0.00 | 43.18 | 4.3 | 2,476 | (0.86) | 2.18(c) | 40 | |||||||||||||||||||||||||||||||||||||||||||||||||||||||||
2014 | 43.42 | (0.39 | ) | 4.32 | 3.93 | — | (2.29 | ) | — | (2.29 | ) | 0.00 | 45.06 | 9.0 | 1,438 | (0.87) | 2.18 | 34 | |||||||||||||||||||||||||||||||||||||||||||||||||||||||||
2013 | 32.66 | (0.27 | ) | 11.03 | 10.76 | — | — | — | — | 0.00 | 43.42 | 33.0 | 1,221 | (0.73) | 2.20 | 35 | |||||||||||||||||||||||||||||||||||||||||||||||||||||||||||
Class I | |||||||||||||||||||||||||||||||||||||||||||||||||||||||||||||||||||||||||||
2017 | $ | 47.31 | $ | 0.06 | $ | 14.06 | $ | 14.12 | — | $ | (3.56 | ) | — | $ | (3.56 | ) | $ | 0.00 | $ | 57.87 | 29.8 | % | $ | 51,803 | 0.10% | 1.16%(c) | 50% | ||||||||||||||||||||||||||||||||||||||||||||||||
2016 | 48.22 | 0.11 | 1.39 | 1.50 | — | (2.38 | ) | $ | (0.03 | ) | (2.41 | ) | 0.00 | 47.31 | 3.1 | 36,866 | 0.22 | 1.19(c)(d) | 52 | ||||||||||||||||||||||||||||||||||||||||||||||||||||||||
2015 | 49.39 | 0.07 | 2.66 | 2.73 | — | (3.90 | ) | — | (3.90 | ) | 0.00 | 48.22 | 5.4 | 35,484 | 0.14 | 1.17(c) | 40 | ||||||||||||||||||||||||||||||||||||||||||||||||||||||||||
2014 | 46.92 | 0.06 | 4.70 | 4.76 | — | (2.29 | ) | — | (2.29 | ) | 0.00 | 49.39 | 10.1 | 16,336 | 0.11 | 1.18 | 34 | ||||||||||||||||||||||||||||||||||||||||||||||||||||||||||
2013 | 35.03 | 0.11 | 11.90 | 12.01 | $ | (0.12 | ) | — | — | (0.12 | ) | 0.00 | 46.92 | 34.3 | 12,395 | 0.27 | 1.20 | 35 | |||||||||||||||||||||||||||||||||||||||||||||||||||||||||
Class T(e) | |||||||||||||||||||||||||||||||||||||||||||||||||||||||||||||||||||||||||||
2017 | $ | 53.02 | $ | (0.05 | ) | $ | 7.32 | $ | 7.27 | — | $ | (3.56 | ) | — | $ | (3.56 | ) | — | $ | 56.73 | 13.7 | % | $ | 1 | (0.19)%(f) | 1.41%(c)(f) | 50% | ||||||||||||||||||||||||||||||||||||||||||||||||
| † | Total return represents aggregate total return of a hypothetical $1,000 investment at the beginning of the period and sold at the end of the period including reinvestment of distributions and does not reflect applicable sales charges. Total return for a period of less than one year is not annualized. |
| (a) | Per share amounts have been calculated using the average shares outstanding method. |
| (b) | Amount represents less than $0.005 per share. |
| (c) | The Fund received credits from a designated broker who agreed to pay certain Fund operating expenses. For the years ended December 31, 2017, 2016, and 2015, there was no impact on the expense ratios. |
| (d) | During the year ended December 31, 2016, the Fund received a reimbursement of custody expenses paid in prior years. Had such reimbursement (allocated by relative net asset values of the Fund’s share classes) been included in this period, the annualized expense ratios would have been 1.33% (Class AAA), 1.33% (Class A), 2.09% (Class C), and 1.07% (Class I). |
| (e) | Class T Shares were initially offered on July 5, 2017. |
| (f) | Annualized. |
See accompanying notes to financial statements.
10
The GAMCO Growth Fund
Notes to Financial Statements
1. Organization. The GAMCO Growth Fund was organized on October 24, 1986 as a Massachusetts business trust and commenced investment operations on April 10, 1987. On July 5, 2017, the Fund began to offer for sale Class T Shares. The Fund is a diversified open-end management investment company registered under the Investment Company Act of 1940, as amended (the “1940 Act”). The Fund’s primary objective is capital appreciation.
2. Significant Accounting Policies. As an investment company, the Fund follows the investment company accounting and reporting guidance, which is part of U.S. generally accepted accounting principles (“GAAP”) that may require the use of management estimates and assumptions in the preparation of its financial statements. Actual results could differ from those estimates. The following is a summary of significant accounting policies followed by the Fund in the preparation of its financial statements.
Security Valuation. Portfolio securities listed or traded on a nationally recognized securities exchange or traded in the U.S. over-the-counter market for which market quotations are readily available are valued at the last quoted sale price or a market’s official closing price as of the close of business on the day the securities are being valued. If there were no sales that day, the security is valued at the average of the closing bid and asked prices or, if there were no asked prices quoted on that day, then the security is valued at the closing bid price on that day. If no bid or asked prices are quoted on such day, the security is valued at the most recently available price or, if the Board of Trustees (the “Board”) so determines, by such other method as the Board shall determine in good faith to reflect its fair market value. Portfolio securities traded on more than one national securities exchange or market are valued according to the broadest and most representative market, as determined by Gabelli Funds, LLC (the “Adviser”).
Portfolio securities primarily traded on a foreign market are generally valued at the preceding closing values of such securities on the relevant market, but may be fair valued pursuant to procedures established by the Board if market conditions change significantly after the close of the foreign market, but prior to the close of business on the day the securities are being valued. Debt obligations for which market quotations are readily available are valued at the average of the latest bid and asked prices. If there were no asked prices quoted on such day, the security is valued using the closing bid price, unless the Board determines such amount does not reflect the securities’ fair value, in which case these securities will be fair valued as determined by the Board. Certain securities are valued principally using dealer quotations. Futures contracts are valued at the closing settlement price of the exchange or board of trade on which the applicable contract is traded. OTC futures and options on futures for which market quotations are readily available will be valued by quotations received from a pricing service or, if no quotations are available from a pricing service, by quotations obtained from one or more dealers in the instrument in question by the Adviser.
Securities and assets for which market quotations are not readily available are fair valued as determined by the Board. Fair valuation methodologies and procedures may include, but are not limited to: analysis and review of available financial and non-financial information about the company; comparisons with the valuation and changes in valuation of similar securities, including a comparison of foreign securities with the equivalent U.S. dollar value American Depositary Receipt securities at the close of the U.S. exchange; and evaluation of any other information that could be indicative of the value of the security.
11
The GAMCO Growth Fund
Notes to Financial Statements (Continued)
The inputs and valuation techniques used to measure fair value of the Fund’s investments are summarized into three levels as described in the hierarchy below:
| ● | Level 1 — quoted prices in active markets for identical securities; |
| ● | Level 2 — other significant observable inputs (including quoted prices for similar securities, interest rates, prepayment speeds, credit risk, etc.); and |
| ● | Level 3 — significant unobservable inputs (including the Board’s determinations as to the fair value of investments). |
A financial instrument’s level within the fair value hierarchy is based on the lowest level of any input both individually and in the aggregate that is significant to the fair value measurement. The inputs or methodology used for valuing securities are not necessarily an indication of the risk associated with investing in those securities. The summary of the Fund’s investments in securities by inputs used to value the Fund’s investments as of December 31, 2017 is as follows:
Valuation Inputs* | Investments in Securities (Market Value) | |||
Level 1 - Quoted Prices | $ | 606,838,262 | ||
Level 2 - Other Significant Observable Inputs | 1,766,227 | |||
|
| |||
Total | $ | 608,604,489 | ||
|
| |||
| * | Portfolio holdings designated in Level 1 and Level 2 are disclosed individually in the Schedule of Investments (“SOI”). Please refer to the SOI for the industry classifications of these portfolio holdings. Level 1 consists of Common Stocks. Level 2 consists of U.S. Government Obligations. |
The Fund did not have transfers between Level 1 and Level 2 during the year ended December 31, 2017. The Fund’s policy is to recognize transfers among Levels as of the beginning of the reporting period.
There were no Level 3 investments held at December 31, 2017 or December 31, 2016.
Additional Information to Evaluate Qualitative Information.
General. The Fund uses recognized industry pricing services – approved by the Board and unaffiliated with the Adviser – to value most of its securities, and uses broker quotes provided by market makers of securities not valued by these and other recognized pricing sources. Several different pricing feeds are received to value domestic equity securities, international equity securities, preferred equity securities, and fixed income securities. The data within these feeds are ultimately sourced from major stock exchanges and trading systems where these securities trade. The prices supplied by external sources are checked by obtaining quotations or actual transaction prices from market participants. If a price obtained from the pricing source is deemed unreliable, prices will be sought from another pricing service or from a broker/dealer that trades that security or similar securities.
Fair Valuation. Fair valued securities may be common or preferred equities, warrants, options, rights, or fixed income obligations. Where appropriate, Level 3 securities are those for which market quotations are not available, such as securities not traded for several days, or for which current bids are not available, or which are restricted as to transfer. Among the factors to be considered to fair value a security are recent prices of comparable securities that are publicly traded, reliable prices of securities not publicly traded, the use of valuation
12
The GAMCO Growth Fund
Notes to Financial Statements (Continued)
models, current analyst reports, valuing the income or cash flow of the issuer, or cost if the preceding factors do not apply. The circumstances of Level 3 securities are frequently monitored to determine if fair valuation measures continue to apply.
The Adviser reports quarterly to the Board the results of the application of fair valuation policies and procedures. These include back testing the prices realized in subsequent trades of these fair valued securities to fair values previously recognized.
Foreign Currency Translations. The books and records of the Fund are maintained in U.S. dollars. Foreign currencies, investments, and other assets and liabilities are translated into U.S. dollars at current exchange rates. Purchases and sales of investment securities, income, and expenses are translated at the exchange rate prevailing on the respective dates of such transactions. Unrealized gains and losses that result from changes in foreign exchange rates and/or changes in market prices of securities have been included in unrealized appreciation/depreciation on investments and foreign currency translations. Net realized foreign currency gains and losses resulting from changes in exchange rates include foreign currency gains and losses between trade date and settlement date on investment securities transactions, foreign currency transactions, and the difference between the amounts of interest and dividends recorded on the books of the Fund and the amounts actually received. The portion of foreign currency gains and losses related to fluctuation in exchange rates between the initial purchase trade date and subsequent sale trade date is included in realized gain/(loss) on investments.
Foreign Securities. The Fund may directly purchase securities of foreign issuers. Investing in securities of foreign issuers involves special risks not typically associated with investing in securities of U.S. issuers. The risks include possible revaluation of currencies, the inability to repatriate funds, less complete financial information about companies, and possible future adverse political and economic developments. Moreover, securities of many foreign issuers and their markets may be less liquid and their prices more volatile than of securities of comparable U.S. issuers.
Foreign Taxes. The Fund may be subject to foreign taxes on income, gains on investments, or currency repatriation, a portion of which may be recoverable. The Fund will accrue such taxes and recoveries as applicable, based upon its current interpretation of tax rules and regulations that exist in the markets in which it invests.
Securities Transactions and Investment Income. Securities transactions are accounted for on the trade date with realized gain/(loss) on investments determined by using the identified cost method. Interest income (including amortization of premium and accretion of discount) is recorded on an accrual basis. Premiums and discounts on debt securities are amortized using the effective yield to maturity method. Dividend income is recorded on the ex-dividend date, except for certain dividends from foreign securities that are recorded as soon after the ex-dividend date as the Fund becomes aware of such dividends.
Determination of Net Asset Value and Calculation of Expenses. Certain administrative expenses are common to, and allocated among, various affiliated funds. Such allocations are made on the basis of each fund’s average net assets or other criteria directly affecting the expenses as determined by the Adviser pursuant to procedures established by the Board.
In calculating the NAV per share of each class, investment income, realized and unrealized gains and losses, redemption fees, and expenses other than class specific expenses are allocated daily to each class of shares based upon the proportion of net assets of each class at the beginning of each day. Distribution expenses are borne solely by the class incurring the expense.
13
The GAMCO Growth Fund
Notes to Financial Statements (Continued)
Distributions to Shareholders. Distributions to shareholders are recorded on the ex-dividend date. Distributions to shareholders are based on income and capital gains as determined in accordance with federal income tax regulations, which may differ from income and capital gains as determined under GAAP. These differences are primarily due to differing treatments of income and gains on various investment securities held by the Fund and timing differences. These book/tax differences are either temporary or permanent in nature. To the extent these differences are permanent, adjustments are made to the appropriate capital accounts in the period when the differences arise. Permanent differences were primarily due to short term gains netted against current year net operating loss. These reclassifications have no impact on the NAV of the Fund. For the year ended December 31, 2017, reclassifications were made to decrease accumulated net investment loss by $757,621 and decrease net realized gain on investments and foreign currency transactions by $753,812 with an offsetting adjustment to paid-in capital.
The tax character of distributions paid during the years ended December 31, 2017 and 2016 was as follows:
| Year Ended December 31, 2017 | Year Ended December 31, 2016 | |||||||||
Distributions paid from: | ||||||||||
Ordinary income (inclusive of short term capital gains) | $ | 679,692 | — | |||||||
Net long term capital gains | 35,437,275 | $ | 24,565,591 | |||||||
Return of capital | — | 253,763 | ||||||||
Total distributions paid | $ | 36,116,967 | $ | 24,819,354 | ||||||
|
|
|
| |||||||
Provision for Income Taxes. The Fund intends to continue to qualify as a regulated investment company under Subchapter M of the Internal Revenue Code of 1986, as amended (the “Code”). It is the policy of the Fund to comply with the requirements of the Code applicable to regulated investment companies and to distribute substantially all of its net investment company taxable income and net capital gains. Therefore, no provision for federal income taxes is required.
As of December 31, 2017, the components of accumulated earnings/losses on a tax basis were as follows:
Undistributed long term capital gains | $ | 1,335,445 | ||
Net unrealized appreciation on investments and foreign currency translations | 239,080,290 | |||
Total | $ | 240,415,735 |
As of December 31, 2017, the differences between book basis and tax basis unrealized appreciation were primarily due to deferral of losses from wash sales for tax purposes.
14
The GAMCO Growth Fund
Notes to Financial Statements (Continued)
The following summarizes the tax cost of investments and the related net unrealized appreciation at December 31, 2017:
Cost | Gross | Gross | Net Unrealized | |||||||||||
Investments | $369,525,904 | $239,342,875 | $(264,290) | $239,078,585 | ||||||||||
The Fund is required to evaluate tax positions taken or expected to be taken in the course of preparing the Fund’s tax returns to determine whether the tax positions are “more-likely-than-not” of being sustained by the applicable tax authority. Income tax and related interest and penalties would be recognized by the Fund as tax expense in the Statement of Operations if the tax positions were deemed not to meet the more-likely-than-not threshold. During the year ended December 31, 2017, the Fund recognized $24,518 in income tax, interest, or penalties. As of December 31, 2017, the Adviser has reviewed all open tax years and concluded that there was no impact to the Fund’s net assets or results of operations. The Fund’s federal and state tax returns for the prior three fiscal years remain open, subject to examination. On an ongoing basis, the Adviser will monitor the Fund’s tax positions to determine if adjustments to this conclusion are necessary.
3. Investment Advisory Agreement and Other Transactions. The Fund has entered into an investment advisory agreement (the “Advisory Agreement”) with the Adviser which provides that the Fund will pay the Adviser a fee, computed daily and paid monthly, at the annual rate of 1.00% of the value of its average daily net assets. In accordance with the Advisory Agreement, the Adviser provides a continuous investment program for the Fund’s portfolio, oversees the administration of all aspects of the Fund’s business and affairs, and pays the compensation of all Officers and Trustees of the Fund who are affiliated persons of the Adviser.
The Fund pays each Trustee who is not considered an affiliated person an annual retainer of $9,000 plus $2,000 for each Board meeting attended. Each Trustee is reimbursed by the Fund for any out of pocket expenses incurred in attending meetings. All Board committee members receive $500 per meeting attended. The Chairman of the Audit Committee and the Lead Trustee each receives an annual fee of $2,000. The Chairman of the Proxy Voting Committee and Nominating Committee each receives a $1,000 annual fee. A Trustee may receive a single meeting fee, allocated among the participating funds, for attending certain meetings held on behalf of multiple funds. Trustees who are directors or employees of the Adviser or an affiliated company receive no compensation or expense reimbursement from the Fund.
4. Distribution Plan. The Fund’s Board has adopted a distribution plan (the “Plan”) for each class of shares, except for Class I Shares, pursuant to Rule 12b-1 under the 1940 Act. Under the Class AAA, Class A, Class C, and Class T Share Plans, payments are authorized to G.distributors, LLC (the “Distributor”), an affiliate of the Adviser, at annual rates of 0.25%, 0.25%, 1.00%, and 0.25%, respectively, of the average daily net assets of those classes, the annual limitations under each Plan. Such payments are accrued daily and paid monthly.
5. Portfolio Securities. Purchases and sales of securities during the year ended December 31, 2017, other than short term securities and U.S. Government obligations, aggregated $277,274,546 and $312,128,851 respectively.
6. Transactions with Affiliates and Other Arrangements. During the year ended December 31, 2017, the Fund paid $150 in brokerage commissions on security trades to G.research, LLC, an affiliate of the Adviser. Additionally, the Distributor retained a total of $2,328 from investors representing commissions (sales charges and underwriting fees) on sales and redemptions of Fund shares.
15
The GAMCO Growth Fund
Notes to Financial Statements (Continued)
During the year ended December 31, 2017, the Fund received credits from a designated broker who agreed to pay certain Fund operating expenses. The amount of such expenses paid through this directed brokerage arrangement during this period was $4,754.
The cost of calculating the Fund’s NAV per share is a Fund expense pursuant to the Advisory Agreement. During the year ended December 31, 2017, the Fund paid or accrued $45,000 to the Adviser in connection with the cost of computing the Fund’s NAV.
7. Line of Credit. The Fund participates in an unsecured line of credit, which expires on March 8, 2018 and may be renewed annually, of up to $75,000,000 under which it may borrow up to 10% of net assets from the custodian for temporary borrowing purposes. Borrowings under this arrangement bear interest at a floating rate equal to the higher of the overnight Federal Funds rate plus 125 basis points or the 30 day LIBOR plus 125 basis points in effect on that day. This amount, if any, would be included in “Interest expense” in the Statement of Operations. At December 31, 2017, there were no borrowings outstanding under the line of credit.
During the year ended December 31, 2017, the Fund had a one day borrowing of $454,000 at an interest rate of 2.36%.
8. Shares of Beneficial Interest. The Fund offers five classes of shares – Class AAA Shares, Class A Shares, Class C Shares, Class I Shares, and Class T Shares. Class AAA and Class I Shares are offered without a sales charge. Class A Shares and Class T Shares are subject to a maximum front-end sales charge of 5.75% and 2.50%, respectively. Class C Shares are subject to a 1.00% contingent deferred sales charge for one year after purchase.
The Fund imposes a redemption fee of 2.00% on all classes of shares that are redeemed or exchanged on or before the seventh day after the date of a purchase. The redemption fee is deducted from the proceeds otherwise payable to the redeeming shareholders and is retained by the Fund as an increase in paid-in capital. The redemption fees retained by the Fund during the years ended December 31, 2017 and 2016, if any, can be found in the Statement of Changes in Net Assets under Redemption Fees.
16
The GAMCO Growth Fund
Notes to Financial Statements (Continued)
Transactions in shares of beneficial interest were as follows:
| Year Ended December 31, 2017 | Year Ended December 31, 2016 | |||||||||||||||||
| Shares | Amount | Shares | Amount | |||||||||||||||
Class AAA | ||||||||||||||||||
Shares sold | 148,434 | $ | 8,042,094 | 125,426 | $ | 5,909,865 | ||||||||||||
Shares issued upon reinvestment of distributions | 547,337 | 31,154,454 | 461,848 | 21,693,346 | ||||||||||||||
Shares redeemed | (886,616 | ) | (47,536,035 | ) | (871,977 | ) | (41,433,518 | ) | ||||||||||
|
|
|
|
|
|
|
| |||||||||||
Net decrease | (190,845 | ) | $ | (8,339,487 | ) | (284,703 | ) | $ | (13,830,307 | ) | ||||||||
|
|
|
|
|
|
|
| |||||||||||
Class A | ||||||||||||||||||
Shares sold | 17,591 | $ | 996,265 | 14,495 | $ | 670,379 | ||||||||||||
Shares issued upon reinvestment of distributions | 3,212 | 182,894 | 3,032 | 142,429 | ||||||||||||||
Shares redeemed | (25,881 | ) | (1,453,896 | ) | (17,211 | ) | (822,432 | ) | ||||||||||
|
|
|
|
|
|
|
| |||||||||||
Net increase/(decrease) | (5,078 | ) | $ | (274,737 | ) | 316 | $ | (9,624 | ) | |||||||||
|
|
|
|
|
|
|
| |||||||||||
Class C | ||||||||||||||||||
Shares sold | 18,678 | $ | 908,417 | 23,248 | $ | 993,003 | ||||||||||||
Shares issued upon reinvestment of distributions | 3,173 | 159,195 | 1,886 | 79,321 | ||||||||||||||
Shares redeemed | (10,225 | ) | (486,878 | ) | (39,843 | ) | (1,718,184 | ) | ||||||||||
|
|
|
|
|
|
|
| |||||||||||
Net increase/(decrease) | 11,626 | $ | 580,734 | (14,709 | ) | $ | (645,860 | ) | ||||||||||
|
|
|
|
|
|
|
| |||||||||||
Class I | ||||||||||||||||||
Shares sold | 144,712 | $ | 7,751,098 | 125,180 | $ | 5,977,875 | ||||||||||||
Shares issued upon reinvestment of distributions | 46,214 | 2,682,718 | 33,609 | 1,604,168 | ||||||||||||||
Shares redeemed | (74,956 | ) | (4,032,514 | ) | (115,515 | ) | (5,553,670 | ) | ||||||||||
|
|
|
|
|
|
|
| |||||||||||
Net increase | 115,970 | $ | 6,401,302 | 43,274 | $ | 2,028,373 | ||||||||||||
|
|
|
|
|
|
|
| |||||||||||
Class T(a) | ||||||||||||||||||
Shares sold | 19 | $ | 1,000 | — | — | |||||||||||||
Shares issued upon reinvestment of distributions | 1 | 67 | — | — | ||||||||||||||
|
|
|
|
|
|
|
| |||||||||||
Net increase | 20 | $ | 1,067 | — | — | |||||||||||||
|
|
|
|
|
|
|
| |||||||||||
(a) Class T Shares were initially offered on July 5, 2017.
9. Indemnifications. The Fund enters into contracts that contain a variety of indemnifications. The Fund’s maximum exposure under these arrangements is unknown. However, the Fund has not had prior claims or losses pursuant to these contracts. Management has reviewed the Fund’s existing contracts and expects the risk of loss to be remote.
10. Subsequent Events. Management has evaluated the impact on the Fund of all subsequent events occurring through the date the financial statements were issued and has determined that there were no subsequent events requiring recognition or disclosure in the financial statements.
17
The GAMCO Growth Fund
Report of Independent Registered Public Accounting Firm
To the Board of Trustees and Shareholders of
The GAMCO Growth Fund:
Opinion on the Financial Statements
We have audited the accompanying statement of assets and liabilities, including the schedule of investments, of The GAMCO Growth Fund (the “Fund”) as of December 31, 2017 the related statement of operations for the year ended December 31, 2017, the statement of changes in net assets for each of the two years in the period ended December 31, 2017, including the related notes, and the financial highlights for each of the periods indicated therein (collectively referred to as the “financial statements”). In our opinion, the financial statements present fairly, in all material respects, the financial position of the Fund as of December 31, 2017, the results of its operations for the year then ended, the changes in its net assets for each of the two years in the period ended December 31, 2017 and the financial highlights for each of the periods indicated therein in conformity with accounting principles generally accepted in the United States of America.
Basis for Opinion
These financial statements are the responsibility of the Fund’s management. Our responsibility is to express an opinion on the Fund’s financial statements based on our audits. We are a public accounting firm registered with the Public Company Accounting Oversight Board (United States) (“PCAOB”) and are required to be independent with respect to the Fund in accordance with the U.S. federal securities laws and the applicable rules and regulations of the Securities and Exchange Commission and the PCAOB.
We conducted our audits of these financial statements in accordance with the standards of the PCAOB. Those standards require that we plan and perform the audit to obtain reasonable assurance about whether the financial statements are free of material misstatement, whether due to error or fraud.
Our audits included performing procedures to assess the risks of material misstatement of the financial statements, whether due to error or fraud, and performing procedures that respond to those risks. Such procedures included examining, on a test basis, evidence regarding the amounts and disclosures in the financial statements. Our audits also included evaluating the accounting principles used and significant estimates made by management, as well as evaluating the overall presentation of the financial statements. Our procedures included confirmation of securities owned as of December 31, 2017 by correspondence with the custodian. We believe that our audits provide a reasonable basis for our opinion.
PricewaterhouseCoopers LLP
New York, New York
February 27, 2018
We have served as the auditor of one or more investment companies in Gabelli/GAMCO Fund Complex since 1986.
18
The GAMCO Growth Fund
Additional Fund Information (Unaudited)
The business and affairs of the Fund are managed under the direction of the Fund’s Board of Trustees. Information pertaining to the Trustees and officers of the Fund is set forth below. The Fund’s Statement of Additional Information includes additional information about the Fund’s Trustees and is available without charge, upon request, by calling 800-GABELLI (800-422-3554) or by writing to The GAMCO Growth Fund at One Corporate Center, Rye, NY 10580-1422.
Name, Position(s) Address1 and Age | Term of Office and Length of Time Served2 | Number of Funds in Fund Complex Overseen by Trustee | Principal Occupation(s) During Past Five Years | Other Directorships Held by Trustee4 | ||||
INTERESTED TRUSTEES3 : | ||||||||
Mario J. Gabelli,CFA Trustee Age: 75 | Since 1992 | 32 | Chairman, Chief Executive Officer, and Chief Investment Officer– Value Portfolios of GAMCO Investors, Inc. and Chief Investment Officer– Value Portfolios of Gabelli Funds, LLC and GAMCO Asset Management Inc.; Director/ Trustee or Chief Investment Officer of other registered investment companies within the Gabelli/GAMCO Fund Complex; Chief Executive Officer of GGCP, Inc.; Executive Chairman of Associated Capital Group, Inc. | Director of Morgan Group Holdings, Inc. (holding company); Chairman of the Board and Chief Executive Officer of LICT Corp. (multimedia and communication services company); Director of CIBL, Inc. (broadcasting and wireless communications); Director of ICTC Group Inc. (communications) | ||||
John D. Gabelli Trustee Age: 73 | Since 1995 | 10 | Senior Vice President of G.research, LLC | — | ||||
INDEPENDENT TRUSTEES5 : | ||||||||
James P. Conn Trustee Age: 79 | Since 1992 | 27 | Former Managing Director and Chief Investment Officer of Financial Security Assurance Holdings Ltd. (1992-1998) | — | ||||
Robert J. Morrissey Trustee Age: 78 | Since 2001 | 6 | Partner in the law firm of Morrissey, Hawkins & Lynch | Chairman of the Board of Directors, Belmont Savings Bank | ||||
Anthony R. Pustorino Trustee Age: 92 | Since 1987 | 10 | Certified Public Accountant; Professor Emeritus, Pace University | Director of The LGL Group, Inc. (diversified manufacturing) (2004-2011) | ||||
Anthony Torna, Sr. Trustee Age: 91 | Since 1987 | 1 | Registered Representative, Maxim Group LLC; Investec Ernst & Company (2001-2012) | — | ||||
Anthonie C. van Ekris Trustee Age: 83 | 1987-1989 1992-present | 22 | Chairman and Chief Executive Officer of BALMAC International, Inc. (global import/ export company) | — | ||||
Salvatore J. Zizza Trustee Age: 72 | 1987-1996 2000-present | 30 | President of Zizza & Associates Corp. (private holding company); Chairman of Harbor Diversified, Inc. (pharmaceuticals); Chairman of BAM (semiconductor and aerospace manufacturing); Chairman of Bergen Cove Realty Inc.; Chairman of Metropolitan Paper Recycling Inc. (recycling) (2005-2014) | Director and Vice Chairman of Trans-Lux Corporation (business services); Director and Chairman of Harbor Diversified Inc. (pharmaceuticals) | ||||
19
The GAMCO Growth Fund
Additional Fund Information (Continued) (Unaudited)
Name, Position(s) and Age | Term of Office Time Served2 | Principal Occupation(s) During Past Five Years | ||
| OFFICERS: | ||||
Bruce N. Alpert President Age: 66 | Since 2006 | Executive Vice President and Chief Operating Officer of Gabelli Funds, LLC since 1988; Officer of registered investment companies within the Gabelli/GAMCO Fund Complex; Senior Vice President of GAMCO Investors, Inc. since 2008 | ||
John C. Ball Treasurer Age: 41 | Since May 2017 | Treasurer of all the registered investment companies within the Gabelli/GAMCO Fund Complex since 2017; Vice President and Assistant Treasurer of AMG Funds, 2014-2017; Vice President of State Street Corporation, 2007-2014 | ||
Agnes Mullady Vice President Age: 59 | Since 2006 | Officer of all of the registered investment companies within the Gabelli/GAMCO Fund Complex since 2006; President and Chief Operating Officer of the Fund Division of Gabelli Funds, LLC since 2015; Chief Executive Officer of G.distributors, LLC since 2010; Senior Vice President of GAMCO Investors, Inc. since 2009; Vice President of Gabelli Funds, LLC since 2007; Executive Vice President of Associated Capital Group, Inc. since 2016 | ||
Andrea R. Mango Secretary Age: 45 | Since 2013 | Vice President of GAMCO Investors, Inc. since 2016; Counsel of Gabelli Funds, LLC since 2013; Secretary of all registered investment companies within the Gabelli/GAMCO Fund Complex since 2013; Vice President of all closed-end funds within the Gabelli/GAMCO Fund Complex since 2014; Corporate Vice President within the Corporate Compliance Department of New York Life Insurance Company, 2011-2013 | ||
Richard J. Walz Chief Compliance Officer Age: 58 | Since 2013 | Chief Compliance Officer of all of the registered investment companies within the Gabelli/ GAMCO Fund Complex since 2013; Chief Compliance Officer of AEGON USA Investment Management, 2011-2013 | ||
| 1 | Address: One Corporate Center, Rye, NY 10580-1422, unless otherwise noted. |
| 2 | Each Trustee will hold office for an indefinite term until the earliest of (i) the next meeting of shareholders, if any, called for the purpose of considering the election or re-election of such Trustee and until the election and qualification of his or her successor, if any, elected at such meeting, or (ii) the date a Trustee resigns or retires, or a Trustee is removed by the Board of Trustees or shareholders, in accordance with the Fund’s By-Laws and Declaration of Trust. Each officer will hold office for an indefinite term until the date he or she resigns or retires or until his or her successor is elected and qualified. |
| 3 | “Interested person” of the Fund as defined in the 1940 Act. Messrs. Mario J. Gabelli and John D. Gabelli, who are brothers, are each considered an “interested person” because of their affiliation with Gabelli Funds, LLC which acts as the Fund’s investment adviser. |
| 4 | This column includes only directorships of companies required to report to the SEC under the Securities Exchange Act of 1934, as amended, i.e., public companies, or other investment companies registered under the 1940 Act. |
| 5 | Trustees who are not interested persons are considered “Independent” Trustees. |
20
Gabelli/GAMCO Funds and Your Personal Privacy
Who are we?
The Gabelli/GAMCO Funds are investment companies registered with the Securities and Exchange Commission under the Investment Company Act of 1940. We are managed by Gabelli Funds, LLC and GAMCO Asset Management Inc., which are affiliated with GAMCO Investors, Inc. that is a publicly held company with subsidiaries and affiliates that provide investment advisory services for a variety of clients.
What kind of non-public information do we collect about you if you become a fund shareholder?
If you apply to open an account directly with us, you will be giving us some non-public information about yourself. The non-public information we collect about you is:
● Information you give us on your application form. This could include your name, address, telephone number, social security number, bank account number, and other information.
● Information about your transactions with us, any transactions with our affiliates, and transactions with the entities we hire to provide services to you. This would include information about the shares that you buy or redeem. If we hire someone else to provide services — like a transfer agent — we will also have information about the transactions that you conduct through them.
What information do we disclose and to whom do we disclose it?
We do not disclose any non-public personal information about our customers or former customers to anyone other than our affiliates, our service providers who need to know such information, and as otherwise permitted by law. If you want to find out what the law permits, you can read the privacy rules adopted by the Securities and Exchange Commission. They are in volume 17 of the Code of Federal Regulations, Part 248. The Commission often posts information about its regulations on its website, www.sec.gov.
What do we do to protect your personal information?
We restrict access to non-public personal information about you to the people who need to know that information in order to provide services to you or the fund and to ensure that we are complying with the laws governing the securities business. We maintain physical, electronic, and procedural safeguards to keep your personal information confidential.
|
This page was intentionally left blank.
THE GAMCO GROWTH FUND
One Corporate Center
Rye, NY 10580-1422
Portfolio Manager Biography
Howard F. Ward, CFA, joined Gabelli Funds in 1995 and currently serves as GAMCO’s Chief Investment Officer of Growth Equities as well as a Gabelli Funds, LLC portfolio manager for several funds within the Gabelli/GAMCO Fund Complex. Prior to joining Gabelli, Mr. Ward served as Managing Director and Lead Portfolio Manager for several Scudder mutual funds. He also was an Investment Officer in the Institutional Investment Department with Brown Brothers, Harriman & Co. Mr. Ward received his BA in Economics from Northwestern University.
2017 TAX NOTICE TO SHAREHOLDERS (Unaudited)
For the year ended December 31, 2017, the Fund paid to shareholders ordinary income distributions (comprised of short term capital gains) totaling $0.067, $0.067, $0.067, $0.067, and $0.067 per share for Class AAA, Class A, Class C, Class I, and Class T Shares, respectively, and long term capital gains totaling $35,437,275 or the maximum allowable. The distributions of long term capital gains have been designated as a capital gain dividend by the Fund’s Board of Trustees. For the year ended December 31, 2017, 100% of the ordinary income distribution qualifies for the dividends received deduction available to corporations. The Fund designates 100% of the ordinary income distribution as qualified dividend income pursuant to the Jobs and Growth Tax Relief Reconciliation Act of 2003. The Fund designates 0% of the ordinary income distribution as qualified interest income pursuant to the Tax Relief, Unemployment Reauthorization, and Job Creation Act of 2010. The Fund designates 100% of the ordinary income distribution as qualified short term gain pursuant to the American Jobs Creation Act of 2004.
All designations are based on financial information available as of the date of this annual report and, accordingly, are subject to change. For each item, it is the intention of the Fund to designate the maximum amount permitted under the Internal Revenue Code and the regulations thereunder.
We have separated the portfolio manager’s commentary from the financial statements and investment portfolio due to corporate governance regulations stipulated by the Sarbanes-Oxley Act of 2002. We have done this to ensure that the content of the portfolio manager’s commentary is unrestricted. Both the commentary and the financial statements, including the portfolio of investments, will be available on our website at www.gabelli.com.
THE GAMCO GROWTH FUND
One Corporate Center
Rye, New York 10580-1422
| t | 800-GABELLI (800-422-3554) | |
f |
914-921-5118 | |
e |
info@gabelli.com | |
GABELLI.COM |
Net Asset Value per share available daily
by calling 800-GABELLI after 7:00 P.M.
BOARD OF TRUSTEES | ||
| Mario J. Gabelli, CFA | Anthonie C. van Ekris Chairman, BALMAC International, Inc.
Salvatore J. Zizza Chairman, Zizza & Associates Corp.
OFFICERS
Bruce N. Alpert President
John C. Ball Treasurer
Agnes Mullady Vice President
Andrea R. Mango Secretary
Richard J. Walz Chief Compliance Officer
DISTRIBUTOR
G.distributors, LLC
CUSTODIAN
State Street Bank and Trust Company
TRANSFER AGENT AND DIVIDEND DISBURSING AGENT
DST Asset Manger Solutions Inc.
LEGAL COUNSEL
Skadden, Arps, Slate, Meagher & Flom LLP | |
| Chairman and Chief | ||
| Executive Officer, | ||
| GAMCO Investors, Inc. | ||
| Executive Chairman, | ||
| Associated Capital Group, Inc. | ||
| James P. Conn | ||
| Former Chief Investment Officer, | ||
| Financial Security Assurance | ||
| Holdings Ltd. | ||
| John D. Gabelli | ||
| Senior Vice President, | ||
| G.research, LLC | ||
| Robert J. Morrissey | ||
| Partner, | ||
| Morrissey, Hawkins & Lynch | ||
| Anthony R. Pustorino | ||
| Certified Public Accountant, | ||
| Professor Emeritus, | ||
| Pace University | ||
| Anthony Torna | ||
| Former Investment Counselor, | ||
| Maxim Group LLC | ||
This report is submitted for the general information of the shareholders of The GAMCO Growth Fund. It is not authorized for distribution to prospective investors unless preceded or accompanied by an effective prospectus.
GAB406Q417AR

Item 2. Code of Ethics.
| (a) | The registrant, as of the end of the period covered by this report, has adopted a code of ethics that applies to the registrant’s principal executive officer, principal financial officer, principal accounting officer or controller, or persons performing similar functions, regardless of whether these individuals are employed by the registrant or a third party. |
| (c) | There have been no amendments, during the period covered by this report, to a provision of the code of ethics that applies to the registrant’s principal executive officer, principal financial officer, principal accounting officer or controller, or persons performing similar functions, regardless of whether these individuals are employed by the registrant or a third party, and that relates to any element of the code of ethics description. |
| (d) | The registrant has not granted any waivers, including an implicit waiver, from a provision of the code of ethics that applies to the registrant’s principal executive officer, principal financial officer, principal accounting officer or controller, or persons performing similar functions, regardless of whether these individuals are employed by the registrant or a third party, that relates to one or more of the items set forth in paragraph (b) of this item’s instructions. |
Item 3. Audit Committee Financial Expert.
As of the end of the period covered by the report, the registrant’s Board of Trustees has determined that Anthony R. Pustorino is qualified to serve as an audit committee financial expert serving on its audit committee and that he is “independent,” as defined by Item 3 of Form N-CSR.
Item 4. Principal Accountant Fees and Services.
Audit Fees
| (a) | The aggregate fees billed for each of the last two fiscal years for professional services rendered by the principal accountant for the audit of the registrant’s annual financial statements or services that are normally provided by the accountant in connection with statutory and regulatory filings or engagements for those fiscal years are $39,508 for 2016 and $39,508 for 2017. |
Audit-Related Fees
| (b) | The aggregate fees billed in each of the last two fiscal years for assurance and related services by the principal accountant that are reasonably related to the performance of the audit of the registrant’s financial statements and are not reported under paragraph (a) of this Item are $0 for 2016 and $0 for 2017. |
Tax Fees
| (c) | The aggregate fees billed in each of the last two fiscal years for professional services rendered by the principal accountant for tax compliance, tax advice, and tax planning are $4,096 for 2016 and $4,100 for 2017. Tax fees represent tax compliance services provided in connection with the review of the Registrant’s tax returns. |
All Other Fees
| (d) | The aggregate fees billed in each of the last two fiscal years for products and services provided by the principal accountant, other than the services reported in paragraphs (a) through (c) of this Item are $0 for 2016 and $0 for 2017. |
| (e)(1) | Disclose the audit committee’s pre-approval policies and procedures described in paragraph (c)(7) of Rule 2-01 of Regulation S-X. |
Pre-Approval Policies and Procedures. The Audit Committee (“Committee”) of the registrant is responsible for pre-approving (i) all audit and permissible non-audit services to be provided by the independent registered public accounting firm to the registrant and (ii) all permissible non-audit services to be provided by the independent registered public accounting firm to the Adviser, Gabelli Funds, LLC, and any affiliate of Gabelli Funds, LLC (“Gabelli”) that provides services to the registrant (a “Covered Services Provider”) if the independent registered public accounting firm’s engagement related directly to the operations and financial reporting of the registrant. The Committee may delegate its responsibility to pre-approve any such audit and permissible non-audit services to the Chairperson of the Committee, and the Chairperson must report to the Committee, at its next regularly scheduled meeting after the Chairperson’s pre-approval of such services, his or her decision(s). The Committee may also establish detailed pre-approval policies and procedures for pre-approval of such services in accordance with applicable laws, including the delegation of some or all of the Committee’s pre-approval responsibilities to the other persons (other than Gabelli or the registrant’s officers). Pre-approval by the Committee of any permissible non-audit services is not required so long as: (i) the permissible non-audit services were not recognized by the registrant at the time of the engagement to be non-audit services; and (ii) such services are promptly brought to the attention of the Committee and approved by the Committee or Chairperson prior to the completion of the audit.
| (e)(2) | The percentage of services described in each of paragraphs (b) through (d) of this Item that were approved by the audit committee pursuant to paragraph (c)(7)(i)(C) of Rule 2-01 of Regulation S-X are as follows: |
(b) N/A
(c) 100%
(d) N/A
| (f) | The percentage of hours expended on the principal accountant’s engagement to audit the registrant’s financial statements for the most recent fiscal year that were attributed to work performed by persons other than the principal accountant’s full-time, permanent employees was less than fifty percent. |
| (g) | The aggregate non-audit fees billed by the registrant’s accountant for services rendered to the registrant, and rendered to the registrant’s investment adviser (not including any sub-adviser whose role is primarily portfolio management and is subcontracted with or overseen by another investment adviser), and any entity controlling, controlled by, or under common control with the adviser that provides ongoing services to the registrant for each of the last two fiscal years of the registrant was $0 for 2016 and $0 for 2017. |
| (h) | The registrant’s audit committee of the board of directors has considered whether the provision of non-audit services that were rendered to the registrant’s investment adviser (not including any sub-adviser whose role is primarily portfolio management and is subcontracted with or overseen by another investment adviser), and any entity controlling, controlled by, or under common control with the investment adviser that provides ongoing services to the registrant that were not pre-approved pursuant to paragraph (c)(7)(ii) of Rule 2-01 of Regulation S-X is compatible with maintaining the principal accountant’s independence. |
Item 5. Audit Committee of Listed Registrants.
Not applicable.
Item 6. Investments.
| (a) | Schedule of Investments in securities of unaffiliated issuers as of the close of the reporting period is included as part of the report to shareholders filed under Item 1 of this form. |
(b) Not applicable.
| Item 7. | Disclosure of Proxy Voting Policies and Procedures for Closed-End Management Investment Companies. |
Not applicable.
Item 8. Portfolio Managers of Closed-End Management Investment Companies.
Not applicable.
| Item 9. | Purchases of Equity Securities by Closed-End Management Investment Company and Affiliated Purchasers. |
Not applicable.
Item 10. Submission of Matters to a Vote of Security Holders.
There have been no material changes to the procedures by which the shareholders may recommend nominees to the registrant’s Board of Trustees, where those changes were implemented after the registrant last provided disclosure in response to the requirements of Item 407(c)(2)(iv) of Regulation S-K (17 CFR 229.407) (as required by Item 22(b)(15) of Schedule 14A (17 CFR 240.14a-101)), or this Item.
Item 11. Controls and Procedures.
| (a) | The registrant’s principal executive and principal financial officers, or persons performing similar functions, have concluded that the registrant’s disclosure controls and procedures (as defined in Rule 30a-3(c) under the Investment Company Act of 1940, as amended (the “1940 Act”) (17 CFR 270.30a-3(c))) are effective, as of a date within 90 days of the filing date of the report that includes the disclosure required by this paragraph, based on their evaluation of these controls and procedures required by Rule 30a-3(b) under the 1940 Act (17 CFR 270.30a-3(b)) and Rules 13a-15(b) or 15d-15(b) under the Securities Exchange Act of 1934, as amended (17 CFR 240.13a-15(b) or 240.15d-15(b)). |
| (b) | There were no changes in the registrant’s internal control over financial reporting (as defined in Rule 30a-3(d) under the 1940 Act (17 CFR 270.30a-3(d))) that occurred during the registrant’s last fiscal quarter that has materially affected, or is reasonably likely to materially affect, the registrant’s internal control over financial reporting. |
Item 12. Disclosure of Securities Lending Activities for Closed-End Management Investment Companies.
Not applicable.
Item 13. Exhibits.
| (a)(1) | Code of ethics, or any amendment thereto, that is the subject of disclosure required by Item 2 is attached hereto. |
| (a)(2) | Certifications pursuant to Rule 30a-2(a) under the 1940 Act and Section 302 of the Sarbanes-Oxley Act of 2002 are attached hereto. |
| (a)(3) | Not applicable. |
| (a)(4) | Not applicable. |
| (b) | Certifications pursuant to Rule 30a-2(b) under the 1940 Act and Section 906 of the Sarbanes- Oxley Act of 2002 are attached hereto. |
SIGNATURES
Pursuant to the requirements of the Securities Exchange Act of 1934 and the Investment Company Act of 1940, the registrant has duly caused this report to be signed on its behalf by the undersigned, thereunto duly authorized.
(Registrant) | The GAMCO Growth Fund | |
By (Signature and Title)* | /s/ Bruce N. Alpert | |
Bruce N. Alpert, Principal Executive Officer |
Date | 3/09/2018 |
Pursuant to the requirements of the Securities Exchange Act of 1934 and the Investment Company Act of 1940, this report has been signed below by the following persons on behalf of the registrant and in the capacities and on the dates indicated.
By (Signature and Title)* | /s/ Bruce N. Alpert | |
Bruce N. Alpert, Principal Executive Officer |
Date | 3/09/2018 |
By (Signature and Title)* | /s/ John C. Ball | |
John C. Ball, Principal Financial Officer and Treasurer |
Date | 3/09/2018 |
* Print the name and title of each signing officer under his or her signature.