UNITED STATES
SECURITIES AND EXCHANGE COMMISSION
Washington, D.C. 20549
FORMN-CSR
CERTIFIED SHAREHOLDER REPORT OF REGISTERED MANAGEMENT
INVESTMENT COMPANIES
Investment Company Act file number 811-04873
The GAMCO Growth Fund | ||||||
| (Exact name of registrant as specified in charter) | ||||||
One Corporate Center Rye, New York 10580-1422 | ||||||
| (Address of principal executive offices) (Zip code) | ||||||
Bruce N. Alpert Gabelli Funds, LLC One Corporate Center Rye, New York 10580-1422 | ||||||
| (Name and address of agent for service) | ||||||
Registrant’s telephone number, including area code:1-800-422-3554
Date of fiscal year end: December 31
Date of reporting period: December 31, 2018
FormN-CSR is to be used by management investment companies to file reports with the Commission not later than 10 days after the transmission to stockholders of any report that is required to be transmitted to stockholders under Rule30e-1 under the Investment Company Act of 1940 (17 CFR270.30e-1). The Commission may use the information provided on FormN-CSR in its regulatory, disclosure review, inspection, and policymaking roles.
A registrant is required to disclose the information specified by FormN-CSR, and the Commission will make this information public. A registrant is not required to respond to the collection of information contained in FormN-CSR unless the Form displays a currently valid Office of Management and Budget (“OMB”) control number. Please direct comments concerning the accuracy of the information collection burden estimate and any suggestions for reducing the burden to Secretary, Securities and Exchange Commission, 450 Fifth Street, NW, Washington, DC 20549-0609. The OMB has reviewed this collection of information under the clearance requirements of 44 U.S.C. § 3507.
Item 1. Reports to Stockholders.
The Report to Shareholders is attached herewith.
The GAMCO Growth Fund
Annual Report — December 31, 2018
(Y)our Portfolio Management Team
 |  | |||||
| Howard F. Ward, CFA | Christopher D. Ward, CFA | |||||
| Portfolio Manager | Associate Portfolio Manager |
To Our Shareholders,
For the year ended December 31, 2018, the net asset value (NAV) per Class I Share of The GAMCO Growth Fund increased 2.1% compared with a decrease of 4.4% for the Standard & Poor’s (S&P) 500 Index and a decrease of 1.5% for the Russell 1000 Growth Index. Other classes of shares are available. See page 3 for performance information for all classes of shares.
Enclosed are the financial statements, including the schedule of investments, as of December 31, 2018.
Performance Discussion (Unaudited)
The Fund’s investment objective is to provide capital appreciation. The Fund’s secondary objective is to produce current income.
The Fund’s investment strategy is to invest in common stocks. The Fund may also invest in foreign securities. The Fund focuses on securities of companies which appear to have favorable, yet undervalued, prospects for earnings growth and price appreciation. The Fund’s investment adviser, Gabelli Funds, LLC (the Adviser), invests the Fund’s assets in companies which the portfolio managers believe have above average or expanding market shares, profit margins, and returns on equity.
Beginning on January 1, 2021, as permitted by regulations adopted by the Securities and Exchange Commission, paper copies of the Fund’s annual and semiannual shareholder reports will no longer be sent by mail, unless you specifically request paper copies of the reports. Instead, the reports will be made available on the Fund’s website (www.gabelli.com), and you will be notified by mail each time a report is posted and provided with a website link to access the report. If you already elected to receive shareholder reports electronically, you will not be affected by this change and you need not take any action. To elect to receive all future reports in paper free of charge, please contact your financial intermediary, or, if you invest directly with the Fund, you may call800-422-3554 or send an email request to info@gabelli.com.
The Adviser uses fundamental security analysis to develop earnings forecasts for companies and to identify investment opportunities. The Adviser bases its analyses on general economic and industry data provided by the U.S. government, various trade associations and other sources, and published corporate financial data such as annual reports,10-Ks, and quarterly statements as well as direct interviews with company management. Generally, the Adviser makes investment decisions first by looking at individual companies and then by scrutinizing their growth prospects in relation to their industries and the overall economy. The Adviser seeks to invest in companies with high future earnings potential relative to their current market valuations.
The first quarter of 2018 saw volatility return. The S&P saw a price gain of 5.6% in January, but rising interest rates, fear of an accelerated Federal Reserve tightening pace, and growing trade tensions soon weighed on the macro backdrop. Social media companies also faced scrutiny over data sharing practices. For the first time since 2009, the S&P saw negative returns for first quarter of the year.
Coincident indicators in the second quarter of the year remained strong. In May, unemployment hit 3.8%, which was the lowest rate since December 2000, and GDP saw growth of 4.2%. The yield on 10 year U.S. Treasuries was 2.85% at the end of the quarter, and in June, President Trump rejected China’s offer to purchase $70 billion in additional U.S. goods.
In the third quarter of 2018, the Trump Administration negotiated with Mexico and Canada to sign a new NAFTA deal called USMCA (U.S., Mexico, and Canada Agreement). The U.S. asked China for greater concessions, making talks more difficult. The trade war with China continued, although its currency weakened, its stock market fell, and its industrial activity slowed.
On December 19, and for the ninth time in three years, the Federal Reserve raised interest rates by 25 basis points. Global growth slowed and financial market volatility increased, while inflation ended the year near 2% and unemployment was near a record low. The Federal Reserve continued to reduce its balance sheet by $50 billion per month.
The top contributor to performance in 2018 was Amazon (6.3% of net asset value as of December 31, 2018). Amazon has been a dominant player in thee-commerce world over the past few years. In 2018, it announced plans to open a second headquarters in Queens, New York. Amazon Web Services also set out to expand in 2018, beyond already owning more than a third of the cloud storage business around the globe. Microsoft Corp. (7.2%), the world’s largest software company, has also moved into the world of cloud services, which has resulted in a growth in users, average revenue per user, and recurring revenue. Adobe Inc. (3.5%) was also a contributor for the year. Revenue from Adobe’s two core businesses increased in 2018 due to two acquisitions in the realm ofe-commerce and cloud marketing.
The top detractor for 2018 was Nvidia Corp. (0.9%), whose fourth quarter results led the portfolio managers to reduce the Fund’s holdings. Facebook Inc. (2.6%) continued to face scrutiny due to security and corporate governance issues. Comcast Corp. (no longer held) lost its bidding war with Walt Disney for Twenty-First Century Fox and saw a drop in U.S. cable customers in the first three quarters of 2018. In comparison with Netflix, which has 140 million subscribers, Comcast is down to just 22 million.
Thank you for your investment in The GAMCO Growth Fund.
We appreciate your confidence and trust.
2
Comparative Results
| Average Annual Returns through December 31, 2018 (a) (Unaudited) | Since | ||||||||||||||||||||||||
| Inception | |||||||||||||||||||||||||
| 1 Year | 3 Year | 5 Year | 10 Year | (4/10/87) | |||||||||||||||||||||
Class I (GGCIX) | 2.09 | % | 10.96 | % | 9.64 | % | 14.40 | % | 10.06 | % | |||||||||||||||
S&P 500 Index | (4.38 | ) | 9.26 | 8.49 | 13.12 | 9.43 | (b) | ||||||||||||||||||
Russell 1000 Growth Index | (1.51 | ) | 11.15 | 10.40 | 15.29 | 9.22 | (b) | ||||||||||||||||||
Class AAA (GABGX) | 1.83 | 10.68 | 9.37 | 14.12 | 9.97 | ||||||||||||||||||||
Class A (GGCAX) | 1.83 | 10.69 | 9.38 | 14.12 | 9.97 | ||||||||||||||||||||
With sales charge (c) | (4.02 | ) | 8.52 | 8.09 | 13.44 | 9.77 | |||||||||||||||||||
Class C (GGCCX) | 1.08 | 9.86 | 8.55 | 13.26 | 9.58 | ||||||||||||||||||||
With contingent deferred sales charge (d) | 0.08 | 9.86 | 8.55 | 13.26 | 9.58 | ||||||||||||||||||||
In the current prospectuses dated April 30, 2018, the expense ratios for Class AAA, A, C, and I Shares are 1.41%, 1.41%, 2.16%, and 1.16%, respectively. See page 9 for the expense ratios for the year ended December 31, 2018. Class AAA and Class I Shares do not have a sales charge. The maximum sales charge for Class A Shares and Class C Shares is 5.75% and 1.00%, respectively.
| (a) | Returns represent past performance and do not guarantee future results. Total returns and average annual returns reflect changes in share price, reinvestment of distributions, and are net of expenses. Investment returns and the principal value of an investment will fluctuate.When shares are redeemed, they may be worth more or less than their original cost. Current performance may be lower or higher than the performance data presented. Visit www.gabelli.com for performance information as of the most recent month end. The Fund imposes a 2% redemption fee on shares sold or exchanged within seven days of purchase. Investors should carefully consider the investment objectives, risks, charges, and expenses of the Fund before investing. The prospectuses contain information about these and other matters and should be read carefully before investing. To obtain a prospectus please visit our website at www.gabelli.com.The Class AAA Share NAVs are used to calculate performance for the periods prior to the issuance of Class A Shares and Class C Shares on December 31, 2003, and Class I Shares on January 11, 2008. The actual performance of the Class A Shares and Class C Shares would have been lower due to the additional fees and expenses associated with these classes of shares. The actual performance of the Class I Shares would have been higher due to lower expenses related to this class of shares. The S&P 500 Index is a market capitalization weighted index of 500 large capitalization stocks commonly used to represent the U.S. equity market. The Russell 1000 Growth Index measures the performance of the large cap growth segment of the U.S. equity market. Dividends are considered reinvested. You cannot invest directly in an index. |
| (b) | S&P 500 Index and Russell 1000 Growth Index since inception performance results are as of March 31, 1987. |
| (c) | Performance results include the effect of the maximum 5.75% sales charge at the beginning of the period. |
| (d) | Assuming payment of the 1% maximum contingent deferred sales charge imposed on redemptions made within one year of purchase. |
COMPARISON OF CHANGE IN VALUE OF A $10,000 INVESTMENT IN
THE GAMCO GROWTH FUND (CLASS AAA SHARES) AND S&P 500 INDEX (Unaudited)
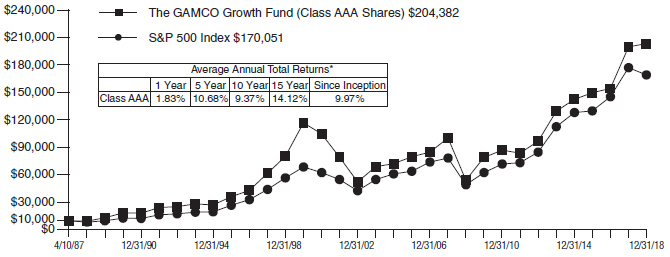
| * | Past performance is not predictive of future results. The performance tables and graph do not reflect the deduction of taxes that a shareholder would pay on Fund distributions or the redemption of Fund shares. |
3
| The GAMCO Growth Fund | ||
| Disclosure of Fund Expenses (Unaudited) | ||
| For the Six Month Period from July 1, 2018 through December 31, 2018 | Expense Table |
We believe it is important for you to understand the impact of fees and expenses regarding your investment. All mutual funds have operating expenses. As a shareholder of a fund, you incur ongoing costs, which include costs for portfolio management, administrative services, and shareholder reports (like this one), among others. Operating expenses, which are deducted from a fund’s gross income, directly reduce the investment return of a fund. When a fund’s expenses are expressed as a percentage of its average net assets, this figure is known as the expense ratio. The following examples are intended to help you understand the ongoing costs (in dollars) of investing in your Fund and to compare these costs with those of other mutual funds. The examples are based on an investment of $1,000 made at the beginning of the period shown and held for the entire period.
The Expense Table below illustrates your Fund’s costs in two ways:
Actual Fund Return:This section provides information about actual account values and actual expenses. You may use this section to help you to estimate the actual expenses that you paid over the period after any fee waivers and expense reimbursements. The “Ending Account Value” shown is derived from the Fund’sactualreturn during the past six months, and the “Expenses Paid During Period” shows the dollar amount that would have been paid by an investor who started with $1,000 in the Fund. You may use this information, together with the amount you invested, to estimate the expenses that you paid over the period.
To do so, simply divide your account value by $1,000 (for example, an $8,600 account value divided by $1,000 = 8.6), then multiply the result by the number given for your Fund under the heading “Expenses Paid During Period” to estimate the expenses you paid during this period.
Hypothetical 5% Return:This section provides information about hypothetical account values and hypothetical expenses based on the Fund’s actual expense
ratio. It assumes a hypothetical annualized return of 5% before expenses during the period shown. In this case – because the hypothetical return used isnotthe Fund’s actual return – the results do not apply to your investment and you cannot use the hypothetical account value and expense to estimate the actual ending account balance or expenses you paid for the period. This example is useful in making comparisons of the ongoing costs of investing in the Fund and other funds. To do so, compare this 5% hypothetical example with the 5% hypothetical examples that appear in shareholder reports of other funds.
Please note that the expenses shown in the table are meant to highlight your ongoing costs only and do not reflect any transactional costs such as sales charges (loads), redemption fees, or exchange fees, if any, which are described in the Prospectus. If these costs were applied to your account, your costs would be higher. Therefore, the 5% hypothetical return is useful in comparing ongoing costs only, and will not help you determine the relative total costs of owning different funds. The “Annualized Expense Ratio” represents the actual expenses for the last six months and may be different from the expense ratio in the Financial Highlights which is for the fiscal year ended December 31, 2018.
| Beginning Account Value 07/01/18 | Ending Account Value 12/31/18 | Annualized Expense Ratio | Expenses Paid During Period* | |||||||||||
The GAMCO Growth Fund |
| |||||||||||||
Actual Fund Return | ||||||||||||||
Class AAA | $1,000.00 | $ 916.40 | 1.41% | $ 6.81 | ||||||||||
Class A | $1,000.00 | $ 916.50 | 1.41% | $ 6.81 | ||||||||||
Class C | $1,000.00 | $ 912.80 | 2.16% | $10.41 | ||||||||||
Class I | $1,000.00 | $ 917.50 | 1.16% | $ 5.61 | ||||||||||
Hypothetical 5% Return | ||||||||||||||
Class AAA | $1,000.00 | $1,018.10 | 1.41% | $ 7.17 | ||||||||||
Class A | $1,000.00 | $1,018.10 | 1.41% | $ 7.17 | ||||||||||
Class C | $1,000.00 | $1,014.32 | 2.16% | $10.97 | ||||||||||
Class I | $1,000.00 | $1,019.36 | 1.16% | $ 5.90 | ||||||||||
| * | Expenses are equal to the Fund’s annualized expense ratio for the last six months multiplied by the average account value over the period, multiplied by the number of days in the most recent fiscal half year (184 days), then divided by 365. |
4
Summary of Portfolio Holdings (Unaudited)
The following table presents portfolio holdings as a percent of net assets as of December 31, 2018:
The GAMCO Growth Fund
Health Care | 23.6 | % | ||
Technology - Computer Software and Services | 17.9 | % | ||
Financial Services | 17.2 | % | ||
Consumer Discretionary - Other | 16.1 | % | ||
Technology - Internet | 10.9 | % | ||
Technology - Computer | ||||
Technology, Semiconductors, and Components | 7.4 | % |
Producer Durables | 2.5 | % | ||
Utilities | 2.4 | % | ||
Consumer Discretionary - Media | 1.6 | % | ||
U.S. Government Obligations | 0.5 | % | ||
Other Assets and Liabilities (Net) | (0.1 | )% | ||
|
| |||
| 100.0 | % | |||
|
|
The Fund files a complete schedule of portfolio holdings with the Securities and Exchange Commission (the SEC) for the first and third quarters of each fiscal year on FormN-Q. Shareholders may obtain this information at www.gabelli.com or by calling the Fund at800-GABELLI(800-422-3554).The Fund’s FormN-Q is available on the SEC’s website at www.sec.gov and may also be reviewed and copied at the SEC’s Public Reference Room in Washington, DC. Information on the operation of the Public Reference Room may be obtained by calling800-SEC-0330.
Proxy Voting
The Fund files FormN-PX with its complete proxy voting record for the twelve months ended June 30, no later than August 31 of each year. A description of the Fund’s proxy voting policies, procedures, and how the Fund voted proxies relating to portfolio securities is available without charge, upon request, by (i) calling800-GABELLI(800-422-3554); (ii) writing to The Gabelli Funds at One Corporate Center, Rye, NY 10580-1422; or (iii) visiting the SEC’s website at www.sec.gov.
5
The GAMCO Growth Fund
Schedule of Investments — December 31, 2018
Shares | Cost | Market | ||||||||
COMMON STOCKS —99.6% |
| |||||||||
HEALTH CARE — 23.6% |
| |||||||||
185,400 | Abbott Laboratories | $ | 11,862,876 | $ | 13,409,982 | |||||
42,900 | Becton, Dickinson and Co. | 5,968,295 | 9,666,228 | |||||||
48,800 | Danaher Corp. | 3,442,068 | 5,032,256 | |||||||
75,000 | Edwards Lifesciences Corp.† | 9,430,886 | 11,487,750 | |||||||
42,900 | Humana Inc. | 10,268,614 | 12,289,992 | |||||||
48,800 | Illumina Inc.† | 12,390,786 | 14,636,584 | |||||||
18,600 | Intuitive Surgical Inc.† | 8,328,779 | 8,907,912 | |||||||
27,900 | Stryker Corp. | 3,980,809 | 4,373,325 | |||||||
43,800 | Thermo Fisher Scientific Inc. | 7,272,687 | 9,802,002 | |||||||
120,600 | UnitedHealth Group Inc. | 17,159,214 | 30,043,872 | |||||||
235,700 | Zoetis Inc. | 12,027,265 | 20,161,778 | |||||||
|
|
|
| |||||||
| 102,132,279 | 139,811,681 | |||||||||
|
|
|
| |||||||
TECHNOLOGY-COMPUTER SOFTWARE AND SERVICES — 17.9% |
| |||||||||
92,800 | Adobe Inc.† | 6,274,874 | 20,995,072 | |||||||
52,000 | Autodesk Inc.† | 6,270,816 | 6,687,720 | |||||||
418,000 | Microsoft Corp. | 14,390,115 | 42,456,260 | |||||||
55,800 | Palo Alto Networks Inc.† | 9,405,377 | 10,509,930 | |||||||
44,900 | salesforce.com Inc.† | 4,159,136 | 6,149,953 | |||||||
73,800 | ServiceNow Inc.† | 13,355,324 | 13,140,090 | |||||||
53,500 | Tableau Software Inc., Cl. A† | 5,122,725 | 6,420,000 | |||||||
|
|
|
| |||||||
| 58,978,367 | 106,359,025 | |||||||||
|
|
|
| |||||||
FINANCIAL SERVICES — 17.2% |
| |||||||||
96,100 | American Tower Corp., REIT | 13,624,461 | 15,202,059 | |||||||
137,600 | Crown Castle International Corp., REIT | 14,761,154 | 14,947,488 | |||||||
125,400 | Fiserv Inc.† | 6,471,499 | 9,215,646 | |||||||
154,400 | Mastercard Inc., Cl. A | 4,982,878 | 29,127,560 | |||||||
160,000 | PayPal Holdings Inc.† | 10,591,981 | 13,454,400 | |||||||
52,000 | Square Inc., Cl. A† | 2,744,907 | 2,916,680 | |||||||
130,900 | Visa Inc., Cl. A | 3,489,724 | 17,270,946 | |||||||
|
|
|
| |||||||
| 56,666,604 | 102,134,779 | �� | ||||||||
|
|
|
| |||||||
CONSUMER DISCRETIONARY - OTHER — 16.1% |
| |||||||||
25,000 | Amazon.com Inc.† | 11,093,715 | 37,549,250 | |||||||
27,800 | Costco Wholesale Corp. | 2,839,699 | 5,663,138 | |||||||
59,400 | Netflix Inc.† | 15,947,132 | 15,899,004 | |||||||
87,300 | NextEra Energy Inc. | 14,889,509 | 15,174,486 | |||||||
Shares | Cost | Market | ||||||||
162,600 | Nike Inc., Cl. B | $ | 9,660,495 | $ | 12,055,164 | |||||
55,400 | The Home Depot Inc. | 3,475,815 | 9,518,828 | |||||||
|
|
|
| |||||||
| 57,906,365 | 95,859,870 | |||||||||
|
|
|
| |||||||
TECHNOLOGY - INTERNET — 10.9% |
| |||||||||
17,100 | Alphabet Inc., Cl. A† | 6,830,730 | 17,868,816 | |||||||
18,445 | Alphabet Inc., Cl. C† | 10,570,342 | 19,101,826 | |||||||
115,600 | Facebook Inc., Cl. A† | 6,400,146 | 15,154,004 | |||||||
67,100 | IAC/InterActiveCorp.† | 10,119,282 | 12,281,984 | |||||||
|
|
|
| |||||||
| 33,920,500 | 64,406,630 | |||||||||
|
|
|
| |||||||
TECHNOLOGY - COMPUTER TECHNOLOGY, SEMICON- DUCTORS, AND COMPONENTS — 7.4% |
| |||||||||
221,600 | Apple Inc. | 12,100,650 | 34,955,184 | |||||||
39,500 | NVIDIA Corp. | 6,820,162 | 5,273,250 | |||||||
44,000 | Xilinx Inc. | 3,637,608 | 3,747,480 | |||||||
|
|
|
| |||||||
| 22,558,420 | 43,975,914 | |||||||||
|
|
|
| |||||||
PRODUCER DURABLES — 2.5% |
| |||||||||
45,200 | The Boeing Co. | 10,277,486 | 14,577,000 | |||||||
|
|
|
| |||||||
UTILITIES — 2.4% | ||||||||||
160,000 | American Water Works Co. Inc. | 15,082,426 | 14,523,200 | |||||||
|
|
|
| |||||||
CONSUMER DISCRETIONARY - MEDIA — 1.6% |
| |||||||||
88,700 | The Walt Disney Co. | 9,381,148 | 9,725,955 | |||||||
|
|
|
| |||||||
TOTAL COMMON STOCKS | 366,903,595 | 591,374,054 | ||||||||
|
|
|
| |||||||
Principal | ||||||||||
Amount | ||||||||||
U.S. GOVERNMENT OBLIGATIONS — 0.5% |
| |||||||||
$2,803,000 | U.S. Treasury Bills, | |||||||||
2.151% to 2.316%††, | ||||||||||
01/08/19 to 02/28/19 | 2,792,976 | 2,792,844 | ||||||||
|
|
|
| |||||||
TOTAL INVESTMENTS — 100.1% | $ | 369,696,571 | 594,166,898 | |||||||
Other Assets and Liabilities (Net) — (0.1)% |
| (474,106 | ) | |||||||
|
| |||||||||
NET ASSETS — 100.0% |
| $ | 593,692,792 | |||||||
| † | Non-income producing security. |
| †† | Represents annualized yields at date of purchase. |
| REIT | Real Estate Investment Trust |
See accompanying notes to financial statements.
6
The GAMCO Growth Fund
Statement of Assets and Liabilities
December 31, 2018
Assets: | ||||
Investments, at value (cost $369,696,571) | $ | 594,166,898 | ||
Cash | 3,111 | |||
Receivable for Fund shares sold | 308,514 | |||
Dividends receivable | 264,008 | |||
Prepaid expenses | 32,124 | |||
|
| |||
Total Assets | 594,774,655 | |||
|
| |||
Liabilities: | ||||
Payable for Fund shares redeemed | 214,262 | |||
Payable for investment advisory fees | 522,610 | |||
Payable for distribution fees | 119,209 | |||
Payable for accounting fees | 7,500 | |||
Payable for shareholder services fees | 76,407 | |||
Other accrued expenses | 141,875 | |||
|
| |||
Total Liabilities | 1,081,863 | |||
|
| |||
Net Assets | ||||
(applicable to 10,843,300 shares outstanding) | $ | 593,692,792 | ||
Net Assets Consist of: | ||||
Paid-in capital | $ | 369,540,181 | ||
Total distributable earnings(a) | 224,152,611 | |||
|
| |||
Net Assets | $ | 593,692,792 | ||
|
| |||
| Shares of Beneficial Interest, each at $0.01 par value; unlimited number of shares authorized: | ||||
Class AAA: | ||||
Net Asset Value, offering, and redemption price per share ($524,721,511 ÷ 9,599,597 shares outstanding) | $54.66 | |||
Class A: | ||||
Net Asset Value and redemption price per share | ||||
($4,881,725 ÷ 89,282 shares outstanding) | $54.68 | |||
Maximum offering price per share (NAV ÷ 0.9425, based on maximum sales charge of 5.75% of the offering price) | $58.02 | |||
Class C: | ||||
Net Asset Value and offering price per share | ||||
($2,848,703 ÷ 60,044 shares outstanding) | $47.44 | (b) | ||
Class I: | ||||
Net Asset Value, offering, and redemption price per share ($61,240,853 ÷ 1,094,377 shares outstanding) | $55.96 |
| (a) | Effective December 31, 2018, the Fund has adopted disclosure requirements conforming to SEC Rule 6-04.17 of Regulation S-X and discloses total distributable earnings. See Note 2 for further details. |
| (b) | Redemption price varies based on the length of time held. |
Statement of Operations
For the Year Ended December 31, 2018
Investment Income: | ||||
Dividends | $ | 5,898,993 | ||
Interest | 74,500 | |||
|
| |||
Total Investment Income | 5,973,493 | |||
|
| |||
Expenses: | ||||
Investment advisory fees | 6,564,730 | |||
Distribution fees - Class AAA | 1,470,677 | |||
Distribution fees - Class A | 11,602 | |||
Distribution fees - Class C | 31,593 | |||
Distribution fees - Class T | 2 | |||
Shareholder services fees | 456,232 | |||
Shareholder communications expenses | 126,212 | |||
Trustees’ fees | 102,000 | |||
Legal and audit fees | 90,415 | |||
Registration expenses | 74,098 | |||
Accounting fees | 45,000 | |||
Custodian fees | 43,141 | |||
Interest expense | 766 | |||
Miscellaneous expenses | 41,096 | |||
|
| |||
Total Expenses | 9,057,564 | |||
|
| |||
Less: | ||||
Expenses paid indirectly by broker | ||||
(See Note 6) | (5,525 | ) | ||
|
| |||
Net Expenses | 9,052,039 | |||
|
| |||
Net Investment Loss | (3,078,546 | ) | ||
|
| |||
Net Realized and Unrealized Gain/(Loss) on | ||||
Investments and Foreign Currency: | ||||
Net realized gain on investments | 30,352,468 | |||
|
| |||
Net change in unrealized appreciation/depreciation: | ||||
on investments | (14,733,550 | ) | ||
on foreign currency translations | (1,027 | ) | ||
|
| |||
Net change in unrealized appreciation/ depreciation on investments and foreign currency translations | (14,734,577 | ) | ||
|
| |||
Net Realized and Unrealized Gain/(Loss) on | ||||
Investments and Foreign Currency | 15,617,891 | |||
|
| |||
Net Increase in Net Assets Resulting from | ||||
Operations | $ | 12,539,345 | ||
|
|
See accompanying notes to financial statements.
7
The GAMCO Growth Fund
Statement of Changes in Net Assets
| Year Ended December 31, 2018 | Year Ended December 31, 2017 | |||||||||
Operations: | ||||||||||
Net investment loss | $ | (3,078,546 | ) | $ | (757,621 | ) | ||||
Net realized gain on investments and foreign currency transactions | 30,352,468 | 38,827,169 | ||||||||
Net change in unrealized appreciation/depreciation on investments and foreign currency translations | (14,734,577 | ) | 105,799,039 | |||||||
|
|
|
| |||||||
Net Increase in Net Assets Resulting from Operations | 12,539,345 | 143,868,587 | ||||||||
|
|
|
| |||||||
Distributions to Shareholders: | ||||||||||
Accumulated earnings | ||||||||||
Class AAA | (28,248,219 | ) | (32,729,163 | ) | ||||||
Class A | (254,355 | ) | (189,723 | ) | ||||||
Class C | (171,579 | ) | (177,657 | ) | ||||||
Class I | (3,206,862 | ) | (3,020,357 | ) | ||||||
Class T* | — | (67 | ) | |||||||
|
|
|
| |||||||
Total Distributions to Shareholders(a) | (31,881,015 | ) | (36,116,967 | )** | ||||||
|
|
|
| |||||||
Shares of Beneficial Interest Transactions: | ||||||||||
Class AAA | (9,713,544 | ) | (8,339,487 | ) | ||||||
Class A | 1,730,791 | (274,737 | ) | |||||||
Class C | 345,174 | 580,734 | ||||||||
Class I | 12,405,471 | 6,401,302 | ||||||||
Class T* | (1,380 | ) | 1,067 | |||||||
|
|
|
| |||||||
Net Increase/(Decrease) in Net Assets from Shares of Beneficial Interest Transactions | 4,766,512 | (1,631,121 | ) | |||||||
|
|
|
| |||||||
Redemption Fees | 506 | 366 | ||||||||
|
|
|
| |||||||
Net Increase/(Decrease) in Net Assets | (14,574,652 | ) | 106,120,865 | |||||||
Net Assets: | ||||||||||
Beginning of year | 608,267,444 | 502,146,579 | ||||||||
|
|
|
| |||||||
End of year | $ | 593,692,792 | $ | 608,267,444 | ||||||
|
|
|
| |||||||
| (a) | Effective December 31, 2018, the Fund has adopted disclosure requirements conforming to SEC Rule6-04.17 of RegulationS-X. See Note 2 for further details. |
| * | Class T Shares were liquidated on September 21, 2018. |
| ** | For the year ended December 31, 2017, the distributions to shareholders from net realized gain were $32,729,163 (Class AAA), $189,723 (Class A), $177,657 (Class C), $3,020,357 (Class I), and $67 (Class T*). |
See accompanying notes to financial statements.
8
The GAMCO Growth Fund
Financial Highlights
Selected data for a share of beneficial interest outstanding throughout each year:
| Income (Loss) from Investment Operations | Distributions | Ratios to Average Net Assets/ Supplemental Data | ||||||||||||||||||||||||||||||||||||||||||||||||||||||||||||||||||||
| Year Ended December 31 | Net Asset Value, Beginning of Period | Net Investment Income (Loss)(a) | Net on | Total from Investment Operations | Net Realized Gain on Investments | Return of Capital | Total Distributions | Redemption Fees (a)(b) | Net Asset Value, End of Year | Total Return† | Net Assets End of Year (in 000’s) | Net Investment Income (Loss) | Operating Expenses | Portfolio Turnover Rate | ||||||||||||||||||||||||||||||||||||||||||||||||||||||||
Class AAA | ||||||||||||||||||||||||||||||||||||||||||||||||||||||||||||||||||||||
2018 | $ | 56.74 | $ | (0.31 | ) | $ | 1.32 | $ | 1.01 | $ | (3.09 | ) | — | $ | (3.09 | ) | $ | 0.00 | $ | 54.66 | 1.8 | % | $ | 524,721 | (0.49 | )% | 1.40 | %(c) | 65 | % | ||||||||||||||||||||||||||||||||||||||||
2017 | 46.56 | (0.08 | ) | 13.82 | 13.74 | (3.56 | ) | — | (3.56 | ) | 0.00 | 56.74 | 29.5 | 550,300 | (0.15 | ) | 1.41 | (c) | 50 | |||||||||||||||||||||||||||||||||||||||||||||||||||
2016 | 47.60 | (0.02 | ) | 1.39 | 1.37 | (2.38 | ) | $ | (0.03 | ) | (2.41 | ) | 0.00 | 46.56 | 2.8 | 460,437 | (0.04 | ) | 1.44 | (c)(d) | 52 | |||||||||||||||||||||||||||||||||||||||||||||||||
2015 | 48.93 | (0.05 | ) | 2.62 | 2.57 | (3.90 | ) | — | (3.90 | ) | 0.00 | 47.60 | 5.1 | 484,320 | (0.11 | ) | 1.43 | (c) | 40 | |||||||||||||||||||||||||||||||||||||||||||||||||||
2014 | 46.62 | (0.06 | ) | 4.66 | 4.60 | (2.29 | ) | — | (2.29 | ) | 0.00 | 48.93 | 9.8 | 514,214 | (0.13 | ) | 1.43 | 34 | ||||||||||||||||||||||||||||||||||||||||||||||||||||
Class A | ||||||||||||||||||||||||||||||||||||||||||||||||||||||||||||||||||||||
2018 | $ | 56.76 | $ | (0.31 | ) | $ | 1.32 | $ | 1.01 | $ | (3.09 | ) | — | $ | (3.09 | ) | $ | 0.00 | $ | 54.68 | 1.8 | % | $ | 4,882 | (0.50 | )% | 1.40 | %(c) | 65 | % | ||||||||||||||||||||||||||||||||||||||||
2017 | 46.57 | (0.08 | ) | 13.83 | 13.75 | (3.56 | ) | — | (3.56 | ) | 0.00 | 56.76 | 29.5 | 3,448 | (0.15 | ) | 1.41 | (c) | 50 | |||||||||||||||||||||||||||||||||||||||||||||||||||
2016 | 47.61 | (0.02 | ) | 1.39 | 1.37 | (2.38 | ) | $ | (0.03 | ) | (2.41 | ) | 0.00 | 46.57 | 2.8 | 3,066 | (0.03 | ) | 1.44 | (c)(d) | 52 | |||||||||||||||||||||||||||||||||||||||||||||||||
2015 | 48.93 | (0.05 | ) | 2.63 | 2.58 | (3.90 | ) | — | (3.90 | ) | 0.00 | 47.61 | 5.1 | 3,120 | (0.10 | ) | 1.43 | (c) | 40 | |||||||||||||||||||||||||||||||||||||||||||||||||||
2014 | 46.62 | (0.06 | ) | 4.66 | 4.60 | (2.29 | ) | — | (2.29 | ) | 0.00 | 48.93 | 9.8 | 1,626 | (0.13 | ) | 1.43 | 34 | ||||||||||||||||||||||||||||||||||||||||||||||||||||
Class C | ||||||||||||||||||||||||||||||||||||||||||||||||||||||||||||||||||||||
2018 | $ | 50.02 | $ | (0.68 | ) | $ | 1.19 | $ | 0.51 | $ | (3.09 | ) | — | $ | (3.09 | ) | $ | 0.00 | $ | 47.44 | 1.1 | % | $ | 2,849 | (1.24 | )% | 2.15 | %(c) | 65 | % | ||||||||||||||||||||||||||||||||||||||||
2017 | 41.68 | (0.44 | ) | 12.34 | 11.90 | (3.56 | ) | — | (3.56 | ) | 0.00 | 50.02 | 28.5 | 2,715 | (0.90 | ) | 2.16 | (c) | 50 | |||||||||||||||||||||||||||||||||||||||||||||||||||
2016 | 43.18 | (0.35 | ) | 1.26 | 0.91 | (2.38 | ) | $ | (0.03 | ) | (2.41 | ) | 0.00 | 41.68 | 2.1 | 1,778 | (0.81 | ) | 2.19 | (c)(d) | 52 | |||||||||||||||||||||||||||||||||||||||||||||||||
2015 | 45.06 | (0.40 | ) | 2.42 | 2.02 | (3.90 | ) | — | (3.90 | ) | 0.00 | 43.18 | 4.3 | 2,476 | (0.86 | ) | 2.18 | (c) | 40 | |||||||||||||||||||||||||||||||||||||||||||||||||||
2014 | 43.42 | (0.39 | ) | 4.32 | 3.93 | (2.29 | ) | — | (2.29 | ) | 0.00 | 45.06 | 9.0 | 1,438 | (0.87 | ) | 2.18 | 34 | ||||||||||||||||||||||||||||||||||||||||||||||||||||
Class I | ||||||||||||||||||||||||||||||||||||||||||||||||||||||||||||||||||||||
2018 | $ | 57.87 | $ | (0.15 | ) | $ | 1.33 | $ | 1.18 | $ | (3.09 | ) | — | $ | (3.09 | ) | $ | 0.00 | $ | 55.96 | 2.1 | % | $ | 61,241 | (0.23 | )% | 1.15 | %(c) | 65 | % | ||||||||||||||||||||||||||||||||||||||||
2017 | 47.31 | 0.06 | 14.06 | 14.12 | (3.56 | ) | — | (3.56 | ) | 0.00 | 57.87 | 29.8 | 51,803 | 0.10 | 1.16 | (c) | 50 | |||||||||||||||||||||||||||||||||||||||||||||||||||||
2016 | 48.22 | 0.11 | 1.39 | 1.50 | (2.38 | ) | $ | (0.03 | ) | (2.41 | ) | 0.00 | 47.31 | 3.1 | 36,866 | 0.22 | 1.19 | (c)(d) | 52 | |||||||||||||||||||||||||||||||||||||||||||||||||||
2015 | 49.39 | 0.07 | 2.66 | 2.73 | (3.90 | ) | — | (3.90 | ) | 0.00 | 48.22 | 5.4 | 35,484 | 0.14 | 1.17 | (c) | 40 | |||||||||||||||||||||||||||||||||||||||||||||||||||||
2014 | 46.92 | 0.06 | 4.70 | 4.76 | (2.29 | ) | — | (2.29 | ) | 0.00 | 49.39 | 10.1 | 16,336 | 0.11 | 1.18 | 34 | ||||||||||||||||||||||||||||||||||||||||||||||||||||||
| † | Total return represents aggregate total return of a hypothetical $1,000 investment at the beginning of the year and sold at the end of the year including reinvestment of distributions and does not reflect the applicable sales charges. |
| (a) | Per share amounts have been calculated using the average shares outstanding method. |
| (b) | Amount represents less than $0.005 per share. |
| (c) | The Fund received credits from a designated broker who agreed to pay certain Fund operating expenses. For the years ended December 31, 2018, 2017, 2016, and 2015, there was no impact on the expense ratios. |
| (d) | During the year ended December 31, 2016, the Fund received a reimbursement of custody expenses paid in prior years. Had such reimbursement (allocated by relative net asset values of the Fund’s share classes) been included in this period, the annualized expense ratios would have been 1.33% (Class AAA), 1.33% (Class A), 2.09% (Class C), and 1.07% (Class I). |
See accompanying notes to financial statements.
9
The GAMCO Growth Fund
Notes to Financial Statements
1. Organization.The GAMCO Growth Fund was organized on October 24, 1986 as a Massachusetts business trust and commenced investment operations on April 10, 1987. The Fund is a diversifiedopen-end management investment company registered under the Investment Company Act of 1940, as amended (the 1940 Act). The Fund’s primary objective is capital appreciation.
2. Significant Accounting Policies.As an investment company, the Fund follows the investment company accounting and reporting guidance, which is part of U.S. generally accepted accounting principles (GAAP) that may require the use of management estimates and assumptions in the preparation of its financial statements. Actual results could differ from those estimates. The following is a summary of significant accounting policies followed by the Fund in the preparation of its financial statements.
New Accounting Pronouncements.The SEC recently adopted changes to RegulationS-X to simplify the reporting of information by registered investment companies in financial statements. The amendments require presentation of the total, rather than the components, of distributable earnings on the Statement of Assets and Liabilities and also require presentation of the total, rather than the components, of distributions to shareholders, except for tax return of capital distributions, if any, on the Statement of Changes in Net Assets. The amendments also removed the requirement for parenthetical disclosure of undistributed net investment income on the Statement of Changes in Net Assets. These RegulationS-X amendments are reflected in the Fund’s financial statements for the year ended December 31, 2018. As a result of adopting these amendments, the distributions to shareholders in the December 31, 2017 Statement of Changes in Net Assets presented herein have been reclassified to conform to the current year presentation.
To improve the effectiveness of fair value disclosure requirements, the Financial Accounting Standards Board recently issued Accounting Standard Update (ASU)2018-13, Fair Value Measurement Disclosure Framework – Changes to the Disclosure Requirements for Fair Value Measurement (ASU2018-13), which adds, removes, and modifies certain aspects relating to fair value disclosure. ASU2018-13 is effective for interim and annual reporting periods beginning after December 15, 2019; early adoption of the additions relating to ASU2018-13 is not required, even if early adoption is elected for the removals under ASU2018-13. Management has early adopted the removals set forth in ASU2018-13 in these financial statements and has not early adopted the additions set forth in ASU2018-13.
Security Valuation.Portfolio securities listed or traded on a nationally recognized securities exchange or traded in the U.S.over-the-counter market for which market quotations are readily available are valued at the last quoted sale price or a market’s official closing price as of the close of business on the day the securities are being valued. If there were no sales that day, the security is valued at the average of the closing bid and asked prices or, if there were no asked prices quoted on that day, then the security is valued at the closing bid price on that day. If no bid or asked prices are quoted on such day, the security is valued at the most recently available price or, if the Board of Trustees (the Board) so determines, by such other method as the Board shall determine in good faith to reflect its fair market value. Portfolio securities traded on more than one national securities exchange or market are valued according to the broadest and most representative market, as determined by Gabelli Funds, LLC (the Adviser).
Portfolio securities primarily traded on a foreign market are generally valued at the preceding closing values of such securities on the relevant market, but may be fair valued pursuant to procedures established by the Board if market conditions change significantly after the close of the foreign market, but prior to the close of
10
The GAMCO Growth Fund
Notes to Financial Statements (Continued)
business on the day the securities are being valued. Debt obligations for which market quotations are readily available are valued at the average of the latest bid and asked prices. If there were no asked prices quoted on such day, the security is valued using the closing bid price, unless the Board determines such amount does not reflect the securities’ fair value, in which case these securities will be fair valued as determined by the Board. Certain securities are valued principally using dealer quotations. Futures contracts are valued at the closing settlement price of the exchange or board of trade on which the applicable contract is traded. OTC futures and options on futures for which market quotations are readily available will be valued by quotations received from a pricing service or, if no quotations are available from a pricing service, by quotations obtained from one or more dealers in the instrument in question by the Adviser.
Securities and assets for which market quotations are not readily available are fair valued as determined by the Board. Fair valuation methodologies and procedures may include, but are not limited to: analysis and review of available financial andnon-financial information about the company; comparisons with the valuation and changes in valuation of similar securities, including a comparison of foreign securities with the equivalent U.S. dollar value American Depositary Receipt securities at the close of the U.S. exchange; and evaluation of any other information that could be indicative of the value of the security.
The inputs and valuation techniques used to measure fair value of the Fund’s investments are summarized into three levels as described in the hierarchy below:
| · | Level 1 — quoted prices in active markets for identical securities; |
| · | Level 2 — other significant observable inputs (including quoted prices for similar securities, interest rates, prepayment speeds, credit risk, etc.); and |
| · | Level 3 — significant unobservable inputs (including the Board’s determinations as to the fair value of investments). |
A financial instrument’s level within the fair value hierarchy is based on the lowest level of any input both individually and in the aggregate that is significant to the fair value measurement. The inputs or methodology used for valuing securities are not necessarily an indication of the risk associated with investing in those securities. The summary of the Fund’s investments in securities by inputs used to value the Fund’s investments as of December 31, 2018 is as follows:
Valuation Inputs* | Investments in Securities (Market Value) | ||||
| Level 1 - Quoted Prices | $ | 591,374,054 | |||
| Level 2 - Other Significant Observable Inputs | 2,792,844 | ||||
|
| ||||
| Total | $ | 594,166,898 | |||
|
| ||||
| * | Portfolio holdings designated in Level 1 and Level 2 are disclosed individually in the Schedule of Investments (SOI). Please refer to the SOI for the industry classifications of these portfolio holdings. Level 1 consists of Common Stocks and Real Estate Investment Trusts. Level 2 consists of U.S. Government Obligations. |
There were no Level 3 investments held at December 31, 2018 or December 31, 2017.
11
The GAMCO Growth Fund
Notes to Financial Statements (Continued)
Additional Information to Evaluate Qualitative Information.
General.The Fund uses recognized industry pricing services – approved by the Board and unaffiliated with the Adviser – to value most of its securities, and uses broker quotes provided by market makers of securities not valued by these and other recognized pricing sources. Several different pricing feeds are received to value domestic equity securities, international equity securities, preferred equity securities, and fixed income securities. The data within these feeds are ultimately sourced from major stock exchanges and trading systems where these securities trade. The prices supplied by external sources are checked by obtaining quotations or actual transaction prices from market participants. If a price obtained from the pricing source is deemed unreliable, prices will be sought from another pricing service or from a broker/dealer that trades that security or similar securities.
Fair Valuation.Fair valued securities may be common or preferred equities, warrants, options, rights, or fixed income obligations. Where appropriate, Level 3 securities are those for which market quotations are not available, such as securities not traded for several days, or for which current bids are not available, or which are restricted as to transfer. Among the factors to be considered to fair value a security are recent prices of comparable securities that are publicly traded, reliable prices of securities not publicly traded, the use of valuation models, current analyst reports, valuing the income or cash flow of the issuer, or cost if the preceding factors do not apply. The circumstances of Level 3 securities are frequently monitored to determine if fair valuation measures continue to apply.
The Adviser reports quarterly to the Board the results of the application of fair valuation policies and procedures. These may include back testing the prices realized in subsequent trades of these fair valued securities to fair values previously recognized.
Foreign Currency Translations.The books and records of the Fund are maintained in U.S. dollars. Foreign currencies, investments, and other assets and liabilities are translated into U.S. dollars at current exchange rates. Purchases and sales of investment securities, income, and expenses are translated at the exchange rate prevailing on the respective dates of such transactions. Unrealized gains and losses that result from changes in foreign exchange rates and/or changes in market prices of securities have been included in unrealized appreciation/depreciation on investments and foreign currency translations. Net realized foreign currency gains and losses resulting from changes in exchange rates include foreign currency gains and losses between trade date and settlement date on investment securities transactions, foreign currency transactions, and the difference between the amounts of interest and dividends recorded on the books of the Fund and the amounts actually received. The portion of foreign currency gains and losses related to fluctuation in exchange rates between the initial purchase trade date and subsequent sale trade date is included in realized gain/(loss) on investments.
Foreign Securities.The Fund may directly purchase securities of foreign issuers. Investing in securities of foreign issuers involves special risks not typically associated with investing in securities of U.S. issuers. The risks include possible revaluation of currencies, the inability to repatriate funds, less complete financial information about companies, and possible future adverse political and economic developments. Moreover, securities of many foreign issuers and their markets may be less liquid and their prices more volatile than of securities of comparable U.S. issuers.
12
The GAMCO Growth Fund
Notes to Financial Statements (Continued)
Foreign Taxes.The Fund may be subject to foreign taxes on income, gains on investments, or currency repatriation, a portion of which may be recoverable. The Fund will accrue such taxes and recoveries as applicable, based upon its current interpretation of tax rules and regulations that exist in the markets in which it invests.
Securities Transactions and Investment Income.Securities transactions are accounted for on the trade date with realized gain/(loss) on investments determined by using the identified cost method. Interest income (including amortization of premium and accretion of discount) is recorded on an accrual basis. Premiums and discounts on debt securities are amortized using the effective yield to maturity method. Dividend income is recorded on theex-dividend date, except for certain dividends from foreign securities that are recorded as soon after theex-dividend date as the Fund becomes aware of such dividends.
Determination of Net Asset Value and Calculation of Expenses.Certain administrative expenses are common to, and allocated among, various affiliated funds. Such allocations are made on the basis of each fund’s average net assets or other criteria directly affecting the expenses as determined by the Adviser pursuant to procedures established by the Board.
In calculating the NAV per share of each class, investment income, realized and unrealized gains and losses, redemption fees, and expenses other than class specific expenses are allocated daily to each class of shares based upon the proportion of net assets of each class at the beginning of each day. Distribution expenses are borne solely by the class incurring the expense.
Distributions to Shareholders.Distributions to shareholders are recorded on theex-dividend date. Distributions to shareholders are based on income and capital gains as determined in accordance with federal income tax regulations, which may differ from income and capital gains as determined under GAAP. These differences are primarily due to differing treatments of income and gains on various investment securities held by the Fund and timing differences. These book/tax differences are either temporary or permanent in nature. To the extent these differences are permanent, adjustments are made to the appropriate capital accounts in the period when the differences arise. Permanent differences were primarily due to thewrite-off of current year net operating loss. These reclassifications have no impact on the NAV of the Fund. For the fiscal year ended December 31, 2018, reclassifications were made to decreasepaid-in capital by $3,078,546 with an offsetting adjustment to total distributable earnings.
The tax character of distributions paid during the years ended December 31, 2018 and 2017 was as follows:
| Year Ended December 31, 2018 | Year Ended December 31, 2017 | |||||||||
Distributions paid from: | ||||||||||
Ordinary income (inclusive of short term capital gains) | — | $ | 679,692 | |||||||
Net long term capital gains | $ | 31,881,015 | 35,437,275 | |||||||
|
|
|
| |||||||
Total distributions paid | $ | 31,881,015 | $ | 36,116,967 | ||||||
|
|
|
| |||||||
Provision for Income Taxes.The Fund intends to continue to qualify as a regulated investment company under Subchapter M of the Internal Revenue Code of 1986, as amended (the Code). It is the policy of the Fund to comply with the requirements of the Code applicable to regulated investment companies and to distribute substantially all of its net investment company taxable income and net capital gains. Therefore, no provision for federal income taxes is required.
13
The GAMCO Growth Fund
Notes to Financial Statements (Continued)
As of December 31, 2018, the components of accumulated earnings/losses on a tax basis were as follows:
Undistributed long term capital gains | $ | 820,686 | ||
Net unrealized appreciation on investments and foreign currency translations | 223,331,925 | |||
|
| |||
Total | $ | 224,152,611 | ||
|
|
As of December 31, 2018, the temporary differences between book basis and tax basis unrealized appreciation on investments were primarily due to deferral of losses from wash sales for tax purposes.
The following summarizes the tax cost of investments and the related net unrealized appreciation at December 31, 2018:
| Gross | Gross | |||||||||||||||||||
| Unrealized | Unrealized | Net Unrealized | ||||||||||||||||||
| Cost | Appreciation | Depreciation | Appreciation | |||||||||||||||||
Investments | $370,835,650 | $226,839,965 | $(3,508,717) | $223,331,248 | ||||||||||||||||
The Fund is required to evaluate tax positions taken or expected to be taken in the course of preparing the Fund’s tax returns to determine whether the tax positions are“more-likely-than-not” of being sustained by the applicable tax authority. Income tax and related interest and penalties would be recognized by the Fund as tax expense in the Statement of Operations if the tax positions were deemed not to meet themore-likely-than-not threshold. During the year ended December 31, 2018, the Fund did not incur any income tax, interest, or penalties. As of December 31, 2018, the Adviser has reviewed all open tax years and concluded that there was no impact to the Fund’s net assets or results of operations. The Fund’s federal and state tax returns for the prior three fiscal years remain open, subject to examination. On an ongoing basis, the Adviser will monitor the Fund’s tax positions to determine if adjustments to this conclusion are necessary.
3. Investment Advisory Agreement and Other Transactions.The Fund has entered into an investment advisory agreement (the Advisory Agreement) with the Adviser which provides that the Fund will pay the Adviser a fee, computed daily and paid monthly, at the annual rate of 1.00% of the value of its average daily net assets. In accordance with the Advisory Agreement, the Adviser provides a continuous investment program for the Fund’s portfolio, oversees the administration of all aspects of the Fund’s business and affairs, and pays the compensation of all Officers and Trustees of the Fund who are affiliated persons of the Adviser.
The Fund pays each Trustee who is not considered an affiliated person an annual retainer of $9,000 plus $2,000 for each Board meeting attended. Each Trustee is reimbursed by the Fund for any out of pocket expenses incurred in attending meetings. All Board committee members receive $500 per meeting attended. The Chairman of the Audit Committee and the Lead Trustee each receives an annual fee of $2,000. The Chairman of the Nominating Committee receives a $1,000 annual fee. A Trustee may receive a single meeting fee, allocated among the participating funds, for attending certain meetings held on behalf of multiple funds. Trustees who are directors or employees of the Adviser or an affiliated company receive no compensation or expense reimbursement from the Fund.
4. Distribution Plan.The Fund’s Board has adopted a distribution plan (the Plan) for each class of shares, except for Class I Shares, pursuant to Rule12b-1 under the 1940 Act. Under the Class AAA, Class A, and Class C Share Plans, payments are authorized to G.distributors, LLC (the distributor), an affiliate of the Adviser, at annual rates of 0.25%, 0.25%, and 1.00%, respectively, of the average daily net assets of those classes, the annual limitations under each Plan. Such payments are accrued daily and paid monthly.
14
The GAMCO Growth Fund
Notes to Financial Statements (Continued)
5. Portfolio Securities.Purchases and sales of securities during the year ended December 31, 2018, other than short term securities and U.S. Government obligations, aggregated $421,272,634 and $452,190,831, respectively.
6. Transactions with Affiliates and Other Arrangements.During the year ended December 31, 2018, the Distributor retained a total of $8,269 from investors representing commissions (sales charges and underwriting fees) on sales and redemptions of Fund shares.
During the year ended December 31, 2018, the Fund received credits from a designated broker who agreed to pay certain Fund operating expenses. The amount of such expenses paid through this directed brokerage arrangement during this period was $5,525.
The cost of calculating the Fund’s NAV per share is a Fund expense pursuant to the Advisory Agreement. During the year ended December 31, 2018, the Fund accrued $45,000 in accounting fees in the Statement of Operations.
7. Line of Credit.The Fund participates in an unsecured line of credit, which expires on March 6, 2019 and may be renewed annually, of up to $75,000,000 under which it may borrow up to 10% of net assets from the custodian for temporary borrowing purposes. Borrowings under this arrangement bear interest at a floating rate equal to the higher of the overnight Federal Funds rate plus 125 basis points or the 30 day ICE LIBOR plus 125 basis points in effect on that day. This amount, if any, would be included in “Interest expense” in the Statement of Operations. At December 31, 2018, there were no borrowings outstanding under the line of credit.
The average daily amount of borrowings outstanding under the line of credit during the year ended December 31, 2018 was $20,362, with a weighted average interest rate of 3.28%. The maximum amount borrowed at any time during the year ended December 31, 2018 was $5,636,000.
8. Shares of Beneficial Interest.The Fund offers four classes of shares – Class AAA Shares, Class A Shares, Class C Shares, and Class I Shares. Class AAA and Class I Shares are offered without a sales charge. Class A Shares are subject to a maximumfront-end sales charge of 5.75%. Class C Shares are subject to a 1.00% contingent deferred sales charge for one year after purchase.
The Fund imposes a redemption fee of 2.00% on all classes of shares that are redeemed or exchanged on or before the seventh day after the date of a purchase. The redemption fee is deducted from the proceeds otherwise payable to the redeeming shareholders and is retained by the Fund as an increase inpaid-in capital. The redemption fees retained by the Fund during the years ended December 31, 2018 and 2017, if any, can be found in the Statement of Changes in Net Assets under Redemption Fees.
15
The GAMCO Growth Fund
Notes to Financial Statements (Continued)
Transactions in shares of beneficial interest were as follows:
| Year Ended | Year Ended | |||||||||||||||
| December 31, 2018 | December 31, 2017 | |||||||||||||||
| Shares | Amount | Shares | Amount | |||||||||||||
Class AAA | ||||||||||||||||
Shares sold | 290,016 | $ | 18,274,431 | 148,434 | $ | 8,042,094 | ||||||||||
Shares issued upon reinvestment of distributions | 495,908 | 26,863,465 | 547,337 | 31,154,454 | ||||||||||||
Shares redeemed | (885,310 | ) | (54,851,440 | ) | (886,616 | ) | (47,536,035 | ) | ||||||||
|
|
|
|
|
|
|
| |||||||||
Net decrease | (99,386 | ) | $ | (9,713,544 | ) | (190,845 | ) | $ | (8,339,487 | ) | ||||||
|
|
|
|
|
|
|
| |||||||||
Class A | ||||||||||||||||
Shares sold | 65,379 | $ | 4,011,440 | 17,591 | $ | 996,265 | ||||||||||
Shares issued upon reinvestment of distributions | 4,497 | 243,671 | 3,212 | 182,894 | ||||||||||||
Shares redeemed | (41,355 | ) | (2,524,320 | ) | (25,881 | ) | (1,453,896 | ) | ||||||||
|
|
|
|
|
|
|
| |||||||||
Net increase/(decrease) | 28,521 | $ | 1,730,791 | (5,078 | ) | $ | (274,737 | ) | ||||||||
|
|
|
|
|
|
|
| |||||||||
Class C | ||||||||||||||||
Shares sold | 19,066 | $ | 1,047,895 | 18,678 | $ | 908,417 | ||||||||||
Shares issued upon reinvestment of distributions | 3,395 | 159,630 | 3,173 | 159,195 | ||||||||||||
Shares redeemed | (16,683 | ) | (862,351 | ) | (10,225 | ) | (486,878 | ) | ||||||||
|
|
|
|
|
|
|
| |||||||||
Net increase | 5,778 | $ | 345,174 | 11,626 | $ | 580,734 | ||||||||||
|
|
|
|
|
|
|
| |||||||||
Class I | ||||||||||||||||
Shares sold | 276,328 | $ | 17,594,901 | 144,712 | $ | 7,751,098 | ||||||||||
Shares issued upon reinvestment of distributions | 53,026 | 2,940,840 | 46,214 | 2,682,718 | ||||||||||||
Shares redeemed | (130,167 | ) | (8,130,270 | ) | (74,956 | ) | (4,032,514 | ) | ||||||||
|
|
|
|
|
|
|
| |||||||||
Net increase | 199,187 | $ | 12,405,471 | 115,970 | $ | 6,401,302 | ||||||||||
|
|
|
|
|
|
|
| |||||||||
Class T* | ||||||||||||||||
Shares sold | — | — | 19 | $ | 1,000 | |||||||||||
Shares issued upon reinvestment of distributions | — | — | 1 | 67 | ||||||||||||
Shares redeemed | (20 | ) | $ | (1,380 | ) | — | — | |||||||||
|
|
|
|
|
|
|
| |||||||||
Net increase/(decrease) | (20 | ) | $ | (1,380 | ) | 20 | $ | 1,067 | ||||||||
|
|
|
|
|
|
|
| |||||||||
| * | Class T Shares were liquidated on September 21, 2018. |
9. Indemnifications.The Fund enters into contracts that contain a variety of indemnifications. The Fund’s maximum exposure under these arrangements is unknown. However, the Fund has not had prior claims or losses pursuant to these contracts. Management has reviewed the Fund’s existing contracts and expects the risk of loss to be remote.
10. Subsequent Events.Management has evaluated the impact on the Fund of all subsequent events occurring through the date the financial statements were issued and has determined that there were no subsequent events requiring recognition or disclosure in the financial statements.
16
The GAMCO Growth Fund
Report of Independent Registered Public Accounting Firm
To the Board of Trustees and
Shareholders of The GAMCO Growth Fund:
Opinion on the Financial Statements
We have audited the accompanying statement of assets and liabilities, including the schedule of investments, of The GAMCO Growth Fund (the “Fund”) as of December 31, 2018, the related statement of operations for the year ended December 31, 2018, the statement of changes in net assets for each of the two years in the period ended December 31, 2018, including the related notes, and the financial highlights for each of the five years in the period ended December 31, 2018 (collectively referred to as the “financial statements”). In our opinion, the financial statements present fairly, in all material respects, the financial position of the Fund as of December 31, 2018, the results of its operations for the year then ended, the changes in its net assets for each of the two years in the period ended December 31, 2018 and the financial highlights for each of the five years in the period ended December 31, 2018 in conformity with accounting principles generally accepted in the United States of America.
Basis for Opinion
These financial statements are the responsibility of the Fund’s management. Our responsibility is to express an opinion on the Fund’s financial statements based on our audits. We are a public accounting firm registered with the Public Company Accounting Oversight Board (United States) (PCAOB) and are required to be independent with respect to the Fund in accordance with the U.S. federal securities laws and the applicable rules and regulations of the Securities and Exchange Commission and the PCAOB.
We conducted our audits of these financial statements in accordance with the standards of the PCAOB. Those standards require that we plan and perform the audit to obtain reasonable assurance about whether the financial statements are free of material misstatement, whether due to error or fraud.
Our audits included performing procedures to assess the risks of material misstatement of the financial statements, whether due to error or fraud, and performing procedures that respond to those risks. Such procedures included examining, on a test basis, evidence regarding the amounts and disclosures in the financial statements. Our audits also included evaluating the accounting principles used and significant estimates made by management, as well as evaluating the overall presentation of the financial statements. Our procedures included confirmation of securities owned as of December 31, 2018 by correspondence with the custodian. We believe that our audits provide a reasonable basis for our opinion.
/s/ PricewaterhouseCoopers LLP
New York, New York
February 28, 2019
We have served as the auditor of one or more investment companies in Gabelli/GAMCO Fund Complex since 1986.
17
The GAMCO Growth Fund
Additional Fund Information (Unaudited)
The business and affairs of the Fund are managed under the direction of the Fund’s Board of Trustees. Information pertaining to the Trustees and officers of the Fund is set forth below. The Fund’s Statement of Additional Information includes additional information about the Fund’s Trustees and is available without charge, upon request, by calling800-GABELLI(800-422-3554) or by writing to The GAMCO Growth Fund at One Corporate Center, Rye, NY 10580-1422.
Name, Position(s) Address1 and Age | Term of Office | Number of Funds in Fund Complex | Principal Occupation(s) During Past Five Years | Other Directorships Held by Trustee3 | ||||||
INTERESTED TRUSTEES4: | ||||||||||
Mario J. Gabelli, CFA Trustee Age: 76 | Since 1987 | 35 | Chairman, Chief Executive Officer, and Chief Investment Officer– Value Portfolios of GAMCO Investors, Inc. and Chief Investment Officer– Value Portfolios of Gabelli Funds, LLC and GAMCO Asset Management Inc.; Director/ Trustee or Chief Investment Officer of other registered investment companies within the Gabelli/GAMCO Fund Complex; Chief Executive Officer of GGCP, Inc.; Executive Chairman of Associated Capital Group, Inc. | Director of Morgan Group Holdings, Inc. (holding company); Chairman of the Board and Chief Executive Officer of LICT Corp. (multimedia and communication services company); Director of CIBL, Inc. (broadcasting and wireless communications); Director of ICTC Group Inc. (communications) | ||||||
John D. Gabelli Trustee Age: 74 | Since 1995 | 12 | Senior Vice President of G.research, LLC | — | ||||||
Anthony Torna, Sr. Trustee Age: 92 | Since 1987 | 1 | Registered Representative, Maxim Group LLC; Investec Ernst & Company (2001-2012) | — | ||||||
INDEPENDENT TRUSTEES5: | ||||||||||
James P. Conn Trustee Age: 80 | Since 1992 | 26 | Former Managing Director and Chief Investment Officer of Financial Security Assurance Holdings Ltd. (1992-1998) | — | ||||||
Robert J. Morrissey Trustee Age: 79 | Since 2001 | 7 | Partner in the law firm of Morrissey, Hawkins & Lynch | Chairman of the Board of Directors, Belmont Savings Bank | ||||||
Anthony R. Pustorino Trustee Age: 93 | Since 1987 | 10 | Certified Public Accountant; Professor Emeritus, Pace University | Director of The LGL Group, Inc. (diversified manufacturing) (2004-2011) | ||||||
Anthonie C. van Ekris6 Trustee Age: 84 | 1987-1989 1992-present | 23 | Chairman and Chief Executive Officer of BALMAC International, Inc. (global import/ export company) | — | ||||||
Salvatore J. Zizza Trustee Age: 73 | 1987-1996 2000-present | 32 | President of Zizza & Associates Corp. (private holding company); Chairman of BAM (semiconductor and aerospace manufacturing); President of Bergen Cove Realty Inc.; Chairman of Metropolitan Paper Recycling Inc. (recycling) (2005-2014) | Director and Chairman ofTrans-Lux Corporation (business services); Director and Chairman of Harbor Diversified Inc. (pharmaceuticals) (2009-2018) | ||||||
18
The GAMCO Growth Fund
Additional Fund Information (Continued) (Unaudited)
Name, Position(s) Address1 and Age | Term of Office and Length of Time Served2 | Principal Occupation(s) During Past Five Years | ||
OFFICERS: | ||||
Bruce N. Alpert President Age: 67 | Since 1988 | Executive Vice President and Chief Operating Officer of Gabelli Funds, LLC since 1988; Officer of registered investment companies within the Gabelli/GAMCO Fund Complex; Senior Vice President of GAMCO Investors, Inc. since 2008 | ||
John C. Ball Treasurer Age: 42 | Since 2017 | Treasurer of funds within the Gabelli/GAMCO Fund Complex since 2017; Vice President and Assistant Treasurer of AMG Funds, 2014-2017; Vice President of State Street Corporation, 2007-2014 | ||
Agnes Mullady Vice President Age: 60 | Since 2006 | Officer of registered investment companies within the Gabelli/GAMCO Fund Complex since 2006; President and Chief Operating Officer of the Fund Division of Gabelli Funds, LLC since 2015; Chief Executive Officer of G.distributors, LLC since 2010; Senior Vice President of GAMCO Investors, Inc. since 2009; Vice President of Gabelli Funds, LLC since 2007; Executive Vice President of Associated Capital Group, Inc. since 2016 | ||
Andrea R. Mango Secretary Age: 46 | Since 2013 | Vice President of GAMCO Investors, Inc. since 2016; Counsel of Gabelli Funds, LLC since 2013; Secretary of registered investment companies within the Gabelli/GAMCO Fund Complex since 2013; Vice President ofclosed-end funds within the Gabelli/GAMCO Fund Complex since 2014; Corporate Vice President within the Corporate Compliance Department of New York Life Insurance Company, 2011-2013 | ||
Richard J. Walz Chief Compliance Officer Age: 59 | Since 2013 | Chief Compliance Officer of registered investment companies within the Gabelli/GAMCO Fund Complex since 2013; Chief Compliance Officer of AEGON USA Investment Management, 2011-2013 | ||
| 1 | Address: One Corporate Center, Rye, NY 10580-1422, unless otherwise noted. |
| 2 | Each Trustee will hold office for an indefinite term until the earliest of (i) the next meeting of shareholders, if any, called for the purpose of considering the election orre-election of such Trustee and until the election and qualification of his or her successor, if any, elected at such meeting, or (ii) the date a Trustee resigns or retires, or a Trustee is removed by the Board of Trustees or shareholders, in accordance with the Fund’sBy-Laws and Declaration of Trust. Each officer will hold office for an indefinite term until the date he or she resigns or retires or until his or her successor is elected and qualified. For officers, includes time served in previous officer positions with the Fund. |
| 3 | This column includes only directorships of companies required to report to the SEC under the Securities Exchange Act of 1934, as amended, i.e., public companies, or other investment companies registered under the 1940 Act. |
| 4 | “Interested person” of the Fund as defined in the 1940 Act. Messrs. Mario J. Gabelli and John D. Gabelli, who are brothers, are each considered an “interested person” because of their affiliation with Gabelli Funds, LLC which acts as the Fund’s investment adviser. |
| 5 | Trustees who are not interested persons are considered “Independent” Trustees. |
| 6 | Mr. van Ekris is an independent director of Gabelli International Ltd., Gabelli Fund LDC, Gama Capital Opportunities Master Ltd., and GAMCO International SICAV, all of which may be deemed to be controlled by Mario J. Gabelli and/or affiliates and, in that event, would be deemed to be under common control with the Fund’s Adviser. |
19
Gabelli/GAMCO Funds and Your Personal Privacy
Who are we?
The Gabelli/GAMCO Funds are investment companies registered with the Securities and Exchange Commission under the Investment Company Act of 1940. We are managed by Gabelli Funds, LLC, which is affiliated with GAMCO Investors, Inc., a publicly held company with subsidiaries and affiliates that provide investment advisory services for a variety of clients.
What kind ofnon-public information do we collect about you if you become a fund shareholder?
If you apply to open an account directly with us, you will be giving us somenon-public information about yourself. Thenon-public information we collect about you is:
• Information you give us on your application form.This could include your name, address, telephone number, social security number, bank account number, and other information.
• Information about your transactions with us, any transactions with our affiliates, and transactions with the entities we hire to provide services to you.This would include information about the shares that you buy or redeem. If we hire someone else to provide services — like a transfer agent — we will also have information about the transactions that you conduct through them.
What information do we disclose and to whom do we disclose it?
We do not disclose anynon-public personal information about our customers or former customers to anyone other than our affiliates, our service providers who need to know such information, and as otherwise permitted by law. If you want to find out what the law permits, you can read the privacy rules adopted by the Securities and Exchange Commission. They are in volume 17 of the Code of Federal Regulations, Part 248. The Commission often posts information about its regulations on its website, www.sec.gov.
What do we do to protect your personal information?
We restrict access tonon-public personal information about you to the people who need to know that information in order to provide services to you or the fund and to ensure that we are complying with the laws governing the securities business. We maintain physical, electronic, and procedural safeguards to keep your personal information confidential.
|
This page was intentionally left blank.
This page was intentionally left blank.
THE GAMCO GROWTH FUND
One Corporate Center
Rye, NY 10580-1422
Portfolio Management Team Biographies
Howard F. Ward, CFA,joined Gabelli Funds in 1995 and currently serves as GAMCO’s Chief Investment Officer of Growth Equities as well as a Gabelli Funds, LLC portfolio manager for several funds within the Gabelli/GAMCO Fund Complex. Prior to joining Gabelli, Mr. Ward served as Managing Director and Lead Portfolio Manager for several Scudder mutual funds. He also was an Investment Officer in the Institutional Investment Department with Brown Brothers, Harriman & Co. Mr. Ward received his BA in Economics from Northwestern University.
Christopher D. Ward, CFA,joined the GAMCO Growth Team in 2015 as Vice President and Research Analyst. Prior to joining Gabelli Funds, Mr. Ward spent five years at Morgan Stanley Private Wealth Management where he served as Director of Business Strategy for The Apollo Group. Before joining Morgan Stanley, he was with the GFI Group, Inc., a wholesale institutional brokerage firm. Mr. Ward is a Chartered Financial Analyst and a member of the New York Society of Security Analysts. He graduated from Boston College with a BA in Economics.
2018 TAX NOTICE TO SHAREHOLDERS(Unaudited)
For the year ended December 31, 2018, the Fund paid to shareholders long term capital gains totaling $31,881,015 or the maximum allowable. The distributions of long term capital gains have been designated as a capital gain dividend by the Fund’s Board of Trustees.
This designation is based on financial information available as of the date of this annual report and, accordingly, is subject to change. For each item, it is the intention of the Fund to designate the maximum amount permitted under the Internal Revenue Code and the regulations thereunder.
We have separated the portfolio managers’ commentary from the financial statements and investment portfolio due to corporate governance regulations stipulated by the Sarbanes-Oxley Act of 2002. We have done this to ensure that the content of the portfolio managers’ commentary is unrestricted. Both the commentary and the financial statements, including the portfolio of investments, will be available on our website at www.gabelli.com.
THE GAMCO GROWTH FUND
One Corporate Center
Rye, New York 10580-1422
| t | 800-GABELLI(800-422-3554) |
| f | 914-921-5118 |
| e | info@gabelli.com |
| GABELLI.COM |
Net Asset Value per share available daily
by calling800-GABELLI after 7:00 P.M.
BOARD OF TRUSTEES |
OFFICERS | |
Mario J. Gabelli, CFA | Bruce N. Alpert | |
Chairman and Chief | President | |
Executive Officer, | ||
GAMCO Investors, Inc. | John C. Ball | |
Executive Chairman, | Treasurer | |
Associated Capital Group, Inc. | ||
Agnes Mullady | ||
James P. Conn | Vice President | |
Former Chief Investment Officer, Financial Security Assurance Holdings Ltd. |
Andrea R. Mango | |
Secretary | ||
Richard J. Walz | ||
John D. Gabelli | Chief Compliance Officer | |
Senior Vice President, | ||
G.research, LLC | DISTRIBUTOR | |
G.distributors, LLC | ||
Robert J. Morrissey | ||
Partner, | CUSTODIAN | |
Morrissey, Hawkins & Lynch | State Street Bank and | |
Anthony R. Pustorino | Trust Company | |
Certified Public Accountant, |
TRANSFER AGENT AND | |
Professor Emeritus, | DIVIDEND DISBURSING AGENT | |
Pace University | DST Asset Manger | |
Solutions, Inc. | ||
Anthony Torna, Sr. | ||
Former Investment Counselor, | ||
Maxim Group LLC | LEGAL COUNSEL | |
Skadden, Arps, Slate, Meagher & | ||
Anthonie C. van Ekris | Flom LLP | |
Chairman, | ||
BALMAC International, Inc. | ||
Salvatore J. Zizza | ||
Chairman, | ||
Zizza & Associates Corp. | ||
This report is submitted for the general information of the shareholders of The GAMCO Growth Fund. It is not authorized for distribution to prospective investors unless preceded or accompanied by an effective prospectus.
GAB406Q418AR
Item 2. Code of Ethics.
| (a) | The registrant, as of the end of the period covered by this report, has adopted a code of ethics that applies to the registrant’s principal executive officer, principal financial officer, principal accounting officer or controller, or persons performing similar functions, regardless of whether these individuals are employed by the registrant or a third party. |
| (c) | There have been no amendments, during the period covered by this report, to a provision of the code of ethics that applies to the registrant’s principal executive officer, principal financial officer, principal accounting officer or controller, or persons performing similar functions, regardless of whether these individuals are employed by the registrant or a third party, and that relates to any element of the code of ethics description. |
| (d) | The registrant has not granted any waivers, including an implicit waiver, from a provision of the code of ethics that applies to the registrant’s principal executive officer, principal financial officer, principal accounting officer or controller, or persons performing similar functions, regardless of whether these individuals are employed by the registrant or a third party, that relates to one or more of the items set forth in paragraph (b) of this item’s instructions. |
Item 3. Audit Committee Financial Expert.
As of the end of the period covered by the report, the registrant’s Board of Trustees has determined that Anthony R. Pustorino is qualified to serve as an audit committee financial expert serving on its audit committee and that he is “independent,” as defined by Item 3 of FormN-CSR.
Item 4. Principal Accountant Fees and Services.
Audit Fees
| (a) | The aggregate fees billed for each of the last two fiscal years for professional services rendered by the principal accountant for the audit of the registrant’s annual financial statements or services that are normally provided by the accountant in connection with statutory and regulatory filings or engagements for those fiscal years are $39,508 for 2017 and $39,508 for 2018. |
Audit-Related Fees
| (b) | The aggregate fees billed in each of the last two fiscal years for assurance and related services by the principal accountant that are reasonably related to the performance of the audit of the registrant’s financial statements and are not reported under paragraph (a) of this Item are $0 for 2017 and $0 for 2018. |
Tax Fees
| (c) | The aggregate fees billed in each of the last two fiscal years for professional services rendered by the principal accountant for tax compliance, tax advice, and tax planning are $4,100 for 2017 and $4,100 for 2018. Tax fees represent tax compliance services provided in connection with the review of the Registrant’s tax returns. |
All Other Fees
| (d) | The aggregate fees billed in each of the last two fiscal years for products and services provided by the principal accountant, other than the services reported in paragraphs (a) through (c) of this Item are $0 for 2017 and $0 for 2018. |
| (e)(1) | Disclose the audit committee’spre-approval policies and procedures described in paragraph (c)(7) of Rule2-01 of RegulationS-X. |
Pre-Approval Policies and Procedures. The Audit Committee (“Committee”) of the registrant is responsible forpre-approving (i) all audit and permissiblenon-audit services to be provided by the independent registered public accounting firm to the registrant and (ii) all permissiblenon-audit services to be provided by the independent registered public accounting firm to the Adviser, Gabelli Funds, LLC, and any affiliate of Gabelli Funds, LLC (“Gabelli”) that provides services to the registrant (a “Covered Services Provider”) if the independent registered public accounting firm’s engagement related directly to the operations and financial reporting of the registrant. The Committee may delegate its responsibility topre-approve any such audit and permissiblenon-audit services to the Chairperson of the Committee, and the Chairperson must report to the Committee, at its next regularly scheduled meeting after the Chairperson’spre-approval of such services, his or her decision(s). The Committee may also establish detailedpre-approval policies and procedures forpre-approval of such services in accordance with applicable laws, including the delegation of some or all of the Committee’spre-approval responsibilities to the other persons (other than Gabelli or the registrant’s officers).Pre-approval by the Committee of any permissiblenon-audit services is not required so long as: (i) the permissiblenon-audit services were not recognized by the registrant at the time of the engagement to benon-audit services; and (ii) such services are promptly brought to the attention of the Committee and approved by the Committee or Chairperson prior to the completion of the audit.
| (e)(2) | The percentage of services described in each of paragraphs (b) through (d) of this Item that were approved by the audit committee pursuant to paragraph (c)(7)(i)(C) of Rule2-01 of RegulationS-X are as follows: |
(b) N/A
(c) 0%
(d) N/A
| (f) | The percentage of hours expended on the principal accountant’s engagement to audit the registrant’s financial statements for the most recent fiscal year that were attributed to work performed by persons other than the principal accountant’s full-time, permanent employees was zero percent. |
| (g) | The aggregatenon-audit fees billed by the registrant’s accountant for services rendered to the registrant, and rendered to the registrant’s investment adviser (not including anysub-adviser whose role is primarily portfolio management and is subcontracted with or overseen by another investment adviser), and any entity controlling, controlled by, or under common control with the adviser that provides ongoing services to the registrant for each of the last two fiscal years of the registrant was $0 for 2017 and $0 for 2018. |
| (h) | The registrant’s audit committee of the board of directorshas considered whether the provision ofnon-audit services that were rendered to the registrant’s investment adviser (not including anysub-adviser whose role is primarily portfolio management and is subcontracted with or overseen by another investment adviser), and any entity controlling, controlled by, or under common control with the investment adviser that provides ongoing services to the registrant that were notpre-approved pursuant to paragraph (c)(7)(ii) of Rule2-01 of RegulationS-X is compatible with maintaining the principal accountant’s independence. |
Item 5. Audit Committee of Listed Registrants.
Not applicable.
Item 6. Investments.
| (a) | Schedule of Investments in securities of unaffiliated issuers as of the close of the reporting period is included as part of the report to shareholders filed under Item 1 of this form. |
(b) Not applicable.
| Item 7. | Disclosure of Proxy Voting Policies and Procedures forClosed-End Management Investment Companies. |
Not applicable.
Item 8. Portfolio Managers ofClosed-End Management Investment Companies.
Not applicable.
| Item 9. | Purchases of Equity Securities byClosed-End Management Investment Company and Affiliated Purchasers. |
Not applicable.
Item 10. Submission of Matters to a Vote of Security Holders.
There have been no material changes to the procedures by which the shareholders may recommend nominees to the registrant’s Board of Trustees, where those changes were implemented after the registrant last provided disclosure in response to the requirements of Item 407(c)(2)(iv) of RegulationS-K (17 CFR 229.407) (as required by Item 22(b)(15) of Schedule 14A (17 CFR240.14a-101)), or this Item.
Item 11. Controls and Procedures.
| (a) | The registrant’s principal executive and principal financial officers, or persons performing similar functions, have concluded that the registrant’s disclosure controls and procedures (as defined in Rule30a-3(c) under the Investment Company Act of 1940, as amended (the “1940 Act”) (17 CFR270.30a-3(c))) are effective, as of a date within 90 days of the filing date of the report that includes the disclosure required by this paragraph, based on their evaluation of these controls and procedures required by Rule30a-3(b) under the 1940 Act (17 CFR270.30a-3(b)) and Rules13a-15(b) or15d-15(b) under the Securities Exchange Act of 1934, as amended (17 CFR240.13a-15(b) or240.15d-15(b)). |
| (b) | There were no changes in the registrant’s internal control over financial reporting (as defined in Rule30a-3(d) under the 1940 Act (17 CFR270.30a-3(d))) that occurred during the registrant’s last fiscal quarter that has materially affected, or is reasonably likely to materially affect, the registrant’s internal control over financial reporting. |
Item 12. Disclosure of Securities Lending Activities forClosed-End Management Investment Companies.
Not applicable.
Item 13. Exhibits.
| (a)(1) | Code of ethics, or any amendment thereto, that is the subject of disclosure required by Item 2 is attached hereto. |
| (a)(2) | Certifications pursuant to Rule30a-2(a) under the 1940 Act and Section 302 of the Sarbanes-Oxley Act of 2002 are attached hereto. |
| (a)(3) | Not applicable. |
| (a)(4) | Not applicable. |
| (b) | Certifications pursuant to Rule30a-2(b) under the 1940 Act and Section 906 of the Sarbanes- Oxley Act of 2002 are attached hereto. |
SIGNATURES
Pursuant to the requirements of the Securities Exchange Act of 1934 and the Investment Company Act of 1940, the registrant has duly caused this report to be signed on its behalf by the undersigned, thereunto duly authorized.
(Registrant) The GAMCO Growth Fund
By (Signature and Title)* /s/ Bruce N. Alpert
Bruce N. Alpert, Principal Executive Officer
Date 3/7/19
Pursuant to the requirements of the Securities Exchange Act of 1934 and the Investment Company Act of 1940, this report has been signed below by the following persons on behalf of the registrant and in the capacities and on the dates indicated.
By (Signature and Title)* /s/ Bruce N. Alpert
Bruce N. Alpert, Principal Executive Officer
Date 3/7/19
By (Signature and Title)* /s/ John C. Ball
John C. Ball, Principal Financial Officer and Treasurer
Date 3/7/19
| * | Print the name and title of each signing officer under his or her signature. |