UNITED STATES
SECURITIES AND EXCHANGE COMMISSION
WASHINGTON, D.C. 20549
FORM 20-F
(Mark One)
| ¨ | REGISTRATION STATEMENT PURSUANT TO SECTION 12(b) OR (g) OF THE SECURITIES EXCHANGE ACT OF 1934 |
OR
| x | ANNUAL REPORT PURSUANT TO SECTION 13 OR 15(d) OF THE SECURITIES EXCHANGE ACT OF 1934 |
For the fiscal year ended 31 December 2012
OR
| ¨ | | TRANSITION REPORT PURSUANT TO SECTION 13 OR 15(d) OF THE SECURITIES EXCHANGE ACT OF 1934 |
For the transition period from to
OR
| ¨ | | SHELL COMPANY REPORT PURSUANT TO SECTION 13 OR 15(d) OF THE SECURITIES EXCHANGE ACT OF 1934 |
Date of event requiring this shell company report
Commission file number 0-16350
WPP plc
(Exact Name of Registrant as specified in its charter)
Jersey
(Jurisdiction of incorporation or organization)
27 Farm Street
London, United Kingdom, W1J 5RJ
(Address of principal executive offices)
Andrea Harris, Esq.
Group Chief Counsel
27 Farm Street, London, United Kingdom, W1J 5RJ
+44(0) 20 7408 2204
(Name, Telephone, E-mail and/or Facsimile number and Address of Company Contact Person)
Securities registered or to be registered pursuant to Section 12(b) of the Act.
| | |
Title of each class | | Name of each exchange on which registered |
| Not applicable | | Not applicable |
Securities registered or to be registered pursuant to Section 12(g) of the Act.
Ordinary Shares of 10p each
(Title of Class)
American Depositary Shares, each representing five Ordinary Shares (ADSs)
(Title of Class)
Securities for which there is a reporting obligation pursuant to Section 15(d) of the Act.
None
(Title of Class)
Indicate the number of outstanding shares of each of the issuer’s classes of capital or common stock as of the close of the period covered by the annual report.
At December 31, 2012, the number of outstanding ordinary shares was 1,265,407,107 which included at such date ordinary shares represented by 10,159,573 ADSs.
Indicate by check mark if the registrant is a well-known seasoned issuer, as defined in Rule 405 of the Securities Act.
YES x NO ¨
If this report is an annual or transition report, indicate by check mark if the registrant is not required to file reports pursuant to Section 13 or 15(d) of the Securities Exchange Act of 1934.
YES ¨ NO x
Note – Checking the box above will not relieve any registrant required to file reports pursuant to Section 13 or 15(d) of the Securities Exchange Act of 1934 from their obligations under those Sections.
Indicate by check mark whether the registrant (1) has filed all reports required to be filed by Section 13 or 15(d) of the Securities Exchange Act of 1934 during the preceding 12 months (or for such shorter period that the registrant was required to file such reports), and (2) has been subject to such filing requirements for the past 90 days.
YES x NO ¨
Indicate by check mark whether the registrant has submitted electronically and posted on its corporate Web site, if any, every Interactive Data File required to be submitted and posted pursuant to Rule 405 of Regulation S-T (§232.405 of this chapter) during the preceding 12 months (or for such shorter period that the registrant was required to submit and post such files).
YES ¨ NO ¨
Indicate by check mark whether the registrant is a large accelerated filer, an accelerated filer, or a non-accelerated filer. See definition of “accelerated filer and large accelerated filer” in Rule 12b-2 of the Exchange Act. (Check one):
Large accelerated filer x Accelerated filer ¨ Non-accelerated filer ¨
Indicate by check mark which basis of accounting the registrant has used to prepare the financial statements included in this filing:
| | | | |
U.S. GAAP ¨ | | International Financial Reporting Standards issued by the International Accounting Standards Board x | | Other ¨ |
If “Other” has been checked in response to the previous question, indicate by check mark which financial statement item the registrant has elected to follow.
Item 17 ¨ Item 18 ¨
If this is an annual report, indicate by check mark whether the registrant is a shell company (as defined in Rule 12b-2 of the Exchange Act).
YES ¨ NO x
TABLE OF CONTENTS
Forward-Looking Statements
In connection with the provisions of the Private Securities Litigation Reform Act of 1995 (the ‘Reform Act’), the Company (as defined below) may include forward-looking statements (as defined in the Reform Act) in oral or written public statements issued by or on behalf of the Company. These forward-looking statements may include, among other things, plans, objectives, projections and anticipated future economic performance based on assumptions and the like that are subject to risks and uncertainties. As such, actual results or outcomes may differ materially from those discussed in the forward-looking statements. Important factors which may cause actual results to differ include but are not limited to: the unanticipated loss of a material client or key personnel, delays or reductions in client advertising budgets, shifts in industry rates of compensation, regulatory compliance costs or litigation, natural disasters or acts of terrorism, the Company’s exposure to changes in the values of major currencies other than the UK pound sterling (because a substantial portion of its revenues are derived and costs incurred outside of the United Kingdom) and the overall level of economic activity in the Company’s major markets (which varies depending on, among other things, regional, national and international political and economic conditions and government regulations in the world’s advertising markets). In addition, you should consider the risks described in Item 3D, captioned “Risk Factors,” which could also cause actual results to differ from forward-looking information. In light of these and other uncertainties, the forward-looking statements included in this document should not be regarded as a representation by the Company that the Company’s plans and objectives will be achieved.
The Company undertakes no obligation to update or revise any such forward-looking statements, whether as a result of new information, future events or otherwise.
PART I
ITEM 1. IDENTITY OF DIRECTORS, SENIOR MANAGEMENT AND ADVISERS
Not applicable.
ITEM 2. OFFER STATISTICS AND EXPECTED TIMETABLE
Not applicable.
ITEM 3. KEY INFORMATION
Overview
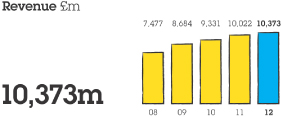
WPP plc and its subsidiaries (WPP) comprise one of the largest communications services businesses in the world. At 31 December 2012, the Group had 115,711 employees. Including all employees of associated companies, this figure was approximately 165,000. For the year ended 31 December 2012, the Group had revenue of £10,373 million and operating profit of £1,241 million.
Unless the context otherwise requires, the terms “Company”, “Group” and “Registrant” as used herein shall also mean WPP plc and its subsidiaries.
A. Selected Financial Data
The selected financial data should be read in conjunction with, and is qualified in its entirety by reference to, the Consolidated Financial Statements of the Company, including the notes thereto.
The selected income statement data for each of the three years ended 31 December 2012, 2011 and 2010 and the selected balance sheet data as at 31 December 2012 and 2011 are derived from the Consolidated Financial Statements of the Company that appear elsewhere in this Form 20-F. The selected financial data for prior periods
1
is derived from the Consolidated Financial Statements of the Company previously filed with the Securities and Exchange Commission (SEC) as part of the Company’s Annual Reports on Form 20-F. The Consolidated Financial Statements were prepared in accordance with International Financial Reporting Standards (IFRS) as issued by the International Accounting Standards Board (IASB).
The reporting currency of the Group is the UK pound sterling and the selected financial data has been prepared on this basis.
Selected Consolidated Income Statement Data
| | | | | | | | | | | | | | | | | | | | |
| | | Year ended 31 December | |
| | | 2012 | | | 2011 | | | 2010 | | | 2009 | | | 2008 | |
| | | £m | | | £m | | | £m | | | £m | | | £m | |
Revenue | | | 10,373.1 | | | | 10,021.8 | | | | 9,331.0 | | | | 8,684.3 | | | | 7,476.9 | |
Operating profit | | | 1,241.1 | | | | 1,192.2 | | | | 973.0 | | | | 761.7 | | | | 876.0 | |
Profit for the year | | | 894.7 | | | | 916.5 | | | | 661.0 | | | | 506.9 | | | | 513.9 | |
Profit attributable to equity holders of the parent | | | 822.7 | | | | 840.1 | | | | 586.0 | | | | 437.7 | | | | 439.1 | |
Earnings per ordinary share: | | | | | | | | | | | | | | | | | | | | |
Basic | | | 66.2 | p | | | 67.6 | p | | | 47.5 | p | | | 35.9 | p | | | 38.4 | p |
Diluted | | | 62.8 | p | | | 64.5 | p | | | 45.9 | p | | | 35.3 | p | | | 37.6 | p |
Earnings per ADS1: | | | | | | | | | | | | | | | | | | | | |
Basic | | | 331.0 | p | | | 338.0 | p | | | 237.5 | p | | | 179.5 | p | | | 192.0 | p |
Diluted | | | 314.0 | p | | | 322.5 | p | | | 229.5 | p | | | 176.5 | p | | | 188.0 | p |
Dividends per ordinary share | | | 25.94 | p | | | 19.28 | p | | | 16.25 | p | | | 15.47 | p | | | 14.32 | p |
Dividends per ADS (US dollars)2 | | | 207.1 | ¢ | | | 151.2 | ¢ | | | 126.7 | ¢ | | | 135.9 | ¢ | | | 139.5 | ¢ |
1 Basic and diluted earnings per American Depositary Share (ADS) have been calculated using the same method as earnings per share, multiplied by a factor of five. 2 These figures have been translated for convenience purposes only, using the approximate average rates shown in the exchange rate table on page 3. This conversion should not be construed as a representation that the pound sterling amounts actually represent, or could be converted into, US dollars at the rates indicated. | |
Selected Consolidated Balance Sheet Data
| | | | | | | | | | | | | | | | | | | | |
| | | At 31 December | |
| | | 2012 | | | 2011 | | | 2010 | | | 2009 | | | 2008 | |
| | | £m | | | £m | | | £m | | | £m | | | £m | |
Total assets | | | 24,877.6 | | | | 24,694.9 | | | | 24,345.1 | | | | 22,351.5 | | | | 24,463.3 | |
Net assets | | | 7,060.6 | | | | 6,894.3 | | | | 6,647.9 | | | | 6,075.7 | | | | 5,959.8 | |
Called-up share capital | | | 126.5 | | | | 126.6 | | | | 126.4 | | | | 125.6 | | | | 125.5 | |
Number of shares (in millions) | | | 1,265.4 | | | | 1,266.4 | | | | 1,264.4 | | | | 1,256.5 | | | | 1,255.3 | |
Dividends
Dividends on the Company’s ordinary shares, when paid, are paid to share owners as of a record date, which is fixed by the Company.
2
The table below sets forth the amounts of first interim, final or second interim and total dividends paid on the Company’s ordinary shares in respect of each fiscal year indicated. In the United States, the Company’s ordinary shares are represented by ADSs, which are evidenced by American Depositary Receipts (ADRs) or held in book-entry form. The Group uses the terms ‘ADS’ and ‘ADR’ interchangeably. The dividends are also shown translated into US cents per ADS using the approximate average rates as shown in the exchange rate table below, for each year presented.
| | | | | | | | | | | | | | | | | | | | | | | | |
| | | Pence per ordinary share | | | US cents per ADS | |
| In respect of the year ended 31 December: | | First
Interim | | | Final or
Second
Interim | | | Total | | | First
Interim | | | Final or
Second
Interim | | | Total | |
2008 | | | 5.19 | | | | 10.28 | | | | 15.47 | | | | 48.07 | | | | 95.21 | | | | 143.28 | |
2009 | | | 5.19 | | | | 10.28 | | | | 15.47 | | | | 40.66 | | | | 80.53 | | | | 121.19 | |
2010 | | | 5.97 | | | | 11.82 | | | | 17.79 | | | | 46.15 | | | | 91.37 | | | | 137.52 | |
2011 | | | 7.46 | | | | 17.14 | | | | 24.60 | | | | 59.80 | | | | 137.39 | | | | 197.19 | |
2012 | | | 8.80 | | | | 19.71 | | | | 28.51 | | | | 69.75 | | | | 156.22 | | | | 225.97 | |
The 2012 first interim dividend was paid on 12 November 2012 to share owners on the register at 12 October 2012. The 2012 proposed final dividend will be paid on 8 July 2013 to share owners on the register at 7 June 2013.
Exchange rates
Fluctuations in the exchange rate between the pound sterling and the US dollar will affect the dollar equivalent of the pound sterling prices of the Company’s ordinary shares on The London Stock Exchange Limited (The London Stock Exchange) and, as a result, are likely to affect the market price of the ADSs in the United States. US dollar amounts paid to holders of ADSs also depend on the sterling/US dollar exchange rate at the time of payment.
The following table sets forth for each of the most recent six months, the high and low exchange rates between the pound sterling and the US dollar. As at 25 April 2013, the closing exchange rate was 1.5429.
| | | | | | | | |
| Month ended | | High | | | Low | |
31 October 2012 | | | 1.6183 | | | | 1.5941 | |
30 November 2012 | | | 1.6124 | | | | 1.5856 | |
31 December 2012 | | | 1.6276 | | | | 1.6032 | |
31 January 2013 | | | 1.6254 | | | | 1.5692 | |
28 February 2013 | | | 1.5794 | | | | 1.5136 | |
31 March 2013 | | | 1.5224 | | | | 1.4902 | |
The annual average exchange rates between the pound sterling and the US dollar for each of the five years ended 31 December were:
| | | | |
| Year ended 31 December | | Average | |
2008 | | | 1.8524 | |
2009 | | | 1.5667 | |
2010 | | | 1.5461 | |
2011 | | | 1.6032 | |
2012 | | | 1.5852 | |
3
B. Capitalization and Indebtedness
Not applicable.
C. Reasons for the Offer and Use of Proceeds
Not applicable.
4
D. Risk Factors
The Company is subject to a variety of possible risks that could adversely impact its revenues, results of operations or financial condition. Some of these risks relate to the industries in which the Company operates while others are more specific to the Company. The table below sets out principal risks the Company has identified that could adversely affect it. See also the discussion of Forward-Looking Statements preceding Item 1.
| | |
| Risk | | Potential impact |
| Clients | | |
| The Group competes for clients in a highly-competitive industry and client loss may have a material adverse effect on the Group’s market share and its business, revenues, results of operations, financial condition or prospects. | | Competitors include large multinational advertising and marketing communication companies and regional and national marketing services companies, database marketing and modelling companies, telemarketers and internet companies. Service agreements with clients are generally terminable by the client on 90 days’ notice and many clients put their advertising and communications business up for competitive review from time to time. The ability to attract new clients and to retain or increase the amount of work from existing clients may also in some cases be limited by clients’ policies on conflicts of interest. |
| The Group receives a significant portion of its revenues from a limited number of large clients and the loss of these clients could have a material adverse effect on the Group’s prospects, business, financial condition and results of operations. | | A relatively small number of clients contribute a significant percentage of the Group’s consolidated revenues. The Group’s 10 largest clients accounted for 17.4% of revenues in the year ended 31 December 2012. Clients generally are able to reduce advertising and marketing spend or cancel projects on short notice. The loss of one or more of the Group’s largest clients, if not replaced by new client accounts or an increase in business from existing clients, would adversely affect the Group’s financial condition. |
| Economic | | |
| The Group’s businesses are subject to recessionary economic cycles. Many of the economies in which the Group operates (including the Eurozone) currently have significant economic challenges. | | Reduction in client spending or postponing spending on the services offered by the Group or switching of client expenditure to non-traditional media and renegotiation of contract terms can lead to reduced profitability and cash flow. |
| Financial | | |
| Currency exchange rate fluctuations could adversely impact the Group’s consolidated results. | | The Company’s reporting currency is pounds sterling. Given the Group’s significant international operations, fluctuations in currency exchange rates can affect the Group’s consolidated results. |
| The interest rates and fees payable by the Group in respect of certain of its borrowings are, in part, influenced by the credit ratings issued by the international debt rating agencies. | | If the Company’s financial performance and outlook materially deteriorate, a ratings downgrade could occur and the interest rates and fees payable on certain of the Company’s revolving credit facilities and certain of the Group’s bonds could be increased. |
| The Group is subject to credit risk through the default of a client or other counterparty. | | The Group is generally paid in arrears for its services. Invoices are typically payable within 30 to 60 days. The Group commits to media and production purchases on behalf of some of its clients as principal or agent depending on the client and market circumstances. If a client is unable to pay sums due, media and production companies may look to the Group to pay such amounts to which it committed as an agent on behalf of those clients. |
| Mergers & Acquisitions | | |
| The Group may be unsuccessful in evaluating material risks involved in completed and future acquisitions and may be unsuccessful in integrating any acquired operations with its existing businesses. | | The Group regularly reviews potential acquisitions of businesses that are complementary to its operations and clients’ needs. If material risks are not identified prior to acquisition or the Group experiences difficulties in integrating an acquired business, it may not realise the expected benefits from such an acquisition and the Group’s financial condition could be adversely affected. |
| Goodwill and other intangible assets recorded on the Group’s balance sheet with respect to acquired companies may become impaired. | | The Group has a significant amount of goodwill and other intangible assets recorded on its balance sheet with respect to acquired companies. The Group annually tests the carrying value of goodwill and other intangibles for impairment. The estimates and assumptions about results of operations and cash flows made in connection with impairment testing could differ from future results of operations and cash flows. Future events could cause the Group to conclude that the asset values associated with a given operation have become impaired which could have a material impact on the Group’s financial condition. |
5
| | |
| Risk | | Potential impact |
| Operational | | |
| The Group operates in 110 countries and is exposed to the risks of doing business internationally. | | The Group’s international operations are subject to the following risk factors: (i) restrictions and/or changes in taxation on repatriation of earnings; (ii) economic, social or political instability within different countries, regions and markets; (iii) changes in foreign laws and regulatory requirements, such as those on foreign ownership of assets or data usage; and (iv) uncertainty or potential ineffectiveness or lack of enforcement in relation to the Group’s client service agreements or other contractual rights. |
| People | | |
| The Group’s performance could be adversely affected if it were unable to attract and retain key talent or had inadequate talent management and succession planning for key management roles. | | The Group is highly dependent on the talent, creative abilities and technical skills of our personnel as well as their relationships with clients. The Group is vulnerable to the loss of personnel to competitors and clients leading to disruption to the business. |
| Regulatory/Legal | | |
| The Group may be subject to regulations restricting its activities or effecting changes in taxation. | | Governments, government agencies and industry self-regulatory bodies from time to time adopt statutes and regulations that directly or indirectly affect the form, content and scheduling of advertising, public relations and public affairs and market research or otherwise limit the scope of the activities of the Group and its clients which could have a material adverse impact on our financial position. Changes in tax laws and international tax treaties or their application may also adversely affect the Group’s reported results. |
| The Group may be exposed to liabilities from allegations that certain of its clients’ advertising claims may be false or misleading or that its clients products may be defective or harmful. | | The Group works for a large number of clients across a broad spectrum of industries and end markets, some of which may become subject to litigation. As a consequence of providing services to such clients, the Group may itself become involved as a defendant in litigation brought against its clients by third parties, including its clients, competitors or consumers or governmental or regulatory authorities. |
| The Group is subject to strict anti-corruption and anti-bribery legislation and enforcement in the countries in which it operates. | | The Group may be exposed to liabilities in the event of breaches of anti-corruption and anti-bribery legislation in all of the 110 countries in which it operates. |
| The Group is subject to strict data protection and privacy legislation in the jurisdictions in which it operates and relies extensively on information technology systems. The Group operates on a largely decentralised basis with a large number of different agencies and operating entities and the resulting size and diversity of the operational systems increases the vulnerability of such systems to breakdown or malicious intrusion. | | The Group may be subject to investigative or enforcement action or legal claims or incur fines, damages, or costs if the Group fails adequately to protect data or observe privacy legislation in every instance. A system breakdown or intrusion could have a material adverse effect on the Group’s business, revenues, results of operations, financial condition or prospects. |
| Civil liabilities or judgements against the Company or its directors or officers based on U.S. federal or state securities laws may not be enforceable in the U.S. or in England and Wales or in Jersey. | | The Company is a public limited company incorporated under the laws of Jersey. Some of the Company’s directors and officers reside outside of the United States. In addition, a substantial portion of the directly owned assets of the Company are located outside of the United States. As a result, it may be difficult or impossible for investors to effect service of process within the United States against the Company or its directors and officers or to enforce against them any of the judgements, including those obtained in original actions or in actions to enforce judgements of the U.S. courts, predicated upon the civil liability provisions of the federal or state securities laws of the United States. |
6
ITEM 4. INFORMATION ON THE COMPANY
The Company operates through a number of established global, multinational and national advertising and marketing services companies that are organised into four business segments. Our largest segment is Advertising and Media Investment Management where we operate the well-known advertising networks Ogilvy & Mather Advertising, JWT, Y&R, Grey, Bates CHI&Partners and the United Network, as well as Media Investment Management companies such as MediaCom, MEC, Mindshare, Maxus and tenthavenue. Our other segments are Consumer Insight, where our operations are conducted through Kantar; Public Relations & Public Affairs, where we operate through well-known companies such as Burson-Marsteller, Cohn & Wolfe, Hill+Knowlton Strategies and Ogilvy Public Relations; and Branding & Identity, Healthcare and Specialist Communications, where our operations are conducted by B to D Group, ghg, Wunderman, Sudler & Hennessey, OgilvyOne Worldwide, Ogilvy CommonHealth Worldwide, G2, OgilvyAction, 24/7 Media, POSSIBLE, AKQA and other companies.
The Company’s ordinary shares are admitted to the Official List of the UK Listing Authority and trade on The London Stock Exchange and American Depositary Shares (which are evidenced by ADRs or held in book-entry form) representing deposited ordinary shares are quoted on the NASDAQ Global Select Market (NASDAQ). At 25 April 2013 the Company had a market capitalisation of £13.6 billion.
The Company’s executive office is located at 27 Farm Street, London, United Kingdom, W1J 5RJ, Tel:+44 (0)20 7408 2204 and its registered office is located at Queensway House, Hilgrove Street, St Helier, Jersey JE1 IES.
A. History and Development of the Company
WPP plc was incorporated in Jersey on 25 October 2012 under the name WPP 2012 plc.
On 2 January 2013, under a scheme of arrangement between WPP 2012 Limited (formerly known as WPP plc), (Old WPP), the former holding company of the Group, and its share owners pursuant to Article 125 of the Companies (Jersey) Law 1991, and as sanctioned by the Royal Court of Jersey (the Jersey Court), a Jersey incorporated and United Kingdom tax resident company, WPP 2012 plc became the new parent company of the WPP Group and adopted the name WPP plc. Under the scheme of arrangement, all the issued shares in Old WPP were cancelled and the same number of new shares were issued to WPP plc in consideration for the allotment to share owners of one share in WPP plc for each share in Old WPP held on the record date, 31 December 2012. Citibank, N.A., depositary for the ADSs representing Old WPP shares, cancelled Old WPP ADSs held in book-entry uncertificated form in the direct registration system maintained by it and issued ADSs representing shares of WPP plc in book entry uncertificated form in the direct registration system maintained by it to the holders. Holders of certificated ADSs, or ADRs, of Old WPP were entitled to receive ADSs of WPP plc upon surrender of the Old WPP ADSs, or ADRs, to the Depositary. Each Old WPP ADS represented five shares of Old WPP and each WPP plc ADS represents five shares of WPP plc.
Pursuant to Rule 12g-3 under the Securities Exchange Act of 1934, as amended (the Exchange Act), WPP plc succeeded to Old WPP’s registration and periodic reporting obligations under the Exchange Act.
Old WPP was incorporated in Jersey on 12 September 2008 and became the holding company of the WPP Group on 19 November 2008 when the company now known as WPP 2008 Limited, the previous holding company of the WPP Group which was incorporated in England and Wales, completed a reorganisation of its capital and corporate structure. WPP 2008 Limited had itself become the holding company of the Group on 25 October 2005 when the company now known as WPP 2005 Limited, the original holding company of the WPP Group, completed a reorganisation of its capital and corporate structure. WPP 2005 Limited was incorporated and registered in England and Wales in 1971 and is a private limited company under the Companies Act 1985, and until 1985 operated as a manufacturer and distributor of wire and plastic products. In 1985, new investors acquired a significant interest in WPP and changed the strategic direction of the Company from being a wire and plastics manufacturer and distributor to being a multinational communications services organisation. Since then,
7
the Company has grown both organically and by the acquisition of companies, most significantly the acquisitions of JWT Group, Inc. in 1987, The Ogilvy Group, Inc. in 1989, Young & Rubicam Inc. (Young & Rubicam or Young & Rubicam Brands, as the group is now known) in 2000, Tempus Group plc (Tempus) in 2001, Cordiant Communications Group plc (Cordiant) in 2003, Grey Global Group, Inc. (Grey) in 2005, 24/7 Real Media Inc (TFSM) in 2007, Taylor Nelson Sofres plc (TNS) in 2008 and AKQA Holdings, Inc. (AKQA) in 2012.
The Company spent £586.6 million, £532.4 million and £215.2 million for acquisitions and investments in 2012, 2011 and 2010, respectively, including payments in respect of loan note redemptions and earnout payments resulting from acquisitions in prior years, net of cash and cash equivalents acquired (net) and proceeds on disposal of investments. For the same periods, cash spent on purchases of property, plant and equipment and other intangible assets was £330.1 million, £253.2 million and £217.5 million, respectively, and cash spent on share repurchases and buy-backs was £134.5 million, £182.2 million and £46.4 million, respectively.
B. Business Overview
The Company’s business comprises the provision of communications services on a national, multinational and global basis. It operates from over 3,000 offices in 110 countries including associates. The Company organises its businesses in the following areas: Advertising and Media Investment Management; Consumer Insight; Public Relations & Public Affairs; and Branding & Identity, Healthcare and Specialist Communications (including direct, digital, promotion and relationship marketing).
Approximately 41% of the Company’s reported revenues in 2012 were from Advertising and Media Investment Management, with the remaining 59% of its revenues being derived from the business segments of Consumer Insight; Public Relations & Public Affairs; and Branding & Identity, Healthcare and Specialist Communications.
The following table shows, for the last three fiscal years, reported revenue attributable to each business segment in which the Company operates.
| | | | | | | | | | | | | | | | | | | | | | | | |
| Revenue1 | | 2012 | | | 2011 | | | 2010 | |
| | | £m | | | % of total | | | £m | | | % of total | | | £m | | | % of total | |
Advertising and Media Investment Management | | | 4,273.2 | | | | 41.2 | | | | 4,157.2 | | | | 41.5 | | | | 3,733.3 | | | | 40.0 | |
Consumer Insight | | | 2,460.2 | | | | 23.7 | | | | 2,458.0 | | | | 24.5 | | | | 2,430.2 | | | | 26.0 | |
Public Relations & Public Affairs | | | 917.1 | | | | 8.8 | | | | 885.4 | | | | 8.8 | | | | 844.5 | | | | 9.1 | |
Branding & Identity, Healthcare and Specialist Communications | | | 2,722.6 | | | | 26.3 | | | | 2,521.2 | | | | 25.2 | | | | 2,323.0 | | | | 24.9 | |
Total | | | 10,373.1 | | | | 100.0 | | | | 10,021.8 | | | | 100.0 | | | | 9,331.0 | | | | 100.0 | |
| 1 | | Intersegment sales have not been separately disclosed as they are not material. |
The following table shows, for the last three fiscal years, reported revenue attributable to each geographic area in which the Company operates and demonstrates the Company’s regional diversity.
| | | | | | | | | | | | | | | | | | | | | | | | |
| Revenue1 | | 2012 | | | 2011 | | | 2010 | |
| | | £m | | | % of total | | | £m | | | % of total | | | £m | | | % of total | |
North America2 | | | 3,546.5 | | | | 34.2 | | | | 3,388.2 | | | | 33.8 | | | | 3,299.8 | | | | 35.3 | |
United Kingdom | | | 1,275.2 | | | | 12.3 | | | | 1,183.5 | | | | 11.8 | | | | 1,087.6 | | | | 11.7 | |
Western Continental Europe3 | | | 2,439.2 | | | | 23.5 | | | | 2,505.1 | | | | 25.0 | | | | 2,325.3 | | | | 24.9 | |
Asia Pacific, Latin America, Africa & Middle East and Central & Eastern Europe | | | 3,112.2 | | | | 30.0 | | | | 2,945.0 | | | | 29.4 | | | | 2,618.3 | | | | 28.1 | |
Total | | | 10,373.1 | | | | 100.0 | | | | 10,021.8 | | | | 100.0 | | | | 9,331.0 | | | | 100.0 | |
| 1 | | Intersegment sales have not been separately disclosed as they are not material. |
| 2 | | North America includes the US with revenues of £3,309.4 million (2011: £3,149.9 million, 2010: £3,097.9 million). |
| 3 | | Western Continental Europe includes Ireland with revenues of £36.6 million (2011: £40.3 million, 2010: £37.4 million). |
8
The Company’s principal disciplines within each of its business segments are described below. Item 4C sets forth the Group brands operating within each discipline.
Advertising and Media Investment Management
Advertising – The principal functions of an advertising agency are the planning and creation of marketing and branding campaigns and the design and production of advertisements for all types of media such as television, cable, the internet, radio, magazines, newspapers and outdoor locations such as billboards.
Media Investment Management – GroupM is WPP’s leading global media investment management operation. With its agencies, GroupM has capabilities in business science, consumer insight, communications and media planning implementation, interactions, content development, and sports and entertainment marketing. The primary purpose of GroupM is to maximise the performance of WPP’s media agencies, operating not only as a parent company but as a collaborator on performance-enhancing activities, such as trading, content creation, sports, digital, finance, tool development and other business-critical capabilities, in order to leverage the combination of GroupM’s core and talent resources. Our offering in this discipline also includes the network tenthavenue, which integrates some of the Group’s key specialist media offerings in online, mobile, experiential and out of home (OOH).
Consumer Insight
To help optimise its worldwide research offering to clients, the Company’s separate global research and strategic marketing consultancy businesses are managed on a centralised basis under the umbrella of the Kantar Group. The Kantar Group offering includes: custom research in a wide range of business sectors and areas of marketplace information including strategic market studies; brand positioning; equity research; customer satisfaction surveys; product development; international research; advanced modeling; advertising research; pre-testing, tracking and sales modeling; and trends and futures research and consultancy.
Public Relations & Public Affairs
Public Relations & Public Affairs companies advise clients who are seeking to communicate with consumers, governments and/or the business and financial communities. Public Relations & Public Affairs activities include national and international corporate, financial and marketing communications, crisis management, reputation management, public affairs and government lobbying.
Branding & Identity, Healthcare and Specialist Communications
Branding & Identity – consumer, corporate and employee branding and design services, covering identity, packaging, literature, events, training and architecture.
Healthcare Communications – provide integrated healthcare marketing solutions from advertising to medical education and online marketing.
Direct, Digital, Promotion & Relationship Marketing – the full range of general and specialist customer, channel, direct, field, retail, promotional and point-of-sale services.
Specialist Communications – a comprehensive range of specialist services, from custom media and multicultural marketing to event, sports, youth and entertainment marketing; corporate and business-to-business; and media, technology and production services.
9
WPP Digital – Through WPP Digital, WPP makes acquisitions and strategic investments in companies that bolster the Group’s presence in digital marketing & media and provide access for WPP companies and their clients to a portfolio of digital experts. Services provided by WPP Digital full-service interactive agencies include: digital marketing solutions for advertisers and publishers; integrated digital marketing strategy services; mobile solutions for handset manufacturers and wireless operators; creating measurable interactive marketing; and proprietary platforms which enable advertisers to engage with global audiences across the universe of digital media.
Manufacturing
The original business of the Group remains as the manufacturing division, which operates through subsidiaries of Wire and Plastic Products Limited. The division produces a wide range of products for commercial, industrial and retail applications.
WPP Head Office
WPP, the parent company, with its offices in London, New York, Tokyo, Hong Kong, Shanghai and São Paulo develops the professional and financial strategy of the Group, promotes operating efficiencies, coordinates cross referrals of clients among the Group companies and monitors the financial performance of its operating companies. The principal activity of the Group continues to be the provision of communications services worldwide. WPP acts only as a parent company and does not trade. The parent company complements the operating companies in three distinct ways.
| | • | | First, the parent company relieves them of much administrative work. Financial matters (such as planning, budgeting, reporting, control, treasury, tax, mergers, acquisitions, investor relations, legal affairs and internal audit) are co-ordinated centrally. |
| | • | | Second, the parent company encourages and enables operating companies of different disciplines to work together for the benefit of clients. The parent company also plays an across-the-Group role in the management of talent, property, procurement, information technology (IT), knowledge sharing, practice development, and sustainability. |
| | • | | And, finally, the parent company itself can function as the 21st-century equivalent of the full-service agency. For some clients, predominantly those with a vast geographical spread and a need for a wide range of marketing services, WPP can act as a portal to provide a single point of contact and accountability. |
The parent company operates with a limited group of approximately 400 people.
WPP Strategy
Our reason for being, the justification for WPP’s existence, continues to be to add value to our clients’ businesses and our people’s careers. Our goal remains to be the world’s most successful provider of communications services to multinational, regional and local companies, not just the largest.
The Group has four core strategic priorities.
| | • | | Increase the share of revenues from the faster-growing markets of Asia Pacific, Latin America, Africa and the Middle East, and Central and Eastern Europe to 35-40%. |
| | • | | Increase the share of revenues of new media to 35-40%. |
| | • | | Increase the share of more measurable marketing services – such as Consumer Insight and direct, digital and interactive – to be more than 50% of revenues, with a focus on the application of new technology, big data and digital. |
10
| | • | | Achieve ‘horizontality’ by ensuring our people work together for the benefit of clients, primarily through two horizontal integrators: client leaders and Country Managers. |
If we implement this strategy effectively then our business will be geographically and functionally well positioned to compete successfully and to deliver on our long-term financial targets:
| | • | | Revenue and gross profit growth greater than the industry average supplemented by acquisitions. |
| | • | | Annual improvement in headline PBIT margin of 0.5 margin points or more depending on revenue growth and staff cost to revenue ratio improvement of 0.3 margin points or more. |
| | • | | Annual headline PBIT growth of 10% to 15% delivered through revenue growth, margin expansion and acquisitions. |
Sustainability
Sustainability issues are important to WPP in the work we do for our clients, the way we run our offices and consider our people and other stakeholders. Our five areas of focus are:
| | • | | The impact of our work for clients. Our companies advise clients on sustainability, helping them to refine their strategies and create compelling communications. The value of client business supported by our sustainability credentials was worth at least $1.2 billion to the Group in 2012. |
| | • | | Marketing standards. We work to embed high ethical standards in our conduct and work for clients and to protect consumer data used for marketing purposes. |
| | • | | Employment practices. Our talent strategy includes competitive remuneration alongside a focus on diversity and inclusion, high-quality training and employee engagement. 32% of Board members and executive leaders are women, although this is still not good enough. |
| | • | | Environmental performance. We have reduced our carbon footprint per person by 28% since 2006. Our target is a 65% reduction by 2020. |
| | • | | Social investment including pro bono work. Our total social investment was worth £16.2 million, the equivalent of 1.5% of reported profit before tax. |
Clients
The Group services 350 of the Fortune Global 500 companies, all 30 of the Dow Jones 30, 63 of the NASDAQ 100, 31 of the Fortune e-50 and almost 760 national or multinational clients in three or more disciplines. Almost 480 clients are served in four disciplines, and these clients account for over 57% of Group revenues. The Group also works with almost 360 clients in six or more countries.
The Company’s 10 largest clients accounted for 17.4% of the Company’s revenues in the year ended 31 December 2012. No client of the Company represented more than 5% of the Company’s aggregate revenues in 2012. The Group’s companies have maintained long-standing relationships with many of their clients, with an average length of relationship for the top 10 clients of approximately 50 years.
Government Regulation
From time to time, governments, government agencies and industry self-regulatory bodies in the United States, European Union and other countries in which the Company operates have adopted statutes, regulations, and rulings that directly or indirectly affect the form, content, and scheduling of advertising, public relations and public affairs, and market research, or otherwise limit the scope of the activities of the Company and its clients. Some of the foregoing relate to privacy and data protection and general considerations such as truthfulness, substantiation and interpretation of claims made, comparative advertising, relative responsibilities of clients and advertising, public relations and public affairs firms, and registration of public relations and public affairs firms’ representation of foreign governments.
11
In addition, there is an increasing trend towards expansion of specific rules, prohibitions, media restrictions, labeling disclosures and warning requirements with respect to advertising for certain products, such as over-the-counter drugs and pharmaceuticals, cigarettes, food and certain alcoholic beverages, and to certain groups, such as children. Proposals have been made for the adoption of additional laws and regulations that could further restrict the activities of advertising, public relations and public affairs, and market research firms and their clients. Though the Company does not expect any existing or proposed regulations to have a material adverse impact on the Company’s business, the Company is unable to estimate the effect on its future operations of the application of existing statutes or regulations or the extent or nature of future regulatory action.
12
C. Organizational Structure
The Company’s business comprises the provision of communications services on a national, multinational and global basis. It operates out of over 3,000 offices in 110 countries including associates. For a list of the Company’s principal subsidiary undertakings and their country of incorporation see note 29 to the Consolidated Financial Statements.
The Company organises its businesses in the following segments: Advertising and Media Investment Management; Consumer Insight; Public Relations & Public Affairs; and Branding & Identity, Healthcare & Specialist Communications. These business segments are comprised of the following principal disciplines: Advertising; Media Investment Management; Consumer Insight; Public Relations & Public Affairs; Branding & Identity; Healthcare Communications; Direct, Digital, Promotion & Relationship Marketing; Specialist Communications; WPP Digital; WPP Digital partner companies; and WPP knowledge community. A listing of the Group brands operating within these disciplines as at April 2013 is set forth below.
| | |
Advertising ADK1 Bates CHI&Partners CHI&Partners1 Dentsu Y&R1, 2, 4 Grey HS Ad1 john st. JWT Ogilvy & Mather Advertising Santo Scangroup1 Scholz & Friends Soho Square TAXI4 Team Detroit The Jupiter Drawing Room1 United Network Y&R4 Media Investment Management GroupM: KR Media Maxus MediaCom MEC Mindshare Outrider Catalyst Xaxis Quisma Other media agencies M/Six2 tenthavenue: Forward Joule Kinetic Worldwide Spafax Consumer Insight Kantar: Added Value Center Partners IMRB International Kantar Health Kantar Japan Kantar Media Kantar Operations Kantar Retail Kantar Worldpanel Lightspeed Research Millward Brown | | Consumer Insight (continued) The Futures Company TNS Other marketing consultancies ohal Public Relations & Public Affairs Blanc & Otus7 Buchanan Communications Burson-Marsteller4 Chime Communications PLC1 Clarion Communications Cohn & Wolfe4 Dewey Square Group Glover Park Group Hering Schuppener Hill+Knowlton Strategies Ogilvy Government Relations Ogilvy Public Relations PBN Hill+Knowlton Strategies Penn Schoen Berland4 Prime Policy Group QGA RLM Finsbury Wexler & Walker Public Policy Associates7 Branding & Identity Addison6 BDG architecture + design Coley Porter Bell Dovetail FITCH6 Lambie-Nairn6 Landor Associates4, 6 PeclersParis6 The Brand Union6 The Partners6 VBAT6 Healthcare Communications Feinstein Kean Healthcare8 GCI Health ghg Ogilvy CommonHealth Worldwide Sudler & Hennessey4 |
13
| | |
Direct, Digital, Promotion & Relationship Marketing A. Eicoff & Co Actis Wunderman5 AGENDA5 AKQA Aqua5 Barrows1 Blast Radius5 Brierley & Partners1 Designkitchen5 Dialogue Digit EWA FullSIX3 Grass Roots1 G29 - G2 Branding & Design - G2 Interactive - G2 Direct & Digital - G2 Promotional Marketing High Co1 iconmobile4 Kassius5 KBM Group5 Mando Maxx Marketing OgilvyAction OgilvyOne Worldwide OOT2 RTC4 Smollan Group1 Smollan/Headcount Studiocom4 These Days5 VML4 Wunderman4 Specialist Communications Corporate/B2B Ogilvy Primary Contact Demographic marketing Bravo4 K&L4 MosaicaMD UniWorld1 Wing9 Employer branding/recruitment JWT Inside Event/face-to-face marketing MJM Metro Foodservice marketing The Food Group | | Specialist Communications (continued) Sports marketing 9ine Sports & Entertainment JMI1 PRISM Group Entertainment marketing Alliance Youth marketing The Geppetto Group Real estate marketing Pace Technology marketing Banner Corporation4 Media & production services The Farm Group Imagina3 MRC3 United Visions The Weinstein Company3 WPP Digital 24/7 Media Acceleration Blue State Digital The Data Alliance Fabric Worldwide1 F.biz Hogarth Worldwide Johannes Leonardo1 POSSIBLE Rockfish Salmon Syzygy1 The Media Innovation Group WPP Digital partner companies Ace Metrix3 eCommera3 Globant1 HDT Holdings Technology3 In Game Ad Interactive3 Invidi3 Jumptap3 mySupermarket3 Moment Systems3 nPario1 Proclivity Systems3 Say Media3 SFX Entertainment3 Vice Media3 Visible1 WildTangent3 WPP knowledge community The Store Notes 1 Associate 2 Joint venture 3 Investment 4 A Young & Rubicam Group company 5 Part of the Wunderman network 6 A member of B to D Group 7 A Hill+Knowlton Strategies company 8 An Ogilvy company 9 A Grey Group company |
14
D. Property, Plant and Equipment
The majority of the Company’s properties are leased, although certain properties which are used mainly for office space are owned. In the United States owned properties include the 214,000 square foot Young & Rubicam office condominium for their new headquarters located at 3 Columbus Circle in New York, New York and the 152,000 square foot TNS property located near Toledo, Ohio. Other owned properties are in Latin America (principally in Argentina, Brazil, Chile, Mexico, Peru and Puerto Rico), Asia (India and China) and in Europe (Spain, France, UK and Italy). In Europe owned properties include the 135,626 square foot TNS office located at 2 Rue Francis Pedron, Chambourcy, Paris, France and the 101,592 square foot TNS House at Westgate, Hangar Lane, London. Manufacturing facilities are owned in the United Kingdom. Principal leased properties, which are accounted for as operating leases, include office space at the following locations:
| | | | | | |
| Location | | Use | |
| Approximate
square footage |
|
636 Eleventh Avenue, New York, NY | | Ogilvy & Mather | | | 554,800 | |
285 Madison Avenue, New York, NY1 | | Young & Rubicam | | | 459,900 | |
498 Seventh Avenue, New York, NY | | GroupM, Mindshare,
Maxus, Mediacom | | | 358,000 | |
200 Fifth Avenue, New York, NY | | Grey Global Group, Cohn &
Wolfe | | | 343,000 | |
500/550 Town Center Drive, Dearborn, MI | | Team Detroit, JWT, Ogilvy
& Mather, Y&R
Advertising, PRISM,
Burrows, ZAAZ | | | 282,900 | |
466 Lexington Avenue, New York, NY | | JWT | | | 270,300 | |
230 Park Avenue South, New York, NY | | Burson-Marsteller,
Landor, Sudler & Hennessey | | | 270,000 | |
| 1 | | Short term lease to 30 April 2013 following building sale |
The Company considers its properties, owned or leased, to be in good condition and generally suitable and adequate for the purposes for which they are used. At 31 December 2012, the fixed asset value (cost less depreciation) representing land, freehold buildings and leasehold buildings as reflected in the Company’s consolidated financial statements was approximately £488.6 million.
In 2012 the Company again reduced its core property portfolio. While overall square footage rose by 1.4% from 23.2 million sq ft to 23.5 million sq ft, this was less than half the 2.9% increase in revenue attributable to acquisitions, and considerably less than the 5.8% growth in constant currency revenues.
Average square foot per head dropped from 211 sq ft to 207 sq ft, but this was partly offset by a 1.6% increase in cost per square foot to £29.50. As a result, the Company held the establishment cost-to-revenue ratio at 6.7%, flat with prior year and ahead of our long term 7% run-rate target.
The Company’s aim for 2013 is to improve on this level in spite of sharp increases in Asia property costs and the impending end of a number of significant below market leases in the region.
See note 3 to the Consolidated Financial Statements for a schedule by years of future minimum rental payments to be made and future sublease rental payments to be received, as at 31 December 2012, under non-cancelable operating leases of the Company.
ITEM 4A. UNRESOLVED STAFF COMMENTS
Not applicable.
15
ITEM 5. OPERATING AND FINANCIAL REVIEW AND PROSPECTS
Introduction
Certain Non GAAP measures included in this operating and financial review and prospects have been derived from amounts calculated in accordance with IFRS but are not themselves IFRS measures. They should not be viewed in isolation as alternatives to the equivalent IFRS measure, rather they should be read in conjunction with the equivalent IFRS measure. These include constant currency, pro-forma (‘like-for-like’), headline PBIT (Profit Before Interest and Taxation), headline PBIT margin, headline PBIT margin on gross profit, headline PBT (Profit Before Taxation), headline EBITDA (Earnings before Interest, Taxation, Depreciation and Amortisation), billings, estimated net new billings, free cash flow and net and average net debt, which we define, explain the use of and reconcile to the nearest IFRS measure on pages 28 to 31.
A. Operating Results
Overview
The Company is one of the world’s most comprehensive marketing communications groups. It operates through a large number of established national, multinational and global advertising and marketing services companies. The Company offers services in four reportable segments:
| | • | | Advertising and Media Investment Management; |
| | • | | Public Relations & Public Affairs; and |
| | • | | Branding & Identity, Healthcare and Specialist Communications. |
In 2012, approximately 41% of the Company’s consolidated revenues were derived from Advertising and Media Investment Management, with the remaining 59% of its revenues being derived from the remaining three segments.
The following objectives represent the Group’s key performance indicators.
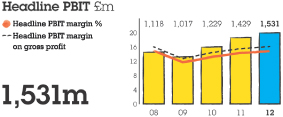
| 1. | | First, to continue to improve operating margins. In 2012, we achieved a headline PBIT margin of 14.8%, a new high. We continue to believe a headline PBIT margin of around 18% or more is a tough, but realistic, objective given that our best-performing companies in each services sector have already demonstrated they can perform at a combined Group margin of 17%. It may well be that headline PBIT as a percentage of gross profit is a more accurate competitive comparison and we achieved 16.1% in 2012, the highest level in the industry. |
| 2. | | Second, to increase flexibility in the cost structure. In 2012, flexible staff costs (including incentives, freelance and consultants) remained close to historical highs of around 7% of revenues and continue to position the Group extremely well, if current market conditions change. |
| 3. | | Third, to enhance share owner value and maximize the return on investment on the Company’s substantial free cash flow across the alternative uses of funds: capital expenditure; mergers and acquisitions; and dividends or share buy-backs. |
| 4. | | Fourth, we will continue to develop the value added by the parent company and build unique integrated marketing approaches for clients. WPP is not just a holding company focused on planning, budgeting, reporting and financial issues, but a parent company that can add value to our clients and our people in the areas of human resources, property, procurement, information technology and practice development including sustainability. This does not mean that we seek to diminish the strength of our operating brands, but rather to learn from one another. Our objective is to maximise the added value for our clients in their businesses and our people in their careers. |
| 5. | | Fifth, to emphasise revenue growth more as margins improve through our practice development activities, aimed at helping us position our portfolio in the faster-growing functional and geographic areas. |
16
| 6. | | Sixth, to improve still further the creative capabilities and reputation of all our businesses by stepping up our training and development programs; by recruiting the finest external talent; by celebrating and rewarding outstanding creative success tangibly and intangibly; by acquiring strong creative companies; and by encouraging, monitoring and promoting our companies’ achievements in winning creative awards. |
The following discussion is based on the Company’s audited Consolidated Financial Statements beginning on page F-1 of this report. The Group’s consolidated financial statements have been prepared in accordance with IFRS as issued by the IASB.
2012, our twenty-seventh year, was another record one, with revenue, profitability, headline PBIT margin and earnings per share all reaching new highs and, for the second year running, the Company was awarded a Cannes Lion for Creative Holding Company of the Year, in recognition of the Company’s collective creative excellence. These record results were achieved against a backdrop of economic uncertainty and fragile client confidence.
The share price rose sharply in 2012 – an increase of over 31% to 888.0p at year end. Dividends were increased by almost 16% to 28.51p, a record level.
Reported billings were down slightly at £44.4 billion, but up well over 1% in constant currencies. Revenues were up 3.5% to £10.4 billion and up almost 6% in constant currencies. Our revenues exceeded all our competitors for the fifth consecutive year and by an increasing amount.
Reported profit before interest and taxation rose over 4% to £1.311 billion from £1.258 billion. Headline PBIT was up over 7% to £1.531 billion against £1.429 billion in 2011 and up over 11% in constant currencies. Headline PBIT margin was 14.8% in 2012 against 14.3% last year, in line with target and also surpassing the historical pro- forma high of 14.3% in 2008. On gross profit, the headline PBIT margin was 16.1%, up 0.6 margin points on 2011.
Profit for the year decreased by 2% to £0.895 billion. Headline EBITDA increased by 7% to £1.756 billion. Headline profit before tax was up over 7% to £1.317 billion and reported profit before tax was up over 8% to £1.092 billion. Diluted earnings per share decreased by over 2% to 62.8p, reflecting the release of prior year tax provisions in 2011.
Net cash inflow from operating activities strengthened to £0.908 billion in the year. Free cash flow strengthened to £1.094 billion in the year, over £1 billion for the second consecutive year. Net debt averaged £3.2 billion in 2012, up £0.4 billion at 2012 exchange rates, and net debt at 31 December 2012 was £2.8 billion, £0.3 billion higher than 2011, reflecting increased spending on acquisitions (chiefly AKQA) and higher dividends.
Estimated net new business billings of £3.9 billion ($6.2 billion) were won in 2012, up almost 21% on 2011.
Segment performance
Performance of the Group’s businesses is reviewed by management based on headline PBIT. A table showing these amounts by operating sector and geographical area for each of the three years ended 31 December 2012, 2011 and 2010 is presented in note 2 to the Consolidated Financial Statements. To supplement the reportable currency segment information presented in note 2 to the Consolidated Financial Statements, the following tables give details of revenue growth by geographical area and operating sector on a reported, constant currency, and like-for-like basis.
17
Geographical area
| | | | | | | | | | | | | | | | | | | | | | | | |
| | | Reported
revenue
growth %+/(-) | | | Constant
currency
revenue growth %+/(-) | | | Like-for-like
revenue
growth %+/(-) | |
| | | 2012 | | | 2011 | | | 2012 | | | 2011 | | | 2012 | | | 2011 | |
North America | | | 4.7 | | | | 2.7 | | | | 3.7 | | | | 6.3 | | | | (0.1 | ) | | | 2.9 | |
United Kingdom | | | 7.7 | | | | 8.8 | | | | 7.7 | | | | 8.8 | | | | 4.0 | | | | 6.7 | |
Western Continental Europe1 | | | (2.6 | ) | | | 7.7 | | | | 3.7 | | | | 6.3 | | | | 0.1 | | | | 2.2 | |
Asia Pacific, Latin America, Africa & Middle East and Central & Eastern Europe | | | 5.7 | | | | 12.5 | | | | 9.3 | | | | 12.6 | | | | 8.3 | | | | 10.5 | |
Total Group | | | 3.5 | | | | 7.4 | | | | 5.8 | | | | 8.4 | | | | 2.9 | | | | 5.3 | |
1 Western Continental Europe includes Ireland. | | | | | | | | | | | | | | | | | | | | | | | | |
Like-for-like revenue growth in North America declined as the year progressed, from over 1% in the first quarter to down -0.6% in quarter four. Relatively strong growth in the Group’s Advertising and Media Investment Management businesses was more than offset by parts of the Group’s Consumer Insight, Public Relations & Public Affairs and Branding & Identity, Healthcare and Specialist Communications businesses. This seems to be indicative of continued pressure on discretionary client spending. In constant currencies, full year revenue growth was well over 3%, while like-for-like revenues were down marginally at -0.1%.
Conversely, and against market trends, the UK showed an improving rate of quarterly like-for-like revenue growth as the year progressed, from 2.5% in the first quarter to over 5% in quarter four. In the last quarter, particularly strong growth in Advertising and Media Investment Management was partly offset by slower growth in Consumer Insight, Branding & Identity and Healthcare Communications. Full year revenue growth in constant currencies was well over 7% and like-for-like growth was 4%.
Western Continental Europe, although relatively more difficult, actually showed some improvement in the fourth quarter, with growth in Italy, Turkey and (surprisingly) Greece, but Spain, Portugal, Scandinavia, France, the Netherlands and Switzerland were tougher, with the continuing effects of the Eurozone crisis impacting parts of the region. Full year revenue growth in constant currencies was well over 3%, while like-for-like growth was only slightly positive at 0.1%.
Our strongest region in 2012 was again Asia Pacific, Latin America, Africa & Middle East and Central & Eastern Europe, with constant currency growth of over 9% and like-for-like growth of over 8%, principally driven by Latin America and the BRICs1.
Latin America showed the strongest growth of all of our sub-regions in the year, with constant currency revenues up almost 13% and like-for-like revenues up well over 11%. The Middle East & Africa showed the strongest growth of our sub-regions in the fourth quarter, with like-for-like revenues up almost 10% and with all sectors improving. Full year revenue growth was almost 9%. Central and Eastern Europe, after a difficult third quarter, improved significantly in the final quarter, with like-for-like growth of over 12% in Russia. Full year like-for-like growth in this sub-region was 0.7%.
| 1 | | Brazil, Russia, India and China |
18
Full year revenues for the BRICs, which account for almost $2 billion of revenue, were up over 11% on a like-for-like basis. In 2012, 30% of the Group’s revenues came from Asia Pacific, Latin America, Africa & Middle East and Central & Eastern Europe, 0.6 percentage points more compared with the previous year and against the Group’s strategic objective of 35-40% over the next two to three years. Markets outside North America now account for 66% of our revenues.
Operating Sector
| | | | | | | | | | | | | | | | | | | | | | | | |
| | | Reported
revenue
growth %+/(-) | | | Constant
currency
revenue growth %+/(-) | | | Like-for-like
revenue
growth %+/(-) | |
| | | 2012 | | | 2011 | | | 2012 | | | 2011 | | | 2012 | | | 2011 | |
Advertising and Media Investment Management | | | 2.8 | | | | 11.4 | | | | 5.2 | | | | 12.2 | | | | 5.1 | | | | 7.4 | |
Consumer Insight | | | 0.1 | | | | 1.1 | | | | 2.8 | | | | 1.7 | | | | 0.8 | | | | 0.8 | |
Public Relations & Public Affairs | | | 3.6 | | | | 4.8 | | | | 4.2 | | | | 6.2 | | | | (1.0 | ) | | | 4.6 | |
Branding & Identity, Healthcare and Specialist Communications | | | 8.0 | | | | 8.5 | | | | 10.2 | | | | 10.1 | | | | 2.6 | | | | 6.9 | |
Total Group | | | 3.5 | | | | 7.4 | | | | 5.8 | | | | 8.4 | | | | 2.9 | | | | 5.3 | |
Advertising and Media Investment Management remained the strongest-performing sector with full year revenues up 5.2% in constant currencies and 5.1% like-for-like. In the final quarter, constant currency revenues were up 4.0% and like-for-like revenues were up 5.4%, considerably stronger than the third quarter like-for-like growth of 2.9%.
Of the Group’s advertising networks, Ogilvy & Mather, which was named Network of the Year at Cannes, performed especially well in North America, the UK and Latin America, with Grey in North America even stronger. However, the Group’s advertising businesses in Western Continental Europe generally remained under pressure with like-for-like revenues down. Growth in the Group’s Media Investment Management businesses has been very consistent throughout the year, with constant currency revenues up over 12% for the year and like-for-like growth of 11.0%. tenthavenue, the ‘engagement’ network focused on out-of-home media, was established towards the end of 2010 and in 2012 showed strong revenue growth, with like-for-like revenues up over 7% following growth of over 14% in 2011. The strong revenue growth across most of the Group’s businesses, together with good cost control, resulted in the combined headline PBIT margin of this sector improving by 1.6 margin points to 17.7%.
In 2012, Ogilvy & Mather, JWT, Y&R, Grey and United generated estimated net new business billings of £1.087 billion ($1.740 billion). GroupM (the Group’s Media Investment Management arm, which includes Mindshare, MEC, MediaCom, Maxus, GroupM Search and Xaxis), together with tenthavenue, generated estimated net new business billings of £2.148 billion ($3.437 billion).
Consumer Insight revenues grew 2.8% on a constant currency basis, with gross profit up 0.8% on the same basis. On a like-for-like basis revenues were up 0.8% with gross profit down 1.1% on the same basis. The pattern of revenue growth seen in the first nine months continued into the final quarter, with the mature markets of North America and Continental Europe difficult but counterbalanced by strong growth in the faster growing markets of Asia Pacific, Latin America, Africa & the Middle East. In the fourth quarter, the UK also slowed. Headline PBIT margins fell 0.5 margin points to 10.0%, while headline PBIT margins on gross profit fell 0.4 margin points to 13.9%. The central issue continues to be like-for-like revenue growth in the custom businesses in mature markets, where discretionary spending remains under review by clients. Custom businesses in faster-growth markets, and syndicated and semi-syndicated businesses in all markets, remain robust, with strong like-for-like revenue growth.
19
The Group’s Public Relations & Public Affairs businesses had a more difficult year with full-year growth in constant currencies of 4.2% and like-for-like revenues down 1.0%, with continuing pressure in North America and Continental Europe across most of the Group’s brands, only partly offset by strong growth in the UK, Latin America and the Middle East & Africa. Headline PBIT margins fell by 1.2 margin points to 14.9%.
At the Group’s Branding & Identity, Healthcare and Specialist Communications businesses (including direct, digital and interactive), constant currency revenues grew strongly at 10.2% with like-for-like growth of 2.6%. Like-for-like revenue growth slipped slightly in quarter four, due primarily to slower growth in parts of the Group’s Branding & Identity and Healthcare Communications businesses, but remained close to 2%. AKQA, the leading digital agency acquired in July 2012, performed well with full year like-for-like revenues up 10%. Headline PBIT margins for the sector as a whole improved slightly, up 0.1 margin points to 14.4%.
Over 32% of the Group’s 2012 revenues came from direct, digital and interactive, up over 1.0 percentage point from the previous year and growing 6.7% like-for-like over 2011. Marketing services comprised almost 60% of our revenues in 2012, a similar proportion to 2011.
2012 compared with 2011
Revenues
Reported revenue growth for the year of 3.5% was impacted by the strength of sterling, primarily against the Euro. On a constant currency basis, which excludes the impact of currency movements, revenues were up almost 6%. On a like-for-like basis, which excludes the impact of currency and acquisitions, revenues were up 2.9%, with like- for-like gross profit up 2.4%, reflecting pressure on gross profit in the Group’s Consumer Insight custom businesses in the mature markets of North America, the UK and Western Continental Europe. In the fourth quarter, like-for-like revenues were up 2.5%, an improvement on the third quarter of 1.9%, due to stronger growth in all regions except North America. This reflects a reversal of the declining quarterly like-for-like revenue growth trend which went from 4% in quarter one, to 3% in quarter two and to 2% in quarter three.
Operating costs
Operating costs increased by 2.8% in 2012 to £8,273.7 million from £8,046.3 million in 2011 on a reported basis and by 4.7% on a constant currency basis. During 2012, the Group continued to reap the benefits of containing operating costs, with improvements across most cost categories, particularly property, commercial and office costs.
On a like-for-like basis the average number of people in the Group increased by 1.6% in 2012. On the same basis, the number of people in the Group at 31 December 2012 was 0.4% lower than at the end of 2011. This point-to-point decrease reflects the adjustments in staff costs made in the second half of 2012, following the slowdown in revenue growth after the first quarter of the year. Also on a like-for-like basis, revenues increased by 2.9% and gross profit 2.4%.
Reported staff costs, excluding incentives, rose by over 5% and by over 7% in constant currency. Incentive payments amounted to £291 million (or over $465 million) which was well over 16% of headline PBIT before incentives and income from associates compared with £338 million or almost 20% in 2011. Performance in parts of the Group’s custom research, public relations and public affairs, healthcare and direct, digital and interactive businesses fell short of the maximum performance objectives agreed for 2012, as the like-for-like revenue growth rate slowed in quarters two and three in 2012. This followed the record profit and margin performance in 2011, when most of the Group’s operating companies achieved maximum incentive levels. Headline PBIT margins, before all incentives and income from associates, were 16.9%, down 0.1 margin points, compared with 17.0% last year. The Group’s staff cost to revenue ratio, including incentives, increased by 0.3 margin points to 58.9% compared with 58.6% in 2011. Following intentional reductions in 2009 and 2010 after the Lehman crisis, the Group increased its investment in people, particularly in the latter part of 2011 and in early 2012, mainly in the faster-growing geographic and functional markets (such as media investment management and digital) as like-for-like revenues and gross profit increased.
20
In 2012, the ratio of variable staff costs (incentives, freelance and consultants costs) to total staff costs was 11.4%, compared with 12.2% in 2011. As a proportion of revenue, variable staff costs were 6.7% in 2012 compared with 7.2% in 2011.
In the second half of 2012, the Group received the proceeds from the sale of the stake in Buddy Media and also completed the sale of the freehold of 285 Madison Avenue, the New York headquarters of Young & Rubicam Inc. These two transactions combined resulted in a gain of £102 million. Offsetting this gain, are restructuring costs of £93.4 million which include £62.9 million of severance cost arising from a structural reassessment of certain of the Group’s operations, primarily in Western Continental Europe; and £30.5 million of other costs, primarily accelerated depreciation of IT assets in the US and Europe, arising from an overhaul of its centralised IT infrastructure.
Profit before interest and taxation
As a result of the above, reported PBIT rose over 4% to £1.311 billion from £1.258 billion, up over 8% in constant currencies. Headline PBIT rose over 7% to £1.531 billion from £1.429 billion, up over 11% in constant currencies.
Finance income, finance costs and revaluation of financial instruments
Finance income decreased to £85.9 million in 2012 from £97.3 million in 2011. Finance costs increased to £299.8 million in 2012 from £297.2 million in 2011. Therefore, net finance costs were £213.9 million, up from £199.9 million last year, reflecting higher average net debt, offset by lower funding costs. Revaluation of financial instruments resulted in a charge of £4.7 million in 2012 and a charge of £50.0 million in 2011.
Taxation
The Company’s effective tax rate on reported profit before tax in 2012 was 18.1%, compared to 9.1% in 2011. The difference in the reported tax rate is primarily due to the release in 2011 of prior year corporate tax provisions following the resolution of a number of open tax matters.
Profit for the year
Profit for the year decreased by 2.4% to £894.7 million in 2012 from £916.5 million in 2011 on a reported basis and increased by 2.4% in constant currency, reflecting a higher effective tax rate, which is only partially offset by the higher revenue and lower charges for revaluation of financial instruments. In 2012, £822.7 million of profit for the year was attributable to equity holders of the parent and £72.0 million attributable to non-controlling interests. Diluted earnings per share decreased by over 2% (increased by almost 2% in constant currencies) to 62.8p, again reflecting the release of prior year tax provisions in 2011.
2011 compared with 2010
Revenues
Reported revenues were up 7.4% in 2011 to £10,021.8 million from £9,331.0 million in 2010. The Group’s reported revenue growth for the year of over 7% reflected the strength of sterling, primarily against the US dollar. On a constant currency basis, which excludes the impact of currency movements, revenues were up over 8%. On a like-for-like basis, excluding the impact of acquisitions and currency, revenues were up 5.3%, with gross profit up 5.9%. In the fourth quarter, like-for-like revenues were up 4.5%, down slightly on the third quarter, primarily due to stronger comparatives.
Despite the slowdown in economic activity resulting from the uncertainty triggered by the Eurozone crisis, advertising and marketing services expenditures continued to rise and there seem to have been some significant changes, particularly in corporate behaviour, to explain why. In 2009, post-Lehman, all bets were off. Consumers
21
and corporates were focused almost totally on rapidly reducing costs and de-leveraging. In 2010 and 2011, however, the situation seemed to change. The financial world did not come to an end as some had predicted. Western-based multinational companies, which today are reputed to be sitting on as much as $2 trillion net cash with relatively un-leveraged balance sheets, were still fearful of making mistakes but prepared to invest in capacity and behind brands in fast-growing markets. At the same time, they were also prepared to invest in brands to maintain or increase market share even in slow-growth Western markets, such as the US and Western Europe. This approach has the virtue of not increasing fixed costs, although we in the communications services business naturally regard brand spending as a fixed investment and not a discretionary cost.
On a combined basis, over the last two years, there has been a sequential improvement in like-for-like quarterly revenue growth, with 6.7% for the first quarter, 10.3% in the second, 12.2% for the third and 13.1% for the fourth. This two-year combined sequential quarterly growth continues to reflect increased client advertising and promotional spending – with the former tending to grow faster than the latter, which from our point of view is more positive – across most of the Group’s major geographic markets and functional sectors despite tougher comparatives. Nonetheless, clients understandably continue to demand increased effectiveness and efficiency, i.e. better value for money.
Operating costs
Operating costs increased by 6.0% in 2011 to £8,046.3 million from £7,587.5 million in 2010 on a reported basis and by 7.1% on a constant currency basis. During 2011, the Group continued to reap the benefits of containing operating costs, with improvements across most cost categories, particularly direct, property, commercial and office costs.
On a like-for-like basis the average number of people in the Group increased by 4.6% in 2011. On the same basis, the number of people in the Group at 31 December 2011 was 4.3% higher than at the end of 2010. Also on a like-for-like basis, revenues increased by 5.3% and gross profit 5.9%.
Reported staff costs, excluding incentives, rose by 8.6% and by 9.6% in constant currency. Incentive payments amounted to £338 million (or over $500 million) which was almost 20% of headline PBIT before incentives and income from associates and represented close to maximum achievement of agreed performance targets. The Group’s reported staff cost to revenue ratio, including incentives, increased by 0.3 margin points to 58.6% compared with 58.3% in 2010. Following intentional containment in 2009 and 2010 post-Lehman, the Group continued to increase its investment in human capital in 2011, particularly in the faster-growing geographic and functional markets as like-for-like revenues and gross profit increased significantly. However, the Group’s more representative staff costs to gross profit ratio remained flat at 63.6% compared with the prior year, as gross profit grew faster than revenues.
In 2011, the ratio of variable staff costs (incentives, freelance and consultants costs) to total staff costs was 12.2%, compared with 13.4% in 2010. As a proportion of revenue, variable staff costs were 7.2% in 2011 compared with 7.8% in 2010.
In 2011 we were able to reduce our core property portfolio. Although square footage rose by 1.7% from 22.8 million sq ft to 23.2 million sq ft at the end of the year, this increase was less than the 3.1% of revenue growth attributable to acquisitions and considerably less than constant currency revenue growth of 8.4%, meaning our core portfolio (excluding the impact of acquisitions) reduced. As a result of this improvement in space utilisation the establishment cost-to-revenue ratio in 2011 dropped to 6.7% (in spite of a 3% increase in cost per square foot) from 7.1% in 2010.
Profit before interest and taxation
As a result of the above, reported PBIT rose over 22% to £1.258 billion from £1.028 billion, up over 23% in constant currencies. Headline PBIT rose over 16% to £1.429 billion from £1.229 billion, up over 17% in constant currencies.
22
Finance income, finance costs and revaluation of financial instruments
Finance income increased to £97.3 million in 2011 from £81.7 million in 2010. Finance costs increased to £297.2 million in 2011 from £276.8 million in 2010. Therefore, net finance costs were £199.9 million, up from £195.1 million last year, reflecting lower average net debt, offset by higher funding costs. Revaluation of financial instruments resulted in a charge of £50.0 million in 2011 and income of £18.2 million in 2010. The 2011 charge is predominantly attributable to revaluation of put options over non-controlling interests.
Taxation
The Company’s effective tax rate on reported profit before tax in 2011 was 9.1%, compared to 22.4% in 2010. The difference was primarily due to the release of prior year corporate tax provisions following the resolution of a number of open tax matters, together with deferred tax credits in relation to amortisation of acquired intangible assets.
Profit for the year
Profit for the year increased by 38.7% to £916.5 million in 2011 from £661.0 million in 2010 on a reported basis and increased by 40.2% in constant currency, reflecting higher profit margins and a lower effective tax rate. In 2011, £840.1 million of profit for the year was attributable to equity holders of the parent and £76.4 million attributable to non-controlling interests.
Inflation
As in 2011, in management’s opinion inflation did not have a material impact on the Company’s results for the year or financial position at 31 December 2012.
Foreign currency fluctuations
See Item 11 for a discussion of the impact of currency exchange rate fluctuations on the Group’s consolidated results.
B. Liquidity and Capital Resources
General—The primary sources of funds for the Group are cash generated from operations and funds available under its credit facilities. The primary uses of cash funds in recent years have been for debt service and repayment, capital expenditures, acquisitions, share repurchases and cancellations and dividends. For a breakdown of the Company’s sources and uses of cash and for the Company’s liquidity risk management see the “Consolidated Cash Flow Statement” and note 24, which are included as part of the Company’s Consolidated Financial Statements in Item 18 of this Report.
23
There are broadly three alternative uses of funds.
| | • | | Capital expenditure, which usually approximates the depreciation cost. Pressure here has eased as technology pricing has fallen, although we have increased investment in our digital- and technology-based service offering, in line with our strategic goals. The Group has actively assessed its IT infrastructure in 2012 and consequently accelerated its overhaul of centralised IT services, although the pace of process simplification, offshoring and outsourcing needs to be quickened. The Company has also invested significantly more in real estate following lease renewals to secure greater efficiencies. A large part of the proceeds from the sale of the freehold of 285 Madison Avenue in New York have been reinvested in relocating the headquarters of Young & Rubicam Inc. to a more modern, efficient facility at 3 Columbus Circle. |
| | • | | Mergers and acquisitions, which have historically taken the lion’s share of free cash flow. Here the Group has raised the hurdle rate on capital employed so that return on capital may be increased. There is a very significant pipeline of reasonably-priced small- and medium-sized potential acquisitions, with the exception of Brazil and India and digital in the US, where prices seem to have got ahead of themselves because of pressure on our competitors to catch up. This is clearly reflected in some of the operational and governance issues that are starting to surface elsewhere in the industry, particularly in fast-growing markets like China and Brazil. |
The Group’s acquisition focus in 2012 was again on the triple play of faster-growing geographic markets, new media and consumer insight, including the application of technology and big data, totally consistent with the Group’s strategic priorities in the areas of geography, new communication services and measurability. In 2012, the Group spent £500 million on initial acquisition payments, net of cash acquired and disposal proceeds. Net acquisition spend is currently targeted at around £300 to £400 million per annum and the Group will continue to seize opportunities in line with its strategy.
| | • | | Dividends or share buy-backs. The Group has increasingly come to the view, based on co-operative research with leading investment institutions, that, currently, the markets favour consistent increases in dividends and higher maintainable pay-out ratios, along with anti-dilutive buy-backs and, of course, sensibly-priced strategic acquisitions. |
Following the strong first-half results in 2012, the Board raised the interim dividend by 18%. The final dividend has been increased by 15%, bringing the total dividend for the year to 28.51p per share, up 15.9%. Dividends paid in respect of 2012 will total almost £360 million for the year.
Share buy-backs will continue to be targeted to absorb any share dilution from issues of options or restricted stock, although the Company does also have considerable free cash flow to take advantage of any anomalies in market values, as it did last year. Share buy-backs in 2012 cost £135 million, representing 1.3% of issued share capital.
The Group’s liquidity is affected primarily by the working capital flows associated with its media buying activities on behalf of clients. The working capital movements relate primarily to the Group’s billings. Billings comprise the gross amounts billed to clients in respect of commission-based/fee-based income together with the total of other fees earned. In 2012, billings were £44.4 billion, or 4.3 times the revenue of the Group. The inflows and outflows associated with media buying activity therefore represent significant cash flow within each month of the year and are forecast and re-forecast on a regular basis throughout the year by the Group’s treasury staff so as to ensure that there is continuing coverage of peak requirements through committed borrowing facilities from the Group’s bankers and other sources.
24
Liquidity risk management—The Group manages liquidity risk by ensuring continuity and flexibility of funding even in difficult market conditions. Undrawn committed borrowing facilities are maintained in excess of peak net borrowing levels and debt maturities are closely monitored. Targets for debt and cash position are set on an annual basis and, to assist in meeting this, working capital targets are set for all the Group’s major operations. See additional discussion on liquidity risk in note 24 to the consolidated financial statements.
Debt
The Company’s borrowings consist of bonds and revolving credit facilities, details on the Company’s borrowings are provided in note 10 to the consolidated financial statements.
Borrowings under the Revolving Credit Facility are governed by certain financial covenants based on the results and financial position of the Group, including requirements that (i) the interest coverage ratio for each financial period equal or exceed 5.0 to 1 and (ii) the ratio of borrowed funds to earnings before interest, taxes, depreciation and amortisation at 30 June and 31 December in each year shall not exceed 3.5 to 1, both covenants as defined in the relevant agreement. The Group is in compliance with both covenants.
Hedging of financial instruments—The Group’s policy on interest rate and foreign exchange rate management sets out the instruments and methods available to hedge interest and currency risk exposures and the control procedures in place to ensure effectiveness. The Group uses derivative financial instruments to reduce exposure to foreign exchange risk and interest rate movements. The Group does not hold or issue derivative financial instruments for speculative purposes.
In 2012, net cash inflow from operating activities was £908.3 million. Free cash flow available for debt repayment, acquisitions, share buy-backs and dividends was £1,094.0 million. This free cash flow was partially absorbed by £586.6 million in net acquisitions and disposals, by £134.5 million in share repurchases and buy-backs and by £306.6 million in dividends, leaving £66.3 million.
In September 2012, the Group successfully issued $500 million of 10-year bonds at a coupon of 3.625%, together with $300 million of 30-year bonds at 5.125%.
At 31 December 2012, the Group’s net debt was £2.8 billion, up £0.3 billion from £2.5 billion in 2011, reflecting increased spending on acquisitions (chiefly AKQA) and higher dividends. Net debt averaged £3.2 billion in 2012, up £0.4 billion at 2012 exchange rates. The Group’s average net debt was around 1.8 times headline EBITDA in 2012 compared with 1.7 times in 2011, well within the Group’s current target range of 1.5-2.0 times.
Interest (finance cost net of finance income, excluding revaluation of financial instruments) cover based on headline PBIT in 2012 was 7.2 times. So far, in the first three months of 2013, average net debt was up approximately £0.3 billion at £3.0 billion against £2.7 billion for the same period in 2012, at 2013 exchange rates.
With a current equity market capitalisation of approximately £13.6 billion, the total enterprise value of the Company is approximately £16.6 billion, a multiple of 9.3 times 2012 headline EBITDA.
The Company’s borrowings are evenly distributed between fixed and floating rate debt. Given the strong cash generation of the business, its debt maturity profile and available facilities, the directors believe the Company has sufficient liquidity to match its requirements for the foreseeable future.
Refer to Item 5F for details on the Company’s material commitments for capital expenditures at 31 December 2012.
C. Research and Development, Patents and Licenses
Not applicable.
25
D. Trend Information
The discussion below and in the rest of this Item 5 includes forward-looking statements regarding plans, objectives, projections and anticipated future performance based on assumptions that are subject to risks and uncertainties. As such, actual results or outcomes may differ materially from those discussed in the forward-looking statements. See “Forward-Looking Statements” preceding Item 1 in this annual report.
In the first quarter of 2013, reported revenues were up 5.9% at £2.532 billion. Revenues in constant currency were up 5.1%, reflecting the slight weakness of the pound sterling against the US dollar and the Euro. On a like-for-like basis, excluding the impact of acquisitions and currency fluctuations, revenues were up 2.1% with like-for-like gross profit up 1.9% compared with the same period last year, as the scale of digital activities increased.
The pattern of revenue growth in 2013 has started similarly to the final quarter of 2012, with constant currency growth showing continuing improvement across all sectors, except Public Relations & Public Affairs, and across all geographies. On a like-for-like basis, Advertising and Media Investment Management and Branding & Identity, Healthcare and Specialist Communications (including direct, digital and interactive), as in the final quarter of 2012, were the strongest by sector, with Consumer Insight also improving. Our budgets for 2013 indicated like-for-like growth of around 3% over last year. For the first three months actual performance was well ahead of the projections for quarter one. A preliminary look at our quarter one revised forecasts for the full year indicates revenue growth ahead of budget with a stronger second half than previously, partly reflecting easier comparatives with the second half of 2012. The mature markets of the United States and Western Continental Europe slowed in 2012, although the United Kingdom, against market trends, grew strongly. This pattern has continued into the first quarter of 2013 and as indicated in the budgets for this year, the faster growing markets of Asia Pacific, Latin America, Africa & Middle East and Central & Eastern Europe were strongest in the first quarter, followed by the United Kingdom. Headline PBIT is above budget and well ahead of last year and the increase in margin is in line with the Group’s full year headline PBIT margin target of 0.5 margin points improvement.
The Group gained a total of £940 million ($1.504 billion) in net new business wins (including all losses) in the first quarter, compared to £1.159 billion ($1.855 billion) in the same period last year.
Concerns globally about the Eurozone crisis, the Middle East, a Chinese or BRICs hard or soft landing and, perhaps, most importantly, dealing with the US deficit and a record $16 trillion of debt, continue to make clients reluctant to take further risks, despite stronger balance sheets. Clients remain focused on a strategy of adding capacity and brand building in both fast growth geographic markets and functional markets like media and digital.
The pattern of 2013 looks similar to 2012 and equally demanding, perhaps with slightly increased client confidence balancing the lack of maxi- or mini-quadrennial events. Forecasts of worldwide real GDP growth still hover around 3%, with inflation of 2% giving nominal GDP growth of 5%. Advertising as a proportion of GDP should at least remain constant overall, although it is still at relatively depressed historical levels, particularly in mature markets, post-Lehman and advertising should, as a result, grow at least at a similar rate to nominal GDP. Both consumers and corporates are likely to remain cautious and risk averse, but corporates should continue to invest in capacity and brands in fast growth markets, and in slow growth markets invest in brands to maintain market share, as they squeeze capacity. 2014 looks a better prospect, however, with the World Cup in Brazil, the Winter Olympics in Sochi and the United States mid-term Congressional elections.
26
E. Off-Balance Sheet Arrangements
None.
F. Tabular Disclosure of Contractual Obligations
The following summarises the Company’s estimated contractual obligations at 31 December 2012, and the effect such obligations are expected to have on its liquidity and cash flows in the future periods. Certain obligations presented below held by one subsidiary of the Company may be guaranteed by another subsidiary in the ordinary course of business.
| | | | | | | | | | | | | | | | | | | | | | | | | | | | |
| | | | | | Payments due in | |
| (£m) | | Total | | | 2013 | | | 2014 | | | 2015 | | | 2016 | | | 2017 | | | Beyond
2017 | |
Debt financing under the Revolving Credit Facility and in relation to unsecured loan notes1 | |
Eurobonds | | | 1,503.2 | | | | 487.5 | | | | — | | | | 406.3 | | | | 609.4 | | | | — | | | | — | |
Sterling and convertible bonds | | | 1,050.0 | | | | — | | | | 450.0 | | | | — | | | | — | | | | 400.0 | | | | 200.0 | |
US$ bonds | | | 1,589.1 | | | | — | | | | 596.4 | | | | — | | | | — | | | | — | | | | 992.7 | |
Other | | | 15.4 | | | | — | | | | 15.4 | | | | — | | | | — | | | | — | | | | — | |
Subtotal | | | 4,157.7 | | | | 487.5 | | | | 1,061.8 | | | | 406.3 | | | | 609.4 | | | | 400.0 | | | | 1,192.7 | |
Interest payable | | | 1,120.9 | | | | 233.9 | | | | 183.0 | | | | 123.3 | | | | 98.0 | | | | 65.1 | | | | 417.6 | |
Total | | | 5,278.6 | | | | 721.4 | | | | 1,244.8 | | | | 529.6 | | | | 707.4 | | | | 465.1 | | | | 1,610.3 | |
Operating leases2 | | | 2,171.2 | | | | 356.6 | | | | 306.6 | | | | 274.6 | | | | 225.7 | | | | 179.1 | | | | 828.6 | |
Capital commitments3 | | | 47.0 | | | | 47.0 | | | | — | | | | — | | | | — | | | | — | | | | — | |
Investment commitments3 | | | 18.8 | | | | 18.8 | | | | — | | | | — | | | | — | | | | — | | | | — | |
Estimated obligations under acquisition earnouts and put option agreements | | | 338.3 | | | | 97.7 | | | | 38.6 | | | | 78.4 | | | | 32.5 | | | | 86.7 | | | | 4.4 | |
Total contractual obligations | | | 7,853.9 | | | | 1,241.5 | | | | 1,590.0 | | | | 882.6 | | | | 965.6 | | | | 730.9 | | | | 2,443.3 | |
| 1 | | In addition to debt financing under the Revolving Credit Facility and in relation to unsecured loan notes, the Company had short-term overdrafts at 31 December 2012 of £586.0 million. The Group’s net debt at 31 December 2012 was £2,821.2 million and is analysed in Item 5B. |
| 2 | | Operating leases are net of sub-let rentals of £17.4 million. |
| 3 | | Capital and investment commitments include commitments contracted, but not provided for in respect of property, plant and equipment and in respect of interests in associates and other investments, respectively. |
The Company expects to make annual contributions to its funded defined benefit plans, as determined in line with local conditions and practices. Contributions in respect of unfunded plans are paid as they fall due. The total contributions (for funded plans) and benefit payments (for unfunded plans) paid for 2012 amounted to £56.5 million (2011: £66.8 million, 2010: £53.3 million). Employer contributions and benefit payments in 2013 are expected to be in the range of £50 million to £70 million depending on the performance of the assets. Projections for years after 2013 are subject to a number of factors, including future asset performance and changes in assumptions which mean the Company is unable to make sufficiently reliable estimations of future contributions.
27
Non-GAAP Information
Constant currency
The Company’s reporting currency is the UK pound sterling. However, the Company’s significant international operations give rise to fluctuations in foreign exchange rates. To neutralise foreign exchange impact and to better illustrate the underlying change in revenue and profit from one year to the next, the Company has adopted the practice of discussing results in both reportable currency (local currency results translated into pounds sterling at the prevailing foreign exchange rate) and constant currency.
The Group uses US dollar-based, constant currency models to measure performance. These are calculated by applying budgeted 2012 exchange rates to local currency reported results for the current and prior year. This gives a US-dollar denominated income statement and balance sheet which exclude any variances attributable to foreign exchange rate movements.
Pro-forma (‘like-for-like’)
Management believes that discussing like-for-like provides a better understanding of the Company’s performance and trends because it allows for more meaningful comparisons of current period to that of prior periods.
Pro-forma comparisons are calculated as follows: current year, constant currency actual results (which include acquisitions from the relevant date of completion) are compared with prior year, constant currency actual results, adjusted to include the results of acquisitions for the commensurate period in the prior year. The Group uses the terms ‘pro-forma’ and ‘like-for-like’ interchangeably.
The following table reconciles reported revenue and gross profit growth for 2012 and 2011 to like-for-like revenue and gross profit growth for the same period.
| | | | | | | | | | | | | | | | |
| | | Revenue | | | Gross profit | |
| | | £m | | | | | | £m | | | | |
2010 Reportable | | | 9,331 | | | | | | | | 8,561 | | | | | |
Impact of exchange rate changes | | | (93 | ) | | | (1.0%) | | | | (94) | | | | (1.1%) | |
Changes in scope of consolidation | | | 289 | | | | 3.1% | | | | 267 | | | | 3.1% | |
Like-for-like growth | | | 495 | | | | 5.3% | | | | 505 | | | | 5.9% | |
2011 Reportable | | | 10,022 | | | | 7.4% | | | | 9,239 | | | | 7.9% | |
Impact of exchange rate changes | | | (231 | ) | | | (2.3%) | | | | (203) | | | | (2.2%) | |
Changes in scope of consolidation | | | 291 | | | | 2.9% | | | | 258 | | | | 2.8% | |
Like-for-like growth | | | 291 | | | | 2.9% | | | | 221 | | | | 2.4% | |
2012 Reportable | | | 10,373 | | | | 3.5% | | | | 9,515 | | | | 3.0% | |
Headline PBIT
Headline PBIT is one of the metrics that management uses to assess the performance of the business. Management believes that it is both useful and necessary to report headline PBIT because this measure is used by management for internal performance analysis; the presentation of this measure facilitates comparability with other companies who may use similar titled measures, although management’s measure may not be calculated in the same way as similarly titled profit measures reported by other companies; and it is useful in connection with discussion with the investment community.
Headline PBIT is calculated as profit before finance income/costs and revaluation of financial instruments, taxation, investment gains/losses and write-downs, goodwill impairment and other goodwill write-downs, amortisation and impairment of acquired intangible assets, share of exceptional gains/losses of associates and
28
gains/losses on remeasurement of equity interest on acquisition of controlling interest; and, in 2012, the gain on sale of freehold property in New York, Group restructuring costs and costs incurred in changing the corporate structure of the Company.
A tabular reconciliation of profit before interest and taxation to headline PBIT is provided in note 31 to the consolidated financial statements.
Headline PBIT margin
Calculated as headline PBIT (defined above) as a percentage of revenue.
Headline PBIT margin on gross profit
Given the significance of Consumer Insight revenues to the Group, with none of the direct competitors present in that sector, gross profit and headline PBIT margin on gross profit are a more meaningful measure of comparative, competitive revenue growth and margin performance. This is because Consumer Insight revenues include pass-through costs, principally for data collection, on which no margin is charged.
Calculated as headline PBIT (defined above) as a percentage of gross profit.
Headline PBT
Headline PBT is one of the metrics that management uses to assess the performance of the business. Management believes that it is both useful and necessary to report headline PBT because this measure is used by management for internal performance analysis; the presentation of this measure facilitates comparability with other companies who may use similar titled measures, although management’s measure may not be calculated in the same way as similarly titled profit measures reported by other companies; and it is useful in connection with discussion with the investment community.
Headline PBT is calculated as profit before taxation, investment gains/losses and write-downs, goodwill impairment and other goodwill write-downs, amortisation and impairment of acquired intangible assets, share of exceptional losses/gains of associates, gains/losses arising from the revaluation of financial instruments, and gains/losses on remeasurement of equity interest on acquisition of controlling interest; and, in 2012, the gain on sale of freehold property in New York, Group restructuring costs and costs incurred in changing the corporate structure of the Company.
A tabular reconciliation of profit before taxation to headline PBT is shown below.
| | | | | | | | | | | | |
| | | Year ended 31 December | |
| | | 2012 £m | | | 2011 £m | | | 2010 £m | |
Profit before taxation | | | 1,091.9 | | | | 1,008.4 | | | | 851.3 | |
Amortisation and impairment of acquired intangible assets | | | 171.9 | | | | 172.0 | | | | 170.5 | |
Goodwill impairment | | | 32.0 | | | | — | | | | 10.0 | |
Gains on disposal of investments | | | (26.8 | ) | | | (0.4 | ) | | | (4.1 | ) |
Gains on re-measurement of equity on acquisition of controlling interest | | | (5.3 | ) | | | (31.6 | ) | | | (13.7 | ) |
Investment write-downs | | | 19.6 | | | | 32.8 | | | | 37.5 | |
Cost of changes to corporate structure | | | 4.1 | | | | — | | | | — | |
Gain on sale of freehold property in New York | | | (71.4 | ) | | | — | | | | — | |
Restructuring costs | | | 93.4 | | | | — | | | | — | |
Share of exceptional losses/(gains) of associates | | | 3.0 | | | | (2.1 | ) | | | 0.3 | |
Revaluation of financial instruments | | | 4.7 | | | | 50.0 | | | | (18.2 | ) |
Headline PBT | | | 1,317.1 | | | | 1,229.1 | | | | 1,033.6 | |
29
Headline EBITDA
Headline EBITDA is a key metric that private equity firms, for example, use for valuing companies.
Headline EBITDA is calculated as profit before finance income/costs and revaluation of financial instruments, taxation, investment gains/losses and write-downs, goodwill impairment and other goodwill write-downs, amortisation and impairment of intangible assets, share of exceptional losses/gains of associates, depreciation of property, plant and equipment and gains/losses on remeasurement of equity interest on acquisition of controlling interest; and, in 2012, the gain on sale of freehold property in New York, Group restructuring costs and costs incurred in changing the corporate structure of the Group.
A tabular reconciliation of profit for the year to headline EBITDA is shown below.
| | | | | | | | | | | | |
| | | Year ended 31 December | |
| | | 2012 £m | | | 2011 £m | | | 2010 £m | |
Profit for the year | | | 894.7 | | | | 916.5 | | | | 661.0 | |
Taxation | | | 197.2 | | | | 91.9 | | | | 190.3 | |
Finance income, finance cost and revaluation of financial instruments, net | | | 218.6 | | | | 249.9 | | | | 176.9 | |
Amortisation and impairment of acquired intangible assets | | | 171.9 | | | | 172.0 | | | | 170.5 | |
Depreciation of property, plant and equipment | | | 191.0 | | | | 185.8 | | | | 184.9 | |
Amortisation of other intangible assets | | | 33.7 | | | | 25.7 | | | | 25.4 | |
Goodwill impairment | | | 32.0 | | | | — | | | | 10.0 | |
Gains on disposal of investments | | | (26.8 | ) | | | (0.4 | ) | | | (4.1 | ) |
Gains on re-measurement of equity on acquisition of controlling interest | | | (5.3 | ) | | | (31.6 | ) | | | (13.7 | ) |
Investment write-downs | | | 19.6 | | | | 32.8 | | | | 37.5 | |
Cost of changes to corporate structure | | | 4.1 | | | | — | | | | — | |
Gain on sale of freehold property in New York | | | (71.4 | ) | | | — | | | | — | |
Restructuring costs | | | 93.4 | | | | — | | | | — | |
Share of exceptional losses/(gains) of associates | | | 3.0 | | | | (2.1 | ) | | | 0.3 | |
Headline EBITDA | | | 1,755.7 | | | | 1,640.5 | | | | 1,439.0 | |
Billings
Billings is one of the metrics that management uses to assess the performance of the business.
Billings comprise the gross amounts billed to clients in respect of commission-based/fee-based income together with the total of other fees earned.
Estimated net new billings
Estimated net new billings is one of the metrics that management uses to assess the performance of the business.
Estimated net new billings represent the estimated annualised impact on billings of new business gained from both existing and new clients, net of existing client business lost. The estimated impact is based upon initial assessments of the clients’ marketing budgets, which may not necessarily result in actual billings of the same amount.
Free cash flow
The Group bases its internal cash flow objectives on free cash flow. Management believes free cash flow is meaningful to investors because it is the measure of the Company’s funds available for acquisition related
30
payments, dividends to shareowners, share repurchases and debt repayment. The purpose of presenting free cash flow is to indicate the ongoing cash generation within the control of the Group after taking account of the necessary cash expenditures of maintaining the capital and operating structure of the Group (in the form of payments of interest, corporate taxation and capital expenditure). Net working capital movements are excluded from this measure since these are principally associated with our media buying activities on behalf of clients and are not necessarily within the control of the Group. This computation may not be comparable to that of similarly titled measures presented by other companies.
A tabular reconciliation of net cash inflow from operating activities to free cash flow is shown below.
| | | | | | | | | | | | |
| | | Year ended 31 December | |
| | | 2012 £m | | | 2011 £m | | | 2010 £m | |
Net cash inflow from operating activities | | | 908.3 | | | | 665.2 | | | | 1,361.2 | |
Share option proceeds | | | 56.0 | | | | 28.8 | | | | 42.7 | |
Proceeds on disposal of property, plant and equipment | | | 123.5 | | | | 13.2 | | | | 7.6 | |
Movement in working capital and provisions | | | 388.2 | | | | 620.9 | | | | (225.5 | ) |
Purchases of property, plant and equipment | | | (290.3 | ) | | | (216.1 | ) | | | (190.5 | ) |
Purchase of other intangible assets (including capitalised computer software) | | | (39.8 | ) | | | (37.1 | ) | | | (27.0 | ) |
Dividends paid to non-controlling interests in subsidiary undertakings | | | (51.9 | ) | | | (62.2 | ) | | | (66.7 | ) |
Free cash flow | | | 1,094.0 | | | | 1,012.7 | | | | 901.8 | |
Net debt and average net debt
Management believes that net debt and average net debt are appropriate and meaningful measures of the debt levels within the Group. This is because of the seasonal swings in our working capital generally, and those resulting from our media buying activities on behalf of our clients in particular, together with the fact that we choose for commercial reasons to locate the debt of the Group in particular countries and leave cash resources in others—though our cash resources could be used to repay the debt concerned.
Average net debt is calculated as the average daily net bank borrowings of the Group, derived from the Group’s automated banking system. Net debt at a period end is calculated as the sum of the net bank borrowings of the Group, derived from the cash ledgers and accounts in the balance sheet.
The following table is an analysis of net debt:
| | | | | | | | | | | | |
| | | 2012 £m | | | 2011 £m | | | 2010 £m | |
Debt financing | | | (4,766.5 | ) | | | (4,411.4 | ) | | | (3,853.6 | ) |
Cash and short-term deposits | | | 1,945.3 | | | | 1,946.6 | | | | 1,965.2 | |
Net debt | | | (2,821.2 | ) | | | (2,464.8 | ) | | | (1,888.4 | ) |
31
Use of Estimates
The preparation of financial statements requires management to make estimates, judgements and assumptions that affect the reported amounts of assets and liabilities and disclosure of contingencies at the date of the financial statements, and the reported amounts of revenues and expenses during the reporting period. Actual results could differ materially from those estimates.
Critical Accounting Policies
The Company’s financial statements have been prepared in accordance with IFRS as issued by the IASB. A summary of the Group’s principal accounting policies is provided in the Accounting Policies section of the Financial Statements. The Company believes certain of these accounting policies are particularly critical to understanding the more significant judgements and estimates used in the preparation of its consolidated financial statements. Therefore, we have prepared the following supplemental discussion of critical accounting policies, which should be read together with our financial statements and notes thereto.
Goodwill and other intangibles
The Company has a significant amount of goodwill and other intangible assets. In accordance with the Group’s accounting policy, the carrying values of goodwill and intangible assets with indefinite useful lives are reviewed for impairment annually or more frequently if events or changes in circumstances indicate that the asset might be impaired.
The carrying values of brands with an indefinite useful life are assessed for impairment purposes by using the royalty and loyalty methods of valuation, both of which utilise the net present value of future cash flows associated with the brands.
In years prior to 2012, the goodwill impairment review was initially undertaken as at 30 June and then updated as at 31 December which was the annual testing date. For 2012, the annual testing date was changed to 30 September to better align the impairment testing procedures with the financial planning process. This change did not accelerate, delay, avoid or cause a goodwill impairment charge.
Under IFRS, an impairment charge is required for both goodwill and other indefinite lived assets when the carrying amount exceeds the ‘recoverable amount’, defined as the higher of fair value less costs to sell and value in use. Our approach in determining the recoverable amount utilises a discounted cash flow methodology, which necessarily involves making numerous estimates and assumptions regarding revenue growth, operating margins, appropriate discount rates and working capital requirements. These estimates will likely differ from future actual results of operations and cash flows, and it is possible that these differences could be material. In addition, judgements are applied in determining the level of cash-generating unit identified for impairment testing and the criteria used to determine which assets should be aggregated. A difference in testing levels could affect whether an impairment is recorded and the extent of impairment loss. Changes in our business activities or structure may also result in changes to the level of testing in future periods. Further, future events could cause the Company to conclude that impairment indicators exist and that the asset values associated with a given operation have become impaired. Any resulting impairment loss could have a material impact on the Company’s financial condition and results of operations.
Historically our impairment losses have resulted from a specific event, condition or circumstance in one of our companies, such as the loss of a significant client. As a result, changes in the assumptions used in our impairment model have not had a significant effect on the impairment charges recognised. The carrying value of goodwill and other intangible assets will continue to be reviewed at least annually for impairment and adjusted to the recoverable amount if required.
32
The most significant assumptions employed by the Company in determining recoverable amounts are as follows:
| | • | | Future cash flows derived from each cash-generating unit are based on a projection period of up to five years. These projections utilise the latest budget information available for each cash-generating unit covering one or more twelve month periods from the balance sheet date. These budgets have been prepared by management; |
| | • | | After the projection period, there is an assumed annual long-term growth rate of 3.0% (2011: 3.0%), with no improvements in operating margins. Management have made the judgement that this long-term growth rate does not exceed the long-term growth rate for the industry; and |
| | • | | The net present value of the future cash flows was calculated using a pre-tax discount rate of 9.5% (2011: 9.5%). |
Acquisition accounting
The Group accounts for acquisitions in accordance with IFRS 3 ‘Business Combinations’. IFRS 3 requires the acquiree’s identifiable assets, liabilities and contingent liabilities (other than non-current assets or disposal groups held for sale) to be recognised at fair value at acquisition date. In assessing fair value at acquisition date, management make their best estimate of the likely outcome where the fair value of an asset or liability may be contingent on a future event. In certain instances, the underlying transaction giving rise to an estimate may not be resolved until some years after the acquisition date. IFRS 3 requires the release to profit of any acquisition reserves which subsequently become excess in the same way as any excess costs over those provided at acquisition date are charged to profit. At each period end management assess provisions and other balances established in respect of acquisitions for their continued probability of occurrence and amend the relevant value accordingly through the consolidated income statement or as an adjustment to goodwill as appropriate under IFRS 3. In 2012, operating profit includes credits totaling £19.8 million (2011: £14.0 million, 2010: £16.5 million) relating to the release of excess provisions and other balances established in respect of acquisitions completed prior to 2011.
Future anticipated payments to vendors in respect of contingent consideration (earnout agreements) are initially recorded at fair value which is the present value of the expected cash outflows of the obligations. The obligations are dependent on the future financial performance of the interests acquired (typically over a four- to five-year period following the year of acquisition) and assume the operating companies improve profits in line with directors’ estimates. The directors derive their estimates from internal business plans together with financial due diligence performed in connection with the acquisition. Subsequent adjustments to the fair value are recorded in the consolidated income statement within revaluation of financial instruments. For acquisitions completed prior to 1 January 2010, such adjustments are recorded in the consolidated balance sheet within goodwill. A summary of earnout related obligations included in creditors is shown in note 19 to the Consolidated Financial Statements.
WPP has also entered into option agreements that allow the Group’s equity partners to require the Group to purchase the non-controlling interest. These agreements are treated as derivatives over equity instruments and are recorded in the consolidated balance sheet at fair value and the valuation is remeasured at each period end. Fair value is based on the present value of expected cash outflows and the movement in the fair value is recognised as income or expense within revaluation of financial instruments in the consolidated income statement.
Actual performance may differ from the assumptions used resulting in amounts ultimately paid out with respect to these earnout and option agreements at more or less than the recorded liabilities.
Revenue recognition
Advertising and Media Investment Management revenue is typically derived from commissions on media placements and fees for advertising services. Revenue may consist of various arrangements involving commissions, fees, incentive-based revenue or a combination of the three, as agreed upon with each client.
33
Revenue is recognised when the service is performed, in accordance with the terms of the contractual arrangement. Incentive-based revenue typically comprises both quantitative and qualitative elements; on the element related to quantitative targets, revenue is recognised when the quantitative targets have been achieved; on the element related to qualitative targets, revenue is recognised when the incentive is received or receivable.
The Group receives volume rebates from certain suppliers for transactions entered into on behalf of clients that, based on the terms of the relevant contracts and local law, are either remitted to clients or retained by the Group. If amounts are passed on to clients they are recorded as liabilities until settled or, if retained by the Group, are recorded as revenue when earned.
In applying the proportional performance method of revenue recognition for both market research and other long-term contracts, management is required to make significant judgements, estimates and assumptions. In assessing contract performance, both input and output criteria are reviewed. Costs incurred are used as an objective input measure of performance. The primary input of all work performed under these arrangements is labour. As a result of the relationship between labour and cost, there is normally a direct relationship between costs incurred and the proportion of the contract performed to date. Costs incurred as a proportion of expected total costs is used as an initial proportional performance measure. The indicative proportional performance measure is subsequently validated against other more subjective criteria (i.e. relevant output measures) such as the percentage of interviews completed, percentage of reports delivered to a client and the achievement of any project milestones stipulated in the contract. In the event of divergence between the objective and more subjective measures, the more subjective measures takes precedence since these are output measures.
Since project costs can vary from initial estimates, the reliance on total project cost estimate represents an uncertainty inherent in the revenue recognition process. Individual project budgets are reviewed regularly with project leaders to ensure that cost estimates are based upon up to date and as accurate information as possible, and take into account any relevant historic performance experience. Also, the majority of contracted services subject to proportional performance method revenue recognition are in relation to short term projects, averaging approximately 3 months. Due to this close and frequent monitoring of budgeted costs and the preponderance of short term projects, the impact of variances between actual and budgeted project costs has historically been minimal. The Company does not believe that the effect of these uncertainties, taken as a whole, will significantly impact their results of operations in the future.
Pension costs
Pension costs are assessed in accordance with the advice of local independent qualified actuaries. The latest full actuarial valuations for the various plans were carried out at various dates in the last three years. These valuations have been updated by the local actuaries to 31 December 2012.
The Group’s policy is to close existing defined benefit plans to new members. This has been implemented across a significant number of pension plans. As a result, these plans generally have an ageing membership population. In accordance with IAS 19, the actuarial calculations have been carried out using the projected unit credit method. In these circumstances, use of this method implies that the contribution rate implicit in the current service cost will increase in future years.
The Group’s pension deficit was £334.3 million at 31 December 2012, compared to £280.8 million at 31 December 2011. The increase in the deficit is primarily due to lower discount rates. These factors are partially offset by actions taken by WPP to curtail and settle plans.
There are a number of areas in the pension accounting that involve judgements made by management. These include establishing the long-term expected rates of investment return on pension assets, mortality assumptions, discount rates, inflation, rate of increase in pensions, in payment and salary increases.
34
Most of the Group’s pension plan assets are held by its plans in the UK and North America. In the UK, the forecasted weighted average return on assets decreased to 4.3% at 31 December 2012 from 4.6% at 31 December 2011, and in North America, the forecasted weighted average return decreased to 5.3% from 5.9%, broadly in line with the yields available in both markets. Management reviews the expected long-term rates of return on an annual basis and revises them as appropriate.
Management periodically commission detailed asset and liability studies performed by third-party professional investment advisors and actuaries that generate probability-adjusted expected future returns on those assets. These studies also project the estimated future pension payments and evaluate the efficiency of the allocation of the pension plan assets into various investment categories.
At 31 December 2012, the life expectancies underlying the value of the accrued liabilities for the main defined benefit pension plans operated by the Group were as follows:
| | | | | | | | | | | | | | | | | | | | |
| Years life expectancy after age 65 | | All
Plans | | | North
America | | | UK | | | Western
Continental Europe | | | Other1 | |
Current pensioners – male | | | 21.9 | | | | 20.4 | | | | 24.4 | | | | 20.5 | | | | 19.3 | |
Current pensioners – female | | | 23.9 | | | | 22.6 | | | | 25.6 | | | | 23.6 | | | | 24.7 | |
Future pensioners (current age 45) – male | | | 24.1 | | | | 22.5 | | | | 26.5 | | | | 23.0 | | | | 19.3 | |
Future pensioners (current age 45) – female | | | 26.0 | | | | 24.5 | | | | 27.9 | | | | 25.6 | | | | 24.7 | |
1 Includes Asia Pacific, Latin America, Africa & Middle East and Central & Eastern Europe. | |
In the determination of mortality assumptions, management uses the most up-to-date mortality tables available in each country.
For a 0.25% increase or decrease in the discount rate at 31 December 2012, the effect on the year-end 2012 plan liabilities would be a decrease or increase, respectively, of approximately £34 million.
Taxation
Corporate taxes are payable on taxable profits at current rates. The tax expense represents the sum of the tax currently payable and deferred tax.
The Group is subject to corporate taxes in a number of different jurisdictions and judgement is required in determining the appropriate provision for transactions where the ultimate tax determination is uncertain. In such circumstances, the Group recognises liabilities for anticipated taxes based on the best information available and where the anticipated liability is both probable and estimable. Such liabilities are classified as current when the Group expects to settle the liability within 12 months and the remainder as non-current. Any interest and penalties accrued are included in income taxes both in the consolidated income statement and balance sheet. Where the final outcome of such matters differs from the amount recorded, any differences may impact the income tax and deferred tax provisions in the period in which the final determination is made.
We record deferred tax assets and liabilities using tax rates that are expected to apply in the period when the liability is settled or the asset is realised based on enacted, or substantively enacted legislation, for the effect of temporary differences between book and tax bases of assets and liabilities. Currently we have deferred tax assets resulting from operating loss carryforwards and deductible temporary differences, all of which could reduce taxable income in the future. Based on available evidence, both positive and negative, we determine whether it is
35
probable that all or a portion of the deferred tax assets will be realised. The main factors that we consider include:
| | • | | future earnings potential determined through the use of internal forecasts; |
| | • | | cumulative losses in recent years; |
| | • | | the various jurisdictions in which the potential deferred tax assets arise; |
| | • | | history of loss carryforwards and other tax assets expiring; |
| | • | | the timing of future reversal of taxable temporary differences; |
| | • | | the expiry period associated with the deferred tax assets; and |
| | • | | the nature of the income that can be used to realise the deferred tax asset. |
If it is our belief that it is probable that some portion of these assets will not be realised, then no asset is recognised in relation to the portion not considered to be realisable. At 31 December 2012 no deferred tax asset has been recognised in respect of gross tax losses and other temporary differences of £4,043.0 million.
If market conditions improve and future results of operations exceed our current expectations, our existing recognised deferred tax assets may be adjusted, resulting in future tax benefits. Alternatively, if market conditions deteriorate further or future results of operations are less than expected, future assessments may result in a determination that some or all of the deferred tax assets are not realisable. As a result, we may need to reverse all or a portion of the deferred tax assets, which may have a significant effect on our results of operations and financial condition.
New IFRS Accounting Pronouncements
See page F-7 of the consolidated financial statements for a description of new IFRS accounting pronouncements.
36
ITEM 6. DIRECTORS, SENIOR MANAGEMENT AND EMPLOYEES
A. Directors and Senior Management
The directors and executive officers of the Company are as follows:
Philip Lader, age 67: Non-executive chairman. Philip Lader was appointed chairman of WPP in 2001. The US Ambassador to the Court of St James’s from 1997 to 2001, he previously served in several senior executive roles in the US government, including as a member of the President’s Cabinet and as White House Deputy Chief of Staff. Before entering government service, he was executive vice president of the company managing the late Sir James Goldsmith’s US holdings and president of both a prominent American real estate company and universities in the US and Australia. A lawyer, he is also a senior advisor to Morgan Stanley, a director of Marathon Oil, Rusal and AES Corporations, a trustee of the Smithsonian Museum of American History and the Atlantic Council and a member of the Council on Foreign Relations.
Sir Martin Sorrell, age 68: Chief executive. Sir Martin Sorrell joined WPP in 1986 as a director, becoming Group chief executive in the same year. He is a non-executive director of Formula One and Alcoa Inc.
Paul Richardson, age 55: Finance director. Paul Richardson became Group finance director of WPP in 1996 after four years with the Company as director of treasury. He is responsible for the Group’s worldwide functions in finance, information technology, procurement, property, treasury, taxation, internal audit and sustainability. He is a chartered accountant and fellow of the Association of Corporate Treasurers. He is a non-executive director of CEVA Group plc, Chime Communications PLC and STW Communications Group Limited in Australia, the last two being companies associated with the Group.
Mark Read, age 46: Strategy director and CEO, WPP Digital. Mark Read was appointed a director in March 2005. He has been WPP’s director of strategy since 2002 and is also chief executive of WPP Digital. He is a member of the Supervisory Board of HighCo and a director of CHI&Partners. He worked at WPP between 1989 and 1995 in both parent company and operating company roles. Prior to rejoining WPP in 2002, he was a principal at the consultancy firm of Booz-Allen & Hamilton and founded and developed the company WebRewards in the UK. He is a trustee of the Natural History Museum Development Trust.
Colin Day, age 58: Non-executive director. Colin Day was appointed a non-executive director of WPP in July 2005. He is the Chief Executive of Filtrona plc and a non-executive director of Amec. He was the group finance director of Reckitt Benckiser plc until April 2011, having been appointed to its board in September 2000. Previously he has been group finance director of Aegis Group plc and held a number of senior finance positions with the ABB Group plc and De La Rue Group plc. He was a non-executive director of Vero Group plc until 1998, Bell Group plc until 2004, Imperial Tobacco plc until February 2007, easyJet plc until September 2005 and Cadbury plc until 2010.
Esther Dyson, age 61: Non-executive director. Esther Dyson was appointed a director of WPP in 1999. In 2004, she sold her business, EDventure Holdings, to CNET Networks, the US-based interactive media company now owned by CBS. She left CNET at the end of 2006 and now operates as an independent investor and writer, again under the name EDventure. She has been highly influential for the past 30 years on the basis of her insights into online/information technology markets and their commercial/social impact worldwide, including the emerging markets of Central & Eastern Europe, Asia and Africa. An active investor as well as an analyst/observer, she participated in the sale of Flickr to Yahoo!, of Medstory and Powerset to Microsoft, and of Vizu to Nielsen, among others. She sits on the boards of Russia’s leading search company Yandex (YNDX), and also of non-listed start-ups including 23andMe, Eventful.com, Meetup, NewspaperDirect (Canada), Voxiva (US) and XCOR Aerospace (US). Her current investments include Evernote, Gridpoint, LinkedIn, Nomanini, Omada Health, Space Adventures and Square. She is also active in public affairs and was founding chairman of ICANN, the domain name policy agency, from 1998 to 2000. She currently sits on the board of the Sunlight Foundation, which advocates transparency in government, and writes a monthly column for Project Syndicate (http://www.project-syndicate.org/contributor/esther-dyson) which is distributed worldwide.
37
Orit Gadiesh, age 62: Non-executive director. Orit Gadiesh was appointed a director in April 2004. She is chairman of Bain & Company Inc., and a world-renowned expert on management and corporate strategy. She holds an MBA from Harvard Business School, was a Baker Scholar and was also presented the Brown Award. Ms. Gadiesh is a member of the Foundation Board for the World Economic Forum as well as a member of the International Business Council of the World Economic Forum. She is on the Board of Directors of The Peres Institute for Peace, sits on the International Advisory Board of The Atlantic Council of the United States, and the Advisory Board for the British-American Business Council, as well as an Advisory Board member at the China Europe International Business School (CEIBS). She is the Chairman of the International Business Leaders’ Advisory Council for the Mayor of Shanghai (IBLAC) and sits on the International Advisory Board at HEC School of Management in France.
Ruigang Li, age 43: Non-executive director. Ruigang Li was appointed a director of WPP in October 2010. He is Founding Chairman of China Media Capital (CMC), China’s first sovereign private equity fund dedicated to Media and Entertainment sector investment. Through Li’s chairmanship, CMC’s most important investments include controlling stake acquisition of News Corporation’s China assets, a joint venture with DreamWorks Animation, a joint venture with world-leading Chinese language TV content provider and broadcaster TVB, China’s largest TV shopping company OCJ, all of groundbreaking industrial significance in China and beyond. Li was CEO of SMG (Shanghai Media Group) for 10 years while he grew SMG into China’s leading media conglomerate with the most diversified media assets of national reach.
Stanley (Bud) Morten, age 69: Non-executive director. Bud Morten was appointed a director in 1991. He is a consultant and private investor. From 2003 to 2009 he was the Independent Consultant to Citigroup/Smith Barney with responsibility for its independent research requirements. Previously, he was the chief operating officer of Punk, Ziegel & Co., a New York investment banking firm with a focus on the healthcare and technology industries. Before that he was the managing director of the equity division of Wertheim Schroder & Co., Inc., in New York. He is a former non-executive director of Register.com, which was sold to a private equity firm in November 2005, and of The Motley Fool, Inc. He is also a non-executive director of Darien Rowayton Bank, a private company.
Koichiro Naganuma, age 68: Non-executive director. Koichiro Naganuma was appointed a director in February 2004. He is chairman of the Board of Asatsu-DK Inc., also known as ADK. He is also vice chairman of the Japan Advertising Association and chairman of the Japan Advertising Industry Pension Fund. Joining ADK in 1981, he was president and Group CEO from 1991-2010. ADK is Japan’s third largest advertising and communications company, and 15th largest in the world.
John Quelch, age 61: Non-executive director. John Quelch was appointed a director of WPP in 1988. He is the Charles Edward Wilson Professor of Business Administration at Harvard Business School and Professor in Health Policy and Management at Harvard School of Public Health. He also serves as the Honorary Consul General of the Kingdom of Morocco for New England. Between 2011 and 2013 he served as Dean, Vice President and Distinguished Professor of International Management at China Europe International Business School in Shanghai. Between 2001 and 2011 he was the Lincoln Filene Professor of Business Administration and Senior Associate Dean at Harvard Business School. Between 1998 and 2001 he was Dean of the London Business School. Between 2002 and 2011 he served as chairman of Massachusetts Port Authority and as Honorary Chairman of the British American Business Council of New England. Professor Quelch’s writings focus on global business practice in emerging as well as developed markets, international marketing and the role of the multinational corporation and the nation state. He is a non-executive director of Alere, Inc and a member of the Trilateral Commission and the Council on Foreign Relations. He served previously on the boards of Blue Circle Industries plc, easyJet plc, Pentland Group plc, Pepsi Bottling Group and Reebok International Limited. In the 2011 Honours List, he was awarded a CBE for services to the promotion of British business.
Jeffrey A. Rosen, age 65: Non-executive director. Jeffrey Rosen was appointed a director of WPP in December 2004. He is a deputy chairman and managing director of Lazard with over 40 years’ experience in international
38
investment banking and corporate finance. He is a member of the Council on Foreign Relations and is President of the Board of Trustees of the International Center of Photography in New York.
Timothy A. Shriver, age 53: Non-executive director. Tim Shriver was appointed a director of WPP in August 2007. He is a social leader, educator, activist, film producer and business entrepreneur. As Chairman and CEO of Special Olympics, he serves nearly four million Special Olympic athletes in 180 countries all working to promote health, education, and unity through the joy of sports. Before joining Special Olympics in 1995, he was (and remains) a leading educator focusing on the social and emotional factors in learning. He co-founded and currently chairs the Collaborative for Academic, Social and Emotional Learning (CASEL), the leading research organisation in the field of social and emotional learning. He is a member of the Council on Foreign Relations. He chairs the board of Lovin’ Scoopful a cause-related consumer products brand specializing in ice cream that ‘loves you as much as you love it’.
Paul Spencer, age 63: Non-executive director. Paul Spencer was appointed a director of WPP in April 2004. He is a financier with 20 years’ experience in the financial management of a number of blue-chip companies, including British Leyland plc, Rolls-Royce plc, Hanson plc and Royal & Sun Alliance plc. He has held a number of non-executive directorships including until 2009 Chairman of NS&I (National Savings and Investments). He is the Independent Trustee of BT, BA and Rolls-Royce Group pension funds. He is Chairman of Hermes Asset Managers Ltd. In the 2010 Honours List he was awarded a CBE for services to the financial services industry. Paul is a governor of Motability, a UK charity for the disabled.
Sol Trujillo, age 61: Non-executive director. Sol Trujillo was appointed a director of WPP in October 2010. He is an international business executive with three decades’ experience as CEO of large market cap global companies in the US, the EU and Asia Pacific, including US West (now CenturyLink), Orange (now France Telecom) and Telstra, the Australian communications company. A digital pioneer operating in the telecommunications, technology, and media space, he has been a long-time champion of high-speed broadband and a pioneer and innovator of smartphone and the mobile internet to stimulate productivity and innovation across all sectors of the economy. He has managed operations in more than 25 countries – including developed and emerging markets from the EU and North America to China, South Asia, Africa and the Middle East. He currently sits on corporate boards in the US, EU and China – including Target, Western Union and ProAmerica Bank in the US and in Asia, Silk Road Technologies in China, where he is Board chairman. In the public sector, Mr Trujillo served as trade policy advisor to the Clinton and Bush administrations and remains active on public policy issues related to immigration, trade, productivity and fiscal affairs.
The board of directors has determined that all of the non-executive directors are independent under NASDAQ Rule 5605(a)(2).
B. Compensation
Review of compensation
The outcome of the 2012 Annual General Meeting (AGM) vote on the Compensation Committee Report was disappointing for the members of the Committee and the Board. The vote indicated that the changes which were made to the CEO’s compensation in 2011, and our engagement on these changes with share owners and representative bodies, fell short of the expectations of a majority of them.
Therefore, following the 2012 AGM, the chairman of the Company and the chairman of the Compensation Committee began a series of meetings with share owners and representative bodies to listen to their issues and concerns so that the committee could formulate proposals to address them.
The dialogue with share owners has been extensive; the Compensation Committee has engaged with the largest share owners and the representative bodies numerous times. Their input and approach have been very helpful and constructive. In formulating changes which the committee has made to remuneration policy in general, the CEO remuneration package, and the design of a long-term incentive plan.
39
Details of these changes are set out later in this report. Among the key changes which have been made or which are proposed are the following:
| | • | | the CEO’s remuneration package has been reduced through adjustments to base salary, pension allowance and short- and long-term incentive opportunity; |
| | • | | the short-term incentive plan for executive directors has been restructured, where appropriate, to emphasise Group financial performance; |
| | • | | a new long-term incentive plan (LTIP) is being proposed to share owners for approval at the AGM. As before, it is based on a five-year performance and vesting period, but performance will be assessed against: three measures – relative TSR; earnings per share growth; and average return on equity, rather than relative TSR alone; and |
| | • | | outcomes for the four Leadership Equity Acquisition Plan (LEAP) awards that vest in each of 2014-2017 will be measured on a common currency basis only, with no application of a fairness review to take account of currency movements during the five-year performance periods. For the new LTIP, the TSR outcome will be measured half in common currency, half in local currency, to reflect the division of opinion amongst share owners as to the appropriate measure. |
The changes to the Executive Remuneration Policy and the proposed LTIP were framed against the background of WPP’s significant growth in size, complexity, and share owner value since 2007, and its strong relative TSR performance against its comparators since that date. They were also structured to be consistent with WPP’s overall philosophy of executive compensation: that it should be substantially oriented towards performance-based compensation; that a substantial proportion of that compensation should require long performance periods; and that it should be consistent with, and, indeed, reinforce, the Group’s strategy.
The CEO’s remuneration opportunity is now consistent with the lower levels which prevailed in the 2007-2010 period, 2007 being the last year prior to 2011 in which changes to his remuneration opportunity were implemented. This reduction in no way reflects the committee’s or the Board’s view of the importance of the CEO to the Company and its success and his unique mix of skills, and for which numerous share owners have expressed their appreciation. Nevertheless, the changes made were designed to be responsive to an environment in which moderation of executive compensation is considered necessary and appropriate.
The Group performed at record levels in 2012 in what proved to be a very challenging general economic environment. Because of equally challenging performance criteria, short-term incentive payments were at or just above target levels.
For the five years to year-end 2012, WPP’s TSR performed strongly relative to its comparators. As a result, the five-year LEAP awards which were granted in 2008 vested at a level equivalent to 86% of the maximum payout, measured on a common currency basis. This result reflects the strong underlying performance of the Company and the focus on share owner value, created by the management team which steered the Group to success over these five-years. The committee is supportive of the UK Department for Business, Innovation & Skills drive to improve the transparency and clarity in the reporting of directors’ remuneration. To that end, the Compensation Committee has voluntarily incorporated many of the proposed changes contained in the draft regulations into the report this year.
What we have changed
The changes that have been made as a result of the Compensation Committee’s consultation with share owners are described below in summary and in more detail later in this report.
40
CEO remuneration
While share owners recognised the increased scale and complexity of WPP since the previous compensation changes in 2007, the global nature of the group and the exceptional performance and leadership of the CEO, share owners nonetheless advised the Company that they believed the CEO’s 2011 remuneration package was too high relative to the UK market. Informed by extensive consultation with many of our major share owners, significant reductions have therefore been made to the CEO’s remuneration package.
For 2012, the CEO’s short- and long-term incentive opportunities were both substantially reduced. Target short-term incentive opportunity reduced from £3.2 million to £2.5 million with a corresponding reduction in the maximum opportunity from £6.5 million to £5.0 million. This reduction was effective 1 January 2012. The maximum long-term incentive opportunity was also reduced by over 23% in 2012.
For 2013, further reductions to the package have been implemented. Base salary has been reduced to £1.15 million (from £1.3 million) and the pension contribution has reduced from 45% of base salary and fees to 40%. Overall, the impact of the changes is a reduction in the CEO’s target pay to result in it being at a level similar to that received from 2007 to 2010.
| | | | | | | | |
| | | | | | | | | |
| | | 2012 | | | 2013 | |
Change in CEO total target pay versus 2011 | | | -20% | | | | -34% | |
Short-term incentive
The structure of the short-term incentive opportunities for the executive directors has remained stable over many years. However, as part of the overall review of the Executive Remuneration Policy, it was considered that there was an opportunity to update the short-term incentive arrangements and strengthen the link between payouts and the performance of the Company. With effect from 2012, the performance of the executives has been assessed relative to a scorecard, 70% of which is linked to WPP financial performance and 30% based on personal strategic goals. Previously, performance was based equally on financial performance, financial performance relative to our competitors and personal goals.
New 2013 long-term incentive plan
LEAP was one of a number of innovative co-investment plans which have served the Company well since the introduction of the first co-investment plan in 1994. The final awards under LEAP III were made in 2012. As a result, a new plan is being recommended to share owners for approval at the AGM in June 2013. This plan adopts a simpler structure while retaining some of the key features of LEAP such as a five-year performance period, ‘clawback’ and pro-ration of awards for early leavers.
Three independent measures will be used to assess performance over each five-year period: relative TSR against an industry peer group; earnings per share (EPS) growth; and average return on equity (ROE). These measures aim to capture and reward stretching performance in growth, capital efficiency and returns to share owners. Threshold vesting will reduce from 30% to 20% of an award.
These proposed changes in plan design accord with much of the feedback received from share owners during the extensive consultation process.
As the Company is moving from a co-investment plan structure to a more standard performance share plan design, Share Ownership Guidelines are also being introduced. These share ownership requirements will be amongst the highest in the UK.
41
How we have performed
Relative TSR Rebased to 31 December 20071
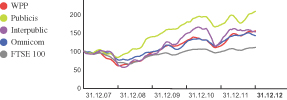
| | 1 | | Measured on a common currency basis with a rolling three-month averaging period against our primary competitors and the FTSE 100 (the broad market equity index of which WPP is a constituent). Source: DataStream. | |
How much the executive directors earned in 2012
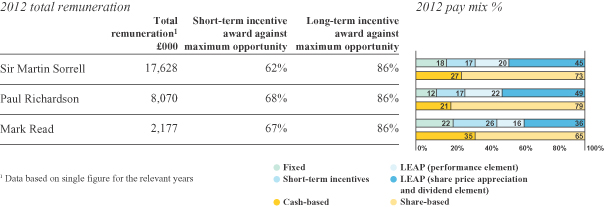
2012 share owner engagement and changes to compensation
Following the 2012 AGM where share owners’ concerns were demonstrated by the low level of support for the Compensation Committee Report, the committee undertook a review of many aspects of the Executive Remuneration Policy, as detailed on page 39. While the changes have been discussed elsewhere, it is also important to set out how the Company dealt with another aspect of share owners’ concerns, namely how the Company engaged with share owners to address this feedback on the Executive Remuneration Policy.
During the summer, the chairmen of both the Company and the Compensation Committee met with WPP’s largest share owners (reflecting in excess of 40% of the Company’s issued share capital) and prominent institutional investor advisory bodies. The objective of these meetings was to solicit feedback generally, in order to understand share owner concerns and opinions before formulating new proposals.
These meetings provided the committee with constructive feedback with respect to its own processes, as well as the structure and level of compensation for executive directors. Building on this feedback, the committee undertook extensive discussions throughout the formulation of its recommendations for the structures and levels of compensation for executive directors in 2013.
42
Between late September and November 2012, the committee presented these proposals to share owners for discussion, with a view to incorporating feedback into the process of fine-tuning many aspects of the Executive Remuneration Policy. In January to March 2013, the committee reverted to share owners to discuss the final proposals as disclosed in this Compensation Committee Report. Following these rounds of consultation, the aggregate changes to the CEO’s remuneration amounted to a reduction in the target package of 34% when compared to 2011.
While the final arrangements detailed on page 41 will not meet every share owner’s individual preferences or views on what is best for the Company, the committee has sought to balance the broad range of views expressed by share owners with the needs of the business. The committee believes that the changes to the Executive Remuneration Policy are in the best collective interests of the share owners of WPP while reinforcing the alignment with business strategy, and that they will continue to incentivise, motivate and reward the executive directors for truly exceptional performance.
How to use this report
This year’s Compensation Committee Report is split into two main sections, as envisaged by the UK Department for Business Innovation & Skills’ proposals.
Within this report, colour is used to denote different elements of remuneration as follows:
Looking forward
This first section of the Compensation Committee Report, entitledLooking forward, contains details of the Company’s Executive Remuneration Policy that will govern the Company’s intentions as regards future payments.
Policy table
The Company’s mission statement and six business objectives shape the Executive Remuneration Policy. Broadly, this Policy is determined by three guiding principles:
| | • | | performance driven reward; |
| | • | | alignment with share owner interests. |
Specifically, the six business objectives (as set out on page 16) are reflected in the design of the compensation plans as set out below:
| | |
| WPP’s six business objectives | | Alignment with compensation structure |
| Continue to improve operating margins | | Short-term incentive measure for the CEO and CFO |
| Increase flexibility in the cost structure | | Short-term incentive measure for the CFO |
| Use free cash flow to enhance share owner value and improve return on capital | | Total share owner return and average ROE are long-term incentive measures for the executive directors |
| Continue to develop the value added by the parent company | | Short-term incentive measures (parent company-led efficiency projects) for the CEO and CFO |
| Emphasise revenue growth more as margins improve | | Short-term incentive measure for the CEO and CFO (Group) and CEO Digital (Digital) |
| Improve still further the creative capabilities and reputation of all the businesses | | Short-term incentive measure for the CEO |
43
The executive remuneration policy is designed to drive and reward exceptional performance producing long-term value for share owners. In applying this policy, the committee takes into account the pay and conditions elsewhere in the Group, which in turn are informed by general market conditions and internal factors such as the performance of the Group or relevant business unit.
Executive directors
| | | | |
| | | Operation | | Changes for 2013 |
| Fixed elements | | | | |
Base salary and fees To maintain package competitiveness and reflect skills and experience. | | Base salary levels are determined by taking a number of relevant factors into account, including individual and business performance, level of experience, scope of responsibility and the competitiveness of total remuneration against competitors, and companies of a similar size and complexity. Base salaries are reviewed every two years or following a significant change in the scope of a role. | | The salaries of Paul Richardson and Mark Read, last reviewed on 1 January 2011, will be reviewed in 2013. Sir Martin Sorrell’s base salary was reduced to £1.15 million with effect from 1 January 2013. This will next be subject to review in 2015. |
Benefits To enable the executive to undertake their role by ensuring their wellbeing and security. | | Benefits provided to executive directors include car allowance, healthcare, life insurance, long-term disability insurance, plus spousal travel together with amounts in respect of tax liabilities incurred on expenditure considered to be essential to the delivery of the executive’s role, housing allowances and club membership which are required for business purposes. Housing allowances are paid where the executive is required to spend considerable time working away from their primary place of business or temporarily where an executive has moved location. | | None |
Pension To enable provision for personal and dependant retirement benefits. | | Pension is provided by way of defined contributions or a cash allowance determined as a percentage of base salary. The pension contribution is 40% of salary for the CEO, 30% of salary for the CFO and 10% for the CEO WPP Digital. | | The pension contributions for Paul Richardson and Mark Read will be reviewed, but not necessarily amended, as part of the remuneration review that will take place in 2013. |
| Short-term incentives | | | | |
| To drive the achievement of business priorities for the financial year and to motivate, retain and reward executives over a medium term, while aligning with interests of share owners. | | Cash Bonus and Executive Share Awards (ESA) Executive directors’ short-term incentive opportunity is delivered in the form of a cash bonus and a deferred share award (ESA), the latter constituting at least 50% of the total bonus achieved. The ESA will vest after a minimum of two years subject to continued employment, together with additional shares in respect of accrued dividends. ESAs are subject to clawback during the vesting period. Performance measures and targets are reviewed and set annually to ensure continuing strategic alignment. Achievement levels are determined following year-end by the Compensation Committee, based on performance against targets. Opportunity: Total bonus opportunity - minimum, target and maximum (as a % of base salary and fees) | | None |
| | | | | | | | | | |
| | | Min | | Target | | | Max | |
Sir Martin Sorrell | | 0% | | | 217.5 | % | | | 435 | % |
Paul Richardson | | 0% | | | 200 | % | | | 300 | % |
Mark Read | | 0% | | | 134 | % | | | 200 | % |
| | | | |
| | | Performance conditions: 70% subject to financial performance, either at a Group or divisional level depending on the role. 30% subject to personal objectives linked to the strategy of WPP or the relevant business area. | | |
44
| | | | |
| | | Operation | | Changes for 2013 |
| Long-term incentives (proposed) | | |
| To incentivise long-term performance and to focus on long-term retention and strategic priorities, while maximising alignment with share owner interests. | | Executive Performance Share Plan Executives may receive an annual award of conditional shares. The Compensation Committee has the authority to make awards. The Compensation Committee will retain discretion to adjust the levels of vesting if it considers that, as a result of an exceptional event or exceptional circumstances, it is materially easier or harder for WPP to achieve a performance measure. The committee will not make adjustments based on currency fluctuations. Clawback applies to unvested awards. Proposed award levels in 2013 (as a multiple of base salary and fees): Sir Martin Sorrell = 9.74 Paul Richardson = 4.00 Mark Read = 2.00 Plan maximum: 9.75 times base salary and fees Performance measures (measured over a five-year period): 33% relative TSR (50% common and 50% local currency) 33% EPS growth 33% average ROE All measures are independent of each other. Vesting schedule: Threshold = 20%/Maximum = 100% (straight-line vesting between threshold and maximum) | | Subject to approval at the 2013 AGM, awards will be made to the executive directors and other senior management in 2013. |
| Long-term incentives (legacy awards) | | |
| | | LEAP III (no further grants to be made) Executives were invited to participate in the plan annually by the Compensation Committee. Individuals must have invested in WPP shares and committed to hold them for the five-year performance period. Investment levels were determined by the committee, subject to an overall maximum. A final number of matching shares, together with dividends that would have accrued on the matching shares, will be awarded, proportionate to the investment, dependent on the performance of WPP. Clawback applies to unvested awards. The Plan was terminated at 31 December 2012. Award level: Select employees were invited to commit investments in WPP shares at the discretion of the Compensation Committee, subject to an overall maximum of one-times the individual’s total target earnings. The maximum award is equivalent to five-times an individual’s investment. Performance conditions: 100% relative TSR (common currency) performance against a customised group of WPP’s peers, weighted by market capitalisation measured over five years. Following the end of the performance period, the Compensation Committee undertakes a ‘fairness review’ to determine whether any exceptional events have impacted the outcome and that the resulting match is in line with financial performance relative to the comparator group and the underlying financial performance of the Group. Vesting schedule: Threshold = 30% / Maximum = 100% (straight-line vesting between threshold and maximum) | | For the four outstanding LEAP awards, TSR will be measured using a common currency, with vesting levels subject to a fairness review that will not consider adjustments driven by currency movements. |
45
| | | | |
| | | Operation | | Changes for 2013 |
| Long-term incentives (legacy awards) (continued) | | |
| | | Deferred awards The Company has previously received share owner approval to permit the CEO to defer the receipt of several of his share awards. These include the UK and US Deferred Stock Units Awards Agreements (which are the agreements that now comprise the awards granted under the Capital Investment Plan in 1995), In accordance with share owner approval, Sir Martin Sorrell receives dividend equivalent payments (DEPs) in respect of these two awards. In addition, Sir Martin Sorrell has deferred receipt of his UK and US 2004, 2005 and 2007 LEAP awards and the UK part of his 2006 LEAP award. The UK awards are options that can be exercised at any time until November 2017. The US awards will vest on the earlier of the end of his employment with the Company and 30 November 2017. Sir Martin has also received share owner approval to jointly elect (with the Company) to defer receipt of his UK and US 2009 LEAP awards. | | None |
| | | Outstanding options Mark Read was granted two tranches of options under the Executive Stock Option Plan prior to his appointment as a director. These options are fully exercisable and are detailed in Item 6E. | | None |
Chairman and non-executive directors
| | | | | | |
| | | Operation | | | | Changes for 2013 |
| Fixed elements | | | | | | |
Fees To reflect the skills, experience and time required to undertake the role. | | Fees are reviewed every two years and take into account the skills, experience and time required to undertake the role, as well as fee levels in similarly-sized UK companies. The chairman of the Company advised the Compensation Committee that, while entitled, his fee should not be reviewed in 2012. The review of the fees of all non-executive directors was deferred and will take place in 2013. An aggregate fee is paid to the chairman with non-executive directors receiving a Board fee and then additional fees, as appropriate, for serving on the Audit, Compensation, and Nomination and Governance Committees. The committee retains the discretion to pay consultancy fees to any non-executive director whose work falls outside the remit of their role (any such payments are detailed on page 53). In addition, former non-executive directors may be retained by the Company to provide consulting services or advice to the Group. | | Subject to review in 2013 |
| | Current fee level (£000) | | | | |
| | Chairman | | 425 | | |
| | Senior independent director | | 20 | | |
| | Non-executive director | | 65 | | |
| | Chairmanship of Audit or Compensation Committee | | 40 | | |
| | Chairmanship of Nomination and Governance Committee | | 15 | | |
| | Member of Audit or Compensation Committee | | 20 | | |
| | Member of Nomination and Governance Committee | | 5 | | |
Benefits To enable the chairman and non-executive directors to undertake their roles. | | Individuals who are required to travel outside of their home country to consider Company-related matters at meetings called at short notice will be paid £1,000 for attendance at each of those meetings. | | None |
Other policies | | | | | | |
| | | Operation | | | | Changes for 2013 |
Share ownership guidelines To align the interests of executives with those of share owners. | | CEO - 600% of base salary and fees CFO - 300% of base salary and fees CEO WPP Digital - 200% of base salary and fees Executive directors will be permitted a period of seven years from date of appointment to achieve the guideline level. | | With effect from 1 January 2013 |
46
How do these policies affect potential compensation packages?
These graphs seek to demonstrate how pay varies with performance. Given the significant reduction to Sir Martin Sorrell’s compensation package from 1 January 2013, the committee considered it helpful to illustrate the impact of this reduction.
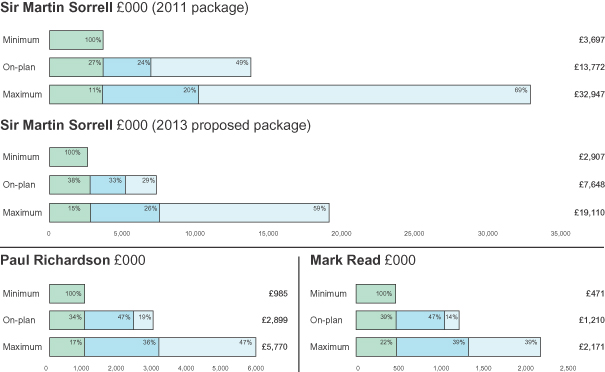
In illustrating the scenario charts above, the following assumptions have been made:
| | | | | | | | | | | | | | | | | | |
Fixed elements | | Consists of base salary & fees, benefits (including DEPs) and pension | |
| | Base salary & fees are as per the policy table for the CEO and the single figure table for the CFO and the CEO WPP Digital | |
| | Benefits and DEPs are as per the single figure table | | | | | | | | | | | | | |
| | Pension is as per the policy table | | | | | | | | | | | | | | | | |
| | | £000 | | Base salary & fees | | | Benefits & dividends | | | Pension | | | Total fixed | |
| | Sir Martin Sorrell (2011 figures) | | | 1,150 (1,306) | | | | 1,297 (1,806) | | | | 460 (585) | | | | 2,907 (3,697) | |
| | Paul Richardson | | | 684 | | | | 96 | | | | 205 | | | | 985 | |
| | | Mark Read | | | 425 | | | | 3 | | | | 43 | | | | 471 | |
Short-term
incentives | | On-plan scenario assumes target bonus is paid for achievement of performance measures | |
| | Maximum scenario assumes the full bonus is paid for achieving stretch performance measures | |
Long-term
incentives | | On-plan scenario assumes threshold vesting of 20% of the award (2011: 30%) | |
| | Maximum scenario assumes vesting of 100% of the award | |
47
Looking back
This second section of the Compensation Committee’s Report, entitledLooking back, contains details of how the Company’s Executive Remuneration Policy was implemented in 2012.
Fixed elements of remuneration
Base salary and fees
| | | | | | | | |
| | | Contractual salary and fees 000 | | Effective date | | | 2012 Base salary and fees £000 |
Sir Martin Sorrell1 | | £1,300 | | | 1 Jan 2012 | | | 1,300 |
Paul Richardson1 | | $925 and £100 | | | 1 Jan 2011 | | | 684 |
Mark Read | | £425 | | | 1 Jan 2011 | | | 425 |
| 1 | | Any US dollar amounts received in 2012 have been converted into sterling at an exchange rate of $1.5852 to £1. |
Each executive director receives a fee of £100,000 in respect of their directorship of WPP plc, which is included above.
Share owners will be aware that the CEO’s base salary is one aspect of his overall remuneration that has been reduced following consultation. Effective 1 January 2013, his base salary is £1.15 million.
Paul Richardson and Mark Read’s base salaries have remained unchanged since 2011 and therefore both salaries are due to be reviewed. The committee will consider these after the 2013 AGM. While there was no increase in base salary and fees for executive directors in 2012, employees who were subject to a salary review globally received an average increase of approximately 3.5%.
Benefits, dividend equivalent payments and pension
| | | | | | | | | | | | |
| | | | | | | 2012 Benefits £000 | | | 2012 DEPs £000 | |
Sir Martin Sorrell | | | | | | | 356 | | | | 940 | |
Paul Richardson | | | | | | | 96 | | | | — | |
Mark Read | | | | | | | 3 | | | | — | |
The benefits provided to the executive directors include car allowance, healthcare, life assurance, long-term disability allowance, spousal travel costs and housing allowance. The CEO also received club membership and an amount of £7,065 (included above) in respect of tax liabilities incurred by him on expenditure on various items considered by the UK Tax authorities as benefits in kind, but which the committee considers to be essential to his ability to deliver his services successfully to the Group. The table above also includes share owner-approved dividend equivalent payments of £940,480 (£1,339,364 during 2011) which are due on certain of Sir Martin Sorrell’s deferred share awards.
| | | | | | | | |
| | | Contractual pension allowance
(as a % of base salary and fees) | | | 2012 Pension
£000 | |
Sir Martin Sorrell | | | 45% | | | | 586 | |
Paul Richardson | | | 30% | | | | 205 | |
Mark Read | | | 10% | | | | 43 | |
All pension benefits for the executive directors are provided on either a defined contribution or a cash allowance basis. Only the aggregate of base salary and fees is pensionable.
As part of the alterations to the CEO’s remuneration package following share owner consultation, his pension allowance has been reduced to 40% (45%).
Paul Richardson’s and Mark Read’s pension contributions remained unchanged at 30% and 10% respectively. The amounts will be reviewed as part of the committee’s review of these two executive directors’ remuneration structures after the 2013 AGM.
48
Determining variable elements of pay
Short-term incentives
The following tables summarise the measures and performance assessment by the Compensation Committee in respect of 2012.
Short-term incentives are determined based on performance across two areas:
| | |
| Financial objectives (Group or WPP Digital) | | Individual strategic objectives |
70% | | 30% |
| | | | |
Performance against targets |
| |
Group Financial Objectives – Sir Martin Sorrell & Paul Richardson | | |
| Performance measure | | Performance in 2012 | | Overall assessment
against targets |
| | |
Headline PBT | | Headline PBT is calculated on a like-for-like basis and increased by 8.7%, midway between target and a very stretching maximum. | | Target to Maximum |
| | |
Headline PBT margin improvement | | The PBT margin is calculated on a like-for-like basis and increased by 0.7%, more than double the target level. | | Maximum |
| | |
Revenue growth | | Growth was up 2.9% on a like-for-like basis and was in the top tier of that achieved by our key competitors. However, the achievement fell below the stretching threshold requirement set by the committee. | | Below threshold |
| | |
| | | | |
|
WPP Digital Financial Objectives – Mark Read |
| Performance measure | | Performance in 2012 | | Overall assessment
against targets |
| | |
Group Digital Margin Growth | | Group Digital margins performed well but grew less strongly than very stretching targets. | | Below threshold |
| | |
Percentage of Group revenue | | The Group Digital proportion of Group revenue continued to progress and in 2012 increased by 1.2% to in excess of 32%. | | Target to Maximum |
| | |
| | | | |
|
Individual Strategic Objectives |
| | |
Sir Martin Sorrell | | – Succession planning was effectively implemented with a number of key appointments to critical roles across the Group. – Creative reputation was recognised with WPP again winning the overall Holding Company of the Year award at Cannes. – Acquisition strategy was effectively implemented with several acquisitions that strengthened the Group including the leading digital business, AKQA. | | Target to Maximum |
| | |
Paul Richardson | | – Working Capital management was effectively managed with relative year-on-year improvement. – Good progress was made toward goals of improving efficiency and cost effectiveness in IT, Property and Finance. | | Target to Maximum |
| | |
Mark Read | | – Management and growth of WPP Digital continued according to plan with key successes in the assimilation of AKQA into WPP, establishment of Xaxis, the development of the WPP brand in the digital market and the sale of Buddy Media. | | Target to Maximum |
49
Based on the performance set out above, the resulting bonus for each executive relating to 2012 is:
| | | | | | | | | | | | | | | | | | | | |
| | | 2012 actual bonus
(% of base salary and fees) | | 2012 actual bonus delivery1
(% of bonus) | | 2012 Short-term
incentive |
| | | Target | | | Maximum | | | Financial
objectives | | Individual
strategic
objectives | | Total
bonus | | Cash | | ESA | | £0002 |
Sir Martin Sorrell3 | | | 217.5 | % | | | 435 | % | | 181% | | 87% | | 268% | | 50% | | 50% | | 3,078 |
Paul Richardson | | | 200 | % | | | 300 | % | | 130% | | 75% | | 205% | | 50% | | 50% | | 1,401 |
Mark Read | | | 134 | % | | | 200 | % | | 66% | | 68% | | 134% | | 50% | | 50% | | 570 |
| |
| 1 | | To be delivered as 50% deferred shares (ESA) and 50% cash. |
| 2 | | Paul Richardson’s bonus has been converted into sterling at an exchange rate of $1.5852 to £1. |
| 3 | | Sir Martin Sorrell’s 2012 bonus was calculated and is expressed using the reduced salary and fees of £1.15 million, the base salary that became effective 1 January 2013. |
Long-term incentives
Since 1999, WPP’s sole long-term incentive plan for executive directors has been the LEAP. In 1999, an award was granted under Original LEAP, and between 2004 and 2008, annual awards were made under Renewed LEAP. Between 2009 and 2012, annual awards were made under LEAP III. Under all plans, participants were invited to make and retain an investment in WPP shares in order to receive an award of conditional ‘matching’ shares. The ultimate number of matching shares awarded varies between 150% and 500% of the participant’s investment, dependent on the relative TSR performance of WPP against a group of global competitors, measured on a common currency basis over five years.
The comparator group comprises of our most relevant global competitors:
| | |
• Aegis1 | | • Interpublic |
• Arbitron | | • Ipsos |
• Dentsu | | • Nielsen (from 2011) |
• GfK | | • Omnicom |
• Havas | | • Publicis |
| 1 | | Following the acquisition by Dentsu, Aegis will be treated in accordance with the established policy. |
Following the end of the performance period, the committee reviews the outcome and undertakes a ‘fairness review’ to determine whether any exceptional circumstances have occurred during the period that would warrant a discretionary adjustment, either up or down, to the final number of matching shares vesting. For awards made since 2008, no adjustments will be made to take into account relative currency movements. It is an established policy that TSR outcomes should not be impacted by the speculation or actuality of takeovers involving comparator companies (or WPP). The appropriate adjustments (described below with respect to their application to the 2008 awards) will be considered as part of the fairness review.
The vesting of all LEAP III awards is based solely on WPP’s TSR performance, calculated using a common currency, relative to the global comparator group. However, vesting is based on a weighted market capitalisation basis, meaning that the level of reward is more closely tied to performance against WPP’s primary competitors (Omnicom, Publicis and Interpublic).
| | |
| Market Capitalisation Percentile | | Number of matching
shares |
90th and above | | 500% |
80th | | 420% |
70th | | 330% |
60th | | 240% |
50th | | 150% |
Below 50th | | 0% |
50
| | | | | | | | |
| | | Aggregate number
of shares actively
committed to LEAP
at 31 December 2012 | | | Value of investment
at 31 December 20121
(£000) | |
Sir Martin Sorrell | | | 2,143,333 | | | | 19,033 | |
Paul Richardson | | | 491,618 | | | | 4,366 | |
Mark Read | | | 127,988 | | | | 1,137 | |
| 1 | | Share price at 31 December 2012 £8.88. |
2008-2012 LEAP vesting
The awards made in 2008 were the last to be granted under Renewed LEAP. Over the five-year investment and performance period WPP’s TSR was 44.7% (i.e. a shareholding of £100 at the start of the period would be worth £144.70 at the end, including reinvested dividends).
In undertaking the fairness review, the committee identified one event during the period that was deemed to be ‘exceptional’. In July 2012, Dentsu made an offer to acquire Aegis, which resulted in Aegis’ share price increasing by around 45% in 24 hours. The committee applied the default approach in line with the established guidelines, removing the impact of the bid premium, with the timing of the standard adjustment informed by independent advice from market specialists. The committee also noted that Arbitron was subject to a bid by Nielsen; however, this did not result in any positive or negative impact and therefore adjustment was not required.
The default approach entails the target company being deemed to de-list on the day prior to the share price being impacted by the proposed transaction. After that date, the TSR performance of the target company is calculated assuming a reinvestment into an unweighted synthetic stock of the other companies in the comparator group. The reinvestment is calculated using a two-month average before deemed de-listing.
WPP relative TSR performance against comparator group
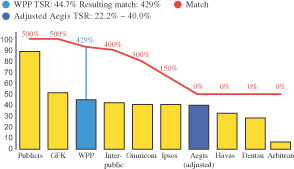
WPP’s TSR performance relative to the comparator group resulted in a match of 429% on a common currency basis. During the share owner consultation, the committee made the commitment that the fairness review will no longer consider currency adjustments. In the interest of continued transparency, the match on a local currency basis would have been 493%.
51
The committee also considered the underlying financial performance of WPP against the comparator group. The measures considered included PBIT, revenue and organic growth, and this analysis along with the underlying financial performance of the Group over the period supported the default level of match.
| | | | | | | | | | | | | | | | |
| | | Number of
shares
vesting | | | Value of
match at
grant price
£000 | | | Value
added due to
share price
appreciation
and dividends
£000 | | | 2012 Long-term incentives £000 | |
Sir Martin Sorrell | | | 1,053,465 | | | | 3,516 | | | | 7,852 | | | | 11,368 | |
Paul Richardson | | | 526,730 | | | | 1,758 | | | | 3,926 | | | | 5,684 | |
Mark Read | | | 105,341 | | | | 352 | | | | 785 | | | | 1,137 | |
2012-2016 LEAP awards
In 2012, all three executive directors were given the opportunity to invest in WPP shares under LEAP III. The opportunity given was determined by the committee and was bespoke to the individual.
| | | | | | | | | | | | |
| Executive | | Number of
Investment
Shares
committed | | | Maximum
number of
Matching
Shares | | | Maximum
face value
at grant
000 | |
Sir Martin Sorrell | | | 431,034 | | | | 2,155,170 | | | £ | 17,500 | |
Paul Richardson1 | | | 15,517 | | | | 77,585 | | | $ | 5,000 | |
Mark Read | | | 23,276 | | | | 116,380 | | | £ | 945 | |
| 1 | | Paul Richardson’s 2012 LEAP Award was granted in respect of ADRs. |
The five-year performance and investment period for the 2012 LEAP awards will finish on 31 December 2016.
Directors’ remuneration
For the fiscal year ended 31 December 2012 the aggregate compensation paid by WPP to all directors and officers of WPP as a group for services in all capacities was £31.3 million. Such compensation was paid by WPP and its subsidiaries primarily in the form of salaries, performance-related bonuses, other benefits and deferred share awards. The sum of £0.9 million was set aside and paid in the last fiscal year to provide pension benefits for directors and officers of WPP.
52
Executive directors’ total remuneration received
Single total figure of remuneration in 2012 and 2011
| | | | | | | | | | | | | | | | | | | | | | | | | | | | | | | | | | | | |
| | | | | | Base salary
and fees
£000 | | | Benefits3
£000 | | | DEPs4 £000 | | | Pension
£000 | | | Short-term incentives5
£000 | | | Long-term incentives6
£000 | | | Total annual
remuneration
£000 | | | Total excluding
pension and
LTI £000 | |
Sir Martin Sorrell1,2 | | | 2012 | | | | 1,300 | | | | 356 | | | | 940 | | | | 586 | | | | 3,078 | | | | 11,368 | | | | 17,628 | | | | 5,674 | |
| | | | 2011 | | | | 1,306 | | | | 466 | | | | 1,339 | | | | 585 | | | | 5,005 | | | | 3,239 | | | | 11,941 | | | | 8,117 | |
Paul Richardson2 | | | 2012 | | | | 684 | | | | 96 | | | | — | | | | 205 | | | | 1,401 | | | | 5,684 | | | | 8,070 | | | | 2,181 | |
| | | | 2011 | | | | 677 | | | | 100 | | | | — | | | | 198 | | | | 1,860 | | | | 1,296 | | | | 4,131 | | | | 2,637 | |
Mark Read | | | 2012 | | | | 425 | | | | 3 | | | | — | | | | 43 | | | | 570 | | | | 1,137 | | | | 2,177 | | | | 998 | |
| | | | 2011 | | | | 425 | | | | 3 | | | | — | | | | 43 | | | | 808 | | | | 324 | | | | 1,603 | | | | 1,236 | |
| 1 | | As noted on page 41, effective 1 January 2013, the CEO’s remuneration package has been reduced with decreases to base salary, pension allowance and short- and long-term incentive opportunities. |
| 2 | | Any US dollar amounts received in 2012 have been converted into sterling at an exchange rate of $1.5852 to £1. |
| 3 | | Benefits include items such as healthcare, life assurance, spouse travel, car allowance, housing allowance and club memberships. The CEO also received an amount of £7,065 (included above) in respect of tax liabilities incurred by him on expenditure on various items considered by the UK Tax authorities as benefits in kind but which the committee considers to be essential to his ability to deliver his services successfully to the Group (£7,402 in 2011). |
| 4 | | Sir Martin Sorrell receives payments in accordance with the approval granted by share owners of amounts equal to the dividends that would be payable (totalling £940,480) during 2012 (£1,339,364 during 2011) in respect of the shares reflected in the UK and US Deferred Stock Units Awards Agreements (which are the agreements that now comprise the awards granted under the Capital Investment Plan in 1995). |
| 5 | | This is the amount awarded for the 2012 financial year performance. The award is usually delivered with at least half in deferred share bonus (ESA) (vesting after two years) and half in cash. |
| 6 | | This is the value of the matching LEAP awards which vested in 2013 following the end of the five-year performance period on 31 December 2012. |
Non-executive directors’ total remuneration received
The fees detailed in the single total figure of remuneration table below are the only payments received by the non-executive directors. The Compensation Committee retains the discretion to make payments to non-executive directors who will stand down at the 2013 AGM in the event that they continue to provide advisory services to the Board.
| | | | |
| | | Total fees |
| Director | | 2012 £000 | | 2011 £000 |
Philip Lader | | 425 | | 425 |
Colin Day1 | | 108 | | 112 |
Esther Dyson | | 90 | | 90 |
Orit Gadiesh | | 70 | | 70 |
Ruigang Li | | 65 | | 65 |
Stanley (Bud) Morten2 | | 85 | | 85 |
Koichiro Naganuma3 | | — | | — |
Lubna Olayan (retired from the Board in June 2012) | | 35 | | 70 |
John Quelch4 | | 71 | | 70 |
Jeffrey Rosen | | 145 | | 145 |
Timothy Shriver | | 85 | | 85 |
Paul Spencer1 | | 106 | | 106 |
Sol Trujillo | | 85 | | 85 |
| 1 | | Received payments in respect of attendance at Company meetings which were called at short notice and held outside of the director’s home country. |
| 2 | | Fee included ex officio payment of £20,000 (£20,000 in 2011). |
| 3 | | Received no fees in 2011 and 2012. |
| 4 | | Fee includes £6,218 (£4,680 in 2011) for consulting services. |
53
Aligning pay and performance
As illustrated in the introduction toLooking forward, the committee has sought to align the variable remuneration with the key strategic priorities of WPP, therefore seeking to maximise the dynamic between pay and performance.
This dynamic is contingent upon the committee setting challenging targets each year. The following graph and table demonstrate the relationship between pay and performance in respect of the CEO.
Historical TSR Performance1 Value of hypothetical £100 holding
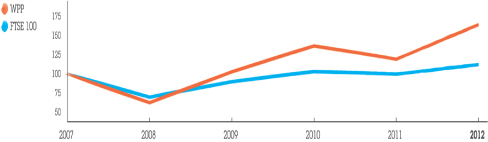
| | | | | | | | | | | | | | | | | | | | |
CEO total remuneration (£000)2 | | | 4,411 | | | | 7,199 | | | | 11,597 | | | | 11,941 | | | | 17,628 | |
Year-on-year change in CEO total remuneration | | | -79% | | | | 63% | | | | 61% | | | | 3% | | | | 48% | |
Short-term incentives award against maximum opportunity | | | 67% | | | | 32% | | | | 95% | | | | 77% | | | | 62% | |
Long-term incentives award against maximum opportunity | | | n/a | | | | 50% | | | | 83% | | | | 46% | | | | 86% | |
Change in annual TSR3 | | | -38% | | | | 66% | | | | 32% | | | | -13% | | | | 37% | |
Change in five-year TSR4 | | | -15% | | | | 10% | | | | 37% | | | | 13% | | | | 45% | |
| 1 | | Growth in the value of a hypothetical £100 holding over five years FTSE 100 (the broad market equity index of which WPP is a constituent) comparison based on one month average of trading day values. Source: DataStream. |
| 2 | | Calculated using the single figure methodology. |
| 3 | | TSR calculated using a one month trading day average, consistent with the data shown in the graph. |
| 4 | | TSR calculated using a six month averaging period, consistent with the calculation methodology under LEAP. |
Value creation over the longer-term
The following graphs compare WPP’s 20-year TSR performance relative to our primary peers and the major indices in both the US and Europe. Over this period, a £100 investment in January 1993 in WPP would have delivered a return of £3,990 in April 2013, out-performing the competitors and the local indices. An identical investment in either the S&P 500 or the FTSE 100 would have yielded £553 or £475 respectively.
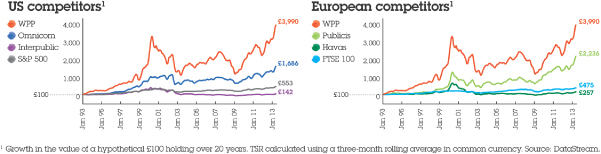
54
Outstanding share-based awards
In the interests of transparency, the following tables summarise all unexercised share options and share-based awards either vesting in the year or subject to ongoing performance conditions.
Executive Share Awards (ESA) held by executive directors
All Executive Share Awards made under the Restricted Stock Plan are made on the basis of satisfaction of previous performance conditions and are subject to continuous employment until the vesting date.
The table does not include grants in relation to the 2012 ESA as these will not be granted until May 2013.
| | | | | | | | | | | | | | | | | | | | | | | | | | | | | | | | | | | | | | | | |
| | | | | | Grant date | | | Share/ADR
price on
grant
date | | | No. of
shares/ADRs
granted | | | Value
on
grant
date
000 | | | Additional
shares
granted
in lieu of
dividends | | | Total
shares
vesting | | | Vesting date | | | Share/ADR
price on
vesting | | | Value on vesting 000 | |
Sir Martin Sorrell | | | 2009 ESA | | | | 04.05.10 | | | £ | 6.7775 | | | | 80,560 | | | £ | 546 | | | | — | | | | — | | | | 01.05.13 | | | | — | | | | — | |
| | | | 2010 ESA | | | | 31.03.11 | | | £ | 7.6825 | | | | 123,657 | | | £ | 950 | | | | — | | | | — | | | | 01.05.13 | | | | — | | | | — | |
| | | | 2011 ESA | | | | 30.04.12 | | | £ | 8.3325 | | | | 360,396 | | | £ | 3,003 | | | | — | | | | — | | | | 06.03.14 | | | | — | | | | — | |
Paul Richardson | | | 2009 ESA | 1 | | | 04.05.10 | | | $ | 51.59 | | | | 11,813 | | | $ | 609 | | | | 826 | | | | 12,639 | | | | 06.03.13 | | | $ | 80.9678 | | | $ | 1,023 | |
| | | | 2010 ESA | 1 | | | 31.03.11 | | | $ | 61.76 | | | | 19,121 | | | $ | 1,181 | | | | 1,173 | | | | 20,294 | | | | 06.03.13 | | | $ | 80.9678 | | | $ | 1,643 | |
| | | | 2011 ESA | 1 | | | 30.04.12 | | | $ | 67.82 | | | | 21,995 | | | $ | 1,492 | | | | — | | | | — | | | | 06.03.14 | | | | — | | | | — | |
Mark Read | | | 2009 ESA | | | | 04.05.10 | | | £ | 6.7775 | | | | 23,164 | | | £ | 157 | | | | — | | | | — | | | | 01.05.13 | | | | — | | | | — | |
| | | | 2010 ESA | | | | 31.03.11 | | | £ | 7.6825 | | | | 38,138 | | | £ | 293 | | | | — | | | | — | | | | 01.05.13 | | | | — | | | | — | |
| | | | 2011 ESA | | | | 30.04.12 | | | £ | 8.3325 | | | | 48,454 | | | £ | 404 | | | | — | | | | — | | | | 06.03.14 | | | | — | | | | — | |
| 1 | | Paul Richardson’s 2009, 2010 and 2011 ESAs were granted in respect of ADRs. |
Long-term incentive plans – Leadership Equity Acquisition Plans
The following table summarises all of the awards outstanding under Renewed LEAP and LEAP III. Awards granted in 2007 and 2008 were granted under Renewed LEAP. Awards granted in 2009, 2010, 2011 and 2012 were granted under LEAP III.
| | | | | | | | | | | | | | | | | | | | | | | | | | | | | | | | | | | | | | | | | | | | |
| Name | | Grant/
award
date | | | Investment and performance period | | | Number of investment
shares/
ADR | | | Share/ADR
price on
grant date | | | Maximum
number of
matching
units at 1 Jan 2012 | | | During 2012 | | | Maximum
number of
matching
units at 31 Dec 2012 | | | Share/
ADR
price on
vest/
deferral
date | | | Value
on vest/
deferral
date
000 | |
| | | | | | | Granted/
(lapsed)
units | | | Additional
dividend
shares | | | Vested
or
deferred
shares | | | | |
Sir Martin Sorrell | | | | | | | | | | | | | | | | | | | | | | | | | | | | | | | | | | | | | | | | | | | | |
| | | | 11.12.07 | | | | 01.01.07-31.12.11 | | | | 148,742 | | | £ | 6.2300 | | | | 743,710 | | | | (400,116 | ) | | | 42,750 | | | | 386,344 | | | | — | | | £ | 8.3846 | | | £ | 3,239 | |
| | | | 31.10.08 | | | | 01.01.08-31.12.12 | | | | 218,596 | | | £ | 3.7490 | | | | 1,092,980 | | | | — | | | | — | | | | — | | | | 1,092,980 | | | | — | | | | — | |
| | | | 15.12.09 | | | | 01.01.09-31.12.13 | | | | 365,878 | | | £ | 6.1025 | | | | 1,829,390 | | | | — | | | | — | | | | — | | | | 1,829,390 | | | | — | | | | — | |
| | | | 24.11.10 | | | | 01.01.10-31.12.14 | | | | 416,666 | | | £ | 7.2475 | | | | 2,083,330 | | | | — | | | | — | | | | — | | | | 2,083,330 | | | | — | | | | — | |
| | | | 07.12.11 | | | | 01.01.11-31.12.15 | | | | 711,159 | | | £ | 6.6475 | | �� | | 3,555,795 | | | | — | | | | — | | | | — | | | | 3,555,795 | | | | — | | | | — | |
| | | | 10.12.12 | | | | 01.01.12-31.12.16 | | | | 431,034 | | | £ | 8.5975 | | | | — | | | | 2,155,170 | | | | — | | | | — | | | | 2,155,170 | | | | — | | | | — | |
Paul Richardson | | | | | | | | | | | | | | | | | | | | | | | | | | | | | | | | | | | | | | | | | | | | |
| | | | 11.12.07 | | | | 01.01.07-31.12.11 | | | | 59,497 | | | £ | 6.2300 | | | | 297,485 | | | | (160,047 | ) | | | 17,100 | | | | 154,538 | | | | — | | | £ | 8.3846 | | | £ | 1,296 | |
| | | | 31.10.08 | | | | 01.01.08-31.12.12 | | | | 109,298 | | | £ | 3.7490 | | | | 546,490 | | | | — | | | | — | | | | — | | | | 546,490 | | | | — | | | | — | |
| | | | 15.12.09 | | | | 01.01.09-31.12.13 | | | | 103,423 | | | £ | 6.1025 | | | | 517,115 | | | | — | | | | — | | | | — | | | | 517,115 | | | | — | | | | — | |
| | | | 24.11.10 | | | | 01.01.10-31.12.14 | | | | 100,968 | | | £ | 7.2475 | | | | 504,840 | | | | — | | | | — | | | | — | | | | 504,840 | | | | — | | | | — | |
| | | | 07.12.11 | | | | 01.01.11-31.12.15 | | | | 100,344 | | | £ | 6.6475 | | | | 501,720 | | | | — | | | | — | | | | — | | | | 501,720 | | | | — | | | | — | |
| | | | 10.12.12 | | | | 01.01.12-31.12.16 | | | | 15,517 | | | $ | 69.25 | | | | — | | | | 77,585 | 1 | | | — | | | | — | | | | 77,585 | | | | — | | | | — | |
Mark Read | | | | | | | | | | | | | | | | | | | | | | | | | | | | | | | | | | | | | | | | | | | | |
| | | | 11.12.07 | | | | 01.01.07-31.12.11 | | | | 14,874 | | | £ | 6.2300 | | | | 74,370 | | | | (40,011 | ) | | | 4,274 | | | | 38,633 | | | | — | | | £ | 8.3846 | | | | £324 | |
| | | | 31.10.08 | | | | 01.01.08-31.12.12 | | | | 21,859 | | | £ | 3.7490 | | | | 109,295 | | | | — | | | | — | | | | — | | | | 109,295 | | | | — | | | | — | |
| | | | 15.12.09 | | | | 01.01.09-31.12.13 | | | | 27,406 | | | £ | 6.1025 | | | | 137,030 | | | | — | | | | — | | | | — | | | | 137,030 | | | | — | | | | — | |
| | | | 24.11.10 | | | | 01.01.10-31.12.14 | | | | 25,281 | | | £ | 7.2475 | | | | 126,405 | | | | — | | | | — | | | | — | | | | 126,405 | | | | — | | | | — | |
| | | | 07.12.11 | | | | 01.01.11-31.12.15 | | | | 30,166 | | | £ | 6.6475 | | | | 150,830 | | | | — | | | | — | | | | — | | | | 150,830 | | | | — | | | | — | |
| | | | 10.12.12 | | | | 01.01.12-31.12.16 | | | | 23,276 | | | £ | 8.5975 | | | | — | | | | 116,380 | | | | — | | | | — | | | | 116,380 | | | | — | | | | — | |
| 1 | | Paul Richardson’s 2012 LEAP Award was granted in respect of ADRs. |
55
Reward policy for management outside the Board
As well as setting the policy for the executive directors, the Compensation Committee is also responsible for reviewing the policy for the most senior people at WPP outside the Board.
Compensation packages for these individuals are normally reviewed every 18-24 months. As with the policy for executive directors, the design of the compensation policy at WPP ensures a clear and direct link between the performance of the Group and compensation. Substantial use of performance-driven compensation not only ensures the continued alignment of the interests of share owners and senior individuals within the Group, but also enables the Group to attract, retain and motivate the talented people upon whom our success depends.
WPP is committed to encouraging strong performance through a reward system that aligns management’s interests with those of share owners. From a compensation perspective, this is encouraged in a number of ways:
| | • | | senior executives participate in the same long-term incentive plan as the executive directors which is designed to incentivise growth, capital efficiency and share price appreciation; and |
| | • | | share ownership is encouraged for the WPP Leaders (approximately the top 240 executives), all of whom have stretching ownership goals. |
Management share incentive plans
The Company uses share-based compensation across the workforce to incentivise, retain and recruit talent which encourages a strong ownership culture among employees. The main share plans are described below.
The Restricted Stock Plan
The RSP is used to satisfy awards under the short-term incentive plans (including deferred share bonuses (ESAs)) as well as to grant awards to management under the WPP Leaders, Partners and High Potential program. This program is used to provide awards to about 1,600 of our key executives.
In the program, awards are made to participants that vest three years after grant, provided the participant is still employed within the Group.
Executive directors are eligible to receive ESAs under the RSP but ineligible to participate in any other aspect of the management share award program.
The Executive Stock Option Plan
The ExSOP is used to make special grants of options in order to attract or retain key talent. One award was granted in 2012 (one in 2011). This plan is not generally used.
All-employee plan
The Worldwide Ownership Plan is an all-employee plan that makes annual grants of stock options to employees with two years of service who work in wholly-owned subsidiaries. During 2012, awards were made to over 48,000 employees, including over 10,000 new participants. By 31 December 2012, options under this plan had been granted to approximately 110,400 employees over 49.2 million shares since March 1997. Executive directors are ineligible to participate in this plan.
Share incentive dilution for 2002 to 2012
The share incentive dilution level, measured on a 10-year rolling basis, has remained constant at 3.7% at 31 December 2012 (4.3%-2011). It is intended that awards under all plans, other than share options, will all be satisfied with purchased shares held either in the ESOPs or in treasury.
56
C. Board Practices
The role of the Board
The Board is collectively responsible for promoting the success of the Company by directing and supervising the Company’s policy and strategy and is responsible to share owners for the Group’s financial and operational performance. Responsibility for the development and implementation of Group policy and strategy and for day-to-day management issues is delegated by the Board to the Group chief executive and the other executive directors. The list of matters reserved to the Board can be downloaded from the Company’s website.
During 2012, the Board met seven times formally and held 21 committee meetings throughout the year.
| | | | | | | | | | | | | | | | |
| Attendance at meetings | | Board | | | Audit Committee | | | Compensation Committee | | | Nomination and
Governance Committee | |
Philip Lader1 (chairman) | | | 7 | | | | 9 | | | | 7 | | | | 5 | |
Sir Martin Sorrell | | | 7 | | | | — | | | | — | | | | — | |
Paul Richardson | | | 7 | | | | — | | | | — | | | | — | |
Mark Read | | | 7 | | | | — | | | | — | | | | — | |
Colin Day | | | 6 | | | | 8 | | | | 6 | | | | — | |
Esther Dyson | | | 7 | | | | — | | | | 6 | | | | 5 | |
Orit Gadiesh | | | 5 | | | | — | | | | — | | | | 5 | |
Ruigang Li | | | 2 | | | | — | | | | — | | | | — | |
Bud Morten2 | | | 7 | | | | 9 | | | | 7 | | | | 4 | |
Koichiro Naganuma | | | 1 | | | | — | | | | — | | | | — | |
Lubna Olayan3 | | | 2 | | | | — | | | | — | | | | — | |
John Quelch | | | 4 | | | | — | | | | — | | | | — | |
Jeffrey Rosen | | | 6 | | | | 9 | | | | 7 | | | | — | |
Paul Spencer | | | 6 | | | | 9 | | | | — | | | | — | |
Tim Shriver | | | 6 | | | | — | | | | 6 | | | | — | |
Sol Trujillo | | | 6 | | | | 9 | | | | — | | | | — | |
| 1 | | By invitation, the chairman attended all of the Audit Committee meetings. |
| 2 | | By invitation, Bud Morten attended all Audit and Compensation Committee meetings and all but one of the Nomination and Governance Committee meetings. |
| 3 | | Lubna Olayan retired on 13 June 2012. |
Information regarding the period during which each director has served is set forth in Item 6A.
The role of the chairman
The Board is chaired by Philip Lader, who chairs the Nomination and Governance Committee, and would continue to serve as a member of the Compensation Committee through December 2013 and, at the invitation of the Audit Committee chairman, attended all meetings of that committee. The chairman provides the leadership of the Board and is the main point of contact between the Board and the management team. The chairman represents the Board in discussions with share owners, investor bodies, ensures that systems are in place to provide directors with timely and accurate information, represents the Company in extensive external gatherings, and is also responsible for the Board governance principles.
The role of the senior independent director
The senior independent director is Jeffrey Rosen who is available to share owners and acts as a sounding board for the chairman and as an intermediary for the other directors with the chairman when necessary. The senior independent director’s role includes responsibility for the chairman’s appraisal and succession. Jeffrey Rosen has been the senior independent director since April 2010.
Non-executive directors
The non-executive directors have a diverse range of skills, experience and backgrounds. As detailed in their biographies on page 37, the non-executive directors work across the globe in media and advertising, investment banking and investment management, pension fund oversight, international management consulting, private
57
equity and angel investing, business education, manufacturing, consumer products and retail management, internet start-ups, government and non-profit organisations. They provide constructive challenge and assistance to the Group chief executive in developing the Group’s strategy. All directors have access to the services of the Company Secretary and may take independent professional advice at the Company’s expense in conducting their duties. The Company provides insurance cover for its directors and officers.
The composition of the Board
The Board was composed of 15 directors in 2012 following Lubna Olayan’s decision to step down at the 2012 AGM. Three members are executive directors and 11, plus the chairman, are non-executive directors. The independence of each non-executive director is assessed annually by the Board. The Board has confirmed that all of the non-executives standing for re-election at the 2013 AGM continue to demonstrate the characteristics of independence.
Succession: Board and committee membership
In 2012 WPP commenced a comprehensive review of the Board’s composition and effectiveness, directed by the Nomination and Governance Committee with the assistance of Egon Zehnder International, a prominent Board recruitment and advisory firm. Geographic and gender diversity together with skills and experience in marketing services, finance and pertinent technologies are among the priorities of our Board succession.
As a consequence of this review the composition of the Board and the committees are being refreshed. Four of the longest serving non-executive directors, Bud Morten, John Quelch, Paul Spencer and Koichiro Naganuma are not standing for re-election at the 2013 AGM. The Compensation Committee chairman, Jeffrey Rosen, will step down from the committee in December 2013, as will Esther Dyson and Philip Lader.
If elected to serve as newly-appointed non-executive directors, Roger Agnelli, Jacques Aigrain and Hugo Shong would join Colin Day, Sol Trujillo, Tim Shriver and Ruigang Li on the Compensation Committee, with an identified, well-qualified individual (whose client conflict clearance cannot be finalized prior to the AGM) to be appointed upon such clearance and to serve as its chair.
If re-elected as a director, Colin Day would succeed Paul Spencer as chairman of the Audit Committee, accompanied by continuing members, Sol Trujillo and Jeffrey Rosen, and to be joined by Jacques Aigrain, Roger Agnelli and Hugo Shong (as well as, potentially, the individual identified above who would be Compensation Committee chairman).
If elected, Roger Agnelli, Tim Shriver, Jeffrey Rosen, Ruigang Li, Hugo Shong and Sally Susman would join Esther Dyson and Orit Gadiesh on the Nomination and Governance Committee, with Philip Lader as chairman. The chairman of the Board participates as an ex-officio member of all Board committees.
Time commitment
Letters of appointment for non-executive directors do not set out a fixed time commitment for Board attendance and duties but give an indication of the likely time required. It is anticipated that the time required by directors will fluctuate depending on the demands of the business and other events.
Development
On joining WPP, non-executive directors are given an induction which includes one-to-one meetings with management and the external auditors, briefings on the duties of directors of a Jersey company, the Model Code, WPP Code of Conduct and the UK Corporate Governance Code. The induction also covers the Board committees
58
that a director will join. All directors are fully briefed on important developments in the various business activities which the Group carries out worldwide and regularly receive extensive information concerning the Group’s operations, finances, risk factors and its people, enabling them to fulfil their duties and obligations as directors. The directors are also frequently advised on regulatory and best practice requirements which affect the Group’s businesses on a global basis. At the Board meeting held in France in 2012 the Board received briefings from all the heads of the Group’s European operations.
Evaluation
WPP undertakes an annual review of the Board, its committees and individual directors. The chairman’s performance evaluation by the non-executive directors is led by the senior independent director. In 2012 a review of the Board’s performance was undertaken by the Group chief counsel on the basis of a questionnaire which tested areas including strategy, risk and governance processes, levels of participation, skills, and the effectiveness of the Board and its committees. Separate conversations were held between each director and either the chairman or the senior independent director. From these findings, we concluded that the Board had been effective and is prepared for a variety of potential macroeconomic, industry, client and personnel challenges. As part of the aforementioned Egon Zehnder International consultancy assignment, that firm interviewed directors, worked closely with the Board chairman and senior independent director to analyse governance strengths and deficiencies, and continues to advise the Board as to additional ways that its effectiveness might be enhanced.
Re-election
The directors submit themselves for annual re-election at each Annual General Meeting, if they wish to continue serving and are considered by the Board to be eligible. Directors may be appointed by share owners by ordinary resolution or by the Board on the recommendation of the Nomination and Governance Committee and must then stand for re-election at the next Annual General Meeting where they may be re-elected by ordinary resolution of the share owners.
With only specific exceptions to ensure Board continuity, non-executive directors shall not stand for re-election after they have served for the period of theirindependence, as determined by then-applicable UK and US standards; that currently being a period of nine years. Further, a transition in the Board chairmanship is also planned for 2014.
Diversity
WPP recognises the importance of diversity, including gender, at all levels of the Group as well as the Board.
WPP is committed to increasing diversity across its subsidiaries and supports the development and promotion of talented individuals, including women. In 2012, women comprised 13% of the WPP Board, 32% of Board members and executive leaders in the subsidiaries, 47% of senior managers and 54% of total employees. Our aspiration is to increase the female representation on the Board to 30% of non-executive directors as part of the Board refreshment process.
Directors’ conflicts of interest
The Company’s Articles of Association permit the Board to consider and, if it sees fit, to authorise situations where a director has an interest that conflicts, or may possibly conflict, with the interests of the Company (Situational Conflicts). The Board has a formal system in place for directors to declare Situational Conflicts to be considered for authorisation by those directors who have no interest in the matter being considered. In deciding whether to authorise a Situational Conflict, the non-conflicted directors must act honestly and in good faith with a view to the best interests of the Company and they may impose limits or conditions when giving the authorisation, or subsequently, if they think this is appropriate.
59
Any Situational Conflicts considered, and any authorisations given, are recorded in the relevant minutes. The prescribed procedures have been followed in deciding whether, and on what terms, to authorise Situational Conflicts and the Board believes that the systems it has in place for reporting and considering Situational Conflicts continue to operate effectively.
Policy on directors’ contracts
The Company’s policy on directors’ service contracts is that they should be on a rolling basis without a specific end date.
Sir Martin Sorrell’s service contract may be terminated by either the Company, or Sir Martin, without notice, or any payment in lieu of notice.
| | | | |
| | | Effective from | | Notice period |
Sir Martin Sorrell | | 19 Nov 2008 | | ‘At will’ |
Paul Richardson | | 19 Nov 2008 | | 12 months |
Mark Read | | 19 Nov 2008 | | 6 months |
Executive directors are permitted to serve as non-executives on the boards of other organisations. If the Company is a share owner in that organisation, non-executive fees for those roles are waived. However, if the Company is not a share owner in that organisation, any non-executive fees can be retained by the office holder.
Standard terms of directors’ contracts
| | • | | Cash bonus – for the purposes of any annual cash bonus entitlement, if the executive director is still employed on the bonus payment date (including if under notice, if notice was given after the performance period ended), he or she will receive his or her bonus in the usual way. No payment will be made if employment is terminated before the end of the performance period, or if the executive is not employed on the bonus payment date. |
| | • | | Deferred share bonus – provided the executive is a ‘Good Leaver’, any unvested deferred share awards (ESAs) will be reduced on a time pro rata basis and paid on the vesting date. |
| | • | | Long-term incentive awards – provided the executive director is a ‘Good Leaver’, any unvested long-term incentive awards which are in at least the second year of the performance period will vest after the end of the performance period. However, the award will be pro-rated as well as dependent on WPP’s performance for the whole of the performance period. If the executive director leaves during the first year of the performance period, the award will lapse. |
Terms that apply to Sir Martin Sorrell
Sir Martin Sorrell’s deferred LEAP awards and his Deferred Stock Units (DSUs) will be paid out unconditionally on termination of employment. The performance requirements in respect of these awards have already been met and the awards are therefore no longer subject to any leaver provisions.
In relation to his annual bonus, if Sir Martin ceases to be an employee after the end of the performance period, he will be entitled to receive his bonus to the extent that the performance targets have been achieved. In relation to the long-term incentive plans, unless he is terminated for cause, he will be treated as having retired on leaving the Company and therefore a ‘Good Leaver’.
60
Non-executive directors
| | | | |
| | | Effective from | | Notice period |
Philip Lader | | 26 Feb 2001 | | 2 months |
Colin Day | | 25 Jul 2005 | | 2 months |
Esther Dyson | | 29 Jun 1999 | | 2 months |
Orit Gadiesh | | 28 Apr 2004 | | 2 months |
Ruigang Li | | 11 Oct 2010 | | 2 months |
Stanley Morten | | 02 Dec 1991 | | 2 months |
Koichiro Naganuma | | 23 Jan 2004 | | 2 months |
John Quelch | | 10 Jul 1991 | | 2 months |
Jeffrey Rosen | | 20 Dec 2004 | | 2 months |
Timothy Shriver | | 06 Aug 2007 | | 2 months |
Paul Spencer | | 28 Apr 2004 | | 2 months |
Sol Trujillo | | 11 Oct 2010 | | 2 months |
Governance in relation to compensation
Compensation Committee members
| | | | |
| | | Meetings | |
Jeffrey Rosen (chairman) | | | 7 | |
Colin Day | | | 6 | |
Esther Dyson | | | 6 | |
Philip Lader | | | 7 | |
Tim Shriver | | | 6 | |
| | | | | |
By invitation: | | | | |
Bud Morten | | | 7 | |
2013 Compensation Committee membership
The Compensation Committee chairman, Jeffrey Rosen, will step down from the committee in December 2013, as will Esther Dyson and Philip Lader. If elected to serve as newly-appointed non-executive directors, Roger Agnelli, Jacques Aigrain and Hugo Shong would join Colin Day, Sol Trujillo, Tim Shriver and Ruigang Li on the Compensation Committee, with an identified, well-qualified individual (whose client conflict clearance cannot be finalised prior to the AGM) to be appointed upon such clearance and to serve as its chair.
During 2012, the Compensation Committee met seven times on a formal basis, as noted above. In addition, numerous informal Compensation Committee meetings were held throughout 2012 to discuss the review of the Executive Remuneration Policy.
None of the committee members has any personal financial interest (other than as a share owner as disclosed in Item 6E) in the matters to be decided by the committee, potential conflicts of interest arising from cross-directorships or day-to-day involvement in running the Group’s businesses.
The terms of reference for the Compensation Committee are available on the Company’s website and will be on display at the AGM, as set out in the Notice of AGM. This Annual Report on Form 20-F does not incorporate by reference information on the Company’s website.
The committee’s principal responsibilities under its terms of reference include:
| | • | | reviewing and approving the Company’s compensation strategy; |
| | • | | determining appropriate remuneration for executive directors; |
61
| | • | | approving the service agreements and severance arrangements for executive directors and other senior executives of the Company; |
| | • | | maintaining appropriate procedures for evaluation of executive performance; |
| | • | | overseeing succession planning and management development for senior executives in the Group who are not members of the Board; |
| | • | | reviewing, approving and administering the Company’s executive long-term incentive plans, employee share schemes and other equity-related incentive plans; |
| | • | | reviewing proposed special incentive awards to senior executives; |
| | • | | monitoring prohibitions on personal loans to directors and officers; |
| | • | | determining targets for performance-related pay schemes; |
| | • | | advising on any major changes in employee benefit structures; |
| | • | | overseeing the provisions for selecting, appointing and setting the terms of reference for any remuneration consultants to the Company; |
| | • | | overseeing the preparation of and recommending to the board the approval of the annual report of the committee in compliance with the disclosure requirements of the Code of Best Practice and the Directors’ Remuneration Report Regulations 2002; |
| | • | | overseeing the adequacy of disclosures throughout the year regarding director compensation, stock transactions and benefits; |
| | • | | approving the policy for authorising claims for expenses from directors and senior executives; and |
| | • | | ensuring that procedures are in place concerning compliance with the employee welfare provisions of the Company’s Code of Business Conduct and Ethics and the Company’s Policy Manual. |
Advisors to the Compensation Committee
The Compensation Committee regularly consults with Group executives. In particular, the committee will invite certain individuals to attend meetings, including the CEO (who is not present when matters relating to his own compensation or contracts are discussed and decided), the Company Secretary, the chief talent officer and the worldwide compensation and benefits director. The latter two individuals provide a perspective on information reviewed by the committee and are a conduit for requests for information and analysis from the Company’s external advisors.
The committee receives external advice on all matters relating to the determination of fair and appropriate compensation packages for the executive directors, including competitive practices in comparator companies. Towers Watson is the committee’s appointed compensation advisor. Towers Watson is a voluntary signatory to the Remuneration Consultants Group Code of Conduct in relation to Executive Remuneration Consulting in the UK. Towers Watson did not provide any other material services to the Group.
The level and components of remuneration
The shareholdings of non-executive directors are set out on Page 66.
Non-executive directors do not participate in the Company’s pension, share option or other incentive plans, but may receive a part of their fees in ordinary shares of the Company and may participate in the Company’s deferred compensation program.
The Board considers that the non-executive directors’ remuneration conforms with the requirements of the UK Corporate Governance Code.
62
The fees payable to non-executive directors represent compensation in connection with Board and Board committee meetings and where appropriate for devoting additional time and expertise for the benefit of the Group in a wider capacity.
Details of non-executivedirectors’ remuneration are provided in Item 6B.
Review of the Audit Committee
| | | | |
Audit Committee members | | | | |
| | | Meetings | |
Paul Spencer (chairman) | | | 9 | |
Colin Day | | | 8 | |
Sol Trujillo | | | 9 | |
Jeffrey Rosen | | | 9 | |
| | | | | |
By invitation: | | | | |
Philip Lader | | | 9 | |
Bud Morten | | | 9 | |
The audit committee held nine meetings during the year, which were attended by the external auditors, the Company’s chairman, the Group finance director, Bud Morten, the director of internal audit, the Group chief counsel and the Company Secretary.
Preparatory meetings were also held with the internal and external auditors as well as members of the Company’s senior management. The committee received presentations from the heads of internal audit, finance, tax, compliance and treasury and the GroupM worldwide CFO. The committee also received reports from the Disclosure Committee on financial reports. The Board received regular reports on all matters of particular significance arising at the committee meetings.
The committee’s terms of reference, which are reviewed with the Board annually and most recently in November 2012, are on the Company’s website at www.wpp.com/investor. This Annual Report on Form 20-F does not incorporate by reference information on the Company’s website.
The committee and its members were formally assessed by the chairman of the Company as part of the annual evaluation process described on page 59 for their technical suitability to be members and also for its overall effectiveness. The Board has designated Paul Spencer as the committee’s financial expert for Sarbanes-Oxley Act (SOX) purposes and as having recent and relevant financial experience for the purposes of the UK Corporate Governance Code. Each member of the committee has considerable financial and financial services expertise as set out in their biographies in Item 6A.
Committee responsibilities and how they were discharged in 2012
The main matters dealt with during 2012 were as follows:
| | • | | monitoring the integrity of the Company’s financial statements and reviewing significant financial reporting judgements; |
| | • | | reviewing internal financial control and internal audit activities; |
| | • | | assisting the Board in meeting its responsibilities in respect of reviewing and reporting on the systems and key elements of risk management as they affect the Group; |
| | • | | reviewing the Group Treasury policy with particular focus on debtors, funding foreign exchange and cash management and the continued ability of the Group to adopt the going concern basis in preparing financial statements; |
63
| | • | | reviewing reports on any material litigation or regulatory reviews involving Group companies; |
| | • | | reviewing the Group’s mergers and acquisitions strategy, any significant acquisitions, due diligence procedures and integration processes and the debt financing by the Group; |
| | • | | reviewing GroupM’s trading model and its risk assessment processes; |
| | • | | reviewing the Group’s Code of Business Conduct and supporting training programs; |
| | • | | reviewing the Group’s tax strategy and domicile; |
| | • | | monitoring the accounting and legal reporting requirements, including all relevant regulations of the UK Listing Authority, the SEC and NASDAQ and the Jersey Financial Services Commission; |
| | • | | overseeing the progress towards compliance with Section 404 of SOX for 2012, through regular status reports submitted by the internal and external auditors; |
| | • | | reviewing the procedures and supporting training programs implemented by the Group in response to the UK Bribery Act and US Foreign Corrupt Practices Act and increased regulatory focus; |
| | • | | reviewing the Group’s reporting systems and back office integration initiatives; |
| | • | | reviewing issues raised on our Right to Speak helpline and the actions taken in response to those calls; |
| | • | | reviewing the funding strategy for the Group’s pension plans in response to new legislation and increased funding requirements in the US and the UK; and |
| | • | | reviewing the Group’s initiatives and policies on data privacy and internet security. |
Financial reporting and significant financial judgements
Deloitte reported to and discussed with the committee whether suitable accounting policies had been adopted in the financial statements for the year ended 2012 and whether management had made appropriate estimates and judgements. The main areas of focus in 2012 and matters where the committee specifically considered the judgements that have been made were:
| | • | | the appropriateness of the restructuring charge taken in 2012. The committee reviewed the accounting standard criteria, the methodology adopted by management to quantify the charge and the presentation of the charge and agreed that management had appropriately presented, recognised and valued the restructuring charge; |
| | • | | the assessments made for goodwill impairment and the committee confirmed, based on management’s expectations of future performance of certain businesses, the level of goodwill impairment charges required in 2012; |
| | • | | the judgements made in respect of tax, in particular deferred tax assets including their recoverability and the level of tax provisioning. The committee supported management’s assumptions in both these areas and believe the current level of provisions is reasonable; |
| | • | | the going concern assessment and key forecast assumptions. The committee concurs with management’s going concern assumptions as set out in note 24 to the Consolidated Financial Statements; |
| | • | | the approach taken to calculating fair value adjustments in respect of acquired businesses and specifically provisions for non-corporate tax, property and legal exposures which the committee considered was appropriate and in line with expectations; and |
| | • | | accounting for the judgemental elements of remuneration including holiday pay, pensions, bonus accruals and share-based payments. The committee agreed that the assumptions applied by management are reasonable. |
External audit
Deloitte has been WPP’s auditor since 2002. The lead partner rotates every five years and the last rotation was in 2010. In line with the committee’s responsibility to review and appoint the external auditors and approve their
64
remuneration and terms of engagement, in 2012 the committee monitored Deloitte’s independence, objectivity and performance with reference to frequent reports from Deloitte during the year covering the overall audit strategy and the progress and results of the audit. The committee concluded that it continues to be satisfied with the performance of Deloitte and that Deloitte continues to be objective and independent. The committee recommends the reappointment of Deloitte at the AGM on 12 June 2013.
The committee will recommend a course of action to the Board during 2013 to respond to the new requirement in the Code that the external audit contract is put out to tender at least every 10 years.
Non-audit fees
The committee has established a policy regarding non-audit services that may be provided by the external auditors, which prohibits certain categories of work in line with relevant guidance on independence, such as ethical standards issued by the Auditing Practices Board and independence rules of the Public Company Accounting Oversight Board (United States) and SEC Rules. Other categories of work may be provided by the auditors if appropriate and if pre-approved by the committee, either as individual assignments or as aggregate amounts for specified categories of services. All fees are summarised periodically for the committee to assess the aggregate value of non-audit fees against audit fees. The level of fees for 2012 is shown in note 3 on page F-15.
D. Employees
The assets of communications services businesses are primarily their employees, and the Company is highly dependent on the talent, creative abilities and technical skills of its personnel and the relationships its personnel have with clients. The Company believes that its operating companies have established reputations in the industry that attract talented personnel. However, the Company, like all communications services businesses, is vulnerable to adverse consequences from the loss of key employees due to the competition among these businesses for talented personnel. On 31 December 2012, the Group, including all employees of associated undertakings, had approximately 165,000 employees located in over 3,000 offices in 110 countries compared with 158,000 and 146,000 as at 31 December 2011 and 2010, respectively. Excluding all employees of associated undertakings, this figure is 115,711 (2011: 113,615, 2010: 104,052). The average number of employees in 2012 was 114,490 compared to 109,971 and 101,387 in 2011 and 2010, respectively, including acquisitions.
Their geographical distribution was as follows:
| | | | | | |
| | | 2012 | | 2011 | | 2010 |
North America | | 27,782 | | 27,540 | | 25,546 |
United Kingdom | | 11,413 | | 10,761 | | 9,620 |
Western Continental Europe | | 23,322 | | 22,298 | | 21,154 |
Asia Pacific, Latin America, Africa & Middle East and Central & Eastern Europe | | 51,973 | | 49,372 | | 45,067 |
| | | 114,490 | | 109,971 | | 101,387 |
Their operating sector distribution was as follows:
| | | | | | |
| | | 2012 | | 2011 | | 2010 |
Advertising and Media Investment Management | | 48,662 | | 47,252 | | 42,424 |
Consumer Insight | | 28,989 | | 29,204 | | 28,167 |
Public Relations & Public Affairs | | 8,437 | | 7,869 | | 7,364 |
Branding & Identity, Healthcare and Specialist Communications | | 28,402 | | 25,646 | | 23,432 |
| | | 114,490 | | 109,971 | | 101,387 |
65
E. Share Ownership
Directors’ interests
Directors’ interests in the Company’s ordinary share capital, all of which were beneficial, are shown in the following table. Save as disclosed in this table and in the report of the Compensation Committee, no director had any interest in any contract of significance with the Group during the year. Each executive director has a technical interest as an employee and potential beneficiary in shares in the Company held under the ESOPs. As at 31 December 2012, the Company’s ESOPs (which are entirely independent of the Company and have waived their rights to receive dividends) held in total 22,570,364 shares in the Company (20,599,871 in 2011).
| | | | | | | | | | | | | | | | | | | | | | | | | | | | | | | | | | | | | | | | |
| | | At 1 Jan
2012 | | | Shares acquired
through long-
term incentive
plan awards in
2012 | | | Movement
during
2012 - shares
acquired
through
SCRIP in
2012 | | | At 31 Dec
2012 (or
resignation
date, if
earlier) | | | Shares/options
acquired through
long-term incentive
plan awards in 2013 | | | Other movements since 31
Dec 2012 | | | At 22 April
2013 | | | Shares
contributed
to charity
2007-2013
(and no
longer
beneficially
owned) | |
| | | Vested | | | (Sold) | | | | | Vested | | | (Sold) | | | | |
C Day | | | 15,240 | | | | — | | | | — | | | | — | | | | 15,240 | | | | — | | | | — | | | | — | | | | 15,240 | | | | — | |
E Dyson | | | 35,000 | | | | — | | | | — | | | | — | | | | 35,000 | | | | — | | | | — | | | | — | | | | 35,000 | | | | — | |
O Gadiesh | | | — | | | | — | | | | — | | | | — | | | | — | | | | — | | | | — | | | | — | | | | — | | | | — | |
P Lader | | | 11,950 | | | | — | | | | — | | | | — | | | | 11,950 | | | | — | | | | — | | | | — | | | | 11,950 | | | | — | |
R Li | | | — | | | | — | | | | — | | | | — | | | | — | | | | — | | | | — | | | | — | | | | — | | | | — | |
S W Morten | | | 20,000 | | | | — | | | | — | | | | — | | | | 20,000 | | | | — | | | | — | | | | — | | | | 20,000 | | | | — | |
K Naganuma1 | | | — | | | | — | | | | — | | | | — | | | | — | | | | — | | | | — | | | | — | | | | — | | | | — | |
L Olayan (retired
from the
Board on 13 June 2012) | | | 10,000 | | | | — | | | | — | | | | — | | | | 10,000 | | | | n/a | | | | n/a | | | | n/a | | | | n/a | | | | n/a | |
J A Quelch | | | 12,000 | | | | — | | | | — | | | | — | | | | 12,000 | | | | — | | | | — | | | | — | | | | 12,000 | | | | — | |
M Read2,7 | | | 104,731 | | | | 38,633 | | | | (38,633 | ) | | | 3,453 | | | | 108,184 | | | | 105,341 | | | | — | | | | — | | | | 213,525 | | | | — | |
P W G Richardson2,3 | | | 535,790 | | | | 154,538 | | | | (77,273 | ) | | | — | | | | 613,055 | | | | 691,395 | | | | (588,080 | ) | | | — | | | | 716,370 | | | | — | |
J Rosen | | | 12,000 | | | | — | | | | — | | | | — | | | | 12,000 | | | | — | | | | — | | | | — | | | | 12,000 | | | | — | |
T Shriver | | | 10,000 | | | | — | | | | — | | | | — | | | | 10,000 | | | | — | | | | — | | | | — | | | | 10,000 | | | | — | |
P Spencer | | | 10,000 | | | | — | | | | — | | | | — | | | | 10,000 | | | | — | | | | — | | | | — | | | | 10,000 | | | | — | |
S Trujillo | | | 10,000 | | | | — | | | | — | | | | — | | | | 10,000 | | | | — | | | | — | | | | — | | | | 10,000 | | | | — | |
Sir Martin Sorrell2,4,5,6,8,9 | | | 17,529,103 | | | | 386,344 | | | | — | | | | 179,782 | | | | 18,095,229 | | | | 1,053,465 | | | | (244,214 | ) | | | (200,000 | ) | | | 18,704,480 | | | | 1,005,936 | 10 |
| 1 | | K Naganuma is a director of Asatsu-DK, which at 22 April 2013 had interests in 31,295,646 WPP shares representing 2.475% of the issued share capital of the Company. |
| 2 | | Interests include investment shares committed to the 2009, 2010, 2011 and 2012 awards under the LEAP plans but do not include matching shares from these awards, if any. |
| 3 | | In December 2012, Mr Paul Richardson reduced the total number of ADRs charged to Bank of America, N. A. for security for existing bank facilities made available to him from 115,611 WPP ADRs to 85,183 WPP ADRs. |
| 4 | | Includes 4,176,833 shares pursuant to the vesting of the 2004 and 2005 awards, part of the 2006 award and the 2007 award granted under LEAP. The receipt of these awards has been deferred until November 2017. |
| 5 | | Includes 3,636,950 shares which originally formed part of the Capital Investment Plan (an award made in 1995, which vested in 1999, in respect of 4,691,392 shares in total, some of which have been received by Sir Martin Sorrell) and which now comprise the share owner- approved UK and US Deferred Stock Units Awards Agreements. |
| 6 | | Includes 579,907 shares held under option pursuant to the UK part of his 2008 LEAP award. |
| 7 | | Includes 105,341 shares held under option pursuant to his 2008 LEAP award. |
| 8 | | In March 2013, Sir Martin Sorrell gifted 200,000 ordinary shares to the JMCMRJ Sorrell Charitable Foundation. |
| 9 | | The 1 January 2012 figure now includes 5,240 WPP ordinary shares held by a family company, not previously disclosed. |
| 10 | | The JMCMRJ Sorrell Charitable Foundation, of which Sir Martin Sorrell is a joint trustee, has an interest of 1,005,936 WPP plc shares. Sir Martin has no beneficial interest in these shares. |
66
In 2013, the executive directors will be subject to share ownership guidelines. Given WPP’s long-standing ownership culture and the use of LEAP program, the executives already hold substantial interests in the Group as illustrated here.

Options held by executive directors
The options held by Mark Read at 31 December 2012 were granted prior to him becoming a director of the Company.
| | | | | | | | | | | | | | | | | | | | | | | | | | | | | | | | | | | | | | | | |
| | | Grant/
award date | | | End of
exercise
period | | | Exercise
price | | | At 1 Jan
2012
(no. of
shares) | | | Granted
(lapsed)
2012
(no. of
shares) | | | Exercised
2012
(no. of
shares) | | | Share
price on
exercise | | | Value on
exercise | | | At 31 Dec
2012
(no. of
shares) | | | Share
price 31 Dec
20121 | |
Mark Read | | | 17.11.2003 | | | | 17.11.2013 | | | £ | 5.595 | | | | 10,615 | | | | — | | | | — | | | | — | | | | — | | | | 10,615 | | | £ | 8.88 | |
| | | | 29.10.2004 | | | | 29.10.2014 | | | £ | 5.535 | | | | 9,879 | | | | — | | | | — | | | | — | | | | — | | | | 9,879 | | | £ | 8.88 | |
| 1 | | Share price 12-month high/low: £8.945/£6.690. |
ITEM 7. MAJOR SHAREHOLDERS AND RELATED PARTY TRANSACTIONS
A. Major Shareholders
As of the dates shown below, the Company is aware of the following interests of 3% or more in the issued ordinary share capital of the Company:
| | | | | | | | | | | | | | | | | | | | | | | | |
| | | | | | 22 April
2013 | | | | | | 20 April
2012 | | | | | | 18 April
2011 | |
BlackRock Inc. | | | 5.12 | % | | | 64,710,630 | | | | * | | | | * | | | | * | | | | * | |
Legal & General | | | 3.51 | % | | | 44,375,396 | | | | 3.55 | % | | | 44,960,433 | | | | 3.78 | % | | | 47,884,647 | |
| * | | No interests in the issued ordinary share capital of the Company in excess of 3.0% have been notified to the Company. |
The disclosed interests refer to the respective combined holdings of those entities and to interests associated with them. The Company has not been notified of any other holdings of ordinary share capital of 3% or more. None of these shareholders has voting rights that are different from those of the holders of the Company’s ordinary shares generally. As far as WPP is aware, it is neither directly nor indirectly owned or controlled by one or more corporations or by any government, or by any other natural or legal persons severally or jointly.
The number of outstanding ordinary shares at 31 December 2012 was 1,265,407,107 which includes the underlying ordinary shares represented by 10,159,573 ADSs. 222 share owners of record of WPP ordinary shares were US residents at 31 December 2012.
67
The geographic distribution of our share ownership as at 31 December 2012 is presented below:
| | | | |
United Kingdom | | | 36% | |
United States | | | 34% | |
Asia Pacific, Latin America, Africa & Middle East,
Canada and Continental Europe | | | 30% | |
Total | | | 100% | |
B. Related Party Transactions
From time to time the Group enters into transactions with its associated undertakings. These transactions were not material for any of the years presented.
C. Interests of Experts and Counsel
Not applicable.
68
ITEM 8. FINANCIAL INFORMATION
A. Consolidated Statements and Other Financial Information
See Item 18.
Outstanding legal proceedings
The Company has claims against others and there are claims against the Company in a variety of matters arising from the conduct of its business. In the opinion of the management of the Company, the ultimate liability, if any, that is likely to result from these matters would not have a material impact on the Company’s financial position, or on the results of its operations.
Dividend distribution policy
ADS holders are eligible for all stock dividends or other entitlements accruing on the underlying WPP plc shares and receive all cash dividends in US dollars. These are normally paid twice a year. Dividend cheques are mailed directly to the ADS holder on the payment date if ADSs are registered with WPP’s US Depositary, Citibank N.A. Dividends on ADSs that are registered with brokers are sent to the brokers, who forward them to ADS holders.
Dollar amounts paid to ADR holders depend on the sterling/dollar exchange rate at the time of payment.
B. Significant Changes
On 2 January 2013, the Scheme of Arrangement was completed between Old WPP and its share owners, as described in Item 4A, captioned “History and Development of the Company”.
69
ITEM 9. THE OFFER AND LISTING
A. Offer and Listing Details
Share price history
The Company’s ordinary shares have been traded on The London Stock Exchange since 1971.
The following table sets forth, for the periods indicated, the reported high and low middle-market quotations for the Company’s ordinary shares on The London Stock Exchange, based on its Daily Official List.
| | | | | | | | |
| | | £ per Ordinary Share | |
| | | High | | | Low | |
2008 | | | 6.48 | | | | 3.10 | |
2009 | | | 6.15 | | | | 3.53 | |
| | |
2010 | | | 7.95 | | | | 5.73 | |
| | |
2011 | | | | | | | | |
First Quarter | | | 8.47 | | | | 7.38 | |
Second Quarter | | | 7.90 | | | | 7.21 | |
Third Quarter | | | 7.86 | | | | 5.79 | |
Fourth Quarter | | | 6.88 | | | | 5.78 | |
| | |
2012 | | | | | | | | |
First Quarter | | | 8.80 | | | | 6.69 | |
Second Quarter | | | 8.74 | | | | 7.43 | |
Third Quarter | | | 8.73 | | | | 7.85 | |
October | | | 8.78 | | | | 7.88 | |
November | | | 8.57 | | | | 8.02 | |
December | | | 8.95 | | | | 8.56 | |
Fourth Quarter | | | 8.95 | | | | 7.88 | |
| | |
2013 | | | | | | | | |
January | | | 9.92 | | | | 9.06 | |
February | | | 10.67 | | | | 9.95 | |
March | | | 10.92 | | | | 10.41 | |
First Quarter | | | 10.92 | | | | 9.06 | |
70
The ordinary shares have traded in the United States since 29 December 1987 in the form of ADSs, which are evidenced by ADRs or held in book entry form. The Depositary for the ADSs is Citibank, N.A. in New York. The following table sets forth, for the periods indicated, the reported high and low sales prices of the ADSs as reported by NASDAQ.
| | | | | | |
| | | US dollars per ADS |
| | | High | | | Low |
2008 | | | 63.19 | | | 23.28 |
2009 | | | 49.99 | | | 24.54 |
| | |
2010 | | | 61.97 | | | 44.30 |
| | |
2011 | | | | | | |
First Quarter | | | 68.78 | | | 58.74 |
Second Quarter | | | 65.29 | | | 58.95 |
Third Quarter | | | 62.87 | | | 45.40 |
Fourth Quarter | | | 55.38 | | | 45.04 |
| | |
2012 | | | | | | |
First Quarter | | | 70.03 | | | 52.14 |
Second Quarter | | | 69.98 | | | 57.56 |
Third Quarter | | | 70.37 | | | 60.98 |
October | | | 70.42 | | | 63.90 |
November | | | 68.70 | | | 63.34 |
December | | | 72.90 | | | 68.60 |
Fourth Quarter | | | 72.90 | | | 63.34 |
| | |
2013 | | | | | | |
January | | | 78.43 | | | 72.81 |
February | | | 81.69 | | | 77.67 |
March | | | 81.78 | | | 78.96 |
First Quarter | | | 81.78 | | | 72.81 |
The Depositary held 50,797,868 ordinary shares as at 31 December 2012, approximately 4.01% of the outstanding ordinary shares, represented by 10,159,573 outstanding ADSs.
B. Plan of Distribution
Not applicable.
C. Markets
See the discussion under“Share price history” in Item 9A.
D. Selling Shareholders
Not applicable.
E. Dilution
Not applicable.
F. Expenses of the Issue
Not applicable.
71
ITEM 10. ADDITIONAL INFORMATION
A. Share Capital
Not applicable.
B. Memorandum and Articles of Association
WPP is a public limited company incorporated under the name “WPP plc” in Jersey with registered number 111714.
The following summarises certain provisions of our memorandum and articles of association and applicable Jersey law. This summary is qualified in its entirety by reference to the Jersey Companies Law and our memorandum and articles of association. A copy of our memorandum and articles of association in the form adopted by special resolution passed on 5 November 2012 and including amendments to reflect the change of name of WPP, which became effective on 2 January 2013, is an exhibit to this Form 20-F.
Objects and Purposes
Under the Jersey Companies Law, the capacity of a Jersey company is not limited by anything contained in its memorandum or articles of association. Accordingly, the memorandum of association of a Jersey company does not contain an objects clause.
Rights attaching to WPP ordinary shares
Voting rights of share owners – subject to disenfranchisement in the event of: (A) non-payment of any call or other sum due and payable in respect of any ordinary share; or (B) any non-compliance with any notice requiring disclosure of the beneficial ownership of any ordinary shares and subject to any special rights or restrictions as to voting for the time being attached to any ordinary shares (as to which there are none at present), on a show of hands every qualifying person (i.e. share owner, proxy or authorised corporate representative) present has one vote other than every proxy appointed by more than one member entitled to vote on the resolution who has two votes, one vote for and one against the resolution if: (i) one or more of the members instructed him to vote for and one or more of the members instructed him to vote against the resolution; or (ii) one or more of the members instructed him to vote for the resolution and one or more of the members gave him discretion as to how to vote and he exercises his discretion by voting against the resolution; or (iii) one or more of the members instructed him to vote against the resolution and one or more of the members gave him discretion as to how to vote and he exercises his discretion by voting for the resolution, and on a poll every share owner present in person or by proxy has one vote for every ordinary share of which he or she is a holder, except that any proxy who has been appointed by the Depositary shall have such number of votes as equals the number of ordinary shares in relation to which such proxy has been appointed. In the case of joint holders, the vote of the person whose name stands first in the register of members and who tenders a vote is accepted to the exclusion of any votes tendered by any other joint holders.
Return of capital on a winding up – the liquidator may, with the sanction of a special resolution of WPP and any other sanction required by the Statutes: (A) divide among the WPP share owners in specie the whole or any part of the assets of WPP; or (B) vest the whole or any part of the assets in trustees on such trusts for the benefit of share owners as the liquidator shall think fit, but no share owner shall be compelled to accept any assets upon which there is any liability. The “Statutes” means the Jersey Companies Law and every other statute, statutory instrument, regulation or order, for the time being in force, concerning companies registered under the Jersey Companies Law, including the Electronic Communication (Jersey) Law 2000 and the Companies (Uncertificated Securities) (Jersey) Order 1999 (as amended).
72
Capitalisation of reserves
The board of directors may, with the authority of an ordinary resolution of WPP: (A) resolve to capitalise any sum standing to the credit of any reserve account of WPP (including share premium account and capital redemption reserve) or any sum standing to the credit of profit and loss account not required for the payment of any preferential dividend (whether or not it is available for distribution); and (B) appropriate that sum as capital to the share owners in proportion to the nominal amount of the ordinary shares held by them respectively and apply that sum on their behalf in paying up in full any unissued ordinary shares or debentures of WPP of a nominal amount equal to that sum and allot the ordinary shares or debentures credited as fully paid to those share owners, or as they may direct, in those proportions or in paying up the whole or part of any amounts that are unpaid in respect of any issued ordinary shares held by them respectively, or otherwise deal with such sum as directed by the resolution, provided that the share premium account and the capital redemption reserve and any sum not available for distribution in accordance with the Statutes may only be applied in paying up unissued ordinary shares to be allotted credited as fully paid up.
Transfer of ordinary shares
Subject to any restrictions in the articles of association, a share owner may transfer all or any of his ordinary shares in any manner that is permitted by the Statutes and is from time to time approved by the board of directors. WPP shall register the transfer of any ordinary shares held in uncertificated form by means of a relevant system in accordance with the Statutes. The board of directors may, in its absolute discretion, refuse to register any transfer of an uncertificated share where permitted by articles of association and the Statutes.
A share owner may transfer all or any of his certificated ordinary shares by an instrument of transfer in any usual form, or in such other form as the board of directors may approve. The instrument of transfer shall be signed by or on behalf of the transferor and, except in the case of a fully paid share, by or on behalf of the transferee. The board of directors may, in its absolute discretion, refuse to register any transfer of any certificated ordinary share that is not fully paid up (but not so as to prevent dealings in ordinary shares admitted to official listing by the United Kingdom Listing Authority (UKLA) from taking place on an open and proper basis) or on which WPP has a lien. The board of directors may also refuse to register any instrument of transfer of a certificated ordinary share unless it is lodged at the registered office, or such other place as the board of directors may decide, for registration, accompanied by the share certificate for the ordinary shares to be transferred and such other evidence as the board of directors may reasonably require to prove title of the intending transferor or his right to transfer the ordinary shares and it is in respect of only one class of WPP shares. If the board of directors refuses to register a transfer of a certificated ordinary share it shall, as soon as practicable and in any event within two months after the date on which the instrument of transfer was lodged or the operator-instruction was received, give to the transferee notice of the refusal. The board of directors must provide the transferee with such further information about the reasons for the refusal as the transferee may reasonably request. Unless otherwise agreed by the board of directors in any particular case, the maximum number of persons who may be entered on the register as joint holders of an ordinary share is four.
Changes in capital
Subject to the provisions of the Jersey Companies Law, WPP may by special resolution:
| | • | | increase its share capital; |
| | • | | consolidate and divide all or any of its share capital into ordinary shares of a larger amount; |
| | • | | sub-divide all or part of its share capital into ordinary shares of a smaller amount; |
| | • | | cancel any ordinary shares that have not, at the date of the special resolution, been taken or agreed to be taken by any person and diminish the amount of its authorised share capital by the amount of the ordinary shares so cancelled; or |
| | • | | alter its share capital in any other manner permitted by the Jersey Companies Law. |
73
Subject to the provisions of the Jersey Companies Law, WPP may:
| | • | | purchase ordinary shares, including any redeemable ordinary shares; and |
| | • | | by special resolution, reduce its share capital and any capital redemption reserve or share premium account. |
Authority to allot securities and disapplication of pre-emption rights
WPP may from time to time pass an ordinary resolution authorising the board of directors to exercise all the powers of WPP to allot relevant securities up to the nominal amount specified in the resolution. The authority shall expire on the day specified in the resolution, not being more than five years after the date on which the resolution is passed. The term “relevant securities” means shares in WPP other than subscriber shares, or shares allotted pursuant to an employee share scheme, and any right to subscribe for or to convert any security into, shares in WPP. For the avoidance of doubt, any reference to the allotment of relevant securities includes the grant of such a right but not the allotment of shares pursuant to such a right.
On the passing of a special resolution, the board of directors shall have power to allot equity securities wholly for cash but that power shall be limited: (A) to the allotment of equity securities in connection with a rights issue; and (B) to the allotment (other than in connection with a rights issue) of equity securities having a nominal amount not exceeding in aggregate the sum specified in the special resolution.
Variation of rights
Whenever the share capital of WPP is divided into different classes of shares (which it is not as at the date of this document), all or any of the rights for the time being attached to any class of shares in issue may, subject to the Statutes, be varied, either in such manner as those rights may provide or with the consent in writing of the holders of two-thirds in nominal value of the issued ordinary shares of that class or with the sanction of a special resolution passed at a separate general meeting of the holders of those ordinary shares. At any separate general meeting, the necessary quorum is two persons holding or representing by proxy at least one-third in nominal amount of the issued ordinary shares of the class in question (but at any adjourned meeting, one person holding ordinary shares of the class or his proxy is a quorum).
Disclosure of interests in WPP’s shares
WPP may give a disclosure notice to any person whom it believes is either:
| | • | | interested in the WPP’s shares; or |
| | • | | has been so interested at any time during the three years on which the disclosure notice is issued. |
The disclosure notice may require the person:
| | • | | to confirm that fact or (as the case may be) to state whether or not it is the case; and |
| | • | | if he holds, or has during that time held, any such interest, to give such further information as may be required. |
The notice may require the person to whom it is addressed, where either:
| | • | | his interest is a present interest and another interest in the shares subsists; or |
| | • | | another interest in the shares subsisted during that three year period at a time when his interest subsisted, to give, so far as lies within his knowledge, such particulars with respect to that other interest as may be required by the notice including: |
| | • | | the identity of persons interested in the shares in question; and |
74
| | • | | whether persons interested in the same shares are or were parties to either an agreement to acquire interests in a particular company, or an agreement or arrangement relating to the exercise of any rights conferred by the holding of the shares. |
The notice may require the person to whom it is addressed, where his interest is a past interest, to give (so far as lies within his knowledge) particulars of the identity of the person who held that interest immediately upon his ceasing to hold it.
Failure to provide the information within 14 days after the notice has been given means that the holder of the relevant shares shall not be entitled to vote either personally or by proxy at a shareholders’ meeting or to exercise any other right confirmed by membership in relation to shareholder meetings for so long as the default continues (and, if those shares represent at least 0.25 percent of the issued shares of the class, the holder shall not be entitled to receive any payment by way of dividend or to transfer any rights in the shares).
Register of members
The register of members of WPP must be kept and maintained in Jersey.
Uncertificated shares – general powers
Subject to the Jersey Companies Law and the Companies Uncertificated Securities (Jersey) Order 1999 (as amended), the board of directors may permit any class of ordinary shares to be held in uncertificated form and to be transferred by means of a relevant system and may revoke such permission. In relation to any uncertificated share, WPP may utilise the relevant system in which it is held to the fullest extent available from time to time in the exercise of any of its powers or functions under the Statutes or the articles of association or otherwise in effecting any actions. Any provision in the articles of association in relation to uncertificated shares that is inconsistent with any applicable statutory provision shall not apply. WPP may, by notice to the holder of an uncertificated share, require the holder to change the form of that share to certificated form within such period as may be specified in the notice. For the purpose of effecting any action by WPP, the board of directors may determine that holdings of the same share owner in uncertificated form and in certificated form shall be treated as separate holdings but shares of a class held by a person in uncertificated form shall not be treated as a separate class from shares of that class held by that person in certificated form.
Directors
The WPP directors (other than alternate directors) shall not, unless otherwise determined by an ordinary resolution of WPP, be fewer than six in number.
A director need not be a share owner.
At each annual general meeting every director who held office on the date seven days before the date of the notice of annual general meeting shall retire from office, but shall be eligible for re-election.
The directors shall be paid fees not exceeding in aggregate £2,000,000 per annum (or such larger sum as WPP may, by ordinary resolution, determine) as the board of directors may decide to be divided among them. Such fee shall be divided among them in such proportion and manner as they may agree or, failing agreement, equally.
The board of directors may grant special remuneration to any director who performs any special or extra services to, or at the request of, WPP. Special remuneration may be payable to a director in addition to his ordinary remuneration (if any) as a director.
The directors shall also be paid out of the funds of WPP all expenses properly incurred by them in and about the discharge of their duties, including their expenses of travelling to and from the meetings of the board of directors, committee meetings and general meetings.
75
The board of directors may exercise all the powers of WPP to: (i) pay, provide, arrange or procure the grant of pensions or other retirement benefits, death, disability or sickness benefits, health, accident and other insurances or other such benefits, allowances, gratuities or insurances, including in relation to the termination of employment, to or for the benefit of any person who is or has been at any time a director of WPP or in the employment or service of WPP or of any body corporate that is or was associated with WPP or of the predecessors in business of WPP or any such associated body corporate, or the relatives or dependants of any such person. For that purpose, the board of directors may procure the establishment and maintenance of, or participation in, or contribution to, any pension fund, scheme or arrangement and the payments of any insurance premiums; (ii) establish, maintain, adopt and enable participation in any profit sharing or incentive scheme including shares, share options or cash or any similar schemes for the benefit of any director or employee of WPP or of any associated body corporate, and, subject to any restrictions under applicable legislation, to lend money to any such director or employee or to trustees on their behalf to enable any such schemes to be established, maintained or adopted; and (iii) support and subscribe to any institution or association that may be for the benefit of WPP or of any associated body corporate or any directors or employees of WPP or associated body corporate or their relatives or dependants or connected with any town or place where WPP or an associated body corporate carries on business, and to support and subscribe to any charitable or public object whatsoever.
Subject to any applicable statutory provisions and to declaring his interests in accordance with the articles of association, a director may enter into or be interested in any transaction or arrangement with WPP, either with regard to his tenure of any office or position in the management, administration or conduct of the business of WPP, or as vendor, purchaser or otherwise. A director may hold and be remunerated in respect of any other office or place of profit with WPP (other than the office of auditor of WPP) in conjunction with his office as a director and he (or his firm) may also act in a professional capacity for WPP (except as auditor) and may be remunerated for it.
A director who, to his knowledge, is in any way, whether directly or indirectly, interested in a transaction or arrangement or a proposed transaction or arrangement with WPP or any of its subsidiaries, or if any situation exists in which a director has or can have a direct or indirect interest that conflicts with or may conflict with the interests of WPP, shall disclose to WPP the nature and extent of the interest or situation in accordance with the articles of association.
A director shall not vote or be counted in the quorum at a meeting in respect of any resolution concerning his own appointment (including fixing and varying its terms), or the termination of his own appointment, as the holder of any office or place of profit with WPP or any other company in which WPP is interested but, where proposals are under consideration concerning the appointment (including fixing or varying its terms), or the termination of the appointment, of two or more directors to offices or places of profit with WPP or any company in which WPP is interested, those proposals may be divided and considered in relation to each director separately, and in such case each of the directors concerned (if not otherwise debarred from voting under the articles of association) shall be entitled to vote and be counted in the quorum in respect of each resolution except that concerning his own appointment or the termination of his own appointment.
A director shall not vote (or be counted in the quorum at a meeting) in respect of any transaction or arrangement or other proposal in which he has an interest that (together with any interest of a connected person) is to his knowledge a direct or indirect interest and as may reasonably be required as likely to give rise to a conflict. Notwithstanding the above, a director shall be entitled to vote (and be counted in the quorum) on: (A) any transaction or arrangement in which he is interested by virtue of an interest in ordinary shares, debentures or other securities of WPP or otherwise in or through WPP; (B) the giving of any guarantee, security or indemnity in respect of money lent or obligations incurred by him or by any other person at the request of, or for the benefit of, WPP or any of its subsidiaries; or a debt or obligation of WPP or any of its subsidiaries for which he himself has assumed responsibility under a guarantee or indemnity or by the giving of security; (C) (subject to the Statutes) indemnification (including loans made in connection with it) by WPP in relation to the performance of his duties on behalf of WPP or any of its subsidiaries; (D) any issue or offer of ordinary shares, debentures or other securities of WPP or any of its subsidiaries in respect of which he is or may be entitled to participate in his
76
capacity as holder of any such securities or as an underwriter or sub-underwriter; (E) any transaction or arrangement concerning another company in which he and any connected person do not to his knowledge hold, directly or indirectly as shareholders, or through their direct or indirect holdings of financial instruments (within the meaning of Chapter 5 of the Disclosure and Transparency Rules) voting rights representing one percent or more of any class of shares in the capital of such company; (F) any arrangement for the benefit of employees of WPP or any of its subsidiaries that does not accord to him any privilege or benefit not generally accorded to the employees to whom the arrangement relates; and (G) the purchase or maintenance of insurance for the benefit of the directors or for the benefit of persons including the directors. “Disclosure and Transparency Rules” means the rules and regulations made by the Financial Services Authority in its capacity as the UK Listing Authority under Part VI of the UK Financial Services and Markets Act of 2000, as amended, and contained in the UK Listing Authority’s publication of the same name.
WPP shall not make a payment for loss of office to a director unless the payment has been approved by an ordinary resolution of WPP.
General meetings
The board of directors shall convene, and WPP shall hold, an annual general meeting in accordance with the Statutes. Other general meetings shall be held whenever the board of directors thinks fit or on the requisition of WPP share owners in accordance with the Statutes or the articles of association.
An annual general meeting shall be called by not less than 21 days’ written notice and any other general meeting shall be called by not less than 14 clear days’ written notice.
The requisite quorum for general meetings of WPP shall be two qualifying persons, entitled to vote on the business to be transacted at the meeting.
Borrowing powers
The board of directors may exercise all the powers of WPP to borrow money and to mortgage or charge all or any part of its undertaking, property and assets (both present and future) and uncalled capital and to issue debentures and other securities, whether outright or as collateral security for any debt, liability or obligations of WPP or of any third party. The board of directors shall restrict the borrowings of WPP and exercise all voting and other rights or powers of control exercisable by WPP in relation to its subsidiaries (if any) so as to secure (as regards subsidiaries only so far as by such exercise it can secure) that the aggregate principal amount outstanding at any time in respect of all borrowings by the WPP Group (exclusive of any borrowings that are owed by one WPP Group company to another WPP Group company) after deducting the amount of cash deposited will not, without the previous sanction of WPP in general meeting, exceed an amount equal to 2.5 times the adjusted capital and reserves (as defined in the articles of association) or any higher limit fixed by ordinary resolution of WPP that is applicable at the relevant time. “WPP Group” means WPP and its subsidiaries and subsidiary undertakings and, where the context requires, its associated undertakings.
To date, no resolution of the type referred to in the paragraph above has been passed.
Dividends
Declaration of dividends – subject to the provisions of the Jersey Companies Law, WPP may, by ordinary resolution, declare a dividend to be paid to the share owners, according to their respective rights and interests in the profits, and may fix the time for payment of such dividend, but no dividend shall exceed the amount recommended by the board of directors.
Fixed and interim dividends – subject to the provisions of the Jersey Companies Law, the board of directors may pay such interim dividends as appear to the board of directors to be justified by the financial position of WPP and
77
may also pay any dividend payable at a fixed rate at intervals settled by the board of directors whenever the financial position of WPP, in the opinion of the board of directors, justifies its payment. If the board of directors acts in good faith, none of the directors shall incur any liability to the share owners conferring preferred rights for any loss such share owners may suffer in consequence of the lawful payment of an interim dividend on any shares having non-preferred or deferred rights.
Calculation and currency of dividends – except insofar as the rights attaching to, or the terms of issue of, any shares otherwise provide: (A) all dividends shall be declared and paid according to the amounts paid up on the shares in respect of which the dividend is paid, but no amount paid up on a share in advance of calls shall be treated as paid up on the share; (B) all dividends shall be apportioned and paid pro rata according to the amounts paid up on the shares during any portion or portions of the period in respect of which the dividend is paid; (C) any amount paid by WPP by way of dividend will be deemed to include any amount that WPP may be compelled by law to withhold or deduct; and (D) dividends may be declared or paid in any currency. The board of directors may agree with any share owner that dividends that may at any time or from time to time be declared or become due on his or her ordinary shares in one currency shall be paid or satisfied in another, and may agree the basis of conversion to be applied and how and when the amount to be paid in the other currency shall be calculated and paid and for WPP or any other person to bear any costs involved.
Dividends not to bear interest – no dividend or other moneys payable by WPP on or in respect of any share shall bear interest as against WPP unless otherwise provided by the rights attached to the share.
Calls or debts or amounts required by law may be deducted from dividends – the board of directors may deduct from any dividend or other moneys payable to any person (either alone or jointly with another) on or in respect of a share all such sums as may be due from him (either alone or jointly with another) to WPP on account of calls or otherwise in relation to shares.
Dividends in specie – with the authority of an ordinary resolution of WPP and on the recommendation of the board of directors, payment of any dividend may be satisfied wholly or in part by the distribution of specific assets and in particular of paid up ordinary shares or debentures of any other company.
Scrip dividends – the board of directors may, with the authority of an ordinary resolution of WPP, offer any share owners the right to elect to receive further ordinary shares (whether or not of that class) credited as fully paid, by way of scrip dividend instead of cash in respect of all (or some part) of any dividend specified by the ordinary resolution.
Unclaimed dividends – any dividend unclaimed for a period of 12 years after having become due for payment shall be forfeited and cease to remain owing by WPP.
Forfeiture of shares
If the whole or any part of any call or installment remains unpaid on any share after the due date for payment, the board of directors may serve a written notice on the share owner requiring him to pay so much of the call or installment as remains unpaid, together with any accrued interest.
The written notice shall state a further day, being not less than 14 clear days from the date of the notice, on or before which, and the place where, payment is to be made and shall state that, in the event of non-payment on or before the day and at the place appointed, the share in respect of which the call was made or installment is payable will be liable to be forfeited.
If the requirements of a notice are not complied with, any share in respect of which it was given may (before the payment required by the notice is made) be forfeited by a resolution of the board of directors. The forfeiture shall include all dividends declared and other moneys payable in respect of the forfeited share and not actually paid before the forfeiture.
78
Every share that is forfeited or surrendered shall become the property of WPP and (subject to the Statutes) may be sold, re-allotted or otherwise disposed of, upon such terms and in such manner as the board of directors shall decide either to the person who was before the forfeiture the share owner or to any other person and whether with or without all or any part of the amount previously paid up on the share being credited as so paid up.
Website communication with share owners
The articles of association enable WPP to use its website as a means of sending or supplying documents or information to share owners. Before communicating with a share owner by means of its website, WPP must have asked the share owner, individually, to agree (generally or specifically) that WPP may send or supply documents or information to him by means of a website. A member shall be deemed to have agreed that WPP may send or supply a document or information by means of a website if no response to the request is received within 28 days. When communicating with share owners by means of website communications, WPP will notify the share owners (by post or other permitted means) of the presence of a document or information on the website.
Directors’ indemnity, insurance and defence
As far as the legislation allows, WPP may:
(i) indemnify any director (or of an associated body corporate) against any liability;
(ii) indemnify a director of a company that is a trustee of an occupational pension scheme for employees (or former employees) of WPP (or of an associated body corporate) against liability incurred in connection with WPP’s activities as trustee of the scheme;
(iii) purchase and maintain insurance against any liability for any director referred to in paragraph (i) or (ii) above; and
(iv) provide any director referred to in paragraph (i) or (ii) above with funds (whether by loan or otherwise) to meet expenditure incurred or to be incurred by him in defending any criminal, regulatory or civil proceedings or in connection with an application for relief (or to enable any such director to avoid incurring such expenditure).
Takeover Bids
The City Code on Takeovers and Mergers (the “City Code”) applies to WPP. Under the City Code, if an acquisition of ordinary shares were to increase the aggregate holding of an acquirer and its concert parties to ordinary shares carrying 30% or more of the voting rights in WPP, the acquirer (and, depending upon the circumstances, its concert parties) would be required, except with the consent of the Panel on Takeovers and Mergers (an independent body in the United Kingdom), to make a cash offer for the outstanding ordinary shares at a price not less than the highest price paid for the ordinary shares by the acquirer or its concert parties during the previous 12 months. A similar obligation to make a such a mandatory offer would also arise on the acquisition of ordinary shares by a person holding (together with its concert parties) ordinary shares carrying between 30% and 50% of the voting rights in WPP if the effect of such acquisition were to increase that person’s percentage of the voting rights they hold in ordinary shares.
The Jersey Companies Law provides that where a person (the “Offeror”) makes a takeover offer to acquire all of the shares (or all of the shares of any class) in a Jersey company (other than any shares already held by the Offeror at the date of the offer), if the Offeror has by virtue of acceptances of the offer acquired or contracted to acquire not less than 90% in nominal value of the shares (or class of shares) to which the offer relates, the Offeror may (subject to the requirements if the Jersey Companies Law), by notice to the holders of the shares (or class of shares) to which the offer relates which the Offeror has not already acquired or contracted to acquire, compulsorily acquire those shares. A holder of any shares who receives a notice of compulsory acquisition may, within six weeks from the date on which such notice was given apply to the Royal Court of Jersey (the “Jersey Court”) for an order that the Offeror not be entitled and bound to purchase the holder’s shares or that the Offeror purchase the holder’s shares on terms different to those of the Offeror’s offer.
79
Where before the end of the period within which the takeover offer can be accepted, the Offeror has by virtue of acceptances of the offer acquired or contracted to acquire not less than 90% in nominal value of all of the shares (or all of the shares of a particular class) of the Jersey company, the holder of any shares (or class of shares) to which the offer relates who has not accepted the offer may, by written notice to the Offeror, require the Offeror to acquire the holder’s shares. The Offeror shall (subject to the requirements of the Jersey Companies Law) be entitled and bound to acquire the holder’s shares on the terms of the offer or on such other terms as may be agreed. Where a holder gives the Offeror a notice of compulsory acquisition, each of the Offeror and the holder of the shares is entitled to apply to the Jersey Court for an order that the terms on which the Offeror is entitled and bound to acquire the holder’s shares shall be such as the Jersey Court thinks fit.
C. Material Contracts
The following is a summary of each contract (not being a contract entered into in the ordinary course of business) that has been entered into by any member of the WPP Group: (a) within the two years immediately preceding the date of this Form 20-F which are, or may be, material to the WPP Group; or (b) at any time which contain obligations or entitlements which are, or may be, material to the WPP Group as at the date of this Form 20-F:
(i) On 3 August 1998, WPP 2005 Limited entered into an agreement with Asatsu pursuant to which WPP 2005 Limited subscribed for approximately 23% (at that time) of the share capital of Asatsu for approximately £139 million and Asatsu subscribed for 31,295,646 ordinary shares in WPP 2005 Limited representing approximately 4% (at that time) of the issued share capital of WPP 2005 Limited. Each party agreed not to transfer any shares held by them in the other for a period of five years and thereafter only to transfer such shares following a procedure set out in the agreement. Each party is further entitled to nominate a non-executive director to the board of the other subject to retaining its shareholding in the other. Due to the disparity of the percentage shareholdings of WPP 2005 Limited in Asatsu and of Asatsu in WPP 2005 Limited, an agreement was also entered into on 3 August 1998 imposing,inter alia, limitations, in certain circumstances, on the voting rights in respect of the shares held by WPP 2005 Limited in Asatsu;
(ii) On 23 June 2004, WPP Finance (UK) issued US$650,000,000 of 5.875% notes due 2014 pursuant to the Indenture and the First Supplemental Indenture both dated as at 23 June 2004 among WPP Finance (UK), as Issuer, WPP 2005 Limited, as guarantor and Citibank N.A., as Trustee. The Notes were fully and unconditionally guaranteed by WPP 2008 Limited pursuant to the Second Supplemental Indenture dated 27 June 2006 and by Young & Rubicam Brands US Holdings (a subsidiary of WPP) pursuant to the Third Supplemental Indenture dated 19 December 2006. The Notes were fully and unconditionally guaranteed by WPP 2012 Limited (formerly known as WPP plc) and WPP Air 1 Limited (a subsidiary of WPP) pursuant to the Fourth Supplemental Indenture dated 7 October 2008 and the Fifth Supplemental Indenture dated 30 April 2009. The Indenture contains events of default provisions (including a cross-default provision). It also contains a restriction on the Issuer or any of the guarantors referred to above consolidating or merging with any other person and conveying, transferring or leasing all or substantially all of their properties and assets to any person except where the entity resulting from such consolidation or merger or to whom such properties and assets are transferred becomes a primary obligor of the Notes and gives certain certificates and indemnities. The covenants of the Indenture also contain a negative pledge and a limitation on the sale and leaseback of any assets by the guarantors referred to above and their principal subsidiaries. The Indenture allows for defeasance of these covenants subject to certain conditions. The Indenture also contains a joint and several indemnity from the Issuer and the guarantors referred to above in favour of the Trustee. On 2 December 2011, holders exchanged US$281,369,000 of the foregoing notes for $312,387,000 principal amount of 4.75% guaranteed senior notes due November 2021 issued by WPP Finance 2010 and guaranteed by WPP 2012 Limited, WPP Air 1 Limited, WPP 2008 Limited and WPP 2005 Limited. The outstanding principal of the 5.875% notes due 2014 is therefore now US$368,631,000. In the Sixth Supplemental Indenture dated 14 December 2012, arrangements were made for WPP plc and
80
WPP Jubilee Limited to accede as additional guarantors subject to the court approval of the scheme of arrangement referred to in the above;
(iii) On 5 December 2006, WPP 2008 Limited issued EUR 600,000,000 4.375% guaranteed bonds due 2013. The bonds are guaranteed by WPP 2005 Limited and were constituted by a Trust Deed dated 5 December 2006 between Citicorp Trustee Company Limited, the guarantor and WPP 2008 Limited. The administration of payments to bondholders is provided for in a Paying Agency Agreement dated 5 December 2006 between WPP 2008 Limited, Citibank, N.A., London Branch and others. The bonds are listed on the London Stock Exchange and the terms and conditions contain a redemption provision at the option of the bondholders on a Change of Control, a negative pledge provision and the events of default provisions in the terms and conditions contain a cross-default provision. The Trust Deed also contains an indemnity by WPP 2008 Limited in favour of Citicorp Trustee Company Limited. Pursuant to a supplemental trust deed dated 14 November 2008, WPP 2012 Limited (formerly known as WPP plc), WPP Air 1 Limited and WPP Air 3 Limited acceded as additional guarantors to the bonds. In a second supplemental trust deed dated 14 December 2012, arrangements were made for WPP 2008 Limited to be substituted by WPP plc as issuer and WPP 2008 Limited and WPP Jubilee Limited to accede as additional guarantors subject to the court approval of the scheme of arrangement referred to in the above;
(iv) On 4 April 2007, WPP 2008 Limited issued £400,000,000 6.0% guaranteed bonds due 2017. The bonds are guaranteed by WPP 2005 Limited and were constituted by a Trust Deed dated 4 April 2007 between Citicorp Trustee Company Limited, the guarantor and WPP 2008 Limited. The bonds are listed on the London Stock Exchange and the terms and conditions contain a redemption provision at the option of the bondholders on a Change of Control, a negative pledge provision and events of default provisions (including a cross-default provision). The Trust Deed also contains an indemnity by WPP 2008 Limited in favour of Citicorp Trustee Company Limited. Pursuant to a supplemental trust deed dated 14 November 2008, WPP 2012 Limited (formerly known as WPP plc), WPP Air 1 Limited and WPP Air 3 Limited acceded as additional guarantors to the bonds. In a second supplemental trust deed dated 14 December 2012, arrangements were made for WPP plc to substitute WPP 2008 Limited as issuer and for WPP 2008 Limited and WPP Jubilee Limited to accede as additional guarantors subject to the court approval of the scheme of arrangement referred to in the above;
(v) On 6 November 2007, WPP Finance S.A. issued EUR 500,000,000 5.25% guaranteed bonds due 2015 and £200,000,000 6.375% guaranteed bonds due 2020. Both tranches of bonds are guaranteed by WPP 2005 Limited and WPP 2008 Limited and were constituted respectively by two Trust Deeds dated 6 November 2007 between Citicorp Trustee Company Limited, the guarantors and WPP Finance S.A. The bonds are listed on the London Stock Exchange and the terms and conditions contain a redemption provision at the option of the bondholders on a Change of Control, a negative pledge provision and events of default provisions (including a cross-default provision). The Trust Deeds also contain indemnities by WPP Finance S.A. in favour of Citicorp Trustee Company Limited. Pursuant to a supplemental trust deed dated 14 November 2008, WPP 2012 Limited (formerly known as WPP plc), WPP Air 1 Limited and WPP Air 3 Limited acceded as additional guarantors to the bonds. In two second supplemental trust deeds for each of the bonds respectively dated 14 December 2012, arrangements were made for WPP plc and WPP Jubilee Limited to accede as additional guarantors subject to the court approval of the scheme of arrangement referred to in the above;
(vi) On 12 May 2008, WPP 2008 Limited issued EUR 750,000,000 6.625% guaranteed bonds due 2016. The bonds are guaranteed by WPP 2005 Limited and were constituted by a Trust Deed dated 12 May 2008 between Citicorp Trustee Company Limited, the guarantor and WPP 2008 Limited. The bonds are listed on the London Stock Exchange and the terms and conditions contain a redemption provision at the option of the bondholders on a Change of Control, a negative pledge provision and events of default provisions (including a cross-default provision). The Trust Deed also contains an indemnity by WPP 2008 Limited in favour of Citicorp Trustee Company Limited. Pursuant to a
81
supplemental trust deed dated 14 November 2008, WPP 2012 Limited (formerly known as WPP plc), WPP Air 1 Limited and WPP Air 3 Limited acceded as additional guarantors to the bonds. In a second supplemental trust deed dated 14 December 2012, arrangements were made for WPP 2008 Limited to be substituted by WPP plc as issuer, and WPP 2008 Limited and WPP Jubilee Limited to accede as additional guarantors subject to the court approval of the scheme of arrangement referred to in the above;
(vii) On 19 May 2009, WPP 2012 Limited (formerly known as WPP plc) issued £450,000,000 of 5.75% guaranteed convertible bonds due 2014. The bonds are guaranteed by WPP 2008 Limited, WPP 2005 Limited, WPP Air 1 Limited and WPP Air 3 Limited and were constituted by a trust deed dated May 19, 2009. The bonds are listed on the London Stock Exchange and the terms and conditions contain a conversion provision allowing bondholders to convert their bonds into ordinary shares of WPP within a specified period. The bonds contain a conversion option upon a Change of Control, a negative pledge and events of default provisions (including a cross default provision). The trust deed contains an indemnity in favour of Citicorp Trustee Company Limited. In a supplemental trust deed dated 14 December 2012, arrangements were made for: (i) WPP 2012 Limited to be substituted by WPP plc as issuer; and (ii) WPP Jubilee Limited to accede as additional guarantors subject to the court approval of the scheme of arrangement referred to in the above;
(viii) On 10 June 2009, WPP Finance (UK) issued US$600,000,000 of 8% guaranteed senior notes due 2014 pursuant to the Indenture and the First Supplemental Indenture both dated as at 10 June 2009 among WPP Finance (UK) as Issuer, WPP 2012 Limited (formerly known as WPP plc), WPP Air 1 Limited, WPP 2008 Limited and WPP 2005 Limited as Guarantors, and Wilmington Trust Company, as Trustee. The indenture contains events of default provisions (including a cross-default provision). It also contains a restriction on the Issuer or any of the Guarantors referred to above consolidating or merging with any other person and conveying, transferring or leasing all or substantially all of their properties and assets to any person except where the entity resulting from such consolidation or merger or to whom such properties and assets are transferred becomes a primary obligor of the notes and gives certain certificates and indemnities. The covenants of the Indenture also contain a negative pledge and a limitation on the sale and leaseback of any assets by the Guarantors referred to above and their principal subsidiaries. The Indenture allows for defeasance of these covenants subject to certain conditions. The holders of the notes have the right to require the Issuer to repurchase the notes at a price equal to 101% of the principal amount of the notes in the event that there is a Change of Control of WPP plc and the notes lose their investment grade rating. The Indenture also contains a joint and several indemnity from the Issuer and the Guarantors referred to above in favour of the Trustee. In the Second Supplemental Indenture dated 14 December 2012, arrangements were made for WPP plc and WPP Jubilee Limited to accede as additional guarantors subject to the court approval of the scheme of arrangement referred to in the above;
(ix) On 2 November 2011, WPP Finance 2010 issued US$500,000,000 of 4.75% guaranteed senior notes due November 2021. In December 2011 WPP Finance 2010 issued an additional $312,387,000 of 4.75% guaranteed senior notes due November 2021 in exchange for $281,369,000 of outstanding 5.875% Senior Notes due 2014 of WPP Finance (UK). In total, WPP Finance 2010 issued US$812,387,000 of the 4.75% guaranteed senior notes due November 2021 pursuant to the Indenture and the First Supplemental Indenture, both dated as at 2 November 2011, among WPP Finance 2010 as Issuer, WPP plc, WPP Air 1 Limited, WPP 2008 Limited and WPP 2005 Limited as Guarantors, and Wilmington Trust National Association as Trustee, Citibank, N.A., as Security Registrar and Principal Paying Agent and Citibank N.A., London Branch as Paying Agent. Aside from the coupon and repayment date, the terms and conditions of the notes are the same as those for the $600,000,000 8% notes due September 2014 described above. In the Fourth Supplemental Indenture dated 14 December 2012, arrangements were made for WPP plc and WPP Jubilee Limited to accede as additional guarantors subject to the court approval of the scheme of arrangement referred to in the above;
82
(x) On 30 November 2011, WPP CP Finance plc, WPP Finance Co. Limited and WPP Group Canada Finance Inc (as borrowers), guaranteed by WPP 2012 Limited (formerly known as WPP plc) , WPP 2005 Limited, WPP 2008 Limited, WPP Air 1 Limited and WPP CP Finance plc entered into an agreement for a five-year multi-currency revolving credit facility (with a US Dollar swingline option) for US$1.05 billion and £375 million with a syndicate of banks and Citibank International plc as facility agent. The facility is available for drawing by way of multi-currency cash advances on a revolving basis, with an option to draw US Dollar swingline advances up to a sub-limit of US$825 million. The rate of margin for the facility is, if the long-term unsecured and non-credit enhanced debt rating of WPP published by Moody’s and Standard & Poor’s (theCredit Rating) is A-/A3 or higher, 0.55% per annum. If the Credit Rating is BBB+ or Baa1, the rate of margin for the facility shall be 0.65% per annum. If the Credit Rating is BBB or Baa2, the rate of margin for the facility is 0.75% per annum. If the Credit Rating is BBB- or Baa3, the rate of margin for the facility is 0.95% per annum. If the Credit Rating is BB+ or Ba1 or lower, the rate of margin for the facility is 1.25% per annum. If Moody’s and Standard & Poor’s assign different Credit Ratings, the margin shall be the average of the margins determined by each of Moody’s and Standard & Poor’s. The commitment fee payable on undrawn commitments is equal to 35% of the then applicable margin. A utilisation fee of 0.20% per annum is payable on US dollar outstandings on any day on which the US dollar amount of dollar outstandings exceed 33% of the total dollar facility commitments but is less than or equal to 66% of the total dollar facility commitments. A utilisation fee of 0.40% per annum is payable on US dollar outstandings on any day on which the US dollar amount of dollar outstandings exceed 66% of the total dollar facility commitments. A utilisation fee of 0.20% per annum is payable on sterling outstandings on any day on which the sterling amount of sterling outstandings exceed 33% but is less than or equal to 66% of the total sterling facility commitments. A utilisation fee of 0.40% per annum is payable on sterling outstandings on any day on which the sterling amount of sterling outstandings exceed 66% of the total sterling facility commitments. The facility agreement contains customary representations, covenants and events of default. The interest rate for swingline advances is the higher of the US prime commercial lending rate and 0.50% per annum above the federal funds rate. In an Amendment and Restatement agreement dated 14 December 2012, arrangements were made for WPP plc and WPP Jubilee Limited to accede as additional guarantors subject to the court approval of the scheme of arrangement referred to in the above;
(xi) On 7 September 2012, WPP Finance 2010 issued US$500,000,000 3.625% guaranteed senior notes due September 2022 and $300,000,000 5.125% guaranteed senior notes due 2042. These notes were issued under the Indenture dated as at 2 November 2011, described above, as supplemented by the Second Supplemental Indenture and the Third Supplemental Indenture, respectively, each dated as at 7 September 2012, among WPP Finance 2010 as issuer, WPP 2012 Limited (formerly known as WPP plc), WPP Air 1 Limited, WPP 2008 Limited and WPP 2005 Limited as guarantors, Wilmington Trust, National Association as trustee, Citibank, N.A., as security registrar and Principal Paying Agent and Citibank, N.A., London Branch as Paying Agent. Aside from the coupon and repayment date, the terms and conditions of these notes are the same as those for the $600,000,000 8% notes due September 2014 described above. In the Fourth Supplemental Indenture dated 14 December 2012, arrangements were made for WPP plc and WPP Jubilee Limited to accede as additional guarantors subject to the court approval of the scheme of arrangement referred to above;
(xii) On 2 January 2013, WPP plc entered into a deposit agreement with Citibank, N.A., as US Depositary, and the holders and beneficial owners of ADSs that sets out the terms on which the US Depositary has agreed to act as depositary with respect to WPP ADSs The deposit agreement contains, amongst other things, customary provisions pertaining to the form of ADRs, the deposit and withdrawal of ordinary shares, distributions to holders of ADSs, voting of ordinary shares underlying ADSs, obligations of the US Depositary and WPP plc, charges of the US Depositary, and compliance with U.S. securities laws.
83
D. Exchange Controls
There are currently no Jersey foreign exchange control restrictions on remittances of dividends on the ordinary shares or on the conduct of the Registrant’s operations.
E. Taxation
The taxation discussion set forth below is intended only as a descriptive summary and does not purport to be a complete technical analysis or listing of all potential tax effects relevant to a decision to purchase, hold or in any way transfer ordinary shares or ADSs. Each investor should seek advice based on their individual particular circumstances from an independent tax adviser.
The following summary of the Jersey (UK in relation to dividend distributions) and the United States tax consequences is not exhaustive of all possible tax considerations and should not be considered legal or tax advice. In addition, this summary does not represent a detailed description of the tax consequences applicable to persons subject to special treatment under Jersey and United States tax laws. Prospective purchasers of ADSs are advised to satisfy themselves as to the overall tax consequences of their ownership of ADSs and the ordinary shares represented thereby by consulting their own tax advisors. In addition, this summary only addresses holders that hold ordinary shares or ADSs as capital assets, and it does not address the taxation of a United States shareholder (either corporate or individual) where that shareholder controls, or is deemed to control, 10% or more of the voting stock of the Company.
References in this discussion to WPP Shares include references to WPP ADSs and corresponding references to WPP Share Owners (or holders of WPP ADSs) include references to holders of WPP ADSs, unless indicated otherwise.
United Kingdom, Jersey and the United States taxation
United Kingdom taxation
Tax on dividends
The Company will not be required to withhold UK tax at source from dividend payments it makes.
WPP Share Owners who are resident outside the UK for tax purposes will not generally be able to claim repayment from HMRC of any part of the tax credit attaching to dividends received from WPP, although this will depend on the existence and terms of any double taxation convention between the UK and the country in which such WPP Share Owner is resident. A WPP Share Owner resident outside the UK may also be subject to taxation on dividend income under local law. A WPP Share Owner who is not solely resident in the UK for tax purposes should consult his own tax advisers concerning his tax liabilities (in the UK and any other country) on dividends received from WPP, whether they are entitled to claim any part of the tax credit and, if so, the procedure for doing so, and whether any double taxation relief is due in any country in which they are subject to tax.
Taxation of disposals
An individual WPP Share Owner who has ceased to be resident or ordinarily resident for tax purposes in the UK for a period of less than five tax years and who disposes of all or part of his WPP Shares during that period may be liable to capital gains tax in respect of any chargeable gain arising from such a disposal on his return to the UK, subject to any available exemptions or reliefs.
Stamp duty and stamp duty reserve tax (SDRT)
No UK stamp duty or SDRT will be payable on the issue of WPP Shares. UK stamp duty should generally not need to be paid on a transfer of the WPP Shares. No UK SDRT will be payable in respect of any agreement to
84
transfer WPP Shares unless they are registered in a register kept in the UK by or on behalf of WPP. It is not intended that such a register will be kept in the UK.
The statements in this paragraph summarise the current position on stamp duty and SDRT and are intended as a general guide only. Special rules apply to agreements made by, amongst others, intermediaries and certain categories of person may be liable to stamp duty or SDRT at higher rates.
Jersey taxation
General
The following summary of the anticipated tax treatment in Jersey of WPP and WPP Share Owners and holders of WPP ADSs (other than residents of Jersey) is based on Jersey taxation law as it is understood to apply at the date of this Form 20-F. It does not constitute legal or tax advice. WPP Share Owners or holders of WPP ADSs should consult their professional advisers on the implications of acquiring, buying, holding, selling or otherwise disposing of WPP Shares or WPP ADSs under the laws of the jurisdictions in which they may be liable to taxation. WPP Share Owners or holders of WPP ADSs should be aware that tax rules and practice and their interpretation may change.
Income Tax
(a) WPP
Under the Jersey Income Tax Law, WPP will be regarded as either:
(i) not resident in Jersey under Article 123(1) of the Jersey Income Tax Law provided that (and for so long as) it satisfies the conditions set out in that provision, in which case WPP will not (except as noted below) be liable to Jersey income tax; or
(ii) resident in Jersey and will fall under Article 123C of the Jersey Income Tax Law, in which case WPP (being neither a financial services company nor a specified utility company under the Jersey Income Tax Law at the date hereof) will (except as noted below) be subject to Jersey income tax at a rate of 0 per cent.
WPP is tax resident in the United Kingdom and therefore should not be regarded as resident in Jersey.
(b) Holders of WPP Shares
WPP will be entitled to pay dividends to holders of WPP Shares without any withholding or deduction for or on account of Jersey tax. Holders of WPP Shares (other than residents of Jersey) will not be subject to any tax in Jersey in respect of the holding, sale or other disposition of such WPP Shares.
Under Jersey law and the WPP Articles, WPP is only permitted to pay a dividend to a person who is recorded in its register of members as the holder of a WPP Share. The US Depositary will be recorded in WPP’s register of members as the holder of each WPP Share represented by a WPP ADS. Accordingly, WPP will pay all dividends in respect of each WPP Share represented by a WPP ADS to the US Depositary (as the registered holder of each such WPP Share) rather than to the holder of the ADS.
The US Depositary will not be subject to any tax in Jersey in respect of the holding, sale or other disposition of the WPP Shares held by it. In addition, holders of the WPP ADSs (other than residents of Jersey) should not be subject to any tax in Jersey in respect of the holding, sale or other disposition of such WPP ADSs.
85
Goods and services tax
WPP is an “international services entity” for the purposes of the Goods and Services Tax (Jersey) Law 2007 (theGST Law). Consequently, WPP is not required to:
(a) register as a taxable person pursuant to the GST Law;
(b) charge goods and services tax in Jersey in respect of any supply made by it; or
(c) subject to limited exceptions that are not expected to apply to WPP, pay goods and services tax in Jersey in respect of any supply made to it.
Stamp duty
No stamp duty is payable in Jersey on the issue orinter vivostransfer of WPP Shares or WPP ADSs.
Upon the death of a WPP Share Owner, a grant of probate or letters of administration will be required to transfer the WPP Shares of the deceased person. However, WPP may (at its discretion) dispense with this requirement where: (a) the deceased person was domiciled outside of Jersey at the time of death; and (b) the value of the deceased’s movable estate in Jersey (including any WPP Shares) does not exceed £10,000.
Upon the death of a WPP Share Owner, where the deceased person was domiciled outside of Jersey at the time of death, Jersey stamp duty will be payable on the registration in Jersey of a grant of probate or letters of administration, which will be required in order to transfer or otherwise deal the deceased person’s personal estate situated in Jersey (including any WPP Shares) if the net value of such personal estate exceeds £10,000.
The rate of stamp duty payable is:
| | (i) | | (where the net value of the deceased person’s relevant personal estate is more than £10,000 but does not exceed £100,000) 0.50 per cent. of the net value of the deceased person’s relevant personal estate; or |
| | (ii) | | (where the net value of the deceased person’s relevant personal estate exceeds £100,000) £500 for the first £100,000 plus 0.75 per cent. of the net value of the deceased person’s relevant personal estate which exceeds £100,000. |
In addition, application and other fees may be payable.
86
US federal income taxation
Introduction
TO ENSURE COMPLIANCE WITH TREASURY DEPARTMENT CIRCULAR 230, HOLDERS OF WPP SHARES OR WPP ADSs ARE HEREBY NOTIFIED THAT: (A) ANY DISCUSSION OF US FEDERAL TAX ISSUES IS NOT INTENDED OR WRITTEN TO BE RELIED UPON, AND CANNOT BE RELIED UPON, BY HOLDERS OF WPP SHARES OR WPP ADSs FOR THE PURPOSE OF AVOIDING PENALTIES THAT MAY BE IMPOSED ON, HOLDERS OF WPP SHARES OR WPP ADSs UNDER THE INTERNAL REVENUE CODE OF 1986; AND (C) HOLDERS OF WPP SHARES OR WPP ADSs SHOULD SEEK ADVICE BASED ON THEIR PARTICULAR CIRCUMSTANCES FROM AN INDEPENDENT TAX ADVISER.
The following is a summary of certain material US federal income tax consequences of the ownership and disposition of WPP Shares or WPP ADSs by a US Holder (as defined below). This summary deals only with initial acquirers of WPP Shares or WPP ADSs that are US Holders and that will hold the WPP Shares or WPP ADSs as capital assets. The discussion does not cover all aspects of US federal income taxation that may be relevant to, or the actual tax effect that any of the matters described herein will have on, the acquisition, ownership or disposition of WPP Shares or WPP ADSs by particular investors, and does not address state, local, foreign or other tax laws. In particular, this summary does not address all of the tax considerations that may be relevant to investors subject to special treatment under the US federal income tax laws (such as financial institutions, insurance companies, investors liable for the alternative minimum tax, investors that own (directly or indirectly) 10% or more of the voting stock of WPP, investors that hold WPP Shares or WPP ADSs through a permanent establishment, individual retirement accounts and other tax-deferred accounts, tax-exempt organisations, dealers in securities or currencies, traders that elect to mark to market, investors that will hold the WPP Shares or WPP ADSs as part of straddles, hedging transactions or conversion transactions for US federal income tax purposes, investors whose functional currency is not the US dollar or persons who received their WPP Shares or WPP ADSs in connection with the performance of services or on exercise of options received as compensation in connection with the performance of services).
As used herein, the term “US Holder” means a beneficial owner of WPP Shares or WPP ADSs that is, for US federal income tax purposes: (i) a citizen or individual resident of the United States; (ii) a corporation, or other entity treated as a corporation for US federal tax purposes, created or organised in or under the laws of the United States or any State thereof; (iii) an estate the income of which is subject to US federal income tax without regard to its source; or (iv) a trust if a court within the United States is able to exercise primary supervision over the administration of the trust and one or more US persons have the authority to control all substantial decisions of the trust, or the trust has elected to be treated as a domestic trust for US federal income tax purposes.
This discussion does not address any tax consequences applicable to holders of equity interests in a holder of WPP Shares or WPP ADSs. The US federal income tax treatment of a partner in a partnership that holds WPP Shares or WPP ADSs will depend on the status of the partner and the activities of the partnership. Holders of WPP Shares or WPP ADSs that are partnerships should consult their tax advisers concerning the US federal income tax consequences to their partners of the acquisition, ownership and disposition of WPP Shares or WPP ADSs.
WPP does not expect to become a passive foreign investment company (a “PFIC”) for US federal income tax purposes and this summary assumes the correctness of this position. WPP’s possible status as a PFIC must be determined annually and therefore may be subject to change. If WPP were to be a PFIC in any year, materially adverse consequences could result for US Holders.
The summary is based on the US federal income tax laws, including the US Internal Revenue Code of 1986 as amended, its legislative history, existing and proposed regulations thereunder, published rulings and court decisions, all as currently in effect, and all of which are subject to change, perhaps with retroactive effect.
87
The summary of US federal income tax consequences set out below is for general information only. US Holders are urged to consult their own tax advisers as to the particular tax consequences to them of owning the WPP Shares or WPP ADSs, including the applicability and effect of state, local, foreign and other tax laws and possible changes in tax law.
Classification of the WPP ADSs
US Holders of WPP ADSs should be treated for US federal income tax purposes as owners of the WPP Shares represented by the WPP ADSs. Accordingly, the US federal income tax consequences discussed below apply equally to US Holders of WPP ADSs.
Tax on dividends
Distributions paid by WPP out of current or accumulated earnings and profits (as determined for US federal income tax purposes) will generally be taxable to a US Holder as foreign source dividend income, and will not be eligible for the dividends received deduction generally allowed to US corporations. A US Holder of WPP ADSs generally will include dividends in gross income in the taxable year in which such holder actually or constructively receives the dividend. US Holders that surrender their WPP ADSs in exchange for the underlying WPP Shares should consult their tax advisers regarding the proper timing for including dividends in gross income.
Distributions in excess of current and accumulated earnings and profits will be treated as a non-taxable return of capital to the extent of the US Holder’s basis in the WPP Shares or WPP ADSs and thereafter as capital gains. However, WPP will not maintain calculations of its earnings and profits in accordance with US federal income tax accounting principles. US Holders should, therefore, assume that any distribution by WPP with respect to the WPP Shares or WPP ADSs will constitute ordinary dividend income. US Holders should consult their tax advisers with respect to the appropriate US federal income tax treatment of any distribution received from WPP.
Under current federal income tax law, for taxable years beginning before 2013, dividends paid by a foreign corporation to a non-corporate US Holder as “qualified dividend income” are taxable at the special reduced rate normally applicable to capital gains provided the foreign corporation qualifies for the benefits of the income tax treaty between the United States and the corporation’s country of residence. In such case, the non-corporate US Holder is eligible for the reduced rate only if the US Holder has held the shares or ADSs for more than 60 days during the 121 day-period beginning 60 days before the ex-dividend date. WPP believes it will qualify for the benefits of the income tax treaty between the United States and the United Kingdom (the “Treaty”).
US Holders of WPP Shares or WPP ADSs who receive distributions from WPP will need to consult their own tax advisors regarding the continued applicability of this special reduced rate to such distributions.
Dividends paid in pounds sterling will be included in income in a US dollar amount calculated by reference to the exchange rate in effect on the day the dividends are received by the US Holder in the case of WPP Shares or the US Depositary (in case of WPP ADSs), regardless of whether the pounds sterling are converted into US dollars at that time. If dividends received in pounds sterling are converted into US dollars on the day they are received, the US Holder generally will not be required to recognise a foreign currency gain or loss in respect of the dividend income. Generally, a gain or loss realised on a subsequent conversion of pounds sterling to US dollars or other disposition will be treated as US source ordinary income or loss.
Sale or other disposition
Upon a sale or other disposition of WPP Shares or WPP ADSs (other than an exchange of WPP ADSs for WPP Shares), a US Holder generally will recognise a capital gain or loss equal to the difference, if any, between the amount realised on the sale or other disposition and the US Holder’s adjusted tax basis in the WPP Shares or
88
WPP ADSs. This capital gain or loss will generally be US source and will be a long-term capital gain or loss if the US Holder’s holding period in the WPP Shares or WPP ADSs exceeds one year. However, regardless of a US Holder’s actual holding period, any loss may be a long-term capital loss to the extent the US Holder receives a dividend that qualifies for the reduced rate described above under the section entitled “Tax on Dividends”, above, and exceeds 10% of the US Holder’s tax basis in its WPP Shares or WPP ADSs. Deductibility of capital losses is subject to limitations.
A US Holder’s tax basis in a WPP Share or a WPP ADS will generally be its US dollar cost. The US dollar cost of a WPP Share or a WPP ADS purchased with foreign currency will generally be the US dollar value of the purchase price on the date of purchase or, in the case of WPP Shares or WPP ADSs traded on an established securities market, as defined in the applicable Treasury Regulations, that are purchased by a cash basis US Holder (or an accrual basis US Holder that so elects), on the settlement date for the purchase. Such an election by an accrual basis US Holder must be applied consistently from year to year and cannot be revoked without the consent of the Internal Revenue Service (the “IRS”).
The surrender of WPP ADSs in exchange for WPP Shares (or vice versa) should not be a taxable event for US federal income tax purposes and US Holders should not recognise any gain or loss upon such a surrender. A US Holder’s tax basis in the withdrawn WPP Shares will be the same as the US Holder’s tax basis in the WPP ADSs surrendered, and the holding period of the WPP Shares will include the holding period of the WPP ADSs.
The amount realised on a sale or other disposition of WPP Shares or WPP ADSs for an amount in foreign currency will be the US dollar value of this amount on the date of sale or disposition. On the settlement date, the US Holder will recognise US source foreign currency gain or loss (taxable as ordinary income or loss) equal to the difference (if any) between the US dollar value of the amount received based on the exchange rates in effect on the date of sale or other disposition and the settlement date. However, in the case of WPP Shares or WPP ADSs traded on an established securities market that are sold by a cash basis US Holder (or an accrual basis US Holder that so elects), the amount realised will be determined using the exchange rate in effect on the settlement date for the sale, and no exchange gain or loss will be recognised at that time.
Foreign currency received on the sale or other disposition of a WPP Share or a WPP ADS will have a tax basis equal to its US dollar value on the settlement date. Any gain or loss recognised on a sale or other disposition of a foreign currency (including upon exchange for US dollars) will be US source ordinary income or loss.
Backup withholding and information reporting
Payments of dividends and other proceeds with respect to WPP Shares or WPP ADSs by a US paying agent or other US intermediary will be reported to the IRS and to the US Holder unless the holder is a corporation or otherwise establishes a basis for exemption. Backup withholding may apply to reportable payments if the US Holder fails to provide an accurate taxpayer identification number or certification of exempt status or fails to report all interest and dividends required to be shown on its US federal income tax returns. Any backup withholding tax will be refunded or allowed as a credit against the US Holder’s US federal income tax liability if the US Holder timely gives the appropriate information to the IRS. US Holders should consult their tax advisers as to their qualification for exemption from backup withholding and the procedure for obtaining an exemption.
F. Dividends and Paying Agents
Not applicable.
G. Statements by Experts
Not applicable.
89
H. Documents on Display
The Company is subject to the informational requirements of the Exchange Act. In accordance with these requirements, the Company files reports and other information with the United States Securities and Exchange Commission. You may read and copy any materials filed with the SEC at the Public Reference Room at 100 F Street N.E., Washington, D.C. 20549. You may obtain information on the operation of the Public Reference Room by calling the SEC at 1-800-SEC-0330. The SEC also maintains a web site at http://www.sec.gov that contains reports, proxy statements and other information regarding registrants that file electronically with the SEC.
I. Subsidiary Information
Not applicable.
90
ITEM 11. QUANTITATIVE AND QUALITATIVE DISCLOSURES ABOUT MARKET RISK
The Company’s principal market risks are changes in interest rates and currency exchange rates. Following evaluation of these positions, the Company selectively enters into derivative financial instruments to manage its risk exposure. The fair value of derivatives held by the Company at 31 December 2012 is estimated to be a net asset of £58.9 million (£170.2 million with respect to derivative assets and £111.3 million for derivative liabilities). These amounts are based on market values of equivalent instruments at the balance sheet date.
Interest rate and foreign currency risks
The Company’s interest rate and foreign currency risks management policies are discussed in note 24 to the consolidated financial statements.
Interest rate derivatives and currency derivatives utilised by the Group are discussed in note 25 to the consolidated financial statements.
Analysis of fixed and floating rate debt by currency, including the effect of interest rate and cross currency swaps, as at the balance sheet date is provided in note 10 to the consolidated financial statements.
Sensitivity analyses that address the effect of interest rate and currency risks on the Group’s financial instruments is provided in note 24 to the consolidated financial statements.
Credit risk
Our credit risk exposure and management policies are discussed in note 24 to the consolidated financial statements.
ITEM 12. DESCRIPTION OF SECURITIES OTHER THAN EQUITY SECURITIES
A. Debt Securities
Not applicable.
B. Warrants and Rights
Not applicable.
C. Other Securities
Not applicable.
91
D. American Depositary Shares
Fees and Charges
Holders of ADSs and persons depositing ordinary shares or surrendering ADSs for cancellation are currently required to pay the following service fees to the Depositary:
| | | | |
Service | | Rate | | By Whom Paid |
(1) Issuance of ADSs upon deposit of ordinary shares (excluding issuances as a result of distributions described in paragraph (4) below). | | Up to U.S.$5.00 per 100 ADSs (or fraction thereof) issued. | | Person depositing ordinary
shares or person receiving
ADSs. |
| | |
(2) Delivery of deposited securities against surrender of ADSs. | | Up to U.S.$5.00 per 100 ADSs (or fraction thereof) surrendered. | | Person surrendering ADSs for
purpose of withdrawal of
deposited securities or person to
whom deposited securities are
delivered. |
| | |
(3) Distribution of cash dividends or other cash distributions (i.e., sale of rights and other entitlements). | | Up to U.S.$2.00 per 100 ADSs (or fraction thereof) held, unless prohibited by the exchange upon which the ADSs are listed. | | Person to whom distribution is
made. |
| | |
(4) Distribution of ADSs pursuant to (i) stock dividends or other free stock distributions, or (ii) exercise of rights to purchase additional ADSs. | | Up to U.S.$5.00 per 100 ADSs (or fraction thereof) issued, unless prohibited by the exchange upon which the ADSs are listed. | | Person to whom distribution is
made. |
| | |
(5) Distribution of securities other than ADSs or rights to purchase additional ADSs (i.e., spin-off shares). | | Up to U.S.$5.00 per unit of 100 securities (or fraction thereof) distributed. | | Person to whom distribution is
made. |
| | |
(6) Depositary Services. | | Up to U.S.$2.00 per 100 ADSs (or fraction thereof) held as of the last day of each calendar year, except to the extent of any cash dividend fee(s) charged under paragraph (3) above during the applicable calendar year. | | Person of record on last day of
any calendar year. |
| | |
(7) Transfer of ADRs. | | U.S.$1.50 per certificate presented for transfer. | | Person presenting certificate for
transfer. |
Holders of ADSs and persons depositing ordinary shares or surrendering ADSs for cancellation and for the purpose of withdrawing deposited securities are also responsible for the payment of certain fees and expenses incurred by the Depositary, and certain taxes and governmental charges, such as:
| | (i) | | Taxes (including applicable interest and penalties) and other governmental charges; |
| | (ii) | | Such registration fees as may from time to time be in effect for the registration of ordinary shares on the share register and applicable to transfers of ordinary shares or other securities on deposit to or from the name of the Custodian, the Depositary or any nominees upon the making of deposits and withdrawals, respectively; |
92
| | (iii) | | Such cable, telex and facsimile transmission and delivery expenses as are expressly provided in the deposit agreement to be at the expense of the person depositing or withdrawing ordinary shares or holders of ADSs; |
| | (iv) | | The expenses and charges incurred by the Depositary in the conversion of foreign currency; |
| | (v) | | Such fees and expenses as are incurred by the Depositary in connection with compliance with exchange control regulations and other regulatory requirements applicable to ordinary shares, ordinary shares on deposit, ADSs and ADRs; and |
| | (vi) | | The fees and expenses incurred by the Depositary, the Custodian or any nominee in connection with the servicing or delivery of ordinary shares on deposit. |
WPP has agreed to pay various other charges and expenses of the Depositary. Please note that the fees and charges that holders of ADSs may be required to pay may vary over time and may be changed by WPP and by the Depositary. Holders of ADSs will receive prior notice of such changes.
Depositary Payments—Fiscal Year 2012
WPP did not receive any payments from Citibank, N.A., the Depositary for its American Depositary Receipt program, in 2012.
93
PART II
ITEM 13. DEFAULTS, DIVIDEND ARREARAGES AND DELINQUENCIES
None.
ITEM 14. MATERIAL MODIFICATIONS TO THE RIGHTS OF SECURITY HOLDERS AND USE OF PROCEEDS
None.
ITEM 15. CONTROLS AND PROCEDURES
Disclosure Controls and Procedures
We performed an evaluation under the supervision and with the participation of our management, including our Chief Executive and our Finance Director, of the effectiveness of our disclosure controls and procedures (as defined in Rules 13a-15(e) and 15d-15(e) under the Exchange Act) as at 31 December 2012. Notwithstanding the foregoing, a control system, no matter how well designed and operated, can provide only reasonable, not absolute, assurance that it will detect or uncover failures within the Company to disclose material information otherwise required to be set forth in the Company’s periodic reports. Following the evaluation described above, our management, including the Chief Executive and Finance Director, concluded that our disclosure controls and procedures were effective at that time.
Management’s Annual Report on Internal Control over Financial Reporting
Our management is responsible for establishing and maintaining adequate internal control over financial reporting (as defined in Rules 13a-15(f) and 15d-15(f) under the Exchange Act). Our management, with the participation of our Chief Executive and our Finance Director, carried out an assessment of the effectiveness of our internal control over financial reporting (including those applicable to WPP DAS Ltd) as at 31 December 2012. The assessment was performed using the criteria for effective internal control reflected in the Internal Control-Integrated Framework issued by the Committee of Sponsoring Organizations of the Treadway Commission (COSO).
Based on our assessment of the system of internal control, management concludes that as at 31 December 2012 our internal control over financial reporting (including those applicable to WPP DAS Ltd) was effective.
The Company’s internal control over financial reporting (including those applicable to WPP DAS Ltd) as at 31 December 2012, has been audited by Deloitte LLP, an independent registered public accounting firm, who also audited the Company’s consolidated financial statements. Their audit report on the effectiveness of internal control over financial reporting is presented on page 95.
94
REPORT OF INDEPENDENT REGISTERED PUBLIC ACCOUNTING FIRM
To the Board of Directors and Shareholders of WPP plc
We have audited the internal control over financial reporting of WPP plc and subsidiaries (the “Company”) as at 31 December 2012, based on criteria established inInternal Control—Integrated Framework issued by the Committee of Sponsoring Organizations of the Treadway Commission. The Company’s management is responsible for maintaining effective internal control over financial reporting and for its assessment of the effectiveness of internal control over financial reporting, included in the accompanying Management’s Annual Report on Internal Control over Financial Reporting. Our responsibility is to express an opinion on the Company’s internal control over financial reporting, including those controls applicable to WPP DAS Ltd. (“the Trust”) based on our audit.
We conducted our audit in accordance with the standards of the Public Company Accounting Oversight Board (United States). Those standards require that we plan and perform the audit to obtain reasonable assurance about whether effective internal control over financial reporting was maintained in all material respects. Our audit included obtaining an understanding of internal control over financial reporting, assessing the risk that a material weakness exists, testing and evaluating the design and operating effectiveness of internal control based on the assessed risk, and performing such other procedures as we considered necessary in the circumstances. We believe that our audit provides a reasonable basis for our opinion.
A company’s internal control over financial reporting is a process designed by, or under the supervision of, the company’s principal executive and principal financial officers, or persons performing similar functions, and effected by the company’s board of directors, management, and other personnel to provide reasonable assurance regarding the reliability of financial reporting and the preparation of financial statements for external purposes in accordance with generally accepted accounting principles. A company’s internal control over financial reporting includes those policies and procedures that (1) pertain to the maintenance of records that, in reasonable detail, accurately and fairly reflect the transactions and dispositions of the assets of the company; (2) provide reasonable assurance that transactions are recorded as necessary to permit preparation of financial statements in accordance with generally accepted accounting principles, and that receipts and expenditures of the company are being made only in accordance with authorizations of management and directors of the company; and (3) provide reasonable assurance regarding prevention or timely detection of unauthorised acquisition, use, or disposition of the company’s assets that could have a material effect on the financial statements.
Because of the inherent limitations of internal control over financial reporting, including the possibility of collusion or improper management override of controls, material misstatements due to error or fraud may not be prevented or detected on a timely basis. Also, projections of any evaluation of the effectiveness of the internal control over financial reporting to future periods are subject to the risk that the controls may become inadequate because of changes in conditions, or that the degree of compliance with the policies or procedures may deteriorate.
In our opinion, the Company maintained, in all material respects, effective internal control over financial reporting, including those applicable to the Trust, as at 31 December 2012, based on the criteria established inInternal Control—Integrated Framework issued by the Committee of Sponsoring Organizations of the Treadway Commission.
We have also audited, in accordance with the standards of the Public Company Accounting Oversight Board (United States), the consolidated financial statements as at and for the year ended 31 December 2012 of the Company and financial statements as at and for the year ended 31 December 2012 of the Trust and our reports dated 30 April 2013 expressed an unqualified opinion on those financial statements.
/s/ Deloitte LLP
Deloitte LLP
London, United Kingdom
30 April 2013
95
Changes in Internal Control Over Financial Reporting
There has been no change in the Company’s internal control over financial reporting (as defined in Rules 13a-15(f) and 15d-15(f) under the Exchange Act) that occurred during 2012, that has materially affected, or is reasonably likely to materially affect, the Company’s internal control over financial reporting.
ITEM 16A. AUDIT COMMITTEE FINANCIAL EXPERT
The audit committee consisted of Paul Spencer, Jeffrey Rosen, Colin Day and Sol Trujillo at 31 December 2012. The board of directors has determined that all members of the audit committee are “independent” as that term is defined in the applicable NASDAQ listing standards and rules of the Securities and Exchange Commission.
WPP does have an audit committee financial expert, Paul Spencer, serving as Chairman of its audit committee. See the biography of Paul Spencer in Item 6A.
ITEM 16B. CODE OF ETHICS
WPP has in place a Code of Business Conduct that constitutes a “code of ethics” as defined in applicable regulations of the Securities and Exchange Commission. The Code of Business Conduct (which is regularly reviewed by the Audit Committee and the Board) and was updated in 2012, sets out the principal obligations of all employees. Directors and senior executives throughout the Group are required each year to sign this Code. A copy of the WPP Code of Business Conduct may be obtained free of charge by contacting the Company’s investor relations department in London or New York at the following addresses or telephone numbers:
London:
Deputy Group finance director
WPP
27 Farm Street
London W1J 5RJ England
Tel: +44 (0)20 7408 2204
Fax: +44 (0)20 7493 6819
New York:
Investor Relations
WPP
100 Park Avenue
New York, New York 10017-5516
Tel: (212) 632-2200
Fax: (212) 632-2222
96
ITEM 16C. PRINCIPAL ACCOUNTANT FEES AND SERVICES
| | | | |
| | | 2012 | | 2011 |
| | | £m | | £m |
Audit fees | | 19.1 | | 19.8 |
Tax fees1 | | 3.5 | | 3.4 |
All other fees2 | | 4.4 | | 5.2 |
| | | 27.0 | | 28.4 |
| | 1 | | Tax fees comprise tax advisory, planning and compliance services. |
| | 2 | | Other fees comprise assurance services, including fees for due diligence, transition support fees and review of earn-out payment calculations. |
See note 3 to the Consolidated Financial Statements for more details of auditors’ remuneration for the years ended 31 December 2012, 2011 and 2010.
Audit Committee Pre-Approval Policies and Procedures
The Audit Committee has adopted a pre-approval policy for the engagement of the external auditors in relation to the supply of permissible non-audit services (including taxation), taking into account relevant ethical and regulatory requirements. WPP’s policy regarding non-audit services that may be provided by the Group’s auditors, Deloitte LLP, prohibits certain categories of work in line with relevant guidance on independence, such as ethical standards issued by the Auditing Practices Board and independence rules of the Public Company Accounting Oversight Board (United States) and the SEC. Other categories of work may be undertaken by Deloitte LLP subject to an approvals process that is designed appropriately for different categories and values of proposed work.
ITEM 16D. EXEMPTIONS FROM THE LISTING STANDARDS FOR AUDIT COMMITTEES.
Not applicable.
ITEM 16E. PURCHASES OF EQUITY SECURITIES BY THE ISSUER AND AFFILIATED PURCHASERS.
At the Annual General Meeting of WPP plc on 2 June 2011 a special resolution was passed authorising WPP plc to make market purchases of its own shares up to a maximum number of 126,473,546 ordinary shares. This authority expired at the Annual General Meeting of WPP plc on 13 June 2012 and was replaced by a new authority to purchase up to a maximum number of 126,006,600 ordinary shares until the earlier of the conclusion of the Annual General Meeting of WPP plc in 2013 and 1 September 2013. This authorisation was replaced as part of the Scheme of Arrangement when a resolution was passed, authorising the Company, in accordance with its Articles of Association to purchase up to 126,300,365 of its own shares in the market.
| | | | | | | | | | | | | | | | |
| | | Total number of shares
purchased | | | Average price | | | Total number of shares purchased as part
of publicly announced plan | | | Maximum number of shares that
may yet be purchased under plan | |
January | | | — | | | | — | | | | — | | | | 108,999,416 | |
February | | | — | | | | — | | | | — | | | | 108,999,416 | |
March | | | 2,925,000 | | | £ | 8.39 | | | | 2,925,000 | | | | 106,074,416 | |
April | | | 2,600,000 | | | £ | 8.44 | | | | 2,600,000 | | | | 103,474,416 | |
May | | | 2,220,000 | | | £ | 8.04 | | | | 2,220,000 | | | | 101,254,416 | |
June | | | 250,000 | | | £ | 7.46 | | | | 250,000 | | | | 125,756,600 | |
July | | | — | | | | — | | | | — | | | | 125,756,600 | |
August | | | — | | | | — | | | | — | | | | 125,756,600 | |
September | | | 933,400 | | | £ | 8.45 | | | | 933,400 | | | | 124,823,200 | |
October | | | 1,000,000 | | | £ | 7.96 | | | | 1,000,000 | | | | 123,823,200 | |
November | | | 4,300,000 | | | £ | 8.24 | | | | 4,300,000 | | | | 119,523,200 | |
December | | | 2,000,000 | | | £ | 8.60 | | | | 2,000,000 | | | | 117,523,200 | |
Total | | | 16,228,400 | | | £ | 8.30 | | | | 16,228,400 | | | | | |
97
ITEM 16F. CHANGE IN REGISTRANT’S CERTIFYING ACCOUNTANT
Not applicable.
ITEM 16G. CORPORATE GOVERNANCE
The Company’s ADSs are listed on the NASDAQ Global Select Market. In general, under NASDAQ’s Rule 5615, foreign private issuers such as WPP listed on NASDAQ are permitted to follow home country corporate governance practices instead of certain of the corporate governance requirements of NASDAQ’s Rule 5600 Series and Rule 5250(d). A foreign private issuer that elects to follow a home country practice instead of any such provisions of the Rule 5600 Series or Rule 5250(d) must submit in advance to NASDAQ a written statement from an independent counsel in such issuer’s home country certifying that the issuer’s practices are not prohibited by the home country’s laws. The Company’s independent Jersey counsel has certified to NASDAQ that the Company’s corporate governance practices are not prohibited by the laws of Jersey.
The requirements of the Rule 5600 Series and Rule 5250(d) and the corporate governance practices that the Company follows in lieu thereof are described below:
| | • | | Rule 5620(c) requires that the quorum for any meeting of stockholders must not be less than 33 1/3% of the outstanding shares of a company’s common voting stock. The Company’s Articles of Association provide that the necessary quorum for a general share owner meeting is a minimum of two persons entitled to vote on the business to be transacted, each being a share owner or a proxy for a share owner or a duly authorised representative of a corporate share owner. |
| | • | | Rule 5635(c) requires that issuers obtain stockholder approval before a stock option or purchase plan is established or materially amended or other equity compensation arrangement is made or materially amended pursuant to which stock may be acquired by officers, directors, employees or consultants of the issuer, subject to certain exceptions. The Company seeks share owner approval for the adoption or amendment of stock plans or stock purchase plans only as required by the Articles of Association of the Company, the Listing Rules of the UK Listing Authority (the Listing Rules) and the laws of Jersey. Subject to the exceptions permitted in the Listing Rules, this involves seeking share owner approval to any such plan that falls into either of the following categories (as defined in the Listing Rules): |
| | (a) | | an employees’ share scheme if the scheme involves or may involve the issue of new shares or the transfer of treasury shares; and |
| | (b) | | a long-term incentive scheme in which one or more directors of the Company is eligible to participate and to material amendments of that scheme to the extent required by the scheme’s rules. In this context, it should be noted that the provisions of the rules relating to whether amendments to the scheme rules must be approved by share owners must themselves be drafted to ensure compliance with the Listing Rules. |
| | • | | Rule 5250(d) requires that if an issuer posts its annual report to its investor relations website rather than mailing hard copies to its stockholders, the issuer must also post a prominent undertaking to provide shareholders, upon request, with a hard copy of the report free of charge. The issuer must also issue a press release stating that the report has been posted to the website and that stockholders can obtain a hard copy free of charge upon request. The Company posts its annual report to its investor relations website, issues a press release stating that the report has been posted and mails a hard copy of the report to all share owners of record, but does not undertake to send a copy of the report to any share owner upon request. |
ITEM 16H. MINE SAFETY DISCLOSURE
Not applicable.
98
PART III
ITEM 17. FINANCIAL STATEMENTS
Not applicable.
ITEM 18. FINANCIAL STATEMENTS
The Consolidated Financial Statements of WPP plc at 31 December 2012, 2011 and 2010 are included in this report beginning on page F-1.
ITEM 19. EXHIBITS
| | | | |
Exhibit No. | | | Exhibit Title |
| |
| | 1.1 | | | Memorandum and Articles of Association of WPP plc (incorporated herein by reference to Exhibit 1 to the Registrant’s Report on Form 6-K filed on 2 January 2013). |
| |
| | 2.1 | | | Deposit Agreement dated as of 2 January 2013 among the Registrant, Citibank, N.A. as Depositary, and all holders and beneficial owners from time to time of American Depositary Receipts issued thereunder (incorporated herein by reference to Exhibit 99(A)(I) to the Registrant’s Registration Statement on Form F-6EF filed on 31 December 2012). |
| |
| | 2.2 | | | Restricted ADS Letter Agreement dated as of 2 January 2013 between the Registrant and Citibank, N.A., as Depositary (incorporated herein by reference to Exhibit 99(A)(II) to the Registrant’s Registration Statement on Form F-6EF filed on 31 December 2012). |
| |
| | 2.3 | | | Agreement of Registrant to file, if requested by the Securities and Exchange Commission, instruments relating to $650,000,000 5.875% Notes due 2014.* |
| |
| | 2.4 | | | Agreement of Registrant to file, if requested by the Securities and Exchange Commission, instruments relating to€600 million of 4.375% Bonds due 5 December 2013 (incorporated herein by reference to Exhibit 2.19 of the Registrant’s Annual Report on Form 20-F filed for the year ended 31 December 2006). |
| |
| | 2.5 | | | Agreement of Registrant to file, if requested by the Securities and Exchange Commission, indenture instruments relating to £400 million of 6% Bonds due 4 April 2017 (incorporated herein by reference to Exhibit 2.20 of the Registrant’s Annual Report on Form 20-F filed for the year ended 31 December 2006). |
| |
| | 2.6 | | | Agreement of Registrant to file, if requested by the Securities and Exchange Commission, instruments relating to€500 million of 5.25% bonds due 2015 (incorporated herein by reference to Exhibit 2.21 of the Registrant’s Annual Report on Form 20-F for the year ended 31 December 2007). |
| |
| | 2.7 | | | Agreement of Registrant to file, if requested by the Securities and Exchange Commission, instruments relating to £200 million of 6.375% bonds due 2020 (incorporated herein by reference to Exhibit 2.22 of the Registrant’s Annual Report on Form 20-F for the year ended 31 December 2007). |
| |
| | 2.8 | | | Agreement of Registrant to file, if requested by the Securities and Exchange Commission, instruments relating to€750 million of 6.25% Guaranteed Bonds due 2016 (incorporated herein by reference to Exhibit 2.23 of the Registrant’s Annual Report on Form 20-F for the year ended 31 December 2007). |
| |
| | 2.9 | | | Agreement of Registrant to file, if requested by the Securities and Exchange Commission, instruments relating to a U.S.$1,050,000,000 and £375,000,000 Revolving Credit Facilities Agreement (incorporating a U.S.$825,000,000 Swingline Facility) dated 30 November 2011, and Amended and Restated on 14 December 2012.* |
99
| | | | |
Exhibit No. | | | Exhibit Title |
| |
| | 2.10 | | | Agreement of Registrant to file, if requested by the Securities and Exchange Commission, instruments relating to a £650,000,000 Term Facility Agreement dated 9 July 2008 and Amended and Restated on 17 November 2008 (incorporated herein by reference to Exhibit 2.17 of the Registrant’s Annual Report on Form 20-F for the year ended 31 December 2008). |
| |
| | 2.11 | | | Agreement of Registrant to file, if requested by the Securities and Exchange Commission, instruments relating to $600,000,000 of 8% Senior Notes due 2014 (incorporated herein by reference to Exhibit 2.19 of the Registrant’s Annual Report on Form 20-F for the year ended 31 December 2009). |
| |
| | 2.12 | | | Agreement of Registrant to file, if requested by the Securities and Exchange Commission, instruments relating to £450,000,000 of 5.75% Guaranteed Bonds due 2014 (incorporated herein by reference to Exhibit 2.20 of the Registrant’s Annual Report on Form 20-F for the year ended 31 December 2009). |
| |
| | 2.13 | | | Agreement of Registrant to file, if requested by the Securities and Exchange Commission, instruments relating to $30 million of 6.22% promissory notes due July 10, 2012, and $25 million of 6.34% promissory notes due July 10, 2014 (incorporated herein by reference to Exhibit 2.21 of the Registrant’s Annual Report on Form 20-F for the year ended 31 December 2009). |
| |
| | 2.14 | | | Agreement of Registrant to file, if requested by the Securities and Exchange Commission, instruments relating to $812.4 million of 4.75% Senior Notes due 2021 (incorporated herein by reference to Exhibit 2.22 of the Registrant’s Annual Report on Form 20-F for the year ended 31 December 2011). |
| |
| | 2.15 | | | Agreement of Registrant to file, if requested by the Securities and Exchange Commission, instruments relating to U.S.$500,000,000 3.625% Guaranteed Senior Notes due September 2022 and $300,000,000 5.125% Guaranteed Senior Notes due 2042.* |
| |
| | 4.1 | | | J. Walter Thompson Company, Inc. Retained Benefit Supplemental Employee Retirement Plan (incorporated herein by reference to Exhibit 4.9 to the Registrant’s Annual Report on Form 20-F for the year ended 31 December 2000). |
| |
| | 4.2 | | | Young & Rubicam Inc. Deferred Compensation Plan (incorporated herein by reference to Exhibit 10.26 to Young & Rubicam’s Registration Statement on Form S-1 (File No. 333-46929)). |
| |
| | 4.3 | | | Amendment No. 2 to Young & Rubicam Inc. Deferred Compensation Plan effective as of 1 January 1999 (incorporated herein by reference to Exhibit 10.27 to Young & Rubicam’s Annual Report on Form 10-K for the year ended 31 December 1998). |
| |
| | 4.4 | | | Young & Rubicam Inc. Executive Income Deferral Program (incorporated herein by reference to Exhibit 4.19 to the Registrant’s Annual Report on Form 20-F for the year ended 31 December 2000). |
| |
| | 4.5 | | | Ogilvy & Mather ERISA Excess Plan Summary Plan Description (incorporated herein by reference to Exhibit 4.12 of the Registrant’s Annual Report on Form 20-F for the year ended 31 December 2008). |
| |
| | 4.6 | | | Ogilvy & Mather Executive Savings Plan Summary Plan Description, in connection with a 25% matching contribution (incorporated herein by reference to Exhibit 4.13 of the Registrant’s Annual Report on Form 20-F for the year ended 31 December 2008). |
| |
| | 4.7 | | | Ogilvy & Mather Executive Savings Plan Summary Plan Description, in connection with a 50% matching contribution (incorporated herein by reference to Exhibit 4.14 of the Registrant’s Annual Report on Form 20-F for the year ended 31 December 2008). |
| |
| | 4.8 | | | Ogilvy & Mather Deferred Compensation Plan Summary Plan Description (incorporated herein by reference to Exhibit 4.15 of the Registrant’s Annual Report on Form 20-F for the year ended 31 December 2008). |
| |
| | 4.9 | | | WPP Executive Stock Option Plan, as amended through 12 November 2012.* |
100
| | | | |
Exhibit No. | | | Exhibit Title |
| |
| | 4.10 | | | WPP plc Restricted Stock Plan, as amended through 12 November 2012.* |
| |
| | 4.11 | | | WPP 2005 Executive Stock Option Plan, as amended through 12 November 2012.* |
| |
| | 4.12 | | | WPP plc Annual Bonus Deferral Programme, as amended through 12 November 2012.* |
| |
| | 4.13 | | | GroupM Executive Savings Plan Summary Plan Description (incorporated herein by reference to Exhibit 4.24 of the Registrant’s Annual Report on Form 20-F for the year ended 31 December 2008). |
| |
| | 4.14 | | | WPP 2008 Executive Stock Option Plan, as amended through 12 November 2012.* |
| |
| | 4.15 | | | UK Service Agreement, effective from 19 November 2008, between WPP 2005 Limited, Sir Martin Sorrell and WPP plc (incorporated herein by reference to Exhibit 4.28 of the Registrant’s Annual Report on Form 20-F for the year ended 31 December 2008). |
| |
| | 4.16 | | | Service Agreement in the USA, effective 26 November 2010, between WPP Group USA, Inc. and Sir Martin Sorrell (incorporated herein by reference to Exhibit 4.23 of the Registrant’s Annual Report on Form 20-F for the year ended 31 December 2010). |
| |
| | 4.17 | | | Service Agreement in the USA, dated 30 April 2009, between WPP Group USA, Inc. and Paul W.G. Richardson (incorporated herein by reference to Exhibit 4.30 of the Registrant’s Annual Report on Form 20-F for the year ended 31 December 2008). |
| |
| | 4.18 | | | Director’s appointment agreement, dated 21 November 2008, between WPP plc and Paul Richardson (incorporated herein by reference to Exhibit 4.31 of the Registrant’s Annual Report on Form 20-F for the year ended 31 December 2008). |
| |
| | 4.19 | | | Service Agreement, dated 12 February 2009, between WPP 2005 Limited and Mark Read (incorporated herein by reference to Exhibit 4.32 of the Registrant’s Annual Report on Form 20-F for the year ended 31 December 2008). |
| |
| | 4.20 | | | Director’s appointment agreement, dated 21 November 2008, between WPP plc and Mark Read (incorporated herein by reference to Exhibit 4.33 of the Registrant’s Annual Report on Form 20-F for the year ended 31 December 2008). |
| |
| | 4.21 | | | Supplemental Retirement Agreement, dated as of 1 July 2008, by and between WPP Group USA, Inc. and Paul Richardson (incorporated herein by reference to Exhibit 4.34 of the Registrant’s Annual Report on Form 20-F for the year ended 31 December 2008). |
| |
| | 4.22 | | | Amendment dated 19 November 2008 to Supplemental Retirement Agreement, dated as of 1 July 2008, by and between WPP Group USA, Inc. and Paul Richardson (incorporated herein by reference to Exhibit 4.35 of the Registrant’s Annual Report on Form 20-F for the year ended 31 December 2008). |
| |
| | 4.23 | | | Stock Purchase Agreement, dated 3 August 1998, among Asatsu Inc., WPP International Holding B.V. and WPP Group plc (incorporated herein by reference to Exhibit 4.36 of the Registrant’s Annual Report on Form 20-F for the year ended 31 December 2008). |
| |
| | 4.24 | | | 24/7 Media, Inc. 1998 Stock Incentive Plan (incorporated herein by reference to Exhibit 10.1 to the Registration Statement on Form S-1 of 24/7 Media, Inc. filed on June 4, 2009, File No. 333-56085). |
| |
| | 4.25 | | | 24/7 Real Media, Inc. 2002 Stock Incentive Plan (incorporated herein by reference to a proxy statement filed by 24/7 Real Media, Inc. on August 9, 2002, File No. 000-29768). |
| |
| | 4.26 | | | Grey Advertising Inc. Senior Executive Officer Post-Employment Compensation Plan (incorporated herein by reference to Exhibit 4.40 of the Registrant’s Annual Report on Form 20-F for the year ended 31 December 2008). |
| |
| | 4.27 | | | Amendment No. 1 to the Grey Advertising Inc. Senior Executive Officer Post-Employment Compensation Plan, effective as of January 1, 2009 (incorporated herein by reference to Exhibit 4.41 of the Registrant’s Annual Report on Form 20-F for the year ended 31 December 2008). |
101
| | | | |
Exhibit No. | | | Exhibit Title |
| |
| | 4.28 | | | Amendment No. 1 to the J. Walter Thompson Retained Benefit Supplemental Employee Retirement Plan, effective as of January 1, 2009 (incorporated herein by reference to Exhibit 4.42 of the Registrant’s Annual Report on Form 20-F for the year ended 31 December 2008). |
| |
| | 4.29 | | | WPP Group plc 2004 Leadership Equity Acquisition Plan, as amended through 12 November 2012.* |
| |
| | 4.30 | | | WPP plc Leadership Equity Acquisition Plan III, as amended through 10 December 2012.* |
| |
| | 4.31 | | | Second Amendment, dated 22 June 2011, to Supplemental Retirement Agreement, dated as of 1 July 2008, by and between WPP Group USA, Inc. and Paul Richardson (incorporated herein by reference to Exhibit 4.41 to the Registrant’s Annual Report on Form 20-F for the year ended 31 December 2011). |
| |
| | 4.32 | | | WPP 2012 Executive Stock Option Plan.* |
| |
| | 8.1 | | | List of subsidiaries.* |
| |
| | 12.1 | | | Certification of Chief Executive.* |
| |
| | 12.2 | | | Certification of Finance Director.* |
| |
| | 13.1 | | | Certification of Chief Executive under 18 U.S.C. Section 1350.* |
| |
| | 13.2 | | | Certification of Finance Director under 18 U.S.C. Section 1350.* |
| |
| | 14.1 | | | Consent of Independent Registered Public Accounting Firm (for WPP plc and subsidiaries).* |
| |
| | 14.2 | | | Consent of Independent Registered Public Accounting Firm (for WPP DAS Limited).* |
102
Signatures
The Registrant hereby certifies that it meets all of the requirements for filing on Form 20-F and that it has duly caused and authorized the undersigned to sign this annual report on its behalf.
| | |
| WPP plc |
| |
By: | | /s/ Paul W.G. Richardson |
| | Paul W. G. Richardson Group Finance Director |
| |
| | 30 April 2013 |
103
Item��18
INDEX TO FINANCIAL STATEMENTS
REPORT OF INDEPENDENT REGISTERED PUBLIC ACCOUNTING FIRM
To the Board of Directors and Shareholders of WPP plc
We have audited the accompanying consolidated balance sheets of WPP plc and subsidiaries (the “Company”) as at 31 December 2012 and 2011, and the related consolidated income statements, consolidated statements of comprehensive income, consolidated cash flow statements, and consolidated statement of changes in equity for each of the three years in the period ended 31 December 2012. These consolidated financial statements are the responsibility of the Company’s management. Our responsibility is to express an opinion on these consolidated financial statements based on our audits.
We conducted our audits in accordance with standards of the Public Company Accounting Oversight Board (United States). Those standards require that we plan and perform the audit to obtain reasonable assurance about whether the financial statements are free of material misstatement. An audit includes examining, on a test basis, evidence supporting the amounts and disclosures in the financial statements. An audit also includes assessing the accounting principles used and significant estimates made by management, as well as evaluating the overall financial statement presentation. We believe that our audits provide a reasonable basis for our opinion.
In our opinion, such consolidated financial statements present fairly, in all material respects, the financial position of the Company as at 31 December 2012 and 2011, and the results of its operations and cash flows for each of the three years in the period ended 31 December 2012, in conformity with International Financial Reporting Standards as issued by the International Accounting Standards Board.
We have also audited, in accordance with the standards of the Public Company Accounting Oversight Board (United States), the Company’s internal control over financial reporting as at 31 December 2012, based on the criteria established inInternal Control—Integrated Frameworkissued by the Committee of Sponsoring Organizations of the Treadway Commission and our report dated 30 April 2013 expressed an unqualified opinion on the Company’s internal control over financial reporting.
/s/ Deloitte LLP
Deloitte LLP
London, United Kingdom
30 April 2013
F-1
Our 2012 financial statements
Accounting policies
The consolidated financial statements of WPP plc and its subsidiaries (the Group) for the year ended 31 December 2012 have been prepared in accordance with International Financial Reporting Standards (IFRS) as issued by the International Accounting Standards Board as they apply to the financial statements of the Group for the year ended 31 December 2012.
Basis of preparation
The consolidated financial statements have been prepared under the historical cost convention, except for the revaluation of certain financial instruments. The principal accounting policies are set out below.
The financial statements were approved by the Board of Directors and authorized for issue on 30 April 2013.
Basis of consolidation
The consolidated financial statements include the results of the Company and all its subsidiary undertakings made up to the same accounting date. All intra-Group balances, transactions, income and expenses are eliminated in full on consolidation. The results of subsidiary undertakings acquired or disposed of during the period are included or excluded from the consolidated income statement from the effective date of acquisition or disposal.
Goodwill and other intangible assets
Intangible assets comprise goodwill, certain acquired separable corporate brand names, acquired customer relationships, acquired proprietary tools and capitalised computer software not integral to a related item of hardware.
Goodwill represents the excess of fair value attributed to investments in businesses or subsidiary undertakings over the fair value of the underlying net assets, including intangible assets, at the date of their acquisition.
Goodwill impairment reviews are undertaken annually or more frequently if events or changes in circumstances indicate a potential impairment. The carrying value of goodwill is compared to the net present value of future cash flows derived from the underlying assets using a projection period of up to five years for each cash-generating unit. After the projection period a steady growth rate representing an appropriate long-term growth rate for the industry is applied. Any impairment is recognised immediately as an expense and is not subsequently reversed.
Corporate brand names, customer relationships and proprietary tools acquired as part of acquisitions of businesses are capitalised separately from goodwill as intangible assets if their value can be measured reliably on initial recognition and it is probable that the expected future economic benefits that are attributable to the asset will flow to the Group.
Certain corporate brands of the Group are considered to have an indefinite economic life because of the institutional nature of the corporate brand names, their proven ability to maintain market leadership and profitable operations over long periods of time and the Group’s commitment to develop and enhance their value. The carrying value of these intangible assets is reviewed at least annually for impairment and adjusted to the recoverable amount if required.
Amortisation is provided at rates calculated to write off the cost less estimated residual value of each asset on a straight-line basis over its estimated useful life as follows:
| • | | Brand names (with finite lives) – 10-20 years. |
| • | | Customer related intangibles – 3-10 years. |
| • | | Other proprietary tools – 3-10 years. |
| • | | Other (including capitalised computer software) – 3-5 years. |
Contingent consideration
Contingent consideration is accounted for in accordance with IFRS 3 Business Combinations.
Future anticipated payments to vendors in respect of contingent consideration (earnout agreements) are initially recorded at fair value which is the present value of the expected cash outflows of the obligations. The obligations are dependent on the future financial performance of the interests acquired (typically over a four- to five-year period following the year of acquisition) and assume the operating companies improve profits in line with directors’ estimates. The directors derive their estimates from internal business plans together with financial due diligence performed in connection with the acquisition.
Subsequent adjustments to the fair value are recorded in the consolidated income statement within revaluation of financial instruments. For acquisitions completed prior to 1 January 2010, such adjustments are recorded in the consolidated balance sheet within goodwill.
Property, plant and equipment
Property, plant and equipment are shown at cost less accumulated depreciation and any provision for
F-2
Accounting policies (continued)
impairment with the exception of freehold land which is not depreciated. The Group assesses the carrying value of its property, plant and equipment to determine if any impairment has occurred. Where this indicates that an asset may be impaired, the Group applies the requirements of IAS 36 Impairment of Assets in assessing the carrying amount of the asset. This process includes comparing its recoverable amount with its carrying value. Depreciation is provided at rates calculated to write off the cost less estimated residual value of each asset on a straight-line basis over its estimated useful life, as follows:
| • | | Freehold buildings – 50 years. |
| • | | Leasehold land and buildings – over the term of the lease or life of the asset, if shorter. |
| • | | Fixtures, fittings and equipment – 3-10 years. |
| • | | Computer equipment – 3-5 years. |
Interests in associates and joint ventures
An associate is an entity over which the Group has significant influence. In certain circumstances, significant influence may be represented by factors other than ownership and voting rights, such as representation on the Board of Directors.
The Group’s share of the profits less losses of associate undertakings net of tax, interest and non-controlling interests is included in the consolidated income statement and the Group’s share of net assets is shown within interests in associates in the consolidated balance sheet. The Group’s share of the profits less losses and net assets is based on current information produced by the undertakings, adjusted to conform with the accounting policies of the Group.
The Group assesses the carrying value of its associate undertakings to determine if any impairment has occurred. Where this indicates that an investment may be impaired, the Group applies the requirements of IAS 36 in assessing the carrying amount of the investment. This process includes comparing its recoverable amount with its carrying value.
The Group accounts for joint venture investments under the equity method which is consistent with the Group’s treatment of associates.
Other investments
Other investments are designated as ‘available for sale’ and are shown at fair value with any movements in fair value taken to equity.
On disposal the cumulative gain or loss previously recognised in equity is included in the profit or loss for the year.
Inventory and work in progress
Work in progress is valued at cost, which includes outlays incurred on behalf of clients and an appropriate proportion of directly attributable costs and overheads on incomplete assignments. Provision is made for irrecoverable costs where appropriate. Inventory is stated at the lower of cost and net realisable value.
Trade receivables
Trade receivables are stated net of provisions for bad and doubtful debts.
Foreign currency and interest rate hedging
The Group’s policy on interest rate and foreign exchange rate management sets out the instruments and methods available to hedge interest and currency risk exposures and the control procedures in place to ensure effectiveness.
The Group uses derivative financial instruments to reduce exposure to foreign exchange risk and interest rate movements. The Group does not hold or issue derivative financial instruments for speculative purposes.
Derivatives are initially recognised at fair value at the date a derivative contract is entered into and are subsequently remeasured to their fair value at each balance sheet date. The resulting gain or loss is recognised in profit or loss immediately unless the derivative is designated and effective as a hedging instrument, in which event the timing of the recognition in profit or loss depends on the nature of the hedge relationship.
At the inception of the hedge relationship the entity documents the relationship between the hedging instrument and hedged item, along with its risk management objectives and its strategy for undertaking various hedge transactions. Furthermore, at the inception of the hedge and on an ongoing basis, the Group documents whether the hedging instrument that is used in a hedging relationship is highly effective in offsetting changes in fair values or cash flows of the hedged item.
Note 25 contains details of the fair values of the derivative instruments used for hedging purposes.
Changes in the fair value of derivatives that are designated and qualify as fair value hedges are recorded in profit or loss immediately, together with any changes
F-3
Accounting policies (continued)
in the fair value of the hedged item that is attributable to the hedged risk.
The effective portion of changes in the fair value of derivatives that are designated and qualify as cash flow or net investment hedges is deferred in equity. The gain or loss relating to the ineffective portion is recognised immediately in profit or loss. Amounts deferred in equity are recycled in profit or loss in the periods when the hedged item is recognised in profit or loss. However, when the forecast transaction that is hedged results in the recognition of a non-financial asset or a non-financial liability, the gains and losses previously deferred in equity are transferred from equity and included in the initial measurement of the cost of the asset or liability.
Hedge accounting is discontinued when the hedging instrument expires or is sold, terminated, or exercised, or no longer qualifies for hedge accounting. At that time, any cumulative gain or loss on the hedging instrument recognised in equity is retained in equity until the forecast transaction occurs. If a hedged transaction is no longer expected to occur, the net cumulative gain or loss recognised in equity is transferred to net profit or loss for the period.
Derivatives embedded in other financial instruments or other host contracts are treated as separate derivatives when their risks and characteristics are not closely related to those of host contracts and the host contracts are not carried at fair value with unrealised gains or losses reported in the consolidated income statement.
Liabilities in respect of option agreements
Option agreements that allow the Group’s equity partners to require the Group to purchase a non-controlling interest are treated as derivatives over equity instruments and are recorded in the consolidated balance sheet at fair value and the valuation is remeasured at each period end. Fair value is based on the present value of expected cash outflows and the movement in the fair value is recognised as income or expense within revaluation of financial instruments in the consolidated income statement.
Derecognition of financial liabilities
In accordance with IAS 39 Financial Instruments: Recognition and Measurement, a financial liability of the Group is only released to the consolidated income statement when the underlying legal obligation is extinguished.
Convertible debt
Convertible debt is assessed according to the substance of the contractual arrangements and is classified into liability and equity elements on the basis of the initial fair value of the liability element. The difference between this figure and the cash received is classified as equity.
The consolidated income statement charge for the finance cost is spread evenly over the term of the convertible debt so that at redemption the liability equals the redemption value.
Other debt
Other interest-bearing debt is recorded at the proceeds received, net of direct issue costs.
Borrowing costs
Finance costs of borrowing are recognised in the consolidated income statement over the term of those borrowings.
Revenue recognition
Revenue comprises commission and fees earned in respect of amounts billed. Direct costs include fees paid to external suppliers where they are retained to perform part or all of a specific project for a client and the resulting expenditure is directly attributable to the revenue earned. Revenue is stated exclusive of VAT, sales taxes and trade discounts.
Advertising and Media Investment Management
Revenue is typically derived from commissions on media placements and fees for advertising services. Revenue may consist of various arrangements involving commissions, fees, incentive-based revenue or a combination of the three, as agreed upon with each client.
Revenue is recognised when the service is performed, in accordance with the terms of the contractual arrangement. The amount of revenue recognised depends on whether we act as an agent or as a principal in an arrangement with a client. Where we act as an agent, the revenue recorded is the net amount retained when the fee or commission is earned. Although the Group may bear credit risk in respect of these activities, the arrangements with our clients are such that we consider that we are acting as an agent on their behalf. In such cases, costs incurred with external suppliers (such as media suppliers) are excluded from our revenue. Where the Group acts as a principal and contracts directly with suppliers for media payments and production costs, the revenue recorded is the gross amount billed.
F-4
Accounting policies (continued)
Incentive-based revenue typically comprises both quantitative and qualitative elements; on the element related to quantitative targets, revenue is recognised when the quantitative targets have been achieved; on the element related to qualitative targets, revenue is recognised when the incentive is received or receivable.
The Group receives volume rebates from certain suppliers for transactions entered into on behalf of clients that, based on the terms of the relevant contracts and local law, are either remitted to clients or retained by the Group. If amounts are passed on to clients they are recorded as liabilities until settled or, if retained by the Group, are recorded as revenue when earned.
Consumer Insight
Revenue recognised in proportion to the level of service performed for market research contracts is based on proportional performance. In assessing contract performance, both input and output criteria are reviewed. Costs incurred are used as an objective input measure of performance. The primary input of all work performed under these arrangements is labour. As a result of the relationship between labour and cost, there is normally a direct relationship between costs incurred and the proportion of the contract performed to date. Costs incurred as a proportion of expected total costs is used as an initial proportional performance measure. This indicative proportional performance measure is subsequently validated against other more subjective criteria (i.e. relevant output measures) such as the percentage of interviews completed, percentage of reports delivered to a client and the achievement of any project milestones stipulated in the contract. In the event of divergence between the objective and more subjective measures, the more subjective measures take precedence since these are output measures.
While most of the studies provided in connection with the Group’s market research contracts are undertaken in response to an individual client’s or group of clients’ specifications, in certain instances a study may be developed as an off-the-shelf product offering sold to a broad client base. For these transactions, revenue is recognised when the product is delivered. Where the terms of transaction provide for licensing the product on a subscription basis, revenue is recognised over the subscription period on a straight-line basis or, if applicable, based on usage.
Substantially all services are provided on a fixed price basis. Pricing may also include a provision for a surcharge where the actual labour hours incurred in completing a project are significantly above the labour hours quoted in the project proposal. In instances where this occurs, the surcharge will be included in the total revenue base on which to measure proportional performance when the actual threshold is reached provided that collectability is reasonably assured.
Public Relations & Public Affairs and Branding & Identity, Healthcare and Specialist Communications
Revenue is typically derived from retainer fees and services to be performed subject to specific agreement. Revenue is recognised when the service is performed, in accordance with the terms of the contractual arrangement. Revenue is recognised on long-term contracts, if the final outcome can be assessed with reasonable certainty, by including in the consolidated income statement revenue and related costs as contract activity progresses.
Taxation
Corporate taxes are payable on taxable profits at current rates. The tax expense represents the sum of the tax currently payable and deferred tax.
The Group is subject to corporate taxes in a number of different jurisdictions and judgement is required in determining the appropriate provision for transactions where the ultimate tax determination is uncertain. In such circumstances, the Group recognises liabilities for anticipated taxes based on the best information available and where the anticipated liability is both probable and estimable. Such liabilities are classified as current when the Group expects to settle the liability within 12 months and the remainder as non-current. Any interest and penalties accrued are included in income taxes both in the consolidated income statement and balance sheet. Where the final outcome of such matters differs from the amount recorded, any differences may impact the income tax and deferred tax provisions in the period in which the final determination is made.
The tax laws that apply to the Group’s subsidiaries may be amended by the relevant tax authorities. Such potential amendments are regularly monitored and adjustments are made to the Group’s tax liabilities and deferred tax assets and liabilities where necessary.
The tax currently payable is based on taxable profit for the year. Taxable profit differs from net profit as reported in the consolidated income statement because it excludes items of income or expense that are taxable or deductible in other years and it further excludes items that are never taxable or deductible. The Group’s liability for current tax
F-5
Accounting policies (continued)
is calculated using tax rates that have been enacted or substantively enacted by the balance sheet date.
Deferred tax is the tax expected to be payable or recoverable on differences between the carrying amounts of assets and liabilities in the financial statements and the corresponding tax bases used in the computation of taxable profit, and is accounted for using the balance sheet liability method. Deferred tax liabilities are recognised for all taxable temporary differences unless specifically excepted by IAS 12 Income Taxes. Deferred tax is charged or credited in the consolidated income statement, except when it relates to items charged or credited to other comprehensive income or directly to equity, in which case the deferred tax is also dealt with in other comprehensive income or equity. Deferred tax assets are recognised to the extent that it is probable that taxable profits will be available against which deductible temporary differences can be utilised. Such assets and liabilities are not recognised if the temporary difference arises from the initial recognition of goodwill or other assets and liabilities (other than in a business combination) in a transaction that affects neither the tax profit nor the accounting profit.
The carrying amount of deferred tax assets is reviewed at each balance sheet date and reduced to the extent that it is no longer probable that sufficient taxable profits will be available to allow all or part of the asset to be recovered.
Deferred tax liabilities are recognised for taxable temporary differences arising on investments in subsidiaries and associates, and interests in joint ventures, except where the Group is able to control the reversal of the temporary difference and it is probable that the temporary difference will not reverse in the foreseeable future.
Deferred tax assets and liabilities are offset when there is a legally enforceable right to set off current tax assets against current tax liabilities and when they relate to income taxes levied by the same taxation authority and the Group intends to settle its current tax assets and liabilities on a net basis.
Deferred tax is calculated at the tax rates that are expected to apply in the period when the liability is settled or the asset is realised based on enacted or substantively enacted legislation. Deferred tax is charged or credited in the consolidated income statement, except when it relates to items charged or credited directly to equity or the consolidated statement of comprehensive income, in which case the deferred tax is also dealt with
in equity or the consolidated statement of comprehensive income.
Retirement benefit costs
For defined contribution plans, contributions are charged to the consolidated income statement as payable in respect of the accounting period.
For defined benefit plans the amounts charged to operating profit are the current service costs and gains and losses on settlements and curtailments. They are included as part of staff costs. Past service costs are recognised immediately in the consolidated income statement if the benefits have vested. If the benefits have not vested, the costs are recognised over the period until vesting occurs. The interest cost and the expected return on assets are shown within finance costs and finance income respectively. Actuarial gains and losses are recognised immediately in the consolidated statement of comprehensive income.
Where defined benefit plans are funded, the assets of the plan are held separately from those of the Group, in separate independently managed funds. Pension plan assets are measured at fair value and liabilities are measured on an actuarial basis using the projected unit method and discounted at a rate equivalent to the current rate of return on a high-quality corporate bond of equivalent currency and term to the plan liabilities. The actuarial valuations are obtained at least triennially and are updated at each balance sheet date.
Recognition of a surplus in a defined benefit plan is limited based on the economic gain the Company is expected to benefit from in the future by means of a refund or reduction in future contributions to the plan, in accordance with IAS 19 Employee Benefits.
Finance leases
Assets held under finance leases are recognised as assets of the Group at the inception of the lease at the lower of their fair value and the present value of the minimum lease payments. Depreciation on leased assets is charged to the consolidated income statement on the same basis as owned assets. Leasing payments are treated as consisting of capital and interest elements and the interest is charged to the consolidated income statement as it is incurred.
Operating leases
Operating lease rentals are charged to the consolidated income statement on a straight-line basis over the lease term. Any premium or discount on the acquisition of a lease is spread over the life of the lease on a straight-line basis.
F-6
Accounting policies (continued)
Translation of foreign currencies
Foreign currency transactions arising from normal trading activities are recorded at the rates in effect at the date of the transaction. Monetary assets and liabilities denominated in foreign currencies at the year end are translated at the year-end exchange rate. Foreign currency gains and losses are credited or charged to the consolidated income statement as they arise.
The income statements of overseas subsidiary undertakings are translated into pounds sterling at average exchange rates and the year-end net assets of these companies are translated at year-end exchange rates.
Exchange differences arising from retranslation of the opening net assets and on foreign currency borrowings (to the extent that they hedge the Group’s investment in such operations) are reported in the consolidated statement of comprehensive income.
Goodwill and fair value adjustments arising on the acquisition of a foreign entity are treated as assets and liabilities of the foreign entity and translated at the closing rate.
Share-based payments
The Group issues equity-settled share-based payments (including share options) to certain employees and accounts for these awards in accordance with IFRS 2 Share-Based Payment. Equity-settled share-based payments are measured at fair value (excluding the effect of non-market-based vesting conditions) at the date of grant. Details regarding the fair value of equity settled share-based transactions are set out in notes 22 and 26.
The fair value determined at the grant date is recognised in the consolidated income statement as an expense on a straight-line basis over the relevant vesting period, based on the Group’s estimate of the number of shares that will ultimately vest and adjusted for the effect of non-market-based vesting conditions.
New IFRS accounting pronouncements
At the date of authorisation of these financial statements, the following Standards and Interpretations, which have not been applied in these financial statements, were in issue but not yet effective:
| • | | IFRS 9: Financial Instruments; |
| • | | IFRS 10: Consolidated Financial Statements; |
| • | | IFRS 11: Joint Arrangements; |
| • | | IFRS 12: Disclosure of Interests in Other Entities; |
| • | | IFRS 13: Fair Value Measurement; |
| • | | IAS 1 (amended): Presentation of Financial Statements; |
| • | | IAS 19 (amended): Employee Benefits; |
| • | | IAS 27 (revised): Separate Financial Statements; |
| • | | IAS 28 (revised): Investments in Associates and Joint Ventures; and |
| • | | IAS 32 (amended): Financial Instruments: Presentation. |
The Group does not consider that these Standards and Interpretations will have a significant impact on the financial statements of the Group except for additional disclosures when the relevant standards come into effect.
In the current year, the following Standards and Interpretations became effective:
| • | | IFRS 7 (amended): Financial Instruments: Disclosures; and |
| • | | IAS 12 (amended): Income Taxes. |
The adoption of these Standards and Interpretations has not led to any changes in the Group’s accounting policies.
Critical judgements in applying accounting policies
Management is required to make key decisions and judgements in the process of applying the Group’s accounting policies. The most significant areas where such judgements have been necessary are revenue recognition, goodwill and other intangibles, payments due to vendors (earnout agreements), acquisition reserves, taxation and accounting for pension liabilities. Where judgement has been applied, the key factors taken into consideration are disclosed in the accounting policies and the appropriate note in these financial statements.
F-7
Consolidated income statement
For the years ended 31 December 2012, 2011, 2010
| | | | | | | | | | | | | | |
| | | Notes | | 2012 £m | | | 2011 £m | | | 2010 £m | |
Revenue | | 2 | | | 10,373.1 | | | | 10,021.8 | | | | 9,331.0 | |
Direct costs | | | | | (858.3 | ) | | | (783.3 | ) | | | (770.5 | ) |
Gross profit | | | | | 9,514.8 | | | | 9,238.5 | | | | 8,560.5 | |
Operating costs | | 3 | | | (8,273.7 | ) | | | (8,046.3 | ) | | | (7,587.5 | ) |
Operating profit | | | | | 1,241.1 | | | | 1,192.2 | | | | 973.0 | |
Share of results of associates | | 4 | | | 69.4 | | | | 66.1 | | | | 55.2 | |
Profit before interest and taxation | | | | | 1,310.5 | | | | 1,258.3 | | | | 1,028.2 | |
Finance income | | 6 | | | 85.9 | | | | 97.3 | | | | 81.7 | |
Finance costs | | 6 | | | (299.8 | ) | | | (297.2 | ) | | | (276.8 | ) |
Revaluation of financial instruments | | 6 | | | (4.7 | ) | | | (50.0 | ) | | | 18.2 | |
Profit before taxation | | | | | 1,091.9 | | | | 1,008.4 | | | | 851.3 | |
Taxation | | 7 | | | (197.2 | ) | | | (91.9 | ) | | | (190.3 | ) |
Profit for the year | | | | | 894.7 | | | | 916.5 | | | | 661.0 | |
| | | | | | | | | | | | | | | |
Attributable to: | | | | | | | | | | | | | | |
Equity holders of the parent | | | | | 822.7 | | | | 840.1 | | | | 586.0 | |
Non-controlling interests | | | | | 72.0 | | | | 76.4 | | | | 75.0 | |
| | | | | | 894.7 | | | | 916.5 | | | | 661.0 | |
| | | | | | | | | | | | | | | |
Earnings per share1 | | | | | | | | | | | | | | |
Basic earnings per ordinary share | | 9 | | | 66.2p | | | | 67.6p | | | | 47.5p | |
Diluted earnings per ordinary share | | 9 | | | 62.8p | | | | 64.5p | | | | 45.9p | |
Notes
The accounting policies on pages F-2 to F-7 and the accompanying notes on pages F-13 to F-45 form an integral part of this consolidated income statement.
| 1 | | The calculations of the Group’s earnings per share are set out in note 9. |
F-8
Consolidated statement of comprehensive income
For the years ended 31 December 2012, 2011, 2010
| | | | | | | | | | | | |
| | | 2012
£m | | | 2011
£m | | | 2010
£m | |
Profit for the year | | | 894.7 | | | | 916.5 | | | | 661.0 | |
Exchange adjustments on foreign currency net investments | | | (305.2 | ) | | | (256.3 | ) | | | 156.3 | |
(Loss)/gain on revaluation of available for sale investments | | | (3.5 | ) | | | 11.3 | | | | (59.8 | ) |
Actuarial loss on defined benefit pension plans | | | (83.9 | ) | | | (72.0 | ) | | | (0.4 | ) |
Deferred tax on defined benefit pension plans | | | 7.3 | | | | 0.1 | | | | 0.2 | |
Other comprehensive (loss)/income relating to the year | | | (385.3 | ) | | | (316.9 | ) | | | 96.3 | |
Total comprehensive income relating to the year | | | 509.4 | | | | 599.6 | | | | 757.3 | |
| Attributable to: | | | | | | | | | | | | |
Equity holders of the parent | | | 444.2 | | | | 529.5 | | | | 672.6 | |
Non-controlling interests | | | 65.2 | | | | 70.1 | | | | 84.7 | |
| | | | 509.4 | | | | 599.6 | | | | 757.3 | |
Note
The accounting policies on pages F-2 to F-7 and the accompanying notes on pages F-13 to F-45 form an integral part of this consolidated statement of comprehensive income.
F-9
Consolidated cash flow statement
For the years ended 31 December 2012, 2011, 2010
| | | | | | | | | | | | | | | | |
| | | Notes | | | 2012 £m | | | 2011 £m | | | 2010 £m | |
Net cash inflow from operating activities | | | 11 | | | | 908.3 | | | | 665.2 | | | | 1,361.2 | |
Investing activities | | | | | | | | | | | | | | | | |
Acquisitions and disposals | | | 11 | | | | (566.5 | ) | | | (469.8 | ) | | | (200.1 | ) |
Purchases of property, plant and equipment | | | | | | | (290.3 | ) | | | (216.1 | ) | | | (190.5 | ) |
Purchases of other intangible assets (including capitalised computer software) | | | | | | | (39.8 | ) | | | (37.1 | ) | | | (27.0 | ) |
Proceeds on disposal of property, plant and equipment | | | | | | | 123.5 | | | | 13.2 | | | | 7.6 | |
Net cash outflow from investing activities | | | | | | | (773.1 | ) | | | (709.8 | ) | | | (410.0 | ) |
Financing activities | | | | | | | | | | | | | | | | |
Share option proceeds | | | | | | | 56.0 | | | | 28.8 | | | | 42.7 | |
Cash consideration for non-controlling interests | | | 11 | | | | (20.1 | ) | | | (62.6 | ) | | | (15.1 | ) |
Share repurchases and buy-backs | | | 11 | | | | (134.5 | ) | | | (182.2 | ) | | | (46.4 | ) |
Net increase in borrowings | | | 11 | | | | 380.5 | | | | 301.4 | | | | 19.8 | |
Financing and share issue costs | | | | | | | (8.2 | ) | | | (11.9 | ) | | | (3.5 | ) |
Equity dividends paid | | | | | | | (306.6 | ) | | | (218.4 | ) | | | (200.4 | ) |
Dividends paid to non-controlling interests in subsidiary undertakings | | | | | | | (51.9 | ) | | | (62.2 | ) | | | (66.7 | ) |
Net cash outflow from financing activities | | | | | | | (84.8 | ) | | | (207.1 | ) | | | (269.6 | ) |
Net increase/(decrease) in cash and cash equivalents | | | | | | | 50.4 | | | | (251.7 | ) | | | 681.6 | |
Translation differences | | | | | | | (119.3 | ) | | | (29.9 | ) | | | 82.2 | |
Cash and cash equivalents at beginning of year | | | | | | | 1,428.2 | | | | 1,709.8 | | | | 946.0 | |
Cash and cash equivalents at end of year | | | 11 | | | | 1,359.3 | | | | 1,428.2 | | | | 1,709.8 | |
Note
The accounting policies on pages F-2 to F-7 and the accompanying notes on pages F-13 to F-45 form an integral part of this consolidated cash flow statement.
F-10
Consolidated balance sheet
At 31 December 2012, 2011
| | | | | | | | | | | | |
| | | Notes | | | 2012 £m | | | 2011 £m | |
Non-current assets | | | | | | | | | | | | |
Intangible assets: | | | | | | | | | | | | |
Goodwill | | | 12 | | | | 9,457.2 | | | | 9,430.8 | |
Other | | | 12 | | | | 1,827.4 | | | | 1,859.9 | |
Property, plant and equipment | | | 13 | | | | 768.3 | | | | 728.3 | |
Interests in associates and joint ventures | | | 14 | | | | 887.2 | | | | 801.3 | |
Other investments | | | 14 | | | | 176.5 | | | | 190.8 | |
Deferred tax assets | | | 15 | | | | 91.2 | | | | 86.0 | |
Trade and other receivables | | | 17 | | | | 245.1 | | | | 309.1 | |
| | | | | | | | 13,452.9 | | | | 13,406.2 | |
Current assets | | | | | | | | | | | | |
Inventory and work in progress | | | 16 | | | | 348.2 | | | | 333.9 | |
Corporate income tax recoverable | | | | | | | 124.2 | | | | 88.5 | |
Trade and other receivables | | | 17 | | | | 9,007.0 | | | | 8,919.7 | |
Cash and short-term deposits | | | | | | | 1,945.3 | | | | 1,946.6 | |
| | | | | | | | 11,424.7 | | | | 11,288.7 | |
Current liabilities | | | | | | | | | | | | |
Trade and other payables | | | 18 | | | | (10,907.8 | ) | | | (11,165.5 | ) |
Corporate income tax payable | | | | | | | (102.9 | ) | | | (113.4 | ) |
Bank overdrafts and loans | | | 20 | | | | (1,085.9 | ) | | | (518.4 | ) |
| | | | | | | | (12,096.6 | ) | | | (11,797.3 | ) |
Net current liabilities | | | | | | | (671.9 | ) | | | (508.6 | ) |
Total assets less current liabilities | | | | | | | 12,781.0 | | | | 12,897.6 | |
Non-current liabilities | | | | | | | | | | | | |
Bonds and bank loans | | | 20 | | | | (3,680.6 | ) | | | (3,893.0 | ) |
Trade and other payables | | | 19 | | | | (512.0 | ) | | | (553.1 | ) |
Corporate income tax payable | | | | | | | (375.3 | ) | | | (379.5 | ) |
Deferred tax liabilities | | | 15 | | | | (680.3 | ) | | | (741.4 | ) |
Provision for post-employment benefits | | | 23 | | | | (335.6 | ) | | | (282.3 | ) |
Provisions for liabilities and charges | | | 21 | | | | (136.6 | ) | | | (154.0 | ) |
| | | | | | | | (5,720.4 | ) | | | (6,003.3 | ) |
Net assets | | | | | | | 7,060.6 | | | | 6,894.3 | |
Equity | | | | | | | | | | | | |
Called-up share capital | | | 26 | | | | 126.5 | | | | 126.6 | |
Share premium account | | | | | | | 175.9 | | | | 105.7 | |
Shares to be issued | | | | | | | 1.8 | | | | 2.4 | |
Merger reserve | | | | | | | (5,135.7 | ) | | | (5,136.2 | ) |
Other reserves | | | 27 | | | | 622.7 | | | | 938.9 | |
Own shares | | | | | | | (166.5 | ) | | | (177.6 | ) |
Retained earnings | | | | | | | 11,186.3 | | | | 10,803.5 | |
Equity share owners’ funds | | | | | | | 6,811.0 | | | | 6,663.3 | |
Non-controlling interests | | | | | | | 249.6 | | | | 231.0 | |
Total equity | | | | | | | 7,060.6 | | | | 6,894.3 | |
Note
The accounting policies on pages F-2 to F-7 and the accompanying notes on pages F-13 to F-45 form an integral part of this consolidated balance sheet.
F-11
Consolidated statement of changes in equity
For the year ended 31 December 2012, 2011, 2010
| | | | | | | | | | | | | | | | | | | | | | | | | | | | | | | | | | | | | | | | |
| | | Called-up
share
capital
£m | | | Share
premium
account
£m | | | Shares to be
issued
£m | | | Merger
reserve
£m | | | Other
reserves1
£m | | | Own
shares
£m | | | Retained
earnings
£m | | | Total
equity
share
owners’
funds
£m | | | Non-
controlling interests
£m | | | Total £m | |
Balance at 1 January 2010 | | | 125.6 | | | | 12.6 | | | | 5.5 | | | | (5,138.0 | ) | | | 1,093.1 | | | | (154.0 | ) | | | 9,949.2 | | | | 5,894.0 | | | | 181.7 | | | | 6,075.7 | |
| Ordinary shares issued | | | 0.8 | | | | 41.9 | | | | (2.4 | ) | | | 1.2 | | | | – | | | | – | | | | 0.9 | | | | 42.4 | | | | – | | | | 42.4 | |
| Exchange adjustments on foreign currency net investments | | | – | | | | – | | | | – | | | | – | | | | 146.6 | | | | – | | | | – | | | | 146.6 | | | | 9.7 | | | | 156.3 | |
| Net profit for the year | | | – | | | | – | | | | – | | | | – | | | | – | | | | – | | | | 586.0 | | | | 586.0 | | | | 75.0 | | | | 661.0 | |
| Dividends paid | | | – | | | | – | | | | – | | | | – | | | | – | | | | – | | | | (200.4 | ) | | | (200.4 | ) | | | (66.7 | ) | | | (267.1 | ) |
| Non-cash share-based incentive plans (including share options) | | | – | | | | – | | | | – | | | | – | | | | – | | | | – | | | | 70.4 | | | | 70.4 | | | | – | | | | 70.4 | |
| Tax adjustment on share-based payments | | | – | | | | – | | | | – | | | | – | | | | – | | | | – | | | | 21.1 | | | | 21.1 | | | | – | | | | 21.1 | |
| Net movement in own shares held by ESOP Trusts | | | – | | | | – | | | | – | | | | – | | | | – | | | | 9.2 | | | | (55.6 | ) | | | (46.4 | ) | | | – | | | | (46.4 | ) |
| Actuarial loss on defined benefit pension plans | | | – | | | | – | | | | – | | | | – | | | | – | | | | – | | | | (0.4 | ) | | | (0.4 | ) | | | – | | | | (0.4 | ) |
| Deferred tax on defined benefit pension plans | | | – | | | | – | | | | – | | | | – | | | | – | | | | – | | | | 0.2 | | | | 0.2 | | | | – | | | | 0.2 | |
| Loss on revaluation of available for sale investments | | | – | | | | – | | | | – | | | | – | | | | (59.8 | ) | | | – | | | | – | | | | (59.8 | ) | | | – | | | | (59.8 | ) |
| Recognition/remeasurement of financial instruments | | | – | | | | – | | | | – | | | | – | | | | 2.9 | | | | – | | | | 0.9 | | | | 3.8 | | | | – | | | | 3.8 | |
| Acquisition of subsidiaries2 | | | – | | | | – | | | | – | | | | – | | | | – | | | | – | | | | (10.9 | ) | | | (10.9 | ) | | | 1.6 | | | | (9.3 | ) |
| Balance at 31 December 2010 | | | 126.4 | | | | 54.5 | | | | 3.1 | | | | (5,136.8 | ) | | | 1,182.8 | | | | (144.8 | ) | | | 10,361.4 | | | | 6,446.6 | | | | 201.3 | | | | 6,647.9 | |
Ordinary shares issued | | | 0.6 | | | | 30.4 | | | | (0.7 | ) | | | 0.6 | | | | – | | | | – | | | | – | | | | 30.9 | | | | – | | | | 30.9 | |
Share cancellations | | | (0.7 | ) | | | – | | | | – | | | | – | | | | 0.7 | | | | – | | | | (45.9 | ) | | | (45.9 | ) | | | – | | | | (45.9 | ) |
Treasury share additions | | | – | | | | – | | | | – | | | | – | | | | – | | | | (29.8 | ) | | | – | | | | (29.8 | ) | | | – | | | | (29.8 | ) |
Treasury share allocations | | | – | | | | – | | | | – | | | | – | | | | – | | | | 0.8 | | | | (0.8 | ) | | | – | | | | – | | | | – | |
Exchange adjustments on foreign currency net investments | | | – | | | | – | | | | – | | | | – | | | | (250.0 | ) | | | – | | | | – | | | | (250.0 | ) | | | (6.3 | ) | | | (256.3 | ) |
Net profit for the year | | | – | | | | – | | | | – | | | | – | | | | – | | | | – | | | | 840.1 | | | | 840.1 | | | | 76.4 | | | | 916.5 | |
Dividends paid | | | – | | | | – | | | | – | | | | – | | | | – | | | | – | | | | (218.4 | ) | | | (218.4 | ) | | | (62.2 | ) | | | (280.6 | ) |
Scrip dividend | | | 0.3 | | | | 20.8 | | | | – | | | | – | | | | – | | | | – | | | | (21.1 | ) | | | – | | | | – | | | | – | |
Non-cash share-based incentive plans (including share options) | | | – | | | | – | | | | – | | | | – | | | | – | | | | – | | | | 78.8 | | | | 78.8 | | | | – | | | | 78.8 | |
Tax adjustment on share-based payments | | | – | | | | – | | | | – | | | | – | | | | – | | | | – | | | | (11.7 | ) | | | (11.7 | ) | | | – | | | | (11.7 | ) |
Net movement in own shares held by ESOP Trusts | | | – | | | | – | | | | – | | | | – | | | | – | | | | (3.8 | ) | | | (102.7 | ) | | | (106.5 | ) | | | – | | | | (106.5 | ) |
Actuarial loss on defined benefit pension plans | | | – | | | | – | | | | – | | | | – | | | | – | | | | – | | | | (72.0 | ) | | | (72.0 | ) | | | – | | | | (72.0 | ) |
Deferred tax on defined benefit pension plans | | | – | | | | – | | | | – | | | | – | | | | – | | | | – | | | | 0.1 | | | | 0.1 | | | | – | | | | 0.1 | |
Gain on revaluation of available for sale investments | | | – | | | | – | | | | – | | | | – | | | | 11.3 | | | | – | | | | – | | | | 11.3 | | | | – | | | | 11.3 | |
Recognition/remeasurement of financial instruments | | | – | | | | – | | | | – | | | | – | | | | (5.9 | ) | | | – | | | | 33.8 | | | | 27.9 | | | | – | | | | 27.9 | |
Acquisition of subsidiaries2 | | | – | | | | – | | | | – | | | | – | | | | – | | | | – | | | | (38.1 | ) | | | (38.1 | ) | | | 21.8 | | | | (16.3 | ) |
Balance at 31 December 2011 | | | 126.6 | | | | 105.7 | | | | 2.4 | | | | (5,136.2 | ) | | | 938.9 | | | | (177.6 | ) | | | 10,803.5 | | | | 6,663.3 | | | | 231.0 | | | | 6,894.3 | |
Ordinary shares issued | | | 1.0 | | | | 55.0 | | | | (0.6 | ) | | | 0.5 | | | | – | | | | – | | | | – | | | | 55.9 | | | | – | | | | 55.9 | |
Share issue/cancellation costs | | | – | | | | (0.2 | ) | | | – | | | | – | | | | – | | | | – | | | | – | | | | (0.2 | ) | | | – | | | | (0.2 | ) |
Share cancellations | | | (0.7 | ) | | | – | | | | – | | | | – | | | | 0.7 | | | | – | | | | (55.1 | ) | | | (55.1 | ) | | | – | | | | (55.1 | ) |
Treasury share additions | | | – | | | | – | | | | – | | | | – | | | | – | | | | (0.6 | ) | | | – | | | | (0.6 | ) | | | – | | | | (0.6 | ) |
Treasury share allocations | | | – | | | | – | | | | – | | | | – | | | | – | | | | 0.9 | | | | (0.9 | ) | | | – | | | | – | | | | – | |
Treasury share cancellations | | | (0.6 | ) | | | – | | | | – | | | | – | | | | 0.6 | | | | 37.2 | | | | (37.2 | ) | | | – | | | | – | | | | – | |
Exchange adjustments on foreign currency net investments | | | – | | | | – | | | | – | | | | – | | | | (298.4 | ) | | | – | | | | – | | | | (298.4 | ) | | | (6.8 | ) | | | (305.2 | ) |
Net profit for the year | | | – | | | | – | | | | – | | | | – | | | | – | | | | – | | | | 822.7 | | | | 822.7 | | | | 72.0 | | | | 894.7 | |
Dividends paid | | | – | | | | – | | | | – | | | | – | | | | – | | | | – | | | | (306.6 | ) | | | (306.6 | ) | | | (51.9 | ) | | | (358.5 | ) |
Scrip dividend | | | 0.2 | | | | 15.4 | | | | – | | | | – | | | | – | | | | – | | | | (15.6 | ) | | | – | | | | – | | | | – | |
Non-cash share-based incentive plans (including share options) | | | – | | | | – | | | | – | | | | – | | | | – | | | | – | | | | 92.8 | | | | 92.8 | | | | – | | | | 92.8 | |
Tax adjustment on share-based payments | | | – | | | | – | | | | – | | | | – | | | | – | | | | – | | | | 18.3 | | | | 18.3 | | | | – | | | | 18.3 | |
Net movement in own shares held by ESOP Trusts | | | – | | | | – | | | | – | | | | – | | | | – | | | | (26.4 | ) | | | (52.4 | ) | | | (78.8 | ) | | | – | | | | (78.8 | ) |
Actuarial loss on defined benefit pension plans | | | – | | | | – | | | | – | | | | – | | | | – | | | | – | | | | (83.9 | ) | | | (83.9 | ) | | | – | | | | (83.9 | ) |
Deferred tax on defined benefit pension plans | | | – | | | | – | | | | – | | | | – | | | | – | | | | – | | | | 7.3 | | | | 7.3 | | | | – | | | | 7.3 | |
Loss on revaluation of available for sale investments | | | – | | | | – | | | | – | | | | – | | | | (3.5 | ) | | | – | | | | – | | | | (3.5 | ) | | | – | | | | (3.5 | ) |
Recognition/remeasurement of financial instruments | | | – | | | | – | | | | – | | | | – | | | | 2.7 | | | | – | | | | 14.8 | | | | 17.5 | | | | – | | | | 17.5 | |
Share purchases – close period commitments | | | – | | | | – | | | | – | | | | – | | | | (18.3 | ) | | | – | | | | – | | | | (18.3 | ) | | | – | | | | (18.3 | ) |
Acquisition of subsidiaries2 | | | – | | | | – | | | | – | | | | – | | | | – | | | | – | | | | (21.4 | ) | | | (21.4 | ) | | | 5.3 | | | | (16.1 | ) |
Balance at 31 December 2012 | | | 126.5 | | | | 175.9 | | | | 1.8 | | | | (5,135.7 | ) | | | 622.7 | | | | (166.5 | ) | | | 11,186.3 | | | | 6,811.0 | | | | 249.6 | | | | 7,060.6 | |
Notes
The accounting policies on pages F-2 to F-7 and the accompanying notes on pages F-13 to F-45 form an integral part of this consolidated statement of changes in equity.
| 1 | | Other reserves are analysed in note 27. |
| 2 | | Acquisition of subsidiaries represents movements in retained earnings and non-controlling interests arising from changes in ownership of existing subsidiaries and recognition of non-controlling interests on new acquisitions. |
Total comprehensive income relating to the year ended 31 December 2012 was £509.4 million (2011: £599.6 million, 2010: £757.3 million).
F-12
Notes to the consolidated financial statements
1. General information
WPP plc is a company incorporated in Jersey. The address of the registered office is Queensway House, Hilgrove Street, St Helier, Jersey, JE11ES and the address of the principal executive office is 27 Farm Street, London, United Kingdom, W1J 5RJ. The nature of the Group’s operations and its principal activities are set out in note 2. These consolidated financial statements are presented in pounds sterling.
2. Segment information
The Group is a leading worldwide communications services organisation offering national and multinational clients a comprehensive range of communications services.
The Group is organised into four reportable segments – Advertising and Media Investment Management; Consumer Insight; Public Relations & Public Affairs; and Branding & Identity, Healthcare and Specialist Communications. This last reportable segment includes WPP Digital and direct, digital, promotional and relationship marketing.
IFRS 8 Operating Segments requires operating segments to be identified on the same basis as is used internally for the review of performance and allocation of resources by the Group chief executive. Provided certain quantitative and qualitative criteria are fulfilled, IFRS 8 permits the aggregation of these components into reportable segments for the purposes of disclosure in the Group’s financial statements. In assessing the Group’s reportable segments, the directors have had regard to the similar economic characteristics of certain operating segments, their shared client base, the similar nature of their products or services and their long-term margins, amongst other factors.
Operating sectors
Reported contributions were as follows:
| | | | | | | | | | | | | | | | | | | | | | | | | | | | | | | | | | | | |
| | | Revenue1 | | | Headline
PBIT2 | | | Headline
PBIT
margin | | | Revenue1 | | | Headline
PBIT2 | | | Headline
PBIT
margin | | | Revenue1 | | | Headline
PBIT2 | | | Headline
PBIT
margin | |
| | | 2012 £m | | | 2012 £m | | | 2012 % | | | 2011 £m | | | 2011 £m | | | 2011 % | | | 2010 £m | | | 2010 £m | | | 2010 % | |
| Advertising and Media Investment Management | | | 4,273.2 | | | | 754.5 | | | | 17.7 | | | | 4,157.2 | | | | 667.9 | | | | 16.1 | | | | 3,733.3 | | | | 573.0 | | | | 15.3 | |
| Consumer Insight | | | 2,460.2 | | | | 246.9 | | | | 10.0 | | | | 2,458.0 | | | | 258.7 | | | | 10.5 | | | | 2,430.2 | | | | 234.8 | | | | 9.7 | |
| Public Relations & Public Affairs | | | 917.1 | | | | 136.4 | | | | 14.9 | | | | 885.4 | | | | 142.9 | | | | 16.1 | | | | 844.5 | | | | 133.1 | | | | 15.8 | |
Branding & Identity, Healthcare and Specialist Communications | | | 2,722.6 | | | | 393.2 | | | | 14.4 | | | | 2,521.2 | | | | 359.5 | | | | 14.3 | | | | 2,323.0 | | | | 287.8 | | | | 12.4 | |
| | | | 10,373.1 | | | | 1,531.0 | | | | 14.8 | | | | 10,021.8 | | | | 1,429.0 | | | | 14.3 | | | | 9,331.0 | | | | 1,228.7 | | | | 13.2 | |
Notes
| 1 | | Intersegment sales have not been separately disclosed as they are not material. |
| 2 | | A reconciliation from profit before interest and taxation (PBIT) to headline PBIT is provided in note 31. PBIT is reconciled to profit before taxation in the consolidated income statement. |
| | | | | | | | | | | | | | | | | | | | | | | | |
| Other information | | Share-based
payments | | | Capital
additions1 | | | Depreciation
and amortisation2 | | | Goodwill
impairment &
write-downs | | | Share of
results of
associates | | | Interests in
associates and
joint ventures | |
| | | £m | | | £m | | | £m | | | £m | | | £m | | | £m | |
| 2012 | | | | | | | | | | | | | | | | | | | | | | | | |
| Advertising and Media Investment Management | | | 49.3 | | | | 198.4 | | | | 97.1 | | | | 0.7 | | | | 34.7 | | | | 566.9 | |
| Consumer Insight | | | 16.6 | | | | 60.5 | | | | 55.5 | | | | – | | | | 18.6 | | | | 102.4 | |
| Public Relations & Public Affairs | | | 4.9 | | | | 12.4 | | | | 15.7 | | | | 31.3 | | | | 2.3 | | | | 47.9 | |
| Branding & Identity, Healthcare and Specialist Communications | | | 22.0 | | | | 66.9 | | | | 56.4 | | | | – | | | | 13.8 | | | | 170.0 | |
| | | | 92.8 | | | | 338.2 | | | | 224.7 | | | | 32.0 | | | | 69.4 | | | | 887.2 | |
| 2011 | | | | | | | | | | | | | | | | | | | | | | | | |
| Advertising and Media Investment Management | | | 44.5 | | | | 112.7 | | | | 94.2 | | | | – | | | | 36.4 | | | | 549.9 | |
| Consumer Insight | | | 12.7 | | | | 63.1 | | | | 49.8 | | | | – | | | | 16.3 | | | | 101.3 | |
| Public Relations & Public Affairs | | | 3.9 | | | | 15.4 | | | | 15.8 | | | | – | | | | 3.2 | | | | 42.6 | |
| Branding & Identity, Healthcare and Specialist Communications | | | 17.7 | | | | 62.0 | | | | 51.7 | | | | – | | | | 10.2 | | | | 107.5 | |
| | | | 78.8 | | | | 253.2 | | | | 211.5 | | | | – | | | | 66.1 | | | | 801.3 | |
| 2010 | | | | | | | | | | | | | | | | | | | | | | | | |
| Advertising and Media Investment Management | | | 36.8 | | | | 95.6 | | | | 94.2 | | | | 0.3 | | | | 26.2 | | | | 487.3 | |
| Consumer Insight | | | 13.7 | | | | 58.9 | | | | 49.8 | | | | – | | | | 15.1 | | | | 122.6 | |
| Public Relations & Public Affairs | | | 3.3 | | | | 12.9 | | | | 14.1 | | | | 2.0 | | | | 4.1 | | | | 58.7 | |
| Branding & Identity, Healthcare and Specialist Communications | | | 16.6 | | | | 50.1 | | | | 52.2 | | | | 7.7 | | | | 9.8 | | | | 123.5 | |
| | | | 70.4 | | | | 217.5 | | | | 210.3 | | | | 10.0 | | | | 55.2 | | | | 792.1 | |
Notes
| 1 | | Capital additions include purchases of property, plant and equipment and other intangible assets (including capitalised computer software). |
| 2 | | Depreciation of property, plant and equipment and amortisation of other intangible assets. |
F-13
Notes to the consolidated financial statements (continued)
2. Segment information (continued)
| | | | | | | | | | | | | | | | | | | | | | | | | | |
| | | Assets | | | | | Liabilities | |
| Balance sheet | | Segment
assets | | | Unallocated
corporate
assets1 | | | Consolidated
total assets | | | | | Segment
liabilities | | | Unallocated
corporate
liabilities1 | | | Consolidated
total
liabilities | |
| | | £m | | | £m | | | £m | | | | | £m | | | £m | | | £m | |
| 2012 | | | | | | | | | | | | | | | | | | | | | | | | | | |
| Advertising and Media Investment Management | | | 12,013.9 | | | | | | | | | | | | | | (9,152.7 | ) | | | | | | | | |
| Consumer Insight | | | 3,371.4 | | | | | | | | | | | | | | (1,004.0 | ) | | | | | | | | |
| Public Relations & Public Affairs | | | 1,724.2 | | | | | | | | | | | | | | (370.8 | ) | | | | | | | | |
| Branding & Identity, Healthcare and Specialist Communications | | | 5,607.4 | | | | | | | | | | | | | | (1,364.5 | ) | | | | | | | | |
| | | | 22,716.9 | | | | 2,160.7 | | | | 24,877.6 | | | | | | (11,892.0 | ) | | | (5,925.0 | ) | | | (17,817.0 | ) |
| 2011 | | | | | | | | | | | | | | | | | | | | | | | | | | |
| Advertising and Media Investment Management | | | 12,075.9 | | | | | | | | | | | | | | (9,331.8 | ) | | | | | | | | |
| Consumer Insight | | | 3,525.3 | | | | | | | | | | | | | | (1,058.2 | ) | | | | | | | | |
| Public Relations & Public Affairs | | | 1,825.0 | | | | | | | | | | | | | | (411.4 | ) | | | | | | | | |
| Branding & Identity, Healthcare and Specialist Communications | | | 5,147.6 | | | | | | | | | | | | | | (1,353.5 | ) | | | | | | | | |
| | | | 22,573.8 | | | | 2,121.1 | | | | 24,694.9 | | | | | | (12,154.9 | ) | | | (5,645.7 | ) | | | (17,800.6 | ) |
| 2010 | | | | | | | | | | | | | | | | | | | | | | | | | | |
| Advertising and Media Investment Management | | | 11,795.7 | | | | | | | | | | | | | | (9,553.6 | ) | | | | | | | | |
| Consumer Insight | | | 3,691.2 | | | | | | | | | | | | | | (1,143.9 | ) | | | | | | | | |
| Public Relations & Public Affairs | | | 1,699.6 | | | | | | | | | | | | | | (388.4 | ) | | | | | | | | |
| Branding & Identity, Healthcare and Specialist Communications | | | 5,031.4 | | | | | | | | | | | | | | (1,409.4 | ) | | | | | | | | |
| | | | 22,217.9 | | | | 2,127.2 | | | | 24,345.1 | | | | | | (12,495.3 | ) | | | (5,201.9 | ) | | | (17,697.2 | ) |
Note
| 1 | | Included in unallocated corporate assets and liabilities are corporate income tax, deferred tax and net interest-bearing debt. |
F-14
Notes to the consolidated financial statements (continued)
2. Segment information (continued)
Contributions by geographical area were as follows:
| | | | | | | | | | | | |
| | | | | 2012 £m | | | | 2011 £m | | | | 2010
£m |
| Revenue1 | | | | | | | | | | | | |
| North America4 | | | | 3,546.5 | | | | 3,388.2 | | | | 3,299.8 |
| UK | | | | 1,275.2 | | | | 1,183.5 | | | | 1,087.6 |
| Western Continental Europe5 | | | | 2,439.2 | | | | 2,505.1 | | | | 2,325.3 |
Asia Pacific, Latin America, Africa & Middle East and Central & Eastern Europe | | | | 3,112.2 | | | | 2,945.0 | | | | 2,618.3 |
| | | | | 10,373.1 | | | | 10,021.8 | | | | 9,331.0 |
| | | | | | |
| | | Margin | | | | Margin | | | | Margin | | |
| Headline PBIT2 | | | | | | | | | | | | |
| North America4 | | 16.3% | | 578.6 | | 15.5% | | 525.6 | | 14.7% | | 484.6 |
| UK | | 13.6% | | 173.3 | | 14.0% | | 165.3 | | 13.6% | | 147.9 |
| Western Continental Europe5 | | 10.4% | | 252.9 | | 11.3% | | 284.0 | | 9.5% | | 221.6 |
Asia Pacific, Latin America, Africa & Middle East and Central & Eastern Europe | | 16.9% | | 526.2 | | 15.4% | | 454.1 | | 14.3% | | 374.6 |
| | | 14.8% | | 1,531.0 | | 14.3% | | 1,429.0 | | 13.2% | | 1,228.7 |
| Non-current assets3 | | | | | | | | | | | | |
| North America4 | | | | 5,131.9 | | | | 4,960.4 | | | | |
| UK | | | | 1,766.7 | | | | 1,728.1 | | | | |
| Western Continental Europe5 | | | | 3,590.3 | | | | 3,681.8 | | | | |
Asia Pacific, Latin America, Africa &
Middle East and Central & Eastern
Europe | | | | 2,731.1 | | | | 2,765.0 | | | | |
| | | | | 13,220.0 | | | | 13,135.3 | | | | |
Notes
| 1 | | Intersegment sales have not been separately disclosed as they are not material. |
| 2 | | See note 31 for a reconciliation of headline PBIT to PBIT. |
| 3 | | Non-current assets excluding financial instruments and deferred tax. |
| 4 | | North America includes the US with revenue of £3,309.4 million (2011: £3,149.9 million, 2010: £3,097.9 million), headline PBIT of £547.8 million (2011: £490.2 million, 2010: £448.7 million) and non-current assets of £4,534.4 million (2011: £4,396.5 million). |
| 5 | | Western Continental Europe includes Ireland with revenue of £36.6 million (2011: £40.3 million, 2010: £37.4 million), headline PBIT of £0.7 million (2011: £1.1 million, 2010: £2.0 million) and non-current assets of £50.4 million (2011: £52.4 million). |
3. Operating costs
| | | | | | |
| | | 2012
£m | | 2011
£m | | 2010
£m |
| Staff costs (note 5) | | 6,106.1 | | 5,872.5 | | 5,438.7 |
| Establishment costs | | 690.6 | | 674.1 | | 659.2 |
| Other operating costs (net) | | 1,477.0 | | 1,499.7 | | 1,489.6 |
| Total operating costs | | 8,273.7 | | 8,046.3 | | 7,587.5 |
| Operating costs include: | | | | | | |
| Goodwill impairment (note 12) | | 32.0 | | – | | 10.0 |
| Investment write-downs | | 19.6 | | 32.8 | | 37.5 |
| Gain on sale of freehold property in New York | | (71.4) | | – | | – |
| Cost of changes to corporate structure | | 4.1 | | – | | – |
| Restructuring costs | | 93.4 | | – | | – |
Amortisation and impairment of acquired intangible assets
(note 12) | | 171.9 | | 172.0 | | 170.5 |
| Amortisation of other intangible assets (note 12) | | 33.7 | | 25.7 | | 25.4 |
| Depreciation of property, plant and equipment | | 184.2 | | 178.7 | | 178.3 |
| Losses/(gains) on sale of property, plant and equipment | | 0.7 | | (0.9) | | 0.7 |
| Gains on disposal of investments | | (26.8) | | (0.4) | | (4.1) |
Gains on remeasurement of equity interest on acquisition
of controlling interest | | (5.3) | | (31.6) | | (13.7) |
| Net foreign exchange losses | | 7.7 | | 1.1 | | 8.0 |
| Operating lease rentals: | | | | | | |
| Land and buildings | | 464.6 | | 459.6 | | 449.9 |
| Sublease income | | (23.0) | | (29.1) | | (32.8) |
| | | 441.6 | | 430.5 | | 417.1 |
| Plant and machinery | | 21.9 | | 23.0 | | 24.8 |
| | | 463.5 | | 453.5 | | 441.9 |
3. Operating costs (continued)
In 2012, operating profit includes credits totalling £19.8 million (2011: £14.0 million, 2010: £16.5 million) relating to the release of excess provisions and other balances established in respect of acquisitions completed prior to 2011. Further details of the Group’s approach to acquisition reserves, as required by IFRS 3 Business Combinations, are given in note 28.
Investment write-downs of £19.6 million (2011: £32.8 million) relate to certain non-core minority investments in the US and Continental Europe where forecast financial performance and/or liquidity issues indicate a permanent decline in the recoverability of the Group’s investment.
Restructuring costs of £93.4 million include £62.9 million of severance costs arising from a structural reassessment of certain of the Group’s operations, primarily in Western Continental Europe; and £30.5 million of other costs, primarily accelerated depreciation of IT assets in the US and Europe, arising from an overhaul of its centralised IT infrastructure.
All of the operating costs of the Group are related to administrative expenses.
Auditors’ remuneration:
| | | | | | | | | | | | |
| | | 2012
£m | | | 2011
£m | | | 2010
£m | |
| Fees payable to the Company’s auditors for the audit of the Company’s annual accounts | | | 1.4 | | | | 1.4 | | | | 1.4 | |
| The audit of the Company’s subsidiaries pursuant to legislation | | | 14.6 | | | | 15.3 | | | | 14.8 | |
| | | | 16.0 | | | | 16.7 | | | | 16.2 | |
| Other services pursuant to legislation | | | 3.1 | | | | 3.1 | | | | 3.1 | |
| Fees payable to the auditors pursuant to legislation | | | 19.1 | | | | 19.8 | | | | 19.3 | |
| Tax advisory services | | | 2.5 | | | | 2.3 | | | | 2.7 | |
| Tax compliance services | | | 1.0 | | | | 1.1 | | | | 1.2 | |
| | | | 3.5 | | | | 3.4 | | | | 3.9 | |
| Corporate finance services | | | 0.5 | | | | 0.5 | | | | 0.2 | |
| Other services1 | | | 3.9 | | | | 4.7 | | | | 5.1 | |
| Total non-audit fees | | | 7.9 | | | | 8.6 | | | | 9.2 | |
| Total fees | | | 27.0 | | | | 28.4 | | | | 28.5 | |
Note
| 1 | | Other services include audits for earnout purposes and services for expatriate employees. |
Minimum committed annual rentals
Amounts payable in 2013 under leases will be as follows:
| | | | | | | | | | | | | | | | | | | | | | | | |
| | | Plant and machinery
| | | Land and buildings
| |
| | | 2013
£m | | | 2012
£m | | | 2011
£m | | | 2013
£m | | | 2012
£m | | | 2011
£m | |
| In respect of operating leases which expire: | | | | | | | | | | | | | | | | | | | | | | | | |
| – within one year | | | 4.1 | | | | 5.5 | | | | 4.8 | | | | 34.8 | | | | 27.4 | | | | 32.7 | |
| – within two to five years | | | 13.0 | | | | 13.2 | | | | 14.8 | | | | 166.1 | | | | 190.7 | | | | 163.4 | |
| – after five years | | | 0.2 | | | | 0.5 | | | | 0.2 | | | | 145.4 | | | | 143.6 | | | | 159.7 | |
| | | | 17.3 | | | | 19.2 | | | | 19.8 | | | | 346.3 | | | | 361.7 | | | | 355.8 | |
Future minimum annual amounts payable under all lease commitments in existence at 31 December 2012 are as follows:
| | | | | | | | | | | | |
| | | Minimum
rental
payments
£m | | | Less
sub-
let
rentals
£m | | | Net
payment £m | |
| Year ending 31 December | | | | | | | | | | | | |
| 2013 | | | 363.6 | | | | (7.0 | ) | | | 356.6 | |
| 2014 | | | 310.9 | | | | (4.3 | ) | | | 306.6 | |
| 2015 | | | 277.9 | | | | (3.3 | ) | | | 274.6 | |
| 2016 | | | 227.4 | | | | (1.7 | ) | | | 225.7 | |
| 2017 | | | 179.8 | | | | (0.7 | ) | | | 179.1 | |
| Later years | | | 829.0 | | | | (0.4 | ) | | | 828.6 | |
| | | | 2,188.6 | | | | (17.4 | ) | | | 2,171.2 | |
F-15
Notes to the consolidated financial statements (continued)
4. Share of results of associates
Share of results of associates include:
| | | | | | | | | | | | |
| | | 2012
£m | | | 2011
£m | | | 2010
£m | |
| Share of profit before interest and taxation | | | 105.1 | | | | 99.9 | | | | 86.0 | |
| Share of exceptional (losses)/gains | | | (3.0 | ) | | | 2.1 | | | | (0.3 | ) |
| Share of interest and non-controlling interests | | | (1.6 | ) | | | (2.5 | ) | | | (2.7 | ) |
| Share of taxation | | | (31.1 | ) | | | (33.4 | ) | | | (27.8 | ) |
| | | | 69.4 | | | | 66.1 | | | | 55.2 | |
5. Our people
Our staff numbers averaged 114,490 for the year ended 31 December 2012 against 109,971 in 2011 and 101,387 in 2010, including acquisitions. Their geographical distribution was as follows:
| | | | | | | | | | | | |
| | | 2012 | | | 2011 | | | 2010 | |
| North America | | | 27,782 | | | | 27,540 | | | | 25,546 | |
| UK | | | 11,413 | | | | 10,761 | | | | 9,620 | |
| Western Continental Europe | | | 23,322 | | | | 22,298 | | | | 21,154 | |
| Asia Pacific, Latin America, Africa & Middle East and Central & Eastern Europe | | | 51,973 | | | | 49,372 | | | | 45,067 | |
| | | | 114,490 | | | | 109,971 | | | | 101,387 | |
Their operating sector distribution was as follows:
| | | | | | | | | | | | |
| | | 2012 | | | 2011 | | | 2010 | |
| Advertising and Media Investment Management | | | 48,662 | | | | 47,252 | | | | 42,424 | |
| Consumer Insight | | | 28,989 | | | | 29,204 | | | | 28,167 | |
| Public Relations & Public Affairs | | | 8,437 | | | | 7,869 | | | | 7,364 | |
| Branding & Identity, Healthcare and Specialist Communications | | | 28,402 | | | | 25,646 | | | | 23,432 | |
| | | | 114,490 | | | | 109,971 | | | | 101,387 | |
At the end of 2012 staff numbers were 115,711 (2011: 113,615, 2010: 104,052). Including all employees of associated undertakings, this figure was approximately 165,000 at 31 December 2012 (2011: 158,000, 2010: 146,000).
Staff costs include:
| | | | | | | | | | | | |
| | | 2012
£m | | | 2011
£m | | | 2010
£m | |
| Wages and salaries | | | 4,289.7 | | | | 4,079.4 | | | | 3,696.8 | |
| Cash-based incentive plans | | | 198.1 | | | | 259.4 | | | | 271.9 | |
| Share-based incentive plans (note 22) | | | 92.8 | | | | 78.8 | | | | 70.4 | |
| Social security costs | | | 524.7 | | | | 499.3 | | | | 450.1 | |
| Pension costs (note 23) | | | 148.7 | | | | 135.4 | | | | 120.6 | |
| Severance | | | 50.8 | | | | 53.9 | | | | 74.3 | |
| Other staff costs1 | | | 801.3 | | | | 766.3 | | | | 754.6 | |
| | | | 6,106.1 | | | | 5,872.5 | | | | 5,438.7 | |
| Staff cost to revenue ratio | | | 58.9 | % | | | 58.6 | % | | | 58.3 | % |
Note
| 1 | | Freelance and temporary staff costs are included in other staff costs. |
Included above are charges of £7.9 million (2011: £7.3 million, 2010: £7.7 million) for share-based incentive plans in respect of key management personnel (who comprise the directors of the Group). Total compensation received by key management personnel in respect of 2012 was £27.9 million (2011: £17.7 million, 2010: £17.6 million) of which £0.8 million (2011: £0.8 million, 2010: £0.7 million) were pension contributions. The value of the matching LEAP awards, which vest in the year following the end of the five-year performance period, is included in total compensation in the year the relevant five-year performance period ends.
6. Finance income, finance costs and revaluation of financial instruments
Finance income includes:
| | | | | | | | | | | | |
| | | 2012
£m | | | 2011
£m | | | 2010
£m | |
| Expected return on pension plan assets (note 23) | | | 30.0 | | | | 32.6 | | | | 30.6 | |
| Income from available for sale investments | | | 1.2 | | | | 0.6 | | | | 9.3 | |
| Interest income | | | 54.7 | | | | 64.1 | | | | 41.8 | |
| | | | 85.9 | | | | 97.3 | | | | 81.7 | |
Finance costs include:
| | | | | | | | | | | | |
| | | 2012
£m | | | 2011
£m | | | 2010
£m | |
| Interest on pension plan liabilities (note 23) | | | 41.3 | | | | 43.8 | | | | 45.9 | |
| Interest on other long-term employee benefits | | | 1.7 | | | | 1.8 | | | | 1.9 | |
| Interest payable and similar charges1 | | | 256.8 | | | | 251.6 | | | | 229.0 | |
| | | | 299.8 | | | | 297.2 | | | | 276.8 | |
Revaluation of financial instruments2include:
| | | | | | | | | | | | |
| | | 2012
£m | | | 2011
£m | | | 2010
£m | |
| Movements in fair value of treasury instruments | | | (14.8 | ) | | | (12.7 | ) | | | 21.8 | |
| Revaluation of put options over non-controlling interests | | | (5.1 | ) | | | (30.9 | ) | | | (3.6 | ) |
| Revaluation of payments due to vendors (earnout agreements) | | | 15.2 | | | | (6.4 | ) | | | – | |
| | | | (4.7 | ) | | | (50.0 | ) | | | 18.2 | |
Notes
| 1 | | Interest payable and similar charges are payable on bank overdrafts, bonds and bank loans held at amortised cost. |
| 2 | | Financial instruments are held at fair value through profit and loss. |
The majority of the Group’s long-term debt is represented by $2,581 million of US dollar bonds at an average interest rate of 5.49%,€1,850 million of Eurobonds at an average interest rate of 5.52% and £1,050 million of sterling bonds including convertible bonds at an average interest rate of 5.96%.
Average borrowings under the Revolving Credit Facilities (note 10) amounted to the equivalent of $186 million at an average interest rate of 1.72% inclusive of margin.
Average borrowings under the US Commercial Paper Program (note 10) amounted to $239 million at an average interest rate of 0.50% inclusive of margin.
7. Taxation
In 2012, the tax rate on profit before taxation was 18.1% (2011: 9.1%).
In 2011, the tax rate was lower, primarily due to the resolution of historic tax liabilities. The release of prior year corporate tax provisions resulted from the resolution of a number of open matters.
Cash taxes paid in the year were £257.0 million (2011: £247.9 million).
F-16
Notes to the consolidated financial statements (continued)
7. Taxation (continued)
The tax charge is based on the profit for the year and comprises:
| | | | | | | | | | | | |
| | | 2012
£m | | | 2011
£m | | | 2010
£m | |
| Corporation tax | | | | | | | | | | | | |
| Current year | | | 335.5 | | | | 310.3 | | | | 276.2 | |
| Prior years | | | (41.7 | ) | | | (47.7 | ) | | | (1.0 | ) |
| Release of prior year provisions | | | – | | | | (106.1 | ) | | | – | |
| Tax credit relating to restructuring costs | | | (15.7 | ) | | | – | | | | – | |
| | | | 278.1 | | | | 156.5 | | | | 275.2 | |
| Deferred tax | | | | | | | | | | | | |
| Current year | | | (14.4 | ) | | | 4.5 | | | | (21.4 | ) |
| Net credit in relation to the amortisation of acquired intangible assets and other goodwill items | | | (86.0 | ) | | | (72.4 | ) | | | (37.5 | ) |
| Deferred tax on gain on sale of freehold property in New York | | | 20.0 | | | | – | | | | – | |
| | | | (80.4 | ) | | | (67.9 | ) | | | (58.9 | ) |
| Prior years | | | (0.5 | ) | | | 3.3 | | | | (26.0 | ) |
| | | | (80.9 | ) | | | (64.6 | ) | | | (84.9 | ) |
| Tax charge | | | 197.2 | | | | 91.9 | | | | 190.3 | |
The tax charge for the year can be reconciled to profit before taxation in the consolidated income statement as follows:
| | | | | | | | | | | | |
| | | 2012
£m | | | 2011
£m | | | 2010
£m | |
| Profit before taxation | | | 1,091.9 | | | | 1,008.4 | | | | 851.3 | |
| Tax at the corporation tax rate of 25%1 | | | 273.0 | | | | 252.1 | | | | 212.8 | |
| Tax effect of share of results of associates | | | (17.4 | ) | | | (16.5 | ) | | | (13.8 | ) |
| Tax effect of items that are not deductible/ (taxable) | | | (7.5 | ) | | | 13.0 | | | | (7.8 | ) |
| Effect of different tax rates of subsidiaries operating in other jurisdictions | | | 13.9 | | | | 9.2 | | | | 15.4 | |
| Origination and reversal of temporary differences not previously recognised | | | (39.2 | ) | | | 20.2 | | | | 12.0 | |
| Tax losses not utilised in the year | | | 45.4 | | | | 49.3 | | | | 46.2 | |
| Tax effect of utilisation of tax losses not previously recognised | | | (18.6 | ) | | | (41.4 | ) | | | (47.5 | ) |
| Tax effect of recognition of tax losses not previously recognised | | | (10.2 | ) | | | (43.5 | ) | | | – | |
| Release of prior year provisions in relation to acquired businesses | | | (20.6 | ) | | | (21.4 | ) | | | (19.7 | ) |
| Other prior year adjustments | | | (21.6 | ) | | | (23.0 | ) | | | (7.3 | ) |
| Release of prior year provisions | | | – | | | | (106.1 | ) | | | – | |
| Tax charge | | | 197.2 | | | | 91.9 | | | | 190.3 | |
| Effective tax rate on profit before tax | | | 18.1 | % | | | 9.1 | % | | | 22.4 | % |
Note
| 1 | | Irish non-trading corporation tax rate. |
8. Ordinary dividends
Amounts recognised as distributions to equity holders in the year:
| | | | | | | | | | | | | | | | | | | | | | | | |
| | | 2012 | | | 2011 | | | 2010 | | | 2012 | | | 2011 | | | 2010 | |
| Per share | | Pence per share | | | £m | | | £m | | | £m | |
| 2011 Second interim dividend | | | 17.14 | p | | | 11.82 | p | | | 10.28 | p | | | 212.8 | | | | 147.3 | | | | 126.6 | |
| 2012 First interim dividend | | | 8.80 | p | | | 7.46 | p | | | 5.97 | p | | | 109.4 | | | | 92.2 | | | | 73.8 | |
| | | | 25.94 | p | | | 19.28 | p | | | 16.25 | p | | | 322.2 | | | | 239.5 | | | | 200.4 | |
8. Ordinary dividends (continued)
The Company operated a scrip dividend scheme in 2012 which enabled share owners to receive new fully paid ordinary shares in the Company instead of cash dividends. Included in the £322.2 million dividends recognised in 2012 are cash dividends of £306.6 million and scrip dividends of £15.6 million.
Proposed final dividend for the year ended 31 December 2012:
| | | | | | | | | | | | |
| | | 2012 | | | 2011 | | | 2010 | |
| Per share | | Pence per share | |
| 2012 Final dividend1 | | | 19.71 | p | | | 17.14 | p | | | 11.82 | p |
Note
| 1 | | Second interim dividend in 2011 and 2010. |
The payment of dividends will not have any tax consequences for the Group.
9. Earnings per share
Basic EPS
The calculation of basic EPS is as follows:
| | | | | | | | | | | | |
| | | 2012 | | | 2011 | | | 2010 | |
| Earnings1(£m) | | | 822.7 | | | | 840.1 | | | | 586.0 | |
| Average shares used in basic EPS calculation (m) | | | 1,243.4 | | | | 1,242.7 | | | | 1,233.1 | |
| EPS | | | 66.2 | p | | | 67.6 | p | | | 47.5 | p |
Note
| 1 | | Earnings is equivalent to profit for the year attributable to equity holders of the parent. |
Diluted EPS
The calculation of diluted EPS is as follows:
| | | | | | | | | | | | |
| | | 2012 | | | 2011 | | | 2010 | |
| Diluted earnings (£m) | | | 848.8 | | | | 866.2 | | | | 614.3 | |
| Average shares used in diluted EPS calculation (m) | | | 1,352.6 | | | | 1,342.2 | | | | 1,339.0 | |
| Diluted EPS | | | 62.8 | p | | | 64.5 | p | | | 45.9 | p |
Diluted EPS has been calculated based on the diluted earnings amounts above. On 19 May 2009 the Group issued £450 million 5.75% convertible bonds due May 2014. For the year ended 31 December 2012 these convertible bonds were dilutive and earnings were consequently increased by £26.1 million (2011: £26.1 million, 2010: £28.3 million) for the purpose of the calculation of diluted earnings. In addition, at 31 December 2012, options to purchase 6.3 million ordinary shares (2011: 4.0 million, 2010: 11.6 million) were outstanding, but were excluded from the computation of diluted earnings per share because the exercise prices of these options were greater than the average market price of the Group’s shares and, therefore, their inclusion would have been accretive.
A reconciliation between the shares used in calculating basic and diluted EPS is as follows:
| | | | | | | | | | | | |
| | | 2012
m | | | 2011
m | | | 2010
m | |
| Average shares used in basic EPS calculation | | | 1,243.4 | | | | 1,242.7 | | | | 1,233.1 | |
| Dilutive share options outstanding | | | 4.9 | | | | 4.5 | | | | 6.7 | |
| Other potentially issuable shares | | | 27.8 | | | | 18.5 | | | | 22.7 | |
| £450 million 5.75% convertible bonds | | | 76.5 | | | | 76.5 | | | | 76.5 | |
| Shares used in diluted EPS calculation | | | 1,352.6 | | | | 1,342.2 | | | | 1,339.0 | |
At 31 December 2012 there were 1,265,407,107 ordinary shares in issue.
F-17
Notes to the consolidated financial statements (continued)
10. Sources of finance
The following table summarises the equity and debt financing of the Group, and changes during the year:
| | | | | | | | | | | | | | | | | | |
| | | | | | Shares | | | | | | | | Debt | |
| | | 2012
£m | | | 2011
£m | | | | | 2012
£m | | | 2011
£m | |
| Analysis of changes in financing | | | | | | | | | | | | | | | | | | |
| Beginning of year | | | 232.3 | | | | 180.9 | | | | | | 3,893.0 | | | | 3,598.2 | |
| Ordinary shares issued | | | 56.0 | | | | 31.0 | | | | | | – | | | | – | |
| Share cancellations | | | (0.7 | ) | | | (0.7 | ) | | | | | – | | | | – | |
| Treasury share cancellations | | | (0.6 | ) | | | – | | | | | | – | | | | – | |
| Share issue costs paid | | | (0.2 | ) | | | – | | | | | | – | | | | – | |
| Scrip dividend | | | 15.6 | | | | 21.1 | | | | | | – | | | | – | |
| Net increase in drawings on bank loans, corporate bonds and convertible bonds | | | – | | | | – | | | | | | 380.5 | | | | 301.4 | |
| Net amortisation of financing costs included in debt | | | – | | | | – | | | | | | 6.8 | | | | 7.6 | |
| Debt acquired | | | – | | | | – | | | | | | 20.0 | | | | 17.5 | |
| Other movements | | | – | | | | – | | | | | | (18.2 | ) | | | (2.7 | ) |
| Exchange adjustments | | | – | | | | – | | | | | | (101.6 | ) | | | (29.0 | ) |
| End of year | | | 302.4 | | | | 232.3 | | | | | | 4,180.5 | | | | 3,893.0 | |
Note
The above table excludes bank overdrafts which fall within cash and cash equivalents for the purposes of the consolidated cash flow statement.
Shares
At 31 December 2012, the Company’s share base was entirely composed of ordinary equity share capital and share premium of £302.4 million (2011: £232.3 million), further details of which are disclosed in note 26.
Debt
US$ bonds The Group has in issue $369 million of 5.875% bonds due June 2014, $600 million of 8% bonds due September 2014 and $812 million of 4.75% bonds due November 2021. In September 2012, the Group issued $500 million of 3.625% bonds due September 2022 and $300 million of 5.125% bonds due September 2042.
Eurobonds The Group has in issue€600 million of 4.375% bonds due December 2013,€500 million of 5.25% bonds due January 2015 and€750 million of 6.625% bonds due May 2016.
Sterling bonds The Group has in issue £400 million of 6% bonds due April 2017 and £200 million of 6.375% bonds due November 2020.
Revolving Credit Facilities The Group has a five-year Revolving Credit Facility of $1.05 billion and £375 million due November 2016. The Group’s borrowing under these facilities, which are drawn down predominantly in US dollars and pounds sterling, averaged the equivalent of $186 million in 2012. The Group had available undrawn committed credit facilities of £1,021.5 million at December 2012 (2011: £972.3 million).
Borrowings under the Revolving Credit Facilities are governed by certain financial covenants based on the results and financial position of the Group.
US Commercial Paper Program
The Group operates a commercial paper program using the Revolving Credit Facility as a backstop. The average commercial paper outstanding during the year was $239.3 million. There was no US Commercial Paper outstanding at 31 December 2012.
Convertible bonds
The Group has in issue £450 million of 5.75% convertible bonds due May 2014. At the option of the holder, the bonds are convertible into 76,530,612 WPP ordinary shares at an initial share price of £5.88 per share.
The convertible bonds have a nominal value of £450 million at 31 December 2012. In accordance with IAS 39, these bonds have been split between a liability component and an equity component by initially valuing the liability component at fair value based on the present value of future cash flows and then holding it at amortised cost. This fair value has been calculated assuming redemption in May 2014 and using a discount rate of 8.25%, based on the estimated rate of interest that would have applied to a comparable bond issued at that time without the convertible option. The equity component represents the fair value, on initial recognition, of the embedded option to convert the liability into equity of the Group.
10. Sources of finance (continued)
The liability element is £435.0 million and the equity component is £44.5 million as at 31 December 2012.
The Group estimates that the fair value of the liability component of the convertible bonds at 31 December 2012 was approximately £453.8 million. This fair value has been calculated by discounting the future cash flows at the market rate.
The following table is an analysis of future anticipated cash flows in relation to the Group’s debt, on an undiscounted basis which, therefore, differs from the fair value and carrying value:
| | | | | | | | |
| | | 2012
£m | | | 2011
£m | |
| Within one year | | | (721.4 | ) | | | (240.8 | ) |
| Between one and two years | | | (1,244.8 | ) | | | (722.2 | ) |
| Between two and three years | | | (529.6 | ) | | | (1,259.3 | ) |
| Between three and four years | | | (707.4 | ) | | | (524.7 | ) |
| Between four and five years | | | (465.1 | ) | | | (787.1 | ) |
| Over five years | | | (1,610.3 | ) | | | (1,304.1 | ) |
| Debt financing under the Revolving Credit Facility and in relation to unsecured loan notes | | | (5,278.6 | ) | | | (4,838.2 | ) |
| Short-term overdrafts – within one year | | | (586.0 | ) | | | (518.4 | ) |
| Future anticipated cash flows | | | (5,864.6 | ) | | | (5,356.6 | ) |
| Effect of discounting/financing rates | | | 1,098.1 | | | | 945.2 | |
| Debt financing | | | (4,766.5 | ) | | | (4,411.4 | ) |
Analysis of fixed and floating rate debt by currency including the effect of interest rate and cross-currency swaps:
| | | | | | | | | | | | | | | | | | |
2012 Currency | | £m | | | Fixed rate1 | | | Floating
basis | | | Period (months)1 | |
| $ | | – fixed | | | 1,913.0 | | | | 5.53% | | | | n/a | | | | 92 | |
| | | – floating | | | 444.0 | | | | n/a | | | | LIBOR | | | | n/a | |
| £ | | – fixed | | | 550.0 | | | | 6.07% | | | | n/a | | | | 58 | |
| | | – floating | | | 200.0 | | | | n/a | | | | LIBOR | | | | n/a | |
| € | | – fixed | | | 690.7 | | | | 6.50% | | | | n/a | | | | 38 | |
| | | – floating | | | 344.2 | | | | n/a | | | | EURIBOR | | | | n/a | |
| ¥ | | – fixed | | | 64.0 | | | | 2.07% | | | | n/a | | | | 11 | |
| Other | | | | | (25.4 | ) | | | n/a | | | | n/a | | | | n/a | |
| | | | | | 4,180.5 | | | | | | | | | | | | | |
Note
| 1 | | Weighted average. These rates do not include the effect of gains on interest rate swap terminations that are written to income over the life of the original instrument. At 31 December 2012 the amount still to be written to income was £0.7 million (2011: £1.2 million) in respect of US dollar swap terminations, to be written to income evenly until June 2014. |
| | | | | | | | | | | | | | | | | | |
2011 Currency | | £m | | | Fixed
rate1 | | | Floating
basis | | | Period
(months)1 | |
| $ | | – fixed | | | 1,494.1 | | | | 6.00% | | | | n/a | | | | 63 | |
| | | – floating | | | 477.9 | | | | n/a | | | | LIBOR | | | | n/a | |
| £ | | – fixed | | | 550.0 | | | | 6.07% | | | | n/a | | | | 70 | |
| | | – floating | | | 200.0 | | | | n/a | | | | LIBOR | | | | n/a | |
| € | | – fixed | | | 710.3 | | | | 6.50% | | | | n/a | | | | 50 | |
| | | – floating | | | 354.0 | | | | n/a | | | | EURIBOR | | | | n/a | |
| ¥ | | – fixed | | | 75.4 | | | | 2.07% | | | | n/a | | | | 24 | |
| $C2 | | – floating | | | 79.7 | | | | n/a | | | | LIBOR | | | | n/a | |
| Other | | | | | (48.4 | ) | | | n/a | | | | n/a | | | | n/a | |
| | | | | | 3,893.0 | | | | | | | | | | | | | |
Notes
| 1 | | Weighted average. These rates do not include the effect of gains on interest rate swap terminations that are written to income over the life of the original instrument. |
| 2 | | Represents Canadian dollars. |
F-18
Notes to the consolidated financial statements (continued)
10. Sources of finance (continued)
The following table is an analysis of future anticipated cash flows in relation to the Group’s financial derivatives, which include interest rate swaps, cash flow hedges and other foreign exchange swaps:
| | | | | | | | | | | | | | | | | | |
| | | Financial liabilities | | | | | Financial assets | |
| 2012 | | Payable
£m | | | Receivable
£m | | | | | Payable
£m | | | Receivable £m | |
| Within one year | | | 333.0 | | | | 262.7 | | | | | | 773.9 | | | | 865.8 | |
| Between one and two years | | | 339.9 | | | | 280.8 | | | | | | 753.5 | | | | 839.8 | |
| Between two and three years | | | 454.1 | | | | 352.5 | | | | | | 525.9 | | | | 608.7 | |
| Between three and four years | | | 1.1 | | | | 0.4 | | | | | | 2.4 | | | | 12.4 | |
| Between four and five years | | | 26.1 | | | | 25.4 | | | | | | 226.7 | | | | 237.4 | |
| Over five years | | | – | | | | – | | | | | | – | | | | – | |
| | | | 1,154.2 | | | | 921.8 | | | | | | 2,282.4 | | | | 2,564.1 | |
| | | | | | | | | | | | | | | | | | |
| | | Financial liabilities | | | | | Financial assets | |
| 2011 | | Payable
£m | | | Receivable
£m | | | | | Payable
£m | | | Receivable £m | |
| Within one year | | | 60.5 | | | | 52.3 | | | | | | 167.5 | | | | 214.3 | |
| Between one and two years | | | 328.1 | | | | 233.3 | | | | | | 771.7 | | | | 869.8 | |
| Between two and three years | | | 356.5 | | | | 284.9 | | | | | | 785.1 | | | | 867.6 | |
| Between three and four years | | | 478.5 | | | | 353.2 | | | | | | 537.4 | | | | 633.9 | |
| Between four and five years | | | 1.1 | | | | 0.6 | | | | | | 4.2 | | | | 37.4 | |
| Over five years | | | 26.1 | | | | 25.5 | | | | | | 227.3 | | | | 237.4 | |
| | | | 1,250.8 | | | | 949.8 | | | | | | 2,493.2 | | | | 2,860.4 | |
11. Analysis of cash flows
The following tables analyse the items included within the main cash flow headings on page F-10.
Net cash from operating activities:
| | | | | | | | | | | | |
| | | 2012 £m | | | 2011 £m | | | 2010 £m | |
| Profit for the year | | | 894.7 | | | | 916.5 | | | | 661.0 | |
| Taxation | | | 197.2 | | | | 91.9 | | | | 190.3 | |
| Revaluation of financial instruments | | | 4.7 | | | | 50.0 | | | | (18.2 | ) |
| Finance costs | | | 299.8 | | | | 297.2 | | | | 276.8 | |
| Finance income | | | (85.9 | ) | | | (97.3 | ) | | | (81.7 | ) |
| Share of results of associates | | | (69.4 | ) | | | (66.1 | ) | | | (55.2 | ) |
| Adjustments for: | | | | | | | | | | | | |
Non-cash share-based incentive plans (including share options) | | | 92.8 | | | | 78.8 | | | | 70.4 | |
| Depreciation of property, plant and equipment | | | 191.0 | | | | 185.8 | | | | 184.9 | |
| Impairment of goodwill | | | 32.0 | | | | – | | | | 10.0 | |
| Amortisation and impairment of acquired intangible assets | | | 171.9 | | | | 172.0 | | | | 170.5 | |
| Amortisation of other intangible assets | | | 33.7 | | | | 25.7 | | | | 25.4 | |
| Investment write-downs | | | 19.6 | | | | 32.8 | | | | 37.5 | |
| Gains on disposal of investments | | | (26.8 | ) | | | (0.4 | ) | | | (4.1 | ) |
| Gains on remeasurement of equity interest on acquisition of controlling interest | | | (5.3 | ) | | | (31.6 | ) | | | (13.7 | ) |
| Gain on sale of freehold property in New York | | | (71.4 | ) | | | – | | | | – | |
| Losses/(gains) on sale of property, plant and equipment | | | 0.7 | | | | (0.9 | ) | | | 0.7 | |
| (Increase)/decrease in inventories and work in progress | | | (17.6 | ) | | | 32.7 | | | | (46.3 | ) |
| Increase in receivables | | | (436.4 | ) | | | (1.8 | ) | | | (850.8 | ) |
| Increase/(decrease) in payables – short term | | | 105.3 | | | | (618.5 | ) | | | 1,135.7 | |
| Increase in payables – long term | | | 4.1 | | | | 19.2 | | | | 10.3 | |
| Decrease in provisions | | | (43.6 | ) | | | (52.5 | ) | | | (23.4 | ) |
| Corporation and overseas tax paid | | | (257.0 | ) | | | (247.9 | ) | | | (207.4 | ) |
| Interest and similar charges paid | | | (228.3 | ) | | | (241.4 | ) | | | (219.7 | ) |
| Interest received | | | 56.6 | | | | 63.2 | | | | 50.7 | |
| Investment income | | | 1.2 | | | | 0.6 | | | | 4.2 | |
| Dividends from associates | | | 44.7 | | | | 57.2 | | | | 53.3 | |
| Net cash inflow from operating activities | | | 908.3 | | | | 665.2 | | | | 1,361.2 | |
F-19
Notes to the consolidated financial statements (continued)
11. Analysis of cash flows (continued)
Acquisitions and disposals:
| | | | | | | | | | | | |
| | | 2012
£m | | | 2011
£m | | | 2010
£m | |
| Initial cash consideration | | | (462.0 | ) | | | (352.3 | ) | | | (138.6 | ) |
| Cash and cash equivalents acquired (net) | | | 46.6 | | | | 98.8 | | | | 57.0 | |
| Earnout payments | | | (85.7 | ) | | | (150.0 | ) | | | (113.3 | ) |
| Loan note redemptions | | | (1.0 | ) | | | (0.8 | ) | | | (5.1 | ) |
| Purchase of other investments (including associates) | | | (111.4 | ) | | | (68.1 | ) | | | (23.8 | ) |
| Proceeds on disposal of investments | | | 47.0 | | | | 2.6 | | | | 23.7 | |
| Acquisitions and disposals | | | (566.5 | ) | | | (469.8 | ) | | | (200.1 | ) |
| Cash consideration for non-controlling interests | | | (20.1 | ) | | | (62.6 | ) | | | (15.1 | ) |
| Net cash outflow | | | (586.6 | ) | | | (532.4 | ) | | | (215.2 | ) |
| | | |
| Share repurchases and buy-backs: | | | | | | | | | |
| | | 2012
£m | | | 2011
£m | | | 2010
£m | |
| Purchase of own shares by ESOP Trusts | | | (78.8 | ) | | | (106.5 | ) | | | (46.4 | ) |
| Share cancellations (excluding brokerage fees) | | | (55.1 | ) | | | (45.9 | ) | | | – | |
| Shares purchased into treasury | | | (0.6 | ) | | | (29.8 | ) | | | – | |
| Net cash outflow | | | (134.5 | ) | | | (182.2 | ) | | | (46.4 | ) |
| | | |
| Net increase in borrowings: | | | | | | | | | |
| | | 2012
£m | | | 2011
£m | | | 2010
£m | |
| Proceeds from issue of $500 million bonds | | | 312.1 | | | | 319.5 | | | | – | |
| Proceeds from issue of $300 million bonds | | | 187.3 | | | | – | | | | – | |
| Repayment of debt acquired | | | (20.0 | ) | | | (18.1 | ) | | | – | |
| (Decrease)/increase in drawings on bank loans | | | (79.7 | ) | | | – | | | | 19.8 | |
| Repayment of $30 million TNS private placements | | | (19.2 | ) | | | – | | | | – | |
| Net cash inflow | | | 380.5 | | | | 301.4 | | | | 19.8 | |
| | | |
| Cash and cash equivalents: | | | | | | | | | | | | |
| | | 2012
£m | | | 2011
£m | | | 2010
£m | |
| Cash at bank and in hand | | | 1,721.4 | | | | 1,833.5 | | | | 1,877.1 | |
| Short-term bank deposits | | | 223.9 | | | | 113.1 | | | | 88.1 | |
| Overdrafts1 | | | (586.0 | ) | | | (518.4 | ) | | | (255.4 | ) |
| Cash and cash equivalents at end of year | | | 1,359.3 | | | | 1,428.2 | | | | 1,709.8 | |
Note
| 1 | | Bank overdrafts are included in cash and cash equivalents because they form an integral part of the Group’s cash management. |
The Group considers that the carrying amount of cash and cash equivalents approximates their fair value.
12. Intangible assets
Goodwill
The movements in 2012 and 2011 were as follows:
| | | | |
| | | £m | |
| Cost: | | | | |
| 1 January 2011 | | | 9,678.8 | |
| Additions1 | | | 434.6 | |
| Revision of earnout estimates | | | 25.9 | |
| Exchange adjustments | | | (150.8 | ) |
| 31 December 2011 | | | 9,988.5 | |
| Additions1 | | | 360.8 | |
| Revision of earnout estimates | | | 8.6 | |
| Exchange adjustments | | | (315.8 | ) |
| 31 December 2012 | | | 10,042.1 | |
| |
| Accumulated impairment losses and write-downs: | | | | |
| 1 January 2011 | | | 572.5 | |
| Exchange adjustments | | | (14.8 | ) |
| 31 December 2011 | | | 557.7 | |
| Impairment losses for the year | | | 32.0 | |
| Exchange adjustments | | | (4.8 | ) |
| 31 December 2012 | | | 584.9 | |
| |
| Net book value: | | | | |
| 31 December 2012 | | | 9,457.2 | |
| 31 December 2011 | | | 9,430.8 | |
| 1 January 2011 | | | 9,106.3 | |
Note
| 1 | | Additions represent goodwill arising on the acquisition of subsidiary undertakings including the effect of any revisions to fair value adjustments that had been determined provisionally at the immediately preceding balance sheet date, as permitted by IFRS 3 Business Combinations. The effect of such revisions was not material in either year presented. Goodwill arising on the acquisition of associate undertakings is shown within interests in associates and joint ventures in note 14. |
Cash-generating units with significant goodwill as at 31 December 2012 and 2011 are:
| | | | | | | | |
| | | 2012
£m | | | 2011
£m | |
| GroupM | | | 1,964.4 | | | | 2,037.7 | |
| Kantar | | | 1,764.0 | | | | 1,791.2 | |
| Wunderman | | | 1,096.9 | | | | 1,119.9 | |
| Y&R Advertising | | | 984.5 | | | | 1,025.5 | |
| Burson-Marsteller | | | 480.4 | | | | 489.8 | |
| Other | | | 3,167.0 | | | | 2,966.7 | |
| Total goodwill | | | 9,457.2 | | | | 9,430.8 | |
Other goodwill represents goodwill on a large number of cash-generating units, none of which is individually significant in comparison to the total carrying value of goodwill.
F-20
Notes to the consolidated financial statements (continued)
12. Intangible assets (continued)
Other intangible assets
The movements in 2012 and 2011 were as follows:
| | | | | | | | | | | | | | | | |
| | | Brands
with an
indefinite
useful life
£m | | | Acquired
intangibles £m | | | Other
£m | | | Total £m | |
Cost: | | | | | | | | | | | | | | | | |
1 January 2011 | | | 1,053.7 | | | | 1,332.5 | | | | 229.9 | | | | 2,616.1 | |
Additions | | | – | | | | – | | | | 37.1 | | | | 37.1 | |
Disposals | | | – | | | | – | | | | (11.7 | ) | | | (11.7 | ) |
New acquisitions | | | – | | | | 117.6 | | | �� | 2.0 | | | | 119.6 | |
Other movements1 | | | – | | | | 21.2 | | | | 1.5 | | | | 22.7 | |
Exchange adjustments | | | (17.3 | ) | | | (7.7 | ) | | | (5.0 | ) | | | (30.0 | ) |
31 December 2011 | | | 1,036.4 | | | | 1,463.6 | | | | 253.8 | | | | 2,753.8 | |
Additions | | | – | | | | – | | | | 39.8 | | | | 39.8 | |
Disposals | | | – | | | | – | | | | (19.0 | ) | | | (19.0 | ) |
New acquisitions | | | – | | | | 185.2 | | | | 1.3 | | | | 186.5 | |
Other movements1 | | | – | | | | 12.9 | | | | 0.3 | | | | 13.2 | |
Exchange adjustments | | | (43.3 | ) | | | (34.1 | ) | | | (11.9 | ) | | | (89.3 | ) |
31 December 2012 | | | 993.1 | | | | 1,627.6 | | | | 264.3 | | | | 2,885.0 | |
Amortisation and impairment: | | | | | | | | | | | | | | | | |
1 January 2011 | | | – | | | | 550.8 | | | | 160.8 | | | | 711.6 | |
Charge for the year | | | – | | | | 172.0 | | | | 25.7 | | | | 197.7 | |
Disposals | | | – | | | | – | | | | (11.3 | ) | | | (11.3 | ) |
Other movements | | | – | | | | (2.6 | ) | | | (1.0 | ) | | | (3.6 | ) |
Exchange adjustments | | | – | | | | 2.0 | | | | (2.5 | ) | | | (0.5 | ) |
31 December 2011 | | | – | | | | 722.2 | | | | 171.7 | | | | 893.9 | |
Charge for the year | | | – | | | | 171.9 | | | | 33.7 | | | | 205.6 | |
Disposals | | | – | | | | – | | | | (18.4 | ) | | | (18.4 | ) |
Other movements | | | – | | | | (2.3 | ) | | | (2.8 | ) | | | (5.1 | ) |
Exchange adjustments | | | – | | | | (10.2 | ) | | | (8.2 | ) | | | (18.4 | ) |
31 December 2012 | | | – | | | | 881.6 | | | | 176.0 | | | | 1,057.6 | |
Net book value: | | | | | | | | | | | | | | | | |
31 December 2012 | | | 993.1 | | | | 746.0 | | | | 88.3 | | | | 1,827.4 | |
31 December 2011 | | | 1,036.4 | | | | 741.4 | | | | 82.1 | | | | 1,859.9 | |
1 January 2011 | | | 1,053.7 | | | | 781.7 | | | | 69.1 | | | | 1,904.5 | |
Note
| 1 | | Other movements in acquired intangibles include revisions to fair value adjustments arising on the acquisition of subsidiary undertakings that had been determined provisionally at the immediately preceding balance sheet date, as permitted by IFRS 3 Business Combinations. |
Brands with an indefinite life are carried at historical cost in accordance with the Group’s accounting policy for intangible assets. The carrying values of the separately identifiable brands are not individually significant in comparison with the total carrying value of brands with an indefinite useful life.
12. Intangible assets (continued)
Acquired intangible assets at net book value at 31 December 2012 include brand names of £408.8 million (2011: £371.9 million), customer-related intangibles of £287.7 million (2011: £294.1 million), and other assets (including proprietary tools) of £49.5 million (2011: £75.4 million).
In accordance with the Group’s accounting policy, the carrying values of goodwill and intangible assets with indefinite useful lives are reviewed for impairment annually or more frequently if events or changes in circumstances indicate that the asset might be impaired.
The carrying values of brands with an indefinite useful life are assessed for impairment purposes by using the royalty and loyalty methods of valuation, both of which utilise the net present value of future cash flows associated with the brands.
In years prior to 2012, the goodwill impairment review was initially undertaken as at 30 June and then updated as at 31 December which was the annual testing date. For 2012, the annual testing date was changed to 30 September to better align the impairment testing procedures with the financial planning process. This change did not accelerate, delay, avoid, or cause a goodwill impairment charge. The review assessed whether the carrying value of goodwill was supported by the net present value of future cash flows, using a pre-tax discount rate of 9.5% (2011: 9.5%) and management forecasts for a projection period of up to five years, followed by an assumed annual long-term growth rate of 3.0% (2011: 3.0%) and no assumed improvement in operating margin. Management have made the judgement that this long-term growth rate does not exceed the long-term average growth rate for the industry.
Goodwill impairment charges of £32.0 million and £nil were recorded in the years ended 31 December 2012 and 2011, respectively. The impairment charge relates to certain underperforming businesses in the Group. In certain markets, the impact of local economic conditions and trading circumstances on these businesses was sufficiently severe to indicate impairment to the carrying value of goodwill.
Under IFRS, an impairment charge is required for both goodwill and other indefinite-lived assets when the carrying amount exceeds the ‘recoverable amount’, defined as the higher of fair value less costs to sell and value in use.
Our approach in determining the recoverable amount utilises a discounted cash flow methodology, which necessarily involves making numerous estimates and assumptions regarding revenue growth, operating margins, appropriate discount rates and working capital requirements. These estimates will likely differ from future actual results of operations and cash flows, and it is possible that these differences could be material. In addition, judgements are applied in determining the level of cash-generating unit identified for impairment testing and the criteria used to determine which assets should be aggregated. A difference in testing levels could affect whether an impairment is recorded and the extent of impairment loss. Changes in our business activities or structure may also result in changes to the level of testing in future periods. Further, future events could cause the Group to conclude that impairment indicators exist and that the asset values associated with a given operation have become impaired. Any resulting impairment loss could have a material impact on the Group’s financial condition and results of operations.
Historically our impairment losses have resulted from a specific event, condition or circumstance in one of our companies, such as the loss of a significant client. As a result, changes in the assumptions used in our impairment model have not had a significant effect on the impairment charges recognised and a reasonably possible change in assumptions would not lead to a significant impairment. The carrying value of goodwill and other intangible assets will continue to be reviewed at least annually for impairment and adjusted to the recoverable amount if required.
F-21
Notes to the consolidated financial statements (continued)
13. Property, plant and equipment
The movements in 2012 and 2011 were as follows:
| | | | | | | | | | | | | | | | | | | | | | | | |
| | | Land
£m | | | Freehold
buildings
£m | | | Leasehold
buildings
£m | | | Fixtures,
fittings
and
equipment
£m | | | Computer
equipment
£m | | | Total
£m | |
Cost: | | | | | | | | | | | | | | | | | | | | | | | | |
1 January 2011 | | | 12.4 | | | | 73.4 | | | | 672.7 | | | | 376.0 | | | | 581.1 | | | | 1,715.6 | |
Additions | | | – | | | | 0.6 | | | | 76.2 | | | | 43.1 | | | | 96.2 | | | | 216.1 | |
New acquisitions | | | – | | | | – | | | | 2.5 | | | | 4.6 | | | | 6.9 | | | | 14.0 | |
Disposals | | | – | | | | (0.9 | ) | | | (33.2 | ) | | | (41.0 | ) | | | (57.8 | ) | | | (132.9 | ) |
| Exchange adjustments | | | – | | | | – | | | | (4.3 | ) | | | (13.0 | ) | | | (14.2 | ) | | | (31.5 | ) |
31 December 2011 | | | 12.4 | | | | 73.1 | | | | 713.9 | | | | 369.7 | | | | 612.2 | | | | 1,781.3 | |
Additions | | | 29.7 | | | | 71.2 | | | | 79.6 | | | | 34.6 | | | | 83.3 | | | | 298.4 | |
New acquisitions | | | – | | | | – | | | | 2.3 | | | | 1.8 | | | | 4.4 | | | | 8.5 | |
Disposals | | | (4.0 | ) | | | (26.3 | ) | | | (79.8 | ) | | | (54.0 | ) | | | (81.8 | ) | | | (245.9 | ) |
| Exchange adjustments | | | (1.0 | ) | | | (0.4 | ) | | | (29.7 | ) | | | (18.7 | ) | | | (25.5 | ) | | | (75.3 | ) |
31 December 2012 | | | 37.1 | | | | 117.6 | | | | 686.3 | | | | 333.4 | | | | 592.6 | | | | 1,767.0 | |
| | | | | | |
Depreciation: | | | | | | | | | | | | | | | | | | | | | | | | |
1 January 2011 | | | – | | | | 28.0 | | | | 311.7 | | | | 228.3 | | | | 439.2 | | | | 1,007.2 | |
Charge for the year | | | – | | | | 3.2 | | | | 58.3 | | | | 42.9 | | | | 81.4 | | | | 185.8 | |
Disposals | | | – | | | | (0.3 | ) | | | (24.9 | ) | | | (37.7 | ) | | | (55.0 | ) | | | (117.9 | ) |
| Exchange adjustments | | | – | | | | (1.4 | ) | | | (2.0 | ) | | | (7.9 | ) | | | (10.8 | ) | | | (22.1 | ) |
31 December 2011 | | | – | | | | 29.5 | | | | 343.1 | | | | 225.6 | | | | 454.8 | | | | 1,053.0 | |
Charge for the year | | | – | | | | 3.2 | | | | 62.3 | | | | 40.6 | | | | 84.9 | | | | 191.0 | |
Disposals | | | – | | | | (14.3 | ) | | | (56.5 | ) | | | (47.6 | ) | | | (78.0 | ) | | | (196.4 | ) |
| Exchange adjustments | | | – | | | | (0.6 | ) | | | (14.3 | ) | | | (13.2 | ) | | | (20.8 | ) | | | (48.9 | ) |
31 December 2012 | | | – | | | | 17.8 | | | | 334.6 | | | | 205.4 | | | | 440.9 | | | | 998.7 | |
| | | | | | |
Net book value: | | | | | | | | | | | | | | | | | | | | | | | | |
31 December 2012 | | | 37.1 | | | | 99.8 | | | | 351.7 | | | | 128.0 | | | | 151.7 | | | | 768.3 | |
31 December 2011 | | | 12.4 | | | | 43.6 | | | | 370.8 | | | | 144.1 | | | | 157.4 | | | | 728.3 | |
1 January 2011 | | | 12.4 | | | | 45.4 | | | | 361.0 | | | | 147.7 | | | | 141.9 | | | | 708.4 | |
At the end of the year, capital commitments contracted, but not provided for in respect of property, plant and equipment were £47.0 million (2011: £127.4 million). The decrease is due to fewer significant property development projects in North America.
14. Interests in associates, joint ventures and other investments
The movements in 2012 and 2011 were as follows:
| | | | | | | | | | | | | | | | |
| | | Net
assets of
associates
and joint
ventures
£m | | | Goodwill
and other
intangibles
of associates
and joint
ventures £m | | | Total
associates
and joint
ventures
£m | | | Other
investments
£m | |
1 January 2011 | | | 372.8 | | | | 419.3 | | | | 792.1 | | | | 173.7 | |
Additions | | | 39.3 | | | | – | | | | 39.3 | | | | 29.3 | |
| Goodwill arising on acquisition of new associates | | | – | | | | 3.4 | | | | 3.4 | | | | – | |
| Share of results of associate undertakings (note 4) | | | 66.1 | | | | – | | | | 66.1 | | | | – | |
| Dividends and other movements | | | (67.3 | ) | | | 18.3 | | | | (49.0 | ) | | | – | |
| Exchange adjustments | | | (0.7 | ) | | | (4.8 | ) | | | (5.5 | ) | | | – | |
| Reclassification (to)/from subsidiaries | | | (16.0 | ) | | | (25.0 | ) | | | (41.0 | ) | | | 7.3 | |
| Revaluation of other investments | | | – | | | | – | | | | – | | | | 11.3 | |
| Amortisation of other intangible assets | | | – | | | | (2.1 | ) | | | (2.1 | ) | | | – | |
| Write-downs | | | (2.0 | ) | | | – | | | | (2.0 | ) | | | (30.8 | ) |
| 31 December 2011 | | | 392.2 | | | | 409.1 | | | | 801.3 | | | | 190.8 | |
| Additions | | | 32.1 | | | | – | | | | 32.1 | | | | 24.8 | |
| Goodwill arising on acquisition of new associates | | | – | | | | 54.5 | | | | 54.5 | | | | – | |
| Share of results of associate undertakings (note 4) | | | 69.4 | | | | – | | | | 69.4 | | | | – | |
| Dividends and other movements | | | (49.3 | ) | | | 15.8 | | | | (33.5 | ) | | | – | |
| Exchange adjustments | | | (28.7 | ) | | | (29.6 | ) | | | (58.3 | ) | | | (6.1 | ) |
| Disposals | | | (9.6 | ) | | | – | | | | (9.6 | ) | | | (14.4 | ) |
| Reclassification from subsidiaries | | | 35.2 | | | | 2.9 | | | | 38.1 | | | | – | |
| Revaluation of other investments | | | – | | | | – | | | | – | | | | (3.5 | ) |
| Amortisation of other intangible assets | | | – | | | | (2.3 | ) | | | (2.3 | ) | | | – | |
Write-downs | | | (0.7 | ) | | | (3.8 | ) | | | (4.5 | ) | | | (15.1 | ) |
31 December 2012 | | | 440.6 | | | | 446.6 | | | | 887.2 | | | | 176.5 | |
The investments included above as ‘other investments’ represent investments in equity securities that present the Group with opportunity for return through dividend income and trading gains. They have no fixed maturity or coupon rate. The fair values of the listed securities are based on quoted market prices. For unlisted securities, where market value is not available, the Group has estimated relevant fair values on the basis of publicly available information from outside sources or on the basis of discounted cash flow models where appropriate.
The carrying values of the Group’s associates and joint ventures are reviewed for impairment in accordance with the Group’s accounting policies.
F-22
Notes to the consolidated financial statements (continued)
14. Interests in associates, joint ventures and other investments (continued)
The Group’s principal associates and joint ventures at 31 December 2012 included:
| | | | | | | | |
| | | %
owned | | | Country of
incorporation | |
| Asatsu-DK Inc | | | 24.3 | | | | Japan | |
| Barrows Design and Manufacturing (Pty) Limited | | | 35.0 | | | | South Africa | |
| CHI&Partners Limited | | | 49.9 | | | | UK | |
| Chime Communications PLC | | | 21.1 | | | | UK | |
| CTR Market Research Co., Ltd | | | 46.0 | | | | China | |
| CVSC Sofres Media Co Limited | | | 40.0 | | | | China | |
| GIIR Inc | | | 28.8 | | | | Korea | |
| Globant | | | 20.3 | | | | Argentina | |
| High Co SA | | | 34.1 | | | | France | |
| IBOPE Latinoamericana SA | | | 41.8 | | | | Brazil | |
| Scangroup Limited | | | 31.8 | | | | Kenya | |
| Singleton Ogilvy & Mather (Holdings) Pty Limited | | | 33.3 | | | | Australia | |
| STW Communications Group Limited1 | | | 18.6 | | | | Australia | |
| The Jupiter Drawing Room (Proprietary) Limited | | | 49.0 | | | | South Africa | |
| WVI Marketing Communications Group Limited | | | 50.0 | | | | Russia | |
Note
| 1 | | Although the Group holds less than 20% of STW Communications Group Limited, it is considered to be an associate as the Group exercises significant influence by virtue of a position on the Board of Directors. |
The market value of the Group’s shares in its principal listed associate undertakings at 31 December 2012 was as follows: Asatsu-DK Inc: £150.7 million, Chime Communications PLC: £40.0 million, High Co SA: £15.2 million, GIIR Inc: £18.3 million, Scangroup Limited: £40.6 million, and STW Communications Group Limited: £53.2 million (2011: Asatsu-DK Inc: £175.0 million, Chime Communications PLC: £20.8 million, High Co SA: £16.9 million, GIIR Inc: £22.9 million, Scangroup Limited: £19.2 million, and STW Communications Group Limited: £41.7 million).
The carrying value (including goodwill and other intangibles) of these equity interests in the Group’s consolidated balance sheet at 31 December 2012 was as follows: Asatsu-DK Inc: £197.0 million, Chime Communications PLC: £36.8 million, High Co SA: £32.4 million, GIIR Inc: £26.7 million, Scangroup Limited: £21.0 million, and STW Communications Group Limited: £67.8 million (2011: Asatsu-DK Inc: £229.4 million, Chime Communications PLC: £29.4 million, High Co SA: £32.4 million, GIIR Inc: £24.0 million, Scangroup Limited: £20.4 million, and STW Communications Group Limited: £68.3 million).
Where the market value of the Group’s listed associates is less than the carrying value, an impairment review is performed utilising the discounted cash flow methodology discussed in note 12.
The Group’s investments in its principal associate undertakings are represented by ordinary shares.
14. Interests in associates, joint ventures and other investments (continued)
Summarised financial information
The following tables present a summary of the aggregate financial performance and net asset position of the Group’s associate undertakings and joint ventures. These have been estimated and converted, where appropriate, to an IFRS presentation based on information provided by the relevant companies at 31 December 2012.
| | | | | | | | | | | | |
| | | 2012
£m | | | 2011
£m | | | 2010
£m | |
| Income statement | | | | | | | | | | | | |
| Revenue | | | 2,268.0 | | | | 2,127.2 | | | | 2,142.3 | |
| Operating profit | | | 262.1 | | | | 293.7 | | | | 229.9 | |
| Profit before taxation | | | 262.8 | | | | 316.5 | | | | 245.1 | |
| Profit for the year | | | 176.5 | | | | 190.5 | | | | 179.1 | |
| | | | | | | | | | |
| | | | | 2012
£m | | | 2011
£m | |
| Balance sheet | | | | | | | | | | |
| Assets | | | | | 4,956.5 | | | | 4,388.2 | |
| Liabilities | | | | | (2,424.0 | ) | | | (2,191.8 | ) |
| Net assets | | | | | 2,532.5 | | | | 2,196.4 | |
The application of equity accounting is ordinarily discontinued when the investment is reduced to zero and additional losses are not provided for unless the investor has guaranteed obligations of the investee or is otherwise committed to provide further financial support for the investee.
At the end of the year, capital commitments contracted, but not provided for in respect of interests in associates and other investments were £18.8 million (2011: £40.0 million).
15. Deferred tax
The Group’s deferred tax assets and liabilities are measured at the end of each period in accordance with IAS 12. The recognition of deferred tax assets is determined by reference to the Group’s estimate of recoverability, using models where appropriate to forecast future taxable profits.
Deferred tax assets have only been recognised for territories where the Group considers that it is probable there would be sufficient taxable profits for the future deductions to be utilised.
Based on available evidence, both positive and negative, we determine whether it is probable that all or a portion of the deferred tax assets will be realised. The main factors that we consider include:
– the future earnings potential determined through the use of internal forecasts;
– the cumulative losses in recent years;
– the various jurisdictions in which the potential deferred tax assets arise;
– the history of losses carried forward and other tax assets expiring;
– the timing of future reversal of taxable temporary differences;
– the expiry period associated with the deferred tax assets; and
– the nature of the income that can be used to realise the deferred tax asset.
If it is probable that some portion of these assets will not be realised, then no asset is recognised in relation to that portion.
If market conditions improve and future results of operations exceed our current expectations, our existing recognised deferred tax assets may be adjusted, resulting in future tax benefits. Alternatively, if market conditions deteriorate further or future results of operations are less than expected, future assessments may result in a determination that some or all of the deferred tax assets are not realisable. As a result, all or a portion of the deferred tax assets may need to be reversed.
F-23
Notes to the consolidated financial statements (continued)
15. Deferred tax (continued)
Certain deferred tax assets and liabilities have been offset as they relate to the same tax group. The following is the analysis of the deferred tax balances for financial reporting purposes:
| | | | | | | | | | | | |
| | | Gross
£m | | | Offset
£m | | | As
reported
£m | |
| 2012 | | | | | | | | | | | | |
| Deferred tax assets | | | 221.2 | | | | (130.0 | ) | | | 91.2 | |
| Deferred tax liabilities | | | (810.3 | ) | | | 130.0 | | | | (680.3 | ) |
| | | | (589.1 | ) | | | – | | | | (589.1 | ) |
| 2011 | | | | | | | | | | | | |
| Deferred tax assets | | | 151.4 | | | | (65.4 | ) | | | 86.0 | |
| Deferred tax liabilities | | | (806.8 | ) | | | 65.4 | | | | (741.4 | ) |
| | | | (655.4 | ) | | | – | | | | (655.4 | ) |
The following are the major gross deferred tax assets recognised by the Group and movements thereon in 2012 and 2011:
| | | | | | | | | | | | | | | | | | | | | | | | |
| | | Tax
losses
£m | | | Retirement
benefit
obligations
£m | | | Property,
plant &
equipment
£m | | | Share
based
pay- ments
£m | | | Other
short-term temporary
differences
£m | | | Total
£m | |
| 1 January 2011 | | | 6.3 | | | | 13.1 | | | | 2.0 | | | | 49.6 | | | | 66.6 | | | | 137.6 | |
| Acquisition of subsidiaries | | | 0.7 | | | | – | | | | – | | | | – | | | | – | | | | 0.7 | |
| Credit/(charge) to income | | | 24.4 | | | | – | | | | 0.8 | | | | (2.8 | ) | | | 3.8 | | | | 26.2 | |
| Credit/(charge) to other comprehensive income | | | – | | | | 0.5 | | | | – | | | | – | | | | (0.3 | ) | | | 0.2 | |
| Charge to equity | | | – | | | | – | | | | – | | | | (11.8 | ) | | | – | | | | (11.8 | ) |
| Exchange adjustments | | | 0.2 | | | | (0.1 | ) | | | (0.1 | ) | | | (0.3 | ) | | | (1.2 | ) | | | (1.5 | ) |
| 31 December 2011 | | | 31.6 | | | | 13.5 | | | | 2.7 | | | | 34.7 | | | | 68.9 | | | | 151.4 | |
| Credit/(charge) to income | | | 5.7 | | | | 3.0 | | | | 41.2 | | | | 9.9 | | | | (0.2 | ) | | | 59.6 | |
| Credit to other comprehensive income | | | – | | | | 7.7 | | | | – | | | | – | | | | – | | | | 7.7 | |
| Credit to equity | | | – | | | | – | | | | – | | | | 13.3 | | | | – | | | | 13.3 | |
| Transfer to corporation tax | | | – | | | | – | | | | – | | | | – | | | | 3.9 | | | | 3.9 | |
| Exchange adjustments | | | (1.7 | ) | | | (0.5 | ) | | | (0.2 | ) | | | (2.0 | ) | | | (10.3 | ) | | | (14.7 | ) |
| 31 December 2012 | | | 35.6 | | | | 23.7 | | | | 43.7 | | | | 55.9 | | | | 62.3 | | | | 221.2 | |
Other short-term temporary differences comprise a number of items, none of which is individually significant to the Group’s consolidated balance sheet. At 31 December 2012 the balance related to temporary differences in relation to accounting provisions, tax credits, and tax deductible goodwill.
In addition the Group has recognised the following gross deferred tax liabilities and movements thereon in 2012 and 2011:
| | | | | | | | | | | | | | | | | | | | | | | | |
| | | Brands
and other
intangibles
£m | | | Associate
earnings
£m | | | Goodwill
£m | | | Property,
plant &
equipment
£m | | | Other
short-term
temporary
differences
£m | | | Total
£m | |
| 1 January 2011 | | | 688.1 | | | | 21.2 | | | | 92.4 | | | | 0.1 | | | | 7.4 | | | | 809.2 | |
| Acquisition of subsidiaries | | | 44.9 | | | | – | | | | – | | | | – | | | | – | | | | 44.9 | |
| (Credit)/ charge to income | | | (60.8 | ) | | | 1.3 | | | | 17.7 | | | | – | | | | 3.4 | | | | (38.4 | ) |
| Exchange adjustments | | | (9.7 | ) | | | 0.4 | | | | 0.4 | | | | – | | | | – | | | | (8.9 | ) |
| 31 December 2011 | | | 662.5 | | | | 22.9 | | | | 110.5 | | | | 0.1 | | | | 10.8 | | | | 806.8 | |
| Acquisition of subsidiaries | | | 59.4 | | | | – | | | | – | | | | – | | | | 1.9 | | | | 61.3 | |
| (Credit)/ charge to income | | | (71.8 | ) | | | 1.5 | | | | 21.1 | | | | 30.2 | | | | (2.2 | ) | | | (21.2 | ) |
| Exchange adjustments | | | (25.4 | ) | | | (3.4 | ) | | | (5.9 | ) | | | – | | | | (1.9 | ) | | | (36.6 | ) |
| 31 December 2012 | | | 624.7 | | | | 21.0 | | | | 125.7 | | | | 30.3 | | | | 8.6 | | | | 810.3 | |
15. Deferred tax (continued)
At the balance sheet date, the Group has gross tax losses and other temporary differences of £4,730.9 million (2011: £4,996.0 million) available for offset against future profits. Deferred tax assets have been recognised in respect of the tax benefit of £687.9 million (2011: £439.0 million) of such tax losses and other temporary differences. No deferred tax asset has been recognised in respect of the remaining £4,043.0 million (2011: £4,557.0 million) of losses and other temporary differences as the Group considers that there will not be enough taxable profits in the entities concerned such that any additional asset could be considered recoverable. Included in the total unrecognised temporary differences are losses of £398.7 million that will expire by 2022, £16.9 million that will expire by 2027, £58.9 million that will expire by 2029, £4.5 million that will expire by 2032 and £2,830.3 million of losses that may be carried forward indefinitely.
At the balance sheet date, the aggregate amount of the temporary differences in relation to the investment in subsidiaries for which deferred tax liabilities have not been recognised was £1,846.3 million. No liability has been recognised in respect of these differences because the Group is in a position to control the timing of the reversal of the temporary differences and the Group considers that it is probable that such differences will not reverse in the foreseeable future.
16. Inventory and work in progress
The following are included in the net book value of inventory and work in progress:
| | | | | | | | |
| | | 2012
£m | | | 2011
£m | |
| Work in progress | | | 343.3 | | | | 327.0 | |
| Inventory | | | 4.9 | | | | 6.9 | |
| | | | 348.2 | | | | 333.9 | |
17. Trade and other receivables
The following are included in trade and other receivables:
Amounts falling due within one year:
| | | | | | | | |
| | | 2012 £m | | | 2011 £m | |
| Trade receivables (net of bad debt provision) | | | 6,204.2 | | | | 6,305.1 | |
| VAT and sales taxes recoverable | | | 75.6 | | | | 76.2 | |
| Prepayments and accrued income | | | 2,232.2 | | | | 2,044.0 | |
| Other debtors | | | 495.0 | | | | 494.4 | |
| | | | 9,007.0 | | | | 8,919.7 | |
F-24
Notes to the consolidated financial statements (continued)
17. Trade and other receivables (continued)
The ageing of trade receivables and other financial assets is as follows:
| | | | | | | | | | | | | | | | | | | | | | | | | | | | |
| 2012 | | | | | | | | | | | | |
| | | Carrying
amount at
31 December
2012 £m | | | Neither
past due
nor
impaired
£m | | | 0-30
days
£m | | | 31-90
days
£m | | | 91-180
days
£m | | | 181
days-
1 year
£m | | | Greater
than
1 year
£m | |
| Trade receivables | | | 6,204.2 | | | | 3,942.5 | | | | 1,447.2 | | | | 659.2 | | | | 140.1 | | | | 9.5 | | | | 5.7 | |
| Other financial assets | | | 467.4 | | | | 311.3 | | | | 77.0 | | | | 35.7 | | | | 7.4 | | | | 10.1 | | | | 25.9 | |
| | | | 6,671.6 | | | | 4,253.8 | | | | 1,524.2 | | | | 694.9 | | | | 147.5 | | | | 19.6 | | | | 31.6 | |
| | | | | | | | | | | | | | | | | | | | | | | | | | | | |
| 2011 | | | | | | | | | | | | |
| | | Carrying
amount at
31 December
2011 £m | | | Neither
past due
nor
impaired
£m | | | 0-30
days
£m | | | 31-90
days
£m | | | 91-180
days
£m | | | 181
days-
1 year
£m | | | Greater
than
1 year
£m | |
| Trade receivables | | | 6,305.1 | | | | 3,887.3 | | | | 1,624.5 | | | | 648.8 | | | | 119.5 | | | | 6.2 | | | | 18.8 | |
| Other financial assets | | | 489.8 | | | | 330.2 | | | | 51.8 | | | | 42.4 | | | | 8.7 | | | | 22.2 | | | | 34.5 | |
| | | | 6,794.9 | | | | 4,217.5 | | | | 1,676.3 | | | | 691.2 | | | | 128.2 | | | | 28.4 | | | | 53.3 | |
Other financial assets are included in other debtors.
Past due amounts are not impaired where collection is considered likely.
Amounts falling due after more than one year:
| | | | | | | | |
| | | 2012
£m | | | 2011
£m | |
| Prepayments and accrued income1 | | | 29.5 | | | | 36.6 | |
| Other debtors1 | | | 73.9 | | | | 87.6 | |
| Fair value of derivatives | | | 141.7 | | | | 184.9 | |
| | | | 245.1 | | | | 309.1 | |
Note
| 1 | | Comparative figures have been restated to be consistent with current year presentation. |
Movements on bad debt provisions were as follows:
| | | | | | | | | | | | |
| | | 2012
£m | | | 2011
£m | | | 2010
£m | |
| Balance at beginning of year | | | 125.7 | | | | 114.6 | | | | 109.9 | |
| New acquisitions | | | 0.7 | | | | 4.0 | | | | 2.0 | |
| Charged to operating costs | | | 18.1 | | | | 31.1 | | | | 27.8 | |
| Exchange adjustments | | | (4.1 | ) | | | (1.9 | ) | | | 2.2 | |
| Utilisations and other movements | | | (35.1 | ) | | | (22.1 | ) | | | (27.3 | ) |
| Balance at end of year | | | 105.3 | | | | 125.7 | | | | 114.6 | |
The allowance for bad and doubtful debts is equivalent to 1.7% (2011: 2.0%, 2010: 1.8%) of gross trade accounts receivable.
The Group considers that the carrying amount of trade and other receivables approximates their fair value.
18. Trade and other payables: amounts falling due within one year
The following are included in trade and other payables falling due within one year:
| | | | | | | | |
| | | 2012
£m | | | 2011
£m | |
| Trade payables | | | 7,227.5 | | | | 7,292.7 | |
| Other taxation and social security | | | 433.6 | | | | 420.5 | |
| Payments due to vendors (earnout agreements) | | | 33.4 | | | | 96.8 | |
| Liabilities in respect of put option agreements with vendors | | | 64.3 | | | | 79.2 | |
| Deferred income | | | 880.2 | | | | 1,002.3 | |
| Fair value of derivatives | | | 31.6 | | | | 0.5 | |
| Share purchases – close period commitments | | | 18.2 | | | | – | |
| Other creditors and accruals | | | 2,219.0 | | | | 2,273.5 | |
| | | | 10,907.8 | | | | 11,165.5 | |
The Group considers that the carrying amount of trade and other payables approximates their fair value.
19. Trade and other payables: amounts falling due after more than one year
The following are included in trade and other payables falling due after more than one year:
| | | | | | | | |
| | | 2012
£m | | | 2011
£m | |
| Payments due to vendors (earnout agreements) | | | 160.6 | | | | 137.3 | |
| Liabilities in respect of put option agreements with vendors | | | 80.0 | | | | 89.1 | |
| Fair value of derivatives | | | 79.7 | | | | 139.9 | |
| Other creditors and accruals | | | 191.7 | | | | 186.8 | |
| | | | 512.0 | | | | 553.1 | |
The Group considers that the carrying amount of trade and other payables approximates their fair value.
The following tables set out payments due to vendors, comprising deferred consideration and the directors’ best estimates of future earnout-related obligations:
| | | | | | | | |
| | | 2012
£m | | | 2011
£m | |
| Within one year | | | 33.4 | | | | 96.8 | |
| Between one and two years | | | 35.7 | | | | 31.6 | |
| Between two and three years | | | 28.7 | | | | 25.2 | |
| Between three and four years | | | 30.4 | | | | 18.6 | |
| Between four and five years | | | 63.8 | | | | 28.9 | |
| Over five years | | | 2.0 | | | | 33.0 | |
| | | | 194.0 | | | | 234.1 | |
| | | | | | | | |
| | | 2012
£m | | | 2011
£m | |
| At the beginning of the year | | | 234.1 | | | | 275.3 | |
| Earnouts paid (note 11) | | | (85.7 | ) | | | (150.0 | ) |
| New acquisitions | | | 61.5 | | | | 80.4 | |
| Revision of estimates taken to goodwill (note 12) | | | 8.6 | | | | 25.9 | |
| Revaluation of payments due to vendors (note 6) | | | (15.2 | ) | | | 6.4 | |
| Exchange adjustments | | | (9.3 | ) | | | (3.9 | ) |
| At the end of the year | | | 194.0 | | | | 234.1 | |
As of 31 December 2012, the potential undiscounted amount of future payments that could be required under the earnout agreements for acquisitions completed in the current year and for all earnout agreements range from £nil to £322 million (2011: £nil to £256 million) and £nil to £819 million (2011: £nil to £931 million), respectively. The decrease in the maximum potential undiscounted amount of future payments for all earnout agreements is due to earnout arrangements that have completed and payments made on active arrangements, partially offset by earnout arrangements related to new acquisitions during the year.
F-25
Notes to the consolidated financial statements (continued)
20. Bank overdrafts, bonds and bank loans
Amounts falling due within one year:
| | | | | | | | |
| | | 2012
£m | | | 2011
£m | |
| Bank overdrafts | | | 586.0 | | | | 518.4 | |
Corporate bonds and bank loans | | | 499.9 | | | | – | |
| | | | 1,085.9 | | | | 518.4 | |
The Group considers that the carrying amount of bank overdrafts
approximates their fair value.
Amounts falling due after more than 1 year:
| | | | | | | | |
| | | 2012
£m | | | 2011
£m | |
| Corporate bonds and bank loans | | | 3,680.6 | | | | 3,893.0 | |
The Group estimates that the fair value of convertible and corporate bonds is £4,759.7 million at 31 December 2012 (2011: £4,232.6 million). The Group considers that the carrying amount of bank loans approximates their fair value.
The corporate bonds, convertible bonds, bank loans and overdrafts included within liabilities fall due for repayment as follows:
| | | | | | | | |
| | | 2012
£m | | | 2011
£m | |
| Within one year | | | 1,085.9 | | | | 518.4 | |
| Between one and two years | | | 1,071.2 | | | | 540.9 | |
| Between two and three years | | | 408.4 | | | | 1,078.9 | |
| Between three and four years | | | 607.8 | | | | 438.9 | |
| Between four and five years | | | 433.0 | | | | 698.0 | |
| Over five years | | | 1,160.2 | | | | 1,136.3 | |
| | | | 4,766.5 | | | | 4,411.4 | |
21. Provisions for liabilities and charges
The movements in 2012 and 2011 were as follows:
| | | | | | | | | | | | |
| | | Property
£m | | | Other
£m | | | Total
£m | |
| 1 January 2011 | | | 58.4 | | | | 103.2 | | | | 161.6 | |
| Charged to the income statement | | | 11.8 | | | | 16.5 | | | | 28.3 | |
| New acquisitions | | | 4.3 | | | | 15.5 | | | | 19.8 | |
| Utilised | | | (10.5 | ) | | | (13.3 | ) | | | (23.8 | ) |
| Released to the income statement | | | (6.3 | ) | | | (6.2 | ) | | | (12.5 | ) |
| Transfers | | | (9.6 | ) | | | (8.7 | ) | | | (18.3 | ) |
| Exchange adjustments | | | 0.2 | | | | (1.3 | ) | | | (1.1 | ) |
| 31 December 2011 | | | 48.3 | | | | 105.7 | | | | 154.0 | |
| Charged to the income statement | | | 8.9 | | | | 14.8 | | | | 23.7 | |
| New acquisitions | | | 0.7 | | | | 11.4 | | | | 12.1 | |
| Utilised | | | (8.0 | ) | | | (18.8 | ) | | | (26.8 | ) |
| Released to the income statement | | | (6.8 | ) | | | (5.4 | ) | | | (12.2 | ) |
| Transfers | | | (0.7 | ) | | | (7.7 | ) | | | (8.4 | ) |
| Exchange adjustments | | | (1.1 | ) | | | (4.7 | ) | | | (5.8 | ) |
| 31 December 2012 | | | 41.3 | | | | 95.3 | | | | 136.6 | |
Provisions comprise liabilities where there is uncertainty about the timing of settlement, but where a reliable estimate can be made of the amount. These include provisions for vacant space, sub-let losses and other property-related liabilities. Also included are other provisions, such as certain long-term employee benefits and legal claims, where the likelihood of settlement is considered probable.
The Company and various of its subsidiaries are, from time to time, parties to legal proceedings and claims which arise in the ordinary course of business. The directors do not anticipate that the outcome of these proceedings and claims will have a material adverse effect on the Group’s financial position or on the results of its operations.
22. Share-based payments
Charges for share-based incentive plans were as follows:
| | | | | | | | | | | | |
| | | 2012
£m | | | 2011
£m | | | 2010
£m | |
| Share-based payments | | | 92.8 | | | | 78.8 | | | | 70.4 | |
Share-based payments comprise charges for stock options and restricted stock awards to employees of the Group.
As of 31 December 2012, there was £167.0 million (2011: £149.1 million) of total unrecognised compensation cost related to the Group’s restricted stock plans. That cost is expected to be recognised over a period of one to two years.
Further information on stock options is provided in note 26.
Restricted stock plans
The Group operates a number of equity-settled share incentive schemes, in most cases satisfied by the delivery of stock from one of the Group’s ESOP Trusts. The most significant current schemes are as follows:
Renewed Leadership Equity Acquisition Plan (Renewed LEAP) and Leadership Equity Acquisition Plan III (LEAP III)
Under Renewed LEAP and LEAP III, the most senior executives of the Group, including certain executive directors, commit WPP shares (‘investment shares’) in order to have the opportunity to earn additional WPP shares (‘matching shares’). The number of matching shares which a participant can receive at the end of the fixed performance period of five years is dependent on the performance (based on the Total Share Owner Return (TSR)) of the Company over that period against a comparator group of other listed communications services companies. The maximum possible number of matching shares for each of the 2012, 2011, 2010, 2009 and 2008 grants is five shares for each investment share. The 2008 Renewed LEAP plan vested in March 2013 at a match of 4.29 shares for each investment share.
Performance Share Awards (PSA)
Grants of stock under PSA are dependent upon annual performance targets, typically based on one or more of: operating profit, profit before taxation and operating margin. Grants are made in the year following the year of performance measurement, and vest two years after grant date provided the individual concerned is continually employed by the Group throughout this time.
Leaders, Partners and High Potential Group
Stock option grants under the executive stock option plan were not significant in 2012, 2011 or 2010 as the Group made grants of restricted stock (to be satisfied by stock from one of the Group’s ESOP Trusts) to participants instead. Performance conditions include continued employment over the three-year vesting period.
Valuation methodology
For all of these schemes, the valuation methodology is based upon fair value on grant date, which is determined by the market price on that date or the application of a Black-Scholes model, depending upon the characteristics of the scheme concerned. The assumptions underlying the Black-Scholes model are detailed in note 26, including details of assumed dividend yields. Market price on any given day is obtained from external, publicly available sources.
Market/non-market conditions
Most share-based plans are subject to non-market performance conditions, such as margin or growth targets, as well as continued employment. The Renewed LEAP and LEAP III schemes are subject to a number of performance conditions, including TSR, a market-based condition.
For schemes without market-based performance conditions, the valuation methodology above is applied and, at each year end, the relevant accrual for each grant is revised, if appropriate, to take account of any changes in estimate of the likely number of shares expected to vest.
F-26
Notes to the consolidated financial statements (continued)
22. Share-based payments (continued)
For schemes with market-based performance conditions, the probability of satisfying these conditions is assessed at grant date through a statistical model (such as the Monte Carlo Model) and applied to the fair value. This initial valuation remains fixed throughout the life of the relevant plan, irrespective of the actual outcome in terms of performance. Where a lapse occurs due to cessation of employment, the cumulative charge taken to date is reversed.
Movement on ordinary shares granted for significant restricted stock plans:
| | | | | | | | | | | | | | | | | | | | |
| | | Non-vested
1 January
2012
number m | | | Granted
number
m | | | Lapsed
number
m | | | Vested
number
m | | | Non- vested
31 December
2012 number m | |
| Renewed LEAP/LEAP III1 | | | 4.5 | | | | 1.8 | | | | (0.1 | ) | | | (1.6 | ) | | | 4.6 | |
| Performance Share Awards (PSA) | | | 4.9 | | | | 3.9 | | | | (0.4 | ) | | | (1.4 | ) | | | 7.0 | |
| Leaders, Partners and High Potential Group | | | 10.9 | | | | 3.4 | | | | (0.8 | ) | | | (3.7 | ) | | | 9.8 | |
| Weighted average fair value (pence per share): | | | | | | | | | | | | | | | | | | | | |
| Renewed LEAP/LEAP III1 | | | 633p | | | | 745p | | | | 375p | | | | 633p | | | | 683p | |
| Performance Share Awards (PSA) | | | 757p | | | | 824p | | | | 792p | | | | 705p | | | | 802p | |
| Leaders, Partners and High Potential Group | | | 657p | | | | 781p | | | | 671p | | | | 546p | | | | 740p | |
Note
| 1 | | The number of shares granted represents the ‘investment shares’ committed by participants at grant date for the 2012 LEAP III plan in addition to the matched shares awarded on vest date for the 2007 Renewed LEAP plan which vested in March 2012. The actual number of shares that vest for each Renewed LEAP/LEAP III plan is dependent on the extent to which the relevant performance criteria are satisfied. |
The total fair value of shares vested for all the Group’s restricted stock plans during the year ended 31 December 2012 was £47.5 million (2011: £76.5 million, 2010: £61.8 million).
23. Provision for post-employment benefits
Companies within the Group operate a large number of pension plans, the forms and benefits of which vary with conditions and practices in the countries concerned. The Group’s pension costs are analysed as follows:
| | | | | | | | | | | | |
| | | 2012
£m | | | 2011
£m | | | 2010
£m | |
| Defined contribution plans | | | 124.9 | | | | 114.7 | | | | 101.5 | |
| Defined benefit plans charge to operating profit | | | 23.8 | | | | 20.7 | | | | 19.1 | |
| Pension costs (note 5) | | | 148.7 | | | | 135.4 | | | | 120.6 | |
| Expected return on pension plan assets (note 6) | | | (30.0 | ) | | | (32.6 | ) | | | (30.6 | ) |
| Interest on pension plan liabilities (note 6) | | | 41.3 | | | | 43.8 | | | | 45.9 | |
| | | | 160.0 | | | | 146.6 | | | | 135.9 | |
Defined benefit plans
The pension costs are assessed in accordance with the advice of local independent qualified actuaries. The latest full actuarial valuations for the various pension plans were carried out at various dates in the last three years. These valuations have been updated by the local actuaries to 31 December 2012.
The Group’s policy is to close existing defined benefit plans to new members. This has been implemented across a significant number of the pension plans.
Contributions to funded plans are determined in line with local conditions and practices. Contributions in respect of unfunded plans are paid as they fall due. The total contributions (for funded plans) and benefit payments (for unfunded plans) paid for 2012 amounted to £56.5 million (2011: £66.8 million, 2010: £53.3 million). Employer contributions and benefit payments in 2013 are expected to be in the range of £50 million to £70 million depending on the performance of the assets.
(a) Assumptions
The main weighted average assumptions used for the actuarial valuations at 31 December are shown in the following table:
| | | | | | | | | | | | | | | | |
| | | 2012
% pa | | | 2011
% pa | | | 2010
% pa | | | 2009
% pa | |
| UK | | | | | | | | | | | | | | | | |
| Discount rate1 | | | 4.2 | | | | 4.7 | | | | 5.4 | | | | 5.7 | |
| Rate of increase in salaries | | | 2.9 | | | | 3.0 | | | | 3.4 | | | | 3.5 | |
| Rate of increase in pensions in payment | | | 3.9 | | | | 4.0 | | | | 4.0 | | | | 4.2 | |
| Inflation | | | 2.4 | | | | 2.5 | | | | 3.2 | | | | 3.5 | |
| Expected rate of return on equities | | | 7.5 | | | | 7.5 | | | | 7.5 | | | | 7.5 | |
| Expected rate of return on bonds1 | | | 3.6 | | | | 3.6 | | | | 4.5 | | | | 4.8 | |
| Expected rate of return on insured annuities | | | 4.2 | | | | 4.7 | | | | 5.4 | | | | 5.7 | |
| Expected rate of return on property | | | n/a | | | | 6.9 | | | | 6.9 | | | | 6.9 | |
| Expected rate of return on cash and other | | | 4.3 | | | | 3.9 | | | | 4.0 | | | | 4.4 | |
| Weighted average return on assets | | | 4.3 | | | | 4.6 | | | | 5.4 | | | | 5.6 | |
| North America | | | | | | | | | | | | | | | | |
| Discount rate1 | | | 3.5 | | | | 4.4 | | | | 5.1 | | | | 5.7 | |
| Rate of increase in salaries | | | 3.0 | | | | 3.0 | | | | 3.0 | | | | 3.0 | |
| Inflation | | | 2.5 | | | | 2.5 | | | | 2.5 | | | | 2.5 | |
| Expected rate of return on equities | | | 7.9 | | | | 7.9 | | | | 7.9 | | | | 7.9 | |
| Expected rate of return on bonds1 | | | 3.6 | | | | 4.1 | | | | 4.3 | | | | 4.7 | |
| Expected rate of return on cash and other | | | 3.6 | | | | 3.9 | | | | 6.4 | | | | 6.6 | |
| Weighted average return on assets | | | 5.3 | | | | 5.9 | | | | 6.4 | | | | 6.5 | |
| Western Continental Europe | | | | | | | | | | | | | | | | |
| Discount rate1 | | | 3.6 | | | | 4.8 | | | | 5.3 | | | | 5.5 | |
| Rate of increase in salaries | | | 2.4 | | | | 2.7 | | | | 2.7 | | | | 2.7 | |
| Rate of increase in pensions in payment | | | 2.0 | | | | 2.0 | | | | 2.0 | | | | 2.0 | |
| Inflation | | | 2.0 | | | | 2.0 | | | | 2.0 | | | | 2.1 | |
| Expected rate of return on equities | | | 7.1 | | | | 7.1 | | | | 7.1 | | | | 7.8 | |
| Expected rate of return on bonds1 | | | 2.7 | | | | 3.8 | | | | 4.4 | | | | 4.1 | |
| Expected rate of return on property | | | 5.4 | | | | 6.1 | | | | 6.1 | | | | 6.5 | |
| Expected rate of return on cash and other | | | 4.0 | | | | 4.3 | | | | 4.6 | | | | 4.6 | |
| Weighted average return on assets | | | 4.3 | | | | 4.7 | | | | 5.0 | | | | 5.1 | |
| Asia Pacific, Latin America, Africa & Middle East and Central & Eastern Europe | | | | | | | | | | | | | | | | |
| Discount rate1 | | | 4.1 | | | | 4.8 | | | | 4.0 | | | | 4.2 | |
| Rate of increase in salaries | | | 6.1 | | | | 5.7 | | | | 4.4 | | | | 4.2 | |
| Inflation | | | 4.7 | | | | 4.8 | | | | 5.1 | | | | 4.9 | |
| Expected rate of return on equities | | | 8.7 | | | | n/a | | | | 10.0 | | | | 10.1 | |
| Expected rate of return on bonds1 | | | 4.4 | | | | 7.3 | | | | 8.0 | | | | 8.2 | |
| Expected rate of return on cash and other | | | 5.6 | | | | 5.4 | | | | 1.0 | | | | 1.1 | |
| Weighted average return on assets | | | 5.3 | | | | 5.8 | | | | 3.4 | | | | 3.6 | |
Note
| 1 | | The assumptions used for the discount rates are based on high-quality corporate bond yields, whereas the assumptions used for the expected rate of return on bonds reflect the yield expected on actual bonds held. |
There are a number of areas in pension accounting that involve judgements made by management based on advice of qualified advisors. These include establishing the long-term expected rates of investment return on pension assets, mortality assumptions, discount rates, inflation, rate of increase in pensions in payment and salary increases.
For the Group’s pension plans, the plans’ assets are invested with the objective of being able to meet current and future benefit payment needs, while controlling balance sheet volatility and future contributions. Pension plan assets are invested with a number of investment managers, and assets are diversified among equities, bonds, insured annuities, property and cash or other liquid investments. The primary use of bonds as an investment class is to match the anticipated cash flows from the plans to pay pensions. Various insurance policies have also been bought historically to provide a more exact match for the cash flows, including a match for
F-27
Notes to the consolidated financial statements (continued)
23. Provision for post-employment benefits (continued)
the actual mortality of specific plan members. These insurance policies effectively provide protection against both investment fluctuations and longevity risks. The strategic target allocation varies among the individual plans.
Management considers the types of investment classes in which the pension plan assets are invested and the expected compound return that can reasonably be expected for the portfolio to earn over time, which reflects forward-looking economic assumptions. Management reviews the expected long-term rates of return on an annual basis and revises them as appropriate.
Management periodically commissions detailed asset and liability studies performed by third-party professional investment advisors and actuaries, that generate probability-adjusted expected future returns on those assets. These studies also project the estimated future pension payments and evaluate the efficiency of the allocation of the pension plan assets into various investment categories. The studies performed at the time these assumptions were set support the reasonableness of the return assumptions based on the target allocation of investment classes and the then current market conditions.
At 31 December 2012, the life expectancies underlying the value of the accrued liabilities for the main defined benefit pension plans operated by the Group were as follows:
| | | | | | | | | | | | | | | | | | | | |
Years life expectancy after age 65 | | All
plans | | | North
America | | | UK | | | Western
Conti-
nental
Europe | | | Other1 | |
– current pensioners (at age 65) – male | | | 21.9 | | | | 20.4 | | | | 24.4 | | | | 20.5 | | | | 19.3 | |
– current pensioners (at age 65) – female | | | 23.9 | | | | 22.6 | | | | 25.6 | | | | 23.6 | | | | 24.7 | |
– future pensioners (current age 45) – male | | | 24.1 | | | | 22.5 | | | | 26.5 | | | | 23.0 | | | | 19.3 | |
– future pensioners (current age 45) – female | | | 26.0 | | | | 24.5 | | | | 27.9 | | | | 25.6 | | | | 24.7 | |
Note
| 1 | | Includes Asia Pacific, Latin America, Africa & Middle East and Central & Eastern Europe. |
The life expectancies after age 65 at 31 December 2011 were 20.9 years and 22.8 years for male and female current pensioners (at age 65) respectively, and 22.4 years and 24.0 years for male and female future pensioners (current age 45), respectively.
In the determination of mortality assumptions, management uses the most up-to-date mortality tables available in each country.
For a 0.25% increase or decrease in the discount rate at 31 December 2012, the effect on the year-end 2012 plan liabilities would be a decrease or increase, respectively, of approximately £34 million.
(b) Assets and liabilities
At 31 December, the fair value of the assets in the pension plans, and the assessed present value of the liabilities in the pension plans are shown in the following table:
| | | | | | | | | | | | | | | | | | | | | | | | |
| | | 2012
£m | | | % | | | 2011
£m | | | % | | | 2010
£m | | | % | |
| Equities | | | 145.0 | | | | 20.4 | | | | 168.7 | | | | 25.8 | | | | 188.2 | | | | 29.8 | |
| Bonds | | | 282.3 | | | | 39.8 | | | | 271.4 | | | | 41.5 | | | | 245.7 | | | | 38.9 | |
| Insured annuities | | | 74.5 | | | | 10.5 | | | | 67.6 | | | | 10.4 | | | | 66.3 | | | | 10.5 | |
| Property | | | 0.8 | | | | 0.1 | | | | 9.4 | | | | 1.4 | | | | 9.6 | | | | 1.5 | |
| Cash and other | | | 207.2 | | | | 29.2 | | | | 136.6 | | | | 20.9 | | | | 121.5 | | | | 19.3 | |
| Total fair value of assets | | | 709.8 | | | | 100.0 | | | | 653.7 | | | | 100.0 | | | | 631.3 | | | | 100.0 | |
| Present value of liabilities | | | (1,044.1 | ) | | | | | | | (934.5 | ) | | | | | | | (871.2 | ) | | | | |
| Deficit in the plans | | | (334.3 | ) | | | | | | | (280.8 | ) | | | | | | | (239.9 | ) | | | | |
| Irrecoverable surplus | | | (1.0 | ) | | | | | | | (1.1 | ) | | | | | | | (0.9 | ) | | | | |
| Unrecognised past service cost | | | (0.3 | ) | | | | | | | (0.4 | ) | | | | | | | (0.7 | ) | | | | |
| Net liability1 | | | (335.6 | ) | | | | | | | (282.3 | ) | | | | | | | (241.5 | ) | | | | |
| Plans in surplus | | | 1.5 | | | | | | | | 5.6 | | | | | | | | 2.8 | | | | | |
| Plans in deficit | | | (337.1 | ) | | | | | | | (287.9 | ) | | | | | | | (244.3 | ) | | | | |
Note
| 1 | | The related deferred tax asset is discussed in note 15. |
The total fair value of assets, present value of pension plan liabilities and deficit in the plans were £588.1 million, £836.1 million and £248.0 million in 2009 and £550.4 million, £819.1 million and £268.7 million in 2008, respectively.
| | | | | | | | | | | | |
| Deficit in plans by region | | 2012
£m | | | 2011
£m | | | 2010
£m | |
| UK | | | (9.4 | ) | | | (1.6 | ) | | | (3.5 | ) |
| North America | | | (193.8 | ) | | | (172.5 | ) | | | (144.4 | ) |
| Western Continental Europe | | | (100.0 | ) | | | (84.5 | ) | | | (75.9 | ) |
| Asia Pacific, Latin America, Africa & Middle East and Central & Eastern Europe | | | (31.1 | ) | | | (22.2 | ) | | | (16.1 | ) |
| Deficit in the plans | | | (334.3 | ) | | | (280.8 | ) | | | (239.9 | ) |
Some of the Group’s defined benefit plans are unfunded (or largely unfunded) by common custom and practice in certain jurisdictions. In the case of these unfunded plans, the benefit payments are made as and when they fall due. Pre-funding of these plans would not be typical business practice.
The following table shows the split of the deficit at 31 December 2012, 2011 and 2010 between funded and unfunded pension plans.
| | | | | | | | | | | | | | | | | | | | | | | | |
| | | 2012
Deficit
£m | | | 2012
Present
value of
liabilities
£m | | | 2011
Deficit
£m | | | 2011
Present
value of
liabilities
£m | | | 2010
Deficit
£m | | | 2010
Present
value of
liabilities
£m | |
| Funded plans by region | | | | | | | | | | | | | | | | | | | | | | | | |
| UK | | | (9.4 | ) | | | (366.6 | ) | | | (1.6 | ) | | | (327.8 | ) | | | (3.5 | ) | | | (305.5 | ) |
| North America | | | (115.6 | ) | | | (375.0 | ) | | | (93.1 | ) | | | (340.2 | ) | | | (66.8 | ) | | | (306.5 | ) |
| Western Continental Europe | | | (45.5 | ) | | | (129.1 | ) | | | (36.4 | ) | | | (108.0 | ) | | | (29.7 | ) | | | (103.8 | ) |
| Asia Pacific, Latin America, Africa & Middle East and Central & Eastern Europe | | | (5.1 | ) | | | (14.7 | ) | | | (2.3 | ) | | | (11.1 | ) | | | (5.6 | ) | | | (21.1 | ) |
| Deficit/liabilities in the funded plans | | | (175.6 | ) | | | (885.4 | ) | | | (133.4 | ) | | | (787.1 | ) | | | (105.6 | ) | | | (736.9 | ) |
| Unfunded plans by region | | | | | | | | | | | | | | | | | | | | | | | | |
| UK | | | – | | | | – | | | | – | | | | – | | | | – | | | | – | |
| North America | | | (78.2 | ) | | | (78.2 | ) | | | (79.4 | ) | | | (79.4 | ) | | | (77.6 | ) | | | (77.6 | ) |
| Western Continental Europe | | | (54.5 | ) | | | (54.5 | ) | | | (48.1 | ) | | | (48.1 | ) | | | (46.2 | ) | | | (46.2 | ) |
| Asia Pacific, Latin America, Africa & Middle East and Central & Eastern Europe | | | (26.0 | ) | | | (26.0 | ) | | | (19.9 | ) | | | (19.9 | ) | | | (10.5 | ) | | | (10.5 | ) |
| Deficit/liabilities in the unfunded plans | | | (158.7 | ) | | | (158.7 | ) | | | (147.4 | ) | | | (147.4 | ) | | | (134.3 | ) | | | (134.3 | ) |
| Deficit/liabilities in the plans | | | (334.3 | ) | | | (1,044.1 | ) | | | (280.8 | ) | | | (934.5 | ) | | | (239.9 | ) | | | (871.2 | ) |
In accordance with IAS 19, plans that are wholly or partially funded are considered funded plans.
F-28
Notes to the consolidated financial statements (continued)
23. Provision for post-employment benefits (continued)
(c) Pension expense
The following table shows the breakdown of the pension expense between amounts charged to operating profit, amounts charged to finance income and finance costs and amounts recognised in the consolidated statement of comprehensive income (OCI):
| | | | | | | | | | | | |
| | | 2012
£m | | | 2011
£m | | | 2010
£m | |
| Current service cost | | | 23.8 | | | | 23.7 | | | | 23.3 | |
| Past service income | | | (0.2 | ) | | | (2.8 | ) | | | (0.6 | ) |
| Gain on settlements and curtailments | | | 0.2 | | | | (0.2 | ) | | | (3.6 | ) |
| Charge to operating profit | | | 23.8 | | | | 20.7 | | | | 19.1 | |
| Expected return on pension plan assets | | | (30.0 | ) | | | (32.6 | ) | | | (30.6 | ) |
| Interest on pension plan liabilities | | | 41.3 | | | | 43.8 | | | | 45.9 | |
| Charge to profit before taxation for defined benefit plans | | | 35.1 | | | | 31.9 | | | | 34.4 | |
| Gain/(loss) on pension plan assets relative to expected return | | | 40.1 | | | | (5.7 | ) | | | 31.9 | |
| Experience (loss)/gain arising on the plan liabilities | | | (1.6 | ) | | | (3.9 | ) | | | 3.4 | |
| Changes in assumptions underlying the present value of the plan liabilities | | | (122.5 | ) | | | (62.2 | ) | | | (37.9 | ) |
| Change in irrecoverable surplus | | | 0.1 | | | | (0.2 | ) | | | 2.2 | |
| Actuarial loss recognised in OCI | | | (83.9 | ) | | | (72.0 | ) | | | (0.4 | ) |
As at 31 December 2012 the cumulative amount of net actuarial losses recognised in equity since 1 January 2001 was £336.6 million (2011: £252.7 million, 2010: £180.7 million). Of this amount, a net loss of £235.5 million was recognised since the 1 January 2004 adoption of IAS 19.
(d) Movement in plan liabilities
The following table shows an analysis of the movement in the pension plan liabilities for each accounting period:
| | | | | | | | | | | | |
| | | 2012
£m | | | 2011
£m | | | 2010
£m | |
| Plan liabilities at beginning of year | | | 934.5 | | | | 871.2 | | | | 836.1 | |
| Service cost | | | 23.8 | | | | 23.7 | | | | 23.3 | |
| Interest cost | | | 41.3 | | | | 43.8 | | | | 45.9 | |
| Actuarial loss | | | 124.1 | | | | 66.1 | | | | 34.5 | |
| Benefits paid | | | (56.9 | ) | | | (59.5 | ) | | | (57.2 | ) |
| (Gain)/loss due to exchange rate movements | | | (25.3 | ) | | | (2.0 | ) | | | 9.7 | |
| Settlements and curtailments | | | (1.7 | ) | | | (13.7 | ) | | | (26.4 | ) |
| Other1 | | | 4.3 | | | | 4.9 | | | | 5.3 | |
| Plan liabilities at end of year | | | 1,044.1 | | | | 934.5 | | | | 871.2 | |
Note
| 1 | | Other includes disposals, acquisitions, plan participants’ contributions, plan amendments and reclassifications. The reclassifications represent certain of the Group’s defined benefit plans which are included in this note for the first time in the periods presented. |
(e) Movement in plan assets
The following table shows an analysis of the movement in the pension plan assets for each accounting period:
| | | | | | | | | | | | |
| | | 2012
£m | | | 2011
£m | | | 2010
£m | |
| Fair value of plan assets at beginning of year | | | 653.7 | | | | 631.3 | | | | 588.1 | |
| Expected return on plan assets | | | 30.0 | | | | 32.6 | | | | 30.6 | |
| Actuarial gain/(loss) on plan assets | | | 40.1 | | | | (5.7 | ) | | | 31.9 | |
| Employer contributions | | | 56.5 | | | | 66.8 | | | | 53.3 | |
| Benefits paid | | | (56.9 | ) | | | (59.5 | ) | | | (57.2 | ) |
| (Loss)/gain due to exchange rate movements | | | (13.9 | ) | | | (1.3 | ) | | | 5.9 | |
| Settlements | | | (1.9 | ) | | | (13.5 | ) | | | (22.8 | ) |
| Other1 | | | 2.2 | | | | 3.0 | | | | 1.5 | |
| Fair value of plan assets at end of year | | | 709.8 | | | | 653.7 | | | | 631.3 | |
| Actual return on plan assets | | | 70.1 | | | | 26.9 | | | | 62.5 | |
Note
| 1 | | Other includes disposals, acquisitions, plan participants’ contributions and reclassifications. The reclassifications represent certain of the Group’s defined benefit plans which are included in this note for the first time in the periods presented. |
(f) History of experience gains and losses
| | | | | | | | | | | | | | |
| | | 2012
£m | | | 2011
£m | | | 2010
£m | | | |
| Gain/(loss) on pension plan assets relative to expected return: | | | | | | | | | | | | | | |
| Amount | | | 40.1 | | | | (5.7 | ) | | | 31.9 | | | |
| Percentage of plan assets | | | 5.6 | % | | | (0.9 | %) | | | 5.1 | % | | |
| Experience (loss)/gain arising on the plan liabilities: | | | | | | | | | | | | | | |
| Amount | | | (1.6 | ) | | | (3.9 | ) | | | 3.4 | | | |
| Percentage of the present value of the plan liabilities | | | (0.2 | %) | | | (0.4 | %) | | | 0.4 | % | | |
| Total loss recognised in OCI: | | | | | | | | | | | | | | |
| Amount | | | (83.9 | ) | | | (72.0 | ) | | | (0.4 | ) | | |
| Percentage of the present value of the plan liabilities | | | (8.0 | %) | | | (7.7 | %) | | | (0.0 | %) | | |
The experience gain/(loss) on pension plan assets and plan liabilities was £44.0 million and (£7.6) million in 2009 and (£93.7) million and £4.4 million in 2008, respectively.
24. Risk management policies
Foreign currency risk
The Group’s results in pounds sterling are subject to fluctuation as a result of exchange rate movements. The Group does not hedge this translation exposure to its earnings but does hedge the currency element of its net assets using foreign currency borrowings, cross-currency swaps and forward foreign exchange contracts.
The Group effects these currency net asset hedges by borrowing in the same currencies as the operating (or ‘functional’) currencies of its main operating units. The majority of the Group’s debt is therefore denominated in US dollars, pounds sterling and euros. Borrowings in these currencies represented 98.5% of the Group’s gross indebtedness at 31 December 2012 (at $3,828 million, £750 million and€1,274 million) and 96.7% of the Group’s average gross debt during the course of 2012 (at $3,356 million, £767 million and€1,274 million).
The Group’s operations conduct the majority of their activities in their own local currency and consequently the Group has no significant transactional foreign exchange exposures. Any significant cross-border trading exposures are hedged by the use of forward foreign-exchange contracts. No speculative foreign exchange trading is undertaken.
Interest rate risk
The Group is exposed to interest rate risk on both interest-bearing assets and interest-bearing liabilities. The Group has a policy of actively managing its interest rate risk exposure while recognising that fixing rates on all its debt eliminates the possibility of benefiting from rate reductions and similarly, having all its debt at floating rates unduly exposes the Group to increases in rates.
Including the effect of interest rate and cross-currency swaps, 81.2% of the year-end US dollar debt is at fixed rates averaging 5.53% for an average period of 92 months; 73.3% of the sterling debt is at a fixed rate of 6.07% for an average period of 58 months; and 66.7% of the euro debt is at fixed rates averaging 6.50% for an average period of 38 months.
Other than fixed rate debt, the Group’s other fixed rates are achieved principally through interest rate swaps with the Group’s bankers. The Group also uses forward rate agreements and interest rate caps to manage exposure to interest rate changes. At 31 December 2012 no forward rate agreements or interest rate caps were in place. These interest rate derivatives are used only to hedge exposures to interest rate movements arising from the Group’s borrowings and surplus cash balances arising from its commercial activities and are not traded independently. Payments made under these instruments are accounted for on an accruals basis.
F-29
Notes to the consolidated financial statements (continued)
24. Risk management policies (continued)
Going concern and liquidity risk
In considering going concern and liquidity risk, the directors have reviewed the Group’s future cash requirements and earnings projections. The directors believe these forecasts have been prepared on a prudent basis and have also considered the impact of a range of potential changes to trading performance. The directors have concluded that the Group should be able to operate within its current facilities and comply with its banking covenants for the foreseeable future and therefore believe it is appropriate to prepare the financial statements of the Group on a going concern basis.
At 31 December 2012, the Group has access to £5.2 billion of committed bank facilities with maturity dates spread over the years 2013 to 2042 as illustrated below:
| | | | | | | | | | | | | | | | | | | | | | | | | | | | |
| | | £m | | | 2013
£m | | | 2014
£m | | | 2015
£m | | | 2016
£m | | | 2017
£m | | | 2018+
£m | |
US bond $300m
(5.125% ’42) | | | 184.7 | | | | | | | | | | | | | | | | | | | | | | | | 184.7 | |
US bond $500m
(3.625% ’22) | | | 307.8 | | | | | | | | | | | | | | | | | | | | | | | | 307.8 | |
US bond $812m
(4.75% ’21) | | | 500.2 | | | | | | | | | | | | | | | | | | | | | | | | 500.2 | |
£ bonds £200m
(6.375% ’20) | | | 200.0 | | | | | | | | | | | | | | | | | | | | | | | | 200.0 | |
£ bonds £400m
(6.0% ’17) | | | 400.0 | | | | | | | | | | | | | | | | | | | | 400.0 | | | | | |
Bank revolver ($1,050m
and £375m) | | | 1,021.5 | | | | | | | | | | | | | | | | 1,021.5 | | | | | | | | | |
Eurobonds€750m
(6.625% ’16) | | | 609.4 | | | | | | | | | | | | | | | | 609.4 | | | | | | | | | |
Eurobonds€500m
(5.25% ’15) | | | 406.3 | | | | | | | | | | | | 406.3 | | | | | | | | | | | | | |
£450m convertible bonds
(5.75% ’14) | | | 450.0 | | | | | | | | 450.0 | | | | | | | | | | | | | | | | | |
US bond $600m
(8.0% ’14) | | | 369.4 | | | | | | | | 369.4 | | | | | | | | | | | | | | | | | |
US bond $369m
(5.875% ’14) | | | 227.0 | | | | | | | | 227.0 | | | | | | | | | | | | | | | | | |
TNS private placements
$25m | | | 15.4 | | | | | | | | 15.4 | | | | | | | | | | | | | | | | | |
Eurobonds€600m
(4.375% ’13) | | | 487.5 | | | | 487.5 | | | | | | | | | | | | | | | | | | | | | |
Total committed facilities
available | | | 5,179.2 | | | | 487.5 | | | | 1,061.8 | | | | 406.3 | | | | 1,630.9 | | | | 400.0 | | | | 1,192.7 | |
| Drawn down facilities at 31 December 2012 | | | 4,157.7 | | | | 487.5 | | | | 1,061.8 | | | | 406.3 | | | | 609.4 | | | | 400.0 | | | | 1,192.7 | |
Undrawn committed credit
facilities | | | 1,021.5 | | | | | | | | | | | | | | | | | | | | | | | | | |
The Group’s borrowings are evenly distributed between fixed and floating rate debt. Given the strong cash generation of the business, its debt maturity profile and available facilities, the directors believe the Group has sufficient liquidity to match its requirements for the foreseeable future.
Treasury activities
Treasury activity is managed centrally from London, New York and Hong Kong, and is principally concerned with the monitoring of working capital, managing external and internal funding requirements and the monitoring and management of financial market risks, in particular interest rate and foreign exchange exposures.
The treasury operation is not a profit centre and its activities are carried out in accordance with policies approved by the Board of Directors and subject to regular review and audit.
The Group manages liquidity risk by ensuring continuity and flexibility of funding even in difficult market conditions. Undrawn committed borrowing facilities are maintained in excess of peak net-borrowing levels and debt maturities are closely monitored. Targets for debt and cash position are set on an annual basis and, to assist in meeting this, working capital targets are set for all the Group’s major operations.
Capital risk management
The Group manages its capital to ensure that entities in the Group will be able to continue as a going concern while maximising the return to stakeholders through the optimisation of the debt and equity balance. The capital structure of the Group consists of debt, which includes the borrowings disclosed in note 10, cash and cash equivalents and equity attributable to equity holders of the parent, comprising issued capital, reserves and retained earnings as disclosed in the consolidated statement of changes in equity and in notes 26 and 27.
Credit risk
The Group’s principal financial assets are cash and short-term deposits, trade and other receivables and investments, the carrying values of which represent the Group’s maximum exposure to credit risk in relation to financial assets, as shown in note 25.
The Group’s credit risk is primarily attributable to its trade receivables. The majority of the Group’s trade receivables are due from large national or multinational companies where the risk of default is considered low. The amounts presented in the consolidated balance sheet are net of allowances for doubtful receivables, estimated by the Group’s management based on prior experience and their assessment of the current economic environment. A relatively small number of clients make up a significant percentage of the Group’s debtors, but no single client represents more than 6% of total trade receivables as at 31 December 2012.
The credit risk on liquid funds and derivative financial instruments is limited because the counterparties are banks with high credit-ratings assigned by international credit-rating agencies or banks that have been financed by their government.
A relatively small number of clients contribute a significant percentage of the Group’s consolidated revenues. The Group’s clients generally are able to reduce advertising and marketing spending or cancel projects at any time for any reason. There can be no assurance that any of the Group’s clients will continue to utilise the Group’s services to the same extent, or at all, in the future. A significant reduction in advertising and marketing spending by, or the loss of one or more of, the Group’s largest clients, if not replaced by new client accounts or an increase in business from existing clients, would adversely affect the Group’s prospects, business, financial condition and results of operations.
Sensitivity analysis
The following sensitivity analysis addresses the effect of currency and interest rate risks on the Group’s financial instruments. The analysis assumes that all hedges are highly effective.
Currency risk
A 10% weakening of sterling against the Group’s major currencies would result in the following losses, which would be posted directly to equity. These losses would arise on the retranslation of foreign currency denominated borrowings and derivatives designated as effective net investment hedges of overseas net assets. These losses would be partially offset in equity by a corresponding gain arising on the retranslation of the related hedged foreign currency net assets. A 10% strengthening of sterling would have an equal and opposite effect. There are no other material foreign exchange exposures which would create gains or losses to the functional reporting currencies of individual entities in the Group.
| | | | | | | | |
| | | 2012
£m | | | 2011
£m | |
| US dollar | | | 85.3 | | | | 91.5 | |
| Euro | | | 69.8 | | | | 71.8 | |
Interest rate risk
A one percentage point increase in market interest rates for all currencies in which the Group had cash and borrowings at 31 December 2012 would increase profit before tax by approximately £4.0 million (2011: £3.7 million). A one percentage decrease in market interest rates would have an equal and opposite effect. This has been calculated by applying the interest rate change to the Group’s variable rate cash and borrowings.
25. Financial instruments
Currency derivatives
The Group utilises currency derivatives to hedge significant future transactions and cash flows and the exchange risk arising on translation of the Group’s investments in foreign operations. The Group is a party to a variety of foreign currency derivatives in the management of its exchange rate exposures. The instruments purchased are primarily denominated in the currencies of the Group’s principal markets.
At 31 December 2012, the fair value of the Group’s currency derivatives is estimated to be a net liability of approximately £44.4 million (2011: £75.5 million). These amounts are based on market values of equivalent instruments at the balance sheet date, comprising £60.8 million (2011: £57.9 million) assets included in trade and other receivables and £105.2 million (2011: £133.4 million) liabilities included in trade and other payables. The amounts taken to and deferred in equity during the year for currency derivatives that are designated and effective hedges was a credit of £42.7 million (2011: charge of £1.9 million) for net investment hedges and a charge of £1.0 million (2011: £14.0 million) for cash flow hedges.
F-30
Notes to the consolidated financial statements (continued)
25. Financial instruments (continued)
Changes in the fair value relating to the ineffective portion of the currency derivatives amounted to a loss of £9.4 million (2011: gain of £3.1 million, 2010: gain of £11.7 million) which is included in the revaluation of financial instruments for the year. This loss resulted from a £32.3 million gain on hedging instruments and a £41.7 million loss on hedged items.
The Group currently designates its foreign currency-denominated debt and cross-currency swaps as hedging instruments against the currency risk associated with the translation of its foreign operations.
At the balance sheet date, the total nominal amount of outstanding forward foreign exchange contracts not designated as hedges was £63.6 million (2011: £124.4 million). The Group estimates the fair value of these contracts to be a net asset of £0.5 million (2011: £2.6 million).
These arrangements are designed to address significant exchange exposure and are renewed on a revolving basis as required.
Interest rate swaps
The Group uses interest rate swaps as hedging instruments in fair value hedges to manage its exposure to interest rate movements on its borrowings. Contracts with nominal values of€600 million have fixed interest receipts at 4.38% up until December 2013 and have floating interest payments averaging EURIBOR plus 0.56%. Contracts with a nominal value of€500 million have fixed interest receipts of 5.25% up until January 2015 and have floating interest payments averaging EURIBOR plus 0.80%. Contracts with a nominal value of€100 million have fixed interest payments of 5.56% until June 2014 and have floating rate receipts averaging EURIBOR plus 0.96%.
Contracts with a nominal value of £200 million have fixed interest receipts of 6.00% up until April 2017 and have floating rate payments averaging LIBOR plus 0.64%.
A contract with a nominal value of $25 million has fixed interest receipts averaging 6.34% until on average July 2014 and has floating rate payments averaging LIBOR plus 0.61%.
The fair value of interest rate swaps entered into at 31 December 2012 is estimated to be a net asset of approximately £102.8 million (2011: £121.0 million). These amounts are based on market values of equivalent instruments at the balance sheet date, comprising £108.7 million (2011: £127.5 million) assets included in trade and other receivables and £5.9 million (2011: £6.5 million) liabilities included in trade and other payables.
Changes in the fair value relating to the ineffective portion of interest rate swaps amounted to a gain of £0.6 million (2011: loss of £9.5 million, 2010: gain of £12.6 million) which is included in the revaluation of financial instruments for the year. This gain resulted from a £19.3 million loss on hedging instruments and a £19.9 million gain on hedged items.
25. Financial instruments (continued)
An analysis of the Group’s financial assets and liabilities by accounting classification is set out below:
| | | | | | | | | | | | | | | | | | | | | | | | |
| | | Derivatives
in
designated
hedge
relationships | | | Held
for
trading | | | Loans &
receivables | | | Available
for sale | | | Amortised
cost | | | Carrying
value | |
| | | £m | | | £m | | | £m | | | £m | | | £m | | | £m | |
| 2012 | | | | | | | | | | | | | | | | | | | | | | | | |
| Other investments | | | – | | | | – | | | | – | | | | 176.5 | | | | – | | | | 176.5 | |
| Cash and short-term deposits | | | – | | | | – | | | | 1,945.3 | | | | – | | | | – | | | | 1,945.3 | |
| Bank overdrafts and loans | | | – | | | | – | | | | – | | | | – | | | | (1,085.9 | ) | | | (1,085.9 | ) |
| Bonds and bank loans | | | – | | | | – | | | | – | | | | – | | | | (3,680.6 | ) | | | (3,680.6 | ) |
| Trade and other receivables: amounts falling due within one year | | | – | | | | – | | | | 6,605.4 | | | | – | | | | – | | | | 6,605.4 | |
| Trade and other receivables: amounts falling due after more than one year | | | – | | | | – | | | | 69.7 | | | | – | | | | – | | | | 69.7 | |
| Trade and other payables: amounts falling due within one year | | | – | | | | – | | | | – | | | | – | | | | (7,306.5 | ) | | | (7,306.5 | ) |
| Trade and other payables: amounts falling due after more than one year | | | – | | | | – | | | | – | | | | – | | | | (14.2 | ) | | | (14.2 | ) |
| Derivative assets | | | 169.5 | | | | 0.7 | | | | – | | | | – | | | | – | | | | 170.2 | |
| Derivative liabilities | | | (111.1 | ) | | | (0.2 | ) | | | – | | | | – | | | | – | | | | (111.3 | ) |
| Share purchases – close period commitments | | | – | | | | (18.2 | ) | | | – | | | | – | | | | – | | | | (18.2 | ) |
| Payments due to vendors (earnout agreements) | | | – | | | | (194.0 | ) | | | – | | | | – | | | | – | | | | (194.0 | ) |
| Liabilities in respect of put options | | | – | | | | (144.3 | ) | | | – | | | | – | | | | – | | | | (144.3 | ) |
| | | | 58.4 | | | | (356.0 | ) | | | 8,620.4 | | | | 176.5 | | | | (12,087.2 | ) | | | (3,587.9 | ) |
F-31
Notes to the consolidated financial statements (continued)
25. Financial instruments (continued)
| | | | | | | | | | | | | | | | | | | | | | | | |
| | | Derivatives
in
designated
hedge
relationships | | | Held
for
trading | | | Loans &
receivables | | | Available
for sale | | | Amortised
cost | | | Carrying
value | |
| | | £m | | | £m | | | £m | | | £m | | | £m | | | £m | |
| 2011 | | | | | | | | | | | | | | | | | | | | | | | | |
| Other investments | | | – | | | | – | | | | – | | | | 190.8 | | | | – | | | | 190.8 | |
| Cash and short-term deposits | | | – | | | | – | | | | 1,946.6 | | | | – | | | | – | | | | 1,946.6 | |
| Bank overdrafts and loans | | | – | | | | – | | | | – | | | | – | | | | (518.4 | ) | | | (518.4 | ) |
| Bonds and bank loans | | | – | | | | – | | | | – | | | | – | | | | (3,893.0 | ) | | | (3,893.0 | ) |
| Trade and other receivables: amounts falling due within one year | | | – | | | | – | | | | 6,718.4 | | | | – | | | | – | | | | 6,718.4 | |
| Trade and other receivables: amounts falling due after more than one year | | | – | | | | – | | | | 76.5 | | | | – | | | | – | | | | 76.5 | |
| Trade and other payables: amounts falling due within one year | | | – | | | | – | | | | – | | | | – | | | | (7,376.7 | ) | | | (7,376.7 | ) |
| Trade and other payables: amounts falling due after more than one year | | | – | | | | – | | | | – | | | | – | | | | (10.2 | ) | | | (10.2 | ) |
| Derivative assets | | | 185.4 | | | | 3.1 | | | | – | | | | – | | | | – | | | | 188.5 | |
| Derivative liabilities | | | (139.9 | ) | | | (0.5 | ) | | | – | | | | – | | | | – | | | | (140.4 | ) |
| Payments due to vendors (earnout agreements) | | | – | | | | (234.1 | ) | | | – | | | | – | | | | – | | | | (234.1 | ) |
| Liabilities in respect of put options | | | – | | | | (168.3 | ) | | | – | | | | – | | | | – | | | | (168.3 | ) |
| | | | 45.5 | | | | (399.8 | ) | | | 8,741.5 | | | | 190.8 | | | | (11,798.3 | ) | | | (3,220.3 | ) |
The following table provides an analysis of financial instruments that are measured subsequent to initial recognition at fair value, grouped into levels 1 to 3 based on the degree to which the fair value is observable:
Level 1 fair value measurements are those derived from quoted prices (unadjusted) in active markets for identical assets or liabilities;
Level 2 fair value measurements are those derived from inputs other than quoted prices included within level 1 that are observable for the asset or liability, either directly (i.e. as prices) or indirectly (i.e. derived from prices);
Level 3 fair value measurements are those derived from valuation techniques that include inputs for the asset or liability that are not based on observable market data (unobservable inputs).
25. Financial instruments (continued)
| | | | | | | | | | | | | | | | |
| | | Level 1
£m | | | Level 2
£m | | | Level 3
£m | | | Carrying
value
£m | |
| 2012 | | | | | | | | | | | | | | | | |
| Derivatives in designated hedge relationships | | | | | | | | | | | | | | | | |
| Derivative assets | | | – | | | | 169.5 | | | | – | | | | 169.5 | |
| Derivative liabilities | | | – | | | | (111.1 | ) | | | – | | | | (111.1 | ) |
| Held for trading | | | | | | | | | | | | | | | | |
| Derivative assets | | | – | | | | 0.7 | | | | – | | | | 0.7 | |
| Derivative liabilities | | | – | | | | (0.2 | ) | | | – | | | | (0.2 | ) |
| Share purchases – close period commitments | | | (18.2 | ) | | | – | | | | – | | | | (18.2 | ) |
| Payments due to vendors (earnout agreements) (note 19) | | | – | | | | – | | | | (194.0 | ) | | | (194.0 | ) |
| Liabilities in respect of put options | | | – | | | | – | | | | (144.3 | ) | | | (144.3 | ) |
| Available for sale | | | | | | | | | | | | | | | | |
| Other investments | | | – | | | | – | | | | 176.5 | | | | 176.5 | |
| | | | (18.2 | ) | | | 58.9 | | | | (161.8 | ) | | | (121.1 | ) |
| | | | | | | | | | | | | | | | |
| | | Level 1
£m | | | Level 2
£m | | | Level 3
£m | | | Carrying
value £m | |
| 2011 | | | | | | | | | | | | | | | | |
| Derivatives in designated hedge relationships | | | | | | | | | | | | | | | | |
| Derivative assets | | | – | | | | 185.4 | | | | – | | | | 185.4 | |
| Derivative liabilities | | | – | | | | (139.9 | ) | | | – | | | | (139.9 | ) |
| Held for trading | | | | | | | | | | | | | | | | |
| Derivative assets | | | – | | | | 3.1 | | | | – | | | | 3.1 | |
| Derivative liabilities | | | – | | | | (0.5 | ) | | | – | | | | (0.5 | ) |
| Payments due to vendors (earnout agreements) (note 19) | | | – | | | | – | | | | (234.1 | ) | | | (234.1 | ) |
| Liabilities in respect of put options | | | – | | | | – | | | | (168.3 | ) | | | (168.3 | ) |
| Available for sale | | | | | | | | | | | | | | | | |
| Other investments | | | – | | | | – | | | | 190.8 | | | | 190.8 | |
| | | | – | | | | 48.1 | | | | (211.6 | ) | | | (163.5 | ) |
Reconciliation of level 3 fair value measurements1:
| | | | | | | | | | | | |
| | | Liabilities in
respect of
put options
£m | | | Other
investments
£m | | | Carrying
value
£m | |
| 1 January 2011 | | | (171.0 | ) | | | 173.7 | | | | 2.7 | |
| Losses recognised in the income statement | | | (30.9 | ) | | | (30.8 | ) | | | (61.7 | ) |
| Gain recognised in other comprehensive income | | | – | | | | 11.3 | | | | 11.3 | |
| Exchange adjustments | | | 5.7 | | | | – | | | | 5.7 | |
| Additions | | | (29.6 | ) | | | 36.6 | | | | 7.0 | |
| Settlements | | | 57.5 | | | | – | | | | 57.5 | |
| 31 December 2011 | | | (168.3 | ) | | | 190.8 | | | | 22.5 | |
| Losses recognised in the income statement | | | (5.1 | ) | | | (15.1 | ) | | | (20.2 | ) |
| Losses recognised in other comprehensive income | | | – | | | | (3.5 | ) | | | (3.5 | ) |
| Exchange adjustments | | | 11.6 | | | | (6.1 | ) | | | 5.5 | |
| Additions | | | (4.6 | ) | | | 24.8 | | | | 20.2 | |
| Disposals | | | – | | | | (14.4 | ) | | | (14.4 | ) |
| Settlements | | | 22.1 | | | | – | | | | 22.1 | |
| 31 December 2012 | | | (144.3 | ) | | | 176.5 | | | | 32.2 | |
Note
| 1 | | Refer to note 19 for the reconciliation of payments due to vendors (earnout agreements). |
F-32
Notes to the consolidated financial statements (continued)
25. Financial instruments (continued)
The fair values of financial assets and liabilities are based on quoted market prices where available. Where the market value is not available, the Group has estimated relevant fair values on the basis of publicly available information from outside sources or on the basis of discounted cash flow models where appropriate.
26. Authorised and issued share capital
| | | | | | | | |
| | | Equity
ordinary
shares | | | Nominal
value
£m | |
| Authorised | | | | | | | | |
| 1 January 2011 | | | 1,750,000,000 | | | | 175.0 | |
| 31 December 2011 | | | 1,750,000,000 | | | | 175.0 | |
| 31 December 2012 | | | 1,750,000,000 | | | | 175.0 | |
| | | | | | | | | |
| Issued and fully paid | | | | | | | | |
| 1 January 2011 | | | 1,264,391,221 | | | | 126.4 | |
| Exercise of share options | | | 5,548,684 | | | | 0.6 | |
| Share cancellations | | | (6,955,523 | ) | | | (0.7 | ) |
| Scrip dividend | | | 3,051,689 | | | | 0.3 | |
| Other | | | 337,750 | | | | – | |
| 31 December 2011 | | | 1,266,373,821 | | | | 126.6 | |
| Exercise of share options | | | 10,002,292 | | | | 1.0 | |
| Share cancellations | | | (6,703,400 | ) | | | (0.7 | ) |
| Scrip dividend | | | 2,001,145 | | | | 0.2 | |
| Treasury share cancellations | | | (6,266,751 | ) | | | (0.6 | ) |
| 31 December 2012 | | | 1,265,407,107 | | | | 126.5 | |
Company’s own shares
The Company’s holdings of own shares are stated at cost and represent shares held in treasury and purchases by the Employee Share Ownership Plan (‘ESOP’) trusts of shares in WPP plc for the purpose of funding certain of the Group’s share-based incentive plans.
The trustees of the ESOP purchase the Company’s ordinary shares in the open market using funds provided by the Company. The Company also has an obligation to make regular contributions to the ESOP to enable it to meet its administrative costs. The number and market value of the ordinary shares of the Company held by the ESOP at 31 December 2012 was 22,570,364 (2011: 20,599,871), and £200.4 million (2011: £139.2 million) respectively. There were no ordinary shares held in treasury at 31 December 2012. The number and market value of ordinary shares held in treasury at 31 December 2011 was 6,351,371 and £42.9 million respectively.
26. Authorised and issued share capital (continued)
Share options
WPP Executive Share Option Scheme
As at 31 December 2012, unexercised options over ordinary shares of 1,186,129 and unexercised options over ADRs of 325,435 have been granted under the WPP Executive Share Option Scheme as follows:
| | | | | | | | |
Number of ordinary shares under option | | Exercise price
per share (£) | | | Exercise dates | |
| 21,197 | | | 3.763 | | | | 2006 - 2013 | |
| 21,830 | | | 5.520 | | | | 2008 - 2014 | |
| 534,240 | | | 5.535 | | | | 2007 - 2014 | |
| 1,185 | | | 5.535 | | | | 2008 - 2014 | |
| 463,407 | | | 5.595 | | | | 2006 - 2013 | |
| 2,546 | | | 5.595 | | | | 2007 - 2013 | |
| 2,902 | | | 5.725 | | | | 2007 - 2014 | |
| 11,423 | | | 5.775 | | | | 2009 - 2015 | |
| 15,814 | | | 5.818 | | | | 2008 - 2015 | |
| 14,304 | | | 5.895 | | | | 2008 - 2015 | |
| 10,670 | | | 5.903 | | | | 2011 - 2018 | |
| 6,420 | | | 6.718 | | | | 2009 - 2016 | |
| 54,526 | | | 6.718 | | | | 2009 - 2016 | |
| 12,447 | | | 7.378 | | | | 2014 - 2021 | |
| 9,522 | | | 7.723 | | | | 2010 - 2017 | |
| 3,696 | | | 8.333 | | | | 2015 - 2022 | |
| | | | | | | | |
Number of ADRs under option | | Exercise price
per ADR ($) | | | Exercise dates | |
| 822 | | | 30.410 | | | | 2011 - 2018 | |
| 125,981 | | | 47.410 | | | | 2006 - 2013 | |
| 1,478 | | | 50.670 | | | | 2008 - 2015 | |
| 160,779 | | | 50.800 | | | | 2007 - 2014 | |
| 3,275 | | | 51.220 | | | | 2007 - 2014 | |
| 2,244 | | | 55.740 | | | | 2008 - 2015 | |
| 12,723 | | | 57.020 | | | | 2008 - 2015 | |
| 12,402 | | | 58.460 | | | | 2009 - 2016 | |
| 844 | | | 59.170 | | | | 2011 - 2018 | |
| 938 | | | 63.900 | | | | 2009 - 2020 | |
| 3,949 | | | 75.940 | | | | 2010 - 2017 | |
F-33
Notes to the consolidated financial statements (continued)
26. Authorised and issued share capital (continued)
WPP Worldwide Share Ownership Program
As at 31 December 2012, unexercised options over ordinary shares of 10,963,206 and unexercised options over ADRs of 1,571,326 have been granted under the WPP Worldwide Share Ownership Program as follows:
| | | | | | | | |
Number of ordinary shares under option | | Exercise price
per share (£) | | | Exercise dates | |
| 20,600 | | | 3.903 | | | | 2006 - 2013 | |
| 1,000 | | | 3.903 | | | | 2007 - 2013 | |
| 12,625 | | | 4.819 | | | | 2011 - 2018 | |
| 56,375 | | | 5.435 | | | | 2007 - 2014 | |
| 14,000 | | | 5.483 | | | | 2012 - 2016 | |
| 621,889 | | | 5.483 | | | | 2012 - 2019 | |
| 6,000 | | | 5.483 | | | | 2012 - 2020 | |
| 209,680 | | | 5.483 | | | | 2013 - 2019 | |
| 51,125 | | | 5.608 | | | | 2012 - 2019 | |
| 875 | | | 5.775 | | | | 2008 - 2015 | |
| 8,700 | | | 5.913 | | | | 2011 - 2018 | |
| 22,750 | | | 5.917 | | | | 2011 - 2018 | |
| 315,025 | | | 6.028 | | | | 2011 - 2018 | |
| 106,450 | | | 6.195 | | | | 2008 - 2015 | |
| 2,459,902 | | | 6.268 | | | | 2014 - 2021 | |
| 89,375 | | | 6.268 | | | | 2014 - 2018 | |
| 340,177 | | | 6.268 | | | | 2015 - 2021 | |
| 2,500 | | | 6.668 | | | | 2009 - 2017 | |
| 18,750 | | | 6.740 | | | | 2009 - 2016 | |
| 196,525 | | | 6.938 | | | | 2009 - 2016 | |
| 7,900 | | | 7.005 | | | | 2010 - 2017 | |
| 14,750 | | | 7.113 | | | | 2013 - 2017 | |
| 1,854,778 | | | 7.113 | | | | 2013 - 2020 | |
| 240,113 | | | 7.113 | | | | 2014 - 2020 | |
| 36,625 | | | 7.478 | | | | 2011 - 2017 | |
| 63,853 | | | 7.543 | | | | 2014 - 2020 | |
| 680,850 | | | 7.718 | | | | 2010 - 2017 | |
| 3,510,014 | | | 8.458 | | | | 2015 - 2022 | |
| | | | | | | | |
Number of ADRs under option | | Exercise price
per ADR ($) | | | Exercise dates | |
| 4,470 | | | 30.800 | | | | 2006 - 2013 | |
| 150,572 | | | 44.560 | | | | 2012 - 2019 | |
| 345,463 | | | 49.230 | | | | 2014 - 2021 | |
| 17,135 | | | 49.880 | | | | 2007 - 2014 | |
| 260,601 | | | 56.560 | | | | 2013 - 2020 | |
| 120,260 | | | 59.500 | | | | 2011 - 2018 | |
| 53,750 | | | 59.520 | | | | 2008 - 2015 | |
| 74,760 | | | 60.690 | | | | 2009 - 2016 | |
| 426,660 | | | 67.490 | | | | 2014 - 2021 | |
| 117,655 | | | 75.760 | | | | 2010 - 2017 | |
26. Authorised and issued share capital (continued)
24/7 Real Media, Inc. 2002 Stock Incentive Plan
As at 31 December 2012, unexercised options over ADRs of 30,640 have been granted under the 24/7 Real Media, Inc. 2002 Stock Incentive Plan as follows:
| | | | | | | | |
Number of ADRs
under option | | Exercise price
per ADR ($) | | | Exercise
dates | |
| 8 | | | 1.3400 | | | | 2007 - 2013 | |
| 184 | | | 15.8800 | | | | 2007 - 2014 | |
| 427 | | | 17.1500 | | | | 2007 - 2014 | |
| 187 | | | 20.0700 | | | | 2007 - 2015 | |
| 79 | | | 23.1800 | | | | 2007 - 2015 | |
| 263 | | | 24.2000 | | | | 2007 - 2014 | |
| 50 | | | 25.1500 | | | | 2007 - 2014 | |
| 7,001 | | | 27.5000 | | | | 2007 - 2015 | |
| 170 | | | 34.6200 | | | | 2007 - 2015 | |
| 89 | | | 38.8700 | | | | 2007 - 2015 | |
| 16,476 | | | 40.6500 | | | | 2007 - 2015 | |
| 110 | | | 41.4700 | | | | 2007 - 2015 | |
| 110 | | | 45.2900 | | | | 2007 - 2016 | |
| 118 | | | 46.0500 | | | | 2007 - 2016 | |
| 115 | | | 49.6000 | | | | 2007 - 2016 | |
| 89 | | | 50.4900 | | | | 2007 - 2016 | |
| 472 | | | 51.3800 | | | | 2008 - 2017 | |
| 78 | | | 52.5900 | | | | 2008 - 2017 | |
| 157 | | | 53.4800 | | | | 2008 - 2017 | |
| 314 | | | 54.1100 | | | | 2007 - 2016 | |
| 944 | | | 54.2400 | | | | 2007 - 2016 | |
| 314 | | | 55.2600 | | | | 2007 - 2016 | |
| 74 | | | 55.6400 | | | | 2007 - 2016 | |
| 157 | | | 56.2700 | | | | 2007 - 2016 | |
| 574 | | | 56.7200 | | | | 2007 - 2016 | |
| 235 | | | 58.9400 | | | | 2007 - 2017 | |
| 393 | | | 60.0200 | | | | 2007 - 2016 | |
| 78 | | | 61.2300 | | | | 2008 - 2017 | |
| 108 | | | 61.9200 | | | | 2007 - 2016 | |
| 314 | | | 62.0500 | | | | 2007 - 2016 | |
| 708 | | | 63.8900 | | | | 2008 - 2017 | |
| 112 | | | 64.2700 | | | | 2007 - 2016 | |
| 54 | | | 64.6500 | | | | 2007 - 2016 | |
| 78 | | | 65.5400 | | | | 2007 - 2016 | |
1999 Worldwide Employee Sharesave Plan
As at 31 December 2012, unexercised options over ordinary shares of 775,351 have been granted under the Taylor Nelson Sofres plc 1999 Worldwide Employee Sharesave Plan as follows:
| | | | | | | | |
Number of ordinary shares
under option | | Exercise price
per share (£) | | | Exercise
dates | |
| 762,925 | | | 1.7300 | | | | 2013 - 2015 | |
| 6,092 | | | 2.6500 | | | | 2012 - 2014 | |
| 6,334 | | | 3.0000 | | | | 2011 - 2013 | |
F-34
Notes to the consolidated financial statements (continued)
26. Authorised and issued share capital (continued)
The aggregate status of the WPP Share Option Plans during 2012 was as follows:
Movements on options granted (represented in ordinary shares)
| | | | | | | | | | | | | | | | | | | | | | | | |
| | | 1 January
2012 | | | Granted | | | Exercised | | | Lapsed | | | Outstanding
31 December
2012 | | | Exercisable
31 December
2012 | |
| WPP | | | 10,276,370 | | | | 3,696 | | | | (7,223,514 | ) | | | (243,248 | ) | | | 2,813,304 | | | | 2,797,161 | |
| WWOP | | | 18,101,132 | | | | 5,763,600 | | | | (2,499,698 | ) | | | (2,545,198 | ) | | | 18,819,836 | | | | 4,873,574 | |
| Grey | | | 27,295 | | | | – | | | | (27,295 | ) | | | – | | | | – | | | | – | |
| 24/7 | | | 218,915 | | | | – | | | | (44,525 | ) | | | (21,190 | ) | | | 153,200 | | | | 105,970 | |
| TNS | | | 1,002,691 | | | | – | | | | (207,260 | ) | | | (20,080 | ) | | | 775,351 | | | | 12,426 | |
| | | | 29,626,403 | | | | 5,767,296 | | | | (10,002,292 | ) | | | (2,829,716 | ) | | | 22,561,691 | | | | 7,789,131 | |
Weighted-average exercise price for options over
| | | | | | | | | | | | | | | | | | | | | | | | |
| | | 1 January
2012 | | | Granted | | | Exercised | | | Lapsed | | | Outstanding
31 December
2012 | | | Exercisable
31 December
2012 | |
| Ordinary shares (£) | | | | | | | | | | | | | | | | | | | | | |
| WPP | | | 5.510 | | | | 8.333 | | | | 5.443 | | | | 6.924 | | | | 5.647 | | | | 5.620 | |
| WWOP | | | 6.463 | | | | 8.458 | | | | 6.010 | | | | 6.621 | | | | 7.163 | | | | 6.465 | |
| TNS | | | 1.755 | | | | – | | | | 1.786 | | | | 1.726 | | | | 1.748 | | | | 2.828 | |
| ADRs ($) | | | | | | | | | | | | | | | | | | | | | | | | |
| WPP | | | 46.836 | | | | – | | | | 38.140 | | | | 48.595 | | | | 50.373 | | | | 50.373 | |
| WWOP | | | 54.569 | | | | 67.490 | | | | 51.418 | | | | 53.995 | | | | 58.581 | | | | 58.498 | |
| Grey | | | 29.983 | | | | – | | | | 29.983 | | | | – | | | | – | | | | – | |
| 24/7 | | | 38.585 | | | | – | | | | 33.185 | | | | 41.622 | | | | 39.735 | | | | 39.327 | |
Options over ordinary shares
Outstanding
| | | | |
Range of exercise prices £ | | Weighted average
exercise price £ | | Weighted average
contractual life
Months |
| 1.730 – 8.458 | | 6.699 | | 88 |
Options over ADRs
Outstanding
| | | | |
Range of exercise prices £ | | Weighted average
exercise price £ | | Weighted average
contractual life
Months |
| 1.340 – 75.940 | | 56.895 | | 78 |
As at 31 December 2012 there was £8.5 million (2011: £7.9 million) of total unrecognised compensation cost related to share options. That cost is expected to be recognised over a weighted average period of 20 months (2011: 17 months).
Share options are satisfied out of newly issued shares.
The weighted average fair value of options granted in the year calculated using the Black-Scholes model was as follows:
| | | | | | | | | | | | |
| | | 2012 | | | 2011 | | | 2010 | |
| Fair value of UK options (shares) | | | 135.3p | | | | 120.6p | | | | 144.5p | |
| Fair value of US options (ADRs) | | $ | 10.90 | | | $ | 9.20 | | | $ | 10.97 | |
| Weighted average assumptions: | | | | | | | | | | | | |
UK Risk-free interest rate | | | 0.56% | | | | 0.84% | | | | 1.76% | |
US Risk-free interest rate | | | 0.51% | | | | 0.67% | | | | 1.05% | |
Expected life (months) | | | 48 | | | | 48 | | | | 48 | |
Expected volatility | | | 27% | | | | 30% | | | | 30% | |
Dividend yield | | | 2.8% | | | | 2.5% | | | | 2.5% | |
26. Authorised and issued share capital (continued)
Options are issued at an exercise price equal to market value on the date of grant.
The weighted average share price of the Group for the year ended 31 December 2012 was £8.17 (2011: £7.11, 2010: £6.78) and the weighted average ADR price for the same period was $64.90 (2011: $57.09, 2010: $52.51).
Expected volatility is sourced from external market data and represents the historic volatility in the Group’s share price over a period equivalent to the expected option life.
Expected life is based on a review of historic exercise behaviour in the context of the contractual terms of the options, as described in more detail below.
Terms of share option plans
The Worldwide Share Ownership Program is open for participation to employees with at least two years’ employment in the Group. It is not available to those participating in other share-based incentive programs or to executive directors. The vesting period for each grant is three years and there are no performance conditions other than continued employment with the Group.
The Executive Stock Option Plan has historically been open for participation to WPP Group Leaders, Partners and High Potential Group. It is not currently offered to parent company executive directors. The vesting period is three years and performance conditions include achievement of various TSR (Total Share Owner Return) and EPS (Earnings Per Share) objectives, as well as continued employment. In 2005, the Group moved away from the issuance of stock options for Leaders, Partners and High Potential Group and has since largely made grants of restricted stock instead (note 22).
The Group grants stock options with a life of 10 years, including the vesting period. The terms of stock options with performance conditions are such that if, after nine years and eight months, the performance conditions have not been met, then the stock option will vest automatically.
F-35
Notes to the consolidated financial statements (continued)
27. Other reserves
Other reserves comprise the following:
| | | | | | | | | | | | | | | | | | | | |
| | | Capital
redemption
reserve £m | | | Equity
reserve
£m | | | Revaluation
reserve £m | | | Translation
reserve £m | | | Total
other
reserves
£m | |
| 1 January 2010 | | | – | | | | (84.6 | ) | | | 73.8 | | | | 1,103.9 | | | | 1,093.1 | |
| Exchange adjustments on foreign currency net investments | | | – | | | | – | | | | – | | | | 146.6 | | | | 146.6 | |
| Loss on revaluation of available for sale investments | | | – | | | | – | | | | (59.8 | ) | | | – | | | | (59.8 | ) |
| Recognition and remeasurement of financial instruments | | | – | | | | 2.9 | | | | – | | | | – | | | | 2.9 | |
| 31 December 2010 | | | – | | | | (81.7 | ) | | | 14.0 | | | | 1,250.5 | | | | 1,182.8 | |
| Exchange adjustments on foreign currency net investments | | | – | | | | – | | | | – | | | | (250.0 | ) | | | (250.0 | ) |
| Gain on revaluation of available for sale investments | | | – | | | | – | | | | 11.3 | | | | – | | | | 11.3 | |
| Recognition and remeasurement of financial instruments | | | – | | | | (5.9 | ) | | | – | | | | – | | | | (5.9 | ) |
| Share cancellations | | | 0.7 | | | | – | | | | – | | | | – | | | | 0.7 | |
| 31 December 2011 | | | 0.7 | | | | (87.6 | ) | | | 25.3 | | | | 1,000.5 | | | | 938.9 | |
| Exchange adjustments on foreign currency net investments | | | – | | | | – | | | | – | | | | (298.4 | ) | | | (298.4 | ) |
| Gain on revaluation of available for sale investments | | | – | | | | – | | | | (3.5 | ) | | | – | | | | (3.5 | ) |
| Recognition and remeasurement of financial instruments | | | – | | | | 2.7 | | | | – | | | | – | | | | 2.7 | |
| Share cancellations | | | 0.7 | | | | – | | | | – | | | | – | | | | 0.7 | |
| Treasury share cancellations | | | 0.6 | | | | – | | | | – | | | | – | | | | 0.6 | |
| Share purchases – close period commitments | | | – | | | | (18.3 | ) | | | – | | | | – | | | | (18.3 | ) |
| 31 December 2012 | | | 2.0 | | | | (103.2 | ) | | | 21.8 | | | | 702.1 | | | | 622.7 | |
28. Acquisitions
The Group accounts for acquisitions in accordance with IFRS 3 Business Combinations. IFRS 3 requires the acquiree’s identifiable assets, liabilities and contingent liabilities (other than non-current assets or disposal groups held for sale) to be recognised at fair value at acquisition date. In assessing fair value at acquisition date, management make their best estimate of the likely outcome where the fair value of an asset or liability may be contingent on a future event. In certain instances, the underlying transaction giving rise to an estimate may not be resolved until some years after the acquisition date. IFRS 3 requires the release to profit of any acquisition reserves which subsequently become excess in the same way as any excess costs over those provided at acquisition date are charged to profit. At each period end management assess provisions and other balances established in respect of acquisitions for their continued probability of occurrence and amend the relevant value accordingly through the consolidated income statement or as an adjustment to goodwill as appropriate under IFRS 3.
28. Acquisitions (continued)
Acquisitions in 2012
The Group acquired a number of subsidiaries in the year. The following table sets out the book values of the identifiable assets and liabilities acquired and their fair value to the Group. The fair value adjustments for certain acquisitions have been determined provisionally at the balance sheet date.
| | | | | | | | | | | | |
| | | Book
value at
acquisition
£m | | | Fair value
adjustments
£m | | | Fair
value
to
Group
£m | |
| Intangible assets | | | 1.3 | | | | 185.2 | | | | 186.5 | |
| Property, plant and equipment | | | 8.5 | | | | – | | | | 8.5 | |
| Cash (net of overdrafts) | | | 48.1 | | | | – | | | | 48.1 | |
| Trade receivables due within one year | | | 66.9 | | | | (1.9 | ) | | | 65.0 | |
| Other current assets | | | 36.8 | | | | – | | | | 36.8 | |
| Total assets | | | 161.6 | | | | 183.3 | | | | 344.9 | |
| Current liabilities | | | (91.3 | ) | | | – | | | | (91.3 | ) |
| Trade and other payables due after one year | | | (3.3 | ) | | | (20.2 | ) | | | (23.5 | ) |
| Deferred tax liabilities | | | (1.9 | ) | | | (59.4 | ) | | | (61.3 | ) |
| Provisions | | | (0.9 | ) | | | (11.2 | ) | | | (12.1 | ) |
| Bank loans | | | (20.0 | ) | | | – | | | | (20.0 | ) |
| Total liabilities | | | (117.4 | ) | | | (90.8 | ) | | | (208.2 | ) |
| Net assets | | | 44.2 | | | | 92.5 | | | | 136.7 | |
| Non-controlling interests | | | | | | | | | | | (10.2 | ) |
| Fair value of equity stake in associate undertakings before acquisition of controlling interest | | | | | | | | | | | (10.3 | ) |
| Goodwill | | | | | | | | | | | 385.3 | |
| Consideration | | | | | | | | | | | 501.5 | |
| Consideration satisfied by: | | | | | | | | | | | | |
| Cash | | | | | | | | | | | 454.4 | |
| Payments due to vendors | | | | | | | | | | | 47.1 | |
Goodwill arising from acquisitions represents the value of synergies with our existing portfolio of businesses and to deliver services to our clients. Goodwill that is expected to be deductible for tax purposes is £34.3 million.
Non-controlling interests in acquired companies are measured at the non-controlling interests’ proportionate share of the acquiree’s identifiable net assets.
The contribution to revenue and operating profit of acquisitions completed in the year was not material. There were no material acquisitions completed between 31 December 2012 and the date the financial statements have been authorised for issue.
F-36
Notes to the consolidated financial statements (continued)
28. Acquisitions (continued)
Acquisitions in 2011
The Group acquired a number of subsidiaries in the year. The following table sets out the book values of the identifiable assets and liabilities acquired and their fair value to the Group. The fair value adjustments for certain acquisitions have been determined provisionally at the balance sheet date.
| | | | | | | | | | | | |
| | | Book
value at
acquisition
£m | | | Fair value
adjustments
£m | | | Fair
value
to
Group
£m | |
| Intangible assets | | | 2.0 | | | | 117.6 | | | | 119.6 | |
| Property, plant and equipment | | | 14.4 | | | | (0.4 | ) | | | 14.0 | |
| Cash (net of overdrafts) | | | 98.8 | | | | – | | | | 98.8 | |
| Trade receivables due within one year | | | 211.3 | | | | (1.3 | ) | | | 210.0 | |
| Other current assets | | | 16.8 | | | | 1.3 | | | | 18.1 | |
| Total assets | | | 343.3 | | | | 117.2 | | | | 460.5 | |
| Current liabilities | | | (283.1 | ) | | | – | | | | (283.1 | ) |
| Trade and other payables due after one year | | | (5.7 | ) | | | (27.4 | ) | | | (33.1 | ) |
| Deferred tax liabilities | | | – | | | | (37.2 | ) | | | (37.2 | ) |
| Provisions | | | (3.7 | ) | | | (16.1 | ) | | | (19.8 | ) |
| Bank loans | | | (17.5 | ) | | | – | | | | (17.5 | ) |
| Total liabilities | | | (310.0 | ) | | | (80.7 | ) | | | (390.7 | ) |
| Net assets | | | 33.3 | | | | 36.5 | | | | 69.8 | |
| Non-controlling interests | | | | | | | | | | | (20.7 | ) |
| Fair value of equity stake in associate undertakings before acquisition of controlling interest | | | | | | | | | | | (72.6 | ) |
| Goodwill | | | | | | | | | | | 454.5 | |
| Consideration | | | | | | | | | | | 431.0 | |
| Consideration satisfied by: | | | | | | | | | | | | |
| Cash | | | | | | | | | | | 350.6 | |
| Payments due to vendors (note 19) | | | | | | | | | | | 80.4 | |
Goodwill arising from acquisitions represents the value of synergies with our existing portfolio of businesses and skilled staff to deliver services to our clients. Goodwill that is expected to be deductible for tax purposes is £126.0 million.
Non-controlling interests in acquired companies are measured at the non-controlling interest’s proportionate share of the acquirees’ identifiable net assets.
The contribution to revenue and operating profit of acquisitions completed in the year was not material.
28. Acquisitions (continued)
Acquisitions in 2010
The Group acquired a number of subsidiaries in the year. The following table sets out the book values of the identifiable assets and liabilities acquired and their fair value to the Group. The fair value adjustments for certain acquisitions have been determined provisionally at the balance sheet date.
| | | | | | | | | | | | |
| | | Book
value at
acquisition
£m | | | Fair value
adjustments
£m | | | Fair
value
to
Group
£m | |
| Intangible assets | | | 0.7 | | | | 25.5 | | | | 26.2 | |
| Property, plant and equipment | | | 9.1 | | | | – | | | | 9.1 | |
| Cash | | | 57.0 | | | | – | | | | 57.0 | |
| Trade receivables due within one year | | | 161.7 | | | | – | | | | 161.7 | |
| Other current assets | | | 56.2 | | | | – | | | | 56.2 | |
| Total assets | | | 284.7 | | | | 25.5 | | | | 310.2 | |
| Current liabilities | | | (259.1 | ) | | | – | | | | (259.1 | ) |
| Trade and other payables due after one year | | | (1.1 | ) | | | (3.4 | ) | | | (4.5 | ) |
| Deferred tax liabilities | | | (0.1 | ) | | | (9.3 | ) | | | (9.4 | ) |
| Provisions | | | (0.5 | ) | | | (0.7 | ) | | | (1.2 | ) |
| Total liabilities | | | (260.8 | ) | | | (13.4 | ) | | | (274.2 | ) |
| Net assets | | | 23.9 | | | | 12.1 | | | | 36.0 | |
| Non-controlling interests | | | | | | | | | | | (0.5 | ) |
| Fair value of equity stake in associate undertakings before acquisition of controlling interest | | | | | | | | | | | (32.6 | ) |
| Goodwill | | | | | | | | | | | 161.1 | |
| Consideration | | | | | | | | | | | 164.0 | |
| Consideration satisfied by: | | | | | | | | | | | | |
| Cash | | | | | | | | | | | 131.2 | |
| Payments due to vendors (note 19) | | | | | | | | | | | 32.8 | |
Goodwill arising from acquisitions represents the value of synergies with our existing portfolio of businesses and skilled staff to deliver services to our clients. Goodwill expected to be deductible for tax purposes is £14.3 million.
The contribution to revenue and operating profit of acquisitions completed in the year was not material.
29. Principal subsidiary undertakings
The principal subsidiary undertakings of the Group are:
| | |
| | | Country of incorporation |
| Grey Global Group, Inc | | US |
| J. Walter Thompson Company, Inc | | US |
| GroupM Worldwide, Inc | | US |
| The Ogilvy Group, Inc | | US |
| Young & Rubicam, Inc | | US |
| TNS Group Holdings Ltd | | UK |
All of these subsidiaries are operating companies and are 100% owned by the Group.
30. Related party transactions
From time to time the Group enters into transactions with its associate undertakings. These transactions were not material for any of the years presented.
F-37
Notes to the consolidated financial statements (continued)
31. Reconciliation to non-GAAP measures of performance
Reconciliation of profit before interest and taxation to headline PBIT:
| | | | | | | | | | | | |
| | | 2012 £m | | | 2011 £m | | | 2010 £m | |
| Profit before interest and taxation | | | 1,310.5 | | | | 1,258.3 | | | | 1,028.2 | |
| Amortisation and impairment of acquired intangible assets | | | 171.9 | | | | 172.0 | | | | 170.5 | |
| Goodwill impairment | | | 32.0 | | | | – | | | | 10.0 | |
| Gains on disposal of investments | | (26.8) | | | (0.4) | | | (4.1) | |
| Gains on remeasurement of equity on acquisition of controlling interest | | | (5.3 | ) | | | (31.6 | ) | | | (13.7 | ) |
| Investment write-downs | | | 19.6 | | | | 32.8 | | | | 37.5 | |
| Cost of changes to corporate structure | | | 4.1 | | | | – | | | | – | |
| Gain on sale of freehold property in New York | | | (71.4 | ) | | | – | | | | – | |
| Restructuring costs | | | 93.4 | | | | – | | | | – | |
| Share of exceptional losses/(gains) of associates | | | 3.0 | | | | (2.1 | ) | | | 0.3 | |
| Headline PBIT | | | 1,531.0 | | | | 1,429.0 | | | | 1,228.7 | |
| Headline PBIT margin (as a percent of revenue) | | | 14.8 | % | | | 14.3 | % | | | 13.2 | % |
32. Condensed consolidating financial information
In September 2012, WPP Finance 2010 issued $500 million of 3.625% bonds due September 2022 and $300 million of 5.125% bonds due September 2042, with WPP plc as parent guarantor and WPP Air 1 Limited, WPP 2008 Limited, and WPP 2005 Limited as subsidiary guarantors.
In November 2011, WPP Finance 2010 issued $812 million of 4.75% bonds due November 2021, with WPP plc as parent guarantor and WPP Air 1 Limited, WPP 2008 Limited, and WPP 2005 Limited as subsidiary guarantors. $312 million of these bonds were issued in exchange for $281 million of the 5.875% bonds due June 2014 which were issued by WPP Finance (UK). Consequently, the amount in issue of the 5.875% bonds due June 2014 has reduced to $369 million from the previous $650 million.
WPP Finance (UK) is the issuer of $369 million of 5.875% bonds due June 2014, with WPP plc as parent guarantor and WPP Air 1 Limited, WPP 2008 Limited, WPP 2005 Limited, and Young & Rubicam Brands US Holdings as subsidiary guarantors, previously registered under the Securities Act of 1933. A Form 15 giving notice of termination of registration was filed with the SEC in relation to this security on 2 August 2006. In June 2009, WPP Finance (UK) issued $600 million of 8% bonds due September 2014, with WPP plc as parent guarantor and WPP Air 1 Limited, WPP 2008 Limited and WPP 2005 Limited as subsidiary guarantors.
The issuer and guarantors of the bonds (issuers and subsidiary guarantors are 100% owned by WPP plc) are each subject to the reporting requirements under section 15(d) of the Securities Exchange Act of 1934. In accordance with SEC Rule 3-10, condensed consolidating financial information containing financial information for WPP Finance (UK), WPP Finance 2010 and the guarantors is presented beginning on page F-39. Condensed consolidating financial information is prepared in accordance with IFRS as issued by the IASB, except to the extent that, in the parent company, subsidiary issuer and subsidiary guarantors columns investments in subsidiaries are accounted for under the equity method of accounting. Under the equity method, earnings of subsidiaries are reflected as “share of results of subsidiaries” in the income statement and as “investment in subsidiaries” in the balance sheet, as required by the SEC.
Although the $600 million, $812 million, $500 million and $300 million bonds do not have the identical subsidiary guarantor structure to the $369 million bonds, the exclusion of the financial information of Young & Rubicam Brands US Holdings has no financial impact on the columns presented in the condensed consolidating financial information for the years ended 31 December 2012, 2011 and 2010, as it is an indirect wholly owned subsidiary of WPP Air 1 Limited with no operations or cash flows of its own and its sole assets are its interests in certain operating subsidiaries.
In the event that WPP Finance (UK) and WPP Finance 2010 fail to pay the holders of the securities, thereby requiring WPP plc, WPP 2008 Limited, WPP 2005 Limited, Young & Rubicam Brands US Holdings or WPP Air 1 Limited to make payment pursuant to the terms of its full and unconditional, and joint and several guarantee of those securities, there is no impediment to WPP plc, WPP 2008 Limited, WPP 2005 Limited, Young & Rubicam Brands US Holdings or WPP Air 1 Limited in obtaining reimbursement for any such payments from WPP Finance (UK) and WPP Finance 2010.
The condensed consolidating financial information has been presented using the guarantor structure as of 31 December 2012.
On 2 January 2013, under the scheme of arrangement discussed on page 7, WPP plc completed a reorganization of its corporate structure (“the reorganization”) and WPP 2012 plc (now known as WPP plc) became the new parent company of the Group.
The former WPP plc was renamed WPP 2012 Limited and became a wholly owned subsidiary of WPP plc. Following the reorganization, the bonds are guaranteed by WPP plc as parent guarantor and WPP Air 1 Limited, WPP 2008 Limited, WPP 2005 Limited, WPP 2012 Limited, another company formed as part of the reorganization, WPP Jubilee Limited, and Young & Rubicam Brands US Holdings (only for the $369 million bond) as subsidiary guarantors.
F-38
32. Condensed consolidating financial information (continued)
Condensed consolidating income statement information
For the year ended 31 December 2012, £m
| | | | | | | | | | | | | | | | | | | | | | | | | | | | |
| | | WPP plc | | | Subsidiary Guarantors1 | | | WPP
Finance
(UK) | | | WPP
Finance
2010 | | | Other
Subsidiaries | | | Reclassifications /
Eliminations | | | Consolidated
WPP plc | |
Revenue | | | — | | | | — | | | | — | | | | — | | | | 10,373.1 | | | | — | | | | 10,373.1 | |
Direct costs | | | — | | | | — | | | | — | | | | — | | | | (858.3 | ) | | | — | | | | (858.3 | ) |
Gross profit | | | — | | | | — | | | | — | | | | — | | | | 9,514.8 | | | | — | | | | 9,514.8 | |
Operating costs | | | (5.7 | ) | | | (79.5 | ) | | | (0.1 | ) | | | — | | | | (8,188.4 | ) | | | — | | | | (8,273.7 | ) |
Operating profit/(loss) | | | (5.7 | ) | | | (79.5 | ) | | | (0.1 | ) | | | — | | | | 1,326.4 | | | | — | | | | 1,241.1 | |
Share of results of subsidiaries | | | 877.7 | | | | 1,135.5 | | | | (1.7 | ) | | | — | | | | — | | | | (2,011.5 | ) | | | — | |
Share of results of associates | | | — | | | | — | | | | — | | | | — | | | | 69.4 | | | | — | | | | 69.4 | |
Profit/(loss) before interest and taxation | | | 872.0 | | | | 1,056.0 | | | | (1.8 | ) | | | — | | | | 1,395.8 | | | | (2,011.5 | ) | | | 1,310.5 | |
Finance income | | | — | | | | 63.6 | | | | 41.4 | | | | 30.2 | | | | (49.3 | ) | | | — | | | | 85.9 | |
Finance costs | | | (49.3 | ) | | | (244.0 | ) | | | (54.8 | ) | | | (31.9 | ) | | | 80.2 | | | | — | | | | (299.8 | ) |
Revaluation of financial instruments | | | — | | | | (0.5 | ) | | | — | | | | — | | | | (4.2 | ) | | | — | | | | (4.7 | ) |
Profit/(loss) before taxation | | | 822.7 | | | | 875.1 | | | | (15.2 | ) | | | (1.7 | ) | | | 1,422.5 | | | | (2,011.5 | ) | | | 1,091.9 | |
Taxation | | | — | | | | 2.6 | | | | — | | | | — | | | | (199.8 | ) | | | — | | | | (197.2 | ) |
Profit/(loss) for the year | | | 822.7 | | | | 877.7 | | | | (15.2 | ) | | | (1.7 | ) | | | 1,222.7 | | | | (2,011.5 | ) | | | 894.7 | |
Attributable to: | | | | | | | | | | | | | | | | | | | | | | | | | | | | |
Equity holders of the parent | | | 822.7 | | | | 877.7 | | | | (15.2 | ) | | | (1.7 | ) | | | 1,150.7 | | | | (2,011.5 | ) | | | 822.7 | |
Non-controlling interests | | | — | | | | — | | | | — | | | | — | | | | 72.0 | | | | — | | | | 72.0 | |
| | | | 822.7 | | | | 877.7 | | | | (15.2 | ) | | | (1.7 | ) | | | 1,222.7 | | | | (2,011.5 | ) | | | 894.7 | |
For the year ended 31 December 2011, £m
| | | | | | | | | | | | | | | | | | | | | | | | | | | | |
| | | WPP plc | | | Subsidiary Guarantors1 | | | WPP
Finance
(UK) | | | WPP
Finance
2010 | | | Other
Subsidiaries | | | Reclassifications /
Eliminations | | | Consolidated
WPP plc | |
Revenue | | | — | | | | — | | | | — | | | | — | | | | 10,021.8 | | | | — | | | | 10,021.8 | |
Direct costs | | | — | | | | — | | | | — | | | | — | | | | (783.3 | ) | | | — | | | | (783.3 | ) |
Gross profit | | | — | | | | — | | | | — | | | | — | | | | 9,238.5 | | | | — | | | | 9,238.5 | |
Operating costs | | | (5.5 | ) | | | (62.5 | ) | | | — | | | | — | | | | (7,978.3 | ) | | | — | | | | (8,046.3 | ) |
Operating profit/(loss) | | | (5.5 | ) | | | (62.5 | ) | | | — | | | | — | | | | 1,260.2 | | | | — | | | | 1,192.2 | |
Share of results of subsidiaries | | | 886.4 | | | | 1,148.8 | | | | (1.9 | ) | | | — | | | | — | | | | (2,033.3 | ) | | | — | |
Share of results of associates | | | — | | | | — | | | | — | | | | — | | | | 66.1 | | | | — | | | | 66.1 | |
Profit/(loss) before interest and taxation | | | 880.9 | | | | 1,086.3 | | | | (1.9 | ) | | | — | | | | 1,326.3 | | | | (2,033.3 | ) | | | 1,258.3 | |
Finance income | | | — | | | | 60.8 | | | | 3.9 | | | | 0.8 | | | | 31.8 | | | | — | | | | 97.3 | |
Finance costs | | | (40.8 | ) | | | (268.5 | ) | | | (75.0 | ) | | | (2.7 | ) | | | 89.8 | | | | — | | | | (297.2 | ) |
Revaluation of financial instruments | | | — | | | | 4.7 | | | | — | | | | — | | | | (54.7 | ) | | | — | | | | (50.0 | ) |
Profit/(loss) before taxation | | | 840.1 | | | | 883.3 | | | | (73.0 | ) | | | (1.9 | ) | | | 1,393.2 | | | | (2,033.3 | ) | | | 1,008.4 | |
Taxation | | | — | | | | 3.1 | | | | — | | | | — | | | | (95.0 | ) | | | — | | | | (91.9 | ) |
Profit/(loss) for the year | | | 840.1 | | | | 886.4 | | | | (73.0 | ) | | | (1.9 | ) | | | 1,298.2 | | | | (2,033.3 | ) | | | 916.5 | |
Attributable to: | | | | | | | | | | | | | | | | | | | | | | | | | | | | |
Equity holders of the parent | | | 840.1 | | | | 886.4 | | | | (73.0 | ) | | | (1.9 | ) | | | 1,221.8 | | | | (2,033.3 | ) | | | 840.1 | |
Non-controlling interests | | | — | | | | — | | | | — | | | | — | | | | 76.4 | | | | — | | | | 76.4 | |
| | | | 840.1 | | | | 886.4 | | | | (73.0 | ) | | | (1.9 | ) | | | 1,298.2 | | | | (2,033.3 | ) | | | 916.5 | |
Note
| 1 | | Includes: WPP Air 1 Limited, WPP 2008 Limited, WPP 2005 Limited and Young & Rubicam Brands US Holdings. |
F-39
32. Condensed consolidating financial information (continued)
Condensed consolidating income statement information (continued)
For the year ended 31 December 2010, £m
| | | | | | | | | | | | | | | | | | | | | | | | | | | | |
| | | WPP plc | | | Subsidiary Guarantors1 | | | WPP
Finance
(UK) | | | WPP
Finance 2010 | | | Other
Subsidiaries | | | Reclassifications /
Eliminations | | | Consolidated
WPP plc | |
Revenue | | | — | | | | — | | | | — | | | | — | | | | 9,331.0 | | | | — | | | | 9,331.0 | |
Direct costs | | | — | | | | — | | | | — | | | | — | | | | (770.5 | ) | | | — | | | | (770.5 | ) |
Gross profit | | | — | | | | — | | | | — | | | | — | | | | 8,560.5 | | | | — | | | | 8,560.5 | |
Operating costs | | | (3.1 | ) | | | 19.4 | | | | (0.1 | ) | | | — | | | | (7,603.7 | ) | | | — | | | | (7,587.5 | ) |
Operating profit/(loss) | | | (3.1 | ) | | | 19.4 | | | | (0.1 | ) | | | — | | | | 956.8 | | | | — | | | | 973.0 | |
Share of results of subsidiaries | | | 626.8 | | | | 734.7 | | | | — | | | | — | | | | — | | | | (1,361.5 | ) | | | — | |
Share of results of associates | | | — | | | | — | | | | — | | | | — | | | | 55.2 | | | | — | | | | 55.2 | |
Profit/(loss) before interest and taxation | | | 623.7 | | | | 754.1 | | | | (0.1 | ) | | | — | | | | 1,012.0 | | | | (1,361.5 | ) | | | 1,028.2 | |
Finance income | | | — | | | | 94.6 | | | | 18.3 | | | | — | | | | (31.2 | ) | | | — | | | | 81.7 | |
Finance costs | | | (37.7 | ) | | | (224.5 | ) | | | (57.6 | ) | | | — | | | | 43.0 | | | | — | | | | (276.8 | ) |
Revaluation of financial instruments | | | — | | | | 0.7 | | | | — | | | | — | | | | 17.5 | | | | — | | | | 18.2 | |
Profit/(loss) before taxation | | | 586.0 | | | | 624.9 | | | | (39.4 | ) | | | — | | | | 1,041.3 | | | | (1,361.5 | ) | | | 851.3 | |
Taxation | | | — | | | | 1.9 | | | | — | | | | — | | | | (192.2 | ) | | | — | | | | (190.3 | ) |
Profit/(loss) for the year | | | 586.0 | | | | 626.8 | | | | (39.4 | ) | | | — | | | | 849.1 | | | | (1,361.5 | ) | | | 661.0 | |
Attributable to: | | | | | | | | | | | | | | | | | | | | | | | | | | | | |
Equity holders of the parent | | | 586.0 | | | | 626.8 | | | | (39.4 | ) | | | — | | | | 774.1 | | | | (1,361.5 | ) | | | 586.0 | |
Non-controlling interests | | | — | | | | — | | | | — | | | | — | | | | 75.0 | | | | — | | | | 75.0 | |
| | | | 586.0 | | | | 626.8 | | | | (39.4 | ) | | | — | | | | 849.1 | | | | (1,361.5 | ) | | | 661.0 | |
Note
| 1 | | Includes: WPP Air 1 Limited, WPP 2008 Limited, WPP 2005 Limited and Young & Rubicam Brands US Holdings. |
F-40
32. Condensed consolidating financial information (continued)
Condensed consolidating statement of comprehensive income
For the year ended 31 December 2012, £m
| | | | | | | | | | | | | | | | | | | | | | | | | | | | |
| | | WPP plc | | | Subsidiary Guarantors1 | | | WPP
Finance
(UK) | | | WPP Finance 2010 | | | Other
Subsidiaries | | | Reclassifications /
Eliminations | | | Consolidated
WPP plc | |
Profit/(loss) for the year | | | 822.7 | | | | 877.7 | | | | (15.2 | ) | | | (1.7 | ) | | | 1,222.7 | | | | (2,011.5 | ) | | | 894.7 | |
| Exchange adjustments on foreign currency net investments | | | (298.4 | ) | | | (298.4 | ) | | | 6.6 | | | | 0.1 | | | | (330.7 | ) | | | 615.6 | | | | (305.2 | ) |
| Loss on revaluation of available for sale investments | | | (3.5 | ) | | | (3.5 | ) | | | — | | | | — | | | | (3.5 | ) | | | 7.0 | | | | (3.5 | ) |
Actuarial loss on defined benefit pension plans | | | (83.9 | ) | | | (83.9 | ) | | | — | | | | — | | | | (83.9 | ) | | | 167.8 | | | | (83.9 | ) |
| Deferred tax on defined benefit pension plans | | | 7.3 | | | | 7.3 | | | | — | | | | — | | | | 7.3 | | | | (14.6 | ) | | | 7.3 | |
Other comprehensive (loss)/income relating to the year | | | (378.5 | ) | | | (378.5 | ) | | | 6.6 | | | | 0.1 | | | | (410.8 | ) | | | 775.8 | | | | (385.3 | ) |
Total comprehensive income/(loss) relating to the year | | | 444.2 | | | | 499.2 | | | | (8.6 | ) | | | (1.6 | ) | | | 811.9 | | | | (1,235.7 | ) | | | 509.4 | |
| Attributable to: | | | | | | | | | | | | | | | | | | | | | | | | | | | | |
| Equity holders of the parent | | | 444.2 | | | | 499.2 | | | | (8.6 | ) | | | (1.6 | ) | | | 746.7 | | | | (1,235.7 | ) | | | 444.2 | |
| Non-controlling interests | | | — | | | | — | | | | — | | | | — | | | | 65.2 | | | | — | | | | 65.2 | |
| | | | 444.2 | | | | 499.2 | | | | (8.6 | ) | | | (1.6 | ) | | | 811.9 | | | | (1,235.7 | ) | | | 509.4 | |
For the year ended 31 December 2011, £m
| | | | | | | | | | | | | | | | | | | | | | | | | | | | |
| | | WPP plc | | | Subsidiary Guarantors1 | | | WPP
Finance
(UK) | | | WPP Finance 2010 | | | Other
Subsidiaries | | | Reclassifications /
Eliminations | | | Consolidated
WPP plc | |
| Profit/(loss) for the year | | | 840.1 | | | | 886.4 | | | | (73.0 | ) | | | (1.9 | ) | | | 1,298.2 | | | | (2,033.3 | ) | | | 916.5 | |
| Exchange adjustments on foreign currency net investments | | | (250.0 | ) | | | (250.0 | ) | | | (3.0 | ) | | | (0.1 | ) | | | (248.1 | ) | | | 494.9 | | | | (256.3 | ) |
| Gain on revaluation of available for sale investments | | | 11.3 | | | | 11.3 | | | | — | | | | — | | | | 11.3 | | | | (22.6 | ) | | | 11.3 | |
Actuarial loss on defined benefit pension plans | | | (72.0 | ) | | | (72.0 | ) | | | — | | | | — | | | | (72.0 | ) | | | 144.0 | | | | (72.0 | ) |
| Deferred tax on defined benefit pension plans | | | 0.1 | | | | 0.1 | | | | — | | | | — | | | | 0.1 | | | | (0.2 | ) | | | 0.1 | |
Other comprehensive loss relating to the year | | | (310.6 | ) | | | (310.6 | ) | | | (3.0 | ) | | | (0.1 | ) | | | (308.7 | ) | | | 616.1 | | | | (316.9 | ) |
Total comprehensive income/(loss) relating to the year | | | 529.5 | | | | 575.8 | | | | (76.0 | ) | | | (2.0 | ) | | | 989.5 | | | | (1,417.2 | ) | | | 599.6 | |
| Attributable to: | | | | | | | | | | | | | | | | | | | | | | | | | | | | |
| Equity holders of the parent | | | 529.5 | | | | 575.8 | | | | (76.0 | ) | | | (2.0 | ) | | | 919.4 | | | | (1,417.2 | ) | | | 529.5 | |
| Non-controlling interests | | | — | | | | — | | | | — | | | | — | | | | 70.1 | | | | — | | | | 70.1 | |
| | | | 529.5 | | | | 575.8 | | | | (76.0 | ) | | | (2.0 | ) | | | 989.5 | | | | (1,417.2 | ) | | | 599.6 | |
For the year ended 31 December 2010, £m
| | | | | | | | | | | | | | | | | | | | | | | | | | | | |
| | | WPP plc | | | Subsidiary Guarantors1 | | | WPP
Finance
(UK) | | | WPP Finance 2010 | | | Other
Subsidiaries | | | Reclassifications /
Eliminations | | | Consolidated
WPP plc | |
Profit/(loss) for the year | | | 586.0 | | | | 626.8 | | | | (39.4 | ) | | | — | | | | 849.1 | | | | (1,361.5 | ) | | | 661.0 | |
Exchange adjustments on foreign currency net investments | | | 146.6 | | | | 146.6 | | | | (1.2 | ) | | | — | | | | 183.6 | | | | (319.3 | ) | | | 156.3 | |
Loss on revaluation of available for sale investments | | | (59.8 | ) | | | (59.8 | ) | | | — | | | | — | | | | (59.8 | ) | | | 119.6 | | | | (59.8 | ) |
Actuarial loss on defined benefit pension plans | | | (0.4 | ) | | | (0.4 | ) | | | — | | | | — | | | | (0.4 | ) | | | 0.8 | | | | (0.4 | ) |
Deferred tax on defined benefit pension plans | | | 0.2 | | | | 0.2 | | | | — | | | | — | | | | 0.2 | | | | (0.4 | ) | | | 0.2 | |
Other comprehensive income/(loss) relating to the period | | | 86.6 | | | | 86.6 | | | | (1.2 | ) | | | — | | | | 123.6 | | | | (199.3 | ) | | | 96.3 | |
Total comprehensive income/(loss) relating to the period | | | 672.6 | | | | 713.4 | | | | (40.6 | ) | | | — | | | | 972.7 | | | | (1,560.8 | ) | | | 757.3 | |
Attributable to: | | | | | | | | | | | | | | | | | | | | | | | | | | | | |
Equity holders of the parent | | | 672.6 | | | | 713.4 | | | | (40.6 | ) | | | — | | | | 888.0 | | | | (1,560.8 | ) | | | 672.6 | |
Non-controlling interests | | | — | | | | — | | | | — | | | | — | | | | 84.7 | | | | — | | | | 84.7 | |
| | | | 672.6 | | | | 713.4 | | | | (40.6 | ) | | | — | | | | 972.7 | | | | (1,560.8 | ) | | | 757.3 | |
Note
| 1Includes: | | WPP Air 1 Limited, WPP 2008 Limited, WPP 2005 Limited and Young & Rubicam Brands US Holdings |
F-41
32. Condensed consolidating financial information (continued)
Condensed consolidating cash flow statement information
For the year ended 31 December 2012, £m
| | | | | | | | | | | | | | | | | | | | | | | | | | | | |
| | | WPP
plc | | | Subsidiary
Guarantors1 | | | WPP Finance (UK) | | | WPP
Finance
2010 | | | Other
Subsidiaries | | | Reclassifications /
Eliminations | | | Consolidated WPP plc | |
| Net cash inflow/(outflow) from operating activities | | | (43.9 | ) | | | 1,579.4 | | | | (652.6 | ) | | | (489.7 | ) | | | 515.1 | | | | — | | | | 908.3 | |
| Investing activities | | | | | | | | | | | | | | | | | | | | | | | | | | | | |
| Acquisitions and disposals | | | — | | | | — | | | | — | | | | — | | | | (566.5 | ) | | | — | | | | (566.5 | ) |
| Purchases of property, plant and equipment | | | — | | | | (5.5 | ) | | | — | | | | — | | | | (284.8 | ) | | | — | | | | (290.3 | ) |
Purchases of other intangible assets (including capitalised computer software) | | | — | | | | — | | | | — | | | | — | | | | (39.8 | ) | | | — | | | | (39.8 | ) |
| Proceeds on disposal of property, plant and equipment | | | — | | | | — | | | | — | | | | — | | | | 123.5 | | | | — | | | | 123.5 | |
| Net cash outflow from investing activities | | | — | | | | (5.5 | ) | | | — | | | | — | | | | (767.6 | ) | | | — | | | | (773.1 | ) |
| Financing activities | | | | | | | | | | | | | | | | | | | | | | | | | | | | |
| Share option proceeds | | | 56.0 | | | | — | | | | — | | | | — | | | | — | | | | — | | | | 56.0 | |
| Cash consideration for non-controlling interests | | | — | | | | — | | | | — | | | | — | | | | (20.1 | ) | | | — | | | | (20.1 | ) |
| Share repurchases and buy-backs | | | (55.7 | ) | | | — | | | | — | | | | — | | | | (78.8 | ) | | | — | | | | (134.5 | ) |
| Net increase/(decrease) in borrowings | | | — | | | | — | | | | — | | | | 499.4 | | | | (118.9 | ) | | | — | | | | 380.5 | |
| Financing and share issue costs | | | (0.2 | ) | | | — | | | | — | | | | (7.9 | ) | | | (0.1 | ) | | | — | | | | (8.2 | ) |
| Capital contribution (paid)/received | | | (287.7 | ) | | | — | | | | — | | | | — | | | | 287.7 | | | | — | | | | — | |
| Equity dividends paid | | | (18.9 | ) | | | — | | | | — | | | | — | | | | (287.7 | ) | | | — | | | | (306.6 | ) |
Dividends paid to non-controlling interests in subsidiary undertakings | | | — | | | | — | | | | — | | | | — | | | | (51.9 | ) | | | — | | | | (51.9 | ) |
| Net cash (outflow)/inflow from financing activities | | | (306.5 | ) | | | — | | | | — | | | | 491.5 | | | | (269.8 | ) | | | — | | | | (84.8 | ) |
| Net increase/(decrease) in cash and cash equivalents | | | (350.4 | ) | | | 1,573.9 | | | | (652.6 | ) | | | 1.8 | | | | (522.3 | ) | | | — | | | | 50.4 | |
| Translation differences | | | 0.1 | | | | (18.6 | ) | | | (30.6 | ) | | | (6.8 | ) | | | (63.4 | ) | | | — | | | | (119.3 | ) |
| Cash and cash equivalents at beginning of year | | | (144.4 | ) | | | (2,923.5 | ) | | | 679.6 | | | | — | | | | 3,816.5 | | | | — | | | | 1,428.2 | |
| Cash and cash equivalents at end of year | | | (494.7 | ) | | | (1,368.2 | ) | | | (3.6 | ) | | | (5.0 | ) | | | 3,230.8 | | | | — | | | | 1,359.3 | |
For the year ended 31 December 2011, £m
| | | | | | | | | | | | | | | | | | | | | | | | | | | | |
| | | WPP
plc | | | Subsidiary
Guarantors1 | | | WPP Finance (UK)2 | | | WPP
Finance
20102 | | | Other
Subsidiaries2 | | | Reclassifications /
Eliminations | | | Consolidated WPP plc | |
Net cash inflow/(outflow) from operating activities | | | 474.2 | | | | (404.7 | ) | | | (46.1 | ) | | | — | | | | 641.8 | | | | — | | | | 665.2 | |
Investing activities | | | | | | | | | | | | | | | | | | | | | | | | | | | | |
Acquisitions and disposals | | | — | | | | — | | | | — | | | | — | | | | (469.8 | ) | | | — | | | | (469.8 | ) |
Purchases of property, plant and equipment | | | — | | | | (5.0 | ) | | | — | | | | — | | | | (211.1 | ) | | | — | | | | (216.1 | ) |
Purchases of other intangible assets (including capitalised computer software) | | | — | | | | — | | | | — | | | | — | | | | (37.1 | ) | | | — | | | | (37.1 | ) |
Proceeds on disposal of property, plant and equipment | | | — | | | | 0.5 | | | | — | | | | — | | | | 12.7 | | | | — | | | | 13.2 | |
Net cash outflow from investing activities | | | — | | | | (4.5 | ) | | | — | | | | — | | | | (705.3 | ) | | | — | | | | (709.8 | ) |
Financing activities | | | | | | | | | | | | | | | | | | | | | | | | | | | | |
Share option proceeds | | | 28.8 | | | | — | | | | — | | | | — | | | | — | | | | — | | | | 28.8 | |
Cash consideration for non-controlling interests | | | — | | | | — | | | | — | | | | — | | | | (62.6 | ) | | | — | | | | (62.6 | ) |
Share repurchases and buy-backs | | | (75.7 | ) | | | — | | | | — | | | | — | | | | (106.5 | ) | | | — | | | | (182.2 | ) |
Net increase in borrowings | | | — | | | | — | | | | — | | | | — | | | | 301.4 | | | | — | | | | 301.4 | |
Financing and share issue costs | | | — | | | | — | | | | — | | | | — | | | | (11.9 | ) | | | — | | | | (11.9 | ) |
Capital contribution (paid)/received | | | (554.9 | ) | | | 475.1 | | | | — | | | | — | | | | 79.8 | | | | — | | | | — | |
Equity dividends paid | | | (18.0 | ) | | | (121.0 | ) | | | — | | | | — | | | | (79.4 | ) | | | — | | | | (218.4 | ) |
Dividends paid to non-controlling interests in subsidiary undertakings | | | — | | | | — | | | | — | | | | — | | | | (62.2 | ) | | | — | | | | (62.2 | ) |
Net cash (outflow)/inflow from financing activities | | | (619.8 | ) | | | 354.1 | | | | — | | | | — | | | | 58.6 | | | | — | | | | (207.1 | ) |
Net decrease in cash and cash equivalents | | | (145.6 | ) | | | (55.1 | ) | | | (46.1 | ) | | | — | | | | (4.9 | ) | | | — | | | | (251.7 | ) |
Translation differences | | | (0.2 | ) | | | (29.2 | ) | | | 3.7 | | | | — | | | | (4.2 | ) | | | — | | | | (29.9 | ) |
Cash and cash equivalents at beginning of year | | | 1.4 | | | | (2,839.2 | ) | | | 722.0 | | | | — | | | | 3,825.6 | | | | — | | | | 1,709.8 | |
Cash and cash equivalents at end of year | | | (144.4 | ) | | | (2,923.5 | ) | | | 679.6 | | | | — | | | | 3,816.5 | | | | — | | | | 1,428.2 | |
Note
| 1 | | Includes: WPP Air 1 Limited, WPP 2008 Limited, WPP 2005 Limited and Young & Rubicam Brands US Holdings. |
| 2 | | Net cash inflow/(outflow) from operating activities and financing activities figures have been restated to better reflect the nature of the transactions. |
F-42
32. Condensed consolidating financial information (continued)
Condensed consolidating cash flow statement information (continued)
For the year ended 31 December 2010, £m
| | | | | | | | | | | | | | | | | | | | | | | | | | | | |
| | | WPP
plc | | | Subsidiary
Guarantors1 | | | WPP Finance (UK) | | | WPP
Finance 2010 | | | Other
Subsidiaries | | | Reclassifications /
Eliminations | | | Consolidated WPP plc | |
Net cash inflow/(outflow) from operating activities | | | 28.1 | | | | (395.6 | ) | | | (30.6 | ) | | | — | | | | 1,759.3 | | | | — | | | | 1,361.2 | |
Investing activities | | | | | | | | | | | | | | | | | | | | | | | | | | | | |
Acquisitions and disposals | | | — | | | | 20.2 | | | | — | | | | — | | | | (220.3 | ) | | | — | | | | (200.1 | ) |
Purchases of property, plant and equipment | | | — | | | | (3.9 | ) | | | — | | | | — | | | | (186.6 | ) | | | — | | | | (190.5 | ) |
Purchases of other intangible assets (including capitalised computer software) | | | — | | | | — | | | | — | | | | — | | | | (27.0 | ) | | | — | | | | (27.0 | ) |
Proceeds on disposal of property, plant and equipment | | | — | | | | — | | | | — | | | | — | | | | 7.6 | | | | — | | | | 7.6 | |
Net cash (outflow)/inflow from investing activities | | | — | | | | 16.3 | | | | — | | | | — | | | | (426.3 | ) | | | — | | | | (410.0 | ) |
Financing activities | | | | | | | | | | | | | | | | | | | | | | | | | | | | |
Share option proceeds | | | 42.7 | | | | — | | | | — | | | | — | | | | — | | | | — | | | | 42.7 | |
Cash consideration for non-controlling interests | | | — | | | | — | | | | — | | | | — | | | | (15.1 | ) | | | — | | | | (15.1 | ) |
Share repurchases and buy-backs | | | — | | | | — | | | | — | | | | — | | | | (46.4 | ) | | | — | | | | (46.4 | ) |
Net increase in borrowings | | | — | | | | — | | | | — | | | | — | | | | 19.8 | | | | — | | | | 19.8 | |
Financing and share issue costs | | | — | | | | — | | | | — | | | | — | | | | (3.5 | ) | | | — | | | | (3.5 | ) |
Capital contribution (paid)/received | | | — | | | | — | | | | — | | | | — | | | | — | | | | — | | | | — | |
Equity dividends paid | | | (13.4 | ) | | | (187.0 | ) | | | — | | | | — | | | | — | | | | — | | | | (200.4 | ) |
Dividends paid to non-controlling interests in subsidiary undertakings | | | — | | | | — | | | | — | | | | — | | | | (66.7 | ) | | | — | | | | (66.7 | ) |
Net cash (outflow)/inflow from financing activities | | | 29.3 | | | | (187.0 | ) | | | — | | | | — | | | | (111.9 | ) | | | — | | | | (269.6 | ) |
Net increase/(decrease) in cash and cash equivalents | | | 57.4 | | | | (566.3 | ) | | | (30.6 | ) | | | — | | | | 1,221.1 | | | | — | | | | 681.6 | |
Translation differences | | | 0.1 | | | | (27.9 | ) | | | 25.9 | | | | — | | | | 84.1 | | | | — | | | | 82.2 | |
Cash and cash equivalents at beginning of year | | | (56.1 | ) | | | (2,245.0 | ) | | | 726.7 | | | | — | | | | 2,520.4 | | | | — | | | | 946.0 | |
Cash and cash equivalents at end of year | | | 1.4 | | | | (2,839.2 | ) | | | 722.0 | | | | — | | | | 3,825.6 | | | | — | | | | 1,709.8 | |
Note
| 1 | | Includes: WPP Air 1 Limited, WPP 2008 Limited, WPP 2005 Limited and Young & Rubicam Brands US Holdings. |
F-43
32. Condensed consolidating financial information (continued)
Condensed consolidating balance sheet information
At 31 December 2012, £m
| | | | | | | | | | | | | | | | | | | | | | | | | | | | |
| | | WPP plc | | | Subsidiary
guarantors1 | | | WPP
Finance
(UK) | | | WPP
Finance
2010 | | | Other
Subsidiaries | | | Reclassifications/
Eliminations | | | Consolidated
WPP plc | |
Non-current assets | | | | | | | | | | | | | | | | | | | | | | | | | | | | |
Intangible assets: | | | | | | | | | | | | | | | | | | | | | | | | | | | | |
Goodwill | | | — | | | | — | | | | — | | | | — | | | | 9,457.2 | | | | — | | | | 9,457.2 | |
Other | | | — | | | | — | | | | — | | | | — | | | | 1,827.4 | | | | — | | | | 1,827.4 | |
Property, plant and equipment | | | — | | | | 12.2 | | | | — | | | | — | | | | 756.1 | | | | — | | | | 768.3 | |
Investment in subsidiaries | | | 7,877.5 | | | | 13,319.6 | | | | — | | | | — | | | | — | | | | (21,197.1 | ) | | | — | |
Interests in associates and joint ventures | | | — | | | | — | | | | — | | | | — | | | | 887.2 | | | | — | | | | 887.2 | |
Other investments | | | — | | | | — | | | | — | | | | — | | | | 176.5 | | | | — | | | | 176.5 | |
Deferred tax assets | | | — | | | | — | | | | — | | | | — | | | | 91.2 | | | | — | | | | 91.2 | |
Trade and other receivables | | | — | | | | 74.9 | | | | — | | | | — | | | | 170.2 | | | | — | | | | 245.1 | |
| | | | 7,877.5 | | | | 13,406.7 | | | | — | | | | — | | | | 13,365.8 | | | | (21,197.1 | ) | | | 13,452.9 | |
Current assets | | | | | | | | | | | | | | | | | | | | | | | | | | | | |
Inventory and work in progress | | | — | | | | — | | | | — | | | | — | | | | 348.2 | | | | — | | | | 348.2 | |
Corporate income tax recoverable | | | — | | | | — | | | | — | | | | — | | | | 124.2 | | | | — | | | | 124.2 | |
Trade and other receivables | | | 0.3 | | | | 135.8 | | | | 0.6 | | | | — | | | | 8,870.3 | | | | — | | | | 9,007.0 | |
Cash and short-term deposits | | | 1.2 | | | | 1,763.0 | | | | — | | | | — | | | | 3,816.7 | | | | (3,635.6 | ) | | | 1,945.3 | |
| | | | 1.5 | | | | 1,898.8 | | | | 0.6 | | | | — | | | | 13,159.4 | | | | (3,635.6 | ) | | | 11,424.7 | |
Current Liabilities | | | | | | | | | | | | | | | | | | | | | | | | | | | | |
Trade and other payables | | | (23.9 | ) | | | (119.0 | ) | | | (9.2 | ) | | | (9.5 | ) | | | (10,746.2 | ) | | | — | | | | (10,907.8 | ) |
Corporate income tax payable | | | — | | | | — | | | | — | | | | — | | | | (102.9 | ) | | | — | | | | (102.9 | ) |
Bank overdrafts and loans | | | (495.9 | ) | | | (3,631.1 | ) | | | (3.6 | ) | | | (5.0 | ) | | | (585.9 | ) | | | 3,635.6 | | | | (1,085.9 | ) |
| | | | (519.8 | ) | | | (3,750.1 | ) | | | (12.8 | ) | | | (14.5 | ) | | | (11,435.0 | ) | | | 3,635.6 | | | | (12,096.6 | ) |
Net current (liabilities)/assets | | | (518.3 | ) | | | (1,851.3 | ) | | | (12.2 | ) | | | (14.5 | ) | | | 1,724.4 | | | | — | | | | (671.9 | ) |
Total assets less current liabilities | | | 7,359.2 | | | | 11,555.4 | | | | (12.2 | ) | | | (14.5 | ) | | | 15,090.2 | | | | (21,197.1 | ) | | | 12,781.0 | |
Non-current liabilities | | | | | | | | | | | | | | | | | | | | | | | | | | | | |
Bonds and bank loans | | | (435.0 | ) | | | (1,042.0 | ) | | | (594.8 | ) | | | (980.2 | ) | | | (628.6 | ) | | | — | | | | (3,680.6 | ) |
Trade and other payables | | | — | | | | (51.7 | ) | | | (3.6 | ) | | | — | | | | (460.3 | ) | | | 3.6 | | | | (512.0 | ) |
Corporate income tax payable | | | — | | | | — | | | | — | | | | — | | | | (375.3 | ) | | | — | | | | (375.3 | ) |
Deferred tax liabilities | | | — | | �� | | — | | | | — | | | | — | | | | (680.3 | ) | | | — | | | | (680.3 | ) |
Provision for post-employment benefits | | | — | | | | — | | | | — | | | | — | | | | (335.6 | ) | | | — | | | | (335.6 | ) |
Provisions for liabilities and charges | | | — | | | | — | | | | — | | | | — | | | | (136.6 | ) | | | — | | | | (136.6 | ) |
| | | | (435.0 | ) | | | (1,093.7 | ) | | | (598.4 | ) | | | (980.2 | ) | | | (2,616.7 | ) | | | 3.6 | | | | (5,720.4 | ) |
Net intercompany (payable)/receivable | | | (113.2 | ) | | | (2,584.2 | ) | | | 443.3 | | | | 991.1 | | | | 1,263.0 | | | | — | | | | — | |
Net assets/(liabilities) | | | 6,811.0 | | | | 7,877.5 | | | | (167.3 | ) | | | (3.6 | ) | | | 13,736.5 | | | | (21,193.5 | ) | | | 7,060.6 | |
Attributable to: | | | | | | | | | | | | | | | | | | | | | | | | | | | | |
Equity share owners’ funds | | | 6,811.0 | | | | 7,877.5 | | | | (167.3 | ) | | | (3.6 | ) | | | 13,486.9 | | | | (21,193.5 | ) | | | 6,811.0 | |
Non-controlling interests | | | — | | | | — | | | | — | | | | — | | | | 249.6 | | | | — | | | | 249.6 | |
Total equity | | | 6,811.0 | | | | 7,877.5 | | | | (167.3 | ) | | | (3.6 | ) | | | 13,736.5 | | | | (21,193.5 | ) | | | 7,060.6 | |
Note
| 1 | | Includes: WPP Air 1 Limited, WPP 2008 Limited, WPP 2005 Limited and Young & Rubicam Brands US Holdings. |
F-44
32. Condensed consolidating financial information (continued)
Condensed consolidating balance sheet information (continued)
At 31 December 2011, £m
| | | | | | | | | | | | | | | | | | | | | | | | | | | | |
| | | WPP plc | | | Subsidiary
guarantors1 | | | WPP
Finance
(UK) | | | WPP
Finance
2010 | | | Other
Subsidiaries | | | Reclassifications/
Eliminations | | | Consolidated
WPP plc | |
Non-current assets | | | | | | | | | | | | | | | | | | | | | | | | | | | | |
Intangible assets: | | | | | | | | | | | | | | | | | | | | | | | | | | | | |
Goodwill | | | — | | | | — | | | | — | | | | — | | | | 9,430.8 | | | | — | | | | 9,430.8 | |
Other | | | — | | | | — | | | | — | | | | — | | | | 1,859.9 | | | | — | | | | 1,859.9 | |
Property, plant and equipment | | | — | | | | 8.0 | | | | — | | | | — | | | | 720.3 | | | | — | | | | 728.3 | |
Investment in subsidiaries | | | 7,350.0 | | | | 13,282.1 | | | | — | | | | — | | | | — | | | | (20,632.1 | ) | | | — | |
Interests in associates and joint ventures | | | — | | | | — | | | | — | | | | — | | | | 801.3 | | | | — | | | | 801.3 | |
Other investments | | | — | | | | — | | | | — | | | | — | | | | 190.8 | | | | ��� | | | | 190.8 | |
Deferred tax assets | | | — | | | | — | | | | — | | | | — | | | | 86.0 | | | | — | | | | 86.0 | |
Trade and other receivables | | | — | | | | 128.9 | | | | — | | | | — | | | | 180.2 | | | | — | | | | 309.1 | |
| | | | 7,350.0 | | | | 13,419.0 | | | | — | | | | — | | | | 13,269.3 | | | | (20,632.1 | ) | | | 13,406.2 | |
Current assets | | | | | | | | | | | | | | | | | | | | | | | | | | | | |
Inventory and work in progress | | | — | | | | — | | | | — | | | | — | | | | 333.9 | | | | — | | | | 333.9 | |
Corporate income tax recoverable | | | — | | | | — | | | | — | | | | — | | | | 88.5 | | | | — | | | | 88.5 | |
Trade and other receivables | | | — | | | | 109.4 | | | | 2.1 | | | | 0.2 | | | | 8,808.0 | | | | — | | | | 8,919.7 | |
Cash and short-term deposits | | | 0.5 | | | | 1,123.9 | | | | 679.6 | | | | — | | | | 4,334.9 | | | | (4,192.3 | ) | | | 1,946.6 | |
| | | | 0.5 | | | | 1,233.3 | | | | 681.7 | | | | 0.2 | | | | 13,565.3 | | | | (4,192.3 | ) | | | 11,288.7 | |
Current Liabilities | | | | | | | | | | | | | | | | | | | | | | | | | | | | |
Trade and other payables | | | (5.2 | ) | | | (87.5 | ) | | | (9.6 | ) | | | (4.0 | ) | | | (11,059.2 | ) | | | — | | | | (11,165.5 | ) |
Corporate income tax payable | | | — | | | | — | | | | — | | | | — | | | | (113.4 | ) | | | — | | | | (113.4 | ) |
Bank overdrafts and loans | | | (144.9 | ) | | | (4,047.4 | ) | | | — | | | | — | | | | (518.4 | ) | | | 4,192.3 | | | | (518.4 | ) |
| | | | (150.1 | ) | | | (4,134.9 | ) | | | (9.6 | ) | | | (4.0 | ) | | | (11,691.0 | ) | | | 4,192.3 | | | | (11,797.3 | ) |
Net current (liabilities)/assets | | | (149.6 | ) | | | (2,901.6 | ) | | | 672.1 | | | | (3.8 | ) | | | 1,874.3 | | | | — | | | | (508.6 | ) |
Total assets less current liabilities | | | 7,200.4 | | | | 10,517.4 | | | | 672.1 | | | | (3.8 | ) | | | 15,143.6 | | | | (20,632.1 | ) | | | 12,897.6 | |
Non-current liabilities | | | | | | | | | | | | | | | | | | | | | | | | | | | | |
Bonds and bank loans | | | (424.0 | ) | | | (1,586.4 | ) | | | (621.9 | ) | | | (518.3 | ) | | | (742.4 | ) | | | — | | | | (3,893.0 | ) |
Trade and other payables | | | — | | | | (109.5 | ) | | | (2.0 | ) | | | — | | | | (443.6 | ) | | | 2.0 | | | | (553.1 | ) |
Corporate income tax payable | | | — | | | | — | | | | — | | | | — | | | | (379.5 | ) | | | — | | | | (379.5 | ) |
Deferred tax liabilities | | | — | | | | — | | | | — | | | | — | | | | (741.4 | ) | | | — | | | | (741.4 | ) |
Provision for post-employment benefits | | | — | | | | — | | | | — | | | | — | | | | (282.3 | ) | | | — | | | | (282.3 | ) |
Provisions for liabilities and charges | | | — | | | | — | | | | — | | | | — | | | | (154.0 | ) | | | — | | | | (154.0 | ) |
| | | | (424.0 | ) | | | (1,695.9 | ) | | | (623.9 | ) | | | (518.3 | ) | | | (2,743.2 | ) | | | 2.0 | | | | (6,003.3 | ) |
Net intercompany (payable)/receivable | | | (113.1 | ) | | | (1,471.5 | ) | | | (206.9 | ) | | | 520.1 | | | | 1,271.4 | | | | — | | | | — | |
Net assets/(liabilities) | | | 6,663.3 | | | | 7,350.0 | | | | (158.7 | ) | | | (2.0 | ) | | | 13,671.8 | | | | (20,630.1 | ) | | | 6,894.3 | |
Attributable to: | | | | | | | | | | | | | | | | | | | | | | | | | | | | |
Equity share owners’ funds | | | 6,663.3 | | | | 7,350.0 | | | | (158.7 | ) | | | (2.0 | ) | | | 13,440.8 | | | | (20,630.1 | ) | | | 6,663.3 | |
Non-controlling interests | | | — | | | | — | | | | — | | | | — | | | | 231.0 | | | | — | | | | 231.0 | |
Total equity | | | 6,663.3 | | | | 7,350.0 | | | | (158.7 | ) | | | (2.0 | ) | | | 13,671.8 | | | | (20,630.1 | ) | | | 6,894.3 | |
Note
| 1 | | Includes: WPP Air 1 Limited, WPP 2008 Limited, WPP 2005 Limited and Young & Rubicam Brands US Holdings. |
F-45
REPORT OF INDEPENDENT REGISTERED PUBLIC ACCOUNTING FIRM
To the Board of Directors and Shareholder of WPP DAS Ltd
We have audited the accompanying balance sheets of WPP DAS Ltd (the “Trust”) as at 31 December 2012 and 2011 and the related cash flow statements and statement of changes in equity for each of the three years in the period ended 31 December 2012. These financial statements are the responsibility of the Trust’s management. Our responsibility is to express an opinion on these financial statements based on our audits.
We conducted our audits in accordance with standards of the Public Company Accounting Oversight Board (United States). Those standards require that we plan and perform the audit to obtain reasonable assurance about whether the financial statements are free of material misstatement. The Trust is not required to have an audit of its internal control over financial reporting. Our audit includes consideration of internal control over financial reporting as a basis for designing audit procedures that are appropriate in the circumstances, but not for the purpose of expressing any opinion on the Trust’s internal control over financial reporting. Accordingly, we express no such separate opinion. Our audits of the financial statements included examining, on a test basis, evidence supporting the amounts and disclosures in the financial statements, assessing the accounting principles used and significant estimates made by management, and evaluating the overall financial statement presentation. We believe that our audits provide a reasonable basis for our opinion.
In our opinion, such financial statements referred to above present fairly, in all material respects, the financial position of the Trust as at 31 December 2012 and 2011, and its cash flows for each of the three years in the period ended 31 December 2012, in conformity with International Financial Reporting Standards as issued by the International Accounting Standards Board.
/s/ Deloitte LLP
Deloitte LLP
London, United Kingdom
30 April 2013
F-46
Cash flow statement
For the years ended 31 December 2012, 2011 and 2010
| | | | | | | | | | | | | | |
| | | Notes | | 2012 £m | | | 2011 £m | | | 2010 £m | |
Net cash inflow from operating activities | | | | | – | | | | – | | | | – | |
Investing activities | | | | | – | | | | – | | | | – | |
Financing activities | | | | | – | | | | – | | | | – | |
Issue of ordinary shares | | 3 | | | 287.7 | | | | 79.4 | | | | – | |
Dividends paid | | 4 | | | (287.7 | ) | | | (79.4 | ) | | | – | |
Net cash inflow from financing activities | | | | | – | | | | – | | | | – | |
Net increase in cash and cash equivalents | | | | | – | | | | – | | | | – | |
Cash and cash equivalents at beginning of year | | | | | – | | | | – | | | | – | |
Cash and cash equivalents at end of year | | | | | – | | | | – | | | | – | |
Note
The accompanying notes form an integral part of this cash flow statement.
Balance sheet
At 31 December 2012, 2011
| | | | |
| | | 2012 £m | | 2011 £m |
Assets | | – | | – |
Liabilities | | – | | – |
Net assets | | – | | – |
Equity | | – | | – |
Note
The accompanying notes form an integral part of this balance sheet.
Statement of changes in equity
For the years ended 31 December 2012, 2011 and 2010
| | | | | | | | | | | | | | | | |
| | | Notes | | | Share
capital £m | | | Distributable
Reserve £m | | | Total £m | |
At 31 December 2009 | | | | | | | – | | | | – | | | | – | |
Issue of ordinary shares | | | 3 | | | | 187.0 | | | | – | | | | 187.0 | |
Capital reduction | | | 3 | | | | (187.0 | ) | | | 187.0 | | | | – | |
Dividends | | | 4 | | | | – | | | | (187.0 | ) | | | (187.0 | ) |
At 31 December 2010 | | | | | | | – | | | | – | | | | – | |
Issue of ordinary shares | | | 3 | | | | 200.4 | | | | | | | | 200.4 | |
Capital reduction | | | 3 | | | | (200.4 | ) | | | 200.4 | | | | | |
Dividends | | | 4 | | | | – | | | | (200.4 | ) | | | (200.4 | ) |
At 31 December 2011 | | | | | | | – | | | | – | | | | – | |
Issue of ordinary shares | | | 3 | | | | 287.7 | | | | | | | | 287.7 | |
Capital reduction | | | 3 | | | | (287.7 | ) | | | 287.7 | | | | – | |
Dividends | | | 4 | | | | – | | | | (287.7 | ) | | | (287.7 | ) |
At 31 December 2012 | | | | | | | – | | | | – | | | | – | |
Note
The accompanying notes form an integral part of this statement of changes in equity.
F-47
Notes to the financial statements
1. The dividend access trust
WPP DAS Limited (the “Trust”) was established on 9 July 2008 by WPP 2012 Limited (formerly known as WPP plc) to which the Trust issued a called-up share capital of 1 ordinary share with a nominal value of £1. The Trust is governed by the applicable laws of England and Wales and is a resident for tax purposes in the United Kingdom, WPP 2012 Limited is a resident for tax purposes in the Republic of Ireland. The Trust is a wholly owned subsidiary of WPP 2008 Limited which is an indirect wholly owned subsidiary of WPP 2012 Limited.
WPP DAS Limited was formed as part of WPP 2012 Limited’s Dividend Access Plan, which was primarily designed to ensure that its share owners may continue to receive UK dividends, meaning in particular that under the Dividend Access Plan, no Irish tax is required to be withheld from the payment of dividends to share owners. To facilitate the Dividend Access Plan, in April 2009 the Trust issued one non-voting dividend access share with a nominal value of £1 to the trustee. WPP share owners will not have any interest in the dividend access share and will not have any rights against the Trust as the issuer of the dividend access share. The only assets held in trust for the benefit of share owners will be dividends paid to the trustee in respect of the dividend access share.
To ensure compliance with UK trust law rules, the period during which the dividend access trust may continue is restricted. However, the dividend access trust under current law is able to continue for 80 years from inception.
The Dividend Access Plan was terminated on 2 January 2013, pursuant to the Scheme of Arrangement becoming effective. Following the Scheme, the new parent company (WPP plc) is resident for tax purposes in the UK.
2. Accounting policies
Basis of preparation
The financial statements have been prepared under the historical cost convention and in accordance with International Financial Reporting Standards (IFRS) as issued by the International Accounting Standards Board (IASB) as they apply to the financial statements of the Trust for the year ended 31 December 2012.
The financial statements were approved by the Board of Directors and authorised for issue on 30 April 2013.
Income statement and statement of comprehensive income
An income statement and a statement of comprehensive income are not presented with these financial statements because the Trust did not receive income, incur expense or recognise any gain or loss during the periods presented.
The directors received no remuneration for services to the Trust and the Trust had no employees during the periods presented. All operating expenses were borne by WPP 2005 Limited.
Functional currency
The functional currency of the Trust is pounds sterling.
Taxation
The Trust is not required to withhold at source any amount in respect of UK tax from dividend payments it makes under the Dividend Access Plan regardless of who the recipient of the payments is.
3. Share capital and distributable reserve
On 25 March 2010 the Trust issued 117,301,956 ordinary shares of £1 each to another Group company and on the same date a capital reduction was performed. On 28 October 2010 the Trust issued a further 69,706,978 ordinary shares of £1 each and on the same date a capital reduction was performed. As a result of this transaction the Trust remained with called-up share capital of 1 ordinary share of £1 and 1 dividend access share of £1.
On 29 June 2011 the Trust issued 121,002,475 ordinary shares of £1 each to another Group company and on the same date a capital reduction was performed. On 8 November 2011 the Trust issued a further 79,370,302 ordinary shares of £1 each and on the same date a capital reduction was performed. As a result of this transaction the Trust remained with called-up share capital of 1 ordinary share of £1 and 1 dividend access share of £1.
On 3 July 2012 the Trust issued 193,551,933 ordinary shares of £1 each to another Group company and on the same date a capital reduction was performed. On 6 July 2012 the Trust issued a further 94,175,711 ordinary shares of £1 each and on 7 November 2012 a capital reduction was performed. As a result of this transaction the Trust remained with called-up share capital of 1 ordinary share of £1 and 1 dividend access share of £1.
4. Dividends
| | | | | | | | | | | | |
| | | 2012 £m | | | 2011 £m | | | 2010 £m | |
| 2009 second interim dividend of 10.28p per ordinary share1 | | | – | | | �� | – | | | | 117.3 | |
| 2010 first interim dividend of 5.97p per ordinary share1 | | | – | | | | – | | | | 69.7 | |
| 2010 second interim dividend of 11.82p per ordinary share1 | | | – | | | | 121.0 | | | | – | |
| 2011 first interim dividend of 7.46p per ordinary share | | | – | | | | 79.4 | | | | – | |
| 2011 second interim dividend of 17.14p per ordinary share | | | 193.5 | | | | – | | | | – | |
| 2012 first interim dividend of 8.80p per ordinary share | | | 94.2 | | | | – | | | | – | |
| | | | 287.7 | | | | 200.4 | | | | 187.0 | |
| 1 | | This dividend was settled in cash by another Group company on behalf of the Trust. |
F-48
Exhibit Index
| | |
Exhibit No. | | Exhibit Title |
| 2.3 | | Agreement of Registrant to file, if requested by the Securities and Exchange Commission, instruments relating to $650,000,000 5.875% Notes due 2014. |
| |
| 2.9 | | Agreement of Registrant to file, if requested by the Securities and Exchange Commission, instruments relating to a U.S.$1,050,000,000 and £375,000,000 Revolving Credit Facilities Agreement (incorporating a U.S.$825,000,000 Swingline Facility) dated 30 November 2011, and Amended and Restated on 14 December 2012. |
| |
| 2.15 | | Agreement of Registrant to file, if requested by the Securities and Exchange Commission, instruments relating to U.S.$500,000,000 3.625% Guaranteed Senior Notes due September 2022 and $300,000,000 5.125% Guaranteed Senior Notes due 2042. |
| |
| 4.9 | | WPP Executive Stock Option Plan, as amended through 12 November 2012. |
| |
| 4.10 | | WPP plc Restricted Stock Plan, as amended through 12 November 2012. |
| |
| 4.11 | | WPP 2005 Executive Stock Option Plan, as amended through 12 November 2012. |
| |
| 4.12 | | WPP plc Annual Bonus Deferral Programme, as amended through 12 November 2012. |
| |
| 4.14 | | WPP 2008 Executive Stock Option Plan, as amended through 12 November 2012. |
| |
| 4.29 | | WPP Group plc 2004 Leadership Equity Acquisition Plan, as amended through 12 November 2012. |
| |
| 4.30 | | WPP plc Leadership Equity Acquisition Plan III, as amended through 10 December 2012. |
| |
| 4.32 | | WPP 2012 Executive Stock Option Plan. |
| |
| 8.1 | | List of subsidiaries. |
| |
| 12.1 | | Certification of Chief Executive. |
| |
| 12.2 | | Certification of Finance Director. |
| |
| 13.1 | | Certification of Chief Executive under 18 U.S.C. Section 1350. |
| |
| 13.2 | | Certification of Finance Director under 18 U.S.C. Section 1350. |
| |
| 14.1 | | Consent of Independent Registered Public Accounting Firm (for WPP plc and subsidiaries). |
| |
| 14.2 | | Consent of Independent Registered Public Accounting Firm (for WPP DAS Limited). |