UNITED STATES
SECURITIES AND EXCHANGE COMMISSION
Washington, D.C. 20549
FORMN-CSR
CERTIFIED SHAREHOLDER REPORT OF REGISTERED MANAGEMENT
INVESTMENT COMPANIES
| | |
| Investment Company Act file number: | | 811-04930 |
| |
| Exact name of registrant as specified in charter: | | Prudential Investment Portfolios 4 |
| |
| Address of principal executive offices: | | 655 Broad Street, 17th Floor Newark, New Jersey 07102 |
| |
| Name and address of agent for service: | | Andrew R. French 655 Broad Street, 17th Floor Newark, New Jersey 07102 |
| |
| Registrant’s telephone number, including area code: | | 800-225-1852 |
| |
| Date of fiscal year end: | | 4/30/2019 |
| |
| Date of reporting period: | | 4/30/2019 |
Item 1 – Reports to Stockholders

PGIM MUNI HIGH INCOME FUND
ANNUAL REPORT
APRIL 30, 2019
COMING SOON: PAPERLESS SHAREHOLDER REPORTS
Beginning on January 1, 2021, as permitted by regulations adopted by the Securities and Exchange Commission, paper copies of the Fund’s annual and semiannual shareholder reports will no longer be sent by mail, unless you specifically request paper copies of the reports. Instead, the reports will be made available on the Fund’s website (pgiminvestments.com), and you will be notified by mail each time a report is posted and provided with a website link to access the report.
If you already elected to receive shareholder reports electronically, you will not be affected by this change and you need not take any action. You may elect to receive shareholder reports and other communications from the Fund electronically anytime by contacting your financial intermediary (such as a broker-dealer or bank) or, if you are a direct investor, by calling 1-800-225-1852 or by sending an email request to PGIM Investments at shareholderreports@pgim.com.
You may elect to receive all future reports in paper free of charge. If you invest through a financial intermediary, you can contact your financial intermediary or follow instructions included with this notice to elect to continue to receive paper copies of your shareholder reports. If you invest directly with the Fund, you can call 1-800-225-1852 or send an email request to shareholderreports@pgim.com to let the Fund know you wish to continue receiving paper copies of your shareholder reports. Your election to receive reports in paper will apply to all funds held in your account if you invest through your financial intermediary or all funds held with the fund complex if you invest directly with the Fund.

To enroll in e-delivery, go to pgiminvestments.com/edelivery
|
Objective:Maximum amount of income that is eligible for exclusion from
federal income taxes |
Highlights(unaudited)
| • | | The Fund’s longer duration versus the Index* contributed positively to performance as yields fell across the curve during the reporting period. |
| • | | An overweight versus the Index in Illinois general obligation bonds, which outperformed during the reporting period, contributed favorably to performance as spreads tightened. |
| • | | The Fund’s overweight in long-term municipal bonds versus those in the Index detracted from performance as spreads (the difference in yields) between long-term municipal bonds and shorter-term maturities widened. |
| • | | The Fund’s underweight in US territory credits detracted from performance as prices recovered from severely distressed levels post Hurricane Maria. |
*The Bloomberg Barclays Municipal Bond Index (50%)/Bloomberg Barclays Municipal High Yield Bond Index (50%) is used for the purposes of discussing the Fund’s relative performance with respect to sector weightings, credit ratings, and security selection.
This report is not authorized for distribution to prospective investors unless preceded or accompanied by a current prospectus.
The views expressed in this report and information about the Fund’s portfolio holdings are for the period covered by this report and are subject to change thereafter.
Mutual funds are distributed by Prudential Investment Management Services LLC (PIMS), member SIPC. PGIM Fixed Income is a unit of PGIM, Inc. (PGIM), a registered investment adviser. PIMS and PGIM are Prudential Financial companies.© 2019 Prudential Financial, Inc. and its related entities. PGIM and the PGIM logo are service marks of Prudential Financial, Inc. and its related entities, registered in many jurisdictions worldwide.
| | |
| 2 | | Visit our website at pgiminvestments.com |
Table of Contents
| | | | |
| PGIM Muni High Income Fund | | | 3 | |
This Page Intentionally Left Blank
Letter from the President

Dear Shareholder:
We hope you find the annual report for the PGIM Muni High Income Fund informative and useful. The report covers performance for the12-month period that ended April 30, 2019.
Global economic performance diverged during the reporting period. In the US, growth remained healthy with strong corporate profits and rising employment. The Federal Reserve hiked interest rate targets three times during the period, based on a strengthening labor market and rising economic activity. Growth in many other regions weakened. China showed signs of slowing amid trade tensions with the US, and turmoil grew in Great Britain as it negotiated an exit from the European Union.
Despite the growing US economy, volatility returned to the equity markets during the period. After corporate tax cuts and regulatory reforms helped boost US stocks early in the period, equities declined significantly at the end of 2018 on concerns about China’s economy, a potential global trade war, higher interest rates, and worries that profit growth might slow. Stocks reversed course early in 2019, rising sharply after the Fed moderated its position on additional rate hikes for the remainder of the year. For the period overall, equities rose in US markets but fell in both developed foreign markets and emerging markets.
The overall US bond market posted healthy returns during the period, led by high yield corporate, municipal, and investment-grade corporate bonds. Globally, bonds in developed markets fell slightly, but emerging markets debt denominated in hard currencies delivered solid gains. A major trend during the period was the flattening of the US Treasury yield curve, as the yield on fixed income investments with shorter maturities rose and made them more attractive to investors.
Regarding your investments with PGIM, we believe it is important to maintain a diversified portfolio of funds consistent with your tolerance for risk, time horizon, and financial goals. Your financial advisor can help you create a diversified investment plan that may include funds covering all the basic asset classes and that reflects your personal investor profile and risk tolerance. However, diversification and asset allocation strategies do not assure a profit or protect against loss in declining markets.
At PGIM Investments, we consider it a great privilege and responsibility to help investors participate in opportunities across global markets while meeting their toughest investment challenges. PGIM is atop-10 global investment manager with more than $1 trillion in assets under management. This investment expertise allows us to deliver actively managed funds and strategies to meet the needs of investors around the globe.
Thank you for choosing our family of funds.
Sincerely,

Stuart S. Parker, President
PGIM Muni High Income Fund
June 14, 2019
| | | | |
| PGIM Muni High Income Fund | | | 5 | |
Your Fund’s Performance(unaudited)
Performance data quoted represents past performance. Past performance does not guarantee future results. The investment return and principal value of an investment will fluctuate, so that an investor’s shares, when redeemed, may be worth more or less than their original cost. Current performance may be lower or higher than the past performance data quoted. An investor may obtain performance data as of the most recent month-end by visiting our website atpgiminvestments.com or by calling (800) 225-1852.
| | | | | | | | |
| |
| | | Average Annual Total Returns as of 4/30/19
(with sales charges) |
| | | One Year (%) | | Five Years (%) | | Ten Years (%) | | Since Inception (%) |
| Class A | | 1.44 | | 4.07 | | 6.18 | | — |
| Class B | | 0.31 | | 4.45 | | 6.33 | | — |
| Class C | | 3.88 | | 4.13 | | 5.85 | | — |
| Class Z | | 5.90 | | 5.18 | | 6.87 | | — |
| Class R6 | | 5.94 | | N/A | | N/A | | 4.58 (6/27/17) |
| Bloomberg Barclays Municipal Bond Index |
| | 6.16 | | 3.56 | | 4.55 | | — |
| Bloomberg Barclays Municipal High Yield Bond Index |
| | 8.26 | | 5.98 | | 8.55 | | — |
| Bloomberg Barclays Municipal Bond Index (50%) / Bloomberg Barclays Municipal High Yield Bond Index (50%) |
| | 7.21 | | 4.78 | | 6.55 | | — |
| Lipper High Yield Municipal Debt Funds Average |
| | | 6.03 | | 5.08 | | 7.02 | | — |
| | |
| 6 | | Visit our website at pgiminvestments.com |
| | | | | | | | |
| |
| | | Average Annual Total Returns as of 4/30/19
(without sales charges) |
| | | One Year (%) | | Five Years (%) | | Ten Years (%) | | Since Inception (%) |
| Class A | | 5.67 | | 4.92 | | 6.61 | | — |
| Class B | | 5.31 | | 4.62 | | 6.33 | | — |
| Class C | | 4.88 | | 4.13 | | 5.85 | | — |
| Class Z | | 5.90 | | 5.18 | | 6.87 | | — |
| Class R6 | | 5.94 | | N/A | | N/A | | 4.58 (6/27/17) |
| Bloomberg Barclays Municipal Bond Index |
| | 6.16 | | 3.56 | | 4.55 | | — |
| Bloomberg Barclays Municipal High Yield Bond Index |
| | 8.26 | | 5.98 | | 8.55 | | — |
| Bloomberg Barclays Municipal Bond Index (50%) / Bloomberg Barclays Municipal High Yield Bond Index (50%) |
| | 7.21 | | 4.78 | | 6.55 | | — |
| Lipper High Yield Municipal Debt Funds Average |
| | | 6.03 | | 5.08 | | 7.02 | | — |
Growth of a $10,000 Investment
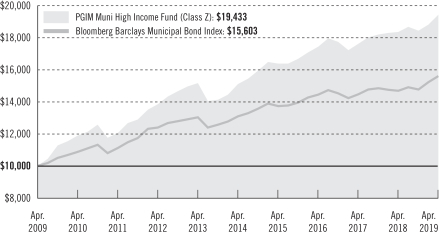
The graph compares a $10,000 investment in the Fund’s Class Z shares with a similar investment in the Bloomberg Barclays Municipal Bond Index by portraying the initial account values at the beginning of the10-year period for Class Z shares (April 30, 2009) and the account values at the end of the current fiscal year (April 30, 2019) as measured
| | | | |
| PGIM Muni High Income Fund | | | 7 | |
Your Fund’s Performance(continued)
on a quarterly basis. For purposes of the graph, and unless otherwise indicated, it has been assumed that (a) all recurring fees (including management fees) were deducted; and (b) all dividends and distributions were reinvested. The line graph provides information for Class Z shares only. As indicated in the tables provided earlier and in the following paragraphs, performance for other share classes will vary due to the differing charges and expenses applicable to each share class (as indicated in the following paragraphs). Without waiver of fees and/or expense reimbursements, if any, the Fund’s returns would have been lower.
Past performance does not predict future performance. Total returns and the ending account values in the graph include changes in share price and reinvestment of dividends and capital gains distributions in a hypothetical investment for the periods shown. The Fund’s total returns do not reflect the deduction of income taxes on an individual’s investment. Taxes may reduce your actual investment returns on income or gains paid by the Fund or any gains you may realize if you sell your shares.
Source: PGIM Investments LLC and Lipper Inc.
Inception returns are provided for any share class that has less than 10 fiscal years of returns. Since Inception returns for the Indexes and the Lipper Average are measured from the closest month-end to the class’ inception date.
The returns in the tables do not reflect the deduction of taxes that a shareholder would pay on Fund distributions or following the redemption of Fund shares. The average annual total returns take into account applicable sales charges, which are described for each share class in the table below.
| | | | | | | | | | |
| | | | | | |
| | | Class A | | Class B* | | Class C | | Class Z | | Class R6 |
| Maximum initial sales charge | | 4.00% of the public offering price | | None | | None | | None | | None |
| Contingent deferred sales charge (CDSC) (as a percentage of the lower of original purchase price or net asset value at redemption) | | 1.00% on sales of $1 million or more made within 12 months of purchase | | 5.00% (Yr. 1) 4.00% (Yr. 2) 3.00% (Yr. 3) 2.00% (Yr. 4) 1.00% (Yr. 5/6) 0.00% (Yr. 7) | | 1.00% on sales made within 12 months of purchase | | None | | None |
| Annual distribution and service(12b-1) fees (shown as a percentage of average daily net assets) | | 0.25% | | 0.50% | | 1.00% | | None | | None |
*Class B shares are closed to all purchase activity and no additional Class B shares may be purchased or acquired except by exchange from Class B shares of another Fund or through dividend or capital gains reinvestment.
| | |
| 8 | | Visit our website at pgiminvestments.com |
Benchmark Definitions
Bloomberg Barclays Municipal Bond Index—The Bloomberg Barclays Municipal Bond Index is an unmanaged index of long-term investment-grade municipal bonds. It gives a broad look at how long-term investment-grade municipal bonds have performed. The average annual total return for the Index measured from the month-end closest to the inception date of the Fund’s Class R6 shares is 3.50%.
Bloomberg Barclays Municipal High Yield Bond Index—The Bloomberg Barclays Municipal High Yield Bond Index is an unmanaged index of non-rated or Ba1 or below-rated municipal bonds. It gives a broad look at how non-investment-grade municipal bonds have performed. The average annual total return for the Index measured from the month-end closest to the inception date of the Fund’s Class R6 shares is 6.92%.
Bloomberg Barclays Municipal Bond Index (50%) / Bloomberg Barclays Municipal High Yield Bond Index (50%)—This is a custom blend of the Bloomberg Barclays Municipal Bond Index (50%) and the Bloomberg Barclays Municipal High Yield Bond Index (50%). The average annual total return for the Index measured from the month-end closest to the inception date of the Fund’s Class R6 shares is 5.45%.
Lipper High Yield Municipal Debt Funds Average—TheLipper High Yield Municipal Debt Funds Average (Lipper Average) is based on the average return of all funds in the Lipper High Yield Municipal Debt Funds universe for the periods noted. Funds in the Lipper Average invest at least 50% of their assets in lower-rated municipal debt issues. The average annual total return for the Lipper Average measured from the month-end closest to the inception date of the Fund’s Class R6 shares is 4.69%.
Investors cannot invest directly in an index or average. The returns for the indexes would be lower if they included the effects of sales charges, operating expenses of a mutual fund, or taxes. Returns for the Lipper Average reflect the deduction of operating expenses of a mutual fund, but not sales charges or taxes.
| | | | | | | | | | | | | | |
| | |
| Distributions and Yields as of 4/30/19 | | | | |
| | Total
Distributions
Paid for
12 Months ($) | | SEC 30-Day
Subsidized
Yield* (%) | | Taxable Equivalent
30-Day Subsidized
Yield*** at Federal Tax Rates of | | SEC 30-Day
Unsubsidized
Yield** (%) | | Taxable Equivalent
30-Day Unsubsidized
Yield*** at Federal
Tax Rates of
|
| | 37.0 (%) | | 40.8 (%) | | 37.0 (%) | | 40.8 (%) |
| Class A | | 0.40 | | 2.64 | | 4.19 | | 4.46 | | 2.64 | | 4.19 | | 4.46 |
| Class B | | 0.37 | | 2.52 | | 4.00 | | 4.26 | | 2.52 | | 4.00 | | 4.26 |
| Class C | | 0.32 | | 2.11 | | 3.35 | | 3.56 | | 2.11 | | 3.35 | | 3.56 |
| Class Z | | 0.42 | | 2.99 | | 4.75 | | 5.05 | | 2.99 | | 4.75 | | 5.05 |
| Class R6 | | 0.43 | | 3.03 | | 4.81 | | 5.12 | | 2.82 | | 4.48 | | 4.76 |
*SEC 30-Day Subsidized Yield (%)—A standardized yield calculation created by the Securities and Exchange Commission, it reflects the income earned during a 30-day period, after the deduction of the Fund’s net expenses (net of any expense waivers or reimbursements). The investor experience is represented by the SEC 30-Day Subsidized Yield.
| | | | |
| PGIM Muni High Income Fund | | | 9 | |
Your Fund’s Performance(continued)
**SEC 30-Day Unsubsidized Yield (%)—A standardized yield calculation created by the Securities and Exchange Commission, it reflects the income earned during a 30-day period, after the deduction of the Fund’s gross expenses. The investor experience is represented by the SEC 30-Day Subsidized Yield.
***Some investors may be subject to the federal alternative minimum tax (AMT) and/or state and local taxes. Taxable equivalent yields reflect federal taxes only. The taxable equivalent yield is the yield an investor would have to earn on a taxable investment in order to equal the yield provided by a tax-exempt municipal bond. The taxable equivalent yields presented in the table use the highest marginal federal individual income tax rate (37.0%) and the highest marginal federal individual income tax rate plus the 3.8% net investment income tax (40.8%).
| | | | |
|
| Credit Quality expressed as a percentage of total investments as of 4/30/19 (%) | |
| AAA | | | 4.8 | |
| AA | | | 9.0 | |
| A | | | 22.4 | |
| BBB | | | 30.1 | |
| BB | | | 10.5 | |
| B | | | 5.4 | |
| CCC | | | 0.2 | |
| CC | | | 0.6 | |
| Not Rated | | | 16.9 | |
| Total Investments | | | 100.0 | |
Source: PGIM Fixed Income
Credit ratings reflect the highest rating assigned by a nationally recognized statistical rating organization (NRSRO) such as Moody’s Investors Service, Inc. (Moody’s), S&P Global Ratings (S&P), or Fitch, Inc. (Fitch). Credit ratings reflect the common nomenclature used by both S&P and Fitch. Where applicable, ratings are converted to the comparable S&P/Fitch rating tier nomenclature. These rating agencies are independent and are widely used. The Not Rated category consists of securities that have not been rated by a NRSRO. Credit ratings are subject to change. Values may not sum to 100.0% due to rounding.
| | |
| 10 | | Visit our website at pgiminvestments.com |
Strategy and Performance Overview(unaudited)
How did the Fund perform?
ThePGIM Muni High Income Fund’s Class Z shares rose 5.90% in the12-month reporting period that ended April 30, 2019, underperforming the 6.16% return of the Bloomberg Barclays Municipal Bond Index, the 7.21% return of the Bloomberg Barclays Municipal Bond Index (50%) / Bloomberg Barclays Municipal High Yield Bond Index (50%) [the Index]*, and the 6.03% return of the Lipper High Yield Municipal Debt Funds Average.
What were conditions like in the municipal bond market?
| • | | Municipal securities exhibited solid performance during the reporting period as mutual funds experienced positive inflows, driven by record inflows in the first quarter of 2019. On the issuance front, supply was manageable during the period, contributing to a favorable supply/demand environment. For the full period, municipal bonds outperformed Treasury bonds across the yield curve. |
| • | | During the period, the Federal Reserve hiked interest rates three times by 25 basis points each—in June, September, and December—before pivoting to a more dovish stance during the first quarter of 2019. (One basis point equals 0.01%.) The municipal yield curve, as measured by the yield difference between5-year and30-year municipals, steepened during the period asfront-end rates declined more than rates declined on the long end. |
| • | | On the credit front, states benefited from robust revenue growth in the period, driven by a healthy US economy. The timing of the fiscal 2019 income tax receipts was affected by taxpayers’ response to federal tax code changes. As a result, certain incometax-dependent states reported shortfalls for much of the year, which were generally offset by healthy April 2019 receipts. Following the successful Puerto Rico Sales Tax Refinancing Corp. (COFINA) debt exchange in the first quarter of 2019, investors will now focus on Puerto Rico general obligation (GO) debt restructuring negotiations as the Federal Oversight and Management Board (FOMB) intends to submit a GO restructuring plan by the end of 2019. Unfunded retiree obligations remain a broader long-term issue, with Illinois and New Jersey at the forefront of this concern. |
What worked?
| • | | The Fund’s longer duration versus the Index contributed positively to performance as yields fell across the curve during the reporting period. Duration measures the sensitivity of the price (the value of principal) of a bond to a change in interest rates. |
| • | | An overweight versus the Index in Illinois GO bonds, which outperformed during the period, contributed favorably to performance as spreads tightened. |
*The Bloomberg Barclays Municipal Bond Index (50%) / Bloomberg Barclays Municipal High Yield Bond Index (50%) is used for the purposes of discussing the Fund’s relative performance with respect to sector weightings, credit ratings, and security selections.
| | | | |
| PGIM Muni High Income Fund | | | 11 | |
Strategy and Performance Overview(continued)
| • | | An overweight versus the Index in health care bonds, which outperformed during the period, contributed favorably to performance. |
What didn’t work?
| • | | The Fund’s overweight in long-term municipal bonds versus the Index detracted from performance as spreads (the difference in yields) between long-term municipal bonds and shorter-term maturities widened. |
| • | | The Fund’s underweight in US territory credits detracted from performance as prices recovered from severely distressed levels post Hurricane Maria. |
| • | | The Fund’s underweight in Chicago Board of Education bonds had a negative impact as spreads tightened during the period. |
| • | | The Fund’s overweight in the charter school sector detracted from performance as spreads widened during the period. |
Did the Fund use derivatives and, if so, how did they affect performance?
The Fund held futures contracts on US Treasuries to shorten the portfolio’s duration, which reduced its sensitivity to changes in the level of rates. Overall, this strategy had a slightly negative impact on performance during the reporting period.
Current outlook
Looking ahead, municipal market technicals (supply and demand) are expected to remain strong as demand is very robust and new-issue supply remains modest. For 2019, negative net supply is expected where interest and principal payments outpace issuance. A stable rate environment should be supportive of continued mutual fund flows, which hit a record pace through the end of the period. Despite the strong outperformance and relatively rich valuations versus Treasuries, the positive technical framework is expected to remain in place through the summer, resulting in solid returns.
| | |
| 12 | | Visit our website at pgiminvestments.com |
Fees and Expenses(unaudited)
As a shareholder of a Fund, you incur two types of costs: (1) transaction costs, including sales charges (loads) on purchase payments and redemptions, as applicable, and (2) ongoing costs, including management fees, distribution and/or service (12b-1) fees, and other Fund expenses, as applicable. This example is intended to help you understand your ongoing costs (in dollars) of investing in each Fund and to compare these costs with the ongoing costs of investing in other mutual funds.
The example is based on an investment of $1,000 held through the six-month period ended April 30, 2019. The example is for illustrative purposes only; you should consult the Prospectus for information on initial and subsequent minimum investment requirements.
Actual Expenses
The first line for each share class in the table on the following page provides information about actual account values and actual expenses. You may use the information on this line, together with the amount you invested, to estimate the expenses that you paid over the period. Simply divide your account value by $1,000 (for example, an $8,600 account value ÷ $1,000 = 8.6), then multiply the result by the number on the first line under the heading “Expenses Paid During the Six-Month Period” to estimate the expenses you paid on your account during this period.
Hypothetical Example for Comparison Purposes
The second line for each share class in the table on the following page provides information about hypothetical account values and hypothetical expenses based on the Fund’s actual expense ratio and an assumed rate of return of 5% per year before expenses, which is not the Fund’s actual return. The hypothetical account values and expenses may not be used to estimate the actual ending account balance or expenses you paid for the period. You may use this information to compare the ongoing costs of investing in the Fund and other funds. To do so, compare this 5% hypothetical example with the 5% hypothetical examples that appear in the shareholder reports of the other funds.
The Fund’s transfer agent may charge additional fees to holders of certain accounts that are not included in the expenses shown in the table on the following page. These fees apply to individual retirement accounts (IRAs) and Section 403(b) accounts. As of the close of the six-month period covered by the table, IRA fees included an annual maintenance fee of $15 per account (subject to a maximum annual maintenance fee of $25 for all accounts held by the same shareholder). Section 403(b) accounts are charged an annual $25 fiduciary maintenance fee. Some of the fees may vary in amount, or may be waived, based on your total account balance or the number of PGIM funds, including the Fund, that you own. You should consider the additional fees that were charged to your Fund account over the six-month period when you estimate the total ongoing expenses paid over the period
| | | | |
| PGIM Muni High Income Fund | | | 13 | |
Fees and Expenses(continued)
and the impact of these fees on your ending account value, as these additional expenses are not reflected in the information provided in the expense table. Additional fees have the effect of reducing investment returns.
Please note that the expenses shown in the table are meant to highlight your ongoing costs only and do not reflect any transactional costs such as sales charges (loads). Therefore, the second line for each share class in the table is useful in comparing ongoing costs only and will not help you determine the relative total costs of owning different funds. In addition, if these transactional costs were included, your costs would have been higher.
| | | | | | | | | | | | | | | | | | |
| | | | |
PGIM Muni High
Income Fund | | Beginning Account
Value
November 1, 2018 | | | Ending Account
Value
April 30, 2019 | | | Annualized
Expense Ratio
Based on the
Six-Month Period | | | Expenses Paid
During the
Six-Month Period* | |
| Class A | | Actual | | $ | 1,000.00 | | | $ | 1,054.40 | | | | 0.85 | % | | $ | 4.33 | |
| | Hypothetical | | $ | 1,000.00 | | | $ | 1,020.58 | | | | 0.85 | % | | $ | 4.26 | |
| Class B | | Actual | | $ | 1,000.00 | | | $ | 1,051.70 | | | | 1.17 | % | | $ | 5.95 | |
| | Hypothetical | | $ | 1,000.00 | | | $ | 1,018.99 | | | | 1.17 | % | | $ | 5.86 | |
| Class C | | Actual | | $ | 1,000.00 | | | $ | 1,050.50 | | | | 1.60 | % | | $ | 8.13 | |
| | Hypothetical | | $ | 1,000.00 | | | $ | 1,016.86 | | | | 1.60 | % | | $ | 8.00 | |
| Class Z | | Actual | | $ | 1,000.00 | | | $ | 1,054.50 | | | | 0.64 | % | | $ | 3.26 | |
| | Hypothetical | | $ | 1,000.00 | | | $ | 1,021.62 | | | | 0.64 | % | | $ | 3.21 | |
| Class R6 | | Actual | | $ | 1,000.00 | | | $ | 1,055.80 | | | | 0.60 | % | | $ | 3.06 | |
| | | Hypothetical | | $ | 1,000.00 | | | $ | 1,021.82 | | | | 0.60 | % | | $ | 3.01 | |
| | | | | | | | | | | | | | | | | | |
*Fund expenses (net of fee waivers or subsidies, if any) for each share class are equal to the annualized expense ratio for each share class (provided in the table), multiplied by the average account value over the period, multiplied by the 181 days in the six-month period ended April 30, 2019, and divided by the 365 days in the Fund’s fiscal year ended April 30, 2019 (to reflect the six-month period). Expenses presented in the table include the expenses of any underlying portfolios in which the Fund may invest.
| | |
| 14 | | Visit our website at pgiminvestments.com |
Schedule of Investments
as of April 30, 2019
| | | | | | | | | | | | | | | | |
| | | | |
| Description | | Interest
Rate | | | Maturity
Date | | | Principal
Amount (000)# | | | Value | |
| | | | |
LONG-TERM INVESTMENTS 98.8% | | | | | | | | | | | | | | | | |
| | | | |
Alabama 0.5% | | | | | | | | | | | | | | | | |
Jefferson Cnty. Sewer Rev., | | | | | | | | | | | | | | | | |
Sr. Lien, Warrants, Ser. A, AGM, Rfdg. | | | 5.000 | % | | | 10/01/44 | | | | 500 | | | $ | 550,705 | |
Sr. Lien, Warrants, Ser. A, AGM, Rfdg. | | | 5.250 | | | | 10/01/48 | | | | 500 | | | | 555,680 | |
Selma Indl. Dev. Brd. Rev., | | | | | | | | | | | | | | | | |
Gulf Opp. Zone, Intl. Paper Co., Ser. A | | | 5.800 | | | | 05/01/34 | | | | 1,000 | | | | 1,036,410 | |
Gulf Opp. Zone, Intl. Paper Co., Ser. A | | | 6.250 | | | | 11/01/33 | | | | 1,750 | | | | 1,786,540 | |
| | | | | | | | | | | | | | | | |
| | | | | | | | | | | | | | | 3,929,335 | |
| | | | | | | | | | | | | | | | |
| | | | |
Arizona 3.9% | | | | | | | | | | | | | | | | |
Arizona Indl. Dev. Auth. Rev., | | | | | | | | | | | | | | | | |
Basis Schs. Proj., Ser. A, Rfgd., 144A | | | 5.375 | | | | 07/01/50 | | | | 1,000 | | | | 1,064,980 | |
Pinecrest Academy-Horizon Inspirada & St. Rose Campus, Ser. A, 144A | | | 5.750 | | | | 07/15/48 | | | | 1,500 | | | | 1,639,215 | |
Maricopa Cnty. Indl. Dev. Auth. Rev., | | | | | | | | | | | | | | | | |
Horizon Cmnty. Learning Ctr., Rfdg. | | | 5.000 | | | | 07/01/35 | | | | 2,000 | | | | 2,086,680 | |
Paradise Schs. Projs. Parago, Rfdg., 144A | | | 5.000 | | | | 07/01/47 | | | | 1,000 | | | | 1,050,250 | |
Reid Traditional Schs. Projs. | | | 5.000 | | | | 07/01/47 | | | | 1,000 | | | | 1,076,540 | |
Phoenix City Indl. Dev. Auth. Rev., | | | | | | | | | | | | | | | | |
Basis Schs. Projs., Rfdg., 144A | | | 5.000 | | | | 07/01/45 | | | | 1,000 | | | | 1,040,240 | |
Basis Schs. Projs., Ser. A, Rfdg., 144A | | | 5.000 | | | | 07/01/46 | | | | 1,000 | | | | 1,039,690 | |
Great Hearts Academies Proj. | | | 5.000 | | | | 07/01/44 | | | | 2,250 | | | | 2,390,580 | |
Pima Cnty. Indl. Dev. Auth. Rev.,
Tucson Elec. Pwr. Co. Proj., Rfdg. | | | 4.000 | | | | 09/01/29 | | | | 3,000 | | | | 3,136,470 | |
Salt Verde Fin. Corp. Gas Rev., | | | | | | | | | | | | | | | | |
Sr. Bonds | | | 5.000 | | | | 12/01/32 | | | | 4,890 | | | | 6,036,656 | |
Sr. Bonds | | | 5.000 | | | | 12/01/37 | | | | 9,705 | | | | 12,222,477 | |
Tempe Indl. Dev. Auth. Rev.,
Friendship Vlg., Ser. A, Rfdg. | | | 6.250 | | | | 12/01/42 | | | | 1,000 | | | | 1,056,620 | |
| | | | | | | | | | | | | | | | |
| | | | | | | | | | | | | | | 33,840,398 | |
| | | | | | | | | | | | | | | | |
| | | | |
California 9.2% | | | | | | | | | | | | | | | | |
ABAG Fin. Auth. for Nonprofit Corp. Rev.,
Episcopal Sr. Cmnty., Rfdg. | | | 6.125 | | | | 07/01/41 | | | | 775 | | | | 834,101 | |
California Cnty. Tob. Secur. Agcy. Rev., | | | | | | | | | | | | | | | | |
Conv., CABS | | | 5.250 | (cc) | | | 06/01/21 | | | | 2,220 | | | | 2,256,075 | |
Conv., CABS | | | 5.450 | (cc) | | | 06/01/28 | | | | 4,500 | | | | 4,579,290 | |
Conv., CABS, Ser. B | | | 5.100 | (cc) | | | 06/01/28 | | | | 1,750 | | | | 1,750,525 | |
California Hlth. Facs. Fin. Auth. Rev., | | | | | | | | | | | | | | | | |
St. Joseph Hlth. Sys., Ser. A | | | 5.750 | | | | 07/01/39 | | | | 1,770 | | | | 1,781,647 | |
Stanford Hosp., Ser. A-3, Rfdg. (Pre-refunded 11/15/21)(ee) | | | 5.500 | | | | 11/15/40 | | | | 750 | | | | 825,562 | |
See Notes to Financial Statements.
| | | | |
| PGIM Muni High Income Fund | | | 15 | |
Schedule of Investments(continued)
as of April 30, 2019
| | | | | | | | | | | | | | | | |
| | | | |
| Description | | Interest
Rate | | | Maturity
Date | | | Principal
Amount (000)# | | | Value | |
| | | | |
California (cont’d.) | | | | | | | | | | | | | | | | |
California Mun. Fin. Auth. Rev., | | | | | | | | | | | | | | | | |
CHF-Davis I, LLC, W. Village Student Housing Proj. | | | 5.000 | % | | | 05/15/51 | | | | 1,000 | | | $ | 1,132,580 | |
River Chrt. Schs., Ser. A, 144A | | | 5.500 | | | | 06/01/48 | | | | 750 | | | | 799,695 | |
Sr. Lien, LINXS APM Proj., Ser. A, AMT | | | 5.000 | | | | 12/31/47 | | | | 1,250 | | | | 1,422,462 | |
California Poll. Ctrl. Fin. Auth. Rev., | | | | | | | | | | | | | | | | |
Green Bond, Calplant I Proj., AMT, 144A | | | 8.000 | | | | 07/01/39 | | | | 2,750 | | | | 2,980,615 | |
Wtr. Facs., Amer. Wtr. Cap. Corp. Proj., 144A | | | 5.250 | | | | 08/01/40 | | | | 500 | | | | 523,095 | |
California St., | | | | | | | | | | | | | | | | |
GO, Var. Purp. | | | 5.500 | | | | 11/01/39 | | | | 1,000 | | | | 1,018,790 | |
GO, Var. Purp. | | | 6.000 | | | | 11/01/39 | | | | 1,500 | | | | 1,533,240 | |
California St. Pub. Wks. Brd. Lease Rev.,
Judicial Council Proj., Ser. D | | | 5.000 | | | | 12/01/31 | | | | 1,000 | | | | 1,077,470 | |
California St. Sch. Fin. Auth. Chrt. Sch. Rev., | | | | | | | | | | | | | | | | |
Alliance Clg.-Ready Pub. Schs., Ser. A, 144A | | | 5.000 | | | | 07/01/45 | | | | 750 | | | | 815,520 | |
Kipp LA Proj., Ser. A, 144A | | | 5.000 | | | | 07/01/45 | | | | 650 | | | | 709,430 | |
Kipp LA Proj., Ser. A, 144A | | | 5.000 | | | | 07/01/47 | | | | 820 | | | | 914,718 | |
California Statewide Cmntys. Dev. Auth. Rev., | | | | | | | | | | | | | | | | |
899 Charleston Proj., Ser. A, Rfdg., 144A | | | 5.250 | | | | 11/01/44 | | | | 750 | | | | 803,498 | |
BE. Grp., 144A | | | 7.250 | | | | 11/15/41 | | | | 500 | | | | 513,570 | |
Cottage Hlth. Oblig. Grp., Rfdg. | | | 5.000 | | | | 11/01/40 | | | | 2,000 | | | | 2,074,180 | |
Loma Linda Univ. Med. Ctr., Ser. A | | | 5.250 | | | | 12/01/44 | | | | 1,000 | | | | 1,086,900 | |
Loma Linda Univ. Med. Ctr., Ser. A, 144A | | | 5.250 | | | | 12/01/43 | | | | 4,475 | | | | 5,045,383 | |
Loma Linda Univ. Med. Ctr., Ser. A, 144A | | | 5.250 | | | | 12/01/56 | | | | 3,500 | | | | 3,844,610 | |
Loma Linda Univ. Med. Ctr., Ser. A, 144A | | | 5.500 | | | | 12/01/58 | | | | 3,000 | | | | 3,408,870 | |
Fontana Spl. Tax Cmnty. Facs.,
Dist. 22, Sierra Hills, Rfdg. | | | 5.000 | | | | 09/01/34 | | | | 500 | | | | 546,070 | |
Golden St. Tob. Secur. Corp., Tob. Settlement Rev., | | | | | | | | | | | | | | | | |
Asset Bkd., 1st Sub., Ser. B, CABS | | | 6.661 | (t) | | | 06/01/47 | | | | 10,000 | | | | 1,587,800 | |
Asset Bkd., Sr., Ser. A-2, CABS | | | 5.300 | (cc) | | | 06/01/37 | | | | 5,000 | | | | 5,087,350 | |
Ser. A-1, Rfdg. | | | 5.000 | | | | 06/01/47 | | | | 3,525 | | | | 3,449,882 | |
Ser. A-1, Rfdg. | | | 5.250 | | | | 06/01/47 | | | | 2,500 | | | | 2,515,400 | |
Ser. A-2, Rfdg. | | | 5.000 | | | | 06/01/47 | | | | 3,500 | | | | 3,425,415 | |
Inland Valley Dev. Agcy. Tax Alloc.,
Ser. A, Rfdg. | | | 5.000 | | | | 09/01/44 | | | | 1,000 | | | | 1,111,690 | |
Lincoln Pub. Fing., Auth. Spl. Assmt.,
Twelve Bridges, Sub., Ser. B | | | 6.000 | | | | 09/02/27 | | | | 1,000 | | | | 1,093,970 | |
Long Beach Bond Fin. Auth. Nat. Gas Pur. Rev., | | | | | | | | | | | | | | | | |
Ser. A | | | 5.000 | | | | 11/15/35 | | | | 3,510 | | | | 4,401,856 | |
Ser. A | | | 5.500 | | | | 11/15/37 | | | | 685 | | | | 908,098 | |
M-S-R Energy Auth. Calif. Rev., | | | | | | | | | | | | | | | | |
Ser. A | | | 6.500 | | | | 11/01/39 | | | | 2,060 | | | | 3,035,843 | |
Ser. A | | | 7.000 | | | | 11/01/34 | | | | 1,650 | | | | 2,429,064 | |
Palomar Pomerado Healthcare Dist. Calif.,
COP (Pre-refunded 11/01/20)(ee) | | | 6.000 | | | | 11/01/41 | | | | 1,800 | | | | 1,918,656 | |
See Notes to Financial Statements.
| | | | | | | | | | | | | | | | |
| | | | |
| Description | | Interest
Rate | | | Maturity
Date | | | Principal
Amount (000)# | | | Value | |
| | | | |
California (cont’d.) | | | | | | | | | | | | | | | | |
Port of Oakland Rev.,
Ser. O, AMT, Rfdg. | | | 5.125 | % | | | 05/01/31 | | | | 1,000 | | | $ | 1,057,800 | |
Riverside Cnty. Pub. Fing. Auth. Rev.,
Capital Facs. Proj. | | | 5.250 | | | | 11/01/45 | | | | 1,000 | | | | 1,169,330 | |
San Buenaventura Rev., | | | | | | | | | | | | | | | | |
Cmnty. Mem. Hlth. Sys. | | | 7.500 | | | | 12/01/41 | | | | 1,000 | | | | 1,110,130 | |
Cmnty. Mem. Hlth. Sys. | | | 8.000 | | | | 12/01/26 | | | | 500 | | | | 568,565 | |
San Francisco City & Cnty. Arpt. Comm. Rev.,
Ser. C, AMT, Rfdg. | | | 5.000 | | | | 05/01/25 | | | | 1,000 | | | | 1,062,020 | |
Santa Margarita Wtr. Dist. Spl. Tax Cmty. Facs.,
Ser. 2013-1, Vlg. of Sendero | | | 5.625 | | | | 09/01/36 | | | | 675 | | | | 733,131 | |
South Bayside Wste. Mgmt. Auth., Sol. Wste. Enterprise Rev.,
Shoreway Environmental, Ser. A | | | 6.000 | | | | 09/01/36 | | | | 500 | | | | 506,955 | |
| | | | | | | | | | | | | | | | |
| | | | | | | | | | | | | | | 79,450,851 | |
| | | | | | | | | | | | | | | | |
| | | | |
Colorado 2.7% | | | | | | | | | | | | | | | | |
City & Cnty. of Denver Arpt. Sys. Rev.,
Sub. Sys., Ser. A, AMT, Rfdg. | | | 4.000 | | | | 12/01/48 | | | | 2,000 | | | | 2,089,260 | |
City & Cnty. of Denver Rev.,
United Airlines Inc. Proj., AMT, Rfdg. | | | 5.000 | | | | 10/01/32 | | | | 500 | | | | 539,075 | |
Colorado Bridge Enterprise Rev.,
Central 70 Proj., AMT | | | 4.000 | | | | 06/30/51 | | | | 1,500 | | | | 1,543,635 | |
Colorado Edl. & Cultural Facs. Auth. Rev., | | | | | | | | | | | | | | | | |
Impt., Chrt. Sch. Univ. LA, Rfdg. | | | 5.000 | | | | 12/15/45 | | | | 1,000 | | | | 1,051,080 | |
Lighthouse Bldg. Corp., Rfdg. | | | 5.000 | | | | 11/01/44 | | | | 885 | | | | 907,638 | |
Rfdg. & Impt., Chrt. Sch. Skyview Academy Proj., 144A | | | 5.375 | | | | 07/01/44 | | | | 1,350 | | | | 1,402,542 | |
Windsor Chrt. Sch., Rfdg., 144A | | | 5.000 | | | | 09/01/46 | | | | 1,390 | | | | 1,392,933 | |
Colorado Hlth. Facs. Auth. Rev., | | | | | | | | | | | | | | | | |
Christian Living Cmntys. Proj., Rfdg. | | | 5.250 | | | | 01/01/37 | | | | 550 | | | | 570,702 | |
Covenant Retirement Cmntys., Rfdg. | | | 5.000 | | | | 12/01/35 | | | | 1,250 | | | | 1,375,850 | |
Vail Valley Med. Ctr. Proj. | | | 4.000 | | | | 01/15/45 | | | | 2,500 | | | | 2,588,900 | |
E-470 Pub. Hwy. Auth. Rev.,
Ser. C, Rfdg. | | | 5.375 | | | | 09/01/26 | | | | 1,000 | | | | 1,041,860 | |
Park Creek Met. Dist. Ltd. Ppty. Tax Alloc.,
Sr. Lmt. Prop. TA., Rfdg. | | | 5.000 | | | | 12/01/45 | | | | 1,500 | | | | 1,650,780 | |
Plaza Co. Met. Dist. 1 Tax Alloc.,
Rfdg., 144A | | | 5.000 | | | | 12/01/40 | | | | 1,000 | | | | 1,036,400 | |
Pub. Auth. Energy Nat. Gas Pur. Rev., | | | | | | | | | | | | | | | | |
| | | 6.500 | | | | 11/15/38 | | | | 4,045 | | | | 6,026,484 | |
| | | | | | | | | | | | | | | | |
| | | | | | | | | | | | | | | 23,217,139 | |
| | | | | | | | | | | | | | | | |
See Notes to Financial Statements.
| | | | |
| PGIM Muni High Income Fund | | | 17 | |
Schedule of Investments(continued)
as of April 30, 2019
| | | | | | | | | | | | | | | | |
| | | | |
| Description | | Interest
Rate | | | Maturity
Date | | | Principal
Amount (000)# | | | Value | |
| | | | |
Connecticut 0.6% | | | | | | | | | | | | | | | | |
Connecticut St. Hlth. & Edl. Facs. Auth. Rev.,
Western Conn. Hlth., Ser. M | | | 5.375 | % | | | 07/01/41 | | | | 1,250 | | | $ | 1,321,537 | |
Harbor Point Infrastructure Impt. Dist. Tax Alloc., | | | | | | | | | | | | | | | | |
Harbor Point Proj. Rfdg., 144A | | | 5.000 | | | | 04/01/39 | | | | 2,000 | | | | 2,140,060 | |
Harbor Point Proj., Ser. A (Pre-refunded 04/01/20)(ee) | | | 7.875 | | | | 04/01/39 | | | | 2,000 | | | | 2,112,420 | |
| | | | | | | | | | | | | | | | |
| | | | | | | | | | | | | | | 5,574,017 | |
| | | | | | | | | | | | | | | | |
| | | | |
Delaware 0.4% | | | | | | | | | | | | | | | | |
Delaware St. Econ. Dev. Auth. Rev., | | | | | | | | | | | | | | | | |
Chrt. Sch.-Aspira Chrt., Ser. A | | | 5.000 | | | | 06/01/36 | | | | 1,000 | | | | 1,066,800 | |
Newark Chrt. Sch., Inc., Ser. A, Rfdg. | | | 5.000 | | | | 09/01/46 | | | | 500 | | | | 543,150 | |
Delaware St. Hlth. Facs. Auth. Rev.,
Nanticoke Mem. Hosp., Rfdg. | | | 5.000 | | | | 07/01/32 | | | | 1,375 | | | | 1,484,024 | |
| | | | | | | | | | | | | | | | |
| | | | | | | | | | | | | | | 3,093,974 | |
| | | | | | | | | | | | | | | | |
| | | | |
District of Columbia 1.4% | | | | | | | | | | | | | | | | |
Dist. of Columbia, Rev., | | | | | | | | | | | | | | | | |
Friendship Pub. Chrt. Sch. | | | 5.000 | | | | 06/01/42 | | | | 3,500 | | | | 3,660,895 | |
Gallaudet Univ. | | | 5.500 | | | | 04/01/34 | | | | 400 | | | | 425,984 | |
Kipp Chrt. Sch., Rfdg. (Pre-refunded 07/01/23)(ee) | | | 6.000 | | | | 07/01/43 | | | | 850 | | | | 997,050 | |
Kipp Chrt. Sch., Rfdg. (Pre-refunded 07/01/23)(ee) | | | 6.000 | | | | 07/01/48 | | | | 725 | | | | 850,425 | |
Kipp DC Iss., Ser. A, Rfdg. | | | 5.000 | | | | 07/01/48 | | | | 1,250 | | | | 1,384,775 | |
Rocketship DC, Oblig. Grp., Ser. A, 144A | | | 5.000 | | | | 06/01/49 | | | | 2,000 | | | | 2,075,620 | |
Metropolitan Washington D.C. Arpt. Auth. Sys. Rev.,
Dulles Toll Rd., Ser. A, Rfdg. | | | 5.000 | | | | 10/01/53 | | | | 2,500 | | | | 2,650,775 | |
| | | | | | | | | | | | | | | | |
| | | | | | | | | | | | | | | 12,045,524 | |
| | | | | | | | | | | | | | | | |
| | | | |
Florida 8.9% | | | | | | | | | | | | | | | | |
Boggy Creek Impt. Dist. Spl. Assmt.,
Ser. 2013, Rfdg. | | | 5.125 | | | | 05/01/43 | | | | 2,695 | | | | 2,726,154 | |
Broward Cnty. Sys. Arpt. Rev.,
Ser. A, AMT | | | 5.250 | | | | 10/01/43 | | | | 1,500 | | | | 1,653,240 | |
Capital Tr. Agcy. Rev.,
Air Cargo, Aero Miami FX LLC, Sr. Lien, Ser. A, Rfdg. | | | 5.350 | | | | 07/01/29 | | | | 1,915 | | | | 1,969,137 | |
Celebration Pointe CDD 1 Spl. Assmt.,
Alachua Cnty., 144A | | | 5.000 | | | | 05/01/48 | | | | 1,000 | | | | 1,024,490 | |
Citizens Ppty. Ins. Corp. Rev.,
Sr. Sec’d., Ser. A-1 | | | 5.000 | | | | 06/01/22 | | | | 1,000 | | | | 1,098,530 | |
Cityplace CDD Spl. Assmt.,
Rfdg. | | | 5.000 | | | | 05/01/26 | | | | 1,000 | | | | 1,128,330 | |
Davie Edl. Facs. Rev.,
Nova Southeastern Univ. Proj., Ser. A | | | 5.625 | | | | 04/01/43 | | | | 500 | | | | 549,450 | |
See Notes to Financial Statements.
| | | | | | | | | | | | | | | | |
| | | | |
| Description | | Interest
Rate | | | Maturity
Date | | | Principal
Amount (000)# | | | Value | |
| | | | |
Florida (cont’d.) | | | | | | | | | | | | | | | | |
Davie Edl. Facs. Rev., (cont’d.)
Nova Southeastern Univ. Proj., Ser. A | | | 6.000 | % | | | 04/01/42 | | | | 1,000 | | | $ | 1,122,510 | |
Florida Dev. Fin. Corp. Rev., | | | | | | | | | | | | | | | | |
Bay Area Chrt. Fndtn., Ser. A | | | 7.750 | | | | 06/15/42 | | | | 2,000 | | | | 2,131,600 | |
Renaissance Chrt. Sch., Ser. A | | | 6.000 | | | | 09/15/40 | | | | 1,750 | | | | 1,801,993 | |
Virgin Trains USA Pass, Ser. A, AMT, Rfdg. (Mandatory put date 01/01/29), 144A | | | 6.500 | (cc) | | | 01/01/49 | | | | 5,000 | | | | 5,122,850 | |
Florida Higher Edl. Facs. Fin. Auth. Rev.,
Ringling Clg. Proj. | | | 5.000 | | | | 03/01/47 | | | | 2,500 | | | | 2,755,800 | |
Greater Orlando Aviation Auth. Orlando Arpt. Facs. Rev., | | | | | | | | | | | | | | | | |
Priority, Sub-Ser. A, AMT | | | 4.000 | | | | 10/01/52 | | | | 3,350 | | | | 3,493,614 | |
Spl. Purp. - JetBlue Airways Corp. Proj., AMT, Rfdg. | | | 5.000 | | | | 11/15/26 | | | | 500 | | | | 537,600 | |
Spl. Purp. - JetBlue Airways Corp. Proj., AMT, Rfdg. | | | 5.000 | | | | 11/15/36 | | | | 4,700 | | | | 4,935,799 | |
Indigo Cmnty. Dev. Dist. Spl. Assmt.,
(original cost $820,000; purchased 02/16/05)^(d)(f) | | | 5.750 | | | | 05/01/36 | | | | 820 | | | | 483,800 | |
Lakewood Ranch Stewardship Dist., Spl. Assmt., | | | | | | | | | | | | | | | | |
Lakewood Centre North Proj. | | | 4.875 | | | | 05/01/45 | | | | 1,000 | | | | 1,012,470 | |
Lakewood Nat’l. & Polo Run Projs. | | | 4.625 | | | | 05/01/27 | | | | 500 | | | | 517,825 | |
Lakewood Nat’l. & Polo Run Projs. | | | 5.375 | | | | 05/01/47 | | | | 1,000 | | | | 1,050,000 | |
N E sector Proj., Phase 1B, 144A | | | 5.450 | | | | 05/01/48 | | | | 1,000 | | | | 1,053,160 | |
Vlg. Lakewood Ranch S. Proj. | | | 4.250 | | | | 05/01/26 | | | | 250 | | | | 254,223 | |
Vlg. Lakewood Ranch S. Proj. | | | 5.125 | | | | 05/01/46 | | | | 1,500 | | | | 1,537,170 | |
Martin Cnty. Indl. Dev. Auth. Rev., | | | | | | | | | | | | | | | | |
Indiantown Cogeneration Proj., AMT, Rfdg., 144A | | | 3.950 | | | | 12/15/21 | | | | 1,750 | | | | 1,783,670 | |
Indiantown Cogeneration Proj., AMT, Rfdg., 144A | | | 4.200 | | | | 12/15/25 | | | | 1,000 | | | | 1,019,080 | |
Midtown Miami Cmnty. Dev. Dist. Spl. Assmt.,
Pkg. Garage Proj., Ser. A, Rfdg. | | | 5.000 | | | | 05/01/37 | | | | 1,980 | | | | 2,064,368 | |
North Sumter Cnty. Util. Dependent Dist., | | | | | | | | | | | | | | | | |
Solid Wste. Rev. | | | 5.000 | | | | 10/01/42 | | | | 2,000 | | | | 2,120,040 | |
Util. Rev. | | | 5.750 | | | | 10/01/43 | | | | 1,500 | | | | 1,584,495 | |
Orange Cnty. Hlth. Facs. Auth. Rev.,
Orlando Hlth. Oblig. Grp., Ser. A | | | 4.000 | | | | 10/01/49 | | | | 3,450 | | | | 3,595,659 | |
Palm Beach Hlth. Facs. Auth. Rev., | | | | | | | | | | | | | | | | |
BRRH Corp. Oblig. Grp., Rfdg. | | | 5.000 | | | | 12/01/31 | | | | 500 | | | | 559,400 | |
Sinai Residences Boca Raton Proj., Ser. A, Rfdg. | | | 7.500 | | | | 06/01/49 | | | | 1,000 | | | | 1,126,560 | |
Sarasota Cnty. Pub. Hosp. Dist. Rev.,
Sarasota Mem. Hosp. | | | 4.000 | | | | 07/01/48 | | | | 5,000 | | | | 5,177,200 | |
South Lake Cnty. Hosp. Dist. Rev., | | | | | | | | | | | | | | | | |
South Lake Hosp., Rfdg. | | | 5.250 | | | | 10/01/34 | | | | 1,250 | | | | 1,285,550 | |
South Lake Hosp., Ser. A | | | 6.250 | | | | 04/01/39 | | | | 1,910 | | | | 1,915,444 | |
South Miami Hlth. Facs. Auth. Rev.,
Baptist Hlth. South Florida, Rfdg. | | | 5.000 | | | | 08/15/47 | | | | 1,000 | | | | 1,142,500 | |
Tallahassee Hlth. Facs. Mem. Rev.,
Ser. A | | | 5.000 | | | | 12/01/55 | | | | 1,430 | | | | 1,557,756 | |
See Notes to Financial Statements.
| | | | |
| PGIM Muni High Income Fund | | | 19 | |
Schedule of Investments(continued)
as of April 30, 2019
| | | | | | | | | | | | | | | | |
| | | | |
| Description | | Interest
Rate | | | Maturity
Date | | | Principal
Amount (000)# | | | Value | |
| | | | |
Florida (cont’d.) | | | | | | | | | | | | | | | | |
Village CDD No. 7,
Fla. Spl. Assmt., Rfdg. | | | 4.000 | % | | | 05/01/36 | | | | 1,910 | | | $ | 1,991,251 | |
Village CDD No. 8,
Fla. Spl. Assmt., Phase II, Rfdg. | | | 6.125 | | | | 05/01/39 | | | | 2,100 | | | | 2,180,430 | |
Village CDD No. 9, | | | | | | | | | | | | | | | | |
Fla. Spl. Assmt. | | | 7.000 | | | | 05/01/41 | | | | 755 | | | | 830,583 | |
Fla. Spl. Assmt., Rfdg. | | | 5.500 | | | | 05/01/42 | | | | 2,080 | | | | 2,198,602 | |
Village CDD No.10, | | | | | | | | | | | | | | | | |
Fla. Spl. Assmt. | | | 5.125 | | | | 05/01/43 | | | | 1,070 | | | | 1,155,129 | |
Fla. Spl. Assmt. | | | 6.000 | | | | 05/01/44 | | | | 900 | | | | 1,016,919 | |
Village CDD No.11,
Fla. Spl. Assmt. | | | 4.500 | | | | 05/01/45 | | | | 1,405 | | | | 1,438,537 | |
Village CDD No.12,
Fla. Spl. Assmt., 144A | | | 4.250 | | | | 05/01/43 | | | | 2,900 | | | | 2,978,619 | |
| | | | | | | | | | | | | | | | |
| | | | | | | | | | | | | | | 76,681,537 | |
| | | | | | | | | | | | | | | | |
| | | | |
Georgia 1.1% | | | | | | | | | | | | | | | | |
Atlanta Arpt. Rev.,
Gen., Ser. B, AMT, Rfdg. | | | 5.000 | | | | 01/01/30 | | | | 500 | | | | 523,105 | |
Atlanta Dev. Auth. Rev.,
GA Proton Treatment Ctr., Ser. A-1 | | | 6.000 | | | | 01/01/23 | | | | 1,700 | | | | 1,724,446 | |
Burke Cnty. Dev. Auth. Rev.,
Oglethorpe Pwr. Corp.-Vogtle Proj., Ser. D, Rfdg. | | | 4.125 | | | | 11/01/45 | | | | 2,000 | | | | 2,054,180 | |
Clayton Cnty. Dev. Auth. Spl. Facs. Rev.,
Delta Air Lines, Ser. A, Rfdg. | | | 8.750 | | | | 06/01/29 | | | | 2,000 | | | | 2,143,060 | |
Henry Cnty. Wtr. & Swr. Auth. Rev.,
AMBAC | | | 6.150 | | | | 02/01/20 | | | | 385 | | | | 398,067 | |
Priv. Colleges & Univs. Auth. Rev.,
Savannah Clg. Art & Design Proj. | | | 5.000 | | | | 04/01/44 | | | | 1,500 | | | | 1,634,295 | |
Rockdale Cnty. Dev. Auth. Rev.,
Pratt Paper LLC Proj., AMT, Rfdg., 144A | | | 4.000 | | | | 01/01/38 | | | | 1,000 | | | | 1,014,610 | |
| | | | | | | | | | | | | | | | |
| | | | | | | | | | | | | | | 9,491,763 | |
| | | | | | | | | | | | | | | | |
| | | | |
Hawaii 0.6% | | | | | | | | | | | | | | | | |
Hawaii St. Dept. Budget & Fin. Rev., | | | | | | | | | | | | | | | | |
Spl. Purp. Rev., 15 Craigside Proj., Ser. A (Pre-refunded 11/15/19)(ee) | | | 9.000 | | | | 11/15/44 | | | | 1,000 | | | | 1,038,560 | |
Spl. Purp. Rev., Hawaii Pacific Hlth. Oblig., Ser. A | | | 5.500 | | | | 07/01/43 | | | | 2,500 | | | | 2,782,500 | |
Spl. Purp. Rev., Hawaiian Elec. Co. | | | 6.500 | | | | 07/01/39 | | | | 1,000 | | | | 1,009,460 | |
| | | | | | | | | | | | | | | | |
| | | | | | | | | | | | | | | 4,830,520 | |
| | | | | | | | | | | | | | | | |
See Notes to Financial Statements.
| | | | | | | | | | | | | | | | |
| | | | |
| Description | | Interest
Rate | | | Maturity
Date | | | Principal
Amount (000)# | | | Value | |
| | | | |
Illinois 12.6% | | | | | | | | | | | | | | | | |
Chicago Brd. of Edu., | | | | | | | | | | | | | | | | |
GO, Ser. A | | | 5.500 | % | | | 12/01/39 | | | | 535 | | | $ | 552,564 | |
GO, Ser. A, 144A | | | 7.000 | | | | 12/01/46 | | | | 1,500 | | | | 1,816,035 | |
GO, Ser. A, Rfdg. | | | 5.000 | | | | 12/01/35 | | | | 500 | | | | 536,160 | |
GO, Ser. A, Rfdg. | | | 7.000 | | | | 12/01/44 | | | | 3,190 | | | | 3,730,737 | |
GO, Ser. C | | | 5.250 | | | | 12/01/35 | | | | 1,015 | | | | 1,076,824 | |
GO, Ser. D | | | 5.000 | | | | 12/01/46 | | | | 1,470 | | | | 1,540,634 | |
GO, Ser. G, Rfdg. | | | 5.000 | | | | 12/01/34 | | | | 2,155 | | | | 2,315,978 | |
GO, Ser. H | | | 5.000 | | | | 12/01/46 | | | | 2,390 | | | | 2,511,125 | |
Spl. Tax | | | 6.000 | | | | 04/01/46 | | | | 1,500 | | | | 1,735,875 | |
Chicago O’Hare Int’l. Arpt. Rev., | | | | | | | | | | | | | | | | |
Gen., Sr. Lien, Ser. D, AMT | | | 5.000 | | | | 01/01/52 | | | | 1,000 | | | | 1,117,470 | |
Gen., Third Lien, Ser. C, AMT, Rfdg. | | | 5.375 | | | | 01/01/39 | | | | 1,500 | | | | 1,646,250 | |
Ser. C, AMT, Rfdg. | | | 4.375 | | | | 01/01/40 | | | | 2,000 | | | | 2,104,200 | |
Sr. Lien, Ser. A, AMT, Rfdg. | | | 5.000 | | | | 01/01/48 | | | | 1,000 | | | | 1,149,800 | |
Sr. Lien, Ser. G, AMT | | | 5.000 | | | | 01/01/52 | | | | 1,000 | | | | 1,117,470 | |
Trips Oblig. Grp., AMT | | | 5.000 | | | | 07/01/48 | | | | 1,000 | | | | 1,126,440 | |
Chicago Transit Auth. Rev.,
Second Lien | | | 5.000 | | | | 12/01/46 | | | | 5,000 | | | | 5,523,250 | |
Chicago Wstwtr. Transmn. Rev.,
Second Lien, Ser. C, Rmkt., Rfdg. | | | 5.000 | | | | 01/01/39 | | | | 3,355 | | | | 3,637,625 | |
Chicago, IL, | | | | | | | | | | | | | | | | |
GO, Ser. 2003 B, Rmkt., Rfdg. | | | 5.000 | | | | 01/01/23 | | | | 750 | | | | 802,463 | |
GO, Ser. 2005 D, Rmkt., Rfdg. | | | 5.500 | | | | 01/01/37 | | | | 5,790 | | | | 6,292,282 | |
GO, Ser. 2007 E, Rmkt., Rfdg. | | | 5.500 | | | | 01/01/35 | | | | 3,000 | | | | 3,275,910 | |
GO, Ser. A | | | 5.500 | | | | 01/01/39 | | | | 1,865 | | | | 2,018,676 | |
GO, Ser. A | | | 5.500 | | | | 01/01/49 | | | | 1,000 | | | | 1,103,170 | |
GO, Ser. A, Rfdg. | | | 5.000 | | | | 01/01/34 | | | | 3,600 | | | | 3,789,900 | |
GO, Ser. A, Rfdg. | | | 6.000 | | | | 01/01/38 | | | | 2,500 | | | | 2,848,850 | |
GO, Ser. C, Rfdg. | | | 5.000 | | | | 01/01/26 | | | | 1,000 | | | | 1,106,340 | |
GO, Ser. C, Rfdg. | | | 5.000 | | | | 01/01/38 | | | | 2,500 | | | | 2,648,450 | |
Illinois Fin. Auth. Rev., | | | | | | | | | | | | | | | | |
Field Museum of Natural History, Rmkt. | | | 4.450 | | | | 11/01/36 | | | | 1,000 | | | | 1,077,470 | |
Impt., Chicago Intl., Rfdg. | | | 5.000 | | | | 12/01/47 | | | | 1,000 | | | | 1,070,870 | |
Presence Hlth. Netw. Ser. C (Pre-refunded 02/15/27)(ee) | | | 4.000 | | | | 02/15/41 | | | | 10 | | | | 11,427 | |
Presence Hlth. Netw. Ser. C, Unrefunded | | | 4.000 | | | | 02/15/41 | | | | 5,990 | | | | 6,349,999 | |
Provena Hlth., Ser. A (Pre-refunded 08/15/19)(ee) | | | 7.750 | | | | 08/15/34 | | | | 10 | | | | 10,172 | |
Illinois St., | | | | | | | | | | | | | | | | |
GO | | | 4.000 | | | | 06/01/36 | | | | 3,000 | | | | 2,927,820 | |
GO | | | 5.000 | | | | 04/01/31 | | | | 2,000 | | | | 2,109,720 | |
GO | | | 5.000 | | | | 01/01/32 | | | | 1,335 | | | | 1,427,102 | |
GO | | | 5.000 | | | | 05/01/33 | | | | 950 | | | | 998,507 | |
GO | | | 5.000 | | | | 03/01/36 | | | | 1,800 | | | | 1,853,118 | |
See Notes to Financial Statements.
| | | | |
| PGIM Muni High Income Fund | | | 21 | |
Schedule of Investments(continued)
as of April 30, 2019
| | | | | | | | | | | | | | | | |
| | | | |
| Description | | Interest
Rate | | | Maturity
Date | | | Principal
Amount (000)# | | | Value | |
| | | | |
Illinois (cont’d.) | | | | | | | | | | | | | | | | |
Illinois St., (cont’d.) | | | | | | | | | | | | | | | | |
GO | | | 5.000 | % | | | 05/01/36 | | | | 2,000 | | | $ | 2,090,300 | |
GO | | | 5.000 | | | | 02/01/39 | | | | 2,215 | | | | 2,299,436 | |
GO | | | 5.000 | | | | 05/01/39 | | | | 3,000 | | | | 3,118,830 | |
GO | | | 5.250 | | | | 07/01/31 | | | | 1,000 | | | | 1,058,010 | |
GO, Rfdg. | | | 5.000 | | | | 08/01/25 | | | | 1,000 | | | | 1,052,930 | |
GO, Ser. A | | | 5.000 | | | | 01/01/33 | | | | 2,000 | | | | 2,062,600 | |
GO, Ser. A | | | 5.000 | | | | 01/01/34 | | | | 1,600 | | | | 1,648,256 | |
GO, Ser. A | | | 5.000 | | | | 12/01/35 | | | | 2,000 | | | | 2,143,060 | |
GO, Ser. A | | | 5.000 | | | | 12/01/42 | | | | 2,500 | | | | 2,649,550 | |
GO, Ser. D | | | 5.000 | | | | 11/01/27 | | | | 4,000 | | | | 4,421,280 | |
Railsplitter Tob. Settlement Auth. Rev.,
(Pre-refunded 06/01/21)(ee) | | | 6.000 | | | | 06/01/28 | | | | 2,250 | | | | 2,448,855 | |
Regl. Transn. Auth. Rev., | | | | | | | | | | | | | | | | |
Ser. A | | | 4.000 | | | | 06/01/38 | | | | 4,015 | | | | 4,210,852 | |
Ser. A | | | 4.000 | | | | 06/01/39 | | | | 3,015 | | | | 3,155,439 | |
Springfield Elec. Rev.,
Sr. Lien, Rfdg., AGM | | | 4.000 | | | | 03/01/40 | | | | 1,500 | | | | 1,556,685 | |
| | | | | | | | | | | | | | | | |
| | | | | | | | | | | | | | | 108,876,766 | |
| | | | | | | | | | | | | | | | |
| | | | |
Indiana 0.6% | | | | | | | | | | | | | | | | |
Indiana St. Fin. Auth. Rev.,
Drexel Fndtn. Edl. Facs. Proj., Ser. A | | | 7.000 | | | | 10/01/39 | | | | 1,000 | | | | 1,006,470 | |
Valparaiso Rev., | | | | | | | | | | | | | | | | |
Pratt Paper LLC Proj., AMT | | | 5.875 | | | | 01/01/24 | | | | 700 | | | | 762,769 | |
Pratt Paper LLC Proj., AMT | | | 7.000 | | | | 01/01/44 | | | | 1,500 | | | | 1,744,140 | |
Vigo Cnty. Hosp. Auth. Rev.,
Union Hosp., Inc. (Pre-refunded 09/01/21)(ee) | | | 7.750 | | | | 09/01/31 | | | | 1,500 | | | | 1,706,085 | |
| | | | | | | | | | | | | | | | |
| | | | | | | | | | | | | | | 5,219,464 | |
| | | | | | | | | | | | | | | | |
| | | | |
Iowa 0.1% | | | | | | | | | | | | | | | | |
Iowa St. Fin. Auth. Rev., | | | | | | | | | | | | | | | | |
Midwstrn. Disaster Area, Iowa Fertilizer Co. Proj., | | | | | | | | | | | | | | | | |
Rfdg. | | | 3.125 | | | | 12/01/22 | | | | 500 | | | | 503,185 | |
Midwstrn. Disaster Area, Iowa Fertilizer Co. Proj., | | | | | | | | | | | | | | | | |
Rfdg. | | | 5.000 | | | | 12/01/19 | | | | 420 | | | | 425,590 | |
| | | | | | | | | | | | | | | | |
| | | | | | | | | | | | | | | 928,775 | |
| | | | | | | | | | | | | | | | |
See Notes to Financial Statements.
| | | | | | | | | | | | | | | | |
| | | | |
| Description | | Interest
Rate | | | Maturity
Date | | | Principal
Amount (000)# | | | Value | |
| | | | |
Kansas 0.1% | | | | | | | | | | | | | | | | |
Kansas St. Dev. Fin. Auth. Rev.,
Adventist Hlth. Sys./Sunbelt, Ser. C, Rfdg. (Pre-refunded 11/15/19)(ee) | | | 5.750 | % | | | 11/15/38 | | | | 20 | | | $ | 20,423 | |
Wyandotte Cnty.-Kansas City Unified Govt. Rev.,
Legends Apts. Garage & West Lawn Proj. | | | 4.500 | | | | 06/01/40 | | | | 1,000 | | | | 1,015,380 | |
| | | | | | | | | | | | | | | | |
| | | | | | | | | | | | | | | 1,035,803 | |
| | | | | | | | | | | | | | | | |
| | | | |
Kentucky 0.6% | | | | | | | | | | | | | | | | |
Kentucky Econ. Dev. Fin. Auth. Hosp. Facs. Rev.,
Baptist Healthcare Sys., Ser. B | | | 5.000 | | | | 08/15/46 | | | | 3,500 | | | | 3,888,885 | |
Owen Cnty. Wtrwks. Sys. Rev., | | | | | | | | | | | | | | | | |
Amern. Wtr. Co. Proj., Ser. A | | | 6.250 | | | | 06/01/39 | | | | 500 | | | | 501,650 | |
Amern. Wtr. Co. Proj., Ser. B | | | 5.625 | | | | 09/01/39 | | | | 500 | | | | 505,775 | |
| | | | | | | | | | | | | | | | |
| | | | | | | | | | | | | | | 4,896,310 | |
| | | | | | | | | | | | | | | | |
| | | | |
Louisiana 0.9% | | | | | | | | | | | | | | | | |
Jefferson Parish Econ. Dev. & Port Dist. Rev.,
Kenner Discovery Hlth. Sciences Academy Proj., Ser. A, 144A | | | 5.625 | | | | 06/15/48 | | | | 2,000 | | | | 2,068,340 | |
Louisiana Loc. Govt. Envir. Facs. & Cmnty. Dev. Auth. Rev., | | | | | | | | | | | | | | | | |
Westlake Chem. Corp., Ser. A-2 | | | 6.500 | | | | 11/01/35 | | | | 1,000 | | | | 1,063,260 | |
Woman’s Hosp. Fndtn., Ser. A (Pre-refunded 10/01/20)(ee) | | | 6.000 | | | | 10/01/44 | | | | 2,000 | | | | 2,122,220 | |
Louisiana Pub. Facs. Auth. Rev.,
Ochsner Clinic Fndtn. Proj., Rfdg. | | | 5.000 | | | | 05/15/47 | | | | 1,000 | | | | 1,092,920 | |
New Orleans Sewerage Serv. Rev.,
Rfdg. | | | 5.000 | | | | 06/01/44 | | | | 1,000 | | | | 1,075,190 | |
| | | | | | | | | | | | | | | | |
| | | | | | | | | | | | | | | 7,421,930 | |
| | | | | | | | | | | | | | | | |
| | | | |
Maine 0.3% | | | | | | | | | | | | | | | | |
Maine St. Hlth. & Higher Edl. Facs. Auth. Rev.,
Maine General Med. Ctr. | | | 7.500 | | | | 07/01/32 | | | | 2,000 | | | | 2,212,360 | |
| | | | | | | | | | | | | | | | |
| | | | |
Maryland 1.4% | | | | | | | | | | | | | | | | |
Frederick Cnty. Spl. Oblig. Rev.,
Jefferson Tech. Park, Ser. B, 144A | | | 7.125 | | | | 07/01/43 | | | | 1,990 | | | | 2,003,572 | |
Frederick Cnty. Spl. Oblig. Tax,
Sub. Urbana Cmnty. Dev. Auth., Ser. B | | | 5.500 | | | | 07/01/40 | | | | 4,390 | | | | 4,515,422 | |
Howard Cnty. Tax Alloc.,
Annapolis Junction Twn. Ctr. Proj. | | | 6.100 | | | | 02/15/44 | | | | 1,420 | | | | 1,458,283 | |
See Notes to Financial Statements.
| | | | |
| PGIM Muni High Income Fund | | | 23 | |
Schedule of Investments(continued)
as of April 30, 2019
| | | | | | | | | | | | | | | | |
| | | | |
| Description | | Interest
Rate | | | Maturity
Date | | | Principal
Amount (000)# | | | Value | |
| | | | |
Maryland (cont’d.) | | | | | | | | | | | | | | | | |
Maryland Econ. Dev. Corp., Poll. Ctrl. Rev., | | | | | | | | | | | | | | | | |
Potomac Elect. Pwr. Co., Rfdg. | | | 6.200 | % | | | 09/01/22 | | | | 1,000 | | | $ | 1,018,980 | |
Transn. Facs. Proj., Ser. A, Rfdg. | | | 5.000 | | | | 06/01/35 | | | | 1,000 | | | | 1,152,400 | |
Maryland St. Hlth. & Higher Edl. Facs. Auth. Rev., | | | | | | | | | | | | | | | | |
Charlestown Cmnty., Rfdg. (Pre-refunded 01/01/21)(ee) | | | 6.250 | | | | 01/01/41 | | | | 1,500 | | | | 1,611,195 | |
Lifebridge Hlth. (Pre-refunded 07/01/21)(ee) | | | 6.000 | | | | 07/01/41 | | | | 600 | | | | 654,438 | |
| | | | | | | | | | | | | | | | |
| | | | | | | | | | | | | | | 12,414,290 | |
| | | | | | | | | | | | | | | | |
| | | | |
Massachusetts 0.9% | | | | | | | | | | | | | | | | |
Massachusetts St. Dev. Fin. Agcy. Rev., | | | | | | | | | | | | | | | | |
Ser. A, Rfdg. | | | 4.000 | | | | 07/01/44 | | | | 2,615 | | | | 2,691,646 | |
Tufts Med. Ctr., Ser. I, Rfdg. (Pre-refunded 01/01/21)(ee) | | | 7.250 | | | | 01/01/32 | | | | 1,200 | | | | 1,307,520 | |
Tufts Med. Ctr., Ser. I, Rfdg. (Pre-refunded 01/01/21)(ee) | | | 7.250 | | | | 01/01/32 | | | | 800 | | | | 871,680 | |
Massachusetts St. Port Auth. Spl. Facs. Rev.,
Bosfuel Proj., AMT, NATL | | | 5.000 | | | | 07/01/32 | | | | 3,000 | | | | 3,008,790 | |
| | | | | | | | | | | | | | | | |
| | | | | | | | | | | | | | | 7,879,636 | |
| | | | | | | | | | | | | | | | |
| | | | |
Michigan 1.2% | | | | | | | | | | | | | | | | |
Michigan Fin. Auth. Rev., | | | | | | | | | | | | | | | | |
Henry Ford Hlth. Sys., Ser. A, Rfdg. | | | 4.000 | | | | 11/15/50 | | | | 1,500 | | | | 1,573,020 | |
Sr. Lien, Detroit Wtr. & Swr., Ser. C-1 | | | 5.000 | | | | 07/01/44 | | | | 1,000 | | | | 1,069,670 | |
Michigan St. Bldg. Auth. Rev.,
Facs. Prog., Ser. I-A, Rfdg. | | | 5.375 | | | | 10/15/41 | | | | 750 | | | | 810,900 | |
Michigan St. Strategic Fund Rev., | | | | | | | | | | | | | | | | |
I-75 Imp. Proj., AMT | | | 5.000 | | | | 06/30/48 | | | | 500 | | | | 570,125 | |
I-75 Imp. Proj., AMT, AGM | | | 4.500 | | | | 06/30/48 | | | | 1,250 | | | | 1,337,588 | |
Var. Detroit Ed., Rmkt., Rfdg. | | | 5.625 | | | | 07/01/20 | | | | 1,000 | | | | 1,041,350 | |
Oakland Cnty. Econ. Dev. Corp. Oblg. Rev.,
Roman Catholic Archdiocese Detroit, Rfdg. | | | 6.500 | | | | 12/01/20 | | | | 1,010 | | | | 1,028,190 | |
Summit Academy Rev.,
Rfdg. | | | 6.250 | | | | 11/01/25 | | | | 1,570 | | | | 1,571,303 | |
Wayne Cnty. Arpt. Auth. Rev.,
Detroit Met. Arpt., Ser. D, AMT, Rfdg. | | | 5.000 | | | | 12/01/28 | | | | 1,500 | | | | 1,646,670 | |
| | | | | | | | | | | | | | | | |
| | | | | | | | | | | | | | | 10,648,816 | |
| | | | | | | | | | | | | | | | |
| | | | |
Minnesota 1.0% | | | | | | | | | | | | | | | | |
Hugo Rev.,
Chrt. Sch. Lease, Noble Academy Proj., Ser. A | | | 5.000 | | | | 07/01/44 | | | | 1,250 | | | | 1,288,900 | |
See Notes to Financial Statements.
| | | | | | | | | | | | | | | | |
| | | | |
| Description | | Interest
Rate | | | Maturity
Date | | | Principal
Amount (000)# | | | Value | |
| | | | |
Minnesota (cont’d.) | | | | | | | | | | | | | | | | |
Rochester Rev.,
Mayo Clinic | | | 4.000 | % | | | 11/15/48 | | | | 3,000 | | | $ | 3,211,770 | |
St. Cloud Rev., | | | | | | | | | | | | | | | | |
Centracare Hlth., Rfdg. | | | 4.000 | | | | 05/01/49 | | | | 1,000 | | | | 1,062,320 | |
Centracare Hlth., Ser. A, Rfdg. | | | 4.000 | | | | 05/01/37 | | | | 1,250 | | | | 1,332,912 | |
St. Paul Hsg. & Redev. Auth. Hosp. Rev.,
Hlth. East Care Sys. Proj., Rfdg. (Pre-refunded 11/15/25)(ee) | | | 5.000 | | | | 11/15/44 | | | | 1,000 | | | | 1,192,400 | |
St. Paul Port Auth. Sol. Wste. Disp. Rev.,
Gerdau St. Paul Steel Mill Proj., Ser. 7, AMT, 144A | | | 4.500 | | | | 10/01/37 | | | | 1,000 | | | | 976,700 | |
| | | | | | | | | | | | | | | | |
| | | | | | | | | | | | | | | 9,065,002 | |
| | | | | | | | | | | | | | | | |
| | | | |
Mississippi 0.1% | | | | | | | | | | | | | | | | |
Mississippi St. Bus. Fin. Corp. Rev.,
Chevron USA, Inc., Ser. F, FRDD (Mandatory put date 05/01/19) | | | 2.310 | (cc) | | | 11/01/35 | | | | 800 | | | | 800,000 | |
| | | | | | | | | | | | | | | | |
| | | | |
Missouri 2.3% | | | | | | | | | | | | | | | | |
Joplin Indl. Dev. Auth. Rev.,
Freeman Hlth. Sys., Rfdg. | | | 5.000 | | | | 02/15/35 | | | | 1,000 | | | | 1,087,330 | |
Lees Summit, Tax Alloc.,
Rfdg. & Impt., Summit Fair Proj., 144A | | | 4.875 | | | | 11/01/37 | | | | 2,000 | | | | 1,968,060 | |
Manchester Tax Increment & Transn. Rev.,
Hwy. 141, Manchester Rd. Proj., Rfdg. | | | 6.875 | | | | 11/01/39 | | | | 1,500 | | | | 1,505,970 | |
Missouri St. Hlth. & Ed. Facs. Auth. Rev., | | | | | | | | | | | | | | | | |
BJC Hlth. Sys., Ser. A | | | 4.000 | | | | 01/01/45 | | | | 2,010 | | | | 2,102,038 | |
Lutheran Sr. Svcs. | | | 6.000 | | | | 02/01/41 | | | | 1,000 | | | | 1,048,670 | |
Lutheran Sr. Svcs., Rfdg. | | | 5.000 | | | | 02/01/44 | | | | 4,000 | | | | 4,221,840 | |
Lutheran Sr. Svcs., Ser. A | | | 5.000 | | | | 02/01/42 | | | | 1,500 | | | | 1,635,000 | |
Poplar Bluff Regl. Transn. Dev. Dist. Rev.,
Transn. Sales Tax | | | 4.750 | | | | 12/01/42 | | | | 2,100 | | | | 2,173,731 | |
St. Louis Cnty. Indl. Dev. Auth. Rev., | | | | | | | | | | | | | | | | |
Friendship Vlg. St. Louis Oblig. Grp., Ser. A | | | 5.250 | | | | 09/01/53 | | | | 2,000 | | | | 2,166,360 | |
Friendship Vlg. Sunset Hills, Ser. A | | | 5.875 | | | | 09/01/43 | | | | 1,000 | | | | 1,085,820 | |
St. Andrews Res. Srs. Oblig., Ser. A, Rfdg. | | | 5.125 | | | | 12/01/45 | | | | 1,000 | | | | 1,048,570 | |
| | | | | | | | | | | | | | | | |
| | | | | | | | | | | | | | | 20,043,389 | |
| | | | | | | | | | | | | | | | |
| | | | |
Nevada 0.3% | | | | | | | | | | | | | | | | |
Clark Cnty. Impt. Dist. Spl. Assmt.,
Dist. No. 142, Mountains Edge Loc. Impvt., Rfdg. | | | 4.000 | | | | 08/01/23 | | | | 1,235 | | | | 1,284,585 | |
See Notes to Financial Statements.
| | | | |
| PGIM Muni High Income Fund | | | 25 | |
Schedule of Investments(continued)
as of April 30, 2019
| | | | | | | | | | | | | | | | |
| | | | |
| Description | | Interest Rate | | | Maturity Date | | | Principal Amount (000)# | | | Value | |
| | | | |
Nevada (cont’d.) | | | | | | | | | | | | | | | | |
Nevada St. Dept. of Bus. & Ind. Rev., | | | | | | | | | | | | | | | | |
Somerset Acad., Ser. A, 144A | | | 5.000 | % | | | 12/15/48 | | | | 500 | | | $ | 519,660 | |
Somerset Acad., Ser. A, 144A | | | 5.125 | | | | 12/15/45 | | | | 1,000 | | | | 1,048,210 | |
| | | | | | | | | | | | | | | | |
| | | | | | | | | | | | | | | 2,852,455 | |
| | | | | | | | | | | | | | | | |
| | | | |
New Jersey 8.1% | | | | | | | | | | | | | | | | |
New Jersey Econ. Dev. Auth. Rev., | | | | | | | | | | | | | | | | |
Continental Airlines, Inc., Proj., AMT, Rfdg. | | | 5.750 | | | | 09/15/27 | | | | 1,530 | | | | 1,687,774 | |
Continental Airlines, Inc., Proj., Spec. Facs. AMT | | | 5.250 | | | | 09/15/29 | | | | 5,000 | | | | 5,454,050 | |
Continental Airlines, Inc., United Airlines, Inc. Proj., AMT | | | 4.875 | | | | 09/15/19 | | | | 790 | | | | 796,849 | |
Continental Airlines, Inc., United Airlines, Inc. Proj., AMT | | | 5.125 | | | | 09/15/23 | | | | 5,000 | | | | 5,384,950 | |
Continental Airlines, Inc., United Airlines, Inc. Proj., Ser. A, AMT | | | 5.625 | | | | 11/15/30 | | | | 2,275 | | | | 2,589,041 | |
Goethals Bridge, AMT | | | 5.375 | | | | 01/01/43 | | | | 1,390 | | | | 1,534,532 | |
N. Star Academy Chrt. Sch. Newark | | | 5.000 | | | | 07/15/47 | | | | 1,000 | | | | 1,088,250 | |
Port Newark Container, AMT, Rfdg. | | | 5.000 | | | | 10/01/47 | | | | 2,500 | | | | 2,719,375 | |
Ser. AAA | | | 5.000 | | | | 06/15/41 | | | | 2,020 | | | | 2,185,842 | |
Ser. BBB, Rfdg. | | | 5.500 | | | | 06/15/30 | | | | 1,500 | | | | 1,732,920 | |
Ser. DDD | | | 5.000 | | | | 06/15/42 | | | | 1,000 | | | | 1,083,910 | |
Ser. WW | | | 5.250 | | | | 06/15/40 | | | | 1,250 | | | | 1,356,613 | |
St. Gov’t. Bldgs. Proj., Ser. C | | | 5.000 | | | | 06/15/47 | | | | 2,000 | | | | 2,169,020 | |
St. House Proj., Ser. B, Rmkt. | | | 5.000 | | | | 06/15/43 | | | | 1,000 | | | | 1,096,050 | |
Team Academy Chrt. Sch. Proj. | | | 6.000 | | | | 10/01/43 | | | | 1,700 | | | | 1,875,236 | |
Umm Energy Partners, Ser. A, AMT | | | 5.000 | | | | 06/15/37 | | | | 1,500 | | | | 1,585,905 | |
Umm Energy Partners, Ser. A, AMT | | | 5.125 | | | | 06/15/43 | | | | 1,100 | | | | 1,164,361 | |
United Airlines, Inc. Proj., Rmkt., AMT | | | 5.500 | | | | 06/01/33 | | | | 2,000 | | | | 2,214,700 | |
New Jersey Healthcare Facs. Fin. Auth. Rev., | | | | | | | | | | | | | | | | |
AHS Hosp. Corp., Rfdg. (Pre-refunded 07/01/21)(ee) | | | 6.000 | | | | 07/01/41 | | | | 500 | | | | 546,485 | |
Barnabas Hlth., Ser. A, Rfdg. (Pre-refunded 07/01/21)(ee) | | | 5.625 | | | | 07/01/37 | | | | 1,000 | | | | 1,083,910 | |
Hackensack Meridian Hlth., Rfgd. | | | 4.000 | | | | 07/01/52 | | | | 1,000 | | | | 1,050,830 | |
RWJ Barnabas Healthcare Sys. Oblig., Ser. A, Rfdg. | | | 5.000 | | | | 07/01/43 | | | | 1,500 | | | | 1,720,305 | |
University Hosp., Ser. A, AGM, Rfdg. | | | 5.000 | | | | 07/01/46 | | | | 1,500 | | | | 1,660,095 | |
Virtua Hlth. | | | 5.750 | | | | 07/01/33 | | | | 2,000 | | | | 2,013,560 | |
New Jersey St. Transn. Tr. Fd. Sys. Auth. Rev., | | | | | | | | | | | | | | | | |
Trans. Sys., Ser. A, Rfdg. | | | 5.000 | | | | 12/15/36 | | | | 1,250 | | | | 1,393,812 | |
Trans. Sys., Ser. AA | | | 5.000 | | | | 06/15/45 | | | | 1,200 | | | | 1,283,664 | |
Trans. Sys., Ser. AA | | | 5.000 | | | | 06/15/46 | | | | 1,940 | | | | 2,130,314 | |
Trans. Sys., Ser. AA | | | 5.250 | | | | 06/15/41 | | | | 1,000 | | | | 1,086,960 | |
See Notes to Financial Statements.
| | | | | | | | | | | | | | | | |
| | | | |
| Description | | Interest Rate | | | Maturity Date | | | Principal Amount (000)# | | | Value | |
| | | | |
New Jersey (cont’d.) | | | | | | | | | | | | | | | | |
New Jersey St. Transn. Tr. Fd. Sys. Auth. Rev., (cont’d.) | | | | | | | | | | | | | | | | |
Trans. Sys., Ser. AA | | | 5.250 | % | | | 06/15/43 | | | | 2,000 | | | $ | 2,249,240 | |
New Jersey Tpk. Auth. Rev.,
Ser. A | | | 4.000 | | | | 01/01/48 | | | | 1,000 | | | | 1,070,640 | |
South Jersey Transn. Auth. LLC, Rev.,
Ser. A, Rfdg. | | | 5.000 | | | | 11/01/39 | | | | 750 | | | | 817,905 | |
Tob. Settlement Fing. Corp. Rev., | | | | | | | | | | | | | | | | |
Ser. A, Rfdg. | | | 5.250 | | | | 06/01/46 | | | | 3,000 | | | | 3,355,770 | |
Sub., Ser. B, Rfdg. | | | 5.000 | | | | 06/01/46 | | | | 10,000 | | | | 10,429,600 | |
| | | | | | | | | | | | | | | | |
| | | | | | | | | | | | | | | 69,612,468 | |
| | | | | | | | | | | | | | | | |
| | | | |
New York 4.6% | | | | | | | | | | | | | | | | |
Build NYC Resource Corp. Rev.,
Pratt Paper, Inc. Proj., AMT, Rdfg., 144A | | | 5.000 | | | | 01/01/35 | | | | 1,000 | | | | 1,078,670 | |
Erie Cnty. Tob. Asset Secur. Corp. Cap. Apprec. Rev., | | | | | | | | | | | | | | | | |
Asset Bkd., 1st Sub., Ser. B, CABS | | | 7.249 | (t) | | | 06/01/47 | | | | 5,000 | | | | 676,800 | |
Asset Bkd., 2nd Sub., Ser. C, CABS | | | 7.769 | (t) | | | 06/01/50 | | | | 4,000 | | | | 374,200 | |
Glen Cove Loc. Econ. Asst. Corp. Rev., | | | | | | | | | | | | | | | | |
Garvies Pt. Impt. Proj., Ser. A | | | 5.000 | | | | 01/01/56 | | | | 2,105 | | | | 2,218,481 | |
Garvies Pt. Impt. Proj., Ser. C, CABS (Convert to Fixed on 01/01/24) | | | 0.000 | (cc) | | | 01/01/55 | | | | 1,000 | | | | 885,540 | |
New York Liberty Dev. Corp. Rev., | | | | | | | | | | | | | | | | |
4 World Trade Center Proj., Rfdg. | | | 5.750 | | | | 11/15/51 | | | | 1,750 | | | | 1,918,193 | |
Class 1-3 World Trade Ctr., Rfdg., 144A | | | 5.000 | | | | 11/15/44 | | | | 5,000 | | | | 5,379,650 | |
New York St. Dorm. Auth. Rev.,
Orange Regl. Med. Ctr., Rfdg., 144A | | | 5.000 | | | | 12/01/45 | | | | 1,000 | | | | 1,097,630 | |
New York Trans. Dev. Corp. Rev., | | | | | | | | | | | | | | | | |
Delta Air Lines, Inc.-Laguardia Arpt. Terms. C&D Redev., AMT | | | 5.000 | | | | 01/01/33 | | | | 560 | | | | 653,134 | |
Delta Air Lines, Inc.-Laguardia Arpt. Terms. C&D Redev., AMT | | | 5.000 | | | | 01/01/34 | | | | 1,000 | | | | 1,162,600 | |
Laguardia Arpt., Term. B Redev., Ser. A, AMT | | | 5.000 | | | | 07/01/46 | | | | 4,885 | | | | 5,299,150 | |
Laguardia Arpt., Term. B Redev., Ser. A, AMT | | | 5.250 | | | | 01/01/50 | | | | 9,250 | | | | 10,100,907 | |
Onondaga Civic Dev. Corp. Rev.,
St. Joseph Hosp. Hlth. Ctr., Ser. 2012 (Pre-refunded 07/01/22)(ee) | | | 5.000 | | | | 07/01/42 | | | | 1,000 | | | | 1,102,840 | |
Port Auth. of NY & NJ Spl. Oblig. Rev., | | | | | | | | | | | | | | | | |
JFK Int’l. Air Term. | | | 5.000 | | | | 12/01/20 | | | | 340 | | | | 351,944 | |
JFK Int’l. Air Term. | | | 6.000 | | | | 12/01/42 | | | | 2,500 | | | | 2,645,800 | |
TSASC, Inc., Rev.,
Ser. A, Rfdg. | | | 5.000 | | | | 06/01/41 | | | | 4,750 | | | | 5,111,095 | |
| | | | | | | | | | | | | | | | |
| | | | | | | | | | | | | | | 40,056,634 | |
| | | | | | | | | | | | | | | | |
See Notes to Financial Statements.
| | | | |
| PGIM Muni High Income Fund | | | 27 | |
Schedule of Investments(continued)
as of April 30, 2019
| | | | | | | | | | | | | | | | |
| | | | |
| Description | | Interest Rate | | | Maturity Date | | | Principal Amount (000)# | | | Value | |
| | | | |
North Carolina 0.4% | | | | | | | | | | | | | | | | |
North Carolina Med. Care Commn. Ret. Facs. Rev.,
First Mtg. Galloway Ridge Proj., Ser. A | | | 6.000 | % | | | 01/01/39 | | | | 750 | | | $ | 763,995 | |
North Carolina Med. Care Commn. Rev.,
Pennybyrn at Maryfield, Rfdg. | | | 5.000 | | | | 10/01/35 | | | | 1,000 | | | | 1,049,200 | |
North Carolina Tpk. Auth. Rev.,
Ser. A, Rfdg. | | | 5.000 | | | | 07/01/51 | | | | 1,250 | | | | 1,364,075 | |
| | | | | | | | | | | | | | | | |
| | | | | | | | | | | | | | | 3,177,270 | |
| | | | | | | | | | | | | | | | |
| | | | |
North Dakota 0.1% | | | | | | | | | | | | | | | | |
Burleigh Cnty. Rev,
St. Alexius Med. Ctr. Proj., Ser. A, Rfdg. (Pre-refunded 07/01/21)(ee) | | | 5.000 | | | | 07/01/35 | | | | 750 | | | | 802,185 | |
| | | | | | | | | | | | | | | | |
| | | | |
Ohio 5.8% | | | | | | | | | | | | | | | | |
Buckeye Tob. Settlement Fin. Auth. Rev., | | | | | | | | | | | | | | | | |
Asset Bkd. Sr. Turbo, Ser. A-2 | | | 5.125 | | | | 06/01/24 | | | | 3,170 | | | | 2,977,296 | |
Asset Bkd. Sr. Turbo, Ser. A-2 | | | 5.375 | | | | 06/01/24 | | | | 2,865 | | | | 2,715,390 | |
Asset Bkd. Sr. Turbo, Ser. A-2 | | | 5.875 | | | | 06/01/30 | | | | 7,100 | | | | 6,787,458 | |
Asset Bkd. Sr. Turbo, Ser. A-2 | | | 5.875 | | | | 06/01/47 | | | | 8,655 | | | | 8,200,612 | |
Asset Bkd. Sr. Turbo, Ser. A-2 | | | 6.500 | | | | 06/01/47 | | | | 7,675 | | | | 7,637,162 | |
Cuyahoga Cnty. Hosp. Rev., | | | | | | | | | | | | | | | | |
Metro Hlth. Sys., Rfdg. | | | 5.000 | | | | 02/15/57 | | | | 2,545 | | | | 2,741,449 | |
Metro Hlth. Sys., Rfdg. | | | 5.500 | | | | 02/15/52 | | | | 5,295 | | | | 5,950,521 | |
Metro Hlth. Sys., Rfdg. | | | 5.500 | | | | 02/15/57 | | | | 1,000 | | | | 1,119,840 | |
Franklin Cnty. Hosp. Facs. Rev., | | | | | | | | | | | | | | | | |
Hlth. Corp., Ser. A | | | 4.000 | | | | 05/15/47 | | | | 2,500 | | | | 2,650,325 | |
Nationwide Children’s Hosp. Proj., Ser. A | | | 4.000 | | | | 11/01/45 | | | | 2,000 | | | | 2,103,020 | |
Hamilton Cnty. Healthcare Facs. Rev.,
Christ Hosp. Proj. | | | 5.000 | | | | 06/01/42 | | | | 1,250 | | | | 1,321,012 | |
Hancock Cnty. Hosp. Facs. Rev.,
Blanchard Valley Hlth. Ctr., Rfdg. (Pre-refunded 06/01/21)(ee) | | | 6.250 | | | | 12/01/34 | | | | 600 | | | | 656,082 | |
Lucas Cnty. Hosp. Rev., | | | | | | | | | | | | | | | | |
Promedica Healthcare, Ser. A, Rfdg. (Pre-refunded 11/15/21)(ee) | | | 6.000 | | | | 11/15/41 | | | | 750 | | | | 830,505 | |
Promedica Healthcare, Ser. A, Rfdg. (Pre-refunded 11/15/21)(ee) | | | 6.500 | | | | 11/15/37 | | | | 875 | | | | 979,510 | |
Middleburg Heights Hosp. Rev.,
Facs. Southwest Gen., Ser. 2011, Rfdg. | | | 5.250 | | | | 08/01/41 | | | | 1,200 | | | | 1,274,460 | |
See Notes to Financial Statements.
| | | | | | | | | | | | | | | | |
| | | | |
| Description | | Interest Rate | | | Maturity Date | | | Principal Amount (000)# | | | Value | |
| | | | |
Ohio (cont’d.) | | | | | | | | | | | | | | | | |
Ohio Air Qlty. Dev. Auth. Rev.,
Pratt Paper OH LLC Proj., AMT, 144A | | | 4.500 | % | | | 01/15/48 | | | | 1,000 | | | $ | 1,043,120 | |
Ohio St. Pvt. Act. Rev.,
Portsmouth Bypass Proj., AMT | | | 5.000 | | | | 06/30/53 | | | | 1,000 | | | | 1,069,080 | |
| | | | | | | | | | | | | | | | |
| | | | | | | | | | | | | | | 50,056,842 | |
| | | | | | | | | | | | | | | | |
| | | | |
Oklahoma 2.4% | | | | | | | | | | | | | | | | |
Oklahoma St. Dev., Fin. Auth. Rev., | | | | | | | | | | | | | | | | |
OU Medicine Proj., Ser. B | | | 5.250 | | | | 08/15/48 | | | | 1,455 | | | | 1,651,003 | |
OU Medicine Proj., Ser. B | | | 5.500 | | | | 08/15/52 | | | | 7,530 | | | | 8,665,147 | |
OU Medicine Proj., Ser. B | | | 5.500 | | | | 08/15/57 | | | | 3,670 | | | | 4,209,123 | |
St. Johns Hlth. Sys., Rfdg. (Pre-refunded 02/15/22)(ee) | | | 5.000 | | | | 02/15/42 | | | | 1,500 | | | | 1,634,955 | |
Tulsa Cnty. Indl. Auth. Rev., | | | | | | | | | | | | | | | | |
Montereau, Inc. Proj., Rfdg. | | | 5.250 | | | | 11/15/45 | | | | 1,000 | | | | 1,111,160 | |
Montereau, Inc. Proj., Ser A, Rfdg. (Pre-refunded 05/01/20)(ee) | | | 7.125 | | | | 11/01/30 | | | | 1,000 | | | | 1,052,390 | |
Tulsa Mun. Arpt. Tr. Trustees Gen. Rev., | | | | | | | | | | | | | | | | |
American Airlines, AMT, Rfdg. (Mandatory put date 06/01/25) | | | 5.000 | (cc) | | | 06/01/35 | | | | 1,250 | | | | 1,373,088 | |
American Airlines, Ser. A, AMT, Rfdg. | | | 5.500 | | | | 06/01/35 | | | | 1,000 | | | | 1,080,370 | |
| | | | | | | | | | | | | | | | |
| | | | | | | | | | | | | | | 20,777,236 | |
| | | | | | | | | | | | | | | | |
| | | | |
Oregon 0.3% | | | | | | | | | | | | | | | | |
Multnomah Cnty. Hosp. Facs. Auth. Rev.,
Mirabella at South Waterfront, Ser. A., Rfdg. | | | 5.400 | | | | 10/01/44 | | | | 1,000 | | | | 1,073,550 | |
Salem Hosp. Facs. Auth. Rev.,
Capital Manor, Inc., Rfdg. | | | 6.000 | | | | 05/15/42 | | | | 1,000 | | | | 1,083,700 | |
| | | | | | | | | | | | | | | | |
| | | | | | | | | | | | | | | 2,157,250 | |
| | | | | | | | | | | | | | | | |
| | | | |
Pennsylvania 5.0% | | | | | | | | | | | | | | | | |
Central Bradford Progress Auth. Rev.,
Guthrie Healthcare Sys., Rfdg. | | | 5.375 | | | | 12/01/41 | | | | 2,700 | | | | 2,883,789 | |
Chester Cnty. Indl. Dev. Auth. Rev.,
Renaissance Academy Chrt. Sch., Rfdg. | | | 5.000 | | | | 10/01/44 | | | | 1,000 | | | | 1,060,200 | |
Comnwlth. Fing. Auth. Rev.,
Tobacco Master Stlmnt. Pymt. | | | 5.000 | | | | 06/01/35 | | | | 1,000 | | | | 1,169,680 | |
Cumberland Cnty. Mun. Auth., Rev., | | | | | | | | | | | | | | | | |
Asbury PA Oblig. Grp., Rfdg. | | | 5.250 | | | | 01/01/41 | | | | 1,000 | | | | 1,022,350 | |
Asbury PA Oblig. Grp., Rfdg. | | | 6.125 | | | | 01/01/45 | | | | 2,000 | | | | 2,039,220 | |
Geisinger Auth. Hlth. Sys. Rev.,
Ser. A-1 | | | 5.125 | | | | 06/01/41 | | | | 1,450 | | | | 1,535,941 | |
See Notes to Financial Statements.
| | | | |
| PGIM Muni High Income Fund | | | 29 | |
Schedule of Investments(continued)
as of April 30, 2019
| | | | | | | | | | | | | | | | |
| | | | |
| Description | | Interest Rate | | | Maturity Date | | | Principal Amount (000)# | | | Value | |
| | | | |
Pennsylvania (cont’d.) | | | | | | | | | | | | | | | | |
Moon Indl. Dev. Auth. Rev.,
Baptist Homes Society Oblig., Rfdg. | | | 6.000 | % | | | 07/01/45 | | | | 2,000 | | | $ | 2,127,700 | |
Pennsylvania Comnwlth.,
Ser. A, COP, Rfdg. | | | 4.000 | | | | 07/01/46 | | | | 1,500 | | | | 1,570,470 | |
Pennsylvania Econ. Dev. Fin. Auth. Rev., | | | | | | | | | | | | | | | | |
Swr. Sludge Disp., Philadelphia Biosolids Fac. | | | 6.250 | | | | 01/01/32 | | | | 750 | | | | 766,335 | |
US Airways Grp., Ser. B, Gty. Agmt. | | | 8.000 | | | | 05/01/29 | | | | 490 | | | | 517,161 | |
Pennsylvania Tpk. Commn. Rev., | | | | | | | | | | | | | | | | |
Ser. A-1 | | | 5.000 | | | | 12/01/46 | | | | 3,950 | | | | 4,477,246 | |
Sub., Ser. A | | | 5.500 | | | | 12/01/42 | | | | 1,500 | | | | 1,763,295 | |
Sub., Ser. A | | | 5.500 | | | | 12/01/46 | | | | 1,740 | | | | 2,045,753 | |
Sub., Ser. A-1 | | | 5.000 | | | | 12/01/46 | | | | 2,000 | | | | 2,218,220 | |
Sub., Ser. B-1 | | | 5.250 | | | | 06/01/47 | | | | 2,000 | | | | 2,296,300 | |
Philadelphia Auth. for Indl. Dev. Rev., | | | | | | | | | | | | | | | | |
First Philadelphia Preparatory Chrt., Ser. A, Rfdg. | | | 7.250 | | | | 06/15/43 | | | | 2,000 | | | | 2,262,520 | |
Gtr. Philadelphia Hlth Action, Rfdg. | | | 6.625 | | | | 06/01/50 | | | | 3,000 | | | | 3,123,570 | |
Mariana Bracetti Academy | | | 7.625 | | | | 12/15/41 | | | | 2,000 | | | | 2,189,420 | |
New Fndtn. Chrt. Sch. Proj. (Pre-refunded 12/15/22)(ee) | | | 6.625 | | | | 12/15/41 | | | | 1,000 | | | | 1,167,930 | |
Philadelphia Hosp. & Higher Ed. Facs. Auth. Rev.,
Temple Univ. Hlth. Sys., Ser. A | | | 5.625 | | | | 07/01/42 | | | | 6,750 | | | | 7,259,692 | |
| | | | | | | | | | | | | | | | |
| | | | | | | | | | | | | | | 43,496,792 | |
| | | | | | | | | | | | | | | | |
| | | | |
Puerto Rico 2.4% | | | | | | | | | | | | | | | | |
Puerto Rico Comnwlth. Aqueduct & Swr. Auth., | | | | | | | | | | | | | | | | |
Aqueduct & Swr. Auth. Rev., Sr. Lien, Ser. A | | | 4.000 | | | | 07/01/22 | | | | 2,000 | | | | 1,965,200 | |
Aqueduct & Swr. Auth. Rev., Sr. Lien, Ser. A | | | 4.250 | | | | 07/01/25 | | | | 1,000 | | | | 968,120 | |
Aqueduct & Swr. Auth. Rev., Sr. Lien, Ser. A | | | 5.750 | | | | 07/01/37 | | | | 1,350 | | | | 1,355,063 | |
Aqueduct & Swr. Auth. Rev., Sr. Lien, Ser. A, Rfdg. | | | 6.000 | | | | 07/01/47 | | | | 1,125 | | | | 1,132,031 | |
Puerto Rico Sales Tax Fing. Corp. Sales Tax Rev., | | | | | | | | | | | | | | | | |
Restructured Ser. A-1 | | | 4.750 | | | | 07/01/53 | | | | 1,058 | | | | 1,010,496 | |
Restructured Ser. A-1 | | | 5.000 | | | | 07/01/58 | | | | 12,082 | | | | 11,907,536 | |
Restructured Ser. A-1, CABS | | | 5.490 | (t) | | | 07/01/46 | | | | 5,156 | | | | 1,183,869 | |
Restructured Ser. A-1, CABS | | | 5.537 | (t) | | | 07/01/51 | | | | 6,725 | | | | 1,152,463 | |
| | | | | | | | | | | | | | | | |
| | | | | | | | | | | | | | | 20,674,778 | |
| | | | | | | | | | | | | | | | |
| | | | |
Rhode Island 0.3% | | | | | | | | | | | | | | | | |
Tob. Settlement Fing. Corp. Rev.,
Ser. A, Rfdg. | | | 5.000 | | | | 06/01/40 | | | | 2,760 | | | | 2,926,069 | |
| | | | | | | | | | | | | | | | |
See Notes to Financial Statements.
| | | | | | | | | | | | | | | | |
| | | | |
| Description | | Interest Rate | | | Maturity Date | | | Principal Amount (000)# | | | Value | |
| | | | |
South Carolina 0.7% | | | | | | | | | | | | | | | | |
South Carolina Prt. Auth. Rev., | | | | | | | | | | | | | | | | |
AMT | | | 4.000 | % | | | 07/01/45 | | | | 1,500 | | | $ | 1,553,385 | |
AMT | | | 4.000 | | | | 07/01/55 | | | | 2,000 | | | | 2,069,580 | |
South Carolina St. Pub. Svc. Auth. Rev.,
Ser. E, Rfdg. | | | 5.250 | | | | 12/01/55 | | | | 2,500 | | | | 2,806,725 | |
| | | | | | | | | | | | | | | | |
| | | | | | | | | | | | | | | 6,429,690 | |
| | | | | | | | | | | | | | | | |
| | | | |
South Dakota 0.2% | | | | | | | | | | | | | | | | |
South Dakota St. Hlth. & Edl. Facs. Auth. Rev.,
Avera Hlth., Ser. A, Rfdg. | | | 5.000 | | | | 07/01/42 | | | | 1,655 | | | | 1,739,604 | |
| | | | | | | | | | | | | | | | |
| | | | |
Tennessee 1.4% | | | | | | | | | | | | | | | | |
Bristol Indl. Dev. Brd. Sales Tax Rev.,
Ser. A, 144A | | | 5.125 | | | | 12/01/42 | | | | 4,000 | | | | 4,028,560 | |
Chattanooga Hlth. Edl. & Hsg. Facs. Brd. Rev.,
Catholic Hlth., Ser. A | | | 5.250 | | | | 01/01/45 | | | | 2,000 | | | | 2,149,820 | |
Knox Cnty. Hlth. Edl. & Hsg. Facs. Brd. Rev.,
East Tennessee Children’s Hosp., Rfdg. | | | 4.000 | | | | 11/15/48 | | | | 2,000 | | | | 2,080,800 | |
Memphis-Shelby Cnty. Indl. Dev. Brd. Tax Alloc.,
Sr. Tax Incr.-Graceland, Ser. A, Rfdg. | | | 5.625 | | | | 01/01/46 | | | | 500 | | | | 533,120 | |
Metropolitan Govt. Nashville & Davidson Cnty. Hlth. & Edl. Facs. Brd. Rev.,
Impt. Blakeford at Green Hills, Rfdg. | | | 5.000 | | | | 07/01/37 | | | | 850 | | | | 888,607 | |
Shelby Cnty. Hlth. Edl. & Hsg. Facs. Brd. Facs. Rev.,
Germantown Village, Rfdg. | | | 5.250 | | | | 12/01/42 | | | | 1,100 | | | | 1,131,350 | |
Tennessee Energy Acquisition Corp. Gas Rev.,
Ser. C | | | 5.000 | | | | 02/01/22 | | | | 1,000 | | | | 1,068,140 | |
| | | | | | | | | | | | | | | | |
| | | | | | | | | | | | | | | 11,880,397 | |
| | | | | | | | | | | | | | | | |
| | | | |
Texas 9.0% | | | | | | | | | | | | | | | | |
Arlington Higher Ed. Fin. Corp. Rev.,
Wayside Schs., Ser. A | | | 4.625 | | | | 08/15/46 | | | | 1,050 | | | | 1,056,384 | |
Austin Convention Enterprises, Inc., | | | | | | | | | | | | | | | | |
Sub., Second Tier, Ser. B, Rfdg. | | | 5.000 | | | | 01/01/32 | | | | 1,085 | | | | 1,219,898 | |
Sub., Second Tier, Ser. B, Rfdg. | | | 5.000 | | | | 01/01/34 | | | | 1,050 | | | | 1,167,705 | |
Bexar Cnty. Hlth. Facs. Dev. Corp. Rev.,
Army Retmnt. Residence Fndt., Rfdg. | | | 5.000 | | | | 07/15/41 | | | | 1,250 | | | | 1,354,963 | |
Capital Area Cultural Ed. Facs. Fin. Corp. Rev.,
Roman Catholic Diocese, Ser. B, Rmkt., Rfdg. | | | 6.125 | | | | 04/01/45 | | | | 2,050 | | | | 2,119,823 | |
Central Tex. Regl. Mobility Auth. Rev., | | | | | | | | | | | | | | | | |
Sr. Lien (Pre-refunded 01/01/21)(ee) | | | 6.000 | | | | 01/01/41 | | | | 2,000 | | | | 2,138,400 | |
Sr. Lien, Ser. A | | | 5.000 | | | | 01/01/45 | | | | 1,000 | | | | 1,108,700 | |
See Notes to Financial Statements.
| | | | |
| PGIM Muni High Income Fund | | | 31 | |
Schedule of Investments(continued)
as of April 30, 2019
| | | | | | | | | | | | | | | | |
| | | | |
| Description | | Interest Rate | | | Maturity Date | | | Principal Amount (000)# | | | Value | |
| | | | |
Texas (cont’d.) | | | | | | | | | | | | | | | | |
Central Tex. Regl. Mobility Auth. Rev., (cont’d.) | | | | | | | | | | | | | | | | |
Sub., Rfdg. | | | 4.000 | % | | | 01/01/41 | | | | 1,100 | | | $ | 1,143,604 | |
Clifton Higher Ed. Fin. Corp. Rev., | | | | | | | | | | | | | | | | |
Idea Pub. Sch. | | | 5.000 | | | | 08/15/42 | | | | 1,000 | | | | 1,052,460 | |
Idea Pub. Sch. | | | 6.000 | | | | 08/15/43 | | | | 1,000 | | | | 1,120,210 | |
Idea Pub. Sch. (Pre-refunded 08/15/21)(ee) | | | 5.750 | | | | 08/15/41 | | | | 1,000 | | | | 1,088,990 | |
Tejano Cmnty. Ctr., Ser. A, Rfdg. | | | 9.000 | | | | 02/15/38 | | | | 2,000 | | | | 2,003,940 | |
Uplift Ed., Ser. A (Pre-refunded 12/01/20)(ee) | | | 6.125 | | | | 12/01/40 | | | | 3,000 | | | | 3,205,620 | |
Decatur Hosp. Auth. Rev.,
Wise Regl. Hlth. Sys., Ser. A, Rfdg. | | | 5.250 | | | | 09/01/44 | | | | 1,370 | | | | 1,480,860 | |
Grand Parkway Transn. Corp.,
First Tier Toll Rev., Ser. A | | | 5.125 | | | | 10/01/43 | | | | 2,000 | | | | 2,188,220 | |
Gulf Coast Wste. Disp. Auth. Rev.,
Exxon Mobil Corp. Proj., FRDD (Mandatory put date 05/01/19) | | | 2.350 | (cc) | | | 09/01/25 | | | | 1,300 | | | | 1,300,000 | |
Houston Arpt. Sys. Rev., | | | | | | | | | | | | | | | | |
Ser. B-1, AMT | | | 5.000 | | | | 07/15/35 | | | | 2,000 | | | | 2,185,720 | |
Spl. Facs. Cont. Airlines, Inc., Ser. A, AMT, Rfdg. | | | 6.625 | | | | 07/15/38 | | | | 1,500 | | | | 1,611,720 | |
Spl. Facs. Cont. Airlines, Inc., Sub. Lien, Ser. A, AMT, Rfdg. | | | 5.000 | | | | 07/01/32 | | | | 1,000 | | | | 1,080,520 | |
Sub. Lien, Ser. A, AMT, Rfdg. | | | 5.000 | | | | 07/01/25 | | | | 250 | | | | 266,048 | |
Houston Higher Ed. Fin. Corp., Higher Ed. Rev., | | | | | | | | | | | | | | | | |
Cosmos Fndtn., Inc., Ser. A | | | 5.000 | | | | 02/15/42 | | | | 1,250 | | | | 1,299,500 | |
Cosmos Fndtn., Inc., Ser. A (Pre-refunded 05/15/21)(ee) | | | 6.500 | | | | 05/15/31 | | | | 535 | | | | 584,819 | |
Cosmos Fndtn., Inc., Ser. A (Pre-refunded 05/15/21)(ee) | | | 6.500 | | | | 05/15/31 | | | | 465 | | | | 508,301 | |
Kerryville Hlth. Facs. Dev. Corp. Rev.,
Peterson Regl. Med. Ctr. Proj., Rfdg. | | | 5.000 | | | | 08/15/35 | | | | 3,000 | | | | 3,355,260 | |
Lower Neches Vlly. Auth. Indl. Dev. Corp. Rev.,
Exxon Mobil Corp. Proj., FRDD (Mandatory put date 05/01/19) | | | 2.290 | (cc) | | | 11/01/38 | | | | 2,800 | | | | 2,800,000 | |
Matagorda Cnty. Nav. Dist. No. 1, Poll. Ctrl. Rev., | | | | | | | | | | | | | | | | |
AEP Tex. Central Co. Proj., Ser. B-1, Rfdg. | | | 4.000 | | | | 06/01/30 | | | | 1,000 | | | | 1,036,610 | |
AEP Tex. Central Co. Proj., Ser. B-2, Rfdg. | | | 4.000 | | | | 06/01/30 | | | | 1,800 | | | | 1,865,898 | |
Bonds, Cent. Pwr. & Lt. Co. Proj., Ser. A, Rmkt., Rfdg. | | | 6.300 | | | | 11/01/29 | | | | 1,000 | | | | 1,026,910 | |
Mission Econ. Dev. Corp. Rev.,
Natgosoline Proj., Sr. Lien, AMT, Rfdg., 144A | | | 4.625 | | | | 10/01/31 | | | | 2,000 | | | | 2,084,660 | |
New Hope Cultural Ed. Facs. Corp. Rev., | | | | | | | | | | | | | | | | |
Jubilee Academic Ctr., Ser. A, 144A | | | 5.125 | | | | 08/15/47 | | | | 1,000 | | | | 1,014,670 | |
Jubilee Academic Ctr., Ser. A, Rfdg., 144A | | | 5.000 | | | | 08/15/46 | | | | 2,000 | | | | 2,024,400 | |
MRC Crestview, Rfdg. | | | 5.000 | | | | 11/15/46 | | | | 1,150 | | | | 1,204,349 | |
See Notes to Financial Statements.
| | | | | | | | | | | | | | | | |
| | | | |
| Description | | Interest Rate | | | Maturity Date | | | Principal Amount (000)# | | | Value | |
| | | | |
Texas (cont’d.) | | | | | | | | | | | | | | | | |
New Hope Cultural Ed. Facs. Corp. Rev., (cont’d.) | | | | | | | | | | | | | | | | |
Westminster Manor Proj., Rfdg. | | | 4.000 | % | | | 11/01/36 | | | | 1,475 | | | $ | 1,487,434 | |
Newark Higher Ed. Fin. Corp. Rev.,
Austin Achieve Pub. Schs. Inc. | | | 5.000 | | | | 06/15/48 | | | | 500 | | | | 507,755 | |
North Tex. Twy. Auth. Rev., | | | | | | | | | | | | | | | | |
First Tier, Sys., Rfdg. (Pre-refunded 01/01/21)(ee) | | | 6.000 | | | | 01/01/38 | | | | 2,000 | | | | 2,140,100 | |
First Tier, Sys., Ser. A, Unrefunded, Rfdg. | | | 6.250 | | | | 01/01/39 | | | | 195 | | | | 195,669 | |
Rfdg. | | | 5.000 | | | | 01/01/48 | | | | 1,250 | | | | 1,439,837 | |
Second Tier, Ser. A, Rfdg. | | | 4.000 | | | | 01/01/38 | | | | 2,000 | | | | 2,082,360 | |
Pharr Higher Ed. Fin. Auth. Rev.,
Idea Pub. Schs., Ser. A (Pre-refunded 08/15/19)(ee) | | | 6.500 | | | | 08/15/39 | | | | 175 | | | | 177,401 | |
Pottsboro Higher Ed. Fin. Corp. Rev.,
Ser. A | | | 5.000 | | | | 08/15/46 | | | | 1,000 | | | | 1,008,430 | |
San Juan Higher Ed. Fin. Auth. Rev.,
Idea Pub. Schs., Ser. A (Pre-refunded 08/15/20)(ee) | | | 6.700 | | | | 08/15/40 | | | | 1,000 | | | | 1,063,040 | |
Tarrant Cnty. Cultural Ed. Facs. Fin. Corp. Rev., | | | | | | | | | | | | | | | | |
Barton Creek Sr. Living Ctr., Rfdg. | | | 5.000 | | | | 11/15/40 | | | | 1,100 | | | | 1,073,061 | |
Trinity Terrace Proj., Ser. A-1, Rfdg. | | | 5.000 | | | | 10/01/44 | | | | 1,000 | | | | 1,065,790 | |
Texas Mun. Gas Acq. & Sply. Corp., Gas Sply. Rev., | | | | | | | | | | | | | | | | |
Corp. I, Sr. Lien, Ser. A | | | 5.250 | | | | 12/15/26 | | | | 4,100 | | | | 4,917,868 | |
Corp. I, Sr. Lien, Ser. B, 3 Month LIBOR + 0.700% | | | 2.449 | (c) | | | 12/15/26 | | | | 640 | | | | 637,178 | |
Texas Priv. Activity Surface Transn. Corp. Rev., | | | | | | | | | | | | | | | | |
Sr. Lien, Blueridge Transn., AMT | | | 5.000 | | | | 12/31/50 | | | | 1,930 | | | | 2,101,133 | |
Sr. Lien, LBJ Infrastructure | | | 7.000 | | | | 06/30/40 | | | | 4,670 | | | | 4,935,396 | |
Sr. Lien, NTE Mobility Partners | | | 6.875 | | | | 12/31/39 | | | | 2,000 | | | | 2,063,780 | |
Sr. Lien, NTE Mobility Partners, AMT, Ser. 3A & 3B | | | 6.750 | | | | 06/30/43 | | | | 500 | | | | 578,670 | |
Sr. Lien, NTE Mobility Partners, AMT, Ser. 3A & 3B | | | 7.000 | | | | 12/31/38 | | | | 1,500 | | | | 1,757,850 | |
| | | | | | | | | | | | | | | | |
| | | | | | | | | | | | | | | 77,931,914 | |
| | | | | | | | | | | | | | | | |
| | | | |
Utah 0.3% | | | | | | | | | | | | | | | | |
Salt Lake City Corp. Arpt. Rev.,
Ser. A, AMT | | | 5.000 | | | | 07/01/47 | | | | 1,100 | | | | 1,254,869 | |
Utah Chrt. Sch. Fin. Auth. Rev.,
Spectrum Academy Proj., 144A | | | 6.000 | | | | 04/15/45 | | | | 1,000 | | | | 1,014,370 | |
| | | | | | | | | | | | | | | | |
| | | | | | | | | | | | | | | 2,269,239 | |
| | | | | | | | | | | | | | | | |
| | | | |
Vermont 0.1% | | | | | | | | | | | | | | | | |
Vermont Econ. Dev. Auth. Mtge. Rev.,
Wake Robin Corp. Proj., Rfdg. | | | 5.400 | | | | 05/01/33 | | | | 1,100 | | | | 1,143,087 | |
| | | | | | | | | | | | | | | | |
See Notes to Financial Statements.
| | | | |
| PGIM Muni High Income Fund | | | 33 | |
Schedule of Investments(continued)
as of April 30, 2019
| | | | | | | | | | | | | | | | |
| | | | |
| Description | | Interest
Rate | | | Maturity
Date | | | Principal Amount (000)# | | | Value | |
| | | | |
Virginia 2.0% | | | | | | | | | | | | | | | | |
City of Chesapeake Expressway Toll Road Rev.,
Transn. Sys., Sr. Ser. B, CABS, Rfdg. (Convert to Fixed on 07/15/23) | | | 0.000 | %(cc) | | | 07/15/40 | | | | 1,000 | | | $ | 930,940 | |
Mosaic District Cmnty. Dev. Auth. Spl. Assmt.,
Ser. A | | | 6.875 | | | | 03/01/36 | | | | 1,250 | | | | 1,327,075 | |
Norfolk Econ. Dev. Auth. Rev.,
Sentara Healthcare, Ser. B, Rfdg. | | | 4.000 | | | | 11/01/48 | | | | 2,000 | | | | 2,139,000 | |
Virginia Small Business Fin. Auth. Rev.,
Transform 66 P3 Proj., AMT | | | 5.000 | | | | 12/31/56 | | | | 2,000 | | | | 2,180,140 | |
Virginia Small Business Fin. Auth. Rev., Sr. Lien, | | | | | | | | | | | | | | | | |
Elizabeth River Crossings OpCo LLC Proj., AMT | | | 5.250 | | | | 01/01/32 | | | | 2,055 | | | | 2,200,576 | |
Elizabeth River Crossings OpCo LLC Proj., AMT | | | 5.500 | | | | 01/01/42 | | | | 3,000 | | | | 3,239,730 | |
Express Lanes LLC Proj., AMT | | | 5.000 | | | | 01/01/40 | | | | 4,780 | | | | 5,040,415 | |
| | | | | | | | | | | | | | | | |
| | | | | | | | | | | | | | | 17,057,876 | |
| | | | | | | | | | | | | | | | |
| | | | |
Washington 1.8% | | | | | | | | | | | | | | | | |
Port of Seattle Indl. Dev. Corp. Rev.,
Spl. Facs., Delta Airlines, AMT, Rfdg. | | | 5.000 | | | | 04/01/30 | | | | 1,000 | | | | 1,081,410 | |
Skagit Cnty. Pub. Hosp. Dist. No. 1 Rev., | | | | | | | | | | | | | | | | |
Skagit Valley Hosp. | | | 5.750 | | | | 12/01/35 | | | | 625 | | | | 653,237 | |
Skagit Valley Hosp., Ser. A, Rfdg. | | | 5.000 | | | | 12/01/37 | | | | 3,000 | | | | 3,232,860 | |
Tob. Settlement Auth. Wash. Rev.,
Rfdg. | | | 5.250 | | | | 06/01/32 | | | | 1,160 | | | | 1,222,559 | |
Washington St. Convention Ctr. Pub. Facs. Dist. Rev.,
Civic Convention Ctr. | | | 4.000 | | | | 07/01/58 | | | | 2,000 | | | | 2,073,100 | |
Washington St. Healthcare Facs. Auth. Rev., | | | | | | | | | | | | | | | | |
Kadlec Regl. Med. Ctr., Rdfg. (Pre-refunded 12/01/21)(ee) | | | 5.000 | | | | 12/01/42 | | | | 1,000 | | | | 1,083,750 | |
Overlake Hosp. Med. Ctr., Rfdg. | | | 5.000 | | | | 07/01/38 | | | | 1,100 | | | | 1,211,892 | |
Overlake Hosp. Med. Ctr., Ser. A | | | 4.000 | | | | 07/01/42 | | | | 2,500 | | | | 2,630,950 | |
Washington St. Hsg. Fin. Comm. Rev.,
Rockwood Retmnt. Cmnty. Proj., Ser. A, Rfdg., 144A | | | 7.375 | | | | 01/01/44 | | | | 2,000 | | | | 2,273,520 | |
| | | | | | | | | | | | | | | | |
| | | | | | | | | | | | | | | 15,463,278 | |
| | | | | | | | | | | | | | | | |
| | | | |
West Virginia 0.2% | | | | | | | | | | | | | | | | |
Monongalia Cnty. Com. Special District, Rev.,
Univ. Town Ctr., Ser. A, Rfdg., 144A | | | 5.750 | | | | 06/01/43 | | | | 500 | | | | 522,965 | |
West Virginia Hosp. Fin. Auth. Rev.,
Cabell Huntington Hosp. Oblig. Grp., Ser. A, Rfdg. | | | 4.125 | | | | 01/01/47 | | | | 1,500 | | | | 1,542,495 | |
| | | | | | | | | | | | | | | | |
| | | | | | | | | | | | | | | 2,065,460 | |
| | | | | | | | | | | | | | | | |
See Notes to Financial Statements.
| | | | | | | | | | | | | | | | |
| | | | |
| Description | | Interest Rate | | | Maturity Date | | | Principal Amount (000)# | | | Value | |
| | | | |
Wisconsin 1.9% | | | | | | | | | | | | | | | | |
Pub. Fin. Auth. Rev., | | | | | | | | | | | | | | | | |
Bancroft Neurohealth Proj., Ser. A, 144A | | | 5.125 | % | | | 06/01/48 | | | | 1,000 | | | $ | 1,018,670 | |
Celanese Proj., Ser. C, AMT, Rfdg. | | | 4.300 | | | | 11/01/30 | | | | 3,000 | | | | 3,111,960 | |
Cornerstone Chrt. Academy Proj., Ser. A, 144A | | | 5.125 | | | | 02/01/46 | | | | 1,000 | | | | 1,010,430 | |
Corvian Cmnty. Sch., Ser. A, 144A | | | 5.125 | | | | 06/15/47 | | | | 2,000 | | | | 2,022,760 | |
Mountain Island Chrt. Sch., Ser. L, Rfdg. | | | 5.000 | | | | 07/01/47 | | | | 1,000 | | | | 1,053,820 | |
Senior-MD Proton Treatment Ctr., Ser. A-1, 144A | | | 6.375 | | | | 01/01/48 | | | | 2,000 | | | | 2,114,020 | |
Sr. Oblig. Grp., Ser. B, AMT, Rfdg. | | | 5.000 | | | | 07/01/42 | | | | 1,500 | | | | 1,589,415 | |
Sr. Oblig. Grp., Ser. B, AMT, Rfdg. | | | 5.250 | | | | 07/01/28 | | | | 1,000 | | | | 1,082,990 | |
Wakemed Hosp., Ser. A, Rfdg. | | | 4.000 | | | | 10/01/49 | | | | 2,000 | | | | 2,079,320 | |
Wisconsin St. Hlth. & Edl. Facs. Auth. Rev., | | | | | | | | | | | | | | | | |
Ascension Hlth. Alliance Sr. Credit Grp., Ser. B-1, | | | | | | | | | | | | | | | | |
Rmkt, Rfdg. | | | 4.000 | | | | 11/15/43 | | | | 1,500 | | | | 1,594,515 | |
| | | | | | | | | | | | | | | | |
| | | | | | | | | | | | | | | 16,677,900 | |
| | | | | | | | | | | | | | | | |
| | | | |
Wyoming 0.1% | | | | | | | | | | | | | | | | |
Campbell Cnty. Solid Wste. Facs. Rev.,
Basin Elec. Pwr. Coop., Ser. A | | | 5.750 | | | | 07/15/39 | | | | 500 | | | | 503,885 | |
| | | | | | | | | | | | | | | | |
| | | | |
TOTAL INVESTMENTS 98.8%
(cost $806,089,883) | | | | | | | | | | | | | | | 853,349,908 | |
Other assets in excess of liabilities(z) 1.2% | | | | | | | | | | | | | | | 10,592,718 | |
| | | | | | | | | | | | | | | | |
| | | | |
NET ASSETS 100.0% | | | | | | | | | | | | | | $ | 863,942,626 | |
| | | | | | | | | | | | | | | | |
Below is a list of the abbreviation(s) used in the annual report:
144A—Security was purchased pursuant to Rule 144A under the Securities Act of 1933 and, pursuant to the requirements of Rule 144A, may not be resold except to qualified institutional buyers.
AGM—Assured Guaranty Municipal Corp.
AMBAC—American Municipal Bond Assurance Corp.
AMT—Alternative Minimum Tax
CABS—Capital Appreciation Bonds
CDD—Community Development District
COP—Certificates of Participation
FRDD—Floating Rate Daily Demand Note
GO—General Obligation
IDB—Industrial Development Bond
LIBOR—London Interbank Offered Rate
NATL—National Public Finance Guaranty Corp.
OTC—Over-the-counter
PCR—Pollution Control Revenue
| # | Principal amount is shown in U.S. dollars unless otherwise stated. |
| ^ | Indicates a Level 3 security. The aggregate value of Level 3 securities is $483,800 and 0.1% of net assets. |
| (c) | Variable rate instrument. The interest rate shown reflects the rate in effect at April 30, 2019. |
See Notes to Financial Statements.
| | | | |
| PGIM Muni High Income Fund | | | 35 | |
Schedule of Investments(continued)
as of April 30, 2019
| (cc) | Variable rate instrument. The rate shown is based on the latest available information as of April 30, 2019. Certain variable rate securities are not based on a published reference rate and spread but are determined by the issuer or agent and are based on current market conditions. These securities do not indicate a reference rate and spread in their description. |
| (d) | Represents issuer in default on interest payments and/or principal repayment. Non-income producing security. Such securities may be post-maturity. |
| (ee) | All or partial escrowed to maturity and pre-refunded issues are secured by escrowed cash, a guaranteed investment contract and /or U.S. guaranteed obligations. |
| (f) | Indicates a restricted security; the aggregate original cost of such securities is $820,000. The aggregate value of $483,800 is 0.1% of net assets. |
| (t) | Represents zero coupon. Rate quoted represents effective yield at April 30, 2019. |
| (z) | Includes net unrealized appreciation/(depreciation) and/or market value of the below holdings which are excluded from the Schedule of Investments: |
Summary of Collateral for Centrally Cleared/Exchange-traded Derivatives:
Cash and securities segregated as collateral, including pending settlement for closed positions, to cover requirements for centrally cleared/exchange-traded derivatives are listed by broker as follows:
| | | | |
Broker | | Cash and/or Foreign Currency | | Securities Market Value |
Citigroup Global Markets, Inc. | | $200,000 | | $— |
| | | | |
Fair Value Measurements:
Various inputs are used in determining the value of the Fund’s investments. These inputs are summarized in the three broad levels listed below.
Level 1—unadjusted quoted prices generally in active markets for identical securities.
Level 2—quoted prices for similar securities, interest rates and yield curves, prepayment speeds, foreign currency exchange rates and other observable inputs.
Level 3—unobservable inputs for securities valued in accordance with Board approved fair valuation procedures.
The following is a summary of the inputs used as of April 30, 2019 in valuing such portfolio securities:
| | | | | | | | | | | | |
| | | Level 1 | | | Level 2 | | | Level 3 | |
Investments in Securities | | | | | | | | | | | | |
Municipal Bonds | | | | | | | | | | | | |
Alabama | | $ | — | | | $ | 3,929,335 | | | $ | — | |
Arizona | | | — | | | | 33,840,398 | | | | — | |
California | | | — | | | | 79,450,851 | | | | — | |
Colorado | | | — | | | | 23,217,139 | | | | — | |
Connecticut | | | — | | | | 5,574,017 | | | | — | |
Delaware | | | — | | | | 3,093,974 | | | | — | |
District of Columbia | | | — | | | | 12,045,524 | | | | — | |
Florida | | | — | | | | 76,197,737 | | | | 483,800 | |
Georgia | | | — | | | | 9,491,763 | | | | — | |
Hawaii | | | — | | | | 4,830,520 | | | | — | |
Illinois | | | — | | | | 108,876,766 | | | | — | |
Indiana | | | — | | | | 5,219,464 | | | | — | |
See Notes to Financial Statements.
| | | | | | | | | | | | |
| | | Level 1 | | | Level 2 | | | Level 3 | |
Investments in Securities (continued) | | | | | | | | | | | | |
Municipal Bonds (continued) | | | | | | | | | | | | |
Iowa | | $ | — | | | $ | 928,775 | | | $ | — | |
Kansas | | | — | | | | 1,035,803 | | | | — | |
Kentucky | | | — | | | | 4,896,310 | | | | — | |
Louisiana | | | — | | | | 7,421,930 | | | | — | |
Maine | | | — | | | | 2,212,360 | | | | — | |
Maryland | | | — | | | | 12,414,290 | | | | — | |
Massachusetts | | | — | | | | 7,879,636 | | | | — | |
Michigan | | | — | | | | 10,648,816 | | | | — | |
Minnesota | | | — | | | | 9,065,002 | | | | — | |
Mississippi | | | — | | | | 800,000 | | | | — | |
Missouri | | | — | | | | 20,043,389 | | | | — | |
Nevada | | | — | | | | 2,852,455 | | | | — | |
New Jersey | | | — | | | | 69,612,468 | | | | — | |
New York | | | — | | | | 40,056,634 | | | | — | |
North Carolina | | | — | | | | 3,177,270 | | | | — | |
North Dakota | | | — | | | | 802,185 | | | | — | |
Ohio | | | — | | | | 50,056,842 | | | | — | |
Oklahoma | | | — | | | | 20,777,236 | | | | — | |
Oregon | | | — | | | | 2,157,250 | | | | — | |
Pennsylvania | | | — | | | | 43,496,792 | | | | — | |
Puerto Rico | | | — | | | | 20,674,778 | | | | — | |
Rhode Island | | | — | | | | 2,926,069 | | | | — | |
South Carolina | | | — | | | | 6,429,690 | | | | — | |
South Dakota | | | — | | | | 1,739,604 | | | | — | |
Tennessee | | | — | | | | 11,880,397 | | | | — | |
Texas | | | — | | | | 77,931,914 | | | | — | |
Utah | | | — | | | | 2,269,239 | | | | — | |
Vermont | | | — | | | | 1,143,087 | | | | — | |
Virginia | | | — | | | | 17,057,876 | | | | — | |
Washington | | | — | | | | 15,463,278 | | | | — | |
West Virginia | | | — | | | | 2,065,460 | | | | — | |
Wisconsin | | | — | | | | 16,677,900 | | | | — | |
Wyoming | | | — | | | | 503,885 | | | | — | |
| | | | | | | | | | | | |
Total | | $ | — | | | $ | 852,866,108 | | | $ | 483,800 | |
| | | | | | | | | | | | |
Sector Classification:
The sector classification of investments and other assets in excess of liabilities shown as a percentage of net assets as of April 30, 2019 were as follows (unaudited):
| | | | |
Healthcare | | | 22.6 | % |
Corporate Backed IDB & PCR | | | 11.6 | |
Transportation | | | 11.1 | |
Special Tax/Assessment District | | | 10.3 | |
Education | | | 9.2 | |
Tobacco Appropriated | | | 9.1 | |
General Obligation | | | 8.4 | |
| | | | |
Power | | | 5.9 | % |
Pre-Refunded | | | 4.8 | |
Lease Backed Certificate of Participation | | | 2.9 | |
Water & Sewer | | | 1.8 | |
Solid Waste/Resource Recovery | | | 1.1 | |
| | | | |
| | | 98.8 | |
See Notes to Financial Statements.
| | | | |
| PGIM Muni High Income Fund | | | 37 | |
Schedule of Investments(continued)
as of April 30, 2019
Sector Classification (continued):
| | | | |
Other assets in excess of liabilities | | | 1.2 | % |
| | | | |
| | | 100.0 | % |
| | | | |
Effects of Derivative Instruments on the Financial Statements and Primary Underlying Risk Exposure:
The Fund invested in derivative instruments during the reporting period. The primary type of risk associated with these derivative instruments is interest rate contracts risk. The effect of such derivative instruments on the Fund’s financial position and financial performance as reflected in the Statement of Assets and Liabilities and Statement of Operations is presented in the summary below.
The Fund did not hold any derivative instruments as of April 30, 2019, accordingly, no derivative positions were presented in the Statement of Assets and Liabilities.
The effects of derivative instruments on the Statement of Operations for the year ended April 30, 2019 are as follows:
| | | | |
Amount of Realized Gain (Loss) on Derivatives Recognized in Income | |
Derivatives not accounted for as hedging
instruments, carried at fair value | | Futures | |
Interest rate contracts | | $ | (70,507 | ) |
| | | | |
For the year ended April 30, 2019, the Fund’s average volume of derivative activities is as follows:
| | | | | | | | | | | | | | | | | | | | | | |
| | | | | | Futures
Contracts—
Short
Positions(1) | | | | | | | | | | |
| | | | | | | | $ | 3,408,963 | | | | | | | | | | | | | |
| (1) | Notional Amount in USD. |
See Notes to Financial Statements.
Statement of Assets & Liabilities
as of April 30, 2019
| | | | |
Assets | | | | |
Unaffiliated investments (cost $806,089,883) | | $ | 853,349,908 | |
Cash | | | 39,317 | |
Interest receivable | | | 14,017,305 | |
Receivable for investments sold | | | 3,684,875 | |
Receivable for Fund shares sold | | | 1,260,274 | |
Deposit with broker for centrally cleared/exchange-traded derivatives | | | 200,000 | |
Prepaid expenses | | | 2,331 | |
| | | | |
Total Assets | | | 872,554,010 | |
| | | | |
| |
Liabilities | | | | |
Payable for investments purchased | | | 5,618,920 | |
Payable for Fund shares reacquired | | | 1,979,854 | |
Management fee payable | | | 350,768 | |
Dividends payable | | | 334,510 | |
Distribution fee payable | | | 156,397 | |
Accrued expenses and other liabilities | | | 156,268 | |
Affiliated transfer agent fee payable | | | 14,667 | |
| | | | |
Total Liabilities | | | 8,611,384 | |
| | | | |
| |
Net Assets | | $ | 863,942,626 | |
| | | | |
| | | | | |
Net assets were comprised of: | | | | |
Shares of beneficial interest, at par | | $ | 841,273 | |
Paid-in capital in excess of par | | | 832,261,027 | |
Total distributable earnings (loss) | | | 30,840,326 | |
| | | | |
Net assets, April 30, 2019 | | $ | 863,942,626 | |
| | | | |
See Notes to Financial Statements.
| | | | |
| PGIM Muni High Income Fund | | | 39 | |
Statement of Assets & Liabilities
as of April 30, 2019
| | | | |
Class A | | | | |
Net asset value and redemption price per share,
($339,939,672 ÷ 33,075,588 shares of beneficial interest issued and outstanding) | | $ | 10.28 | |
Maximum sales charge (4.00% of offering price) | | | 0.43 | |
| | | | |
Maximum offering price to public | | $ | 10.71 | |
| | | | |
| |
Class B | | | | |
Net asset value, offering price and redemption price per share,
($17,068,218 ÷ 1,660,312 shares of beneficial interest issued and outstanding) | | $ | 10.28 | |
| | | | |
| |
Class C | | | | |
Net asset value, offering price and redemption price per share,
($95,749,381 ÷ 9,315,599 shares of beneficial interest issued and outstanding) | | $ | 10.28 | |
| | | | |
| |
Class Z | | | | |
Net asset value, offering price and redemption price per share,
($404,187,804 ÷ 39,394,345 shares of beneficial interest issued and outstanding) | | $ | 10.26 | |
| | | | |
| |
Class R6 | | | | |
Net asset value, offering price and redemption price per share,
($6,997,551 ÷ 681,470 shares of beneficial interest issued and outstanding) | | $ | 10.27 | |
| | | | |
See Notes to Financial Statements.
Statement of Operations
Year Ended April 30, 2019
| | | | |
Net Investment Income (Loss) | |
Interest income | | $ | 39,777,457 | |
| | | | |
| |
Expenses | | | | |
Management fee | | | 4,212,073 | |
Distribution fee(a) | | | 1,976,823 | |
Transfer agent’s fees and expenses (including affiliated expense of $ 75,842)(a) | | | 597,665 | |
Custodian and accounting fees | | | 133,689 | |
Registration fees(a) | | | 116,920 | |
Shareholders’ reports | | | 51,557 | |
Audit fee | | | 39,554 | |
Trustees’ fees | | | 27,797 | |
Legal fees and expenses | | | 26,230 | |
Miscellaneous | | | 27,449 | |
| | | | |
Total expenses | | | 7,209,757 | |
Less: Fee waiver and/or expense reimbursement(a) | | | (14,115 | ) |
Custodian fee credit | | | (4,909 | ) |
| | | | |
Net expenses | | | 7,190,733 | |
| | | | |
Net investment income (loss) | | | 32,586,724 | |
| | | | |
|
Realized And Unrealized Gain (Loss) On Investments | |
Net realized gain (loss) on: | |
Investment transactions | | | (8,241,395 | ) |
Futures transactions | | | (70,507 | ) |
| | | | |
| | | (8,311,902 | ) |
| | | | |
Net change in unrealized appreciation (depreciation) on investments | | | 21,794,364 | |
| | | | |
Net gain (loss) on investment transactions | | | 13,482,462 | |
| | | | |
Net Increase (Decrease) In Net Assets Resulting From Operations | | $ | 46,069,186 | |
| | | | |
| (a) | Class specific expenses and waivers were as follows: |
| | | | | | | | | | | | | | | | | | | | |
| | | Class A | | | Class B | | | Class C | | | Class Z | | | Class R6 | |
Distribution fee | | | 808,452 | | | | 120,508 | | | | 1,047,863 | | | | — | | | | — | |
Transfer agent’s fees and expenses | | | 189,718 | | | | 20,890 | | | | 56,246 | | | | 330,712 | | | | 99 | |
Registration fees | | | 28,722 | | | | 15,944 | | | | 15,360 | | | | 39,816 | | | | 17,078 | |
Fee waiver and/or expense reimbursement | | | — | | | | — | | | | — | | | | — | | | | (14,115 | ) |
See Notes to Financial Statements.
| | | | |
| PGIM Muni High Income Fund | | | 41 | |
Statements of Changes in Net Assets
| | | | | | | | |
| |
| | | Year Ended April 30, | |
| | |
| | | 2019 | | | 2018 | |
Increase (Decrease) in Net Assets | | | | | | | | |
Operations | | | | | | | | |
Net investment income (loss) | | $ | 32,586,724 | | | $ | 33,085,189 | |
Net realized gain (loss) on investment transactions | | | (8,311,902 | ) | | | 6,382,371 | |
Net change in unrealized appreciation (depreciation) on investments | | | 21,794,364 | | | | (6,511,384 | ) |
| | | | | | | | |
Net increase (decrease) in net assets resulting from operations | | | 46,069,186 | | | | 32,956,176 | |
| | | | | | | | |
| | |
Dividends and Distributions | | | | | | | | |
Distributions from distributable earnings* | | | | | | | | |
Class A | | | (12,784,930 | ) | | | — | |
Class B | | | (869,397 | ) | | | — | |
Class C | | | (3,352,033 | ) | | | — | |
Class Z | | | (16,052,548 | ) | | | — | |
Class R6 | | | (210,839 | ) | | | — | |
| | | | | | | | |
| | | (33,269,747 | ) | | | — | |
| | | | | | | | |
Dividends from net investment income* | | | | | | | | |
Class A | | | | | | | (13,210,689 | ) |
Class B | | | | | | | (1,312,516 | ) |
Class C | | | | | | | (3,634,016 | ) |
Class Z | | | | | | | (15,445,809 | ) |
Class R6 | | | | | | | (1,892 | ) |
| | | | | | | | |
| | | * | | | | (33,604,922 | ) |
| | | | | | | | |
| | |
Fund share transactions (Net of share conversions) | | | | | | | | |
Net proceeds from shares sold | | | 248,089,682 | | | | 188,807,446 | |
Net asset value of shares issued in reinvestment of dividends and distributions | | | 28,688,077 | | | | 28,272,949 | |
Cost of shares reacquired | | | (264,452,843 | ) | | | (220,374,624 | ) |
| | | | | | | | |
Net increase (decrease) in net assets from Fund share transactions | | | 12,324,916 | | | | (3,294,229 | ) |
| | | | | | | | |
Total increase (decrease) | | | 25,124,355 | | | | (3,942,975 | ) |
| | |
Net Assets: | | | | | | | | |
Beginning of year | | | 838,818,271 | | | | 842,761,246 | |
| | | | | | | | |
End of year(a) | | $ | 863,942,626 | | | $ | 838,818,271 | |
| | | | | | | | |
(a) Includes undistributed/(distributions in excess of) net investment income of: | | $ | * | | | $ | 7,036,516 | |
| | | | | | | | |
| * | For the year ended April 30, 2019, the disclosures have been revised to reflect revisions to Regulation S-X adopted by the SEC in 2018 (refer to Note 9). |
See Notes to Financial Statements.
Notes to Financial Statements
Prudential Investment Portfolios 4 (the “Trust”) is registered under the Investment Company Act of 1940, as amended (“1940 Act”), as a diversified, open-end management investment company. The Trust was organized as an unincorporated business trust in Massachusetts on November 3, 1986 and currently consists of one fund: the PGIM Muni High Income Fund (the “Fund”).
The investment objective of the Fund is to provide the maximum amount of income that is eligible for exclusion from federal income taxes.
1. Accounting Policies
The Fund follows the investment company accounting and reporting guidance of the Financial Accounting Standards Board (“FASB”) Accounting Standard Codification (“ASC”) Topic 946 Financial Services — Investment Companies. The following accounting policies conform to U.S. generally accepted accounting principles. The Fund consistently follows such policies in the preparation of its financial statements.
Securities Valuation:The Fund holds securities and other assets and liabilities that are fair valued at the close of each day (generally, 4:00 PM Eastern time) the New York Stock Exchange (“NYSE”) is open for trading. Fair value is the price that would be received to sell an asset or paid to transfer a liability in an orderly transaction between market participants on the measurement date. The Trust’s Board of Trustees (the “Board”) has adopted valuation procedures for security valuation under which fair valuation responsibilities have been delegated to PGIM Investments LLC (“PGIM Investments” or the “Manager”). Pursuant to the Board’s delegation, the Manager has established a Valuation Committee responsible for supervising the fair valuation of portfolio securities and other assets and liabilities. The valuation procedures permit the Fund to utilize independent pricing vendor services, quotations from market makers, and alternative valuation methods when market quotations are either not readily available or not deemed representative of fair value. A record of the Valuation Committee’s actions is subject to the Board’s review, approval, and ratification at its next regularly scheduled quarterly meeting.
For the fiscal reporting year-end, securities and other assets and liabilities were fair valued at the close of the last U.S. business day. Trading in certain foreign securities may occur when the NYSE is closed (including weekends and holidays). Because such foreign securities trade in markets that are open on weekends and U.S. holidays, the values of some of the Fund’s foreign investments may change on days when investors cannot purchase or redeem Fund shares.
Various inputs determine how the Fund’s investments are valued, all of which are categorized according to the three broad levels (Level 1, 2, or 3) detailed in the Schedule of
| | | | |
| PGIM Muni High Income Fund | | | 43 | |
Notes to Financial Statements(continued)
Investments and referred to herein as the “fair value hierarchy” in accordance with FASB ASC Topic 820—Fair Value Measurements and Disclosures.
Derivative instruments, such as futures or options, that are traded on a national securities exchange are valued at the last sale price as of the close of trading on the applicable exchange where the security principally trades. Securities traded via NASDAQ are valued at the NASDAQ official closing price. To the extent these securities are valued at the last sale price or NASDAQ official closing price, they are classified as Level 1 in the fair value hierarchy. In the event that no sale or official closing price on valuation date exists, these securities are generally valued at the mean between the last reported bid and ask prices, or at the last bid price in the absence of an ask price. These securities are classified as Level 2 in the fair value hierarchy.
Fixed income securities traded in the OTC market are generally classified as Level 2 in the fair value hierarchy. Such fixed income securities are typically valued using the market approach which generally involves obtaining data from an approved independent third-party vendor source. The Fund utilizes the market approach as the primary method to value securities when market prices of identical or comparable instruments are available. The third-party vendors’ valuation techniques used to derive the evaluated bid price are based on evaluating observable inputs, including but not limited to, yield curves, yield spreads, credit ratings, deal terms, tranche level attributes, default rates, cash flows, prepayment speeds, broker/dealer quotations and reported trades. Certain Level 3 securities are also valued using the market approach when obtaining a single broker quote or when utilizing transaction prices for identical securities that have been used in excess of five business days. During the reporting period, there were no changes to report with respect to the valuation approach and/or valuation techniques discussed above.
Securities and other assets that cannot be priced according to the methods described above are valued based on pricing methodologies approved by the Board. In the event that unobservable inputs are used when determining such valuations, the securities will be classified as Level 3 in the fair value hierarchy.
When determining the fair value of securities, some of the factors influencing the valuation include: the nature of any restrictions on disposition of the securities; assessment of the general liquidity of the securities; the issuer’s financial condition and the markets in which it does business; the cost of the investment; the size of the holding and the capitalization of the issuer; the prices of any recent transactions or bids/offers for such securities or any comparable securities; any available analyst media or other reports or information deemed reliable by the Manager regarding the issuer or the markets or industry in which it operates. Using fair value to price securities may result in a value that is different from a security’s
most recent closing price and from the price used by other unaffiliated mutual funds to calculate their net asset values.
Illiquid Securities:Pursuant to Rule 22e-4 under the 1940 Act, the Fund has adopted a Board approved Liquidity Risk Management Program (“LRMP”) that requires, among other things, that the Fund limit its illiquid investments that are assets to no more than 15% of net assets. Illiquid securities are those that, because of the absence of a readily available market or due to legal or contractual restrictions on resale, may not reasonably be expected to be sold or disposed of in current market conditions in seven calendar days or less without the sale or disposition significantly changing the market value of the investment. The Fund may find it difficult to sell illiquid securities at the time considered most advantageous by its subadviser and may incur transaction costs that would not be incurred in the sale of securities that were freely marketable.
Restricted Securities:Securities acquired in unregistered, private sales from the issuing company or from an affiliate of the issuer are considered restricted as to disposition under federal securities law (“restricted securities”). Such restricted securities are valued pursuant to the valuation procedures noted above. Restricted securities that would otherwise be considered illiquid investments pursuant to the Fund’s LRMP because of legal restrictions on resale to the general public may be traded among qualified institutional buyers under Rule 144A of the Securities Act of 1933. Therefore, these Rule 144A securities, as well as commercial paper that is sold in private placements under Section 4(2) of the Securities Act of 1933, may be classified higher than “illiquid” under the LRMP (i.e. “moderately liquid” or “less liquid” investments). However, the liquidity of the Fund’s investments in restricted securities could be impaired if trading does not develop or declines.
Financial Futures Contracts:A financial futures contract is an agreement to purchase (long) or sell (short) an agreed amount of securities at a set price for delivery on a future date. Upon entering into a financial futures contract, the Fund is required to pledge to the broker an amount of cash and/or other assets equal to a certain percentage of the contract amount. This amount is known as the “initial margin.” Subsequent payments, known as “variation margin,” are made or received by the Fund each day, depending on the daily fluctuations in the value of the underlying security. Such variation margin is recorded for financial statement purposes on a daily basis as unrealized gain (loss). When the contract expires or is closed, the gain (loss) is realized and is presented in the Statement of Operations as net realized gain (loss) on futures transactions.
The Fund invested in financial futures contracts in order to hedge its existing portfolio securities, or securities the Fund intends to purchase, against fluctuations in value caused by changes in prevailing interest rates. Should interest rates move unexpectedly, the Fund may not achieve the anticipated benefits of the financial futures contracts and may realize a loss. The use of futures transactions involves the risk of imperfect correlation in movements in the price of futures contracts, interest rates and the underlying hedged assets. Since futures contracts are exchange-traded, there is minimal counterparty credit risk to the Fund
| | | | |
| PGIM Muni High Income Fund | | | 45 | |
Notes to Financial Statements(continued)
since the exchanges’ clearinghouse acts as counterparty to all exchange-traded futures and guarantees the futures contracts against default.
Securities Transactions and Net Investment Income:Securities transactions are recorded on the trade date. Realized gains (losses) from investment and currency transactions are calculated on the specific identification method. Dividend income is recorded on the ex-date, or for certain foreign securities, when the Fund becomes aware of such dividends. Interest income, including amortization of premium and accretion of discount on debt securities, as required, is recorded on the accrual basis. Expenses are recorded on an accrual basis, which may require the use of certain estimates by management that may differ from actual. Net investment income or loss (other than class specific expenses and waivers, which are allocated as noted below) and unrealized and realized gains (losses) are allocated daily to each class of shares based upon the relative proportion of adjusted net assets of each class at the beginning of the day. Class specific expenses and waivers, where applicable, are charged to the respective share classes. Class specific expenses include distribution fees and distribution fee waivers, shareholder servicing fees, transfer agent’s fees and expenses, registration fees and fee waivers and/or expense reimbursements, as applicable.
Taxes:It is the Fund’s policy to continue to meet the requirements of the Internal Revenue Code applicable to regulated investment companies and to distribute all of its taxable net investment income and capital gains, if any, to its shareholders. Therefore, no federal income tax provision is required. Withholding taxes on foreign dividends, interest and capital gains, if any, are recorded, net of reclaimable amounts, at the time the related income is earned.
Custody Fee Credits:The Fund has an arrangement with its custodian bank, whereby uninvested monies earn credits which reduce the fees charged by the custodian. Such custody fee credits, if any, are presented as a reduction of gross expenses in the accompanying Statement of Operations.
Dividends and Distributions:The Fund expects to declare dividends of its net investment income daily and pay such dividends monthly. Distributions of net realized capital gains, if any, are declared and paid at least annually. Dividends and distributions to shareholders, which are determined in accordance with federal income tax regulations and which may differ from generally accepted accounting principles, are recorded on the ex-date. Permanent book/tax differences relating to income and gain (loss) are reclassified between total distributable earnings (loss) and paid-in capital in excess of par, as appropriate.
Estimates:The preparation of financial statements requires management to make estimates and assumptions that affect the reported amounts and disclosures in the financial
statements. Actual results could differ from those estimates.
2. Agreements
The Trust, on behalf of the Fund, has a management agreement with PGIM Investments. Pursuant to this agreement, PGIM Investments has responsibility for all investment advisory services and supervises the subadviser’s performance of such services. In addition, under the management agreement, PGIM Investments provides all of the administrative functions necessary for the organization, operation and management of the Fund. PGIM Investments administers the corporate affairs of the Fund and, in connection therewith, furnishes the Fund with office facilities, together with those ordinary clerical and bookkeeping services which are not being furnished by the Fund’s custodian and the Fund’s transfer agent. PGIM Investments is also responsible for the staffing and management of dedicated groups of legal, marketing, compliance and related personnel necessary for the operation of the Fund. The legal, marketing, compliance and related personnel are also responsible for the management and oversight of the various service providers to the Fund, including, but not limited to, the custodian, transfer agent, and accounting agent.
PGIM Investments has entered into a subadvisory agreement with PGIM, Inc., which provides subadvisory services to the Fund through its PGIM Fixed Income unit. The subadvisory agreement provides that PGIM, Inc. will furnish investment advisory services in connection with the management of the Fund. In connection therewith, PGIM, Inc. is obligated to keep certain books and records of the Fund. PGIM Investments pays for the services of PGIM, Inc., the cost of compensation of officers of the Fund, occupancy and certain clerical and bookkeeping costs of the Fund. The Fund bears all other costs and expenses.
The management fee paid to the Manager is accrued daily and payable monthly at an annual rate of 0.50% of the Fund’s average daily net assets up to $1 billion and 0.45% of the average daily net assets in excess of $1 billion. The effective management fee rate before any waivers and/or expense reimbursements was 0.50% for the year ended April 30, 2019.
The Manager has contractually agreed, through August 31, 2020, to limit transfer agency, shareholder servicing, sub-transfer agency, and blue sky fees, as applicable, to the extent that such fees cause the total annual operating expenses to exceed 0.60% of average daily net assets for Class R6 shares. This contractual waiver excludes interest, brokerage, taxes (such as income and foreign withholding taxes, stamp duty and deferred tax expenses), acquired fund fees and expenses, extraordinary expenses, and certain other Fund expenses such as dividend and interest expense and broker charges on short sales.
Where applicable, the Manager agrees to waive management fees or shared operating expenses on any share class to the same extent that it waives similar expenses on any other share class. In addition, total annual fund operating expenses for Class R6 shares will not exceed total annual operating expenses for Class Z shares. Fees and/or expenses waived
| | | | |
| PGIM Muni High Income Fund | | | 47 | |
Notes to Financial Statements(continued)
and/or reimbursed by PGIM Investments may be recouped by PGIM Investments within the same fiscal year during which such waiver and/or reimbursement is made if such recoupment can be realized without exceeding the expense limit in effect at the time of the recoupment for that fiscal year.
The Trust, on behalf of the Fund, has a distribution agreement with Prudential Investment Management Services LLC (“PIMS”), which acts as the distributor of the Class A, Class B, Class C, Class Z and Class R6 shares of the Fund. The Fund compensates PIMS for distributing and servicing the Fund’s Class A, Class B and Class C shares, pursuant to the plans of distribution (the “Distribution Plans”), regardless of expenses actually incurred by PIMS. The distribution fees are accrued daily and payable monthly. No distribution or service fees are paid to PIMS as distributor of the Class Z or Class R6 shares of the Fund.
Pursuant to the Distribution Plans, the Fund compensates PIMS for distribution related activities at an annual rate of up to 0.25%, 0.50% and 1% of the average daily net assets of the Class A, Class B and Class C shares, respectively.
For the year ended April 30, 2019, PIMS received $286,973 in front-end sales charges resulting from sales of Class A shares. Additionally, for the year ended April 30, 2019, PIMS received $12,744, $11,003 and $5,973 in contingent deferred sales charges imposed upon redemptions by certain Class A, Class B and Class C shareholders, respectively. From these fees, PIMS paid such sales charges to broker-dealers, who in turn paid commissions to salespersons and incurred other distribution costs.
PGIM Investments, PGIM, Inc. and PIMS are indirect, wholly-owned subsidiaries of Prudential Financial, Inc. (“Prudential”).
3. Other Transactions with Affiliates
Prudential Mutual Fund Services LLC (“PMFS”), an affiliate of PGIM Investments and an indirect, wholly-owned subsidiary of Prudential, serves as the Fund’s transfer agent. Transfer agent’s fees and expenses in the Statement of Operations include certain out-of-pocket expenses paid to non-affiliates, where applicable.
The Fund may enter into certain securities purchase or sale transactions under Board approved Rule 17a-7 procedures. Rule 17a-7 is an exemptive rule under the 1940 Act, that subject to certain conditions, permits purchase and sale transactions among affiliated investment companies, or between an investment company and a person that is affiliated solely by reason of having a common (or affiliated) investment adviser, common directors, and/or common officers. Pursuant to the Rule 17a-7 procedures and consistent with guidance issued by the SEC, the Trust’s Chief Compliance Officer (“CCO”) prepares a
quarterly summary of all such transactions for submission to the Board, together with the CCO’s written representation that all such 17a-7 transactions were effected in accordance with the Fund’s Rule 17a-7 procedures. Any 17a-7 transactions for the reporting period are disclosed in the “Portfolio Securities” note, below.
4. Portfolio Securities
The aggregate cost of purchases and proceeds from sales of portfolio securities (excluding short-term investments and U.S. Government securities) for the year ended April 30, 2019, were $462,489,912 and $453,001,309, respectively.
For the year ended April 30, 2019, the Fund’s purchase and sales transactions under Rule 17a-7 and realized gain as a result of 17a-7 sales transactions were as follows:
| | | | |
Purchases | | Sales | | Realized Gain |
| $18,559,607 | | $25,848,214 | | $— |
5. Distributions and Tax Information
Distributions to shareholders, which are determined in accordance with federal income tax regulations and which may differ from generally accepted accounting principles, are recorded on the ex-date. In order to present total distributable earnings (loss) and paid-in capital in excess of par on the Statement of Assets and Liabilities that more closely represent their tax character, certain adjustments have been made to total distributable earnings (loss)and paid-in capital in excess of par. For the year ended April 30, 2019, the adjustments were to increase total distributable earnings and decrease paid-in capital in excess of par by $19,388,615 due to the expiration of a capital loss carryforward. Net investment income, net realized loss on investment transactions and net assets were not affected by this change.
For the year ended April 30, 2019, the tax character of dividends paid by the Fund were $926,131 of ordinary income and $32,343,616 of tax-exempt income. For the year ended April 30, 2018, the tax character of dividends paid by the Fund were $929,867 of ordinary income and $32,675,055 of tax-exempt income.
As of April 30, 2019, the accumulated undistributed earnings on a tax basis were $8,401,002 of tax-exempt income (includes timing difference of $334,510 for dividends payable) and $370,879 of ordinary income.
| | | | |
| PGIM Muni High Income Fund | | | 49 | |
Notes to Financial Statements(continued)
The United States federal income tax basis of the Fund’s investments and the net unrealized appreciation as of April 30, 2019 were as follows:
| | | | | | |
Tax Basis | | Gross
Unrealized
Appreciation | | Gross
Unrealized
Depreciation | | Net
Unrealized
Appreciation |
| $805,157,577 | | $50,018,814 | | $(1,826,483) | | $48,192,331 |
The difference between book and tax basis was primarily due to the difference between financial and tax reporting with respect to accretion of market discount and defaulted securities.
Under the Regulated Investment Company Modernization Act of 2010 (the “Act”), the Fund is permitted to carryforward capital losses realized on or after May 1, 2011 (“post-enactment losses”) for an unlimited period. Post-enactment losses are required to be utilized before the utilization of losses incurred prior to the effective date of the Act. As a result of this ordering rule, capital loss carryforwards related to taxable years ending before April 30, 2012, (“pre-enactment losses”) may have an increased likelihood to expire unused. Additionally, post-enactment capital losses that are carried forward will retain their character as either short-term or long-term capital losses rather than being considered all short-term as under previous law. For the year ended April 30, 2019, approximately $19,389,000 of pre-enactment losses for the Fund was written off unused due to expiration. As of April 30, 2019, the Fund has post-enactment losses of approximately $25,789,000 which can be carried forward for an unlimited period. No capital gains distributions are expected to be paid to shareholders until net gains have been realized in excess of such losses.
The Manager has analyzed the Fund’s tax positions taken on federal, state and local income tax returns for all open tax years and has concluded that no provision for income tax is required in the Fund’s financial statements for the current reporting period. The Fund’s federal, state and local income and federal excise tax returns for tax years for which the applicable statutes of limitations have not expired are subject to examination by the Internal Revenue Service and state departments of revenue.
6. Capital and Ownership
The Fund offers Class A, Class B, Class C, Class Z and Class R6 shares. Class A shares are sold with a maximum front-end sales charge of 4.00%. Investors who purchase $1 million or more of Class A shares and sell these shares within 12 months of purchase are subject to a contingent deferred sales charge (“CDSC”) of 1%, although they are not subject to an initial sales charge. The Class A CDSC is waived for certain retirement and/or benefit plans. A special exchange privilege is also available for shareholders who qualified to purchase Class A shares at net asset value. Class B shares are sold with a CDSC which declines from
5% to zero depending on the period of time the shares are held. Class B shares will automatically convert to Class A shares on a monthly basis approximately seven years after purchase. Class B shares are closed to new purchases. Class C shares are sold with a CDSC of 1% on sales made within 12 months of purchase. Class C shares will automatically convert to Class A shares on a monthly basis approximately 10 years after purchase. Class Z and Class R6 shares are not subject to any sales or redemption charge and are available exclusively for sale to a limited group of investors.
Under certain circumstances, an exchange may be made from specified share classes of the Fund to one or more other share classes of the Fund as presented in the table of transactions in shares of beneficial interest.
The Fund is authorized to issue an unlimited number of shares of beneficial interest of each class at $0.01 par value divided into five classes, designated Class A, Class B, Class C, Class Z and Class R6.
As of April 30, 2019, Prudential, through its affiliated entities, including affiliated funds (if applicable), owned 1,057 Class R6 shares of the Fund. At reporting period end, seven shareholders of record, each holding greater than 5% of the Fund, held 64% of the Fund’s outstanding shares.
Transactions in shares of beneficial interest were as follows:
| | | | | | | | |
Class A | | Shares | | | Amount | |
Year ended April 30, 2019: | | | | | | | | |
Shares sold | | | 6,372,328 | | | $ | 64,481,202 | |
Shares issued in reinvestment of dividends and distributions | | | 1,143,933 | | | | 11,577,187 | |
Shares reacquired | | | (7,357,744 | ) | | | (74,369,930 | ) |
| | | | | | | | |
Net increase (decrease) in shares outstanding before conversion | | | 158,517 | | | | 1,688,459 | |
Shares issued upon conversion from other share class(es) | | | 1,975,248 | | | | 20,068,401 | |
Shares reacquired upon conversion into other share class(es) | | | (939,892 | ) | | | (9,525,940 | ) |
| | | | | | | | |
Net increase (decrease) in shares outstanding | | | 1,193,873 | | | $ | 12,230,920 | |
| | | | | | | | |
Year ended April 30, 2018: | | | | | | | | |
Shares sold | | | 3,583,222 | | | $ | 36,692,916 | |
Shares issued in reinvestment of dividends and distributions | | | 1,161,138 | | | | 11,871,580 | |
Shares reacquired | | | (7,011,641 | ) | | | (71,734,373 | ) |
| | | | | | | | |
Net increase (decrease) in shares outstanding before conversion | | | (2,267,281 | ) | | | (23,169,877 | ) |
Shares issued upon conversion from other share class(es) | | | 919,364 | | | | 9,434,737 | |
Shares reacquired upon conversion into other share class(es) | | | (748,666 | ) | | | (7,665,878 | ) |
| | | | | | | | |
Net increase (decrease) in shares outstanding | | | (2,096,583 | ) | | $ | (21,401,018 | ) |
| | | | | | | | |
| | | | |
| PGIM Muni High Income Fund | | | 51 | |
Notes to Financial Statements(continued)
| | | | | | | | |
Class B | | Shares | | | Amount | |
Year ended April 30, 2019: | | | | | | | | |
Shares sold | | | 16,689 | | | $ | 168,443 | |
Shares issued in reinvestment of dividends and distributions | | | 73,041 | | | | 739,322 | |
Shares reacquired | | | (496,030 | ) | | | (5,017,682 | ) |
| | | | | | | | |
Net increase (decrease) in shares outstanding before conversion | | | (406,300 | ) | | | (4,109,917 | ) |
Shares reacquired upon conversion into other share class(es) | | | (924,091 | ) | | | (9,361,292 | ) |
| | | | | | | | |
Net increase (decrease) in shares outstanding | | | (1,330,391 | ) | | $ | (13,471,209 | ) |
| | | | | | | | |
Year ended April 30, 2018: | | | | | | | | |
Shares sold | | | 23,675 | | | $ | 242,323 | |
Shares issued in reinvestment of dividends and distributions | | | 97,556 | | | | 997,910 | |
Shares reacquired | | | (511,038 | ) | | | (5,228,448 | ) |
| | | | | | | | |
Net increase (decrease) in shares outstanding before conversion | | | (389,807 | ) | | | (3,988,215 | ) |
Shares reacquired upon conversion into other share class(es) | | | (777,464 | ) | | | (7,989,578 | ) |
| | | | | | | | |
Net increase (decrease) in shares outstanding | | | (1,167,271 | ) | | $ | (11,977,793 | ) |
| | | | | | | | |
Class C | | | | | | |
Year ended April 30, 2019: | | | | | | | | |
Shares sold | | | 1,473,740 | | | $ | 14,910,803 | |
Shares issued in reinvestment of dividends and distributions | | | 279,493 | | | | 2,828,432 | |
Shares reacquired | | | (2,036,139 | ) | | | (20,528,579 | ) |
| | | | | | | | |
Net increase (decrease) in shares outstanding before conversion | | | (282,906 | ) | | | (2,789,344 | ) |
Shares reacquired upon conversion into other share class(es) | | | (1,279,724 | ) | | | (13,041,888 | ) |
| | | | | | | | |
Net increase (decrease) in shares outstanding | | | (1,562,630 | ) | | $ | (15,831,232 | ) |
| | | | | | | | |
Year ended April 30, 2018: | | | | | | | | |
Shares sold | | | 1,449,015 | | | $ | 14,824,570 | |
Shares issued in reinvestment of dividends and distributions | | | 293,916 | | | | 3,005,022 | |
Shares reacquired | | | (1,885,741 | ) | | | (19,272,628 | ) |
| | | | | | | | |
Net increase (decrease) in shares outstanding before conversion | | | (142,810 | ) | | | (1,443,036 | ) |
Shares reacquired upon conversion into other share class(es) | | | (826,812 | ) | | | (8,452,510 | ) |
| | | | | | | | |
Net increase (decrease) in shares outstanding | | | (969,622 | ) | | $ | (9,895,546 | ) |
| | | | | | | | |
Class Z | | | | | | |
Year ended April 30, 2019: | | | | | | | | |
Shares sold | | | 16,442,249 | | | $ | 165,657,337 | |
Shares issued in reinvestment of dividends and distributions | | | 1,319,262 | | | | 13,332,296 | |
Shares reacquired | | | (16,231,282 | ) | | | (163,114,951 | ) |
| | | | | | | | |
Net increase (decrease) in shares outstanding before conversion | | | 1,530,229 | | | | 15,874,682 | |
Shares issued upon conversion from other share class(es) | | | 1,347,097 | | | | 13,634,360 | |
Shares reacquired upon conversion into other share class(es) | | | (652,255 | ) | | | (6,615,094 | ) |
| | | | | | | | |
Net increase (decrease) in shares outstanding | | | 2,225,071 | | | $ | 22,893,948 | |
| | | | | | | | |
Year ended April 30, 2018: | | | | | | | | |
Shares sold | | | 13,371,276 | | | $ | 136,714,994 | |
Shares issued in reinvestment of dividends and distributions | | | 1,214,921 | | | | 12,396,545 | |
Shares reacquired | | | (12,169,899 | ) | | | (124,131,489 | ) |
| | | | | | | | |
Net increase (decrease) in shares outstanding before conversion | | | 2,416,298 | | | | 24,980,050 | |
Shares issued upon conversion from other share class(es) | | | 1,539,755 | | | | 15,729,060 | |
Shares reacquired upon conversion into other share class(es) | | | (110,461 | ) | | | (1,127,029 | ) |
| | | | | | | | |
Net increase (decrease) in shares outstanding | | | 3,845,592 | | | $ | 39,582,081 | |
| | | | | | | | |
| | | | | | | | |
Class R6 | | Shares | | | Amount | |
Year ended April 30, 2019: | | | | | | | | |
Shares sold | | | 286,836 | | | $ | 2,871,897 | |
Shares issued in reinvestment of dividends and distributions | | | 20,881 | | | | 210,840 | |
Shares reacquired | | | (141,536 | ) | | | (1,421,701 | ) |
| | | | | | | | |
Net increase (decrease) in shares outstanding before conversion | | | 166,181 | | | | 1,661,036 | |
Shares issued upon conversion from other share class(es) | | | 475,956 | | | | 4,841,453 | |
| | | | | | | | |
Net increase (decrease) in shares outstanding | | | 642,137 | | | $ | 6,502,489 | |
| | | | | | | | |
Year ended April 30, 2018: | | | | | | | | |
Shares sold | | | 32,863 | | | $ | 332,643 | |
Shares issued in reinvestment of dividends and distributions | | | 187 | | | | 1,892 | |
Shares reacquired | | | (761 | ) | | | (7,686 | ) |
| | | | | | | | |
Net increase (decrease) in shares outstanding before conversion | | | 32,289 | | | | 326,849 | |
Shares issued upon conversion from other share class(es) | | | 7,044 | | | | 71,198 | |
| | | | | | | | |
Net increase (decrease) in shares outstanding | | | 39,333 | | | $ | 398,047 | |
| | | | | | | | |
7. Borrowings
The Trust, on behalf of the Fund, along with other affiliated registered investment companies (the “Funds”), is a party to a Syndicated Credit Agreement (“SCA”) with a group of banks. The purpose of the SCA is to provide an alternative source of temporary funding for capital share redemptions. The SCA provides for a commitment of $900 million for the period October 4, 2018 through October 3, 2019. The Funds pay an annualized commitment fee of 0.15% of the unused portion of the SCA. The Fund’s portion of the commitment fee for the unused amount, allocated based upon a method approved by the Board, is accrued daily and paid quarterly. Prior to October 4, 2018, the Funds had another SCA that provided a commitment of $900 million and the Funds paid an annualized commitment fee of 0.15% of the unused portion of the SCA. The interest on borrowings under both SCAs is paid monthly and at a per annum interest rate based upon a contractual spread plus the higher of (1) the effective federal funds rate, (2) the 1-month LIBOR rate or (3) zero percent.
Certain affiliated registered investment companies that are parties to the SCA include portfolios that are subject to a predetermined mathematical formula used to manage certain benefit guarantees offered under variable annuity contracts. The formula may result in large scale asset flows into and out of these portfolios. Consequently, these portfolios may be more likely to utilize the SCA for purposes of funding redemptions. It may be possible for those portfolios to fully exhaust the committed amount of the SCA, thereby requiring the Manager to allocate available funding per a Board-approved methodology designed to treat the Funds in the SCA equitably.
The Fund utilized the SCA during the year ended April 30, 2019. The average daily balance for the 3 days that the Fund had loans outstanding during the period was approximately $254,333, borrowed at a weighted average interest rate of 3.35%. The maximum loan outstanding amount during the period was $389,000. At April 30, 2019, the Fund did not have an outstanding loan amount.
| | | | |
| PGIM Muni High Income Fund | | | 53 | |
Notes to Financial Statements(continued)
8. Risks of Investing in the Fund
The Fund’s risks include, but are not limited to, some or all of the risks discussed below:
Bond Obligations Risk:The Fund’s holdings, share price, yield and total return may fluctuate in response to bond market movements. The value of bonds may decline for issuer-related reasons, including management performance, financial leverage and reduced demand for the issuer’s goods and services. Certain types of fixed-income obligations also may be subject to “call and redemption risk,” which is the risk that the issuer may call a bond held by the Fund for redemption before it matures and the Fund may not be able to reinvest at the same level and therefore would earn less income.
Interest Rate Risk:The value of an investment may go down when interest rates rise. A rise in rates tends to have a greater impact on the prices of longer term or duration securities. When interest rates fall, the issuers of debt obligations may prepay principal more quickly than expected, and the Fund may be required to reinvest the proceeds at a lower interest rate. This is referred to as “prepayment risk.” When interest rates rise, debt obligations may be repaid more slowly than expected, and the value of the Fund’s holdings may fall sharply. This is referred to as “extension risk. The Fund may face a heightened level of interest rate risk as a result of the U.S. Federal Reserve Board’s policies. The Fund’s investments may lose value if short-term or long-term interest rates rise sharply or in a manner not anticipated by the subadviser.
Liquidity Risk:The Fund may invest in instruments that trade in lower volumes and are less liquid than other investments. Liquidity risk exists when particular investments made by the Fund are difficult to purchase or sell. Liquidity risk includes the risk that the Fund may make investments that may become less liquid in response to market developments or adverse investor perceptions. Investments that are illiquid or that trade in lower volumes may be more difficult to value. If the Fund is forced to sell these investments to pay redemption proceeds or for other reasons, the Fund may lose money. In addition, when there is no willing buyer and investments may not reasonably be expected to be sold or disposed of in current market conditions in seven calendar days or less without the sale or disposition significantly changing the market value of the investment, the Fund may incur higher transaction costs when executing trade orders of a given size. The reduction in dealer market-making capacity in the fixed-income markets that has occurred in recent years also has the potential to reduce liquidity. An inability to sell a portfolio position can adversely affect the Fund’s value or prevent the Fund from being able to take advantage of other investment opportunities.
Market and Credit Risk:Securities markets may be volatile and the market prices of the Fund’s securities may decline. Securities fluctuate in price based on changes in an issuer’s financial condition and overall market and economic conditions. If the market prices of the
securities owned by the Fund fall, the value of an investment in the Fund will decline. Additionally, the Fund may also be exposed to credit risk in the event that an issuer or guarantor fails to perform or that an institution or entity with which the Fund has unsettled or open transactions defaults.
Municipal Bonds Risk:Municipal bonds are subject to credit risk, market risk and interest rate risk. The Fund’s holdings, share price, yield and total return may also fluctuate in response to municipal bond market movements. Municipal bonds are also subject to the risk that potential future legislative changes could affect the market for and value of municipal bonds, which may adversely affect the Fund’s yield or the value of the Fund’s investments in municipal bonds.
9. Recent Accounting Pronouncements and Reporting Updates
In August 2018, the Securities and Exchange Commission (the “SEC”) adopted amendments to Regulation S-X to update and simplify the disclosure requirements for registered investment companies by eliminating requirements that are redundant or duplicative of US GAAP requirements or other SEC disclosure requirements. The new amendments require the presentation of the total, rather than the components, of distributable earnings on the Statement of Assets and Liabilities and the total, rather than the components, of dividends from net investment income and distributions from net realized gains on the Statements of Changes in Net Assets. The amendments also removed the requirement for the parenthetical disclosure of undistributed net investment income on the Statements of Changes in Net Assets and certain tax adjustments that were reflected in the Notes to Financial Statements. The Manager has adopted the amendments and reflected them in the Fund’s financial statements.
In August 2018, the FASB issued Accounting Standards Update (“ASU”) No. 2018-13, which changes certain fair value measurement disclosure requirements. The new ASU, in addition to other modifications and additions, removes the requirement to disclose the amount and reasons for transfers between Level 1 and Level 2 of the fair value hierarchy, and the Fund’s policy for the timing of transfers between levels. The amendments are effective for financial statements issued for fiscal years beginning after December 15, 2019, and interim periods within those fiscal years. The Manager has evaluated the implications of certain provisions of the ASU and has determined to early adopt aspects related to the removal and modification of certain fair value measurement disclosures under the ASU effective immediately. At this time, the Manager is evaluating the implications of certain other provisions of the ASU related to new disclosure requirements and any impact on the financial statement disclosures has not yet been determined.
| | | | |
| PGIM Muni High Income Fund | | | 55 | |
Financial Highlights
| | | | | | | | | | | | | | | | | | | | |
| Class A Shares | | | | | | | | | | | | | | | |
| | | Year Ended April 30, | |
| | | 2019 | | | 2018 | | | 2017 | | | 2016 | | | 2015 | |
| Per Share Operating Performance(a): | | | | | | | | | | | | | | | | | | | | |
| Net Asset Value, Beginning of Year | | | $10.12 | | | | $10.12 | | | | $10.45 | | | | $10.26 | | | | $9.91 | |
| Income (loss) from investment operations: | | | | | | | | | | | | | | | | | | | | |
| Net investment income (loss) | | | 0.39 | | | | 0.39 | | | | 0.41 | | | | 0.44 | | | | 0.44 | |
| Net realized and unrealized gain (loss) on investment transactions | | | 0.17 | | | | 0.01 | | | | (0.33 | ) | | | 0.18 | | | | 0.36 | |
| Total from investment operations | | | 0.56 | | | | 0.40 | | | | 0.08 | | | | 0.62 | | | | 0.80 | |
| Less Dividends and Distributions: | | | | | | | | | | | | | | | | | | | | |
| Dividends from net investment income | | | (0.40 | ) | | | (0.40 | ) | | | (0.41 | ) | | | (0.43 | ) | | | (0.45 | ) |
| Net asset value, end of year | | | $10.28 | | | | $10.12 | | | | $10.12 | | | | $10.45 | | | | $10.26 | |
| Total Return(b): | | | 5.67% | | | | 3.99% | | | | 0.73% | | | | 6.19% | | | | 8.19% | |
| |
| Ratios/Supplemental Data: | |
| Net assets, end of year (000) | | | $339,940 | | | | $322,606 | | | | $343,939 | | | | $402,933 | | | | $375,176 | |
| Average net assets (000) | | | $323,381 | | | | $337,410 | | | | $387,190 | | | | $379,356 | | | | $376,328 | |
| Ratios to average net assets(c)(d): | | | | | | | | | | | | | | | | | | | | |
| Expenses after waivers and/or expense reimbursement | | | 0.85% | | | | 0.86% | | | | 0.87% | | | | 0.87% | | | | 0.87% | |
| Expenses before waivers and/or expense reimbursement | | | 0.85% | | | | 0.86% | | | | 0.87% | | | | 0.87% | | | | 0.91% | |
| Net investment income (loss) | | | 3.88% | | | | 3.86% | | | | 3.99% | | | | 4.30% | | | | 4.36% | |
| Portfolio turnover rate(e)(f) | | | 54% | | | | 36% | | | | 39% | | | | 9% | | | | 17% | |
| (a) | Calculated based on average shares outstanding during the year. |
| (b) | Total return does not consider the effects of sales loads. Total return is calculated assuming a purchase of a share on the first day and a sale on the last day of each year reported and includes reinvestment of dividends and distributions, if any. Total returns may reflect adjustments to conform to generally accepted accounting principles. |
| (c) | Effective March 9, 2015, the contractual distribution and service (12b-1) fees were reduced from 0.30% to 0.25% of the average daily net assets and the 0.05% contractual 12b-1 fee waiver was terminated. |
| (d) | Effective January 1, 2018, class specific expenses include transfer agent fees and expenses and registration fees, which are charged to their respective share class. |
| (e) | The Fund’s portfolio turnover rate is calculated in accordance with regulatory requirements, without regard to transactions involving short term investments and certain derivatives. If such transactions were included, the Fund’s portfolio turnover rate may be higher. |
| (f) | The portfolio turnover rate includes variable rate demand notes. |
See Notes to Financial Statements.
| | | | | | | | | | | | | | | | | | | | |
| Class B Shares | | | | | | | | | | | | | | | |
| | | Year Ended April 30, | |
| | | 2019 | | | 2018 | | | 2017 | | | 2016 | | | 2015 | |
| Per Share Operating Performance(a): | | | | | | | | | | | | | | | | | | | | |
| Net Asset Value, Beginning of Year | | | $10.12 | | | | $10.13 | | | | $10.46 | | | | $10.27 | | | | $9.92 | |
| Income (loss) from investment operations: | | | | | | | | | | | | | | | | | | | | |
| Net investment income (loss) | | | 0.37 | | | | 0.37 | | | | 0.39 | | | | 0.42 | | | | 0.42 | |
| Net realized and unrealized gain (loss) on investment transactions | | | 0.16 | | | | (0.01 | ) | | | (0.34 | ) | | | 0.17 | | | | 0.36 | |
| Total from investment operations | | | 0.53 | | | | 0.36 | | | | 0.05 | | | | 0.59 | | | | 0.78 | |
| Less Dividends and Distributions: | | | | | | | | | | | | | | | | | | | | |
| Dividends from net investment income | | | (0.37 | ) | | | (0.37 | ) | | | (0.38 | ) | | | (0.40 | ) | | | (0.43 | ) |
| Net asset value, end of year | | | $10.28 | | | | $10.12 | | | | $10.13 | | | | $10.46 | | | | $10.27 | |
| Total Return(b): | | | 5.31% | | | | 3.60% | | | | 0.50% | | | | 5.93% | | | | 7.92% | |
| |
| Ratios/Supplemental Data: | |
| Net assets, end of year (000) | | | $17,068 | | | | $30,272 | | | | $42,104 | | | | $57,613 | | | | $62,944 | |
| Average net assets (000) | | | $24,102 | | | | $36,097 | | | | $50,808 | | | | $59,446 | | | | $66,035 | |
| Ratios to average net assets(c): | | | | | | | | | | | | | | | | | | | | |
| Expenses after waivers and/or expense reimbursement | | | 1.19% | | | | 1.14% | | | | 1.12% | | | | 1.12% | | | | 1.12% | |
| Expenses before waivers and/or expense reimbursement | | | 1.19% | | | | 1.14% | | | | 1.12% | | | | 1.12% | | | | 1.12% | |
| Net investment income (loss) | | | 3.61% | | | | 3.58% | | | | 3.73% | | | | 4.06% | | | | 4.11% | |
| Portfolio turnover rate(d)(e) | | | 54% | | | | 36% | | | | 39% | | | | 9% | | | | 17% | |
| (a) | Calculated based on average shares outstanding during the year. |
| (b) | Total return does not consider the effects of sales loads. Total return is calculated assuming a purchase of a share on the first day and a sale on the last day of each year reported and includes reinvestment of dividends and distributions, if any. Total returns may reflect adjustments to conform to generally accepted accounting principles. |
| (c) | Effective January 1, 2018, class specific expenses include transfer agent fees and expenses and registration fees, which are charged to their respective share class. |
| (d) | The Fund’s portfolio turnover rate is calculated in accordance with regulatory requirements, without regard to transactions involving short term investments and certain derivatives. If such transactions were included, the Fund’s portfolio turnover rate may be higher. |
| (e) | The portfolio turnover rate includes variable rate demand notes. |
See Notes to Financial Statements.
| | | | |
| PGIM Muni High Income Fund | | | 57 | |
Financial Highlights(continued)
| | | | | | | | | | | | | | | | | | | | |
| Class C Shares | | | | | | | | | | | | | | | |
| | | Year Ended April 30, | |
| | | 2019 | | | 2018 | | | 2017 | | | 2016 | | | 2015 | |
| Per Share Operating Performance(a): | | | | | | | | | | | | | | | | | | | | |
| Net Asset Value, Beginning of Year | | | $10.12 | | | | $10.12 | | | | $10.45 | | | | $10.27 | | | | $9.92 | |
| Income (loss) from investment operations: | | | | | | | | | | | | | | | | | | | | |
| Net investment income (loss) | | | 0.31 | | | | 0.32 | | | | 0.33 | | | | 0.36 | | | | 0.37 | |
| Net realized and unrealized gain (loss) on investment transactions | | | 0.17 | | | | - | (b) | | | (0.33 | ) | | | 0.17 | | | | 0.35 | |
| Total from investment operations | | | 0.48 | | | | 0.32 | | | | 0.00 | | | | 0.53 | | | | 0.72 | |
| Less Dividends and Distributions: | | | | | | | | | | | | | | | | | | | | |
| Dividends from net investment income | | | (0.32 | ) | | | (0.32 | ) | | | (0.33 | ) | | | (0.35 | ) | | | (0.37 | ) |
| Net asset value, end of year | | | $10.28 | | | | $10.12 | | | | $10.12 | | | | $10.45 | | | | $10.27 | |
| Total Return(c): | | | 4.88% | | | | 3.21% | | | | 0.01% | | | | 5.31% | | | | 7.39% | |
| |
| Ratios/Supplemental Data: | |
| Net assets, end of year (000) | | | $95,749 | | | | $110,077 | | | | $119,937 | | | | $125,439 | | | | $105,708 | |
| Average net assets (000) | | | $104,786 | | | | $114,788 | | | | $127,425 | | | | $111,295 | | | | $97,740 | |
| Ratios to average net assets(d): | | | | | | | | | | | | | | | | | | | | |
| Expenses after waivers and/or expense reimbursement | | | 1.60% | | | | 1.62% | | | | 1.62% | | | | 1.62% | | | | 1.62% | |
| Expenses before waivers and/or expense reimbursement | | | 1.60% | | | | 1.62% | | | | 1.62% | | | | 1.62% | | | | 1.62% | |
| Net investment income (loss) | | | 3.10% | | | | 3.11% | | | | 3.24% | | | | 3.55% | | | | 3.61% | |
| Portfolio turnover rate(e)(f) | | | 54% | | | | 36% | | | | 39% | | | | 9% | | | | 17% | |
| (a) | Calculated based on average shares outstanding during the year. |
| (b) | Less than $0.005 per share. |
| (c) | Total return does not consider the effects of sales loads. Total return is calculated assuming a purchase of a share on the first day and a sale on the last day of each year reported and includes reinvestment of dividends and distributions, if any. Total returns may reflect adjustments to conform to generally accepted accounting principles. |
| (d) | Effective January 1, 2018, class specific expenses include transfer agent fees and expenses and registration fees, which are charged to their respective share class. |
| (e) | The Fund’s portfolio turnover rate is calculated in accordance with regulatory requirements, without regard to transactions involving short term investments and certain derivatives. If such transactions were included, the Fund’s portfolio turnover rate may be higher. |
| (f) | The portfolio turnover rate includes variable rate demand notes. |
See Notes to Financial Statements.
| | | | | | | | | | | | | | | | | | | | |
| Class Z Shares | | | | | | | | | | | | | | | |
| | | Year Ended April 30, | |
| | | 2019 | | | 2018 | | | 2017 | | | 2016 | | | 2015 | |
| Per Share Operating Performance(a): | | | | | | | | | | | | | | | | | | | | |
| Net Asset Value, Beginning of Year | | | $10.10 | | | | $10.11 | | | | $10.44 | | | | $10.25 | | | | $9.90 | |
| Income (loss) from investment operations: | | | | | | | | | | | | | | | | | | | | |
| Net investment income (loss) | | | 0.41 | | | | 0.42 | | | | 0.44 | | | | 0.46 | | | | 0.47 | |
| Net realized and unrealized gain (loss) on investment transactions | | | 0.17 | | | | - | (b) | | | (0.33 | ) | | | 0.18 | | | | 0.36 | |
| Total from investment operations | | | 0.58 | | | | 0.42 | | | | 0.11 | | | | 0.64 | | | | 0.83 | |
| Less Dividends and Distributions: | | | | | | | | | | | | | | | | | | | | |
| Dividends from net investment income | | | (0.42 | ) | | | (0.43 | ) | | | (0.44 | ) | | | (0.45 | ) | | | (0.48 | ) |
| Net asset value, end of year | | | $10.26 | | | | $10.10 | | | | $10.11 | | | | $10.44 | | | | $10.25 | |
| Total Return(c): | | | 5.90% | | | | 4.15% | | | | 1.02% | | | | 6.48% | | | | 8.48% | |
| |
| Ratios/Supplemental Data: | |
| Net assets, end of year (000) | | | $404,188 | | | | $375,466 | | | | $336,781 | | | | $274,404 | | | | $180,050 | |
| Average net assets (000) | | | $385,217 | | | | $370,141 | | | | $307,480 | | | | $208,377 | | | | $152,856 | |
| Ratios to average net assets(d): | | | | | | | | | | | | | | | | | | | | |
| Expenses after waivers and/or expense reimbursement | | | 0.63% | | | | 0.62% | | | | 0.62% | | | | 0.62% | | | | 0.62% | |
| Expenses before waivers and/or expense reimbursement | | | 0.63% | | | | 0.62% | | | | 0.62% | | | | 0.62% | | | | 0.62% | |
| Net investment income (loss) | | | 4.08% | | | | 4.11% | | | | 4.24% | | | | 4.54% | | | | 4.61% | |
| Portfolio turnover rate(e)(f) | | | 54% | | | | 36% | | | | 39% | | | | 9% | | | | 17% | |
| (a) | Calculated based on average shares outstanding during the year. |
| (b) | Less than $0.005 per share. |
| (c) | Total return is calculated assuming a purchase of a share on the first day and a sale on the last day of each year reported and includes reinvestment of dividends and distributions, if any. Total returns may reflect adjustments to conform to generally accepted accounting principles. |
| (d) | Effective January 1, 2018, class specific expenses include transfer agent fees and expenses and registration fees, which are charged to their respective share class. |
| (e) | The Fund’s portfolio turnover rate is calculated in accordance with regulatory requirements, without regard to transactions involving short term investments and certain derivatives. If such transactions were included, the Fund’s portfolio turnover rate may be higher. |
| (f) | The portfolio turnover rate includes variable rate demand notes. |
See Notes to Financial Statements.
| | | | |
| PGIM Muni High Income Fund | | | 59 | |
Financial Highlights(continued)
| | | | | | | | | | | | |
| Class R6 Shares | | | | | | | | | |
| | | Year
Ended
April 30, | | | | | | June 27,
2017(a)
through
April 30, | |
| | | 2019 | | | | | | 2018 | |
| Per Share Operating Performance(b): | | | | | | | | | | | | |
| Net Asset Value, Beginning of Period | | | $10.11 | | | | | | | | $10.23 | |
| Income (loss) from investment operations: | | | | | | | | | | | | |
| Net investment income (loss) | | | 0.42 | | | | | | | | 0.36 | |
| Net realized and unrealized gain (loss) on investment transactions | | | 0.17 | | | | | | | | (0.11 | ) |
| Total from investment operations | | | 0.59 | | | | | | | | 0.25 | |
| Less Dividends and Distributions: | | | | | | | | | | | | |
| Dividends from net investment income | | | (0.43 | ) | | | | | | | (0.37 | ) |
| Net asset value, end of period | | | $10.27 | | | | | | | | $10.11 | |
| Total Return(c): | | | 5.94% | | | | | | | | 2.50% | |
| |
| Ratios/Supplemental Data: | |
| Net assets, end of period (000) | | | $6,998 | | | | | | | | $398 | |
| Average net assets (000) | | | $4,932 | | | | | | | | $53 | |
| Ratios to average net assets(d): | | | | | | | | | | | | |
| Expenses after waivers and/or expense reimbursement | | | 0.60% | | | | | | | | 0.59% | (e) |
| Expenses before waivers and/or expense reimbursement | | | 0.89% | | | | | | | | 25.88% | (e) |
| Net investment income (loss) | | | 4.19% | | | | | | | | 4.31% | (e) |
| Portfolio turnover rate(f)(g) | | | 54% | | | | | | | | 36% | |
| (a) | Commencement of offering. |
| (b) | Calculated based on average shares outstanding during the period. |
| (c) | Total return is calculated assuming a purchase of a share on the first day and a sale on the last day of each period reported and includes reinvestment of dividends and distributions, if any. Total returns may reflect adjustments to conform to generally accepted accounting principles. Total returns for periods less than one full year are not annualized. |
| (d) | Effective January 1, 2018, class specific expenses include transfer agent fees and expenses and registration fees, which are charged to their respective share class. |
| (f) | The Fund’s portfolio turnover rate is calculated in accordance with regulatory requirements, without regard to transactions involving short term investments and certain derivatives. If such transactions were included, the Fund’s portfolio turnover rate may be higher. |
| (g) | The portfolio turnover rate includes variable rate demand notes. |
See Notes to Financial Statements.
Report of Independent Registered Public Accounting Firm
To the Shareholders of PGIM Muni High Income Fund
and the Board of Trustees of Prudential Investment Portfolios 4:
Opinion on the Financial Statements
We have audited the accompanying statement of assets and liabilities of PGIM Muni High Income Fund (the Fund), a series of Prudential Investment Portfolios 4, including the schedule of investments, as of April 30, 2019, the related statement of operations for the year then ended, the statements of changes in net assets for each of the years in thetwo-year period then ended, and the related notes (collectively, the financial statements) and the financial highlights for each of the years or periods indicated therein. In our opinion, the financial statements and financial highlights present fairly, in all material respects, the financial position of the Fund as of April 30, 2019, the results of its operations for the year then ended, changes in its net assets for each of the years in thetwo-year period then ended, and the financial highlights for each of the years or periods indicated therein, in conformity with U.S. generally accepted accounting principles.
Basis for Opinion
These financial statements and financial highlights are the responsibility of the Fund’s management. Our responsibility is to express an opinion on these financial statements and financial highlights based on our audits. We are a public accounting firm registered with the Public Company Accounting Oversight Board (United States) (PCAOB) and are required to be independent with respect to the Fund in accordance with the U.S. federal securities laws and the applicable rules and regulations of the Securities and Exchange Commission and the PCAOB.
We conducted our audits in accordance with the standards of the PCAOB. Those standards require that we plan and perform the audit to obtain reasonable assurance about whether the financial statements and financial highlights are free of material misstatement, whether due to error or fraud. Our audits included performing procedures to assess the risks of material misstatement of the financial statements and financial highlights, whether due to error or fraud, and performing procedures that respond to those risks. Such procedures included examining, on a test basis, evidence regarding the amounts and disclosures in the financial statements and financial highlights. Such procedures also included confirmation of securities owned as of April 30, 2019, by correspondence with the custodian and brokers. Our audits also included evaluating the accounting principles used and significant estimates made by management, as well as evaluating the overall presentation of the financial statements and financial highlights. We believe that our audits provide a reasonable basis for our opinion.

We have served as the auditor of one or more PGIM and/or Prudential Retail investment companies since 2003.
New York, New York
June 17, 2019
| | | | |
| PGIM Muni High Income Fund | | | 61 | |
Income Tax Information(unaudited)
We are advising you that during the fiscal year ended April 30, 2019, the Fund designates the maximum amount allowable per share but not less than the following amounts as exempt-interest dividends in accordance with Section 852(b)(5) of the Internal Revenue Code.
| | | | | | | | | | | | | | | | | | | | |
| | | Per Share | |
| | | Class A | | | Class B | | | Class C | | | Class Z | | | Class R6 | |
| | | | | |
Tax-Exempt Dividends | | $ | 0.39 | | | $ | 0.35 | | | $ | 0.31 | | | $ | 0.41 | | | $ | 0.41 | |
| | | | | | | | | | | | | | | | | | | | |
In January 2020, you will be advised on IRS Form 1099-DIV and/or 1099-INT, if applicable, or substitute forms as to the federal tax status of the dividends received in calendar year 2019.
For more detailed information regarding your state and local taxes, you should contact your tax adviser or the state/local taxing authorities.
INFORMATION ABOUT BOARD MEMBERS AND OFFICERS(unaudited)
Information about Board Members and Officers of the Fund is set forth below. Board Members who are not deemed to be “interested persons” of the Fund, as defined in the 1940 Act, are referred to as “Independent Board Members.” Board Members who are deemed to be “interested persons” of the Fund are referred to as “Interested Board Members.” The Board Members are responsible for the overall supervision of the operations of the Fund and perform the various duties imposed on the directors of investment companies by the 1940 Act. The Board in turn elects the Officers, who are responsible for administering theday-to-day operations of the Fund.
| | | | | | |
| Independent Board Members | | | | |
| | | | |
Name Date of Birth Position(s) Portfolios Overseen | | Principal Occupation(s) During Past Five Years | | Other Directorships Held During Past Five Years | | Length of
Board Service |
| | | | |
Ellen S. Alberding 3/11/58 Board Member Portfolios Overseen: 96 | | President and Board Member, The Joyce Foundation (charitable foundation) (since 2002); Vice Chair, City Colleges of Chicago (community college system) (2011-2015); Trustee, National Park Foundation (charitable foundation for national park system) (2009-2018); Trustee, Economic Club of Chicago (since 2009); Trustee, Loyola University (since 2018). | | None. | | Since September 2013 |
| | | | |
Kevin J. Bannon 7/13/52 Board Member Portfolios Overseen: 96 | | Retired; Managing Director (April2008-May 2015) and Chief Investment Officer (October 2008-November 2013) of Highmount Capital LLC (registered investment adviser); formerly Executive Vice President and Chief Investment Officer (April 1993-August 2007) of Bank of New York Company; President (May2003-May 2007) of BNY Hamilton Family of Mutual Funds. | | Director of Urstadt Biddle Properties (equity real estate investment trust) (since September 2008). | | Since July 2008 |
PGIM Muni High Income Fund
| | | | | | |
| Independent Board Members | | | | | | |
| | | | |
Name Date of Birth Position(s) Portfolios Overseen | | Principal Occupation(s) During Past Five Years | | Other Directorships Held During Past Five Years | | Length of
Board Service |
| | | | |
Linda W. Bynoe 7/9/52 Board Member Portfolios Overseen: 96 | | President and Chief Executive Officer (since March 1995) and formerly Chief Operating Officer (December 1989-February 1995) of Telemat Ltd. (management consulting); formerly Vice President (January 1985-June 1989) at Morgan Stanley & Co. (broker-dealer). | | Director of Anixter International, Inc. (communication products distributor) (since January 2006); Director of Northern Trust Corporation (financial services) (since April 2006); Trustee of Equity Residential (residential real estate) (since December 2009). | | Since March 2005 |
| | | | |
Barry H. Evans 11/2/60 Board Member Portfolios Overseen: 95 | | Retired; formerly President (2005 – 2016), Global Chief Operating Officer (2014 – 2016), Chief Investment Officer – Global Head of Fixed Income (1998-2014), and various portfolio manager roles (1986-2006), Manulife Asset Management U.S. | | Formerly Director, Manulife Trust Company (2011-2018); formerly Director, Manulife Asset Management Limited (2015-2017); formerly Chairman of the Board of Directors of Manulife Asset Management U.S. (2005-2016); formerly Chairman of the Board, Declaration Investment Management and Research (2008-2016). | | Since September 2017 |
| | | | |
Keith F. Hartstein 10/13/56 Board Member & Independent Chair Portfolios Overseen: 96 | | Retired; Member (since November 2014) of the Governing Council of the Independent Directors Council (organization of independent mutual fund directors); formerly President and Chief Executive Officer (2005-2012), Senior Vice President (2004-2005), Senior Vice President of Sales and Marketing (1997-2004), and various executive management positions (1990-1997), John Hancock Funds, LLC (asset management); Chairman, Investment Company Institute’s Sales Force Marketing Committee (2003-2008). | | None. | | Since September 2013 |
Visit our website at pgiminvestments.com
| | | | | | |
| Independent Board Members | | | | | | |
| | | | |
Name Date of Birth Position(s) Portfolios Overseen | | Principal Occupation(s) During Past Five Years | | Other Directorships Held During Past Five Years | | Length of
Board Service |
| | | | |
Laurie Simon Hodrick 9/29/62 Board Member Portfolios Overseen: 95 | | A. Barton Hepburn Professor Emerita of Economics in the Faculty of Business, Columbia Business School (since 2018); Visiting Professor of Law, Stanford Law School (since 2015); Visiting Fellow at the Hoover Institution, Stanford University (since 2015); Sole Member, ReidCourt LLC (since 2008) (a consulting firm); formerly A. Barton Hepburn Professor of Economics in the Faculty of Business, Columbia Business School (1996-2017); formerly Managing Director, Global Head of Alternative Investment Strategies, Deutsche Bank (2006-2008). | | Independent Director, Synnex Corporation (since April 2019) (information technology); Independent Director, Kabbage, Inc. (since July 2018) (financial services); Independent Director, Corporate Capital Trust (2017-2018) (a business development company). | | Since September 2017 |
| | | | |
Michael S. Hyland, CFA 10/4/45 Board Member Portfolios Overseen: 96 | | Retired (since February 2005); formerly Senior Managing Director (July 2001-February 2005) of Bear Stearns & Co, Inc.; Global Partner, INVESCO (1999-2001); Managing Director and President of Salomon Brothers Asset Management (1989-1999). | | None. | | Since July 2008 |
| | | | |
Brian K. Reid 9/22/61 Board Member Portfolios Overseen: 95 | | Retired; formerly Chief Economist for the Investment Company Institute (ICI) (2005-2017); formerly Senior Economist and Director of Industry and Financial Analysis at the ICI (1998-2004); formerly Senior Economist, Industry and Financial Analysis at the ICI (1996-1998); formerly Staff Economist at the Federal Reserve Board (1989-1996); Director, ICI Mutual Insurance Company (2012-2017). | | None. | | Since March 2018 |
PGIM Muni High Income Fund
| | | | | | |
| Interested Board Members | | | | | | |
| | | | |
Name Date of Birth Position(s) Portfolios Overseen | | Principal Occupation(s) During Past Five Years | | Other Directorships Held During Past Five Years | | Length of
Board Service |
| | | | |
Stuart S. Parker 10/5/62 Board Member & President Portfolios Overseen: 96 | | President of PGIM Investments LLC (formerly known as Prudential Investments LLC) (since January 2012); Executive Vice President of Prudential Investment Management Services LLC (since December 2012); formerly Executive Vice President of Jennison Associates LLC and Head of Retail Distribution of PGIM Investments LLC (June 2005-December 2011). | | None. | | Since January 2012 |
| | | | |
Scott E. Benjamin 5/21/73 Board Member & Vice President Portfolios Overseen:96 | | Executive Vice President (since June 2009) of PGIM Investments LLC; Executive Vice President (June 2009-June 2012) and Vice President (since June 2012) of Prudential Investment Management Services LLC; Executive Vice President (since September 2009) of AST Investment Services, Inc.; Senior Vice President of Product Development and Marketing, PGIM Investments (since February 2006); formerly Vice President of Product Development and Product Management, PGIM Investments LLC (2003-2006). | | None. | | Since March 2010 |
Visit our website at pgiminvestments.com
| | | | | | |
| Interested Board Members | | | | | | |
| | | | |
Name Date of Birth Position(s) Portfolios Overseen | | Principal Occupation(s) During Past Five Years | | Other Directorships Held During Past Five Years | | Length of
Board Service |
| | | | |
Grace C. Torres* 6/28/59 Board Member Portfolios Overseen: 95 | | Retired; formerly Treasurer and Principal Financial and Accounting Officer of the PGIM Funds, Target Funds, Advanced Series Trust, Prudential Variable Contract Accounts and The Prudential Series Fund (1998-June 2014); Assistant Treasurer (March 1999-June 2014) and Senior Vice President (September 1999-June 2014) of PGIM Investments LLC; Assistant Treasurer (May 2003-June 2014) and Vice President (June 2005-June 2014) of AST Investment Services, Inc.; Senior Vice President and Assistant Treasurer (May 2003-June 2014) of Prudential Annuities Advisory Services, Inc. | | Formerly Director (July 2015-January 2018) of Sun Bancorp, Inc. N.A. and Sun National Bank; Director (since January 2018) of OceanFirst Financial Corp. and OceanFirst Bank. | | Since November 2014 |
* Note: Prior to her retirement in 2014, Ms. Torres was employed by PGIM Investments LLC. Due to her prior employment, she is considered to be an “interested person” under the 1940 Act. Ms. Torres is aNon-Management Interested Board Member.
| | | | |
| Fund Officers(a) | | | | |
| | | |
Name Date of Birth Fund Position | | Principal Occupation(s) During Past Five Years | | Length of Service as Fund Officer |
| | | |
Raymond A. O’Hara 9/11/55 Chief Legal Officer | | Vice President and Corporate Counsel (since July 2010) of Prudential Insurance Company of America (Prudential); Vice President (March 2011-Present) of Pruco Life Insurance Company and Pruco Life Insurance Company of New Jersey; Vice President and Corporate Counsel (March 2011-Present) of Prudential Annuities Life Assurance Corporation; Chief Legal Officer of PGIM Investments LLC (since June 2012); Chief Legal Officer of Prudential Mutual Fund Services LLC (since June 2012) and Corporate Counsel of AST Investment Services, Inc. (since June 2012); formerly Assistant Vice President and Corporate Counsel (September 2008-July 2010) of The Hartford Financial Services Group, Inc.; formerly Associate (September 1980-December 1987) and Partner (January 1988–August 2008) of Blazzard & Hasenauer, P.C. (formerly, Blazzard, Grodd & Hasenauer, P.C.). | | Since June 2012 |
PGIM Muni High Income Fund
| | | | |
| Fund Officers(a) | | | | |
| | | |
Name Date of Birth Fund Position | | Principal Occupation(s) During Past Five Years | | Length of Service as Fund
Officer |
| | | |
Chad A. Earnst 8/14/75 Chief Compliance Officer | | Chief Compliance Officer (September 2014-Present) of PGIM Investments LLC; Chief Compliance Officer (September 2014-Present) of the PGIM Funds, Target Funds, Advanced Series Trust, The Prudential Series Fund, Prudential’s Gibraltar Fund, Inc., PGIM Global High Yield Fund, Inc., PGIM High Yield Bond Fund, Inc. and PGIM Jennison MLP Income Fund, Inc.; Global Head of Compliance for PGIM, Inc. (July 2018-Present); formerly Assistant Director (March 2010-August 2014) of the Asset Management Unit, Division of Enforcement, US Securities & Exchange Commission; Assistant Regional Director (January 2010-August 2014), Branch Chief (June 2006–December 2009) and Senior Counsel (April2003-May 2006) of the Miami Regional Office, Division of Enforcement, US Securities & Exchange Commission. | | Since September 2014 |
| | | |
Dino Capasso 8/19/74 Deputy Chief Compliance Officer | | Vice President and Deputy Chief Compliance Officer (June 2017-Present) of PGIM Investments LLC; formerly, Senior Vice President and Senior Counsel (January 2016-June 2017), and Vice President and Counsel (February 2012-December 2015) of Pacific Investment Management Company LLC. | | Since March 2018 |
| | | |
Andrew R. French 12/22/62 Secretary | | Vice President of PGIM Investments LLC (December 2018-Present); formerly Vice President and Corporate Counsel (February 2010-December 2018) of Prudential; formerly Director and Corporate Counsel (2006-2010) of Prudential; Vice President and Assistant Secretary (since January 2007) of PGIM Investments LLC; Vice President and Assistant Secretary (since January 2007) of Prudential Mutual Fund Services LLC. | | Since October 2006 |
| | | |
Jonathan D. Shain 8/9/58 Assistant Secretary | | Vice President and Corporate Counsel (since August 1998) of Prudential; Vice President and Assistant Secretary (since May 2001) of PGIM Investments LLC; Vice President and Assistant Secretary (since February 2001) of Prudential Mutual Fund Services LLC; formerly Vice President and Assistant Secretary (May 2003-June 2005) of AST Investment Services, Inc. | | Since May 2005 |
| | | |
Claudia DiGiacomo 10/14/74 Assistant Secretary | | Vice President and Corporate Counsel (since January 2005) of Prudential; Vice President and Assistant Secretary of PGIM Investments LLC (since December 2005); formerly Associate at Sidley Austin Brown & Wood LLP (1999-2004). | | Since December 2005 |
| | | |
Diana N. Huffman 4/14/82 Assistant Secretary | | Vice President and Corporate Counsel (since September 2015) of Prudential; formerly Associate at Willkie Farr & Gallagher LLP (2009-2015). | | Since March 2019 |
Visit our website at pgiminvestments.com
| | | | |
| Fund Officers(a) | | | | |
| | | |
Name Date of Birth Fund Position | | Principal Occupation(s) During Past Five Years | | Length of
Service as Fund
Officer |
| | | |
Christian J. Kelly 5/5/75 Treasurer and Principal Financial and Accounting Officer | | Vice President, Head of Fund Administration of PGIM Investments LLC (since November 2018); formerly, Director of Fund Administration of Lord Abbett & Co. LLC (2009-2018), Treasurer and Principal Accounting Officer of the Lord Abbett Family of Funds (2017-2018); Director of Accounting, Avenue Capital Group (2008-2009); Senior Manager, Investment Management Practice of Deloitte & Touche LLP (1998-2007). | | Since January 2019 |
| | | |
Peter Parrella 8/21/58 Assistant Treasurer | | Vice President (since 2007) and Director (2004-2007) within PGIM Investments Fund Administration; formerly Tax Manager at SSB Citi Fund Management LLC (1997-2004). | | Since June 2007 |
| | | |
Lana Lomuti 6/7/67 Assistant Treasurer | | Vice President (since 2007) and Director (2005-2007), within PGIM Investments Fund Administration; formerly Assistant Treasurer (December 2007-February 2014) of The Greater China Fund, Inc. | | Since April 2014 |
| | | |
Linda McMullin 7/10/61 Assistant Treasurer | | Vice President (since 2011) and Director (2008-2011) within PGIM Investments Fund Administration. | | Since April 2014 |
| | | |
Kelly A. Coyne 9/8/68 Assistant Treasurer | | Director, Investment Operations of Prudential Mutual Fund Services LLC (since 2010). | | Since March 2015 |
| | | |
Charles H. Smith 1/11/73 Anti-Money Laundering Compliance Officer | | Vice President, Corporate Compliance, Anti-Money Laundering Unit (since January 2015) of Prudential; committee member of the American Council of Life Insurers Anti-Money Laundering and Critical Infrastructure Committee (since January 2016); formerly Global Head of Economic Sanctions Compliance at AIG Property Casualty (February 2007-December 2014); Assistant Attorney General at the New York State Attorney General’s Office, Division of Public Advocacy. (August 1998-January 2007). | | Since January 2017 |
| (a) | Excludes Mr. Parker and Mr. Benjamin, interested Board Members who also serve as President and Vice President, respectively. |
Explanatory Notes to Tables:
| ∎ | Board Members are deemed to be “Interested,” as defined in the 1940 Act, by reason of their affiliation with PGIM Investments LLC and/or an affiliate of PGIM Investments LLC. |
| ∎ | Unless otherwise noted, the address of all Board Members and Officers is c/o PGIM Investments LLC, 655 Broad Street, Newark, New Jersey 07102-4410. |
| ∎ | There is no set term of office for Board Members or Officers. The Board Members have adopted a retirement policy, which calls for the retirement of Board Members on December 31 of the year in which they reach the age of 75. |
| ∎ | “Other Directorships Held” includes only directorships of companies required to register or file reports with the SEC under the 1934 Act (that is, “public companies”) or other investment companies registered under the 1940 Act. |
| ∎ | “Portfolios Overseen” includes all investment companies managed by PGIM Investments LLC. The investment companies for which PGIM Investments LLC serves as manager include the PGIM Funds, The Prudential Variable Contract Accounts, PGIM ETF Trust, PGIM High Yield Bond Fund, Inc., PGIM Global High Yield Fund, Inc., The Prudential Series Fund, Prudential’s Gibraltar Fund, Inc. and the Advanced Series Trust. |
PGIM Muni High Income Fund
| | | | |
| | |
| ∎ MAIL | | ∎ TELEPHONE | | ∎ WEBSITE |
655 Broad Street
Newark, NJ 07102 | | (800) 225-1852 | | pgiminvestments.com |
|
| PROXY VOTING |
| The Board of Trustees of the Fund has delegated to the Fund’s subadviser the responsibility for voting any proxies and maintaining proxy recordkeeping with respect to the Fund. A description of these proxy voting policies and procedures is available without charge, upon request, by calling (800) 225-1852. Information regarding how the Fund voted proxies relating to portfolio securities during the most recent 12-month period ended June 30 is available on the Fund’s website and on the Securities and Exchange Commission’s website. |
|
| TRUSTEES |
| Ellen S. Alberding• Kevin J. Bannon• Scott E. Benjamin• Linda W. Bynoe• Barry H. Evans• Keith F. Hartstein• Laurie Simon Hodrick• Michael S. Hyland• Stuart S. Parker• Brian K. Reid• Grace C. Torres |
|
| OFFICERS |
| Stuart S. Parker,President•Scott E. Benjamin,Vice President• Christian J. Kelly,Treasurer and Principal Financialand Accounting Officer• Raymond A. O’Hara,Chief Legal Officer• Chad A. Earnst,Chief Compliance Officer• Dino Capasso,Deputy Chief Compliance Officer• Andrew R. French,Secretary• Jonathan D. Shain,Assistant Secretary• Claudia DiGiacomo,Assistant Secretary• Diana N. Huffman,Assistant Secretary• Peter Parrella,Assistant Treasurer• Lana Lomuti,Assistant Treasurer• Linda McMullin,Assistant Treasurer• Kelly A. Coyne,Assistant Treasurer• Charles H. Smith,Anti-Money Laundering Compliance Officer |
| | | | |
| MANAGER | | PGIM Investments LLC | | 655 Broad Street
Newark, NJ 07102 |
|
| SUBADVISER | | PGIM Fixed Income | | 655 Broad Street
Newark, NJ 07102 |
|
| DISTRIBUTOR | | Prudential Investment
Management Services LLC | | 655 Broad Street
Newark, NJ 07102 |
|
| CUSTODIAN | | The Bank of New York Mellon | | 240 Greenwich Street
New York, NY 10286 |
|
| TRANSFER AGENT | | Prudential Mutual Fund
Services LLC | | PO Box 9658
Providence, RI 02940 |
|
INDEPENDENT REGISTERED
PUBLIC ACCOUNTING FIRM | | KPMG LLP | | 345 Park Avenue
New York, NY 10154 |
|
| FUND COUNSEL | | Willkie Farr & Gallagher LLP | | 787 Seventh Avenue
New York, NY 10019 |
|
|
| An investor should consider the investment objectives, risks, charges, and expenses of the Fund carefully before investing. The prospectus and summary prospectus contain this and other information about the Fund. An investor may obtain the prospectus and summary prospectus by visiting our website atpgiminvestments.com or by calling(800) 225-1852. The prospectus and summary prospectus should be read carefully before investing. |
|
| E-DELIVERY |
| To receive your mutual fund documents online, go topgiminvestments.com/edelivery and enroll. Instead of receiving printed documents by mail, you will receive notification via email when new materials are available. You can cancel your enrollment or change your email address at any time by visiting the website address above. |
|
| SHAREHOLDER COMMUNICATIONS WITH TRUSTEES |
| Shareholders can communicate directly with the Board of Trustees by writing to the Chair of the Board, PGIM Muni High Income Fund, PGIM Investments, Attn: Board of Trustees, 655 Broad Street, Newark, NJ 07102. Shareholders can communicate directly with an individual Trustee by writing to the same address. Communications are not screened before being delivered to the addressee. |
|
| AVAILABILITY OF PORTFOLIO SCHEDULE |
The Fund files its complete schedule of portfolio holdings with the Securities and Exchange Commission for the first and third quarters of each fiscal year on Form N-PORT. The Fund’s Form N-PORT filings are available on the Commission’s website at sec.gov. Form N-PORT is filed with the Commission quarterly, and each Fund’s full portfolio holdings as of the first and third fiscal quarter-ends will be made publicly available 60 days after the end of each quarter. |
|
| The Fund’s Statement of Additional Information contains additional information about the Fund’s Trustees and is available without charge, upon request, by calling (800) 225-1852. |
Mutual Funds:
| | | | |
| ARE NOT INSURED BY THE FDIC OR ANY FEDERAL GOVERNMENT AGENCY | | MAY LOSE VALUE | | ARE NOT A DEPOSIT OF OR GUARANTEED
BY ANY BANK OR ANY BANK AFFILIATE |
PGIM MUNI HIGH INCOME FUND
| | | | | | | | | | |
| SHARE CLASS | | A | | B | | C | | Z | | R6 |
| NASDAQ | | PRHAX | | PMHYX | | PHICX | | PHIZX | | PHIQX |
| CUSIP | | 74440M104 | | 74440M203 | | 74440M302 | | 74440M401 | | 74440M609 |
MF133E
Item 2 – Code of Ethics ––See Exhibit (a)
As of the end of the period covered by this report, the registrant has adopted a code of ethics (the “Section 406 Standards for Investment Companies – Ethical Standards for Principal Executive and Financial Officers”) that applies to the registrant’s Principal Executive Officer and Principal Financial Officer; the registrant’s Principal Financial Officer also serves as the Principal Accounting Officer.
The registrant hereby undertakes to provide any person, without charge, upon request, a copy of the code of ethics. To request a copy of the code of ethics, contact the registrant800-225-1852, and ask for a copy of the Section 406 Standards for Investment Companies - Ethical Standards for Principal Executive and Financial Officers.
Item 3 – Audit Committee Financial Expert –
The registrant’s Board has determined that Mr. Kevin J. Bannon, member of the Board’s Audit Committee is an “audit committee financial expert,” and that he is “independent,” for purposes of this Item.
Item 4 – Principal Accountant Fees and Services –
(a) Audit Fees
For the fiscal years ended April 30, 2019 and April 30, 2018, KPMG LLP (“KPMG”), the Registrant’s principal accountant, billed the Registrant $39,554 and $39,162 respectively, for professional services rendered for the audit of the Registrant’s annual financial statements or services that are normally provided in connection with statutory and regulatory filings.
(b) Audit-Related Fees
For the fiscal years ended April 30, 2019 and April 30, 2018: none.
(c) Tax Fees
For the fiscal years ended April 30, 2019 and April 30, 2018: none.
(d) All Other Fees
For the fiscal years ended April 30, 2019 and April 30, 2018: none.
(e) (1) Audit CommitteePre-Approval Policies and Procedures
THE PRUDENTIAL MUTUAL FUNDS
AUDIT COMMITTEE POLICY
on
Pre-Approval of Services Provided by the Independent Accountants
The Audit Committee of each Prudential Mutual Fund is charged with the responsibility to monitor the independence of the Fund’s independent accountants. As part of this responsibility, the Audit Committee mustpre-approve the independent accounting firm’s engagement to render audit and/or permissiblenon-audit services, as required by law. In evaluating a proposed engagement of the independent accountants, the Audit Committee will assess the effect that the engagement might reasonably be expected to have on the accountant’s independence. The Committee’s evaluation will be based on:
| | • | | a review of the nature of the professional services expected to be provided, |
| | • | | a review of the safeguards put into place by the accounting firm to safeguard independence, and |
| | • | | periodic meetings with the accounting firm. |
Policy for Audit andNon-Audit Services Provided to the Funds
On an annual basis, the scope of audits for each Fund, audit fees and expenses, and audit-related andnon-audit services (and fees proposed in respect thereof) proposed to be performed by the Fund’s independent accountants will be presented by the Treasurer and the independent accountants to the Audit Committee for review and, as appropriate, approval prior to the initiation of such services. Such presentation shall be accompanied by confirmation by both the Treasurer and the independent accountants that the proposednon-audit services will not adversely affect the independence of the independent accountants. Such proposednon-audit services shall be described in sufficient detail to enable the Audit Committee to assess the appropriateness of such services and fees, and the compatibility of the provision of such services with the auditor’s independence. The Committee shall receive periodic reports on the progress of the audit and other services which are approved by the Committee or by the Committee Chair pursuant to authority delegated in this Policy.
The categories of services enumerated under “Audit Services”, “Audit-related Services”, and “Tax Services” are intended to provide guidance to the Treasurer and the independent accountants as to those categories of services which the Committee believes are generally consistent with the independence of the independent accountants and which the Committee (or the Committee Chair) would expect upon the presentation of specific proposals topre-approve. The enumerated categories are not intended as an exclusive list of audit, audit-related or tax services, which the Committee (or the Committee Chair) would consider forpre-approval.
Audit Services
The following categories of audit services are considered to be consistent with the role of the Fund’s independent accountants:
| | ➣ | Annual Fund financial statement audits |
| | ➣ | Seed audits (related to new product filings, as required) |
| | ➣ | SEC and regulatory filings and consents |
Audit-related Services
The following categories of audit-related services are considered to be consistent with the role of the Fund’s independent accountants:
| | ➣ | Accounting consultations |
| | ➣ | Fund merger support services |
| | ➣ | Agreed Upon Procedure Reports |
| | ➣ | Other Internal Control Reports |
Individual audit-related services that fall within one of these categories (except for fund merger support services) and are not presented to the Audit Committee as part of the annualpre-approval process are subject to an authorizedpre-approval by the Audit Committee so long as the estimated fee for those services does not exceed $30,000. Any services provided under suchpre-approval will be reported to the Audit Committee at its next regular meeting. Should the amount of such services exceed $30,000 any additional fees will be subject topre-approval by the Committee Chair (or any other Committee member on whom this responsibility has been delegated). Fees related to fund merger support services are subject to a separate authorizedpre-approval by the Audit Committee with fees determined on a per occurrence and merger complexity basis.
Tax Services
The following categories of tax services are considered to be consistent with the role of the Fund’s independent accountants:
| | ➣ | Tax compliance services related to the filing or amendment of the following: |
| | ◾ | Federal, state and local income tax compliance; and, |
| | ◾ | Sales and use tax compliance |
| | ➣ | Timely RIC qualification reviews |
| | ➣ | Tax distribution analysis and planning |
| | ➣ | Tax authority examination services |
| | ➣ | Tax appeals support services |
| | ➣ | Accounting methods studies |
| | ➣ | Fund merger support services |
| | ➣ | Tax consulting services and related projects |
Individual tax services that fall within one of these categories and are not presented to the Audit Committee as part of the annualpre-approval process are subject to an authorizedpre-approval by the Audit Committee so long as the estimated fee for those services does not exceed $30,000. Any services provided under suchpre-approval will be reported to the Audit Committee at its next regular meeting. Should the amount of such services exceed $30,000 any additional fees will be subject topre-approval by the Committee Chair (or any other Committee member on whom this responsibility has been delegated).
OtherNon-Audit Services
Certainnon-audit services that the independent accountants are legally permitted to render will be subject topre-approval by the Committee or by one or more Committee members to whom the Committee has delegated this authority and who will report to the full Committee anypre-approval decisions made pursuant to this Policy.Non-audit services presented forpre-approval pursuant to this paragraph will be accompanied by a confirmation from both the Treasurer and the independent accountants that the proposed services will not adversely affect the independence of the independent accountants.
Proscribed Services
The Fund’s independent accountants will not render services in the following categories ofnon-audit services:
| | ➣ | Bookkeeping or other services related to the accounting records or financial statements of the Fund |
| | ➣ | Financial information systems design and implementation |
| | ➣ | Appraisal or valuation services, fairness opinions, orcontribution-in-kind reports |
| | ➣ | Internal audit outsourcing services |
| | ➣ | Management functions or human resources |
| | ➣ | Broker or dealer, investment adviser, or investment banking services |
| | ➣ | Legal services and expert services unrelated to the audit |
| | ➣ | Any other service that the Public Company Accounting Oversight Board determines, by regulation, is impermissible. |
Pre-approval ofNon-Audit Services Provided to Other Entities Within the Prudential Fund Complex
Certainnon-audit services provided to PGIM Investments or any of its affiliates that also provide ongoing services to the Prudential Mutual Funds will be subject topre-approval by the Audit Committee. The onlynon-audit services provided to these entities that will requirepre-approval are thoserelated directly to the operations and financial reporting of the Funds. Individual projects that are not presented to the Audit Committee as part of the annualpre-approval process will be subject topre-approval by the Committee Chair (or any other Committee member on whom this responsibility has been delegated) so long as the estimated fee for those services does not exceed $30,000. Services presented forpre-approval pursuant to this paragraph will be
accompanied by a confirmation from both the Treasurer and the independent accountants that the proposed services will not adversely affect the independence of the independent accountants.
Although the Audit Committee will notpre-approve all services provided to PGIM Investments and its affiliates, the Committee will receive an annual report from the Fund’s independent accounting firm showing the aggregate fees for all services provided to PGIM Investments and its affiliates.
(e) (2)Percentage of services referred to in 4(b) – 4(d) that were approved by the audit committee –
For the fiscal years ended April 30, 2019 and April 30, 2018: none.
(f)Percentage of hours expended attributable to work performed by other than full time employees of principal accountant if greater than 50%.
The percentage of hours expended on the principal accountant’s engagement to audit the registrant’s financial statements for the most recent fiscal year that were attributed to work performed by persons other than the principal accountant’s full-time, permanent employees was 0%.
(g)Non-Audit Fees
The aggregatenon-audit fees billed by KPMG for services rendered to the registrant’s investment adviser and any entity controlling, controlled by, or under common control with the investment adviser that provides ongoing services to the registrant for the fiscal years ended April 30, 2019 and April 30, 2018 was $0 and $0, respectively.
(h)Principal Accountant’s Independence
Not applicable as KPMG has not providednon-audit services to the registrant’s investment adviser and any entity controlling, controlled by, or under common control with the investment adviser that provides ongoing services to the registrant that were notpre-approved pursuant toRule 2-01(c)(7)(ii) ofRegulation S-X.
| | |
| Item 5 – | | Audit Committee of Listed Registrants – Not applicable. |
| |
| Item 6 – | | Schedule of Investments – The schedule is included as part of the report to shareholders filed under Item 1 of this Form. |
| |
| Item 7 – | | Disclosure of Proxy Voting Policies and Procedures forClosed-End Management Investment Companies – Not applicable. |
| |
| Item 8 – | | Portfolio Managers ofClosed-End Management Investment Companies – Not applicable. |
| |
| Item 9 – | | Purchases of Equity Securities byClosed-End Management Investment Company and Affiliated Purchasers – Not applicable. |
| | |
| |
| Item 10 – | | Submission of Matters to a Vote of Security Holders – Not applicable. |
| |
| Item 11 – | | Controls and Procedures |
| | (a) | It is the conclusion of the registrant’s principal executive officer and principal financial officer that the effectiveness of the registrant’s current disclosure controls and procedures (such disclosure controls and procedures having been evaluated within 90 days of the date of this filing) provide reasonable assurance that the information required to be disclosed by the registrant has been recorded, processed, summarized and reported within the time period specified in the Commission’s rules and forms and that the information required to be disclosed by the registrant has been accumulated and communicated to the registrant’s principal executive officer and principal financial officer in order to allow timely decisions regarding required disclosure. |
| | (b) | There has been no significant change in the registrant’s internal control over financial reporting that occurred during the period covered by this report that has materially affected, or is likely to materially affect, the registrant’s internal control over financial reporting. |
Item 12 – Exhibits
| | (a) | (1) Code of Ethics – Attached hereto as ExhibitEX-99.CODE-ETH |
| | (2) | Certifications pursuant to Section 302 of the Sarbanes-Oxley Act – Attached hereto asExhibit EX-99. CERT. |
| | (3) | Any written solicitation to purchase securities under Rule23c-1. – Not applicable. |
| | (b) | Certifications pursuant to Section 906 of the Sarbanes-Oxley Act – Attached hereto asExhibit EX-99.906CERT. |
SIGNATURES
Pursuant to the requirements of the Securities Exchange Act of 1934 and the Investment Company Act of 1940, the registrant has duly caused this report to be signed on its behalf by the undersigned, thereunto duly authorized.
| | |
Registrant: | | Prudential Investment Portfolios 4 |
| |
By: | | /s/ Andrew R. French |
| | Andrew R. French |
| | Secretary |
| |
Date: | | June 17, 2019 |
Pursuant to the requirements of the Securities Exchange Act of 1934 and the Investment Company Act of 1940, this report has been signed below by the following persons on behalf of the registrant and in the capacities and on the dates indicated.
| | |
By: | | /s/ Stuart S. Parker |
| | Stuart S. Parker |
| | President and Principal Executive Officer |
| |
Date: | | June 17, 2019 |
| |
By: | | /s/ Christian J. Kelly |
| | Christian J. Kelly |
| | Treasurer and Principal Financial and Accounting Officer |
| |
Date: | | June 17, 2019 |