UNITED STATES
SECURITIES AND EXCHANGE COMMISSION
WASHINGTON, D.C. 20549
Form 10-K
ANNUAL REPORT
PURSUANT TO SECTION 13 OR 15(d)
OF THE SECURITIES EXCHANGE ACT OF 1934
(Mark One) |
| R | ANNUAL REPORT PURSUANT TO SECTION 13 OR 15(d) OF THE SECURITIES EXCHANGE ACT OF 1934 |
| | |
| | For the fiscal year ended September 30, 2006 |
| | |
| | or |
| | |
| £ | TRANSITION REPORT PURSUANT TO SECTION 13 OR 15(d) OF THE SECURITIES EXCHANGE ACT OF 1934 |
| | |
| | For the transition period from to |
Commission file number: 000-16547
WINNER MEDICAL GROUP INC.
(Exact Name of Registrant as Specified in Its Charter)
Nevada | 33-0215298 |
(State or other jurisdiction of incorporation or organization) | (I.R.S. Employer Identification No.) |
Winner Industrial Park, Bulong Road Longhua, Shenzhen City, 518109 People’s Republic of China |
| (Address of principal executive offices) |
Registrant’s telephone number, including area code: (86) 755-28138888
Securities registered pursuant to Section 12(b) of the Act:
None
Securities registered pursuant to Section 12(g) of the Act:
Common stock, $.001 par value
Indicate by check mark if the registrant is a well-known seasoned issuer, as defined in Rule 405 of the Securities Act. Yes o No x
Indicate by check mark if the registrant is not required to file reports pursuant to Section 13 or Section 15(d) of the Act. Yes o No x
Indicate by check mark whether the registrant (1) has filed all reports required to be filed by Section 13 or 15(d) of the Securities Exchange Act of 1934 during the preceding 12 months (or for such shorter period that the registrant was required to file such reports), and (2) has been subject to such filing requirements for the past 90 days. Yes x No o
Indicate by check mark if disclosure of delinquent filers pursuant to Item 405 of Regulation S-K is not contained herein, and will not be contained, to the best of registrant’s knowledge, in definitive proxy or information statements incorporated by reference in Part III of this Form 10-K or any amendment to this Form 10-K. o
Indicate by check mark whether the registrant is a large accelerated filer, an accelerated filer, or a non-accelerated filer (as defined in Rule 12b-2 of the Securities Exchange Act).
Large accelerated filer o | Accelerated filer o | Non-accelerated filer x |
Indicate by check mark whether the registrant is a shell company (as defined in Rule 12b-2 of the Securities Exchange Act).
Yes o No x
At March 31, 2006, the last business day of the Registrant’s most recently completed second fiscal quarter, there were 44,636,371 shares of the Registrant’s common stock outstanding, and the aggregate market value of such shares held by non-affiliates of the Registrant (based upon the average bid and asked price of such shares as reported on the Over-the-Counter Bulletin Board) was $74.65 million. Shares of the Registrant’s common stock held by each executive officer and director have been excluded in that such persons may be deemed to be affiliates of the Registrant. This determination of affiliate status is not necessarily a conclusive determination for other purposes.
As of December 19, 2006, there were 44,677,171 shares of the Registrant’s common stock outstanding.
FORM 10-K
For the Fiscal Year Ended September 30, 2006
Number | | Page |
PART I | |
| | | |
| | |
| | |
| | |
| | |
| | |
| | |
| | | |
PART II | |
| | | |
| | |
| | |
| | |
| | |
| | |
| | |
| | |
| | |
| | | |
PART III | |
| | | |
| | |
| | |
| | |
| | |
| | |
| | | |
PART IV | |
| | | |
| | |
Use of Terms
Except as otherwise indicated by the context, references in this report to “Winner Medical,” the “Company,” “we,” “us,” or “our,” are references to the combined business of Winner Medical Group Inc. and its wholly-owned subsidiary, Winner Group Limited, along with Winner Group Limited’s wholly-owned subsidiaries which include Winner Medical International Trading Co., Ltd. (in deregistration), Winner Industries (Shenzhen) Co., Ltd., Winner Medical & Textile Ltd. Zhuhai, Winner Medical & Textile Ltd. Jingmen, Winner Medical & Textile Ltd. Tianmen, Winner Medical & Textile Ltd. Yichang, Winner Medical & Textile Ltd. Jiayu, Winner Medical & Textile Ltd., Chongyang and Winner Medical (Huanggang) Co., Ltd., and Winner Group Limited’s majority owned subsidiary Shanghai Winner Medical Apparatus Co., Ltd. References to “Winner Group Limited” or “Winner Group” are references to Winner Group Limited and its subsidiaries listed above. References to “China” and “PRC” are references to the “People’s Republic of China.” References to “U.S.” are references to the United States of America. References to “RMB” are to Renminbi, the legal currency of China, and all references to “$” are to the legal currency of the United States.
Forward-Looking Statements
Statements contained in this Annual Report on Form 10-K include “forward-looking statements” within the meaning of Section 27A of the Securities Act of 1933 and Section 21E of the Securities Exchange Act of 1934. Forward-looking statements involve known and unknown risks, uncertainties and other factors which could cause actual financial or operating results, performances or achievements expressed or implied by such forward-looking statements not to occur or be realized. Forward-looking statements may be identified by the use of forward-looking terminology such as “may,” “will,” “could,” “should,” “project,” “expect,” “believe,” “estimate,” “anticipate,” “intend,” “continue,” “potential,” “opportunity” or similar terms, variations of those terms or the negative of those terms or other variations of those terms or comparable words or expressions. Potential risks and uncertainties include, among other things, such factors as:
| · | our dependence upon international customers; |
| · | international trade restrictions; |
| · | foreign currency fluctuation; |
| · | developments in the healthcare industry; |
| · | our dependence on patent and trade secret laws; |
| · | our revenues are highly concentrated in a single customer; |
| · | uncertainties with respect to the PRC legal and regulatory environment. |
| · | our ability to adequately finance the significant costs associated with the development of new medical products; |
| · | potential product liability claims for which we do not have insurance coverage; and |
| · | other risks identified in this Report and our other filings with the SEC. |
Readers are urged to carefully review and consider the various disclosures made by us in this Annual Report on Form 10-K and our other filings with the SEC. These reports attempt to advise interested parties of the risks and factors that may affect our business, financial condition and results of operations and prospects. The forward-looking statements made in this Form 10-K speak only as of the date hereof and we disclaim any obligation to provide updates, revisions or amendments to any forward-looking statements to reflect changes in our expectations or future events.
PART I
Our History
We are a Nevada corporation primarily engaged in the manufacture of medical dressings and medical disposables. We were originally incorporated under the name Birch Enterprises, Inc. in August 1986 and subsequently changed our name to HDH Industries, Inc. and then to Las Vegas Resorts Corporation. On February 13, 2006, we amended our Articles of Incorporation to change our name from Las Vegas Resorts Corporation to Winner Medical Group Inc. Our name change reflects our acquisition of the Winner Group and our focus on the Winner Group’s medical dressings and disposables business.
We were initially formed as a “blank check” entity for the purpose of seeking a merger, acquisition or other business combination transaction with a privately owned entity seeking to become a publicly owned entity. On September 14, 1987, we acquired Las Vegas Resort Investments and later acquired real property and certain other non-gaming assets, and leased the casino area and operated the non-gaming area of a small casino in Henderson, Nevada. In September 1992, all of our operations in Las Vegas ceased. We had no active operations from that time until December 16, 2005, when we completed a reverse acquisition transaction with Winner Group Limited, a Cayman Islands corporation, whose subsidiary companies originally commenced business in February 1991.
Winner Group Limited is a medical dressings and medical disposables manufacturer based in China. Winner Group Limited became our wholly owned subsidiary in connection with the reverse acquisition transaction and is the holding company for all of our commercial operations.
Our Reverse Acquisition of Winner Group Limited
On December 16, 2005, we completed a reverse acquisition transaction with Winner Group Limited whereby we issued to the stockholders of Winner Group Limited 42,280,840 shares of our common stock in exchange for all of the issued and outstanding capital stock of Winner Group Limited. Winner Group Limited thereby became our wholly owned subsidiary and the former stockholders of Winner Group Limited became our controlling stockholders.
On December 16, 2005, Timothy Halter, our former CEO and sole director, resigned from all offices of Winner Medical he held effective immediately and submitted his resignation as our director, effective January 7, 2006. Jianquan Li, our CEO and President, was named as a director on December 16, 2005, and Xiuyuan Fang, our Chief Financial Officer, Vice President and Treasurer, was named as a director on January 7, 2006. Subsequently, we have named additional directors to our board of directors. See Item 10. “Directors and Executive Officers of the Registrant.” The Winner Group executive officers became our executive officers upon the closing of the reverse acquisition.
Winner Group’s operations began with Winner Medical & Textile Ltd. Zhuhai, which was incorporated in China in February 1991 by Mr. Jianquan Li. Over the years, Winner Group expanded to eight wholly owned manufacturing and distribution facilities, two joint venture factories and one trading company. Winner Group Limited was incorporated as a Limited Liability Exempted Company in the Cayman Islands in April 2003 and is the holding company of all our business operations. Winner Group Limited owns 100% of Winner Medical International Trading Co., Ltd. (in deregistration), Winner Industries (Shenzhen) Co., Ltd., Winner Medical & Textile Ltd. Zhuhai, Winner Medical & Textile Ltd. Jingmen, Winner Medical & Textile Ltd. Tianmen, Winner Medical & Textile Ltd. Yichang, Winner Medical & Textile Ltd. Jiayu, Winner Medical & Textile Ltd., Chongyang and Winner Medical (Huanggang) Co., Ltd. Winner Limited Group also owns 60% of Shanghai Winner Medical Apparatus Co., Ltd. and 40% of Winner medical &Textile Ltd Xishui, respectively.
Our Business
Our business consists of research and development, manufacturing and marketing of medical dressings and medical disposables. We have eight wholly owned manufacturing and distribution facilities, two joint venture factories and one trading company; and we have established several integrated manufacturing and processing lines for our core products. Our product offerings include surgical dressings, dressing packs, wound care dressings, protective products, medical instruments, dental products, hygiene products and home care products.
We are one of the leading exporters of medical dressings and medical disposables from China. In the fiscal year ended September 30, 2006, approximately 90% of our products were exported. According to the China Chamber of Commerce for Import & Export of Medicines & Health Products, the total medical dressings and medical disposables exports from China was approximately $534 million in 2005, our export represents approximately 10% of the total export. Our products have been sold in approximately 80 countries, including Japan, Germany, the United States, Italy, the Netherlands, the United Kingdom, Australia, France, China, as well as countries in South America, Africa and the Middle East. Certain of our medical device products are listed with the U.S. Food and Drug Administration or FDA, giving us the ability to directly export those products to the United States. We are certified ISO9001, ISO2000, ISO13485 and CE by TUV PS in Germany for quality control system.
Our Industry
The worldwide market for medical dressings and medical disposables is growing at a rapid pace. For example, according to information published in 2006 by Freedonia Group, a U.S.-based international business research company, the U.S. market for medical dressings and medical disposables products is expected to be $79 billion by 2007 and to grow at an annual rate of 5.6% for the next three years. We believe the growth for medical dressings and medical disposables products in the U.S. could be even greater, driven by continued improvement in medical treatment techniques, and the rapid progress in technology. As a result, we expect demand for our products to rise due to an increased need for health care services, in general, and to increased demand for products such as filled inhalers, Eustachian tubes, products for angioplasty applications, nucleic acid diagnostic instruments and elastic bandages.
Another significant market for medical dressings, medical instruments and medical disposables is the European Union or EU. In 2003, sales in this market reached €8.884 billion (approximately $11.85 billion, based on an exchange rate of €1 = $1.3342 as of December 1, 2006), a 37% increase from €6.5 billion (approximately $8.67 billion) in 1998 according to CBI-the Centre for the Promotion of Imports from developing countries. In the EU, diapers and similar hygiene products, wadding, gauze and bandage products accounted for the largest share of medical disposables used. Since the mid-1990s, hospital treatment in the EU has declined as a result of the low medical care expense policy applicable in the EU. We believe that that decline is offset in part by an increase in home nursing. We believe that this policy and the related increase in home nursing care has created greater retail demand for hygiene cotton products such as gauzes, bandage products and diapers.
Rapid economic growth in China over the past 20 years has significantly increased the demand for medical disposable products. Since 1990, the demand for medical disposable products in China has grown at an annual rate of 14.4%. Based on the information provided by the official website of International Hospital Federation, the import and export volume of medical consumables and dressing products in China was $1.4 billion in 2004, an increase of 27.82% per year, of which the import value was $742 million (an increase of 65.44%), and the export amount was $648 million (an increase of 25.14%). In Beijing alone, consumables purchased by hospitals amount to billions of RMB per year, indicating a huge market demand. (Source: China MED 2006.) The most popular disposable medical products in China are hypodermic syringes, intravenous tubular products, bandages, cotton balls, disposable surgical suits, products for incontinence, surgical and examination gloves, sterilization products, suture lines and other products. We believe the continued development of the health care industry in China will result in increased demand for disposable products.
Cotton grown in China has a low sugar content and moderate fiber content, making it ideal for medical use. As a result, Chinese medical dressing products enjoy a unique competitive advantage in the global marketplace. From January to May 2005, medical dressing products such as medicinal cotton gauzes and bandages ranked second among China’s medical products exports, with an export value of $161 million. In 2004, the total value of medical dressings exports and imports reached $489 million, an increase of 27.82% compared to the prior year. Imports accounted for $42 million, with a year-over-year increase of 65.44%; exports accounted for $447 million, with a year-over-year increase of 25.14%. (Source: Medicines and Economy).
The lifting of the textile quota system worldwide on January 1, 2005, eliminated trade barriers in the global marketplace and provided more firms with the ability to export textile products. With this impediment removed, China now can begin to capitalize on its advantages in medical gauze exports. Therefore, we anticipate that medical gauze exports from China will increase significantly going forward.
New Market Segments We Are Targeting
We are targeting two new market segments that we believe offer growth opportunities for us: the medical nonwoven fabric market and the self-adhesive and elastic bandages market.
(1). Medical Nonwoven Fabric Market
Nonwoven fabric came into existence only 20 years ago. Spunlace is one type of nonwoven fabric technology. Spunlace fabrics are soft to the touch, have high strength, good moisture absorbency and excellent drapability. Spunlace has a performance similar to traditional textiles, but due to its lower costs of production, it sells at a price that is generally lower than traditional textiles.
100% cotton spunlace nonwoven fabric successfully combines natural cotton fiber in a nonwoven production technique. Its advantages accrue from its use of renewable resources, the quality benefits associated with natural materials and the employment of large-scale production made possible by modern technology.
Medical nonwoven fabrics are used in therapy and diagnosis applications, including medical protective clothing, products for infection control and incontinence, surgical gauze, products for ward, and surgical curtains, among others. To date, disposable suits have dominated the market, while the market for static-free products for everyday use continues to expand.
Nonwoven fabrics currently account for almost 15% of cotton fabric production in the medical care industry and demand is increasing. The medical nonwoven fabric industry is expanding rapidly. For example, 17,000,000 square yards of medical nonwoven fabric is produced each year in the U.S. and this amount is predicted to increase at a rate of 5% annually. In 2004, the demand for medical nonwoven fabric products in the U.S. market reached $10.7 billion, of which more than $ 4.2 billion was for disposable nonwoven products. From 2001 to 2004, the annual growth rate was 4.9% for nonwoven products in the U.S.
In 1985, the total production of spunlace fabric in the world was less than 50,000 tons. By 2004, total production had increased to 350,000 tons. According to the INDA (the Association of the Nonwoven Fabrics Industry) statistics, the annual growth rate of spunlace fabric was 13.3% between 2001 and 2004, higher than any other nonwoven fabrics. INDA also estimates that in the following five-year period (2005-2010), the average annual growth rate for spunlace fabric production could be as high as 11%.
In 2004, China produced 54,000 tons of nonwoven fabric, up 50% from 2003. China is now the third largest single producer of spunlace fabric, following Europe and North America. In terms of per capita, the Chinese production is less than 1/10th that of the EU and U.S., and there is still large growth in demand and capacity. Yet, China’s production volume remains relatively low compared to the US and the EU, and we believe there is still large growth potential in both capacity and demand for spunlace products.
(2). Self-Adhesive Bandages and Elastic Bandages Markets
Self-adhesive bandages and elastic bandages can support and protect the body as well as assist in prevention and recuperation. Compared with traditional bandages, they are safer, more comfortable and more convenient, and thus are widely used in the health care, sports, labor protection, family use and veterinary clinics markets. The markets for self-adhesive bandages and elastic bandages are exhibiting growth, and we believe these markets will become further segmented with an expanding number of product categories and increased worldwide production capacity.
Our Strategy - How We Plan to Succeed
Our primary business strategy is to achieve annual growth in revenue by building our brand and reputation. We seek to implement our business strategy by focusing on:
Providing Customers with a Complete Product Line - One Stop Procurement Services
We provide to customers all over the world specialized medical dressing products that are intended to address a number of customer issues and needs. Our products are designed to meet a wide variety of Original Equipment Manufacturer, or OEM product configuration demands. We employ manufacturing equipment including gauze sponge bleaching equipment, sterile packaging machines, auto-gauze sponges folding machines, nonwoven sponge folding machines, and steam sterilization and ethylene oxide, or ETO, sterilization processing which we believe allow us to produce our products in an efficient cost-effective manner.
Developing and Expanding Our Logistics Capabilities
Logistics capability is an important aspect of our strategy. We believe it is important for us to have warehouses in large transportation ports and near central cities. Our use of modern logistics management methods is designed to enhance our service levels, including our ability to deliver products to customers in a timely fashion, and we strive to handle customer service inquiries quickly and accurately. Information on purchase order confirmation, production or order status and shipping advice is readily available. We also offer our customers a variety of payment terms to facilitate international purchases.
Achieving Low Production Costs
Our factories are located in China, where we enjoy relatively low labor costs. We are also able to purchase raw materials in China at lower costs than many of our competitors that need to purchase these materials outside of China. Our manufacturing processes for nonwoven cotton fabrics were implemented in order to reduce our production costs as compared with makers of woven fabrics. We believe as a result of these and other factors our production costs are lower than those of our major competitors.
Providing High Quality Products
Our goal is to manufacture and sell products that are of the highest quality in the industry and in accordance with established industry standards. We have listed some of our medical device products with the FDA, giving us the ability to directly export these products to the United States. We also are certified ISO9001, ISO2000, ISO13485 and CE by TUV PS in Germany for quality control system.
Developing Products Through Research and Development
Our research and development efforts are aimed at finding new varieties of products, improving existing products, improving product quality and reducing production costs.
We intend to focus significant efforts on opening new opportunities for our new products. These new products include nonwoven cotton spunlace products, self-adhesive bandages and elastic bandages. We believe the following products will contribute to our growth.
Nonwoven cotton spunlace products. We plan to launch our nonwoven cotton spunlace products in January 2007. This product launch is intended to capitalize on our market research which suggests that several worldwide medical device distributors may have interest in purchasing our nonwoven cotton spunlace products.
To execute on our strategy, we entered into an agreement in 2005 with the local government agency of Huanggang to acquire 609,410 square meters (approximately 150.6 acre) of land that will mostly be dedicated to the construction of 100% cotton spunlaced nonwoven fabric production facilities. Land use right certificate for 295,187.70 square meters (approximately 72.9 acre) of this land was issued to us in November 2005. We expect that the land use right certificate for the remaining land will be granted to us in 2007.
We believe that the launch of the cotton nonwoven spunlace products will provide a significant advantage to us.
Self-adhesive bandages and elastic bandages. We independently developed and produced a new series of self-adhesive bandages and elastic bandages, which we introduced to the U.S. and Japan market in January 2006. As of September 30, 2006, our revenues from these new products were approximately $1.5 million.
Managing Business Effectively Through Strong Management Team
Each member of our management team has an average of ten years of experience in the industry. Under their leadership, we have a demonstrated record of rapid and orderly growth. We intend to capitalize on the acumen and industry experience of our management team to grow our business.
Building a Broad Customer Base
Although about 21.6% of our products in fiscal year 2006 were sold to one customer who acts as a purchasing agent for a large number of ultimate consumers of our products in Japan, we have many additional customers in approximately 80 countries throughout all areas of the world. Our customers are located in Japan, Germany, North America, Italy, Australia, France, the United Kingdom, Australia, the Netherlands, South America, China, Africa, the Middle East and other places around the globe. Our largest markets currently are Japan and the EU. We intend to broaden our customer base by diversifying our sales and marketing efforts.
Our Products - What We Sell
Our products can be divided into the following eight categories according to their functions:
Surgical dressings
Includes gauze swabs, gaped gauze sponges, fluff gauze swabs, vaseline gauze swabs, nonwoven swabs, trach sponges, cotton swabs, gauze balls, applicators, lap sponges, combined dressings, eye pads, cotton rolls and gauze rolls.
Dressing packs
Includes Dressing packs, drape kits and first aid kits.
Wound care dressings
Includes gauze bandages, triangular bandages, plaster of Paris bandages, elastic adhesive bandages, elastic bandages, elastic tubular mesh bandages, adhesive plasters, wound dressing and first aid products (finger bandages).
Protective products
Includes surgical gowns, surgical drapes, protective gowns, nonwoven caps, band bags (machine cover), shoe covers, sleeves, bed sheets, pillowcases, aprons, headrest covers, face masks, Polyethylene gloves, bibs and sterile pouches.
Medical instruments
Disposable syringes, infusion sets, transfusion sets, blood bags, urine bags, scalp vein sets, needles, catheters, blades, sutures, forceps, scissors, umbilical cord clamps, vagina dilators, trays, measuring caps, aluminum clip boards, hemostatic tapes, identity bands, microslides, gloves.
Dental products
Bibs, cotton dental rolls, tongue depressors, disposable impression trays, dental syringes, disposable traps, disposable surgical tips.
Hygiene products
Alcohol prep pads, Iodophor prep pads, benzalkonium bromide prep pads.
Home care products
Cosmetic cotton swabs, facial masks, cotton swabs, colored cotton balls, handkerchiefs, disposable baby wear, knitting gloves, disposable underwear, disposable slippers, mattresses, nano antibacterial wipers.
We continuously focus on the development and launch of high value added products, and on increasing our sales volume of sterilized products, which have a higher profit rate than traditional products.
Our new self-adhesive bandages and elastic bandages are technology-driven products that provide us with a significant competitive advantage due to its unique weaving pattern and glue technology.
We plan to continue to penetrate the home health care market for medical protective products, particularly in Japan, Europe and the U.S., which are the main markets for medical protective products. We have established trade relationships with Sakai Shorten of Japan which was one of our largest clients in fiscal year 2006, with total sales of approximately $13.78 million. We sell our home care products through BSN medical GmbH, Boots (Retail Buying) Limited, Lohmann & Rauscher International GmbH & Co. KG, Molnlycke Health Care AB and Medico BV in Europe, and TYCO Healthcare and AMG Medical Inc. in the U.S. In order to adapt the demand of increasing international orders, we have also established production systems designed to address international product demands, which includes a one hundred thousand grade purification room and modern manufacturing equipment.
We also focus on quality control. Our products have met the requirements of major international medical product quality tests, and we have passed ISO9001, EN46002, and CE (Conformité Européenne). We continuously seek to improve our production systems and processes, to meet the latest quality control requirements of ISO9001 (Version 2000), ISO 13485 and ISO11135.
Our Intellectual Property
We currently have one issued patent in China for a utility model named “disposable medical compound eye-protective face mask” (patent No. ZL03273570.7), which expires in August 2013. One patent application named “a safety-style dressing with X tracing” was filed with the Patent Office of the State Intellectual Property Office of China and is pending approval. The application number is 200510033022.9.
Nianfu Huo, the senior vice president of Winner Group Limited and the general manager of our subsidiary Winner Medical & Textile Ltd. Zhuhai, or Winner Zhuhai, has entered into a licensing agreement with Winner Zhuhai pursuant to which Mr. Huo granted Winner Zhuhai perpetual rights for the use of his patent “disposable compounded face mask” (patent No. ZL01256074.X) on a worldwide, royalty-free basis. Such patent is to expire in September 2011. In addition, we have licensed from Jianquan Li, our CEO, President and director, his rights under one patent, three patent applications and related technology for nonwoven fabric manufacturing on a perpetual, worldwide royalty-free basis. Below are the brief descriptions of these patent and patent applications:
Description of Patent | | Patent No. / Patent Application No. | | Type | | Status |
| Manufacture method of the 100% cotton non-woven medical dressings | | 200510033147.1 (China) | | Invention | | Under application |
| | | | | | | |
| Spunlace Non-Woven Cloth With X-Ray Detectable Element Produced Thereby. We added X-Ray detectable elements into the spunlace non-woven cloth so that it can be easily detected by X-ray, thereby avoiding leaving medical dressings in patient’s body | | ZL 200520055659.3 (China) | | Utility Model | | Granted |
| | | | | | | |
| Manufacture Method of the Spunlace Non-Woven Cloth With X-Ray Detectable Element Produced Thereby | | 200510033576.9 (China) | | Invention | | Under application |
| | | | | | | |
| Method For Producing Spunlace Non-Woven Cloth, Method For Producing Spunlace Non-Woven Cloth With X-Ray Detectable Element, Spunlace Non-Woven Cloth With X-Ray Detectable Element Produced Thereby | | 11/169240 (U.S.) PI 0502653-9 (Brazil) 2005118845 (Russia) 2005-0056783 (Korea) 200503941-7 (Singapore) 05013515.1/EP05013515 (E.U.) GCC/P/2005/4854 (The United Arab Emirates) 1629/DEL/2005 (India) 2005-206619 (Japan) PA/a/2005/4854 (Mexico) | | Invention | | Under application |
We have registered six trademarks with the Trademark office of the State Administration for Industry and Commerce of China relating to the word “Winner” in English and in Chinese. Thirteen applications for trademarks with the Trademark office of the State Administration for Industry and Commerce of China related to the words “Winwin” and “Winband” in English and in Chinese are pending. We also have registered the trademark for the word “Winner” in other countries and areas, including the United States, Singapore, Jordan, the United Arab Emirates, Yemen, Chile, Cambodia and Hong Kong, and this trademark has passed the registration application in the member countries of the Madrid Agreement.
In addition, we have registered the following domain names: www.winnermedical.com (currently in use), www.winner-industries.com, www.winner-shenzhen.com, www.winner-shanghai.com, and www.winner-beijing.com. We also have registered two Chinese domain names.
Where appropriate for our business strategy, we will continue to take steps to protect our intellectual property rights.
Our Research and Development Efforts - How We Create New Products and Enhance Existing Ones
Currently, we have more than 100 employees devoted to our research and development efforts and to the application of the research achievements into integrated manufacturing practices and processes. We spent approximately $1,580,000, $855,000 and $312,000 on research and development in fiscal years 2006, 2005 and 2004, respectively. More than 95% of our research and development staff graduated from junior colleges or achieved an equivalent educational level. Thirty five percent of our research and development staff has worked in this field for more than 20 years. Our CEO, President and director, Jianquan Li, has filed three patent applications under which he is named as the inventor of certain nonwoven cotton fabric technology. We will continue to utilize the skills and experience of our research and development team to manufacture nonwoven cotton medical dressings in a very cost effective and efficient manner. Mr. Li granted us a perpetual, worldwide, royalty-free license of this technology.
Our research and development in 2006 was mainly focused on the development of the nonwoven 100% cotton products, self-adhesive and elastic bandages, surgical drapes, and wound dressing.
Nonwoven medical dressing is a type of medical dressing that is made of nonwoven fabric. As a natural product, it is environmentally friendly, reproducible, comfortable, non-allergenic and static-free.
With this nonwoven fabric technology, we can produce environmentally friendly nonwoven medical dressings at a lower cost. Our new nonwoven fabric technology modifies the conventional manufacturing method of nonwoven cloth, which involves eight steps. We refined the production equipment and reduced the steps in making nonwoven cloth from eight steps to five steps. As a result, the new technology allows us to minimize raw material waste, save production costs, and improve production efficiency.
Our research and development activities are conducted in accordance with the ISO9001/13485 systems, adhere to strict procedures and utilize standardized processes. We are focused on further developing and improving our core manufacturing technologies so that we can reduce waste and overall costs.
In addition, we use advanced automatic equipment as part of our processing system, including folding machines, plastic absorbing machines and sterilization systems. These improvements not only impact positively on production costs, but also enable us to further diversify our product lines.
Our research and development efforts have resulted in the development and production in 2006 of a new series of self-adhesive bandages and elastic bandages.
Our Marketing Efforts - How We Sell Our Products
During fiscal year 2006, nearly 90% of our products were exported from China to markets around the world and we have established a position as a leading Chinese exporter in the medical dressings and medical disposables markets. According to the China Chamber of Commerce for Import & Export of Medicines & Health Products, we accounted for approximately 10% of the total exports from China of these products in 2005. Our products are sold in approximately 80 countries through a network of more than 100 OEMs, distributors, wholesalers and manufacturers’ representatives. Our major target markets are the major international markets outside of China such as Japan, Europe and the Americas. In light of our existing production capacity constraints, we plan to first meet the demands from international markets, then gradually expand our sales to the Chinese market. China accounted for approximately 10% of our total sales volume in fiscal year 2006.
Since there are different requirements in different geographic markets, we have adopted marketing strategies that are market specific. For developed markets such as the U.S., Japan and the EU, we are an OEM supplier, providing our customers with a customized product in which the design, size, type and scale of the products is decided by our customers. This approach enables us to capitalize on our customers’ brand strength and established market channels. In order to gain market share, we attempt to leverage our customers’ strong brand names, efficient distribution networks and market presence. We believe it is a better strategy for us to team up with large, well known companies than to compete directly with them. Most of our sales in developed countries are conducted by direct marketing. In addition, we conduct nearly 25% of our sales through third-party manufacturers’ representatives, who are compensated through the payment of sales commissions.
In developing countries, we sell our products under the “Winner” brand name. As the economies of developing countries grow, we expect there will be a significant increase in demand for medical products, including demand for our medical dressings and other medical disposable products. We believe our products are generally price-competitive with products from the U.S., Japan and the EU. Competition can also come from local producers in the developing countries, but we attempt to compete with local manufacturers based on the quality of our products. Under these circumstances, we believe we have successfully established a reputation for our own brand based on low price and high quality. We employ manufacturers’ representatives and actively participate in formal bid contracts organized by local governments and organizations. We believe we have built our brand reputation and market share in these markets and “Winner” has become a recognized brand in local hospitals, the home health care sector and retail markets in many developing countries.
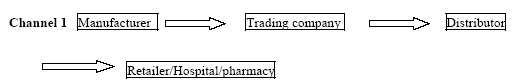
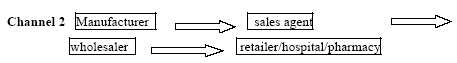
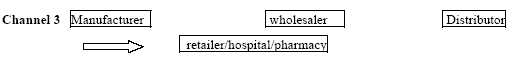
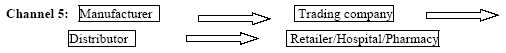
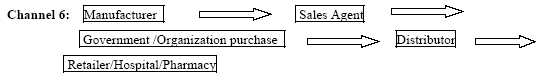
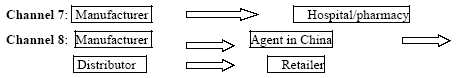
The following demonstrates the multi-channel distribution systems we adopted in distributing our products:
U.S./European Markets:
In this channel, we sell our products through some trading companies in Europe and the U.S.
In this channel, we sell our products to a wholesaler and through a sales agent. In addition, we pay commissions to the sales agents.
In this channel, we sell finished and semi-finished products to wholesalers.
In this channel, we sell home care products to retail chains.
Japanese Market:
In this channel, we sell our products to more than 20 distributors through Sakai Shoten Co., Ltd. in Japan.
Middle Eastern / African Markets:
In this channel, we employ sales agents and participate in the formal bid contracts organized by local governments and organizations. The sales agents are compensated through payment of sales commissions.
Chinese Market:
In China, we sell our products under the “Winner” brand name to hospitals and pharmacies and also to distributors through agents.
Raw Materials
We depend on outside suppliers for all of the raw materials we use to produce our products. The principal raw materials used for our products are cotton, medical film and medical paper, each of which we purchase from a limited number of suppliers. Our major supplier of cotton is Jingshan Weijia Textile Co., Ltd., which currently supplies more than 5% of the cotton we use to manufacture our products. We purchase most of our medical film and medical paper from AMCOR Flexibles Winterbourne (UK) and Billerud Beetham Limitied (UK), respectively. We believe we are not dependent on any of these suppliers and can replace them, if necessary, without material difficulties.
Given the importance of key raw materials to our business, materials purchasing and materials management are key activities for us. We carefully manage our purchasing efforts and have established company policies involving raw materials procurement. The cost of raw materials amounts to almost 60% of our total production cost.
Supplier Management System
We have established a strict supplier management system to comprehensively assess suppliers on the basis of quality and improvement, purchasing cycles, management systems, price and delivery cycles. Suppliers are formally evaluated twice a year. The performance of the suppliers determines how much business they receive from us in subsequent months. We also host an annual suppliers’ conference, during which we communicate directly with our suppliers about our needs and service level demands. We undertake an open and transparent purchasing practice, which is well received by most suppliers.
Purchasing Procedures
Purchasing transactions are conducted in accordance with a procedure termed “inquiry-comparison-negotiation.” Potential suppliers make initial offers that are compared objectively according to relevant guidelines. After validation of the various suppliers’ service and quality capabilities, we acquire the needed materials from the supplier offering the highest quality product at the lowest cost. Our financial department establishes an oversight process by appointing individuals to conduct independent market research of key price points. The research findings are announced periodically. Our auditing department and quality assurance department also provide oversight to assure that we strictly adhere to all purchasing procedures.
Our Major Customers
We have customers in approximately 80 countries throughout the world, including Japan, Germany, the United States, Italy, the Netherlands, the United Kingdom, Australia, France, China, as well as countries in South America, Africa and the Middle East. Some of our customers are large-scale producers and distributors with well known brand names, while others are import and export firms or wholesalers with trade expertise and established sales channels. We have long-term relationships with most of our customers.
No customer, other than Sakai Shoten Co., Ltd., accounted for 10% or more of our revenues in fiscal year 2006. Sakai Shoten Co., Ltd. accounted for approximately 21.6% and 24.5% of our revenue in the fiscal year 2006 and 2005, respectively. Sakai Shoten Co., Ltd. acts as a purchasing agent for a large number of ultimate consumers of our products in Japan. If we lose this customer and are unable to replace this customer with other customers that purchase a similar amount of our products, our revenues and net income would decline considerably.
Our Competition
We are subject to intense competition. Some of our competitors have greater financial resources, larger staff and more established market recognition than do we in the domestic, Chinese market and international markets. Increased competition in the medical disposables products market could put pressure on the price at which we sell our products, resulting in reduced profitability for the company.
In our industry, we compete based upon manufacturing capacity, product quality, product cost, ability to produce a diverse range of products and logistical capabilities.
Our competitors include medical dressings and other medical disposables products manufacturers around the world. Below is a list by geographic area of the companies we view as our most significant competitors in the major markets in which we sell our products.
Competitors based in China
Our competitors based in China primarily include: Shenzhen Aumei, Zhejiang Zhende Medical Dressing Co., Ltd., Jiangsu Province Jianerkang Medical Dressing Co., Ltd., and Qingdao Hartmann Medical Dressing Co., Ltd.
Our China-based competitors tend to have lower labor costs, and we believe that their products are of lower quality and often lack diversity.
Competitors based in Asia (Outside of China)
Competitors based in this area mainly come from India, and include: Premier Enterprise and Sri Ram Products, whose main business is weaving.
These competitors tend to have older equipment and lower product quality.
Competitors based in Europe
Competitors based in Europe include: Bastos Viegas, S.A. (Portugal), Intergaz, S.R.O. (Czech Republic) and TZMO S.A. (Poland).
Our competitors from Europe may have a geographic advantage in the EU market, but we believe they are generally smaller in scale, have less product diversity and higher production costs.
Regulation
We are subject to complex and stringent governmental laws and regulations relating to the manufacture and sale of medical devices in China and in many of the other countries in which we sell our products. These laws and regulations in the major markets in which we compete are discussed further below. All of the regulatory laws and regulations may be revised or reinterpreted, or new laws and regulations may become applicable that could have a negative effect on our business and results of operations. See Item 1A. “Risk Factors — Risks Related to Our Industry — Our failure to comply with ongoing governmental regulations could hurt our operations and reduce our market share.”
China
In China, medical sanitary materials and dressings (including medical gauzes, absorbent cottons, bandages and disposable surgical suits) are regulated as medical devices and are administered by the Department of Medical Devices of the State Drug Administration of China. The technology and specifications of these products must be consistent with the Regulations for the Supervision and Administration of Medical Devices and relevant laws and standards.
Our business is regulated by a number of provincial authorities that license the production of, and register products such as those we manufacture. Of our eight wholly owned facilities, all of which require licenses from these authorities, seven operate under current licenses. The one technically non-compliant facility, Winner Medical (Huanggang) Co., Ltd., has not yet commenced production, and our license application is pending. We believe the technical non-compliance with these regulations will not result in material adverse effect on our financial condition or operation.
Other Countries
In addition, since we sell our products in the international markets, our products are subject to regulations imposed by various governmental agencies in the markets where our products are sold. All of our products exported to EU countries must have a CE certificate (CE-certification or CE Marking is a conformity marking consisting of the letters “CE”. The CE Marking applies to products regulated by certain European health, safety and environmental protection legislation. The CE Marking is obligatory for products it applies to and the manufacturer affixes the marking in order to be allowed to sell his product in the European market).
In Japan, we need a Certificate of Foreign Manufacture from the Pharmaceuticals and Medical Devices Agency of Ministry of Health, Labor and Welfare of Japan in order to sell our products in the Japanese market. We have reached the applicable standards and obtained the required certificates in the EU and Japan.
In the U.S., some of our products are considered medical devices. The FDA regulates the design, manufacture, distribution, quality standards and marketing of medical devices. Accordingly, our product development, testing, labeling, manufacturing processes and promotional activities related to those products that are considered medical devices are regulated extensively in the U.S. by the FDA. The FDA has given us clearance to market such products within the U.S.
Under the U.S. Federal Food, Drug, and Cosmetic Act, or “FFDCA”, medical devices are classified into one of three classifications, each of which is subject to different levels of regulatory control, with Class I being the least stringent and Class III being subject to the most control. Class III devices, which are life supporting or life sustaining, or are of substantial importance in preventing impairment of human health, are generally subject to a clinical evaluation program before receiving pre-market approval, or PMA, from the FDA for commercial distribution. Class II devices are subject in some cases to performance standards that are typically developed through the joint efforts of the FDA and manufacturers, but do not require clinical evaluation and pre-market approval by the FDA. Instead, these products require a pre-market notification to the FDA and in most cases a showing of substantial equivalence to an existing product under Section 510(k) of the FFDCA. Class I devices are subject only to general controls, such as labeling and record-keeping regulations, and are generally exempt from pre-market notification or approval under Section 510(k) of the FFDCA, although they are required to be listed with the FDA. Our products that are considered to be medical devices are generally considered Class I devices; therefore, they are exempt from pre-market notification or approval requirements. We have listed all of our relevant products with the FDA pursuant to the FFDAC.
If a 510(k) pre-market notification is required for a device, then such device cannot be commercially distributed until the FDA issues a letter of substantial equivalent, approving the sale of the product. Certain of our surgical face masks and sterilization pouches are subject to the 510(k) pre-market notification requirements. We have received the necessary approvals from the FDA for such products.
Our medical device products are also subject to the general labeling requirements under the FDA medical device labeling regulations. As of September 30, 2006, we have labeled all of our medical device products and are not the subject of any current enforcement action initiated by the FDA.
In addition, manufacturers of medical devices distributed in the U.S. are subject to various regulations, which include establishment registration, medical device listing, quality system regulation (QSR) and medical device reporting. Under FFDAC, any foreign establishment that manufactures, prepares, propagates, compounds or processes a medical device that is imported, or offered for import, into the U.S. is required to register its establishment with the FDA. In addition, any foreign establishment that engages in manufacturing, preparation, compounding, assembly or processing of a medical device intended for commercial distribution in the U.S. is required to list its devices with the FDA. Our subsidiary Winner Shenzhen, which exports all our products, has registered its establishment with the FDA and has listed 31 medical and dental devices.
Our manufacturing processes are required to comply with the applicable portions of the QSR, which covers the methods and documentation of the design, testing, production, processes, controls, quality assurance, labeling, packaging and shipping of our medical device products. The QSR also, among other things, requires maintenance of a device master record, device history record and complaint files. As of September 30, 2006, we were not the subject of any current enforcement actions initiated by the FDA.
The FDA has broad regulatory and enforcement powers. If the FDA determines that we have failed to comply with applicable regulatory requirements, it can impose a variety of enforcement actions ranging from public warning letters, fines, injunctions, consent decrees and civil penalties to suspension or delayed issuance of approvals, seizure or recall of our products, total or partial shutdown of production, withdrawal of approvals or clearances already granted and criminal prosecution. The FDA can also require us to repair, replace or refund the cost of devices that we manufactured or distributed. Our failure to meet any of these requirements may cause the FDA to automatically detain our products when they are presented for entry into the U.S. If any of these events were to occur, it could materially adversely affect us. As of September 30, 2006, we were not the subject of any current enforcement actions initiated by FDA.
Our Employees
As of September 30, 2006, we employed approximately 5,400 full-time employees. Six of our Chinese subsidiaries have trade unions that protect employees’ rights, aim to assist in the fulfillment of our economic objectives, encourage employee participation in management decisions and assist in mediating disputes between us and union members. We believe that we maintain a satisfactory working relationship with our employees and we have not experienced any significant labor disputes or any difficulty in recruiting staff for our operations.
As required by applicable Chinese law, we have entered into employment contracts with most of our officers, managers and employees. We are working towards entering into employment contracts with those employees who do not currently have employment contracts with us.
Our employees in China participate in a state pension scheme organized by the Chinese municipal and provincial governments. We are required to contribute to the scheme at the rates ranging from 8% to 20% of the average monthly salary. The expenses related to this scheme were $321,899, $303,411 and $253,473 for the fiscal years 2006, 2005 and 2004, respectively. In addition, we are required to participate in a Mandatory Provident Fund scheme operated by approved trustees in Hong Kong and to contribute to the scheme at a rate of 5% of the salaries and wages. We contributed $154 and $1,466 to this scheme in the fiscal years 2006 and 2005, respectively.
In addition, we are required by Chinese law to cover employees in China with various types of social insurance. We have purchased such social insurances for a portion of our labor force. We are working towards providing all employees with the required insurance. In the event that any current employee, or former employee, files a complaint with Chinese government, not only will we be required to purchase insurance for such employee, we may be subject to administrative fines. We believe that such fines, if imposed, would be immaterial.
You should carefully consider the following risks, as well as the other information contained in this annual report, before investing in our securities. If any of the following risks actually occurs, our business could be harmed. You should refer to the other information set forth or referred to in our annual report, including our consolidated financial statements and the related notes incorporated by reference herein.
RISKS RELATED TO OUR BUSINESS
Our dependence upon international customers may impede our ability to supply products.
During the fiscal year 2006, approximately 90% of our products were sold internationally. As a result, we are subject to risks associated with shipping products across borders, including shipping delay. If we cannot deliver our products on a competitive and timely basis, our relationships with international customers will be damaged and our financial condition could also be harmed.
We engage in international sales, which expose us to trade restrictions.
As a result of our product sales in various geographic regions, we may be subject to the risks associated with customs duties, export quotas and other trade restrictions that could have a significant impact on our revenue and profitability. While we have not encountered significant difficulties in connection with the sales of our products in international markets, the future imposition of, or significant increases in, the level of custom duties, export quotas or other trade restrictions could have an adverse effect on us. Further, we cannot assure you that the laws of foreign jurisdictions where we sell and seek to sell our products afford similar or any protection of our intellectual property rights as may be available under U.S. laws. We are directly impacted by the political, economic, military and other conditions in the countries where we sell or seek to sell our products.
Expansion of our business may put added pressure on our management, financial resources and operational infrastructure impeding our ability to meet any increased demand for our medical products and possibly hurting our operating results.
Our business plan is to significantly grow our operations to meet anticipated growth in demand for existing products, and by the introduction of new product offerings. Our planned growth includes the construction of several new production lines to be put into operation over the next five years. Growth in our business may place a significant strain on our personnel, management, financial systems and other resources. We may be unable to successfully and rapidly expand sales to potential customers in response to potentially increasing demand or control costs associated with our growth.
To accommodate any such growth and compete effectively, we may need to obtain additional funding to improve information systems, procedures and controls and expand, train, motivate and manage our employees, and such funding may not be available in sufficient quantities, if at all. If we are not able to manage these activities and implement these strategies successfully to expand to meet any increased demand, our operating results could suffer.
We rely on patent and trade secret laws that are complex and difficult to enforce.
The validity and breadth of claims in medical technology patents involve complex legal and factual questions and, therefore, the extent of their enforceability and protection is highly uncertain. Issued patents or patents based on pending patent applications or any future patent applications may not exclude competitors or may not provide a competitive advantage to us. In addition, patents issued or licensed to us may not be held valid if subsequently challenged and others may claim rights in or ownership of such patents. Furthermore, we cannot assure you that our competitors have not developed or will not develop similar products, will not duplicate our products, or will not design around any patents issued to or licensed by us.
We depend on key personnel, and turnover of key employees and senior management could harm our business.
Our future business and results of operations depend in significant part upon the continued contributions of our key technical and senior management personnel, including Jianquan Li, Xiuyuan Fang, Jiagan Chen, Hongwei Jia and Nianfu Huo, who hold the titles of CEO, President and Chairman, CFO and Vice President, Vice President of Project Management, Vice President of Quality Inspection and General Manager of Winner Zhuhai, respectively. They also depend in significant part upon our ability to attract and retain additional qualified management, technical, marketing and sales and support personnel for our operations. If we lose a key employee or if a key employee fails to perform in his or her current position, or if we are unable to attract and retain skilled employees as needed, our business could suffer. Significant turnover in our senior management could significantly deplete our institutional knowledge held by our existing senior management team. We depend on the skills and abilities of these key employees in managing the manufacturing, technical, marketing and sales aspects of our business, any part of which could be harmed by further turnover.
Our revenues are highly concentrated in a single customer and our business will be harmed if our customer reduces its orders from us.
In fiscal year 2006, almost 21.6% of our business comes from just one of our customers, Sakai Shoten Co., Ltd, which acts as a purchasing agent for a large number of ultimate consumers of our products in Japan. If we lose this customer and are unable to replace this customer with other customers that purchase a similar amount of our products, our revenues and net income would decline considerably.
We are subject to potential product liability claims for which we do not have insurance coverage.
Defects in our products could subject us to potential product liability claims that our products are ineffective or caused some harm to the human body. We do not have product liability insurance. Plaintiffs may also advance other legal theories supporting claims that our products or actions resulted in some harm. A successful claim brought against us could significantly harm our business and financial condition.
We may not be able to adequately finance the significant costs associated with the development of new medical products.
The medical products in the medical dressings and medical disposables market change dramatically with new technological advancements. We are currently conducting research and development on a number of new products, which require a substantial outlay of capital. To remain competitive, we must continue to incur significant costs in product development, equipment, facilities and invest in research and development of new products. These costs may increase, resulting in greater fixed costs and operating expenses.
In addition to research and development costs, we could be required to expend substantial funds for and commit significant resources to the following:
| · | additional engineering and other technical personnel; |
| · | advanced design, production and test equipment; |
| · | manufacturing services that meet changing customer needs; |
| · | technological changes in manufacturing processes; and |
| · | manufacturing capacity. |
Our future operating results will depend to a significant extent on our ability to continue to provide new products that compare favorably on the basis of cost and performance with the design and manufacturing capabilities of competitive third-party suppliers and technologies. We will need to sufficiently increase our net sales to offset these increased costs, the failure of which would negatively affect our operating results.
We may be exposed to potential risks relating to our internal controls over financial reporting and our ability to have those controls attested to by our independent auditors.
As directed by Section 404 of the Sarbanes-Oxley Act of 2002 or SOX 404, the Securities and Exchange Commission adopted rules requiring public companies to include a report of management on the company’s internal controls over financial reporting in their annual reports, including Form 10-K. In addition, the independent registered public accounting firm auditing a company’s financial statements must also attest to and report on management’s assessment of the effectiveness of the company’s internal controls over financial reporting as well as the operating effectiveness of the company’s internal controls. We are not subject to these requirements for our current fiscal year ending September 30, 2006, accordingly we have not evaluated our internal control systems in order to allow our management to report on, and our independent auditors to attest to, our internal controls as required by these requirements of SOX 404. Under current law, we will be subject to these requirements beginning with our annual report for the fiscal year ending September 30, 2008. We can provide no assurance that we will comply with all of the requirements imposed thereby. There can be no positive assurance that we will receive a positive attestation from our independent auditors. In the event we identify significant deficiencies or material weaknesses in our internal controls that we cannot remediate in a timely manner or we are unable to receive a positive attestation from our independent auditors with respect to our internal controls, investors and others may lose confidence in the reliability of our financial statements.
Our holding company structure and Chinese accounting standards and regulations may limit the payment of dividends.
We have no direct business operations, other than our ownership of our subsidiaries. While we have no current intention of paying dividends, should we decide in the future to do so, as a holding company, our ability to pay dividends and meet other obligations depends upon the receipt of dividends or other payments from our operating subsidiaries and other holdings and investments. In addition, our operating subsidiaries, from time to time, may be subject to restrictions on their ability to make distributions to us, including as a result of restrictive covenants in loan agreements, restrictions on the conversion of local currency into U.S. dollars or other hard currency and other regulatory restrictions as discussed below. If future dividends are paid in Renminbi, fluctuations in the exchange rate for the conversion of Renminbi into U.S. dollars may reduce the amount received by U.S. stockholders upon conversion of the dividend payment into U.S. dollars.
Chinese regulations currently permit the payment of dividends only out of accumulated profits as determined in accordance with Chinese accounting standards and regulations. Our subsidiaries in China also are required to set aside a portion of their after tax profits according to Chinese accounting standards and regulations to fund certain reserve funds. Currently, our subsidiaries in China are the only sources of revenues or investment holdings for the payment of dividends. If they do not accumulate sufficient profits under Chinese accounting standards and regulations to first fund certain reserve funds as required by Chinese accounting standards, we will be unable to pay any dividends.
RISKS RELATED TO OUR INDUSTRY
We may not be able to maintain or improve our competitive position because of strong competition in the medical dressing and medical disposable industry, and we expect this competition to continue to intensify.
The medical dressing and medical disposable industry is highly competitive. We face competition from medical dressing and medical disposable manufacturers around the world. Some of our international competitors are larger than we and possess greater name recognition, assets, personnel, sales and financial resources. These entities may be able to respond more quickly to changing market conditions by developing new products and services that meet customer requirements or are otherwise superior to our products and services and may be able to more effectively market their products than we can because they have significantly greater financial, technical and marketing resources than we do. They may also be able to devote greater resources than we can to the development, promotion and sale of their products. Increased competition could require us to reduce our prices, result in our receiving fewer customer orders, and result in our loss of market share. We cannot assure you that we will be able to distinguish ourselves in a competitive market. To the extent that we are unable to successfully compete against existing and future competitors, our business, operating results and financial condition would be materially adversely affected.
Cost containment measures that are prevalent in the healthcare industry may result in lower margins.
The health care market accounts for most of the demand for medical disposables products. The health care market was typified in recent years by strict cost containment measures imposed by governmental agencies, private insurers and other “third party” payors of medical costs. In response to these economic pressures, virtually all segments of the health care market have become extremely cost sensitive and in many cases hospitals and other health care providers have become affiliated with purchasing consortiums that are charged with obtaining large quantities of needed products at the lowest possible cost. These factors in combination have hindered suppliers and manufacturers of these products like us who may not be able to supply the large quantities sought by the purchasing consortiums or who are unable to respond to the need for lower product pricing.
Our failure to comply with ongoing governmental regulations could hurt our operations and reduce our market share.
In China, medical sanitary materials and dressings (including medical gauzes, absorbent cottons, bandages and disposable surgical suits) are supervised as medical devices and are administered by the Department of Medical Device of State Drug Administration of China. The technology and specifications of these types of products must be consistent with Regulations for the Supervision and Administration of Medical Devices of China and the relevant Chinese laws and standards. In addition, since we sell our products in the international markets, our products also are subject to regulations imposed by various governmental agencies in the markets where our products are sold. For example, certain of our products exported to the U.S. must be listed with FDA. All our products exported to EU countries must have the CE certificate. We also need a Certificate of Foreign Manufacture for Japan market. These layers of regulation cause delays in the distribution of our products and may require us to incur operating costs resulting from the need to obtain approvals and clearances from regulators. As to date, we have reached the applicable standards and obtained the required certificates in the markets mentioned above.
Our margins are reduced when we sell our products to customers through a buying group.
A trend in our industry is the use by customers of buying groups. These buying groups aggregate the demand of several different customers and then buy products in bulk at lower prices than any of the customers would be able to obtain individually. We have only limited production capacity. This makes it difficult for us to meet the often large demand for our products from buying groups that represent overseas customers in developed countries. A single order of one kind of product from a top 500 multinational buyer could require the full manufacturing capacity of one of our plants. Although we have expanded our manufacturing capacity, our capacity is still not large enough to always meet the demands of these clients. As a result, we may lose business to other manufacturers of our products who have more manufacturing capacity than we do.
RISKS RELATED TO DOING BUSINESS IN CHINA
Changes in China’s political or economic situation could harm the company and its operational results.
Economic reforms adopted by the Chinese government have had a positive effect on the economic development of the country, but the government could change these economic reforms or any of the legal systems at any time. This has an unknown effect on our operations and profitability. Some of the things that could have this effect are:
| | · | Level of government involvement in the economy; |
| | · | Control of foreign exchange; |
| | · | Methods of allocating resources; |
| | · | Balance of payments position; |
| | · | International trade restrictions; and |
The Chinese economy differs from the economies of most countries belonging to the Organization for Economic Cooperation and Development, or OECD, in many ways. As a result of these differences, we may not develop in the same way or at the same rate as might be expected if the Chinese economy were similar to those of the OECD member countries.
Our business is largely subject to the uncertain legal environment in China and your ability to legally protect your investment could be limited.
The Chinese legal system is a civil law system based on written statutes. Unlike common law systems, it is a system in which precedents set in earlier legal cases are not generally used. The overall effect of legislation enacted over the past 20 years has been to enhance the protections afforded to foreign invested enterprises in China. However, these laws, regulations and legal requirements are relatively recent and are evolving rapidly, and their interpretation and enforcement involve uncertainties. These uncertainties could limit the legal protections available to foreign investors, such as the right of foreign invested enterprises to hold licenses and permits such as requisite business licenses. In addition, all of our executive officers and our directors are residents of China and not of the U.S., and substantially all the assets of these persons are located outside the U.S. As a result, it could be difficult for investors to effect service of process in the U.S., or to enforce a judgment obtained in the U.S. against us or any of these persons.
The Chinese government exerts substantial influence over the manner in which we must conduct our business activities.
China has only recently permitted provincial and local economic autonomy and private economic activities. The Chinese government has exercised and continues to exercise substantial control over virtually every sector of the Chinese economy through regulation and state ownership. Our ability to operate in China may be harmed by changes in its economic policies and regulations, including those relating to taxation, import and export tariffs, environmental regulations, land use rights, property and other matters. We believe that our operations in China are in material compliance with all applicable legal and regulatory requirements. However, the central or local governments of these jurisdictions may impose new, stricter regulations or interpretations of existing regulations that would require additional expenditures and efforts on our part to ensure our compliance with such regulations or interpretations.
Accordingly, government actions in the future, including any decision not to continue to support recent economic reforms and to return to a more centrally planned economy or regional or local variations in the implementation of economic policies, could have a significant effect on economic conditions in China or particular regions thereof, and could require us to divest ourselves of any interest we then hold in Chinese properties or joint ventures.
Future inflation in China may inhibit our activity to conduct business in China.
In recent years, the Chinese economy has experienced periods of rapid expansion and widely fluctuating rates of inflation. During the past ten years, the rate of inflation in China has been as high as 20.7% and as low as -2.2%. These factors have led to the adoption by Chinese government, from time to time, of various corrective measures designed to restrict the availability of credit or regulate growth and contain inflation. High inflation may in the future cause Chinese government to impose controls on credit and/or prices, or to take other action, which could inhibit economic activity in China, and thereby harm the market for our products.
Restrictions on currency exchange may limit our ability to receive and use our revenues effectively.
The majority of our revenues will be settled in Renminbi and U.S. dollars, and any future restrictions on currency exchanges may limit our ability to use revenue generated in Renminbi to fund any future business activities outside China or to make dividend or other payments in U.S. dollars. Although the Chinese government introduced regulations in 1996 to allow greater convertibility of the Renminbi for current account transactions, significant restrictions still remain, including primarily the restriction that foreign-invested enterprises may only buy, sell or remit foreign currencies after providing valid commercial documents, at those banks in China authorized to conduct foreign exchange business. In addition, conversion of Renminbi for capital account items, including direct investment and loans, is subject to governmental approval in China, and companies are required to open and maintain separate foreign exchange accounts for capital account items. We cannot be certain that the Chinese regulatory authorities will not impose more stringent restrictions on the convertibility of the Renminbi.
The value of our securities will be affected by the foreign exchange rate between U.S. dollars and Renminbi.
The value of our common stock will be affected by the foreign exchange rate between U.S. dollars and Renminbi, and between those currencies and other currencies in which our sales may be denominated. For example, to the extent that we need to convert U.S. dollars into Renminbi for our operational needs and should the Renminbi appreciate against the U.S. dollar at that time, our financial position, the business of the company, and the price of our common stock may be harmed. Conversely, if we decide to convert our Renminbi into U.S. dollars for the purpose of declaring dividends on our common stock or for other business purposes and the U.S. dollar appreciates against the Renminbi, the U.S. dollar equivalent of our earnings from our subsidiaries in China would be reduced.
RISKS RELATED TO THE MARKET FOR OUR STOCK
Our common stock is quoted on the OTC Bulletin Board, which may have an unfavorable impact on our stock price and liquidity.
Our common stock is quoted on the OTC Bulletin Board under the symbol “WMDG.OB”. The OTC Bulletin Board is a significantly more limited market than the New York Stock Exchange or NASDAQ Stock Market. The quotation of our shares on the OTC Bulletin Board may result in a less liquid market available for existing and potential stockholders to trade shares of our common stock, could depress the trading price of our common stock and could have a long-term adverse impact on our ability to raise capital in the future.
We are subject to penny stock regulations and restrictions.
The SEC has adopted regulations which generally define so-called “penny stocks” as an equity security that has a market price less than $5.00 per share or an exercise price of less than $5.00 per share, subject to certain exemptions. As of December 14, 2006, the closing bid and asked prices for our common stock were $4.0 and $4.8 per share, respectively. As a “penny stock”, our common stock may become subject to Rule 15g-9 under the Exchange Act of 1934, or the “Penny Stock Rule.” This rule imposes additional sales practice requirements on broker-dealers that sell such securities to persons other than established customers and “accredited investors” (generally, individuals with a net worth in excess of $1,000,000 or annual incomes exceeding $200,000, or $300,000 together with their spouses). For transactions covered by Rule 15g-9, a broker-dealer must make a special suitability determination for the purchaser and have received the purchaser’s written consent to the transaction prior to sale. As a result, this rule may affect the ability of broker-dealers to sell our securities and may affect the ability of purchasers to sell any of our securities in the secondary market.
For any transaction involving a penny stock, unless exempt, the rules require delivery, prior to any transaction in a penny stock, of a disclosure schedule prepared by the SEC relating to the penny stock market. Disclosure also is required to be made about sales commissions payable to both the broker-dealer and the registered representative and current quotations for the securities. Finally, monthly statements are required to be sent disclosing recent price information for the penny stock held in the account and information on the limited market in penny stock.
There can be no assurance that our common stock will qualify for exemption from the Penny Stock Rule. In any event, even if our common stock were exempt from the Penny Stock Rule, we would remain subject to Section 15(b)(6) of the Exchange Act, which gives the SEC the authority to restrict any person from participating in a distribution of penny stock, if the SEC finds that such a restriction would be in the public interest.
Certain of our stockholders hold a significant percentage of our outstanding voting securities.
Mr. Jianquan Li owns 80.77% of our outstanding voting securities. As a result, he possesses significant influence, giving him the ability, among other things, to elect a majority of our Board of Directors and to authorize or prevent proposed significant corporate transactions. His ownership and control may also have the effect of delaying or preventing a future change in control, impeding a merger, consolidation, takeover or other business combination or discourage a potential acquirer from making a tender offer.
Certain provisions of our Articles of Incorporation may make it more difficult for a third party to effect a change- in-control.
Our Articles of Incorporation authorizes the Board of Directors to issue up to 5,000,000 shares of preferred stock. The preferred stock may be issued in one or more series, the terms of which may be determined at the time of issuance by the Board of Directors without further action by the stockholders. These terms may include voting rights including the right to vote as a series on particular matters, preferences as to dividends and liquidation, conversion rights, redemption rights and sinking fund provisions. The issuance of any preferred stock could diminish the rights of holders of our common stock, and therefore could reduce the value of such common stock. In addition, specific rights granted to future holders of preferred stock could be used to restrict our ability to merge with, or sell assets to, a third party. The ability of the Board of Directors to issue preferred stock could make it more difficult, delay, discourage, prevent or make it more costly to acquire or effect a change-in-control, which in turn could prevent our stockholders from recognizing a gain in the event that a favorable offer is extended and could materially and negatively affect the market price of our common stock.
Item 1B. Unresolved Staff Comments.
We filed a registration statement on Form SB-2 on December 19, 2005. We used Form SB-2 based on the fact that Winner Medical Group Inc., which at the time of the reverse acquisition of our subsidiary, Winner Group Limited, was a shell company, had revenues and public float of less than $25 million in 2005. The Staff of the SEC has informed us that we should have used Form S-1 instead of SB-2 for such registration statement because our acquisition of Winner Group Limited was treated as a reverse acquisition with Winner Group Limited being the accounting acquirer, and Winner Group Limited had revenues of more than $25 million in 2005. We plan to amend our registration statement on Form S-1 by the end of January 2004.
All land in China is owned by the State. Individuals and companies are permitted to acquire rights to use land or land use rights for specific purposes. In the case of land used for industrial purposes, the land use rights are granted for a period of 50 years. This period may be renewed at the expiration of the initial and any subsequent terms. Granted land use rights are transferable and may be used as security for borrowings and other obligations. We currently have land use rights to approximately 610,532 square meters consisting of manufacturing facilities, warehouses and office buildings in various parts of China, including Tianmen City, Shenzhen, Jingmen City, Zhijiang City, Jiayu County, Chongyang County and Huanggang. All fees for acquiring such land use rights have been paid off as of September 2006. Approximately 148,438.35 square meters of our facilities are subject to liens. In addition, we expect to acquire an additional 39,960 square meters in Chongyang County in July 2006. We also have entered into an agreement with the local government agency of Huanggang to acquire 314,222.40 square meters of land in Huanggang. We expect to receive the land use right certificate for this Huanggang property in 2007.
The following table summarizes our main facilities we owned as of September 30, 2006.
| Winner Medical Sub | | Location | | Size (Square Meters) |
Winner Shenzhen | | Winner Industrial Park, Bulong Road, Longhua, Shenzhen City, Guangdong Province, China. | | 29,064.49 |
Winner Jingmen | | Te 1 Hangkong Road, Pailou Town, Jingmen City, Hubei Province , China | | 40,542.35 |
Winner Tianmen | | No. 47 South Road of Jianshe, Yuekou Town of Tianmen City , Hubei Province. China | | 41,771.41 |
Winner Hubei | | No. 47 South Road of Jianshe, Yuekou Town, Tianmen City, Hubei Province. China | | 80,934.84 |
Winner Yichang | | No. 20 Jiangxia Avenue, Jiangkou Town, Zhijiang City, Hubei Province, China | | 24,448.14 |
Winner Chongyang | | Qingshan Park, Chongyang County, Hubei Province, China | | 33,133.50 |
Winner Jiayu | | No. 172 Phoenix Avenue, Yuyue Town, Jiayu County, Hubei Province, China | | 34,167.25 |
Winner Xishui | | Hongshan Industries Park, Qingquan Town, Xishui County, Hubei Province | | 31,283.00 |
Winner Huanggang | | Te 1, Chibi Avenue, Huanggang City, Hubei Province, China | | 295,187.70 |
Total | | | | 610,532.68 |
The following table summarizes our properties that are subject to mortgages as of September 30, 2006.
| Mortgagor/Borrower | | Location | | Mortgagee/Lender Bank | | Land Subject to Mortgage (sq. m) | | Structure Subject to Mortgage (sq. m_ |
| Winner Shenzhen | | Winner Industrial Park, Bulong Road, Longhua, Shenzhen City, Guangdong Province, China. | | Shenzhen Branch of Merchants Bank of China | | | | 18,808.09 |
| Winner Hubei | | No. 47 South Road of Jianshe, Yuekou Town, Tianmen City, Hubei Province. China | | Tianmen Branch of Industrial and commercial Bank of China | | 84,824.84 | | 44,805.42 |
Total | | 84,824.84 | | 63,613.51 |
In July 2005, we started the construction of a new manufacturing facility of approximately 39,960 square meters in Chongyang County, China. The first phase of the project was completed and the new weaving facility and its accessory facilities started operation in early January 2006. The second phase of the project, which involves the construction of the finished product facilities, was completed, and the facilities started operation in July 2006. The total investment for this project is approximately $1.8 million, which is funded through bank loans.
We entered into an agreement in 2005 with the local government agency of Huanggang to acquire 609,410 square meters (approximately 150.6 acres) of land, which we plan to dedicate primarily to the construction of 100% cotton spunlace nonwoven fabric production facilities. The land use right certificate for 295,187.70 square meters (approximately 72.9 acres) of this land was issued to us in November 2005. We expect the land use right certificate for the remaining land will be granted to us in 2007. As of September 30, 2006, the total investment for this project is approximately $8.21 million ($0.76 million in land, $3.71 million in facilities and $3.54 million in equipment, $0.2 million in other aspects). Funds for this project were raised in the equity market and through bank loans.
Some of our properties are leased from third parties. In most cases, the leased properties are dormitories or small operating spaces. In the remaining cases, the leased properties include manufacturing facilities and the use we are making of the land is in compliance with that relevant government authority’s land use planning. In a few cases, the lessors were unable to provide copies of documentation evidencing their rights to use the property leased to us. In the event of any future dispute over the ownership of the leased properties, we believe we could easily and quickly find replacement premises and dormitories so that the operations would not be affected.
Our subsidiaries Hubei Winner Textile Co., Ltd and Winner Medical & Textile Co., Ltd. Tianmen, were involved in an action brought by a resident group consisting of 388 residents residing at Jianshe South Road, Yuekou Town, Tianmen City, China against Tianfang Textile Factory and Hubei Tianfang Group Co. Ltd. in the Intermediate People’s Court of Hanjiang City, Hubei, China. The plaintiffs allege that Tianfang Textile Factory and Hubei Tianfang Group Co. Ltd. acquired the right to use certain land from the plaintiffs and failed to pay off the full amount of fees agreed upon by the parties. The Plaintiffs are seeking to recover a fee of approximately $930,000 (RMB 7,379,230) and requesting our subsidiaries to bear several and joint liabilities with the named defendants. Winner International Trading Company acquired the disputed land from Tianfang Textile Factory and Hubei Tianfang Group Co. Ltd. in 2000, and this land is currently occupied by Hubei Winner Textile Co., Ltd and Winner Medical & Textile Co., Ltd. Tianmen. On June 20, 2005, the intermediate court ruled against the plaintiffs. The plaintiffs appealed on June 30, 2005. On August 22, 2006, the plaintiffs withdrew their appeal.
Our subsidiary Chongyang Wenqiang Medical Treatment Materials Co., Ltd. or Chongyang Wenqiang liquidated on September 25, 2006. Chongyang Wenqiang’s business license expired on September 27, 2005 and our board of directors decided it was in our best interest not to continue the operation of Chongyang Wenqiang. Chongyang Wenqiang transferred parts of its assets and equipments to Winner Medical & Textile Ltd., Chongyang after the liquidation.
Our board of directors decided it was in our best interest to transfer all the business operations of our subsidiary Winner Medical International Trading Co., Ltd. or Winner Hong Kong to Winner Shenzhen. In April 2006, we stopped all the business operations of Winner Hong Kong and will file the liquidation of Winner Hong Kong in the next few months.
To our knowledge, no director, officer or affiliate of ours, and no owner of record or beneficial owner of more than five percent (5%) of our securities, or any associate of any such director, officer or security holder is a party adverse to us or has a material interest adverse to us in reference to pending litigation.
No matters were submitted to a vote of our security holders during the fourth quarter of 2006.
PART II
Item 5. Market for Registrant’s Common Equity, Related Stockholder Matters and Issuer Purchases of Equity Securities.
Market for Our Common Stock
Our common stock is quoted under the symbol “WMDG.OB” on the Over The Counter Bulletin Board. The CUSIP number is 517831103.
During 2005, we filed a request for clearance of quotations on the OTC Bulletin Board or OTCBB under Subsection (a)(5) of Rule 15c2-11 of the Securities Exchange Act of 1934, with NASD Regulation Inc. A clearance letter was issued to us on April 27, 2005 and we were issued a trading symbol “LVRC.OB.” As a result of a 1:1,500 reverse split of our common stock that became effective on October 26, 2005, our trading symbol on the OTC Bulletin Board was changed from “LVRC.OB” to “LVGC.OB.” On March 6, 2006, in connection with our name change from Las Vegas Resorts Corporation to Winner Medical Group Inc., our trading symbol was changed from “LVGC.OB” to “WMDG.OB.” The following table sets forth, for the periods indicated, the high and low bid prices for our common stock. These prices reflect inter-dealer prices, without retail mark-up, mark-down or commission, and may not represent actual transactions. The high and low quotations for the first quarter of fiscal year 2006 have been adjusted for the above mentioned 1:1,500 reverse stock split.
| | | High | | Low | |
| Fiscal 2005 - First quarter(8/1/04 to 10/31/04) | | | not available | | | | |
| Fiscal 2005 - Second quarter(11/1/04 to 1/31/04) | | | not available | | | | |
| Fiscal 2005 - Third quarter(2/1/05 to 4/30/05) | | | not available | | | | |
| Fiscal 2005 - Fourth quarter(5/1/05 to 7/31/05) | | $ | 0.03 | | $ | 0.008 | |
| Fiscal 2006 - First quarter(8/1/05 to 10/31/05) | | $ | 3.00 | | $ | 0.02 | |
| Fiscal 2006* - Second quarter(11/1/05 to 12/31/05) | | $ | 5.00 | | $ | 1.06 | |
| Fiscal 2006* - Second quarter(1/1/06 to 3/31/06) | | $ | 10.50 | | $ | 3.10 | |
| Fiscal 2006* - Third quarter (4/1/06 to 6/30/06) | | $ | 9.40 | | $ | 5.25 | |
| Fiscal 2006* - Fourth quarter (7/1/06 to 9/30/06) | | $ | 7.00 | | $ | 5.25 | |
*Our acquisition of Winner Group Limited is being accounted for as a reverse acquisition and Winner Group Limited is being treated as the accounting acquiror. Therefore, after the acquisition of Winner Group Limited on December 16, 2005, our fiscal year end became September 30, which is Winner Group Limited’s fiscal year end prior to the closing of the acquisition.
Reports to Stockholders
We plan to furnish our stockholders with an annual report for each fiscal year ending September 30 containing financial statements audited by our independent certified public accountants. Additionally, we may, in our sole discretion, issue unaudited quarterly or other interim reports to our stockholders when we deem appropriate. We intend to maintain compliance with the periodic reporting requirements of the Securities Exchange Act of 1934.
Approximate Number of Holders of Our Common Stock
On December 14, 2006, there were approximately 1,638 stockholders of record of our common stock.
Dividend Policy
Other than the dividends declared or paid by our subsidiary Winner Group Limited and the reverse stock split effected before the reverse acquisition transaction, we have never declared dividends or paid cash dividends. Our board of directors will make any future decisions regarding dividends. We currently intend to retain and use any future earnings for the development and expansion of our business and do not anticipate paying any cash dividends in the foreseeable future.
Recent Sales of Unregistered Securities
On December 16, 2005, we issued 42,280,840 shares of our common stock to stockholders of Winner Group Limited. The issuance of our shares to these individuals was made in reliance on the exemption provided by Section 4(2) of the Securities Act for the offer and sale of securities not involving a public offering and regulation D promulgated thereunder.
On December 16 2005, we completed a private placement in which we sold 793,260 shares of our common stock to certain of our employees and suppliers at a price of $2.017 per share for aggregate gross proceeds of $1,600,000. The shares were offered and sold to investors in reliance upon exemptions from the registration requirements of the Securities Act pursuant to Regulation S thereunder.
On November 4, 2005, we settled a $60,000 note payable to Glenn Little by the issuance of 240,000 shares of unregistered, restricted common stock in reliance on the exemption provided by Section 4(2) of the Securities Act for the offer and sale of securities not involving a public offering.
On November 4, 2005, we consummated a private placement of common stock with Halter Financial Investments, L.P. for the sale of 1,070,000 shares of unregistered, restricted common stock for $267,500 in cash in reliance on the exemption provided by Section 4(2) of the Securities Act for the offer and sale of securities not involving a public offering.
In instances described above where we issued securities in reliance upon Regulation D, we relied upon Rule 506 of Regulation D of the Securities Act. These stockholders who received the securities in such instances made representations that (a) the stockholder is acquiring the securities for his, her or its own account for investment and not for the account of any other person and not with a view to or for distribution, assignment or resale in connection with any distribution within the meaning of the Securities Act, (b) the stockholder agrees not to sell or otherwise transfer the purchased shares unless they are registered under the Securities Act and any applicable state securities laws, or an exemption or exemptions from such registration are available, (c) the stockholder has knowledge and experience in financial and business matters such that he, she or it is capable of evaluating the merits and risks of an investment in us, (d) the stockholder had access to all of our documents, records, and books pertaining to the investment and was provided the opportunity ask questions and receive answers regarding the terms and conditions of the offering and to obtain any additional information which we possessed or were able to acquire without unreasonable effort and expense, and (e) the stockholder has no need for the liquidity in its investment in us and could afford the complete loss of such investment. Management made the determination that the investors in instances where we relied on Regulation D are Accredited Investors (as defined in Regulation D) based upon management’s inquiry into their sophistication and net worth. In addition, there was no general solicitation or advertising for securities issued in reliance upon Regulation D.
In instances described above where we indicate that we relied upon Regulation S promulgated under the Securities Act in issuing securities, our reliance was based upon the following factors (a) each subscriber was neither a U.S. person nor acquiring the shares for the account or benefit of any U.S. person, (b) each subscriber agreed not to offer or sell the shares (including any pre-arrangement for a purchase by a U.S. person or other person in the United States) directly or indirectly, in the United States or to any natural person who is a resident of the United States or to any other U.S. person as defined in Regulation S unless registered under the Securities Act and all applicable state laws or an exemption from the registration requirements of the Securities Act and similar state laws is available, (c) each subscriber made his, her or its subscription from the subscriber’s residence or offices at an address outside of the United States and (d) each subscriber or the subscriber’s advisor has such knowledge and experience in financial and business matters that the subscriber is capable of evaluating the merits and risks of, and protecting his interests in connection with an investment in us.
In instances described above where we indicate that we relied upon Section 4(2) of the Securities Act in issuing securities, our reliance was based upon the following factors: (a) the issuance of the securities was an isolated private transaction by us which did not involve a public offering; (b) there were only a limited number of offerees; (c) there were no subsequent or contemporaneous public offerings of the securities by us; (d) the securities were not broken down into smaller denominations; and (e) the negotiations for the sale of the stock took place directly between the offeree and us.
Item 6. Selected Financial Data
The selected consolidated statement of income and comprehensive income data for the years ended September 30, 2004, 2005 and 2006 and the selected balance sheet data as of September 30, 2004, 2005 and 2006 are derived from our audited consolidated financial statements included elsewhere in this Report. The selected consolidated financial data for the year ended September 30, 2003 is derived from our audited consolidated financial statements not included in this Report. The selected consolidated financial data for the year ended September 30, 2002 is derived from our unaudited consolidated financial statements that are not included in this Report.
The following selected historical financial information should be read in conjunction with our consolidated financial statements and related notes and the information contained in Item 7. “Management’s Discussion and Analysis of Financial Condition and Results of Operations.”
| | | Year Ended September 30, | |
| | | 2002 | | 2003 | | 2004 | | 2005 | | 2006 | |
Statement of operations data: | | | | | | | | | | | |
| Sales Revenues: | | $ | 20,325,089 | | $ | 31,750,491 | | $ | 44,281,465 | | $ | 58,357,129 | | $ | 63,873,058 | |
| Cost of Sales | | | 14,578,733 | | | 22,990,021 | | | 32,814,282 | | | 42,059,663 | | | 46,335,354 | |
| | | | | | | | | | | | | | | | | |
| Gross profit | | | 5,746,356 | | | 8,760,470 | | | 11,467,183 | | | 16,297,466 | | | 17,537,704 | |
| | | | | | | | | | | | | | | | | |
| Expenses: | | | | | | | | | | | | | | | | |
| Administrative expenses | | | 1,543,793 | | | 2,668,786 | | | 2,142,340 | | | 3,536,218 | | | 5,619,590 | |
| Amortization and depreciation | | | 344,402 | | | 316,004 | | | 383,540 | | | 448,787 | | | 726,816 | |
| Other operating expenses | | | 1,163,216 | | | 2,321,042 | | | 1,655,237 | | | 3,085,624 | | | 4,892,774 | |
| Provision for doubtful debt | | | 36,175 | | | 31, 740 | | | 103,563 | | | 1,807 | | | 25,789 | |
| Selling expenses | | | 2,409,351 | | | 3,473,823 | | | 4,488,256 | | | 5,294,557 | | | 5,689,627 | |
| | | | | | | | | | | | | | | | | |
| Total expenses | | | 3,953,144 | | | 6,142,609 | | | 6,630,596 | | | 8,830,775 | | | 11,335,006 | |
| | | | | | | | | | | | | | | | | |
| Income from continuing operations before taxes | | | 1,526,880 | | | 2,446,260 | | | 4,681,760 | | | 8,362,388 | | | 6,326,690 | |
| Income taxes | | | 164, 566 | | | 115,118 | | | 285,462 | | | 446,146 | | | 516,635 | |
| | | | | | | | | | | | | | | | | |
| Net income | | | 1,206,739 | | | 2,322,761 | | | 4,391,491 | | | 7,892,670 | | | 5,829,294 | |
| | | | | | | | | | | | | | | | | |
| Earnings per share — basic and diluted* | | $ | 0.03 | | $ | 0.06 | | $ | 0.12 | | $ | 0.21 | | $ | 0.14 | |
| | | | | | | | | | | | | | | | | |
Weighted average number of shares outstanding — basic | | | 36,991,105 | | | 36,991,105 | | | 36,991,105 | | | 36,991,105 | | | 45,053,212 | |
| —diluted | | | 36,991,105 | | | 36,991,105 | | | 36,991,105 | | | 36,991,105 | | | 43,061,546 | |
| | | | | | | | | | | | | | | | | |
| Cash dividend declared per common share | | | | | | | | | | | | | | | | |
| | | | | | | | | | | | | | | | | |
Cash flows data: | | | | | | | | | | | | | | | | |
| Net cash flows provided by operating activities | | $ | 1,333,982 | | $ | 2,344,591 | | $ | 5,510,556 | | $ | 4,340,034 | | $ | 10,306,780 | |
| Net cash flows used in investing activities | | | (6,633,211 | ) | | (3,167,838 | ) | | (8,057,982 | ) | | (3,089,900 | ) | | (13,676,919 | ) |
| Net cash flows used in financing activities | | | 4,733,584 | | | 2,086,055 | | | 2,465,411 | | | (268,782 | ) | | 5,046,022 | |
| | | September 30, | |
| | | 2002 | | 2003 | | 2004 | | 2005 | | 2006 | |
Balance sheet data: | | | | | | | | | | | |
| Cash and cash equivalents | | $ | 363,338 | | $ | 1,626,146 | | $ | 1,544,131 | | $ | 2,650,867 | | $ | 4,319,579 | |
| Working capital | | | (2,753,925 | ) | | 3,494,479 | | | 2,522,777 | | | 7,160,711 | | | 15,097,981 | |
| Total assets | | | 31,605,257 | | | 39,225,956 | | | 44,812,790 | | | 54,223,425 | | | 67,154,414 | |
| | | | | | | | | | | | | | | | | |
| Total liabilities | | | 14,318,115 | | | 15,038,182 | | | 16,228,717 | | | 18,704,409 | | | 14,739,446 | |
| | | | | | | | | | | | | | | | | |
| Total stockholders’ equity | | | 16,330,425 | | | 23,222,677 | | | 27,614,169 | | | 34,354,830 | | | 52,265,472 | |
Item 7. Management’s Discussion and Analysis of Financial Condition and Results of Operations.
Overview
Winner Medical’s business operations consist of the research and development, manufacturing and marketing of medical dressings and medical disposables products. We have eight wholly owned manufacturing and distribution facilities, two joint venture factories, and one trading company; and we have established several integrated manufacturing and processing lines for our core products. Our product offerings include surgical dressings, dressing packs, wound care dressings, protective products, medical instruments, dental products, hygiene products and home care products. We manufacture our products in China and sell them both in China and abroad in other countries and areas such as Japan, Germany, Italy, the Netherlands, the United Kingdom, Australia, France, South America, China, Africa, the Middle East and the United States. We are certified ISO9001, ISO2000, ISO13485 and CE by TUV PS in Germany for quality control system.
The following analysis discusses changes in the financial condition and results of operations at and for years ended on September 30, 2006, 2005 and 2004, and should be read in conjunction with our audited consolidated financial statements and the notes thereto include elsewhere in this Report.
Our Company History
Winner Medical Group Inc. (formerly known as Birch Enterprises, Inc., HDH Industries, Inc. and Las Vegas Resorts Corporation) was originally incorporated in the State of Nevada in August 1986. From July 1993 until late 2005, our immediate predecessor, Las Vegas Resorts Corporation, and its predecessors had no meaningful business operations.
On December 16, 2005, Winner Medical Group Inc. and Winner Group Limited entered into a share exchange agreement pursuant to which the stockholders of Winner Group Limited were issued 42,280,840 shares of our common stock in exchange for all 1,143,000 shares of Winner Group Limited that were issued and outstanding as of December 16, 2005. In connection with the acquisition transaction, Winner Group Limited became our wholly owned subsidiary. Even though, from a legal perspective, Winner Medical Group Inc. was the acquirer in this transaction, Winner Group Limited is treated the acquirer from an accounting perspective.
Winner Medical Group Inc. presently conducts its business operations through its operating subsidiaries located in China and elsewhere.
Our Business Operations
Winner Medical’s present business operations commenced February 1991 and involve the manufacture and marketing of our products primarily out of our facilities in China. We generate revenues through the domestic (China) and foreign sale of a variety of medical dressings and medical disposables products, such as dressing packs, wound care dressings, protective products, medical instruments, dental products, hygiene products and home care products. Nearly 90% of our products were sold to approximately 80 different countries outside of China in fiscal 2006. Based on the information reported by China Medical Economic News, China exported $534 million of medical disposables products in calendar year 2005, an increase of 19.45% compared with calendar year 2004. Our total product export valued $54.3 million in 2005 and accounted for approximately 10% of the total export value of medical dressings and medical disposables from China. According to the medical dressing export data in the China Year Book 2000-2005, we held this share of the market since 2004. In 2005, we were the largest exporter by volume in China in the medical dressing industry according to the China Chamber of Commerce for Import & Export of Medicines & Health Products. Based on this market information, we believe we are the leading manufacturer of medical dressings and medical disposables products in China.
We have integrated manufacturing lines that provide our clients with the ability to procure certain products from a single supplier. In the developed countries where we sell our products, we also operate on an OEM basis (whereby we provide our customers with a customized product that is then sold by the customer under its brand name) by providing our OEM customers with our specialized design, manufacturing and packaging services. OEM sales have accounted for approximately 75% of our sales revenue. When we work on this basis, our clients are able to select the design, size, type and scale of the products we manufacture for them.
Industry Wide Trends that are Relevant to Our Business
The medical dressings and medical disposables manufacturing market is continually evolving due to technological advances and new demands in the healthcare industry. We believe the trends in the industry towards improving medical care and patient conditions, changes in patient treatment approaches and technological advances will impact favorably on the demand for our products. We anticipate that these factors will result in growth in sales of medical dressings and medical disposables products and increased revenues for us.
The export of medical dressings and medical disposables products from China has grown rapidly over the last few years. In 2005, medical disposables products valued at $534 million were exported, an increase of 19.45% compared with 2004. Our total product export valued $54.3 million in 2005 and accounted for approximately 10% of the total export value of medical dressings and medical disposables from China. We believe that our sales over the next five years will grow in correlation to the growth of medical dressings and medical disposables exports volume from China.
One main factor that management considers when estimating our future growth is the potential for revenues from new product sales. We launched our new self-adhesive bandage product in the first fiscal quarter of 2006 and the sales revenue from this product was approximately $1.5 million from the first fiscal quarter to September 2006. We expect that the sales of this new product will increase in the future. Our spunlace cotton nonwoven products will enter the market in the first quarter of calendar year 2007. We expect these new products to be strong growth vehicles for the company going forward. The spunlace cotton nonwoven process (“PurCottonTM”) is patented in more than 30 countries. This product combines the superior characteristics of both natural cotton and materials made using nonwoven technology. It has many advantages over woven cotton or synthetic nonwoven fabric, such as it is natural, safe, healthy, environmentally friendly, of higher quality and lower cost. We expect our new PurCotton products to gradually supersede our gauze products. We have installed two manufacturing lines, which are currently in the pre-manufacturing testing stage, and plan to launch this new product by January 2007.
The medical dressings and medical disposables market is also subject to consumption patterns and trends. One such trend or consumption pattern relates to the age demographics of the end users of our products. On average, the population is aging and life spans are generally increasing. As the general population begins to include a larger percentage of older people, we anticipate that more medical care will be required, and that will result in increased sales of our products.
Another trend or consumption pattern in our industry is that hospitals are increasingly seeking to reduce their costs. One method hospitals employ to reduce costs is to seek alternative products that increase efficiency or reduce labor costs. For example, disposable catheters may reduce the need for frequent changes of diapers and bed sheets. Other popular disposable products used by hospitals to reduce operating costs include Eustachian tubes and needles, disposable clothing and accessories. We believe the demand for cost effective products and healthcare solutions and an increasing emphasis on health in the U.S. and EU will bring an increase in the demand for medical instruments, medical dressings and medical disposables products.
Also affecting our industry is the growing trend towards protecting the environment. Consumers are becoming increasingly concerned about the environmental impact of the products they buy. Nonwoven medical dressings, medical instruments and medical disposables products usually contain materials like rubber and polyester, which may result in restrictions on these products under environmental protection regulations and may negatively affect sales of these products. We believe this trend will benefit us in competing with our competitors because our new PurCotton products are primarily made of natural cotton, which is an environmentally friendly raw material, and our new nonwoven fabric manufacturing capabilities enables us to make our new products with natural cotton at lower costs.
We also believe that there is a trend in our industry that is resulting in the geographical shift in product manufacturing from countries with high labor and manufacturing costs to countries, such as China, where labor and manufacturing costs are generally lower. As a result of the lower cost structure and rapid development of the Chinese economy, we are seeing more foreign multinational companies are entering the Chinese market to produce their goods and China’s emergence as part of the global production and supply chain for large multinational corporations. Simultaneously, we believe that the worldwide perception of the quality level of Chinese products is improving. We anticipate that this trend of large multinational companies seeking to produce their products in China will benefit us, especially since our main business model is to act on an OEM basis. In addition, we are currently negotiating with several large companies in the industry (in developed countries) to outsource some of their production lines.
Finally, we estimate that China’s current annual exports of medical dressings and medical disposables products still account for a small percentage of total world market demand. Therefore, we believe there is a significant opportunity to expand China’s export volume in this area. Recognizing this opportunity, the Chinese government is encouraging domestic companies that manufacture medical dressings and medical disposables to increase their export activities. Our view is that this presents a significant opportunity for us.
Competition
We compete based upon manufacturing capacity, product quality, product cost, ability to produce a diverse range of products and logistical capabilities.
We encounter significant competition from within China and throughout the world. Some of our competitors have greater financial resources, larger human resources, and more established market recognition in both domestic and international markets than do we. We believe that our China-based competitors have lower labor costs, but their products often lack diversity. With respect to our competitors located outside of China, we believe that competitors in India generally utilize older equipment to manufacture their products, resulting in lower product quality. Our competition in Europe and the Americas may have a geographic advantage in the EU and U.S. markets, but we believe they are generally manufacturing on a smaller scale, have less product diversity and higher production costs.
This level of competition puts pressure on the sales prices of our products, which results in lower margins for us.
Recent Development
In October 2006, we merged our subsidiary Hubei Winner Textiles Co., Ltd. with and into another subsidiary Winner Medical & Textile Ltd. Tianmen or Winner Tianmen, with Winner Tianmen as the surviving company. The merger was conducted for the sole purpose of improving the operation efficiency and reducing the operation and management costs.
Results of Operations
Comparison for the Year Ended September 30, 2006 and 2005
The following sets forth certain of our income statement information for the years ended September 30, 2005 and 2006.
| | | YEAR ENDED 9/30/06 | | YEAR ENDED 9/30/05 | |
Item | | In Millions | | As a Percentage | | In Millions | | As a Percentage | |
| Sales Revenue | | $ | 63.87 | | | 100 | % | $ | 58.36 | | | 100 | % |
| Other revenue | | $ | 0.19 | | | 0.30 | % | $ | 0.3 | | | 0.52 | % |
| Costs of Goods Sold | | $ | 46.34 | | | 72.55 | % | $ | 42.06 | | | 72.07 | % |
| Total operating fees | | $ | 11.34 | | | 17.75 | % | $ | 9.30 | | | 15.94 | % |
| Investment yields | | $ | 0.05 | | | 0.08 | % | $ | 1.06 | | | 1.82 | % |
| Income tax | | $ | 0.52 | | | 0.82 | % | $ | 0.46 | | | 0.79 | % |
| Minority interest | | $ | 0.02 | | | 0.04 | % | $ | 0.02 | | | 0.04 | % |
| Net income | | $ | 5.83 | | | 9.13 | % | $ | 7.89 | | | 13.52 | % |
Sales Revenue
Sales revenue increased $5.51 million, or 9.45% to $63.87 million for the year ended September 30, 2006 from $58.36 million for the year ended on September 30, 2005. This increase was mainly attributable to the increase of our manufacturing capacity, the market expansion and our efforts to promote our new products, such as the self-adhesive and elastic bandage products.
Our new self-adhesive and elastic bandage products entered into the market in January 2006. As of September 30, 2006, revenue from these products reached approximately $1.5 million. We plan to launch our nonwoven cotton spunlace products in January 2007 and expect this group of products to become one of our main revenue drivers.
Sales by Region
The following table illustrates the sales revenues from the major geographic areas in which we sell our products for the years ended September 30, 2006 and 2005. The table also provides the percentage of total revenues represented by each listed region.
All amounts, other than percentages, in millions of U.S. dollars
| | | Year Ended on 9/30/06 | | Percentage of Total Revenues | | Year Ended on 9/30/05 | | Percentage of Total Revenues | |
| Europe | | $ | 25.01 | | | 39.16 | % | $ | 22.39 | | | 38.37 | % |
| Japan | | $ | 16.65 | | | 26.06 | % | $ | 15.12 | | | 25.91 | % |
| North America | | $ | 7.62 | | | 11.93 | % | $ | 7.50 | | | 12.85 | % |
| China | | $ | 7.78 | | | 12.18 | % | $ | 6.94 | | | 11.89 | % |
| Other | | $ | 6.81 | | | 10.67 | % | $ | 6.41 | | | 10.98 | % |
| Total | | $ | 63.87 | | | 100.00 | % | $ | 58.36 | | | 100.00 | % |
Cost of Goods Sold
Our cost of goods sold increased $4.28 million to $46.34 million for the year ended September 30, 2006 from $42.06 million during the year ended September 30, 2005. As a percentage of net revenues, the cost of goods sold increased 0.48% to 72.55% in the year ended September 30, 2006 from 72.07% in the year ended September 30, 2005. The increase was mainly attributable to the increase in the markup of the cost of labor and energy.
Gross Profits
Our gross profit increased $1.23 million to $17.53 million for the year ended September 30, 2006 from $16.30 million for the year ended September 30, 2005. Gross profit as a percentage of net revenues was 27.45% for the year ended September 30, 2006, as compared to 27.93% during the year ended September 30, 2005. The decrease in gross profit as a percentage of net revenue was mainly due to the increase of direct labor and energy expense, and approximately 2.3% appreciation of RMB against the U.S. dollar from fiscal year 2005 to 2006.
The following table illustrates the gross profits from each product types for the years ended September 30, 2006 and 2005. The table also provides the percentage of total gross profits represented by each product type.
All amounts, other than percentages, in millions of U.S. dollars
| | | Year Ended on 9/30/06 | | Percentage of Total Gross Profits | | Year Ended on 9/30/05 | | Percentage of Total Gross Profits | |
| Sterilized Products | | $ | 7.44 | | | 42.44 | % | $ | 3.27 | | | 20.07 | % |
| Non-sterilized Products | | $ | 8.33 | | | 47.51 | % | $ | 10.62 | | | 65.16 | % |
| Self-adhesive and Elastic Bandage Products | | $ | 0.49 | | | 2.75 | % | | - | | | | |
| Other Products | | $ | 1.28 | | | 7.3 | % | $ | 2.41 | | | 14.77 | % |
| Total | | $ | 17.53 | | | 100.00 | % | $ | 16.30 | | | 100.00 | % |
Selling Expenses
Our selling expenses increased $0.4 million to $5.69 million for the year ended September 30, 2006 from $5.29 million for the year ended September 30, 2005. As a percentage of net revenues, our selling expenses decreased to 8.91% for the year ended September 30, 2006 from 9.07% for the year ended September 30, 2005. This dollar increase was primarily attributable to increased sales volume, expansion of our sales staff, and an increase in freight costs.
Administrative Costs
Our administrative expenses increased $2.04 million, or 38%, to $5.60 million for the year ended September 30, 2006 from $3.54 million for the year ended September 30, 2005. As a percentage of net revenues, administrative expenses increased to 8.79% for the year ended September 30, 2006 from 6.07% for the year ended September 30, 2005. This increase was primarily attributable to an approximately $1 million expenditure in connection with maintaining our public reporting company status in the fiscal year 2006, and increased research and development investment.
We are the in the process of implementing the SAP ERP system and hired IBM as our consultant for such implementation. We are also working on improving our internal control system to ensure the compliance with SOX 404. As a result, we expect that our administrative costs will continue to increase until we fully implement our new accounting system and implement SOX 404.
Transportation Costs
At present, we perform nearly all of our finished product manufacturing at our Shenzhen, China based manufacturing facilities. Our facilities in Hubei provide semi-finished products to the Shenzhen facilities, where the products are finished. We export our products to the overseas markets from our Shenzhen facilities. Therefore, there are two important elements of transportation costs that affect us: one is the transportation cost between our Hubei production facilities and our Shenzhen production facilities, and the other is the cost to export our products to destinations outside of China. Our domestic land transportation costs (i.e., transportation costs within China) were $480,000 (0.76% of total sales) and $520,000 (0.89% of total sales) in fiscal years 2006 and 2005, respectively. Our export transportation costs were $3,570,000 (5.59% of total sales) and $3,430,000 (5.88% of total sales) in fiscal years 2006 and 2005, respectively. Our export transportation fees increased by $140,000 from 2005 to 2006 or approximately 4.09%. This dollar increase in the export transportation fees was mainly due to the increase of sales volume and the increase of transportation fee.
Environmental Laws Compliance Costs
We spent approximately $11,800 and $5,500 for environmental compliance costs in fiscal years 2006 and 2005, respectively. The increase was attributable to planting trees and flowers in our new facilities in 2006, and the increase of the environmental laws compliance fees paid to the PRC government pursuant to applicable PRC environmental laws and regulations.
Financial Costs
Financial expenses decreased to approximately $270,000 (0.43% of the total revenue) for the year ended September 30, 2006 as compared to approximately $470,000 (0.8% of total revenue) for the same period of 2005, a decrease of approximately $200,000 or 42.56%. Our financial expenses consist of interest expenses related to bank loans which are primarily used to construct or purchase manufacturing facilities and equipment and to improve our production capacity. The percentage decrease of financial costs was mainly attributable to the decrease of the total amount of the bank loans.
Gain on Disposal of a Subsidiary
In 2005, we sold 60% of our equity interest in our subsidiary Winner Medical & Textile Ltd., Xishui or Winner Xishui to Lohman & Rauscher Limited which resulted in a one time after-tax income of $1.05 million.
Income taxes
Enterprises income tax in PRC is generally charged at 33%, in which 30% is for national tax and 3% is for local tax, of the assessable profit. All the subsidiaries of the Company in PRC have applied for the exemption for the local tax. For foreign investment enterprises established in a Special Economic Zone or Coastal Open Economic Zone, where the subsidiaries of the Company are located, and which are engaged in production-oriented activities, the national tax rate could be reduced to 15% or 24% respectively. The Company’s subsidiaries incorporated in PRC are subject to PRC enterprises income tax at the applicable tax rates on the taxable income as reported in their Chinese statutory accounts in accordance with the relevant enterprises income tax laws applicable to foreign enterprises. Pursuant to the same enterprises income tax laws, the subsidiaries are fully exempted from PRC enterprises income tax for two years starting from the first profit-making year, followed by a 50% tax exemption for the next three years. For those foreign enterprises established in the middle west of PRC, a 50% tax exemption is granted for a further three years after the tax holiday and concession stated above. On the other hand, export-oriented enterprise, which exports sales contributed over 70% of the total sales, can enjoy a lower tax rate of 10%.
According to the PRC’s applicable income tax laws, regulations, notices and decisions related to foreign investment enterprises and their investors, income such as dividends and profits distribution from the PRC derived from a foreign enterprise which has no establishment in the PRC is subject to a 10% withholding tax.
Foreign enterprises in Shenzhen, PRC, are also eligible for a refund of tax paid for 40% of the purchase amount of domestic machinery in that year, if the enterprises income tax for the year of acquisition is higher than that of the previous year and if those invested projects are encouraged by the government. The maximum tax deduction is 5 years. For example, our subsidiaries of Shenzhen and Huang Gang can enjoy this tax exemption.
Foreign-invested enterprises in China are eligible for a refund of tax paid equal to 40% of the reinvestment of profit. Being an export originated and high-technology enterprise, Winner Shenzhen is eligible for a 100% tax refund for its reinvestment of profits. On the other hand, export-oriented enterprise, which exports sales contributed over 70% of the total sales, can enjoy refund of 100% tax paid.
In 2006, Shenzhen Bureau of Science Technology & Information formally recognized Winner Industries (Shenzhen) Co., Ltd. as a High- technology Enterprise, which gives Winner Shenzhen a 50% tax exemption till 2009 and a 50% tax drawback from 2010 to 2011.
Our income tax provision for year ended September 30, 2006 was $516,635 as compared to $446,146 for the year ended September 30, 2005.
Minority Interest
Our financial statements reflect an adjustment to our consolidated group net income equal to $19,239 and ($23,572) in the fiscal years 2006 and 2005, respectively, reflecting the minority interests held by third parties in two of our subsidiaries (45% in Chongyang Wenqiang Medical Treatment Materials Co., Ltd. and 40% in Shanghai Winner Medical Apparatus Co., Ltd.).
Net income (profit after taxes)
Net profit decreased to approximately $5.83 million for the year ended September 30, 2006 as compared to approximately $7.89 million for the same period of 2005, a decrease of approximately $2.06 million or approximately 26%. Such decrease is mainly attributable to a one-time gain of $1.05 million from selling 60% of our equity interest in Winner Xishui in 2005 and the increase of our cost of labor and energy in 2006. In addition, we completed the reverse merger of Winner Group Limited in December 2005 and, as a result, we incurred approximately $1 million for maintaining our public reporting company status in the fiscal year 2006. We also incurred costs for developing and marketing our new product PurCotton which is expected enter into the market in January 2007 and have not yet generated any revenue.
Foreign Currency Translation Expenses
We incurred a foreign currency translation expense equal to $857,313 and $720,741 in the fiscal years 2006 and 2005, respectively. In July 21, 2005, China reformed its foreign currency exchange policy, resulted an appreciation of RMB against USD by 2.1 percent during a very short period of time. As of September 30, 2006, the accumulated appreciation of RMB against U.S. dollar is approximately 5%. As a result, we implemented different exchange rates in translating RMB into U.S. dollar in our financial statements for fiscal years 2006 and 2005. In fiscal year 2006, the exchange rates of 7.9087, 8.277 and 8.0004 were implemented in calculating the total assets/liabilities, shareholders’ equity and profit and loss, as compared to the exchange rates of 8.0922, 8.277 and 8.1846 in fiscal year 2005, respectively.
Inventory turnover
Our inventory increased to approximately $11.33 million for the year ended September 30, 2006 as compared to approximately $10.48 million for the same period of 2005, an increase of approximately $0.85 million or 8.11%. Our inventory turnover was 4.25 and 4.38 in fiscal years 2006 and 2005, respectively. The relatively low inventory turnover was mainly due to our integrated manufacturing process. In order to control product quality and maintain a stable supply chain, our subsidiaries take different roles in the manufacturing processes and constitute a whole production line from raw materials to semi-finished products, then to final products. This arrangement increased our inventory and lowered our inventory turnover.
Accounts receivable collection period
Accounts receivable decreased to approximately $7.51 million for the year ended September 30, 2006 as compared to approximately $8.26 million for the same period of 2005, a decrease of approximately $0.75 million or 9.08%. Our average accounts receivable collection period was 44.44 days and 42.59 days in fiscal years 2006 and 2005, respectively. Our short accounts receivable collection period is primarily attributable to our customer credit control system. In terms of the payment methods used by our international customers, based on our historical record, Letters of Credit, Documents Against Payments, T/T, and D/A generally accounted for approximately 40%, 40%, 15% and 5% of our settled payments, respectively.
Comparison for the Year Ended September 30, 2005 and 2004
The following table summarizes the results of our operations during the fiscal years ended September 30, 2005 and 2004 and provides information regarding the dollar and percentage increase or (decrease) from the 2004 fiscal period to the 2005 fiscal period:
All amounts, other than percentages, in millions of U.S. dollars
| | | YEAR ENDED 9/30/05 | | YEAR ENDED 9/30/04 | |
Item | | In Millions | | As a Percentage | | In Millions | | As a Percentage | |
| Sales Revenue | | $ | 58.36 | | | 100 | % | $ | 44.28 | | | 100 | % |
| Other revenue | | $ | 0.3 | | | 0.52 | % | $ | 0.3 | | | 0.68 | % |
| Costs of Goods Sold | | $ | 42.06 | | | 72.07 | % | $ | 32.81 | | | 74.10 | % |
| Total operating fees | | $ | 9.30 | | | 15.94 | % | $ | 7.09 | | | 16.02 | % |
| Investment yields | | $ | 1.06 | | | 1.82 | % | | - | | | | |
| Income tax | | $ | 0.46 | | | 0.79 | % | $ | 0.29 | | | 0.66 | % |
| Minority interest | | $ | 0.02 | | | 0.04 | % | $ | 0.00 | | | | |
| Net income | | $ | 7.89 | | | 13.52 | % | $ | 4.39 | | | 9.92 | % |
Sales Revenue
Our total revenue in fiscal year 2005 amounted to $58.36 million, which is $14.08 million or almost 31.80% more than that of fiscal year 2004, where we had revenues of $44.28 million. This increase in our revenue is mainly the result of increases in manufacturing capacity.
Sales by Region
The following table illustrates the sales revenues from the major geographic areas in which we sell our products for each of the last two fiscal years. The table also provides the percentage of total revenues represented by each listed region.
All amounts, other than percentages, in millions of U.S. dollars
| | | 2005FY | | Percentage of Total Revenues | | 2004FY | | Percentage of Total Revenues | |
| Europe | | $ | 22.39 | | | 38.37 | % | $ | 16.95 | | | 38.28 | % |
| Japan | | $ | 15.12 | | | 25.91 | % | $ | 13.43 | | | 30.33 | % |
| North America | | $ | 7.50 | | | 12.85 | % | $ | 5.37 | | | 12.13 | % |
| China | | $ | 6.94 | | | 11.89 | % | $ | 2.59 | | | 5.85 | % |
| Other | | $ | 6.41 | | | 10.98 | % | $ | 5.94 | | | 13.41 | % |
| Total | | $ | 58.36 | | | 100.00 | % | $ | 44.28 | | | 100.00 | % |
Cost of Goods Sold
Our cost of goods sold in fiscal years 2005 and 2004 was $42.06 million and $32.81 million, respectively, which accounts for 72.07% and 74.10%, respectively, as a percentage of total revenues. The dollar amount of the costs of goods sold increased with the growth of annual sales, while its percentage of annual sales declined each year by about 2%. This improvement is attributable to cost control initiatives that we implemented, which resulted in an annual improvement in gross margin.
Selling Expenses
Selling expenses in 2005 were $5.29 million, which was $810,000, or nearly 18%, more than the $4.49 million in selling expenses in 2004. Most of our products were sold into the international market through the OEM model. OEM clients purchase products directly from us. This type of direct procurement accounted for more than 75% of our total sales. The remainder of our products is sold through sales agents (similar to manufacturers’ representatives) who are paid a commission on the sales they generate. As a result, we have not invested heavily in establishing overseas sales channels or in product promotion. The main method we use to promote our products is participation in international trade exhibitions. Therefore, our marketing expenses are relatively low compared to those of our competitors, who sell directly to healthcare providers and other end users.
Transportation Costs
During 2005 and 2004, we perform nearly all of our finished product manufacturing at our Shenzhen, China based manufacturing facilities. Our facilities in Hubei provide semi-finished products to the Shenzhen facilities, where the products are finished. We export our products to the overseas markets from our Shenzhen facilities. Therefore, there are two important elements of transportation costs that affect us: one is the transportation cost between our Hubei production facilities and our Shenzhen production facilities, and the other is the cost to export our products to destinations outside of China. Our domestic land transportation costs (i.e., transportation costs within China) were $420,000 (0.89% of total sales) and $350,000 (0.78% of total sales) in fiscal years 2005 and 2004, respectively. Our export transportation costs were $3,430,000 (5.88% of total sales) and $2,640,000 (5.96% of total sales) in fiscal years 2005 and 2004, respectively. Our export transportation fees increased by $790,000 from 2004 to 2005, or approximately 30%, which is in line with the increase in our revenues.
Administrative Costs
Our administrative expenses were $3,540,000 (6.06% of total sales) and $2,140,000 (4.84% of total sales) in fiscal years 2005 and 2004, respectively. We have significantly expanded the scale of our operations and there was a corresponding increase in administrative expenses; however, our administrative expenses remained at approximately 5% to 6% of total sales. The administrative expenses are primarily related to research and development expenses, salaries, fringe benefits for management level staff and daily office expenses. In fiscal year 2005, administrative expenses grew because of a decision to invest more in our research and development activities to develop both new processes and new materials. Additional costs also resulted from salary increases and increased labor and inventory insurance costs.
Financial Costs
Our financial expenses were $470,000 (0.80% of total sales) and $460,000 (1.04% of total sales) in fiscal years 2005 and 2004, respectively.
The financial expenses of the Company consist of interest expense. In 2005, we paid interest on monies borrowed at rates ranging from 4.43% to 8.37%. In 2004, these rates ranged from 3.8% to 5.75%. The balances of short-term bank loans as of September 30, 2005 and 2004 were $8.18 million and $8.77 million, respectively.
Environmental Laws Compliance Costs
We spent $5,500 and $11,448 for environmental compliance costs in fiscal years 2005 and 2004, respectively. We spent more in environmental law compliance costs in 2004 because of a one-time expenditure of $4,398 on planting trees and flowers in our facilities in 2004.
Investment Proceeds
In 2005, we disposed of our 60% interest in L & L Healthcare Hubei Co., Ltd. for a total consideration of $2.4 million, resulting in an after-tax gain of $1.05 million.
Income taxes
Companies in China are generally taxed at a rate of 33% of assessable profit, consisting of a 30% national tax and a 3% local tax. All of our subsidiaries in China have applied for an exemption from the local taxes. In China, for foreign investment enterprises like us that are established in a Special Economic Zone or a Coastal Open Economic Zone, where our subsidiaries are located, and which are engaged in production oriented activities, the national tax rate could be reduced to 15% or 24%, respectively. Our subsidiaries incorporated in China are subject to Chinese income taxes at the applicable tax rates on taxable income as reported in their statutory accounts in accordance with the relevant tax laws for two years starting from the first profit making year, followed by a 50% tax exemption for the next three years. For those foreign enterprises established in the middle west of China, a 50% tax exemption is granted for a further three years after the tax holiday and concession stated above. According to Chinese tax law, export-oriented enterprises, which export sales constitute over 70% of their total sales, can enjoy a tax rate of 10%.
According to the applicable Chinese income tax laws, regulations, notices and decisions related to foreign-invested enterprises and their investors, income such as dividends and profits distribution from China derived from a foreign enterprise which has no establishment in China is subject to a 10% withholding tax.
Foreign-invested enterprises in Shenzhen, China, also are eligible for a tax deduction equal to 40% of the purchase amount of domestic machinery in the same year, if the enterprises income tax for the year of acquisition is higher than that of the previous year.
During the years ended September 30, 2005 and 2004, we recorded a benefit relating to our decision to reinvest earnings of our Chinese subsidiaries totaling $210,616 and $0, respectively.
We incurred income taxes of $446,146 in 2005. This is an increase of 56% from the taxes we incurred in 2004, which amounted to $285,462. We paid more taxes in 2005 mostly because of higher income in 2005 compared to 2004.
Minority Interest
Our financial statements reflect an adjustment to our consolidated group net income equal to ($23,572) and ($4,807) in the fiscal years 2005 and 2004, respectively, reflecting the minority interests held by third parties in two of our subsidiaries (45% in Chongyang Wenqiang Medical Treatment Materials Co., Ltd. and 40% in Shanghai Winner Medical Apparatus Co., Ltd.).
Net income (profit after taxes)
We earned net income of $7.89 million in fiscal year 2005. This is an increase of $3.50 million or approximately 80% from fiscal year 2004 net income of $4.39 million. The increase in our net income in 2005 resulted from an increase of 2% in our gross profit margin (from 26% in 2004 to 28% in 2005) and from the inclusion of the after-tax gain of $1.05 million from the sale of our 60% interest in L & L Healthcare Hubei Co., Ltd.
Foreign Currency Translation Expenses
We incurred a foreign currency translation expense of $720,741 in fiscal year 2005 as compared with no foreign currency translation expense in fiscal year 2004. In July 21, 2005, China reformed its foreign currency exchange policy, resulted an appreciation of RMB against USD by 2.1 percent during a very short period of time. As a result, we implemented different exchange rates in translating RMB into U.S. dollar in our financial statements for fiscal year 2005, the exchange rates of 8.0922, 8.277 and 8.1846 were implemented in calculating the total assets/liabilities, shareholders’ equity and profit and loss, respectively, which results in a $720,741 increase in the foreign currency translation expenses from fiscal year of 2004.
Liquidity and Capital Resources
As of September 30, 2006, we had cash and cash equivalents of $4.32 million.
Cash Flow
(in Million)
| | | Years Ended September 30, | |
| | | 2004 | | 2005 | | 2006 | |
| Net cash provided by (used in) operating activities | | $ | 5.51 | | $ | 4.34 | | $ | 10.31 | |
| Net cash provided by (used in) investing activities | | $ | (8.06 | ) | $ | (3.09 | ) | $ | (13.68 | ) |
| Net cash provided by (used in) financing activities | | $ | 2.47 | | $ | (0.27 | ) | $ | 5.05 | |
| Net cash Flow | | $ | (0.08 | ) | $ | 1.11 | | $ | 1.67 | |
Operating Activities:
Net cash provided by operating activities was $10.31 million for the year ended September 30, 2006 which is an increase of $5.97 million from the $4.34 million net cash provided by operating activities for the same period in 2005. The increase was mainly due to the decrease in account receivable, and the increase of account payable.
Net cash provided by operating activities in 2005 was $4.34 million, which is a decrease of $1.17 million from the $5.51 million provided by operating activities in 2004. The decrease was mainly due to the increase in account receivable and inventory.
Investing Activities:
Our main uses of cash for investing activities are payments to the acquisition of property, plant and equipment and restricted cash pledged as deposit for bills payable issuance.
Net cash used in investing activities in the year ended September 30, 2006 was $13.68 million, which is an increase of $10.59 million from net cash used in investing activities of $3.09 million in the same period of 2005 due to the increased investment in the non-woven spunlance 100% cotton project in Winner Medical (Huanggang) Co., Ltd., and the increased investment in the plant and equipment in Winner Medical & Textile, Ltd. Chongyang, and Winner Medical & Textile, Ltd., Tianmen.
Net cash used for investing activities in the year 2005 was $3.09 million, which is a decrease of $4.97 million from the $8.06 million used for investing activities in 2004. Such decrease was primarily the result of the decrease in the investment on equipments and construction, and a one time gain from selling our 60% ownership of Winner Xishui in 2005.
Financing Activities:
Net cash provided by financing activities in the year ended September 30, 2006 totaled $5.05 million as compared to $0.27 million used in financing activities in the same period of 2005. Such increase of the cash provided by financing activities was mainly attributable to the private placement which closed in December 2005, less the repayment of matured loans.
Net cash used for financing activities was $0.27 million in 2005 as compared to $2.47 million provided by financing activities in 2004. The $2.73 million decrease of the cash provided by financing activities was mainly attributable to the repayment of matured loans.
Our debt to equity ratio was 22.09% as of September 30, 2006. We plan to maintain our debt to equity ratio below 40%, increase the long-term loans, and decrease the short-term loans. We believe we currently maintain a good business relationship with many banks.
As of September 30, 2006, we have loans with Chinese banks totaling $5.44 million. These loans have annual interest rates ranging from 5.40%-5.58% in fiscal year 2006.
Bank loans as of September 30, 2006
| Loan | | Loan period | | Interest rate | | Secured by | | Sept. 30 2006 | |
| | | | | | | | US$ | |
| A | | 10-20-2005 to 10-16-2006 | | 5.58% | | Land use rights & buildings | | 505,772 | |
| B | | 10-20-2005 to 10-12-2006 | | 5.58% | | Land use rights & buildings | | 505,772 | |
| C | | 10-20-2005 to 10-18-2006 | | 5.58% | | Land use rights & buildings | | 505,772 | |
| D | | 10-20-2005 to 10-17-2006 | | 5.58% | | Land use rights & buildings | | 505,772 | |
| E | | 10-19-2005 to 10-13-2006 | | 5.58% | | Land use rights & buildings | | 252,886 | |
| F | | 08-29-2006 to 02-28-2007 | | 5.58% | | Land use rights & buildings | | 1,264,430 | |
| G | | 07-03-2006 to 01-03-2007 | | 5.40% | | Land use rights & buildings | | 632,215 | |
| H | | 08-14-2006 to 02-13-2007 | | 5.40% | | Land use rights & buildings | | 632,215 | |
| I | | 06-12-2006 to 12-12-2006 | | 5.40% | | - | | 632,216 | |
| | | Total | | | | | | 5,437,050 | |
As of September 30, 2006, we have approximately $11 million bank credit facilities available from three commercial banks , consisting of approximately $1.52 million from Shenzhen Commercial Bank, approximately $6.32 million from Shenzhen Branch of the Industrial and Commercial Bank of China and approximately $3.16 million from the Huanggang Branch of Agricultural Bank of China. These loan facilities are all secured by our real property and other assets.
On December 16, 2005, prior to the consummation of the share exchange with us, our subsidiary Winner Group Limited completed a private placement of 139,380 shares of its common stock to 15 accredited investors which was subsequently exchanged for 5,155,877 shares of our common stock, raising $10,400,000 in gross proceeds. In addition, another 793,260 shares of our common stock were issued in a separate private placement raising gross proceeds of $1,600,000. As a result of these private placement transactions, we raised a total of $12,000,000 in gross proceeds, which left us with approximately $10,882,516 in net proceeds after the deduction of approximately $1,117,484 offering expenses.
We believe that our currently available working capital, after receiving the aggregate proceeds of the capital raising activities and the credit facilities referred to above, short-term investments and future cash provided by operating activities will be sufficient to meet our operations at our current level and working capital and capital expenditure needs over the next 12 months. Our future capital requirements will depend on many factors, including our rate of revenue growth, the expansion of our marketing and sales activities, the timing and extent of spending to support product development efforts and expansion into new territories, the timing of introductions of new products or services, the timing of enhancements to existing products and services and the timing of capital expenditures. Also, we may make investments in, or acquisitions of, complementary businesses, services or technologies which could also require us to seek additional equity or debt financing. To the extent that available funds are insufficient to fund our future activities, we may need to raise additional funds through public or private equity or debt financing. Additional funds may not be available on terms favorable to us or at all.
Contractual Obligations
As of September 30, 2006, the Company was obligated under operating leases requiring minimum rentals as follows:
| | | US$ | |
Year ending September 30, 2006 | | | |
| 2007 | | | 286,940 | |
| 2008 | | | 232,023 | |
| 2009 | | | 119,039 | |
| 2010 | | | 49,867 | |
| Total minimum lease payments | | | 687,869 | |
Critical Accounting Policies
The preparation of financial statements in conformity with accounting principles generally accepted in the United States requires our management to make assumptions, estimates and judgments that affect the amounts reported in the financial statements, including the notes thereto, and related disclosures of commitments and contingencies, if any. We consider our critical accounting policies to be those that require the more significant judgments and estimates in the preparation of financial statements, including the following:
| · | Principles of consolidation - Our consolidated financial statements were prepared in accordance with generally accepted accounting principles in the United States of America and include the assets, liabilities, revenues, expenses and cash flows of the Company and all its subsidiaries. All significant intercompany accounts, transactions and cash flows are eliminated on consolidation. |
| · | Revenue Recognition - Sales of goods are recognized when goods are shipped and title of goods sold has passed to the purchaser. Customers do not have a general right of return on products shipped. Products returns to the Company were insignificant during past years. |
| · | Inventory - Inventories are stated at the lower of cost or market, determined by the weighted average method. Work-in-progress and finished goods inventories consist of raw material, direct labor and overhead associated with the manufacturing process. |
| · | Trade accounts receivable - Trade accounts receivable are stated at the amount management expects to collect from balances outstanding at year-end. Based on management's assessment of the credit history with customers having outstanding balances and current relationships with them, it has concluded that realization losses on balances outstanding at year-end will be immaterial. |
| · | Property, plant and equipment - Property, plant and equipment are stated at cost including the cost of improvements. Maintenance and repairs are charged to expense as incurred. Assets under construction are not depreciated until construction is completed and the assets are ready for their intended use. Depreciation and amortization are provided on the straight-line method based on the estimated useful lives of the assets as follows: |
| Leasehold land | Over the lease term |
| Buildings | 10 - 30 years |
| Plant and machinery | 10 - 12 years |
| Furniture, fixtures and equipment | 5 - 8 years |
| Motor vehicles | 5 - 8 years |
| Leasehold improvements | Over the lease term |
| · | Income taxes - Income taxes are provided on an asset and liability approach for financial accounting and reporting of income taxes. Any tax paid by subsidiaries during the year is recorded. Current tax is based on the profit or loss from ordinary activities adjusted for items that are non-assessable or disallowable for income tax purpose and is calculated using tax rates that have been enacted or substantively enacted at the balance sheet date. Deferred income tax liabilities or assets are recorded to reflect the tax consequences in future years of differences between the tax basis of assets and liabilities and the financial reporting amounts at each year end. A valuation allowance is recognized if it is more likely than not that some portion, or all, of a deferred tax asset will not be realized. |
Off-Balance Sheet Arrangements
We have no off-balance sheet arrangements.
Seasonality
Our operating results and operating cash flows historically have not been subject to seasonal variations. This pattern may change, however, as a result of new market opportunities or new product introductions.
Item 7A. Quantitative and Qualitative Disclosures about Market Risk.
Interest Rate Risk
We are exposed to interest rate risk primarily with respect to our short-term bank loans. Although the interest rates are fixed for the terms of the loans, the terms are typically twelve months and interest rates are subject to change upon renewal. The People’s Bank of China (the central bank of China) increased the interest rate of RMB bank loans twice - in April 28, 2006 and in August 19, 2006. Since August 19, 2006, the new interest rates are 5.58% and 6.12% for RMB bank loans with a term less than 6 months and loans with a term of 6-12 months, respectively, as compared to the respective rates of were 5.22% and 5.58%, before April 28, 2006. The change in interest rates has no impact on our bank loans that were entered into prior to April 28, 2006. A hypothetical 1.0% increase in the annual interest rates for all of our credit facilities at September 30, 2006 would decrease net income before provision for income taxes by approximately $0.54 million for the year ended September 30, 2006. Management monitors the banks’ interest rates in conjunction with our cash requirements to determine the appropriate level of debt balances relative to other sources of funds. We have not entered into any hedging transactions in an effort to reduce our exposure to interest rate risk.
Foreign Exchange Risk
Our reporting currency is the U.S. dollar and the majority of our revenues will be settled in RMB and U.S. dollars. All of our assets are denominated in RMB except for cash. As a result, we are exposed to foreign exchange risk as our revenues and results of operations may be affected by fluctuations in the exchange rate between U.S. dollars and RMB. If the RMB depreciates against the U.S. dollar, the value of our RMB revenues, earnings and assets as expressed in our U.S. dollar financial statements will decline. If RMB continues its appreciation against U.S. dollar, it will make our sale prices more expensive, thus our sales may decline. In an effort to reduce our exposure to foreign exchange risk, we have entered into several foreign currency forward contracts totaling $18,000,000 with Industrial and Commercial Bank of China to hedge for future trade receipts from normal course of sales of goods in U.S. dollars against RMB. As at September 30, 2006, we have no outstanding balance of the foreign currency contracts. We will consider choosing proper financial instruments to hedge for the foreign exchange risk in the future.
Inflation
Inflationary factors such as increases in the cost of our product and overhead costs may adversely affect our operating results. Although we do not believe that inflation has had a material impact on our financial position or results of operations to date, a high rate of inflation in the future may have an adverse effect on our ability to maintain current levels of gross margin and selling, general and administrative expenses as a percentage of net revenues if the selling prices of our products do not increase with these increased costs.
Item 8. Financial Statements and Supplementary Data.
The financial statements required by this item begin on page F-1 hereof.
Item 9. Changes in and Disagreements with Accountants on Accounting and Financial Disclosure.
On December 16, 2005, concurrent with the reverse merger transaction discussed above, our Board of Directors elected to continue the existing relationship of our new subsidiary Winner Group Limited with BDO McCabe Lo Limited (“BDO”) and appointed BDO as our independent auditor. Additionally, concurrent with the decision to maintain our relationship with BDO, our board of directors approved the dismissal of S. W. Hatfield, CPA of Dallas, Texas (“SWHCPA”) as our independent auditor.
No accountant’s report issued by SWHCPA on the financial statements for either of the past two (2) years contained an adverse opinion or a disclaimer of opinion or was qualified or modified as to uncertainty, audit scope or accounting principles, except for a going concern opinion issued on August 31, 2005, expressing substantial doubt about the ability of our company to continue as a going concern.
During our two most recent fiscal years (ended July 31, 2005 and 2004) and from August 1, 2005 to the date of this report, there were no disagreements with SWHCPA on any matter of accounting principles or practices, financial disclosure, or auditing scope or procedure. There were no reportable events, as described in Item 304(a)(1)(iv)(B) of Regulation S-B, during our two most recent fiscal years (ended July 31, 2005 and 2004) and from August 1, 2005 to the date of this Report.
We furnished a copy of this disclosure to SWHCPA and requested SWHCPA to furnish us with a letter addressed to the Securities and Exchange Commission stating whether it agrees with the statements made by us herein in response to Item 304(a) of Regulation S-K and, if not, stating the respect in which it does not agree. A copy of the letter was filed by us as Exhibit 16.1 to our current report on Form 8-K, filed December 19, 2005.
Our management, with the participation of our chief executive officer and chief financial officer, Messrs. Jianquan Li and Xiuyuan Fang, respectively, evaluated the effectiveness of our disclosure controls and procedures. The term “disclosure controls and procedures,” as defined in Rules 13a-15(e) and 15d-15(e) under the Exchange Act of 1934, means controls and other procedures of a company that are designed to ensure that information required to be disclosed by a company in the reports, such as this 10-K, that it files or submits under the Exchange Act is recorded, processed, summarized and reported, within the time periods specified in the SEC’s rules and forms. Disclosure controls and procedures include, without limitation, controls and procedures designed to ensure that information required to be disclosed by a company in the reports that it files or submits under the Exchange Act is accumulated and communicated to the company’s management, including its principal executive and principal financial officers, as appropriate to allow timely decisions regarding required disclosure. Management recognizes that any controls and procedures, no matter how well designed and operated, can provide only reasonable assurance of achieving their objectives and management necessarily applies its judgment in evaluating the cost-benefit relationship of possible controls and procedures. Based on that evaluation, Messrs. Li and Fang concluded that as of September 30, 2006, and as of the date that the evaluation of the effectiveness of our disclosure controls and procedures was completed, our disclosure controls and procedures were effective to satisfy the objectives for which they are intended.
There were no changes in our internal control over financial reporting identified in connection with the evaluation performed that occurred during the fiscal year covered by this report that has materially affected or is reasonably likely to materially affect, our internal control over financial reporting.
None.
PART III
Item 10. Directors and Executive Officers of the Registrant.
The following sets forth the name and position of each of our current executive officers and directors.
| Name | | Age | | Position |
| Jianquan Li | | | 51 | | | Chief Executive Officer and President, and Chairman of the Board of Directors |
| Xiuyuan Fang | | | 38 | | | Chief Financial Officer, Vice President, Treasurer and Director |
| Larry Goldman | | | 50 | | | Director |
| Richard B. Goodner, Esq. | | | 61 | | | Director |
| Dr. Horngjon Shieh | | | 46 | | | Director |
| Hongwei Jia | | | 30 | | | Vice President of Quality Inspection and General Manager of Winner Shenzhen |
| Jiagan Chen | | | 56 | | | Vice President of Project Management |
| Nianfu Huo | | | 54 | | | Senior Vice President of Winner Group Limited and General Manager of Winner Zhuhai |
JIANQUAN LI. Mr. Li has served as our Chief Executive Officer, President and director since December 16, 2005. Mr. Li is the founder of Winner Group and has served as its Chairman and CEO since its subsidiary companies’ formation in 1991. As Chairman and CEO, Mr. Li oversaw the implementation of the business plan of Winner Group and was key to the development of its strategic vision. Mr. Li is a graduate of the Hubei Foreign Trade University with a major in International Trade.
XIUYUAN FANG. Mr. Fang has been our Chief Financial Officer, Vice President and Treasurer since December 16, 2005 and our director since January 7, 2006. Mr. Fang has been employed by Winner Group since 1999. Mr. Fang has served as Winner Group’s director since 1999 and as a Vice President since 2001. Mr. Fang is a certified public accountant and has extensive experience in financial management, capital management and tax planning. He was responsible for Winner Group’s financial management and capital management programs. He graduated from Zhongnan University of Economics and Law.
LARRY GOLDMAN, CPA. Mr. Goldman has been our director since May 8, 2006. Mr. Goldman is a certified public accountant and currently serves as the Acting Chief Financial Officer and Treasure of Thorium Power, Ltd. (OTCBB: THPW), a nuclear fuel technology company. Prior joining Thorium Power, Ltd., Mr. Goldman worked as the Chief Financial Officer, Treasurer and Vice President of Finance of WinWin Gaming, Inc., a multi-media developer and publisher of sports, lottery and other games (OTCBB: WNWN). Prior to his employment with WinWin Gaming, Inc., Mr. Goldman was a partner with Livingston Wachtell & Co., LLP where he acted as an auditor for several publicly traded companies in a variety of industries.
RICHARD B. GOODNER, Esq. Mr. Goodner has been our director since May 8, 2006. Mr. Goodner has served as Vice President - Legal Affairs and General Counsel of U.S. Home Systems, Inc., a NASDAQ listed company that is engaged in the business of home improvement and consumer finance, since June 2003. From 1997 to June 2003, he was a partner in the Dallas, Texas law firm of Jackson Walker, L.L.P. He also serves as a director of China BAK Battery, Inc., a company that is engaged in the manufacture, commercialization and distribution of a wide variety of standard and customized lithium ion rechargeable batteries. Mr. Goodner has practiced in the area of corporate and securities law for over 35 years and has represented numerous public and private companies in a range of general corporate and securities matters.
DR. HORNGJON SHIEH. Dr. Shieh has been our director since May 8, 2006. Dr. Shieh has served as an Assistant Professor at the City University of Hong Kong for the past seven years, where he has teaching experience in Enterprise Resource Planning, Accounting Information Systems, Accounting Information Systems Security and Control, Financial Accounting, Managerial Accounting, Financial Management, Financial Statement Analysis, International Accounting, and International Financial Statement Analysis and research experience in international accounting, information content and usefulness of financial statements, corporate governance, as well as disclosure requirements and capital market access.
HONGWEI JIA. Mr. Jia has been our Vice President of Quality Inspection since December 16, 2005 and has served as the General Manager of Winner Shenzhen since July 8, 2006. Mr. Jia joined Winner Group in 1997, and successively served as the Manager of Production of one of the Winner Group subsidiaries, the Manager of Human Resources, the Vice General Manager of Production, a management representative, and, since 2003, as Winner Group’s Vice General Manager of Quality Inspection. Mr. Jia directed the establishment of Quality Management Systems for eight of our subsidiary companies. Mr. Jia was responsible for Human Resources Management Systems at our headquarter and for its subsidiary companies in Shenzhen. Mr. Jia graduated from South China Normal University.
JIAGAN CHEN. Mr. Chen has been our Vice President of Project Management since December 16, 2005. Mr. Chen joined Winner Group as its Vice President of Project Management in 2000. Mr. Chen is currently in charge of the Huanggang construction project, which is the facility that will produce 100% of our new, cotton spunlace nonwoven products. He is an economic engineer and graduated from Wuhan Institute of Economic Management. Mr. Chen was responsible for Winner Group’s construction projects at our headquarters facility in the Shenzhen Winner Industrial Park.
NIANFU HUO. Mr. Huo has been the Senior Vice President of Winner Group Limited since April 8, 2003 and has served as the General Manager of Winner Zhuhai since February 1, 2001. He is responsible for the strategic planning as well as formulating and monitoring policies and operating objectives of the Company. Mr. Huo also is involved in the decision making process of establishing all of our subsidiaries in Hubei, Shanghai, Shenzhen and Zhuhai. Mr. Huo joined Winner Zhuhai in 1991. He graduated from Beijing International Studies University.
There are no agreements or understandings for any of our executive officers or directors to resign at the request of another person and no officer or director is acting on behalf of nor will any of them act at the direction of any other person.
Directors are elected until their successors are duly elected and qualified.
Board Composition and Committees
The board of directors is currently composed of five members, Jianquan Li, Xiuyuan Fang, Larry Goldman, Richard B. Goodner and Dr. Horngjon Shieh. All Board action requires the approval of a majority of the directors in attendance at a meeting at which a quorum is present.
Committees of Our Board of Directors
Audit Committee. On May 9, 2006, our board of directors formed an audit committee, which is chaired by Mr. Goldman, who is determined to be an independent board member and qualifies as the audit committee financial expert. Mr. Goodner and Dr. Shieh also serve on the audit committee. The audit committee reviews and monitors our internal controls, financial reports and accounting practices, as well as the scope and extent of the audits performed by both the independent and internal auditors, reviews the nature and scope of our internal audit program and the results of internal audits, and meets with the independent auditors.
Governance and Nominating. On May 9, 2006, our board of directors formed a governance and nominating committee, which is chaired by Mr. Goodner. Mr. Goldman and Dr. Shieh also serve on the governance and nominating committee. The primary purpose of governance and nominating committee is to identify and to recommend to the board individuals qualified to serve as directors of our company and on committees of the board, advise the board with respect to the board composition, procedures and committees, develop and recommend to the board a set of corporate governance principles and guidelines applicable to us; and oversee the evaluation of the board and our management.
Other Committees. Our board of directors may on occasion establish other committees, as it deems necessary or required.
Independent Director
Our board of directors has determined that each of Messrs. Goldman, Goodner and Shieh qualify as an “independent director” within the meaning of that term under the rules and regulations of the NASDAQ National Market.
Family Relationships
There are no family relationships among our directors or officers.
Code of Ethics
On May 9, 2006, our board of directors adopted a new Code of Ethics that applies to all of our directors, officers and employees, including our principal executive officer, principal financial officer, and principal accounting officer. The new code replaces our prior code of ethics that applied only to our principal executive officer, principal financial officer, principal accounting officer or controller and any person who performed similar functions, and addresses, among other things, honesty and ethical conduct, conflicts of interest, compliance with laws, regulations and policies, including disclosure requirements under the federal securities laws, confidentiality, trading on inside information, and reporting of violations of the code. A copy of the Code of Ethics has been filed as Exhibit 14.1 to our current report on Form 8-K filed on May 11, 2006. The Code of Ethics will also be posted on the corporate governance page of our website at www.winnermedical.com as soon as practicable. We intend to post any amendments and any waivers to our code of conduct on our website in accordance with Item 5.05 of Form 8-K and Item 406 of Regulation S-K.
The following table sets forth information concerning all cash and non-cash compensation awarded to, earned by or paid to Timothy Halter, our former CEO and Jianquan Li, our Chief Executive Officer for services rendered in all capacities during the noted periods. No other executive officers received total annual salary and bonus compensation in excess of $100,000 in the fiscal year ended September 30, 2006.
| | | | | Annual Compensation | | Long-Term Compensation | |
| | | | | | | | | | | Awards | | Payouts | | | |
Name And Principal Position | | Calendar Year (2) | | Salary ($) | | Bonus ($) | | Other Annual Compen- sation ($) | | Restricted Stock Awards ($) | | Securities Under-lying Options/ SARs (#) | | LTIP Payouts ($) | | All Other Compen- sation ($) | |
| | | | | | | | | | | | | | | | | | |
| Timothy Halter, | | | 2006 | | | - | | | - | | | - | | | - | | | - | | | - | | | - | |
| CEO and CFO (3) | | | 2005 | | | - | | | - | | | - | | | - | | | - | | | - | | | - | |
| | | | 2004 | | | - | | | - | | | - | | | - | | | - | | | - | | | - | |
| | | | | | | | | | | | | | | | | | | | | | | | | | |
| Jianquan Li | | | 2006 | | | 50,250 | (4) | | - | | | - | | | - | | | - | | | - | | | - | |
| Chairman, CEO and President (1) | | | 2005 | | | 75,000 | (5) | | - | | | - | | | - | | | - | | | - | | | - | |
| | | | 2004 | | | 45,000 | (6) | | - | | | - | | | - | | | - | | | - | | | - | |
| (1) | On December 16, 2005, we acquired Winner Group Limited in a reverse acquisition transaction that was structured as a share exchange and in connection with that transaction, Mr. Li became our Chief Executive Officer and President. Prior to the effective date of the reverse acquisition, Mr. Li served Winner Group Limited in the same capacities that he currently serves our company. The annual, long term and other compensation shown in this table includes the amount Mr. Li received from Winner prior to the consummation of the reverse acquisition. |
| (2) | Our acquisition of Winner Group Limited is being accounted for as a reverse acquisition and Winner Group Limited is being treated as the accounting acquiror. Therefore, after the acquisition of Winner Group Limited on December 16, 2005, our fiscal year end became September 30, which is Winner Group Limited’s fiscal year end prior to the closing of the acquisition. |
| (3) | Mr. Halter resigned from all offices he held with us on December 16, 2005 and from his position as our director on January 7, 2006. Mr. Halter received no compensation of any kind from us for the past three years. |
| (4) | In 2006, Mr. Li received an annual compensation of RMB 402,000 (approximately $50,250). On August 20, 2005, the board of directors of our subsidiary, Winner Group Limited, declared a dividend in the amount of $1,856,831.62 to Mr. Li. As a stockholder, Mr. Li received such dividend in the amount of $500,527.84, $500,000, $94,964.47, and $257,023.41 from Winner Group Limited in December 2005, January 2006, August 2006, and September 2006, respectively. The rest of the dividend in the amount of $504,315.90 will be paid to Mr. Li during fiscal year 2007. |
| (5) | In 2005, Mr. Li received an annual compensation of RMB 600,000 (approximately $75,000). On August 20, 2005, the board of directors of our subsidiary, Winner Group Limited, declared a dividend in the amount of $1,856,831.62 to Mr. Li. As a stockholder, Mr. Li received such dividend in the amount of $500,527.84 $500,000 $94,964.47 and $257,023.41 from Winner Group Limited in December 2005, January 2006, August 2006, and September 2006, respectively. The rest of the dividend in the amount of $504,315.90 will be paid to Mr. Li during fiscal year 2007. |
| (6) | In 2004, Mr. Li received an annual compensation of RMB 120,000 plus Hong Kong dollar 240,000, which is approximately $45,000. |
Bonuses and Deferred Compensation
We do not have any bonus, deferred compensation or retirement plan. All decisions regarding compensation are determined by our compensation committee.
Stock Option and Stock Appreciation Rights
On April 18, 2006, our Board of Directors adopted a 2006 Equity Incentive Plan pursuant to which we may grant equity incentives in the form of incentive and nonqualified stock options, stock appreciation rights, restricted stock, performance grants, and stock bonuses to our and our affiliates’ employees, officers, directors, consultants, independent contractors and advisors. We have reserved 5,000,000 shares of our common stock for issuance pursuant to this plan. On April 21, 2006, we issued 40,800 shares of our common stock to 223 employees in accordance with this plan. The 2006 Equity Incentive Plan has been filed as an exhibit to the Registration Statement on Form S-8 filed on April 19, 2006.
Director Compensation
On May 8, 2006, we entered into separate Independent Directors’ Contracts and Indemnification Agreements with each of the independent directors. Under the terms of the Independent Directors’ Contracts, Mr. Goldman is entitled to $30,000, Mr. Goodner is entitled to $20,000 and Dr. Shieh is entitled to $12,000 as compensation for the services to be provided by them as our independent directors, and as chairpersons of various board committees, as applicable. We also agreed to grant Messrs. Goldman and Goodner options to purchase up to 10,000 shares of our common stock for their first year of service. These options shall be vested in equal installments on a quarterly basis, shall have a term of three (3) years from the grant date and have an exercise price equal to the fair market value on the grant date. As of September 30, 2006, we had granted Mr. Goldman and Mr. Goodner each an option to purchase 4,167 shares of our common stock at an exercise price of $9.25 per share, and with a vesting date of December 31, 2006. These options expire in three (3) years. Under the terms of the Indemnification Agreements, we agreed to indemnify the independent directors against expenses, judgments, fines, penalties or other amounts actually and reasonably incurred by the independent directors in connection with any proceeding if the independent director acted in good faith and in the best interests of our company. The Independent Directors’ Contracts and Indemnification Agreements were filed as Exhibits 10.1 through 10.6 to our current report on Form 8-K filed on May 11, 2006.
None of the employee directors receives additional compensation solely as a result of his position as a director.
Employment Agreements
Our subsidiary Winner Group has employment agreements with the following executive officers.
Jianquan Li, our CEO and President’s employment agreement became effective as of January 1, 2005. The agreement is for a term of three years. Mr. Li is receiving an annual salary of approximately $75,000 under the agreement (RMB 600,000).
Xiuyuan Fang, our CFO, Vice President and Treasurer’s employment agreement became effective as of January 1, 2005. The agreement is for a term of three years. Mr. Fang is receiving an annual salary of approximately $26,670 under the agreement (RMB 213,368).
Hongwei Jia, our Vice President of Quality Inspection’s employment agreement became effective as of January 1, 2005. The agreement is for a term of three years. Mr. Jia is receiving an annual salary of approximately $26,670 under the agreement (RMB 213,368).
Jiagan Chen, our Vice President of Project Management’s employment agreement became effective as of January 1, 2005. The agreement is for a term of three years. Mr. Chen is receiving an annual salary of approximately $26,670 under the agreement (RMB 213,368).
Nianfu Huo, our Senior Vice President’s employment agreement became effective as of January 1, 2005. The agreement is for a term of three years. Mr. Huo is receiving an annual salary of approximately $26,670 under the agreement (RMB 213,368).
Indemnification of Directors and Executive Officers and Limitation of Liability
Our Bylaws provide for the indemnification of our directors and officers, past, present and future, under certain circumstances, against attorney’s fees, judgments, fines and other expenses incurred by them in any litigation to which they become a party arising from their association with or activities on behalf of us. We will also bear expenses of such litigation for any of our directors, officers, employees or agents upon such persons promise to repay us therefor if it is ultimately determined that any such person shall not have been entitled to indemnification. This indemnification policy could result in substantial expenditure by us, which we may be unable to recoup.
Insofar as indemnification by us for liabilities arising under the Securities Exchange Act of 1934 may be permitted to our directors, officers and controlling persons pursuant to provisions of the Articles of Incorporation and Bylaws, or otherwise, we have been advised that in the opinion of the SEC, such indemnification is against public policy and is, therefore, unenforceable. In the event that a claim for indemnification by such director, officer or controlling person of us in the successful defense of any action, suit or proceeding is asserted by such director, officer or controlling person in connection with the securities being offered, we will, unless in the opinion of our counsel the matter has been settled by controlling precedent, submit to a court of appropriate jurisdiction the question whether such indemnification by us is against public policy as expressed in the Act and will be governed by the final adjudication of such issue.
At the present time, there is no pending litigation or proceeding involving a director, officer, employee or other agent of ours in which indemnification would be required or permitted. We are not aware of any threatened litigation or proceedings that may result in a claim for such indemnification.
Item 12. Security Ownership of Certain Beneficial Owners and Management.
The following table sets forth information regarding beneficial ownership of our common stock as of December 14, 2006 (i) by each person who is known by us to beneficially own more than 5% of our common stock; (ii) by each of our officers and directors; and (iii) by all of our officers and directors as a group.
Title of Class | | Name & Address of Beneficial Owner | | Office, If Any | | Amount & Nature of Beneficial Ownership1 | | Percent of Class2 |
Common Stock $0.001 par value | | Jianquan Li 6-15D, Donghai Garden, Futian District, Shenzhen, China | | CEO, President and Director | | 36,084,527 | | 80.77% |
| | | | | | | | | |
Common Stock $0.001 par value | | Xiuyuan Fang Room 5B Building 2 Jun’an Garden, Futian District, Shenzhen City, Guangdong Province, China | | CFO, Vice President, Treasurer and Director | | 464,512 | | 1% |
| | | | | | | | | |
Common Stock $0.001 par value | | Larry Goldman 5 Victory Road, Suffern, NY 10901 | | Director | | 0 | | * |
| | | | | | | | | |
Common Stock $0.001 par value | | Richard B. Goodner, Esq. 6608 Emerald Drive Colleyville, Texas 76034 | | Director | | 0 | | * |
| | | | | | | | | |
Common Stock $0.001 par value | | Dr. Horngjon Shieh Flat 37B, Tower 3 The Victoria Towers 188 Canton Road, TST Kowloon, Hong Kong | | Director | | 0 | | * |
| | | | | | | | | |
Common Stock $0.001 par value | | Hongwei Jia Lita Village, Shunshandian Xiang, Queshan County, Henan Province, China | | Vice President of Quality Inspection and General Manager of Winner Shenzhen | | 4,958 | | * |
| | | | | | | | | |
Common Stock $0.001 par value | | Jiagan Chen No.25 Zhazhu Front Road, Wuchang District, Wuhan City, China | | Vice President of Project Management | | 24,789 | | * |
| | | | | | | | | |
Common Stock $0.001 par value | | Nianfu Huo Hai Yi Wan Pan, No. 333 Jin Tang Road, Tang Jia Wan Zhuhai, China 519000 | | Senior Vice President of Winner Group Limited and General Manager of Winner Zhuhai | | 174,524 | | * |
| | | | | | | | | |
Common Stock $0.001 par value | | Pinnacle China Fund, L.P. 3 4965 Preston Park Blvd. Suite 240, Plano, Texas 75093 | | | | 4,194,077 | | 9.39% |
| | | | | | | | | |
Common Stock $0.001 par value | | All officers and directors as a group (48 persons named above) | | | | 36,753,310 | | 82.26% |
* Less than 1%
1Beneficial Ownership is determined in accordance with the rules of the Securities and Exchange Commission and generally includes voting or investment power with respect to securities. Each of the beneficial owners listed above has direct ownership of and sole voting power and investment power with respect to the shares of our common stock.
2A total of 44,677,171 shares of our Common Stock are considered to be outstanding pursuant to SEC Rule 13d-3(d)(1). For each Beneficial Owner above, any options exercisable within 60 days have been included in the denominator.
3 Barry Kitt is the sole officer of Pinnacle China Advisors, L.P. which is the general partner of Pinnacle China Fund, L.P. There are approximately 60 limited partners in Pinnacle China Fund, L.P. Mr. Kitt beneficially owned less than 10% as of September 30, 2006.
The following discloses transactions entered into by both Winner Medical Group Inc. and Winner Group in the past two years as required by Item 404 of Regulation S-K.
On December 16, 2005, we consummated the transactions contemplated by a share exchange agreement among us and the owners of the issued and outstanding capital stock of Winner Group Limited, including Jianquan Li, our CEO, President, director, and controlling stockholder and certain of our other officers and directors. Pursuant to the share exchange agreement, we acquired 100 percent of the outstanding capital stock of Winner Group Limited in exchange for 42,280,840 shares of our common stock. As a result of this transaction, Mr. Li became the owner of 80.84 percent of our outstanding capital stock. The number of our shares issued to the stockholders of Winner Group Limited was determined based on an arms-length negotiation.
On November 4, 2005, we settled a $60,000 note payable to Glenn A. Little, our former sole director and controlling stockholder, by the issuance of 240,000 shares of unregistered, restricted common stock at a price of $0.25 per share. This price was determined based on the closing bid price of our common stock on November 4, 2005.
On November 4, 2005, we consummated a private placement of common stock with Halter Financial Investments, L.P. for the sale of 1,070,000 shares of unregistered, restricted common stock for $267,500 in cash at a price of $0.25 per share. This price was determined based on the closing bid price of our common stock on November 4, 2005. As a result of the private placement, Halter Financial Investments became our controlling stockholder. Timothy Halter, our former CEO and director, is the sole member of TPH GP, LLC, which is the sole general partner of TPH GP, L.P., which is a limited partner of Halter Financial Investments, L.P. Mr. Halter is also the chairman of Halter Financial Investment GP, LLC, which is the general partner of Halter Financial Investments, L.P.
On July 16, 2005, we entered into a Financial Advisory Agreement with HFG International, Limited, a Hong Kong Corporation, as amended on December 12, 2005, pursuant to which HFG International, Limited agreed to provide us with financial advisory and consulting services in implementing a restructuring plan and facilitating our going public transaction. In consideration for these services, HFG International, Limited was paid a fee of $260,000 upon the closing of the going public transaction. Timothy Halter, our former CEO and director, is the principal stockholder and an executive officer of HFG International, Limited.
On December 1, 2005, our CEO, President and director, Jianquan Li, entered into a perpetual license agreement with us, pursuant to which he licensed his rights under certain patent applications and related technology for nonwoven fabric manufacturing to us on a perpetual, worldwide, royalty-free basis. Mr. Li received no consideration for this license.
In addition, we entered into the following transactions, all of which are unsecured, interest free and with no fixed repayment terms.
During the year ended September 30, 2006 and 2005, we sold goods to L+L Healthcare Hubei Co., Ltd., of which we own a 40% equity interest, for US$1,760 and US$83,013 and purchased goods from it for US$1,093,712 and US$444,553 respectively. As of September 30, 2006 and 2005, amount due to L+L Healthcare Hubei Co., Ltd. was US$Nil and US$107,914 respectively. As of September 2006 and 2005, the amount due from L+L Healthcare Hubei Co., Ltd. was US$241,312 and US$Nil respectively.
During the year ended September 30, 2006, 2005 and 2004, we purchased goods from Safe Secure Packing (Shenzhen) Co., Ltd. for US$1,319,939, US$1,007,675 and US$415,793, respectively. Mr. Jianquan Li, our CEO, President and director, had a controlling interest in Safe Secure Packing (Shenzhen) Co., Ltd. during the periods. As of September 30, 2006, 2005 and 2004, the outstanding net balances due to Safe Secure Packing (Shenzhen) Co., Ltd. were US$203,999 and US$147,697 and US$5,270, respectively.
During the years ended September 30, 2006, 2005 and 2004, we sold goods to Kangsoon Import & Export Trading Co. Ltd. Shenzhen for US$Nil, US$519,889 and US$2,631,563 and purchased goods from it for US$Nil, US$963,548 and US$4,243,467, respectively. Mr. Xiuyuan Fang, our CFO, Vice President, Treasurer and director, had a controlling interest in Kangsoon Import & Export Trading Co. Ltd. Shenzhen during that period. As of September 30, 2006, 2005 and 2004, the outstanding balances due to Kangsoon Import & Export Trading Co. Ltd. Shenzhen were US$Nil, US$Nil and US$32,227, respectively.
During the year ended September 30, 2006 and 2005, we sold goods to Winner Medical & Textile (H.K.) Limited for US$988,895 and US$215,509. Mr. Jianquan Li, our CEO, President and director, has a controlling interest in Winner Medical & Textile (H.K.) Limited. As of September 30, 2006 and 2005, the outstanding balance due from Winner Medical & Textile (H.K.) Limited were US$239,588 and US$116,804 respectively.
During September 2005, we borrowed $168,817 from Mr. Jianquan Li, our CEO, President and director.
On August 20, 2005, the board of directors of our subsidiary, Winner Group Limited, declared a dividend in the amount of $1,856,831.62 and $15,918.38, to Mr. Jianquan Li, our CEO, President and director, and Mr. Xiuyuan Fang, our CFO, Vice President, Treasurer and director, respectively. Such amounts are in proportion to the 99.15% and 0.85% of ownership of Winner Group Limited owned by Mr. Li and Mr. Fang, respectively. We paid Jianquan Li $500,527.84, $500,000, $94,964.47, and $257,023.41 in December 2005, January 2006, August 2006, and September 2006, respectively. We paid Xiuyuan Fang $15,918.38 in May 2006. The rest of the dividend in the amount of $504,315.90 will be paid to Mr. Li during fiscal year 2007 without interest. Messrs. Li and Fang were the only shareholders of Winner Group Limited when such dividend was declared. Mr. Li is the sole director of Winner Group Limited.
Item 14. Principal Accountant Fees and Services.
Audit Fees
The fees billed by BDO in 2006 and 2005 for performing the Company’s audit for the fiscal years ended September 30, 2006 and 2005 were approximately $205,000 and $112,500, respectively. The fees billed by BDO in 2006 and in 2005 relating to the review of the Company’s financial statements included in the Company’s Quarterly Reports on Form 10-Q during the fiscal years ended September 30, 2006 and 2005 were approximately $115,000 and $0, respectively.
Audit-Related Fees
The fees billed by BDO in 2006 and 2005 for audit-related services for the fiscal years ended September 30, 2006 and 2005 were approximately $0 and $0, respectively.
Tax Fees
The fees billed by BDO in 2006 and 2005 for tax services for the fiscal years ended September 30, 2006 and 2005 were approximately $20,565 and $0 respectively.
All Other Fees
BDO did not provide any services other than as described above under the headings “Audit Fees,” “Audit-Related Fees” and “Tax Fees” during the fiscal year ended September 30, 2006 and 2005.
Policy on Pre-Approval of Services
Our Board of Directors pre-approved all auditing services and non-audit services to be performed by the independent auditors during the fiscal year ended September 30, 2006.
PART IV
Item 15. Exhibits, Financial Statements Schedules.
(1) Financial Statements
The consolidated financial statements filed as part of this Form 10-K are located as set forth in the index on page F-1 of this report.
(2) Financial Statement Schedules
Not applicable.
(3) Exhibits
The list of exhibits included in the attached Exhibit Index is hereby incorporated herein by reference.
SIGNATURES
Pursuant to the requirements of Section 13 or 15(d) of the Securities Exchange Act of 1934, the registrant has duly caused this report to be signed on its behalf by the undersigned, thereunto duly authorized.
Date: December 19, 2006
| | | |
| | WINNER MEDICAL GROUP INC. |
|
|
|
| By: | /s/ Jianquan Li |
| |
Jianquan Li |
| | Chief Executive Officer |
| | | |
| By: | /s/ Xiuyuan Fang |
| |
Xiuyuan Fang |
| | Chief Financial Officer |
POWER OF ATTORNEY
KNOW ALL PERSONS BY THESE PRESENTS, that each person whose signature appears below constitutes and appoints Jianquan Li and Xiuyuan Fang, and each of them, their attorneys-in-fact and agents, each with the power of substitution, for them in any and all capacities, to sign any and all amendments to this Report on Form 10-K, and to file the same, with exhibits thereto and other documents in connection therewith, with the Securities and Exchange Commission, hereby ratifying and confirming all that said attorneys-in-fact, or substitutes, may do or cause to be done by virtue hereof.
Pursuant to the requirements of the Securities Exchange Act of 1934, this report has been signed below by the following persons on behalf of the registrants and in the capacities and on the dates indicated.
| | | |
| By: | /s/ Jianquan Li |
| |
Jianquan Li |
| | Chief Executive Officer, President and Chairman of the Board of the Directors (Principal Executive Officer) Dated: December 19, 2006 |
| | | |
| By: | /s/ Xiuyuan Fang |
| |
Xiuyuan Fang |
| | Chief Financial Officer, Vice President, Treasurer and Director (Principal Accounting and Financial Officer) Dated: December 19, 2006 |
| | | |
| By: | /s/ Larry Goldman |
| |
Larry Goldman |
| | Director Dated: December 19, 2006 |
| | | |
| By: | /s/ Richard B. Goodner |
| |
Richard B. Goodner, Esq. |
| | Director Dated: December 19, 2006 |
| | | |
| By: | /s/ Horngjon Shieh |
| |
Dr. Horngjon Shieh |
| | Director Dated: December 19, 2006 |
| | WINNER MEDICAL GROUP INC. Consolidated Financial Statements For the years ended September 30, 2006 and 2005 |
WINNER MEDICAL GROUP INC.
INDEX TO CONSOLIDATED FINANCIAL STATEMENTS
| | Page |
| Report of Independent Registered Public Accounting Firm | F-1 |
| Consolidated Balance Sheets | F-2 |
| Consolidated Statements of Income | F-3 |
| Consolidated Statements of Stockholder’s Equity | F-4 |
| Consolidated Statements of Cash Flows | F-5 |
| Notes to Consolidated Financial Statements | F-6 - F-20 |
REPORT OF INDEPENDENT REGISTERED PUBLIC ACCOUNTING FIRM
To the Stockholders and the Board of Directors of
Winner Medical Group Inc.
We have audited the accompanying consolidated balance sheets of Winner Medical Group Inc. and subsidiaries (the “Company”) as of September 30, 2006 and 2005, and the related consolidated statements of income and comprehensive income, shareholders' equity and cash flows for each of the three years in the period ended September 30, 2006. These financial statements are the responsibility of the Company's management. Our responsibility is to express an opinion on these financial statements based on our audits.
We conducted our audits in accordance with the standards of the Public Company Accounting Oversight Board (United States). Those standards require that we plan and perform the audit to obtain reasonable assurance about whether the financial statements are free of material misstatement. The Company is not required to have, nor were we engaged to perform, an audit of its internal control over financial reporting. Our audits include consideration of internal control over financial reporting as a basis for designed audit procedures that are appropriate in the circumstances, but not for the purpose of expressing an opinion on the effectiveness of the Company’s internal control over financial reporting. Accordingly, we express no such opinion. Our audit also includes examining, on a test basis, evidence supporting the amounts and disclosures in the financial statements, assessing the accounting principles used and significant estimates made by management, as well as evaluating the overall financial statement presentation. We believe that our audits provide a reasonable basis for our opinion.
In our opinion, the consolidated financial statements referred to above present fairly, in all material respects, the consolidated financial position of Winner Medical Group Inc. and subsidiaries as of September 30, 2006 and 2005, and the consolidated results of their operations and their cash flows for each of the three years in the period ended September 30, 2006, in conformity with accounting principles generally accepted in the United States of America.
BDO McCabe Lo Limited
Hong Kong, December 8, 2006
WINNER MEDICAL GROUP INC.
CONSOLIDATED BALANCE SHEETS
| | | September 30, | |
| | | 2006 | | 2005 | |
| | | US$ | | US$ | |
ASSETS |
| Current assets: | | | | | |
| Cash and cash equivalents | | | 4,319,579 | | | 2,650,867 | |
| Accounts receivable, less allowances for doubtful accounts of US$20,347 and US$12,643 at September 30, 2006 and 2005, respectively | | | 7,513,013 | | | 8,257,923 | |
| Amounts due from affiliated companies | | | 480,900 | | | 116,804 | |
| Inventories | | | 11,329,520 | | | 10,476,534 | |
| Prepaid expenses and other current assets | | | 6,182,472 | | | 4,268,072 | |
| Income taxes recoverable | | | 7,533 | | | 57,649 | |
| Total current assets | | | 29,833,017 | | | 25,827,849 | |
| | | | | | | | |
| Property, plant and equipment, net | | | 35,800,530 | | | 26,834,824 | |
| Investment in an equity investee | | | 1,062,135 | | | 1,009,318 | |
| Intangible assets, net | | | 38,731 | | | 38,288 | |
| Prepaid expenses | | | 224,391 | | | 219,125 | |
| Deferred tax assets | | | 195,610 | | | 294,021 | |
| Total assets | | | 67,154,414 | | | 54,223,425 | |
| | | | | | | | |
LIABILITIES AND SHAREHOLDERS’ EQUITY
| | | | | | |
| Current liabilities: | | | | | |
| Short-term bank loans | | | 5,437,050 | | | 8,773,881 | |
| Accounts payable | | | 4,196,874 | | | 3,490,047 | |
| Accrued payroll and employee benefits | | | 1,184,779 | | | 1,150,036 | |
| Customer deposits | | | 269,965 | | | 99,994 | |
| Other accrued liabilities | | | 2,379,849 | | | 2,279,845 | |
| Amount due to a shareholder | | | 1,556 | | | 168,817 | |
| Amounts due to affiliated companies | | | 203,999 | | | 255,611 | |
| Dividend payable | | | 504,317 | | | 1,872,750 | |
| Income taxes payable | | | 556,647 | | | 576,157 | |
| Total current liabilities | | | 14,735,036 | | | 18,667,138 | |
| | | | | | | | |
| Deferred tax liabilities | | | 4,410 | | | 37,271 | |
| Total liabilities | | | 14,739,446 | | | 18,704,409 | |
| | | | | | | | |
| Commitments and contingencies | | | | | | | |
| | | | | | | | |
| Minority interests | | | 149,496 | | | 1,164,186 | |
| | | | | | | | |
| Stockholders’ equity: | | | | | | | |
Common stock, par value $0.001 per share; authorized 495,000,000 stock, stock issued and outstanding September 30, 2006 - 44,677,171 shares; September 30, 2005- 36,991,105 shares | | | 44,677 | | | 36,991 | |
| Additional paid-in capital | | | 30,237,197 | | | 19,020,848 | |
| Retained earnings | | | 19,182,866 | | | 14,104,400 | |
| Statutory reserves | | | 1,222,678 | | | 471,850 | |
| Accumulated other comprehensive income | | | 1,578,054 | | | 720,741 | |
| Total stockholders’ equity | | | 52,265,472 | | | 34,354,830 | |
| Total liabilities and stockholders’ equity | | | 67,154,414 | | | 54,223,425 | |
See accompanying notes to consolidated financial statements.
WINNER MEDICAL GROUP INC.
CONSOLIDATED STATEMENTS OF INCOME AND COMPREHENSIVE INCOME
| | | Year ended September 30, | |
| | | 2006 | | 2005 | | 2004 | |
| | | US$ | | US$ | | US$ | |
| | | | | | | | |
| Net sales | | | 63,873,058 | | | 58,357,129 | | | 44,281,465 | |
| | | | | | | | | | | |
| Cost of sales | | | (46,335,354 | ) | | (42,059,663 | ) | | (32,814,282 | ) |
| Gross profit | | | 17,537,704 | | | 16,297,466 | | | 11,467,183 | |
| | | | | | | | | | | |
| Other operating income, net | | | 283,337 | | | 296,117 | | | 298,536 | |
| Selling, general and administrative expenses | | | (11,335,006 | ) | | (8,830,775 | ) | | (6,630,596 | ) |
| | | | | | | | | | | |
| Income from operations | | | 6,486,035 | | | 7,762,808 | | | 5,135,123 | |
| Gain on disposal of a subsidiary | | | - | | | 1,049,239 | | | - | |
| Interest income | | | 54,772 | | | 12,009 | | | 6,582 | |
| Interest expense | | | (266,934 | ) | | (470,776 | ) | | (459,945 | ) |
| Share of undistributed earnings in an equity investee | | | 52,817 | | | 9,108 | | | - | |
| Income before income taxes and minority interests | | | 6,326,690 | | | 8,362,388 | | | 4,681,760 | |
| | | | | | | | | | | |
| Income taxes | | | (516,635 | ) | | (446,146 | ) | | (285,462 | ) |
| Income before minority interests | | | 5,810,055 | | | 7,916,242 | | | 4,396,298 | |
| | | | | | | | | | | |
| Minority interests | | | 19,239 | | | (23,572 | ) | | (4,807 | ) |
Net income | | | 5,829,294 | | | 7,892,670 | | | 4,391,491 | |
| | | | | | | | | | | |
| Other comprehensive income | | | | | | | | | | |
| Foreign currency translation difference | | | 857,313 | | | 720,741 | | | - | |
| | | | | | | | | | | |
| Comprehensive income | | | 6,686,607 | | | 8,613,411 | | | 4,391,491 | |
| | | | | | | | | | | |
| | | | | | | | | | | |
| Net income per stock | | | | | | | | | | |
| - basic | | | 0.14 | | | 0.21 | | | 0.12 | |
| - diluted | | | 0.14 | | | 0.21 | | | 0.12 | |
| | | | | | | | | | | |
| Weighted average common stock outstanding | | | | | | | | | | |
| - basic | | | 43,053,212 | | | 36,991,105 | | | 36,991,105 | |
| - diluted | | | 43,061,546 | | | 36,991,105 | | | 36,991,105 | |
See accompanying notes to consolidated financial statements.
WINNER MEDICAL GROUP INC.
CONSOLIDATED STATEMENTS OF SHAREHOLDERS' EQUITY
| | | Common stock | | Additional | | | | | | Accumulated other | | Total stock- | |
| | | Stock | | | | paid-in | | Retained | | Statutory | | comprehensive | | holders’ | |
| | | outstanding | | Amount | | capital | | earnings | | reserves | | income | | equity | |
| | | | | US$ | | US$ | | US$ | | US$ | | US$ | | US$ | |
| | | | | | | | | | | | | | | | |
| Balance at September 30, 2003 | | | 36,991,105 | | | 36,991 | | | 19,020,848 | | | 3,899,881 | | | 264,958 | | | - | | | 23,222,678 | |
| Net income | | | - | | | - | | | - | | | 4,391,491 | | | - | | | - | | | 4,391,491 | |
| Transfer to statutory reserves | | | - | | | - | | | - | | | (201,126 | ) | | 201,126 | | | - | | | - | |
| Balance at September 30, 2004 | | | 36,991,105 | | | 36,991 | | | 19,020,848 | | | 8,090,246 | | | 466,084 | | | - | | | 27,614,169 | |
| Net income | | | - | | | - | | | - | | | 7,892,670 | | | - | | | - | | | 7,892,670 | |
| Foreign currency translation difference | | | - | | | - | | | - | | | - | | | - | | | 720,741 | | | 720,741 | |
| Transfer to statutory reserves | | | - | | | - | | | - | | | (5,766 | ) | | 5,766 | | | - | | | - | |
| Dividends | | | - | | | - | | | - | | | (1,872,750 | ) | | - | | | - | | | (1,872,750 | ) |
| Balance at September 30, 2005 | | | 36,991,105 | | | 36,991 | | | 19,020,848 | | | 14,104,400 | | | 471,850 | | | 720,741 | | | 34,354,830 | |
| Shares issued for reverse takeover | | | 1,562,271 | | | 1,562 | | | 1,089 | | | - | | | - | | | - | | | 2,651 | |
| Issuance of common stock | | | 6,082,995 | | | 6,083 | | | 10,876,433 | | | - | | | - | | | - | | | 10,882,516 | |
| Issuance of employee stock | | | 40,800 | | | 41 | | | 316,159 | | | - | | | - | | | - | | | 316,200 | |
| Stock options granted | | | - | | | - | | | 22,668 | | | - | | | - | | | - | | | 22,668 | |
| Net income | | | - | | | - | | | - | | | 5,829,294 | | | - | | | - | | | 5,829,294 | |
| Foreign currency translation difference | | | - | | | - | | | - | | | - | | | - | | | 857,313 | | | 857,313 | |
| Transfer to statutory reserves | | | - | | | - | | | - | | | (750,828 | ) | | 750,828 | | | - | | | - | |
| Balance at September 30, 2006 | | | 44,677,171 | | | 44,677 | | | 30,237,197 | | | 19,182.866 | | | 1,222,678 | | | 1,578,054 | | | 52,265,472 | |
See accompanying notes to consolidated financial statements.
WINNER MEDICAL GROUP INC.
CONSOLIDATED STATEMENTS OF CASH FLOWS
| | | Year ended September 30, | |
| | | 2006 | | 2005 | | 2004 | |
| | | US$ | | US$ | | US$ | |
| Cash flows from operating activities | | | | | | | |
| Net income | | | 5,829,294 | | | 7,892,670 | | | 4,391,491 | |
| Adjustment to reconcile net income to net cash from | | | | | | | | | | |
| operating activities: | | | | | | | | | | |
| Depreciation and amortization of property, plant and equipment | | | 2,636,716 | | | 2,603,386 | | | 2,859,703 | |
| Impairment for property, plant and equipment | | | - | | | 160,649 | | | - | |
| Amortization of intangible assets | | | 5,063 | | | 4,078 | | | 2,960 | |
| Deferred tax | | | 70,688 | | | (27,309 | ) | | (172,872 | ) |
| Gain on disposal of a subsidiary | | | (88,454 | ) | | (1,165,821 | ) | | - | |
| (Gain)/loss on disposal of property, plant and equipment | | | (10,289 | ) | | 178,548 | | | 89,984 | |
| Minority interests | | | 19,239 | | | 23,572 | | | 4,807 | |
| Share of undistributed earnings in an equity investee | | | (52,817 | ) | | (9,108 | ) | | - | |
| Provision for stock based compensation expense | | | 327,182 | | | - | | | - | |
| Increase (decrease) in cash resulting from changes in: | | | | | | | | | | |
| Accounts receivable | | | 896,164 | | | (2,612,217 | ) | | (201,425 | ) |
| Amounts due from affiliated companies | | | (218,176 | ) | | 73,863 | | | (38,983 | ) |
| Inventories | | | (609,907 | ) | | (1,754,970 | ) | | (1,630,750 | ) |
| Prepaid expenses and other current assets | | | 856,974 | | | (1,516,580 | ) | | 1,542,470 | |
| Income taxes recoverable | | | 51,454 | | | (1,856 | ) | | (54,547 | ) |
| Non-current prepaid expenses | | | (182 | ) | | (127,282 | ) | | (89,792 | ) |
| Notes payable | | | - | | | (370,727 | ) | | 362,450 | |
| Accounts payable | | | 625,850 | | | 903,778 | | | (944,659 | ) |
| Accrued payroll and employee benefits | | | 8,059 | | | 372,046 | | | 309,689 | |
| Customer deposits | | | 167,651 | | | (43,861 | ) | | (741,286 | ) |
| Other accrued liabilities | | | (112,998 | ) | | (439,848 | ) | | 31,045 | |
| Amounts due to affiliated companies | | | (57,543 | ) | | 26,591 | | | (443,167 | ) |
| Income taxes payable | | | (32,878 | ) | | 170,744 | | | 233,438 | |
| Net cash generated from operating activities | | | 10,311,090 | | | 4,340,346 | | | 5,510,556 | |
| | | | | | | | | | | |
| Cash flows from investing activities | | | | | | | | | | |
| Purchase of property, plant and equipment | | | (11,180,904 | ) | | (5,666,278 | ) | | (8,341,112 | ) |
| Proceeds from disposal of property, plant and equipment | | | 220,298 | | | 210,161 | | | 303,791 | |
| Increase in intangible assets | | | (4,623 | ) | | (7,325 | ) | | (20,661 | ) |
| Proceeds from disposal of a subsidiary, net of cash disposed | | | (39,004 | ) | | 2,373,542 | | | - | |
| Decrease in prepaid expenses and other current assets | | | (2,672,686 | ) | | - | | | - | |
| Net cash used in investing activities | | | (13,676,919 | ) | | (3,089,900 | ) | | (8,057,982 | ) |
| | | | | | | | | | | |
| Cash flows from financing activities | | | | | | | | | | |
| Proceeds from bank borrowings | | | 6,621,689 | | | 7,661,699 | | | 13,412,445 | |
| Repayment of bank borrowings | | | (10,119,940 | ) | | (7,253,899 | ) | | (11,813,791 | ) |
| Amounts due from affiliated companies | | | (143,209 | ) | | - | | | - | |
| Amount due to a shareholder | | | (171,178 | ) | | (825,142 | ) | | 866,757 | |
| Repayment of dividend payable | | | (1,411,886 | ) | | - | | | - | |
| Issuance of common stocks | | | 11,062,647 | | | - | | | - | |
| (Repayment to) proceeds from minority interest | | | (792,101 | ) | | 148,560 | | | - | |
| Net cash generated from (used in) financing activities | | | 5,046,022 | | | (268,782 | ) | | 2,465,411 | |
| | | | | | | | | | | |
| Effect of foreign currencies on cash flows | | | (11,481 | ) | | 125,072 | | | - | |
| | | | | | | | | | | |
| Net increase (decrease) in cash and cash equivalents | | | 1,668,712 | | | 1,106,736 | | | (82,015 | ) |
| Cash and cash equivalents, beginning of year | | | 2,650,867 | | | 1,544,131 | | | 1,626,146 | |
| Cash and cash equivalents, end of year | | | 4,319,579 | | | 2,650,867 | | | 1,544,131 | |
| | | | | | | | | | | |
| Supplemental disclosures of cash flow information: | | | | | | | | | | |
| Cash paid during the year for: | | | | | | | | | | |
| Interest | | | 266,934 | | | 470,776 | | | 459,945 | |
| Income taxes | | | 417,027 | | | 306,474 | | | 279,444 | |
See accompanying notes to consolidated financial statements.
WINNER MEDICAL GROUP INC.
NOTES TO CONSOLIDATED FINANCIAL STATEMENTS
FOR THE YEARS ENDED SEPTEMBER 30, 2006 AND 2005
1. Organization and Basis of Preparation of Financial Statements
Winner Medical Group Inc. (formerly known as Las Vegas Resorts Corporation, HDH Industries, Inc. and Birch Enterprises, Inc.) (“Winner Medical” or “the Company”) was originally incorporated in August 1986 in accordance with the Laws of the State of Nevada under the name of Birch Enterprises, Inc. In October 1986, the Company changed its name to HDH Industries, Inc. The Company was initially formed as a "blank check" entity for the purpose of seeking a merger, acquisition or other business combination transaction with a privately owned entity seeking to become a publicly-owned entity.
On September 14, 1987, the Company consummated a business combination transaction, pursuant to an Agreement and Plan of Reorganization (Agreement) with Las Vegas Resorts Investments whereby Las Vegas Resorts Investments became a wholly-owned subsidiary of the Company. Concurrent with this transaction, the Company changed its name to Las Vegas Resorts Corporation.
The Company completed a public offering of its common stock pursuant to a Registration Statement on Form S-18 (Registration No. 33-10513-LA) during 1989.
On January 25, 2005, the Company experienced a change in control when the then controlling shareholder, Forrest J. Woodward, II sold 213,019,552 shares (or approximately 56.52%) of the then issued and outstanding shares to Glenn A. Little.
On August 26, 2005, the Company filed a Schedule 14C - Information Statement Pursuant to Section 14(c) of the Securities Exchange Act of 1934, as amended, notifying its shareholders that holders of approximately 56.52% of the Company's outstanding shares of common stock signed a written consent approving the amendment of the Company's Articles of Incorporation to effect the one-for-fifteen hundred reverse stock split, on or about September 12, 2005. As a result of the reverse split, the total number of issued and outstanding shares of the common stock was reversed from 376,862,000 shares to 252,271 shares. The effect of this action is reflected in the accompanying financial statements as of the first day of the first period presented.
On November 4, 2005, Glenn A. Little settled an outstanding promissory note in the amount of $60,000, inclusive of debts assumed by Mr. Little, $25,000 cash previously advanced for operating purposes and accrued interest payable on the initial $25,000 debt, for 240,000 shares of post-reverse split restricted, unregistered shares of common stock.
On November 4, 2005, the Company consummated a private placement of common stock with Halter Financial Investments, L. P. for the sale of 1,070,000 registered shares. This transaction resulted in a change in control of the Company.
On December 16, 2005, the Company completed a reverse acquisition transaction with Winner Group Limited (“Winner”), a Cayman Islands corporation, whereby the Company issued to the shareholders of Winner 42,280,840 shares of common stock in exchange for all of the issued and outstanding shares of Winner. Winner thereby became the Company’s wholly owned subsidiary and the former shareholders of the Company (“Shareholders”) became the Company’s controlling shareholders. This share exchange transaction resulted in those Shareholders obtaining a majority voting interest in the Company. Generally accepted accounting principles require that the company whose shareholders retain the majority interest in a combined business be treated as the acquirer for accounting purpose, resulting in a reverse acquisition. Accordingly, the share exchange transaction has been accounted for as a recapitalization of the Company. The equity section of the accompanying financial statements have been restated to reflect the recapitalization of the Company due to the reverse acquisition as of the first day of the first period presented. Prior to the consummation of the share exchange with the Company, Winner completed a private placement of its ordinary shares to 15 accredited investors, which were then exchanged for 5,289,735 shares of common stock in the Company, raising US$10,400,000 in gross proceeds. A further 793,260 of the Company’s shares were issued for US$1,600,000 in gross proceeds. As a result of the above stock issue, the Company raised a total of US$12,000,000 in gross proceeds, which left the Company with US$10,882,516 in net proceeds after the deduction of US$1,117,484 offering expenses. On April 19, 2006, a total of 40,800 of the Company’s shares, based on the terms “buy 1 get 1 free”, were issued to employees for US$177,480 in gross proceeds.
The financial year end date of the Company was changed from July 31 to September 30 with effect from February 13, 2006. On February 13, 2006, the Company changed its name to Winner Medical Group Inc.
Winner Group Limited is a limited liability company registered under the laws of the Cayman Islands and was incorporated in Cayman Islands on April 8, 2003. On July 1, 2003, the major shareholder of Winner contributed all of his equity interest in 11 entities to Winner. Winner then became the holding company of the reorganized group with a total of 11 subsidiaries. The transaction was a group reorganization entered into among entities under common control. The reorganization was treated similar to the pooling of interest method with carry over basis.
WINNER MEDICAL GROUP INC.
NOTES TO CONSOLIDATED FINANCIAL STATEMENTS
FOR THE YEARS ENDED SEPTEMBER 30, 2006 AND 2005
2. Summary of Significant Accounting Policies
The principal activities of the Company and its subsidiaries consist of research and development, manufacturing and trading of medical dressings and medical disposables. All activities of the Group are principally conducted by subsidiaries operating in the People’s Republic of China (“PRC”).
Principles of consolidation-The consolidated financial statements, prepared in accordance with generally accepted accounting principles in the United States of America, include the assets, liabilities, revenues, expenses and cash flows of the Company and all its subsidiaries. All significant intercompany accounts, transactions and cash flows are eliminated on consolidation.
Equity investments, in which the Company exercises significant influence but does not control and is not the primary beneficiary, are accounted for using the equity method. The Company regularly reviews its investments to determine whether a decline in fair value below the cost basis is other than temporary.
Intangible assets- Trademarks are measured initially at cost and amortized on a straight-line basis over their estimated useful lives, which is on average ten years.
Cash and cash equivalents-Cash and cash equivalents include cash on hand, cash accounts, interest bearing savings accounts and time certificates of deposit with a maturity of three months or less when purchased.
Inventories-Inventories are stated at the lower of cost or market, determined by the weighted average method. Work-in-progress and finished goods inventories consist of raw materials, direct labor and overhead associated with the manufacturing process.
Trade accounts receivable-Trade accounts receivable are stated at the amount management expects to collect from balances outstanding at year-end. Based on management's assessment of the credit history with customers having outstanding balances and current relationships with them, it has concluded that realization losses on balances outstanding at year-end will be immaterial.
Allowances for doubtful accounts receivable balances are recorded when circumstances indicate that collection is doubtful for particular accounts receivable or as a general reserve for all accounts receivable. Management estimates such allowances based on historical evidence such as amounts that are subject to risk. Accounts receivable are written off if reasonable collection efforts are not successful.
Property, plant and equipment-Property, plant and equipment are stated at cost including the cost of improvements. Maintenance and repairs are charged to expense as incurred. Assets under construction are not depreciated until construction is completed and the assets are ready for their intended use. Depreciation and amortization are provided on the straight-line method based on the estimated useful lives of the assets as follows:
| Leasehold land | | | Over the lease term | |
| Buildings | | | 10 - 30 years | |
| Plant and machinery | | | 10 - 12 years | |
| Furniture, fixtures and equipment | | | 5 - 8 years | |
| Motor vehicles | | | 5 - 8 years | |
| Leasehold improvements | | | Over the lease term | |
Valuation of long-lived assets-The Company periodically evaluates the carrying value of long-lived assets to be held and used, including intangible assets subject to amortization, when events and circumstances warrant such a review. The carrying value of a long-lived asset is considered impaired when the anticipated undiscounted cash flow from such asset is separately identifiable and is less than its carrying value. In that event, a loss is recognized based on the amount by which the carrying value exceeds the fair market value of the long-lived asset. Fair market value is determined primarily using the anticipated cash flows discounted at a rate commensurate with the risk involved. Losses on long-lived assets to be disposed of are determined in a similar manner, except that fair market values are reduced for the cost to dispose.
Revenue recognition-Sales of goods are recognized when goods are shipped and title of goods sold has passed to the purchaser. Customers do not have a general right of return on products shipped. Products returns to the Company were insignificant during past years.
Comprehensive income-Accumulated other comprehensive income represents foreign currency translation adjustments and is included in the consolidated statement of shareholders’ equity.
WINNER MEDICAL GROUP INC.
NOTES TO CONSOLIDATED FINANCIAL STATEMENTS
FOR THE YEARS ENDED SEPTEMBER 30, 2006 AND 2005
2. Summary of Significant Accounting Policies - Continued
Shipping and handling cost-Shipping and handling costs related to delivery of finished goods are included in selling expenses. During the years ended September 30, 2006, 2005 and 2004, shipping and handling costs expensed to selling expenses were US$4,055,053, US$3,951,944 and US$2,984,961 respectively.
Research and development costs-Research and development costs are charged to expense when incurred and are included in operating expenses. During the years ended September 30, 2006, 2005 and 2004, research and development costs expensed to operating expenses were approximately US$1,580,000, US$855,000 and US$312,000 respectively.
Income taxes-Income taxes are provided on an asset and liability approach for financial accounting and reporting of income taxes. Any tax paid by subsidiaries during the year is recorded. Current tax is based on the profit or loss from ordinary activities adjusted for items that are non-assessable or disallowable for income tax purpose and is calculated using tax rates that have been enacted or substantively enacted at the balance sheet date. Deferred income tax liabilities or assets are recorded to reflect the tax consequences in future years of differences between the tax basis of assets and liabilities and the financial reporting amounts at each year end. A valuation allowance is recognized if it is more likely than not that some portion, or all, of a deferred tax asset will not be realized.
Foreign currency translation-The consolidated financial statements of the Company are presented in United States Dollars (“US$”). Transactions in foreign currencies during the year are translated into US$ at the exchange rates prevailing at the transaction dates. Monetary assets and liabilities denominated in foreign currencies at the balance sheet date are translated into US$ at the exchange rates prevailing at that date. All transaction differences are recorded in the income statement.
The Company’s subsidiaries in the PRC have their local currency, Renminbi (“RMB”), as their functional currency. On consolidation, the financial statements of the Company’s subsidiaries in PRC are translated from RMB into US$ in accordance with SFAS No. 52, "Foreign Currency Translation". Accordingly all assets and liabilities are translated at the exchange rates prevailing at the balance sheet dates and all income and expenditure items are translated at the average rates for each of the years. The exchange rate between the Renminbi and the US$ and used for the years ended September 30, 2006, 2005 and 2004 were RMB7.9087 to US$1, RMB8.0922 to US$1, and RMB8.277 to US$1.00 respectively. Translation adjustments arising from the use of different exchange rate from period to period are included as a component of stockholders’ equity as “Accumulated other comprehensive income”. Gain and losses resulting from foreign currency transactions are included in other comprehensive income.
Fair Value of Financial Instruments- The carrying amounts of cash and cash equivalents, accounts and bills receivable, deposits and other receivable and other current assets, bank loans, accounts payable and other current liabilities are reasonable estimates of their fair values. All the financial instruments are for trade purposes. Fair value of the amounts due to or from affiliates and shareholder cannot be readily determined because of the nature of the related party transactions.
Post-retirement and post-employment benefits-The Company’s subsidiaries contribute to a state pension scheme in respect of their PRC employees. Other than the above, neither the Company nor its subsidiaries provide any other post-retirement or post-employment benefits.
Net income per share-Basic net income per share is computed by dividing net income available to common shareholders by the weighted average number of common shares outstanding during the period. Diluted net income per share gives effect to all dilutive potential ordinary shares outstanding during the year. The weighted average number of common shares outstanding is adjusted to include the number of additional common shares that would have been outstanding if the dilutive potential common shares had been issued.
As of September 30, 2006, 2005 and 2004, basic and diluted net income per share calculated in accordance with SFAS No. 128, "Earnings Per Share", are reconciled as follows:
| | | Year ended September 30, | |
| | | 2006 | | 2005 | | 2004 | |
| | | US$ | | US$ | | US$ | |
| | | | | | | | |
| Net income | | | 5,829,294 | | | 7,892,670 | | | 4,391,491 | |
| Weighted average common shares outstanding | | | | | | | | | | |
| - basic | | | 43,053,212 | | | 36,991,105 | | | 36,991,105 | |
| - diluted | | | 43,061,546 | | | 36,991,105 | | | 36,991,105 | |
| Net income per share | | | | | | | | | | |
| - basic | | | 0.14 | | | 0.21 | | | 0.12 | |
| - diluted | | | 0.14 | | | 0.21 | | | 0.12 | |
WINNER MEDICAL GROUP INC.
NOTES TO CONSOLIDATED FINANCIAL STATEMENTS
FOR THE YEARS ENDED SEPTEMBER 30, 2006 AND 2005
2. Summary of Significant Accounting Policies - Continued
Use of estimates-The preparation of financial statements in conformity with generally accepted accounting principles requires management to make estimates and assumptions that affect the reported amounts of assets and liabilities and disclosures of contingent assets and liabilities at the date of the financial statements and the reported amounts of revenues and expenses during the reporting period. The most significant estimates relate to allowance for uncollectible accounts receivable, inventory obsolescence, asset impairment, depreciation and useful lives, taxes and contingencies. These estimates may be adjusted as more current information becomes available and any adjustment could be significant. Actual results could differ from those estimates.
Recent changes in accounting standards-In May 2005, the Financial Accounting Standards Board (“FASB”) SFAS No. 154, Accounting Changes and Error Corrections (“SFAS No. 154”), which replaces Accounting Principles Board Opinion No. 20, Accounting Changes and SFAS No. 3, Reporting Accounting Changes in Interim Financial Statements. SFAS No. 154 changes the requirements for the accounting for and reporting of a change in accounting principles. It requires retrospective application to prior periods’ financial statements of changes in accounting principles, unless it is impracticable to determine either the period-specific effects or the cumulative effect of the change. This statement is effective for accounting changes and corrections of errors made in fiscal years beginning after December 15, 2005. The impact on the Company’s operations will depend on future accounting pronouncements or changes in accounting principles.
In February 2006, the Financial Accounting Standards Board (“FASB”) issued Statement of Financial Accounting Standards (“SFAS”) No. 155, Accounting for Certain Hybrid Financial Instruments - an amendment of FASB Statements No. 133 and 140, which simplifies accounting for certain hybrid financial instruments by permitting fair value remeasurement for any hybrid instrument that contains an embedded derivative that otherwise would require bifurcation and eliminates a restriction on the passive derivative instruments that a qualifying special-purpose entity may hold. SFAS No. 155 is effective for all financial instruments acquired, issued or subject to a remeasurement (new basis) event occurring after the beginning of an entity’s first fiscal year that begins after September 15, 2006. The adoption of SFAS No. 155 will have no impact on the results of operations or the financial position.
In June 2006, the FASB ratified the consensus reached by EITF on Issue No. 06-3, How Taxes Collected from Customers and Remitted to Governmental Authorities Should Be Presented in the Income Statement (That is, Gross versus Net Presentation) (“EITF 06-3”). EITF 06-3, includes any tax assessed by a governmental authority that is directly imposed on a revenue-producing transaction between a seller and a customer and may include, but is not limited to, sales, use, value added, and some excise taxes. EITF 06-3 concludes that the presentation of taxes on either a gross basis (included in revenues and costs) or a net basis (excluded from revenues) is an accounting policy decision that should be disclosed. In addition, for any such taxes that are reported on a gross basis, a company should disclose the amounts of those taxes in interim and annual financial statements for each period for which an income statement is presented if those amounts are significant. The provisions of EITF 06-0 should be applied to financial reports for interim and annual reporting periods beginning after December 15, 2006, with earlier adoption permitted. The adoption of EITF 06-3 will have no impact on the results of operations or the financial position.
In July 2006, the FASB issued Interpretation No. 48, Accounting for Uncertainty in Income Taxes (“FIN 48”). FIN 48 clarifies the accounting for uncertainty in income taxes recognized in an enterprise’s financial statements in accordance with FASB Statement No. 109, Accounting for Income Taxes. FIN 48 prescribes a recognition threshold and measurement attribute for the financial statement recognition and measurement of a tax position taken or expected to be taken in a tax return. This Interpretation also provides guidance on derecognition, classification, interest and penalties, accounting in interim periods, disclosure, and transition. This interpretation is effective for fiscal years beginning after December 15, 2006, with earlier adoption permitted. The Company is currently evaluating the provisions of FIN 48.
In September, 2006, the Securities and Exchange Commission issued Staff Accounting Bulletin No. 108 “Considering the Effects of Prior Year Misstatements When Quantifying Misstatements in Current Year Financial Statements” (SAB 108”), which provides interpretive guidance on how the effects of the carryover or reversal of prior year misstatements should be considered in quantifying a current year misstatement. The guidance is applicable of our fiscal 2008. The Group does not believe SAB 108 will have a material impact on the consolidated financial statements.
WINNER MEDICAL GROUP INC.
NOTES TO CONSOLIDATED FINANCIAL STATEMENTS
FOR THE YEARS ENDED SEPTEMBER 30, 2006 AND 2005
3. Inventories
Inventories by major categories are summarized as follows:
| | | September 30, | |
| | | 2006 | | 2005 | |
| | | US$ | | US$ | |
| | | | | | |
| Raw materials | | | 4,675,411 | | | 4,589,013 | |
| Work in progress | | | 3,737,681 | | | 3,193,074 | |
| Finished goods | | | 3,026,062 | | | 2,824,286 | |
| | | | 11,439,154 | | | 10,606,373 | |
| Less: allowances for slowing moving items | | | (109,634 | ) | | (129,839 | ) |
| | | | 11,329,520 | | | 10,476,534 | |
4. Property, Plant and Equipment
Property, plant and equipment consist of the following:
| | | September 30, | |
| | | 2006 | | 2005 | |
| | | US$ | | US$ | |
| At cost: | | | | | |
| Leasehold land and buildings | | | 18,989,527 | | | 16,649,795 | |
| Plant and machinery | | | 16,588,114 | | | 14,806,958 | |
| Furniture, fixtures and equipment | | | 1,622,077 | | | 776,769 | |
| Motor vehicles | | | 742,248 | | | 539,186 | |
| Leasehold improvements | | | 1,516,174 | | | 1,224,362 | |
| Total | | | 39,458,140 | | | 33,997,070 | |
| | | | | | | | |
| Less: accumulated depreciation and amortization | | | (9,536,174 | ) | | (7,337,055 | ) |
| Less: impairment on plant and machinery | | | (164,376 | ) | | (160,649 | ) |
| Construction in progress | | | 6,042,940 | | | 335,458 | |
| Net book value | | | 35,800,530 | | | 26,834,824 | |
All the land in the PRC is owned by the PRC government. The government, according to PRC laws, may grant to entities the right to use of land for a specified period of time. Thus all of the Company’s land purchased in the PRC is considered to be leasehold land and amortized on a straight-line basis over the respective term of the right to use the land. Included in the plant and machinery is a set of idle machineries amounting to US$679,025 against which total impairment provision of US$164,376 was made as of September 30, 2006.
Construction in progress is stated at cost, which includes the cost of construction and other direct costs attributable to the construction. No provision for depreciation is made on construction in progress until such time as the relevant assets are completed and put into use. Construction in progress at September 30, 2006 and 2005, represents machinery under installation or quality inspection stages.
WINNER MEDICAL GROUP INC.
NOTES TO CONSOLIDATED FINANCIAL STATEMENTS
FOR THE YEARS ENDED SEPTEMBER 30, 2006 AND 2005
5. Credit Facilities and Pledged Assets
The Company’s subsidiaries in Shenzhen and Huang Gang have credit lines with Shenzhen Commercial Bank, Shenzhen Branch of the Industrial and Commercial Bank of China and Huanggang Branch of Agricultural Bank of China representing trade acceptances, loans and overdrafts. As of September 30, 2006 these facilities totaled RMB120,000,000, equivalent to US$15,173,164. The maturities of these facilities are generally up to August 15, 2007. The total unused credit lines as of September 30, 2006 was US$12,012,088. For bank loans obtained by other subsidiaries, there were no unused credit lines. The weighted average interest rates on short-term borrowings as of September 30, 2006, 2005 and 2004 were 5.52%, 5.24% and 5.07% per annum, respectively. There are no significant covenants or other financial restrictions relating to the Company’s facilities except that at September 30, 2006, 2005 and 2004, leasehold land and buildings, plant and machinery with net book value of US$1,777,892, US$3,790,720 and US$2,962,447, respectively, have been pledged as collateral for the above facilities.
As of September 30, 2006 and 2005, the Company has the following short-term bank loans:
| | | September 30, | |
| | | 2006 | | 2005 | |
| | | US$ | | US$ | |
| | | | | | |
| Bank loans repayable within one year | | | 5,437,050 | | | 8,773,881 | |
| | | | | | | | |
| Original currency in Chinese Renminbi | | | 43,000,000 | | | 71,000,000 | |
Bank loans as of September 30, 2006 consist of the following:
| Loan | | Loan period | | Interest rate | | Secured by | | |
| | | | | | | | | US$ |
| A | | 2005-10-19 to 2006-10-13 | | 5.58% | | Land use rights & buildings | | 252,886 |
| B | | 2005-10-20 to 2006-10-18 | | 5.58% | | Land use rights & buildings | | 505,772 |
| C | | 2005-10-20 to 2006-10-17 | | 5.58% | | Land use rights & buildings | | 505,772 |
| D | | 2005-10-20 to 2006-10-16 | | 5.58% | | Land use rights & buildings | | 505,772 |
| E | | 2005-10-20 to 2006-10-12 | | 5.58% | | Land use rights & buildings | | 505,772 |
| F | | 2006-6-12 to 2006-12-12 | | 5.40% | | Property, plant & machineries | | 632,215 |
| G | | 2006-7-3 to 2007-1-3 | | 5.40% | | Property, plant & machineries | | 632,215 |
| H | | 2006-8-14 to 2007-2-13 | | 5.40% | | Nil | | 632,215 |
| I | | 2006-8-29 to 2007-2-28 | | 5.58% | | Property, plant & machineries | | 1,264,431 |
| | | | | | | | | 5,437,050 |
Bank loans as of September 30, 2005 consist of the following:
| Loan | | Loan period | | Interest rate | | Secured by | | 2005 |
| | | | | | | | | US$ |
| | | | | | | | | |
| A | | 2004-7-26 to 2005-7-26 | | 5.31% | | Land use rights | | 2,780,455 |
| B | | 2004-10-28 to 2005-10-27 | | 4.43% | | Property , plant & machinery | | 247,152 |
| C | | 2005-1-13 to 2006-1-13 | | 5.58% | | Land use rights | | 247,152 |
| D | | 2005-4-19 to 2005-10-19 | | 5.22% | | Property , plant & machinery | | 617,879 |
| E | | 2005-4-25 to 2005-10-25 | | 5.22% | | Property , plant & machinery | | 370,727 |
| F | | 2005-6-16 to 2006-6-16 | | 8.37% | | Land use rights | | 247,152 |
| G | | 2005-7-4 to 2005-11-4 | | 5.22% | | Land use rights | | 1,235,758 |
| H | | 2005-7-27 to 2006-1-27 | | 5.22% | | Property , plant & machinery | | 617,879 |
| I | | 2005-7-28 to 2006-1-28 | | 5.22% | | Property , plant & machinery | | 617,879 |
| J | | 2005-7-29 to 2005-12-29 | | 5.22% | | Property , plant & machinery | | 494,303 |
| K | | 2005-8-31 to 2006-2-28 | | 5.22% | | Property , plant & machinery | | 308,939 |
| L | | 2005-9-12 to 2006-3-11 | | 5.76% | | Property , plant & machinery | | 494,303 |
| M | | 2005-9-28 to 2006-3-27 | | 5.76% | | Property , plant & machinery | | 494,303 |
| | | | | | | | | 8,773,881 |
Loan A was subsequently settled by the Company on October 19, 2005.
WINNER MEDICAL GROUP INC.
NOTES TO CONSOLIDATED FINANCIAL STATEMENTS
FOR THE YEARS ENDED SEPTEMBER 30, 2006 AND 2005
6. Prepaid Expenses and Other Current Assets
Prepaid expenses and other current assets consist of the following:
| | | September 30, | |
| | | 2006 | | 2005 | |
| | | US$ | | US$ | |
| | | | | | |
| Value added tax receivable | | | 993,456 | | | 1,601,332 | |
| Deferred expenditure | | | 69,551 | | | 410,879 | |
| Advance to suppliers | | | 1,010,270 | | | 1,548,493 | |
| Advance to fixed assets vendors | | | 2,672,686 | | | - | |
| Others | | | 1,436,509 | | | 707,368 | |
| | | | 6,182,472 | | | 4,268,072 | |
7. Investment in an Equity Investee
| | | September 30, | |
| | | 2006 | | 2005 | |
| | | US$ | | US$ | |
| | | | | | |
| Investment cost | | | 1,045,130 | | | 1,045,130 | |
| Share of undistributed earnings (accumulated losses) | | | 17,005 | | | (35,812 | ) |
| | | | 1,062,135 | | | 1,009,318 | |
As of September 30, 2006, the Company holds a 40% equity interest in L+L Healthcare Hubei Co. Ltd. (“L+L”), a wholly foreign owned enterprise established in the PRC. The Company originally owned 100% of L+L. On February 28, 2005, the Company disposed 60% of the interest in L+L to a third party at the consideration of US$2,400,000 with a gain of US$1,165,821. The related tax payable of gain on disposal of investment is US$116,582. At the time of disposal, the accumulated loss shared by the Company was US$44,920. The share of undistributed earnings during the year ended September 30, 2006 was US$52,817.
8. Intangible Assets
| | | September 30, | |
| | | 2006 | | 2005 | |
| | | US$ | | US$ | |
| | | | | | |
| Trademark, cost | | | 51,271 | | | 45,536 | |
| Less: accumulated amortization | | | (12,540 | ) | | (7,248 | ) |
| Net book value | | | 38,731 | | | 38,288 | |
9. Other Accrued Liabilities
Other accrued liabilities consist of the following:
| | | September 30, | |
| | | 2006 | | 2005 | |
| | | US$ | | US$ | |
| | | | | | |
| Temporary receipt | | | - | | | 446,358 | |
| Transportation costs | | | 315,437 | | | 185,746 | |
| Accrued expenses | | | 706,692 | | | 305,367 | |
| Deposit received | | | 83,653 | | | 35,837 | |
| Commission payable | | | 326,457 | | | 188,763 | |
| Value added tax payable | | | 281,512 | | | 130,102 | |
| Withholding tax payable | | | 116,582 | | | 116,582 | |
| Security deposits | | | - | | | 103,175 | |
| Other loans | | | 59,167 | | | 558,987 | |
| Others | | | 490,349 | | | 208,928 | |
| | | | 2,379,849 | | | 2,279,845 | |
WINNER MEDICAL GROUP INC.
NOTES TO CONSOLIDATED FINANCIAL STATEMENTS
FOR THE YEARS ENDED SEPTEMBER 30, 2006 AND 2005
10. Income Taxes
United States
The Company is incorporated in the United States of America and is subject to United States of America tax law. No provisions for income taxes have been made as the Company has no taxable income for the years. The applicable income tax rate for the Company for the years ended September 30, 2006 is 34%.
Cayman Islands
Winner Group Limited, a wholly owned subsidiary of the Company, is incorporated in the Cayman Islands and, under the current laws of the Cayman Islands, is not subject to income taxes.
Hong Kong
Winner Medical International Trading Co., Ltd., a wholly owned subsidiary of the Company, is incorporated in Hong Kong and is subject to Hong Kong profits tax. The Company is subject to Hong Kong taxation on its activities conducted in Hong Kong and income arising in or derived from Hong Kong. No provision for profits tax has been made as the subsidiary has no net assessable income for the year. The applicable statutory tax rate for the years ended September 30, 2006 is 17.5%.
PRC
Enterprise income tax in PRC is generally charged at 33%, in which 30% is for national tax and 3% is for local tax, of the assessable profit. All the subsidiaries of the Company in PRC have applied for the exemption for the local tax. For foreign investment enterprises established in a Special Economic Zone or Coastal Open Economic Zone, where the subsidiaries of the Company are located, and which are engaged in production-oriented activities, the national tax rate could be reduced to 15% or 24% respectively. The Company’s subsidiaries incorporated in PRC are subject to PRC enterprises income tax at the applicable tax rates on the taxable income as reported in their Chinese statutory accounts in accordance with the relevant enterprises income tax laws applicable to foreign enterprises. Pursuant to the same enterprises income tax laws, the subsidiaries are fully exempted from PRC enterprises income tax for two years starting from the first profit-making year, followed by a 50% tax exemption for the next three years. For those foreign enterprises established in the middle west of PRC, a 50% tax exemption is granted for a further three years after the tax holiday and concession stated above. On the other hand, export-oriented enterprise, which exports sales contributed over 70% of the total sales, can enjoy a lower tax rate of 10%.
According to the PRC’s applicable income tax laws, regulations, notices and decisions related to foreign investment enterprises and their investors, income such as dividends and profits distribution from the PRC derived from a foreign enterprise which has no establishment in the PRC is subject to a 10% withholding tax.
Foreign enterprises in Shenzhen, PRC, are also eligible for a refund of tax paid for 40% of the purchase amount of domestic machinery in that year, if the enterprises income tax for the year of acquisition is higher than that of the previous year and if those invested projects are encouraged by the government. The maximum tax deduction is 5 years. For example, our subsidiaries of Shenzhen and Huang Gang can enjoy this tax exemption.
Foreign-invested enterprises in China are eligible for a refund of tax paid equal to 40% of the reinvestment of profit. Being an export originated and high-technology enterprise, Winner Shenzhen is eligible for a 100% tax refund for its reinvestment of profits. On the other hand, export-oriented enterprise, which exports sales contributed over 70% of the total sales, can enjoy refund of 100% tax paid.
In 2006, Shenzhen Bureau of Science Technology & Information formally recognized Winner Industries (Shenzhen) Co., Ltd. as a High- technology Enterprise, which gives Winner Shenzhen a 50% tax exemption till 2009 and a 50% tax drawback from 2010 to 2011.
Had all of the above tax holidays and refunds not been available, the tax charge would have been higher by US$689,291, US$639,032 and US$70,623 and the basic and diluted net income per share would have been lower by US$0.02, US$0.02 and US$Nil for the years ended September 30, 2006, 2005 and 2004, respectively.
WINNER MEDICAL GROUP INC.
NOTES TO CONSOLIDATED FINANCIAL STATEMENTS
FOR THE YEARS ENDED SEPTEMBER 30, 2006 AND 2005
10. Income Taxes - Continued
The provision for income taxes consists of the following:
| | | Year ended September 30, | |
| | | 2006 | | 2005 | | 2004 | |
| | | US$ | | US$ | | US$ | |
| | | | | | | | |
| Current tax | | | | | | | |
| - PRC | | | 445,947 | | | 473,455 | | | 458,334 | |
| Deferred tax | | | 70,688 | | | (27,309 | ) | | (172,872 | ) |
| | | | 516,635 | | | 446,146 | | | 285,462 | |
A reconciliation between the provision for income taxes computed by applying the statutory tax rate in PRC to income before income taxes and the actual provision for income taxes is as follows:
| | | Year ended September 30, | |
| | | 2006 | | 2005 | | 2004 | |
| | | US$ | | US$ | | US$ | |
| | | | | | | | |
| Tax calculated at domestic statutory rate of 33% | | | 2,114,437 | | | 2,759,588 | | | 1,544,981 | |
| Effect of different tax rates in various jurisdictions | | | (951,155 | ) | | (1,546,767 | ) | | (1,026,403 | ) |
| Tax holidays and concessions | | | (689,291 | ) | | (639,032 | ) | | (70,623 | ) |
| Tax effect of expenses not deductible for tax purpose | | | 168,976 | | | 27,104 | | | 25,341 | |
| Tax effect of revenue not subject to tax | | | (156,085 | ) | | (170,701 | ) | | (204,264 | ) |
| Tax effect of tax loss not utilized | | | - | | | 12,197 | | | 4,382 | |
| Others | | | 29,753 | | | 3,757 | | | 12,048 | |
| | | | 516,635 | | | 446,146 | | | 285,462 | |
The amount of deferred tax assets recognized is as follows:
| | | September 30, | |
| | | 2006 | | 2005 | |
| | | US$ | | US$ | |
| | | | | | |
| Future benefit of tax losses | | | 116,707 | | | 178,985 | |
| Temporary differences in property, plant and equipment | | | 25,818 | | | 39,495 | |
| Temporary differences in accrued liabilities | | | 28,963 | | | 15,541 | |
| Temporary differences in inventories | | | 24,122 | | | 60,000 | |
| Deferred tax assets | | | 195,610 | | | 294,021 | |
The amount of deferred tax liabilities recognized is as follows:
| | | September 30, | |
| | | 2006 | | 2005 | |
| | | US$ | | US$ | |
| | | | | | |
| Temporary differences in property, plant and equipment | | | 21,707 | | | 46,673 | |
| Temporary differences in accrued liabilities | | | (3,885 | ) | | 16,715 | |
| Temporary differences in inventories | | | (13,412 | ) | | (26,117 | ) |
| Deferred tax liabilities | | | 4,410 | | | 37,271 | |
WINNER MEDICAL GROUP INC.
NOTES TO CONSOLIDATED FINANCIAL STATEMENTS
FOR THE YEARS ENDED SEPTEMBER 30, 2006 AND 2005
11. Related Party Transactions
During the years ended September 30, 2006 and 2005, the Company sold goods to L+L Healthcare Hubei Co., Ltd., an equity investee, for US$1,760 and US$83,013 and purchased goods from it for US$1,093,712 and US$444,553 respectively. As of September 30, 2006 and 2005, amount due to the equity investee was US$Nil and US$107,914 respectively. As of September 2006 and 2005, the amount due from the investee was US$241,312 and US$Nil respectively.
During the years ended September 30, 2006, 2005 and 2004, the Company purchased goods from Safe Secure Packing (Shenzhen) Co., Ltd. for US$1,319,939, US$1,007,675 and US$415,793, respectively. Mr. Jianquan Li, director of the Company, has a controlling interest in Safe Secure Packing (Shenzhen) Co., Ltd. during the years. As of September 30, 2006, 2005 and 2004, the outstanding net balances due to Safe Secure Packing (Shenzhen) Co., Ltd. were US$203,999 and US$147,697 and US$5,270, respectively.
During the years ended September 30, 2006, 2005 and 2004, the Company sold goods to Kangsoon Import & Export Trading Co. Ltd. Shenzhen for US$Nil, US$519,889 and US$2,631,563 and purchased goods from it for US$Nil, US$963,548 and US$4,243,467, respectively. Mr. Xiuyuan Fang, director of the Company, has a controlling interest in Kangsoon Import & Export Trading Co. Ltd. Shenzhen during the years. As of September 30, 2006, 2005 and 2004, the outstanding balances due to Kangsoon Import & Export Trading Co. Ltd. Shenzhen were US$Nil, US$Nil and US$32,227, respectively.
During the years ended September 30, 2006 and 2005, the Company sold goods to Winner Medical & Textile (H.K.) Limited for US$988,895 and US$215,509 respectively. Mr. Jianquan Li, director of the Company, has a controlling interest in Winner Medical & Textile (H.K.) Limited. As of September 30, 2006 and 2005, the outstanding balance due from Winner Medical & Textile (H.K.) Limited were US$239,588 and US$116,804, respectively.
The amounts due from/to the above affiliated companies with the exception of L+L Healthcare Hubei are unsecured, interest free and payable according to the trading credit terms. Starting from 2006, the amount due from L+L Healthcare Hubei Co., Ltd. are unsecured, 5% interest bearing and payable according to the trading credit terms.
Amount due to a shareholder mainly represents advances from Mr. Jianquann Li for the acquisition of plant and machinery. The outstanding balance is unsecured, interest free and has no fixed repayment term.
| 12. | Stock-Based Compensation |
Stocks-Based Compensation- In December 2004, the Financial Accounting Standards Board issued SFAS No. 123 (revised 2004), “Share-Based Payment”, which is a revision of SFAS No. 123, “Accounting for Stock-Based Compensation”, SFAS No. 123(R) supersedes APB Opinion No. 25, “Accounting for Stock Issued to Employees and amends SFAS No. 95, “Statement of Cash Flows”. Generally, the approach in SFAS No. 123(R) is similar to the approach described in SFAS No. 123. However, SFAS No. 123(R) requires all share-based payments to employees, including grants of employee stock options, to be recognized in the income statement based on their fair values. Pro forma disclosure is no longer an alternative. SFAS No.123(R) was to be effective from the beginning of the first interim or annual reporting period after June 15, 2005. In April 2005, the Securities and Exchange Commission delayed the implementation of SFAS No. 123(R). As a result, SFAS No. 123(R) will be effective from the beginning of the first annual reporting period after June 15, 2005. The adoption of SFAS No. 123(R) does not have a material impact on the Company’s financial position, results of operations or cash flows as the Company has not granted any options to employees or directors, prior to 2006.
The Company uses the Black-Scholes option-pricing model, which was developed for use in estimating the fair value of traded options that have no restrictions are fully transferable and negotiable in a free trading market, to value its options under the independent director’s contract. Use of an option valuation model, as required by SFAS No. 123(R), “Accounting for Stock-Based Compensation”, includes highly subjective assumptions based on long-term prediction, including the expected stock price volatility and average life of each option grant.
WINNER MEDICAL GROUP INC.
NOTES TO CONSOLIDATED FINANCIAL STATEMENTS
FOR THE YEARS ENDED SEPTEMBER 30, 2006 AND 2005
| 12. | Stock-Based Compensation - Continued |
| | | 2006 | | 2005 | | 2004 | |
| | | US$ | | US$ | | US$ | |
| | | | | | | | |
| Risk free interest rate | | | 4.5 | % | | N/A | | | N/A | |
| Volatility | | | 107 | % | | N/A | | | N/A | |
| Expected life (years) | | | 3 | | | N/A | | | N/A | |
| Dividends | | | - | | | N/A | | | N/A | |
| Weighted average fair value of options granted during the period | | | 2.73 | | | N/A | | | N/A | |
On April 18, 2006, the Company adopted a 2006 Equity Incentive Plan pursuant to which it may grant equity incentives in the form of incentive and nonqualified stock options, stock appreciation rights, restricted stock, performance grants, and stock bonuses to its and its affiliates’ employees, officers, directors, consultants, independent contractors and advisors. The Company has reserved 5,000,000 shares of its common stock for issuance pursuant to this plan. On April 21, 2006, the Company issued a total of 20,400 shares of common stock, to 223 employees at contracted price of US$8.70 per share in accordance with the 2006 Equity Incentive Plan, for a gross proceeds of US$177,480. Pursuant to the 2006 Equity Incentive Plan, the Company issued 20,400 bonus shares of common stock to these 223 employees in respect of the earlier 20,400 common stock issued.
In a contract signed on May 8, 2006, the Company agreed to grant to the independent directors each year non-qualified options for the purchase up to 20,000 shares of the common stock of the Company, which options shall be exercisable within three years from the grant date and have an exercise price equal to the fair market value on the grant date. These options shall be vested in equal installments on a quarterly basis over a one year period. Upon execution of this Agreement, the Company granted the prorated amount of initial options of 5,000. Such options might be adjusted from time to time as agreed by the parties. The Company uses the Black-Scholes option-pricing model, to value its options granted to the independent directors, and recorded the relating compensation expenses accordingly. As of September 30, 2006, a total of 8,334 options have been granted.
A summary of option activity under the Plan as of September 30, 2006, and changes during the year then ended is presented below:
| | | Options | | Weighted Average Exercise Price | | Weighted Average Remaining Contractual Term | |
| | | | | US$ | | Years | |
| Outstanding at October 1, 2005 | | | - | | | - | | | - | |
| Granted | | | 8,334 | | | 9.25 | | | - | |
| Exercised | | | - | | | - | | | - | |
| Forfeited or expired | | | - | | | - | | | - | |
| Outstanding at September 30, 2006 | | | 8,334 | | | 9.25 | | | 2.58 | |
On May 30, 2006, a consulting company, Heritage Management Consultants, Inc. (“Heritage”), was entitled to 50,000 shares of common stock which should be delivered on or before July 31, 2006. No common stock was delivered to Heritage up to the end of September 30, 2006.
The Company has accrued compensation expenses of US$165,794 for the services provided by Heritage, and recorded compensation expenses of US$138,720 and US$22,668 in respect of common stock issued to employees and stock options granted to the independent directors in administrative expenses respectively, up to the year ended September 30, 2006.
WINNER MEDICAL GROUP INC.
NOTES TO CONSOLIDATED FINANCIAL STATEMENTS
FOR THE YEARS ENDED SEPTEMBER 30, 2006 AND 2005
| 13. | Commitments and Contingencies |
Operating leases- The Company was obligated under operating leases requiring minimum rentals as follows:
| | | US$ | |
| | | | |
| Year ending September 30, 2006 | | | |
| | | | |
| 2007 | | | 286,940 | |
| 2008 | | | 232,023 | |
| 2009 | | | 119,039 | |
| 2010 | | | 49,867 | |
| Total minimum lease payments | | | 687,869 | |
Rental expenses under operating leases included in the income statement was US$150,911, US$92,416 and US$30,876 for the year ended September 30, 2006, 2005 and 2004 respectively.
In prior years, the Company has leased out some of its unused factory facilities and production line to third parties. The Company has signed a lease agreement in 2004 and leased a factory building to a third party for a period of 10 years. In addition, the Company has also signed an airstreams carding lease agreement and leased its airstreams carding production line, factory, equipment, warehouse and ancillary facilities to an individual. The lease term is 3 years to November 1, 2007. All these agreement have been cancelled before expiry.
Purchase obligations-The Company has signed agreements with suppliers and other parties to purchase plant and machinery, computer equipment and SAP system implementation program with estimated non-cancelable obligations of US$612,540.
In addition, the Company is constructing a new facility, which is scheduled to be complete in 2007. The Company has entered into an agreement with the local government of Huang Gang to acquire a land use right in PRC for constructing this new facility at a consideration of US$657,504. The Company also entered into agreements with suppliers to purchase plant and machinery in Huang Gang with estimated non-cancelable obligations of US$1,281,020.
Foreign currency forward contract obligations- The Company’s subsidiaries in the PRC utilize their local currency as their functional currency. The functional currency is used to pay material purchased, labor and other operating costs. However, these subsidiaries have client contracts wherein revenue is invoiced and collected in US$. Since the management foresees that RMB will appreciate against US$, the Company has contracted with a commercial bank to hedge for future trade receipts as an economic hedge against its future US$ denominated cash flows. These contracts generally expire within one to six months. The foreign exchange forward contracts entered into by the Company are not designated as hedge instruments under SFAS 133 “Accounting for Derivative Instruments and Hedging Activities” and, accordingly, any changes in fair value of such contracts are reflected in earnings.
The Company does not use derivative financial instruments for speculative or trading purposes, nor does it hold or issue leveraged derivative financial instruments.
The Company has entered into several foreign currency forward contracts with a commercial bank to hedge for future trade receipts in U.S. dollars against RMB. During the year, the total remaining outstanding foreign currency forward contracts amounted to US$3,200,000 as of September 30, 2005 has been realized with net exchange gain totaling US$30,088 credited against selling, general and administrative expenses. The Company entered into several foreign currency forward contracts totaling US$18,000,000 with a commercial bank on December 30, 2005. These foreign currency forward contracts were also realized before the year end September 30, 2006 and net exchange loss totaling US$116,863 has been debited against selling, general and administrative expenses. There was no outstanding foreign currency forward contract as of September 30, 2006.
WINNER MEDICAL GROUP INC.
NOTES TO CONSOLIDATED FINANCIAL STATEMENTS
FOR THE YEARS ENDED SEPTEMBER 30, 2006 AND 2005
13. Commitments and Contingencies - Continued
Contractual obligations- By the end of 2005, the Company entered into a one year consulting agreement with Heritage Management Consultants, Inc. (“Heritage”) pursuant to which Heritage will assist the Company in meeting its obligations as a U.S. publicly traded company. This agreement was subsequently replaced by another agreement that covered a specific period of one year commencing January 25, 2006. According to the revised agreement, the Company agrees to pay an annual compensation of $175,000 to Heritage together with certain transferable warrants. The warrants will entitle Heritage to purchase 200,000 shares of the Company’s common stocks with a vesting period of 12 months after the commencement date of the agreement. The exercise price of warrants will be set at a price of US$5.5 per share and the warrants, which are to be delivered within 180 days of the execution date of the agreement, will expire 3 years after date of issue. The warrants shall be assignable and transferable, shall include standard weighted average anti-dilution protection and unlimited piggyback registration rights.
On May 30, 2006, the Company has further amended and superseded previous two agreements with Heritage. Pursuant to the agreement, as amended, Heritage will assist the Company in meeting the obligations as a U.S. publicly traded company in exchange for an annual compensation of $175,000 and 50,000 restricted shares of common stock of the Company, which shall be delivered on or before July 31, 2006. The shares shall be restricted stock and the certificate representing the shares shall bear a customary legend referring to the Securities Act of 1933. Heritage is prohibited from trading these shares during the term of the agreement if these shares become freely tradable during the term. The Company agrees to file with the Securities an Exchange Commission a Registration Statement on S-8 registering the sale by Heritage and its assignees of the Proposed Shares (the “Resale Registration Statement”) before December 31, 2006. On September 30, 2006, the 50,000 restricted shares have not been issued yet. The Company has to remeasure the fair value of shares at the date of issuance and at each subsequent valuation date until these shares become fully vest. As of September 30, 2006, the fair value of the 50,000 restricted shares based on the market price of US$4.9 per share was US$245,000. The compensation expense recorded up to September 30, 2006 was US$165,794.
Director Compensation- On May 8, 2006, the Company entered into separate Independent Director’s Contracts and Indemnification Agreements with each of the independent directors. Under the terms of the Independent Director’s Contracts, Mr. Goldman is entitled to $30,000, Mr. Goodner is entitled to $20,000 and Dr. Shieh is entitled to $12,000 as compensation for the services to be provided by them as our independent directors, and as chairpersons of various board committees, as applicable. The Company also agreed to grant to Mr. Goldman and Mr. Goodner options to purchase up to 10,000 shares each of our common stock for their first year of service. These options shall be vested in equal installments on a quarterly basis, shall have a term of three years from the grant date and have an exercise price equal to the fair market value on the grant date. The initial year’s base fee is considered earned when paid and is nonrefundable. Upon execution of this Agreement, the Company shall pay to the Directors the prorated amount of the initial year’s fee $15,500 and grant the prorated amount of initial 5,000 options. Such base fee and options may be adjusted from time to time as agreed by the parties. Under the terms of the Indemnification Agreements, the Company agreed to indemnify the independent directors against expenses, judgments, fines, penalties or other amounts actually and reasonably incurred by the independent directors in connection with any proceeding if the independent director acted in good faith and in the best interest of the company.
Legal proceedings-A group of 388 residents residing at Jianshe South Road, Yuekou Town, Tianmen City, China vs Hubei Winner Textile Co., Ltd. and Winner Medical & Textile Co., Ltd., the Company’s subsidiaries and Winner International Trading Company, Tianfang Textile Factory and Hubei Tianfang Group Co. Ltd.. On July 12, 2004, the plaintiffs filed a lawsuit against Tianfang Textile Factory and Hubei Tianfang Group Co. Ltd. and alleged that the two parties had acquired the right to use certain land from the Plaintiffs and failed to pay off the full amount of fees agreed upon by the parties. The plaintiffs seek to recover a fee of approximately US$930,000 (RMB7,379,230) and requested the Company to bear several and joint liabilities with the named defendants. Winner International Trading Company acquired the disputed land from Tianfang Textile Factory and Hubei Tianfang Group Co. Ltd. in 2000 and such land is currently occupied by Hubei Winner Textile Co., Ltd. and Winner Medical & Textile Co., Ltd.. On June 20, 2005, the Intermediate People’s Court of Hanjiang City, Hubei Province ruled against the plaintiffs. On August 22, 2006, the plaintiffs applied to the local court to withdraw the lawsuit and the court approved the withdrawal.
WINNER MEDICAL GROUP INC.
NOTES TO CONSOLIDATED FINANCIAL STATEMENTS
FOR THE YEARS ENDED SEPTEMBER 30, 2006 AND 2005
14. Stockholders’ Equity
Common Stock
Ordinary share split- In August 2005, the Company declared a 100:1 stock split in the form of a stock dividend. Shareholders’ equity has been restated to give retroactive recognition of the stock split for all periods presented by reclassifying the par value of the additional shares arising from the split from paid in capital to common stock. All references in the financial statements and notes to shares and per share amounts reflect the stock split.
In December 2005, there were 1,562,271 shares of common stock created in reverse merger.
In December 2005, prior to the consummation of the share exchange with the Company, Winner completed a private placement of its common shares to 15 accredited investors, which were then exchanged for 5,289,735 shares of common stock in the Company, in raising US$10,400,000 in gross proceeds. Further, a 793,260 of the Company’s shares were issued for US$1,600,000 in gross proceeds. As a result of the above stock issue, the Company raised a total of US$12,000,000 in gross proceeds.
In April, 2006, the Company issued a total of 20,400 shares of common stock, to 223 employees at contracted price of US$8.70 per share in accordance with the 2006 Equity Incentive Plan, for a gross proceeds of US$177,480. Pursuant to the 2006 Equity Incentive Plan, the Company issued 20,400 bonus shares of common stock to these 223 employees in respect of the earlier 20,400 common stock issued.
15. Employee Benefits
The Company contributes to a state pension scheme organized by municipal and provincial governments in respect of its employees in PRC. The compensation expense related to this plan, which is calculated at a range of 8%-20% of the average monthly salary, was US$321,899, US$303,411 and US$253,473 for the years ended September 2006, 2005 and 2004 respectively.
According to the Mandatory Provident Fund ("MPF") legislation regulated by the Mandatory Provident Fund Schemes Authority in Hong Kong, with effect from December 1, 2000, the Company is required to participate in a MPF scheme operated by approved trustees in Hong Kong and to make contributions for its eligible employees. The contributions borne by the Company are calculated at 5% of the salaries and wages (monthly contribution is limited to 5% of HK$20,000 for each eligible employee) as calculated under the MPF legislation. The expense related to the MPF in the years ended September 30, 2006, 2005 and 2004 amounted to US$154, US$1,446 and US$604, respectively.
16. Operating Risk
Concentrations of credit risk, major customers and suppliers-A substantial percentage of the Company’s sales are made to one customer, Sakai Shoten Co. Ltd., and are typically sold on an open account basis. The sales to this customer accounted for 22%, 23% and 30% of the total net sales for the years ended September 30, 2006, 2005 and 2004, respectively.
The Company has not experienced any significant difficulty in collecting its accounts receivable in the past and is not aware of any financial difficulties being experienced by its major customers. There were bad debt expense of US$25,789, US$886 and US$77,874 during the years ended September 30, 2006, 2005 and 2004, respectively.
A substantial percentage of the Company’s raw materials are purchased from one supplier, Tianmen Cotton Company. The purchases from this supplier accounted for around 15% of the total purchases for each of the two years ended September 30, 2005 and 2004 respectively. There are only a minimal raw material purchases during the year 2006
Interest rate risk-The interest rates and terms of repayment of bank and other borrowings are disclosed in Note 5. Other financial assets and liabilities do not have material interest rate risk.
Credit risk- The Company is exposed to credit risk from its cash at bank and fixed deposits and bills and accounts receivable. The credit risk on cash at bank and fixed deposits is limited because the counterparties are recognized financial institutions. Bills and accounts receivable are subjected to credit evaluations. An allowance has been made for estimated irrecoverable amounts which has been determined by reference to past default experience and the current economic environment.
Foreign currency risk- Most of the transactions of the Company were settled in Renminbi and U.S. dollars. In the opinion of the directors, the Company would not have significant foreign currency risk exposure.
WINNER MEDICAL GROUP INC.
NOTES TO CONSOLIDATED FINANCIAL STATEMENTS
FOR THE YEARS ENDED SEPTEMBER 30, 2006 AND 2005
17. Statutory reserves
According to the laws and regulations in the PRC, the Company is required to provide for certain statutory funds, namely, reserve fund, enterprise expansion fund and staff and workers’ bonus and welfare fund by an appropriation from net profit after taxation but before dividend distribution based on the local statutory financial statements of the PRC subsidiaries prepared in accordance with the accounting principles and relevant financial regulations.
The Company’s wholly owned subsidiaries in the PRC is required to allocate at least 10% of its net profit to the reserve fund until the balance of such fund has reached 50% of its registered capital. Appropriations of enterprise expansion fund and staff and workers’ bonus and welfare fund are determined at the discretion of its directors. Appropriation to staff and workers’ bonus and welfare fund is charged to expenses.
The reserve fund can only be used, upon approval by the relevant authority, to offset accumulated losses or increase capital. The enterprise expansion fund can only be used to increase capital upon approval by the relevant authority. The staff and workers’ bonus and welfare fund can only be used for special bonus or collective welfare of their employees, and assets acquired through this fund shall not be treated as assets of the Company. Accordingly, the balance of the staff and workers’ bonus and welfare is recorded as a liability of the Company.
18. Geographical Information
The Company has only one business segment, which is manufacturing and trading of medical dressings and medical disposables. The Company's sales by geographic destination are analysed as follows:
| | | Year ended September 30, | |
| | | 2006 | | 2005 | | 2004 | |
| | | US$ | | US$ | | US$ | |
| | | | | | | | |
| Europe | | | 25,014,601 | | | 22,390,473 | | | 16,945,262 | |
| Japan | | | 16,646,672 | | | 15,120,482 | | | 13,431,225 | |
| America | | | 7,617,644 | | | 7,502,291 | | | 5,367,996 | |
| PRC | | | 7,777,550 | | | 6,939,991 | | | 2,595,087 | |
| Others | | | 6,816,591 | | | 6,403,892 | | | 5,941,895 | |
| Total net sales | | | 63,873,058 | | | 58,357,129 | | | 44,281,465 | |
EXHIBIT INDEX
Exhibit No. | | Description |
| | | |
| 2.1 | | Share Exchange Agreement, dated December 16, 2005, among the registrant, Winner Group Limited and its stockholders [Incorporated by reference to Exhibit 2.1 to the registrant’s current report on Form 8-K filed on December 16, 2005 in commission file number 33-10513-LA] |
| | | |
| 3.1 | | Articles of Incorporation of the registrant as filed with the Secretary of State of the State of Nevada on August 7, 1986, as amended to date. [Incorporated by reference to Exhibit 3.1 to the registrant’s current report on Form 8-K filed on December 16, 2005 in commission file number 33-10513-LA] |
| | | |
| 3.2 | | Amended and Restated Bylaws of the registrant adopted on December 16, 2005. [Incorporated by reference to Exhibit 3.2 to the registrant’s current report on Form 8-K filed on December 16, 2005 in commission file number 33-10513-LA] |
| | | |
| 10.1 | | English translation of Licensing Agreement between Winner Group Limited and Jianquan Li, dated December 1, 2005 [Incorporated by reference to Exhibit 10.1 to the registrant’s current report on Form 8-K filed on December 16, 2005 in commission file number 33-10513-LA] |
| | | |
| 10.2 | | English translation of Licensing Agreement between Winner Medical & Textile Ltd. Zhuhai and Nianfu Huo, dated August 5, 2005 [Incorporated by reference to Exhibit 10.2 to the registrant’s current report on Form 8-K filed on December 16, 2005 in commission file number 33-10513-LA] |
| | | |
| 10.3 | | English translation of Equipment Purchase Contract between Winner Medical (Huanggang) Co., Ltd. and Zhengzhou Textile Machinery Co., Ltd, dated July 12, 2005 [Incorporated by reference to Exhibit 10.3 to the registrant’s current report on Form 8-K filed on December 16, 2005 in commission file number 33-10513-LA] |
| | | |
| 10.4 | | English translation of Water Supply Agreement between Winner Medical & Textile Ltd. Tianmen and Hubei Winner Textiles Co., Ltd., dated August 2, 2004 [Incorporated by reference to Exhibit 10.4 to the registrant’s current report on Form 8-K filed on December 16, 2005 in commission file number 33-10513-LA] |
| | | |
| 10.5 | | English Translation of Working Capital Loan Contract between Hubei Winner Textiles Co., Ltd. and Tianmen Branch of Industrial & Commercial Bank of China, dated October 19, 2005 [Incorporated by reference to Exhibit 10.5 to the registrant’s current report on Form 8-K filed on December 16, 2005 in commission file number 33-10513-LA] |
| | | |
| 10.6 | | English translation of Working Capital Loan Contract between Hubei Winner Textiles Co., Ltd. and Tianmen Branch of Industrial & Commercial Bank of China with a one-year term terminating on October 17, 2006, dated October 20, 2005 [Incorporated by reference to Exhibit 10.6 to the registrant’s current report on Form 8-K filed on December 16, 2005 in commission file number 33-10513-LA] |
| | | |
| 10.7 | | English translation of Working Capital Loan Contract between Hubei Winner Textiles Co., Ltd. and Tianmen Branch of Industrial & Commercial Bank of China with a one-year term terminating on October 16, 2006, dated October 20, 2005 [Incorporated by reference to Exhibit 10.7 to the registrant’s current report on Form 8-K filed on December 16, 2005 in commission file number 33-10513-LA] |
| | | |
| 10.8 | | English translation of Working Capital Loan Contract between Hubei Winner Textiles Co., Ltd. and Tianmen Branch of Industrial & Commercial Bank of China with a one-year term terminating on October 12, 2006, dated October 20, 2005 [Incorporated by reference to Exhibit 10.8 to the registrant’s current report on Form 8-K filed on December 16, 2005 in commission file number 33-10513-LA] |
| 10.9 | | English translation of Working Capital Loan Contract between Hubei Winner Textiles Co., Ltd. and Tianmen Branch of Industrial & Commercial Bank of China with a one-year term terminating on October 18, 2006, dated October 20, 2005 [Incorporated by reference to Exhibit 10.9 to the registrant’s current report on Form 8-K filed on December 16, 2005 in commission file number 33-10513-LA] |
| | | |
| 10.10 | | English translation of Working Capital Loan Contract between Winner Industries (Shenzhen) Co., Ltd. and Longhua Branch of Industrial & Commercial Bank of China, dated September 20, 2005 [Incorporated by reference to Exhibit 10.10 to the registrant’s current report on Form 8-K filed on December 16, 2005 in commission file number 33-10513-LA] |
| | | |
| 10.11 | | English translation of Working Capital Loan Contract between Winner Industries (Shenzhen) Co., Ltd. and Longhua Branch of Industrial & Commercial Bank of China, dated October 8, 2004 [Incorporated by reference to Exhibit 10.11 to the registrant’s current report on Form 8-K filed on December 16, 2005 in commission file number 33-10513-LA] |
| | | |
| 10.12 | | English translation of Working Capital Loan Contract between Winner Medical & Textile Ltd. Tianmen and Tianmen Branch of Industrial & Commercial Bank of China, dated January 14, 2005 [Incorporated by reference to Exhibit 10.12 to the registrant’s current report on Form 8-K filed on December 16, 2005 in commission file number 33-10513-LA] |
| | | |
| 10.13 | | English translation of Extension Loan Agreement between Winner Industries (Shenzhen) Co., Ltd. and Longhua Branch of Industrial & Commercial Bank of China, dated September 28, 2005 [Incorporated by reference to Exhibit 10.13 to the registrant’s current report on Form 8-K filed on December 16, 2005 in commission file number 33-10513-LA] |
| | | |
| 10.14 | | English translation of Extension Loan Agreement between Winner Industries (Shenzhen) Co., Ltd. and Longhua Branch of Industrial & Commercial Bank of China, dated September 12, 2005 [Incorporated by reference to Exhibit 10.14 to the registrant’s current report on Form 8-K filed on December 16, 2005 in commission file number 33-10513-LA] |
| | | |
| 10.15 | | English translation of Guarantee Contract among Shenzhen Longhua Branch of Industrial & Commercial Bank of China and guarantors identified therein, dated September 13, 2004 [Incorporated by reference to Exhibit 10.15 to the registrant’s current report on Form 8-K filed on December 16, 2005 in commission file number 33-10513-LA] |
| | | |
| 10.16 | | English translation of Mortgage Contract of Maximum Amount between Winner Medical & Textile Ltd. Jingmen and Jingmen Branch of Industrial and Commercial Bank of China, dated June 11, 2004 [Incorporated by reference to Exhibit 10.16 to the registrant’s current report on Form 8-K filed on December 16, 2005 in commission file number 33-10513-LA] |
| | | |
| 10.17 | | English translation of Mortgage Contract of Maximum Amount between Winner Medical & Textile Ltd. Tianmen and Tianmen Branch of Industrial and Commercial Bank of China, dated June 2, 2004 [Incorporated by reference to Exhibit 10.17 to the registrant’s current report on Form 8-K filed on December 16, 2005 in commission file number 33-10513-LA] |
| | | |
| 10.18 | | English translation of Mortgage Contract of Maximum Amount between Hubei Winner Medical Co., Ltd. and Tianmen Branch of Industrial and Commercial Bank of China, dated August 23, 2005 [Incorporated by reference to Exhibit 10.18 to the registrant’s current report on Form 8-K filed on December 16, 2005 in commission file number 33-10513-LA] |
| | | |
| 10.19 | | English translation of Loan Contract between Winner Medical & Textile Ltd. Yichang and Zhijiang Branch of Agricultural, dated June 16, 2005 [Incorporated by reference to Exhibit 10.19 to the registrant’s current report on Form 8-K filed on December 16, 2005 in commission file number 33-10513-LA] |
| 10.20 | | English translation of Loan Contract between Shenzhen Honggang Branch of China Merchants Bank and Winner Industries (Shenzhen) Co., Ltd., dated July 27, 2005 [Incorporated by reference to Exhibit 10.20 to the registrant’s current report on Form 8-K filed on December 16, 2005 in commission file number 33-10513-LA] |
| | | |
| 10.21 | | English translation of Loan Contract between Shenzhen Honggang Branch of China Merchants Bank and Winner Industries (Shenzhen) Co., Ltd., dated July 28, 2005 [Incorporated by reference to Exhibit 10.21 to the registrant’s current report on Form 8-K filed on December 16, 2005 in commission file number 33-10513-LA] |
| | | |
| 10.22 | | English translation of Loan Contract between Shenzhen Honggang Branch of China Merchants Bank and Winner Industries (Shenzhen) Co., Ltd., dated July 29, 2005 [Incorporated by reference to Exhibit 10.22 to the registrant’s current report on Form 8-K filed on December 16, 2005 in commission file number 33-10513-LA] |
| | | |
| 10.23 | | English translation of Loan Contract between Shenzhen Honggang Branch of China Merchants Bank and Winner Industries (Shenzhen) Co., Ltd., August 31, 2005 [Incorporated by reference to Exhibit 10.23 to the registrant’s current report on Form 8-K filed on December 16, 2005 in commission file number 33-10513-LA] |
| | | |
| 10.24 | | English translation of Loan Contract between Shenzhen Honggang of China Merchants Bank and Winner Industries (Shenzhen) Co., Ltd., dated October 28, 2005 [Incorporated by reference to Exhibit 10.24 to the registrant’s current report on Form 8-K filed on December 16, 2005 in commission file number 33-10513-LA] |
| | | |
| 10.25 | | English translation of Loan Contract between Shenzhen Honggang Branch of China Merchants Bank and Winner Industries (Shenzhen) Co., Ltd., dated November 7, 2005 [Incorporated by reference to Exhibit 10.25 to the registrant’s current report on Form 8-K filed on December 16, 2005 in commission file number 33-10513-LA] |
| | | |
| 10.26 | | English translation of Mortgage Contract of Maximum Amount between Shenzhen Honggang Branch of China Merchants Bank and Winner Industries (Shenzhen) Co., Ltd., dated June 27, 2005 [Incorporated by reference to Exhibit 10.26 to the registrant’s current report on Form 8-K filed on December 16, 2005 in commission file number 33-10513-LA] |
| | | |
| 10.27 | | English translation of Mortgage Contract of Maximum Amount between Zhijiang Branch of Agricultural Bank of China and Winner Medical & Textile Ltd. Yichang, dated June 16, 2005 [Incorporated by reference to Exhibit 10.27 to the registrant’s current report on Form 8-K filed on December 16, 2005 in commission file number 33-10513-LA] |
| | | |
| 10.28 | | English translation of Credit Facility Agreement between Shenzhen Honggang Branch of China Merchants Bank and Winner Industries (Shenzhen) Co., Ltd., dated June 28, 2005 [Incorporated by reference to Exhibit 10.28 to the registrant’s current report on Form 8-K filed on December 16, 2005 in commission file number 33-10513-LA] |
| | | |
| 10.29 | | English translation of Irrevocable Letter of Guarantee Within Maximum Amount from Winner Medical & Textile Ltd. Jingmen to Shenzhen Honggang Branch of China Merchants Bank, dated June 27, 2005 [Incorporated by reference to Exhibit 10.29 to the registrant’s current report on Form 8-K filed on December 16, 2005 in commission file number 33-10513-LA] |
| | | |
| 10.30 | | English translation of Irrevocable Letter of Guarantee Within Maximum Amount from Jianquan Li to Shenzhen Honggang Branch of China Merchants Bank, dated June 27, 2005 [Incorporated by reference to Exhibit 10.30 to the registrant’s current report on Form 8-K filed on December 16, 2005 in commission file number 33-10513-LA] |
| 10.31 | | English translation of Irrevocable Letter of Guarantee Within Maximum Amount from Winner Medical & Textile Ltd. Tianmen to Shenzhen Honggang Branch of China Merchants Bank, dated June 27, 2005 [Incorporated by reference to Exhibit 10.31 to the registrant’s current report on Form 8-K filed on December 16, 2005 in commission file number 33-10513-LA] |
| | | |
| 10.32 | | English translation of Irrevocable Letter of Guarantee Within Maximum Amount from Winner Medical & Textile Ltd. Yichang to Shenzhen Honggang Branch of China Merchants Bank, dated June 27, 2005 [Incorporated by reference to Exhibit 10.32 to the registrant’s current report on Form 8-K filed on December 16, 2005 in commission file number 33-10513-LA] |
| | | |
| 10.33 | | English translation of Factory Lease Agreement between Shenzhen Wanyinglong Investment Co., Ltd. and Winner Industries (Shenzhen) Co., Ltd., dated July 8, 2005 [Incorporated by reference to Exhibit 10.33 to the registrant’s current report on Form 8-K filed on December 16, 2005 in commission file number 33-10513-LA] |
| | | |
| 10.34 | | English translation of Factory Lease Agreement between Shenzhen Wanyinglong Investment Co., Ltd. and Winner Industries (Shenzhen) Co., Ltd., dated July 25, 2005 [Incorporated by reference to Exhibit 10.34 to the registrant’s current report on Form 8-K filed on December 16, 2005 in commission file number 33-10513-LA] |
| | | |
| 10.35 | | English translation of Factory Lease Agreement between Shenzhen Wanyinglong Investment Co., Ltd. and Winner Industries (Shenzhen) Co., Ltd., dated August 12, 2005 [Incorporated by reference to Exhibit 10.35 to the registrant’s current report on Form 8-K filed on December 16, 2005 in commission file number 33-10513-LA] |
| | | |
| 10.36 | | English translation of Lease Agreement of Standard Factory between Shanghai Feizhou Test Pressure Pump Co., Ltd. and Shanghai Winner Medical Apparatus Co., Ltd., dated January 21, 2005 [Incorporated by reference to Exhibit 10.36 to the registrant’s current report on Form 8-K filed on December 16, 2005 in commission file number 33-10513-LA] |
| | | |
| 10.37 | | English translation of Employment Agreement between Winner Industries (Shenzhen) Co., Ltd. and Hongwei Jia, dated January 1, 2005 [Incorporated by reference to Exhibit 10.37 to the registrant’s current report on Form 8-K filed on December 16, 2005 in commission file number 33-10513-LA] |
| | | |
| 10.38 | | English translation of Employment Agreement between Winner Industries (Shenzhen) Co., Ltd. and Jiagan Chen, dated January 1, 2005 [Incorporated by reference to Exhibit 10.38 to the registrant’s current report on Form 8-K filed on December 16, 2005 in commission file number 33-10513-LA] |
| | | |
| 10.39 | | English translation of Employment Agreement between Winner Industries (Shenzhen) Co., Ltd. and Jianquan Li, dated January 1, 2005 [Incorporated by reference to Exhibit 10.39 to the registrant’s current report on Form 8-K filed on December 16, 2005 in commission file number 33-10513-LA] |
| | | |
| 10.40 | | English translation of Employment Agreement between Winner Industries (Shenzhen) Co., Ltd. and Xiuyuan Fang, dated January 1, 2005 [Incorporated by reference to Exhibit 10.40 to the registrant’s current report on Form 8-K filed on December 16, 2005 in commission file number 33-10513-LA] |
| | | |
| 10.41 | | English translation of Equity Transfer and Capital Increase Agreement between Winner Group Limited and Lohmann & Rauscher Limited, Hong Kong, dated April 8, 2005 [Incorporated by reference to Exhibit 10.41 to the registrant’s current report on Form 8-K filed on December 16, 2005 in commission file number 33-10513-LA] |
| | | |
| 10.42 | | Form of Subscription Agreement [Incorporated by reference to Exhibit 10.42 to the registrant’s registration statement on Form SB-2 filed on July 7, 2006] |
| 10.43 | | Consulting Agreement among the registrant, Winner Group Limited and Heritage Management Consultants, Inc., dated January 25, 2006. [Incorporated by reference to Exhibit 10.43 to the registrant’s registration statement on Form SB-2 filed on July 7, 2006] |
| | | |
| 10.44 | | 2006 Incentive Equity Plan [Incorporated by reference to Exhibit 10 to the registrant’s registration statement on Form S-8 filed on April 19, 2006] |
| | | |
| 10.45 | | Independent Director’s Contract, dated as of May 8, 2006, by and between Winner Medical Group Inc. and Larry Goldman, CPA [Incorporated by reference to Exhibit 10.1 to the registrant’s current report on Form 8-K filed on May 11, 2006] |
| | | |
| 10.46 | | Independent Director’s Contract, dated as of May 8, 2006, by and between Winner Medical Group Inc. and Richard B. Goodner, Esq. [Incorporated by reference to Exhibit 10.2 to the registrant’s current report on Form 8-K filed on May 11, 2006] |
| | | |
| 10.47 | | Independent Director’s Contract, dated as of May 8, 2006, by and between Winner Medical Group Inc. Dr. Horngjon Shieh [Incorporated by reference to Exhibit 10.3 to the registrant’s current report on Form 8-K filed on May 11, 2006] |
| | | |
| 10.48 | | Indemnification Agreement, dated as of May 8, 2006, by and between Winner Medical Group Inc. and Larry Goldman, CPA [Incorporated by reference to Exhibit 10.4 to the registrant’s current report on Form 8-K filed on May 11, 2006] |
| | | |
| 10.49 | | Indemnification Agreement, dated as of May 8, 2006, by and between Winner Medical Group Inc. and Richard B. Goodner, Esq. [Incorporated by reference to Exhibit 10.5 to the registrant’s current report on Form 8-K filed on May 11, 2006] |
| | | |
| 10.50 | | Indemnification Agreement, dated as of May 8, 2006, by and between Winner Medical Group Inc. and Dr. Horngjon Shieh [Incorporated by reference to Exhibit 10.6 to the registrant’s current report on Form 8-K filed on May 11, 2006] |
| | | |
| 10.51 | | Amendment No. 1 to the Consulting Agreement among the registrant, Winner Group Limited and Heritage Management Consultants, Inc., dated May 30, 2006. [Incorporated by reference to Exhibit 10.51 to the registrant’s registration statement on Form SB-2 filed on July 7, 2006] |
| | | |
| | |
| | | |
| | |
| | | |
| | |
| | | |
| | |
| | | |
| | |
| | | |
| | |
| | | |
| | |
| | |
| | | |
| | |
| | | |
| | |
| | | |
| 14 | | Code of ethics, dated May 9, 2006. [Incorporated by reference to Exhibit 14 to the registrant’s current report on Form 8-K filed on May 11, 2006] |
| | | |
| | |
| | | |
| | |
| | | |
| | |
| | | |
| | |
| | | |
| | |
* filed herewith