
Leonard Kiely
VP and GM of Power Systems Division
10 years with SPS Technologies/Precision Castparts Corp.
Various operations leadership positions including President of their Precision Tool group
VP of Business Development
9 years with Raychem Corporation
Positions included Controller, Operations Manager and General Manager of Irish operations
C&D Management Team
Dr. Bill Bachrach
VP and GM, Power Electronics Division
Extensive experience in manufacturing of highly engineered products
Worked with Jeff Graves on strategic planning for KEMET
Founded InphoMatch
Worked for General Electric for over ten years.
James Dee
VP, General Counsel & Corporate Secretary
Formerly with Montgomery, McCracken, Walker & Rhoads
From 1997-2004, last served as Vice President, General Counsel and Corporate Secretary
at SPS Technologies

C&D Accomplishments
New management team has made significant strides to address key operating
challenges within both its battery and power electronics segments
With a renewed focus on execution, customer satisfaction, quality and technology
development, C&D is well positioned for growth and profitability
Reynosa plant migration
Batteries
Responses
New plant management
Quality focus/fix
Labor force retention
New leadership
Strategic turnaround plan developed and in process
Continue to push price increases
Hedging programs and contractual arrangements
Power Electronics
New divisional GM/Other management changes
Bolstered quality and logistics resources
Stabilization of revenue base
Focus on supply chain management
Acquisition integration
Motive Power performance
Lead costs and pricing
Key Challenges

Segment Overview

Power Systems Division
Standby Power

Standby Power– Overview
LTM1: $265.0 million net sales
Applications
Standby batteries & electronics
Wireline / fiber
Wireless cell sites / pager sites
Cable TV
Power generation / utilities
Uninterruptible Power Supply (“UPS”)
Key customers
AT&T, Cingular, Verizon, US
Cellular, Sprint, Qwest, Eaton,
Emerson, Schneider, Alpha
Products
Reserve batteries
Integrated reserve power systems
Power rectifiers / chargers
System monitors
Power boards and chargers
Representative Products
Battery Products
Power Systems
Note:
1 LTM as of 7/31/06

Standby Power– End Uses
Wireline Telecom
Wireless Telecom
Computer Backup
Critical
Communications
Nuclear
Utilities
Cable TV
Source: Company

North American Standby Power Market Size ($mm)
North American Standby Market
Competitive Split1,3
Other
18%
Enersys
20%
Exide
16%
E. Penn
12%
Crown
9%
C&D
25%
Tel
43%
Other
17%
20061,2 - $915 million
CAGR 5.7%
UPS
34%
Util. 6%
Source: BCI, Frost & Sullivan, ITA, Management Estimates
Note: 1 Market size and share based on all sizes of lead acid batteries for the standby market including
<25Ahr
2 Calendar year
3 6 months ending 7/31/06

Standby Power Accomplishments and Focus
Launched highly profitable msEndur® product line
$25+ million run-rate revenue
Achieved continued growth in FY 2007 in international business
Successfully realigned distribution channels
New manufacturing facility under construction in China
Taken industry leadership position in driving pricing
New business wins
Leadership changes
Pricing
China plant relocation
Global sales growth through industry focus – utilities, oil & gas and emerging
markets
Cost and quality improvements – low cost manufacturing, Lean and Six Sigma
Recent Accomplishments
Fiscal 2007 focus

Lead Price History
Historical Lead Price
Source: London Metal Exchange
$0.10
$0.20
$0.30
$0.40
$0.50
$0.60
$0.70
$0.80
Oct-96
Jan-98
Apr-99
Jul-00
Oct-01
Jan-03
Apr-04
Jul-05
Nov-06
9/27/2006:
Announced 6% price
increase implementation
on all motive and standby
power products, effective
November 15, 2006
1/19/2006:
Announced price increase of
8% on all 10- and 20-year
battery products effective
with orders placed starting
March 1, 2006
9/28/2005:
Announced price increase
of 5% on all 10- and 20-year
battery products effective
with orders placed starting
January 1, 2006
11/15/2006:
The Company plans to
announce lead surcharge

Standby Power Division– Recent Performance
Historical Revenue ($mm)
Historical Operating Income ($mm) and Margin 1
Notes:
1 Excludes non-recurring charges in all periods
2 LTM as of 7/31/06

Power Systems Division
Motive Power

Motive Power Division – Overview
LTM1: $57.1 million net sales
Applications
Electric powered forklift trucks
Other material handling equipment
Automatic guided vehicles
Airline ground support vehicles
Key Customers
John Deere, Toyota, HEB, C&S
Wholesale, Safeway, US Cold Storage
Products
Motive power batteries
Chargers
Electronic monitoring modules
Computerized management systems
Geographic Focus on North America
Representative Products
Note:
1 LTM as of 7/31/06

North American Motive Power Market Size ($mm)
North American Motive Market
Competitive Split2
Other
9%
Enersys
38%
Exide
18%
E. Penn
18%
Crown
9%
C&D
8%
Batteries
$600M
Charger
$100M
CAGR 7.4%
20061 - $700 million
Source: BCI, Frost & Sullivan, ITA, Management Estimates
Note: 1 Calendar Year
2 Six months ending 7/31/06
Motive Power Accomplishments and Focus
New management team and improved workforce retention
Enhanced quality
Established Texas distribution center
Shed unprofitable business – replaced with new opportunities
Recent Accomplishments
Fiscal 2007 Focus
Closure of Huguenot, NY facility and transfer of production to Reynosa, Mexico
completed in October 2006
Pricing
Investments to extend product offerings
Establishment of new/additional distribution center in Leola, PA
Continued focus on cost and quality

Motive Power Division– Recent Performance
Historical Revenue ($mm)
Historical Operating Income ($mm) and Margin1
Note:
1 Excludes non-recurring charges in all periods
2 LTM as of 7/31/06
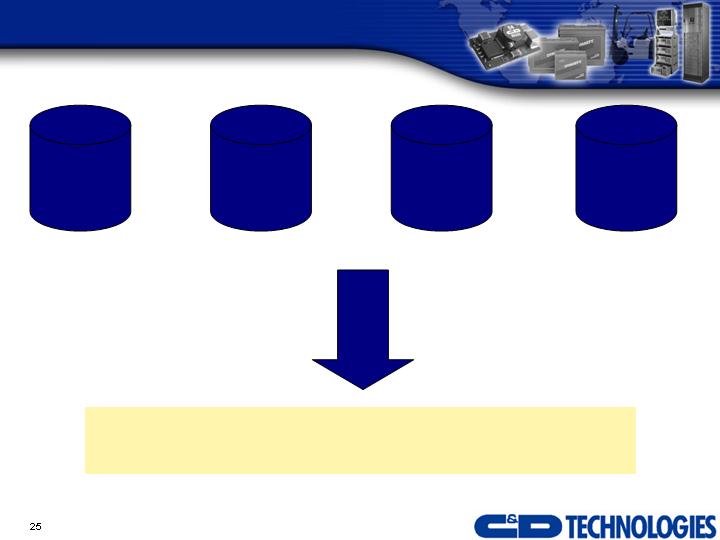
The “New” C&D Cost Improvement Opportunity
Sourcing
Structure
Operations
Estimated Annual Savings of
$25–$30 million per year
Design
Power Electronics Division

BUSS Converters
Power Electronics – Overview
LTM1: $191.0 million net sales
Applications
Telecom
Office equipment
Networking equipment
Cable TV
Military
Key Customers
Cisco Systems, Sun Microsystems,
Huawei, HP, IBM, Xerox, Daktronics
Products
DC/DC converters (bricks)
Single In-Line Packages (“SIPs”)
Voltage Regulator Module (“VRMs”)
Power pods
AC/DC front ends
Representative Products
High Performance
DC/DC Converters
Point of Load
Converters
AC/DC Converters
Note:
1 LTM as of 7/31/06
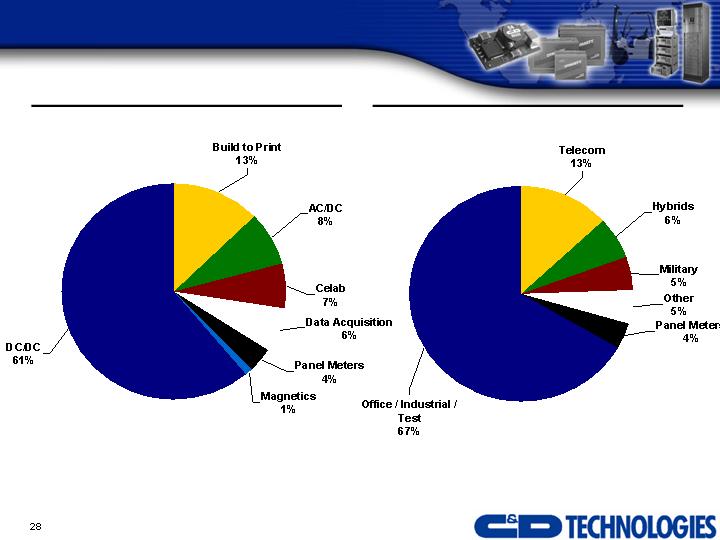
Power Electronics – Products and End Uses
FY06 Net Sales by Product Breakdown
FY06 Net Sales by End Market
Source: Company Estimates
FY06 Net Sales = $186 million
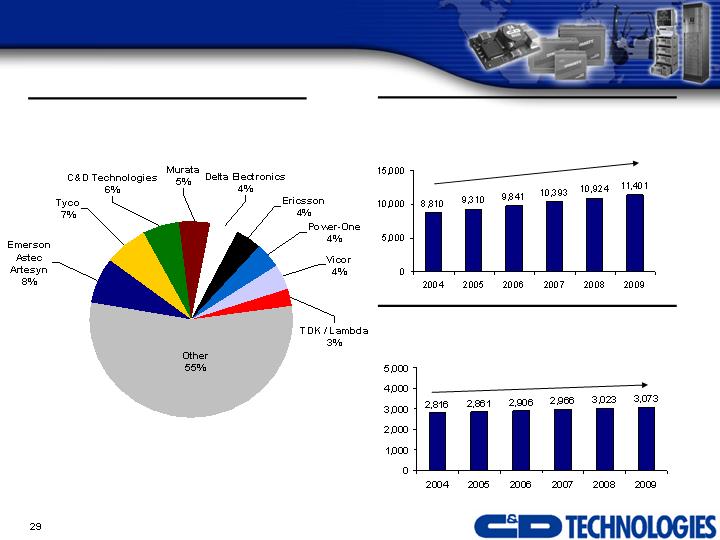
Power Electronics – Market Overview
Source: Micro-Tech Consultants, 2005
Emerson acquired Artesyn early 2006
Artesyn data combined with Emerson/Astec
Invensys sold its Lambda Division to TDK Corporation in 2005
CAGR 5.3%
CAGR 1.8%
Global Consumption of Merchant AC/DC
Switchers ($mm)
Global Merchant DC/DC Market
Total = $2.8 billion
Global Consumption of Merchant DC/DC
Converters ($mm)
Low to Medium
Power products
Serves Tier 2 and
Tier 3 OEMs
Well developed
channels to market
Medium Power
products
Long-established
international
presence
Broad customer
base
Complementary
product lines
High power
products
Access to Tier 1
OEMs
Premier engineering
/ technology
capabilities
Customized
Power products
Military market
focus
International
presence
Highly profitable
Celab
CPS
Power Electronics – Acquisitions
One-Stop
Power
Electronics
Solution
Legacy
PED
One-stop power
electronics solution
provider
Cross-selling
opportunities
Manufacturing
synergies
Broadened customer
base and expanded
geographic markets
Acquired 5/04
Acquired 6/04
Acquired 9/04
Power Electronics Accomplishments and Focus
Reversed post-acquisition trends with record revenue achievement in Q4 Fiscal 2006
Continued integration of acquisitions
New management team in place
Recent Accomplishments
Fiscal 2007 Focus
RoHS compliance conversion
Celestica separation and outsourcing to new contract manufacturers
Other supply chain infrastructure changes
Accelerating design lifecycle
Leverage technology expertise in AC/DC markets
Consolidate Portland facility into Toronto and Mansfield facilities
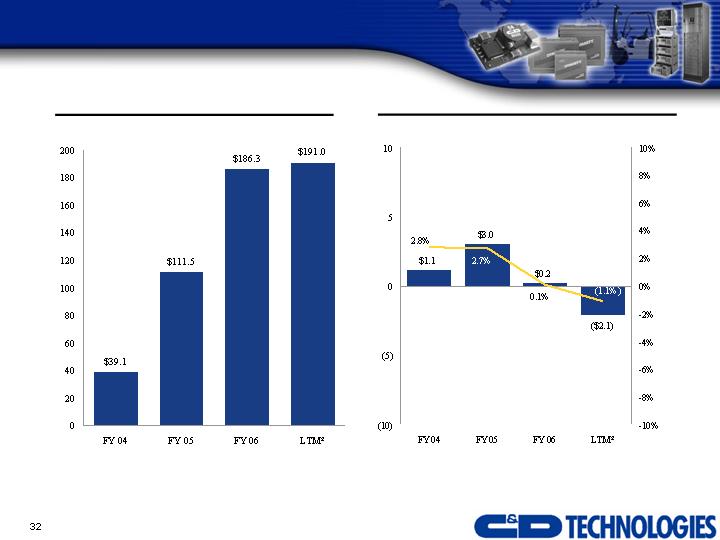
Power Electronics Division – Recent Performance
Historical Revenue ($mm)
Historical Operating Income ($mm) and Margin 1
Notes:
1 Excludes non-recurring charges in all periods
2 LTM as of 7/31/06
Exploring Strategic Alternatives for PED
C&D has decided to explore strategic alternatives for the Power Electronics business
PED operations have stabilized
PED now operates as a standalone entity from the battery business
No synergies between PED and PSD
To be announced in conjunction with convertible financing
Exploring Strategic Alternatives for PED (Cont’d)
Potential sale would allow focus on growing the core “energy storage” business
Great foundation: strong customer & brand position
Growing markets with high barriers to entry
Technology and service differentiation important, along with price competitiveness
Continue to implement low-cost manufacturing strategy
Improve synergies between standby and motive businesses
Leverage leading position in US to continue international expansion
Flexibility to invest in new technology and accelerate cost improvement actions
Financial Overview
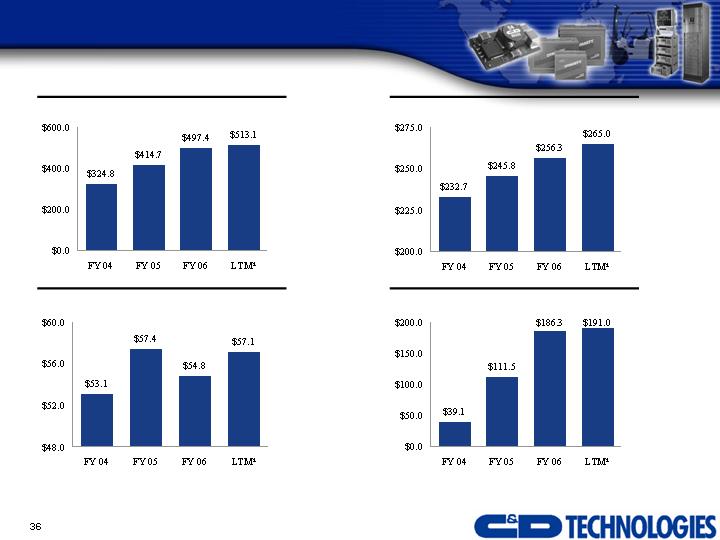
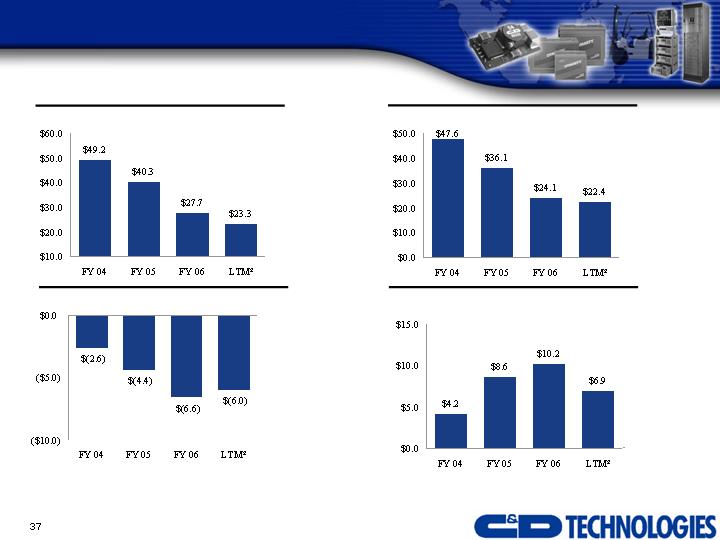
Financial Performance
Fiscal Years Ending January 31 ($mm)
Total Net Sales
Motive Power Net Sales
Standby Power Net Sales
Power Electronics Net Sales
Source: Company 10-K and 10-Qs
Note:
1 LTM as of 7/31/06
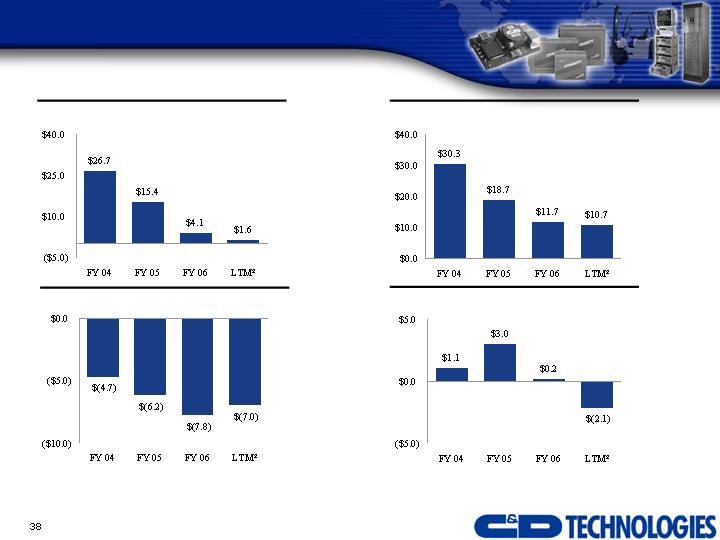
Financial Performance (Cont’d)
Fiscal Years Ending January 31 ($mm)1
Total Adjusted EBITDA
Motive Adjusted EBITDA
Standby Adjusted EBITDA
Power Electronics Adjusted EBITDA
Notes:
1 Excludes non-recurring charges in all periods
2 LTM as of 7/31/06
Source: Company 10-K and 10-Qs
Financial Performance (Cont’d)
Fiscal Years Ending January 31 ($mm)1
Total Operating Income
Motive Operating Income
Standby Operating Income
Power Electronics Operating Income
Notes:
1 Excludes non-recurring charges in all periods
2 LTM as of 7/31/06
Source: Company 10-K and 10-Qs
Conclusion
Investment Highlights
Leading market shares in key markets
#1 market position in the North American standby power market
#2 board mounted power supply manufacturer globally
Positive industry fundamentals
Powerful global manufacturing platform
Industry-leading technology and robust R&D capabilities
Diversified, world-class customer base
Significant upside from restructuring/cost improvement opportunities
Potential sale of PED will allow for renewed focus and growth for PSD
Convertible financing and potential sale of PED will provide stable and flexible
capital structure
New and experienced management team
Appendix
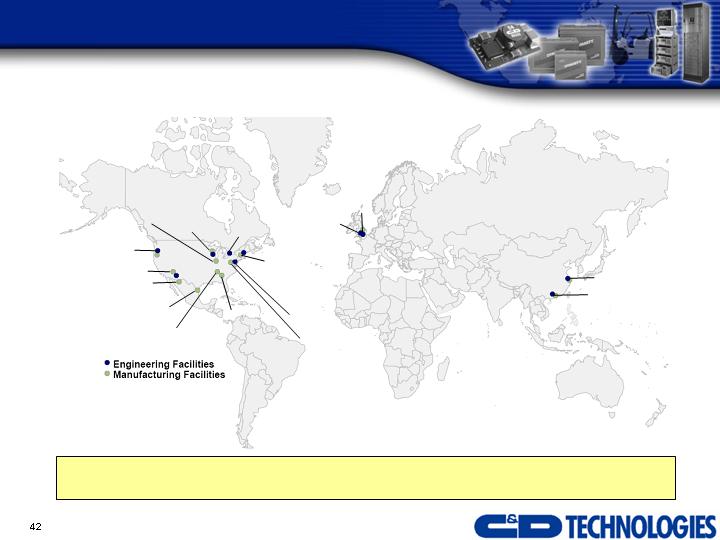
Global Manufacturing and R&D Platform
14 Manufacturing Facilities and 10 Engineering Locations Around the World
Source: Company 10-K and 10-Qs
Toronto, Canada
Portland, OR
(to be closed)
Tucson, AZ
Nogales, Mexico
Reynosa, Mexico
Mansfield, MA
Milton Keynes, UK
Bordon, UK
Shanghai, China
Guangzhou, China
Blue Bell, PA
Leola, PA
Dunlap, TN
Milwaukee, WI
Attica, IN
Conyers, GA
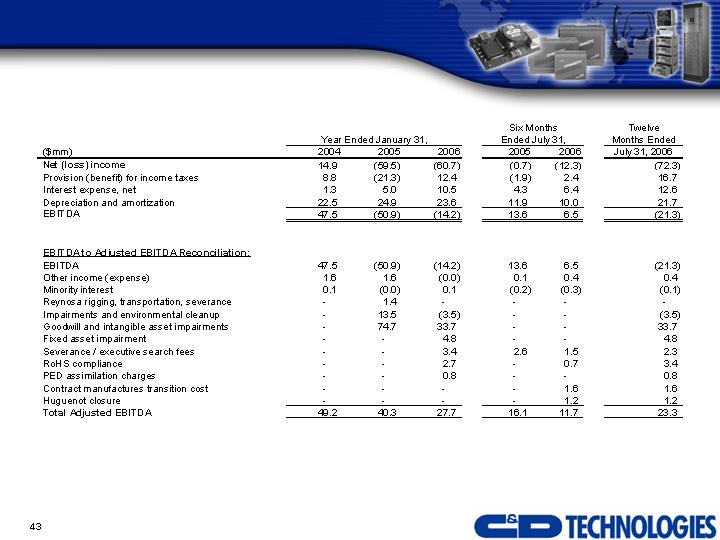
Adjusted EBITDA Reconciliation
Source: Company

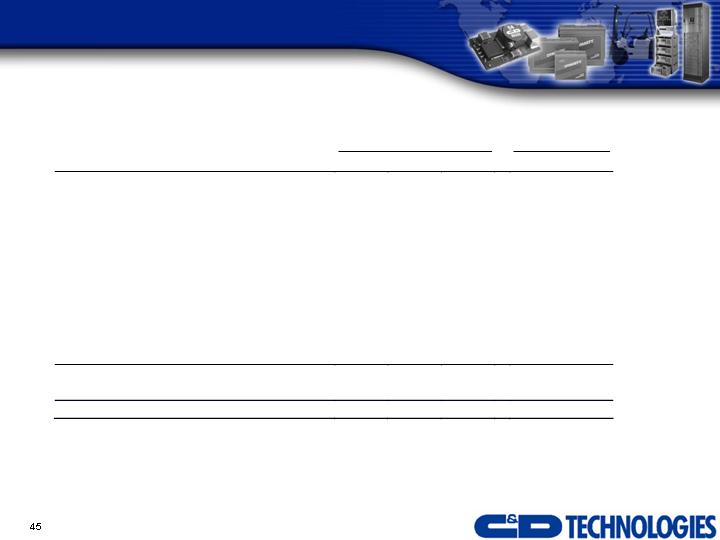
Adjusted Operating Income Reconciliation
Source: Company
Year Ended January 31,
Twelve
Months
Ended July 31,
($
mm
)
2004
2005
2006
2006
Operating Income
26
.7
(74
.2
)
(37
.8
)
(42
.8
)
Adjustments:
Severance/executive search fees
-
-
3.4
2.3
RoHS compliance
-
-
2.7
3.4
PED assimilation
-
-
0.
8
0.
8
Fixed asset impairment
-
-
4.8
4.8
Contract manufacturers transition cost
-
-
-
1.6
Impairments and environmental cleanup
-
13.5
(3.5)
(3.5)
Reynosa rigging, transportation and severance
-
1.4
-
-
Huguenot closure
-
-
-
1.2
Goodwill
and intangible asset impairment
-
74.7
33.7
33.7
Adjusted Operating Income
26
.7
15
.4
4
.1
1
.6
Standby Power – Adjusted Operating Income and
EBITDA Reconciliation
Source: Company
Year Ended January 31,
Twelve
Months
Ended July 31,
($mm
)
2004
2005
2006
2006
Operating Income
30.3
9.2
12.6
11.9
Adjustments:
Severance/
executive search fees
-
-
1.5
1.3
RoHS
c
ompliance
-
-
-
-
PED
a
ssimilation
-
-
-
-
Fixed
a
sset
i
mp
airment
-
-
-
-
Contract
manufacturers transition cost
-
-
-
-
Impairments and
environmental cleanup
-
8.9
(2.5)
(2.5)
Reynosa
rigging, transportation and severance
-
0.6
-
-
Huguenot
closure
-
-
-
-
Goodwill and
intangible asset impairment
-
-
-
-
Adjusted Operating Income
30.3
18.7
11.7
10.
7
Depreciation and amortization
17.3
17.4
12.4
11.7
Adjusted
EBITDA
47.6
36.1
24.1
22.4
Motive Power – Adjusted Operating Income and EBITDA
Reconciliation
Source: Company
Year Ended January 31,
Twelve
Months
Ended July 31,
($mm
)
2004
2005
2006
2006
Operating Income
(4.7)
(11.7)
(9.9)
(10.0)
Adjustments:
Severance/
executive search fees
-
-
0.5
0.2
RoHS
c
ompliance
-
-
-
-
PED
a
ssimilation
-
-
-
-
Fixed
a
s
set
i
mpairment
-
-
2.6
2.6
Contract
manufacturers transition cost
-
-
-
-
Impairments and
environmental cleanup
-
4.6
(1.0)
(1.0)
Reynosa
rigging, transportation and severance
-
0.8
-
-
Huguenot
closure
-
-
-
1.2
Goodwill and
intangible asset imp
airment
-
-
-
-
Adjusted Operating Income
(4.7)
(6.2)
(7.8)
(7.0)
Depreciation and amortization
2.1
1.8
1.
2
1.0
Adjusted
EBITDA
(2.6)
(4.
4
)
(6.6)
(6.0)
Power Electronics Division– Adjusted Operating Income
and EBITDA Reconciliation
Source: Company
Year Ended January 31,
Twelve
Months
Ended July 31,
($mm
)
2004
2005
2006
2006
Operating Income
1.1
(71.7)
(40.5)
(44.6)
Adjustments:
-
-
-
-
Severance/
executive search fees
-
-
1.4
0.8
RoHS
c
ompliance
-
-
2.7
3.4
PED
a
ssimilation
-
-
0.8
0.
8
Fixed
a
sset
i
mpairment
-
-
2.2
2.2
Contract
manufacturers transition cost
-
-
-
1.6
Impairments and
environmental cleanup
-
-
-
-
Reynosa
rigging, transportation and severance
-
-
-
-
Huguenot
closure
-
-
-
-
Goo
dwill and
intangible asset impairment
-
74.7
33.7
33.7
Adjusted Operating Income
1.1
3.0
0.2
(2.1)
Depreciation and amortization
3.
1
5.
6
10.1
9.0
Adjusted
EBITDA
4.
2
8.
6
10.2
6.9

Investor Presentation
November 2006


