UNITED STATES
SECURITIES AND EXCHANGE COMMISSION
Washington, D.C. 20549
FORM N-CSR
CERTIFIED SHAREHOLDER REPORT OF REGISTERED
MANAGEMENT INVESTMENT COMPANIES
Investment Company Act File Number: 811-04998
T. Rowe Price Spectrum Fund, Inc.
(Exact name of registrant as specified in charter)
100 East Pratt Street, Baltimore, MD 21202
(Address of principal executive offices)
David Oestreicher
100 East Pratt Street, Baltimore, MD 21202
(Name and address of agent for service)
Registrant’s telephone number, including area code: (410) 345-2000
Date of fiscal year end: December 31
Date of reporting period: December 31, 2024
Item 1. Reports to Shareholders
(a) Report pursuant to Rule 30e-1
Annual Shareholder Report
December 31, 2024
This annual shareholder report contains important information about Spectrum Income Fund (the "fund") for the period of January 1, 2024 to December 31, 2024. You can find the fund’s prospectus, financial information on Form N‑CSR (which includes required tax information for dividends), holdings, proxy voting information, and other information atwww.troweprice.com/prospectus. You can also request this information without charge by contacting T. Rowe Price at 1‑800‑638‑5660 or info@troweprice.com or contacting your intermediary. This report describes changes to the fund that occurred during the reporting period.
What were the fund costs for the last year? (based on a hypothetical $10,000 investment)
| | Costs of a $10,000 investment | Costs paid as a percentage of a $10,000 investment |
|---|
| Spectrum Income Fund - Investor Class | $62 | 0.61% |
|---|
What drove fund performance during the past 12 months?
U.S. taxable investment-grade bonds produced positive returns in 2024. Bonds in developed non-U.S. markets produced negative returns in U.S. dollar terms due to weaker currencies versus the dollar and rising bond yields in some countries. Easing inflation pressures enabled the European Central Bank to reduce short-term interest rates four times starting in June. Emerging markets bond returns were mixed. U.S. stocks advanced during the period, buoyed by generally favorable corporate earnings and continuing interest in companies expected to benefit from artificial intelligence developments. High yield corporate bonds produced solid gains and strongly outperformed the investment-grade bond market.
Versus the Bloomberg U.S. Aggregate Bond Index, results were supported by an out-of-benchmark exposure to dividend-paying equities. Similarly, the inclusion of high yield bonds as a diversifying exposure within the fund was additive during the period.
On the negative side, an out-of-benchmark exposure to long-term U.S. Treasury bonds was detrimental to results over the period. Security selection among high yield bonds also weighed on results.
The Spectrum Income Fund seeks a high level of current income with moderate share price fluctuation. The fund invests in a diversified group of underlying T. Rowe Price domestic bond funds, foreign bond funds, money market funds, and income-oriented stock funds. The diversifying sectors also provide exposures to key attributes that aim to support the overall portfolio’s risk and return profile over a range of market environments.
How has the fund performed?
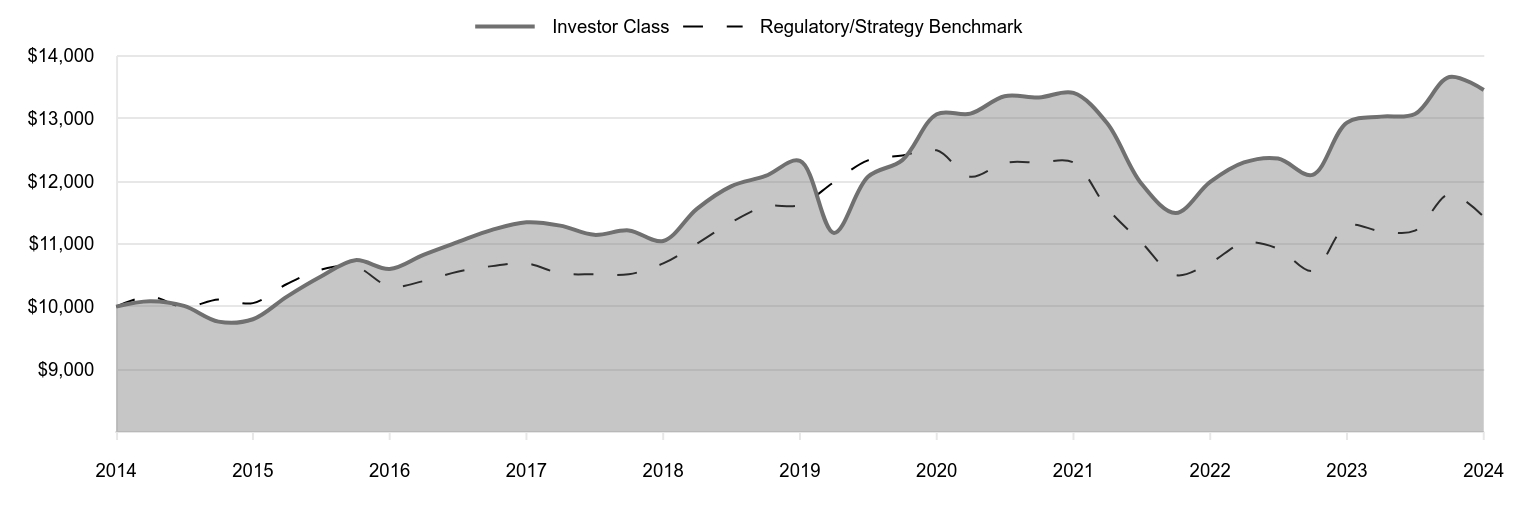
Cumulative Returns of a Hypothetical $10,000 Investment as of December 31, 2024
| Investor Class | Regulatory/Strategy Benchmark |
|---|
| 2014 | 10,000 | 10,000 |
|---|
| 2015 | 10,085 | 10,161 |
|---|
| 2015 | 10,010 | 9,990 |
|---|
| 2015 | 9,760 | 10,113 |
|---|
| 2015 | 9,798 | 10,055 |
|---|
| 2016 | 10,159 | 10,360 |
|---|
| 2016 | 10,479 | 10,589 |
|---|
| 2016 | 10,740 | 10,638 |
|---|
| 2016 | 10,600 | 10,321 |
|---|
| 2017 | 10,826 | 10,406 |
|---|
| 2017 | 11,028 | 10,556 |
|---|
| 2017 | 11,223 | 10,645 |
|---|
| 2017 | 11,344 | 10,687 |
|---|
| 2018 | 11,291 | 10,531 |
|---|
| 2018 | 11,144 | 10,514 |
|---|
| 2018 | 11,215 | 10,516 |
|---|
| 2018 | 11,046 | 10,688 |
|---|
| 2019 | 11,558 | 11,003 |
|---|
| 2019 | 11,917 | 11,341 |
|---|
| 2019 | 12,083 | 11,599 |
|---|
| 2019 | 12,322 | 11,620 |
|---|
| 2020 | 11,175 | 11,985 |
|---|
| 2020 | 12,069 | 12,332 |
|---|
| 2020 | 12,336 | 12,409 |
|---|
| 2020 | 13,068 | 12,492 |
|---|
| 2021 | 13,076 | 12,071 |
|---|
| 2021 | 13,354 | 12,291 |
|---|
| 2021 | 13,335 | 12,298 |
|---|
| 2021 | 13,407 | 12,299 |
|---|
| 2022 | 12,922 | 11,569 |
|---|
| 2022 | 11,963 | 11,026 |
|---|
| 2022 | 11,491 | 10,502 |
|---|
| 2022 | 11,987 | 10,699 |
|---|
| 2023 | 12,298 | 11,016 |
|---|
| 2023 | 12,360 | 10,923 |
|---|
| 2023 | 12,101 | 10,570 |
|---|
| 2023 | 12,933 | 11,291 |
|---|
| 2024 | 13,029 | 11,203 |
|---|
| 2024 | 13,071 | 11,210 |
|---|
| 2024 | 13,661 | 11,793 |
|---|
| 2024 | 13,453 | 11,432 |
|---|
202501-4140694, 202502-4108930
Average Annual Total Returns
| | 1 Year | 5 Years | 10 Years |
|---|
| Spectrum Income Fund (Investor Class) | 4.02% | 1.77% | 3.01% |
|---|
| Bloomberg U.S. Aggregate Bond Index (Regulatory/Strategy Benchmark) | 1.25 | -0.33 | 1.35 |
|---|
The preceding line graph shows the value of a hypothetical $10,000 investment in the fund over the past 10 fiscal year periods or since inception (for funds lacking 10-year records). The fund’s performance information included in the line graph and table above is compared with a regulatory required index that represents an overall securities market (Regulatory Benchmark). In addition, the line graph and table may also include one or more indexes that more closely aligns to the fund's investment strategy (Strategy Benchmark(s)). Due to new SEC Rules on shareholder reporting the fund adopted a new broad-based securities market index, referred to as the Regulatory Benchmark. Market index returns do not include expenses, which are deducted from fund returns. The fund's total return figures reflect the reinvestment of dividends and capital gains, if any.Neither the fund’s returns nor the index returns reflect the deduction of taxes that a shareholder would pay on fund distributions or redemptions of fund shares.The fund’s past performance is not a good predictor of the fund’s future performance.Updated performance information can be found at www.troweprice.com.
What are some fund statistics?
- Total Net Assets (000s)$5,894,081
- Number of Portfolio Holdings22
- Investment Advisory Fees Paid (000s)$30,014
- Portfolio Turnover Rate38.7%
What did the fund invest in?
Asset Allocation (as a % of Net Assets)
| Domestic Bond Funds | 58.7% |
| International Bond Funds | 29.9 |
| Corporate Securities | 7.1 |
| Domestic Equity Funds | 2.7 |
| Short-Term and Other | 1.6 |
Top Ten Holdings (as a % of Net Assets)
| T. Rowe Price High Yield Fund | 14.7% |
| T. Rowe Price New Income Fund | 11.5 |
| T. Rowe Price GNMA Fund | 10.3 |
| T. Rowe Price Emerging Markets Bond Fund | 7.5 |
| T. Rowe Price U.S. High Yield ETF | 7.1 |
| T. Rowe Price International Bond Fund (USD Hedged) | 6.1 |
| T. Rowe Price Floating Rate Fund | 5.7 |
| T. Rowe Price Short-Term Bond Fund | 5.3 |
| T. Rowe Price Dynamic Global Bond Fund | 5.2 |
| T. Rowe Price Dynamic Credit Fund | 5.1 |
How has the fund changed?
This is a summary of certain material changes to Spectrum Income Fund. Effective March 1, 2025, the fund will no longer invest in other funds that focus on dividend-paying stocks and will use derivatives as a principal strategy. The adviser also lowered the class’s all-inclusive fee to 0.61%. The fund’s March 1, 2025 prospectus contains more information.
If you invest directly with T. Rowe Price, you can elect to receive future shareholder reports or other important documents through electronic delivery by enrolling at www.troweprice.com/paperless. If you invest through a financial intermediary such as an investment advisor, a bank, retirement plan sponsor or a brokerage firm, please contact that organization and ask if it can provide electronic delivery.
Bloomberg does not accept any liability for any errors or omissions in the indexes or data, and hereby expressly disclaim all warranties of originality, accuracy, completeness, timeliness, merchantability and fitness for a particular purpose. No party may rely on any indexes or data contained in this communication. Visit www.troweprice.com/en/us/market-data-disclosures for additional legal notices & disclaimers.
Spectrum Income Fund
Investor Class (RPSIX)
T. Rowe Price Investment Services, Inc.
100 East Pratt Street
Baltimore, MD 21202
Annual Shareholder Report
December 31, 2024
This annual shareholder report contains important information about Spectrum Income Fund (the "fund") for the period of January 1, 2024 to December 31, 2024. You can find the fund’s prospectus, financial information on Form N‑CSR (which includes required tax information for dividends), holdings, proxy voting information, and other information atwww.troweprice.com/prospectus. You can also request this information without charge by contacting T. Rowe Price at 1‑800‑638‑5660 or info@troweprice.com or contacting your intermediary. This report describes changes to the fund that occurred during the reporting period.
What were the fund costs for the last year? (based on a hypothetical $10,000 investment)
| | Costs of a $10,000 investment | Costs paid as a percentage of a $10,000 investment |
|---|
| Spectrum Income Fund - I Class | $47 | 0.46% |
|---|
What drove fund performance during the past 12 months?
U.S. taxable investment-grade bonds produced positive returns in 2024. Bonds in developed non-U.S. markets produced negative returns in U.S. dollar terms due to weaker currencies versus the dollar and rising bond yields in some countries. Easing inflation pressures enabled the European Central Bank to reduce short-term interest rates four times starting in June. Emerging markets bond returns were mixed. U.S. stocks advanced during the period, buoyed by generally favorable corporate earnings and continuing interest in companies expected to benefit from artificial intelligence developments. High yield corporate bonds produced solid gains and strongly outperformed the investment-grade bond market.
Versus the Bloomberg U.S. Aggregate Bond Index, results were supported by an out-of-benchmark exposure to dividend-paying equities. Similarly, the inclusion of high yield bonds as a diversifying exposure within the fund was additive during the period.
On the negative side, an out-of-benchmark exposure to long-term U.S. Treasury bonds was detrimental to results over the period. Security selection among high yield bonds also weighed on results.
The Spectrum Income Fund seeks a high level of current income with moderate share price fluctuation. The fund invests in a diversified group of underlying T. Rowe Price domestic bond funds, foreign bond funds, money market funds, and income-oriented stock funds. The diversifying sectors also provide exposures to key attributes that aim to support the overall portfolio’s risk and return profile over a range of market environments.
How has the fund performed?
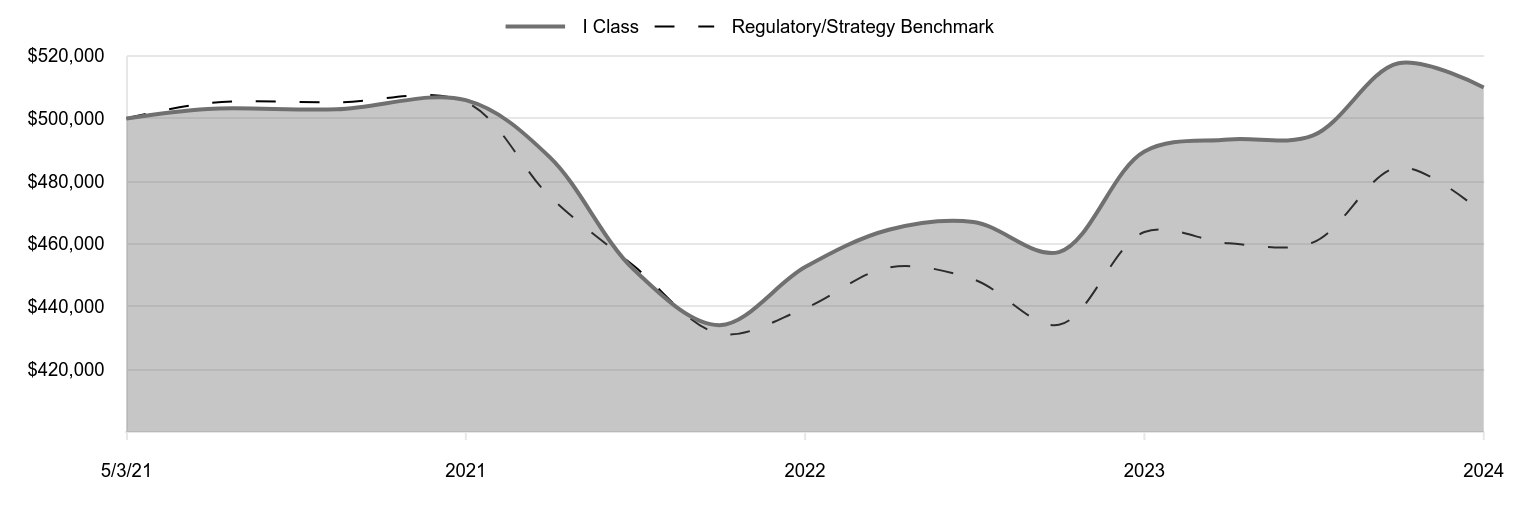
Cumulative Returns of a Hypothetical $500,000 Investment as of December 31, 2024
| I Class | Regulatory/Strategy Benchmark |
|---|
| 5/3/21 | 500,000 | 500,000 |
|---|
| 6/30/21 | 503,039 | 504,893 |
|---|
| 9/30/21 | 502,899 | 505,154 |
|---|
| 12/31/21 | 505,825 | 505,213 |
|---|
| 3/31/22 | 487,736 | 475,234 |
|---|
| 6/30/22 | 451,733 | 452,929 |
|---|
| 9/30/22 | 434,078 | 431,404 |
|---|
| 12/31/22 | 452,584 | 439,484 |
|---|
| 3/31/23 | 464,500 | 452,502 |
|---|
| 6/30/23 | 466,982 | 448,681 |
|---|
| 9/30/23 | 457,383 | 434,184 |
|---|
| 12/31/23 | 489,465 | 463,783 |
|---|
| 3/31/24 | 493,279 | 460,185 |
|---|
| 6/30/24 | 494,586 | 460,485 |
|---|
| 9/30/24 | 517,582 | 484,412 |
|---|
| 12/31/24 | 509,878 | 469,581 |
|---|
202501-4140694, 202502-4108930
Average Annual Total Returns
| | 1 Year | Since Inception 5/3/21 |
|---|
| Spectrum Income Fund (I Class) | 4.17% | 0.54% |
|---|
| Bloomberg U.S. Aggregate Bond Index (Regulatory/Strategy Benchmark) | 1.25 | -1.70 |
|---|
The preceding line graph shows the value of a hypothetical $500,000 investment in the fund over the past 10 fiscal year periods or since inception (for funds lacking 10-year records). The fund’s performance information included in the line graph and table above is compared with a regulatory required index that represents an overall securities market (Regulatory Benchmark). In addition, the line graph and table may also include one or more indexes that more closely aligns to the fund's investment strategy (Strategy Benchmark(s)). Due to new SEC Rules on shareholder reporting the fund adopted a new broad-based securities market index, referred to as the Regulatory Benchmark. Market index returns do not include expenses, which are deducted from fund returns. The fund's total return figures reflect the reinvestment of dividends and capital gains, if any.Neither the fund’s returns nor the index returns reflect the deduction of taxes that a shareholder would pay on fund distributions or redemptions of fund shares.The fund’s past performance is not a good predictor of the fund’s future performance.Updated performance information can be found at www.troweprice.com.
What are some fund statistics?
- Total Net Assets (000s)$5,894,081
- Number of Portfolio Holdings22
- Investment Advisory Fees Paid (000s)$30,014
- Portfolio Turnover Rate38.7%
What did the fund invest in?
Asset Allocation (as a % of Net Assets)
| Domestic Bond Funds | 58.7% |
| International Bond Funds | 29.9 |
| Corporate Securities | 7.1 |
| Domestic Equity Funds | 2.7 |
| Short-Term and Other | 1.6 |
Top Ten Holdings (as a % of Net Assets)
| T. Rowe Price High Yield Fund | 14.7% |
| T. Rowe Price New Income Fund | 11.5 |
| T. Rowe Price GNMA Fund | 10.3 |
| T. Rowe Price Emerging Markets Bond Fund | 7.5 |
| T. Rowe Price U.S. High Yield ETF | 7.1 |
| T. Rowe Price International Bond Fund (USD Hedged) | 6.1 |
| T. Rowe Price Floating Rate Fund | 5.7 |
| T. Rowe Price Short-Term Bond Fund | 5.3 |
| T. Rowe Price Dynamic Global Bond Fund | 5.2 |
| T. Rowe Price Dynamic Credit Fund | 5.1 |
How has the fund changed?
This is a summary of certain material changes to Spectrum Income Fund. Effective March 1, 2025, the fund will no longer invest in other funds that focus on dividend-paying stocks and will use derivatives as a principal strategy. The adviser also lowered the class’s all-inclusive fee to 0.46%. The fund’s March 1, 2025 prospectus contains more information.
If you invest directly with T. Rowe Price, you can elect to receive future shareholder reports or other important documents through electronic delivery by enrolling at www.troweprice.com/paperless. If you invest through a financial intermediary such as an investment advisor, a bank, retirement plan sponsor or a brokerage firm, please contact that organization and ask if it can provide electronic delivery.
Bloomberg does not accept any liability for any errors or omissions in the indexes or data, and hereby expressly disclaim all warranties of originality, accuracy, completeness, timeliness, merchantability and fitness for a particular purpose. No party may rely on any indexes or data contained in this communication. Visit www.troweprice.com/en/us/market-data-disclosures for additional legal notices & disclaimers.
Spectrum Income Fund
I Class (TSPNX)
T. Rowe Price Investment Services, Inc.
100 East Pratt Street
Baltimore, MD 21202
Item 1. (b) Notice pursuant to Rule 30e-3.
Not applicable.
Item 2. Code of Ethics.
The registrant has adopted a code of ethics, as defined in Item 2 of Form N-CSR, applicable to its principal executive officer, principal financial officer, principal accounting officer or controller, or persons performing similar functions. A copy of this code of ethics is filed as an exhibit to this Form N-CSR. No substantive amendments were approved or waivers were granted to this code of ethics during the period covered by this report.
Item 3. Audit Committee Financial Expert.
The registrant’s Board of Directors has determined that Mr. Paul F. McBride qualifies as an audit committee financial expert, as defined in Item 3 of Form N-CSR. Mr. McBride is considered independent for purposes of Item 3 of Form N-CSR.
Item 4. Principal Accountant Fees and Services.
(a) – (d) Aggregate fees billed for the last two fiscal years for professional services rendered to, or on behalf of, the registrant by the registrant’s principal accountant were as follows:
| | | | | | | | | | | | | | | | |
| | | | 2024 | | | | | | 2023 | | | |
| | Audit Fees | | $ | 14,377 | | | | | | | $ | 14,113 | |
| | Audit-Related Fees | | | - | | | | | | | | - | |
| | Tax Fees | | | - | | | | | | | | - | |
| | All Other Fees | | | - | | | | | | | | - | |
Audit fees include amounts related to the audit of the registrant’s annual financial statements and services normally provided by the accountant in connection with statutory and regulatory filings. Audit-related fees include amounts reasonably related to the performance of the audit of the registrant’s financial statements and specifically include the issuance of a report on internal controls and, if applicable, agreed-upon procedures related to fund acquisitions. Tax fees include amounts related to services for tax compliance, tax planning, and tax advice. The nature of these services specifically includes the review of distribution calculations and the preparation of Federal, state, and excise tax returns. All other fees include the registrant’s pro-rata share of amounts for agreed-upon procedures in conjunction with service contract approvals by the registrant’s Board of Directors/Trustees.
(e)(1) The registrant’s audit committee has adopted a policy whereby audit and non-audit services performed by the registrant’s principal accountant for the registrant, its investment adviser, and any entity controlling, controlled by, or under common control with the investment adviser that provides ongoing services to the registrant require pre-approval in advance at regularly scheduled audit committee meetings. If such a service is required between regularly scheduled audit committee meetings, pre-approval may be authorized by one audit committee member with ratification at the next scheduled audit committee meeting. Waiver of pre-approval for audit or non-audit services requiring fees of a de minimis amount is not permitted.
(2) No services included in (b) – (d) above were approved pursuant to paragraph (c)(7)(i)(C) of Rule 2-01 of Regulation S-X.
(f) Less than 50 percent of the hours expended on the principal accountant’s engagement to audit the registrant’s financial statements for the most recent fiscal year were attributed to work performed by persons other than the principal accountant’s full-time, permanent employees.
(g) The aggregate fees billed for the most recent fiscal year and the preceding fiscal year by the registrant’s principal accountant for non-audit services rendered to the registrant, its investment adviser, and any entity controlling, controlled by, or under common control with the investment adviser that provides ongoing services to the registrant were $1,262,000 and $1,524,000, respectively.
(h) All non-audit services rendered in (g) above were pre-approved by the registrant’s audit committee. Accordingly, these services were considered by the registrant’s audit committee in maintaining the principal accountant’s independence.
(i) Not applicable.
(j) Not applicable.
Item 5. Audit Committee of Listed Registrants.
Not applicable.
Item 6. Investments.
(a) Not applicable. The complete schedule of investments is included in Item 7 of this Form N-CSR.
(b) Not applicable.
Item 7. Financial Statements and Financial Highlights for Open-End Management Investment Companies.
(a – b) Report pursuant to Regulation S-X.
Financial
Highlights
Portfolio
of
Investments
Financial
Statements
and
Notes
Additional
Fund
Information
Financial
Statements
and
Other
Information
For
more
insights
from
T.
Rowe
Price
investment
professionals,
go
to
troweprice.com
.
T.
ROWE
PRICE
RPSIX
Spectrum
Income
Fund
TSPNX
Spectrum
Income
Fund–
.
I Class
T.
ROWE
PRICE
Spectrum
Income
Fund
For
a
share
outstanding
throughout
each
period
Investor
Class
..
Year
..
..
Ended
.
12/31/24
12/31/23
12/31/22
12/31/21
12/31/20
NET
ASSET
VALUE
Beginning
of
period
$
11.30
$
10.94
$
12.83
$
13.00
$
12.73
Investment
activities
Net
investment
income
(1)(2)
0.50
0.43
0.34
0.33
0.34
Net
realized
and
unrealized
gain/loss
(0.06)
0.41
(1.69)
—
(3)
0.41
Total
from
investment
activities
0.44
0.84
(1.35)
0.33
0.75
Distributions
Net
investment
income
(0.51)
(0.48)
(0.39)
(0.34)
(0.38)
Net
realized
gain
(0.05)
—
(0.15)
(0.16)
(0.10)
Total
distributions
(0.56)
(0.48)
(0.54)
(0.50)
(0.48)
NET
ASSET
VALUE
End
of
period
$
11.18
$
11.30
$
10.94
$
12.83
$
13.00
Ratios/Supplemental
Data
Total
return
(2)(4)(5)
4.02%
7.89%
(10.59)%
2.59%
6.06%
Ratios
to
average
net
assets:
(2)
Gross
expenses
before
payments
by
Price
Associates
(5)
0.62%
0.62%
0.62%
0.45%
0.00%
Net
expenses
after
payments
by
Price
Associates
(5)
0.61%
0.62%
0.62%
0.45%
0.00%
Weighted
average
net
expenses
of
underlying
Price
Funds
(6)
0.00%
0.00%
0.00%
0.14%
0.65%
Effective
net
expenses
0.61%
0.62%
0.62%
0.59%
0.65%
Net
investment
income
(5)
4.45%
3.92%
2.88%
2.52%
2.77%
Portfolio
turnover
rate
(5)
38.7%
23.6%
20.7%
15.1%
29.9%
Net
assets,
end
of
period
(in
millions)
$1,620
$1,869
$1,983
$4,778
$6,890
0%
0%
0%
0%
0%
T.
ROWE
PRICE
Spectrum
Income
Fund
For
a
share
outstanding
throughout
each
period
The
accompanying
notes
are
an
integral
part
of
these
financial
statements.
(1)
Per
share
amounts
calculated
using
average
shares
outstanding
method.
(2)
Includes
the
impact
of
expense-related
arrangements
with
Price
Associates.
Effective
March
24,
2021,
the
fund
began
charging
an
all-inclusive
management
fee
based
on
the
class'
average
daily
net
assets.
On
that
same
date,
the
fund
converted
its
investments
from
each
underlying
Price
Fund’s
Investor
Class
to
its
Z
Class,
which
has
a
net
expense
ratio
of
less
than
0.01%.
(3)
Amounts
round
to
less
than
$0.01
per
share.
(4)
Total
return
reflects
the
rate
that
an
investor
would
have
earned
on
an
investment
in
the
fund
during
each
period,
assuming
reinvestment
of
all
distributions,
and
payment
of
no
redemption
or
account
fees,
if
applicable.
The
fund's
total
return
may
be
higher
or
lower
than
the
investment
results
of
the
individual
underlying
Price
Funds.
(5)
Reflects
the
activity
of
the
fund,
and
does
not
include
the
activity
of
the
underlying
Price
Funds.
However,
investment
performance
of
the
fund
is
directly
related
to
the
investment
performance
of
the
underlying
Price
Funds
in
which
it
invests.
(6)
Reflects
the
indirect
expense
impact
to
the
fund
from
its
investment
in
the
underlying
Price
Funds,
based
on
the
actual
expense
ratio
of
each
underlying
Price
Fund
weighted
for
the
fund's
relative
average
investment
therein.
T.
ROWE
PRICE
Spectrum
Income
Fund
For
a
share
outstanding
throughout
each
period
I
Class
(1)
..
Year
..
..
Ended
.
5/3/21
(1)
Through
12/31/21
12/31/24
12/31/23
12/31/22
NET
ASSET
VALUE
Beginning
of
period
$
11.31
$
10.94
$
12.84
$
13.10
Investment
activities
Net
investment
income
(2)(3)
0.52
0.45
0.38
0.24
Net
realized
and
unrealized
gain/loss
(0.06)
0.42
(1.72)
(0.09)
(4)
Total
from
investment
activities
0.46
0.87
(1.34)
0.15
Distributions
Net
investment
income
(0.53)
(0.50)
(0.41)
(0.25)
Net
realized
gain
(0.05)
—
(0.15)
(0.16)
Total
distributions
(0.58)
(0.50)
(0.56)
(0.41)
NET
ASSET
VALUE
End
of
period
$
11.19
$
11.31
$
10.94
$
12.84
Ratios/Supplemental
Data
Total
return
(3)(5)(6)
4.17%
8.15%
(10.53)%
1.16%
Ratios
to
average
net
assets:
(3)
Gross
expenses
before
payments
by
Price
Associates
(6)
0.47%
0.47%
0.47%
0.47%
(7)
Net
expenses
after
payments
by
Price
Associates
(6)
0.46%
0.47%
0.47%
0.47%
(7)
Net
investment
income
(6)
4.65%
4.09%
3.33%
2.79%
(7)
Portfolio
turnover
rate
(6)
38.7%
23.6%
20.7%
15.1%
Net
assets,
end
of
period
(in
millions)
$4,274
$4,099
$3,945
$2,422
0%
0%
0%
0%
(1)
Inception
date
(2)
Per
share
amounts
calculated
using
average
shares
outstanding
method.
(3)
Includes
the
impact
of
expense-related
arrangements
with
Price
Associates.
(4)
The
amount
presented
is
inconsistent
with
the
fund's
aggregate
gains
and
losses
because
of
the
timing
of
sales
and
redemptions
of
fund
shares
in
relation
to
fluctuating
market
values
for
the
investment
portfolio.
(5)
Total
return
reflects
the
rate
that
an
investor
would
have
earned
on
an
investment
in
the
fund
during
each
period,
assuming
reinvestment
of
all
distributions,
and
payment
of
no
redemption
or
account
fees,
if
applicable.
Total
return
is
not
annualized
for
periods
less
than
one
year.
The
fund's
total
return
may
be
higher
or
lower
than
the
investment
results
of
the
individual
underlying
Price
Funds.
T.
ROWE
PRICE
Spectrum
Income
Fund
For
a
share
outstanding
throughout
each
period
The
accompanying
notes
are
an
integral
part
of
these
financial
statements.
(6)
Reflects
the
activity
of
the
fund,
and
does
not
include
the
activity
of
the
underlying
Price
Funds.
However,
investment
performance
of
the
fund
is
directly
related
to
the
investment
performance
of
the
underlying
Price
Funds
in
which
it
invests.
(7)
Annualized
T.
ROWE
PRICE
Spectrum
Income
Fund
December
31,
2024
Portfolio
of
Investments
(1)
(1)
$
Value
12/31/23
$
Purchase
Cost
(2)
$
Sales
Cost
(2)
Shares
$
Value
12/31/24
(Cost
and
value
in
$000s)
BOND
FUNDS
95.7%
T.
Rowe
Price
Funds:
High
Yield
Fund
883,900
83,302
104,547
146,628,617
866,575
New
Income
Fund
805,391
49,446
169,162
86,381,312
678,957
GNMA
Fund
632,148
43,303
57,731
76,180,249
607,157
Emerging
Markets
Bond
Fund
474,943
40,483
88,029
48,290,945
441,862
U.S.
High
Yield
ETF
–
418,593
–
8,033,501
418,545
International
Bond
Fund
(USD
Hedged)
225,654
152,788
27,642
41,897,753
357,388
Floating
Rate
Fund
338,473
37,201
41,974
36,030,251
335,442
Short-Term
Bond
Fund
292,932
38,924
21,296
68,162,963
313,550
Dynamic
Global
Bond
Fund
283,766
33,966
18,169
39,312,067
306,241
Dynamic
Credit
Fund
262,646
46,468
6,842
34,244,128
303,060
Corporate
Income
Fund
267,259
21,750
26,233
32,850,946
261,165
U.S.
Treasury
Long-Term
Index
Fund
303,627
20,062
161,018
27,153,530
192,790
Emerging
Markets
Local
Currency
Bond
Fund
198,619
17,702
19,878
40,212,229
183,770
International
Bond
Fund
277,594
13,034
125,634
24,614,713
167,134
Limited
Duration
Inflation
Focused
Bond
Fund
85,325
55,867
23,707
25,927,438
119,266
Inflation
Protected
Bond
Fund
–
91,199
2,948
8,560,298
86,459
U.S.
Treasury
Intermediate
Index
Fund
482
20
–
97,982
486
Total
Bond
Funds
(Cost
$5,857,215)
5,639,847
EQUITY
FUNDS
2.7%
T.
Rowe
Price
Funds:
Equity
Income
Fund
598,339
35,837
277,177
4,667,056
161,854
Total
Equity
Funds
(Cost
$75,064)
161,854
SHORT-TERM
INVESTMENTS
1.4%
Money
Market
Funds
1.4%
T.
Rowe
Price
U.S.
Treasury
Money
Fund,
4.52% (3)
38,361
628,624
583,593
83,392,444
83,392
Total
Short-Term
Investments
(Cost
$83,392)
83,392
Total
Investments
in
Securities
99.8%
of
Net
Assets
(Cost
$6,015,671)
$
5,885,093
T.
ROWE
PRICE
Spectrum
Income
Fund
(1)
Each
underlying
Price
Fund
is
an
affiliated
company;
the
fund
is
invested
in
the
Z
Class
of
each
underlying
Price
Fund,
except
for
the
Transition
Fund
and
ETFs,
if
held,
which
are
single
class
funds.
Additional
information
about
each
underlying
Price
Fund
is
available
by
calling
1-877-495-1138
and
at
www.troweprice.com.
(2)
Purchase
cost
and
Sales
cost
for
affiliates
not
held
at
period
end
totaled
$474,087
and
$474,087,
respectively.
(3)
Seven-day
yield
ETF
Exchange-Traded
Fund
T.
ROWE
PRICE
Spectrum
Income
Fund
FUTURES
CONTRACTS
($000s)
Expiration
Date
Notional
Amount
Value
and
Unrealized
Gain
(Loss)
Short,
545
S&P
500
E-Mini
Index
contracts
3/25
(161,749)
$
5,491
Long,
523
U.S.
Treasury
Notes
five
year
contracts
3/25
55,597
(237)
Long,
1,494
U.S.
Treasury
Notes
ten
year
contracts
3/25
162,473
(1,613)
Net
payments
(receipts)
of
variation
margin
to
date
(3,390)
Variation
margin
receivable
(payable)
on
open
futures
contracts
$
251
T.
ROWE
PRICE
Spectrum
Income
Fund
The
accompanying
notes
are
an
integral
part
of
these
financial
statements.
AFFILIATED
COMPANIES
($000s)
The
fund
may
invest
in
certain
securities
that
are
considered
affiliated
companies.
As
defined
by
the
1940
Act,
an
affiliated
company
is
one
in
which
the
fund
owns
5%
or
more
of
the
outstanding
voting
securities,
or
a
company
that
is
under
common
ownership
or
control.
The
following
securities
were
considered
affiliated
companies
for
all
or
some
portion
of
the
year
ended
December
31,
2024.
Net
realized
gain
(loss),
investment
income,
and
change
in
net
unrealized
gain/loss
reflect
all
activity
for
the
period
then
ended.
Affiliate
Net
Realized
Gain
(Loss)
Change
in
Net
Unrealized
Gain/Loss
Investment
Income
T.
Rowe
Price
Funds:
Corporate
Income
Fund
$
(2,939)
$
(1,611)
$
14,154
Dynamic
Credit
Fund
(31)
788
21,368
Dynamic
Global
Bond
Fund
(1,408)
6,678
12,348
Emerging
Markets
Bond
Fund
(12,939)
14,465
30,055
Emerging
Markets
Local
Currency
Bond
Fund
(559)
(12,673)
6,749
Equity
Income
Fund
268,601
(195,145)
11,546
Floating
Rate
Fund
(1,082)
1,742
29,726
GNMA
Fund
(4,936)
(10,563)
25,576
High
Yield
Fund
(5,356)
3,920
63,163
Inflation
Protected
Bond
Fund
15
(1,792)
3,513
International
Bond
Fund
(14,788)
2,140
—
International
Bond
Fund
(USD
Hedged)
(2,278)
6,588
11,384
Limited
Duration
Inflation
Focused
Bond
Fund
(1,027)
1,781
5,193
New
Income
Fund
(16,511)
(6,718)
35,417
Short-Term
Bond
Fund
(187)
2,990
14,056
U.S.
High
Yield
ETF
22
(48)
6,195
U.S.
Treasury
Intermediate
Index
Fund
—
(16)
20
U.S.
Treasury
Long-Term
Index
Fund
(55,780)
30,119
9,192
U.S.
Treasury
Money
Fund,
4.52%
—
—
2,051
Affiliates
not
held
at
period
end
2,072
—
456
Totals
$
150,889#
$
(157,355)
$
302,162+
#
Capital
gain
distributions
from
underlying
Price
funds
represented
$10,967
of
the
net
realized
gain
(loss).
+
Investment
income
comprised
$302,162
of
income
distributions
from
underlying
Price
Funds.
T.
ROWE
PRICE
Spectrum
Income
Fund
December
31,
2024
Statement
of
Assets
and
Liabilities
($000s,
except
shares
and
per
share
amounts)
The
accompanying
notes
are
an
integral
part
of
these
financial
statements.
Assets
Investments
in
securities,
at
value
(cost
$6,015,671)
$
5,885,093
Cash
deposits
on
futures
contracts
11,693
Receivable
for
investment
securities
sold
5,149
Receivable
for
shares
sold
3,064
Variation
margin
receivable
on
futures
contracts
251
Total
assets
5,905,250
Liabilities
Payable
for
shares
redeemed
5,675
Investment
management
and
administrative
fees
payable
2,899
Payable
for
investment
securities
purchased
1,500
Other
liabilities
1,095
Total
liabilities
11,169
NET
ASSETS
$
5,894,081
Net
Assets
Consist
of:
Total
distributable
earnings
(loss)
$
(384,605)
Paid-in
capital
applicable
to
526,880,630
shares
of
$0.01
par
value
capital
stock
outstanding;
2,000,000,000
shares
of
the
Corporation
authorized
6,278,686
NET
ASSETS
$
5,894,081
NET
ASSET
VALUE
PER
SHARE
Investor
Class
(Net
assets:
$1,620,135;
Shares
outstanding:
144,884,704)
$
11.18
I
Class
(Net
assets:
$4,273,946;
Shares
outstanding:
381,995,926)
$
11.19
T.
ROWE
PRICE
Spectrum
Income
Fund
The
accompanying
notes
are
an
integral
part
of
these
financial
statements.
Year
Ended
12/31/24
Investment
Income
(Loss)
Income
Income
distributions
from
underlying
Price
Funds
$
302,162
Interest
136
Total
income
302,298
Expenses
Investment
management
and
administrative
expense
30,513
Waived
/
paid
by
Price
Associates
(499)
Total
expenses
30,014
Net
investment
income
272,284
Realized
and
Unrealized
Gain
/
Loss
–
Net
realized
gain
(loss)
Sales
of
underlying
Price
Funds
139,922
Futures
(26,297)
Capital
gain
distributions
from
underlying
Price
Funds
10,967
Net
realized
gain
124,592
Change
in
net
unrealized
gain
/
loss
Underlying
Price
Funds
(157,355)
Futures
3,641
Change
in
net
unrealized
gain
/
loss
(153,714)
Net
realized
and
unrealized
gain
/
loss
(29,122)
INCREASE
IN
NET
ASSETS
FROM
OPERATIONS
$
243,162
T.
ROWE
PRICE
Spectrum
Income
Fund
Statement
of
Changes
in
Net
Assets
The
accompanying
notes
are
an
integral
part
of
these
financial
statements.
Year
.
.
.
.
.
.
.
.
.
.
.
.
.
.
Ended
.
.
.
.
.
.
.
.
.
.
.
.
.
.
12/31/24
12/31/23
Increase
(Decrease)
in
Net
Assets
Operations
Net
investment
income
$
272,284
$
237,324
Net
realized
gain
(loss)
124,592
(116,735)
Change
in
net
unrealized
gain
/
loss
(153,714)
331,937
Increase
in
net
assets
from
operations
243,162
452,526
Distributions
to
shareholders
Net
earnings
Investor
Class
(87,527)
(83,788)
I
Class
(215,784)
(179,581)
Decrease
in
net
assets
from
distributions
(303,311)
(263,369)
Capital
share
transactions
*
Shares
sold
Investor
Class
184,226
157,934
I
Class
652,529
703,464
Distributions
reinvested
Investor
Class
81,979
78,148
I
Class
209,360
173,348
Shares
redeemed
Investor
Class
(498,784)
(410,563)
I
Class
(643,032)
(850,813)
Decrease
in
net
assets
from
capital
share
transactions
(13,722)
(148,482)
Net
Assets
Increase
(decrease)
during
period
(73,871)
40,675
Beginning
of
period
5,967,952
5,927,277
End
of
period
$
5,894,081
$
5,967,952
*Share
information
(000s)
Shares
sold
Investor
Class
16,334
14,338
I
Class
58,026
63,698
Distributions
reinvested
Investor
Class
7,278
7,099
I
Class
18,565
15,744
Shares
redeemed
Investor
Class
(44,132)
(37,311)
I
Class
(56,992)
(77,508)
Decrease
in
shares
outstanding
(921)
(13,940)
T.
ROWE
PRICE
Spectrum
Income
Fund
NOTES
TO
FINANCIAL
STATEMENTS
T.
Rowe
Price
Spectrum
Fund,
Inc.
(the
corporation)
is
registered
under
the
Investment
Company
Act
of
1940
(the
1940
Act).
The Spectrum
Income
Fund (the
fund)
is
a diversified,
open-end
management
investment
company
established
by
the
corporation.
The
fund broadly
diversifies
its
assets
within
specified
ranges
among
a
set
of
T.
Rowe
Price
mutual
funds
or
exchange-
traded
funds
(ETFs)
(underlying
Price
Funds)
representing
specific
market
segments.
The
fund
seeks
a
high
level
of
current
income
with
moderate
share
price
fluctuation.
The fund
has
two
classes
of
shares
as
follows:
Spectrum
Income
Fund (Investor
Class)
and
Spectrum
Income
Fund –
I
Class
(I
Class).
I
Class
shares
require
a
$500,000
initial
investment
minimum,
although
the
minimum
generally
is
waived
or
reduced
for
financial
intermediaries,
eligible
retirement
plans
and
certain
other
accounts.
Each
class
has
exclusive
voting
rights
on
matters
related
solely
to
that
class;
separate
voting
rights
on
matters
that
relate
to
both
classes;
and,
in
all
other
respects,
the
same
rights
and
obligations
as
the
other
class.
NOTE
1
-
SIGNIFICANT
ACCOUNTING
POLICIES
Basis
of
Preparation
The fund
is
an
investment
company
and
follows
accounting
and
reporting
guidance
in
the
Financial
Accounting
Standards
Board
Accounting
Standards
Codification
Topic
946
(ASC
946).
The
accompanying
financial
statements
were
prepared
in
accordance
with
accounting
principles
generally
accepted
in
the
United
States
of
America
(GAAP),
including,
but
not
limited
to,
ASC
946.
GAAP
requires
the
use
of
estimates
made
by
management.
Management
believes
that
estimates
and
valuations
of
the
underlying
Price
Funds
are
appropriate;
however,
actual
results
may
differ
from
those
estimates,
and
the
valuations
reflected
in
the
accompanying
financial
statements
may
differ
from
the
value
ultimately
realized
upon
sale
of
the
underlying
Price
Funds.
Investment
Transactions,
Investment
Income,
and
Distributions
Investment
transactions are
accounted
for
on
the
trade
date
basis.
Income
and
expenses
are
recorded
on
the
accrual
basis.
Realized
gains
and
losses are
reported
on
the
identified
cost
basis.
Income
tax-related
interest
and
penalties,
if
incurred,
are
recorded
as
income
tax
expense.
Dividends
received
from
underlying
Price
Fund
investments
are
reflected
as income;
capital
gain
distributions
are
reflected
as
realized
gain/loss.
Income
and
capital
gain
distributions
from
the
T.
ROWE
PRICE
Spectrum
Income
Fund
underlying
Price
Funds
are
recorded
on
the
ex-dividend
date.
Distributions
to
shareholders
are
recorded
on
the
ex-dividend
date.
Income
distributions,
if
any,
are
declared
by
each
class
daily
and
paid
monthly.
A
capital
gain
distribution,
if
any, may
also
be
declared
and
paid
by the
fund
annually.
Class
Accounting
Investment
management
and
administrative
expenses
incurred
by
each
class
are
charged
directly
to
the
class
to
which
they
relate.
Expenses
common
to
all
classes,
investment
income,
and
realized
and
unrealized
gains
and
losses
are
allocated
to
the
classes
based
upon
the
relative
daily
net
assets
of
each
class.
Capital
Transactions
Each
investor’s
interest
in
the
net
assets
of the
fund
is
represented
by
fund
shares. The
fund’s
net
asset
value
(NAV)
per
share
is
computed
at
the
close
of
the
New
York
Stock
Exchange
(NYSE),
normally
4
p.m.
Eastern
time,
each
day
the
NYSE
is
open
for
business.
However,
the
NAV
per
share
may
be
calculated
at
a
time
other
than
the
normal
close
of
the
NYSE
if
trading
on
the
NYSE
is
restricted,
if
the
NYSE
closes
earlier,
or
as
may
be
permitted
by
the
SEC.
Purchases
and
redemptions
of
fund
shares
are
transacted
at
the
next-computed
NAV
per
share,
after
receipt
of
the
transaction
order
by
T.
Rowe
Price
Associates,
Inc.,
or
its
agents.
Indemnification
In
the
normal
course
of
business,
the fund
may
provide
indemnification
in
connection
with
its
officers
and
directors,
service
providers
and/or
private
company
investments. The
fund’s
maximum
exposure
under
these
arrangements
is
unknown;
however,
the
risk
of
material
loss
is
currently
considered
to
be
remote.
NOTE
2
-
VALUATION
The fund’s
financial
instruments
are
valued
at
the
close
of
the
NYSE
and
are
reported
at
fair
value,
which
GAAP
defines
as
the
price
that
would
be
received
to
sell
an
asset
or
paid
to
transfer
a
liability
in
an
orderly
transaction
between
market
participants
at
the
measurement
date.
Investments
in
the
underlying
Price
Funds
are
valued
at
their
closing
NAV
per
share
on
the
day
of
valuation.
Futures
contracts
are
valued
at
closing
settlement
prices. Assets
and
liabilities
other
than
financial
instruments,
including
short-term
receivables
and
payables,
are
carried
at
cost,
or
estimated
realizable
value,
if
less,
which
approximates
fair
value.
T.
ROWE
PRICE
Spectrum
Income
Fund
The
fund’s
Board
of
Directors
(the
Board) has
designated
T.
Rowe
Price
Associates,
Inc.
as
the fund’s
valuation
designee
(Valuation
Designee).
Subject
to
oversight
by
the
Board,
the
Valuation
Designee
performs
the
following
functions
in
performing
fair
value
determinations:
assesses
and
manages
valuation
risks;
establishes
and
applies
fair
value
methodologies;
tests
methodologies;
and
evaluates
pricing
vendors
and
pricing
agents.
The
duties
and
responsibilities
of
the
Valuation
Designee
are
performed
by
its
Valuation
Committee.
The
Valuation Designee
provides
periodic
reporting
to
the
Board
on
valuation
matters.
Various
valuation
techniques
and
inputs
are
used
to
determine
the
fair
value
of
financial
instruments.
GAAP
establishes
the
following
fair
value
hierarchy
that
categorizes
the
inputs
used
to
measure
fair
value:
Level
1 – quoted
prices
(unadjusted)
in
active
markets
for
identical
financial
instruments
that
the
fund
can
access
at
the
reporting
date
Level
2 – inputs
other
than
Level
1
quoted
prices
that
are
observable,
either
directly
or
indirectly
(including,
but
not
limited
to,
quoted
prices
for
similar
financial
instruments
in
active
markets,
quoted
prices
for
identical
or
similar
financial
instruments
in
inactive
markets,
interest
rates
and
yield
curves,
implied
volatilities,
and
credit
spreads)
Level
3 – unobservable
inputs
(including
the
Valuation Designee’s
assumptions
in
determining
fair
value)
Observable
inputs
are
developed
using
market
data,
such
as
publicly
available
information
about
actual
events
or
transactions,
and
reflect
the
assumptions
that
market
participants
would
use
to
price
the
financial
instrument.
Unobservable
inputs
are
those
for
which
market
data
are
not
available
and
are
developed
using
the
best
information
available
about
the
assumptions
that
market
participants
would
use
to
price
the
financial
instrument.
GAAP
requires
valuation
techniques
to
maximize
the
use
of
relevant
observable
inputs
and
minimize
the
use
of
unobservable
inputs.
When
multiple
inputs
are
used
to
derive
fair
value,
the
financial
instrument
is
assigned
to
the
level
within
the
fair
value
hierarchy
based
on
the
lowest-level
input
that
is
significant
to
the
fair
value
of
the
financial
instrument.
Input
levels
are
not
necessarily
an
indication
of
the
risk
or
liquidity
associated
with
financial
instruments
at
that
level
but
rather
the
degree
of
judgment
used
in
determining
those
values.
On
December
31,
2024,
all
of
the
fund’s
financial
instruments
were
classified
as
Level
1,
based
on
the
inputs
used
to
determine
their
fair
values.
T.
ROWE
PRICE
Spectrum
Income
Fund
NOTE
3
-
DERIVATIVE
INSTRUMENTS
The fund
may
use
derivatives
in
an
effort
to
manage
cash
flows
efficiently,
remain
fully
invested,
or
facilitate
asset
allocation
and
rebalancing.
As
defined
by
GAAP,
a
derivative
is
a
financial
instrument
whose
value
is
derived
from
an
underlying
security
price,
foreign
exchange
rate,
interest
rate,
index
of
prices
or
rates,
or
other
variable;
it
requires
little
or
no
initial
investment
and
permits
or
requires
net
settlement
or
delivery
of
cash
or
other
assets.
The fund
invests in
derivatives
only
if
the
expected
risks
and
rewards
are
consistent
with
its
investment
objectives,
policies,
and
overall
risk
profile,
as
described
in
its
prospectus
and
Statement
of
Additional
Information.
The
risks
associated
with
the
use
of
derivatives
are
different
from,
and
potentially
much
greater
than,
the
risks
associated
with
investing
directly
in
the
instruments
on
which
the
derivatives
are
based.
The fund
values
its derivatives
at
fair
value
and
recognizes
changes
in
fair
value
currently
in its
results
of
operations.
Accordingly,
the fund
does not
follow
hedge
accounting,
even
for
derivatives
employed
as
economic
hedges.
Generally,
the fund
accounts for its
derivatives
on
a
gross
basis. It
does not
offset
the
fair
value
of
derivative
liabilities
against
the
fair
value
of
derivative
assets
on its financial
statements,
nor does
it offset
the
fair
value
of
derivative
instruments
against
the
right
to
reclaim
or
obligation
to
return
collateral. The
following
table
summarizes
the
fair
value
of
the
fund’s
futures
contracts
held
as
of
December
31,
2024,
and
the
related
location
on
the
accompanying
Statement
of
Assets
and
Liabilities,
presented
by
primary
underlying
risk
exposure:
($000s)
Location
on
Statement
of
Assets
and
Liabilities
Fair
Value*
Assets
Equity
derivatives
Futures
$
5,491
*
Total
$
5,491
*
Liabilities
Interest
rate
derivatives
Futures
$
1,850
Total
$
1,850
T.
ROWE
PRICE
Spectrum
Income
Fund
Additionally,
the
amount
of
gains
and
losses
on futures
recognized
in
fund
earnings
during
the
year ended
December
31,
2024,
and
the
related
location
on
the
accompanying
Statement
of
Operations,
is
summarized
in
the
following
table
by
primary
underlying
risk
exposure:
Counterparty
Risk
and
Collateral
The fund
invests in
exchange-
traded
futures.
Counterparty
risk
on
such
derivatives
is
minimal
because
the
clearinghouse
provides
protection
against
counterparty
defaults.
For
futures,
the fund
is required
to
deposit
collateral
in
an
amount
specified
by
the
clearinghouse
and
the
clearing
firm
(margin
requirement)
and
the
margin
requirement
must
be
maintained
over
the
life
of
the
contract.
Each
clearinghouse
and
clearing
firm,
in
its
sole
discretion,
may
adjust
the
margin
requirements
applicable
to
the
fund.
Collateral
may
be
in
the
form
of
cash
or
debt
securities
issued
by
the
U.S.
government
or
related
agencies.
Cash
posted
by
the
fund
is
reflected
as
cash
deposits
in
the
accompanying
financial
statements
and
generally
is
restricted
from
withdrawal
by
the
fund;
securities
posted
by
the
fund
are
so
noted
in
the
accompanying
Portfolio
of
Investments;
both
remain
in
the
fund’s
assets.
While
typically
not
sold
in
the
same
manner
as
equity
or
fixed
*
The
fair
value
presented
includes
cumulative
gain
(loss)
on
open
futures
contracts;
however,
the
value
reflected
on
the
accompanying
Statement
of
Assets
and
Liabilities
is
only
the
unsettled
variation
margin
receivable
(payable)
at
that
date.
($000s)
Location
of
Gain
(Loss)
on
Statement
of
Operations
Futures
Realized
Gain
(Loss)
Interest
rate
derivatives
$
(9,791
)
Equity
derivatives
(16,506
)
Total
$
(26,297
)
Change
in
Unrealized
Gain
(Loss)
Interest
rate
derivatives
$
(1,850
)
Equity
derivatives
5,491
Total
$
3,641
T.
ROWE
PRICE
Spectrum
Income
Fund
income
securities,
exchange-traded
derivatives
may
be
closed
out
only
on
the
exchange
or
clearinghouse
where
the
contracts
were
cleared.
This
ability
is
subject
to
the
liquidity
of
underlying
positions.
As
of
December
31,
2024,
cash
of $11,693,000 had
been
posted
by
the fund
for
exchange-traded
derivatives.
Futures
Contracts
A
futures
contract
provides
for
the
future
sale
by
one
party
and
purchase
by
another
of
a
specified
amount
of
a
specific
underlying
financial
instrument
at
an
agreed
upon
price,
date,
time,
and
place.
The fund currently invests only
in
exchange-traded
futures,
which
generally
are
standardized
as
to
maturity
date,
underlying
financial
instrument,
and
other
contract
terms.
Payments
are
made
or
received
by
the
fund
each
day
to
settle
daily
fluctuations
in
the
value
of
the
contract
(variation
margin),
which
reflect
changes
in
the
value
of
the
underlying
financial
instrument.
Variation
margin
is
recorded
as
unrealized
gain
or
loss
until
the
contract
is
closed.
The
value
of
a
futures
contract
included
in
net
assets
is
the
amount
of
unsettled
variation
margin;
net
variation
margin
receivable
is
reflected
as
an
asset
and
net
variation
margin
payable
is
reflected
as
a
liability
on
the
accompanying
Statement
of
Assets
and
Liabilities.
When
a
contract
is
closed,
a
realized
gain
or
loss
is
recorded
on
the
accompanying
Statement
of
Operations.
Risks
related
to
the
use
of
futures
contracts
include
possible
illiquidity
of
the
futures
markets,
contract
prices
that
can
be
highly
volatile
and
imperfectly
correlated
to
movements
in
hedged
security
values
and/or
interest
rates,
and
potential
losses
in
excess
of
the
fund’s
initial
investment.
During
the
year ended
December
31,
2024,
the
volume
of
the
fund’s
activity
in
futures,
based
on
underlying
notional
amounts,
was
generally
between
0%
and
8%
of
net
assets.
NOTE
4
-
INVESTMENTS
IN
UNDERLYING
PRICE
FUNDS
Purchases
and
sales
of
the
underlying
Price
Funds
other
than
in-kind
transactions,
if
any,
during
the
year
ended
December
31,
2024,
aggregated
$2,302,656,000
and
$2,347,928,000,
respectively.
T.
ROWE
PRICE
Spectrum
Income
Fund
NOTE
5
-
FEDERAL
INCOME
TAXES
Generally,
no
provision
for
federal
income
taxes
is
required
since
the
fund
intends
to continue
to
qualify
as
a
regulated
investment
company
under
Subchapter
M
of
the
Internal
Revenue
Code
and
distribute
to
shareholders
all
of
its taxable
income
and
gains.
Distributions
determined
in
accordance
with
federal
income
tax
regulations
may
differ
in
amount
or
character
from
net
investment
income
and
realized
gains
for
financial
reporting
purposes.
The
fund
files
U.S.
federal,
state,
and
local
tax
returns
as
required.
The
fund’s
tax
returns
are
subject
to
examination
by
the
relevant
tax
authorities
until
expiration
of
the
applicable
statute
of
limitations,
which
is
generally
three
years
after
the
filing
of
the
tax
return
but
which
can
be
extended
to
six
years
in
certain
circumstances.
Tax
returns
for
open
years
have
incorporated
no
uncertain
tax
positions
that
require
a
provision
for
income
taxes.
Capital
accounts
within
the
financial
reporting
records
are
adjusted
for
permanent
book/tax
differences
to
reflect
tax
character
but
are
not
adjusted
for
temporary
differences.
The
permanent
book/tax
adjustments,
if
any,
have
no
impact
on
results
of
operations
or
net
assets.
The
permanent
book/
tax
adjustments
relate
primarily
to
an
over-distribution
of
taxable
income
not
deemed
a
return
of
capital
for
tax
purposes
and
the
recharacterization
of
distributions.
The
tax
character
of
distributions
paid
for
the
periods
presented
was
as
follows:
($000s)
December
31,
2024
December
31,
2023
Ordinary
income
(including
short-term
capital
gains,
if
any)
$
276,982
$
263,369
Long-term
capital
gain
26,329
—
Total
distributions
$
303,311
$
263,369
T.
ROWE
PRICE
Spectrum
Income
Fund
At
December
31,
2024,
the
tax-basis
cost
of
investments
(including
derivatives,
if
any)
and
gross
unrealized
appreciation
and
depreciation
were as
follows:
At
December
31,
2024,
the
tax-basis
components
of
accumulated
net
earnings
(loss)
were
as
follows:
Temporary
differences
between
book-basis
and
tax-basis
components
of
total
distributable
earnings
(loss)
arise
when
certain
items
of
income,
gain,
or
loss
are
recognized
in
different
periods
for
financial
statement
purposes
versus
for
tax
purposes;
these
differences
will
reverse
in
a
subsequent
reporting
period. The
temporary
differences
relate
primarily
to
the
deferral
of
losses
from
wash
sales
and
the
realization
of
gains/losses
on
certain
open
derivative
contracts.
During
the
year
ended
December
31,
2024,
the
fund
utilized
$100,300,000
of
capital
loss
carryforwards.
NOTE
6
-
RELATED
PARTY
TRANSACTIONS
The fund
is managed
by
T.
Rowe
Price
Associates,
Inc.
(Price
Associates),
a
wholly
owned
subsidiary
of
T.
Rowe
Price
Group,
Inc.
Price
Associates,
directly
or
through
sub-advisory
agreements
with
its
wholly
owned
subsidiaries,
also
provides
investment
management
services
to
all
the
underlying
Price
Funds.
Pursuant
to
various
service
agreements,
Price
Associates
and
its
wholly
owned
subsidiaries
provide
shareholder
servicing
and
administrative
services
as
well
as
certain
accounting,
marketing,
and
other
services
to
the fund.
Certain
officers
and
directors
of
the fund
are
also
officers
and
directors
of
Price
Associates
and
its
subsidiaries
and
of
the
underlying
Price
Funds.
($000s)
Cost
of
investments
$
6,269,698
Unrealized
appreciation
$
138,075
Unrealized
depreciation
(522,680)
Net
unrealized
appreciation
(depreciation)
$
(384,605)
($000s)
Net
unrealized
appreciation
(depreciation)
$
(384,605
)
Total
distributable
earnings
(loss)
$
(384,605
)
T.
ROWE
PRICE
Spectrum
Income
Fund
The fund
operates
in
accordance
with
an
amended
investment
management
agreement
(amended
management
agreement),
between
the
corporation,
on
behalf
of
the
fund,
and
Price
Associates.
Under
the
amended
agreement,
the fund
pays
a
fee
rate
of 0.62%
for
the
Investor
Class
and
0.47%
for
the
I
Class.
The
annual
all-inclusive fee
covers
investment
management
and
all
of the
fund’s
operating
expenses
except
for
interest
expense;
expenses
related
to
borrowings,
taxes,
and
brokerage; nonrecurring,
extraordinary
expenses;
and
acquired
fund
fees
and
expenses.
Differences
in
the
annual
all-inclusive
fees
between
certain
classes
relate
to
differences
in
expected
shareholder
servicing
expenses.
In
addition,
the fund
has entered
into
service
agreements
with
Price
Associates
and
two
wholly
owned
subsidiaries
of
Price
Associates,
each
an
affiliate
of
the
fund
(collectively,
Price).
Price
Associates
provides
certain
accounting
and
administrative
services
to
the
fund.
T.
Rowe
Price
Services,
Inc.
provides
shareholder
and
administrative
services
in
its
capacity
as
the
fund’s
transfer
and
dividend-disbursing
agent.
T.
Rowe
Price
Retirement
Plan
Services,
Inc.
provides
subaccounting
and
recordkeeping
services
for
certain
retirement
accounts
invested
in
the
fund.
Pursuant
to
the
annual
all-inclusive
fee
arrangement
under
the
investment
management
and
administrative
agreement,
expenses
incurred
by
the
fund
pursuant
to
these
service
agreements
are
paid
by
Price
Associates.
T.
Rowe
Price
Investment
Services,
Inc.
(Investment
Services)
serves
as
distributor
to
the
fund.
Pursuant
to
an
underwriting
agreement,
no
compensation
for
any
distribution
services
provided
is
paid
to
Investment
Services
by
the
fund
(except
for
12b-1
fees
under
a
Board-approved
Rule
12b-1
plan).
The fund
may
invest
in
the
T.
Rowe
Price
Transition
Fund
(Transition
Fund)
to
facilitate
the
fund’s
transition
between
the
various
underlying
Price
Funds
as
the
fund
rebalances
its
allocation
to
the
underlying
Price
Funds.
The
fund
does
not
invest
in
the
underlying
Price
Funds
for
the
purpose
of
exercising
management
or
control;
however,
investments
by
the
fund
may
represent
a
significant
portion
of
an
underlying
Price
Fund’s
net
assets.
To
ensure
that
the
fund
does
not
incur
duplicate
management
fees
(paid
by
the
underlying
Price
Fund(s)
and
the
fund),
Price
Associates
has
agreed
to
permanently
waive
a
portion
of
its
management
fee
charged
to
the
fund
in
an
amount
sufficient
to
fully
offset
that
portion
of
management
fees
paid
by
each
underlying
Price
Fund
related
to
the
fund’s
investment
therein.
Annual
management
fee
rates
and
amounts
waived
related
to
investments
in
the
underlying
Price
Fund(s)
for
the year
ended December
31,
2024,
are
as
follows:
T.
ROWE
PRICE
Spectrum
Income
Fund
Total
management
fee
waived
was allocated
ratably
in
the
amounts
of
$139,000
and
$360,000,
for
the
Investor
Class
and
I
Class,
respectively,
for
the
year
ended
December
31,
2024.
At
December
31,
2024,
the
fund
held
approximately
89%
of
the
outstanding
shares
of
the
U.S.
High
Yield
ETF,
63%
of
GNMA
Fund,
62%
of
the
Emerging
Markets
Local
Currency
Bond
Fund,
49%
of
the
Corporate
Income
Fund,
30%
of
the
Dynamic
Credit
Fund,
and
less
than
25%
of
any
other
underlying
Price
Fund.
Additionally, the
fund is
one
of
several
mutual
funds
in
which
certain
college
savings
plans
managed
by
Price
Associates
may
invest.
Shareholder
servicing
costs
associated
with
each
college
savings
plan
are
allocated
to the
fund
in
proportion
to
the
average
daily
value
of
its
shares
owned
by
the
college
savings
plan.
Shareholder
servicing
costs
allocated
to
the
fund
are
borne
by
Price
Associates,
pursuant
to
the
fund’s
annual
all-inclusive
fee
agreement.
At
December
31,
2024,
approximately
67%
of
the
outstanding
shares
of
the
I
Class were
held
by
the
college
savings
plans.
NOTE
7
-
SEGMENT
REPORTING
Operating
segments
are
defined
as
components
of
a
company
that
engage
in
business
activities
and
for
which
discrete
financial
information
is
available
and
regularly
reviewed
by
the
chief
operating
decision
maker
(CODM)
in
deciding
how
to
allocate
resources
and
assess
performance.
The
Management
Committee
of
Price
Associates
acts
as
the
fund’s
CODM.
The
fund
makes
investments
in
accordance
with
its
investment
objective
as
outlined
in
the
Prospectus
and
is
considered
one
reportable
segment
because
the
CODM
allocates
resources
and
assesses
the
operating
results
of
the
fund
on
the
whole.
The
fund’s
revenue
is
derived
from
investments
in
portfolio
of
securities.
The
CODM
allocates
resources
and
assesses
performance
based
on
the
operating
results
of
the
fund,
which
is
consistent
with
the
results
presented
in
the
statement
of
operations,
statement
of
changes
in
net
assets
and
financial
($000s)
Effective
Management
Fee
Rate
Management
Fee
Waived
T.
Rowe
Price
U.S.
High
Yield
ETF
0.56%
$
499
Total
Management
Fee
Waived
$
499
T.
ROWE
PRICE
Spectrum
Income
Fund
highlights.
The
CODM
compares
the
fund’s
performance
to
its
benchmark
index
and
evaluates
the
positioning
of
the
fund
in
relation
to
its
investment
objective.
The
measure
of
segment
assets
is
net
assets
of
the
fund
which
is
disclosed
in
the
statement
of
assets
and
liabilities.
The
accounting
policies
of
the
segment
are
the
same
as
those
described
in
the
summary
of
significant
accounting
policies.
The
financial
statements
include
all
details
of
the
segment
assets,
segment
revenue
and
expenses;
and
reflect
the
financial
results
of
the
segment.
NOTE
8
-
OTHER
MATTERS
Unpredictable
environmental,
political,
social
and
economic
events,
including
but
not
limited
to,
environmental
or
natural
disasters,
war
and
conflict
(including
Russia’s
military
invasion
of
Ukraine
and
the
conflict
in
Israel,
Gaza
and
surrounding
areas),
terrorism,
geopolitical
developments
(including
trading
and
tariff
arrangements,
sanctions
and
cybersecurity
attacks),
and
public
health
epidemics
(including
the
global
outbreak
of
COVID-19)
and
similar
public
health
threats,
may
significantly
affect
the
economy
and
the
markets
and
issuers
in
which
a
fund
invests.
The
extent
and
duration
of
such
events
and
resulting
market
disruptions
cannot
be
predicted.
These
and
other
similar
events
may
cause
instability
across
global
markets,
including
reduced
liquidity
and
disruptions
in
trading
markets,
while
some
events
may
affect
certain
geographic
regions,
countries,
sectors,
and
industries
more
significantly
than
others,
and
exacerbate
other
pre-existing
political,
social,
and
economic
risks.
The
fund’s
performance
could
be
negatively
impacted
if
the
value
of
a
portfolio
holding
were
harmed
by
these
or
such
events.
Management
actively
monitors
the
risks
and
financial
impacts
arising
from
such
events.
NOTE
9
-
SUBSEQUENT
EVENT
At
a
meeting
held
on
February
6,
2025,
the
fund’s
board
approved
an
amendment
to
the
fund’s
investment
management
agreement.
Effective
March
1,
2025,
the
annual
all-inclusive
fee
will
be
reduced
by
0.01%,
which
will
lower
the
Investor
Class
fee
from
0.62%
to
0.61%
and
the
I
Class
fee
from
0.47%
to
0.46%
of
the
class’s
average
daily
net
assets.
T.
ROWE
PRICE
Spectrum
Income
Fund
REPORT
OF
INDEPENDENT
REGISTERED
PUBLIC
ACCOUNTING
FIRM
To
the
Board
of
Directors
of
T.
Rowe
Price
Spectrum
Fund,
Inc.
and
Shareholders
of
T.
Rowe
Price
Spectrum
Income
Fund
Opinion
on
the
Financial
Statements
We
have
audited
the
accompanying
statement
of
assets
and
liabilities,
including
the
portfolio
of
investments,
of
T.
Rowe
Price
Spectrum
Income
Fund
(one
of
the
funds
constituting
T.
Rowe
Price
Spectrum
Fund,
Inc.,
referred
to
hereafter
as
the
"Fund")
as
of
December
31,
2024,
the
related
statement
of
operations
for
the
year
ended
December
31,
2024,
the
statement
of
changes
in
net
assets
for
each
of
the
two
years
in
the
period
ended
December
31,
2024,
including
the
related
notes,
and
the
financial
highlights
for
each
of
the
periods
indicated
therein
(collectively
referred
to
as
the
“financial
statements”).
In
our
opinion,
the
financial
statements
present
fairly,
in
all
material
respects,
the
financial
position
of
the
Fund
as
of
December
31,
2024,
the
results
of
its
operations
for
the
year
then
ended,
the
changes
in
its
net
assets
for
each
of
the
two
years
in
the
period
ended
December
31,
2024
and
the
financial
highlights
for
each
of
the
periods
indicated
therein,
in
conformity
with
accounting
principles
generally
accepted
in
the
United
States
of
America.
Basis
for
Opinion
These
financial
statements
are
the
responsibility
of
the
Fund’s
management.
Our
responsibility
is
to
express
an
opinion
on
the
Fund’s
financial
statements
based
on
our
audits.
We
are
a
public
accounting
firm
registered
with
the
Public
Company
Accounting
Oversight
Board
(United
States)
(PCAOB)
and
are
required
to
be
independent
with
respect
to
the
Fund
in
accordance
with
the
U.S.
federal
securities
laws
and
the
applicable
rules
and
regulations
of
the
Securities
and
Exchange
Commission
and
the
PCAOB.
We
conducted
our
audits
of
these
financial
statements
in
accordance
with
the
standards
of
the
PCAOB.
Those
standards
require
that
we
plan
and
perform
the
audit
to
obtain
reasonable
assurance
about
whether
the
financial
statements
are
free
of
material
misstatement,
whether
due
to
error
or
fraud.
T.
ROWE
PRICE
Spectrum
Income
Fund
Our
audits
included
performing
procedures
to
assess
the
risks
of
material
misstatement
of
the
financial
statements,
whether
due
to
error
or
fraud,
and
performing
procedures
that
respond
to
those
risks.
Such
procedures
included
examining,
on
a
test
basis,
evidence
regarding
the
amounts
and
disclosures
in
the
financial
statements.
Our
audits
also
included
evaluating
the
accounting
principles
used
and
significant
estimates
made
by
management,
as
well
as
evaluating
the
overall
presentation
of
the
financial
statements.
Our
procedures
included
confirmation
of
securities
owned
as
of
December
31,
2024
by
correspondence
with
the
transfer
agent
and
brokers;
when
replies
were
not
received
from
brokers,
we
performed
other
auditing
procedures.
We
believe
that
our
audits
provide
a
reasonable
basis
for
our
opinion.
/s/
PricewaterhouseCoopers
LLP
Baltimore,
Maryland
February
18,
2025
We
have
served
as
the
auditor
of
one
or
more
investment
companies
in
the
T.
Rowe
Price
group
of
investment
companies
since
1973.
REPORT
OF
INDEPENDENT
REGISTERED
PUBLIC
ACCOUNTING
FIRM
(continued)
T.
ROWE
PRICE
Spectrum
Income
Fund
TAX
INFORMATION
(UNAUDITED)
FOR
THE
TAX
YEAR
ENDED 12/31/24
We
are
providing
this
information
as
required
by
the
Internal
Revenue
Code.
The
amounts
shown
may
differ
from
those
elsewhere
in
this
report
because
of
differences
between
tax
and
financial
reporting
requirements.
The
fund’s
distributions
to
shareholders
included
$26,329,000
from
long-term
capital
gains,
subject
to
a
long-term
capital
gains
tax
rate
of
not
greater
than
20%.
For
taxable
non-corporate
shareholders,
$11,646,000
of
the
fund's
income
represents
qualified
dividend
income
subject
to
a
long-term
capital
gains
tax
rate
of
not
greater
than
20%.
For
corporate
shareholders,
$11,378,000
of
the
fund's
income
qualifies
for
the
dividends-received
deduction.
100
East
Pratt
Street
Baltimore,
MD
21202
T.
Rowe
Price
Investment
Services,
Inc.
Call
1-800-225-5132
to
request
a
prospectus
or
summary
prospectus;
each
includes
investment
objectives,
risks,
fees,
expenses,
and
other
information
that
you
should
read
and
consider
carefully
before
investing.
F88-050
2/25
Item 8. Changes in and Disagreements with Accountants for Open-End Management Investment Companies.
Not applicable.
Item 9. Proxy Disclosures for Open-End Management Investment Companies.
Not applicable.
Item 10. Remuneration Paid to Directors, Officers, and Others of Open-End Management Investment Companies.
Remuneration paid to Directors is included in Item 7 of this Form N-CSR.
Item 11. Statement Regarding Basis for Approval of Investment Advisory Contract.
If applicable, see Item 7.
Item 12. Disclosure of Proxy Voting Policies and Procedures for Closed-End Management Investment Companies.
Not applicable.
Item 13. Portfolio Managers of Closed-End Management Investment Companies.
Not applicable.
Item 14. Purchases of Equity Securities by Closed-End Management Investment Company and Affiliated Purchasers.
Not applicable.
Item 15. Submission of Matters to a Vote of Security Holders.
There has been no change to the procedures by which shareholders may recommend nominees to the registrant’s board of directors.
Item 16. Controls and Procedures.
(a) The registrant’s principal executive officer and principal financial officer have evaluated the registrant’s disclosure controls and procedures within 90 days of this filing and have concluded that the registrant’s disclosure controls and procedures were effective, as of that date, in ensuring that information required to be disclosed by the registrant in this Form N-CSR was recorded, processed, summarized, and reported timely.
(b) The registrant’s principal executive officer and principal financial officer are aware of no change in the registrant’s internal control over financial reporting that occurred during the period covered by this report that has materially affected, or is reasonably likely to materially affect, the registrant’s internal control over financial reporting.
Item 17. Disclosure of Securities Lending Activities for Closed-End Management Investment Companies.
Not applicable.
Item 18. Recovery of Erroneously Awarded Compensation.
Not applicable.
Item 19. Exhibits.
SIGNATURES
Pursuant to the requirements of the Securities Exchange Act of 1934 and the Investment Company Act of 1940, the registrant has duly caused this report to be signed on its behalf by the undersigned, thereunto duly authorized.
| | | | |
| T. Rowe Price Spectrum Fund, Inc. |
| By | | /s/ David Oestreicher | | |
| | David Oestreicher | | |
| | Principal Executive Officer | | |
| | |
| Date | | February 18, 2025 | | |
Pursuant to the requirements of the Securities Exchange Act of 1934 and the Investment Company Act of 1940, this report has been signed below by the following persons on behalf of the registrant and in the capacities and on the dates indicated.
| | | | |
| By | | /s/ David Oestreicher | | |
| | David Oestreicher | | |
| | Principal Executive Officer | | |
| | |
| Date | | February 18, 2025 | | |
| | | | |
| By | | /s/ Alan S. Dupski | | |
| | Alan S. Dupski | | |
| | Principal Financial Officer | | |
| | |
| Date | | February 18, 2025 | | |