UNITED STATES
SECURITIES AND EXCHANGE COMMISSION
Washington, D.C. 20549
FORM N-CSR
CERTIFIED SHAREHOLDER REPORT OF REGISTERED
MANAGEMENT INVESTMENT COMPANIES
Investment Company Act File Number: 811-04998
| T. Rowe Price Spectrum Fund, Inc. |
|
| (Exact name of registrant as specified in charter) |
| |
| 100 East Pratt Street, Baltimore, MD 21202 |
|
| (Address of principal executive offices) |
| |
| David Oestreicher |
| 100 East Pratt Street, Baltimore, MD 21202 |
|
| (Name and address of agent for service) |
Registrant’s telephone number, including area code: (410) 345-2000
Date of fiscal year end: December 31
Date of reporting period: June 30, 2012
Item 1. Report to Shareholders
| Spectrum Fund | June 30, 2012 |
The views and opinions in this report were current as of June 30, 2012. They are not guarantees of performance or investment results and should not be taken as investment advice. Investment decisions reflect a variety of factors, and the managers reserve the right to change their views about individual stocks, sectors, and the markets at any time. As a result, the views expressed should not be relied upon as a forecast of the fund’s future investment intent. The report is certified under the Sarbanes-Oxley Act, which requires mutual funds and other public companies to affirm that, to the best of their knowledge, the information in their financial reports is fairly and accurately stated in all material respects.
REPORTS ON THE WEB
Sign up for our E-mail Program, and you can begin to receive updated fund reports and prospectuses online rather than through the mail. Log in to your account at troweprice.com for more information.
Manager’s Letter
Fellow Shareholders
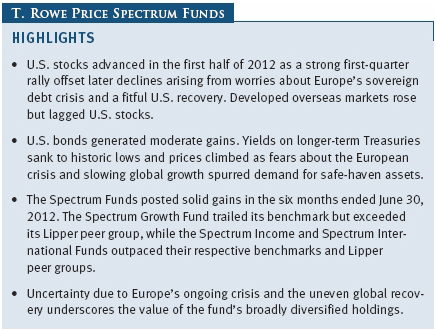
U.S. stocks gained in the first half of 2012, driven entirely by a strong first-quarter rally as the U.S. economy strengthened and European leaders took steps to contain the region’s debt crisis. Stocks pared some of their gains in the second quarter, however, as the eurozone crisis entered a new phase centered on Spain and global economic data weakened. U.S. bonds advanced, supported by long-term U.S. Treasuries, as Europe’s turmoil and uncertainty about the global outlook spurred demand for more conservative assets. Outside the U.S., stock markets in developed markets rose modestly due to strength in Asia and most of Europe but fell sharply in some troubled peripheral eurozone countries.
MARKET ENVIRONMENT
U.S. stocks rallied sharply in the first quarter as the economy showed signs of improvement and European leaders made progress in containing the region’s debt crisis. However, the tenor of economic news turned more negative in the spring. After growing strongly in the first quarter, monthly jobs growth from April to June weakened and the unemployment rate remained stuck at 8.2%, reinforcing other indicators suggesting that the U.S. recovery was losing steam. Investors also grew anxious about a slowdown in China, where data increasingly showed that the world’s second-largest economy was cooling after decades of rapid growth. The S&P 500 rose to its highest level in almost four years on April 2, 2012, but erased much of its year-to-date gains by June 1 before clawing its way higher by month-end amid heightened anxiety about the global outlook.
Europe’s fiscal problems continued to dominate investor sentiment. The worsening debt crisis upended the political landscape in several countries and reignited worries about a disorderly Greek default and the survival of the currency zone. By the end of our reporting period, Spain sought a bailout for its troubled banks, Greece voted for a party committed to staying in the euro and forming a coalition government, and European leaders agreed on new measures to contain the crisis. The latest summit produced some positive steps toward closer economic integration but once again left many details unaddressed and failed to resolve fundamental problems facing the eurozone. Most European markets produced decent returns, but stock markets in Greece, Italy, Spain, and Portugal fell as they struggled with recession and austerity measures. Developed Asian markets rose. Emerging markets stocks outpaced their developed market peers, though economic growth in China, Brazil, and India slowed markedly during the period.
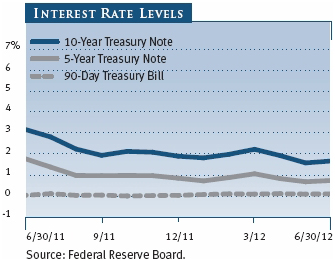
U.S. bonds generated moderate gains in the year’s first half. In the investment-grade universe, corporate bonds did very well and longer-term Treasuries posted solid gains as global uncertainty spurred investors to seek refuge in U.S. government debt. In June, the Federal Reserve said it would extend until year-end a stimulus program aimed at suppressing long-term interest rates by selling short-term securities and using the proceeds to buy longer-term securities. The extension of the program, known as “Operation Twist,” helped sustain demand for longer-dated Treasuries. High yield outpaced investment-grade bonds as yield-hungry investors sought greater returns in a low interest rate environment. Outside the U.S., sovereign bonds in developed Europe posted mild gains in dollar terms as the dollar strengthened against the euro and other major currencies. Bonds in emerging markets fared considerably better than sovereign bonds in developed markets—a testament to their generally lower debt levels and stronger growth outlook relative to developed markets.
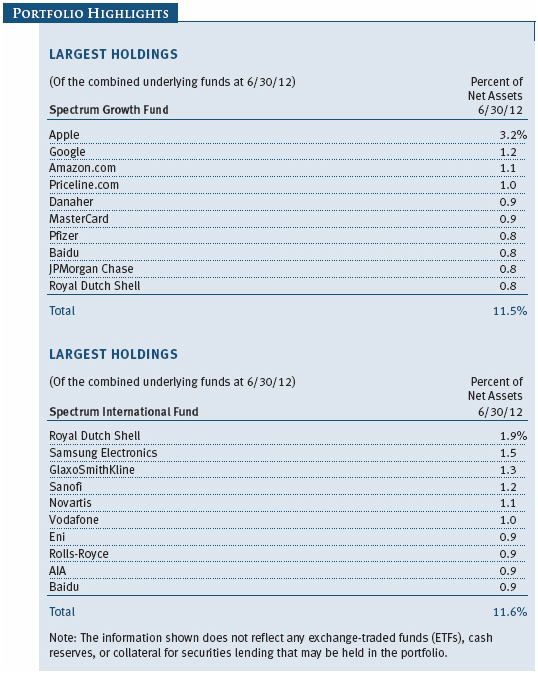
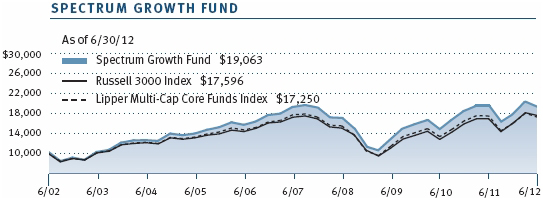
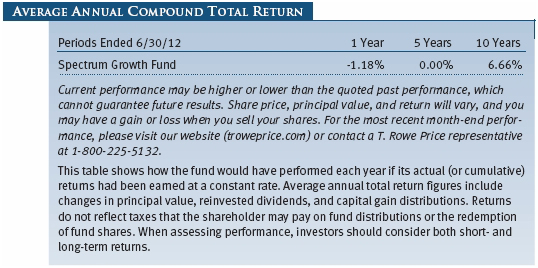
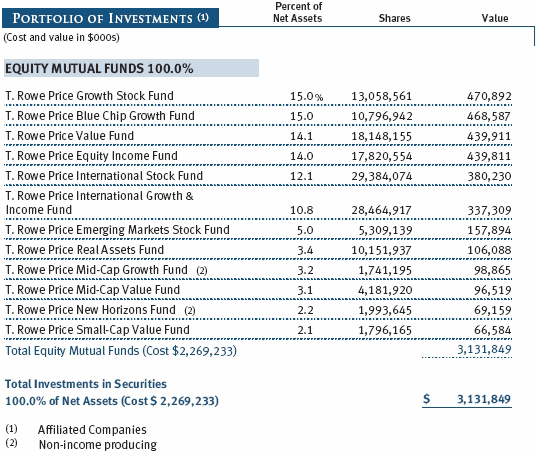
SPECTRUM GROWTH FUND
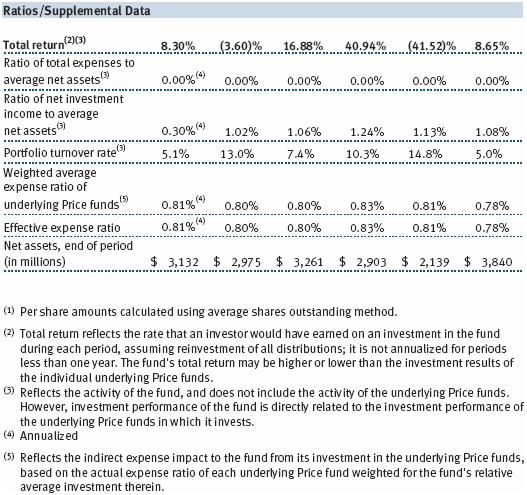
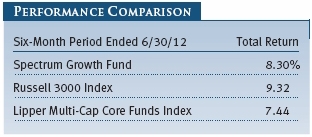
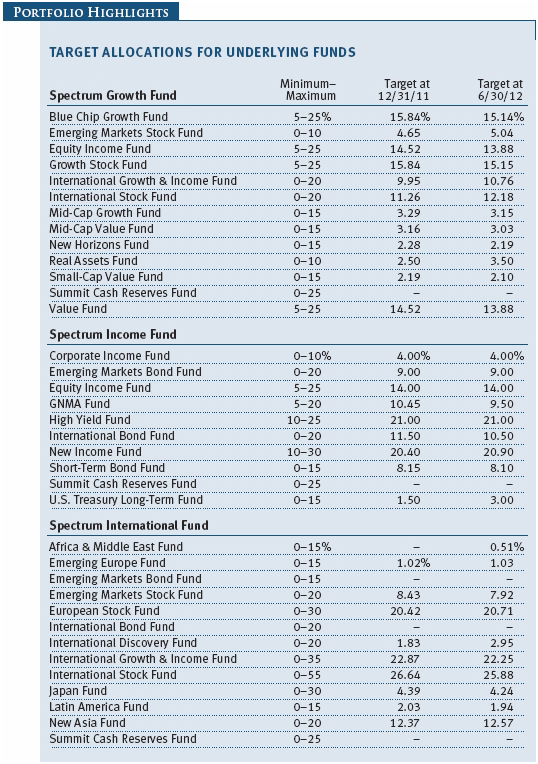
The Spectrum Growth Fund returned 8.30% for the six months ended June 30, 2012, trailing the Russell 3000 Index but outpacing the Lipper Multi-Cap Core Funds Index. All of the underlying funds posted positive absolute returns. Within the U.S. holdings, the Growth Stock and Blue Chip Growth Funds posted strong absolute and relative performance, but the Value Fund weighed on relative returns. Additionally, the fund’s out-of-benchmark allocation to non-U.S. stocks hurt performance against the Russell 3000 Index, which represents the broad U.S. equity market. The fund’s underlying non-U.S. funds—the International Stock, International Growth & Income, and Emerging Markets Stock Funds—posted modest returns but lagged the performance of the domestic equity funds. Finally, the Real Assets Fund weighed on relative returns. This fund, which invests mostly in assets with physical properties such as energy, commodities, and infrastructure, was hampered by a steep drop in energy prices, particularly for oil and natural gas.
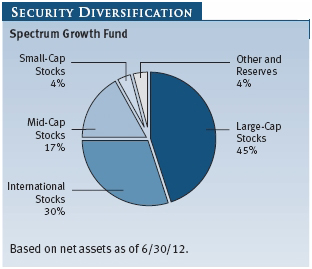
The Spectrum Growth Fund invests in a range of underlying funds that focus on domestic stocks across the capitalization scale, international stocks in developed and emerging markets, and growth and value stocks. Our current strategy is neutral between U.S. and non-U.S. stocks. U.S. corporate earnings are healthy and stock prices are attractive compared with their historical levels, though we expect earnings growth will moderate given recent signs of weakness in the economy. Equity valuations outside the U.S. are less expensive and, we believe, are pricing in dimmer growth prospects in Europe and other developed markets.
Since 2011, we have been gradually increasing the fund’s international equity exposure from 20% to approximately 30% of its traditional equity allocation while proportionately reducing U.S. equities. International developed and emerging markets stocks have risen as a percentage of the global equity market and now represent over half of the world market capitalization. These areas often include countries that enjoy faster economic growth rates than the U.S. and offer attractive investment opportunities that complement the fund’s U.S. holdings. We anticipate completing this transition in the coming months.
Within non-U.S. equities, we continue to favor emerging markets, which we believe have greater long-term growth opportunities compared with developed markets. Emerging markets generally carry far less debt than developed markets and have implemented conservative fiscal policies that make them better equipped to withstand a global crisis than in past years. Although weaker global demand may challenge export-driven markets like China and Brazil, inflation has generally subsided, which should allow room for looser monetary policy. For valuation reasons, we are underweight small-cap stocks in favor of large-caps and prefer growth stocks over value.
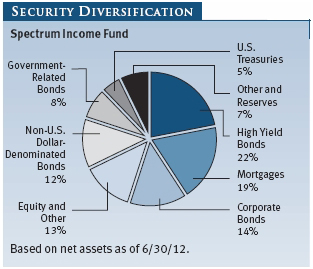
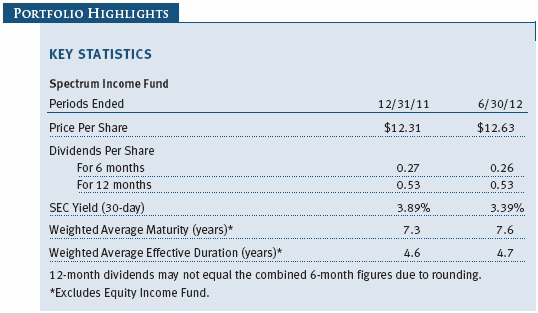
SPECTRUM INCOME FUND
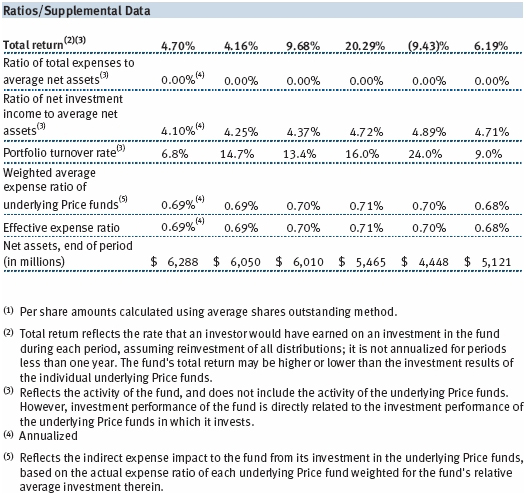
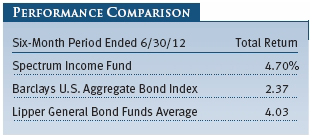
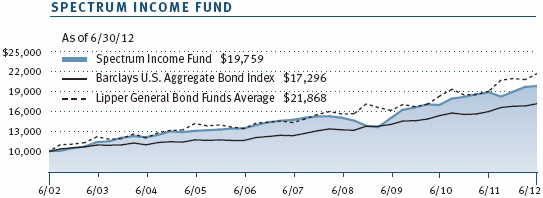
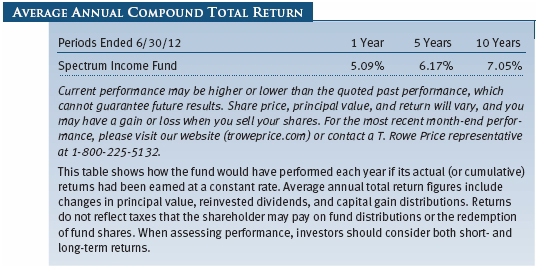
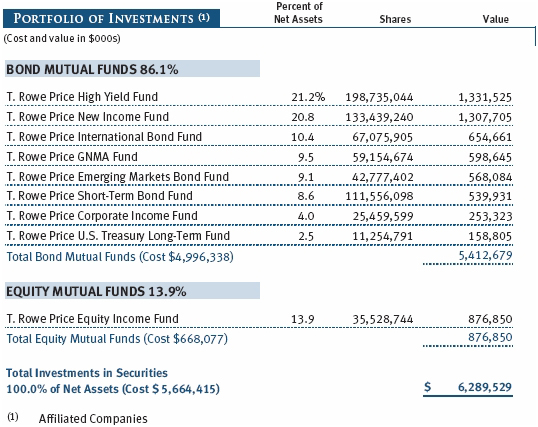
The Spectrum Income Fund returned 4.70% for the six months ended June 30, 2012, easily outpacing both the Barclays U.S. Aggregate Bond Index and the Lipper General Bond Funds Average. The fund’s out-of-benchmark holdings drove absolute and relative performance over the period. Specifically, holdings in the Equity Income, High Yield, and Emerging Markets Bond Funds—which invest in dividend-paying stocks, high yield bonds, and emerging markets debt, respectively—drove outperformance against the Barclays index, which represents the broad U.S. investment-grade bond market. However, an allocation to non-U.S. debt through the International Bond Fund weighed on relative results.
Allocations to diversifying sectors such as dividend-paying stocks, high yield bonds, and non-U.S. debt are key features of the Spectrum Income Fund’s design and have contributed to outperformance against the Barclays index over the past 10 years, as seen in the Growth of $10,000 chart on page 13. We continue to favor high yield over investment-grade bonds. Many high yield bond issuers have taken advantage of low interest rates to refinance debt, extend maturities, and shore up their balance sheets. Yield spreads relative to other sectors remain at attractive levels in the current low-yield environment, particularly given our outlook for a slowly improving economy. We also favor emerging markets over U.S. investment-grade bonds. Emerging markets generally have stronger fiscal profiles than most developed countries that are now struggling with high debt and low growth and have better long-term growth prospects than their developed peers.
SPECTRUM INTERNATIONAL FUND
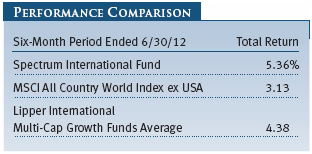
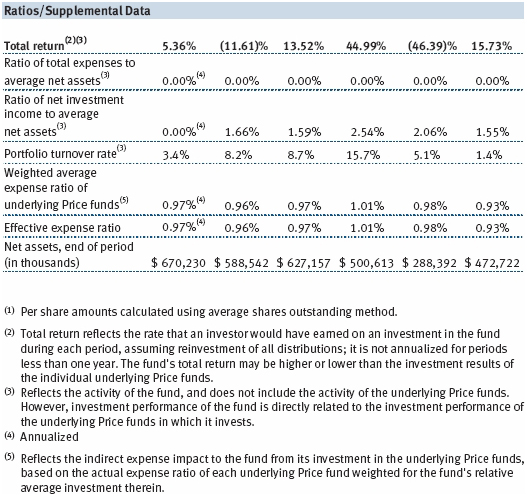
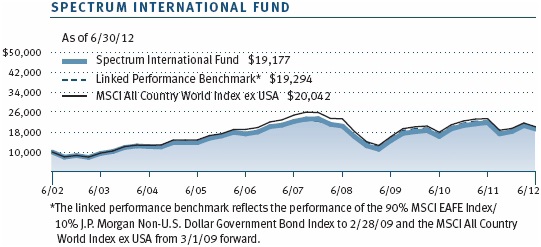
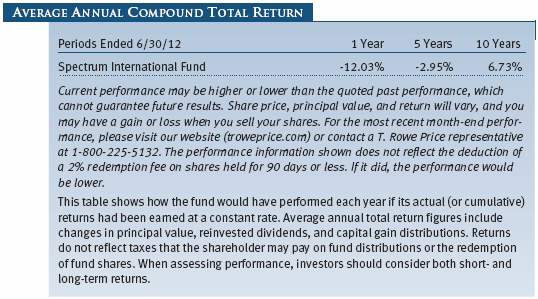
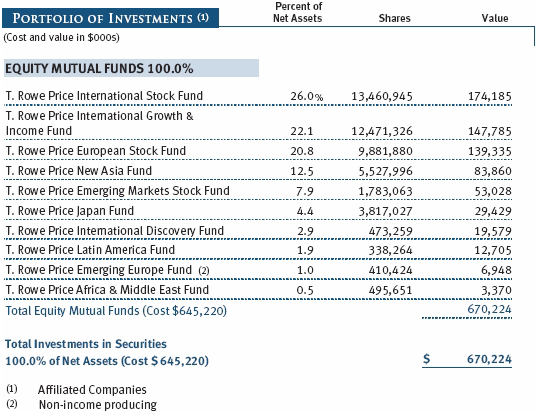
The Spectrum International Fund returned 5.36% for the six months ended June 30, 2012, widely exceeding its benchmark, the MSCI All Country World Index ex USA, as well as the Lipper International Multi-Cap Growth Funds Average. The International Stock, European Stock, and New Asia Funds were the top contributors to absolute returns. Within the underlying funds, stock selection in developed Europe—particularly the UK and Germany—aided absolute performance. Conversely, holdings in Brazil weighed on returns. Brazil’s market slumped over the past six months as its export-driven economy grappled with the impact of weaker commodities demand from China, a fragile U.S. recovery, and recession in Europe.
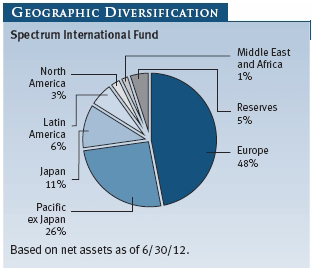
Europe remains the fund’s biggest regional exposure, followed by the Pacific ex Japan. As we stated earlier, we believe emerging markets stocks have stronger long-term growth potential over developed markets. While recent headlines have highlighted economic slowdowns in China, India, and Brazil, emerging markets are unfettered by the formidable debt and fiscal challenges facing the U.S. and Europe and have greater flexibility to respond to financial challenges that may arise. A rapidly growing middle class, rising consumption, and increasing upward mobility are hallmarks of emerging markets, and we believe these trends will continue to drive strong long-term growth.
OUTLOOK
Our global growth expectations are modest for the next several quarters. We expect the U.S. economy to continue along a course of low growth in an environment of abundant policy uncertainties and weakness abroad. Continued job and income growth remain critical for a self-sustained recovery, although employment data have recently softened and suggest cautious hiring ahead. Global financial markets remain volatile over the uncertainty associated with the European debt crisis; Greece’s potential exit from the euro; and leaders’ incremental approach to policymaking in the region, which allows contagion risk to linger. We believe that risk aversion will remain high and markets will stay volatile until the eurozone crisis approaches a resolution.
Notwithstanding these risks, U.S. corporate earnings growth and balance sheets appear strong, and stocks, particularly large-caps, are reasonably valued. We believe that the prevailing geopolitical uncertainty underscores the value of the Spectrum Funds’ diversified holdings and investment approach.
Thank you for investing with T. Rowe Price.
Respectfully submitted,

Charles M. Shriver
Portfolio manager, Spectrum Growth, Spectrum Income, and Spectrum International Funds
July 20, 2012
GLOSSARY
Barclays U.S. Aggregate Bond Index: An unmanaged index that tracks investment-grade corporate and government bonds.
J.P. Morgan Non-U.S. Dollar Government Bond Index: An unmanaged index that tracks the performance of major non-U.S. bond markets.
Lipper indexes: Fund benchmarks that consist of a small number of the largest mutual funds in a particular category as tracked by Lipper Inc.
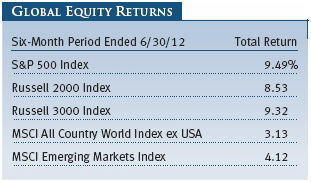
MSCI All Country World Index ex USA: An index that measures equity market performance of developed and emerging countries, excluding the U.S.
MSCI EAFE Index: An unmanaged index that tracks the stocks of about 1,000 companies in Europe, Australasia, and the Far East (EAFE).
MSCI Emerging Markets Index: An unmanaged index that tracks stocks in 26 emerging markets countries.
Russell 2000 Index: An unmanaged index that tracks the stocks of 2,000 small U.S. companies.
Russell 3000 Index: An index that tracks the performance of the 3,000 largest U.S. companies, representing approximately 98% of the investable U.S. equity market.
S&P 500 Index: An unmanaged index that tracks the stocks of 500 primarily large-cap U.S. companies.
Weighted average effective duration (years): A measure of a security’s price sensitivity to changes in interest rates. Securities with longer durations are more sensitive to changes in interest rates than securities of shorter durations.
Weighted average maturity: A measure of a fund’s interest rate sensitivity. In general, the longer the average maturity, the greater the fund’s sensitivity to interest rate changes. The weighted average maturity may take into account interest rate readjustment dates for certain securities. Money funds must maintain a weighted average maturity of less than 60 days.
Performance and Expenses
This chart shows the value of a hypothetical $10,000 investment in the fund over the past 10 fiscal year periods or since inception (for funds lacking 10-year records). The result is compared with benchmarks, which may include a broad-based market index and a peer group average or index. Market indexes do not include expenses, which are deducted from fund returns as well as mutual fund averages and indexes.
This chart shows the value of a hypothetical $10,000 investment in the fund over the past 10 fiscal year periods or since inception (for funds lacking 10-year records). The result is compared with benchmarks, which may include a broad-based market index and a peer group average or index. Market indexes do not include expenses, which are deducted from fund returns as well as mutual fund averages and indexes.
This chart shows the value of a hypothetical $10,000 investment in the fund over the past 10 fiscal year periods or since inception (for funds lacking 10-year records). The result is compared with benchmarks, which may include a broad-based market index and a peer group average or index. Market indexes do not include expenses, which are deducted from fund returns as well as mutual fund averages and indexes.
As a mutual fund shareholder, you may incur two types of costs: (1) transaction costs, such as redemption fees or sales loads, and (2) ongoing costs, including management fees, distribution and service (12b-1) fees, and other fund expenses. The following example is intended to help you understand your ongoing costs (in dollars) of investing in the fund and to compare these costs with the ongoing costs of investing in other mutual funds. The example is based on an investment of $1,000 invested at the beginning of the most recent six-month period and held for the entire period.
Actual Expenses
The first line of the following table (Actual) provides information about actual account values and expenses based on the fund’s actual returns. You may use the information on this line, together with your account balance, to estimate the expenses that you paid over the period. Simply divide your account value by $1,000 (for example, an $8,600 account value divided by $1,000 = 8.6), then multiply the result by the number on the first line under the heading “Expenses Paid During Period” to estimate the expenses you paid on your account during this period.
Hypothetical Example for Comparison Purposes
The information on the second line of the table (Hypothetical) is based on hypothetical account values and expenses derived from the fund’s actual expense ratio and an assumed 5% per year rate of return before expenses (not the fund’s actual return). You may compare the ongoing costs of investing in the fund with other funds by contrasting this 5% hypothetical example and the 5% hypothetical examples that appear in the shareholder reports of the other funds. The hypothetical account values and expenses may not be used to estimate the actual ending account balance or expenses you paid for the period.
Note: T. Rowe Price charges an annual account service fee of $20, generally for accounts with less than $10,000. The fee is waived for any investor whose T. Rowe Price mutual fund accounts total $50,000 or more; accounts electing to receive electronic delivery of account statements, transaction confirmations, prospectuses, and shareholder reports; or accounts of an investor who is a T. Rowe Price Preferred Services, Personal Services, or Enhanced Personal Services client (enrollment in these programs generally requires T. Rowe Price assets of at least $100,000). This fee is not included in the accompanying table. If you are subject to the fee, keep it in mind when you are estimating the ongoing expenses of investing in the fund and when comparing the expenses of this fund with other funds.
You should also be aware that the expenses shown in the table highlight only your ongoing costs and do not reflect any transaction costs, such as redemption fees or sales loads. Therefore, the second line of the table is useful in comparing ongoing costs only and will not help you determine the relative total costs of owning different funds. To the extent a fund charges transaction costs, however, the total cost of owning that fund is higher.

| T. Rowe Price Spectrum Growth Fund |
Unaudited |
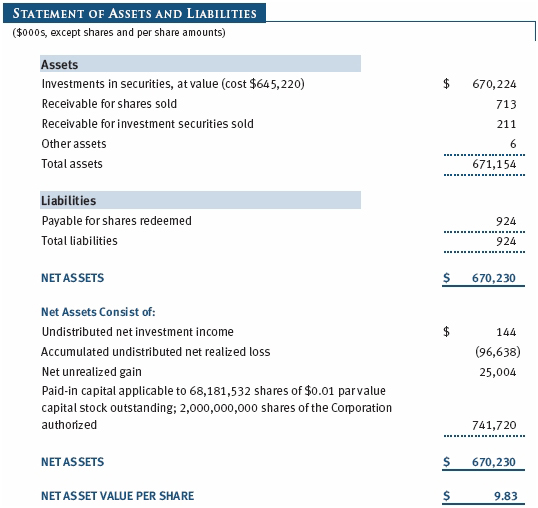
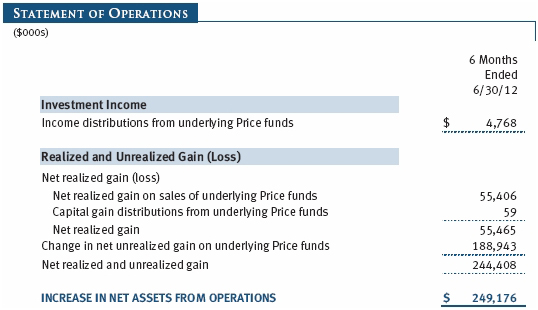
The accompanying notes are an integral part of these financial statements.
| T. Rowe Price Spectrum Income Fund |
Unaudited |
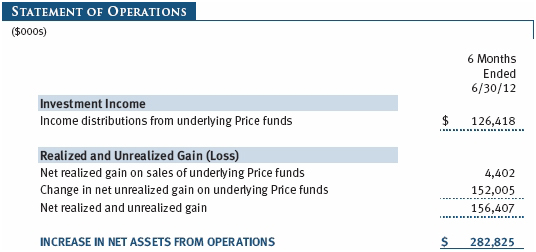
The accompanying notes are an integral part of these financial statements.
| T. Rowe Price Spectrum International Fund |
Unaudited |
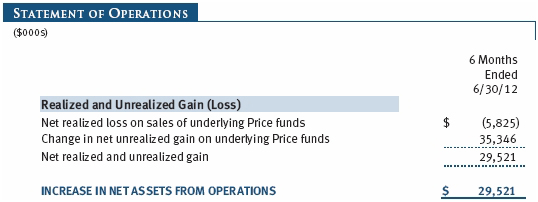
The accompanying notes are an integral part of these financial statements.
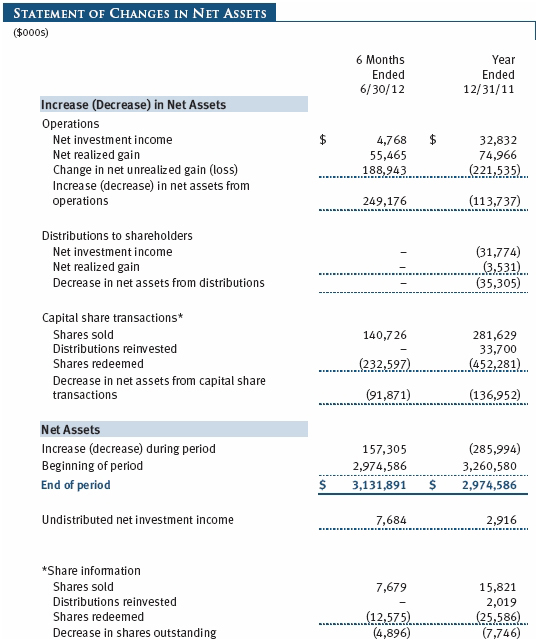
| T. Rowe Price Spectrum Growth Fund |
Unaudited |
The accompanying notes are an integral part of these financial statements.
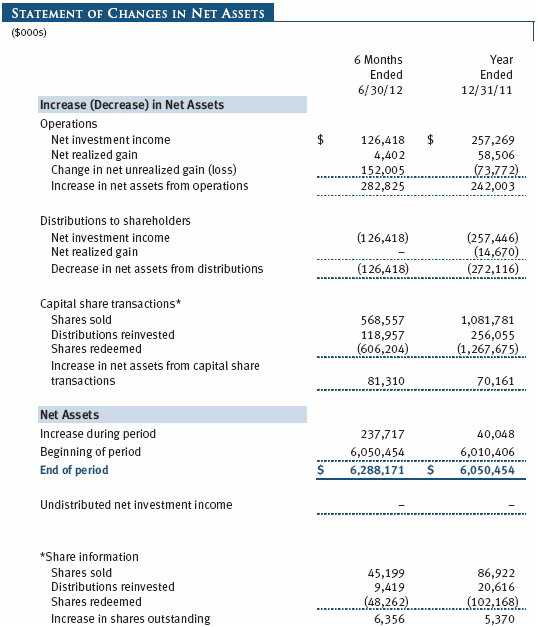
| T. Rowe Price Spectrum Income Fund |
Unaudited |
The accompanying notes are an integral part of these financial statements.
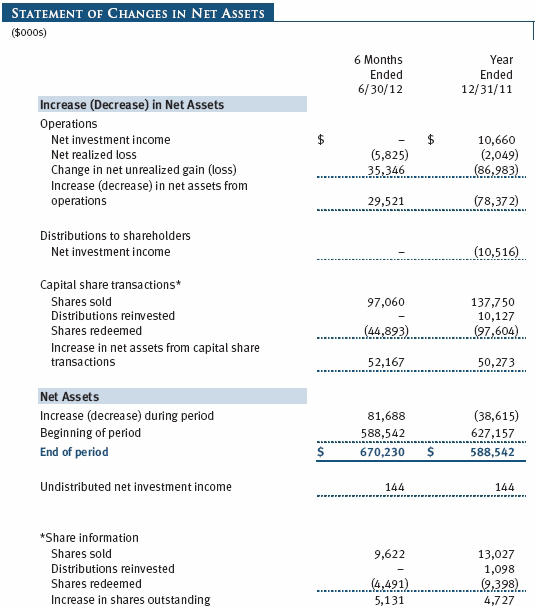
| T. Rowe Price Spectrum International Fund |
Unaudited |
The accompanying notes are an integral part of these financial statements.
| T. Rowe Price Spectrum Growth Fund |
Unaudited |
The accompanying notes are an integral part of these financial statements.
| T. Rowe Price Spectrum Income Fund |
Unaudited |
The accompanying notes are an integral part of these financial statements.
| T. Rowe Price Spectrum International Fund |
Unaudited |
The accompanying notes are an integral part of these financial statements.
| T. Rowe Price Spectrum Funds |
Unaudited |
| Notes to Financial Statements |
T. Rowe Price Spectrum Fund, Inc. (the corporation), is registered under the Investment Company Act of 1940 (the 1940 Act) as a nondiversified, open-end management investment company. Spectrum Growth Fund, Spectrum Income Fund, and Spectrum International Fund (collectively, the Spectrum Funds) are three portfolios established by the corporation. Spectrum Growth and Spectrum Income commenced operations on June 29, 1990, and Spectrum International commenced operations on December 31, 1996.
Each Spectrum Fund diversifies its assets within set limits among specific underlying T. Rowe Price funds (underlying Price funds). Spectrum Growth seeks long-term capital appreciation and growth of income with current income a secondary objective. Spectrum Income seeks a high level of current income with moderate share price fluctuation. Spectrum International seeks long-term capital appreciation.
NOTE 1 - SIGNIFICANT ACCOUNTING POLICIES
Basis of Preparation The accompanying financial statements were prepared in accordance with accounting principles generally accepted in the United States of America (GAAP), which require the use of estimates made by management. Management believes that estimates and valuations of the underlying Price funds are appropriate; however, actual results may differ from those estimates, and the valuations reflected in the accompanying financial statements may differ from the value ultimately received upon sale of the underlying Price funds.
Investment Transactions, Investment Income, and Distributions Income is recorded on the accrual basis. Income and capital gain distributions from the underlying Price funds are recorded on the ex-dividend date. Purchases and sales of the underlying Price funds are accounted for on the trade date. Gains and losses realized on sales of the underlying Price funds are reported on the identified cost basis. Income tax-related interest and penalties, if incurred, would be recorded as income tax expense. Distributions to shareholders are recorded on the ex-dividend date. Income distributions are declared by Spectrum Income daily and paid monthly. Income distributions are declared and paid by Spectrum Growth and Spectrum International annually. Capital gain distributions, if any, generally are declared and paid by each fund annually.
Redemption Fees A 2% fee is assessed on redemptions of Spectrum International shares held for 90 days or less to deter short-term trading and to protect the interests of long-term shareholders. Redemption fees are withheld from proceeds that shareholders receive from the sale or exchange of fund shares and are paid to the fund. Redemption fees received by Spectrum International are allocated to each underlying Price fund in proportion to the average daily value of its shares owned by the fund. Accordingly, redemption fees have no effect on the net assets of Spectrum International.
NOTE 2 - VALUATION
Each fund’s financial instruments are reported at fair value as defined by GAAP. Each fund values its financial instruments and computes its net asset value per share at the close of the New York Stock Exchange (NYSE), normally 4 p.m. ET, each day that the NYSE is open for business. Investments in the underlying Price funds are valued at their closing net asset value per share on the day of valuation. Financial instruments for which these valuation procedures are inappropriate or are deemed not to reflect fair value are stated at fair value as determined in good faith by the T. Rowe Price Valuation Committee, established by the funds’ Board of Directors.
Various inputs are used to determine the value of financial instruments. These inputs are summarized in the three broad levels listed below:
Level 1 – quoted prices in active markets for identical financial instruments
Level 2 – observable inputs other than Level 1 quoted prices (including, but not limited to, quoted prices for similar financial instruments, interest rates, prepayment speeds, and credit risk)
Level 3 – unobservable inputs
Observable inputs are those based on market data obtained from sources independent of the Spectrum Funds, and unobservable inputs reflect the Spectrum Funds’ own assumptions based on the best information available. The input levels are not necessarily an indication of the risk or liquidity associated with financial instruments at that level. On June 30, 2012, all investments in the underlying Price funds were classified as Level 1, based on the inputs used to determine their values.
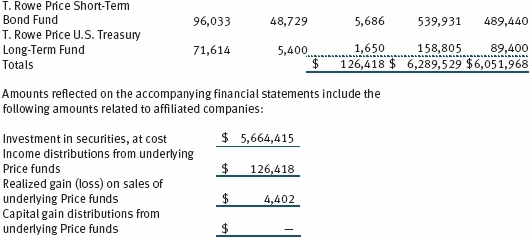
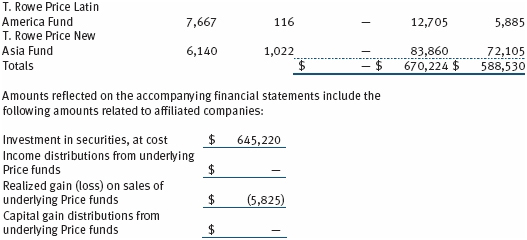
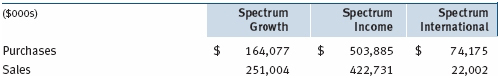
NOTE 3 - INVESTMENTS IN UNDERLYING PRICE FUNDS
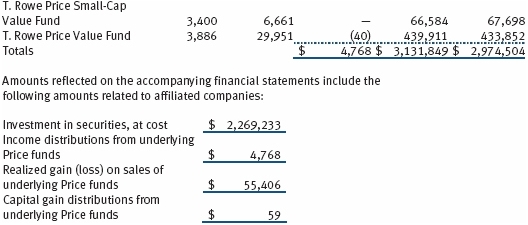
Purchases and sales of the underlying Price funds during the six months ended June 30, 2012, were as follows:
NOTE 4 - FEDERAL INCOME TAXES
No provision for federal income taxes is required since each fund intends to continue to qualify as a regulated investment company under Subchapter M of the Internal Revenue Code and distribute to shareholders all of its taxable income and gains. Distributions determined in accordance with federal income tax regulations may differ in amount or character from net investment income and realized gains for financial reporting purposes. Financial reporting records are adjusted for permanent book/tax differences to reflect tax character but are not adjusted for temporary differences. The amount and character of tax-basis distributions and composition of net assets are finalized at fiscal year-end; accordingly, tax-basis balances have not been determined as of the date of this report.
Each fund intends to retain realized gains to the extent of available capital loss carryforwards. As a result of the Regulated Investment Company Modernization Act of 2010, net capital losses realized on or after January 1, 2011 (effective date) may be carried forward indefinitely to offset future realized capital gains; however, post-effective losses must be used before pre-effective capital loss carryforwards with expiration dates. Accordingly, it is possible that all or a portion of the Spectrum Growth Fund’s and/or the Spectrum Income Fund’s and/or the Spectrum International Fund’s pre-effective capital loss carryforwards could expire unused. As of December 31, 2011, the Spectrum Growth Fund had $31,454,000 of available capital loss carryforwards, which all expire in 2017. The Spectrum Income Fund had $1,506,000 of available capital loss carryforwards as of December 31, 2011, which all expire in 2017. Additionally, as of December 31, 2011, the Spectrum International Fund had $40,467,000 of available capital loss carryforwards, which expire as follows: $33,275,000 in 2017 and $7,192,000 in 2018.
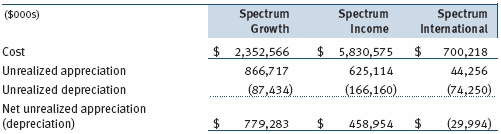
At June 30, 2012, the cost of investments for federal income tax purposes and net unrealized gain (loss) on investments was as follows:
NOTE 5 - RELATED PARTY TRANSACTIONS
The Spectrum Funds are managed by T. Rowe Price Associates, Inc. (Price Associates), a wholly owned subsidiary of T. Rowe Price Group, Inc. (Price Group). Price Associates, directly or through sub-advisory agreements with its wholly owned subsidiaries, also provides investment management services to all the underlying Price funds. Pursuant to various service agreements, Price Associates and its wholly owned subsidiaries provide shareholder servicing and administrative, transfer and dividend disbursing, accounting, marketing, and certain other services to the Spectrum Funds. Certain officers and directors of the Spectrum Funds are also officers and directors of Price Associates and its subsidiaries and of the underlying Price funds.
The Spectrum Funds pay no management fees; however, Price Associates receives management fees from the underlying Price funds. The Spectrum Funds operate in accordance with the investment management and special servicing agreements between and among the corporation, the underlying Price funds and Price Associates. Pursuant to these agreements, expenses associated with the operation of the Spectrum Funds are borne by each underlying Price fund to the extent of estimated savings to it and in proportion to the average daily value of its shares owned by the Spectrum Funds. Therefore, each Spectrum Fund operates at a zero expense ratio. However, each Spectrum Fund indirectly bears its proportionate share of the management fees and operating costs of the underlying Price funds in which it invests.
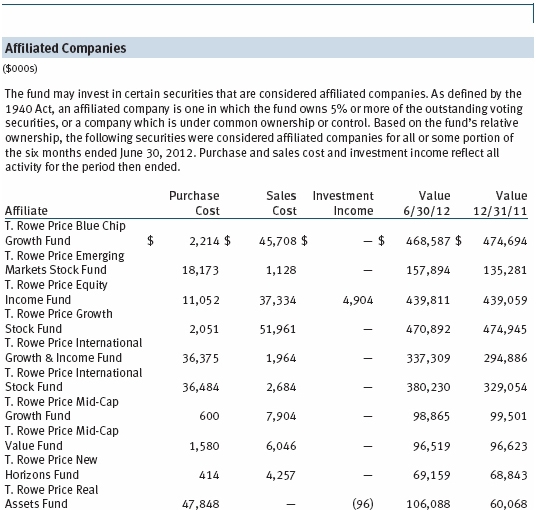
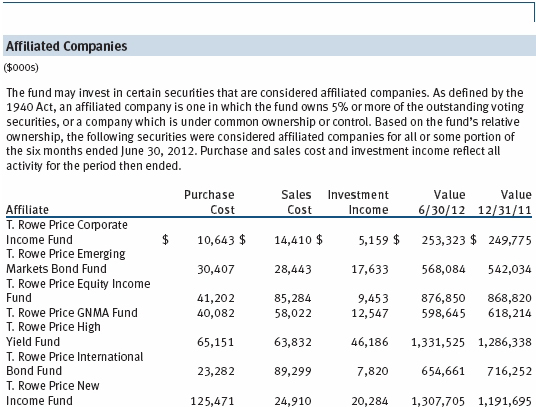
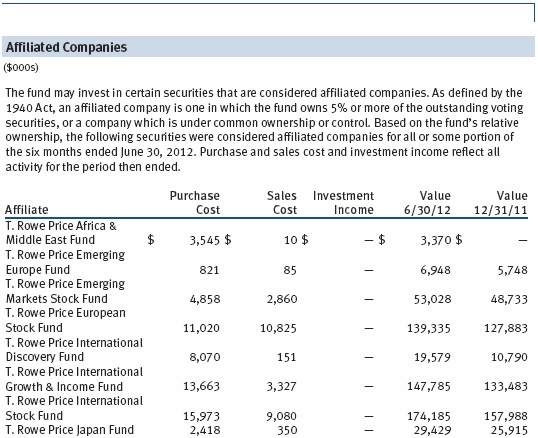
The Spectrum Funds do not invest in the underlying Price funds for the purpose of exercising management or control; however, investments by the Spectrum Funds may represent a significant portion of an underlying Price fund’s net assets. At June 30, 2012, Spectrum Growth and Spectrum International each held less than 25% of the outstanding shares of any underlying Price fund; Spectrum Income held approximately 40% of the outstanding shares of the Corporate Income Fund, 33% of the GNMA Fund, and 30% of the U.S. Treasury Long Fund.
Additionally, Spectrum Income is one of several mutual funds in which certain college savings plans managed by Price Associates may invest. Shareholder servicing costs associated with each college savings plan are allocated to Spectrum Income in proportion to the average daily value of its shares owned by the college savings plan and, in turn, are borne by the underlying Price funds in accordance with the terms of the investment management and special servicing agreements. At June 30, 2012, approximately 21% of the outstanding shares of Spectrum Income were held by the college savings plans.
As of June 30, 2012, T. Rowe Price Group, Inc., and/or its wholly owned subsidiaries owned 2,061,790 shares of Spectrum Growth, representing 1% of the fund’s net assets.
| Information on Proxy Voting Policies, Procedures, and Records |
A description of the policies and procedures used by T. Rowe Price funds and portfolios to determine how to vote proxies relating to portfolio securities is available in each fund’s Statement of Additional Information, which you may request by calling 1-800-225-5132 or by accessing the SEC’s website, sec.gov. The description of our proxy voting policies and procedures is also available on our website, troweprice.com. To access it, click on the words “Our Company” at the top of our corporate homepage. Then, when the next page appears, click on the words “Proxy Voting Policies” on the left side of the page.
Each fund’s most recent annual proxy voting record is available on our website and through the SEC’s website. To access it through our website, follow the directions above, then click on the words “Proxy Voting Records” on the right side of the Proxy Voting Policies page.
| How to Obtain Quarterly Portfolio Holdings |
The fund files a complete schedule of portfolio holdings with the Securities and Exchange Commission for the first and third quarters of each fiscal year on Form N-Q. The fund’s Form N-Q is available electronically on the SEC’s website (sec.gov); hard copies may be reviewed and copied at the SEC’s Public Reference Room, 100 F St. N.E., Washington, DC 20549. For more information on the Public Reference Room, call 1-800-SEC-0330.
| T. Rowe Price Spectrum Growth Fund |
|
| Approval of Investment Management Agreement |
On March 6, 2012, the fund’s Board of Directors (Board), including a majority of the fund’s independent directors, approved the continuation of the investment management agreement (Advisory Contract) between the fund and its investment advisor, T. Rowe Price Associates, Inc. (Advisor), as well as a Special Servicing Agreement among the fund and each of the underlying funds in which it invests. In connection with its deliberations, the Board requested, and the Advisor provided, such information as the Board (with advice from independent legal counsel) deemed reasonably necessary. The Board considered a variety of factors in connection with its review of the Advisory Contract, also taking into account information provided by the Advisor during the course of the year, as discussed below:
Services Provided by the Advisor
The Board considered the nature, quality, and extent of the services provided to the fund by the Advisor. These services included, but were not limited to, directing the fund’s investments in accordance with its investment program and the overall management of the fund’s portfolio, as well as a variety of related activities such as financial, investment operations, and administrative services; compliance; maintaining the fund’s records and registrations; and shareholder communications. The Board also reviewed the background and experience of the Advisor’s senior management team and investment personnel involved in the management of the fund, as well as the Advisor’s compliance record. The Board concluded that it was satisfied with the nature, quality, and extent of the services provided by the Advisor.
Investment Performance of the Fund
The Board reviewed the fund’s average annual total returns over the three-month and 1-, 3-, 5-, and 10-year periods, as well as the fund’s year-by-year returns, and compared these returns with a wide variety of previously agreed upon comparable performance measures and market data, including those supplied by Lipper and Morningstar, which are independent providers of mutual fund data.
On the basis of this evaluation and the Board’s ongoing review of investment results, and factoring in the relative market conditions during certain of the performance periods, the Board concluded that the fund’s performance was satisfactory.
Costs, Benefits, Profits, and Economies of Scale
The Advisor does not receive fees from the fund, and expenses of the fund are borne by the underlying funds in which it invests pursuant to a Special Servicing Agreement. The Advisor does receive fees from other T. Rowe Price funds in which the fund invests. Accordingly, the Board did not review information relating to revenues received by the Advisor under the Contract. The Board did review information regarding benefits that the Advisor (and its affiliates) may have realized from its relationship with the fund or other T. Rowe Price funds in which the fund invests, including any research received under “soft dollar” agreements and commission-sharing arrangements with broker-dealers. The Board considered that the Advisor may receive some benefit from its soft-dollar arrangements pursuant to which it receives research from broker-dealers that execute the applicable fund’s portfolio transactions. The Board also received information on the estimated costs incurred and profits realized by the Advisor and its affiliates from advising T. Rowe Price mutual funds and concluded that the Advisor’s profits were reasonable. Because the Advisor does not receive fees from the fund, the Board did not consider whether the fund or other funds benefit under the fee levels set forth in the Contract from any economies of scale realized by the Advisor. Because the Advisor does not receive a management fee from the fund and the fund does not have an explicit expense ratio, the Board did not review fees and expenses of other comparable funds or of institutional accounts of the Advisor and its affiliates.
Approval of the Advisory Contract
As noted, the Board approved the continuation of the Advisory Contract as well as the Special Servicing Agreement. No single factor was considered in isolation or to be determinative to the decision. Rather, the Board concluded, in light of a weighting and balancing of all factors considered, that it was in the best interests of the fund and its shareholders for the Board to approve the continuation of the Advisory Contract (including the fees to be charged for services thereunder). The independent directors were advised throughout the process by independent legal counsel.
| T. Rowe Price Spectrum Income Fund |
|
| Approval of Investment Management Agreement |
On March 6, 2012, the fund’s Board of Directors (Board), including a majority of the fund’s independent directors, approved the continuation of the investment management agreement (Advisory Contract) between the fund and its investment advisor, T. Rowe Price Associates, Inc. (Advisor), as well as a Special Servicing Agreement among the fund and each of the underlying funds in which it invests. In connection with its deliberations, the Board requested, and the Advisor provided, such information as the Board (with advice from independent legal counsel) deemed reasonably necessary. The Board considered a variety of factors in connection with its review of the Advisory Contract, also taking into account information provided by the Advisor during the course of the year, as discussed below:
Services Provided by the Advisor
The Board considered the nature, quality, and extent of the services provided to the fund by the Advisor. These services included, but were not limited to, directing the fund’s investments in accordance with its investment program and the overall management of the fund’s portfolio, as well as a variety of related activities such as financial, investment operations, and administrative services; compliance; maintaining the fund’s records and registrations; and shareholder communications. The Board also reviewed the background and experience of the Advisor’s senior management team and investment personnel involved in the management of the fund, as well as the Advisor’s compliance record. The Board concluded that it was satisfied with the nature, quality, and extent of the services provided by the Advisor.
Investment Performance of the Fund
The Board reviewed the fund’s average annual total returns over the three-month and 1-, 3-, 5-, and 10-year periods, as well as the fund’s year-by-year returns, and compared these returns with a wide variety of previously agreed upon comparable performance measures and market data, including those supplied by Lipper and Morningstar, which are independent providers of mutual fund data.
On the basis of this evaluation and the Board’s ongoing review of investment results, and factoring in the relative market conditions during certain of the performance periods, the Board concluded that the fund’s performance was satisfactory.
Costs, Benefits, Profits, and Economies of Scale
The Advisor does not receive fees from the fund, and expenses of the fund are borne by the underlying funds in which it invests pursuant to a Special Servicing Agreement. The Advisor does receive fees from other T. Rowe Price funds in which the fund invests. Accordingly, the Board did not review information relating to revenues received by the Advisor under the Contract. The Board did review information regarding benefits that the Advisor (and its affiliates) may have realized from its relationship with the fund or other T. Rowe Price funds in which the fund invests, including any research received under “soft dollar” agreements and commission-sharing arrangements with broker-dealers. The Board considered that the Advisor may receive some benefit from its soft-dollar arrangements pursuant to which it receives research from broker-dealers that execute the applicable fund’s portfolio transactions. The Board also received information on the estimated costs incurred and profits realized by the Advisor and its affiliates from advising T. Rowe Price mutual funds and concluded that the Advisor’s profits were reasonable. Because the Advisor does not receive fees from the fund, the Board did not consider whether the fund or other funds benefit under the fee levels set forth in the Contract from any economies of scale realized by the Advisor. Because the Advisor does not receive a management fee from the fund and the fund does not have an explicit expense ratio, the Board did not review fees and expenses of other comparable funds or of institutional accounts of the Advisor and its affiliates.
Approval of the Advisory Contract
As noted, the Board approved the continuation of the Advisory Contract as well as the Special Servicing Agreement. No single factor was considered in isolation or to be determinative to the decision. Rather, the Board concluded, in light of a weighting and balancing of all factors considered, that it was in the best interests of the fund and its shareholders for the Board to approve the continuation of the Advisory Contract (including the fees to be charged for services thereunder). The independent directors were advised throughout the process by independent legal counsel.
| T. Rowe Price Spectrum International Fund |
|
| Approval of Investment Management Agreement |
On March 6, 2012, the fund’s Board of Directors (Board), including a majority of the fund’s independent directors, approved the continuation of the investment management agreement (Advisory Contract) between the fund and its investment advisor, T. Rowe Price Associates, Inc. (Advisor), as well as a Special Servicing Agreement among the fund and each of the underlying funds in which it invests. In connection with its deliberations, the Board requested, and the Advisor provided, such information as the Board (with advice from independent legal counsel) deemed reasonably necessary. The Board considered a variety of factors in connection with its review of the Advisory Contract, also taking into account information provided by the Advisor during the course of the year, as discussed below:
Services Provided by the Advisor
The Board considered the nature, quality, and extent of the services provided to the fund by the Advisor. These services included, but were not limited to, directing the fund’s investments in accordance with its investment program and the overall management of the fund’s portfolio, as well as a variety of related activities such as financial, investment operations, and administrative services; compliance; maintaining the fund’s records and registrations; and shareholder communications. The Board also reviewed the background and experience of the Advisor’s senior management team and investment personnel involved in the management of the fund, as well as the Advisor’s compliance record. The Board concluded that it was satisfied with the nature, quality, and extent of the services provided by the Advisor.
Investment Performance of the Fund
The Board reviewed the fund’s average annual total returns over the three-month and 1-, 3-, 5-, and 10-year periods, as well as the fund’s year-by-year returns, and compared these returns with a wide variety of previously agreed upon comparable performance measures and market data, including those supplied by Lipper and Morningstar, which are independent providers of mutual fund data.
On the basis of this evaluation and the Board’s ongoing review of investment results, and factoring in the relative market conditions during certain of the performance periods, the Board concluded that the fund’s performance was satisfactory.
Costs, Benefits, Profits, and Economies of Scale
The Advisor does not receive fees from the fund, and expenses of the fund are borne by the underlying funds in which it invests pursuant to a Special Servicing Agreement. The Advisor does receive fees from other T. Rowe Price funds in which the fund invests. Accordingly, the Board did not review information relating to revenues received by the Advisor under the Contract. The Board did review information regarding benefits that the Advisor (and its affiliates) may have realized from its relationship with the fund or other T. Rowe Price funds in which the fund invests, including any research received under “soft dollar” agreements and commission-sharing arrangements with broker-dealers. The Board considered that the Advisor may receive some benefit from its soft-dollar arrangements pursuant to which it receives research from broker-dealers that execute the applicable fund’s portfolio transactions. The Board also received information on the estimated costs incurred and profits realized by the Advisor and its affiliates from advising T. Rowe Price mutual funds and concluded that the Advisor’s profits were reasonable. Because the Advisor does not receive fees from the fund, the Board did not consider whether the fund or other funds benefit under the fee levels set forth in the Contract from any economies of scale realized by the Advisor. Because the Advisor does not receive a management fee from the fund and the fund does not have an explicit expense ratio, the Board did not review fees and expenses of other comparable funds or of institutional accounts of the Advisor and its affiliates.
Approval of the Advisory Contract
As noted, the Board approved the continuation of the Advisory Contract as well as the Special Servicing Agreement. No single factor was considered in isolation or to be determinative to the decision. Rather, the Board concluded, in light of a weighting and balancing of all factors considered, that it was in the best interests of the fund and its shareholders for the Board to approve the continuation of the Advisory Contract (including the fees to be charged for services thereunder). The independent directors were advised throughout the process by independent legal counsel.
Item 2. Code of Ethics.
A code of ethics, as defined in Item 2 of Form N-CSR, applicable to its principal executive officer, principal financial officer, principal accounting officer or controller, or persons performing similar functions is filed as an exhibit to the registrant’s annual Form N-CSR. No substantive amendments were approved or waivers were granted to this code of ethics during the registrant’s most recent fiscal half-year.
Item 3. Audit Committee Financial Expert.
Disclosure required in registrant’s annual Form N-CSR.
Item 4. Principal Accountant Fees and Services.
Disclosure required in registrant’s annual Form N-CSR.
Item 5. Audit Committee of Listed Registrants.
Not applicable.
Item 6. Investments.
(a) Not applicable. The complete schedule of investments is included in Item 1 of this Form N-CSR.
(b) Not applicable.
Item 7. Disclosure of Proxy Voting Policies and Procedures for Closed-End Management Investment Companies.
Not applicable.
Item 8. Portfolio Managers of Closed-End Management Investment Companies.
Not applicable.
Item 9. Purchases of Equity Securities by Closed-End Management Investment Company and Affiliated Purchasers.
Not applicable.
Item 10. Submission of Matters to a Vote of Security Holders.
Not applicable.
Item 11. Controls and Procedures.
(a) The registrant’s principal executive officer and principal financial officer have evaluated the registrant’s disclosure controls and procedures within 90 days of this filing and have concluded that the registrant’s disclosure controls and procedures were effective, as of that date, in ensuring that information required to be disclosed by the registrant in this Form N-CSR was recorded, processed, summarized, and reported timely.
(b) The registrant’s principal executive officer and principal financial officer are aware of no change in the registrant’s internal control over financial reporting that occurred during the registrant’s second fiscal quarter covered by this report that has materially affected, or is reasonably likely to materially affect, the registrant’s internal control over financial reporting.
Item 12. Exhibits.
(a)(1) The registrant’s code of ethics pursuant to Item 2 of Form N-CSR is filed with the registrant’s annual Form N-CSR.
(2) Separate certifications by the registrant's principal executive officer and principal financial officer, pursuant to Section 302 of the Sarbanes-Oxley Act of 2002 and required by Rule 30a-2(a) under the Investment Company Act of 1940, are attached.
(3) Written solicitation to repurchase securities issued by closed-end companies: not applicable.
(b) A certification by the registrant's principal executive officer and principal financial officer, pursuant to Section 906 of the Sarbanes-Oxley Act of 2002 and required by Rule 30a-2(b) under the Investment Company Act of 1940, is attached.
SIGNATURES
Pursuant to the requirements of the Securities Exchange Act of 1934 and the Investment Company Act of 1940, the registrant has duly caused this report to be signed on its behalf by the undersigned, thereunto duly authorized.
T. Rowe Price Spectrum Fund, Inc.
| By | /s/ Edward C. Bernard |
| | Edward C. Bernard |
| | Principal Executive Officer |
| | |
| Date August 16, 2012 | | |
Pursuant to the requirements of the Securities Exchange Act of 1934 and the Investment Company Act of 1940, this report has been signed below by the following persons on behalf of the registrant and in the capacities and on the dates indicated.
| By | /s/ Edward C. Bernard |
| | Edward C. Bernard |
| | Principal Executive Officer |
| | |
| Date August 16, 2012 | | |
| | |
| | |
| By | /s/ Gregory K. Hinkle |
| | Gregory K. Hinkle |
| | Principal Financial Officer |
| | |
| Date August 16, 2012 | | |