Exhibit 99.1

TAT Technologies Corporate Presentation March 2018
Forward Looking Statements This presentation may contain certain forward-looking statements within the meaning of the “safe harbor” provisions of the Private Securities Litigation Reform Act of 1995. Generally, the words “expects,” “anticipates,” “targets,” “goals,” “projects,” “intends,” “plans,” “believes,” “seeks,” “estimates,” variations of such words and similar expressions identify forward-looking statements and any statements regarding TAT’s future financial condition, results of operations and business are also forward-looking statements. These forward-looking statements involve certain risks and uncertainties. Factors that could cause actual results to differ materially from those contemplated by the forward-looking statements include, among others, the following factors: continued compliance with government regulations; competition in the industry in which TAT does business; TAT’s business strategy and plans; exchange rate fluctuations; general economic conditions; and political, economic and military conditions in Israel.Any forward-looking statements in this presentation are not guarantees of future performance, and actual results, developments and business decisions may differ from those contemplated by those forward-looking statements, possibly materially. Except as otherwise required by applicable law, TAT disclaims any duty to update any forward-looking statements.Additional discussions of risks and uncertainties that may affect the accuracy of forward-looking statements included in this presentation or which may otherwise affect TAT’s business is included under the heading “RISK FACTORS” in TAT’s filings on Forms 20-F and 6-K, which are filed from time to time.
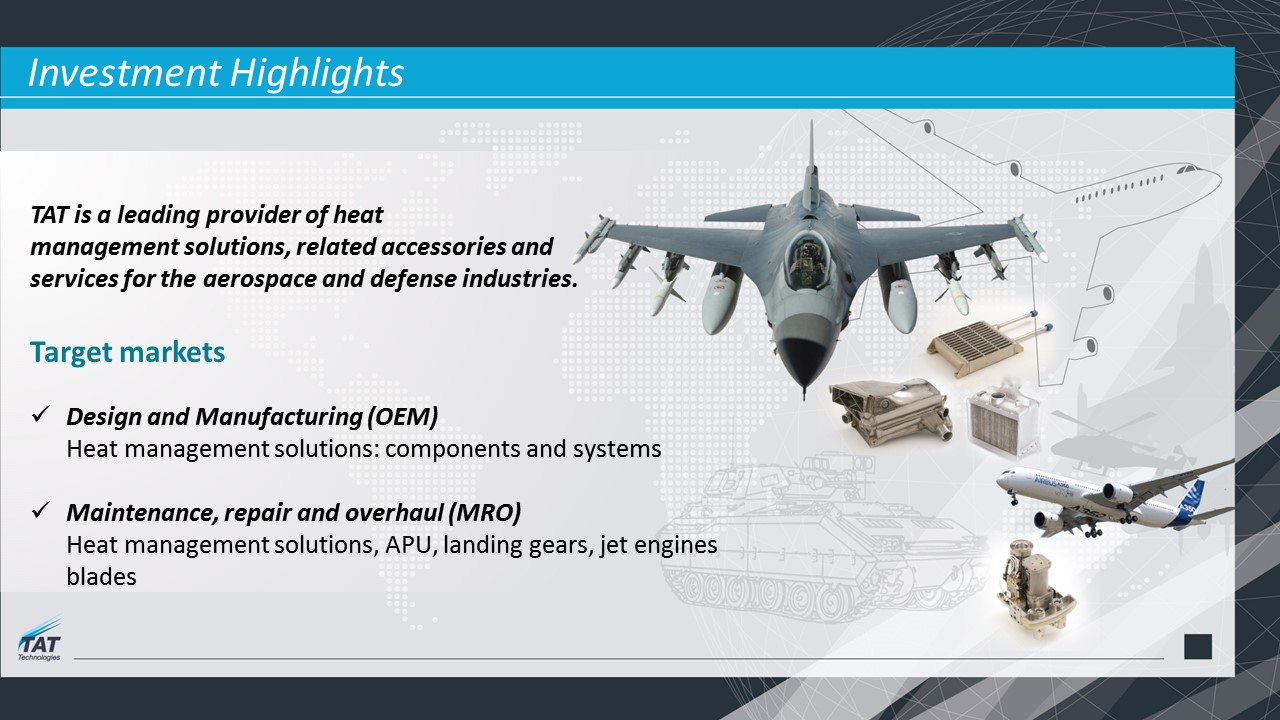
Investment Highlights TAT is a leading provider of heat management solutions, related accessories andservices for the aerospace and defense industries. Target marketsDesign and Manufacturing (OEM)Heat management solutions: components and systemsMaintenance, repair and overhaul (MRO)Heat management solutions, APU, landing gears, jet engines blades
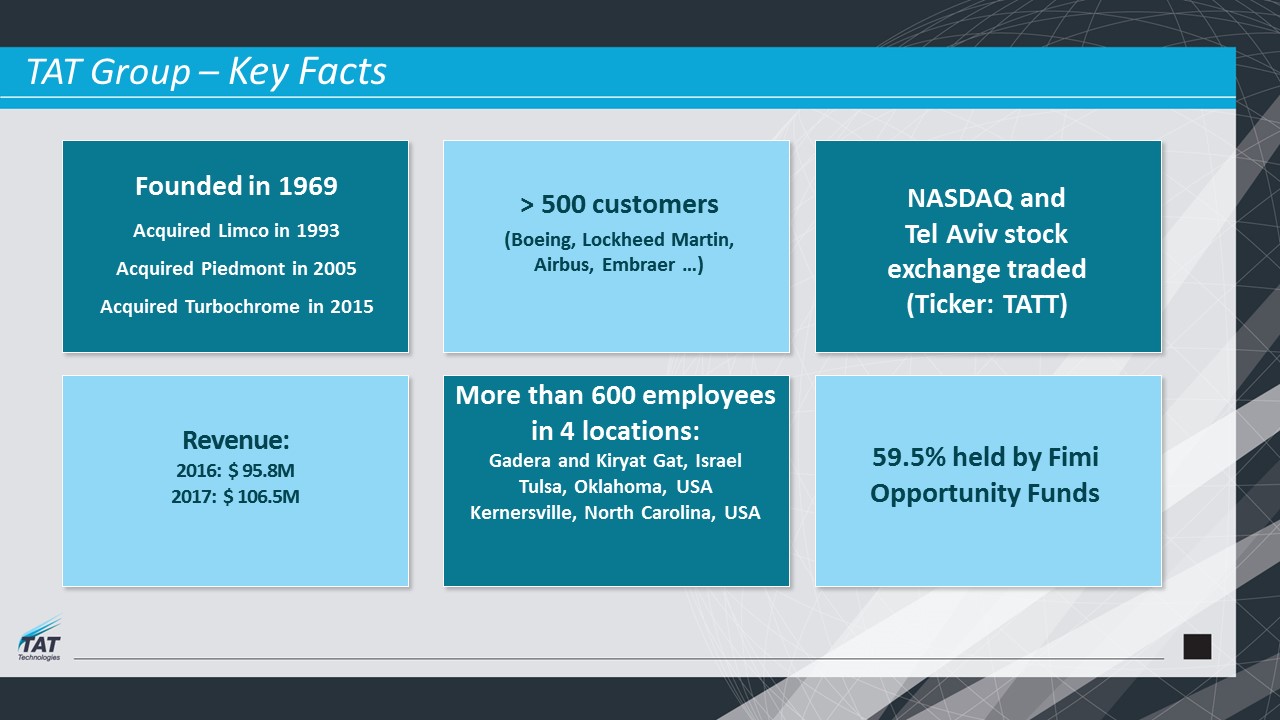
Founded in 1969Acquired Limco in 1993Acquired Piedmont in 2005Acquired Turbochrome in 2015 > 500 customers (Boeing, Lockheed Martin, Airbus, Embraer …) More than 600 employees in 4 locations: Gadera and Kiryat Gat, IsraelTulsa, Oklahoma, USAKernersville, North Carolina, USA NASDAQ and Tel Aviv stock exchange traded (Ticker: TATT) 59.5% held by Fimi Opportunity Funds TAT Group – Key Facts Revenue: 2016: $ 95.8M2017: $ 106.5M

TAT Group –Senior Management In position since June 2016Former Head of the Israeli Defense Intelligence and Commander of the IDF Ground Forces Command. Retired in 2002Founder and Chairman of Spire Security Solutions Ltd. and Nyotron Information Security LtdPrior positions:2007-2015: Chairman of the Board of Logic Industries Ltd2007-2010: Chairman of the Board of Plasan Sasa Ltd2002-2005: CEO Elul Technologies Ltd Amos Malka Chairman of the Board In position since April 2016Prior experience: President – Mapco Express (subsidiary of Delek US Holdings Inc)CEO – Metrolight LtdCEO – Rostam Ltd (acquired by Albaad Massout Yitzhak Ltd) Igal Zamir President & CEO In position since July 2015Prior experience:CFO– Altair-Semiconductors CFO – Provigent - acquired by Broadcom (NASDAQ: BRCM)Senior auditor - PwC Guy Nathanzon CFO
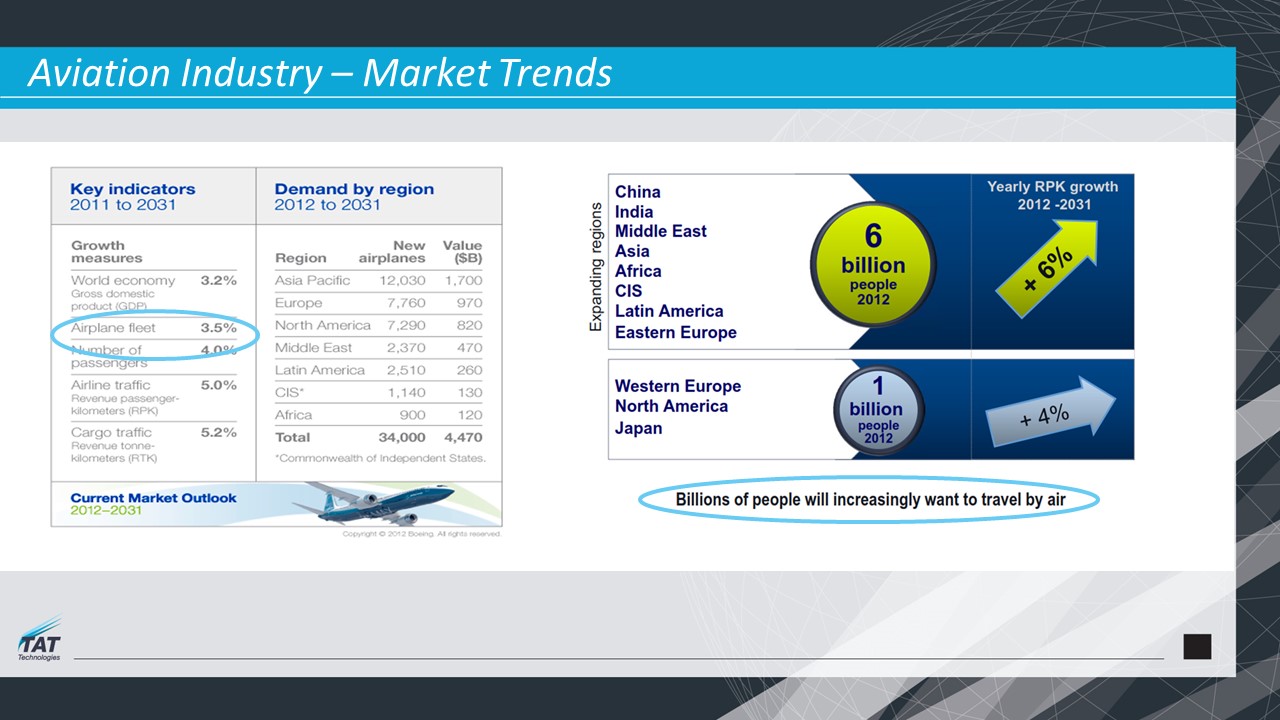
Aviation Industry – Market Trends
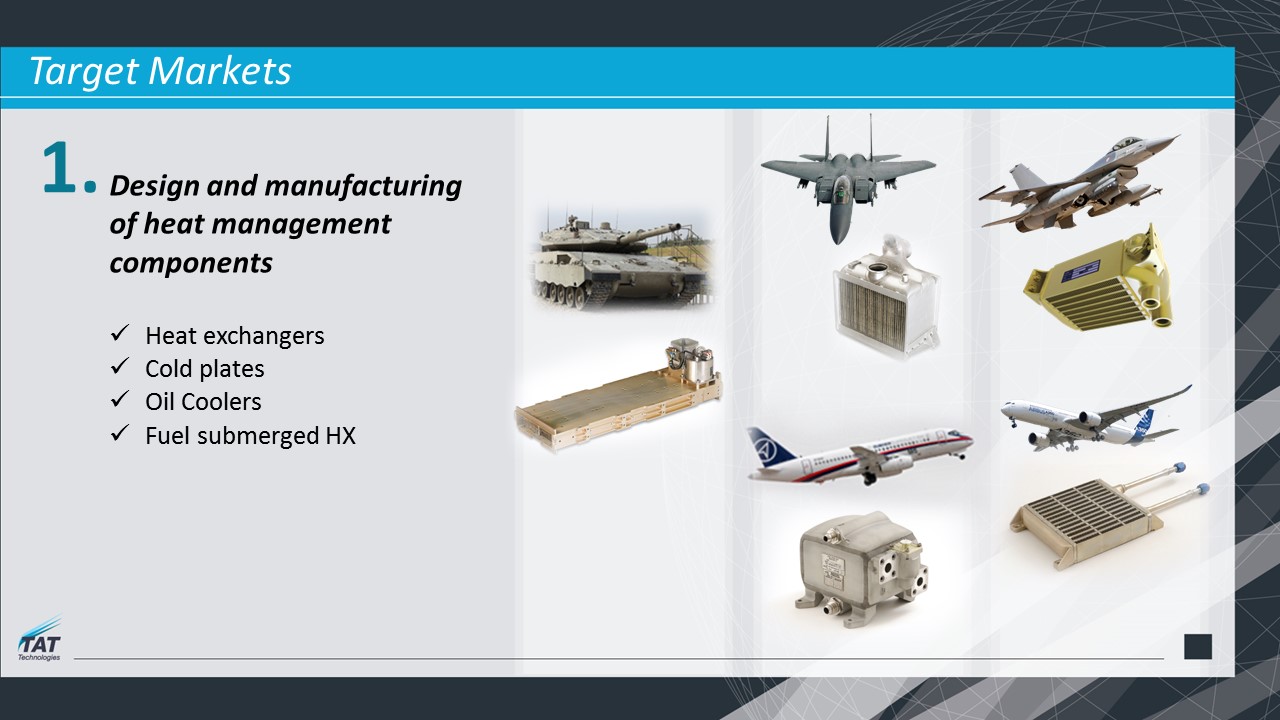
1. Target Markets Design and manufacturing of heat management components Heat exchangersCold platesOil CoolersFuel submerged HX
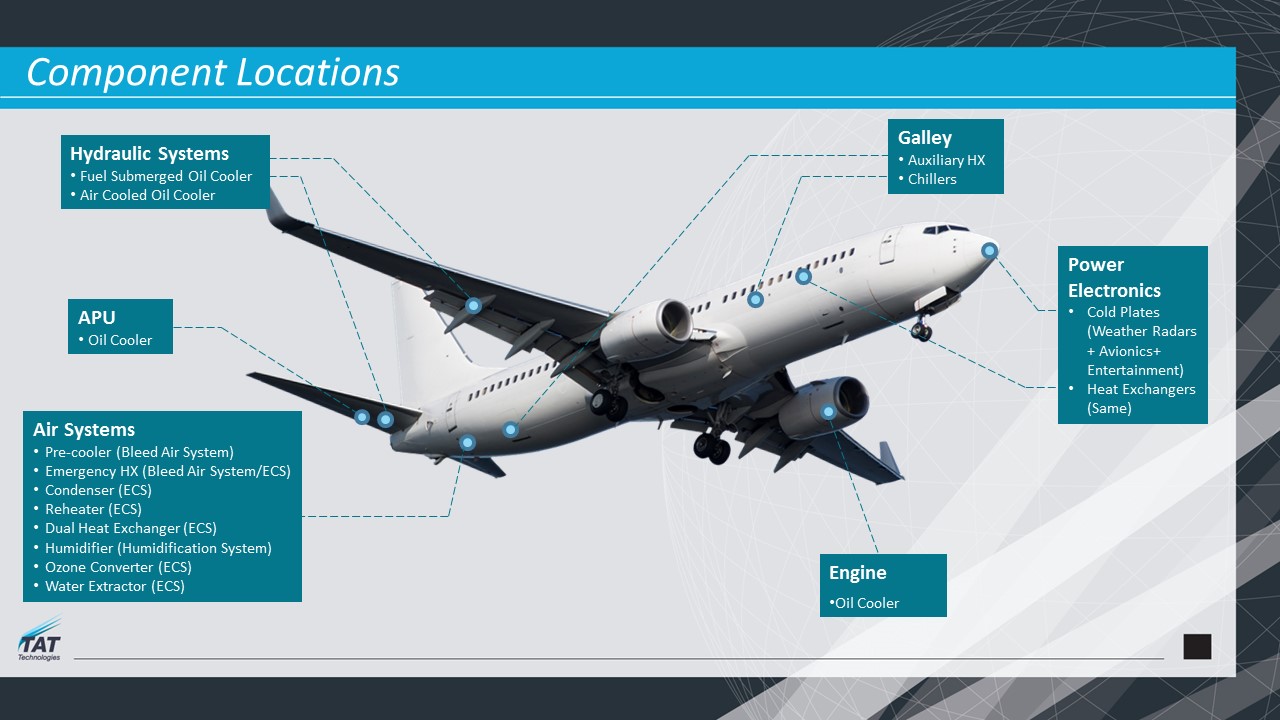
Hydraulic Systems Fuel Submerged Oil Cooler Air Cooled Oil Cooler Component Locations Power ElectronicsCold Plates (Weather Radars + Avionics+ Entertainment)Heat Exchangers (Same) APU Oil Cooler EngineOil Cooler Galley Auxiliary HX Chillers Air SystemsPre-cooler (Bleed Air System)Emergency HX (Bleed Air System/ECS)Condenser (ECS)Reheater (ECS)Dual Heat Exchanger (ECS)Humidifier (Humidification System)Ozone Converter (ECS)Water Extractor (ECS)
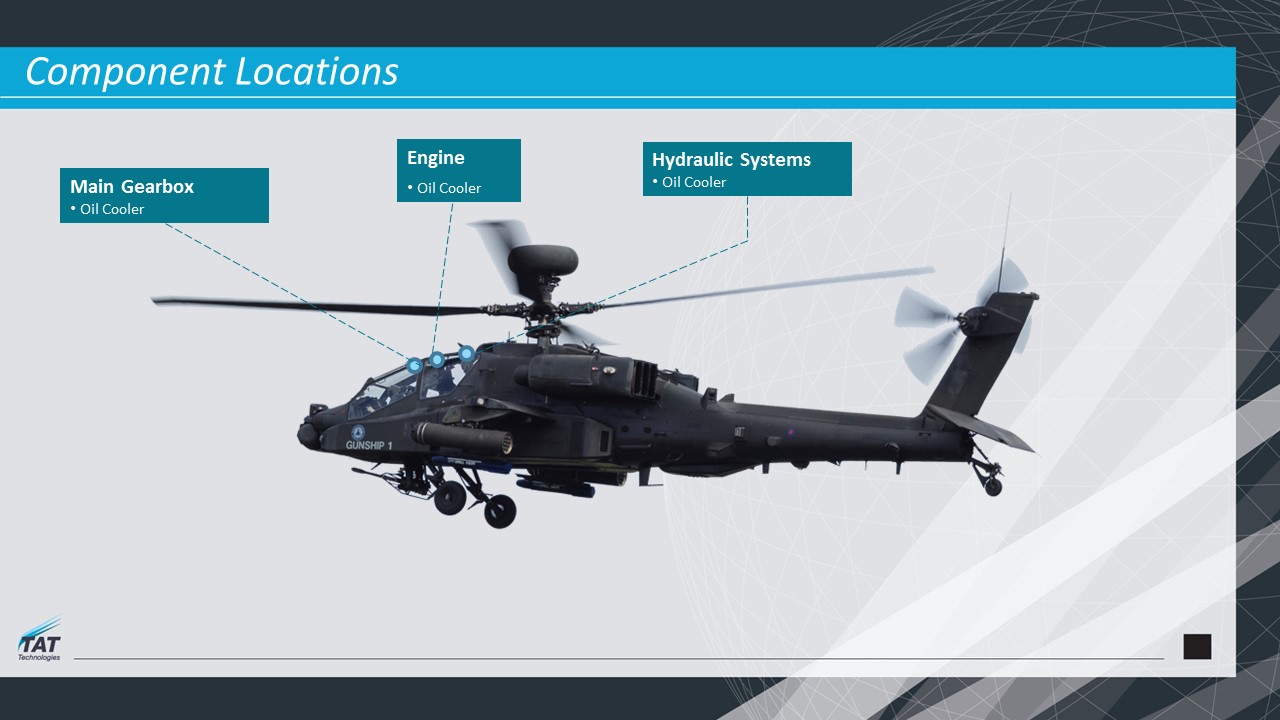
Component Locations Hydraulic Systems Oil Cooler Engine Oil Cooler Main Gearbox Oil Cooler
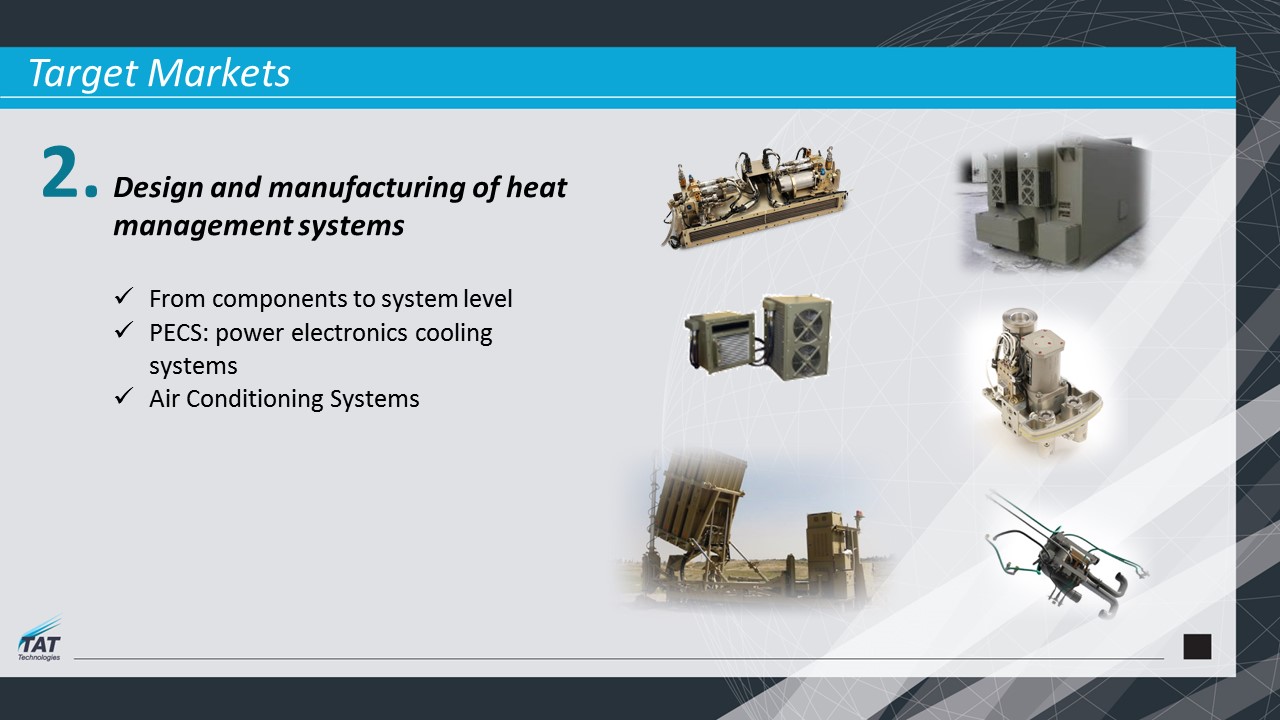
Target Markets Design and manufacturing of heat management systems From components to system levelPECS: power electronics cooling systemsAir Conditioning Systems 2.
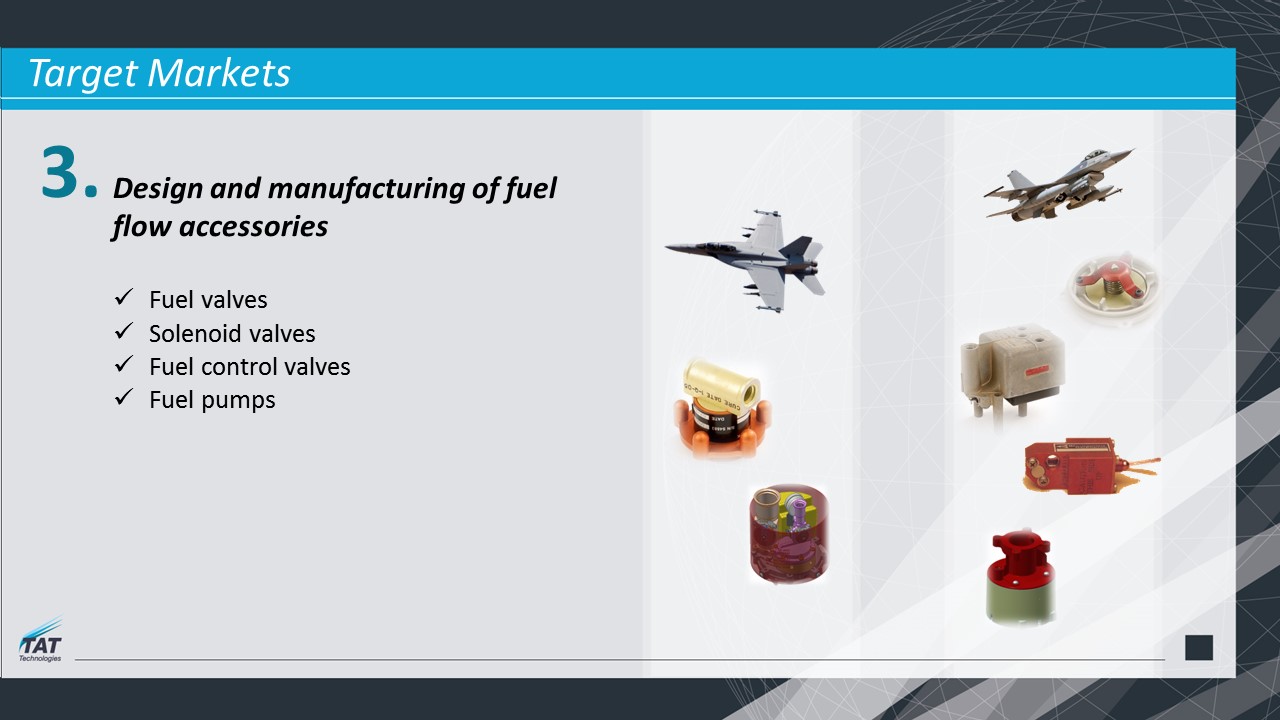
3. Target Markets Design and manufacturing of fuel flow accessoriesFuel valvesSolenoid valvesFuel control valvesFuel pumps
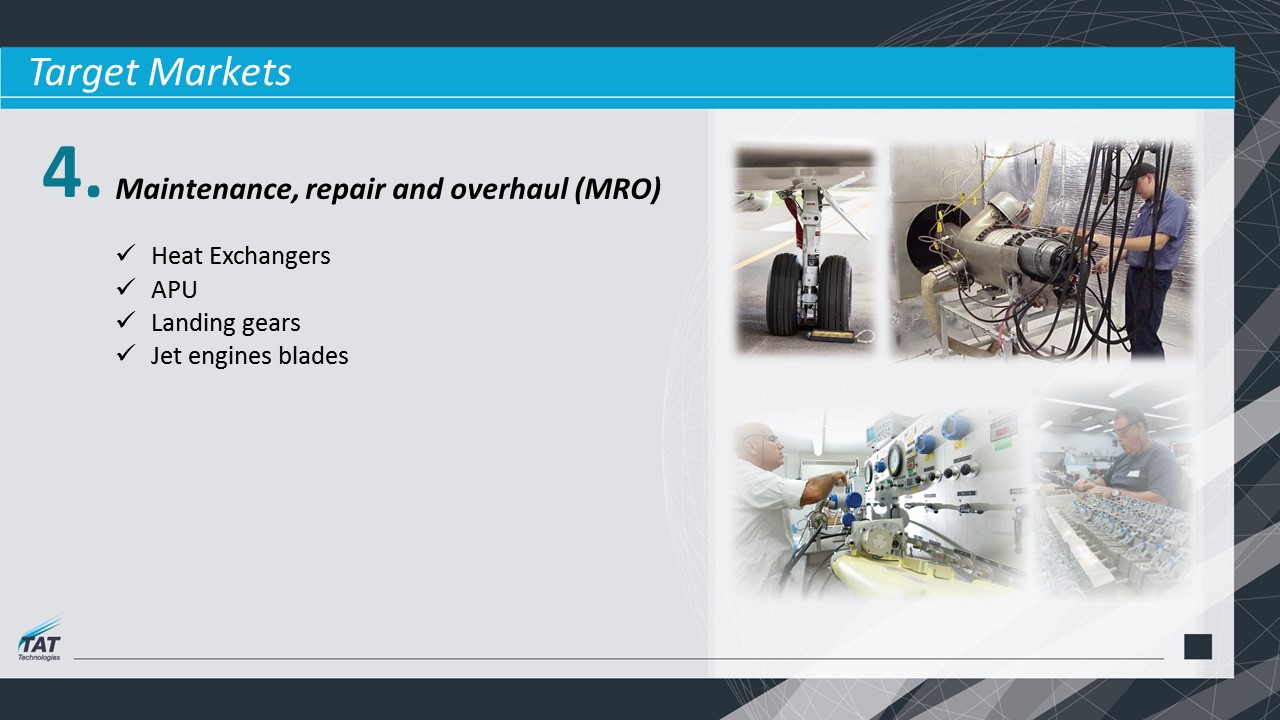
4. Target Markets Maintenance, repair and overhaul (MRO) Heat Exchangers APU Landing gearsJet engines blades
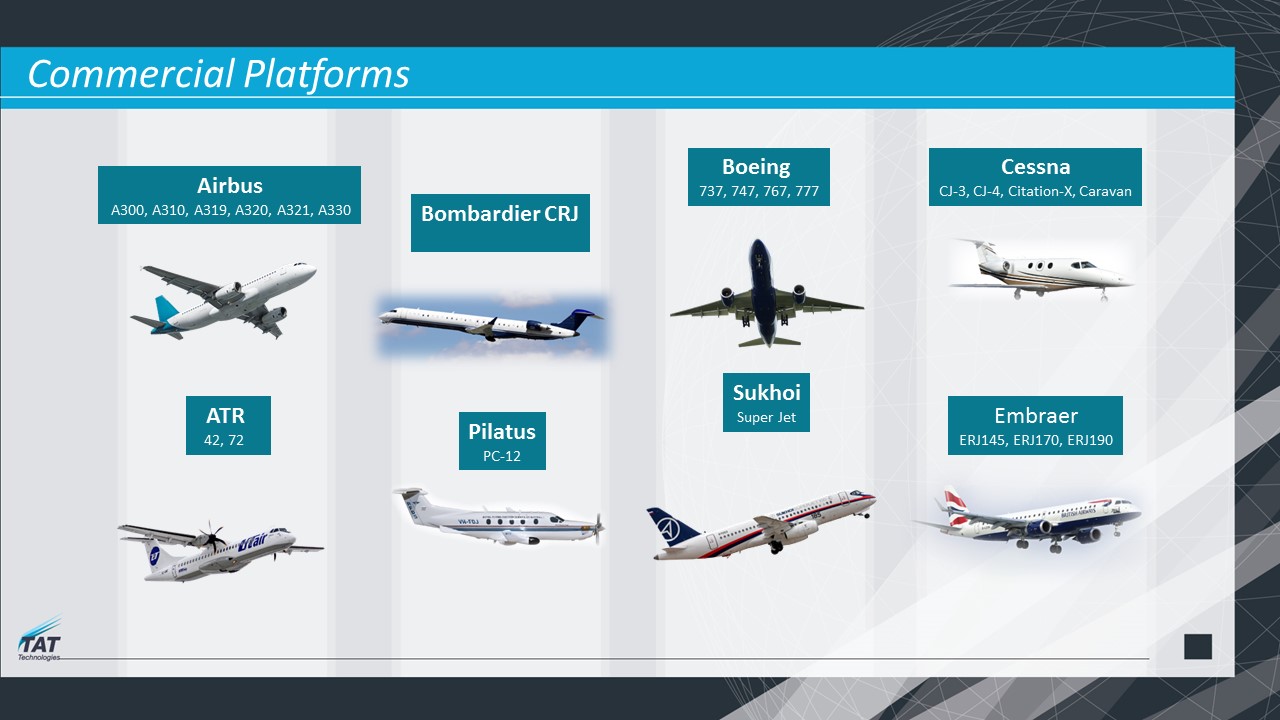
Commercial Platforms Airbus A300, A310, A319, A320, A321, A330 Bombardier CRJ ATR 42, 72 PilatusPC-12 Boeing 737, 747, 767, 777 SukhoiSuper Jet CessnaCJ-3, CJ-4, Citation-X, Caravan EmbraerERJ145, ERJ170, ERJ190
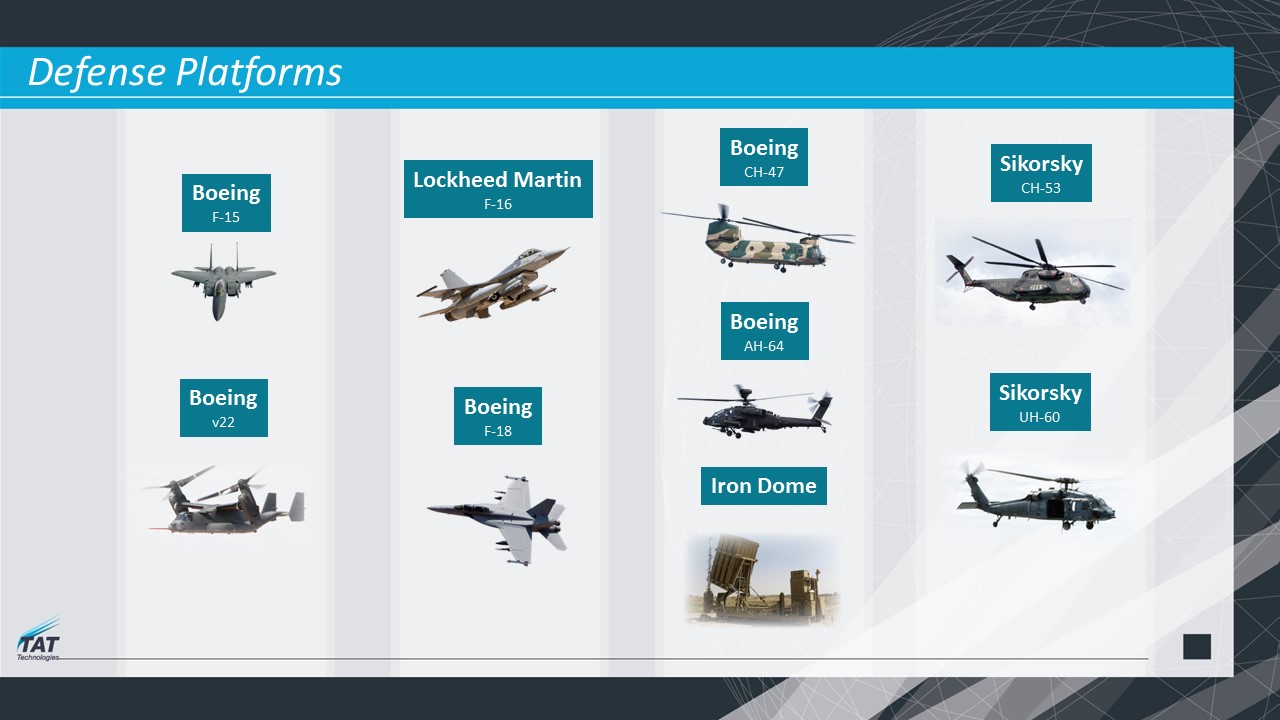
Defense Platforms BoeingF-15 Boeingv22 BoeingF-18 BoeingCH-47 BoeingAH-64 Iron Dome SikorskyUH-60 SikorskyCH-53 Lockheed MartinF-16
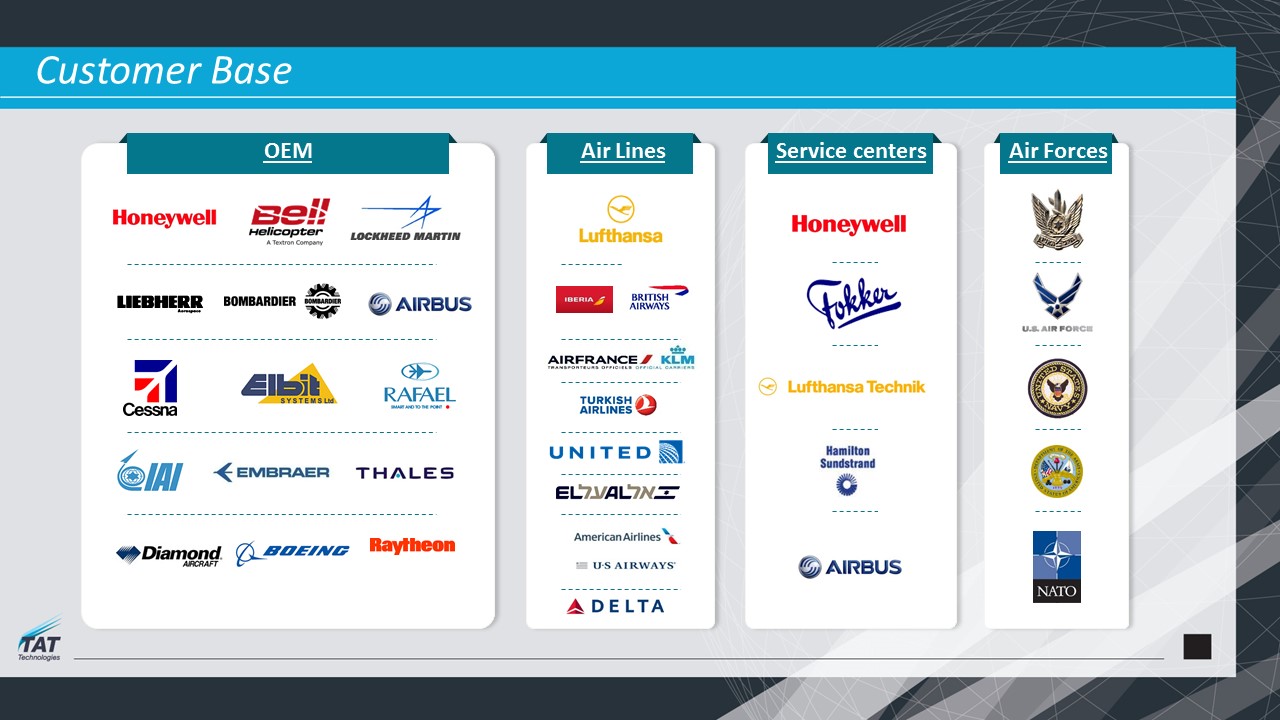
Service centers Air Forces Customer Base Air Lines OEM

Strength / Differentiators Over 40 years of experience – proven competence in demanding aerospace world Technology Unique manufacturing capabilities – 4 facilities world wide, including dip brazing and vacuum brazing, EBW Manufacturing Expertise FAA, EASA, AS9100, Honeywell authorized repair center for APUs Customers Relationships and Certifications
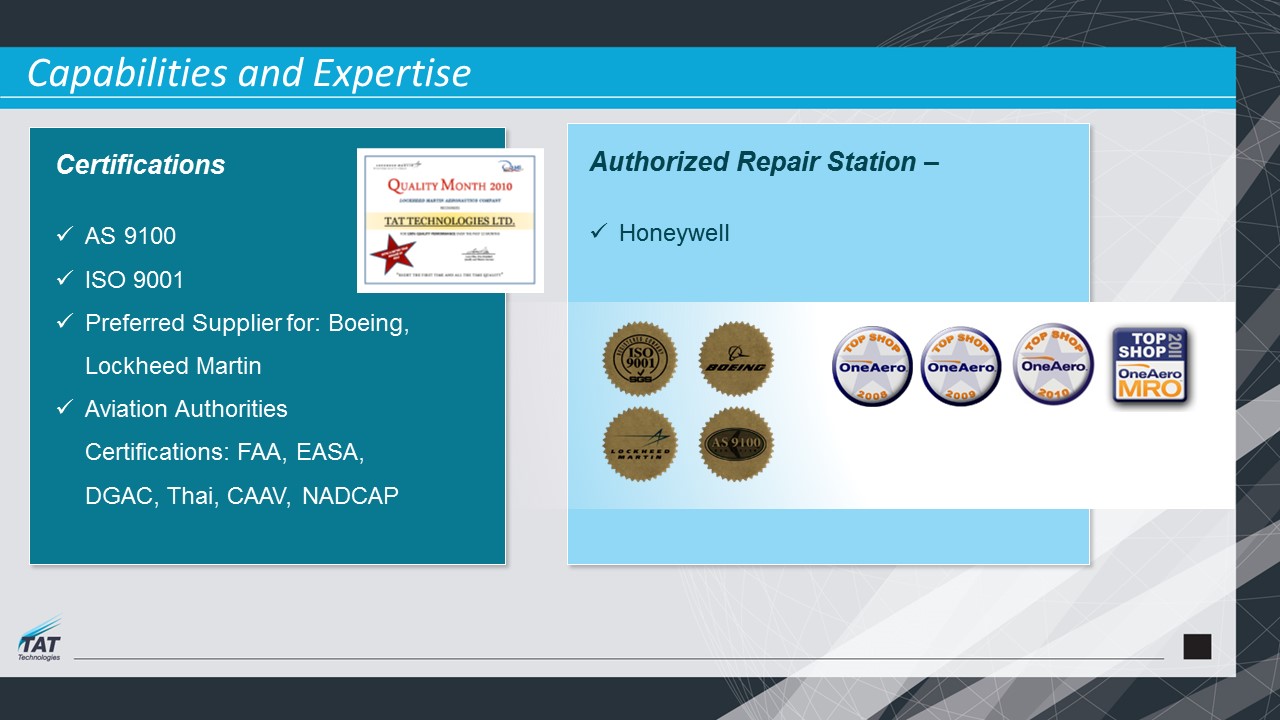
Capabilities and Expertise CertificationsAS 9100ISO 9001Preferred Supplier for: Boeing, Lockheed MartinAviation Authorities Certifications: FAA, EASA, DGAC, Thai, CAAV, NADCAP Authorized Repair Station – Honeywell
Growth Drivers Going upstream in the chain (from components to systems)Enter into new platforms – aviation and groundMaintenance, repair and overhaul (MRO) of new parts Organic growth and acquisitionsExpand to new territories: Eastern Europe, Asia, UK etc


Revenue Trend
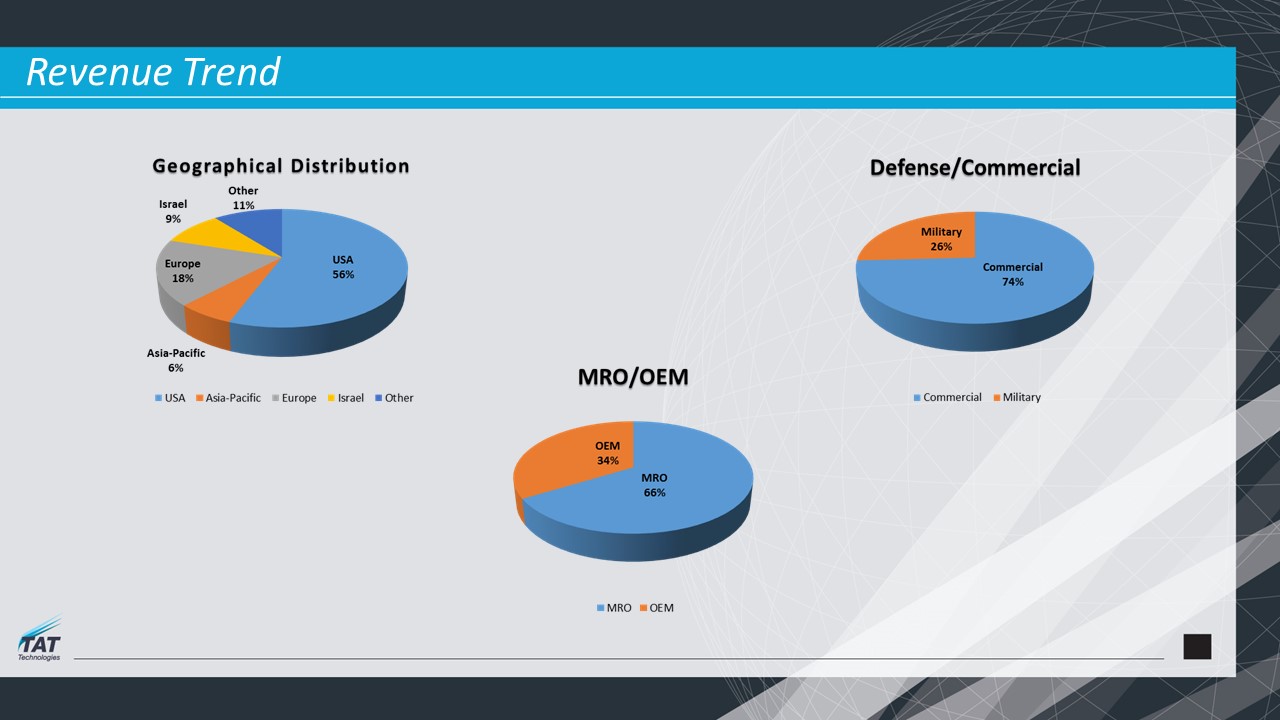
Revenue Trend
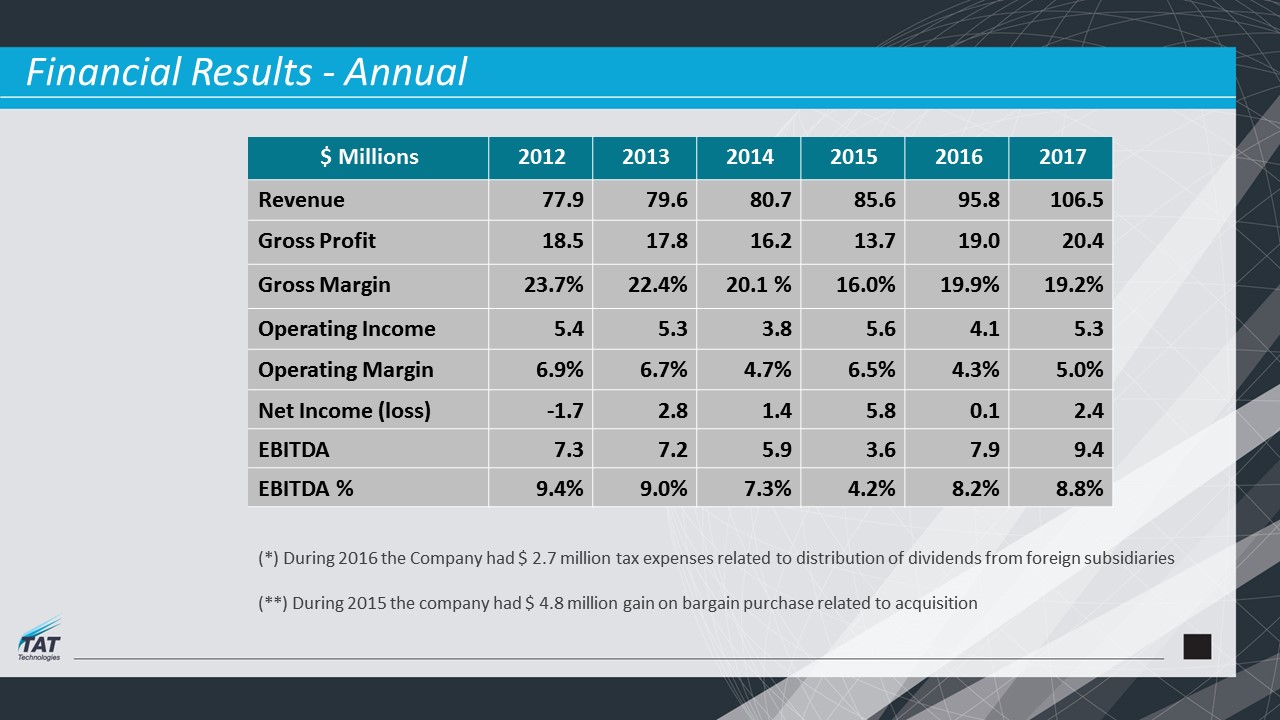
2017 2016 2015 2014 2013 2012 $ Millions 106.5 95.8 85.6 80.7 79.6 77.9 Revenue 20.4 19.0 13.7 16.2 17.8 18.5 Gross Profit 19.2% 19.9% 16.0% 20.1 % 22.4% 23.7% Gross Margin 5.3 4.1 5.6 3.8 5.3 5.4 Operating Income 5.0% 4.3% 6.5% 4.7% 6.7% 6.9% Operating Margin 2.4 0.1 5.8 1.4 2.8 -1.7 Net Income (loss) 9.4 7.9 3.6 5.9 7.2 7.3 EBITDA 8.8% 8.2% 4.2% 7.3% 9.0% 9.4% EBITDA % Financial Results - Annual (*) During 2016 the Company had $ 2.7 million tax expenses related to distribution of dividends from foreign subsidiaries (**) During 2015 the company had $ 4.8 million gain on bargain purchase related to acquisition
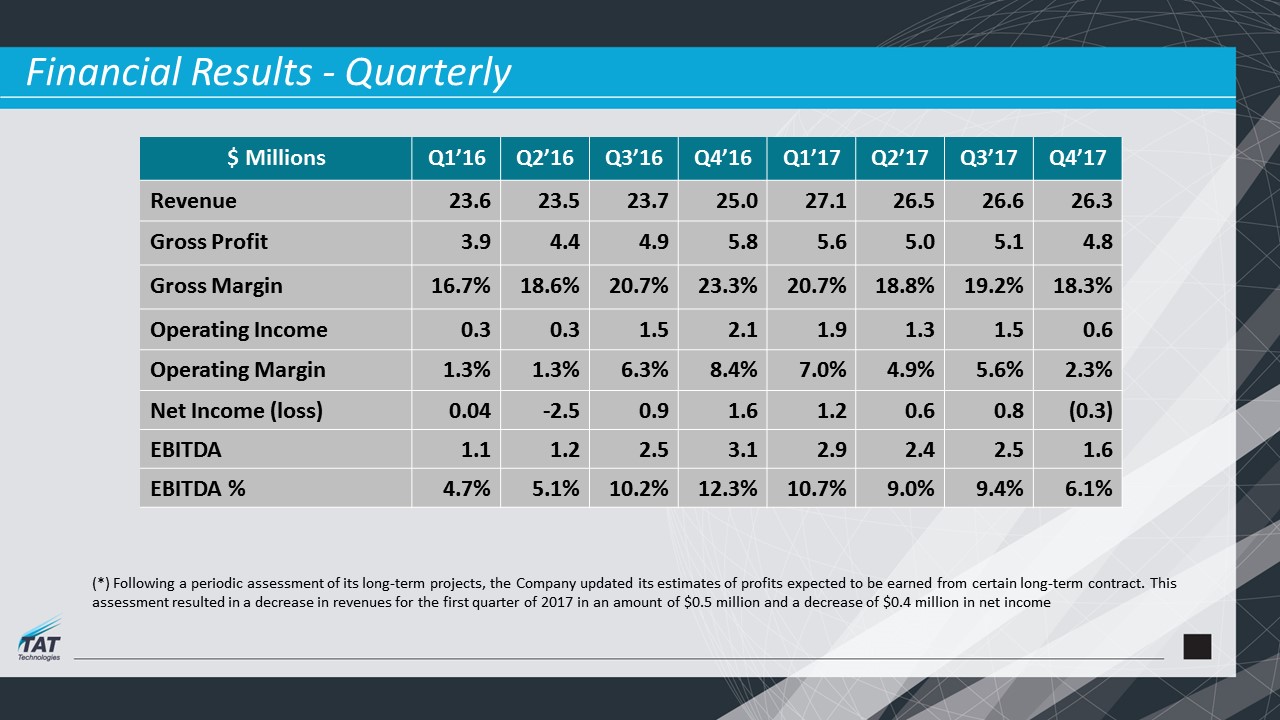
Financial Results - Quarterly Q4’17 Q3’17 Q2’17 Q1’17 Q4’16 Q3’16 Q2’16 Q1’16 $ Millions 26.3 26.6 26.5 27.1 25.0 23.7 23.5 23.6 Revenue 4.8 5.1 5.0 5.6 5.8 4.9 4.4 3.9 Gross Profit 18.3% 19.2% 18.8% 20.7% 23.3% 20.7% 18.6% 16.7% Gross Margin 0.6 1.5 1.3 1.9 2.1 1.5 0.3 0.3 Operating Income 2.3% 5.6% 4.9% 7.0% 8.4% 6.3% 1.3% 1.3% Operating Margin (0.3) 0.8 0.6 1.2 1.6 0.9 -2.5 0.04 Net Income (loss) 1.6 2.5 2.4 2.9 3.1 2.5 1.2 1.1 EBITDA 6.1% 9.4% 9.0% 10.7% 12.3% 10.2% 5.1% 4.7% EBITDA % (*) Following a periodic assessment of its long-term projects, the Company updated its estimates of profits expected to be earned from certain long-term contract. This assessment resulted in a decrease in revenues for the first quarter of 2017 in an amount of $0.5 million and a decrease of $0.4 million in net income
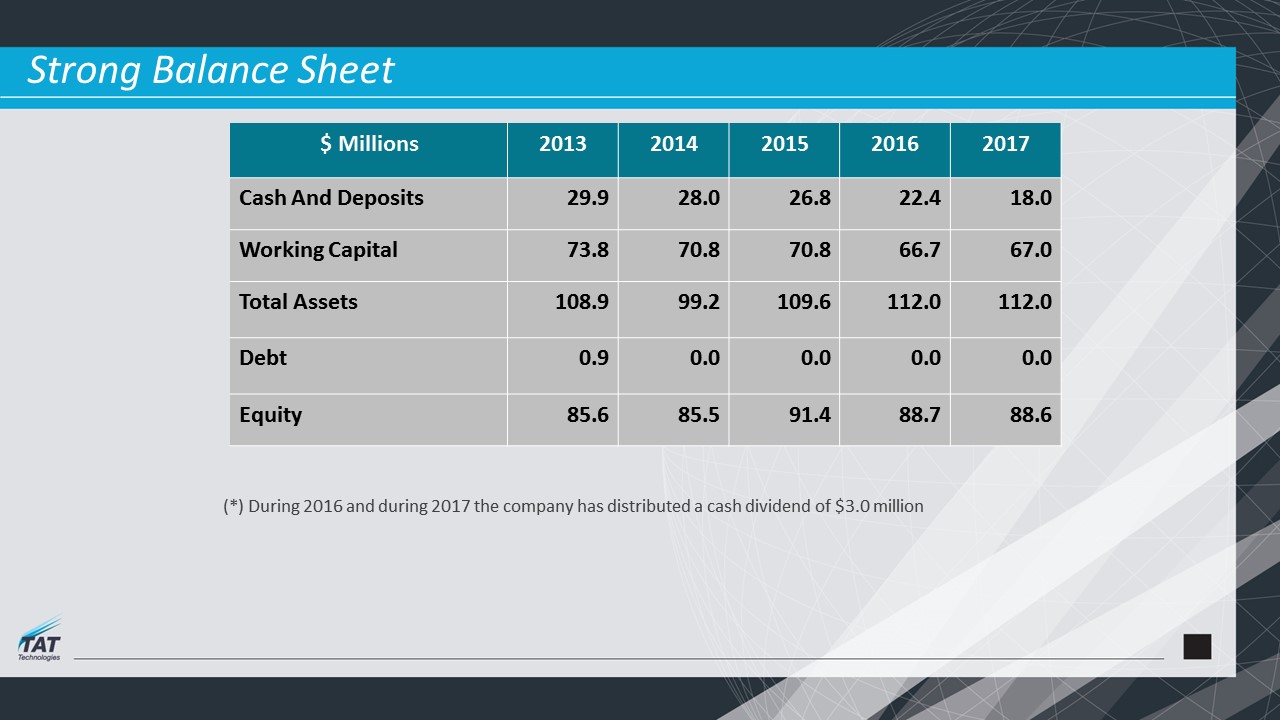
Strong Balance Sheet 2017 2016 2015 2014 2013 $ Millions 18.0 22.4 26.8 28.0 29.9 Cash And Deposits 67.0 66.7 70.8 70.8 73.8 Working Capital 112.0 112.0 109.6 99.2 108.9 Total Assets 0.0 0.0 0.0 0.0 0.9 Debt 88.6 88.7 91.4 85.5 85.6 Equity (*) During 2016 and during 2017 the company has distributed a cash dividend of $3.0 million
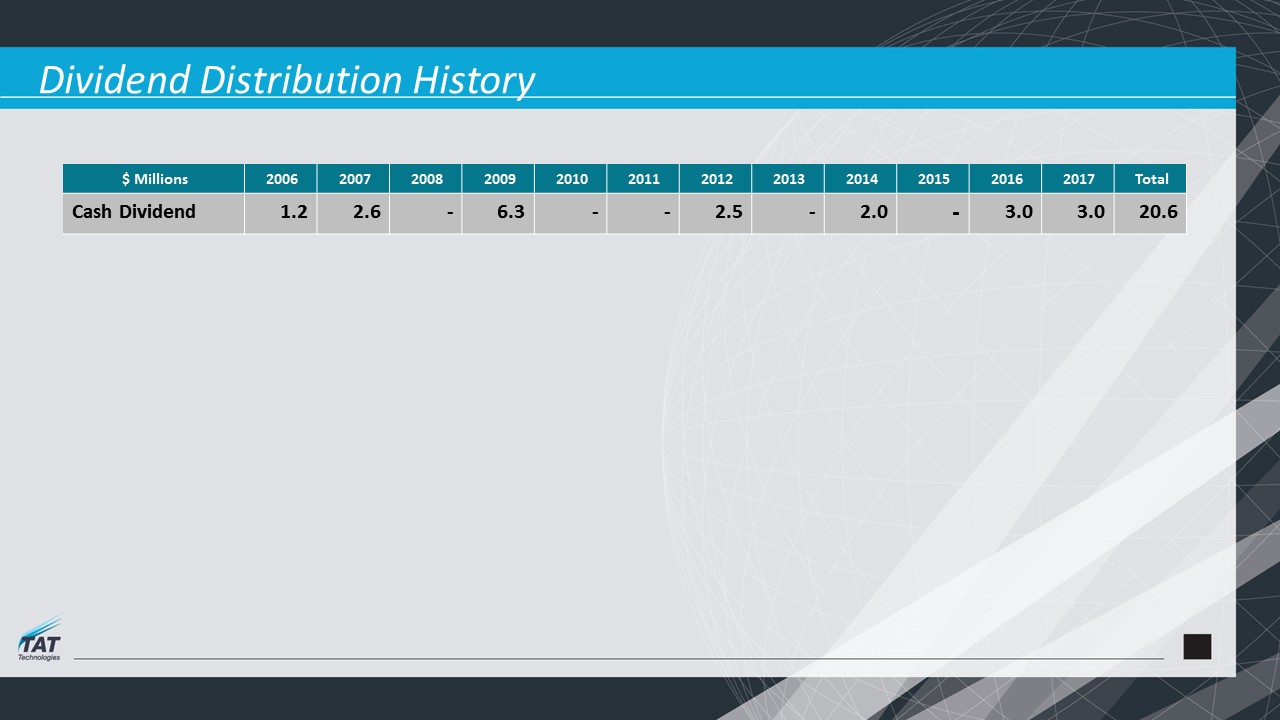
Dividend Distribution History Total 2017 2016 2015 2014 2013 2012 2011 2010 2009 2008 2007 2006 $ Millions 20.6 3.0 3.0 - 2.0 - 2.5 - - 6.3 - 2.6 1.2 Cash Dividend