PLAYING PEOPLE PERFORMANCE #1 CHOICE TO WIN MARTY KETELAAR Vice President, Investor Relations Navistar International Corporation Public

Navistar WELCOMES you to the 2019 Investor Day! Public

Final Logistics Emergency - Exit through any door, down the stairs and out Please silence all through the main entrance electronic devices. atrium doors or into stairwells. Restrooms - exit left doors, down the hallway, then on Refreshments are in the your right – look for a sign! back of the room. Public

Download the APP! Easy as 1, 2, 3! 1. Search your APP store for: – Navistar Investor Day 2019 2. To log in, enter: – Email: used to register – Password: the mobile phone number used to register (no spaces or special characters) 3. Useful Features Include: – Full Agenda – Speaker Bios – Submitting Questions – Downloading Presentations – Take session notes and email them to yourself! Public

Today’s Agenda Start End Marty Ketelaar 9:00 am 9:10 am Vice President, Investor Relations Troy Clarke 9:10 am 9:40 am Chairman, President & CEO Persio Lisboa 9:40 am 10:05 am Executive Vice President & COO 10:05 am 10:35 am Q&A / Break Friedrich Baumann 10:50 am 11:15 am President, Aftersales / Alliance Management Walter Borst 11:15 am 11:40 pm Executive Vice President & CFO 11:40 pm 12:15 pm Q&A Troy Clarke 12:15 pm 12:20 pm Chairman, President & CEO 12:20 pm Lunch / Informal Discussion with Leadership Team 1:00 pm Shuttles to O’Hare & Midway Airports Depart Public
Safe Harbor Statement and Other Cautionary Notes Information provided and statements contained in this presentation that are not purely historical are forward-looking statements within the meaning of Section 27A of the Securities Act of 1933, as amended ("Securities Act"), Section 21E of the Securities Exchange Act of 1934, as amended ("Exchange Act"), and the Private Securities Litigation Reform Act of 1995. Such forward-looking statements only speak as of the date of this presentation and the company assumes no obligation to update the information included in this presentation. Such forward-looking statements include information concerning our plans to increase EBITDA margin, our plans for market share growth through segmentation and lower product costs through increased modularization, our plans to build a new manufacturing plant and realize reduced logistics and manufacturing costs, our expectations from the TRATON alliance, our expectations for Aftersales revenue growth, our plans for de-levering the balance sheet and fully funding pension plans and other possible or assumed future results of operations, including further descriptions of our business strategy. These statements often include words such as believe, expect, anticipate, intend, plan, estimate, or similar expressions. These statements are not guarantees of performance or results and they involve risks, uncertainties, and assumptions. For a further description of these factors, see the risk factors set forth in our filings with the Securities and Exchange Commission, including our annual report on Form 10-K for the fiscal year ended October 31, 2018, which was filed on December 18, 2018. Although we believe that these forward-looking statements are based on reasonable assumptions, there are many factors that could affect our actual financial results or results of operations and could cause actual results to differ materially from those in the forward-looking statements. All future written and oral forward- looking statements by us or persons acting on our behalf are expressly qualified in their entirety by the cautionary statements contained or referred to above. Except for our ongoing obligations to disclose material information as required by the federal securities laws, we do not have any obligations or intention to release publicly any revisions to any forward-looking statements to reflect events or circumstances in the future or to reflect the occurrence of unanticipated events. The financial information herein contains audited and unaudited information and has been prepared by management in good faith and based on data currently available to the company. Certain non-GAAP measures are used in this presentation to assist the reader in understanding our core manufacturing business. We believe this information is useful and relevant to assess and measure the performance of our core manufacturing business as it illustrates manufacturing performance. It also excludes financial services and other items that may not be related to the core manufacturing business or underlying results. Management often uses this information to assess and measure the underlying performance of our operating segments. We have chosen to provide this supplemental information to investors, analysts, and other interested parties to enable them to perform additional analyses of operating results. The non-GAAP numbers are reconciled to the most appropriate GAAP number in the appendix of this presentation. Public
PLAYING PEOPLENAVISTARPERFORMANCE 4.0 #1 CHOICE TO WIN TROY CLARKE Chairman, President and CEO Navistar International Corporation Public

Insert video here Public

IT’S NOT ABOUT US IT’S ABOUT THEM Public

WHO WE ARE: Meet Today’s Navistar SHIFTING GEARS: Preparing for Tomorrow NAVISTAR 4.0: Achieving our Vision Public

TODAY’S Public
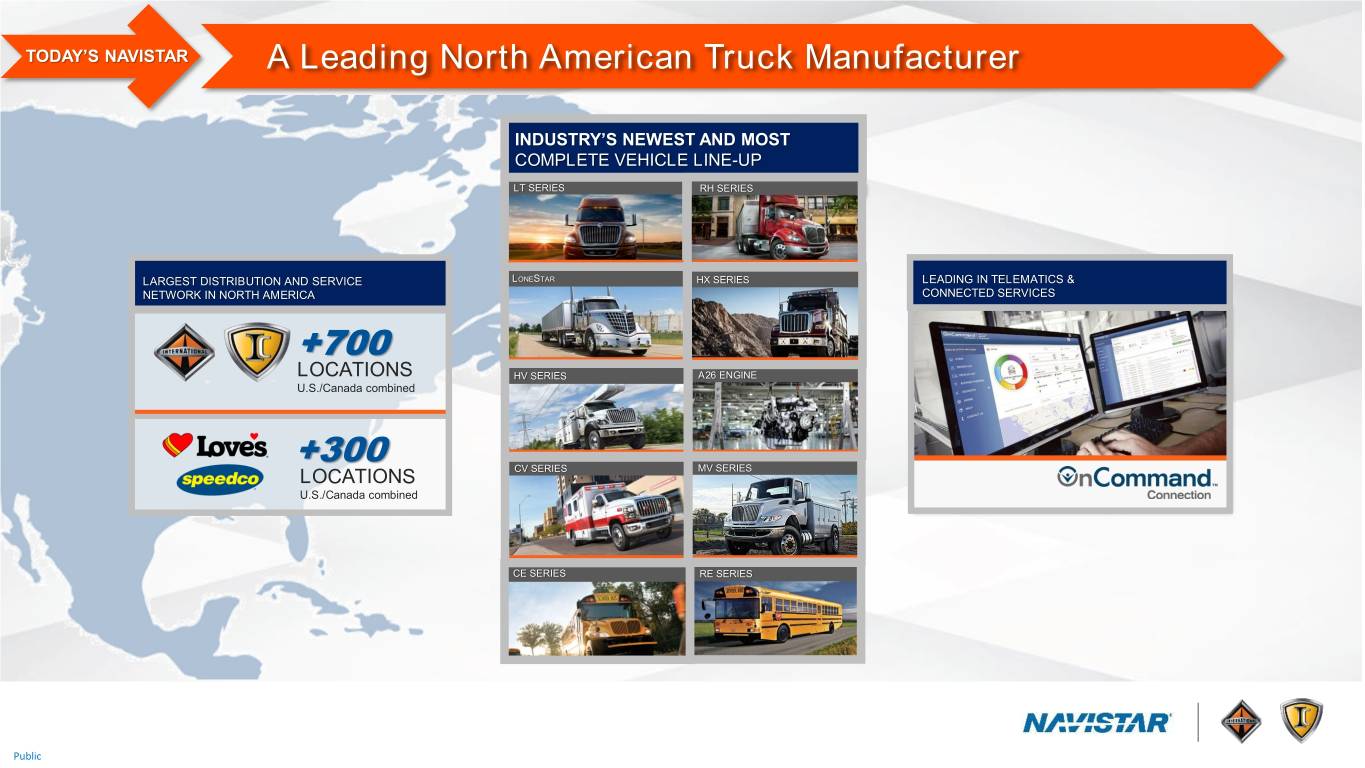
TODAY’S NAVISTAR A Leading North American Truck Manufacturer INDUSTRY’S NEWEST AND MOST COMPLETE VEHICLE LINE-UP LT SERIES RH SERIES LARGEST DISTRIBUTION AND SERVICE LONESTAR HX SERIES LEADING IN TELEMATICS & NETWORK IN NORTH AMERICA CONNECTED SERVICES +700 LOCATIONS HV SERIES A26 ENGINE U.S./Canada combined +300 LOCATIONS CV SERIES MV SERIES U.S./Canada combined CE SERIES RE SERIES Public

TODAY’S NAVISTAR Operational Footprint Reflects North American Focus World Headquarters Proving Grounds Lisle, IL New Carlisle, IN Bus Truck Manufacturing Manufacturing Tulsa, OK Springfield, OH Engine Manufacturing Engine Huntsville, AL Manufacturing Truck Sao Paulo, BR Manufacturing Escobedo, MX Public

TODAY’S NAVISTAR Serving a Diverse Customer Base Across Industries ON HIGHWAY SEVERE SERVICE MEDIUM DUTY LIGHT DUTY BUS • LT Series • HX Series • MV Series • CV Series • CE Series • RH Series • HV Series • RE Series • LoneStar • A26 Diesel • A26 Diesel Public

TODAY’S NAVISTAR Providing Transportation Solutions to Leading Fleets HEAVY MEDIUM SEVERE SERVICE Public
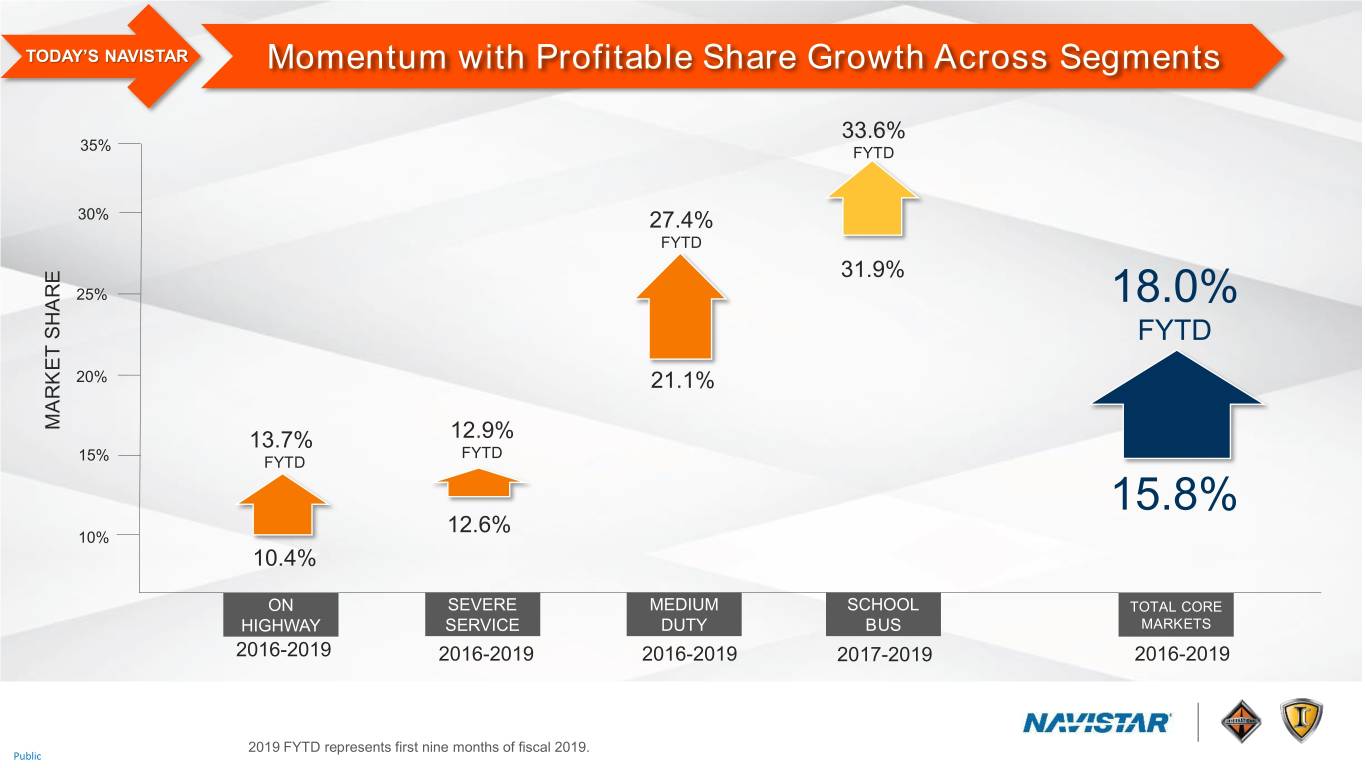
TODAY’S NAVISTAR Momentum with Profitable Share Growth Across Segments 33.6% 35% FYTD 30% 27.4% FYTD 31.9% 25% 18.0% FYTD 20% 21.1% MARKET SHARE MARKET 13.7% 12.9% FYTD 15% FYTD 15.8% 12.6% 10% 10.4% ON SEVERE MEDIUM SCHOOL TOTAL CORE HIGHWAY SERVICE DUTY BUS MARKETS 2016-2019 2016-2019 2016-2019 2017-2019 2016-2019 2019 FYTD represents first nine months of fiscal 2019. Public
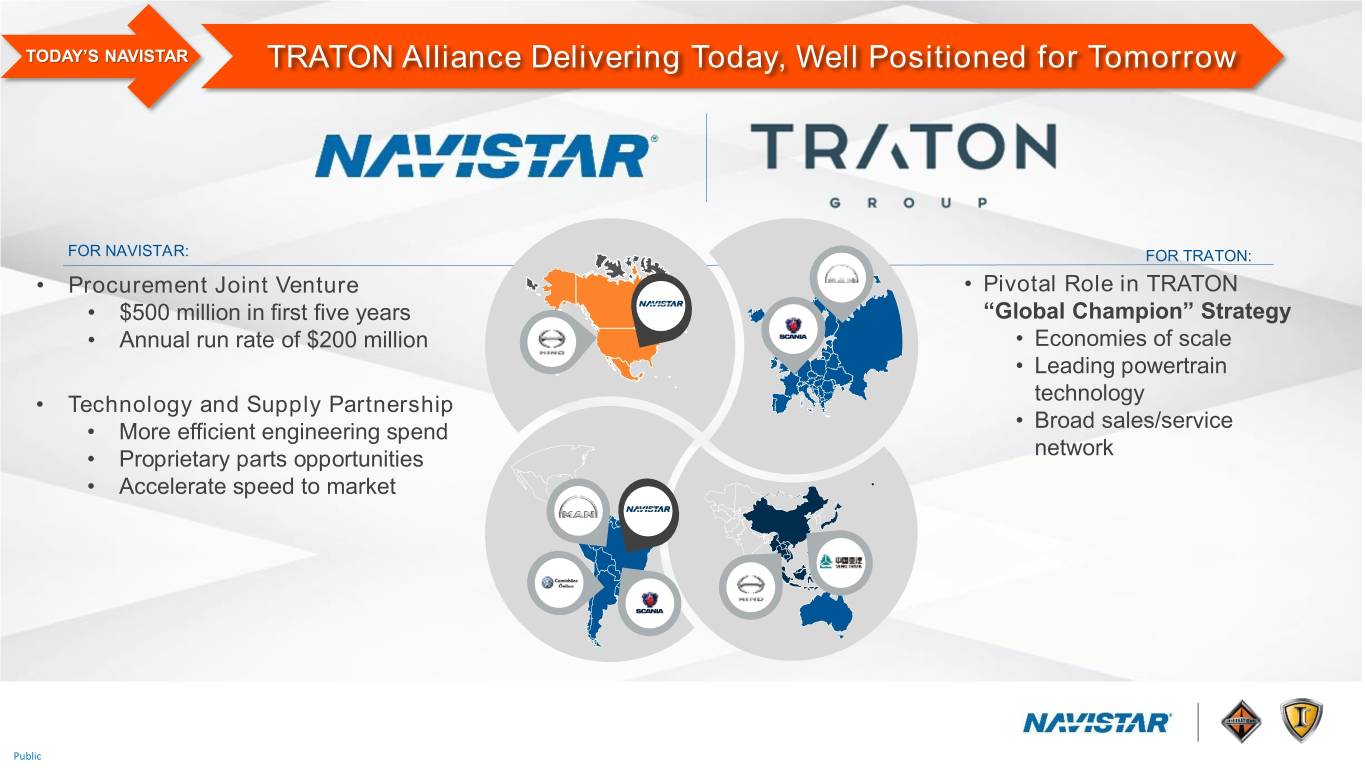
TODAY’S NAVISTAR TRATON Alliance Delivering Today, Well Positioned for Tomorrow FOR NAVISTAR: FOR TRATON: • Procurement Joint Venture • Pivotal Role in TRATON • $500 million in first five years “Global Champion” Strategy • Annual run rate of $200 million • Economies of scale • Leading powertrain technology • Technology and Supply Partnership • Broad sales/service • More efficient engineering spend network • Proprietary parts opportunities • Accelerate speed to market Public
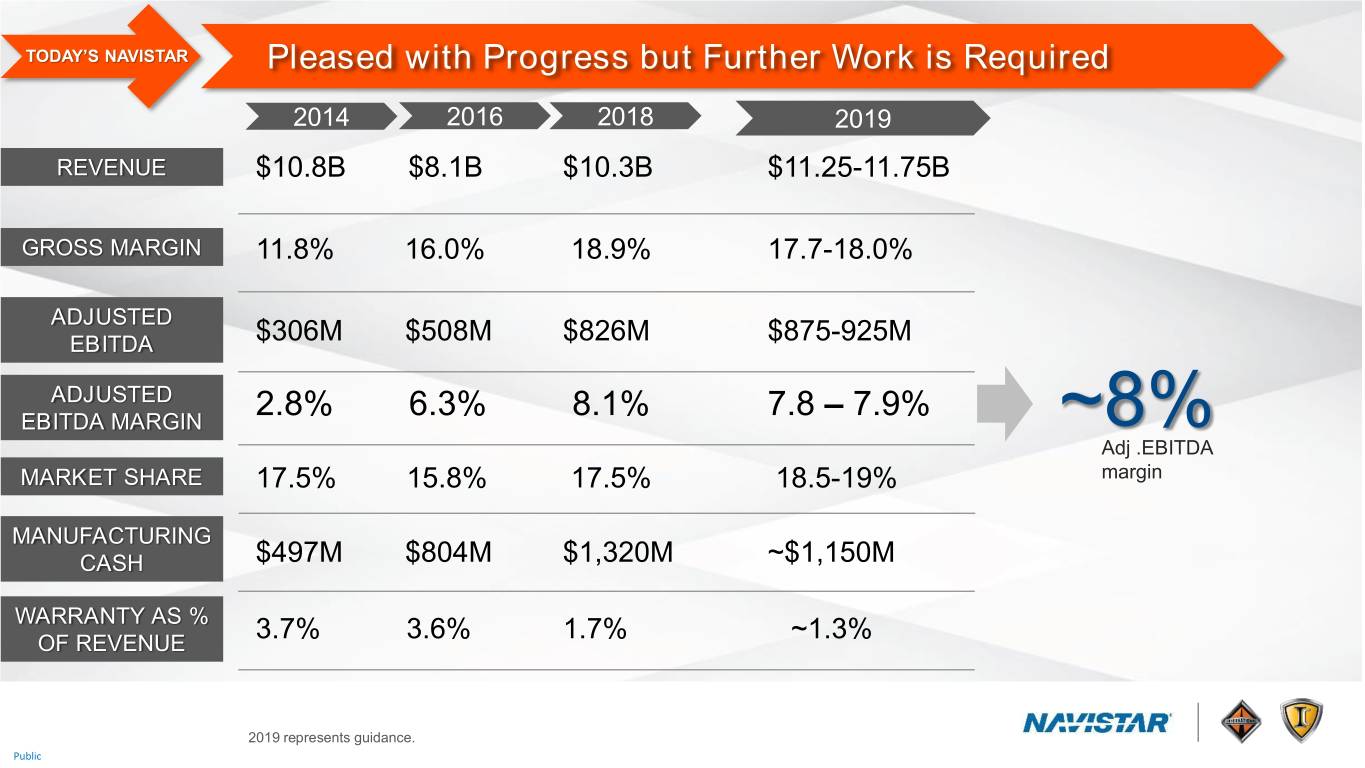
TODAY’S NAVISTAR Pleased with Progress but Further Work is Required 2014 2016 2018 2019 REVENUE $10.8B $8.1B $10.3B $11.25-11.75B GROSS MARGIN 11.8% 16.0% 18.9% 17.7-18.0% ADJUSTED EBITDA $306M $508M $826M $875-925M ADJUSTED 2.8% 6.3% 8.1% 7.8 – 7.9% EBITDA MARGIN ~8% Adj .EBITDA MARKET SHARE 17.5% 15.8% 17.5% 18.5-19% margin MANUFACTURING CASH $497M $804M $1,320M ~$1,150M WARRANTY AS % 3.7% 3.6% 1.7% ~1.3% OF REVENUE 2019 represents guidance. Public

2020-2022: SHIFTING GEARS, PREPARING FOR TOMORROW Public
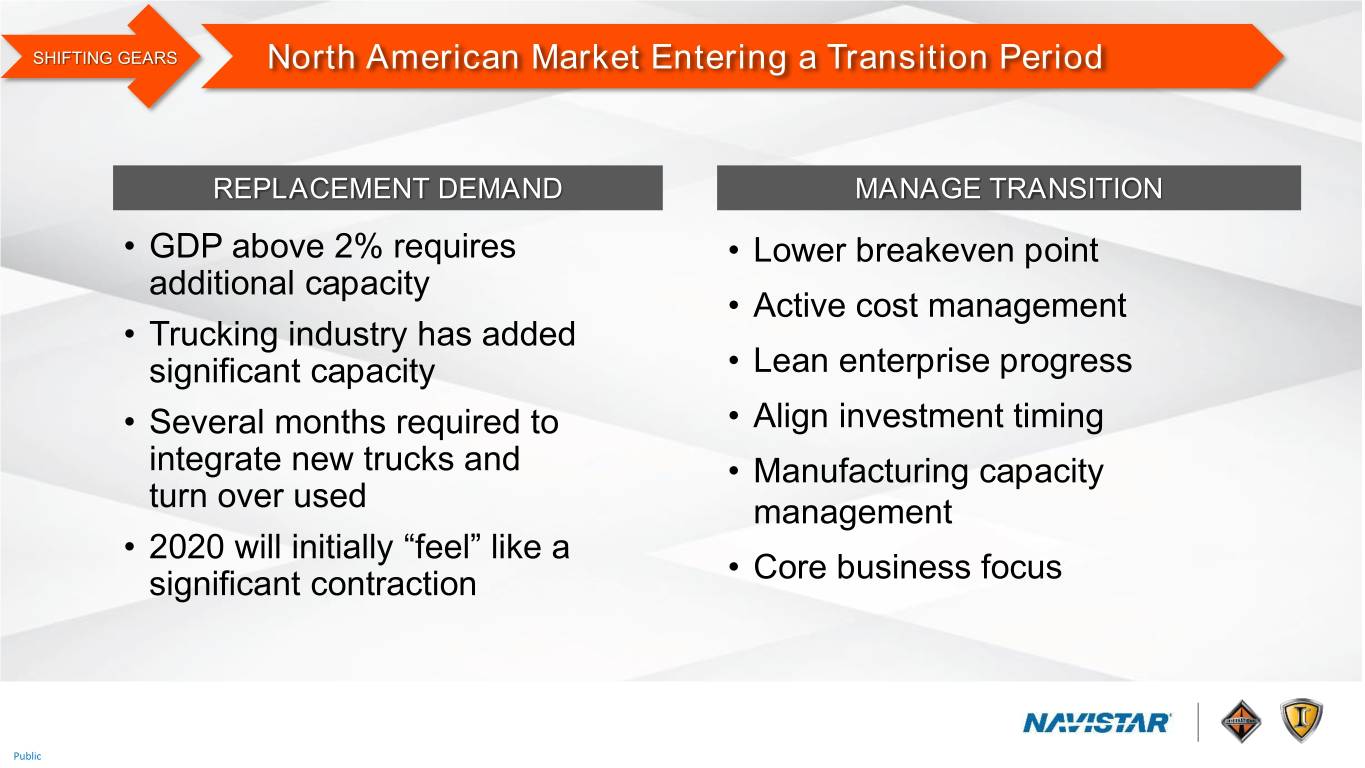
SHIFTING GEARS North American Market Entering a Transition Period REPLACEMENT DEMAND MANAGE TRANSITION • GDP above 2% requires • Lower breakeven point additional capacity • Active cost management • Trucking industry has added significant capacity • Lean enterprise progress • Several months required to • Align investment timing integrate new trucks and • Manufacturing capacity turn over used management • 2020 will initially “feel” like a significant contraction • Core business focus Public
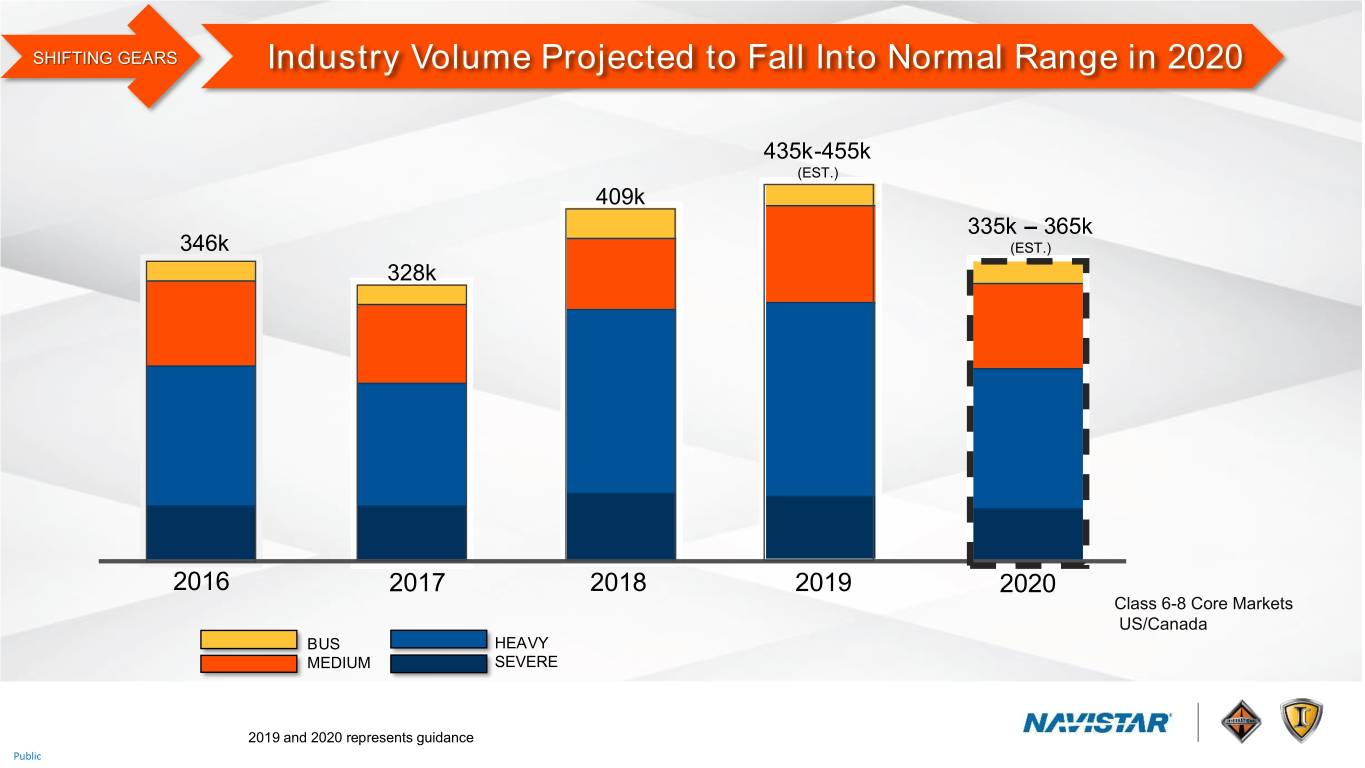
SHIFTING GEARS Industry Volume Projected to Fall Into Normal Range in 2020 435k-455k (EST.) 409k 335k – 365k 346k (EST.) 328k 2016 2017 2018 2019 2020 Class 6-8 Core Markets US/Canada BUS HEAVY MEDIUM SEVERE 2019 and 2020 represents guidance Public

SHIFTING GEARS Grow Share and Margin Through Industry Transition 2014 2016 2018 2019 2022 REVENUE $10.8B $8.1B $10.3B $11.25-11.75B $12B Revenue GROSS MARGIN 11.8% 16.0% 18.9% 17.7-18.0% ADJUSTED EBITDA $306M $508M $826M $875-925M Adjusted ADJUSTED 2.8% 6.3% 8.1% 7.8 – 7.9% EBITDA EBITDA MARGIN 10% Margin MARKET SHARE 17.5% 15.8% 17.5% 18.5-19% + 0.5-1% share points MANUFACTURING gained per year CASH $497M $804M $1,320M ~$1,150M WARRANTY AS % OF REVENUE 3.7% 3.6% 1.7% ~1.3% 2019 and 2022 represents guidance. Public

ACHIEVING OUR VISION: 4.0 Public

NAVISTAR 4.0 Macrotrends Impacting Economy and Culture URBANIZATION POPULATION CLIMATE CHANGE CONNECTEDNESS Public

NAVISTAR 4.0 These Macrotrends Inform Evolving Transportation Landscape 1 E-MOBILITY 2 AUTONOMOUS 3 CONNECTED Regulations and Digitalization and Broad use of digital and awareness of climate robotics enable connected applications change drive enhanced safety and means connectivity is alternative power total vehicle the new normal sources. automation Public
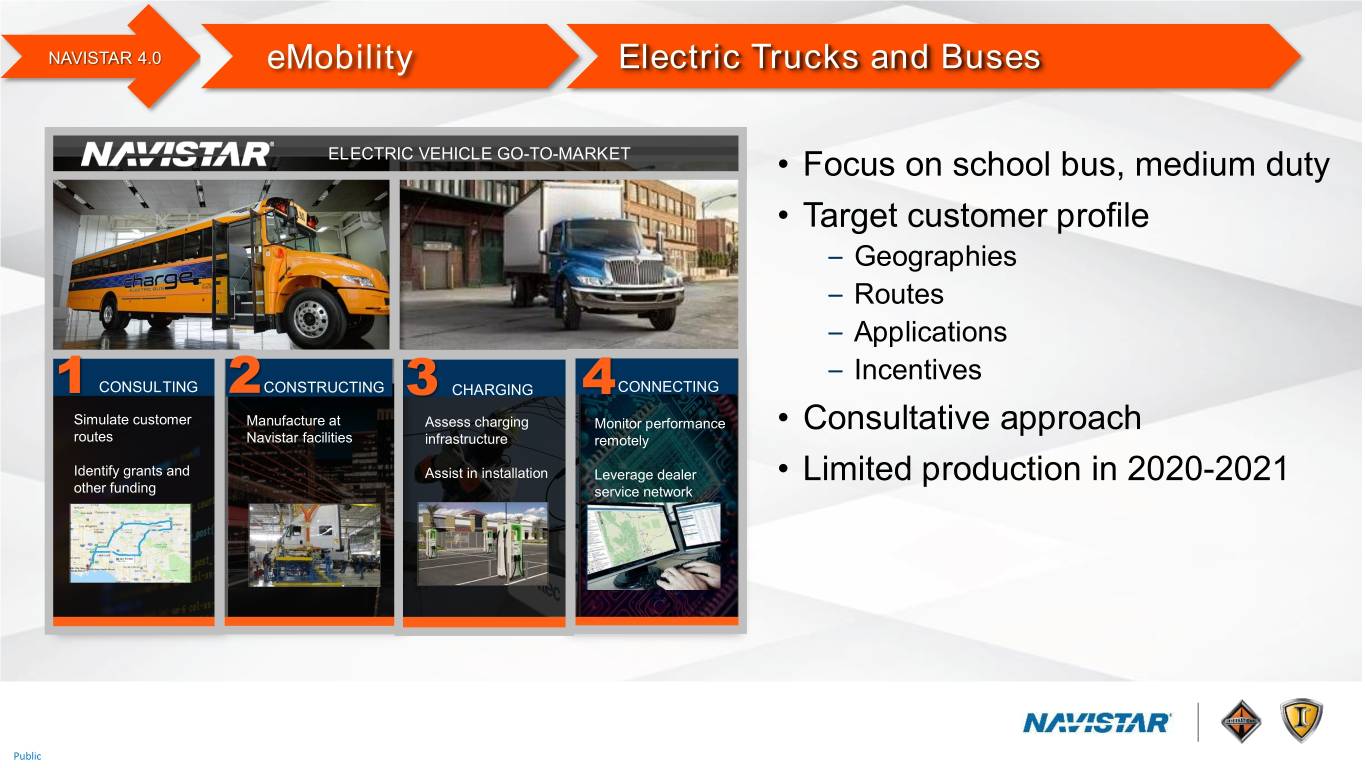
NAVISTAR 4.0 eMobility Electric Trucks and Buses ELECTRIC VEHICLE GO-TO-MARKET • Focus on school bus, medium duty • Target customer profile – Geographies – Routes – Applications – Incentives 1 CONSULTING 2CONSTRUCTING 3 CHARGING 4CONNECTING Simulate customer Manufacture at Assess charging Monitor performance • Consultative approach routes Navistar facilities infrastructure remotely Identify grants and Assist in installation Leverage dealer • Limited production in 2020-2021 other funding service network Public

NAVISTAR 4.0 Autonomous ADAS and Autonomous Trucks • Level 2 ADAS systems coming in 2020 • Fast follower approach • Trucks designed for efficient autonomous integration • Several test vehicles running with technology from leading start-ups Public
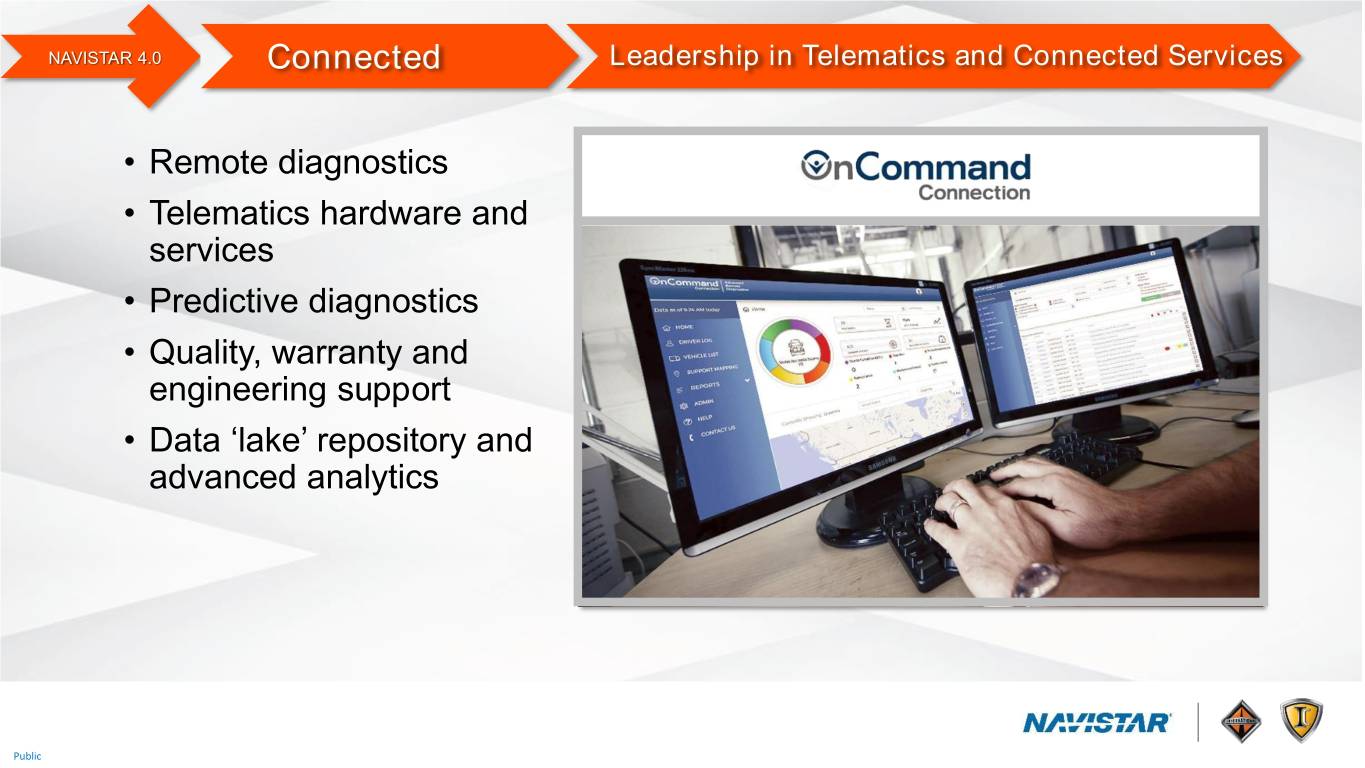
NAVISTAR 4.0 Connected Leadership in Telematics and Connected Services • Remote diagnostics • Telematics hardware and services • Predictive diagnostics • Quality, warranty and engineering support • Data ‘lake’ repository and advanced analytics Public

NAVISTAR 4.0 Connected Data Lake and Advanced Analytics EXTERNAL DATA INTERNAL DATA SALES AND MARKETING NAVISTAR DEVICE CUSTOMER ALL- PARTS AND SERVICE MAKES DATA 26+ WARRANTY CLAIMS TELEMATICS ENGINEERING PROVIDERS DATA LAKE PRODUCT DEVELOPMENT GEOSPATIAL PROCUREMENT WEATHER MANUFACTURING SUPPLY CHAIN MAPS GOVERNMENT IMPROVED EFFICIENCY AND CUSTOMER VALUE Public
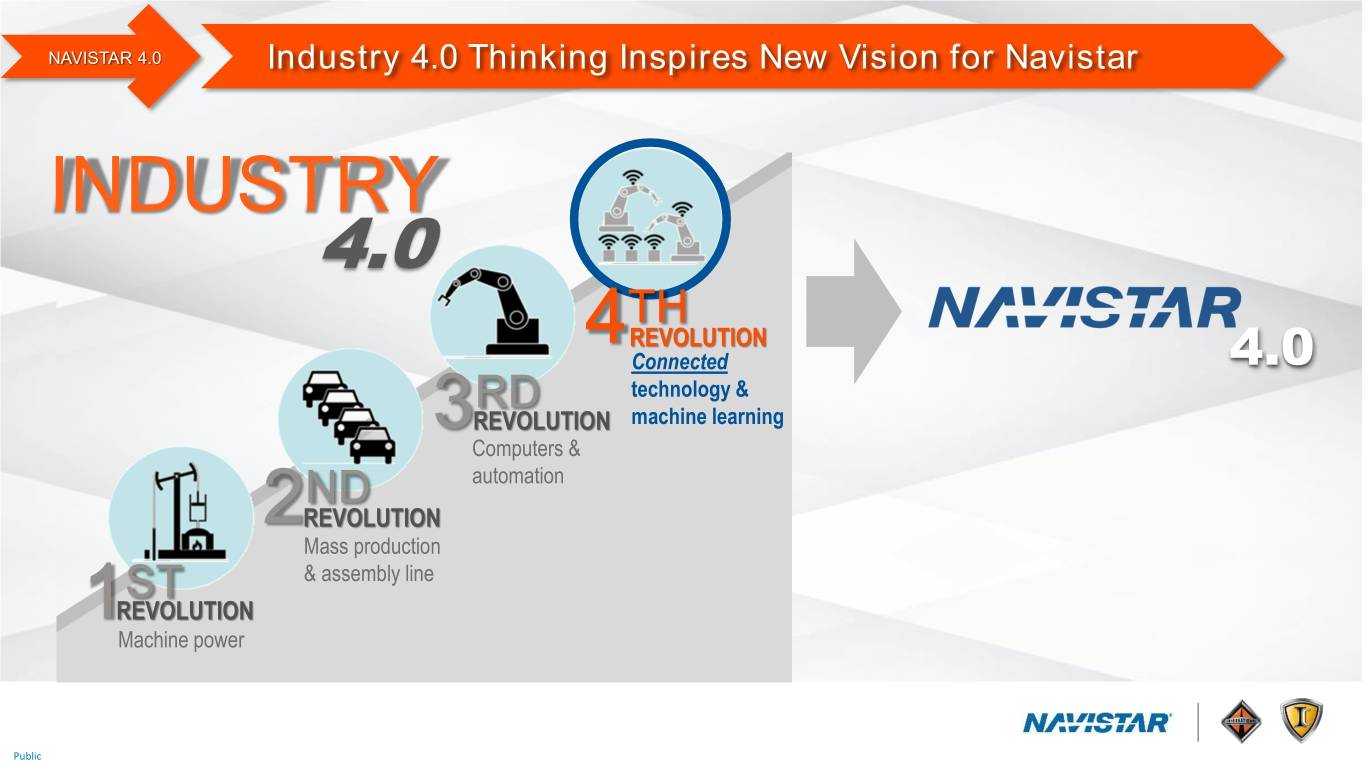
NAVISTAR 4.0 Industry 4.0 Thinking Inspires New Vision for Navistar INDUSTRY 4.0 TH 4REVOLUTION Connected 4.0 RD technology & 3REVOLUTION machine learning Computers & ND automation 2REVOLUTION Mass production ST & assembly line 1REVOLUTION Machine power Public

NAVISTAR 4.0 Navistar 4.0 Playing to Win Strategy PLAYING PEOPLE PERFORMANCE #1 CHOICE TO WIN Public

NAVISTAR 4.0 Navistar 4.0 Strategic Transformation Requires Focus • Building sustainable customer relationships • Closing any “gap” to competition PLAYING • Growing share of products and services TO • Strengthening the International brand WIN • Delivering superior shareholder return Public

NAVISTAR 4.0 Playing to Win Means The Best Team Wins • We choose to work in teams • Strong values and culture PEOPLE • Lean enterprise • Develop or recruit key leadership Public

NAVISTAR 4.0 Strong Senior Leadership Team New to Navistar New role since 2015 Persio Lisboa Walter Borst Curt Kramer Donna Dorsey Julie Ragland Chief Operating Officer Chief Financial Officer General Counsel Chief Human Resources Officer Chief Information Officer Phil Christman Michael Cancelliere Friedrich Baumann Samara Strycker George Letten Marty Ketelaar President, Operations President, Truck President, Aftersales and SVP, Corporate Controller VP, Strategy and Planning VP, Investor Relations Alliance Management. Bill McMenamin Joe Kory Tony Sutton Sajid Kunnummal Mark Hernandez Gary Horvat President, Navistar Financial SVP, Parts SVP, Global Product VP, Chief Procurement Officer SVP, Global Manufacturing VP, eMobility and Treasurer Development and Supply Chain Public

NAVISTAR 4.0 Creating a Sustainable Performance Advantage • Integrated Powertrains • Enterprise Platform Strategy PERFORMANCE • Advanced Modular Architecture • Integrated Manufacturing • Aftersales Acceleration Public
NAVISTAR 4.0 Customers See Us as the #1 Choice • Market Segmentation – Identify where to play – Determine how to win #1 CHOICE • Strengthening International brand – Listen-Understand-Deliver – Uptime/TCO leadership Public
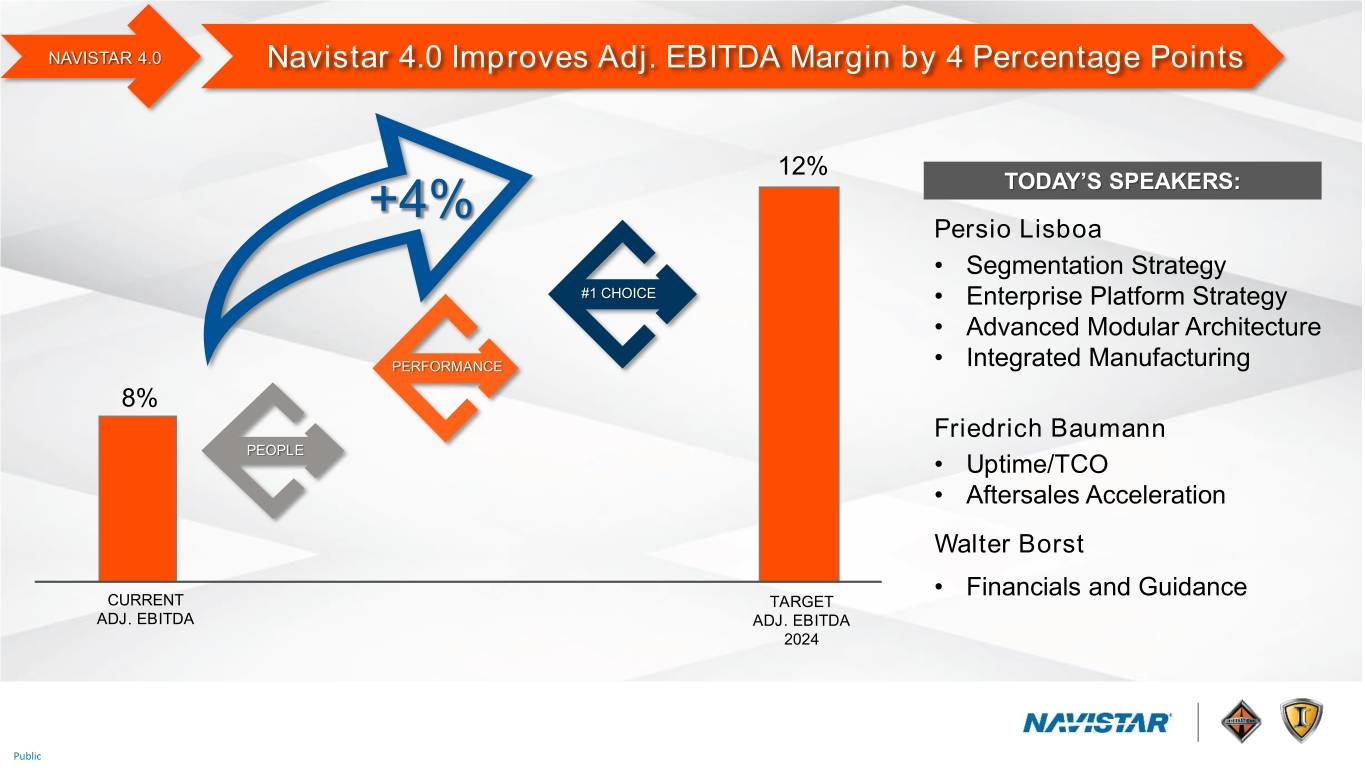
NAVISTAR 4.0 Navistar 4.0 Improves Adj. EBITDA Margin by 4 Percentage Points 12% +4% TODAY’S SPEAKERS: Persio Lisboa • Segmentation Strategy #1 CHOICE • Enterprise Platform Strategy • Advanced Modular Architecture PERFORMANCE • Integrated Manufacturing 8% Friedrich Baumann PEOPLE • Uptime/TCO • Aftersales Acceleration Walter Borst • Financials and Guidance CURRENT TARGET ADJ. EBITDA ADJ. EBITDA 2024 Public

NAVISTAR 4.0 Navistar 4.0: The Right Vision, The Right Strategy SITUATION STRATEGY SUCCESS Where we are today Playing to Win Navistar 4.0 • A leading North American • People • “The Best Team” truck manufacturer • Operating performance • Strong market position in • Performance advantage key segments • Leadership in key segments • New products driving • #1 Choice share growth – Segmentation strategy • Brand preference – Brand reputation • Largest aftersales network in North America • Adjusted EBITDA margin growth from 8% to 12% • Strategic alliance with TRATON Public

Public
PLAYING PEOPLE PERFORMANCE #1 CHOICE TO WIN PERSIO LISBOA Executive Vice President and Chief Operating Officer Navistar International Corporation Public
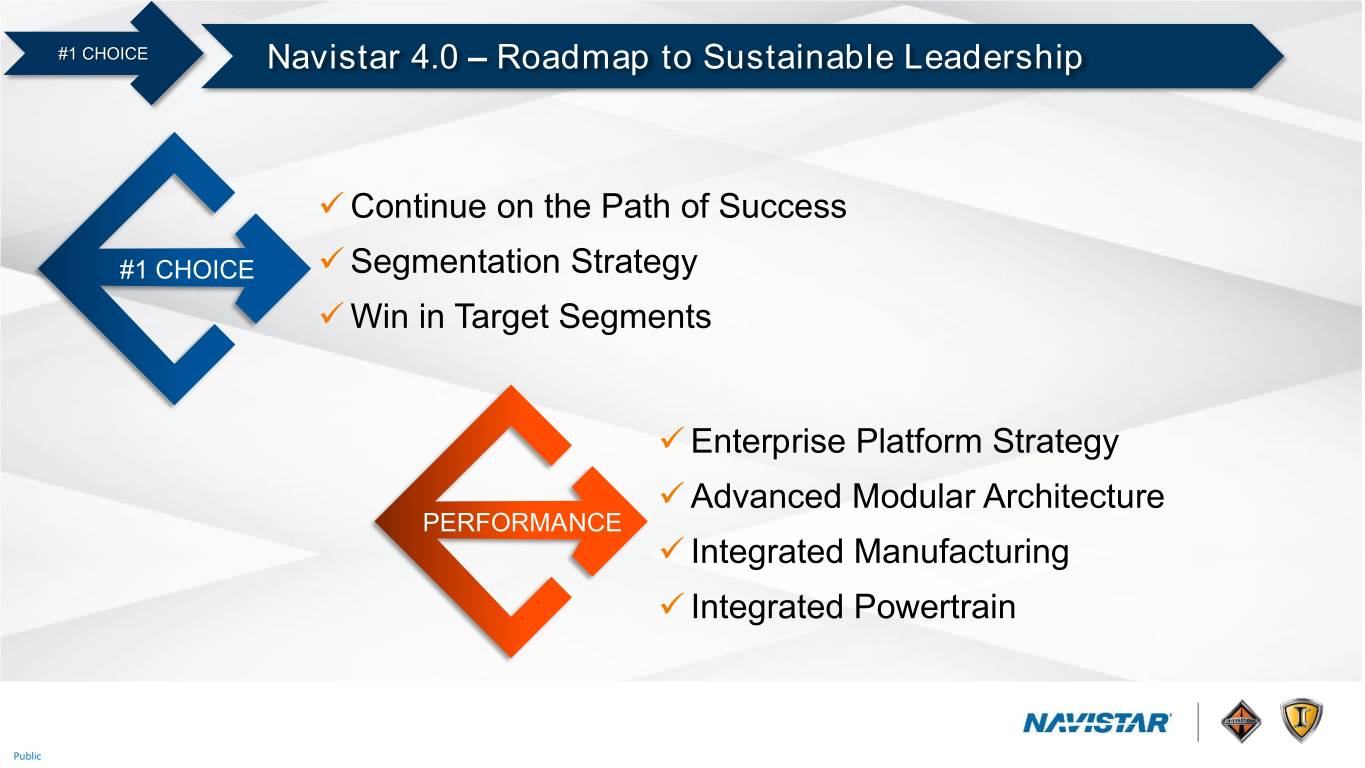
#1 CHOICE Navistar 4.0 – Roadmap to Sustainable Leadership ✓ Continue on the Path of Success #1 CHOICE ✓ Segmentation Strategy ✓ Win in Target Segments ✓ Enterprise Platform Strategy ✓ Advanced Modular Architecture PERFORMANCE ✓ Integrated Manufacturing ✓ Integrated Powertrain Public

#1 CHOICE Public
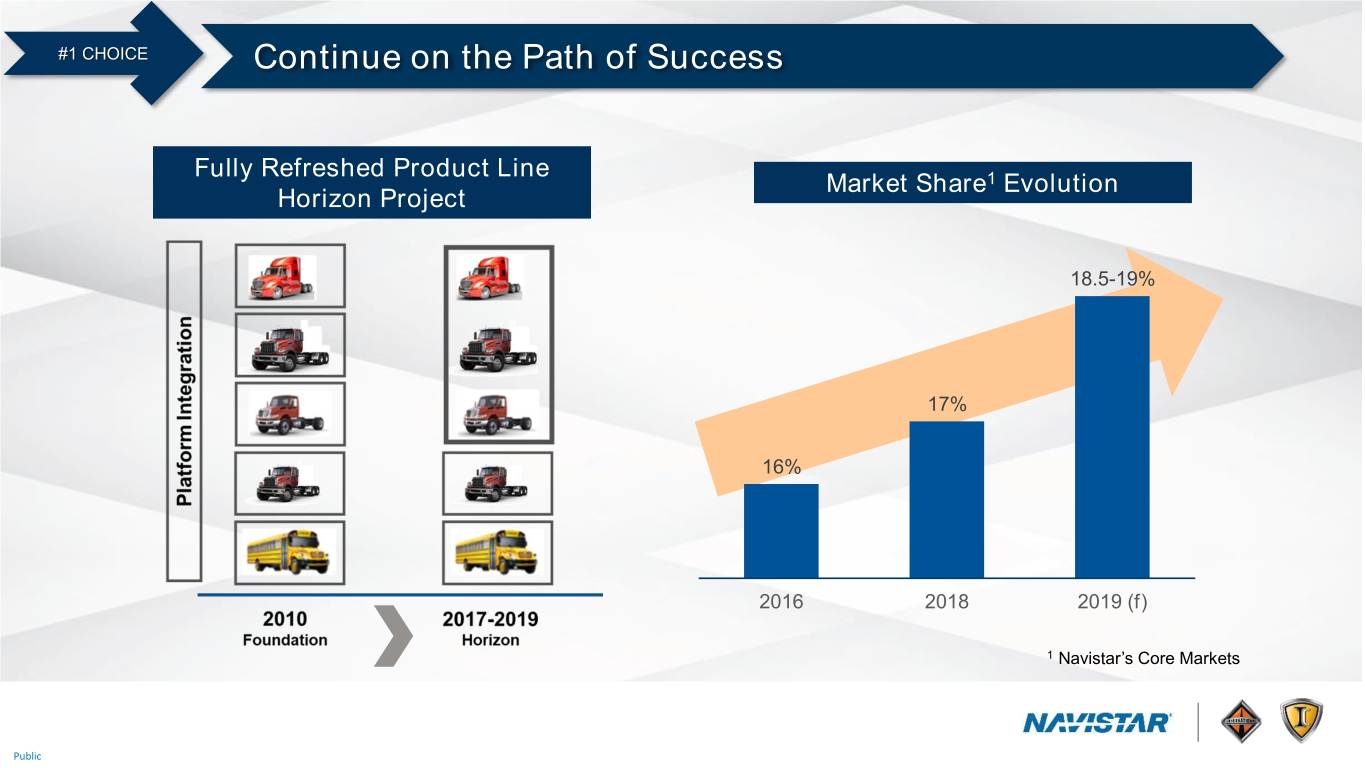
#1 CHOICE Continue on the Path of Success Fully Refreshed Product Line Market Share1 Evolution Horizon Project 18.5-19% 17% 16% 2016 2018 2019 (f) 1 Navistar’s Core Markets Public

#1 CHOICE Segmentation Strategy: Where to Play “Broad” Product Line Focus Customer Segment Based Public
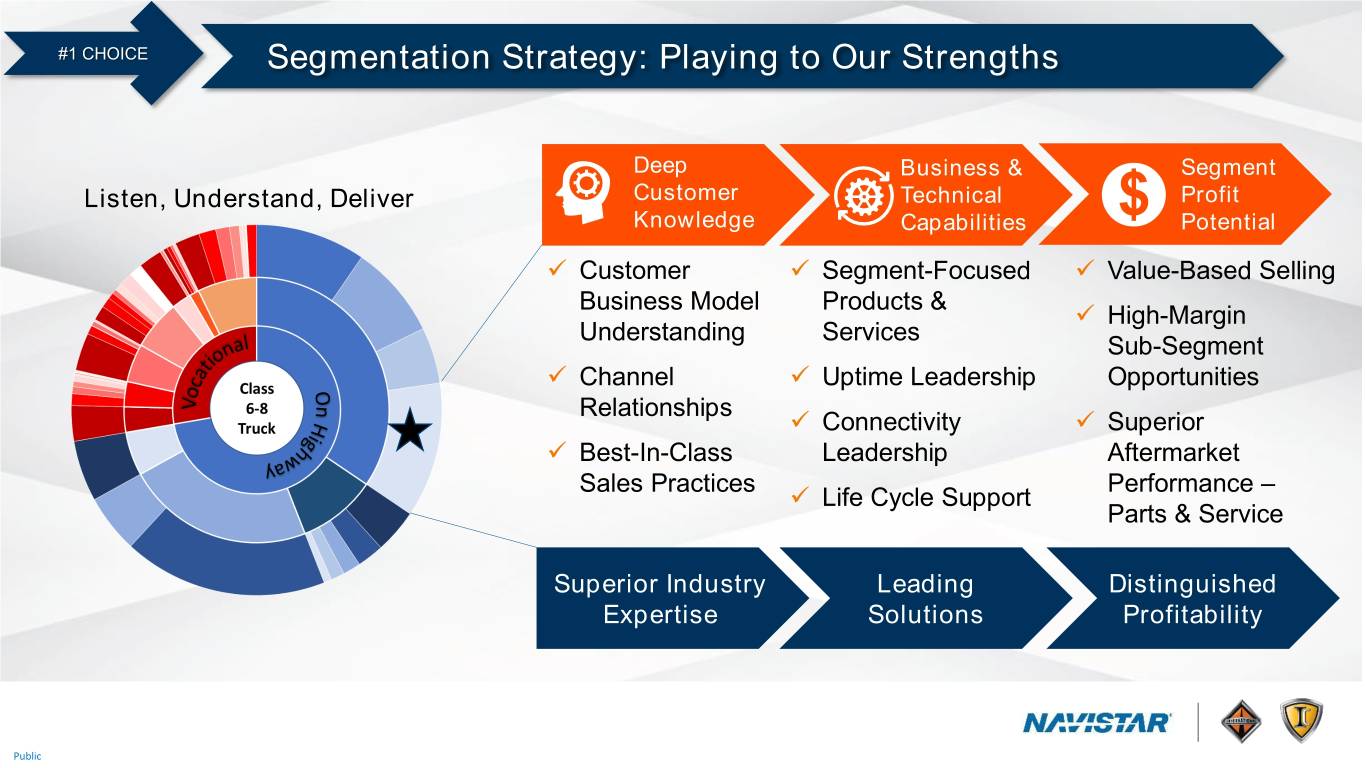
#1 CHOICE Segmentation Strategy: Playing to Our Strengths Deep Business & Segment Listen, Understand, Deliver Customer Technical Profit Knowledge Capabilities Potential ✓ Customer ✓ Segment-Focused ✓ Value-Based Selling Business Model Products & ✓ High-Margin Understanding Services Sub-Segment ✓ Channel ✓ Uptime Leadership Opportunities Relationships ✓ Connectivity ✓ Superior ✓ Best-In-Class Leadership Aftermarket Sales Practices Performance – ✓ Life Cycle Support Parts & Service Superior Industry Leading Distinguished Expertise Solutions Profitability Public

#1 CHOICE Segmentation Strategy: How We Win Listen, Understand, Deliver Customer Product Commercial Service Satisfaction Organization Investment Strategy Network Sales Tools Metrics Index Public

#1 CHOICE Business Unit Leaders Mark Stasell Trish Reed Chet Ciesielski Gary Horvat VP, Vocational Business Unit VP, Bus Business Unit VP, On Highway Business Unit VP, E-Mobility Public

PERFORMANCE Public
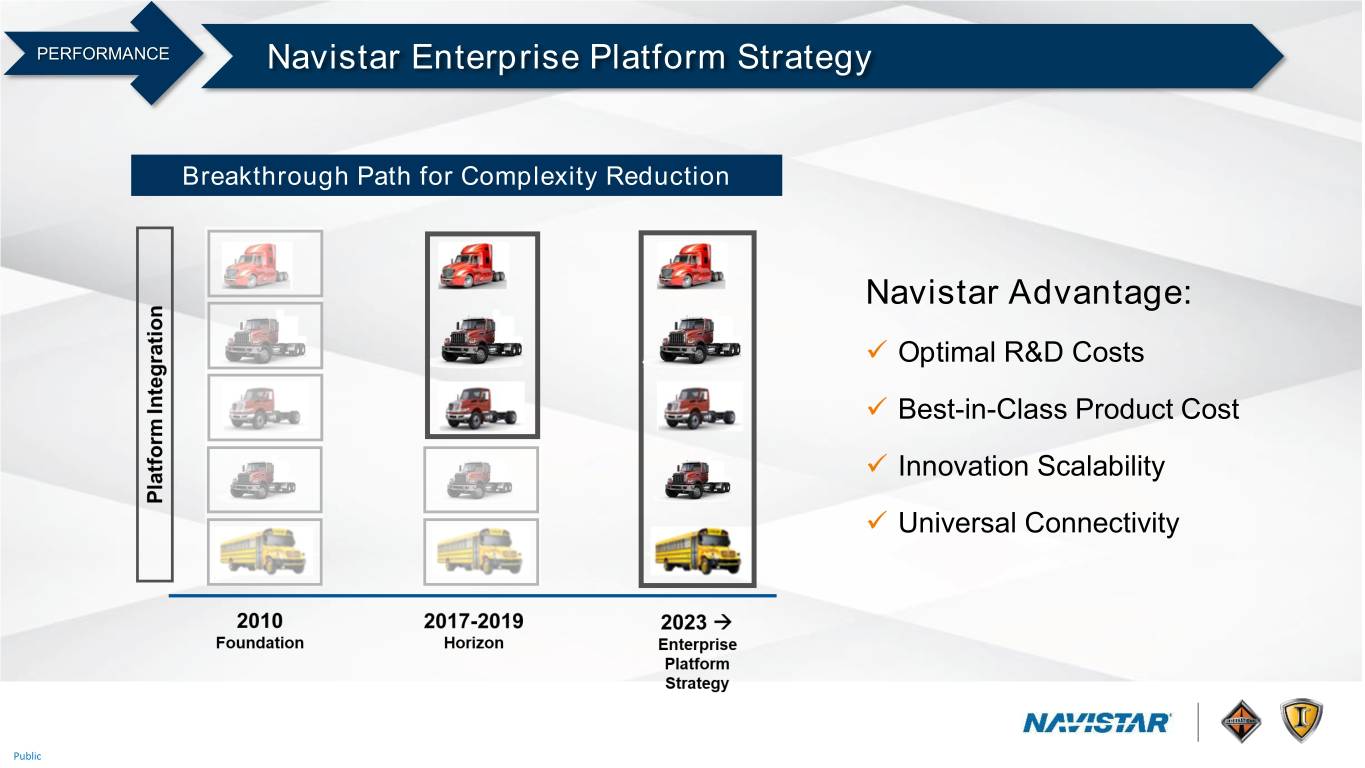
PERFORMANCE Navistar Enterprise Platform Strategy Breakthrough Path for Complexity Reduction Navistar Advantage: ✓ Optimal R&D Costs ✓ Best-in-Class Product Cost ✓ Innovation Scalability ✓ Universal Connectivity Public
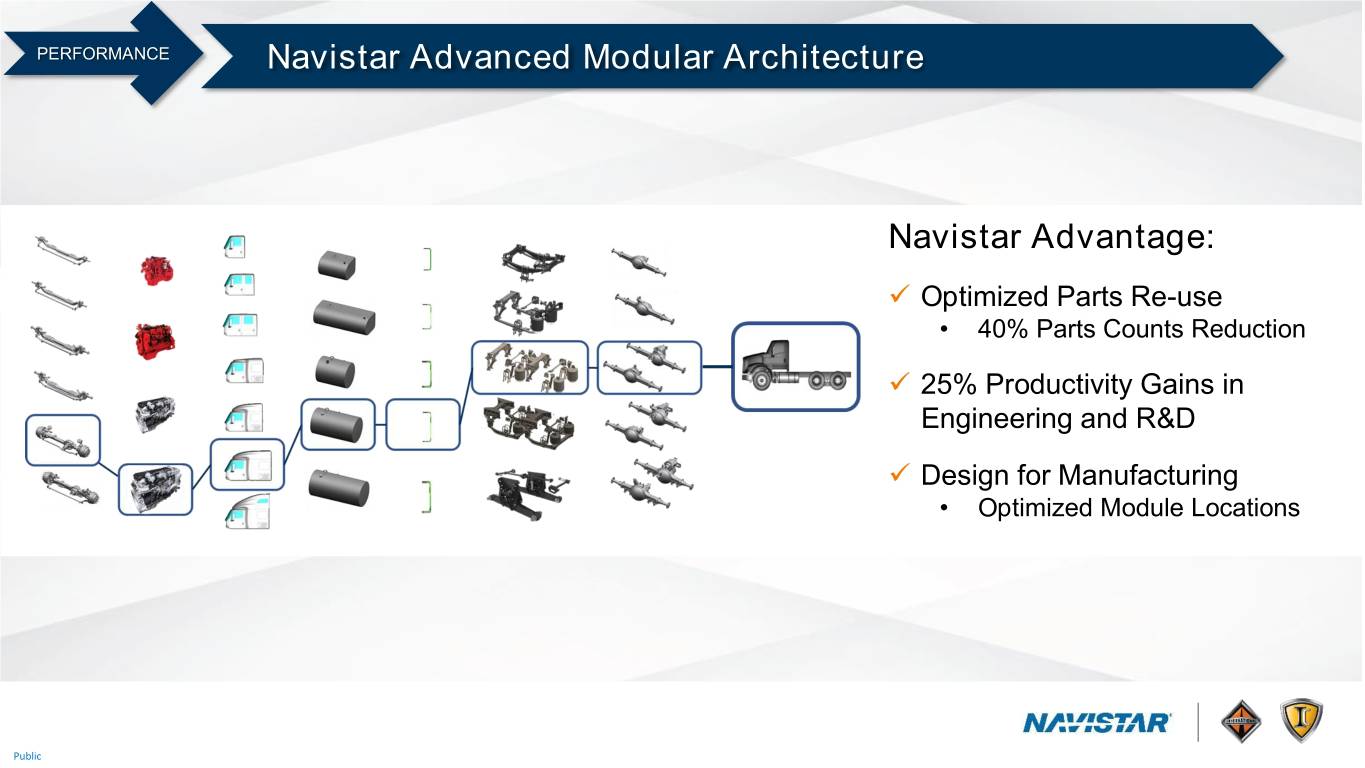
PERFORMANCE Navistar Advanced Modular Architecture Navistar Advantage: ✓ Optimized Parts Re-use • 40% Parts Counts Reduction ✓ 25% Productivity Gains in Engineering and R&D ✓ Design for Manufacturing • Optimized Module Locations Public

PERFORMANCE Enterprise Platform + Modular Architecture = Powerful Combination Functionality Navistar Advantage: ✓ Superior Availability of Custom Solutions • Permutation of Modules ✓ Faster to Market – 90% Pre- Engineered Solutions Prior to Order Complexity ✓ Breakout Quality & Reliability • Across All Platforms 2010 Horizon Enterprise Platform + Platforms Advanced Modular Architecture Public
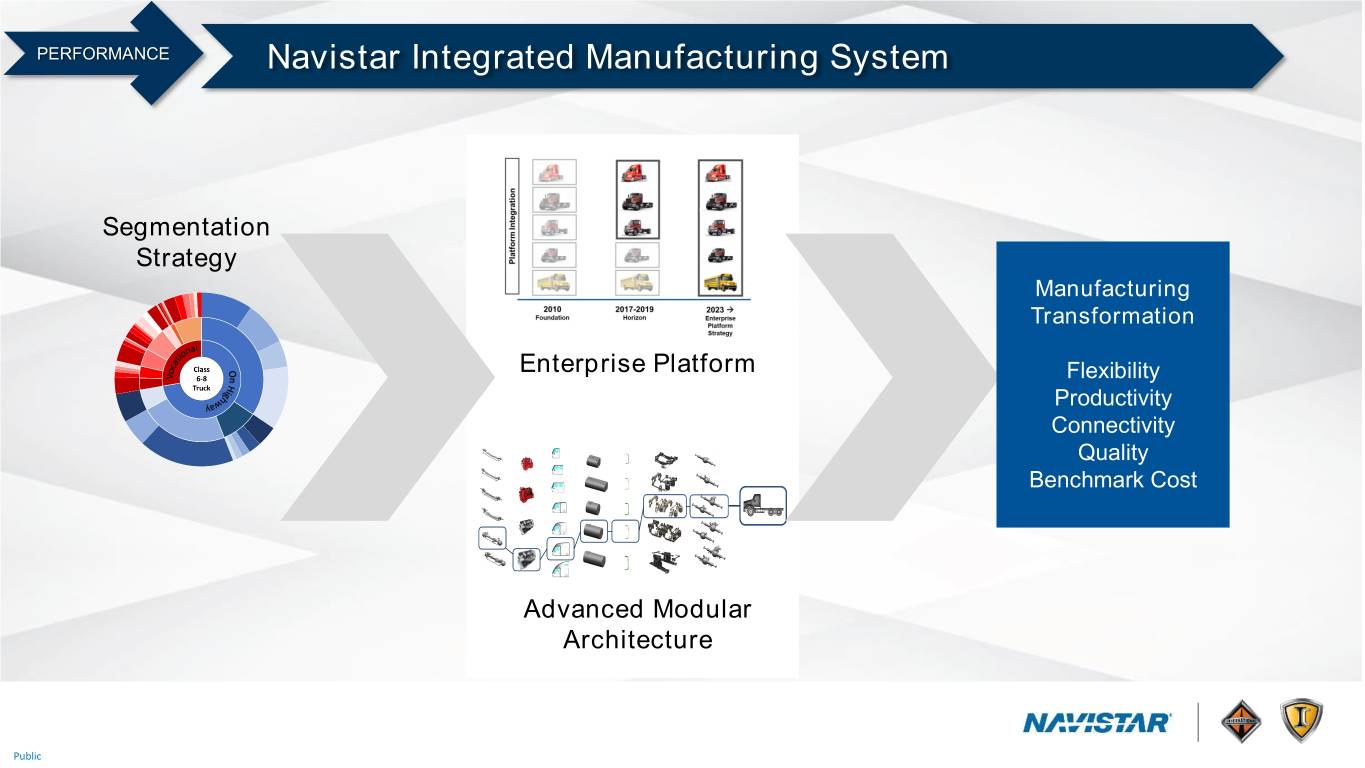
PERFORMANCE Navistar Integrated Manufacturing System Segmentation Strategy Manufacturing Transformation Enterprise Platform Flexibility Productivity Connectivity Quality Benchmark Cost Advanced Modular Architecture Public

PERFORMANCE Benchmark Manufacturing Network World Class New Truck Plant: ✓ Location: Texas ✓ Best-In-Class Lean Manufacturing ✓ Optimized Operations • HPU • Labor Costs ✓ Flexible - Enterprise Platform models Texas Assembly Plant Investment: >$250 Mil ✓ Industry 4.0 Ready Public
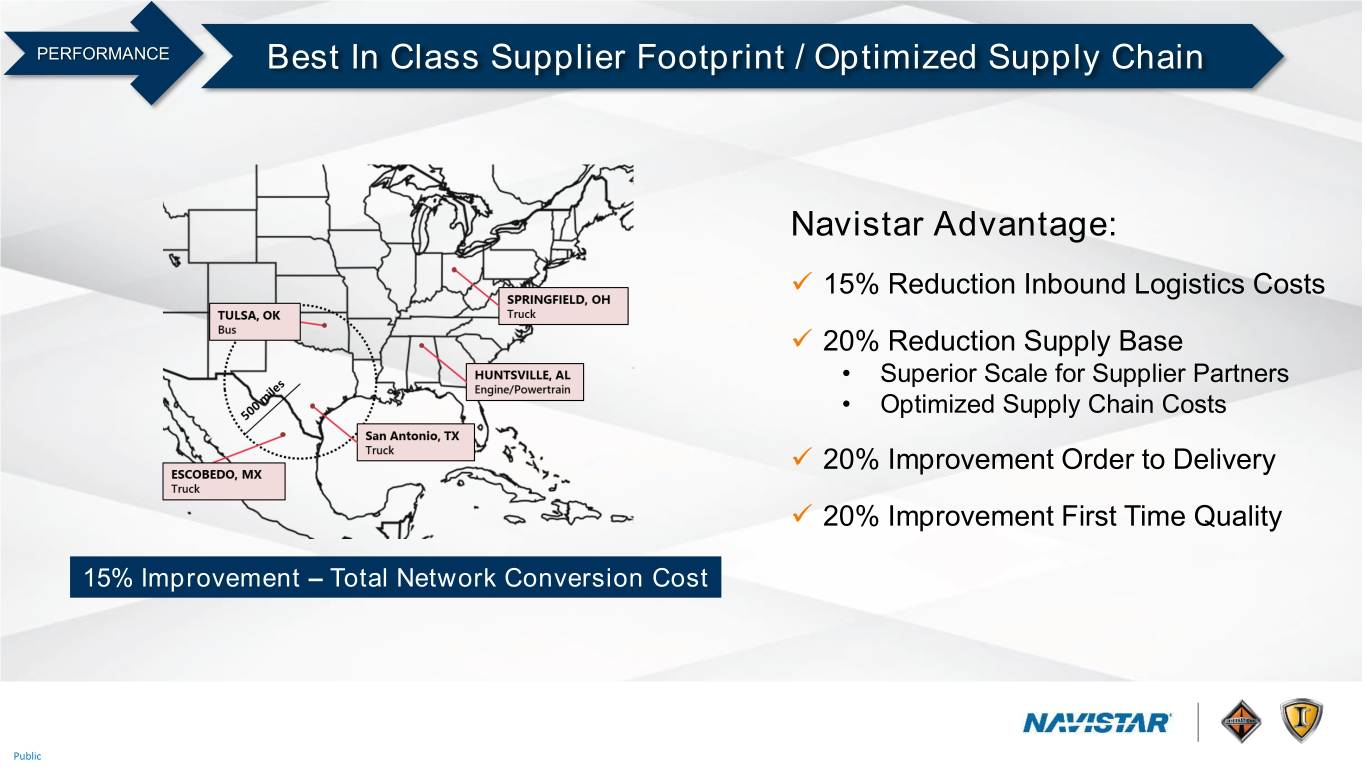
PERFORMANCE Best In Class Supplier Footprint / Optimized Supply Chain Navistar Advantage: ✓ 15% Reduction Inbound Logistics Costs ✓ 20% Reduction Supply Base • Superior Scale for Supplier Partners • Optimized Supply Chain Costs ✓ 20% Improvement Order to Delivery ✓ 20% Improvement First Time Quality 15% Improvement – Total Network Conversion Cost Public
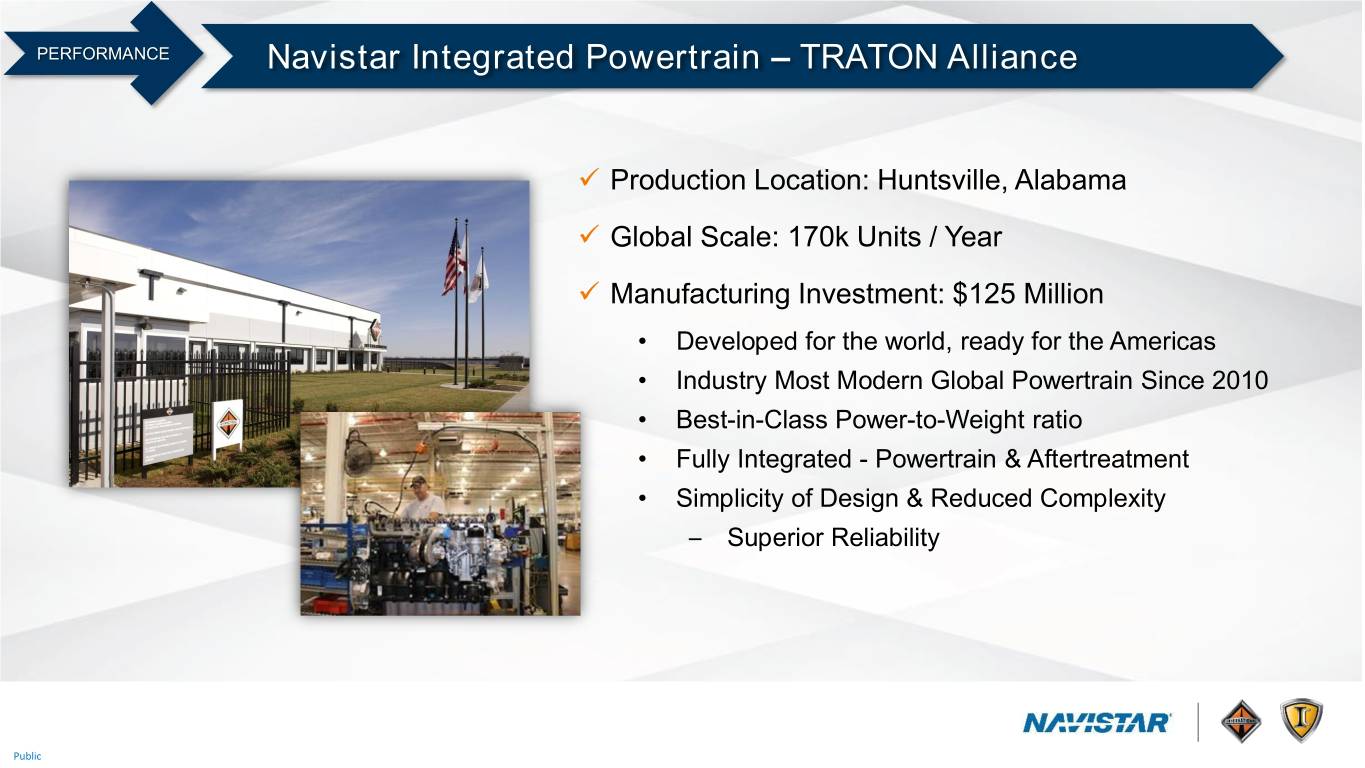
PERFORMANCE Navistar Integrated Powertrain – TRATON Alliance ✓ Production Location: Huntsville, Alabama ✓ Global Scale: 170k Units / Year ✓ Manufacturing Investment: $125 Million • Developed for the world, ready for the Americas • Industry Most Modern Global Powertrain Since 2010 • Best-in-Class Power-to-Weight ratio • Fully Integrated - Powertrain & Aftertreatment • Simplicity of Design & Reduced Complexity – Superior Reliability Public
Navistar 4.0 – Playing to Win Key Takeaways ✓ Solid Foundation ✓ Tracking Record ✓ Customer Centric Segmentation ✓ Market Share ✓ Enterprise Platform Strategy ✓ Breakthrough Scale ✓ Advanced Modular Architecture ✓ Superior Customer Value ✓ Integrated Powertrain ✓ Global Scale, Profitability and Parts ✓ Best-In-Class Lean Manufacturing ✓ Unmatched Quality, Cost and Delivery Public

PLAYING PEOPLE PERFORMANCE #1 CHOICE TO WIN QUESTION AND ANSWER Public

Public

PLAYING PEOPLE PERFORMANCE #1 CHOICE TO WIN FRIEDRICH BAUMANN September 19, 2019 Public

Vision 2025: The Customer at the Center of What We Do! Design will replace 2025 Poster Public
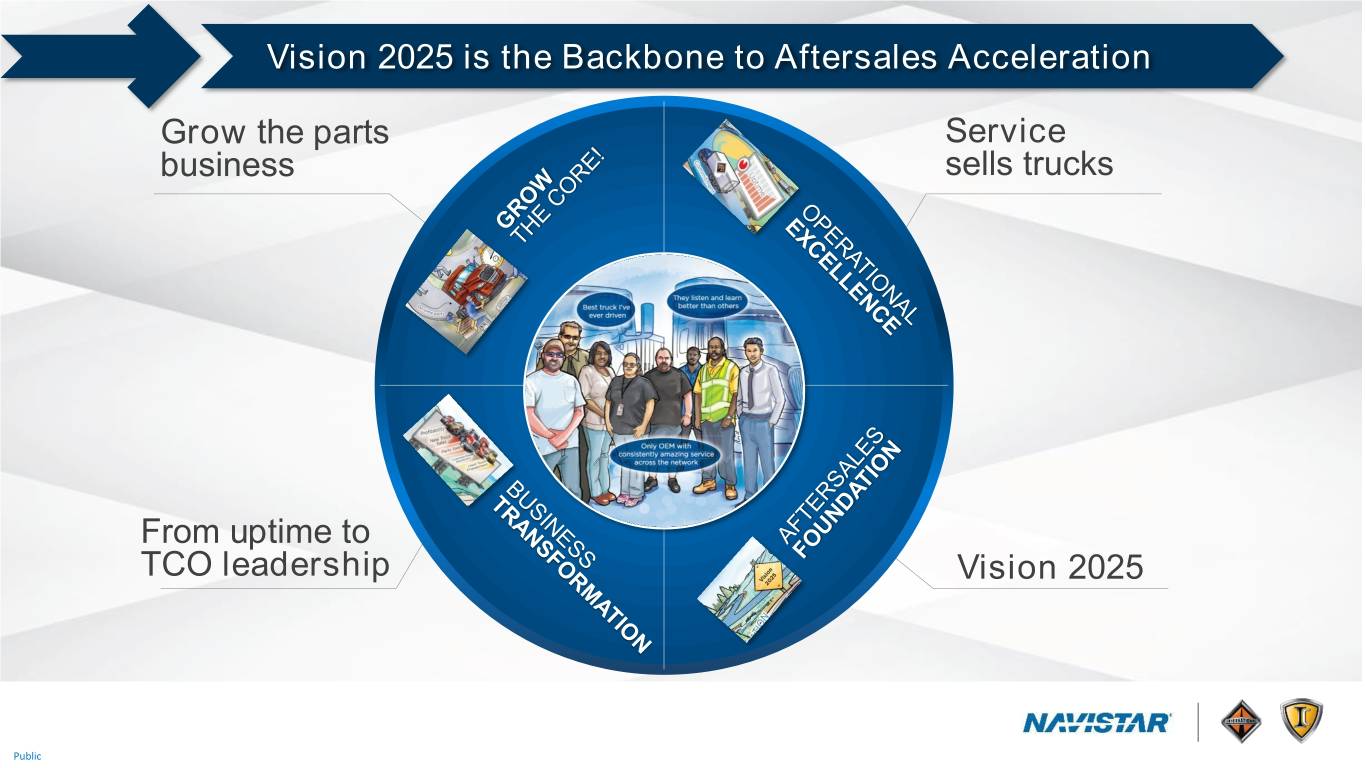
Vision 2025 is the Backbone to Aftersales Acceleration Grow the parts Service business sells trucks From uptime to TCO leadership Vision 2025 Public

Parts: Growth and New Initiatives Outpace the Runoff U.S. and Canada Parts Revenue • Revenue runoff impacted by vehicle age and current lack of proprietary engine mix Strategic Initiatives • “Organic” decline in revenue of more than $200M from Projected Runoff 2015 through 2018 • Parts initiatives designed to offset revenue decline and grow the total business 2015 2016 2017 2018 2019 2020 2025 Public

Parts: Organically Grow the Parts Business Commercial Acceleration Program (CAP) • Increase sales 4% to 6% • Increase dealer margins 2% to 3% Attribute Based Pricing • Pricing alignment and consistency Segmentation Strategy Support • Focus on key customers Public
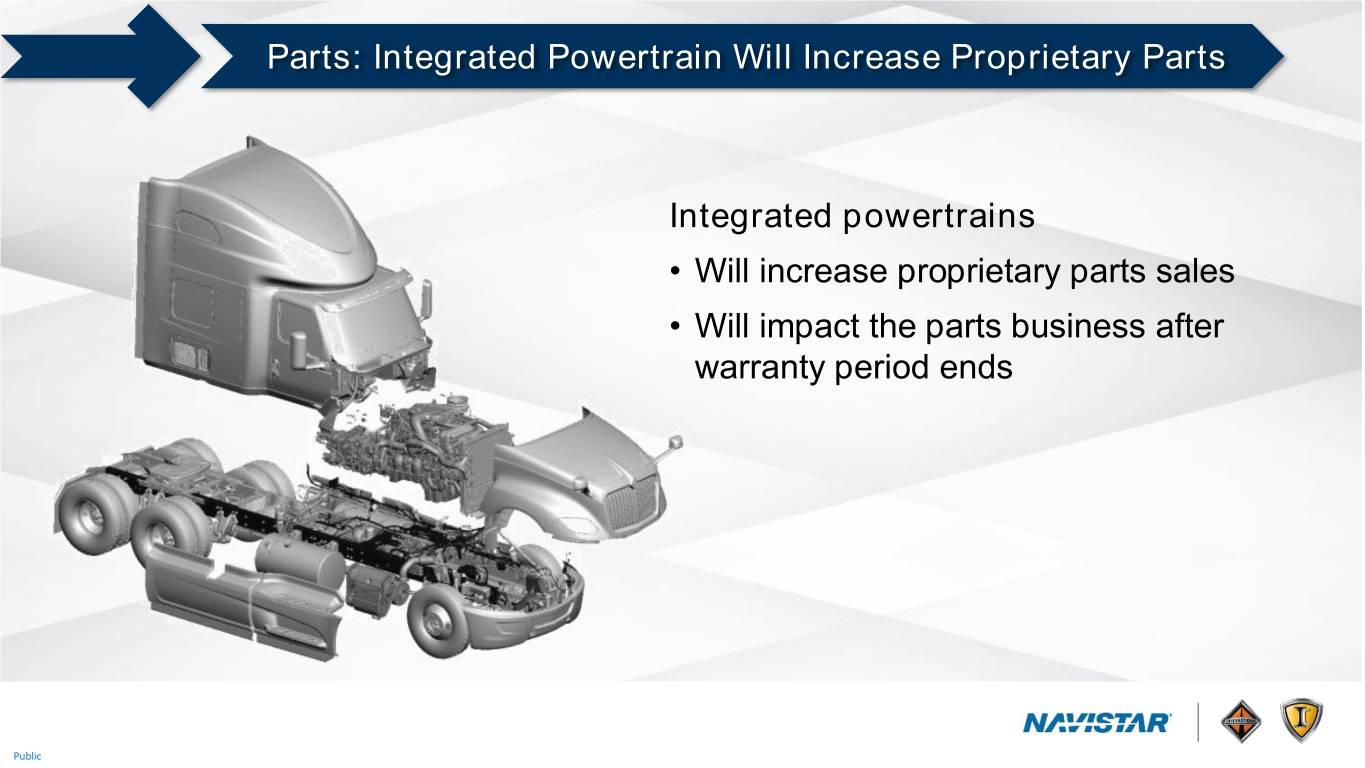
Parts: Integrated Powertrain Will Increase Proprietary Parts Integrated powertrains • Will increase proprietary parts sales • Will impact the parts business after warranty period ends Public
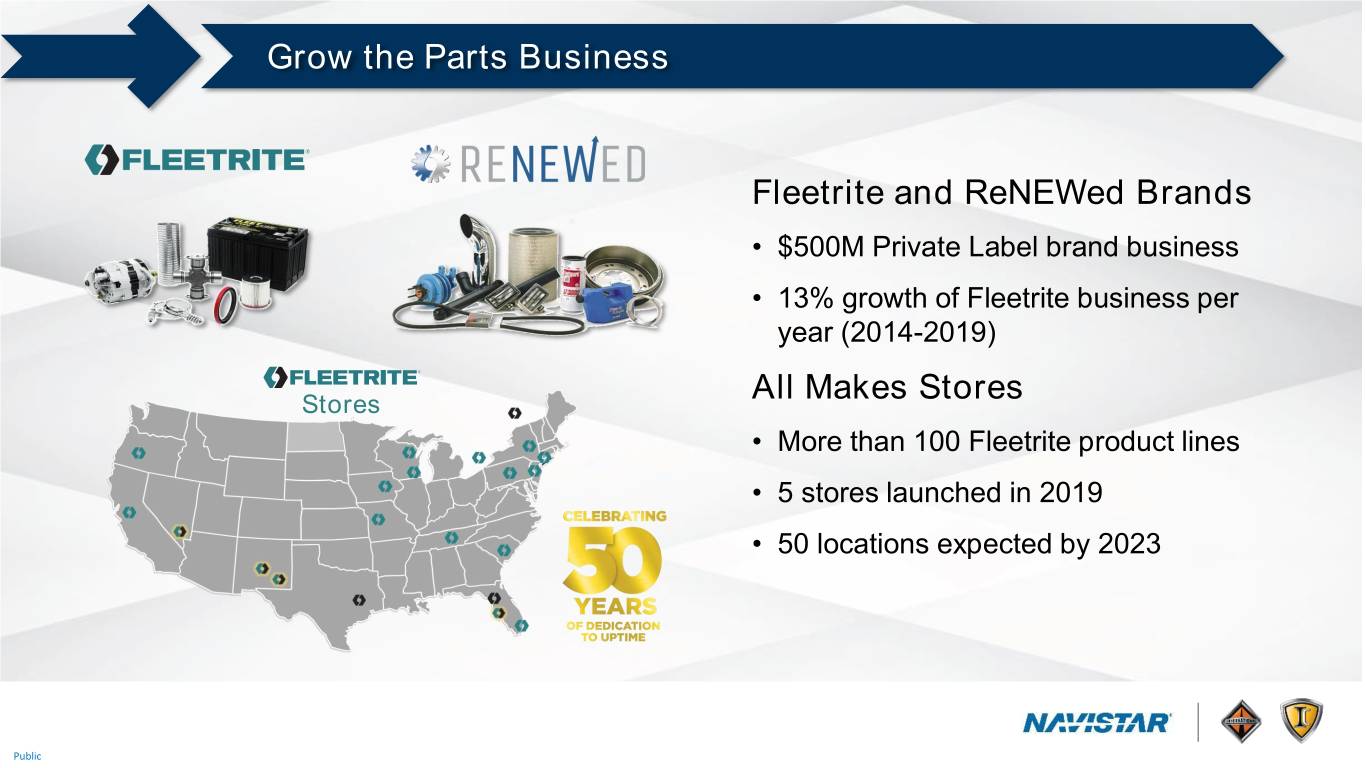
Grow the Parts Business Fleetrite and ReNEWed Brands • $500M Private Label brand business • 13% growth of Fleetrite business per year (2014-2019) Stores All Makes Stores • More than 100 Fleetrite product lines • 5 stores launched in 2019 • 50 locations expected by 2023 Public

Parts: RepairLink E-Commerce Addresses Ease of Doing Business • 2020 Dealer adoption to exceed 90% • Active customers to exceed 15,000 by 2022 • Complete coverage of parts catalog • Expected incremental revenue of $100M by 2022 Public

Parts: Improve Distribution Speed by Adding New PDCs • Next day delivery to 95% of dealer locations • Industry leading cutoff times • Support 80% in 24 hours service target Navistar’s PDCs Navistar’s New PDC Public

Parts: Predictive Stocking Transforming the Business Conventional Demand Driven Way Reactive • Leading example of digitalization in Aftersales business Predictive • 75%+ of the SKU/PDC Historical OCC Parts Stocking Vehicle combination have seen demand Demand Data Pings Sources • Fill rates on campaigns improved to 99% Public

Service: Navistar and Love’s Create Industry’s Largest Service Network • Additional 300+ service locations to the 700+ dealers • 7,500 service bays and 8,500 techs • Love service centers open 24/7 • Explore opportunities to expand relationship Public

Service: Lead Industry in Uptime 24 Hour Repair Velocity • Navistar is the industry leader for 24 hour Repair Velocity • Key Uptime Initiatives: – Memphis PDC – Predictive Stocking – Love’s Partnership – Lean Dealer Operations – “One View” Platform 2018 Q1 2019 Q1 2019 Q3 Public

Service: Creating New Level of Service Transparency • Integrated network communications solution • Realtime transparency for “Project customers, dealers and OneView” Navistar • Industry leading service experience – easy and simple Public

Warranty: Best In Class Warranty Exposure Navistar Warranty Expense As a % of Manufacturing Revenue • 83% improvement in 10% warranty exposure from 83% Improvement 2012 to 2019 • Significant product quality enhancements 5% • Warranty system upgrades 0% 2013 2016 2019 Public

TCO: Moving From Uptime to TCO Leader Acquisition Cost Uptime/Repair (Pricing) & Maintenance Fuel Efficiency Residual Value Public

Aftersales Acceleration PLAYING PEOPLE PERFORMANCE #1 CHOICE TOWIN Grow the Parts Business Service Sells Trucks Leader in Total Cost of Ownership Public
PLAYING PEOPLE PERFORMANCE #1 CHOICE TO WIN WALTER BORST Executive Vice President and CFO Navistar International Corporation Public

Agenda Past Future Near-Term Balance Sheet Public

Past Accomplishments on Our Journey Increase shareholder value Improve credit ratings #1 De-lever balance sheet Choice Generate free cash flow Return to profitability Lower breakeven point Growth Grow margins Increase market share Form alliances / partnerships Transition Renew product portfolio Focus on core business Public

Past Financial Breakthrough Revenue Net Income Manufacturing Free $500 Cash Flow $12,500 $11,250 - $400 $11,750 $340 $10,250 $307 $10,000 $250 $8,570 $8,111 $200 $7,500 $0 $5,000 $30 ($99) $0 ($138) ($250) $2,500 ($278) ($97) ($184) $0 ($200) ($500) 2016 2017 2018 2019 2015 2016 2017 2018 2015 2016 2017 2018 (Dollars in millions) 2019 reflects financial guidance. Public Note: This slide contains non-GAAP information; please see the REG G in appendix for a detailed reconciliation.

Past Strong EBITDA Performance Consolidated Adjusted EBITDA $875 - $950 $925 $826 $775 $582 $600 $508 $494 $425 $306 $250 $102 $75 2012 2013 2014 2015 2016 2017 2018 2019 $(100) ($91) (Dollars in millions) 2019 reflects financial guidance. Public Note: This slide contains non-GAAP information; please see the REG G in appendix for a detailed reconciliation.

Agenda Past Future Near-Term Balance Sheet Public

Future Financial Path Forward Adjusted EBITDA Margin % 15% 12% 10% 10% 8% 5% 0% 2019 Revenue Product Structural and Other 2022 Operational Strategic Other 2024 Guidance Cost Pension Costs Performance Initiatives Reflects financial guidance. Public
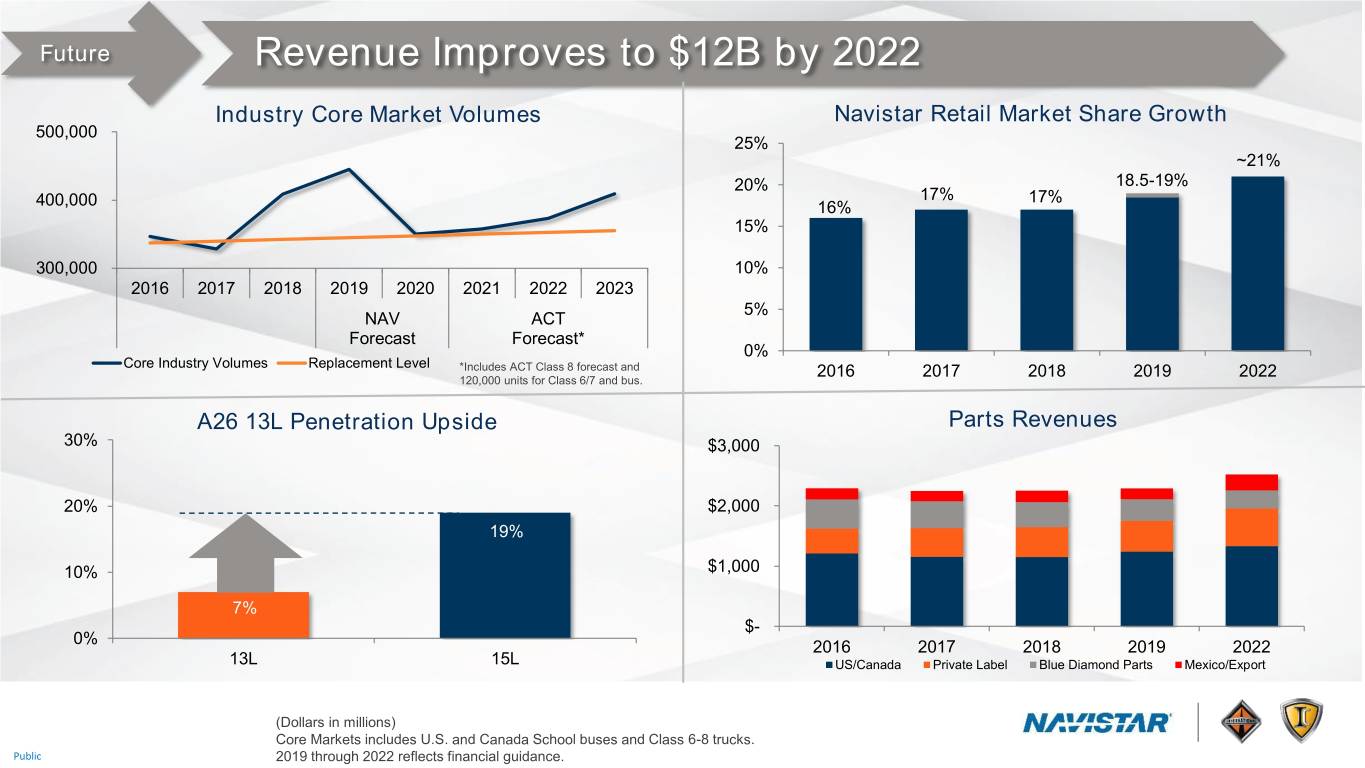
Future Revenue Improves to $12B by 2022 Industry Core Market Volumes Navistar Retail Market Share Growth 500,000 25% ~21% 20% 18.5-19% 17% 17% 400,000 16% 15% 300,000 10% 2016 2017 2018 2019 2020 2021 2022 2023 5% NAV ACT Forecast Forecast* 0% Core Industry Volumes Replacement Level *Includes ACT Class 8 forecast and 2016 2017 2018 2019 2022 120,000 units for Class 6/7 and bus. A26 13L Penetration Upside Parts Revenues 30% $3,000 20% $2,000 19% 10% $1,000 7% $- 0% 2016 2017 2018 2019 2022 13L 15L US/Canada Private Label Blue Diamond Parts Mexico/Export (Dollars in millions) Core Markets includes U.S. and Canada School buses and Class 6-8 trucks. Public 2019 through 2022 reflects financial guidance.

Future Strategic Initiatives Drive Lower Product Costs • Alliance savings on track • Achieved $225 million of savings since inception • $500 million cumulative savings by year 5 (2022) • Enterprise platform strategy enables modularity • New San Antonio manufacturing plant • Lean manufacturing • Supply chain optimization • Parts commercial acceleration program • E-commerce • Additional PDC capacity • Love’s service partnership Public

Future Intense Focus on Costs to Fund Growth Initiatives Trend • Fund integrated powertrains and Engineering advanced technology investments • Active cost management SG&A • Lean organization • Lower interest expense Pension • Better funded pension plans Total • Targeting 10% of revenues Public

Agenda Past Future Near-Term Balance Sheet Public
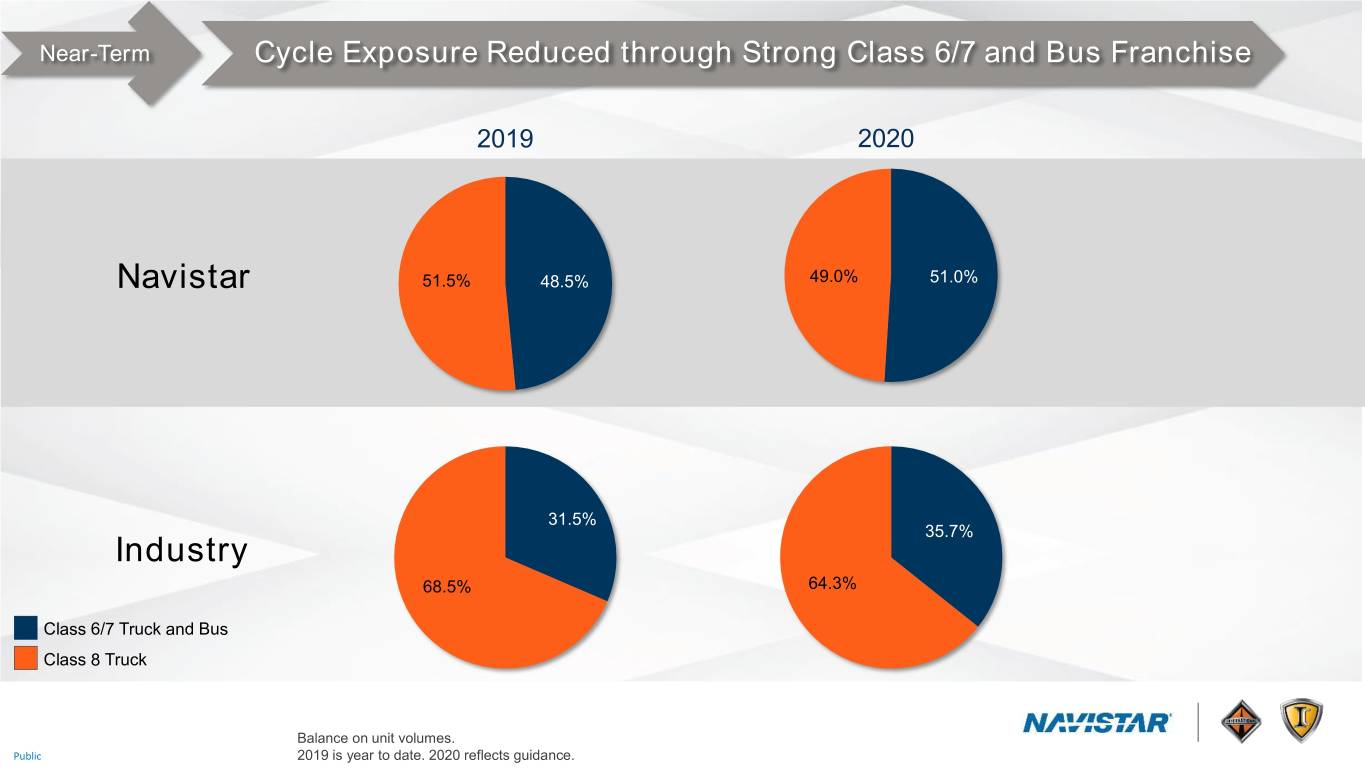
Near-Term Cycle Exposure Reduced through Strong Class 6/7 and Bus Franchise 2019 2020 Navistar 51.5% 48.5% 49.0% 51.0% 31.5% 35.7% Industry 68.5% 64.3% Class 6/7 Truck and Bus Class 8 Truck Balance on unit volumes. Public 2019 is year to date. 2020 reflects guidance.
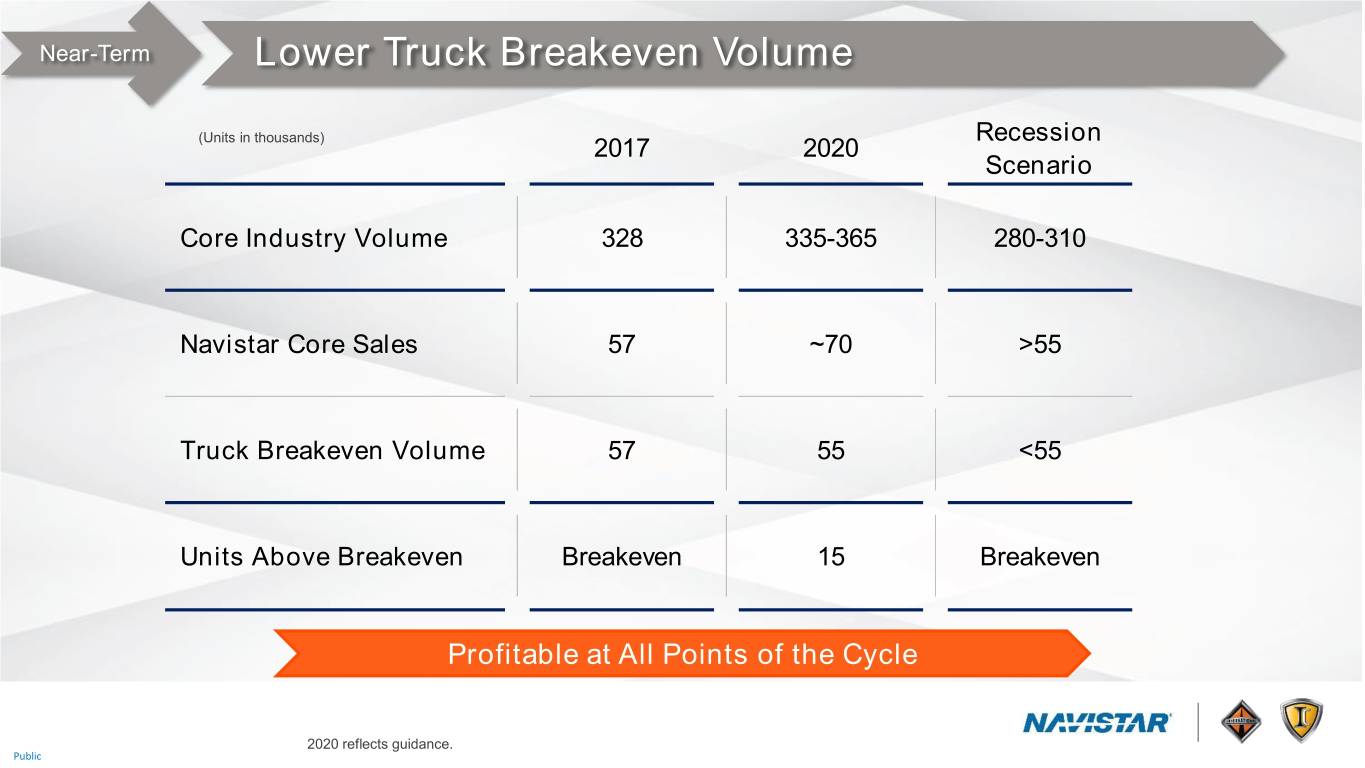
Near-Term Lower Truck Breakeven Volume (Units in thousands) Recession 2017 2020 Scenario Core Industry Volume 328 335-365 280-310 Navistar Core Sales 57 ~70 >55 Truck Breakeven Volume 57 55 <55 Units Above Breakeven Breakeven 15 Breakeven Profitable at All Points of the Cycle 2020 reflects guidance. Public

Agenda Past Future Near-Term Balance Sheet Public

Balance Sheet Free Cash Flow Generation 2018 2019 2020 Revenue $10.25B $11.25-$11.75B $10-$10.5B Adjusted EBITDA $826M $875-$925M $775-$825M Warranty Spend > Expense $141M $90M $75M Capital Expeditures $113M $115M $225M Pension/OPEB Contributions > Expense $81M $85M $140M Manufacturing Interest Expense $235M $225M $190M Manufacturing Free Cash Flow $307M Positive Breakeven* *Excluding the impact of net working capital and other one-time items 2019 and 2020 reflects financial guidance. Public Note: This slide contains non-GAAP information; please see the REG G in appendix for a detailed reconciliation.
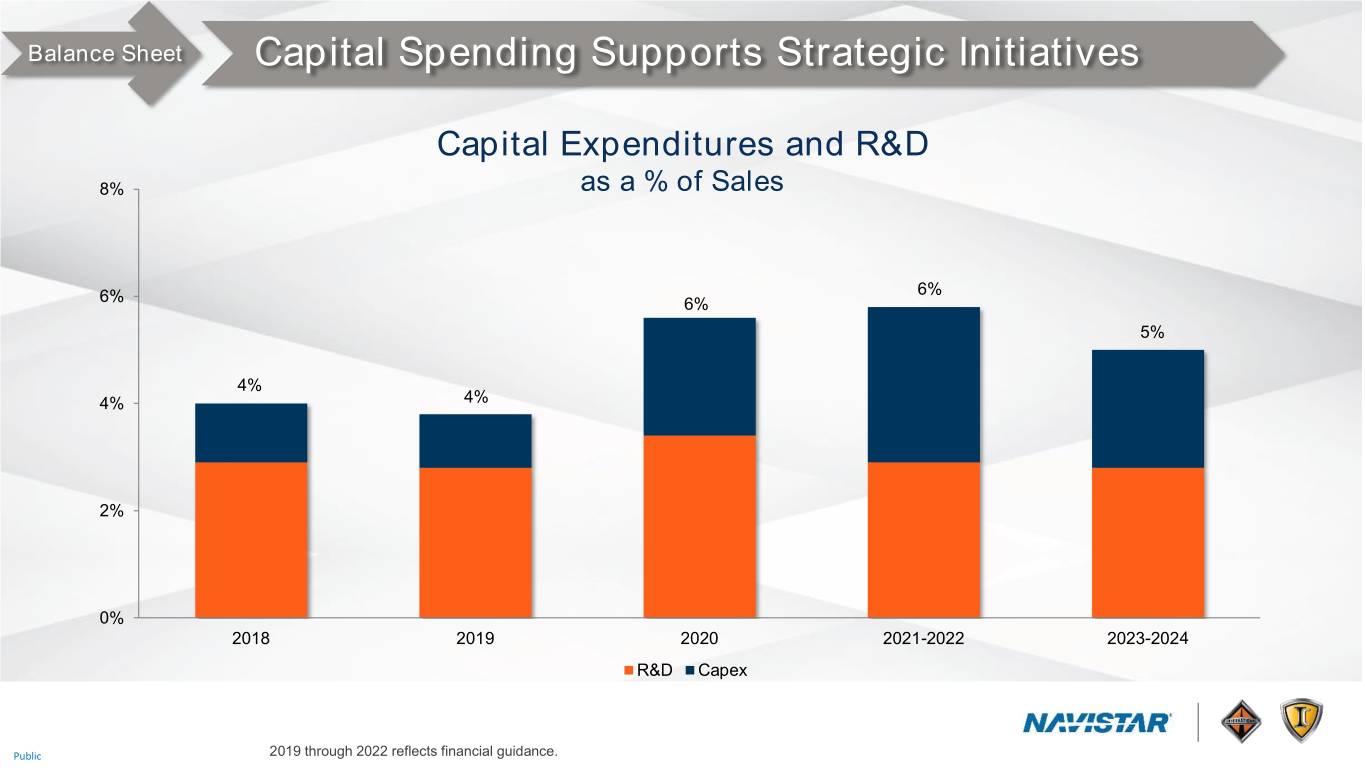
Balance Sheet Capital Spending Supports Strategic Initiatives Capital Expenditures and R&D 8% as a % of Sales 6% 6% 6% 5% 4% 4% 4% 2% 0% 2018 2019 2020 2021-2022 2023-2024 R&D Capex Public 2019 through 2022 reflects financial guidance.

Balance Sheet De-Risking the Balance Sheet Actions To Date Future Cash • > $1B • Maintain ~$1B • Repaid $600M in convertible notes • Target investment grade Debt • Extended maturities to 2025+ (1.5x gross debt to EBITDA) • Reduced underfunded status from Pension / OPEB • Fund Pension by 2025 $3.1B to $2.1B in 2 years • Reduced liability from $1.3B to $0.5B • Maintain best-in-class Warranty • Expense is 1.3% of revenue • MaxxForce settlement of $135M • Satisfactory resolution of Litigation pending final court approval remaining litigation • $2.7B of U.S. federal NOL Net Operating Loss • Tax shield of $4 to $6 per share carryforwards Public

Summary Best Investment in Commercial Vehicle Space Trend • Market share improving Revenues • Best in class quality • Exceptional customer experience • Parts growth • Lean operations EBITDA • TRATON alliance Margins • Strategic initiatives • Strong free cash flow Balance • Efficient capital investments Sheet • Pay down debt and pension liabilities • People Play to • Performance WIN! • #1 Choice Public
PLAYING PEOPLE PERFORMANCE #1 CHOICE TO WIN QUESTION AND ANSWER Public

Public

Appendix Public

SEC Regulation G non-GAAP Reconciliations SEC Regulation G Non-GAAP Reconciliation: The financial measures presented below are unaudited and not in accordance with, or an alternative for, financial measures presented in accordance with U.S. generally accepted accounting principles ("GAAP"). The non-GAAP financial information presented herein should be considered supplemental to, and not as a substitute for, or superior to, financial measures calculated in accordance with GAAP and are reconciled to the most appropriate GAAP number below. Earnings (loss) Before Interest, Income Taxes, Depreciation, and Amortization (“EBITDA”): We define EBITDA as our consolidated net income (loss) attributable to Navistar International Corporation plus manufacturing interest expense, income taxes, and depreciation and amortization. We believe EBITDA provides meaningful information as to the performance of our business and therefore we use it to supplement our GAAP reporting. We have chosen to provide this supplemental information to investors, analysts and other interested parties to enable them to perform additional analyses of operating results. Adjusted Net Income and Adjusted EBITDA: We believe that adjusted net income and adjusted EBITDA, which excludes certain identified items that we do not consider to be part of our ongoing business, improves the comparability of year to year results, and is representative of our underlying performance. Management uses this information to assess and measure the performance of our operating segments. We have chosen to provide this supplemental information to investors, analysts and other interested parties to enable them to perform additional analyses of operating results, to illustrate the results of operations giving effect to the non-GAAP adjustments shown in the below reconciliations, and to provide an additional measure of performance. Manufacturing Cash, Cash Equivalents, and Marketable Securities: Manufacturing cash, cash equivalents, and marketable securities, and free cash flow represents the Company’s consolidated cash, cash equivalents, and marketable securities excluding cash, cash equivalents, and marketable securities of our financial services operations. We include marketable securities with our cash and cash equivalents when assessing our liquidity position as our investments are highly liquid in nature. We have chosen to provide this supplemental information to investors, analysts and other interested parties to enable them to perform additional analyses of our ability to meet our operating requirements, capital expenditures, equity investments, and financial obligations. Gross Margin consists of Sales and revenues, net, less Costs of products sold. Structural Cost consists of Selling, general and administrative expenses and Engineering and product development costs. Manufacturing Free Cash Flow consists of Net cash from operating activities and Capital Expenditures, all from our Manufacturing operations. Adjusted EBITDA margin is calculated by dividing adjusted EBITDA by Sales and revenues, net. Public

SEC Regulation G non-GAAP Reconciliations Manufacturing Free Cash Flow Years Ended Oct. 31 (in millions) 2018 2017 2016 2015 Consolidated Net Cash from Operating Activities.............. $ 269 $ 109 $ 267 $ 46 Less: Net Cash from Financial Services Operations.......... (150) 107 431 73 Net Cash from Manufacturing Operations (A) ....................... 419 2 (164) (27) Capital Expenditures...................................................... (112) (101) (114) (111) Manufacturing Free Cash Flow................................. $ 307 $ (99) $ (278) $ (138) Manufacturing Cash Jul. 31, ($ in millions) 2019 Manufacturing Operations: Cash and cash equivalents………………………………………………………....... $ 1,112 Marketable securities……………………………………………………………......... 3 Manufacturing Cash, Cash equivalents, and Marketable securities........................ $ 1,115 Financial Services Operations: Cash and cash equivalents………………………………………………………....... $ 48 Marketable securities……………………………………………………………......... - Financial Services Cash, Cash equivalents, and Marketable securities……......... $ 48 Consolidated Balance Sheet: Cash and cash equivalents………………………………………………………....... $ 1,160 Marketable securities……………………………………………………………......... 3 Consolidated Cash, Cash equivalents, and Marketable securities………….......... $ 1,163 Public

SEC Regulation G non-GAAP Reconciliations Adjusted EBITDA Years Ended October 31 (in millions) 2019* 2018 2017 2016 2015 2014 2013 2012 Loss from continuing operations attributable to NIC, net of tax........ $ 119 $ 340 $ 29 $ (97) $ (187) $ (622) $ (857) $ (2,939) Plus: Depreciation and amortization expense...................................... 144 211 223 225 281 332 417 323 Manufacturing interest expense .................................................. 160 235 265 247 233 243 251 171 Less: Income tax benefit (expense).........................................................1 (9) (52) (10) (33) (51) (26) 171 (1,780) EBITDA................................................................................................... $ 432 $ 838 $ 527 $ 408 $ 378 $ (21) $ (360) $ (665) The following table reconciles Manufacturing interest expense to the consolidated interest expense: Interest expense..................................................................................... $ 243 $ 327 $ 351 $ 327 $ 307 $ 314 $ 321 $ 259 Less: Financial services interest expense......................................... 83 92 86 80 74 71 70 88 Manufacturing interest expense........................................................... $ 160 $ 235 $ 265 $ 247 $ 233 $ 243 $ 251 $ 171 EBITDA (reconciled above).................................................................2 $ 432 $ 838 $ 527 $ 408 $ 378 $ (21) $ (360) $ (665) Less: Significant items ........................................................................ 231 (12) 55 100 116 327 462 574 Adjusted EBITDA.................................................................................. $ 663 $ 826 $ 582 $ 508 $ 494 $ 306 $ 102 $ (91) Adjusted EBITDA Margin..................................................................... 7.8% 8.1% 6.8% 6.3% 4.9% 2.8% 0.9% -0.7% 2019* is nine months ended Public See the following slides for details on Significant items
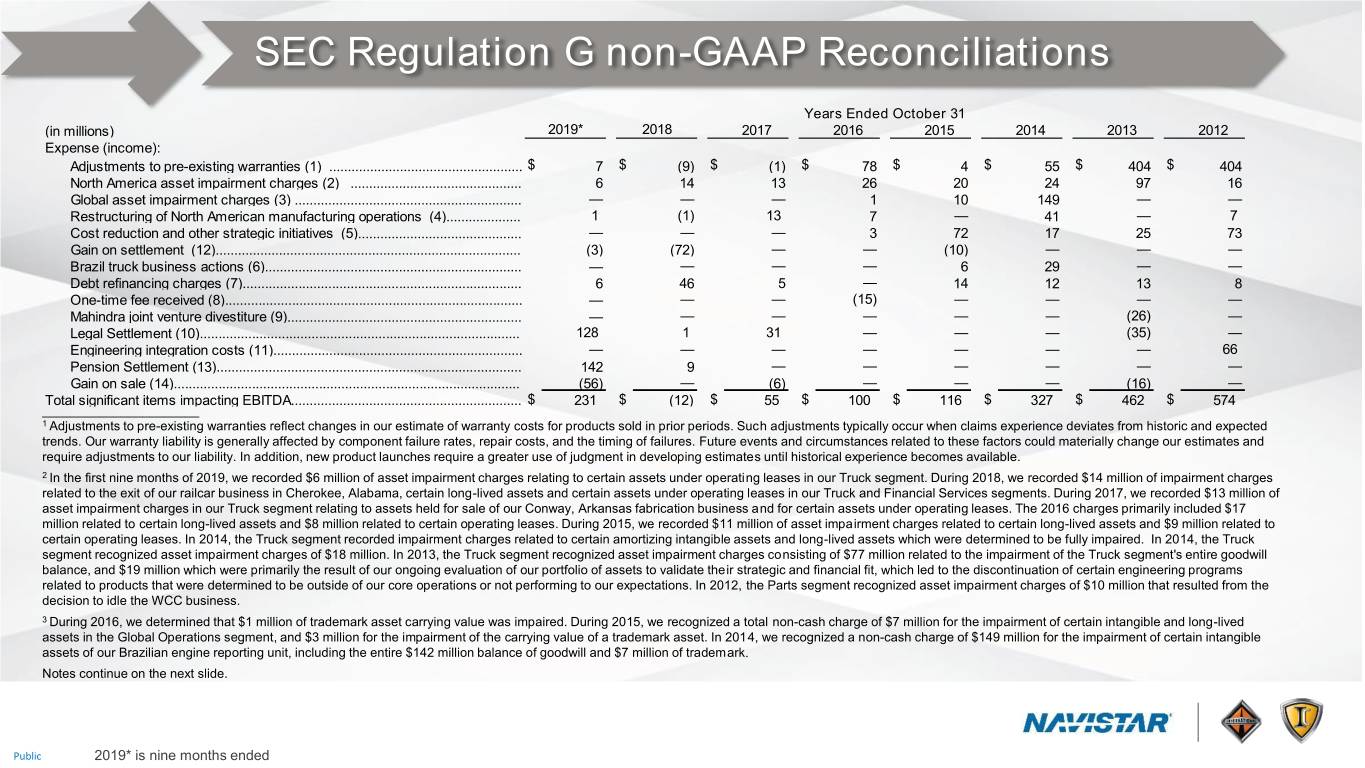
SEC Regulation G non-GAAP Reconciliations Years Ended October 31 (in millions) 2019* 2018 2017 2016 2015 2014 2013 2012 Expense (income): Adjustments to pre-existing warranties (1) .................................................... $ 7 $ (9) $ (1) $ 78 $ 4 $ 55 $ 404 $ 404 North America asset impairment charges (2) .............................................. 6 14 13 26 20 24 97 16 Global asset impairment charges (3) ............................................................. — — — 1 10 149 — — Restructuring of North American manufacturing operations (4).................... 1 (1) 13 7 — 41 — 7 Cost reduction and other strategic initiatives (5)............................................ — — — 3 72 17 25 73 Gain on settlement (12).................................................................................. (3) (72) — — (10) — — — Brazil truck business actions (6)..................................................................... — — — — 6 29 — — Debt refinancing charges (7)........................................................................... 6 46 5 — 14 12 13 8 One-time fee received (8)................................................................................ — — — (15) — — — — Mahindra joint venture divestiture (9)............................................................... — — — — — — (26) — Legal Settlement (10)...................................................................................... 128 1 31 — — — (35) — Engineering integration costs (11)................................................................... — — — — — — — 66 Pension Settlement (13).................................................................................. 142 9 — — — — — — Gain on sale (14)............................................................................................. (56) — (6) — — — (16) — Total significant items impacting EBITDA.............................................................. $ 231 $ (12) $ 55 $ 100 $ 116 $ 327 $ 462 $ 574 ______________________ 1 Adjustments to pre-existing warranties reflect changes in our estimate of warranty costs for products sold in prior periods. Such adjustments typically occur when claims experience deviates from historic and expected trends. Our warranty liability is generally affected by component failure rates, repair costs, and the timing of failures. Future events and circumstances related to these factors could materially change our estimates and require adjustments to our liability. In addition, new product launches require a greater use of judgment in developing estimates until historical experience becomes available. 2 In the first nine months of 2019, we recorded $6 million of asset impairment charges relating to certain assets under operating leases in our Truck segment. During 2018, we recorded $14 million of impairment charges related to the exit of our railcar business in Cherokee, Alabama, certain long-lived assets and certain assets under operating leases in our Truck and Financial Services segments. During 2017, we recorded $13 million of asset impairment charges in our Truck segment relating to assets held for sale of our Conway, Arkansas fabrication business and for certain assets under operating leases. The 2016 charges primarily included $17 million related to certain long-lived assets and $8 million related to certain operating leases. During 2015, we recorded $11 million of asset impairment charges related to certain long-lived assets and $9 million related to certain operating leases. In 2014, the Truck segment recorded impairment charges related to certain amortizing intangible assets and long-lived assets which were determined to be fully impaired. In 2014, the Truck segment recognized asset impairment charges of $18 million. In 2013, the Truck segment recognized asset impairment charges consisting of $77 million related to the impairment of the Truck segment's entire goodwill balance, and $19 million which were primarily the result of our ongoing evaluation of our portfolio of assets to validate their strategic and financial fit, which led to the discontinuation of certain engineering programs related to products that were determined to be outside of our core operations or not performing to our expectations. In 2012, the Parts segment recognized asset impairment charges of $10 million that resulted from the decision to idle the WCC business. 3 During 2016, we determined that $1 million of trademark asset carrying value was impaired. During 2015, we recognized a total non-cash charge of $7 million for the impairment of certain intangible and long-lived assets in the Global Operations segment, and $3 million for the impairment of the carrying value of a trademark asset. In 2014, we recognized a non-cash charge of $149 million for the impairment of certain intangible assets of our Brazilian engine reporting unit, including the entire $142 million balance of goodwill and $7 million of trademark. Notes continue on the next slide. Public 2019* is nine months ended

SEC Regulation G non-GAAP Reconciliations 4 In the first nine months of 2019, we recorded a restructuring charge of $1 million in our Truck segment. During 2018, we recognized a benefit of $1 million related to adjustments for restructuring in our Truck, Global Operations and Corporate segments. During 2017, we recorded charges of $13 million primarily attributable to $41 million of charges related to our plan to cease production at our Melrose Park Facility, a net benefit of $36 million related to the resolution of the closing agreement and wind up charges for our Chatham, Ontario plant, and the release of $1 million in other postretirement benefit liabilities in connection with the sale of our fabrication business in Conway, Arkansas. We also recorded $6 million of restructuring charges in Brazil related to cost reduction actions consisting of personnel costs for employee separation and related benefits. During 2016, we recorded $7 million of restructuring charges related to the 2011 closure of our Chatham, Ontario plant. In 2014 the Truck segment recorded $27 million of charges related to our anticipated exit from our Indianapolis, Indiana foundry facility and certain assets in our Waukesha, Wisconsin foundry operations. The charges included $13 million of restructuring charges, $7 million of fixed asset impairment charges and $7 million of charges for inventory reserves. In 2014, the Truck segment recorded $14 million of charges related to the 2011 closure of its Chatham, Ontario plant, based on a ruling received from the Financial Services Tribunal in Ontario Canada. In 2012, the Truck segment recorded $4 million of charges related to the planned closure of the Garland, Texas plant for personnel costs related to employee terminations and related benefits. 5 Cost reduction and other strategic initiatives relates to costs associated with the divestiture of non-strategic facilities and efforts to optimize our cost structure. In 2015, we had $72 million of cost reduction and other strategic initiatives primarily consisting of restructuring charges. In 2015, we offered the majority of our U.S.-based non-represented salaried employees the opportunity to apply for a VSP, which resulted in $37 million of restructuring charges. In addition, we incurred restructuring charges of $23 million related to cost reduction actions, including a reduction-in-force in the U.S. and Brazil. In 2014, the Company recorded restructuring charges related to cost reduction actions that included a reduction-in-force in the U.S and Brazil. In 2013, the Company leveraged efficiencies identified through redesigning our organizational structure and implemented new cost-reduction initiatives, including an enterprise-wide reduction-in-force. As a result of these actions, the Company recognized restructuring charges of $25 million in the year ended October 31, 2013. In 2012, the Company announced actions to control spending across the Company with targeted reductions of certain costs. As a result of these actions, the Company recognized restructuring charges of $73 million in the quarter and year ended October 31, 2012. 6 During 2015, we recorded $6 million in inventory charges to right size the Brazil Truck business. In 2014, the Global Operations segment recorded approximately $29 million in charges, primarily related to inventory, to right size the Brazil Truck business. 7 In the first nine months of 2019, we recorded a charge of $6 million for the write off of debt issuance costs and discounts associated with NFC Term Loan. During 2018, we recorded a charge of $46 million for the write off of debt issuance costs and discounts associated with the repurchase of our 8.25% Senior Notes and the refinancing of our previously existing Term Loan. During 2017, we recorded a charge of $5 million related to third party fees and debt issuance costs associated with the replacement of our Term Loan with our Term Loan Credit Agreement and the refinancing of the revolving portion of the NFC bank credit facility in our Financial Services segment. In 2015, we recorded $14 million of third party fees and unamortized debt issuance costs associated with the refinancing of our Amended Term Loan Credit Facility with a new Senior Secured Term Loan Credit Facility. In 2014, we recorded $12 million of unamortized debt issuance costs and other charges associated with the repurchase of our 2014 Convertible Notes. In 2013, we recorded $13 million of unamortized debt issuance costs and other charges associated with the sale of additional Senior Notes and the refinancing of the Term Loan. In 2012, we recorded $8 million of unamortized debt issuance costs and other charges associated with our Senior Notes and Amended and Restated Asset-Based Credit Facility. 8 During 2016, we received a $15 million one-time fee from a third party. 9 In 2013, the Company sold its stake in the Mahindra Joint Ventures to Mahindra and the Global Operations segment recognized a gain of $26 million. 10 In the first nine months of 2019, we recognized charge of $128 million related to MaxxForce Advanced EGR engine class action settlement and related litigation in our Truck segment. During 2018, we recognized an additional charge of $1 million for a jury verdict related to the MaxxForce engine EGR product litigation in our Truck segment. During 2017, we recognized a charge of $31 million related to that same jury verdict in our Truck segment .In 2013, as a result of the legal settlement with Deloitte and Touche LLP, the Company recognized a gain and received cash proceeds of $35 million. 11 Engineering integrated costs related to the consolidation of our truck and engine engineering operations, as well as the relocation of our world headquarters. In 2012, the charges included restructuring charges of $23 million and other related costs of $43 million, primarily in our Truck segment. 12 In the first nine months of 2019, we recorded interest income of $3 million, in Other income, net derived from the prior year settlement of a business economic loss claim relating to our former Alabama engine manufacturing facility in Corporate. During 2018, we settled a business economic loss claim relating to our Alabama engine manufacturing facility in which we will receive a net present value of $70 million, net of our fees and costs, from the Deepwater Horizon Settlement Program. We recorded the $70 million net present value of the settlement and related interest income of $2 million in Other Income, net. In the second quarter of 2015, the Global Operations segment recognized a $10 million net gain related to a settlement of a customer dispute. The $10 million net gain for the settlement included restructuring charges of $4 million. 13 In the first nine months of 2019, we purchased group annuity contracts for certain retired pension plan participants resulting in plan remeasurements. As a result, we recorded pension settlement accounting charges of $142 million. During 2018, we purchased a group annuity contract for certain retired pension plan participants resulting in a plan remeasurement. As a result, we recorded a pension settlement accounting charge of $9 million in SG&A expenses. 14 In the first nine months of 2019, we recognized a gain of $51 million related to the sale of a majority interest in the Navistar Defense business in our Truck segment, and a gain of $5 million related to the sale of our joint venture in China with JAC in our Global Operations segment. During 2017, we recognized a gain of $6 million related to the sale of a business line in our Parts segment. We recognized a gain of $16 million in the Truck segment in 2013, as a result of the divestiture of Bison. Public