Exhibit 99.1
1st Quarter Operational Update March 18, 2008 |
Safe Harbor Statement Information provided and statements contained in this presentation that are not purely historical are forward-looking statements within the meaning of Section 27A of the Securities Act, Section 21E of the Exchange Act, and the Private Securities Litigation Reform Act of 1995. Such forward-looking statements only speak as of the date of the presentation and the company assumes no obligation to update the information included in the presentation. Such forward-looking statements include information concerning our possible or assumed future results of operations, including descriptions of our business strategy. These statements often include words such as "believe," "expect," "anticipate," "intend," "plan," "estimate," "goal" or similar expressions. These statements are not guarantees of performance or results and they involve risks, uncertainties and assumptions, including the risk of continued delay in the completion of our financial statements and the consequences thereof, the availability of funds, either through cash on hand or the company's other liquidity sources, to repay any amounts due should any of the company's debt become accelerated, and decisions by suppliers and other vendors to restrict or eliminate customary trade and other credit terms for the company's future orders and other services, which would require the company to pay cash and which could have a material adverse effect on the company's liquidity position and financial condition. Although we believe that these forward-looking statements are based on reasonable assumptions, there are many factors that could affect our actual financial results or results of operations and could cause actual results to differ materially from those in the forward-looking statements. For a further description of these and other factors, see Item 1A, Risk Factors of our Form 10-K for fiscal year ended October 31, 2005, which was filed on December 10, 2007. |
Other Cautionary Legends The financial information herein contains both audited and preliminary/unaudited and has been prepared by management in good faith and based on current company data. Certain Non-GAAP measures are used in this presentation to assist the reader in understanding our core manufacturing business. We believe this information is useful and relevant to assess and measure the performance of our core manufacturing business as it illustrates manufacturing performance without regard to selected historical legacy costs (i.e. pension cost) and other expenses that may not be related to the core manufacturing business. Management often uses this information to assess and measure the performance of our operating segments. A reconciliation to the most appropriate GAAP number is included in the appendix of this presentation. |
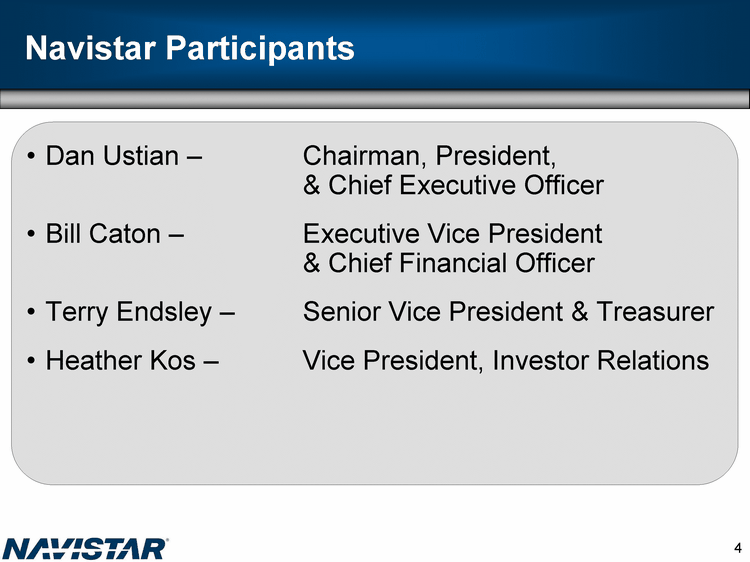
Navistar Participants Dan Ustian - Chairman, President, & Chief Executive Officer Bill Caton - Executive Vice President & Chief Financial Officer Terry Endsley - Senior Vice President & Treasurer Heather Kos - Vice President, Investor Relations |
Agenda 2008-2009 Industry Landscape Progress on Strategy Great Products Competitive Cost Structure Profitable Growth Current Filing Status Continuing Liquidity Summary |
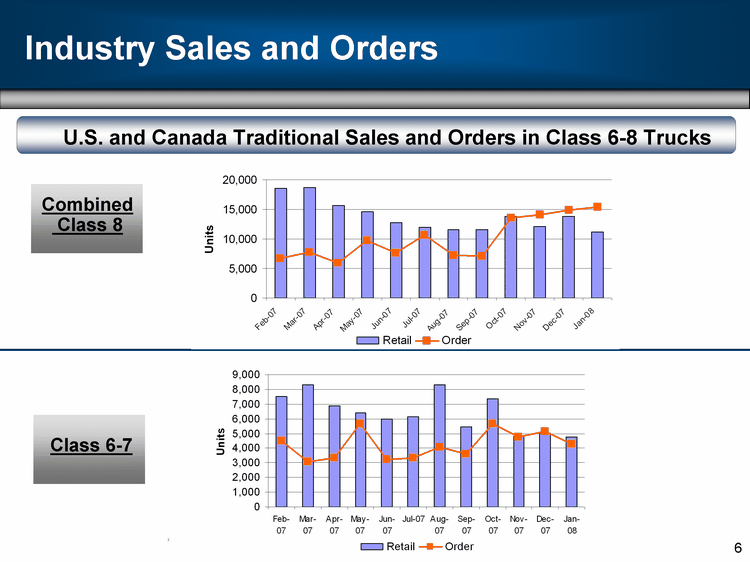
Industry Sales and Orders Combined Class 8 Class 6-7 U.S. and Canada Traditional Sales and Orders in Class 6-8 Trucks |
Agenda 2008-2009 Industry Landscape Progress on Strategy Great Products Competitive Cost Structure Profitable Growth Current Filing Status Continuing Liquidity Summary |
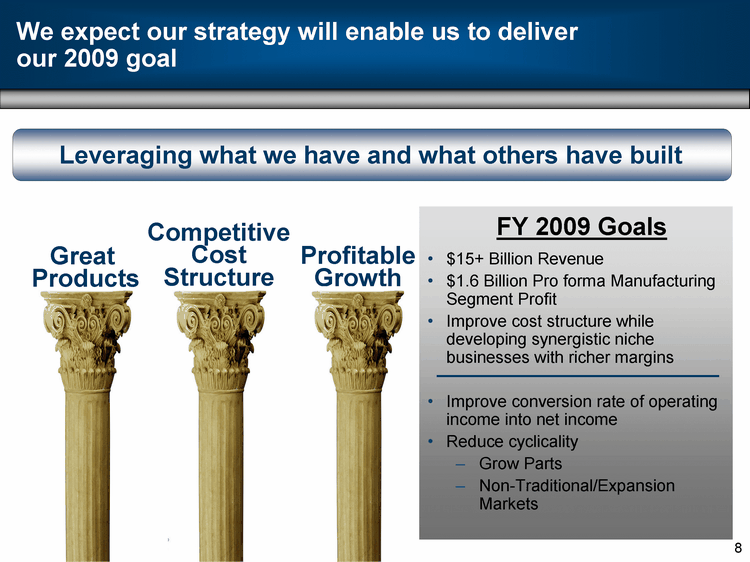
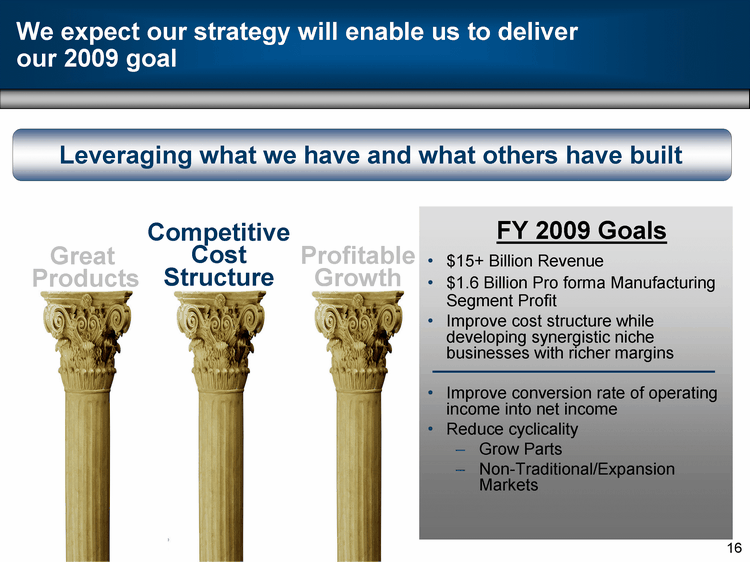
We expect our strategy will enable us to deliver our 2009 goal Competitive Cost Structure Profitable Growth Great Products FY 2009 Goals $15+ Billion Revenue $1.6 Billion Pro forma Manufacturing Segment Profit Improve cost structure while developing synergistic niche businesses with richer margins Improve conversion rate of operating income into net income Reduce cyclicality Grow Parts Non-Traditional/Expansion Markets Leveraging what we have and what others have built Leveraging what we have and what others have built |
Class 6-8 Great Products ProStarTM 2007 Engines MRAP School Bus 11/13 Liter Big Bore LoneStarTM Mahindra International Launching Future Finished ProStarTM Skyrise JLTV GM |
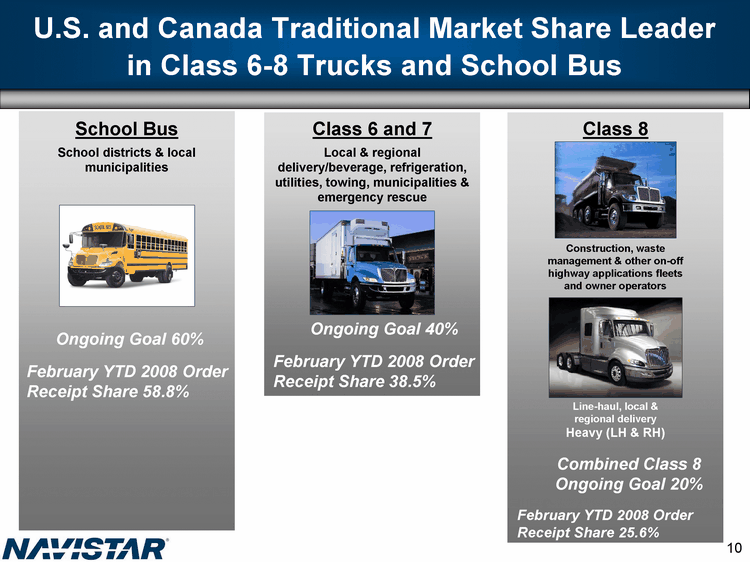
U.S. and Canada Traditional Market Share Leader in Class 6-8 Trucks and School Bus School Bus School districts & local municipalities Class 6 and 7 Local & regional delivery/beverage, refrigeration, utilities, towing, municipalities & emergency rescue Class 8 Ongoing Goal 60% February YTD 2008 Order Receipt Share 58.8% Construction, waste management & other on-off highway applications fleets and owner operators Line-haul, local & regional delivery Heavy (LH & RH) Ongoing Goal 40% February YTD 2008 Order Receipt Share 38.5% Combined Class 8 Ongoing Goal 20% February YTD 2008 Order Receipt Share 25.6% |
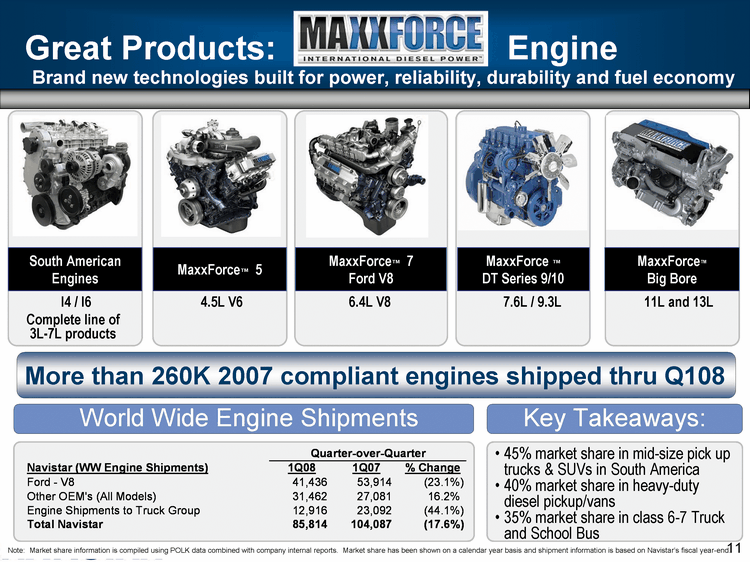
MaxxForce (tm) DT Series 9/10 MaxxForce(tm) 7 Ford V8 Brand new technologies built for power, reliability, durability and fuel economy MaxxForce(tm) 5 South American Engines MaxxForce(tm) Big Bore 11L and 13L 6.4L V8 4.5L V6 7.6L / 9.3L Great Products: Engine Note: Market share information is compiled using POLK data combined with company internal reports. Market share has been shown on a calendar year basis and shipment information is based on Navistar's fiscal year-end. World Wide Engine Shipments 45% market share in mid-size pick up trucks & SUVs in South America 40% market share in heavy-duty diesel pickup/vans 35% market share in class 6-7 Truck and School Bus Complete line of 3L-7L products Key Takeaways: I4 / I6 Leveraging what we have and what others have built More than 260K 2007 compliant engines shipped thru Q108 |
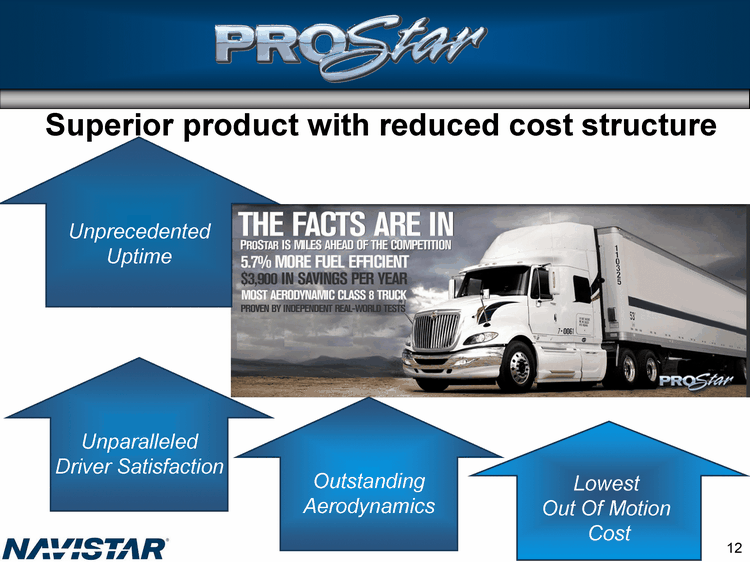
Superior product with reduced cost structure Unprecedented Uptime Unparalleled Driver Satisfaction Outstanding Aerodynamics Lowest Out Of Motion Cost |
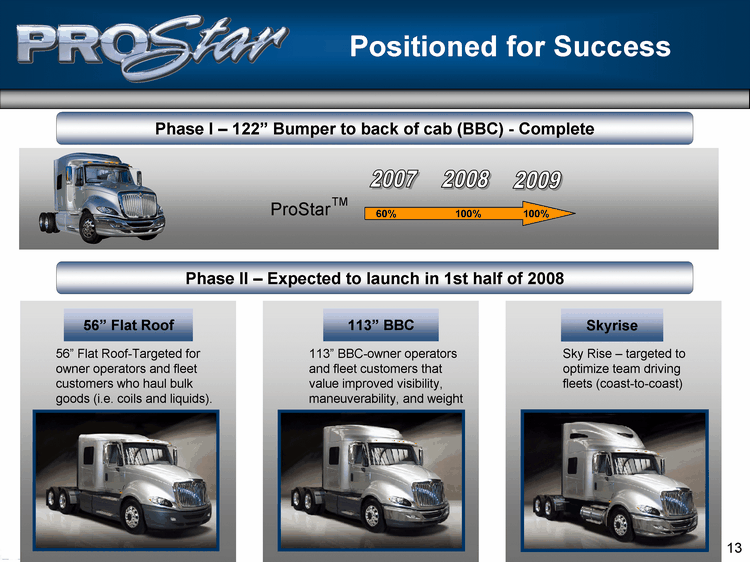
Skyrise 56" Flat Roof 113" BBC Positioned for Success 56" Flat Roof-Targeted for owner operators and fleet customers who haul bulk goods (i.e. coils and liquids). 113" BBC-owner operators and fleet customers that value improved visibility, maneuverability, and weight Sky Rise - targeted to optimize team driving fleets (coast-to-coast) 2007 2008 2009 60% 100% 100% ProStar TM Phase II - Expected to launch in 1st half of 2008 Phase I - 122" Bumper to back of cab (BBC) - Complete |
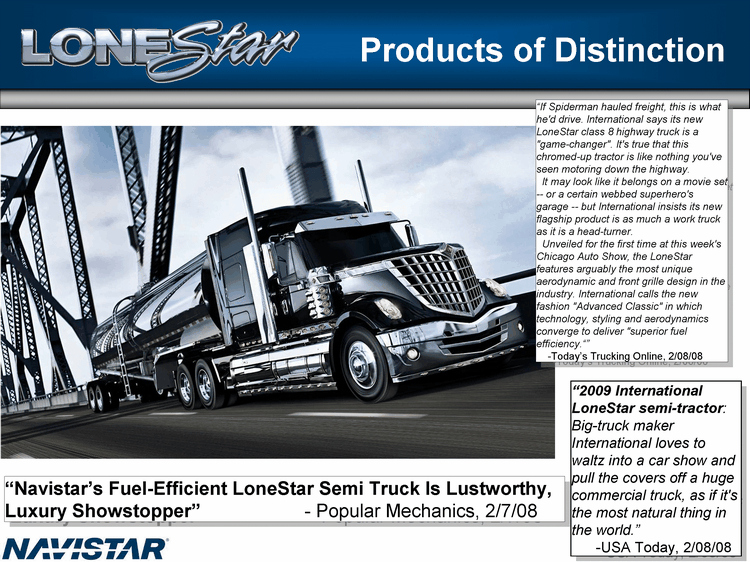
Products of Distinction "If Spiderman hauled freight, this is what he'd drive. International says its new LoneStar class 8 highway truck is a "game-changer". It's true that this chromed-up tractor is like nothing you've seen motoring down the highway. It may look like it belongs on a movie set - -- or a certain webbed superhero's garage -- but International insists its new flagship product is as much a work truck as it is a head-turner. Unveiled for the first time at this week's Chicago Auto Show, the LoneStar features arguably the most unique aerodynamic and front grille design in the industry. International calls the new fashion "Advanced Classic" in which technology, styling and aerodynamics converge to deliver "superior fuel efficiency."" -Today's Trucking Online, 2/08/08 "Navistar's Fuel-Efficient LoneStar Semi Truck Is Lustworthy, Luxury Showstopper" - Popular Mechanics, 2/7/08 "2009 International LoneStar semi-tractor: Big-truck maker International loves to waltz into a car show and pull the covers off a huge commercial truck, as if it's the most natural thing in the world." -USA Today, 2/08/08 |
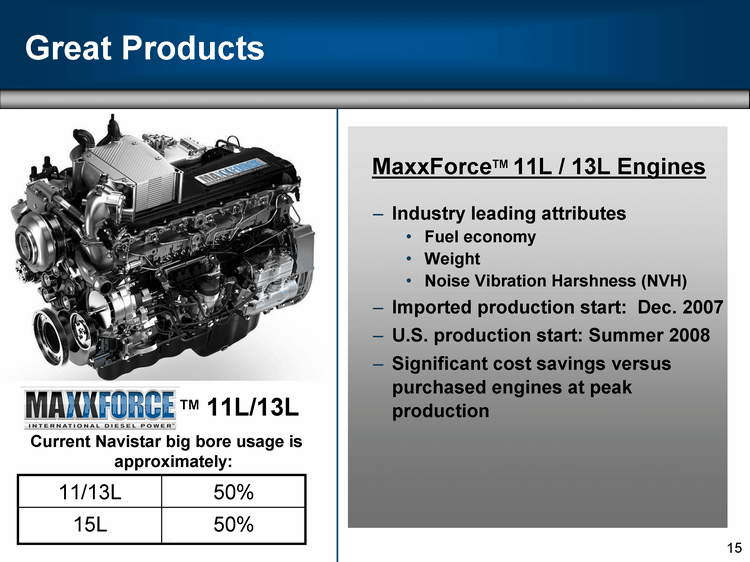
Great Products MaxxForceTM 11L / 13L Engines Industry leading attributes Fuel economy Weight Noise Vibration Harshness (NVH) Imported production start: Dec. 2007 U.S. production start: Summer 2008 Significant cost savings versus purchased engines at peak production MaxxForceTM 11L/13L Current Navistar big bore usage is approximately: 11/13L 50% 15L 50% |
We expect our strategy will enable us to deliver our 2009 goal Competitive Cost Structure Profitable Growth Great Products FY 2009 Goals $15+ Billion Revenue $1.6 Billion Pro forma Manufacturing Segment Profit Improve cost structure while developing synergistic niche businesses with richer margins Improve conversion rate of operating income into net income Reduce cyclicality Grow Parts Non-Traditional/Expansion Markets Leveraging what we have and what others have built Leveraging what we have and what others have built |
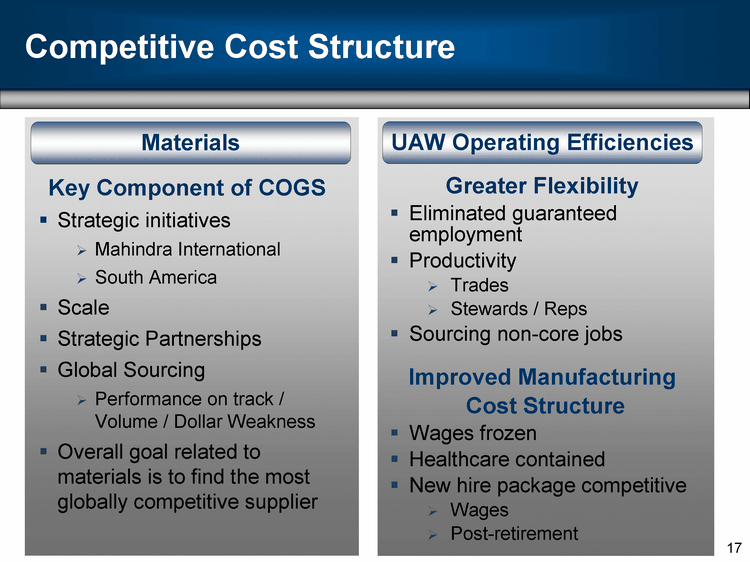
Competitive Cost Structure Key Component of COGS Strategic initiatives Mahindra International South America Scale Strategic Partnerships Global Sourcing Performance on track / Volume / Dollar Weakness Overall goal related to materials is to find the most globally competitive supplier Greater Flexibility Eliminated guaranteed employment Productivity Trades Stewards / Reps Sourcing non-core jobs Improved Manufacturing Cost Structure Wages frozen Healthcare contained New hire package competitive Wages Post-retirement UAW Operating Efficiencies Materials |
We expect our strategy will enable us to deliver our 2009 goal Competitive Cost Structure Profitable Growth Great Products FY 2009 Goals $15+ Billion Revenue $1.6 Billion Pro forma Manufacturing Segment Profit Improve cost structure while developing synergistic niche businesses with richer margins Improve conversion rate of operating income into net income Reduce cyclicality Grow Parts Non-Traditional/Expansion Markets Leveraging what we have and what others have built Leveraging what we have and what others have built |
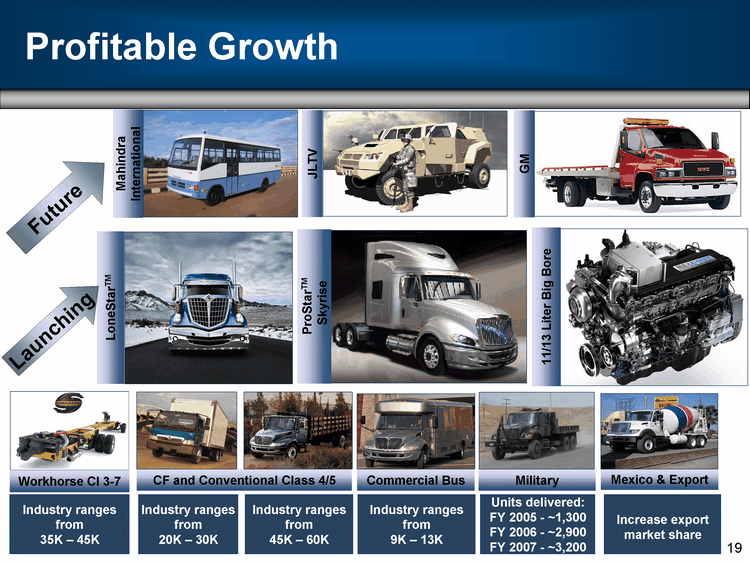
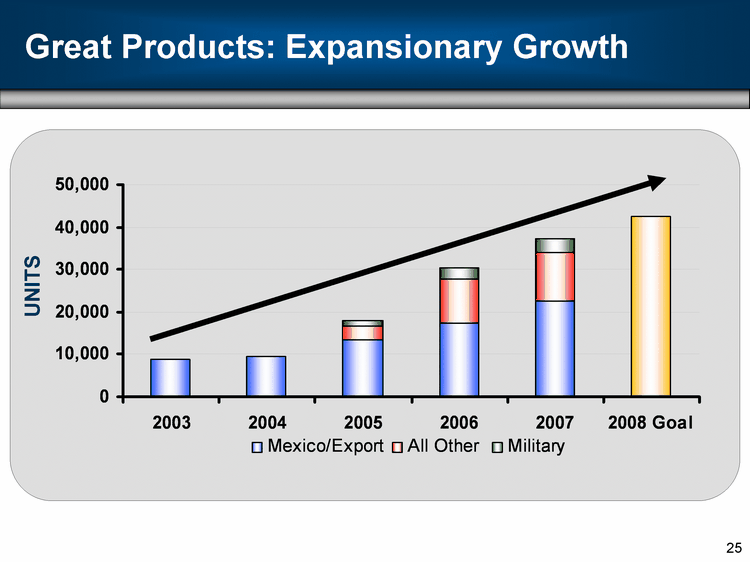
Profitable Growth Mexico & Export Increase export market share Military Units delivered: FY 2005 - ~1,300 FY 2006 - ~2,900 FY 2007 - ~3,200 Commercial Bus Industry ranges from 9K - 13K CF and Conventional Class 4/5 Industry ranges from 20K - 30K Industry ranges from 45K - 60K Workhorse Cl 3-7 Industry ranges from 35K - 45K 11/13 Liter Big Bore LoneStarTM Mahindra International Launching Future ProStarTM Skyrise JLTV GM |
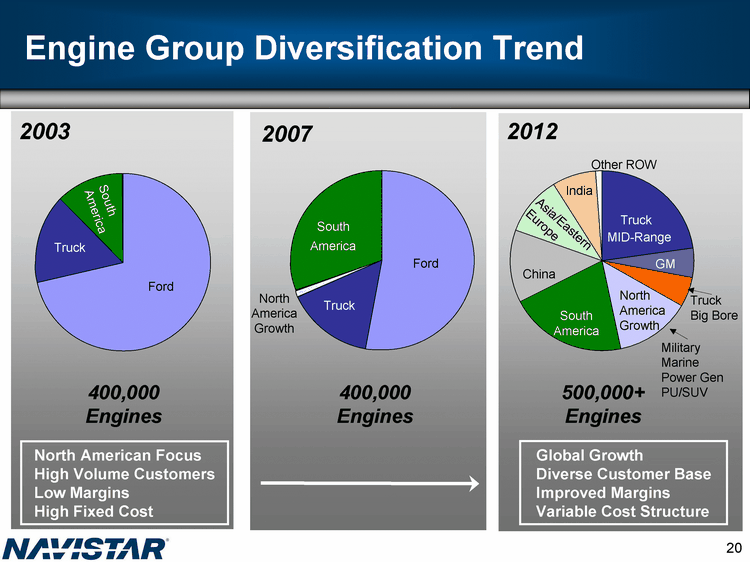
Ford Truck South America North America Growth Ford Truck South America 2007 2003 2012 400,000 Engines 400,000 Engines 500,000+ Engines GM South America China Asia/Eastern Europe India Truck MID-Range North America Growth Truck Big Bore Other ROW Military Marine Power Gen PU/SUV North American Focus High Volume Customers Low Margins High Fixed Cost Engine Group Diversification Trend Global Growth Diverse Customer Base Improved Margins Variable Cost Structure |
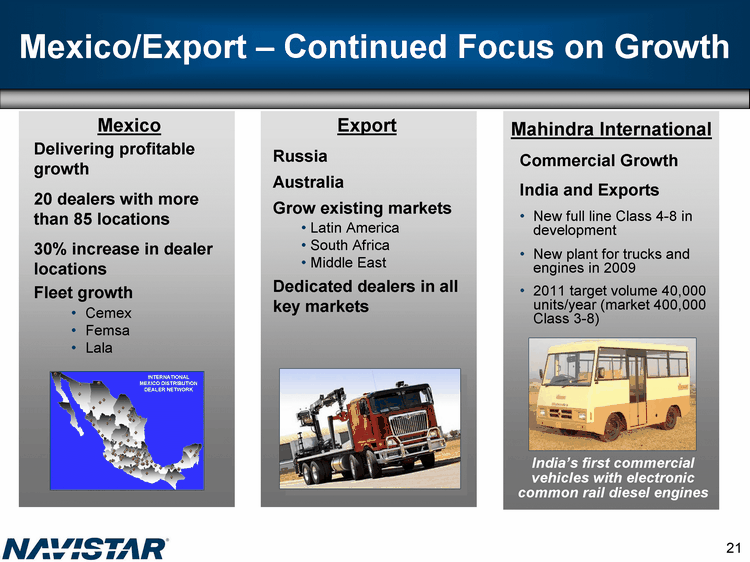
Mexico/Export - Continued Focus on Growth Mexico Delivering profitable growth 20 dealers with more than 85 locations 30% increase in dealer locations Fleet growth Cemex Femsa Lala Export Russia Australia Grow existing markets Latin America South Africa Middle East Dedicated dealers in all key markets Mahindra International Commercial Growth India and Exports New full line Class 4-8 in development New plant for trucks and engines in 2009 2011 target volume 40,000 units/year (market 400,000 Class 3-8) India's first commercial vehicles with electronic common rail diesel engines |
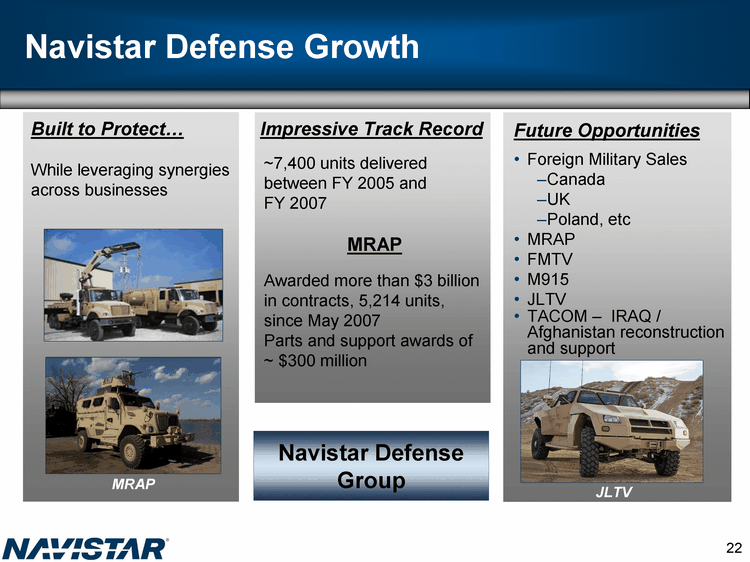
Navistar Defense Growth Built to Protect... While leveraging synergies across businesses Impressive Track Record Future Opportunities Foreign Military Sales Canada UK Poland, etc MRAP FMTV M915 JLTV TACOM - IRAQ / Afghanistan reconstruction and support JLTV MRAP Navistar Defense Group ~7,400 units delivered between FY 2005 and FY 2007 MRAP Awarded more than $3 billion in contracts, 5,214 units, since May 2007 Parts and support awards of ~ $300 million |
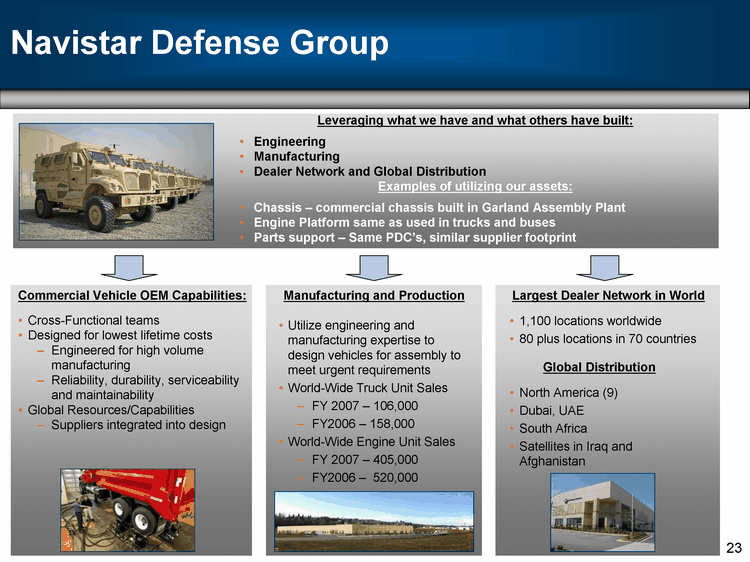
Navistar Defense Group Global Distribution North America (9) Dubai, UAE South Africa Satellites in Iraq and Afghanistan Largest Dealer Network in World 1,100 locations worldwide 80 plus locations in 70 countries Manufacturing and Production Utilize engineering and manufacturing expertise to design vehicles for assembly to meet urgent requirements World-Wide Truck Unit Sales FY 2007 - 106,000 FY2006 - 158,000 World-Wide Engine Unit Sales FY 2007 - 405,000 FY2006 - 520,000 Leveraging what we have and what others have built: Engineering Manufacturing Dealer Network and Global Distribution Examples of utilizing our assets: Chassis - commercial chassis built in Garland Assembly Plant Engine Platform same as used in trucks and buses Parts support - Same PDC's, similar supplier footprint Commercial Vehicle OEM Capabilities: Cross-Functional teams Designed for lowest lifetime costs Engineered for high volume manufacturing Reliability, durability, serviceability and maintainability Global Resources/Capabilities Suppliers integrated into design |
Navistar Defense Growth Tactical 7000 MV AFMTV Taiwan FMS Militarized / supporting vehicles 5000 MV Armored Line Haul Tractor TACOM-other urgent requirements MXT MRAP US & Foreign Future Opportunities Foreign Military Sales Canada UK Poland, etc FMTV M915 JLTV TACOM - IRAQ / Afghanistan reconstruction and support We believe the military business is a $1.5 to $2 Billion sustainable business Navistar Defense Group Won 24 out of 27 contracts |
Great Products: Expansionary Growth UNITS |
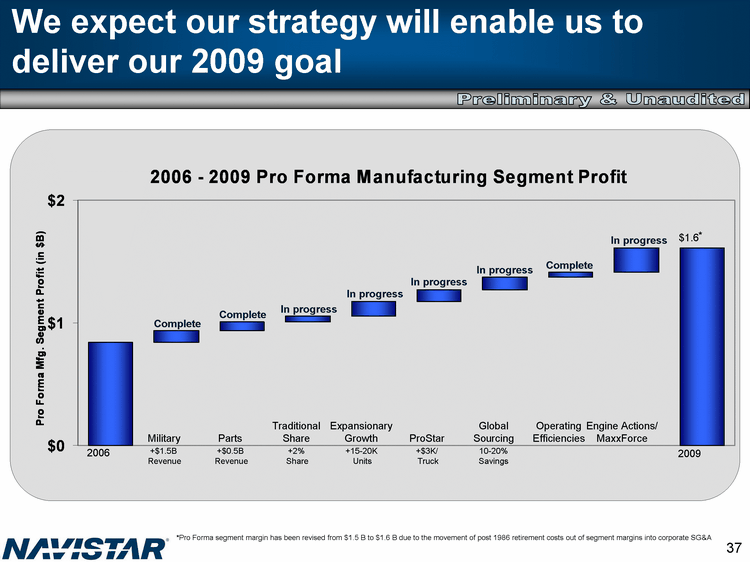
2006 *Pro Forma segment margin has been revised from $1.5 B to $1.6 B due to the movement of post 1986 retirement costs out of segment margins into corporate SG&A We expect our strategy will enable us to deliver our 2009 goal Preliminary & Unaudited $1.6 * Engine Actions/ MaxxForce Operating Efficiencies 10-20% Savings Global Sourcing ProStar +$3K/ Truck Expansionary Growth +15-20K Units Traditional Share +2% Share Parts +$0.5B Revenue Military +$1.5B Revenue 2009 |
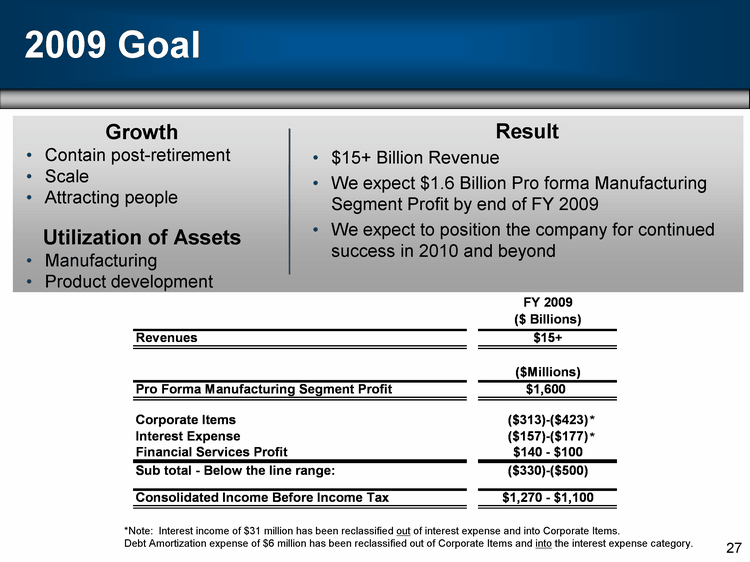
2009 Goal Growth Contain post-retirement Scale Attracting people Utilization of Assets Manufacturing Product development Result $15+ Billion Revenue We expect $1.6 Billion Pro forma Manufacturing Segment Profit by end of FY 2009 We expect to position the company for continued success in 2010 and beyond *Note: Interest income of $31 million has been reclassified out of interest expense and into Corporate Items. Debt Amortization expense of $6 million has been reclassified out of Corporate Items and into the interest expense category. |
Agenda 2008-2009 Industry Landscape Progress on Strategy Great Products Competitive Cost Structure Profitable Growth Current Filing Status Continuing Liquidity Summary |
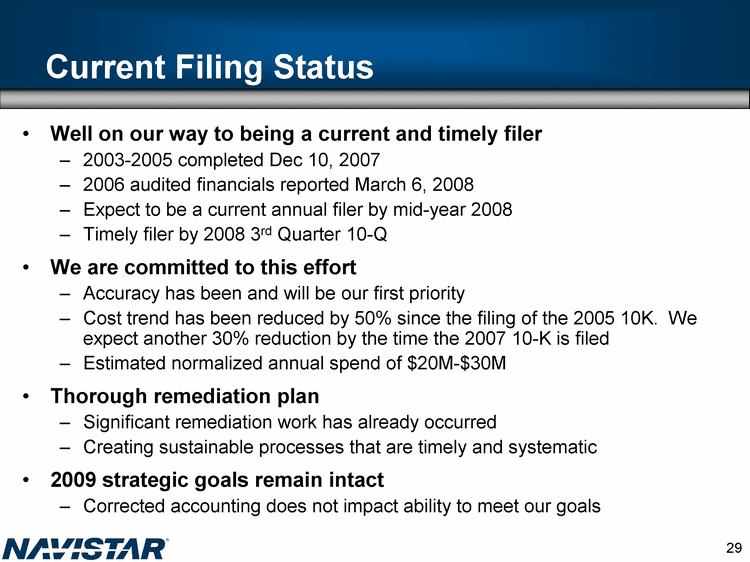
Current Filing Status Well on our way to being a current and timely filer 2003-2005 completed Dec 10, 2007 2006 audited financials reported March 6, 2008 Expect to be a current annual filer by mid-year 2008 Timely filer by 2008 3rd Quarter 10-Q We are committed to this effort Accuracy has been and will be our first priority Cost trend has been reduced by 50% since the filing of the 2005 10K. We expect another 30% reduction by the time the 2007 10-K is filed Estimated normalized annual spend of $20M-$30M Thorough remediation plan Significant remediation work has already occurred Creating sustainable processes that are timely and systematic 2009 strategic goals remain intact Corrected accounting does not impact ability to meet our goals |
Agenda 2008-2009 Industry Landscape Progress on Strategy Great Products Competitive Cost Structure Profitable Growth Current Filing Status Continuing Liquidity Summary |
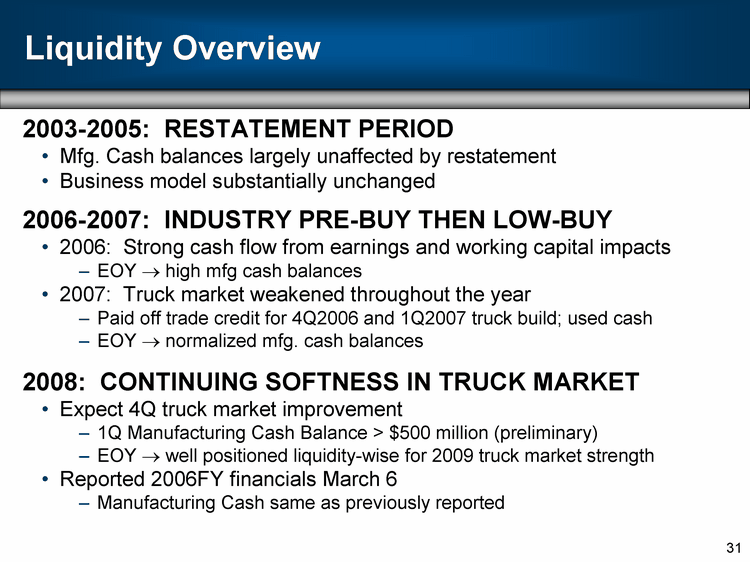
Liquidity Overview 2003-2005: RESTATEMENT PERIOD Mfg. Cash balances largely unaffected by restatement Business model substantially unchanged 2006-2007: INDUSTRY PRE-BUY THEN LOW-BUY 2006: Strong cash flow from earnings and working capital impacts EOY ? high mfg cash balances 2007: Truck market weakened throughout the year Paid off trade credit for 4Q2006 and 1Q2007 truck build; used cash EOY ? normalized mfg. cash balances 2008: CONTINUING SOFTNESS IN TRUCK MARKET Expect 4Q truck market improvement 1Q Manufacturing Cash Balance > $500 million (preliminary) EOY ? well positioned liquidity-wise for 2009 truck market strength Reported 2006FY financials March 6 Manufacturing Cash same as previously reported |
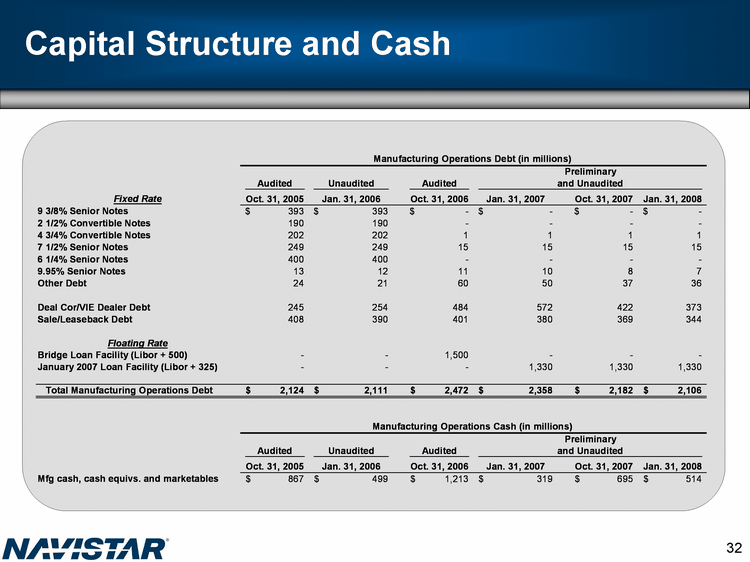
Capital Structure and Cash |
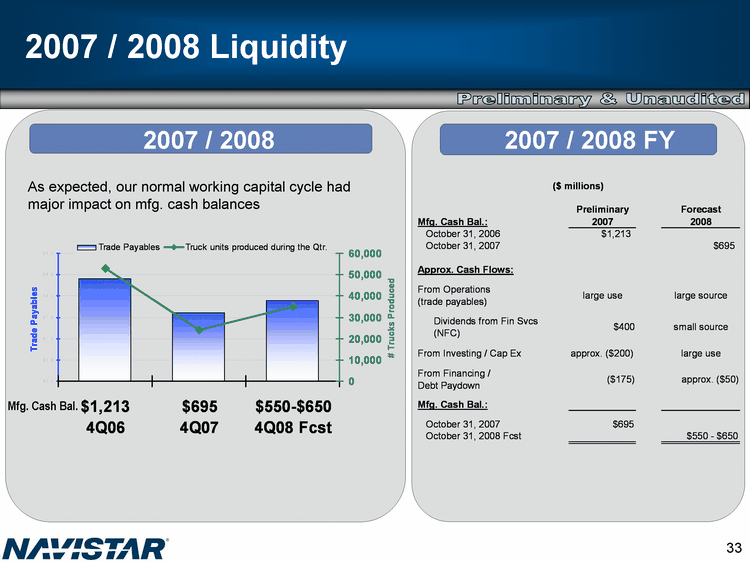
2007 / 2008 Liquidity 2007 / 2008 2007 / 2008 FY As expected, our normal working capital cycle had major impact on mfg. cash balances Mfg. Cash Bal. Preliminary & Unaudited |
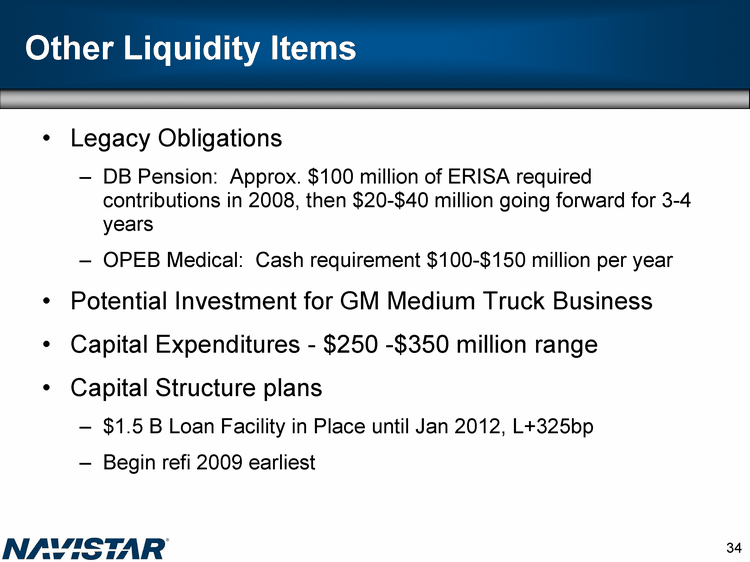
Other Liquidity Items Legacy Obligations DB Pension: Approx. $100 million of ERISA required contributions in 2008, then $20-$40 million going forward for 3-4 years OPEB Medical: Cash requirement $100-$150 million per year Potential Investment for GM Medium Truck Business Capital Expenditures - $250 -$350 million range Capital Structure plans $1.5 B Loan Facility in Place until Jan 2012, L+325bp Begin refi 2009 earliest |
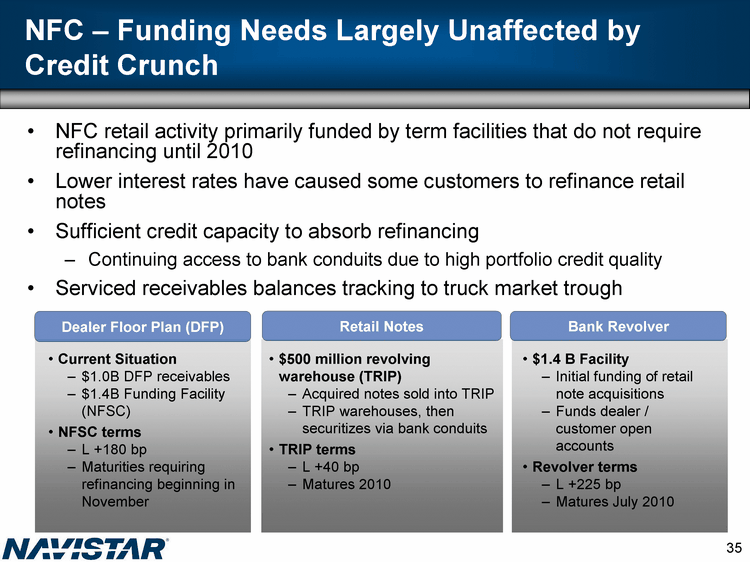
NFC - Funding Needs Largely Unaffected by Credit Crunch NFC retail activity primarily funded by term facilities that do not require refinancing until 2010 Lower interest rates have caused some customers to refinance retail notes Sufficient credit capacity to absorb refinancing Continuing access to bank conduits due to high portfolio credit quality Serviced receivables balances tracking to truck market trough Dealer Floor Plan (DFP) Retail Notes Bank Revolver Current Situation $1.0B DFP receivables $1.4B Funding Facility (NFSC) NFSC terms L +180 bp Maturities requiring refinancing beginning in November $500 million revolving warehouse (TRIP) Acquired notes sold into TRIP TRIP warehouses, then securitizes via bank conduits TRIP terms L +30 bp Matures 2010 $1.4 B Facility Initial funding of retail note acquisitions Funds dealer / customer open accounts Revolver terms L +200 bp Matures July 2010 |
Agenda 2008-2009 Industry Landscape Progress on Strategy Great Products Competitive Cost Structure Profitable Growth Current Filing Status Continuing Liquidity Summary |
2006 *Pro Forma segment margin has been revised from $1.5 B to $1.6 B due to the movement of post 1986 retirement costs out of segment margins into corporate SG&A We expect our strategy will enable us to deliver our 2009 goal Preliminary & Unaudited $1.6 * Engine Actions/ MaxxForce Operating Efficiencies 10-20% Savings Global Sourcing ProStar +$3K/ Truck Expansionary Growth +15-20K Units Traditional Share +2% Share Parts +$0.5B Revenue Military +$1.5B Revenue 2009 Complete Complete In progress Complete In progress In progress In progress In progress |
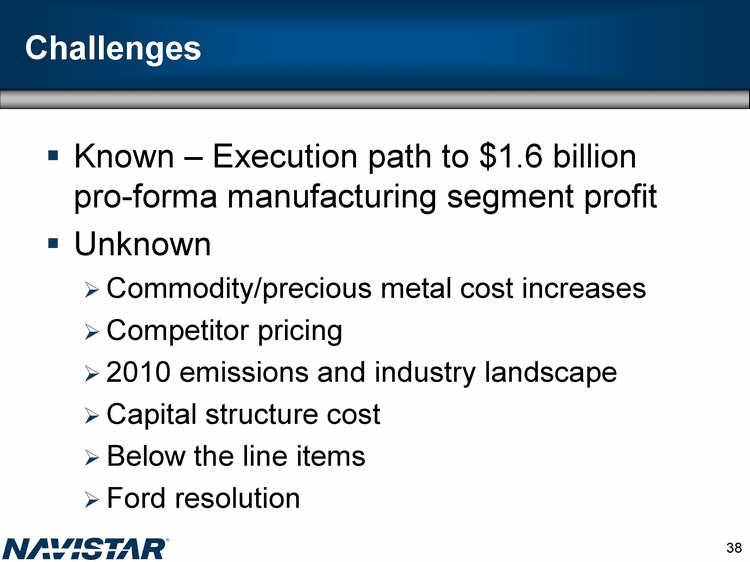
Challenges Known - Execution path to $1.6 billion pro-forma manufacturing segment profit Unknown Commodity/precious metal cost increases Competitor pricing 2010 emissions and industry landscape Capital structure cost Below the line items Ford resolution |
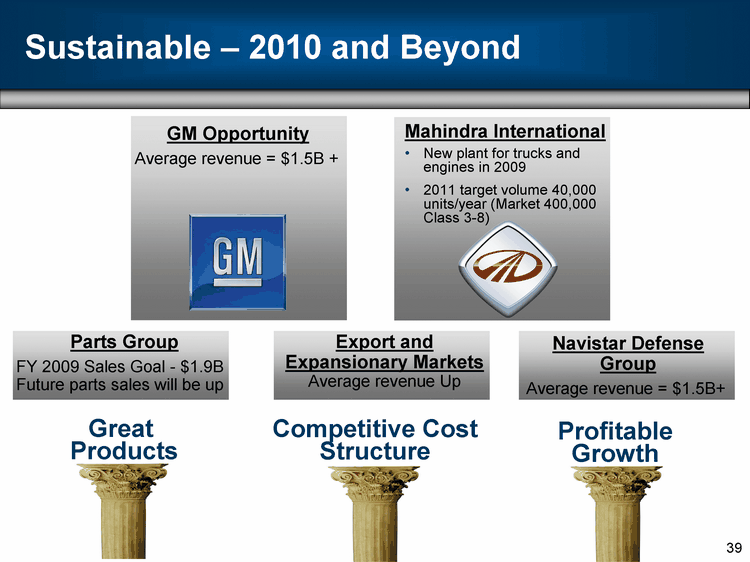
Sustainable - 2010 and Beyond GM Opportunity Average revenue = $1.5B + Mahindra International New plant for trucks and engines in 2009 2011 target volume 40,000 units/year (Market 400,000 Class 3-8) Navistar Defense Group Average revenue = $1.5B+ Competitive Cost Structure Profitable Growth Great Products Parts Group FY 2009 Sales Goal - $1.9B Future parts sales will be up Export and Expansionary Markets Average revenue Up |
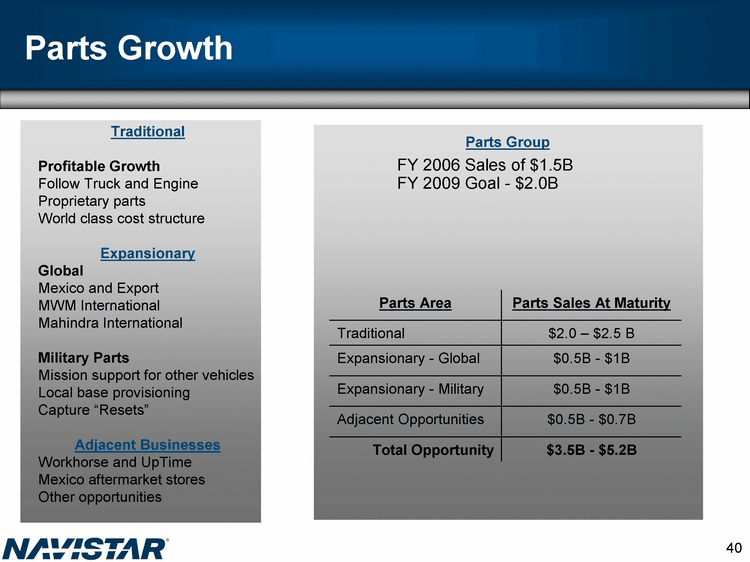
Parts Growth Parts Area Parts Sales At Maturity Traditional $2.0 - $2.5 B Expansionary - Global $0.5B - $1B Expansionary - Military $0.5B - $1B Adjacent Opportunities $0.5B - $0.7B Total Opportunity $3.5B - $5.2B Parts Group FY 2006 Sales of $1.5B FY 2009 Goal - $1.9B Traditional Profitable Growth Follow Truck and Engine Proprietary parts World class cost structure Expansionary Global Mexico and Export MWM International Mahindra International Military Parts Mission support for other vehicles Local base provisioning Capture "Resets" Adjacent Businesses Workhorse and UpTime Mexico aftermarket stores Other opportunities |
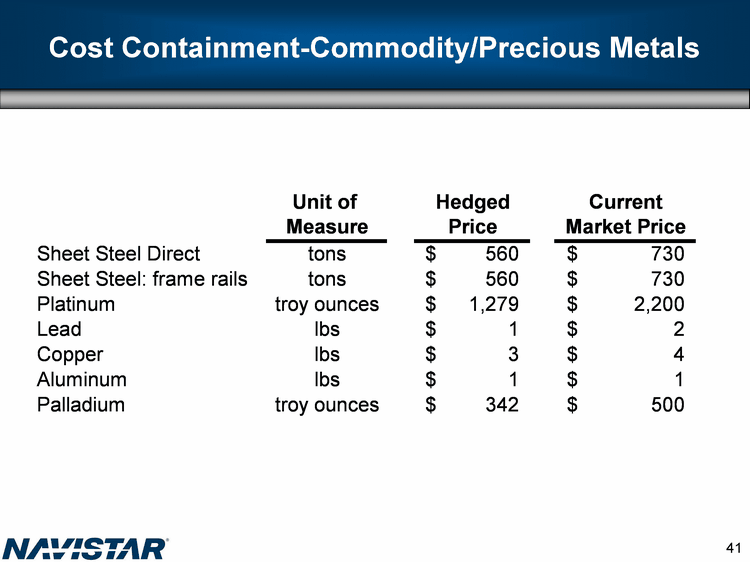
Cost Containment-Commodity/Precious Metals |
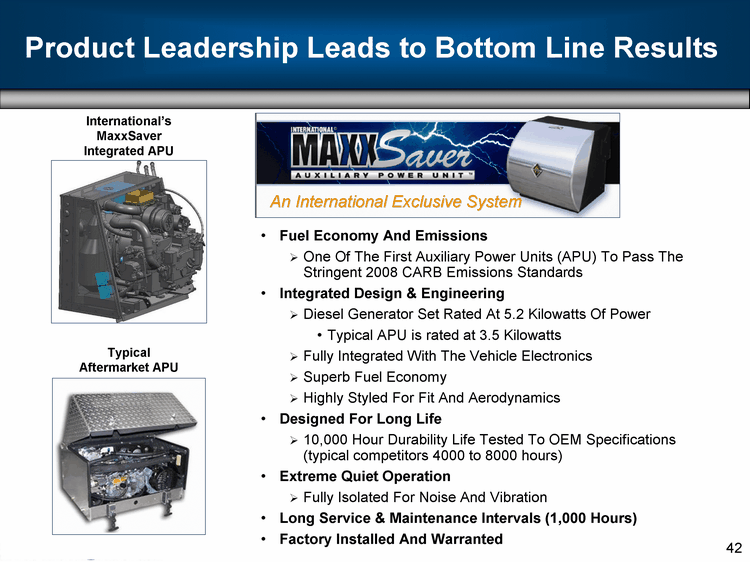
Fuel Economy And Emissions One Of The First Auxiliary Power Units (APU) To Pass The Stringent 2008 CARB Emissions Standards Integrated Design & Engineering Diesel Generator Set Rated At 5.2 Kilowatts Of Power Typical APU is rated at 3.5 Kilowatts Fully Integrated With The Vehicle Electronics Superb Fuel Economy Highly Styled For Fit And Aerodynamics Designed For Long Life 10,000 Hour Durability Life Tested To OEM Specifications (typical competitors 4000 to 8000 hours) Extreme Quiet Operation Fully Isolated For Noise And Vibration Long Service & Maintenance Intervals (1,000 Hours) Factory Installed And Warranted An International Exclusive System International's MaxxSaver Integrated APU Typical Aftermarket APU Product Leadership Leads to Bottom Line Results |
2010 Great Products Why we choose EGR vs. SCR? We believe SCR is a transitional-stop gap approach SCR forces the burden of compliance on the customer EGR builds on technologies we are using today without ongoing customer cost, complexity, and inconvenience Minimal, if any, effect on fuel economy |
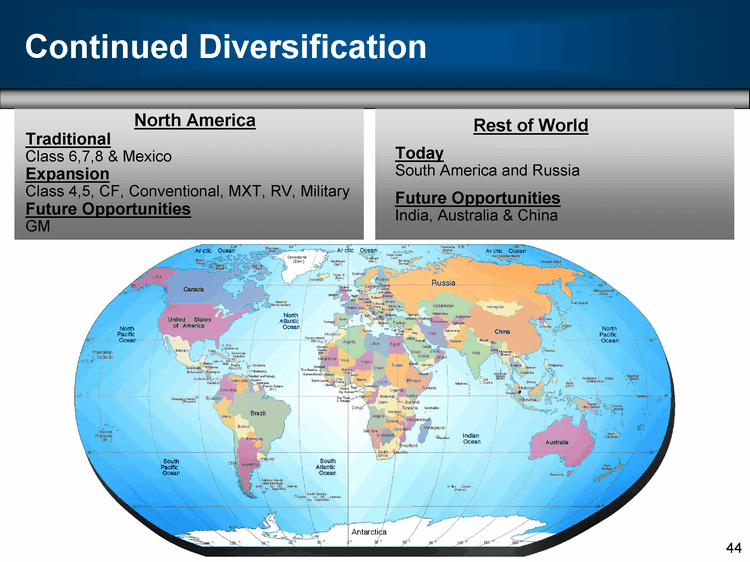
Continued Diversification North America Traditional Class 6,7,8 & Mexico Expansion Class 4,5, CF, Conventional, MXT, RV, Military Future Opportunities GM Rest of World Today South America and Russia Future Opportunities India, Australia & China |
Appendix |
Frequently Asked Questions Q1: What is the status of the GM opportunity? A: As for the potential acquisition of the General Motors medium-duty truck business, we are diligently working to make sure that any acquisition would be in the best interests of the company and its shareholders but given the status of negotiations and our confidentiality obligations, we are not in a position at this time to make any further public announcements on this matter. Q2: Why did you file the 2006 results as an 8K versus a 10K? A: To be expedient and adhere to our plan to be current by mid-year; we responded to what we thought the market was seeking and determined that we would report 2006 audited financials under an 8K. This allowed us to tighten the timeline while still providing the pertinent information our shareholders need-financial statements, MD&A and other valuable disclosures. Keep in mind that since we expect to file the 2007 10K relatively soon, the 2006 8K will have a relatively short "shelf life." The important point is we followed the same internal certification processes and KPMG followed the same standards for providing their audit opinion on the financial statements as if we had filed a 10k. We continue our ongoing dialogue with the SEC. They are aware of our process and supportive of our goal to be current by mid-year. Q3: What should we assume as the total on capital expenditures for 2008? A: For 2008, excluding our NFC and Dealcor acquisition of vehicles for leasing, we still expect our capital expenditures to be within the lower half of the $250 million to $350 million range. We continue to fund our strategic programs. |
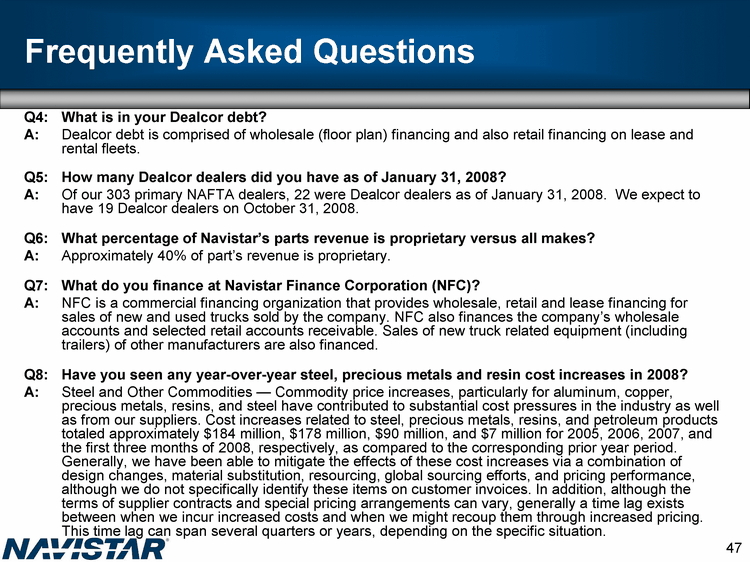
Frequently Asked Questions Q4: What is in your Dealcor debt? A: Dealcor debt is comprised of wholesale (floor plan) financing and also retail financing on lease and rental fleets. Q5: How many Dealcor dealers did you have as of January 31, 2008? A: Of our 303 primary NAFTA dealers, 22 were Dealcor dealers as of January 31, 2008. We expect to have 19 Dealcor dealers on October 31, 2008. Q6: What percentage of Navistar's parts revenue is proprietary versus all makes? A: Approximately 40% of part's revenue is proprietary. Q7: What do you finance at Navistar Finance Corporation (NFC)? A: NFC is a commercial financing organization that provides wholesale, retail and lease financing for sales of new and used trucks sold by the company. NFC also finances the company's wholesale accounts and selected retail accounts receivable. Sales of new truck related equipment (including trailers) of other manufacturers are also financed. Q8: Have you seen any year-over-year steel, precious metals and resin cost increases in 2008? A: Steel and Other Commodities - Commodity price increases, particularly for aluminum, copper, precious metals, resins, and steel have contributed to substantial cost pressures in the industry as well as from our suppliers. Cost increases related to steel, precious metals, resins, and petroleum products totaled approximately $184 million, $178 million, $90 million, and $7 million for 2005, 2006, 2007, and the first three months of 2008, respectively, as compared to the corresponding prior year period. Generally, we have been able to mitigate the effects of these cost increases via a combination of design changes, material substitution, resourcing, global sourcing efforts, and pricing performance, although we do not specifically identify these items on customer invoices. In addition, although the terms of supplier contracts and special pricing arrangements can vary, generally a time lag exists between when we incur increased costs and when we might recoup them through increased pricing. This time lag can span several quarters or years, depending on the specific situation. |
Frequently Asked Questions Q9: What is the status of your hybrid program? A: We were the first manufacturer to bring this technology to on line production and currently are producing our DuraStar hybrid trucks well as a hybrid version of our industry-leading IC Bus-brand school bus. To date, we have built and fielded over 100 units covering medium truck, bus, and package car applications. We have over 1.5 million miles of validation testing and are in the process of training our entire dealer organization on selling and servicing this new product. Q10: The future of diesel transportation is being impacted by environmental and energy issues such as fuel efficiency, climate change and clean air. How is Navistar responding to these growing influences? A: Navistar and its production units are fully engaged. Aerodynamic efficiency is the single most important issue to address to improve the fuel economy of on-highway trucks. International ProStar is the industry's most aerodynamic and fuel efficient Class 8 truck. We do extensive development in wind tunnels and work hard to achieve industry-leading aero-efficiency. And our recently introduced International LoneStar is setting a whole new standard of aero-efficiency among premium Class 8 trucks. We also believe hybrid technology will be a large part of the national response to climate change and fuel use and we are raising our role as a contributor to energy efficient transportation solutions in the commercial truck, commercial bus and school bus businesses. We are leveraging the natural fuel efficiency of diesel engines and vehicles in several key moves. We are building on our record as the leader in Green Diesel Technology, where Navistar set the pace for the industry in achieving this year's historically low emission requirements. We have advanced the standard of efficiency with our new ProStarTM truck. And we are well into the important wave of customer interest in hydraulic and electric hybrids. Navistar was recognized for leadership in the development of hybrid advanced technology in California, receiving the Blue Sky Award for 2007 from WestStart-CALSTART. |
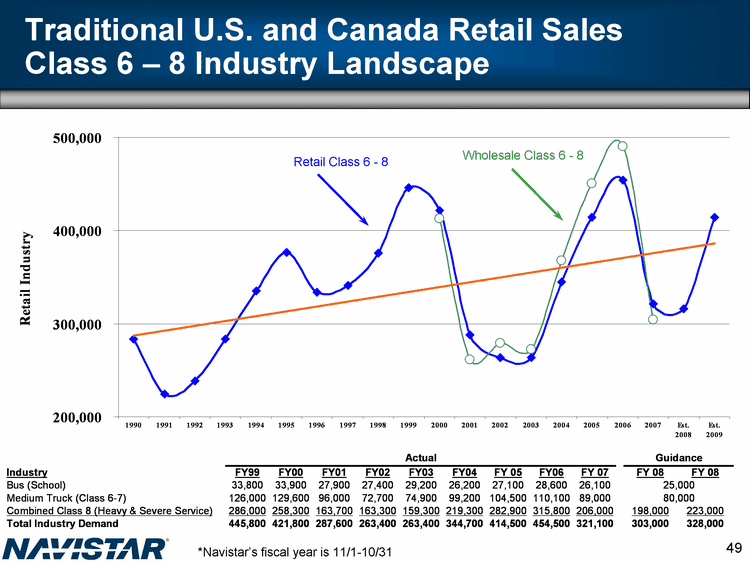
Traditional U.S. and Canada Retail Sales Class 6 - 8 Industry Landscape Retail Class 6 - 8 *Navistar's fiscal year is 11/1-10/31 Wholesale Class 6 - 8 |
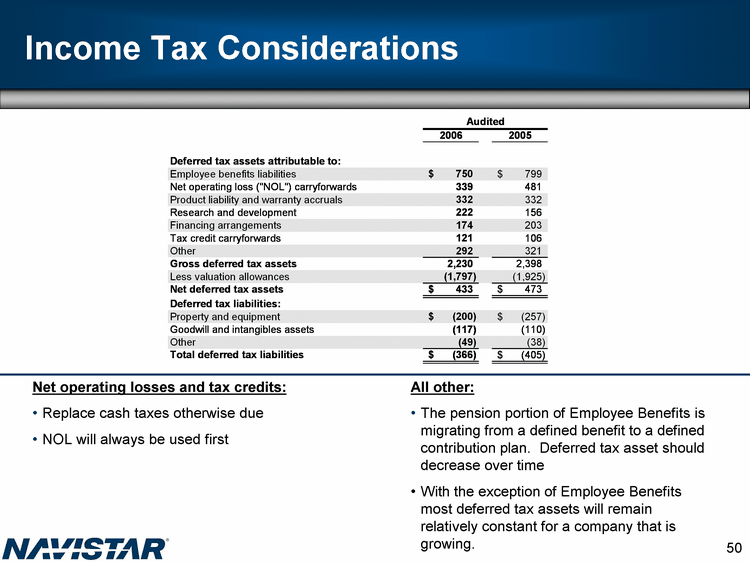
Income Tax Considerations Net operating losses and tax credits: Replace cash taxes otherwise due NOL will always be used first All other: The pension portion of Employee Benefits is migrating from a defined benefit to a defined contribution plan. Deferred tax asset should decrease over time With the exception of Employee Benefits most deferred tax assets will remain relatively constant for a company that is growing. |
Market Share - US & Canada School Bus and Class 6-8 Source: Wards, ACT, Polk data combined with Internal Company reports |
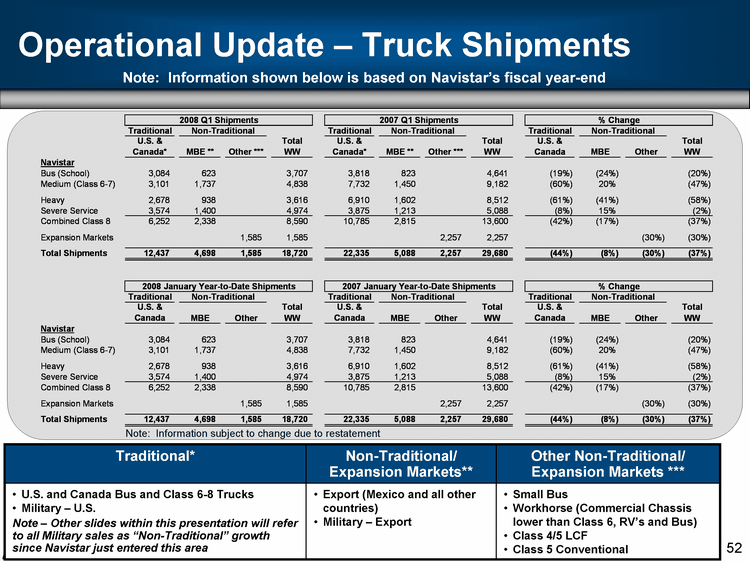
Operational Update - Truck Shipments Note: Information shown below is based on Navistar's fiscal year-end Traditional* Non-Traditional/ Expansion Markets** Other Non-Traditional/ Expansion Markets *** U.S. and Canada Bus and Class 6-8 Trucks Military - U.S. Note - Other slides within this presentation will refer to all Military sales as "Non-Traditional" growth since Navistar just entered this area Export (Mexico and all other countries) Military - Export Small Bus Workhorse (Commercial Chassis lower than Class 6, RV's and Bus) Class 4/5 LCF Class 5 Conventional Note: Information subject to change due to restatement |
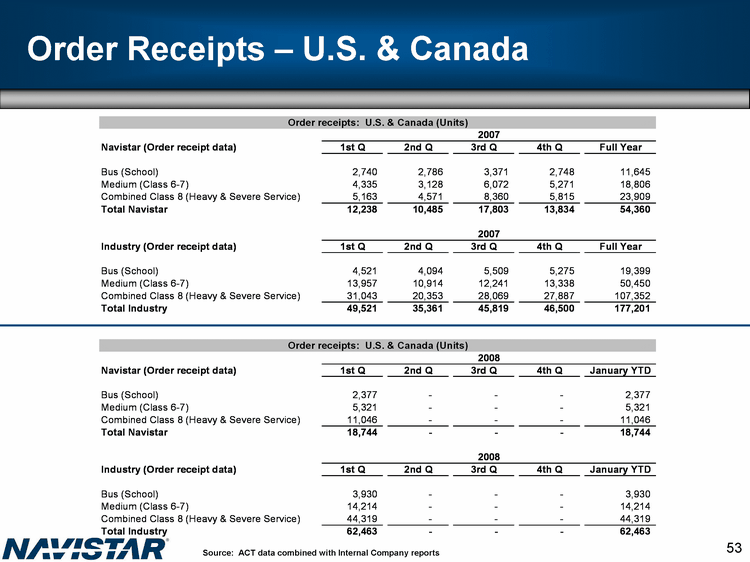
Order Receipts - U.S. & Canada Source: ACT data combined with Internal Company reports |
World Wide Engine Shipments |
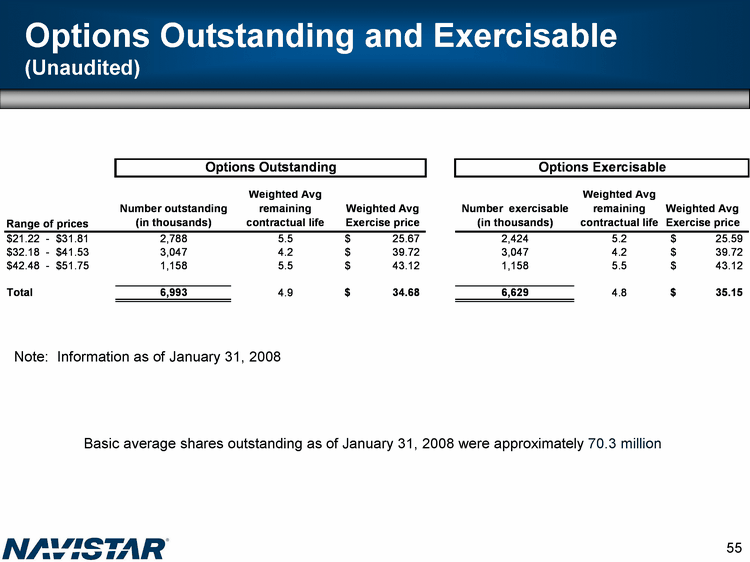
Options Outstanding and Exercisable (Unaudited) Basic average shares outstanding as of January 31, 2008 were approximately 70.3 million Note: Information as of January 31, 2008 |
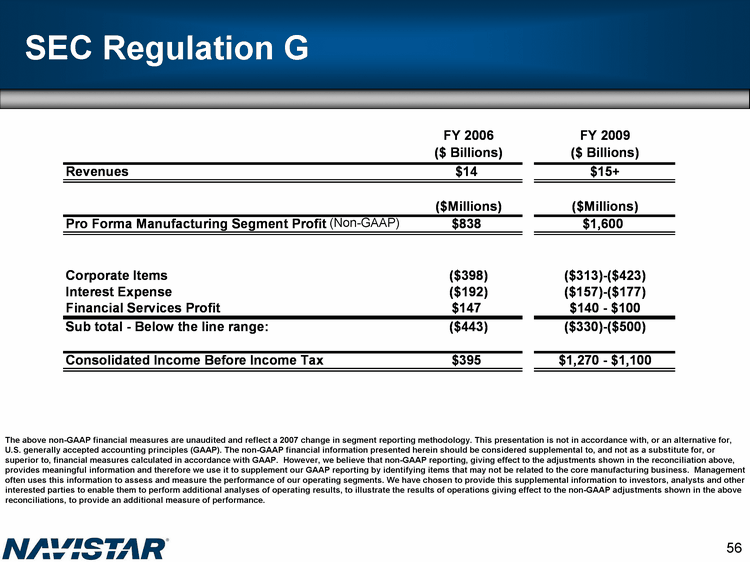
SEC Regulation G The above non-GAAP financial measures are unaudited and reflect a 2007 change in segment reporting methodology. This presentation is not in accordance with, or an alternative for, U.S. generally accepted accounting principles (GAAP). The non-GAAP financial information presented herein should be considered supplemental to, and not as a substitute for, or superior to, financial measures calculated in accordance with GAAP. However, we believe that non-GAAP reporting, giving effect to the adjustments shown in the reconciliation above, provides meaningful information and therefore we use it to supplement our GAAP reporting by identifying items that may not be related to the core manufacturing business. Management often uses this information to assess and measure the performance of our operating segments. We have chosen to provide this supplemental information to investors, analysts and other interested parties to enable them to perform additional analyses of operating results, to illustrate the results of operations giving effect to the non-GAAP adjustments shown in the above reconciliations, to provide an additional measure of performance. (Non-GAAP) |
SEC Regulation G The above non-GAAP financial measures are unaudited and reflect a 2007 change in segment reporting methodology. This presentation is not in accordance with, or an alternative for, U.S. generally accepted accounting principles (GAAP). The non-GAAP financial information presented herein should be considered supplemental to, and not as a substitute for, or superior to, financial measures calculated in accordance with GAAP. However, we believe that non-GAAP reporting, giving effect to the adjustments shown in the reconciliation above, provides meaningful information and therefore we use it to supplement our GAAP reporting by identifying items that may not be related to the core manufacturing business. Management often uses this information to assess and measure the performance of our operating segments. We have chosen to provide this supplemental information to investors, analysts and other interested parties to enable them to perform additional analyses of operating results, to illustrate the results of operations giving effect to the non-GAAP adjustments shown in the above reconciliations, to provide an additional measure of performance. |
Definitions Market Share - Information is compiled using Wards, ACT and POLK data combined with company internal reports. Market share information reflects retails sales in the United States and Canada for Classes 6-8. Retail Sales - Navistar defines a retail sale as any vehicle sold to the end customer. Shipment - Navistar defines a shipment as it is presented in the supplemental data as any shipment to the end customer or to an International dealer. Weight Classes - refers to the maximum amount a loaded truck should weigh - vehicle weight plus payload weight. There are eight classes of Gross Vehicle Weight Ratings (GVWR). Class 3 - 10,000 to 14,000 lbs Class 4 - 14,001 to 16000 lbs Class 5 - 16,000 to 19,500 lbs Class 6 - 19,501 - 26,000 lbs Class 7 - 26,001 - 33,000 lbs Class 8 - 33,001 lbs and above Order Receipt - An order receipt is a formal request to build a truck either for an end user (sold order) or for a dealer (stock order). Our order information comes from ACT Research and our own internal analysis. |