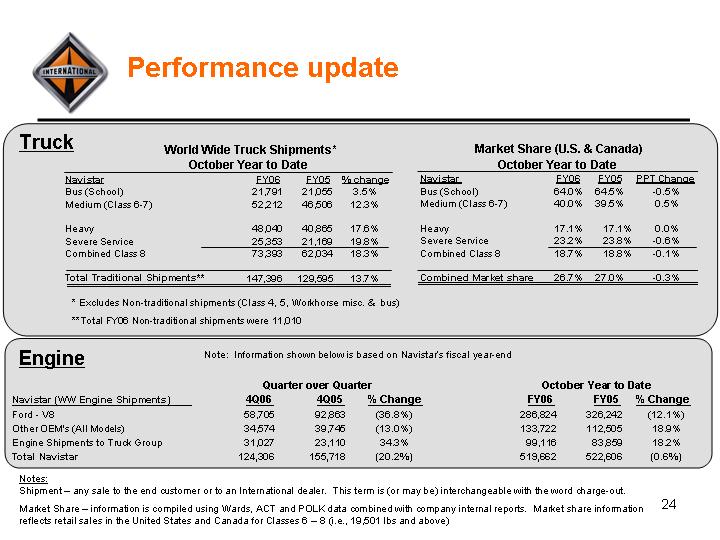
| Performance update Truck Navistar FY06 FY05 PPT Change Bus (School) 64.0% 64.5% - -0.5% Medium (Class 6-7) 40.0% 39.5% 0.5% Heavy 17.1% 17.1% 0.0% Severe Service 23.2% 23.8% - -0.6% Combined Class 8 18.7% 18.8% - -0.1% Combined Market share 26.7% 27.0% - -0.3% Market Share (U.S. & Canada) October Year to Date Navistar FY06 FY05 % change Bus (School) 21,791 21,055 3.5% Medium (Class 6-7) 52,212 46,506 12.3% Heavy 48,040 40,865 17.6% Severe Service 25,353 21,169 19.8% Combined Class 8 73,393 62,034 18.3% Total Traditional Shipments** 147,396 129,595 13.7% October Year to Date World Wide Truck Shipments* * Excludes Non-traditional shipments (Class 4, 5, Workhorse misc. & bus) **Total FY06 Non-traditional shipments were 11,010 Notes: Shipment - any sale to the end customer or to an International dealer. This term is (or may be) interchangeable with the word charge-out. Market Share - information is compiled using Wards, ACT and POLK data combined with company internal reports. Market share information reflects retail sales in the United States and Canada for Classes 6 - 8 (i.e., 19,501 lbs and above) Note: Information shown below is based on Navistar's fiscal year-end Engine Navistar (WW Engine Shipments) 4Q06 4Q05 % Change FY06 FY05 % Change Ford - V8 58,705 92,863 (36.8%) 286,824 326,242 (12.1%) Other OEM's (All Models) 34,574 39,745 (13.0%) 133,722 112,505 18.9% Engine Shipments to Truck Group 31,027 23,110 34.3% 99,116 83,859 18.2% Total Navistar 124,306 155,718 (20.2%) 519,662 522,606 (0.6%) October Year to Date Quarter over Quarter |