 Investor Conference Call 2 nd Quarter 2008 May 28, 2008 Exhibit 99.1 |
 2 Safe Harbor Statement Information provided and statements contained in this presentation that are not purely historical are forward- looking statements within the meaning of Section 27A of the Securities Act, Section 21E of the Exchange Act, and the Private Securities Litigation Reform Act of 1995. Such forward-looking statements only speak as of the date of this presentation and the company assumes no obligation to update the information included in this presentation. Such forward-looking statements include information concerning our possible or assumed future results of operations, including descriptions of our business strategy. These statements often include words such as “believe,” “expect,” “anticipate,” “intend,” “plan,” “estimate” or similar expressions. These statements are not guarantees of performance or results and they involve risks, uncertainties and assumptions, including the risk of continued delay in the completion of our financial statements and the consequences thereof, the availability of funds, either through cash on hand or the company’s other liquidity sources, to repay any amounts due should any of the company’s debt become accelerated, and decisions by suppliers and other vendors to restrict or eliminate customary trade and other credit terms for the company’s future orders and other services, which would require the company to pay cash and which could have a material adverse effect on the company’s liquidity position and financial condition. Although we believe that these forward-looking statements are based on reasonable assumptions, there are many factors that could affect our actual financial results or results of operations and could cause actual results to differ materially from those in the forward-looking statements. For a further description of these factors, see Item 1A. Risk Factors of our Form 10-K for the fiscal year ended October 31, 2005, which was filed on December 10, 2007. |
 3 Other Cautionary Legends • The financial information herein contains both audited and preliminary/unaudited and has been prepared by management in good faith and based on data currently available to the company. • Certain Non-GAAP measures are used in this presentation to assist the reader in understanding our core manufacturing business. We believe this information is useful and relevant to assess and measure the performance of our core manufacturing business as it illustrates manufacturing performance without regard to selected historical legacy costs (i.e. pension and other post-retirement costs) and other expenses that may not be related to the core manufacturing business. Management often uses this information to assess and measure the performance of our operating segments. A reconciliation to the most appropriate GAAP number is included in the appendix of this presentation. |
 4 Navistar Participants • Dan Ustian – Chairman, President, & Chief Executive Officer • Bill Caton – Executive Vice President & Chief Financial Officer • Terry Endsley – Senior Vice President & Treasurer • Heather Kos – Vice President, Investor Relations |
 5 Overview • FY 2008 1 st and 2 nd quarter 10-Q’s expected by end of June • Goal to be relisted on major exchange as soon as possible • Timely filer moving forward • Known – Execution of path to $1.6 billion manufacturing segment profit • Despite a weak 2008 U.S. and Canada Industry we will have a good year • Committed to 2009 goals |
 6 We expect our strategy will enable us to deliver our 2009 goals FY 2009 Goals • $15+ Billion Revenue • $1.6 Billion Manufacturing Segment Profit • Improve cost structure while developing synergistic niche businesses with richer margins • Improve conversion rate of operating income into net income • Reduce impact of cyclicality – Grow Parts – Non-Traditional/Expansion Markets Leveraging what we have and what others have built Leveraging what we have and what others have built Competitive Cost Structure Profitable Growth Great Products |
 7 Great Products Leveraging what we have and what others have built Class 6-7 ProStar™ School Bus 4400 11/13 Liter Big Bore Commercial Bus Workhorse Cl 3-7 2007 Engines LoneStar™ Military 7700 |
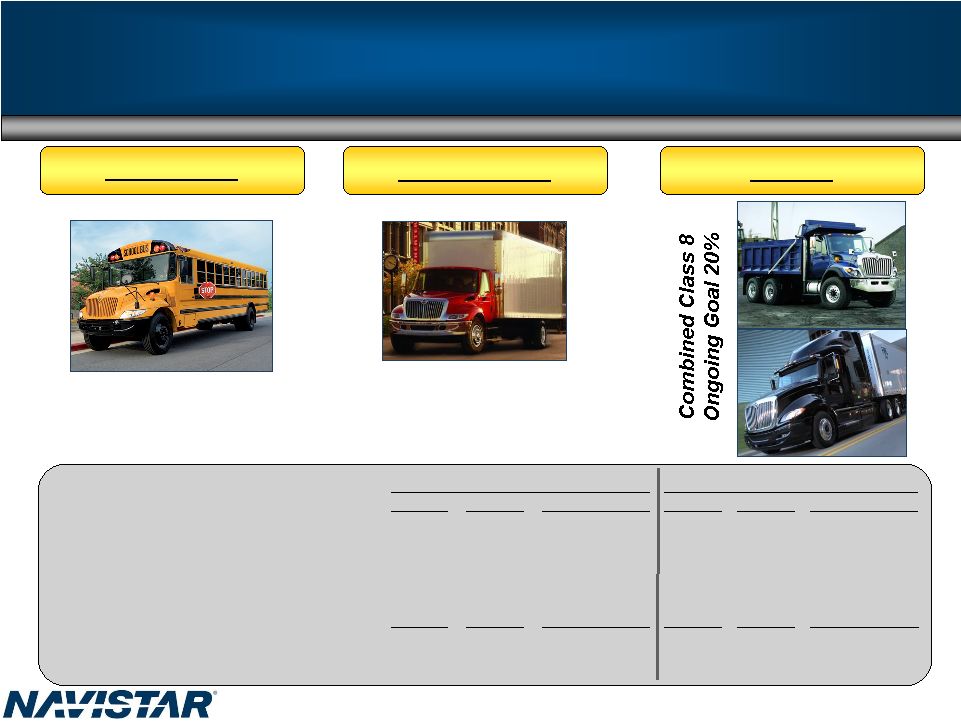 8 U.S. and Canada Traditional Market Share Leader in Class 6-8 Trucks and School Bus School Bus Class 6 and 7 Class 8 Ongoing Goal 60% Ongoing Goal 40% Navistar FY08 FY07 PPT Change FY08 FY07 PPT Change School Bus 56.6% 61.3% (4.7) ppt 57.8% 64.1% (6.3) ppt Class 6-7 - Medium 34.3% 35.4% (1.1) ppt 36.0% 30.0% 6.0 ppt Class 8 - Heavy 15.4% 14.3% 1.1 ppt 20.2% 13.3% 6.9 ppt Class 8 - Severe Service 35.7% 25.6% 10.1 ppt 41.0% 28.8% 12.2 ppt Combined Class 8 (Heavy & Severe Service) 22.7% 19.0% 3.7 ppt 26.5% 18.9% 7.6 ppt Total Navistar 29.0% 24.9% 4.1 ppt 31.1% 26.8% 4.3 ppt April YTD Market Share April YTD Order Receipt Share |
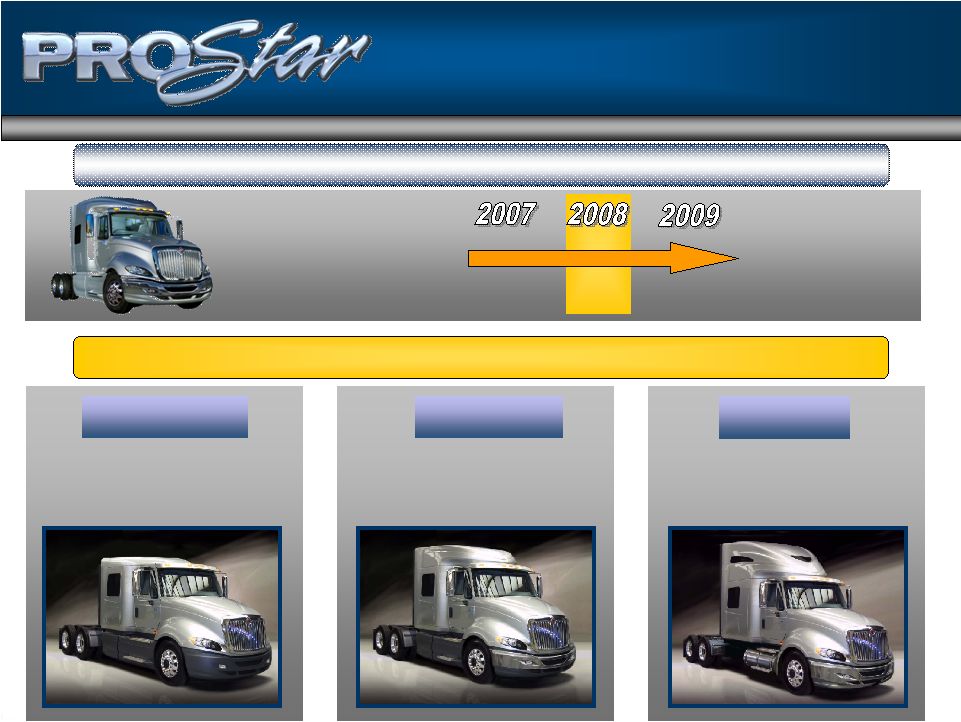 9 Skyrise 56” Flat Roof 113” BBC Positioned for Success 56” Flat Roof-Targeted for owner operators and fleet customers who haul bulk goods (i.e. coils and liquids) 113” BBC-owner operators and fleet customers that value improved visibility, maneuverability, and weight Sky Rise – targeted to optimize team driving fleets (coast-to-coast) 60% 100% 100% ProStar TM Phase II – launched in 1st half of 2008 Phase I – 122” Bumper to back of cab (BBC) - Complete Phase II in place |
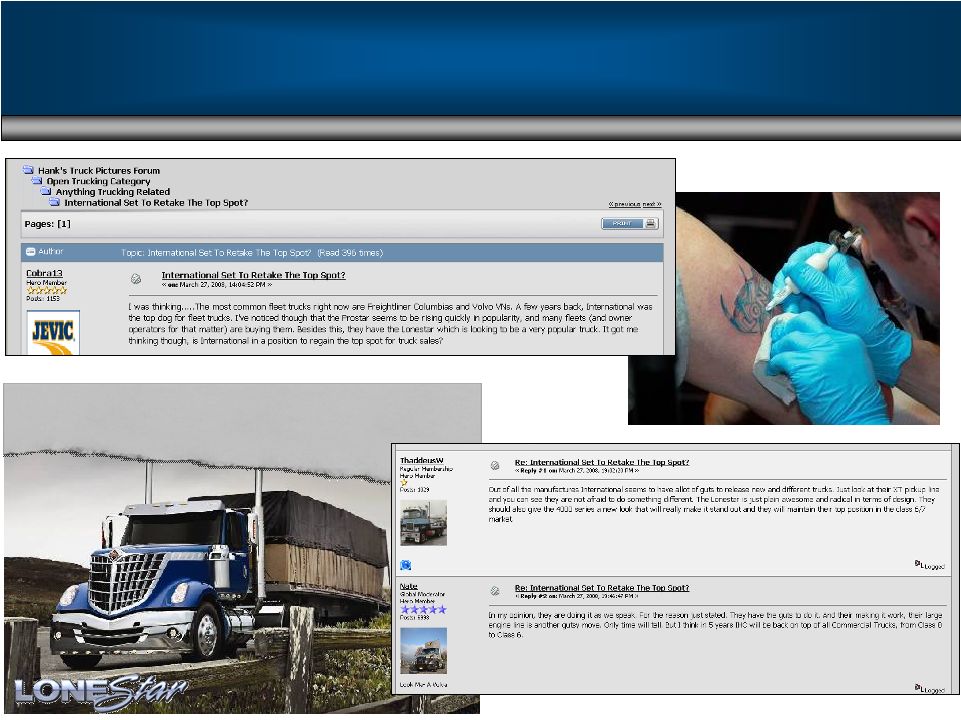 10 “If Spiderman hauled freight… this is what he’d drive” – Today’s Trucking Blogs – Message Boards |
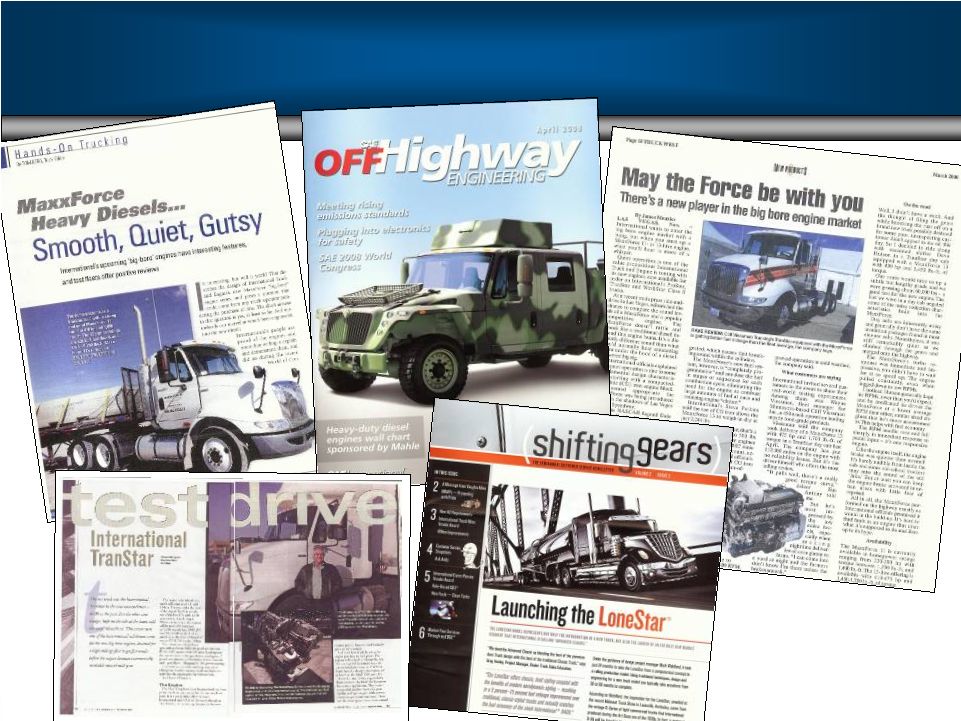 11 Industry News |
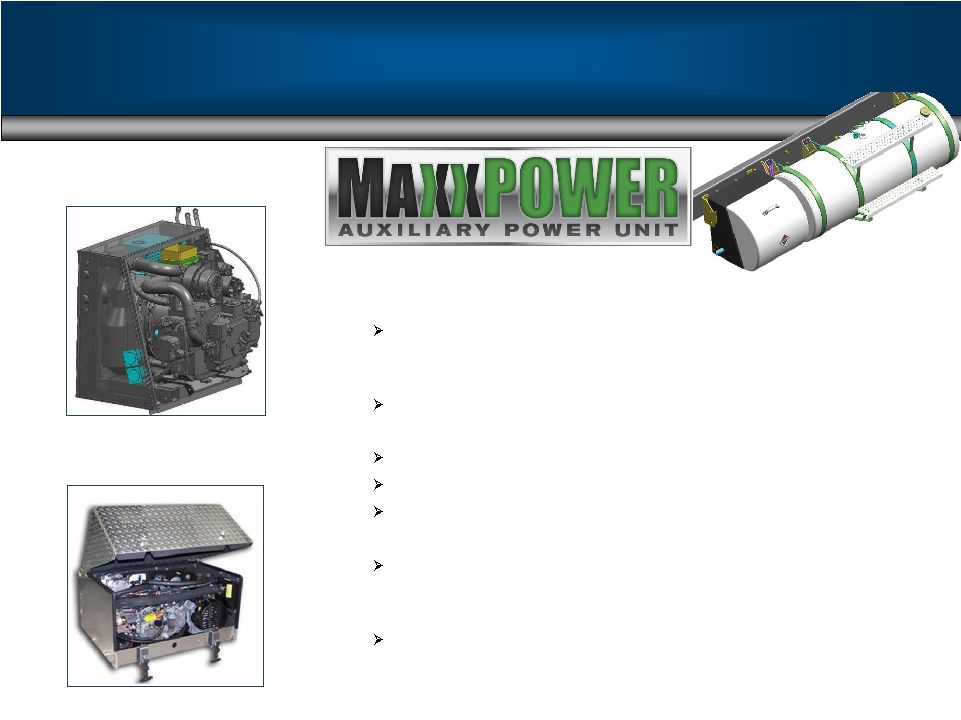 12 • Fuel Economy And Emissions One Of The First Auxiliary Power Units (APU) To Pass The Stringent 2008 CARB Emissions Standards • Integrated Design & Engineering Diesel Generator Set Rated At 5.2 Kilowatts Of Power • Typical APU is rated at 3.5 Kilowatts Fully Integrated With The Vehicle Electronics Best In Class Fuel Economy Highly Styled For Fit And Aerodynamics • Designed For Long Life 10,000 Hour Durability Life Tested To OEM Specifications (typical competitors 4000 to 8000 hours) • Extreme Quiet Operation Fully Isolated For Noise And Vibration • Long Service & Maintenance Intervals (1,000 Hours) • Factory Installed And Warranted An International Exclusive System International’s MaxxPower Integrated APU Typical Aftermarket APU Product Leadership |
 13 We expect our strategy will enable us to deliver our 2009 goals FY 2009 Goals • $15+ Billion Revenue • $1.6 Billion Manufacturing Segment Profit • Improve cost structure while developing synergistic niche businesses with richer margins • Improve conversion rate of operating income into net income • Reduce impact of cyclicality – Grow Parts – Non-Traditional/Expansion Markets Leveraging what we have and what others have built Leveraging what we have and what others have built Competitive Cost Structure Profitable Growth Great Products |
 14 Competitive Cost Structure Key Component of COGS Strategic initiatives ProStar™ MaxxForce™ Big Bore 11/13L Scale Strategic Partnerships Mahindra International South America Global Sourcing Performance on track / Volume / Dollar Weakness Overall goal is to continuously seek the needed quality at the best price Greater Flexibility Eliminated guaranteed employment Productivity Trades Stewards / Reps Sourcing non-core jobs Improved Manufacturing Cost Structure Wages frozen Healthcare contained New hire package competitive Wages Post-retirement Labor Operating Efficiencies Materials |
 15 11L / 13L MaxxForceTM 11L / 13L Engines Industry leading attributes Fuel economy Weight Noise Vibration Harshness (NVH) Imported production start: Dec. 2007 U.S. production start: Summer 2008 Significant cost savings versus purchased engines at peak production |
 16 We expect our strategy will enable us to deliver our 2009 goals FY 2009 Goals • $15+ Billion Revenue • $1.6 Billion Manufacturing Segment Profit • Improve cost structure while developing synergistic niche businesses with richer margins • Improve conversion rate of operating income into net income • Reduce impact of cyclicality – Grow Parts – Non-Traditional/Expansion Markets Leveraging what we have and what others have built Leveraging what we have and what others have built Competitive Cost Structure Profitable Growth Great Products |
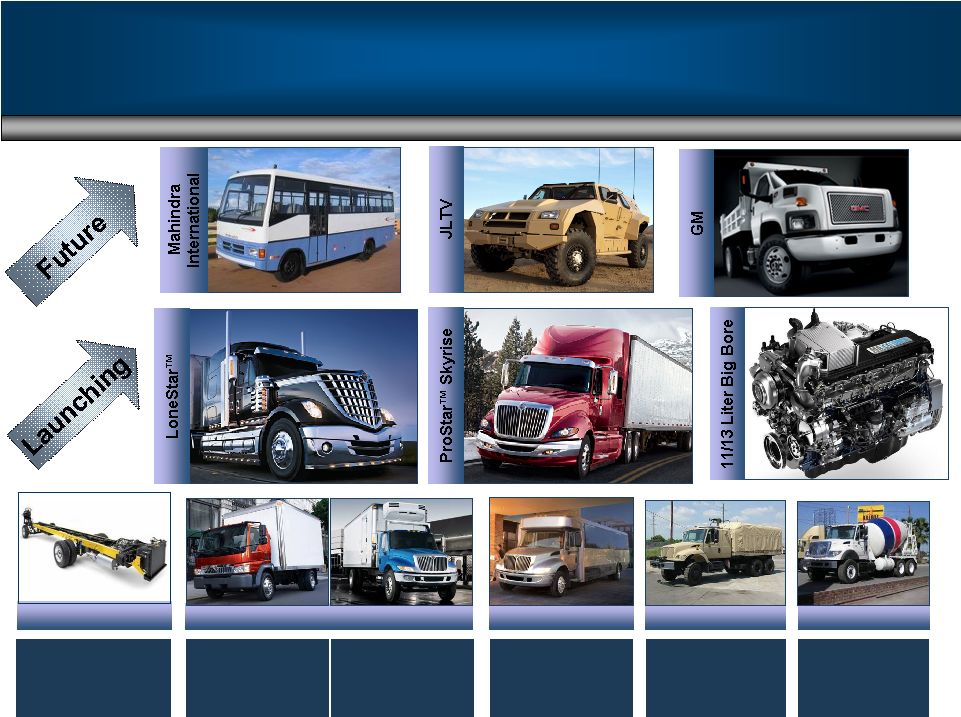 17 CF and Conventional Class 4/5 Profitable Growth Mexico & Export Increase export market share Military Commercial Bus Units delivered: FY 2005: ~ 1,300 FY 2006: ~ 2,900 FY 2007: ~ 3,200 Industry ranges from 35K – 45K Industry ranges from 20K – 30K Industry ranges from 45K – 60K Industry ranges from 9K – 13K Workhorse Cl 3-7 |
 18 Profitable Growth Mexico/Export – Continued Focus on Growth Mexico Delivering profitable growth 20 dealers with more than 85 locations 30% increase in dealer locations Fleet growth • Cemex • Femsa • Lala Export Russia Australia Grow existing markets • Latin America • South Africa • Middle East Dedicated dealers in all key markets Mahindra International Commercial Growth India and Exports • New full line Class 4-8 in development • New plant for trucks and engines in 2009 • 2011 target volume 40,000 units/year (market 400,000 Class 3-8) India’s first commercial vehicles with electronic common rail diesel engines Mexico Market Share 24.0% 25.0% 26.0% 27.0% 28.0% 29.0% 30.0% 31.0% 32.0% FY 2005 FY 2006 FY 2007 1st H FY08 |
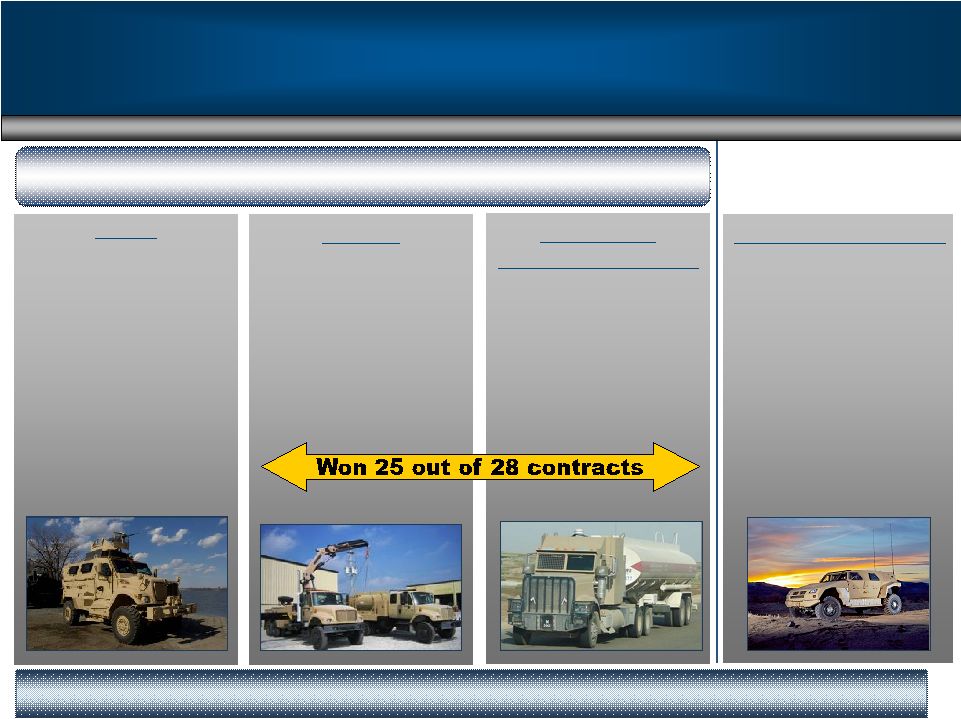 19 Profitable Growth Navistar Defense Tactical 7000 MV AFMTV Taiwan FMS Afghan Militarized / supporting vehicles 5000 MV Armored Line Haul Tractor TACOM-other urgent requirements MXT MRAP U.S. & Foreign Future Opportunities FMTV M915 JLTV We believe the military business is a $1.5 to $2 Billion sustainable business Navistar Defense Group |
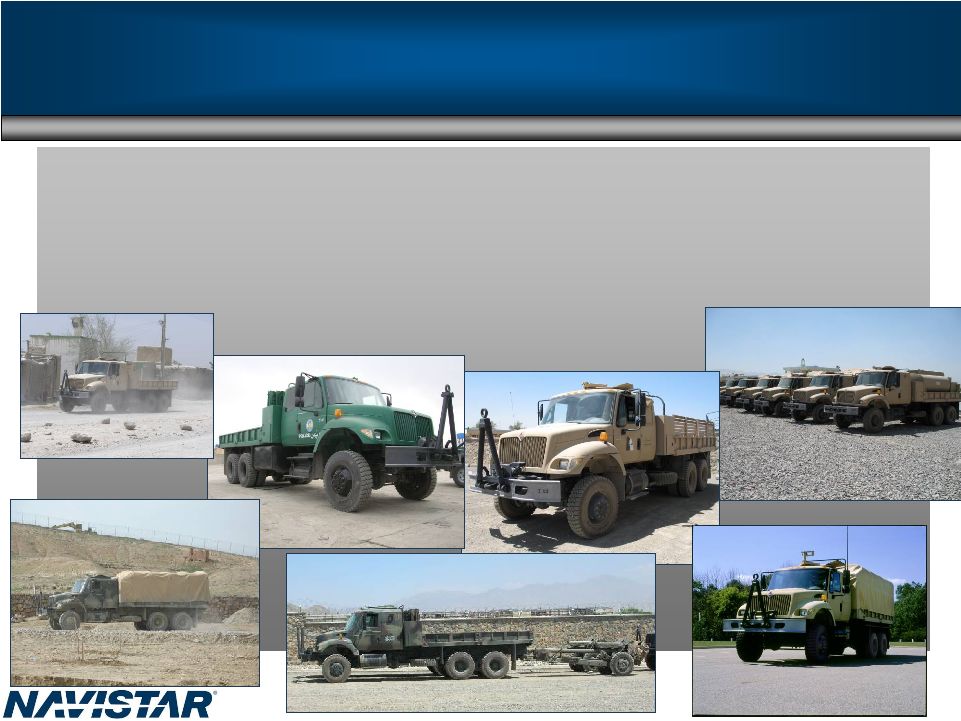 20 Delivering on our Commitments Tactical Vehicles for security and rebuilding in Afghanistan and Iraq • ~$1.3 Billion contract awarded April 2008 to provide tactical wheeled vehicles and parts • 7,072 vehicles and parts over three years |
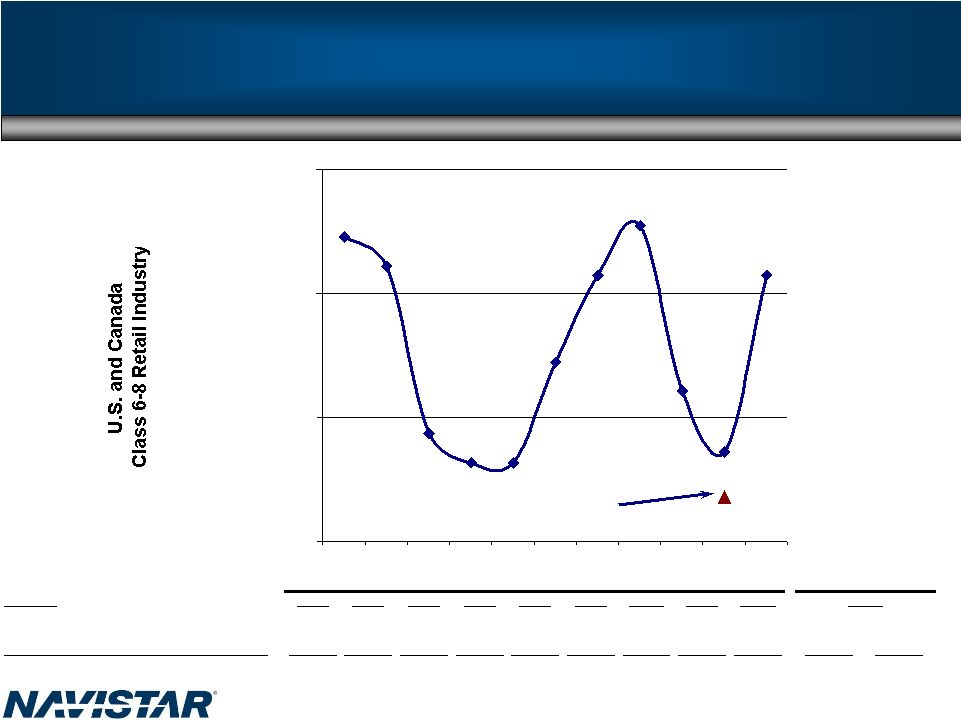 21 200,000 300,000 400,000 500,000 1999 2000 2001 2002 2003 2004 2005 2006 2007 2008 Guidance Est. 2009 Traditional U.S. and Canada Retail Sales Class 6 – 8 Industry Landscape FY 2008 retail class 6-8 annualized through April Navistar’s fiscal year is 11/1-10/31 Industry FY99 FY00 FY01 FY02 FY03 FY04 FY 05 FY06 FY 07 School Bus 33,800 33,900 27,900 27,400 29,200 26,200 26,800 28,200 24,500 20,000 24,000 Class 6-7 - Medium 126,000 129,600 96,000 72,700 74,900 99,200 104,600 110,400 88,500 63,000 70,000 Combined Class 8 (Heavy & Severe Service) 286,000 258,300 163,700 163,300 159,300 219,300 282,900 316,100 206,000 175,000 191,000 Total Industry Demand 445,800 421,800 287,600 263,400 263,400 344,700 414,300 454,700 319,000 258,000 285,000 FY 08 Guidance Actual |
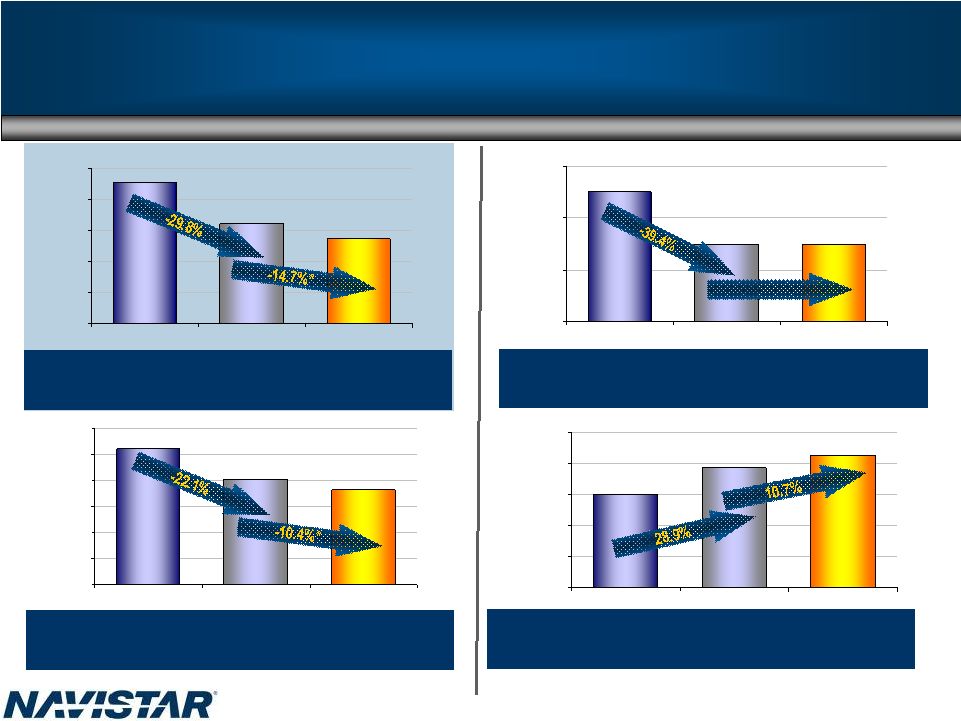 22 0 50,000 100,000 150,000 FY2006 FY2007 FY2008 Fcst* 0 10,000 20,000 30,000 40,000 50,000 FY2006 FY2007 FY2008 Goal 0 100,000 200,000 300,000 400,000 500,000 600,000 FY2006 FY2007 FY2008 Fcst* 0 100,000 200,000 300,000 400,000 500,000 FY2006 FY2007 FY2008 Fcst* 30,000 2008 Guidance 520,000 405,000 350K – 375K U.S. & Canada Truck Industry (Class 6-8 Units) 455,000 319,000 258K – 285K Navistar Expansionary** Shipments 38,000 42,500 126,000 75,000 70K – 80K *midpoint of guidance Navistar U.S. & Canada Shipments (Class 6-8 Units) Flat Navistar Engine Shipments **includes all military shipments |
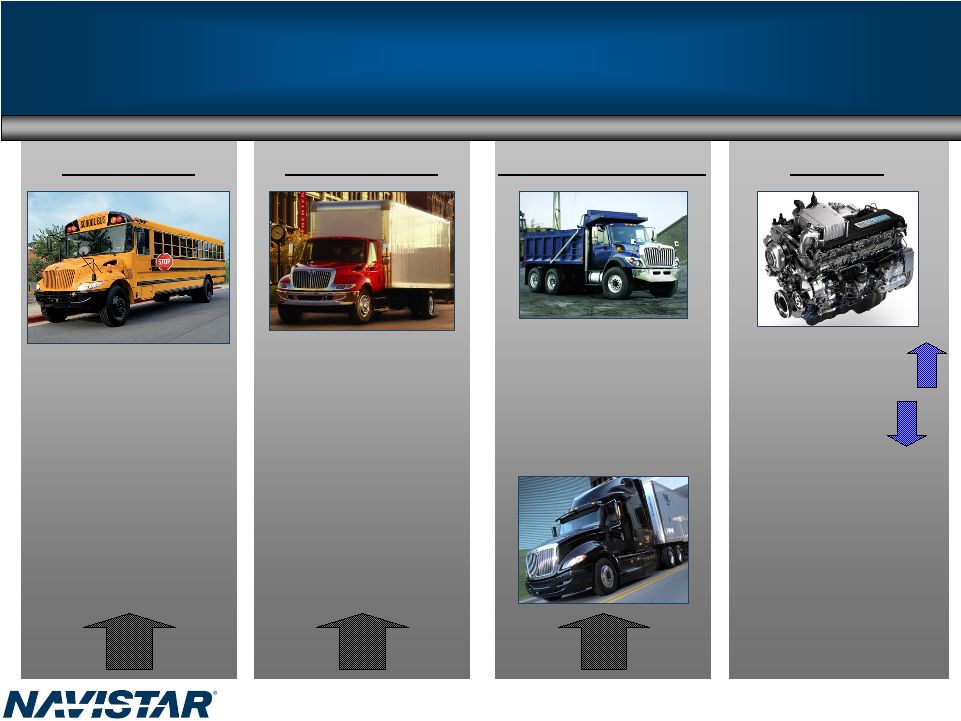       23 Great Products School Bus Class 6 and 7 Combined Class 8 Current - 72/Day May 19th – up 4% 1st Q – 65/day Current - 124/Day 91% increase Sept. 2nd – up 13% 1st Q – 165/day Current - 202/Day 22% increase May 19th – up 4% June 16th – up 14% Engines Current Inline - 350/Day V8 – 830/Day Note: All information is based on latest industry assumptions and is subject to change; depending on the facility, days of production varies |
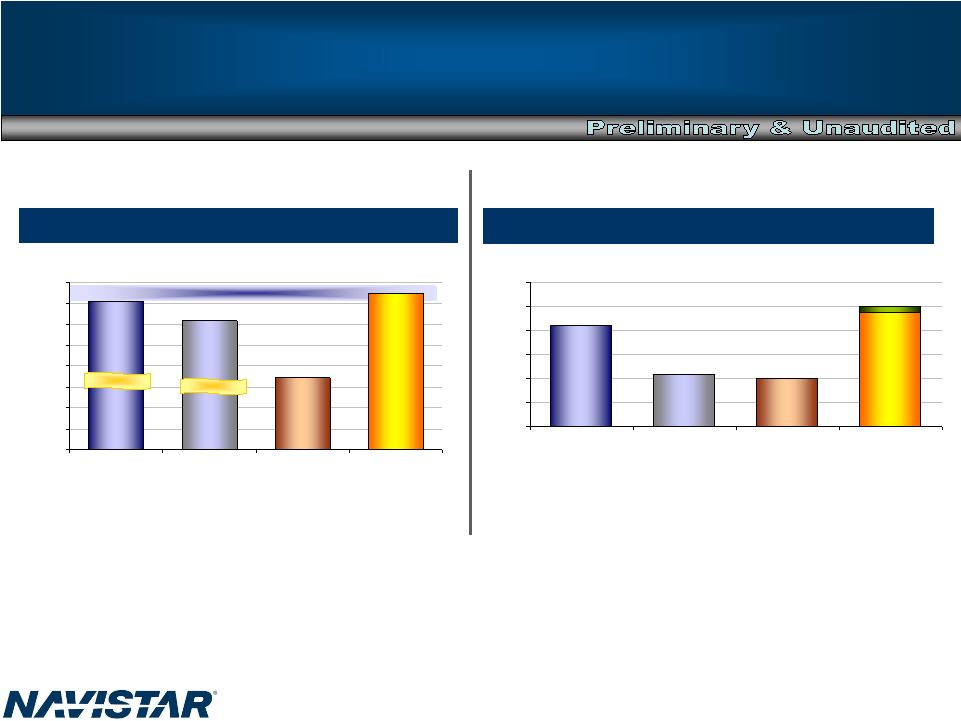 24 $0 $200 $400 $600 $800 $1,000 $1,200 FY2006 Full Year FY 2007 Full Year FY2008 1st Half* FY 2008 Full Year - - - - - - -$15B+ Goal by FY End 2009 - - - - - 0 2,000 4,000 6,000 8,000 10,000 12,000 14,000 16,000 FY2006 Full Year FY2007 Full Year FY2008 1st Half * FY 2008 Full Year 2008 Guidance Manufacturing Segment Profit ($ in millions) Consolidated Revenues ($ in millions) $14,200 *Charts reflect midpoint of guidance $12,300 $6,700 -$6,900 1st Half-$6,300 1st Half-$6,100 $15,000+ $838 $426 $375-425 $950-1,000 |
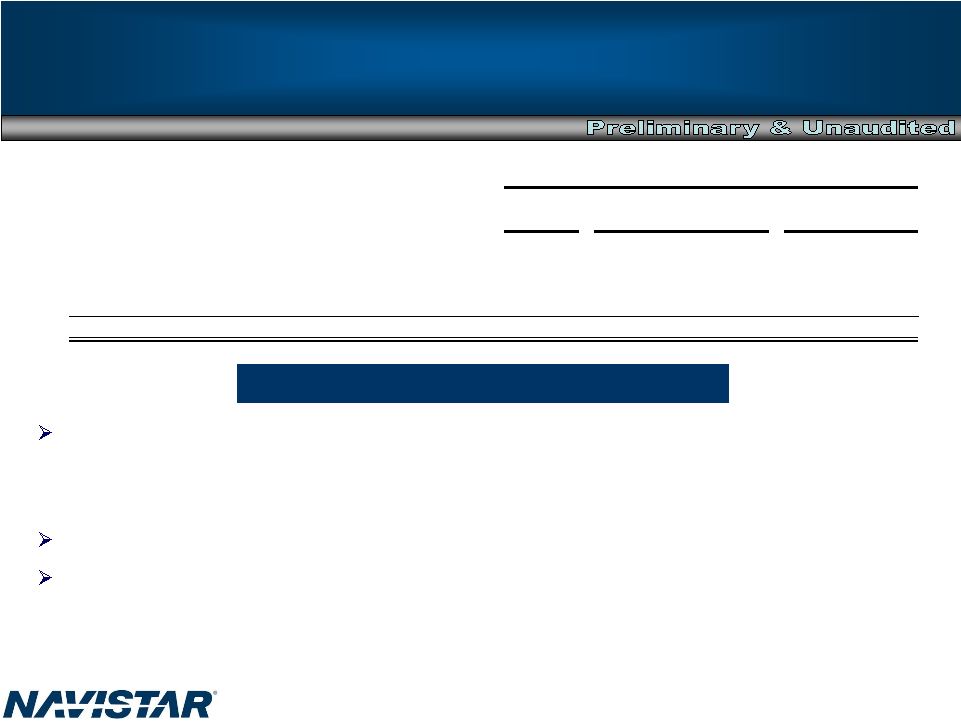 25 2008 Guidance – Below the Line Below the Line - Actions Corporate items: • SGA – On Track • Post retirement actions – On Track / Better Interest Expense – On Track NFC – Low End (challenges from lower industry volume, lower spreads, and accounting for derivatives) Actual Target FY 2007 FY 2009 Professional Fees ($224) ($140) ($160) ($20)-($30) Corporate Items (Excluding Professional Fees) ($207) ($280) ($300) ($293)-($393) Interest Expense (Manufacturing Only) ($196) ($140) ($160) ($157)-($177) Financial Services Profit $128 $70 $50 $140 - $100 Sub total - Below the line range: ($499) ($490) ($570) ($330)-($500) Full Year ($millions) Target FY 2008 |
 26 -$3,000 -$2,500 -$2,000 -$1,500 -$1,000 -$500 $0 FY 2005 FY 2006 FY 2007 $0 $20 $40 $60 $80 $100 $120 $140 $160 $180 $200 $220 $240 FY 2005 FY 2006 FY 2007 2008 Guidance – Post Retirement Plans $224 $209 $122 Post retirement benefits - Expense Pension funded status improved from $(865) million to $(197) million Health and Life Insurance benefits funded status improved from $(1.7) billion to $(1.1) billion Post Retirement plans funded status improved due to return on plan assets, rising discount rates and lowered expected medical costs for our Medicare eligible retiree population Post retirement benefits – Funded Status $(2,979) $(2,535) $(1,338) |
 0 2,000 4,000 6,000 8,000 10,000 12,000 14,000 16,000 FY2006 Full Year FY2007 Full Year FY2008 1st Half * FY 2008 Full Year 200,000 300,000 400,000 500,000 1999 2000 2001 2002 2003 2004 2005 2006 2007 2008 Guidance Est. 2009 27 $0 $200 $400 $600 $800 $1,000 $1,200 FY2006 Full Year FY 2007 Full Year FY2008 1st Half* FY 2008 Full Year - - - - - - -$15B Goal by FY End 2009 - - - - - Summary Manufacturing Segment Profit ($ in millions) Consolidated Revenues ($ in millions) $14,200 *Charts reflects midpoint of guidance $12,300 $6,800 1st Half-$6,300 1st Half-$6,100 $15,000+ $838 $426 $375-425 $950-1,000 Retail Class 6 - 8 FY 2008 retail class 6-8 annualized through April $0 $50 $100 $150 $200 FY 2006 1st Half FY 2007 1st Half FY 2008 1st Half Consolidated Pretax Income ($ in millions) $103 $6 $120 $200 range |
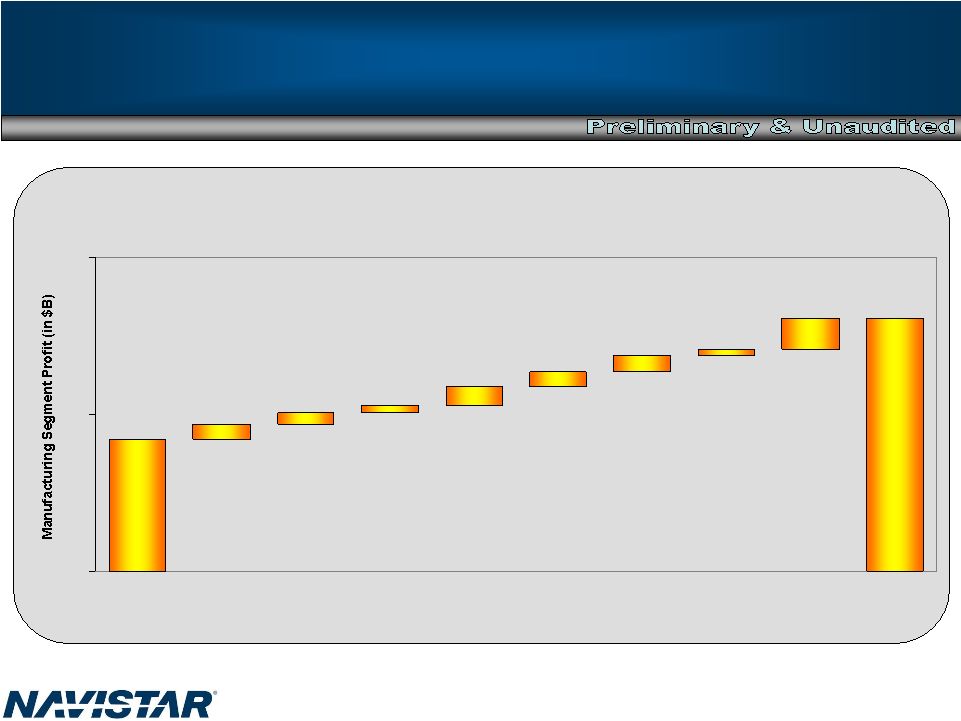 28 2006 - 2009 Manufacturing Segment Profit $0 $1 $2 2006 We expect our strategy will enable us to deliver our 2009 goal Goal $1.6* Engine Actions/ MaxxForceTM Operating Efficiencies 10-20% Savings Global Sourcing ProStarTM +$3K/ Truck Expansionary Growth +15-20K Units Traditional Share +2% Share Parts +$0.5B Revenue Military +$1.5B Revenue 2009 Complete Complete In Progress Complete In Progress In Progress In Progress In Progress Actual $838 |
 29 Current Filing Status • Continue to make progress on filing – 2007 10-K will be filed shortly – We have accelerated our 1 st and 2 nd Quarter 10-Q timelines; goal to file by end of June – We plan to be timely filer by 2008 3 rd Quarter 10-Q – Annual Meeting date set for September 5, 2008 • Associated professional auditing and consulting expenses continue to decline – Excess costs are quickly trending down and will be minimal by calendar year-end – Estimated normalized annual spend of $20M - $30M • Remediation plan supports long-term vision – As of 2007 fiscal year-end, three material weaknesses were remediated – Significant progress towards remaining items – Focus on strengthening people, processes, and systems – Foundational change will ensure that we have the controls in place to continue delivering accurate and timely financial results |
 30 Liquidity Overview • We have sufficient liquidity / borrowing capacity to execute our strategies • Manufacturing Parent Company: – Cash balances as expected – Significant borrowing capacity available from committed facilities • Finance Companies: – Completed $250 million retail note securitization April 25 – Access to relationship bank conduits will continue to be important – Sufficient capacity for dealer floor-plan financing |
 31 Capital Structure and Cash Audited Audited Fixed Rate Oct. 31, 2005 Oct. 31, 2006 Oct. 31, 2007 Apr. 30, 2008 9 3/8% Senior Notes 393 $ �� - $ - $ - $ 2 1/2% Convertible Notes 190 - - - 4 3/4% Convertible Notes 202 - - 7 1/2% Senior Notes 249 15 15 15 6 1/4% Senior Notes 400 - - - 9.95% Senior Notes 13 11 8 7 Floating Rate Bridge Loan Facility (L+500) - 1,500 - - Term Loan Facility (L+325), matures Jan 2012 - - 1,330 1,330 Other Debt 24 61 40 36 Deal Cor/VIE Dealer Debt 245 484 267 288 Sale/Leaseback Debt 408 400 368 321 Total Manufacturing Operations Debt 2,124 $ 2,471 $ 2,028 $ 1,997 $ Audited Audited Oct. 31, 2005 Oct. 31, 2006 Oct. 31, 2007 Apr. 30, 2008 Mfg cash, cash equivs. and marketables 867 $ 1,214 $ 722 $ 625 $ Preliminary & Unaudited Manufacturing Operations Debt (in millions) Manufacturing Operations Cash (in millions) Preliminary & Unaudited |
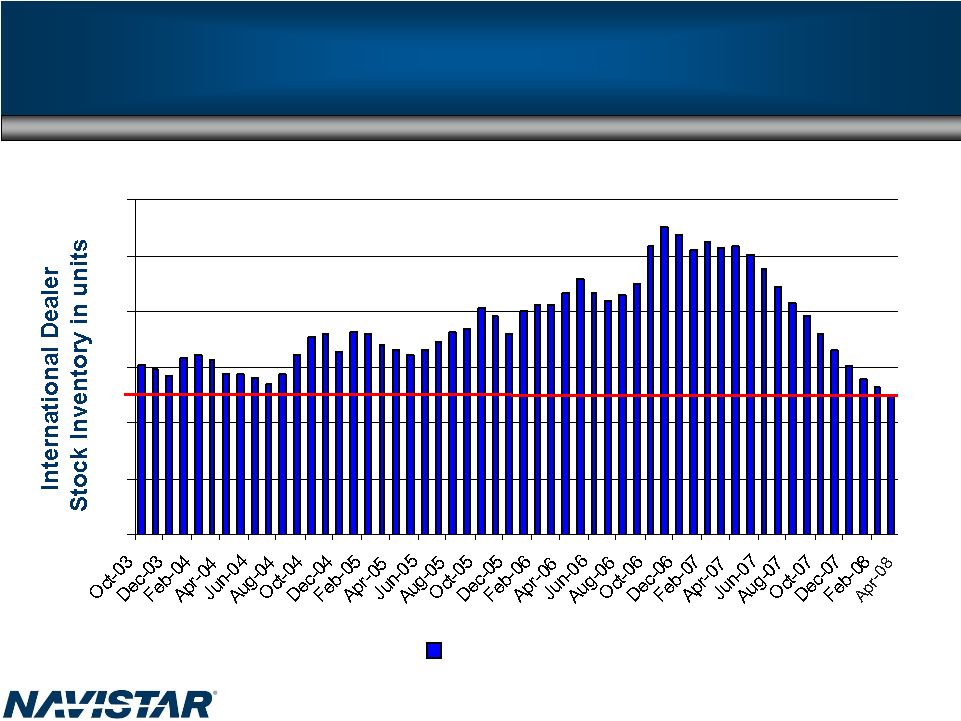 32 0 Stock Inventory Dealer Stock Inventory- Lowest point in over 5 years Note: Includes DealCor stock inventory Source: internal company reports |
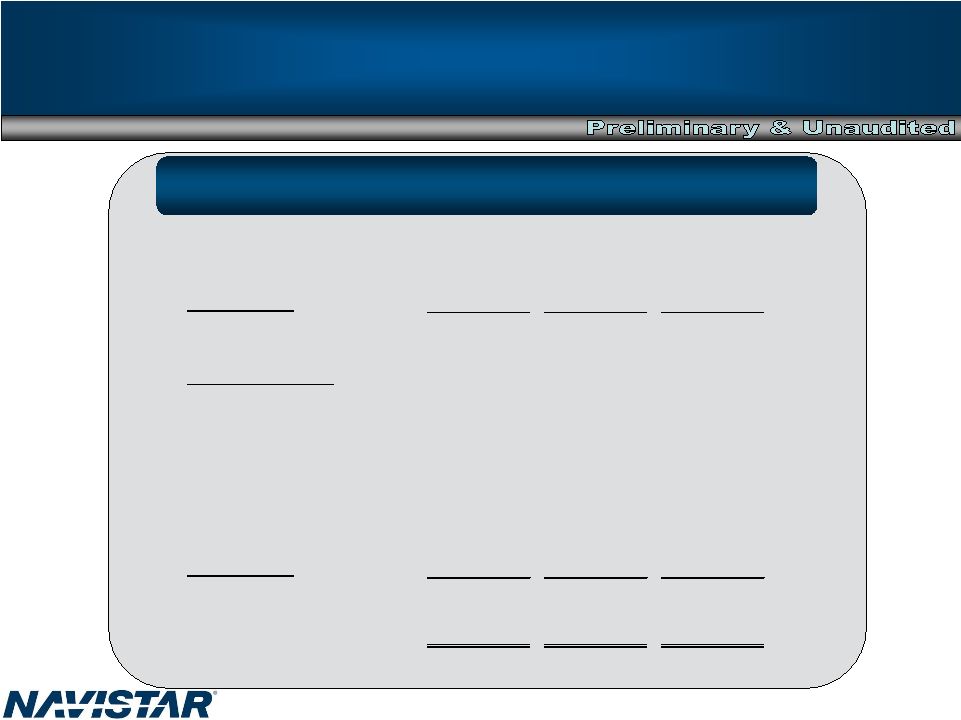 33 2007 / 2008 Liquidity 2007 / 2008 FY ($ millions) Mfg. Cash Bal.: (Preliminary and Unaudited) 2007 2008 Unaudited 6 months ended April 30 Forecast 2008 October 31, 2006 $1,214 October 31, 2007 $722 $722 Approx. Cash Flows: From Operations ($185) small source large source Dividends from NFC $400 $15 small source From Investing / Cap Ex ($254) ($83) large use From Financing / Debt Paydown ($453) ($34) approx. ($60) Mfg. Cash Bal.: October 31, 2007 $722 April 30, 2008 (approx.) $625 October 31, 2008 Fcst $550 - $650 |
 34 NFC’s ability to fund itself largely unaffected by credit crunch • NFC retail activity primarily funded by term facilities that do not require refinancing until 2010 • Lower interest rates have caused some customers to refinance retail notes • We have sufficient credit capacity to absorb refinancing – Continuing access to bank conduits due to high portfolio credit quality • Serviced receivables balances tracking to truck market trough Retail Notes Bank Revolver • Current Situation – $1.0B DFP receivables – $1.4B Funding Facility (NFSC) • NFSC terms – Libor +52 bp – Maturities requiring refinancing beginning in November Off-balance sheet • $500 million revolving warehouse (TRIP) – Acquired notes sold into TRIP – TRIP warehouses, then securitizes via bank conduits • TRIP terms – Libor +40 bp – Matures 2010 On-balance sheet • $1.4 B Facility – Initial funding of retail note acquisitions – Also funds dealer / customer open accounts • Revolver terms – Libor +225 bp – Matures July 2010 On-balance sheet Dealer Floor Plan (DFP) |
 35 Liquidity Summary • Expect truck production to increase in Q4 2008, restocking dealer inventory improved truck market and impact of new products • Parent company has no need to refinance in near-term – Benefiting from lower Libor interest rate – Intend to refinance opportunistically to stagger maturities • Finance companies will regain access to public markets when current filer – Next significant refinance date is November 2008 in facility that funds dealer-floor plan notes • We have sufficient liquidity / borrowing capacity to execute our strategies |
 36 We expect our strategy will enable us to deliver our 2009 goals and BEYOND FY 2009 Goals • $15+ Billion Revenue • $1.6 Billion Manufacturing Segment Profit • Improve cost structure while developing synergistic niche businesses with richer margins • Improve conversion rate of operating income into net income • Reduce impact of cyclicality – Grow Parts – Non-Traditional/Expansion Markets Leveraging what we have and what others have built Leveraging what we have and what others have built Competitive Cost Structure Profitable Growth Great Products |
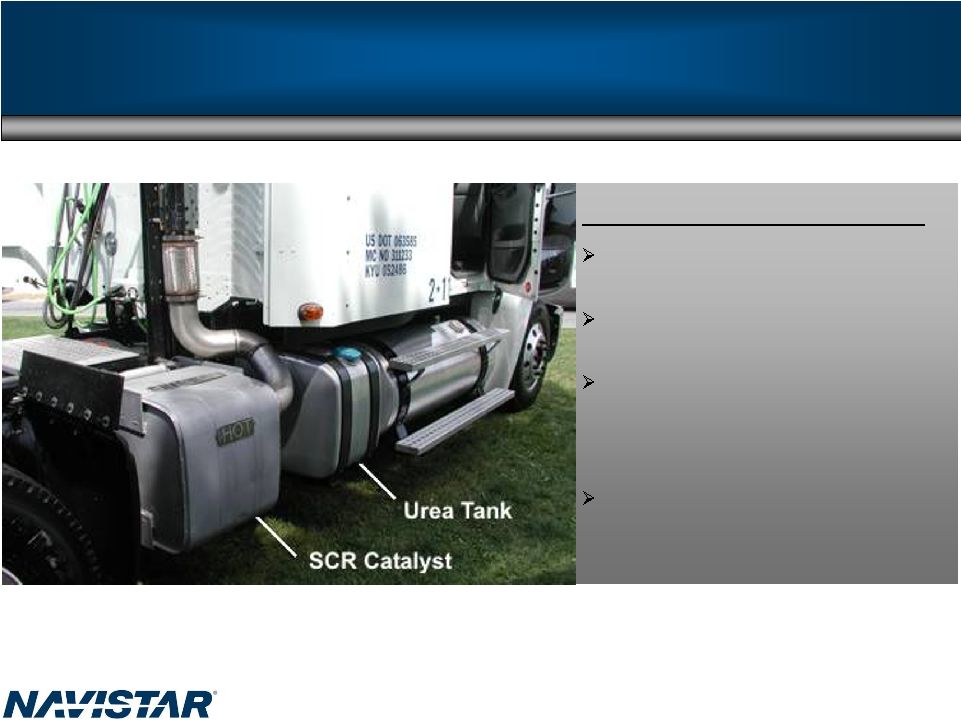 37 Strategy to sustain and improve 2010 and beyond Why we choose EGR vs. SCR: We believe SCR is a transitional-stop gap approach SCR forces the burden of compliance on the customer EGR builds on technologies we are using today without ongoing customer cost, complexity, and inconvenience Minimal, if any, effect on fuel economy |
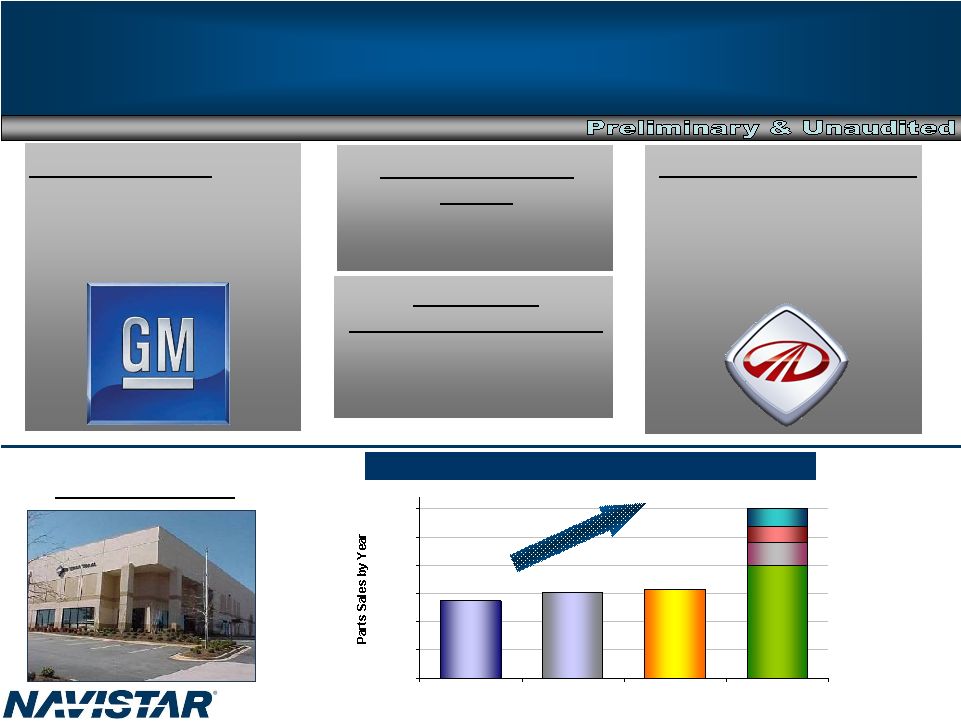 38 $0 $500 $1,000 $1,500 $2,000 $2,500 $3,000 FY 2005 FY 2006 FY 2007 FY 2012 Sustainable – 2010 and Beyond GM Opportunity Average revenue = $1.5B + Mahindra International • New plant for trucks and engines in 2009 • 2011 target volume 40,000 units/year (Market 400,000 Class 3-8) Navistar Defense Group Average revenue = $1.5B+ Export and Expansionary Markets Average Revenue Up Navistar Parts $1,373 $1,516 $1,562 $3,000 Part Sales at Maturity ($ in millions) Other Opportunities Military Expansionary Global Traditional Goal |
 39 Continued Diversification North America Traditional Class 6,7,8 & Mexico Expansion Class 4,5, CF, Conventional, MXT, RV, Military Future Opportunities GM Rest of World Today South America, South Africa and Russia Future Opportunities India, Russia, Australia & China |
 40 Challenges Known – Execution of path to $1.6 billion manufacturing segment profit Navistar 2010 emissions path Unknown Cost increases – commodity/precious metal/currency 2010 emissions industry landscape Capital structure cost Ford resolution Execution speed – ROW strategy |
 41 Summary 2008 industry recovery delayed with economy 2008 will be a strong year for Navistar despite a weak U.S. and Canada industry Plans in place for 2009 targets-$15+ Billion with $1.6 Billion Manufacturing Segment Profit Great Products Competitive Cost Structure Profitable Growth Growth in Export and Military Changing Diesel environment Sustainability 2010 and beyond |
 42 Appendix |
 43 2008 Guidance *Excludes debt of majority-owned dealerships **Represents cost included in both segments and corporate ***However, in general, we are always required to evaluate our valuation allowance position ($ Millions of dollars) 2007 2008 Guidance Capital Expenditures $312 $250 - $350 Professional Fees** $234 $150 - $170 Manufacturing Debt* $1,762 ~$1,700 Engineering & Product Development $382 $400 - $430 Manufacturing Cash Balance $722 $550 - $650 Income tax expense $47 ***No U.S. Federal, however, State and AMT taxes. Foreign tax rate ~mid 30’s. Diluted Shares 70.3 million ~73 million |
 44 Frequently Asked Questions Q1: What is the status of the GM opportunity? A: As for the potential acquisition of the General Motors medium-duty truck business, we are diligently working to make sure that any acquisition would be in the best interests of the company and its shareholders but given the status of negotiations and our confidentiality obligations, we are not in a position at this time to make any further public announcements on this matter. Q2: What should we assume as the total on capital expenditures for 2008? A: For 2008, excluding our NFC and Dealcor acquisition of vehicles for leasing, we expect our capital expenditures to be within the $250 million to $350 million range. We continue to fund our strategic programs. Q3: What is in your Dealcor debt? A: Dealcor debt is comprised of wholesale (floor plan) financing and also retail financing on lease and rental fleets that is securitized (owned by) third party financing sources. Q4: How many Dealcor dealers did you have as of April 30, 2008? A: Of our 302 primary NAFTA dealers, 20 were Dealcor dealers as of April 30, 2008. We expect to have 18 Dealcor dealers on October 31, 2008. Q5: What percentage of Navistar’s parts revenue is proprietary versus all makes? A: Approximately 40% of part’s revenue is proprietary. |
 45 Frequently Asked Questions Q6: What do you finance at Navistar Finance Corporation (NFC)? A: NFC is a commercial financing organization that provides wholesale, retail and lease financing for sales of new and used trucks sold by the company. NFC also finances the company’s wholesale accounts and selected retail accounts receivable. Sales of new truck related equipment (including trailers) of other manufacturers are also financed. Q7: Have you seen any year-over-year steel, precious metals and resin cost increases in 2008? A: Steel and Other Commodities — Commodity price increases, particularly for aluminum, copper, precious metals, resins, and steel have contributed to substantial cost pressures in the industry as well as from our suppliers. Cost increases related to steel, precious metals, resins, and petroleum products totaled approximately $184 million, $178 million, $86 million, and $20 million for 2005, 2006, 2007, and the six months of 2008, respectively, as compared to the corresponding prior year period. Generally, we have been able to mitigate the effects of these cost increases via a combination of design changes, material substitution, resourcing, global sourcing efforts, and pricing performance, although we do not specifically identify these items on customer invoices. In addition, although the terms of supplier contracts and special pricing arrangements can vary, generally a time lag exists between when we incur increased costs and when we might recoup them through increased pricing. This time lag can span several quarters or years, depending on the specific situation. Q8: What is the status of your hybrid program? A: We were the first manufacturer to bring this technology to on line production for Class 6 &7 and currently are producing our DuraStar™ hybrid trucks well as a hybrid version of our industry-leading IC Bus-brand school bus. To date, we have built and fielded over 200 units covering medium truck, bus, and package car applications. We have over 2.0 million miles of validation testing and are in the process of training our entire dealer organization on selling and servicing this new product. Certification tests are showing improvements of up to 70% in fuel economy and 40% in CO2 emissions. |
 46 Frequently Asked Questions Q9: The future of diesel transportation is being impacted by environmental and energy issues such as fuel efficiency, climate change and clean air. How is Navistar responding to these growing influences? A: Navistar and its production units are fully engaged and are offering solutions on multiple fronts to the commercial truck industry. Aerodynamic efficiency is the single most important issue to address to improve the fuel economy of on-highway trucks. International ProStar™ is the industry's most aerodynamic and fuel efficient Class 8 truck. We do extensive development in wind tunnels and work hard to achieve industry-leading aero-efficiency. And our recently introduced International® LoneStar™ is setting a whole new standard of aero-efficiency among premium Class 8 trucks. Another significant reduction in both fuel consumption and emissions can be achieved by reducing idle time of on-highway trucks. Navistar will be the first manufacturer to offer a fully integrated Alternate Power Unit (APU) when the MaxxPower™ APU is launched later this year. The MaxxPower™ APU allows drivers to operate the truck HVAC system and other "hotel" loads while consuming 80% less fuel than idling the main engine. We also believe hybrid technology will be a large part of the national response to climate change and fuel use and we are raising our role as a contributor to energy efficient transportation solutions in the commercial truck, commercial bus and school bus businesses. We are leveraging the natural fuel efficiency of diesel engines and vehicles in several key moves. We are building on our record as the leader in Green Diesel Technology, where Navistar set the pace for the industry in achieving this year’s historically low emission requirements. We have advanced the standard of efficiency with our new ProStar™ truck. And we are well into the important wave of customer interest in hydraulic and electric hybrids which will have a substantial impact on the reduction in green house gas emissions. Navistar was recognized for leadership in the development of hybrid advanced technology in California, receiving the Blue Sky Award for 2007 from WestStart-CALSTART. |
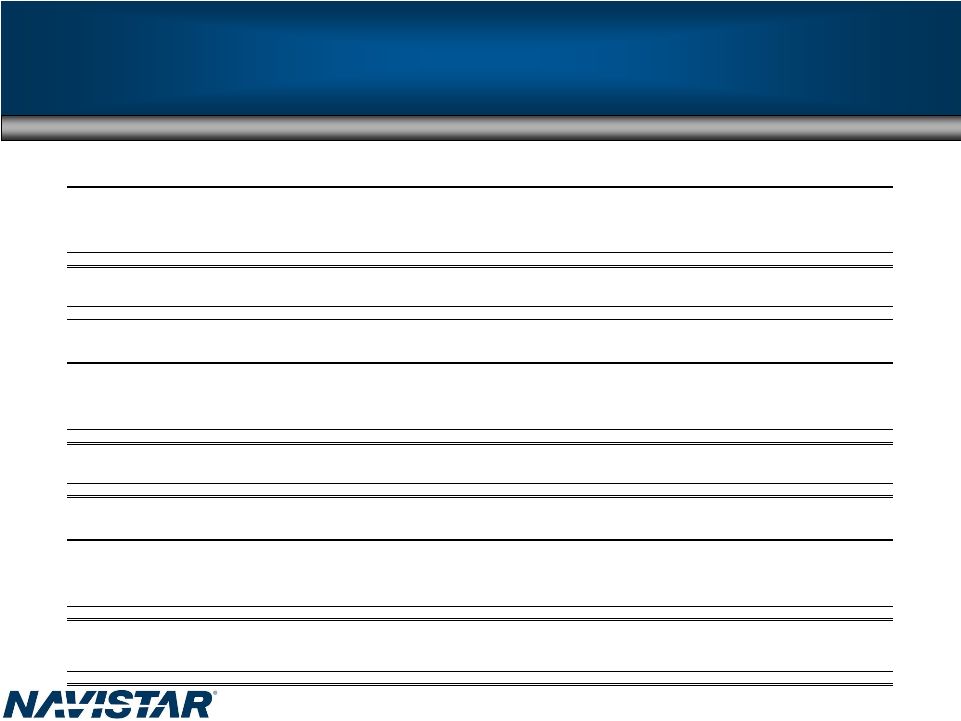 47 Truck Shipments Note: Information shown below is based on Navistar’s fiscal year-end FISCAL YEAR 06 FULL YEAR 06 Units Units Units Units Units BUS 4,100 4,500 4,300 5,100 18,000 MEDIUM TRUCK 7,300 11,500 12,100 14,300 45,200 HEAVY TRUCK 7,900 9,900 10,200 15,400 43,400 SEVERE SERVICE 3,900 4,500 4,300 6,300 19,000 TOTAL TRUCK SHIPMENTS 23,200 30,400 30,900 41,100 125,600 Military (U.S. and Foreign) 100 100 900 400 1,500 Expansionary Shipments 6,100 7,000 7,800 7,400 28,300 World Wide Truck Shipments 29,400 37,500 39,600 48,900 155,400 FISCAL YEAR 07 FULL YEAR 07 Units Qtr vs Qtr Units Qtr vs Qtr Units Qtr vs Qtr Units Qtr vs Qtr Units BUS 3,400 -17% 4,100 -9% 3,200 -26% 3,900 -24% 14,600 MEDIUM TRUCK 9,700 33% 6,800 -41% 5,600 -54% 6,600 -54% 28,700 HEAVY TRUCK 7,000 -11% 4,500 -55% 2,600 -75% 3,300 -79% 17,400 SEVERE SERVICE 3,900 0% 3,300 -27% 3,500 -19% 3,700 -41% 14,400 TOTAL TRUCK SHIPMENTS 24,000 3% 18,700 -38% 14,900 -52% 17,500 -57% 75,100 Military (U.S. and Foreign) 300 200% 400 300% 400 -56% 600 50% 1,700 Expansionary Shipments 9,400 54% 9,200 31% 9,300 19% 8,900 20% 36,800 World Wide Truck Shipments 33,700 15% 28,300 -25% 24,600 -38% 27,000 -45% 113,600 FISCAL YEAR 08 April YTD FY08 Units Qtr vs Qtr Units Qtr vs Qtr Units Qtr vs Qtr Units Qtr vs Qtr Units BUS 3,100 -9% 3,300 -20% 6,400 MEDIUM TRUCK 3,700 -62% 6,300 -7% 10,000 HEAVY TRUCK 2,600 -63% 3,900 -13% 6,500 SEVERE SERVICE 2,300 -41% 3,400 3% 5,700 TOTAL TRUCK SHIPMENTS 11,700 -51% 16,900 -10% - - 28,600 Military (U.S. and Foreign) 1,300 333% 2,000 400% 3,300 Expansionary Shipments 6,300 -33% 8,300 -10% 14,600 World Wide Truck Shipments 19,300 -43% 27,200 -4% - - 46,500 VOLUME BY PRODUCT LINE: 1Q06 2Q06 3Q06 4Q06 1Q07 2Q07 3Q07 4Q07 1Q08 2Q08 3Q08 4Q08 |
 48 World Wide Engine Shipments Navistar (WW Engine Shipments) 1st Q 2nd Q 3rd Q 4th Q Full Year Ford 80,200 92,200 75,200 68,100 315,700 Other OEM's (All Models) 25,300 29,000 26,500 24,100 104,900 Engine Shipments to Truck Group 17,600 24,300 25,100 32,100 99,100 Total Shipments 123,100 145,500 126,800 124,300 519,700 Navistar (WW Engine Shipments) 1st Q 2nd Q 3rd Q 4th Q Full Year Ford 60,000 56,200 65,300 53,500 235,000 Other OEM's (All Models) 21,000 26,400 29,200 27,700 104,300 Engine Shipments to Truck Group 23,100 12,100 13,700 16,500 65,400 Total Shipments 104,100 94,700 108,200 97,700 404,700 Navistar (WW Engine Shipments) 1st Q 2nd Q 3rd Q 4th Q April YTD Ford 47,000 55,300 - - 102,300 Other OEM's (All Models) 25,900 31,500 - - 57,400 Engine Shipments to Truck Group 12,900 15,700 - - 28,600 Total Shipments 85,800 102,500 - - 188,300 2008 2006 2007 |
 49 Order Receipts – U.S. & Canada Navistar (Order receipt data) 1st Q 2nd Q 3rd Q 4th Q Full Year Bus (School) 2,740 2,786 3,371 2,748 11,645 Medium (Class 6-7) 4,335 3,128 6,072 5,271 18,806 Combined Class 8 (Heavy & Severe Service) 5,163 4,571 8,360 5,815 23,909 Total Navistar 12,238 10,485 17,803 13,834 54,360 Industry (Order receipt data) 1st Q 2nd Q 3rd Q 4th Q Full Year Bus (School) 4,521 4,094 5,509 5,275 19,399 Medium (Class 6-7) 13,957 10,914 12,241 13,338 50,450 Combined Class 8 (Heavy & Severe Service) 31,043 20,353 28,069 27,887 107,352 Total Industry 49,521 35,361 45,819 46,500 177,201 Navistar (Order receipt data) 1st Q 2nd Q 3rd Q 4th Q April YTD Bus (School) 2,377 2,763 - - 5,140 Medium (Class 6-7) 5,321 5,597 - - 10,918 Combined Class 8 (Heavy & Severe Service) 11,046 11,268 - - 22,314 Total Navistar 18,744 19,628 - - 38,372 Industry (Order receipt data) 1st Q 2nd Q 3rd Q 4th Q April YTD Bus (School) 3,930 4,956 - - 8,886 Medium (Class 6-7) 14,214 16,145 - - 30,359 Combined Class 8 (Heavy & Severe Service) 44,319 39,839 - - 84,158 Total Industry 62,463 60,940 - - 123,403 2007 2007 Order receipts: U.S. & Canada (Units) Order receipts: U.S. & Canada (Units) 2008 2008 |
 50 Options Outstanding and Exercisable (Unaudited) Basic average shares outstanding as of April 30, 2008 were approximately 70.3 million. Note: Information as of April 30, 2008 Range of prices Number Outstanding (in thousands) Weighted Avg Remaining Contractual Life Weighted Avg Exercise Price Number Exercisable (in thousands) Weighted Avg Remaining Contractual Life Weighted Avg Exercise Price $21.22 - $31.81 2,775 5.2 25.66 $ 2,416 4.9 25.58 $ $32.18 - $41.53 3,043 3.9 39.72 3,043 3.9 39.72 $42.48 - $51.75 1,159 5.2 43.12 1,159 5.2 43.12 Total 6,977 4.6 34.69 $ 6,618 4.5 35.16 $ Options Outstanding Options Exercisable |
 51 SEC Regulation G The above non-GAAP financial measures are unaudited and reflect a 2007 change in segment reporting methodology. This presentation is not in accordance with, or an alternative for, U.S. generally accepted accounting principles (GAAP). The non-GAAP financial information presented herein should be considered supplemental to, and not as a substitute for, or superior to, financial measures calculated in accordance with GAAP. However, we believe that non-GAAP reporting, giving effect to the adjustments shown in the reconciliation above, provides meaningful information and therefore we use it to supplement our GAAP reporting by identifying items that may not be related to the core manufacturing business. Management often uses this information to assess and measure the performance of our operating segments. We have chosen to provide this supplemental information to investors, analysts and other interested parties to enable them to perform additional analyses of operating results, to illustrate the results of operations giving effect to the non-GAAP adjustments shown in the above reconciliations, to provide an additional measure of performance. DEBT YE 2005 YE 2006 YE 2007 2007 - 2Q 2008 - 2Q (in millions) Manufacturing operations January 2007 Loan Facility (Libor + 325) - $ - $ 1,330 $ 1,470 $ 1,330 $ Bridge Loan Facility (Libor + 500) - 1,500 - - - Financing arrangements and capital lease obligations 408 401 369 383 321 6.25% Senior Notes 400 - - - - 9.375% Senior Notes 393 - - - - 7.5% Senior Notes 249 15 15 15 15 Majority owned dealership debt 245 484 267 399 288 4.75% Subordinated Exchangeable Notes, due 2009 202 2.5% Senior Convertible Notes 190 - - - - 9.95% Senior Notes 13 11 8 10 7 Other 24 61 40 50 36 Total manufacturing operations debt 2,124 2,472 2,029 2,327 1,997 Financial services operations Borrowing secured by asset-backed securities,, at variable rates, due serially through 2011 2,779 $ 3,104 $ 2,748 $ 3,027 $ 2,585 $ Bank revolvers, variable rates, due 2010 838 1,426 1,355 1,232 1,562 Revolving retail warehouse facility, variable rates, due 2010 500 500 500 500 500 Commercial Paper - 28 117 92 190 Borrowing secured by operating and finance leases 148 116 132 132 134 Total financial services operations debt 4,265 $ 5,174 $ 4,852 $ 4,983 $ 4,971 $ Cash & Marketable Securities YE 2005 YE 2006 YE 2007 2007 - 2Q 2008 - 2Q Manufacturing non-GAAP 867 $ 1,214 $ 722 $ 584 $ 625 $ Financial Services non-GAAP 53 80 95 83 77 Consolidated US GAAP 920 $ 1,294 $ 817 $ 667 $ 702 $ (Audited) (Audited) (Preliminary and Unaudited) (Preliminary and Unaudited) |
 52 SEC Regulation G The above non-GAAP financial measures are unaudited and reflect a 2007 change in segment reporting methodology. This presentation is not in accordance with, or an alternative for, U.S. Generally accepted accounting principles (GAAP). The non-GAAP financial information presented herein should be considered supplemental to, and not as a substitute for, or superior to, financial measures calculated in accordance with GAAP. However, we believe that non-GAAP reporting, giving effect to the adjustments shown in the reconciliation above, provides meaningful information and therefore we use it to supplement our GAAP reporting by identifying items that may not be related to the core manufacturing business. Management often uses this information to assess and measure the performance of our operating segments. We have chosen to provide this supplemental information to investors, analysts and other interested parties to enable them to perform additional analyses of operating results, to illustrate the results of operations giving effect to the non-GAAP adjustments shown in the above reconciliations, to provide an additional measure of performance. Memo: Full Year Full Year FY 2006 ($ Billions) FY 2007 ($ Billions) Revenues $14 $12 $6.7 $6.9 ($Millions) ($Millions) Manufacturing Segment Profit $838 $426 $425 $375 $1,000 $950 Corporate Items ($398) ($431) ($162) ($172) ($420) ($460) ($313) ($423) Interest Expense ($192) ($196) ($68) ($78) ($140) ($160) ($157) ($177) Financial Services Profit $147 $128 $5 ($5) $70 $50 $140 $100 Sub total - Below the line range: ($443) ($499) ($225) ($255) ($490) ($570) ($330) ($500) Consolidated Income Before Income Tax $395 ($73) $200 $120 $510 $380 $1,270 ($1,100) Memo - Professional fees included above in corporate items: ($71) ($224) ($97) ($101) ($140) ($160) ($20) ($30) SEC Regulation G ($Millions) FY 2008 ($ Billions) 1st Half Full Year FY 2008 ($ Billions) ($Millions) $15+ $1,600 $15+ Full Year FY 2009 ($ Billions) ($Millions) |