JP Morgan 3 rd Annual Basics & Industrials June 3, 2008 Exhibit 99.1 |
2 Forward Looking Information Information provided and statements contained in this presentation that are not purely historical are forward- looking statements within the meaning of Section 27A of the Securities Act, Section 21E of the Exchange Act, and the Private Securities Litigation Reform Act of 1995. Such forward-looking statements only speak as of the date of this presentation and the company assumes no obligation to update the information included in this presentation. Such forward-looking statements include information concerning our possible or assumed future results of operations, including descriptions of our business strategy. These statements often include words such as “believe,” “expect,” “anticipate,” “intend,” “plan,” “estimate” or similar expressions. These statements are not guarantees of performance or results and they involve risks, uncertainties and assumptions, including the risk of continued delay in the completion of our financial statements and the consequences thereof, the availability of funds, either through cash on hand or the company’s other liquidity sources, to repay any amounts due should any of the company’s debt become accelerated, and decisions by suppliers and other vendors to restrict or eliminate customary trade and other credit terms for the company’s future orders and other services, which would require the company to pay cash and which could have a material adverse effect on the company’s liquidity position and financial condition. Although we believe that these forward-looking statements are based on reasonable assumptions, there are many factors that could affect our actual financial results or results of operations and could cause actual results to differ materially from those in the forward-looking statements. For a further description of these factors, see Item 1A. Risk Factors of our Form 10-K for the fiscal year ended October 31, 2007, which was filed on May 29, 2008. |

3 Other Cautionary Legends • The financial information herein contains both audited and preliminary/unaudited and has been prepared by management in good faith and based on data currently available to the company. • Certain Non-GAAP measures are used in this presentation to assist the reader in understanding our core manufacturing business. We believe this information is useful and relevant to assess and measure the performance of our core manufacturing business as it illustrates manufacturing performance without regard to selected historical legacy costs (i.e. pension and other post-retirement costs) and other expenses that may not be related to the core manufacturing business. Management often uses this information to assess and measure the performance of our operating segments. A reconciliation to the most appropriate GAAP number is included in the appendix of this presentation. |
4 We expect our strategy will enable us to deliver our 2009 goals and BEYOND FY 2009 Goals • $15+ Billion Revenue • $1.6 Billion Manufacturing Segment Profit • Improve cost structure while developing synergistic niche businesses with richer margins • Improve conversion rate of operating income into net income • Reduce impact of cyclicality – Grow Parts – Non-Traditional/Expansion Markets Leveraging what we have and what others have built Leveraging what we have and what others have built Competitive Cost Structure Profitable Growth Great Products |
5 2008 – Performing in a Down Market • Great Products – Bold – Trucks and Engines • Competitive Cost Structure – ProStar™ – MaxxForce™ Big Bore 11L/13L – Labor efficiencies – Below the line items • Profitable Growth/New Businesses – Military – Mexico/Export FY 2009 Goals • $15+ Billion Revenue • $1.6 Billion Manufacturing Segment Profit • Improve cost structure while developing synergistic niche businesses with richer margins • Improve conversion rate of operating income into net income • Reduce impact of cyclicality – Grow Parts – Non-Traditional/Expansion Markets Leveraging what we have and what others have built Leveraging what we have and what others have built |
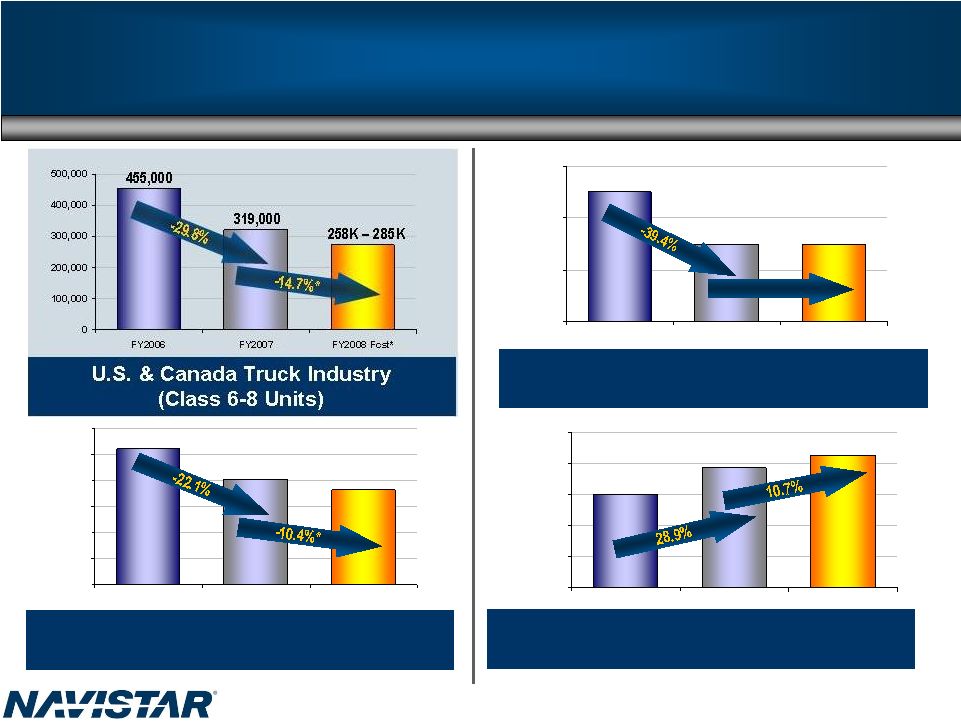
6 0 50,000 100,000 150,000 FY2006 FY2007 FY2008 Fcst* 0 10,000 20,000 30,000 40,000 50,000 FY2006 FY2007 FY2008 Goal 0 100,000 200,000 300,000 400,000 500,000 600,000 FY2006 FY2007 FY2008 Fcst* 30,000 2008 Guidance 520,000 405,000 350K – 375K Navistar Expansionary** Shipments 38,000 42,500 126,000 75,000 70K – 80K *midpoint of guidance Navistar U.S. & Canada Shipments (Class 6-8 Units) Flat Navistar Engine Shipments **includes all military shipments |
7 $0 $200 $400 $600 $800 $1,000 $1,200 FY2006 Full Year FY 2007 Full Year FY2008 1st Half* FY 2008 Full Year Summary Manufacturing Segment Profit ($ in millions) *Charts reflects midpoint of guidance $838 $426 $375-425 $950-1,000 $0 $50 $100 $150 $200 FY 2006 1st Half FY 2007 1st Half FY 2008 1st Half Consolidated Pretax Income ($ in millions) $103 $6 $120 $200 range |
8 We expect our strategy will enable us to deliver our 2009 goals FY 2009 Goals • $15+ Billion Revenue • $1.6 Billion Manufacturing Segment Profit • Improve cost structure while developing synergistic niche businesses with richer margins • Improve conversion rate of operating income into net income • Reduce impact of cyclicality – Grow Parts – Non-Traditional/Expansion Markets Leveraging what we have and what others have built Competitive Cost Structure Profitable Growth Great Products |
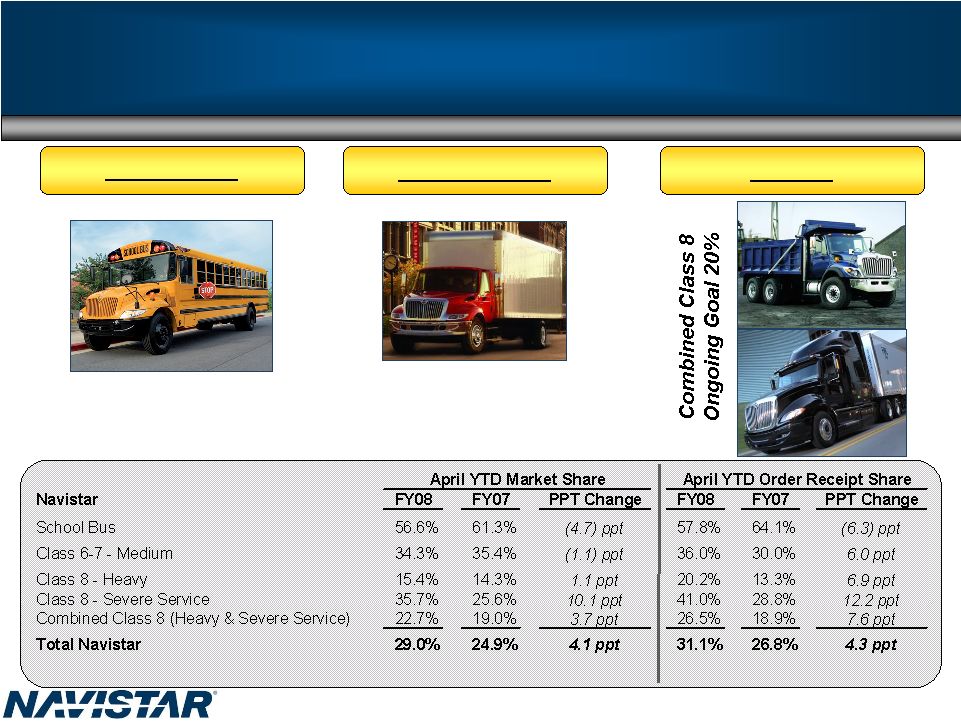
9 U.S. and Canada Traditional Market Share Leader in Class 6-8 Trucks and School Bus School Bus Class 6 and 7 Class 8 Ongoing Goal 60% Ongoing Goal 40% |
10 |
11 |
12 |
13 |
14 11L / 13L MaxxForceTM 11L / 13L Engines Industry leading attributes Fuel economy Weight Noise Vibration Harshness (NVH) Imported production start: Dec. 2007 U.S. production start: Summer 2008 Significant cost savings versus purchased engines at peak production |
15 • Fuel Economy And Emissions One Of The First Auxiliary Power Units (APU) To Pass The Stringent 2008 CARB Emissions Standards • Integrated Design & Engineering Diesel Generator Set Rated At 5.2 Kilowatts Of Power • Typical APU is rated at 3.5 Kilowatts Fully Integrated With The Vehicle Electronics Best In Class Fuel Economy Highly Styled For Fit And Aerodynamics • Designed For Long Life 10,000 Hour Durability Life Tested To OEM Specifications (typical competitors 4000 to 8000 hours) • Extreme Quiet Operation Fully Isolated For Noise And Vibration • Long Service & Maintenance Intervals (1,000 Hours) • Factory Installed And Warranted An International Exclusive System International’s MaxxPower Integrated APU Typical Aftermarket APU Product Leadership |
16 We expect our strategy will enable us to deliver our 2009 goals FY 2009 Goals • $15+ Billion Revenue • $1.6 Billion Manufacturing Segment Profit • Improve cost structure while developing synergistic niche businesses with richer margins • Improve conversion rate of operating income into net income • Reduce impact of cyclicality – Grow Parts – Non-Traditional/Expansion Markets Competitive Cost Structure Profitable Growth Great Products Leveraging what we have and what others have built |
17 Competitive Cost Structure Key Component of COGS Strategic initiatives ProStar™ MaxxForce™ Big Bore 11/13L Scale Strategic Partnerships Mahindra International South America Global Sourcing Performance on track / Volume / Dollar Weakness Overall goal is to continuously seek the needed quality at the best price Greater Flexibility Eliminated guaranteed employment Productivity Trades Stewards / Reps Sourcing non-core jobs Improved Manufacturing Cost Structure Wages frozen Healthcare contained New hire package competitive Wages Post-retirement Labor Operating Efficiencies Materials |
18 We expect our strategy will enable us to deliver our 2009 goals FY 2009 Goals • $15+ Billion Revenue • $1.6 Billion Manufacturing Segment Profit • Improve cost structure while developing synergistic niche businesses with richer margins • Improve conversion rate of operating income into net income • Reduce impact of cyclicality – Grow Parts – Non-Traditional/Expansion Markets Competitive Cost Structure Profitable Growth Great Products Leveraging what we have and what others have built |
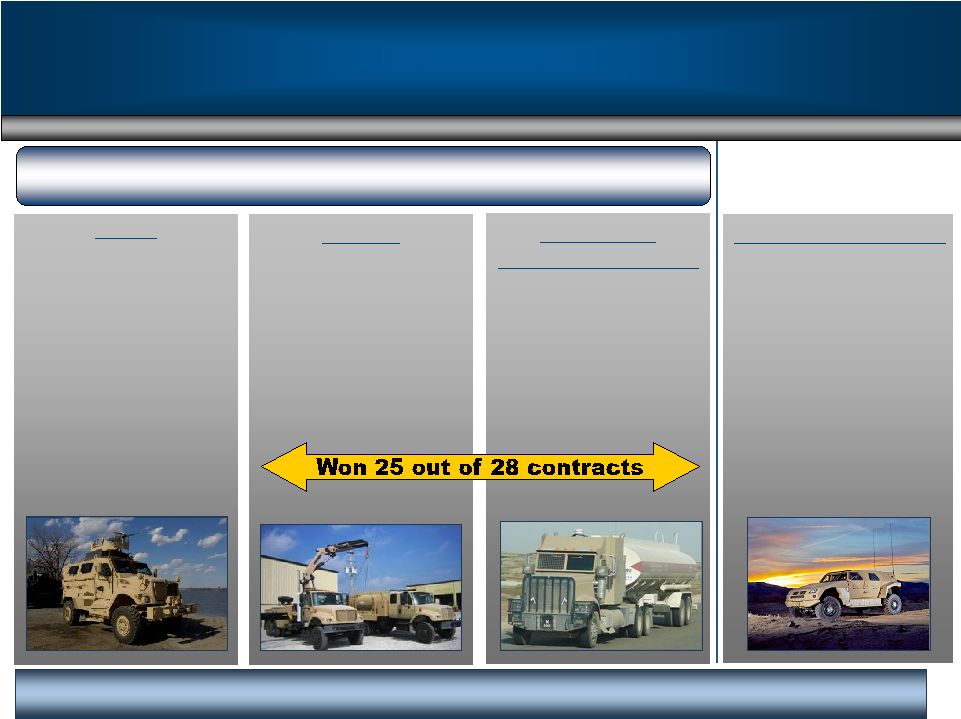
CF and Conventional Class 4/5 Profitable Growth Mexico & Export Increase export market share Military Commercial Bus Units delivered: FY 2005: ~ 1,300 FY 2006: ~ 2,900 FY 2007: ~ 3,200 Industry ranges from 35K – 45K Industry ranges from 20K – 30K Industry ranges from 50K – 70K Industry ranges from 9K – 15K Workhorse Cl 3-7 |
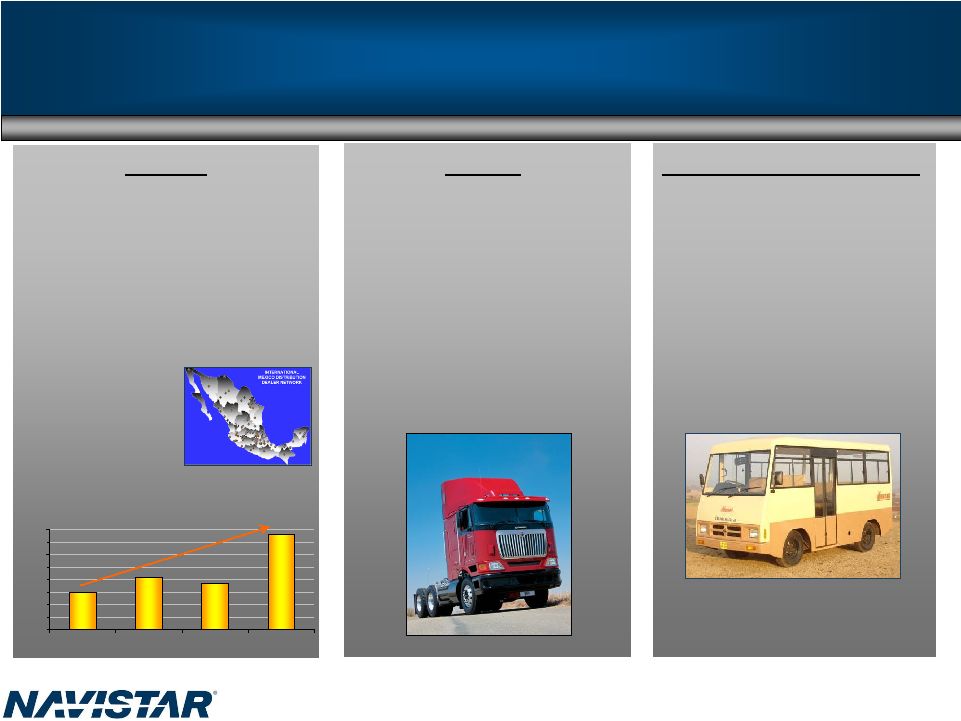
20 Profitable Growth Mexico/Export – Continued Focus on Growth Mexico Delivering profitable growth 20 dealers with more than 85 locations 30% increase in dealer locations Fleet growth • Cemex • Femsa • Lala Export Russia Australia Grow existing markets • Latin America • South Africa • Middle East Dedicated dealers in all key markets Mahindra International Commercial Growth India and Exports • New full line Class 4-8 in development • New plant for trucks and engines in 2009 • 2011 target volume 40,000 units/year (market 400,000 Class 3-8) India’s first commercial vehicles with electronic common rail diesel engines Mexico Market Share 24.0% 25.0% 26.0% 27.0% 28.0% 29.0% 30.0% 31.0% 32.0% FY 2005 FY 2006 FY 2007 1st H FY08 |
22 |
23 |
24 |
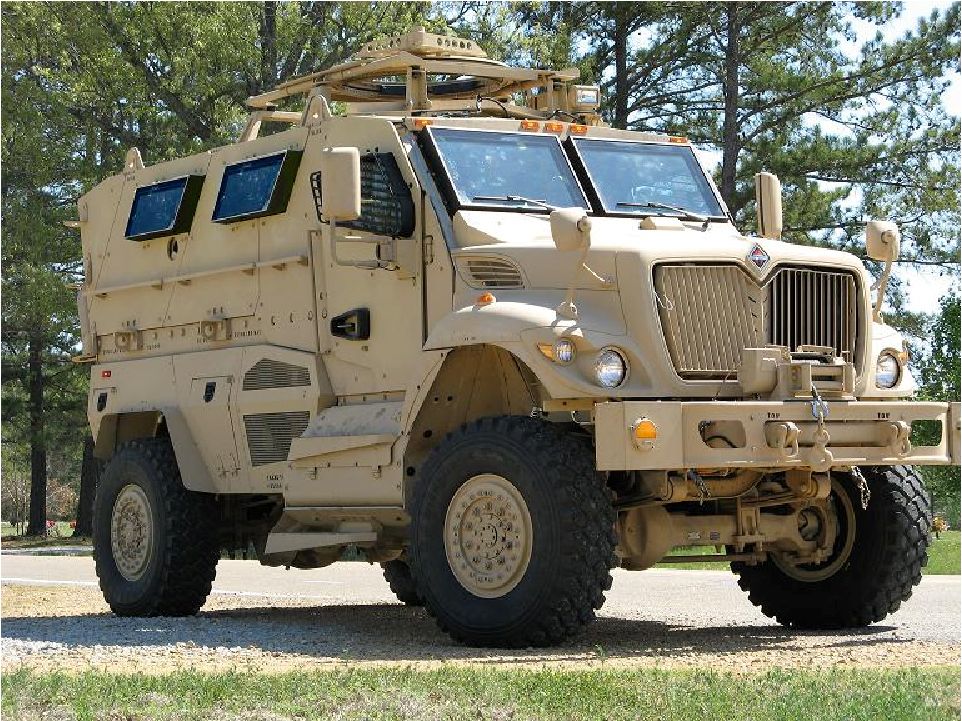
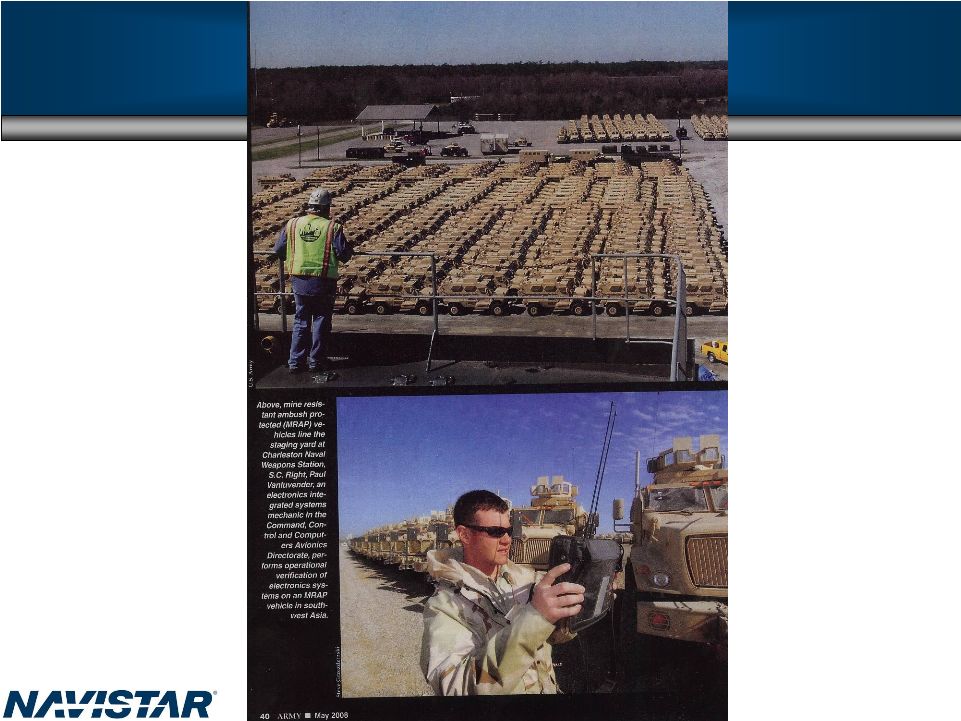
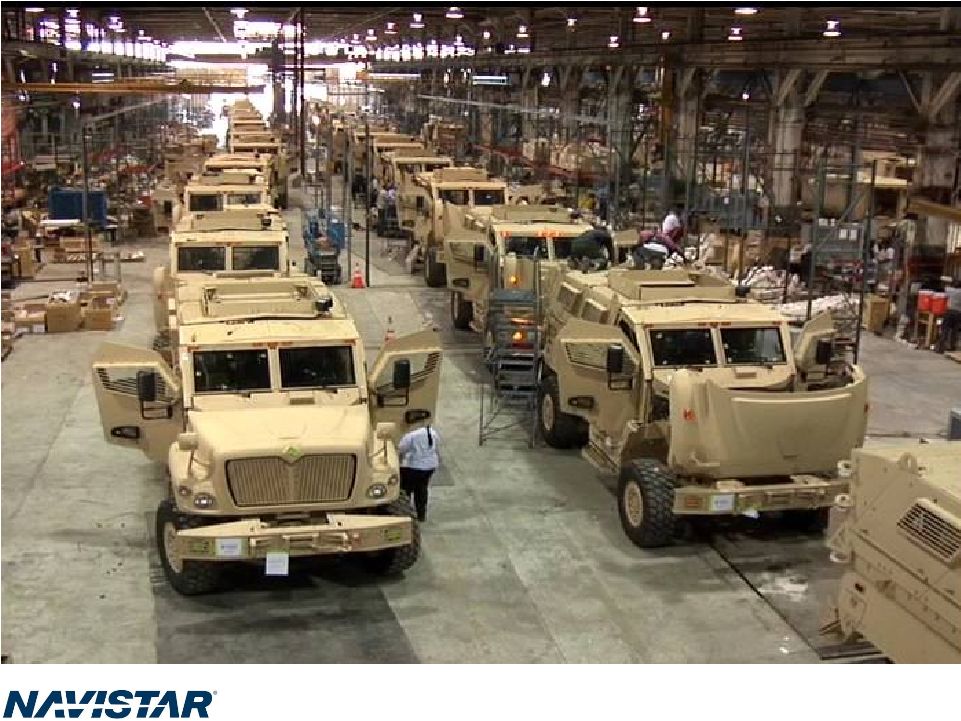
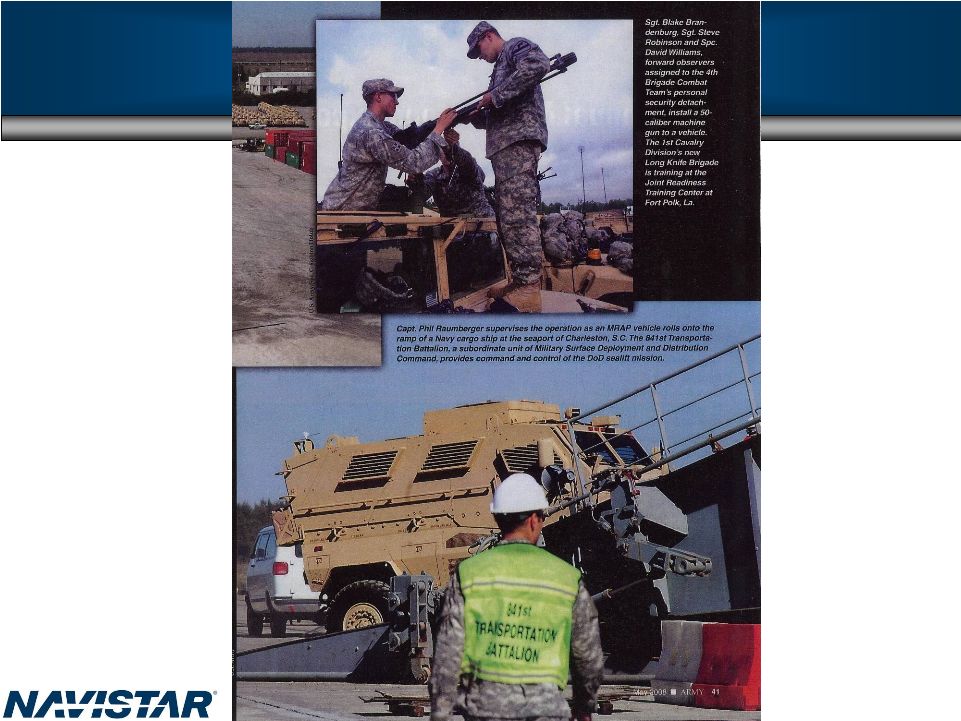
25 Profitable Growth Navistar Defense Tactical 7000 MV AFMTV Taiwan FMS Afghan Militarized / supporting vehicles 5000 MV Armored Line Haul Tractor TACOM-other urgent requirements MXT MRAP U.S. & Foreign Future Opportunities FMTV M915 JLTV We believe the military business is a $1.5 to $2 Billion sustainable business Navistar Defense Group |
26 Challenges Known – Execution of path to $1.6 billion manufacturing segment profit Navistar 2010 emissions path Unknown Cost increases – commodity/precious metal/currency 2010 emissions industry landscape Capital structure cost Ford resolution Execution speed – ROW strategy |
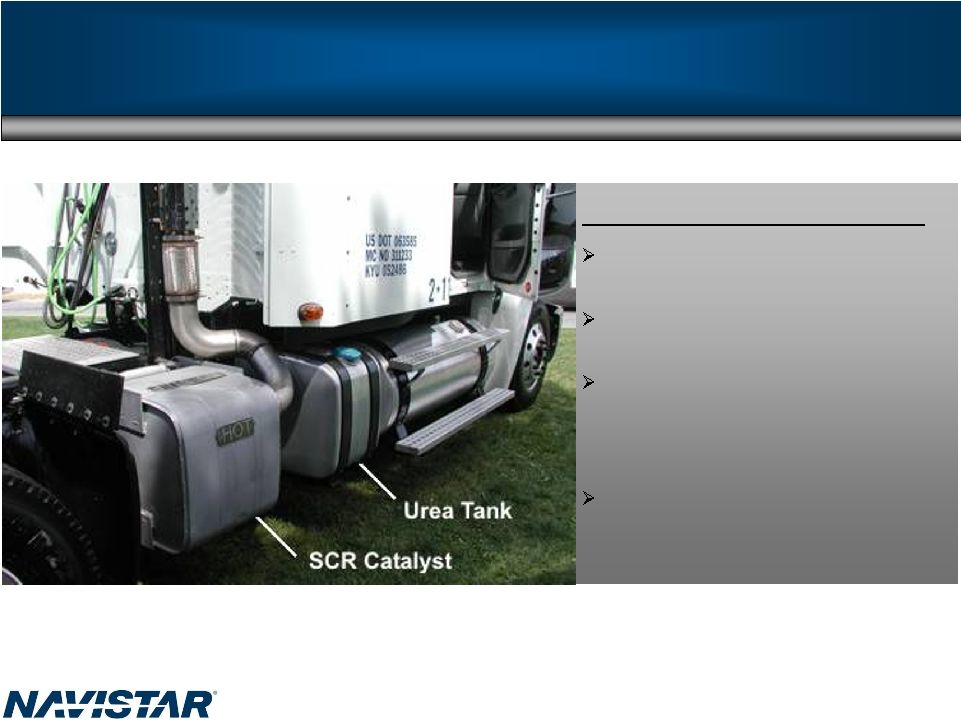
27 Strategy to sustain and improve 2010 and beyond Why we choose EGR vs. SCR: We believe SCR is a transitional-stop gap approach SCR forces the burden of compliance on the customer EGR builds on technologies we are using today without ongoing customer cost, complexity, and inconvenience Minimal, if any, effect on fuel economy |
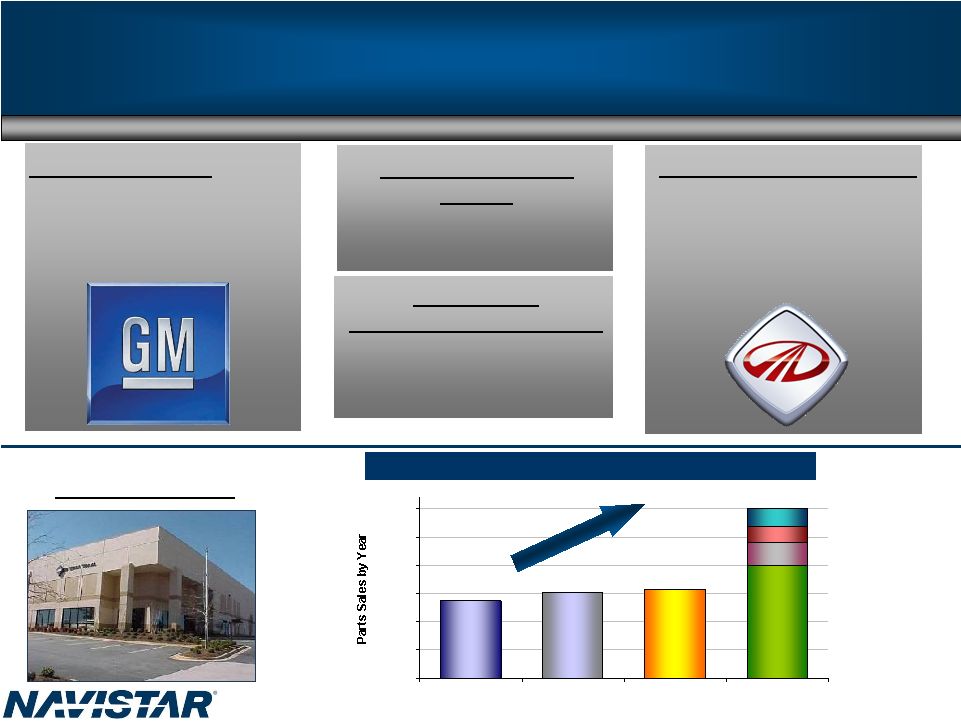
28 $0 $500 $1,000 $1,500 $2,000 $2,500 $3,000 FY 2005 FY 2006 FY 2007 FY 2012 Sustainable – 2010 and Beyond GM Opportunity Average revenue = $1.5B + Mahindra International • New plant for trucks and engines in 2009 • 2011 target volume 40,000 units/year (Market 400,000 Class 3-8) Navistar Defense Group Average revenue = $1.5B+ Export and Expansionary Markets Average Revenue Up Navistar Parts $1,373 $1,516 $1,562 $3,000 Part Sales at Maturity ($ in millions) Other Opportunities Military Expansionary Global Traditional Goal |
29 Continued Diversification North America Traditional Class 6,7,8 & Mexico Expansion Class 4,5, CF, Conventional, MXT, RV, Military Future Opportunities GM Rest of World Today South America, South Africa and Russia Future Opportunities India, Russia, Australia & China |
30 Appendix |
31 SEC Regulation G Memo: Full Year Full Year FY 2006 FY 2007 ($ Billions) ($ Billions) Revenues $14 $12 $6.7 $6.9 ($Millions) ($Millions) Manufacturing Segment Profit $838 $426 $425 $375 $1,000 $950 Corporate Items ($398) ($431) ($162) ($172) ($420) ($460) ($313) ($423) Interest Expense ($192) ($196) ($68) ($78) ($140) ($160) ($157) ($177) Financial Services Profit $147 $128 $5 ($5) $70 $50 $140 $100 Sub total - Below the line range: ($443) ($499) ($225) ($255) ($490) ($570) ($330) ($500) Consolidated Income Before Income Tax $395 ($73) $200 $120 $510 $380 $1,270 $1,100 Memo - Professional fees included above in corporate items: ($71) ($224) ($97) ($101) ($140) ($160) ($20) ($30) $1,600 $15+ Full Year FY 2009 ($ Billions) ($Millions) SEC Regulation G ($Millions) FY 2008 FY 2008 ($ Billions) 1st Half Full Year ($ Billions) ($Millions) $15+ |