Bank of America 2008 Credit Conference Orlando, FL November 20, 2008 Exhibit 99.1 |
2 Safe Harbor Statement Information provided and statements contained in this report that are not purely historical are forward-looking statements within the meaning of Section 27A of the Securities Act of 1933, as amended, Section 21E of the Securities Exchange Act of 1934, and the Private Securities Litigation Reform Act of 1995. Such forward-looking statements only speak as of the date of this report and the company assumes no obligation to update the information included in this report. Such forward-looking statements include information concerning our possible or assumed future results of operations, including descriptions of our business strategy. These statements often include words such as “believe,” “expect,” “anticipate,” “intend,” “plan,” “estimate” or similar expressions. These statements are not guarantees of performance or results and they involve risks, uncertainties and assumptions. For a further description of these factors, see Item 1A. Risk Factors included within our Form 10-Q for the period ended July 31, 2008 and our Form 10-K for the year ended October 31, 2007, which were filed on September 3, 2008 and May 29, 2008, respectively. Although we believe that these forward-looking statements are based on reasonable assumptions, there are many factors that could affect our actual financial results or results of operations and could cause actual results to differ materially from those in the forward-looking statements. |
3 Other Cautionary Legends • The financial information herein contains both audited and preliminary/unaudited information and has been prepared by management in good faith and based on data currently available to the company. • Certain Non-GAAP measures are used in this presentation to assist the reader in understanding our core manufacturing business. We believe this information is useful and relevant to assess and measure the performance of our core manufacturing business as it illustrates manufacturing performance without regard to selected historical legacy costs (i.e. pension and other postretirement costs) and other expenses that may not be related to the core manufacturing business. Management often uses this information to assess and measure the performance of our operating segments. A reconciliation to the most appropriate GAAP number is included in the appendix of this presentation. |
4 Controlling our Destiny Leveraging What We Have and What Others Have Built |
Industry Environment Today 5 “Today I joined with Senate Republicans and leaders from the trucking industry to once again emphasize the need for the United States Senate to act on bringing down the price of gas at the pump,” Senator Inhofe said. “From transporting goods across the country, to finding ways to pay for our nation’s infrastructure, high gas prices impact every aspect of our lives. Congress can improve both our energy security and our economy by increasing American-based energy production. I will continue to stand with my Republican colleagues to ensure the Senate stays focused on bringing down the price of gas at the pump.” |
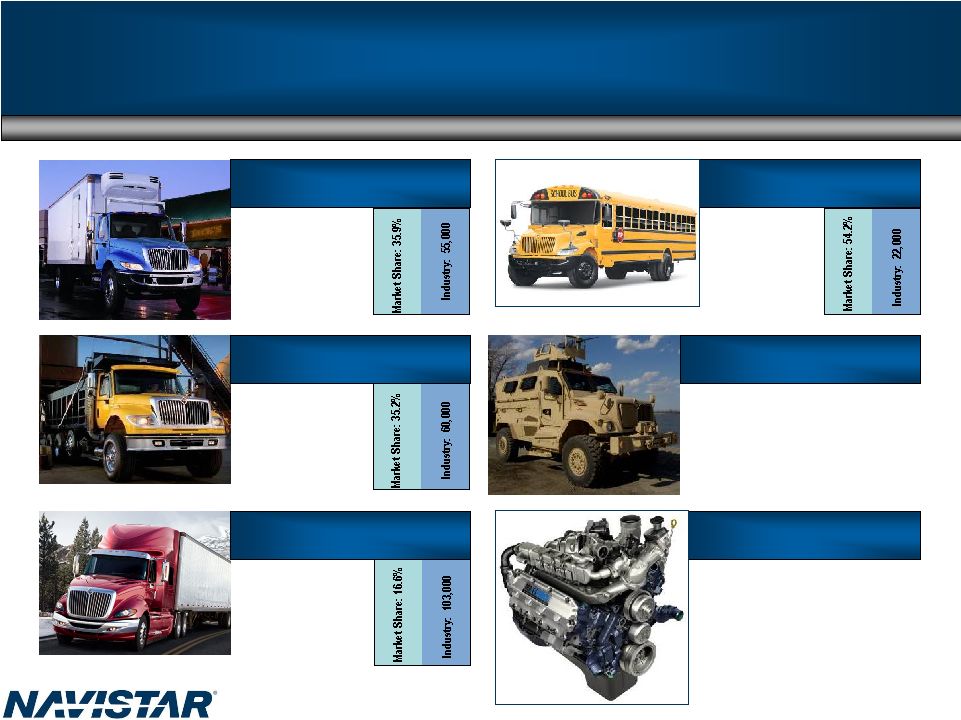
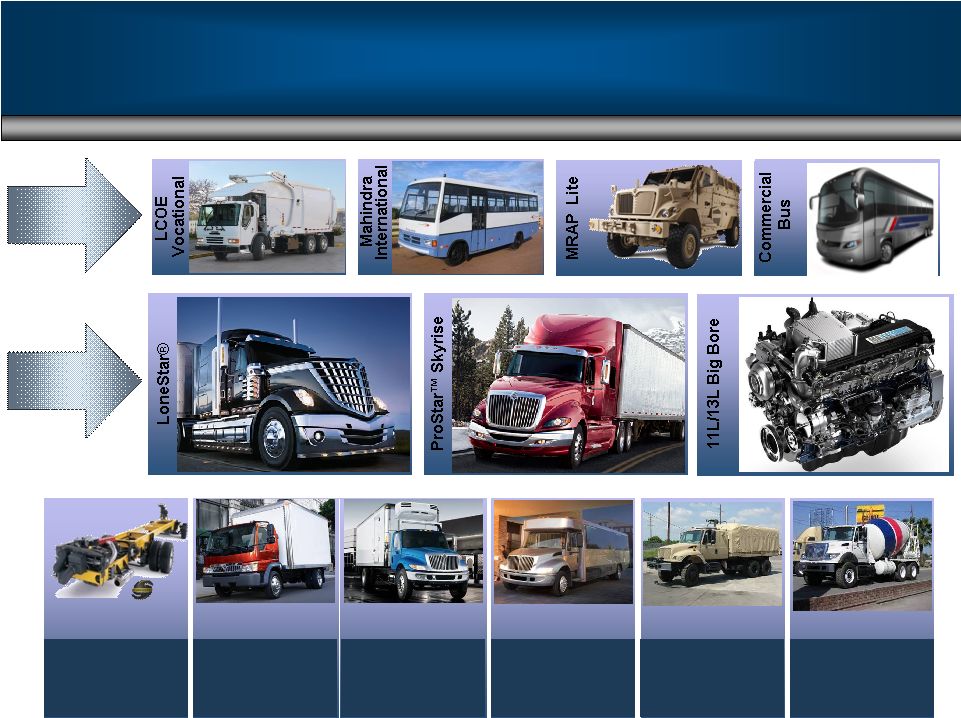
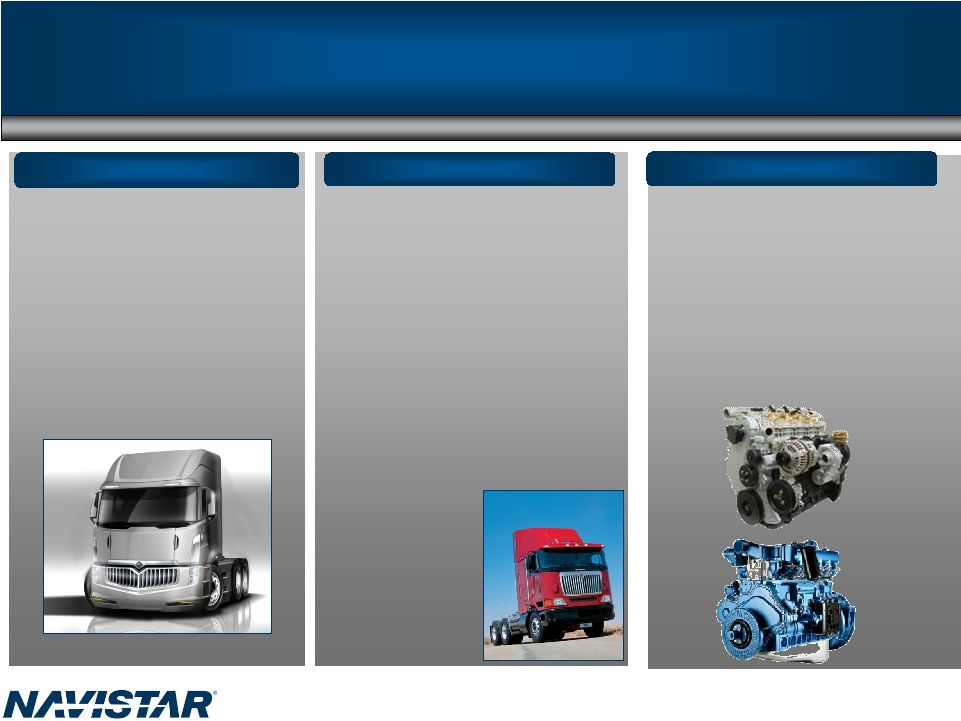
School Bus – Goal 60% MRAP Mid-Range Engines Great Products U.S. and Canada Truck Market Share Position 6 Medium – Goal 40% Severe Service – Goal 25% Heavy – Goal 20% #1 #1 #4 #1 #1 #1 ProStar™/LoneStar ® Market Share: 40% Source: ACT and internal reports Mid-Range Engine Manufacturer |
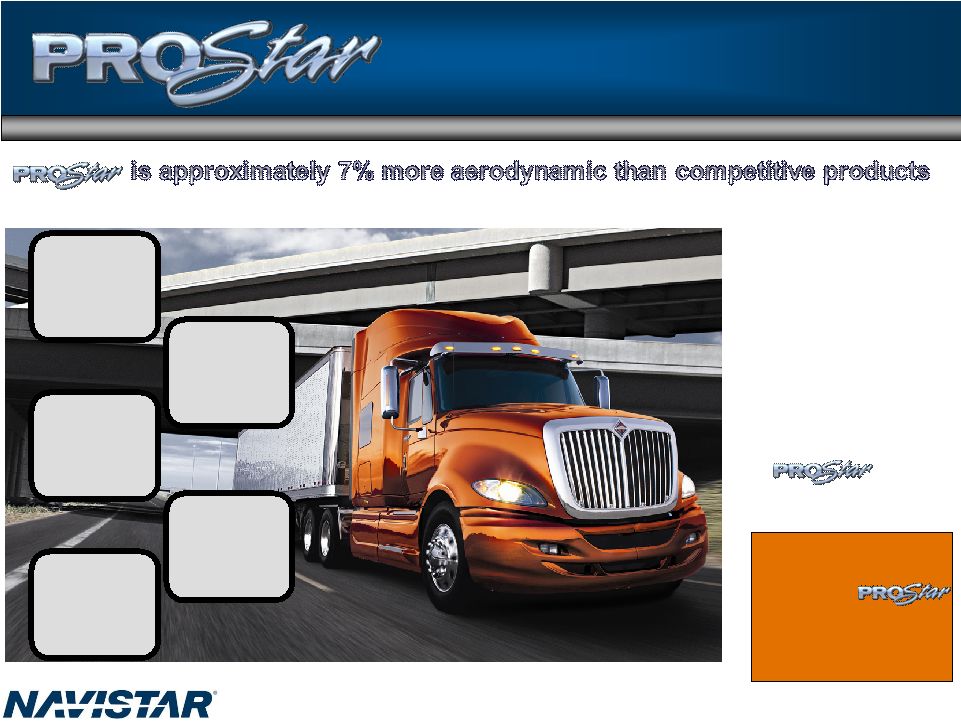
7 Delivers on Its Promise 6.9 mpg Fleet A 7.0 mpg Fleet B 7.2 mpg Fleet C 7.2 mpg Fleet D 7.7 mpg Fleet E At 100,000 to 150,000 miles a year, the saves $2,800- $7,000 a year in fuel! • Average line haul costs $110,000 • Diesel is currently around $3 but was as high as $5 a gallon • has 7% fuel savings |
8 |
Right Products/Right Time 9 Combined Class 8 Retail Market Share Order Receipt Share |
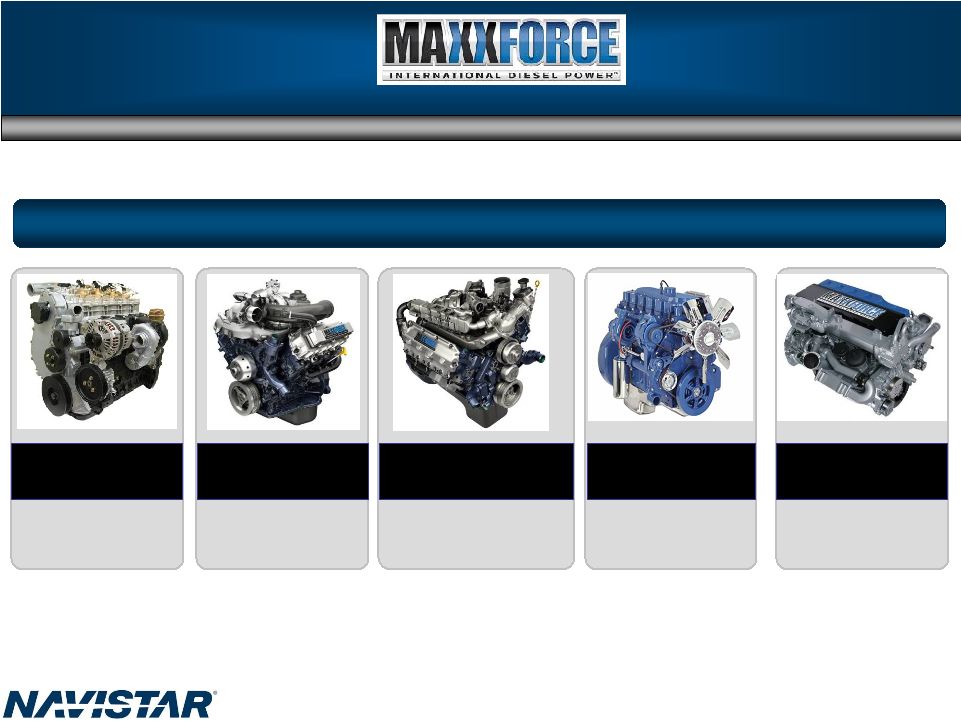
10 MaxxForce ™ DT Series 9/10 MaxxForce™ 7 Ford V8 MaxxForce™ 5 South American Engines MaxxForce ™ Big Bore 11L/13L 6.4L V8 4.5L V6 7.6L/9.3L Great Products: Engine Complete line of 3L-7L products I4/I6 Built for power, reliability, durability and fuel economy |
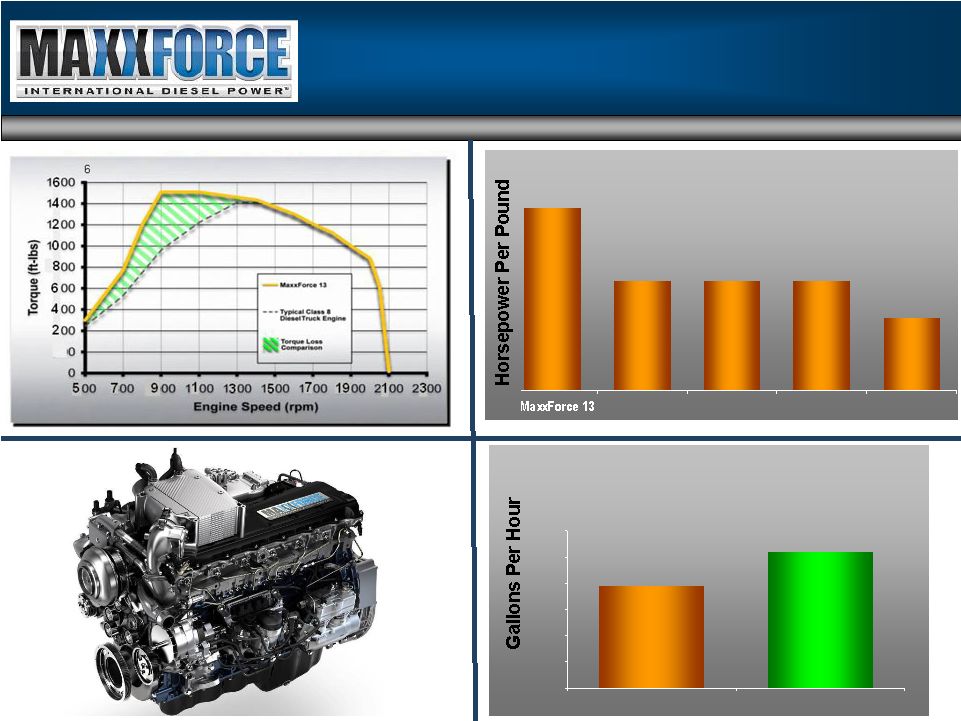
11L/13L Outstanding Power Characteristics 11 Competitor A Competitor C Competitor D Competitor B Designed for Payload Best-in-Class Fuel Usage @ Idle 0 0.1 0.2 0.3 0.4 0.5 0.6 MaxxForce 13 Competitor A |
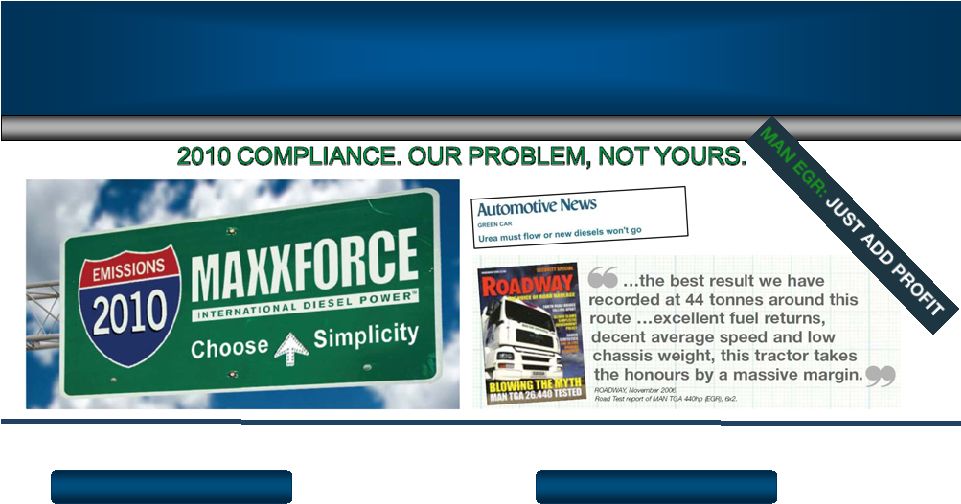
EGR (Simplicity) vs. SCR (Complexity) Making Life Easier For Our Customers 12 EGR SCR What changes in 2010 for the customer? • Fuel economy – neutrality • Lower operating costs vs. SCR • No urea required • No additional hardware • No payload penalty • No additional training • No urea delivery infrastructure required • Fuel economy – slight benefit in certain applications • Urea required – offsets fuel economy benefit • Higher operating costs than EGR • Additional hardware • Payload penalty • Additional training • Urea delivery infrastructure required |
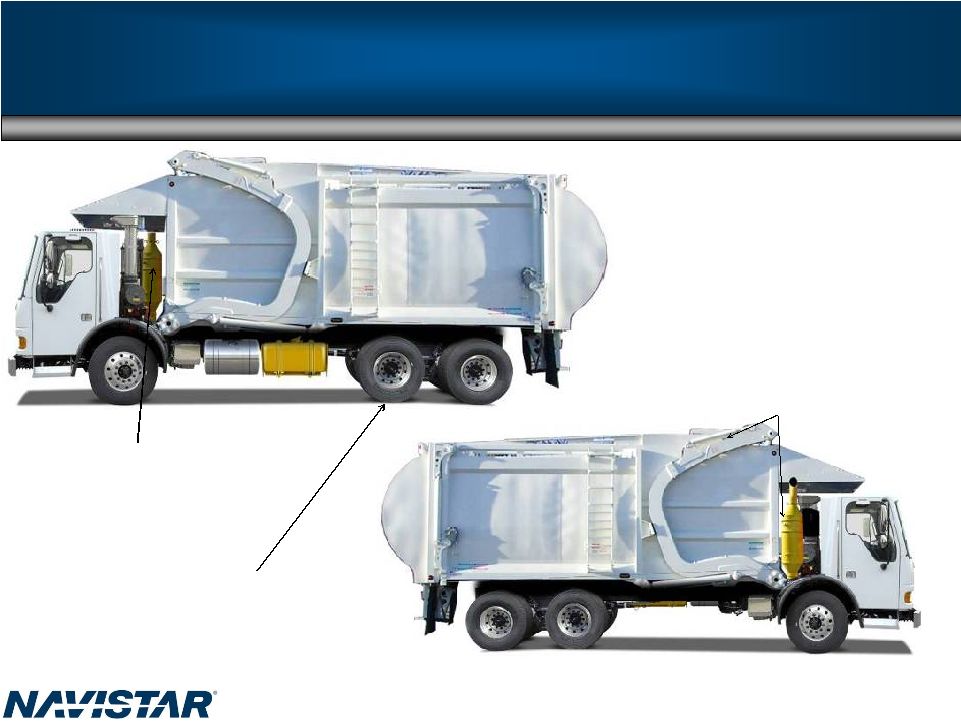
SCR on a Typical Vehicle: Refuse Vocation Urea Tank and Vertical Exhaust Note: Yellow highlight denotes SCR part and component, size, and location requirements Refuse application – potential issues • Body may move rearward • Wheel base growth • Weight distribution • Arm interference with exhaust • Pivot arm position relative to cab Routing challenges •OBD sensors •Urea heater •Hoses Significant WB impacts •AT module •Urea tank •Controls •Weight distribution • - Adds ~ 400lbs •Lower payload •Weight distribution 13 |
14 Competitive Cost Structure Key Component of COGS • Strategic initiatives ProStar™ MaxxForce™ Big Bore 11L/13L • Scale • Strategic partnerships Mahindra International South America CAT • Global sourcing Performance on track/volume/ dollar weakness • Overall goal is to continuously seek the needed quality at the best price Greater Flexibility • Eliminated guaranteed employment • Productivity Trades Stewards/Reps • Sourcing non-core jobs Improved Manufacturing Cost Structure • Wages frozen • Healthcare contained • New hire package competitive Wages Postretirement Labor Operating Efficiencies Materials |
15 Profitable Growth Future Mexico & Export Increase export market share Military Units delivered: FY 2005: ~ 1,300 FY 2006: ~ 2,900 FY 2007: ~ 3,200 Commercial Bus Industry ranges from 9K – 13K CF and Conventional Class 4/5 Industry ranges from 20K – 30K Industry ranges from 45K – 60K Industry ranges from 35K – 45K Workhorse Cl 3-7 Launched |
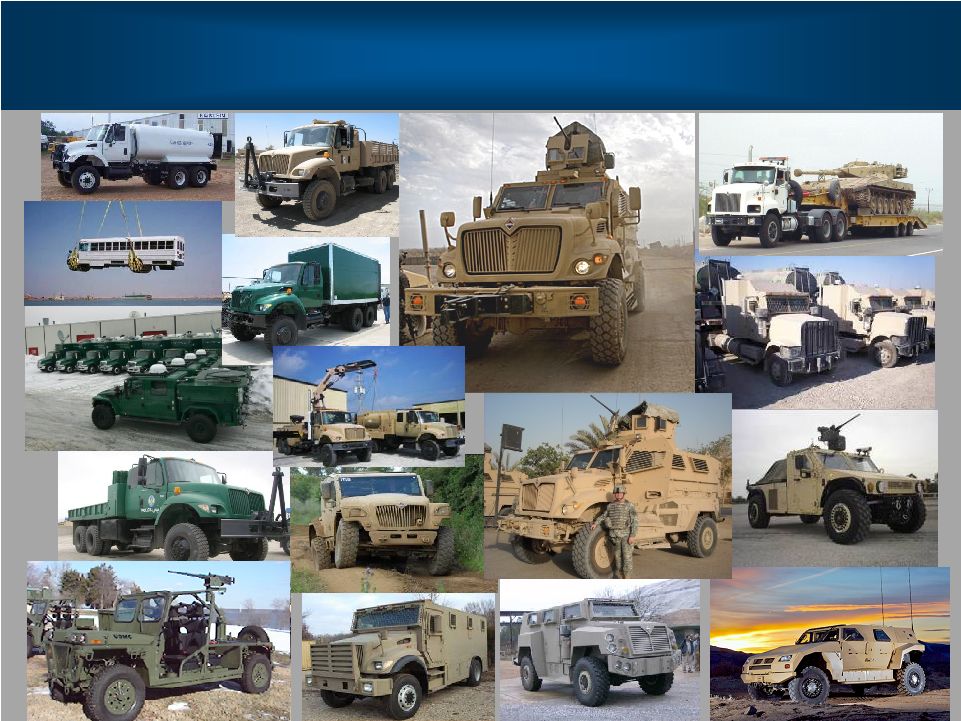
Military – Portfolio of Platforms 16 |
Military Opportunities • 2009 military orders are ~ $2 billion, which includes $500 million of military parts orders • Foreign military opportunities identified in over 20 countries – Netherlands – United Kingdom – Romania – Saudi Arabia – Australia – Polish Land Force MTV • Navistar Defense – contract manufacturer (FMTV, MRAP reset/recap) • Contract logistic support/integrated logistic support revenue streams 17 - Canada - Turkey - Mexico - Taiwan - UAE |
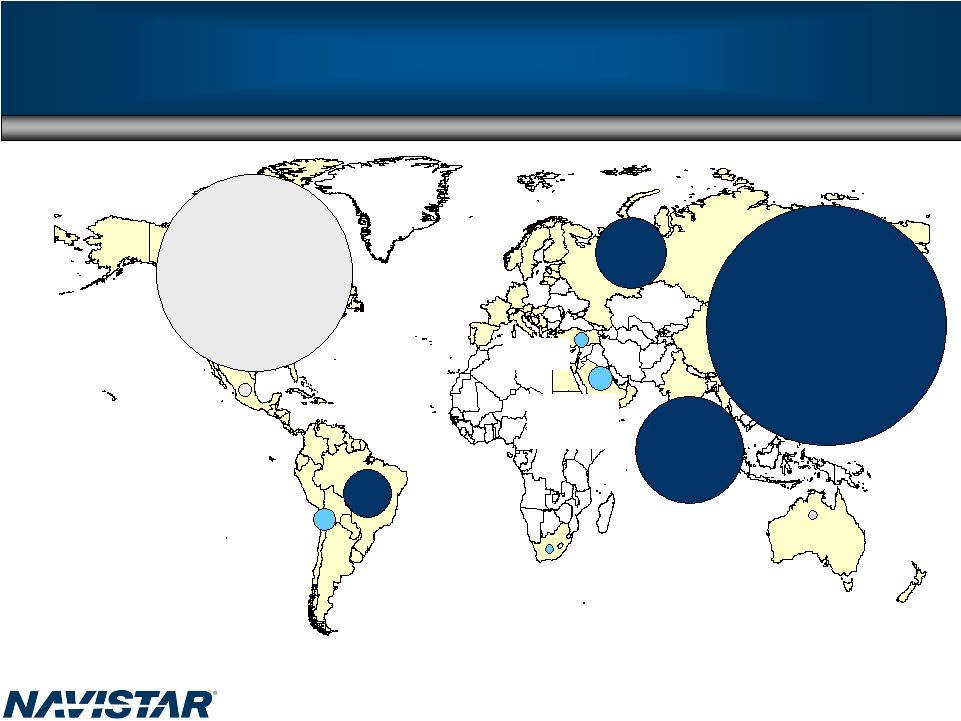
18 2013 Projected Global Truck Market Note: Includes Medium and Heavy Trucks >6T only Source: JD Power; External Research Analysis South Africa China Russia Mercosur Other LA Mexico Middle East North America Australia Turkey India |
- New full line Class 4-8 in development - New plant for trucks and engines in 2009 - 2011 target volume 40,000 units/year (market 400,000 Class 3-8) 19 Profitable Growth Continued Focus on Global Growth • CAT JV • Commercial Bus • Russia • China • Australia • Grow existing markets - Latin America - South Africa - Middle East • Dedicated dealers in all key markets Rest of World-Truck India Rest of World-Engine • Russia • India • China • Grow existing markets - Latin America - South America • Commercial growth India and exports |
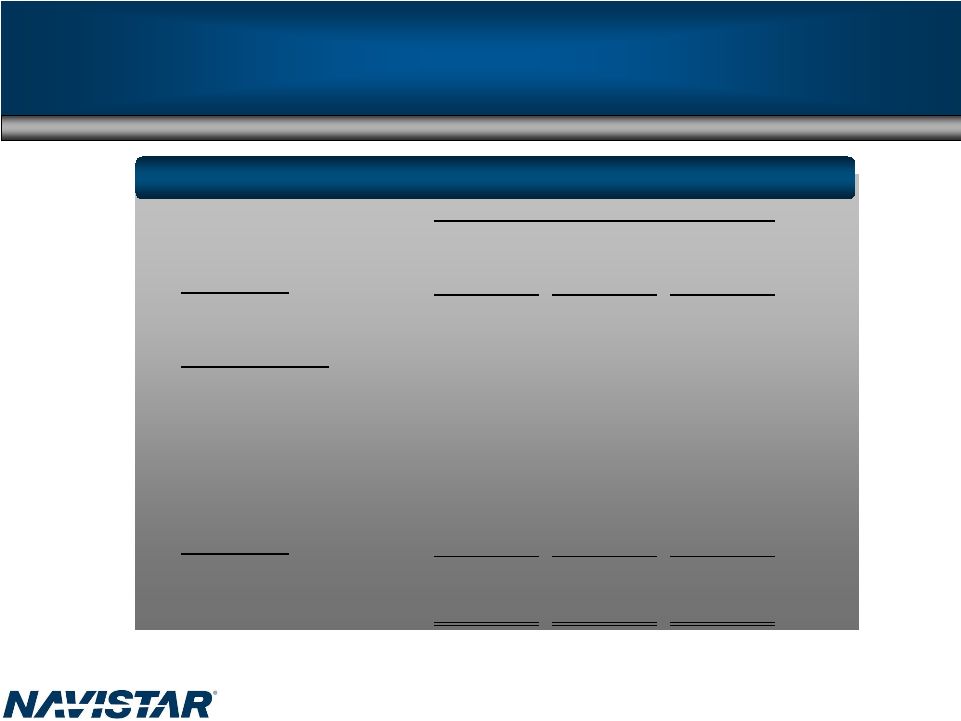
20 2008 Liquidity 2007/2008 FY ($ millions) Unaudited Mfg. Cash Bal.: 10/31/2007 9 months ended July 31, 2008 Forecast 2008 October 31, 2006 $1,214 October 31, 2007 $722 $722 Approx. Cash Flows: From Operations ($191) $90 large source Dividends from NFC $400 $15 small use From Investing / (Cap Ex) ($221) ($157) large use From Financing / (Debt Paydown) ($480) ($94) large use Mfg. Cash Bal.: October 31, 2007 $722 July 31, 2008 $576 October 31, 2008 Fcst $750 - $850 * *The above unaudited non-GAAP manufacturing cash flow information has been revised to reflect the correction of certain errors. The corrections within the unaudited non-GAAP manufacturing cash flow information, which are not considered material, had no effect on previously reported unaudited non-GAAP manufacturing cash balances. |
21 Debt DEBT YE 2005 YE 2006 YE 2007 2007 - 3Q 2008 - 3Q ($Millions) Manufacturing operations January 2007 Loan Facility (Libor + 325) - $ - $ 1,330 $ 1,445 $ 1,330 $ Bridge Loan Facility (Libor + 500) - 1,500 - - - Financing arrangements and capital lease obligations 408 401 369 376 315 6.25% Senior Notes 400 - - - - 9.375% Senior Notes 393 - - - 7.5% Senior Notes 249 15 15 15 15 Majority owned dealership debt 245 484 267 326 184 4.75% Subordinated Exchangeable Notes, due 2009 202 1 1 2.5% Senior Convertible Notes 190 - - - - 9.95% Senior Notes 13 11 8 9 6 Other 24 61 40 47 34 Total manufacturing operations debt 2,124 $ 2,472 $ 2,029 $ 2,219 $ 1,885 $ Financial services operations Borrowing secured by asset-backed securities, at variable rates, due serially through 2011 2,779 $ 3,104 $ 2,748 $ 2,899 $ 2,371 $ Bank revolvers, variable rates, due 2010 838 1,426 1,354 1,224 1,401 Revolving retail warehouse facility, variable rates, due 2010 500 500 500 500 500 Commercial Paper - 28 117 115 249 Borrowing secured by operating and finance leases 148 116 133 139 127 Total financial services operations debt 4,265 $ 5,174 $ 4,852 $ 4,877 $ 4,648 $ Cash & Marketable Securities YE 2005 YE 2006 YE 2007 2007 - 3Q 2008 - 3Q Manufacturing non-GAAP (Unaudited) 867 $ 1,214 $ 722 $ 607 $ 576 $ Financial Services non-GAAP (Unaudited) 53 79 61 72 120 Consolidated US GAAP 920 $ 1,293 $ 783 $ 679 $ 696 $ (Audited) (Audited) (Unaudited) (Unaudited) The above non-GAAP financial measures are unaudited and reflect a 2007 change in segment reporting methodology. This presentation is not in accordance with, or an alternative for, U.S. generally accepted accounting principles (GAAP). The non-GAAP financial information presented herein should be considered supplemental to, and not as a substitute for, or superior to, financial measures calculated in accordance with GAAP. However, we believe that non-GAAP reporting, giving effect to the adjustments shown in the reconciliation above, provides meaningful information and therefore we use it to supplement our GAAP reporting by identifying items that may not be related to the core manufacturing business. Management often uses this information to assess and measure the performance of our operating segments. We have chosen to provide this supplemental information to investors, analysts and other interested parties to enable them to perform additional analyses of operating results, to illustrate the results of operations giving effect to the non-GAAP adjustments shown in the above reconciliations and to provide an additional measure of performance. |

Pension Cash Pension Impacts • Quarterly cash funding requirements for 2009 are already set based on 1/1/2008 valuation – $25 million for 2009 • Poor stock market returns during 2008 will increase our 2009 funding requirement, which will impact cash in 2010 • Stock market returns during 2009 will reset cash funding requirements for 2010 and beyond Income Statement Pension Impacts • October 31 is the key measurement date for pension impacts on the income statement • 2008 investment losses will be smoothed in accordance with FASB rules: – Amortized over average future lifetime/service (approx. 15 - 17 years) • One-time items in 2008 will drive pension income; 2009 is expected to return to expense, however, it is too early to determine the exact amount 22 |
23 NFC Liquidity Remains Strong • NFC retail activity primarily funded by facilities that do not require refinancing until 2010 • NFC has continued to obtain access to bank conduit markets to fund retail note acquisitions • Over $1.2 B in retail notes have been financed since the subprime issues began to impact the asset securitization market • We have sufficient credit capacity to absorb refinancing – High portfolio credit quality permits continuing access to bank conduits • Serviced receivables balances tracking to truck market trough Retail Notes Bank Revolver • Current Situation – $0.9 B DFP receivables – $1.0 B Funding Facility (NFSC) • NFSC terms – Bank conduit portion renewed October 2008 – Public portion matures February 2010 Off-balance sheet • $500 million revolving warehouse (TRIP) – Acquired notes sold into TRIP – TRIP warehouses, then securitizes via bank conduits • TRIP terms – Matures July 2010 On-balance sheet • $1.4 B Facility – Initial funding of retail note acquisitions – Also funds dealer/customer open accounts • Revolver terms – Matures July 2010 On-balance sheet Dealer Floor Plan (DFP) |
24 Liquidity Summary • We have sufficient liquidity/borrowing capacity to execute our strategies • Parent company has no need to refinance in near-term – Benefiting from lower Libor interest rate – Refinancing will be opportunistic to stagger maturities • Recent key financing renewals ensure NFC liquidity – Next significant refinance date is late 2009 • Recently announced asset impairment charges are predominately non-cash in nature and therefore do not impact NIC’s Fixed Charge Coverage Ratio Covenant in $1.5 billion term loan agreement |
Summary • Strategic direction of corporation and actions are on track • 2009 and 2010 industry uncertain • Actions to offset include: – Products (market share) • Fuel economy • LoneStar ® /ProStar™/WorkStar™ • EGR vs. SCR – Cost • Accelerate sourcing/design cost take out • Manufacturing • SG&A – Growth (additional) • CAT Impact • Diesels - Rest of World • Commercial bus 25 • China • Military • LCOE and Waste segment of market • Parts |
Appendix |
27 SEC Regulation G Based on 414,500 Industry* *Navistar intends to update on 4Q08 earnings call FY 2006 ($Billions) FY 2007 ($Billions) As Reported As Reported Revenues $14 $12 ($Millions) ($Millions) Consolidated Income Before Income Tax $395 ($73) $525 $610 $1,100 $1,270 Taxes Benefit (Expense) ($94) ($47) ($58) ($62) Net Income (Loss) $301 ($120) $467 $548 Diluted EPS $4.12 ($1.70) $6.35 $7.45 2008 Full year estimate number of diluted shares 73.5 Million ($Millions) ($Millions) Guidance Goal ~$15 $15+ Full Year FY 2008 ($Billions) FY 2009 ($Billions) The above non-GAAP financial measures are unaudited and reflect a 2007 change in segment reporting methodology. This presentation is not in accordance with, or an alternative for, U.S. generally accepted accounting principles (GAAP). The non-GAAP financial information presented herein should be considered supplemental to, and not as a substitute for, or superior to, financial measures calculated in accordance with GAAP. However, we believe that non-GAAP reporting, giving effect to the adjustments shown in the reconciliation above, provides meaningful information and therefore we use it to supplement our GAAP reporting by identifying items that may not be related to the core manufacturing business. Management often uses this information to assess and measure the performance of our operating segments. We have chosen to provide this supplemental information to investors, analysts and other interested parties to enable them to perform additional analyses of operating results, to illustrate the results of operations giving effect to the non-GAAP adjustments shown in the above reconciliations and to provide an additional measure of performance. This guidance excludes charges associated with any loss of, or a significant reduction in, business from Ford or the early termination or non-renewal of our agreement with Ford. See Item 1A Risk Factors of the 3 quarter Form 10-Q for more information with respect to Ford. On November 12, 2008, Navistar filed with the SEC a Form 8-K disclosing an impairment charge related to its Vee business unit. This work is ongoing, but the Company estimates that it will record expenses ranging from $375 to $430 million, the majority of which are expected to be recognized in the 4 quarter of fiscal 2008. These charges are primarily non-cash in nature and therefore do not count toward the company's fixed charge coverage ratio. th rd |
Q&A 28 Q: What do you finance at Navistar Finance Corporation (NFC)? A: NFC is a commercial financing organization that provides wholesale, retail and lease financing for sales of new and used trucks sold by the company. NFC also finances the company’s wholesale accounts and selected retail accounts receivable. Sales of new truck related equipment (including trailers) of other manufacturers are also financed. Q: What percentage of truck purchases do you fund? A: We consistently fund about 95% of floor plan inventory for our dealers in the U.S., and approximately 15% of retail purchases by customers. That 15% will fluctuate depending on market conditions, and we expect to see it rise in the near-term, as other banks stop financing truck purchases. Q: When is the next refinancing due at NFC? A: All financing facilities have been extended, and we do not need to renew any facility until October 2009. Q: What are your retail notes funded by? A: The retail notes are primarily funded by a bank revolver and a revolving warehouse that we call TRIP. Both of these facilities don’t mature until mid 2010. These notes are ultimately sold to either a conduit facility or into a public securitization. Q: Are there any requirements for NFC leverage? A: NFC is compliant with our Revolver leverage covenant of 6 to 1. This ratio calculation excludes securitization debt. Q: How are your securitization rates determined? A: Portfolio performance, deal structure and market conditions affect pricing. Also asset class, Retail versus Wholesale versus Trade Receivable would affect pricing as may some structural elements. |
Q&A 29 Q: What is your funding strategy? How do you match maturities of the liabilities with the asset profile? How much duration risk is there if the credit markets were to shut you down for a period of time? A. We use three or four primary funding sources. For our longer term retail truck notes that finance the sale of trucks to end customers, we finance those in the term securitization markets either in public deals or with the banks. We primarily finance our wholesale in traditional private or public securitizations. We also have a combination of revolving type facilities that often warehouse assets until they can be financed permanently. Q: How are your loan losses? A. The provision for losses is primarily driven by our actual credit losses. Our loss ratio (including Truck’s share) year-to-date is a running a little over 1%. The loss ratio in the last cycle in 2001 approached 3.0%, and we don't anticipate getting close to those levels. With respect to NFC, its serviced retail note portfolio ,YTD losses, as a percentage of total retail receivables were running at 0.80% as of July 31, 2008. 60 day delinquencies through 7/31/08 for retail were running at approximately 1% and have been well managed through the remainder of the year. Our reserves as a percentage of assets are comparable with that 1% level and we believe are appropriate given current market conditions. Q: How are your repossessions trending? A: Repossessions were slowing down. It is too early to tell if the current turmoil in the markets will require increased repossession activity in the future. To a great extent, fleets have already right sized and fuel costs have rapidly come down, which is all good news. |
Q&A 30 Q: How are your wholesale balances and dealers doing? A: Wholesale balances have actually come down recently. We think our dealers, which have always been one of our strengths, are well positioned in this area. We have never had any significant dealer losses and expect that trend to continue in the future. Q: Are your rates going to increase? A: Like all lenders, we need to achieve a profitability threshold to ensure our continued access to capital, and that means pricing our rates in line with the marketplace. So, yes, as the cost of financing increases for all companies, we are going to need to share some of the increase with our dealers and customers. Q: What kind of rates do you charge your dealers and customers? A: Generally, our rates vary of course (those with higher credit risk have always had to pay higher interest rates) and are usually in line with the market. Q: How do you make your credit decisions? Do you require a certain credit score? A: We factor in a variety of criteria that includes FICO scores but also weighs factors such as business model, company history, down payment, etc. Q: What is our total amount of capacity at NFC? A: As of July 31, 2008, total availability in our funding facilities was $1.1BB. Plus we had $90 MM of availability in the Credit Suisse deal which we topped up in September. |