4th Quarter Earnings Presentation January 5, 2009 Exhibit 99.1 |
2 Safe Harbor Statement Information provided and statements contained in this presentation that are not purely historical are forward-looking statements within the meaning of Section 27A of the Securities Act of 1933, as amended, Section 21E of the Securities Exchange Act of 1934, as amended, and the Private Securities Litigation Reform Act of 1995. Such forward-looking statements only speak as of the date of this presentation and the Company assumes no obligation to update the information included in this presentation. Such forward-looking statements include information concerning our possible or assumed future results of operations, including descriptions of our business strategy. These statements often include words such as “believe,” “expect,” “anticipate,” “intend,” “plan,” “estimate,” or similar expressions. These statements are not guarantees of performance or results and they involve risks, uncertainties, and assumptions. For a further description of these factors, see Item 1A. Risk Factors of our Form 10-K for the fiscal year ended October 31, 2008, which was filed on December 30, 2008. Although we believe that these forward-looking statements are based on reasonable assumptions, there are many factors that could affect our actual financial results or results of operations and could cause actual results to differ materially from those in the forward-looking statements. All future written and oral forward-looking statements by us or persons acting on our behalf are expressly qualified in their entirety by the cautionary statements contained or referred to above. Except for our ongoing obligations to disclose material information as required by the federal securities laws, we do not have any obligations or intention to release publicly any revisions to any forward-looking statements to reflect events or circumstances in the future or to reflect the occurrence of unanticipated events. |
3 Other Cautionary Legends • The financial information herein contains audited and unaudited information and has been prepared by management in good faith and based on data currently available to the company. • Certain Non-GAAP measures are used in this presentation to assist the reader in understanding our core manufacturing business. We believe this information is useful and relevant to assess and measure the performance of our core manufacturing business as it illustrates manufacturing performance without regard to selected historical legacy costs (i.e. pension and other postretirement costs). It also excludes financial services and other expenses that may not be related to the core manufacturing business. Management often uses this information to assess and measure the performance of our operating segments. A reconciliation to the most appropriate GAAP number is included in the appendix of this presentation. |
Investor & Analyst Day – January 22, 2009 Make Your Reservation Navistar’s Investor & Analyst Day Thursday, January 22, 2009 Melrose Park Engine Facility Melrose Park, IL 11:30 a.m. – 4 p.m. CST Lunch, Presentation with Q&A Plant Tour, Lab Demos & Product Displays Reservation Required Please contact Suzanne Sorensen at Suzanne.Sorensen@Navistar.com 4 |
Agenda • 2008 Results – Financial Results – Operations • 2009 Outlook – Challenges – Actions/Plans – More to do • Summary • Q&A 5 |
FY 2008 Financial Information Consolidated Revenues ($ in billions) FY 2007 $12.3 Manufacturing Segment Profit ($ in millions) Diluted earnings (loss) per share US & Canada Class 6-8 Retail Industry 6 FY 2008 $14.7 FY 2007 $426 FY 2008 $1,114 FY 2008 $7.23 FY 2007 $(1.70) FY 2006 $828 FY 2006 $4.12 FY 2006 $14.2 *Excludes $358 million of asset impairment charges and $37 million other costs related to of significant permanent reductions related to Ford engine volume. Note: $134 million reported net income + $358 million asset impairment plus $37 million other costs =$529 million /73.2 millions shares = $7.23/share. For additional information see the SEC Reg G slide in the appendix |
7 Controlling Our Destiny Leveraging What We Have and What Others Have Built • Market share – Ahead of Plan • 2008 Capital Spending <$200M* • MaxxForce™ 11L/13L Launch On target: • Manufacturing • Supplier • Commodities • Strong Military • CAT J.V. Pending *Exclusive of purchases of equipment leased to others |
Medium Truck Great Products-Total FY2008 Class 6-8 Market Share was 31%* 8 55% Market Share School Bus 36% Market Share 37% Market Share Severe Service Truck* Heavy Truck 19% Market Share 0.0% 5.0% 10.0% 15.0% 20.0% 25.0% 30.0% 35.0% 40.0% 45.0% FY07 Retail Share FY08 Retail Share FY08 Order Share #1 In Market Share despite industry consolidation First Student announced potential $1.2 billion purchase agreement with Navistar’s IC Bus MaxxForce™ EGR engines #1 in Market Share A leader in Medium Hybrid MaxxForce™ EGR engines #1 in Market Share 3 straight year of increasing market share MaxxForce™ EGR engines #4 in Market Share Executing on strategy - ProStar ® launch in early FY 2007; derivatives launched in FY 2008 - LoneStar ® launched in late FY 2008 *Includes U.S. Military shipments rd |
9 *Includes U.S. Military shipments Total FY 2007 Class 6-8 Market Share was 27%* Total FY 2008 Class 6-8 Market Share was 31%* Great Products |
MaxxForce™ DT Series 9/10 MaxxForce™ 7 Ford V8 MaxxForce™ 5 South American Engines MaxxForce™ Big Bore 11L/13L 6.4L V8 4.5L V6 7.6L/9.3L Great Products: Engine Complete line of 3L-7L products I4/I6 Built for power, reliability, durability and fuel economy 36% Market Share Mid-Range Engines 10 |
South America Engine 11 |
12 Competitive Cost Structure Key Component of COGS Strategic initiatives ProStar ® MaxxForce™ Big Bore 11L/13L Scale Strategic partnerships Mahindra International South America CAT Global sourcing Performance on track/Volume/ Currency Fluctuations Overall goal is to continuously seek the needed quality at the best price Greater Flexibility Eliminated guaranteed employment Productivity Trades Stewards/Reps Sourcing non-core jobs Improved Manufacturing Cost Structure Base wages frozen Healthcare contained New hire package competitive Wages Postretirement Labor Operating Efficiencies Materials |
13 Competitive Cost Structure Leveraging Assets Investment Facilities Military parts distribution center West Point Military Assembly – Facility – Contract employees Garland Escobedo South America block line Paint assembly |
Military – Portfolio of Platforms 14 |
15 Profitable Growth – Navistar Defense Sustainment / Reset / Remanufacturing Tactical 7000 MV AFMTV MTV Taiwan FMS-UK (TSV) JLTV – Down selected OUVS – Down selected FMS-Other Militarized / supporting vehicles 5000 MV Armored Line Haul Tractor TACOM-other urgent requirements MXT MRAP U.S. & Foreign MRAP Variants (6+) • CAT I & II Base • Larger Vehicle – increased protection (PLUS) • Smaller Vehicle (DASH) • Ambulance Future Opportunities M-ATV FMTV MMPV MILCOTS - Canada SMP - Canada M915 JLTV OUVS HET STS We believe the military business (including parts) is sustainable at ~$2 Billion In FY 2008 we delivered ~ $4 Billion in Revenues Navistar Defense Group |
2009 Outlook • Industry still challenged (similar to FY 2008) • Economy influences 2009 – Pricing versus commodities – Pension fund losses in 2008 impact 2009 income statement – Finance Business • 2009 base military business is ~ $2.3 billion 16 |
*Excludes $358 million of asset impairment charges and $37 million other costs related to expectations of significant permanent reductions related to Ford engine volume. 2009 Guidance 17 Note: SEC Reg G reconciliation slide in appendix |
Actions to Overcome Industry Volume • Market share • SG&A and business restructuring cost reductions • Presence in other expansion areas • Military • Emissions strategy 18 |
Industry Environment Today 19 AVERAGE AGE: U.S. Class 8 Active Population 1990 - 2008 Forecast 90 92 94 96 98 00 02 04 06 08 4.8 5.0 5.2 5.4 5.6 5.8 6.0 6.2 6.4 6.6 6.8 Avg. Age in Years Source: ACT Research |
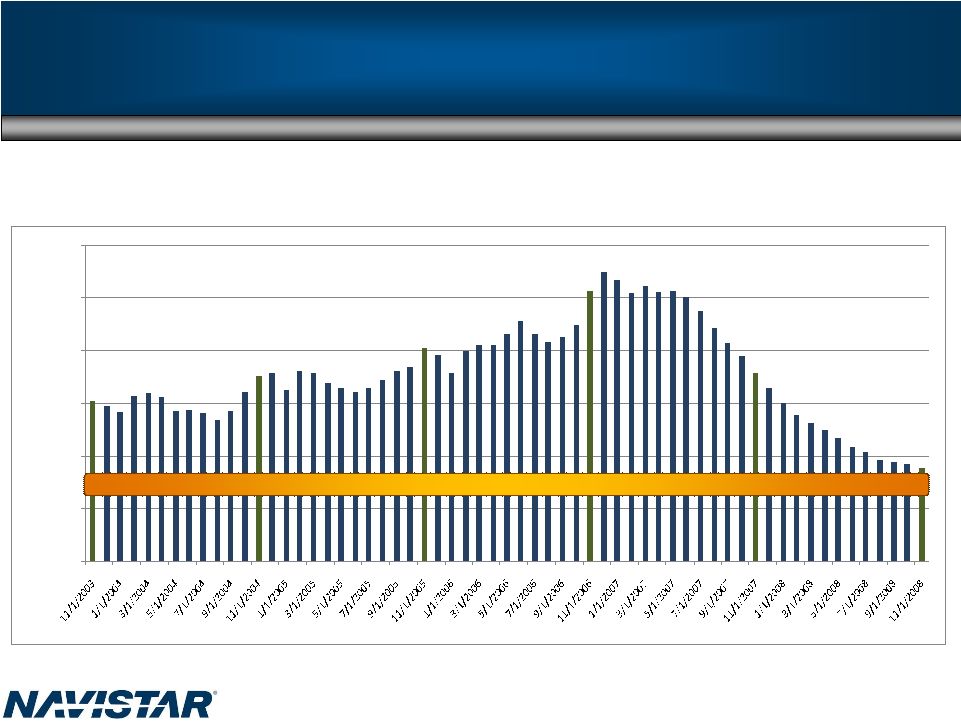
Industry Moving More Into Diesel 20 Exxon boosts diesel output as others scale back Exxon Mobil, which had $37 billion in cash at the end of the third quarter, will expand production at its refineries in Baton Rouge, La., Baytown, Texas, and Antwerp, Belgium. Baytown is the largest U.S. refinery. The Associated Press 12/16/2008 HOUSTON — Exxon Mobil Corp., the world's biggest oil refiner, will spend more than $1 billion in the next couple of years to increase its global production of cleaner-burning diesel by about 10 percent, the company said Monday. The announcement comes as many oil producers and refiners scale back spending because of the sharp decline in crude prices, dismal expectations for energy demand in 2009 and tight credit markets that have put many big capital expenditures out of reach. When the upgrades are completed in 2010, Irving, Texas-based Exxon Mobil will account for about 8 percent of the world's diesel output, up about 1 percent from current levels, said Sherman Glass, the oil giant's president of refining and supply. Exxon Mobil, which had $37 billion in cash at the end of the third quarter, will expand production at its refineries in Baton Rouge, La., Baytown, Texas, and Antwerp, Belgium. Baytown is the largest U.S. refinery. While acknowledging the global economic downturn and its significant impact on energy consumption, Glass said there is growing global demand for ultra-low-sulfur diesel, also known as ULSD. "We test our investments against a variety of scenarios, regardless of what the short-term economic environment is," Glass said. "Our view is these projects will be robust for a long period of time to come." ULSD, which helps reduce emissions, was introduced for highway use in 2006 and already is available at gas stations across the United States. By December 2010, it will be the only highway diesel available at retail outlets, as mandated by the U.S. Environmental Protection Agency. Over the next few years, locomotives and marine vessels also will be required to make the switch to cleaner-burning diesel to meet new federal emission standards. "Virtually all the diesel here in the U.S. will be ... ultra-low sulfur by 2012," said Al Mannato, a fuels expert at the American Petroleum Institute. Demand also is growing overseas. During the past decade, diesel demand in Europe has risen more than 15 percent, while gasoline demand has actually fallen 22 percent, according to statistics on the API Web site. Mannato said fewer European exports coupled with rising diesel consumption at home are two reasons diesel is nearly $1-a-gallon more costly than gasoline in the United States. Some Exxon competitors have recently delayed refining projects because of volatile global markets. ConocoPhillips and the state-run Saudi Arabian Oil Co. said last month they'd postponed construction of a multibillion-dollar refinery in Saudi Arabia. The project was in the construction-bidding process, and the two partners said they'll rebid it in the second quarter of 2009. Marathon Oil Co. also has delayed expansion of a gasoline refinery in Detroit because of market conditions. Sen. James Inhofe (R-Okla.), Ranking Member of the Environment and Public Works Committee, joined fellow GOP Senators and members of the U.S. trucking industry to call for lower gas prices to help truckers ship goods, met with Oklahoma business leaders of NAVISTAR to discuss diesel prices. "Today I joined with Senate Republicans and leaders from the trucking industry to once again emphasize the need for the United States Senate to act on bringing down the price of gas at the pump," Senator Inhofe said. "From transporting goods across the country, to finding ways to pay for our nation's infrastructure, high gas prices impact every aspect of our lives." |
21 Traditional U.S. and Canada Retail Sales Class 6 – 8 Industry Landscape Economic uncertainty about 2009 and 2010: • 2009 no longer the peak • 2010 no longer the trough Reality: • Age of fleet increasing • Fuel prices coming down 2nd half of 2009 will determine total industry size Industry FY99 FY00 FY01 FY02 FY03 FY04 FY 05 FY06 FY 07 FY08 School Bus 33,800 33,900 27,900 27,400 29,200 26,200 26,800 28,200 24,500 24,400 22,000 24,000 Class 6-7 - Medium 126,000 129,600 96,000 72,700 74,900 99,200 104,600 110,400 88,500 59,600 56,000 64,000 Combined Class 8 (Heavy & Severe Service) 286,000 258,300 163,700 163,300 159,300 219,300 282,900 316,100 206,000 160,100 166,000 168,000 Total Industry Demand 445,800 421,800 287,600 263,400 263,400 344,700 414,300 454,700 319,000 244,100 244,000 256,000 Navistar Order Receipt Share* NA NA NA NA NA 23.7% 26.8% 29.8% 30.7% 33.1% *U.S. and Canada Class 6-8 (includes U.S. military) Historical Information FY 09 Guidance Current Actual United States and Canadian Class 6-8 Truck Industry - Retail Sales Volume |
22 Opportunity for 2009 improvement 6.9 mpg Fleet A 7.0 mpg Fleet B 7.2 mpg Fleet C 7.2 mpg Fleet D 7.7 mpg Fleet E At current fuel prices of $2.50, driving 150,000 to 200,000 miles a year, the saves $3,500-4,700 a year in fuel! • The average line haul costs $110,000 • Commodities have been volatile • Diesel was at $5 a gallon • has 7% fuel savings ® |
23 Profitable Growth: Class 8 Combined Class 8 Retail Market Share Order Receipt Share |
Outstanding Power Characteristics 24 Competitor A Competitor C Competitor D Competitor B Designed for Payload Best-in-Class Fuel Usage @ Idle 0 0.1 0.2 0.3 0.4 0.5 0.6 MaxxForce 13 Competitor A |
Engine Volume Transition 25 Today 2009 Transition 2010 Big Bore 11L-15L 11L/13L 46% 15L 54% <425 hp 12% 425-455 hp 64% 475-550 hp 24% MaxxForce™ 11L/13L 330-475 hp @ 1900 rpm 1250-1700 hp lb.–ft. @ 1000 rpm |
Business Restructuring/SGA • SG&A / fixed cost actions – Suspend management pay raises – Reduced 650 contractors and employees – Other containment actions • Resulting year-over-year cost reductions – Professional (filing) fees ~ $100M – Other SG&A / fixed costs ~$150M • Plant rationalization – Ready to act as necessary 26 |
Military – Opportunity for 2009 • 2009 military orders: – Truck and Parts ~$2.3 B • Foreign Military Opportunities Identified in over 20 Countries – Netherlands – United Kingdom – Romania – Saudi Arabia – Australia – Polish Land Force MTV • Navistar Defense - contract manufacturer (FMTV, MRAP reset/recap) • Contract logistic support / integrated logistic support revenue streams – Canada – Turkey – Mexico – Taiwan – UAE 27 |
28 Parts Segment – Opportunity for 2009 Navistar Parts $1.4 $1.5 $1.6 Part Sales ($ in billions) $1.8 $2.3 to $2.5 Focus on the Customer • Superior customer experience • Pull vs. Push New Proprietary Products • MaxxForce™ 11L/13L • Only source Leverage Our Strengths • Largest dealer channel • Innovative customer solutions Growth Increase truck share Military full offering • Parts • Kits and remanufacturing • Services Global New Product Programs |
29 Emissions Strategy • Meet emissions by using customer friendly EGR solution • Leverage Assets while investing in technologies – Hybrid electric – Electric vehicles • Why are we doing EGR and others SCR? – Because we can!!! |
What the rules tell us about 2010: – Manufacturers can go to .5 NOx if they clean up the environment earlier with advanced technology – Manufacturers need to be at .2 NOx if they choose not to introduce advanced technologies earlier. Navistar’s approach actually reduces NOx levels more because we started earlier Engine Credit Banking and Trading Program 30 |
Extra Fluid Additional Maintenance Additional Driver Training Extra Exhaust Hardware EGR Takes the Emissions Burden Off Customers 31 |
EGR Characteristics are Self-Evident SCR EGR Fuel Economy/Operating Costs NEUTRAL Cost X Maintenance X Driver Training X Weight (payload) X Packaging (configuration) X Green X Trade Value X Obsolete Technology / Euro Trend X Advantage X 32 X=Advantage |
Do not fill into the diesel fuel tank! Product information •Store between 23 F (-5 C) and 68 F (20 C) •Protect against direct sunlight •Empty bottle completely into the tank •Avoid contamination while filling •Avoid ongoing storage in the vehicle •Dispose bottle after 2 years from the production date •Do not mix with other substances •Use or store only as directed •Keep out of the reach of children and animals •Avoid contact with skin and eyes •Avoid inhalation or ingestion of the solution and any dried residue 33 $19.05 EGR Avoids the Risks |
Meet the MaxxForce™ 15 34 |
Mid-America – March 18-21 35 |
2009 Guidance 36 *Excludes $358 million of asset impairment charges and $37 million other costs related to expectations of significant permanent reductions related to Ford engine volume. Note: SEC Reg G reconciliation slide in appendix |
37 Financial Overview • Summary • Financial Reporting • Liquidity/Capital Structure |
38 Summary • Yet - In 2008, Navistar: 1. Generated $1.1 billion in manufacturing segment margin (pre-impairment) 2. Generated $429 million in Manufacturing Cash from Operations, more than covering uses from Cap Ex/Investing thereby allowing Debt Paydown 3. Increased manufacturing cash balances to $775 million 4. Maintained approximately $340 million in available committed undrawn borrowing capacity • 2007 Follow-on low-buy • 2006 Industry pre-buy • 2008 Worst N.A. Truck industry |
39 Manufacturing Cash Flow ¹Cash = Cash & Cash Equivalents *The above unaudited non-GAAP manufacturing cash and cash flow information has been revised to reflect the correction of certain errors. The corrections within the unaudited non-GAAP manufacturing cash flow information, which are not considered material, had no effect on previously reported unaudited non-GAAP manufacturing cash balances. $429 of Cash flow to cover Investing activities Enables Debt Paydown $ (millions) Revised Manufacturing Cash¹ Balance: 10/31/2007 10/31/2008 October 31, 2006 $1,078 October 31, 2007 $716 Approximate Cash¹ Flows:* From Operations ($231) $414 Dividends from NFC $400 $15 From Investing / (Cap Ex) ($70) ($216) From Financing / (Debt Paydown) ($480) ($133) Exchange Rate Effect $19 ($21) Manufacturing Cash¹ Balance: October 31, 2007 $716 October 31, 2008 $775 |
Summary 40 • Continued to strengthen Financial Reporting and Internal Controls 1. Enhanced through put capacity – filed 10 major SEC filings in last 13 months 2. Sarb-Ox – have reduced number of MW’s from 15 (March 2008) to 8 (December 2008) – still unacceptable: goal is zero for 2009; progress by Q2 3. Absorbed the growth of doubling in size 4. Expect smooth closings and filings hereafter, starting with January 31, Q1 2009 5. Restatement Impacts – Revisions • Pension/OPEBs – 2008 decline in market value will affect: – Expense in 2009 – Cash funding in 2010 • NFC liquidity is strong • No refinancing necessary until late 2009/early 2010 – Capital Structure Opportunities |
Restatements/Revisions 41 • Restatement Background – Issue was to get costs into proper quarters. Narrow focus – not widespread. Revenue recognition for associated military units was unchanged. Rapidly changing supply base to meet customer requirements challenged the accuracy of BOM and COGS process. (see appendix) • Restatement Impact: only 2008 in Q1, Q2, Q3. No other periods affected. • Revisions: Two immaterial errors were recorded as revisions – no change to income or cash balances. Impact on NI ($millions) Q1 Q2 Q3 9 mos. Accum. Accum. 2008 FY Higher (Lower) ($12) ($4) $59 $43 $0 |
Pension & OPEB 42 • 2008 FY Retirement plan asset performance was (30%) – typical decline in market values • Impact will be: higher expense in 2009 vs. 2008 cash contributions impact in 2010 - ???? • Y-O-Y Post Retirement Expense will be higher in 2009 vs. 2008 – Funded status at 10/31/07 resulted in approximately $0 expense in 2008 excluding one-time gains – Market sell-off will add $150-$200 million GAAP expense in 2009 vs. 2008 – Funded status will get back to 2007 levels and expense will return to $0 by 2011/12 with low-teens asset returns for next several years • December 2008 law HR7327 mitigates ERISA contribution requirements until second half 2010 – still studying cash impacts |
NFC Performance 43 • Financial Services segment off ~$150 million y-o-y ‘08 vs ’07 – Lower volumes and margins $80 million – Accounting for derivative swaps used to hedge securitizations $50 million – Other $20 million • Expect profitability to rebound significantly in 2009 – Volumes and margins will remain depressed for first half – Impact of derivative accounting depends on interest rate movement after October 2008 – Margins improving – finance competitors on sidelines/not aggressive • Despite P&L losses, NFC has maintained high credit quality receivables portfolio – Enabled NFC to refi all significant funding facilities in 2008 and maintain access to CP backed private bank conduits • In 2009 will primarily use NFC-U.S. and NFC-Mexico as Sales Finance tools to grow Truck market share – Portfolio credit quality can’t be compromised |
44 NFC Liquidity Remains Strong • NFC has total available undrawn committed funding of approximately $900 million • NFC retail activity primarily funded by facilities that do not require refinancing until 2010 • NFC has continued to obtain access to bank conduit markets to fund retail note acquisitions • Over $1.2 B in retail notes have been sold and securitized since the subprime issues began to impact the asset securitization market • Serviced receivables balances tracking to truck market trough • Truck Financing is available for quality credits, especially conquest accounts Retail Notes Bank Revolver • Current situation – ~$1.0 B funding facility (NFSC) – Available $345 million • NFSC terms – Bank conduit portion (VFC) renewed October 2008 – Public portion matures February 2010 Off-balance sheet • $500 million revolving warehouse (TRIP) – Acquired notes sold into TRIP – TRIP warehouses, then securitizes via bank conduits • TRIP terms – Matures June 2010 On-balance sheet • $1.4 B facility – Initial funding of retail note acquisitions – Also funds dealer/customer open accounts • Revolver terms – Matures July 2010 On-balance sheet Dealer Floor Plan (DFP) |
45 Capital Structure – Next Steps • Intend to execute at least 1 million share repurchase • Anticipated cash flow in excess of CapEx / Investments allows consideration of debt buyback – Currently 55 cents to $1 par – Debt reduction, gain on extinguishment • Recent key financing renewals ensure NFC liquidity for 2009 – Must have NFC-U.S. revolver refinanced by Q2 2010 - $1.4B, relationship banks • Parent company has no need to refinance in near-term – not until late 2011 – Using combo of Parent company and NFC-U.S. availability to meet Mexican market truck inventory financing demands on NFC-Mexico – $340M unutilized committed credit facilities – Benefiting from low Libor interest rate (next reset less than 5%) – Debt buyback now could greatly facilitate ease of refinancing later • We have sufficient liquidity/borrowing capacity to execute our strategies |
Actions in 2009 for 2010 and Beyond • Resolve Ford • Pension • Establish Global Presence – Mahindra – Cat J.V. Pending – Diesel Expansion – Commercial Bus • EGR Engine Strategy • MaxxForce Big Bore 46 TM |
• Commercial growth India and exports – New full line Class 4-8 in development – New plant for trucks and engines in 2009 – 2011 target volume 40,000 units/year (market 400,000 Class 3-8) – MNAL plans on selling ~13K light trucks and buses in 2009 – MNAL will also begin production of the new heavy duty truck 47 Continued Focus on Global Growth • CAT JV Pending • Commercial Bus • Russia • China • Australia • Grow existing markets – Latin America – South Africa – Middle East • Dedicated dealers in all key markets Rest of World-Truck India Rest of World-Engine • Russia • India • China • Grow existing markets – Latin America – South America |
North America Motorcoach Opportunity 48 Industry Dynamics – Growing market – U.S. and Canada market: 2000 a year – Current manufacturers niche players – Prevailing engines all exiting in 2010 Leveraging our Strengths – Manufacturing capacity – Vertically integrated engine – Advanced EGR crucial for highway operations – Extensive distribution network for after sales parts and service – Design for FMVSS safety regulations is a core competency Strategic Relationships – Grow with few, key customers – Leverage Idealease breakdown service Motorcoach Opportunity |
Integrated Commercial Bus Opportunity MOU with San Marino (Neobus) for integrated commercial bus body JV assembly plant in Mexico Industry Dynamics – Large market in South America – Emerging market in Mexico driven by government funding – Long-term potential for US and Canada Leveraging our Strengths – Chassis manufacturing capability – Distribution network in Mexico Leveraging the Strengths of Others – New body assembly JV – Non-traditional integrated bus distribution opportunities in other markets Midibus Opportunity 49 |
50 Summary – Controlling Our Destiny 2008 was a strong year in spite of difficult environment 2009 will be a strong year for Navistar despite a weak U.S. and Canadian industry Sustainability actions in place for 2009, 2010 and beyond – Great Products Class 8 market share growth EGR is our technological path – Competitive Cost Structure Global sourcing Competitive labor contract Global footprint – Profitable Growth Global Growth and military Cat J.V. Pending Mahindra J.V. |
• Base Plan Challenged – Industry – Pension & OPEB - $250 million increase – Military ~$2.3 billion with parts – Base EPS $1.65 to $2.20* 51 Summary • Increase Market Share • Cost Reductions – Design – SG&A • Military • Plant Rationalization • Target $5.10 to $5.60 2009 with Actions 2009 Base Plan 2010 Actions Industry Global Opportunities Pension Revenue EPS *For additional information please see Reg G slide in appendix |
52 Appendix |
53 2009 Guidance ($ Millions (excluding EPS)) Truck Industry Units 244K to 256K Revenue $15,000 to $16,000 Mfg. Segment Profit* $1,000 to $1,050 Below the line items ~$(590) Profit Before Tax $410 to $460 Net Income $370 to $410 EPS $5.10 to $5.60 # of shares ~73M Guidance *For additional information please see Reg G slide in appendix |
Navistar 1st Q 2nd Q 3rd Q 4th Q Full Year 1st Q 2nd Q 3rd Q 4th Q Full Year Bus (School) 60% 60% 59% 59% 60% 57% 57% 48% 58% 55% Medium (Class 6-7) 37% 34% 34% 37% 36% 34% 35% 39% 36% 36% Heavy (LH & RH) 16% 12% 15% 17% 15% 16% 15% 19% 25% 19% Severe Service 24% 28% 26% 32% 27% 35% 36% 34% 41% 37% Combined Class 8 18% 17% 19% 22% 19% 23% 23% 25% 30% 25% Combined Market Share 25% 25% 27% 31% 27% 29% 29% 30% 35% 31% Navistar 1st Q 2nd Q 3rd Q 4th Q Full Year 1st Q 2nd Q 3rd Q 4th Q Full Year Bus (School) 60% 60% 59% 59% 60% 57% 57% 48% 58% 55% Medium (Class 6-7) 37% 34% 34% 37% 36% 34% 35% 39% 36% 36% Heavy (LH & RH) 16% 12% 15% 17% 15% 16% 15% 19% 25% 19% Severe Service 23% 26% 24% 28% 25% 28% 26% 26% 29% 27% Combined Class 8 18% 16% 19% 21% 18% 20% 19% 21% 26% 22% Combined Market Share 25% 25% 27% 31% 26% 27% 27% 28% 33% 29% 2007 2008 Market Share - US & Canada School Bus and Class 6-8 2007 2008 Market Share – U.S. & Canada School Bus and Class 6-8 54 |
55 Truck Shipments Note: Information shown below is based on Navistar’s fiscal year-end Fiscal Year 2006 1Q06 2Q06 3Q06 4Q06 Full Year 2006 BUS 4,100 4,500 4,300 5,100 18,000 MEDIUM 7,300 11,500 12,100 14,300 45,200 HEAVY 7,900 9,900 10,200 15,400 43,400 SEVERE 3,900 4,500 4,300 6,300 19,000 TOTAL 23,200 30,400 30,900 41,100 125,600 MILITARY (U.S. & Foreign) 400 500 1,200 800 2,900 EXPANSIONARY 5,800 6,600 7,500 7,000 26,900 WORLD WIDE TRUCK 29,400 37,500 39,600 48,900 155,400 Fiscal Year 2007 1Q07 2Q07 3Q07 4Q07 Full Year 2007 BUS 3,400 4,100 3,200 3,900 14,600 MEDIUM 9,700 6,800 5,600 6,600 28,700 HEAVY 7,000 4,500 2,600 3,300 17,400 SEVERE 3,900 3,300 3,500 3,700 14,400 TOTAL 24,000 18,700 14,900 17,500 75,100 MILITARY (U.S. & Foreign) 600 900 700 1,000 3,200 EXPANSIONARY 9,100 8,700 9,000 8,500 35,300 WORLD WIDE TRUCK 33,700 28,300 24,600 27,000 113,600 Fiscal year 2008 1Q08 2Q08 3Q08 4Q08 Full Year 2008 BUS 3,100 3,300 2,700 4,400 13,500 MEDIUM 3,700 6,300 5,800 4,500 20,300 HEAVY 2,600 3,900 4,500 7,800 18,800 SEVERE 2,400 3,400 3,400 3,600 12,800 TOTAL 11,800 16,900 16,400 20,300 65,400 MILITARY (U.S. & Foreign) 1,600 2,200 2,300 2,600 8,700 EXPANSIONARY 6,000 8,100 8,400 5,600 28,100 WORLD WIDE TRUCK 19,400 27,200 27,100 28,500 102,200 |
56 World Wide Engine Shipments Navistar 1st Q 2nd Q 3rd Q 4th Q Full Year Ford 80,200 92,200 75,200 68,100 315,700 Other OEM's (All Models) 25,300 29,000 26,500 24,100 104,900 Engine Shipments to Truck Group 17,600 24,300 25,100 32,100 99,100 Total Shipments 123,100 145,500 126,800 124,300 519,700 Navistar 1st Q 2nd Q 3rd Q 4th Q Full Year Ford 60,000 56,200 65,400 53,500 235,100 Other OEM's (All Models) 21,000 26,400 29,100 27,700 104,200 Engine Shipments to Truck Group 23,100 12,100 13,700 16,500 65,400 Total Shipments 104,100 94,700 108,200 97,700 404,700 Navistar 1st Q 2nd Q 3rd Q 4th Q Full Year Ford 47,000 55,300 25,200 24,500 152,000 Other OEM's (All Models) 25,900 31,500 35,100 37,400 129,900 Engine Shipments to Truck Group 12,900 15,700 19,000 16,000 63,600 Total Shipments 85,800 102,500 79,300 77,900 345,500 2008 World Wide Engine Shipments 2007 2006 |
57 Order Receipts – U.S. & Canada Navistar (Order receipt data) FY 2007 FY 2008 Bus (School) 9,600 11,900 Medium (Class 6-7) 21,400 19,400 Combined Class 8 (Heavy & Severe Service) 26,200 45,700 Total Navistar 57,200 77,000 Industry (Order receipt data) FY 2007 FY 2008 Bus (School) 19,400 20,900 Medium (Class 6-7) 50,500 54,600 Combined Class 8 (Heavy & Severe Service) 107,500 157,200 Total Industry 177,400 232,700 Order receipts: U.S. & Canada (Units) |
- 2,000 4,000 6,000 8,000 10,000 12,000 International Dealer Stock Inventory in Units* U.S. and Canada Dealer Stock Inventory 58 Lowest point in over 5 years; has been decreasing every month since March 2007 *Includes U.S. and Canada Class 4-8 and school bus inventory, but does not include Workhorse Custom Chassis inventory. |
Restatements/Revisions 59 Background – As part of this restatement, only very minor service fee Revenue Recognition errors were identified (less than $4 million). During our analytical review during the 4 th quarter, we discovered that our standard cost based Cost Accounting System had not updated the BOM for the new supplier base used in COGS for certain trucks delivered in Q3, resulting in over relieving of inventory and higher than appropriate COGS for Q3. Further work revealed an offsetting similar issue in Q1 and Q2 to a much smaller extent. All process errors were fixed and zeroed out by year-end. The scope was limited to a particular line of business in the Truck Segment. The root cause has been fixed and system improvements are being made. |
Restatements/Revisions (continued) 60 • Financial Statements were also revised due to two immaterial errors: – To correct the balance sheet for payout rights granted to certain stock option holders, a mezzanine equity classification, Redeemable Equity securities, has been added for 6 quarters: Q3/Q4 2007 and Q1/Q2/Q3/Q4 2008. No impact on Income Statement or SOCF. No change in “Total Shareholder Equity”. See EITF D-98. – Also corrected the SOCF (and impact on balance sheet) for effect of exchange rates on liquid assets of foreign subs. Affected statements were 2006 FY, all 2007 statements and Q1/Q2/Q3 2008 statements. Major impact was to increase Cash Flow from Operating activities by $85 million for 2007 FY. No change in Manufacturing Cash Balances or Income Statement. • Both issues detected by Quality Control monitoring, corrected and revised within the year detected and were revised as part of 2008 year-end filings. |
61 Frequently Asked Questions Q1: What should we assume as the total on capital expenditures for 2009? A: For 2009, excluding our NFC and Dealcor acquisition of vehicles for leasing, we expect our capital expenditures to be within the $250 million to $350 million range. We continue to fund our strategic programs. Q2: What is in your Dealcor debt? A: Dealcor debt is comprised of wholesale (floor plan) financing and also retail financing on lease and rental fleets that is securitized (owned by) third-party financing sources. Q3: How many Dealcor dealers did you have as of October 31, 2008? A: Of our 297 primary NAFTA dealers, 21 were Dealcor dealers as of October 31, 2008. We expect to have fewer Dealcor dealers on October 31, 2009. Q4: Have you seen any year-over-year steel, precious metals and resin cost increases in 2008? A: Steel and Other Commodities — Commodity price increases, particularly for aluminum, copper, precious metals, resins, and steel have contributed to substantial cost pressures in the industry as well as from our suppliers. Cost increases related to steel, precious metals, resins, and petroleum products totaled approximately $184 million, $178 million, $86 million, and $97 million for 2005, 2006, 2007, and 2008, respectively, as compared to the corresponding prior year period. Generally, we have been able to mitigate the effects of these cost increases via a combination of design changes, material substitution, resourcing, global sourcing efforts, and pricing performance, although we do not specifically identify these items on customer invoices. In addition, although the terms of supplier contracts and special pricing arrangements can vary, generally a time lag exists between when we incur increased costs and when we might recoup them through increased pricing. This time lag can span several quarters or years, depending on the specific situation. |
62 Frequently Asked Questions Q5: What is the status of your hybrid program? A: Navistar is currently in full on-line production of DuraStar™ class 6 & 7 hybrid electric models at our Springfield Assembly plant. This hybrid product is demonstrating 30-60% improvement in fuel economy and has been EPA certified to receive tax credits. We have received 500 orders to date and have raised our production capacity to 5 units a day to meet the increasing demand. In addition we offer a plug in hybrid IC Bus product. We recently released a new beverage tractor application at 55,000 pounds GCWR and have added a WorkStar ® 4x4 to our product offerings. Beyond our DuraStar™ and WorkStar ® hybrid electric products, we are continuing to look at and test other viable platforms such as the delivery of 7 hybrid hydraulic Workhorse package car chassis to UPS. This system uses hydraulic pressure in lieu of electricity to operate the hybrid system. They are showing promise of over 50% improvement in fuel economy. Other hybrid platforms are in development for Class 8 products of the future. The result of this new hybrid technology will be to substantially improve fuel efficiency and reduce the carbon footprint of our truck and bus products of today and in the future. |
63 Frequently Asked Questions Q6: The future of diesel transportation is being impacted by environmental and energy issues such as fuel efficiency, climate change and clean air. How is Navistar responding to these growing influences? A: Navistar and its production units are fully engaged and are offering solutions on multiple fronts to the commercial truck industry. Aerodynamic efficiency is the single most important issue to address to improve the fuel economy of on-highway trucks. International ® ProStar ® is the industry's most aerodynamic and fuel efficient Class 8 truck. We do extensive development in wind tunnels and work hard to achieve industry-leading aero-efficiency. And our recently introduced International® LoneStar ® , the first ever owner/operator product that is SmartWay certified, is setting a whole new standard of aero-efficiency among premium Class 8 trucks. Another significant reduction in both fuel consumption and emissions can be achieved by reducing idle time of on-highway trucks. Navistar will be the first manufacturer to offer a fully integrated Alternate Power Unit (APU) when the MaxxPower™ APU is launched later this year. The MaxxPower™ APU allows drivers to operate the truck HVAC system and other "hotel" loads while consuming 80% less fuel than idling the main engine. We also believe hybrid technology will be a large part of the national response to climate change and fuel use and we are raising our role as a contributor to energy efficient transportation solutions in the commercial truck, commercial bus and school bus businesses. We are leveraging the natural fuel efficiency of diesel engines and vehicles in several key moves. We are building on our record as the leader in Green Diesel Technology, where Navistar set the pace for the industry in achieving this year’s historically low emission requirements. We have advanced the standard of efficiency with our new ProStar ® truck. And we are well into the important wave of customer interest in hydraulic and electric hybrids which will have a substantial impact on the reduction in green house gas emissions. Navistar was recognized for leadership in the development of hybrid advanced technology in California, receiving the Blue Sky Award for 2007 from WestStart-CALSTART. |
Frequently Asked Questions 64 Q7: What do you finance at Navistar Finance Corporation (NFC)? A: NFC is a commercial financing organization that provides wholesale, retail and lease financing for sales of new and used trucks sold by the company. NFC also finances the company’s wholesale accounts and selected retail accounts receivable. Sales of new truck related equipment (including trailers) of other manufacturers are also financed. Q8: What percentage of truck purchases do you fund? A: We consistently fund about 95% of floor plan inventory for our dealers in the U.S., and approximately 11% of retail purchases. As the company continues to penetrate and sell trucks to larger fleets, we would expect that percentage to decrease. Q9: When is the next refinancing due at NFC? A: All financing facilities have been extended, and we do not need to renew any facility until October 2009. Q10: What are your retail notes funded by? A: The retail notes are primarily funded by a bank revolver and a revolving warehouse facility that we call TRIP that doesn’t mature until 2010. These notes are ultimately sold to either a conduit facility or into a public securitization. Q11: Are there any requirements for NFC leverage? A: NFC is compliant with our revolver leverage covenant of 6 to 1. This ratio calculation excludes securitization debt. |
Frequently Asked Questions 65 Q12: How are your securitization rates determined? A: Portfolio performance, deal structure and market conditions affect pricing. Also asset class, Retail versus Wholesale versus Trade Receivable would affect pricing as may some structural elements. Q13: What is your funding strategy? A: We use three or four primary funding sources. For our longer term retail truck notes that finance the sale of trucks to end customers, we finance those in the term securitization markets either in public deals or with the banks. We primarily finance our wholesale portfolio in traditional private or public securitizations. We also have a combination of revolving type facilities that often warehouse assets until they can be financed permanently. Q14: How is your portfolio performing? A: The portfolio is performing as we would expect given the industry downturn and consistent with prior cycles. The provision for credit losses increased from approximately $19 million to $32 million. Our retail delinquency statistics greater than 60 days also increased slightly from .6% to 1.1%. |
Frequently Asked Questions 66 Q15: How are your repossessions trending? A: Repossessions were slowing down. It is too early to tell if the current turmoil in the markets will require increased repossession activity in the future. To a great extent, fleets have already right sized and fuel costs have rapidly come down, which is all good news. Q16: How are your wholesale balances and dealers doing? A: Wholesale balances have actually come down recently. We think our dealers -- which have always been one of our strengths -- are well positioned in this area. We have never had any significant dealer losses and expect that trend to continue in the future. Q17: Are your interest rates going to increase? A: Like all lenders, we need to achieve a profitability threshold to ensure our continued access to capital, and that means pricing our rates in line with the marketplace. So, yes, as the cost of financing increases for all companies, we are going to pass on some of the cost increase to our dealers and customers. Q18: What kind of rates do you charge your dealers and customers? A: Generally, our rates vary of course (those with higher credit risk have always had to pay higher interest rates) and are usually in line with the market. Q19: How do you make your credit decisions? Do you require a certain credit score? A: We factor in a variety of criteria in our credit scoring model such as business model, company history, down payment, etc. |
Frequently Asked Questions 67 Q20: What is our total amount of capacity at NFC? A: Total availability in our funding facilities was approximately $900 million. Q21: Why is Navistar asking for a revision to the 2010 emission regulation? A: Navistar’s technology path is ready for 2010, and the industry will be ready too. We’re asking that the government take action to allow truckers to have the opportunity to purchase the 2007-compliant technology as well as the 2010-compliant technology. When the new 2010 engines come out, they’re going to be more expensive and many truckers won’t be able to afford them. Q22: What is the current timeline for M-ATV (MRAP Light)? A: Proposals are due January 12 and participants must deliver two test vehicles by February 23, 2009. After two of the vehicles have been evaluated, the government will select five companies by April 10, 2009 to submit a final proposal and deliver the three final test vehicles. Final award(s) to follow in May 2009. Q23: Is the 2009 budget for tactical vehicles approved? A: We understand that there is approximately $3.65 billion available in 2009 for tactical wheeled vehicles. Typically, truck funding comes out of supplementals. Q24: What is the current JLTV timing? A: Companies competing for JLTV are still abiding by a stop order until the military concludes its investigation into the dispute. |
Frequently Asked Questions 68 Q25: Do you have any military parts orders for MaxxPro™ DASH? A: We have not received any parts orders for MaxxPro Dash vehicles. Q26: What is the current funding for MRAP vehicles? A: $1.7 billion was provided for MRAP vehicles in June in the FY2008 supplemental. Funding for MRAP procurement is provided through emergency appropriations bills as it is considered high priority. The Department of Defense will present another emergency request to Congress early next year in order to fund military operations in Iraq and Afghanistan. In addition, the DOD acquisition chief recently authorized up to an additional $100 million for the initial steps of the new MRAP All-Terrain Vehicle (M- ATV) program. |
69 SEC Regulation G The above non-GAAP financial measures are unaudited and reflect a 2007 change in segment reporting methodology. This presentation is not in accordance with, or an alternative for, U.S. generally accepted accounting principles (GAAP). The non-GAAP financial information presented herein should be considered supplemental to, and not as a substitute for, or superior to, financial measures calculated in accordance with GAAP. However, we believe that non-GAAP reporting, giving effect to the adjustments shown in the reconciliation above, provides meaningful information and therefore we use it to supplement our GAAP reporting by identifying items that may not be related to the core manufacturing business. Management often uses this information to assess and measure the performance of our operating segments. We have chosen to provide this supplemental information to investors, analysts and other interested parties to enable them to perform additional analyses of operating results, to illustrate the results of operations giving effect to the non-GAAP adjustments shown in the above reconciliations and to provide an additional measure of performance. DEBT YE 2005 YE 2006 YE 2007 YE 2008 (in millions) Manufacturing operations January 2007 Loan Facility (Libor + 325 matures January 2012) - $ - $ 1,330 $ 1,330 $ Bridge Loan Facility (Libor + 500) - 1,500 - - Financing arrangements and capital lease obligations 408 401 369 306 6.25% Senior Notes 400 - - - 9.375% Senior Notes 393 - - - 7.5% Senior Notes 249 15 15 15 Majority owned dealership debt 245 484 267 157 4.75% Subordinated Exchangeable Notes, due 2009 202 1 1 1 2.5% Senior Convertible Notes 190 - - - 9.95% Senior Notes 13 11 8 6 Other 24 60 39 19 Total manufacturing operations debt 2,124 2,472 2,029 1,834 Financial services operations Borrowing secured by asset-backed securities, at variable rates, due serially through 2011 2,779 $ 3,104 $ 2,748 $ 2,076 $ Bank revolvers, variable rates, due 2010 838 1,426 1,354 1,370 Revolving retail warehouse facility, variable rates, due 2010 500 500 500 500 Commercial Paper (Mexican Finance Subsidary) - 28 117 162 Borrowing secured by operating and finance leases 148 116 133 132 Total financial services operations debt 4,265 $ 5,174 $ 4,852 $ 4,240 $ Cash & Cash Equivalents YE 2005 YE 2006 YE 2007 YE 2008 Manufacturing non-GAAP (Unaudited) 776 $ 1,078 $ 716 $ 775 $ Financial Services non-GAAP (Unaudited) 53 79 61 86 Consolidated US GAAP (Audited) 829 $ 1,157 $ 777 $ 861 $ (Audited) |
70 SEC Regulation G The above non-GAAP financial measures are unaudited and reflect a 2007 change in segment reporting methodology. This presentation is not in accordance with, or an alternative for, U.S. generally accepted accounting principles (GAAP). The non-GAAP financial information presented herein should be considered supplemental to, and not as a substitute for, or superior to, financial measures calculated in accordance with GAAP. However, we believe that non-GAAP reporting, giving effect to the adjustments shown in the reconciliation above, provides meaningful information and therefore we use it to supplement our GAAP reporting by identifying items that may not be related to the core manufacturing business. Management often uses this information to assess and measure the performance of our operating segments. We have chosen to provide this supplemental information to investors, analysts and other interested parties to enable them to perform additional analyses of operating results, to illustrate the results of operations giving effect to the non-GAAP adjustments shown in the above reconciliations and to provide an additional measure of performance. FY 2006 ($Billions) FY 2007 ($Billions) FY 2008 ($Billions) As Reported As Reported As Reported Revenues $14 $12 $15 $15 $16 ($Millions) ($Millions) ($Millions) Manufacturing Segment Profit $838 $426 $1,114 $1,000 $1,050 $750 $800 Asset Impairment Charges & Related Costs* NA NA ($395) Manufacturing Segment Profit $838 $426 $719 $1,000 $1,050 $750 $800 Sub total - Below the line range: ($443) ($499) ($528) ($500) ($330) Consolidated Income Before Income Tax $395 ($73) $191 $410 $460 $1,100 $1,270 $160 $210 Taxes Benefit (Expense) ($94) ($47) ($57) ($40) ($50) ($40) ($50) Net Income (Loss) $301 ($120) $134 $370 $410 $120 $160 Diluted EPS $4.12 ($1.70) $1.82 $5.10 $5.60 $1.65 $2.20 Memo - Professional fees included above in corporate items: ($70) ($224) ($154) ($40) ($30) ($30) ($20) ($40) ($30) *Related to reductions in Ford engine volumes Forecast Original Goal @ 414.5K unit industry 15+ ($590) Full Year FY 2009 ($Billions) Goal @ 244K to 256K unit industry 15+ ($Millions) NA ($Millions) NA ($590) ($Millions) NA $1,600 $1,600 FY 2009 ($Billions) FY 2009 ($Billions) |