 Investor & Analyst Day Melrose Park January 22, 2009 Exhibit 99.1 |
 2 Safe Harbor Statement Information provided and statements contained in this presentation that are not purely historical are forward-looking statements within the meaning of Section 27A of the Securities Act of 1933, as amended, Section 21E of the Securities Exchange Act of 1934, as amended, and the Private Securities Litigation Reform Act of 1995. Such forward-looking statements only speak as of the date of this presentation and the Company assumes no obligation to update the information included in this presentation. Such forward-looking statements include information concerning our possible or assumed future results of operations, including descriptions of our business strategy. These statements often include words such as “believe,” “expect,” “anticipate,” “intend,” “plan,” “estimate,” or similar expressions. These statements are not guarantees of performance or results and they involve risks, uncertainties, and assumptions. For a further description of these factors, see Item 1A. Risk Factors of our Form 10-K for the fiscal year ended October 31, 2008, which was filed on December 30, 2008. Although we believe that these forward-looking statements are based on reasonable assumptions, there are many factors that could affect our actual financial results or results of operations and could cause actual results to differ materially from those in the forward- looking statements. All future written and oral forward-looking statements by us or persons acting on our behalf are expressly qualified in their entirety by the cautionary statements contained or referred to above. Except for our ongoing obligations to disclose material information as required by the federal securities laws, we do not have any obligations or intention to release publicly any revisions to any forward-looking statements to reflect events or circumstances in the future or to reflect the occurrence of unanticipated events. |
 3 Other Cautionary Legends • The financial information herein contains audited and unaudited information and has been prepared by management in good faith and based on data currently available to the company. • Certain Non-GAAP measures are used in this presentation to assist the reader in understanding our core manufacturing business. We believe this information is useful and relevant to assess and measure the performance of our core manufacturing business as it illustrates manufacturing performance without regard to selected historical legacy costs (i.e. pension and other postretirement costs). It also excludes financial services and other expenses that may not be related to the core manufacturing business. Management often uses this information to assess and measure the performance of our operating segments. A reconciliation to the most appropriate GAAP number is included in the appendix of this presentation. |
 Agenda • Review Strategy – Short Term – Longer Term • Ingredients of Success • Q & A • Product and Technology Tour 4 |
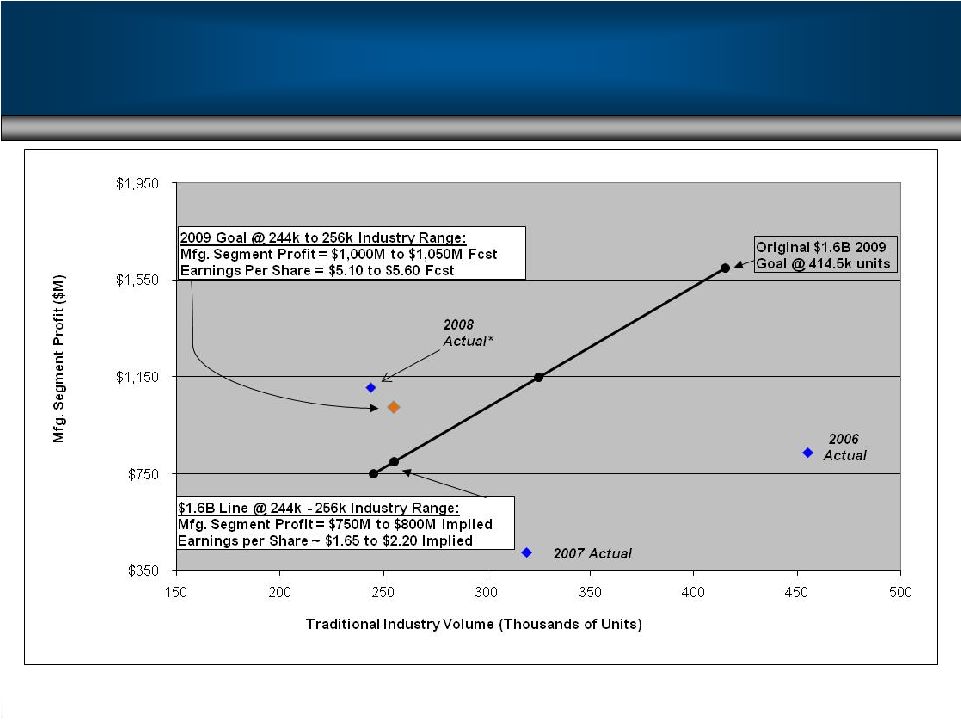
 5 Original FY2009 Goal • Original Goal was $15+ Billion Revenue-$1.6 Billion Manufacturing Segment Profit at 415,000 Industry • Now 2009 Volumes are unknown • Focus is on reducing impact of cyclicality – Non-Traditional/Expansion Markets – Grow Parts • Improve cost structure while developing synergistic niche businesses with richer margins • Improve conversion rate of operating income into net income • Controlling our Destiny Leveraging What We Have and What Others Have Built |
 6 Controlling Our Destiny Leveraging What We Have and What Others Have Built • Market share – Ahead of Plan • ProStar ® • Lonestar ® • Hybrids • MaxxForce™ 11L/13L Launch • EGR Proprietary Solutions On target: • Manufacturing • Sourcing • Commodities • 2008 Capital Spending <$200M • Parts Revenue Growth • Strong Military • CAT J.V. Pending • South America Engine |
 Leveraging Assets & Controlling Our Destiny Dealing with the Unanticipated 7 *Excludes $358 million of asset impairment charges and $37 million other costs related to expectations of significant permanent reductions related to Ford engine volume. Note: SEC Reg G reconciliation slide in appendix |
 Actions to Overcome Industry Volume • Market share improvement • SG&A and business restructuring cost reductions • Presence in other expansion areas • Military • Emissions strategy 8 |
 Leveraging Our Assets while Controlling Our Destiny • When we were at $7 - $8 Billion in revenues, we spent $300 - $500 Million in Capital Expenditures* • Now ~$15 Billion in revenues and our goal is to spend $250 - $350 Million in Capital Expenditures – FY 2006 - $230M – FY 2007 - $312M – FY 2008 - $176M 9 *Exclusive of purchases of equipment leased to others |
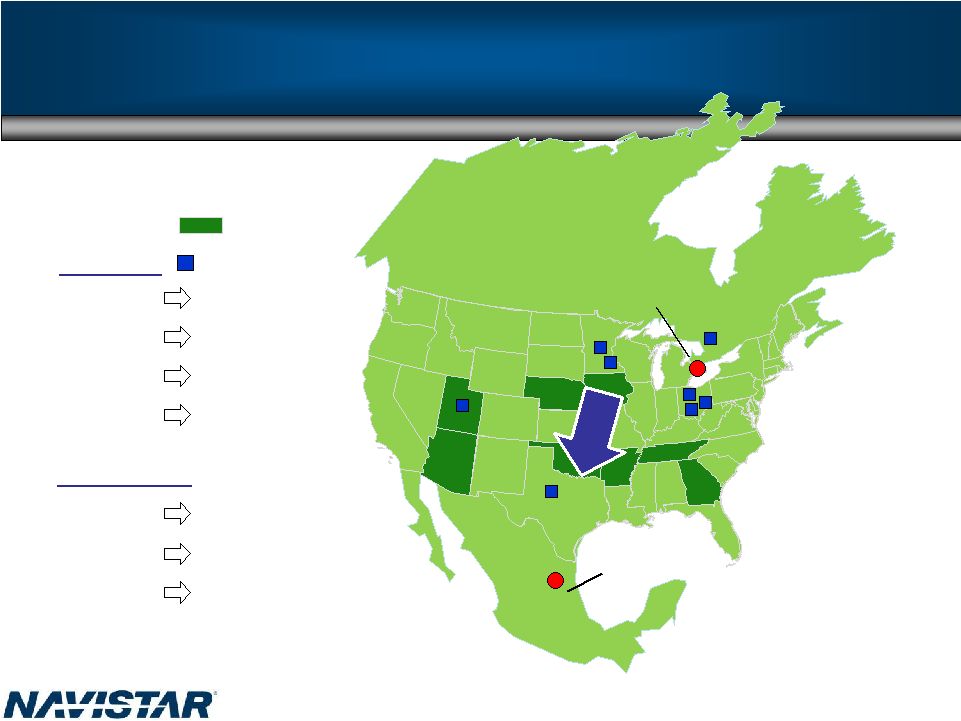
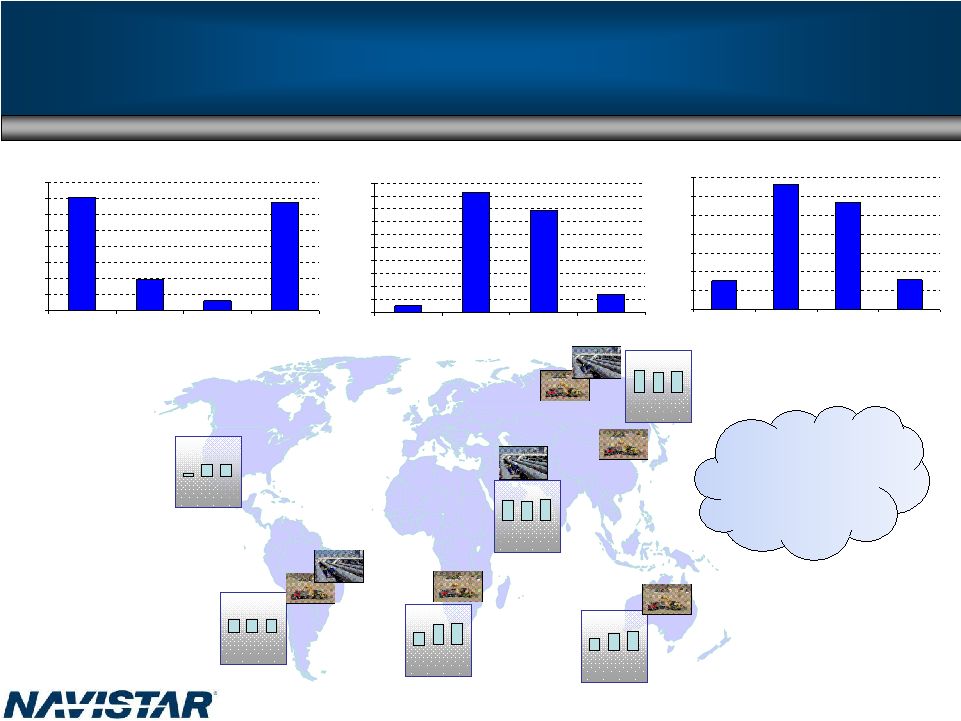
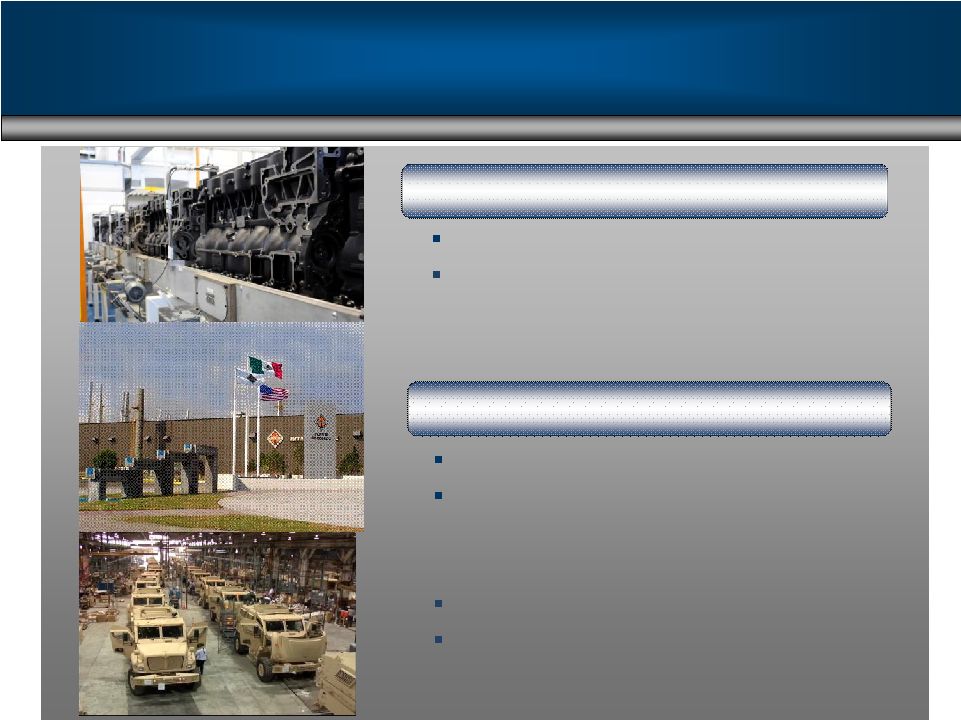 10 Investment Facilities/Sourcing Military parts distribution center West Point Military Assembly - Facility - Contract employees Garland Escobedo South America block line Paint assembly Leveraging Our Assets while Controlling Our Destiny |
 Leveraging Assets - Engine Growth-9.3L 570 Platform Expansion NGD 9.3L Euro IV NGD 9.3L Euro III and IV 11 11 |
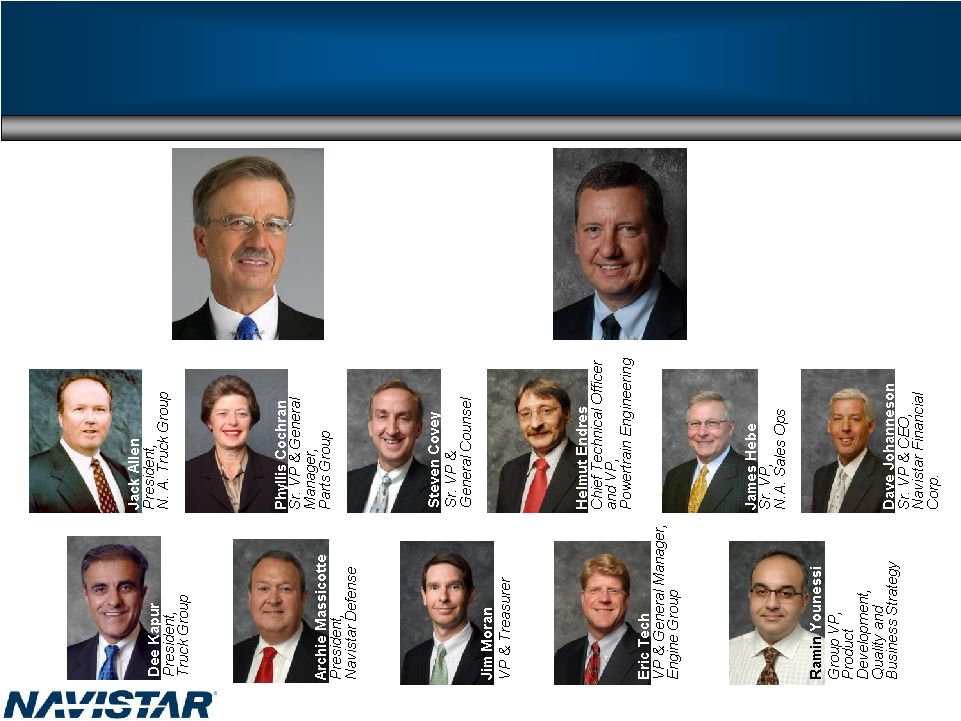 Management Team 12 Daniel C. Ustian Chairman, President and Chief Executive Officer Terry M. Endsley Executive Vice President and Chief Financial Officer |
 Strategy to Lead 13 • Class 6 through 8 • Class 3 through 5 • Niche markets • Military • Global expansion Commercial Trucks, Buses and Diesels |
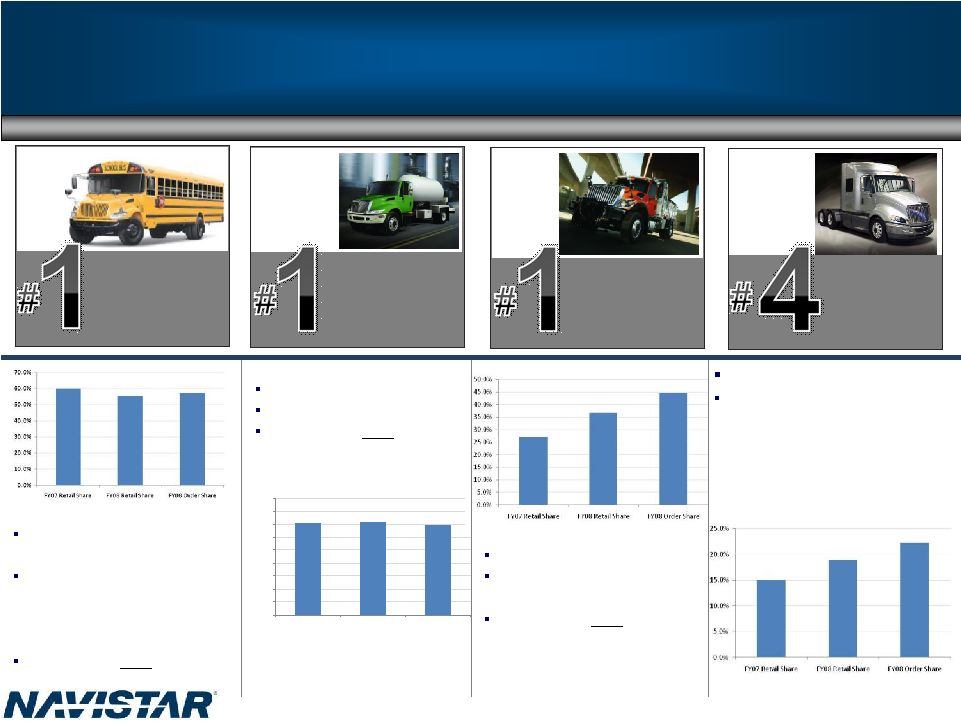 Medium Truck Strategy to Lead-Great Products Total FY2008 Class 6-8 Market Share was 31% * 14 55% Market Share School Bus 36% Market Share 37% Market Share Severe Service Truck* Heavy Truck 19% Market Share 0.0% 5.0% 10.0% 15.0% 20.0% 25.0% 30.0% 35.0% 40.0% 45.0% FY07 Retail Share FY08 Retail Share FY08 Order Share #1 in market share despite industry consolidation First Student announced potential $1.2 billion purchase agreement with Navistar’s IC Bus MaxxForce™ EGR engines #1 in market share A leader in medium hybrid MaxxForce™ EGR engines #1 in market share 3 straight year of increasing market share MaxxForce™ EGR engines #4 in market share Executing on strategy - ProStar ® launch in early FY2007; derivatives launched in FY2008 - LoneStar ® launched in late FY2008 *Includes U.S. Military shipments rd |
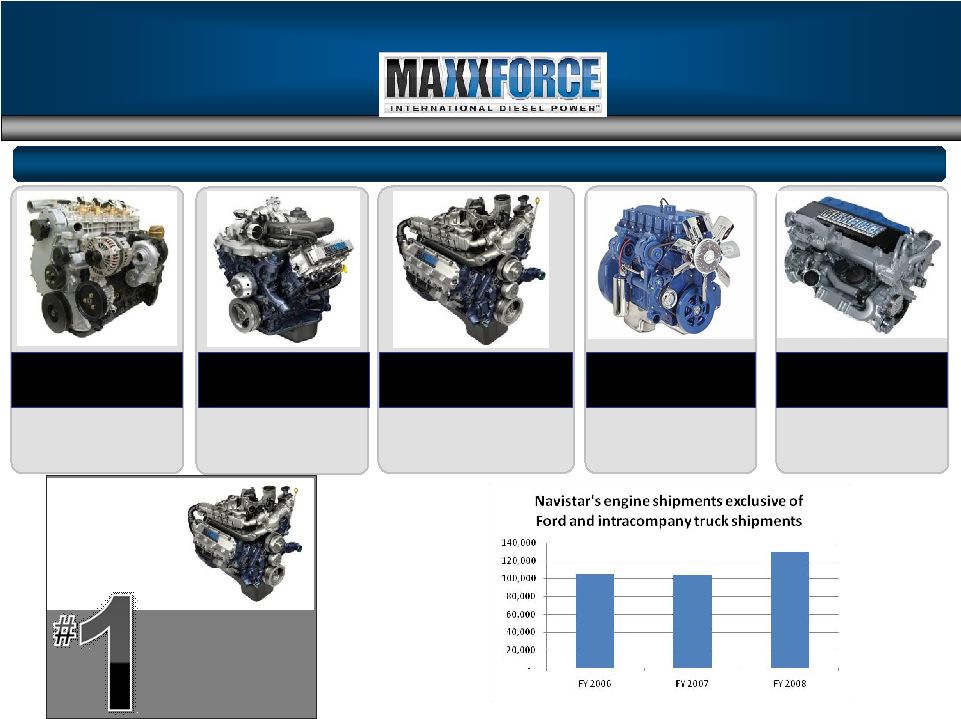 MaxxForce™ DT Series 9/10 MaxxForce™ 7 Ford V8 MaxxForce™ 5 South American Engines MaxxForce™ Big Bore 11L/13L 6.4L V8 4.5L V6 7.6L/9.3L Strategy to Lead Great Products: Engine Complete line of 3L-7L products I4/I6 Built for power, reliability, durability and fuel economy 36% Market Share Mid-Range Engines 15 |
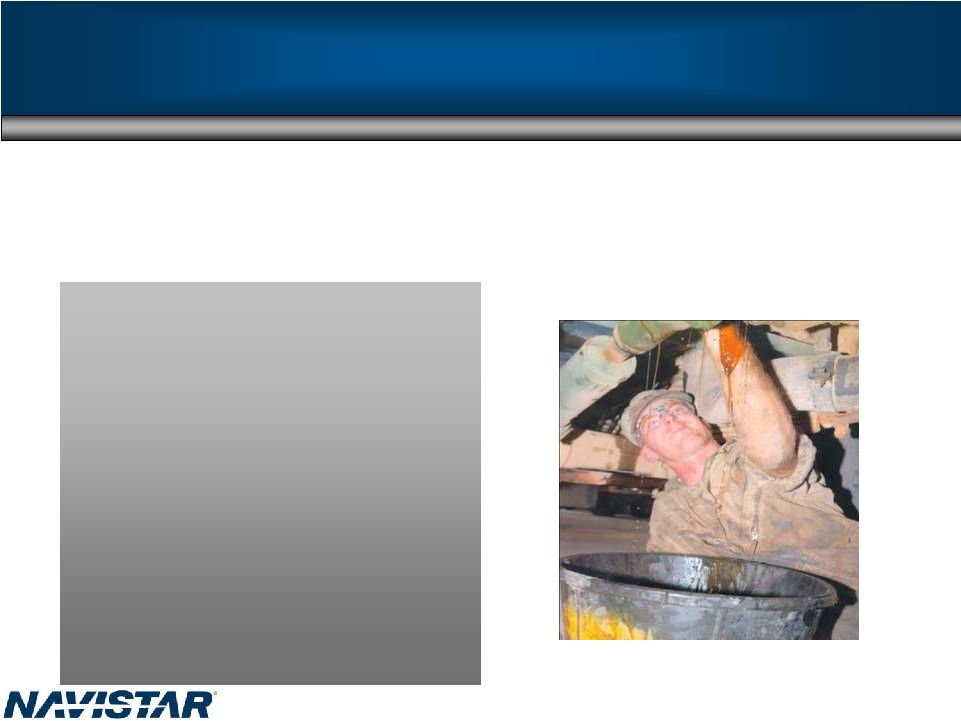
 Extra Fluid Additional Maintenance Additional Driver Training Extra Exhaust Hardware Environmental Strategy to Lead: EGR Takes the Emissions Burden Off Customers 16 |
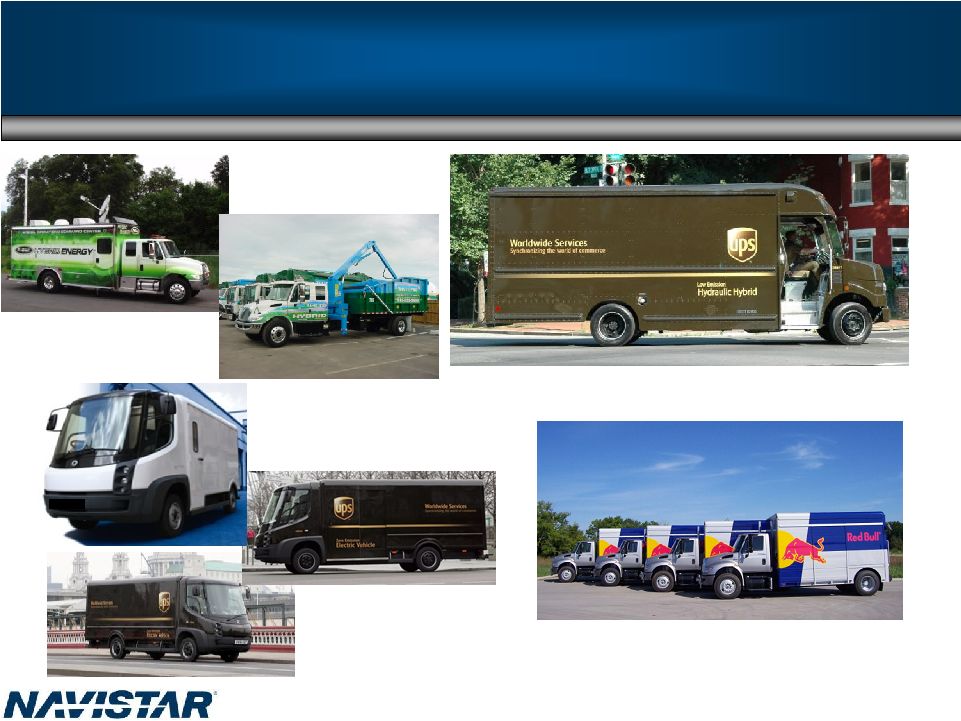 17 Environmental Leadership Red Bull Purchases New International ® DuraStar™ Hybrid Delivery Trucks Trucks save 30%-40% fuel costs while reducing emissions UPS, EPA, Eaton, Navistar Agree: “Hydraulic Hybrid Vehicles Ready for Prime Time” Electric Step Van |
 Strategy to Lead: Military ~70% Wins on Contracts 18 |
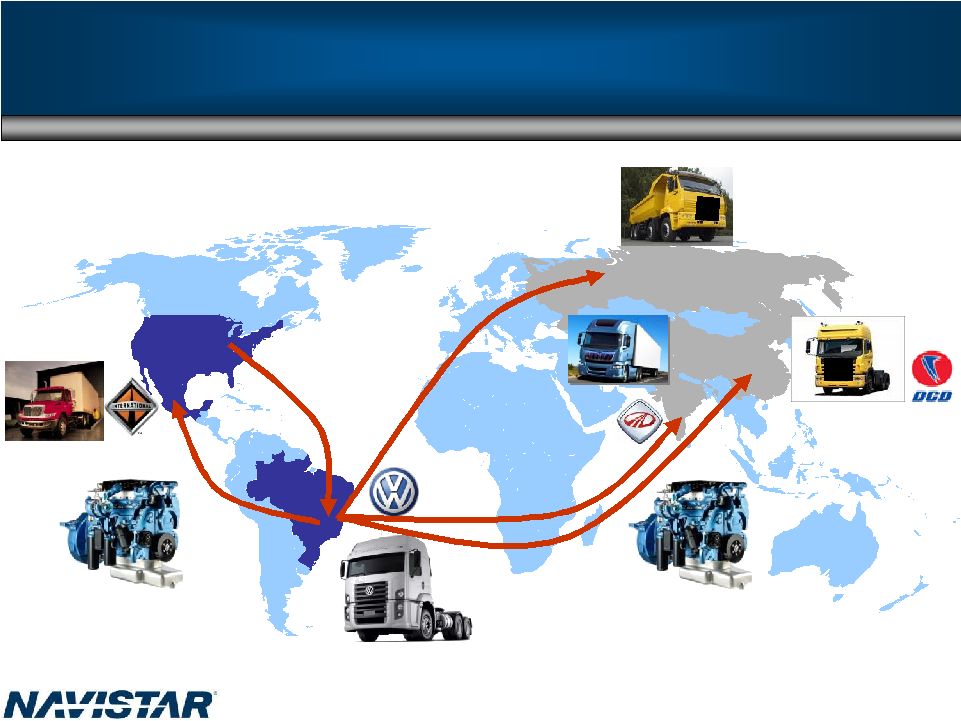
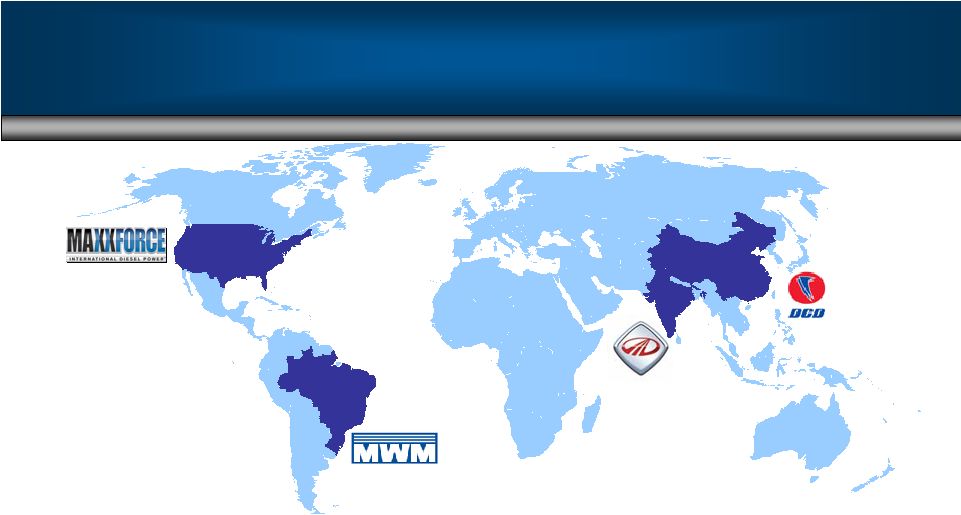
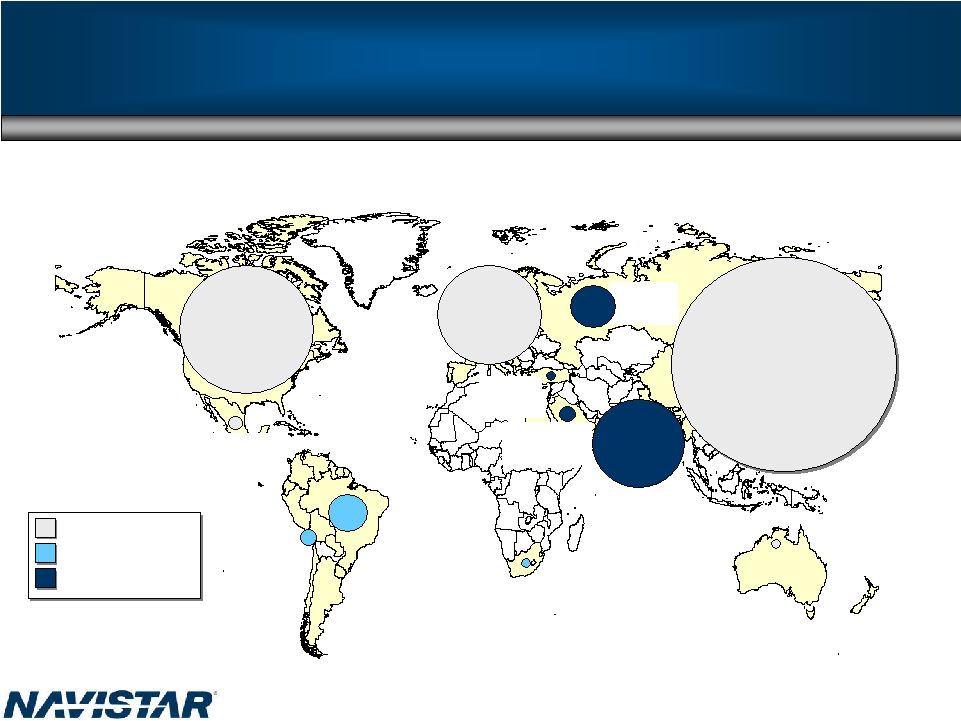
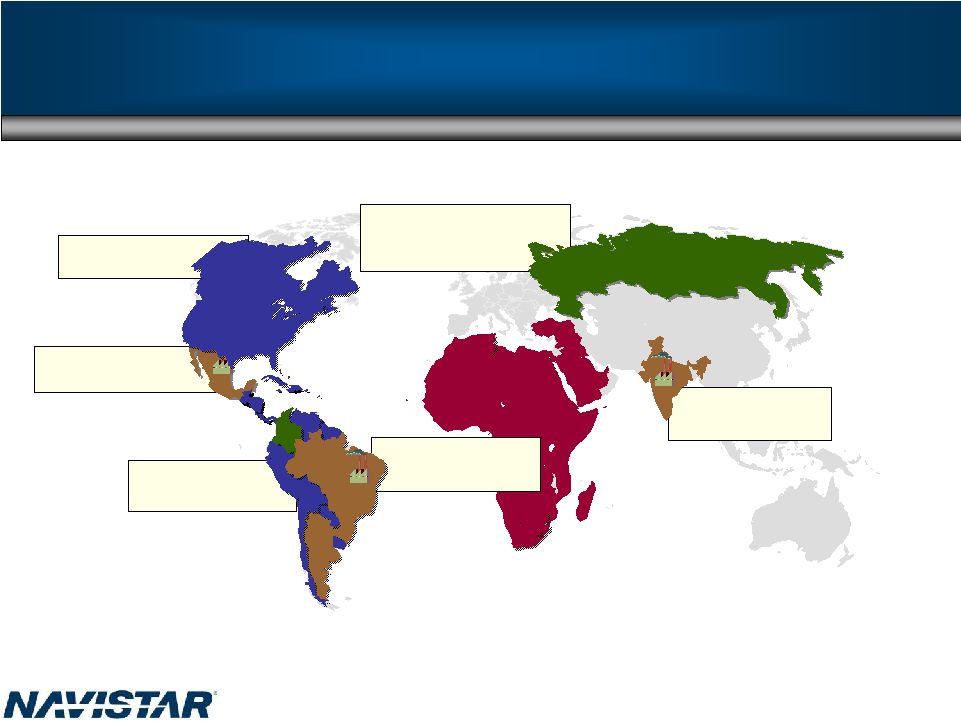
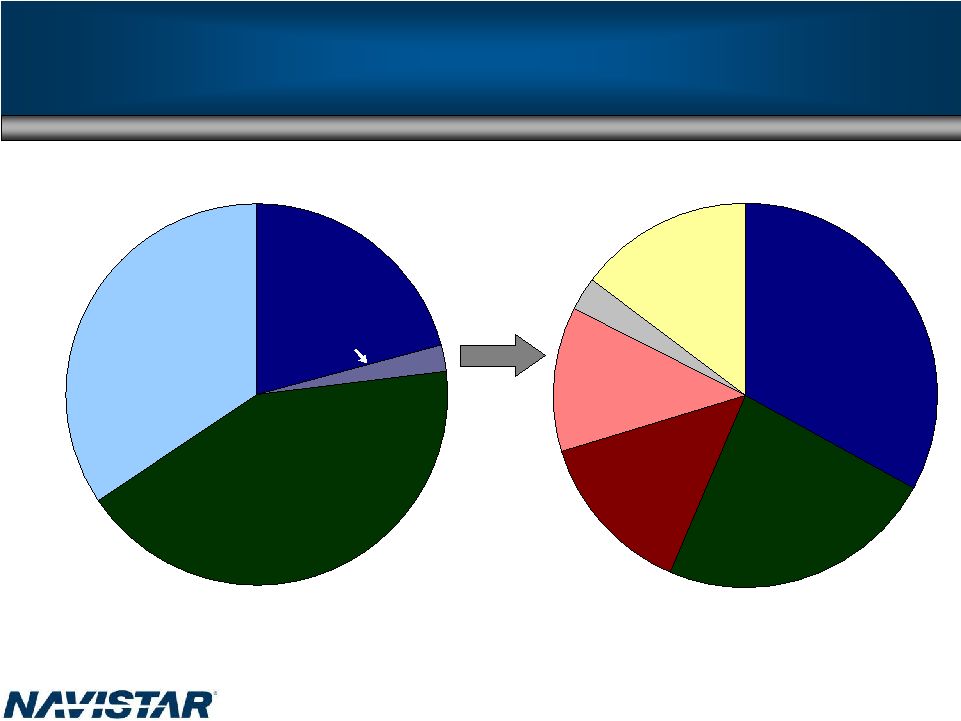 19 Engine Global Diversification 2008 2013 China India Russia North America South America Other ROW South America North America N.A. Growth Ford 315,000 Engines 460,000 Engines |
 Strategy to Lead: Global Engine Strategy 20 • South American product expansion • Integrate with Navistar Truck growth – Military – Bus – Rest of World (ROW) • MaxxForce 11L/13L/15L Diversification of customers TM |
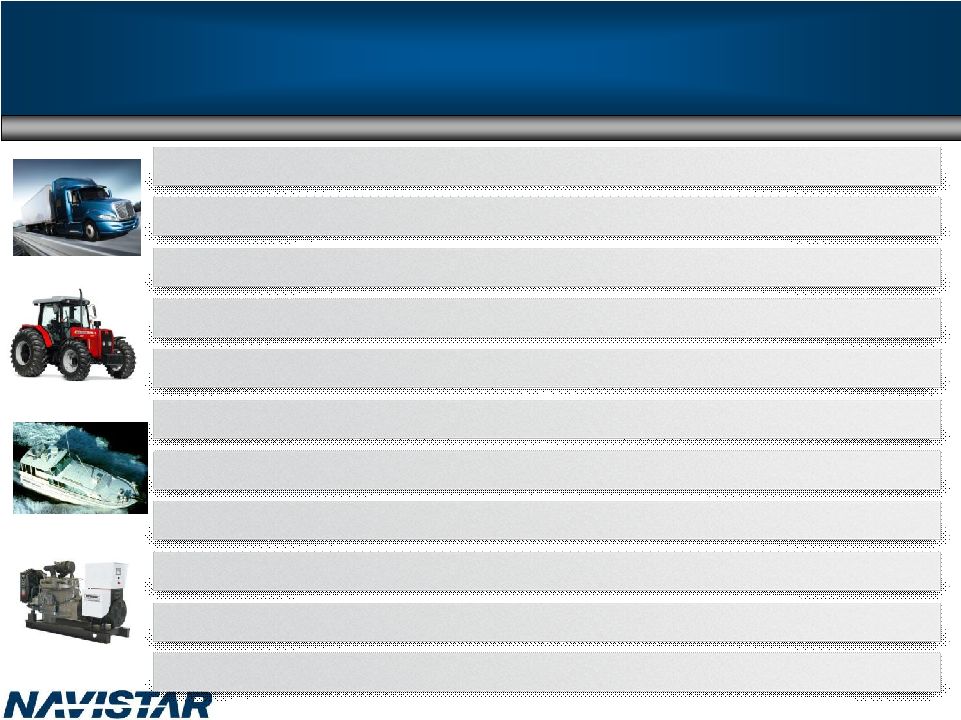 Seen as independent manufacturer of diesel engines Seen as independent manufacturer of diesel engines Complete product line up: 50 hp to 375 hp Complete product line up: 50 hp to 375 hp Develops technology according to customer needs Develops technology according to customer needs Strong brand equity (MWM) Strong brand equity (MWM) Present in various segments: vehicular, wheel tractors, industrial, Genset Present in various segments: vehicular, wheel tractors, industrial, Genset Wide customer portfolio Wide customer portfolio Strategically located Strategically located Customer intimacy Customer intimacy Flexibility Flexibility Lean organization Lean organization Exports represent 30% of net sales Exports represent 30% of net sales How and Why South America is so Successful 21 |
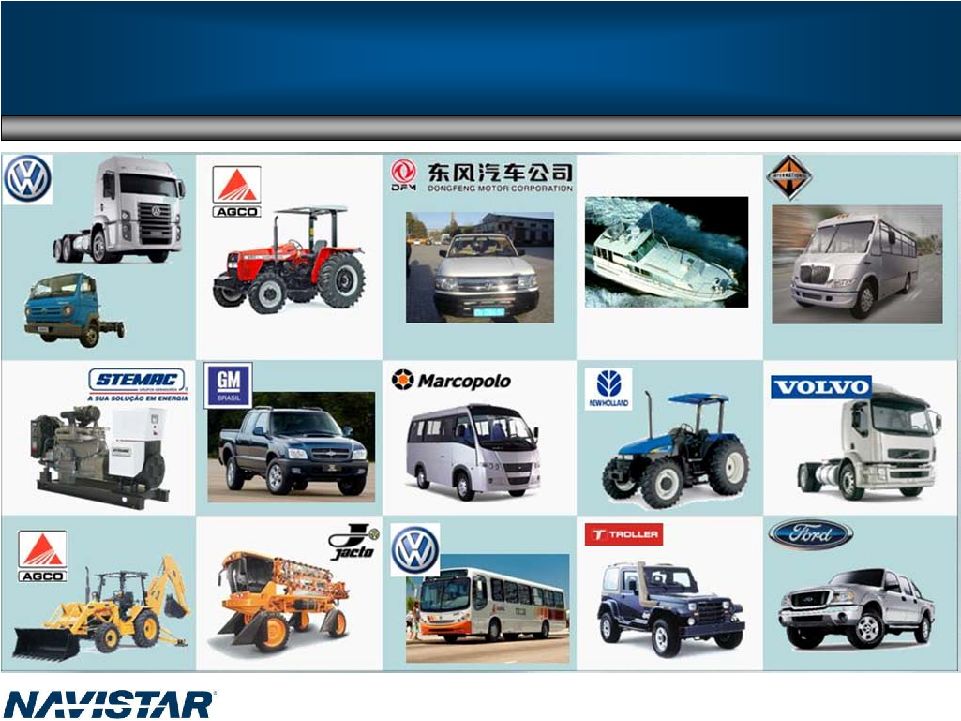 Engine-South America Customers & Applications 22 |
 2 Foundries 3 Machining 3 Assembly 3 Machining 2 Assembly 1 Assembly 1 Machining 1 Assembly 2 Foundries 3 Machining 3 Assembly 3 Machining 2 Assembly 1 Assembly 1 Machining 1 Assembly Engine Global Operations Strategy Supply Chain • Source where assembled • Local presence advantage • Leveraging global scale • Multiple cost competitive sources • Global sourcing to 50% 23 Manufacturing • Assemble products where sold • Manufacturing location flexibility • Multiple changing customers varying volumes • Adapting to local needs • North American plant rationalization |
 • Commercial growth India and exports - New full line Class 4-8 in development - New plant for trucks and engines in 2009 - 2011 target volume 40,000 units/year (market 400,000 Class 3-8) - MNAL plans on selling ~13K light trucks and buses in 2009 - MNAL will also begin production of the new heavy- duty truck 24 Continued Focus on Global Growth • CAT J.V. pending • Commercial bus • Russia • China • Australia • Grow existing markets -Latin America -South Africa -Middle East • Dedicated dealers in all key markets Rest of World-Truck India Rest of World-Engine • Russia • India • China • Grow existing markets -Latin America -South America |
 • Base plan challenged – Industry – Pension & OPEB – year-over-year $250 million increase – Military 25 Summary • Increase market share • Cost reductions – Design – SG&A • Increase military • Plant rationalization • Target $5.10 to $5.60 2009 with Actions 2009 Base Plan 2010 Actions Industry Global opportunities Pension Revenue EPS *For additional information please see Reg G slide in appendix |
 Jack Allen President, N. A. Truck Group |
 Leveraging Assets/Controlling Destiny Leveraging What We Have and What Others Have Built 27 |
  Medium Trucks 37% Market Share Modern high-quality cab and chassis MaxxForce ™ EGR engines Best dealer network Leadership in hybrid vehicles 28 |
 Medium Trucks: Class 6 / 7 TranStar WorkStar Springfield Flexibility New Contract Hybrid DuraStar Blue Diamond JV MaxxForce™ Diesels Platform Scale - Cab - Chassis Medium Industry Medium Share 29 Cost Growth |
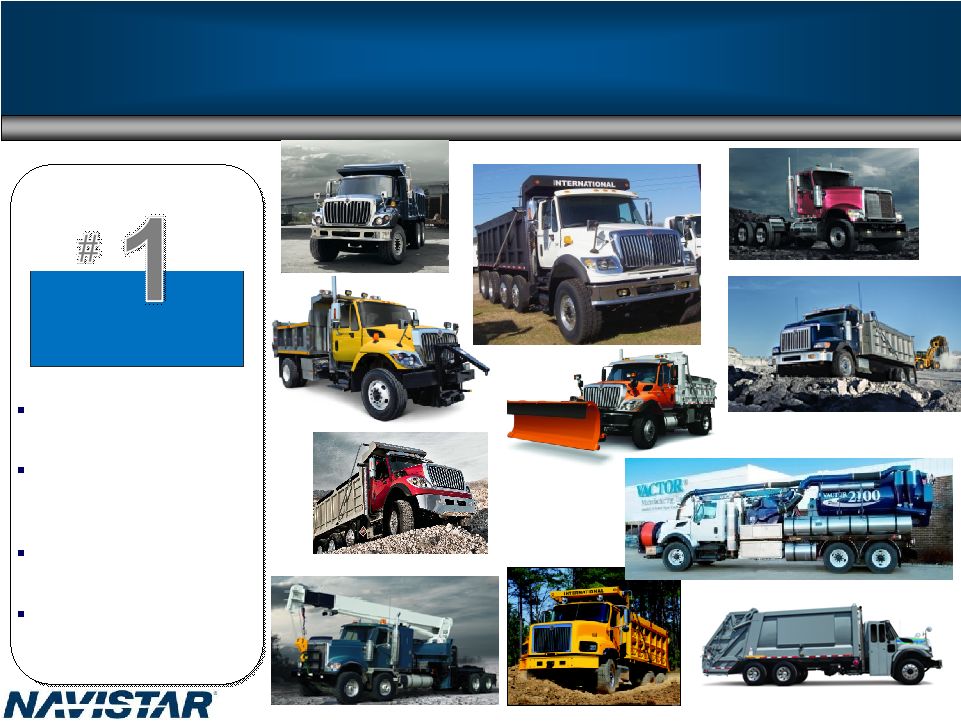  Severe Service 3 straight year of increasing market share Rugged tailored products for niche applications MaxxForce™ EGR engines Best dealer network 36% Market Share 30 rd |
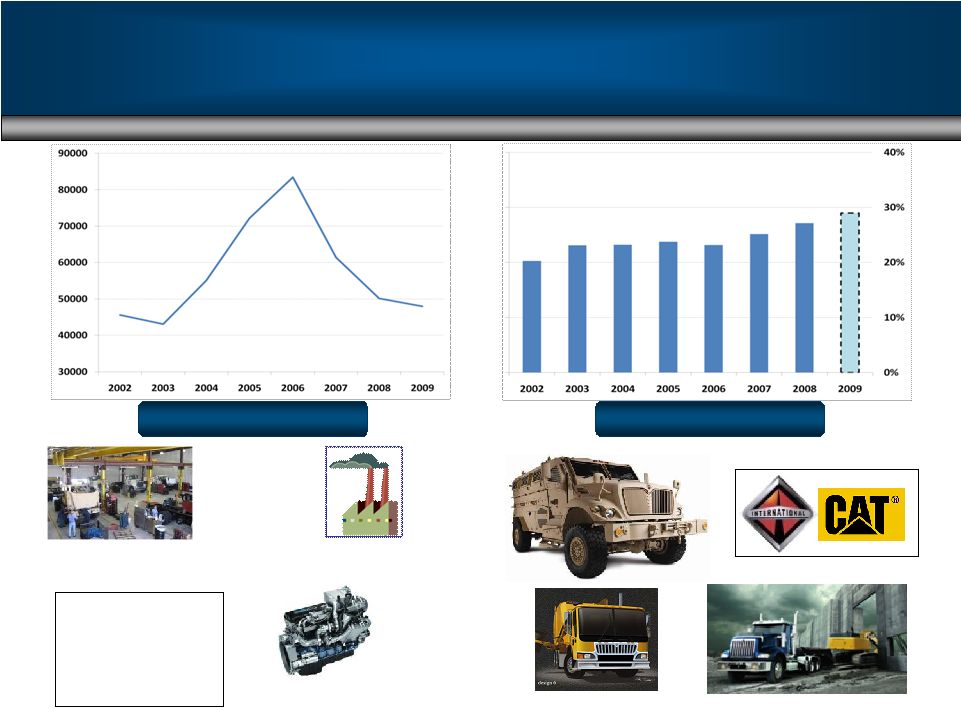  Severe Service 31 5900 Set Back Axle LCOE Garland Modification Center MaxxForce™ 11L/13L Platform Scale - Cab - Chassis Severe Industry Severe Share* Garland cost structure Cost Growth NOTE: ALF J.V. and CAT J.V. Pending *Excludes military shipments |
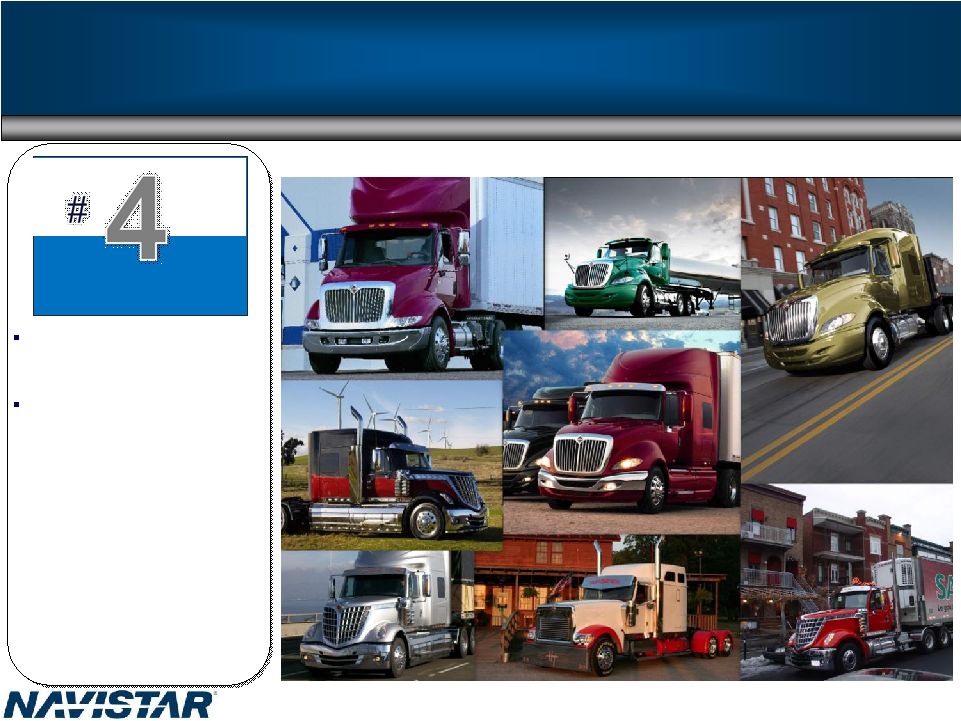  Heavy Trucks 32 19% Market Share #1 with 30% market share in Regional Haul with 11L/13L engines New products - ProStar ® launch in early FY2007; derivatives launched in FY2008 - LoneStar ® launched in late FY2008 • Best fuel economy in class • Best dealer network • Incoming order share at 20+% |
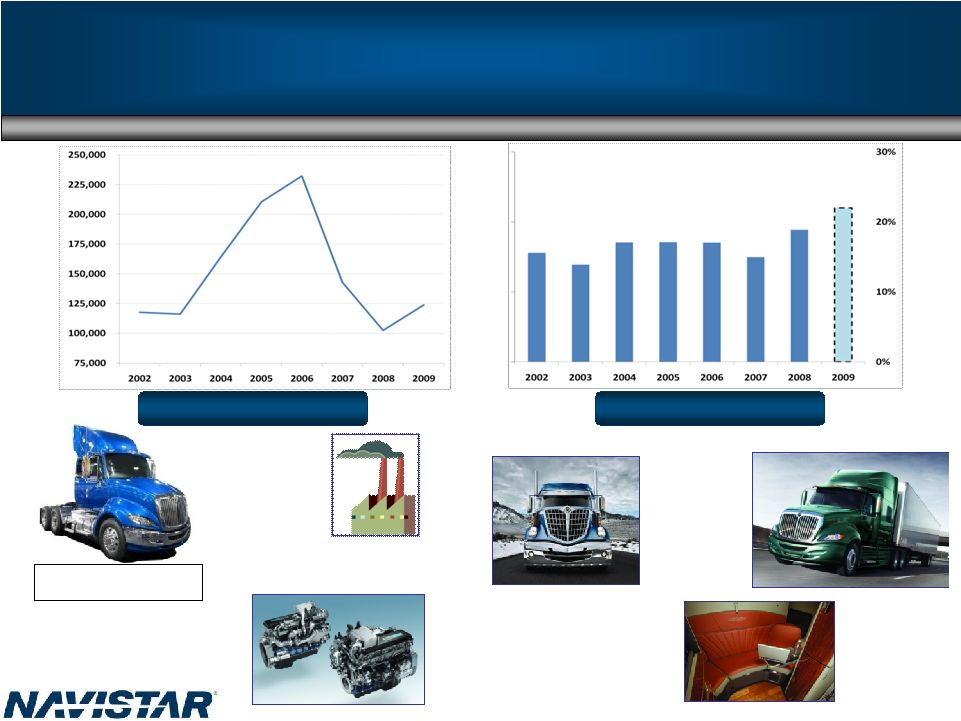 MaxxForce™ Big Bore 11L, 13L, 15L ProStar ® & LoneStar ® Innovative interior design Heavy Industry Heavy Share Heavy Trucks: Class 8 Manufacturing cost opportunity Cab Scale 33 Cost Growth |
 Supply Base and Competitor Migration South • Competitor: x • Supplier: OEM Mexico OEM Exited business OEM Consolidated operations Supplier 1 Nuevo Supplier 2 Mexico Supplier 3 San Luis Supplier 4 Texas • Customer Growth in Southern corridor: Escobedo Plant x x x Chatham Plant 34 |
 Big Bore Engine Volume Transition 35 Today 2009 Transition 2010 Big Bore 11L-15L 11L/13L 46% 15L 54% <425 hp 12% 425-455 hp 64% 475-550 hp 24% MaxxForce™ 11L/13L 330 hp-475 hp @ 1900 rpm 1250-1700 hp lb.–ft. @ 1000 rpm |
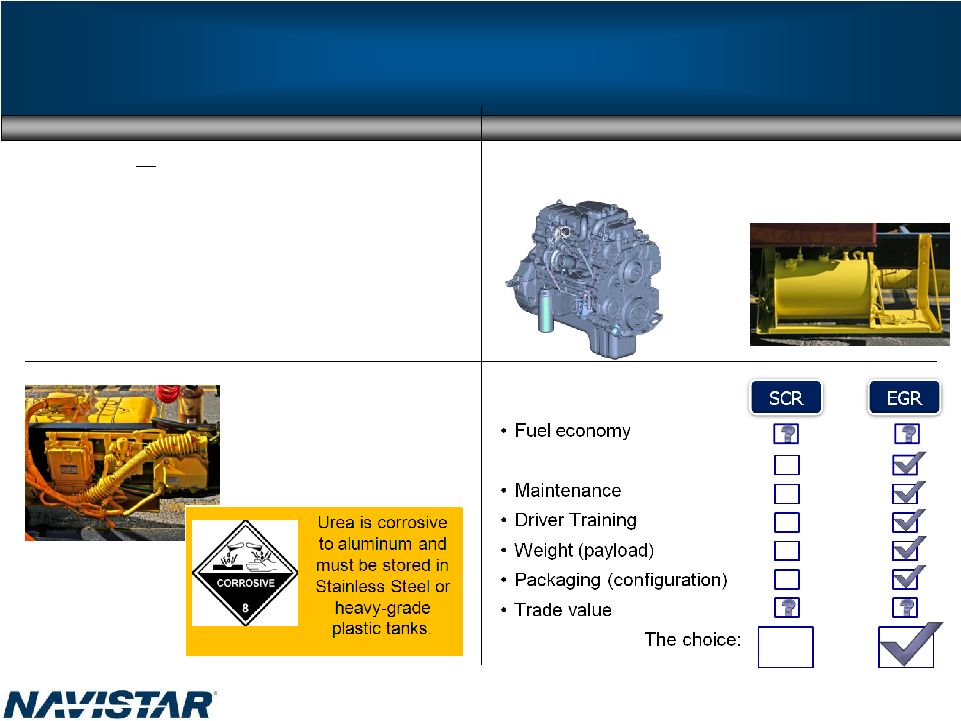 2010 EGR Advantage • In 2009 all MaxxForce engines meet or exceed the government NOx Standard • No other engine OEM has accumulated a significant number of credits by exceeding EPA standards • Advanced EGR provides us with a 2010 solution without the need for additional equipment Advanced EGR In-Cylinder NOx Reduction SCR-based solution requires urea for after treatment Additional parts, components and complex electrical interfaces could reduce SCR system reliability vs. Urea requires infrastructure and increases operating cost Benefits of EGR • Cost 36 |
 Dee Kapur President, Truck Group |
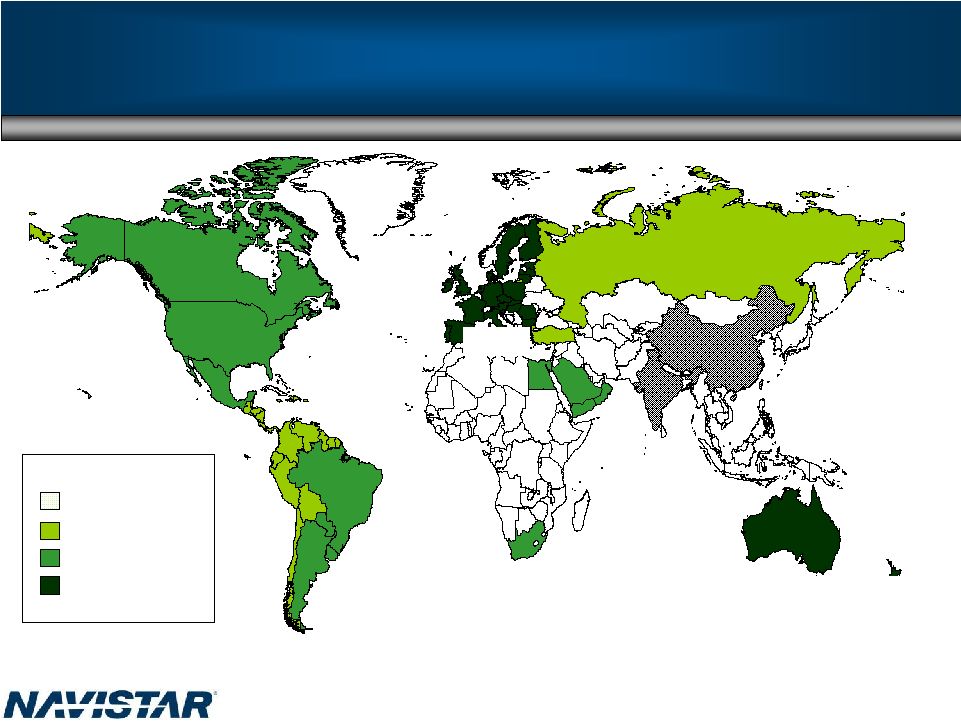
 Australia South Africa India* Mercosur Other LA 30,000 335,000 129,000 22,000 25,000 54,000 North America 443,000 Western Europe 345,000 China 746,000 Turkey Middle East 53,000 Russia 147,000 Mexico 44,000 Note: Includes Medium and Heavy Trucks >6T only Source: JD Power; Monitor Analysis, Mahindra Data (*India >3.5T) Global Truck Market Overview • Global Truck market provides a significant opportunity for growth for Navistar 38 Low Growth Medium Growth High Growth |
 39 World Economies: The Fundamentals for Continued Growth United States 2009 2011 2013 GDP Growth Prospects 0.6 3.7 3.2 South America 2009 2011 2013 GDP Growth Prospects 4.1 4.1 4.1 South Africa 2009 2011 2013 GDP Growth Prospects 3.9 4.8 4.8 Saudi Arabia 2009 2011 2013 GDP Growth Prospects 5.6 5.6 5.8 Australia 2009 2011 2013 GDP Growth Prospects 3.1 3.4 3.5 Russia 2009 2011 2013 GDP Growth Prospects 6.3 5.9 5.6 GDP (US$ trillions) $0 $2 $4 $6 $8 $10 $12 $14 $16 United States China India Western Europe Annual GDP Growth 0% 1% 2% 3% 4% 5% 6% 7% 8% 9% 10% United States China India Western Europe Population (millions) 0 200 400 600 800 1000 1200 1400 United States China India Western Europe Source: World Bank 2008 Regions with significant natural resources have promising prospects |
          40 Navistar Global Growth CATJV & China Partner Partnership for global growth including expansion into China MNAL Growth through partnership with Mahindra for India and exports EXPORTS Opportunistic exports of current North America products Growth potential into next generation Growth potential into next generation 200k+ units/year 200k+ units/year $7+ Billion revenue $7+ Billion revenue 40 NOTE: CAT J.V. Pending |
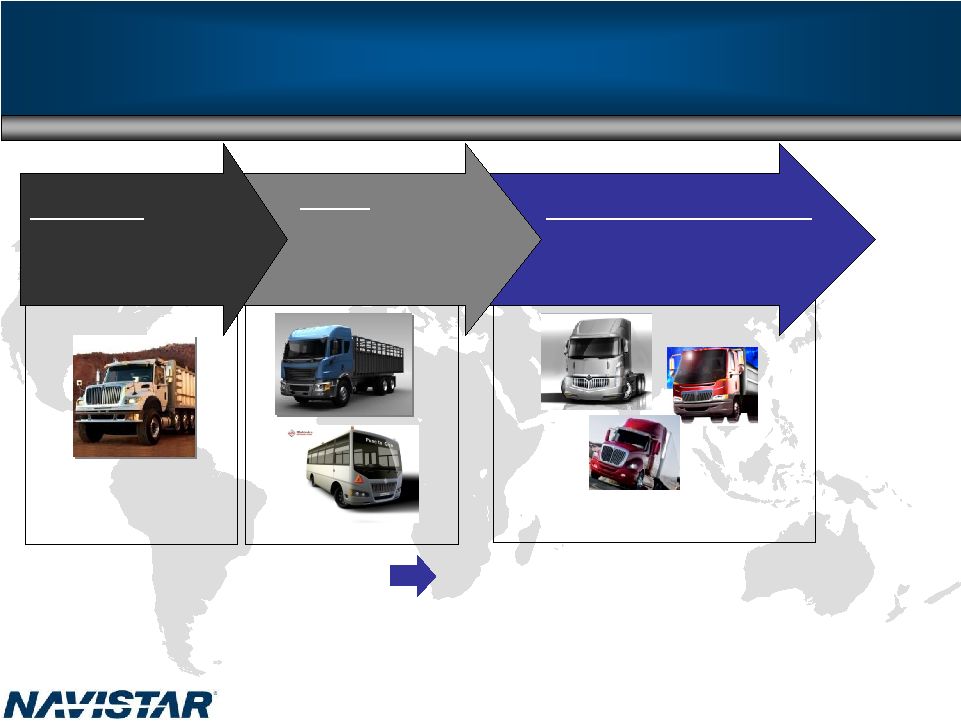
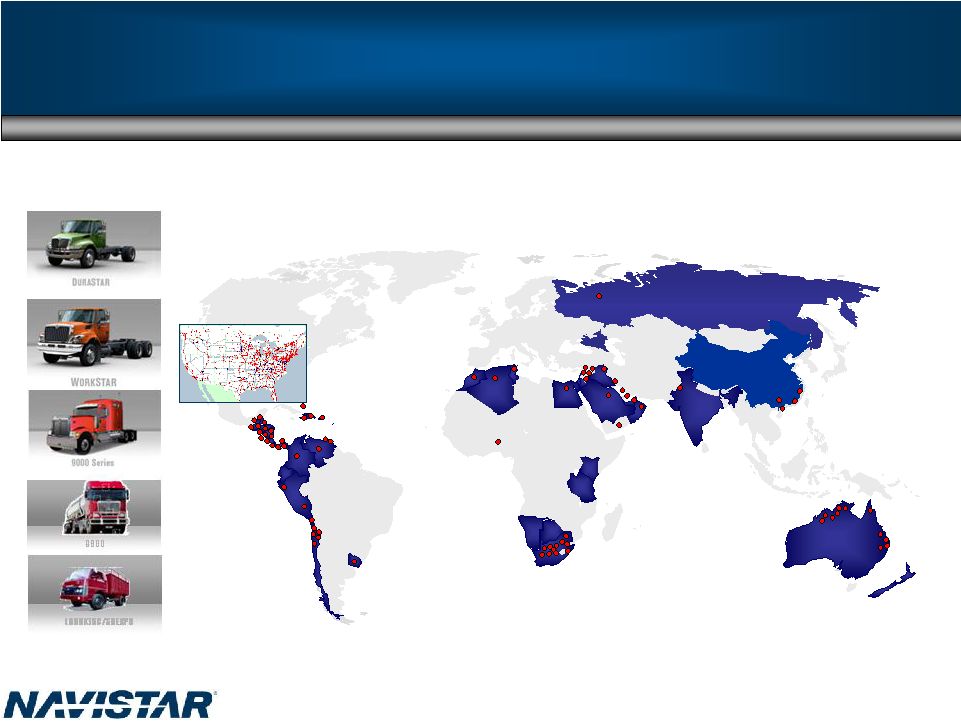 Expanding Navistar’s Global Footprint Phase I: Export opportunities—12,000 units in 2008 41 |
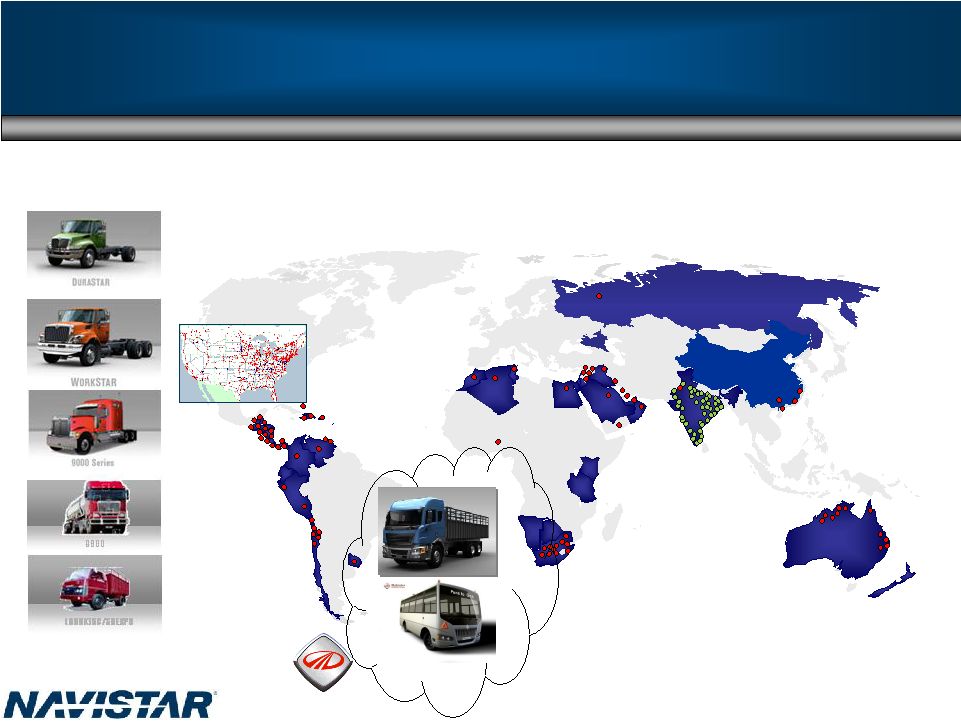 Expanding Navistar’s Global Footprint Phase II: Launch Mahindra-Navistar products/production in India in 2009 42 Mahindra + |
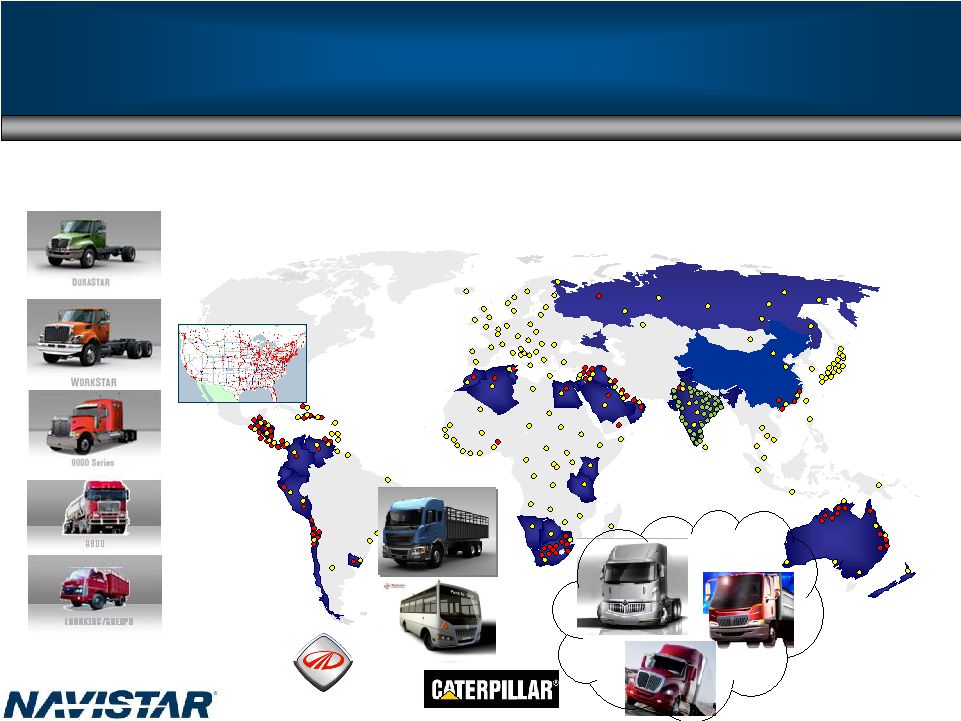 Expanding Navistar’s Global Footprint Phase III: Expand with Caterpillar into rest of world, including China 43 Mahindra + + NOTE: CAT J.V. Pending |
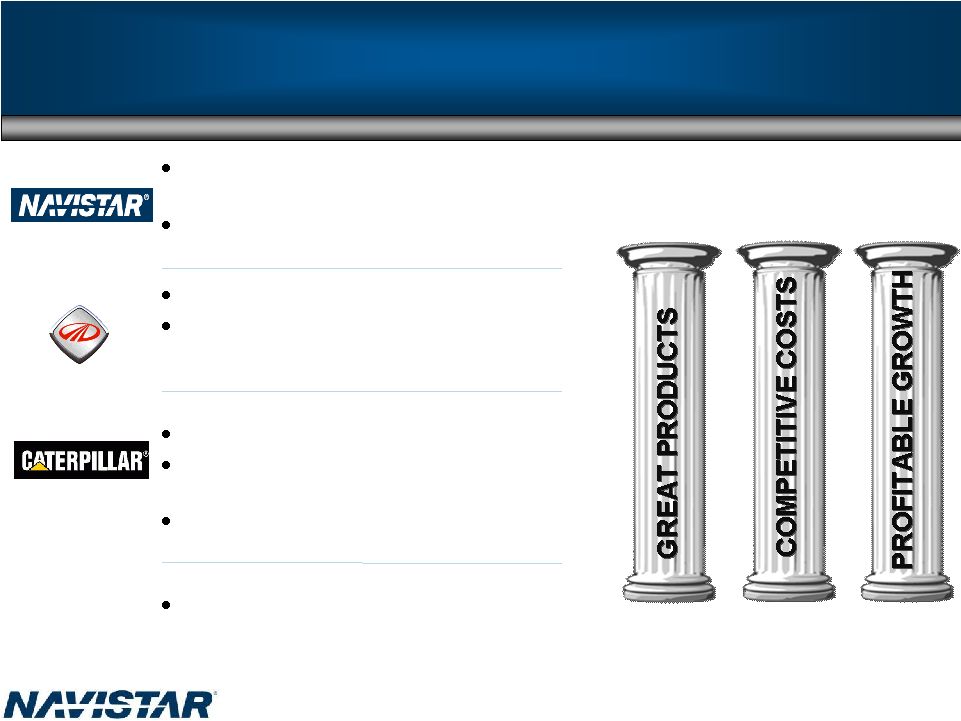 44 Global Strategy: Leveraging What We Have and What Others Have Built Strong, well capitalized global distribution Customer relationships in construction/machinery Well known and respected global brand Best-in-class truck knowledge and experience Strong presence in Latin America and South Africa Leader in Indian light truck market Mahindra-Navistar JV to build cost- competitive COE platforms for local markets Talks ongoing between Navistar, Caterpillar and a top-tier Chinese commercial vehicle manufacturer Mahindra China Partner NOTE: CAT J.V. Pending |
       Global Commercial Bus Opportunities Mexico Industry 15k+ India Industry 30k+ North America Industry 15k+ Latin America Industry 9k+ Russia, Africa, Middle East Industry 9k+ Mercosul Industry 25k+ 45 Key enablers to global commercial bus growth • Crude oil prices WILL rise again • Increased focus on environmental conservation • Ridership on mass transit breaks records – USA Today, June 16, 2008 Global market assumptions based on information from the Freedonia Group |
 Leveraging Assets 46 J.V. with Neobus Neobus: 2 Largest body manufacturer in Brazil Low cost/high quality design capability MIDI Bus targeted for Mexico in 2009 Leverage truck chassis capabilities Leverage distribution network Study U.S./Canada opportunities School Bus Solidify North American leadership with EGR Review global opportunities for safe school- student transportation Preliminary discussions in U.K. and China Motorcoach J.V. with Neobus or Monaco U.S./Canada market EGR advantage Existing distribution Preliminary discussions with number 1 carrier NOTE: J.V. Pending nd |
     47 Note: Truck prices are estimated retail prices (McKinsey, Booz, Monitor) Australia South Africa Turkey Middle East India Russia Mercosur Other LA Mexico China Western Europe North America Avg. heavy truck price <$50K $50-$100K $100-$150K >$150K Conclusions • Marriage of U.S. Technology and low cost/high quality manufacturing (India/China/Brazil) • Products tailored to local markets • Global distribution footprint with partners (CAT, Mahindra) • Potential 200,000 vehicles; $7 Billion revenue |
 Archie Massicotte President, Navistar Defense |
 Leveraging Assets/Controlling Destiny Market Opportunity 49 Benefits • Sharing of engine and truck development cost • Increased volume in current product offerings • Expanding the product portfolio with new products • Gaining access to the global marketplace by providing products and services to the U.S. government and their allies throughout the world • Entry into a less cyclical business |
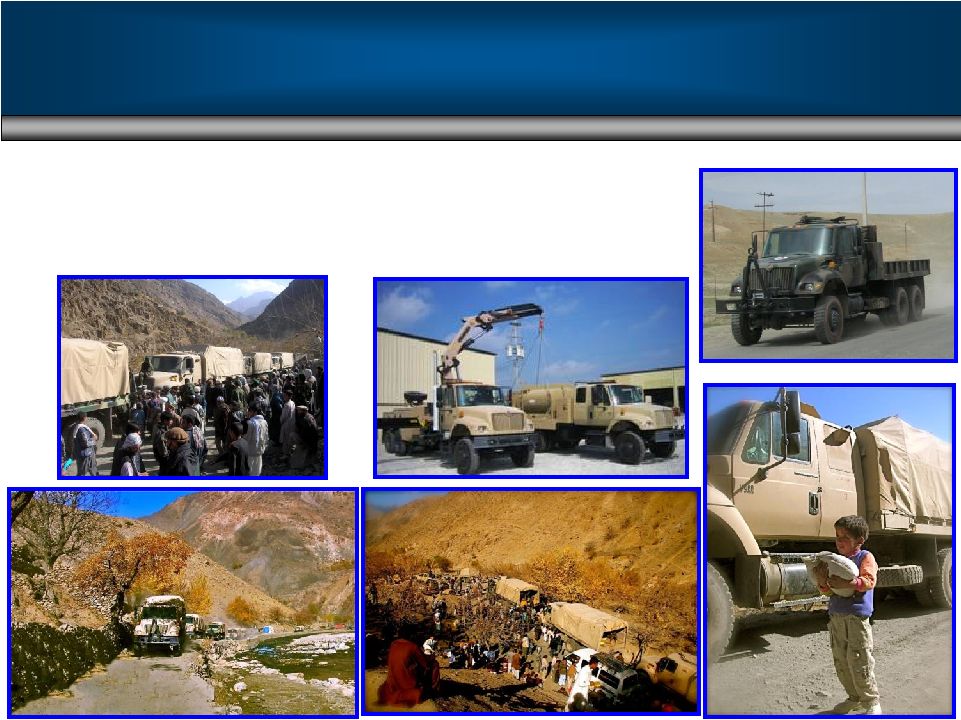
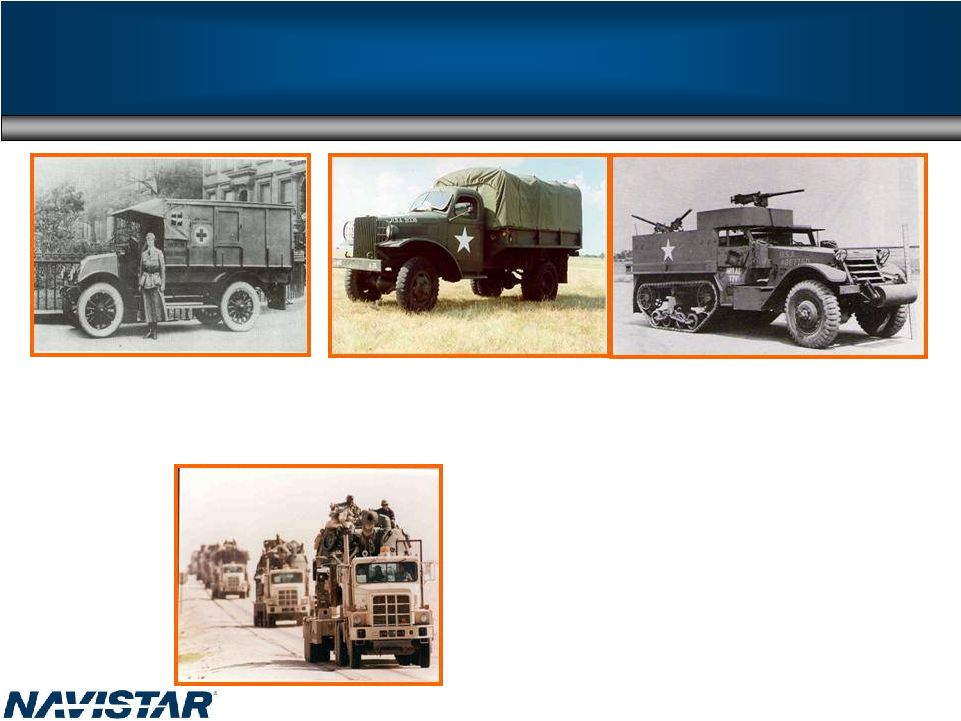 World War II (1942) International M-3-4 1 ½ ton Cargo Truck WW I • International Model H • Deployed in Europe Navistar Military History • Gulf War 12/90 • Near Hafar Al-Batin • Seventy Five F5070 6x4s • Launch of "Desert Storm" • Transported fully loaded, battle ready, M1A1 "Abraham" tanks, artillery, APCs, M88 artillery and Bradely’s 50 |
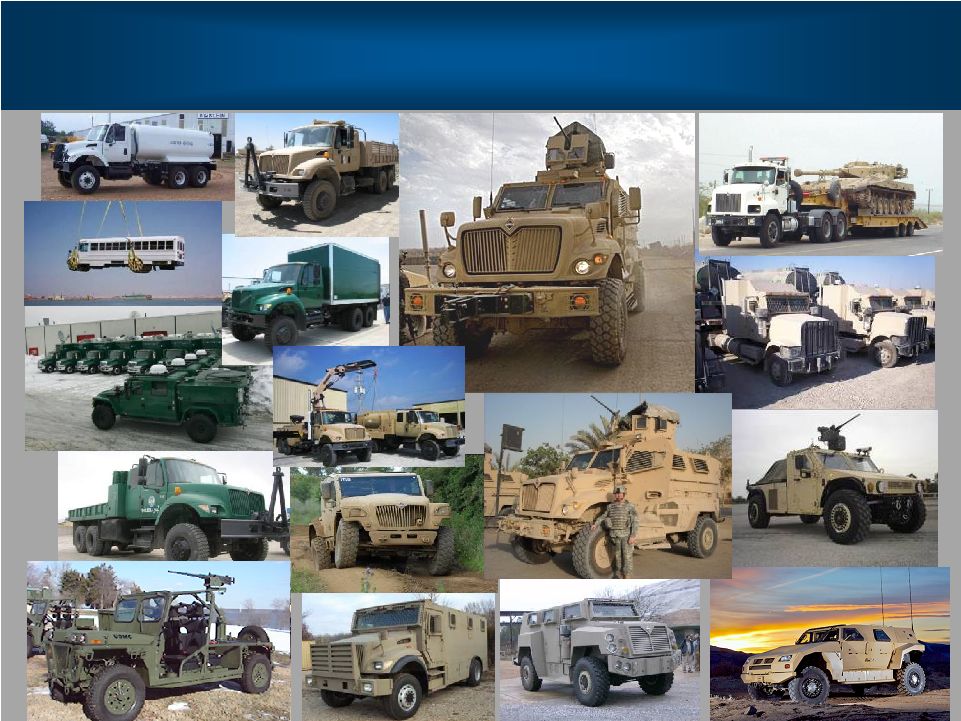
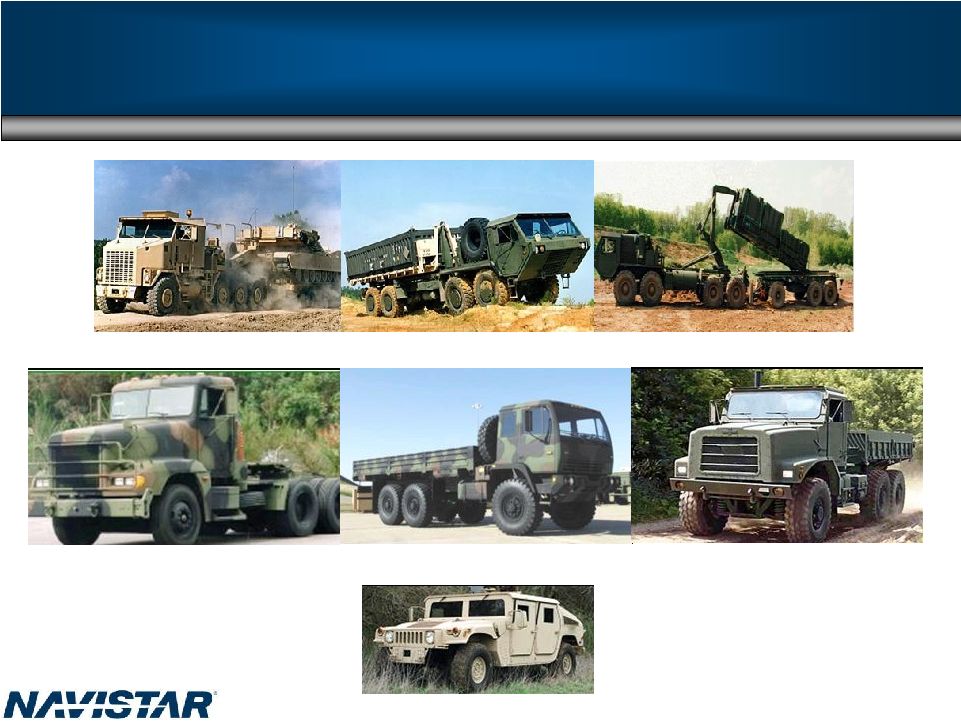 Competitive Landscape HET HEMTT HEMTT - PLS M915 FMTV MTVR HMMWV 51 |
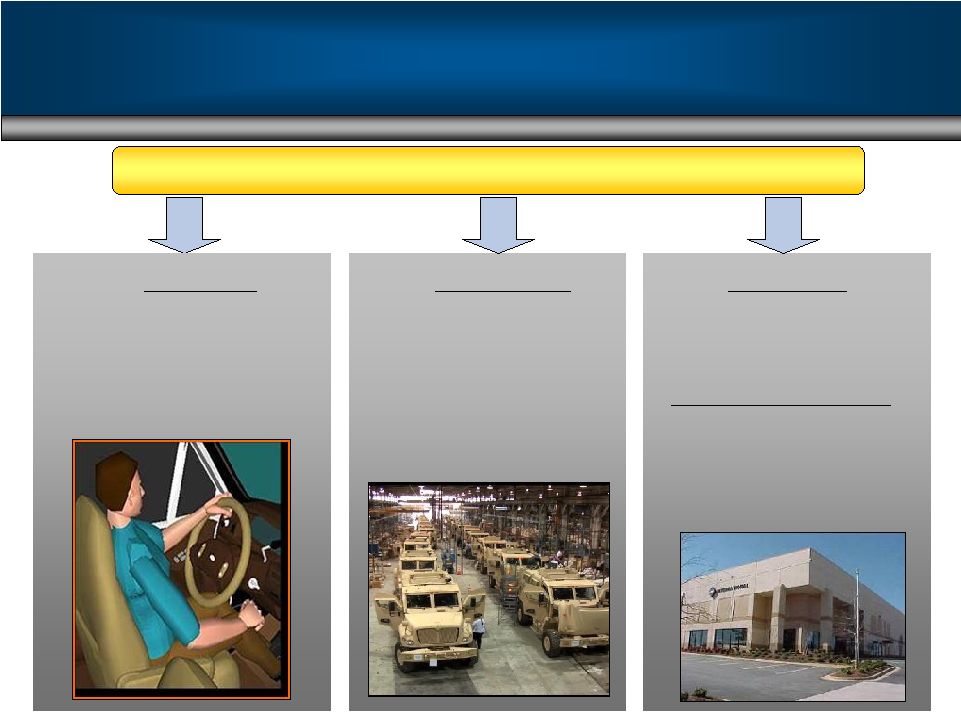 Global Parts Distribution • North America (9) • Dubai, UAE • South Africa • In Theater - Iraq and Afghanistan Sustainment • 1,100 locations worldwide • 80 plus locations in 70 countries Manufacturing • Extremely flexible assembly facilities to meet urgent requirements Engineering • 1,200 engineers • Designed for assembly • Rapid response • Global resources/capabilities – Suppliers integrated into design ENABLERS FOR OUR SUCCESS ENABLERS FOR OUR SUCCESS Leveraging What We Have 52 |
 School Bus Class 6 and 7 Combined Class 8 19,000 to 22,000 19,000 to 22,000 Units per year Units per year Engines 38,000 to 78,000 38,000 to 78,000 Units per year Units per year 37,000 to 73,000 37,000 to 73,000 Units per year Units per year 405,000 to 520,000 405,000 to 520,000 Units per year Units per year Leveraging What We Have 53 |
 Navistar Defense Growth 54 |
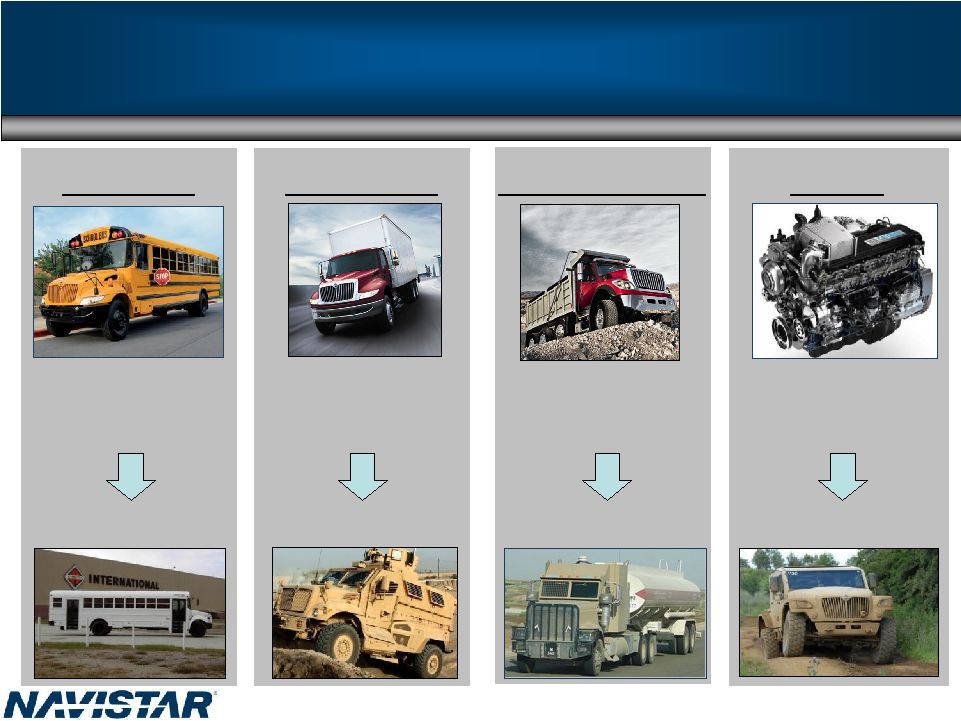
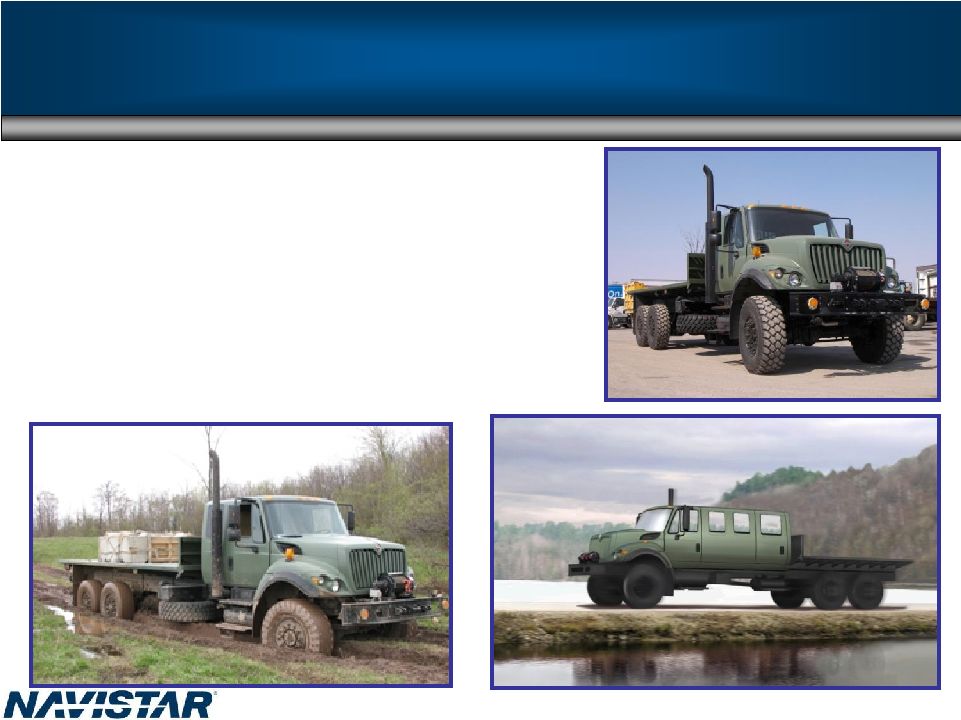
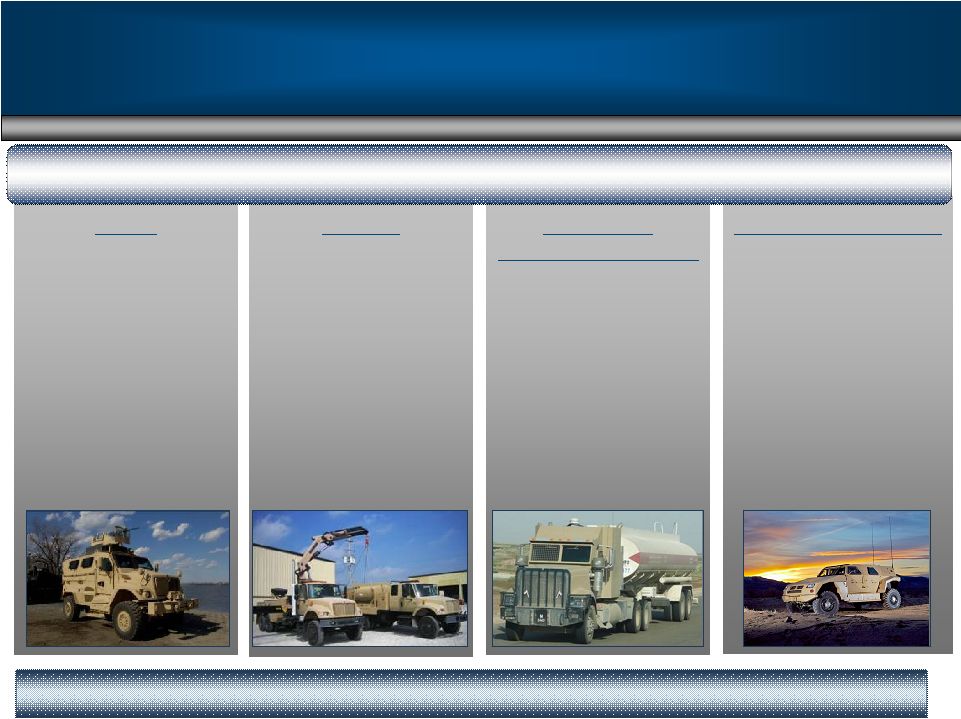
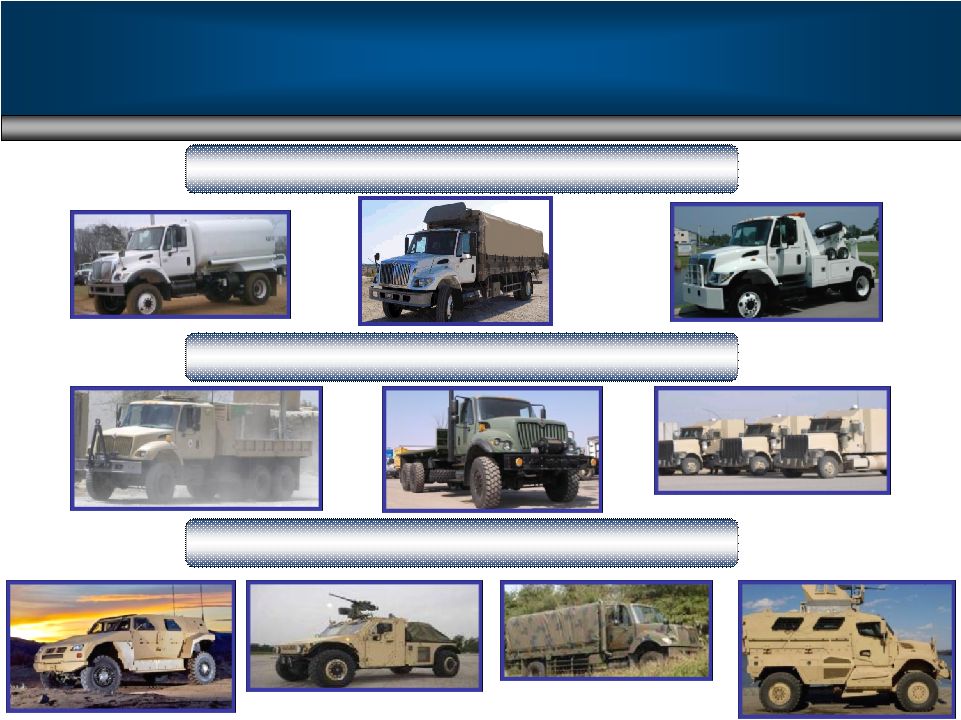 Family of Products Commercial Off The Shelf (COTS) COTS with Military Features True Tactical Wheeled Vehicles 55 |
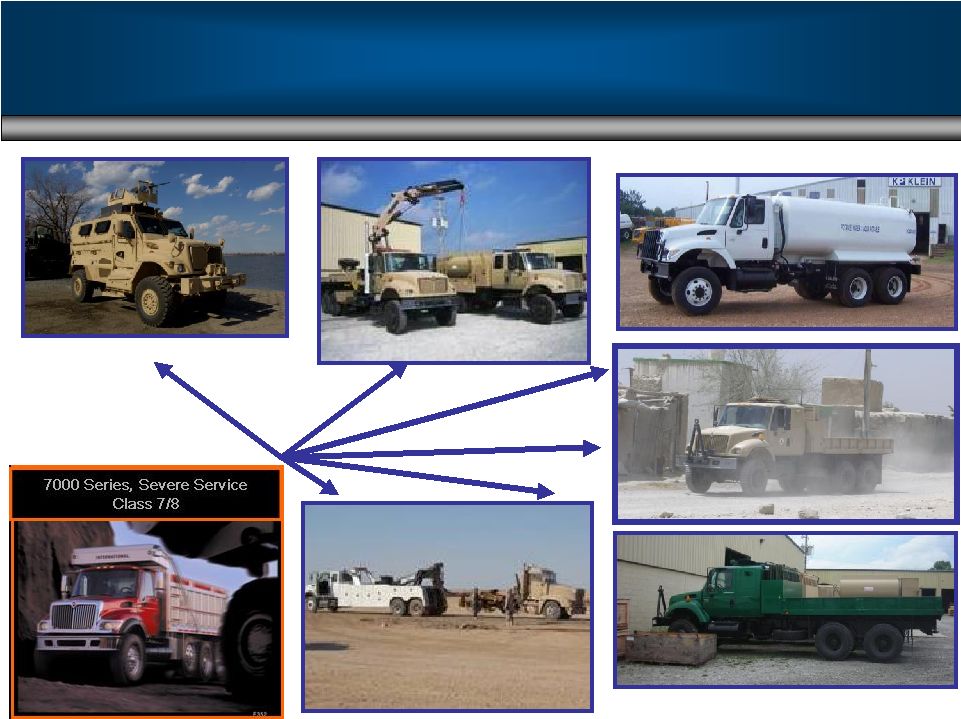 WorkStar - Severe Service 56 TM |
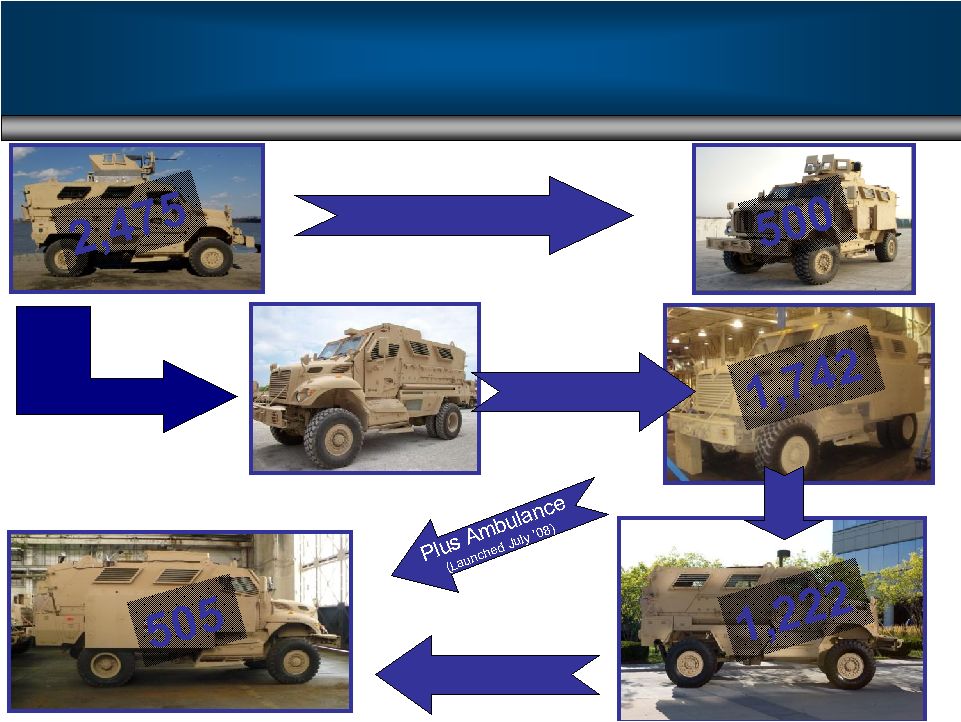           MaxxPro MaxxPro MEAP MaxxPro Plus MaxxPro Plus w/ EFP MaxxPro Dash MEAP Integration (Delivered April ’08) EFP Installation (Delivered May ’08) 53k GVW Upgrade (Launched April ’08) Dash Ambulance (Under development) Leveraging What We Have 57 |
 Afghan (AFMTV) and MTV Contract • Original AFMTV contract ordered 2,916 units and $420M (Delivered) • New MTV contract potential – 7,072 units for $1.3B • Products supported by in-country dealer 58 |
 Tacom Contracts Iraq and Afghan Reconstruction Efforts 59 |
 Canadian Military • Medium Support Vehicle System (MSVS) program • MILCOTS contract of 1,300 units production – $230M – 18 months • Logistics backbone of the Army • Leads path to standard military pattern vehicles (SMP) – 1,500 units 60 |
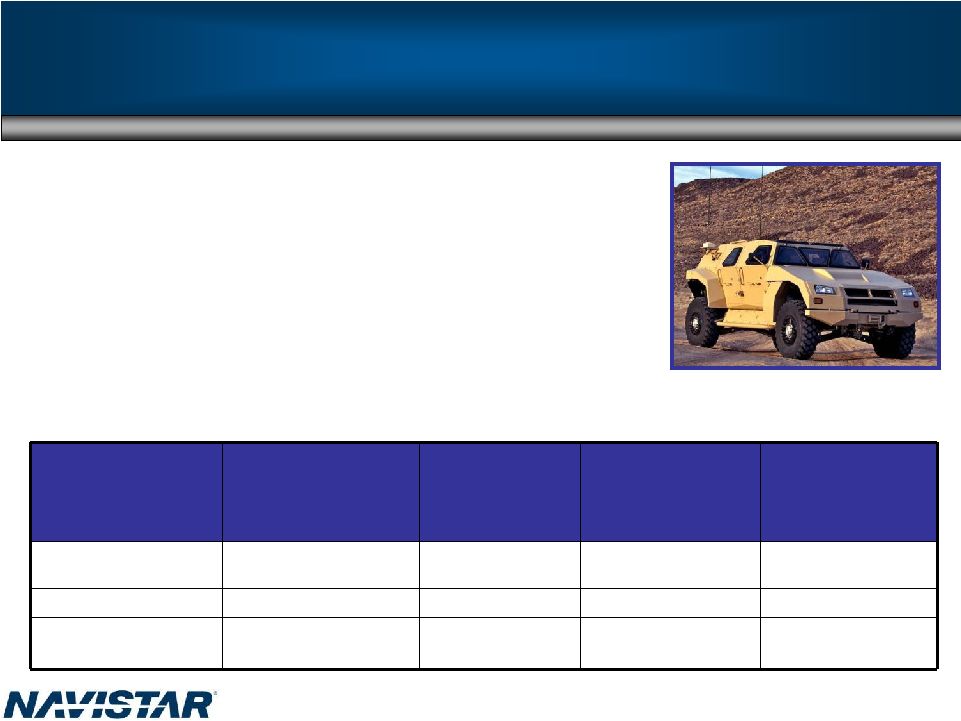 • Customer: JLTV Program Office (U.S. Army, U.S. Marines), Air Force, Special Forces – Replace HMMWV in some roles – better mobility, survivability and transportability • Customer need: 8 year production, 60,000 vehicles + trailers • Incumbent: AM General • Summary of family of vehicles: Three weight categories, 11 variants with high commonality across classes and variants • Government Acquisition Strategy: Four phases Technology Demonstrator (TD) System Development & Demonstration (SDD) Low Rate Initial Production (LRIP) Full Rate Production (2015- 2019) Full Rate Production (2020+) 7 vehicles, 4 ballistic hulls, 4 trailers ~100 vehicles 600 vehicles 29,400 vehicles 30,000 vehicles 27 mos 21 mos 24 mos 5 yrs 3 yrs 3 – 4 awards Full open competition 2 awards Full open competition 1 award Down-select 1 award sole source for 1 5 yrs 1 award sole source Re-compete FRP JLTV 61 st |
 Navistar Defense/ BAE Systems Lockheed Martin/ Armor Holdings (BAE) General Dynamics/AM General General Tactical Vehicles (GTV) Oshkosh/Northrop Grumman / Plassan Force Protection/DRS Textron/Boeing/Ford Raytheon/Blackwater JLTV Competitors 62 |
 63 MRAP – All Terrain Vehicle (M-ATV) • The U.S. Department of Defense plans to acquire M-ATVs in support of an approved Joint Urgent Operational Needs Statement (JUONS) • The M-ATV will be lighter than current MRAP vehicles and must provide maximum protection levels while delivering unprecedented off-road mobility • Government will make up to five indefinite delivery/indefinite quantity (IDIQ) awards • Proposal due 1/12/09 • Two vehicles due 2/23/09 • IDIQ award scheduled for 4/19/09 • Government intends to award ONE vendor May 2009 • Projected volume 2,080 – 10,000 |
 TSV - Tactical Support Vehicle (HUSKY) •Up to 262 units on initial buy •To support operations in Afghanistan •Deliveries to start spring 2009 •Armored 4x4 with PAYLOAD capacity (3,000 PLUS pounds) OUVS- Operational Utility Vehicle System (4,000 – 8,000 units) •2 categories - light and heavy •Navistar Defense down selected in both •MXT platform similar to TSV above UK - Opportunities 64 |
 Exciting new business for Navistar Defense Leverages our Parts expertise This is an opportunity to bring new capabilities to DOD and re-invent traditional government fleet sustainment MRAP Sustainment MRAP Sustainment • Field service representatives • Vehicle upgrades • ECP retrofit • Battle damage assessment and repair • New equipment training • Spares • Supply distribution system • Technical data management • RESET (CONUS and OCONUS) • Fleet management • Manufacturing and production 65 |
 Funding Outlook Funding Outlook Defense spending outlook • President Obama supports de-escalating the war in Iraq but also endorses focusing more resources on Afghanistan • Administration working on an economic stimulus package therefore it would be difficult to envision a cut to defense spending during a recession • Obama’s appointments indicate a more centrist approach • Obama desires to increase “Readiness” and he supports the “grow the Army” strategy • Senate Democrats didn’t achieve filibuster proof majority Conclusions • Over the moderate term, defense spending will most likely grow • FY2011, appears to be the 1 year that can be significantly impacted by the new administration • Pulling out of Iraq and leaving behind equipment will present opportunities for Navistar • Obama’s administration’s dedication to rooting out inefficiencies in government and finding ways to streamline operations benefits Navistar • Increasing readiness levels,“ grow the Army’” strategies, and an Afghanistan troop surge all present opportunities 66 st |
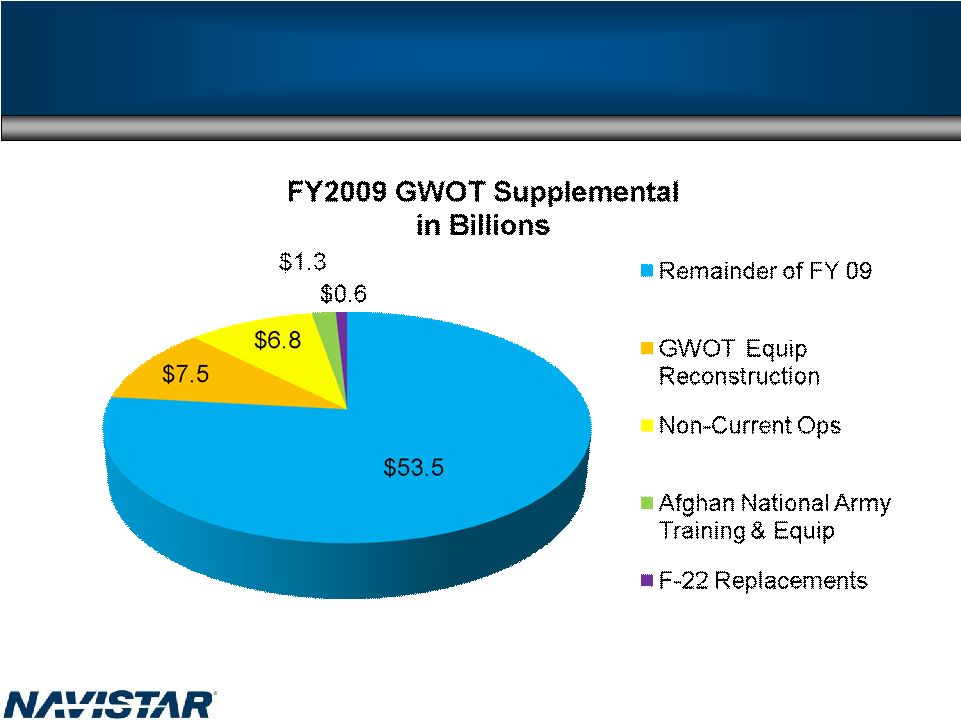 FY2009 Global War on Terror (GWOT) Supplemental 67 Secretary Gates estimate for additional amount of funding needed by DoD for remainder of FY2009 – submitted Dec 2008 |
 • Foreign military opportunities identified in over 20 countries – Iraq – Netherlands – UK – Romania – Saudi Arabia – Australia – Canada – Poland – Turkey • Navistar Defense-contract manufacturer (FMTV, MRAP reset/recap) • Contract logistic support/integrated logistic support revenue streams – Mexico – Singapore – Taiwan – UAE – Greece – Hungry – Croatia – Portugal Other Opportunities 68 |
 Delivery is Just the Beginning Sustainment Matters 69 |
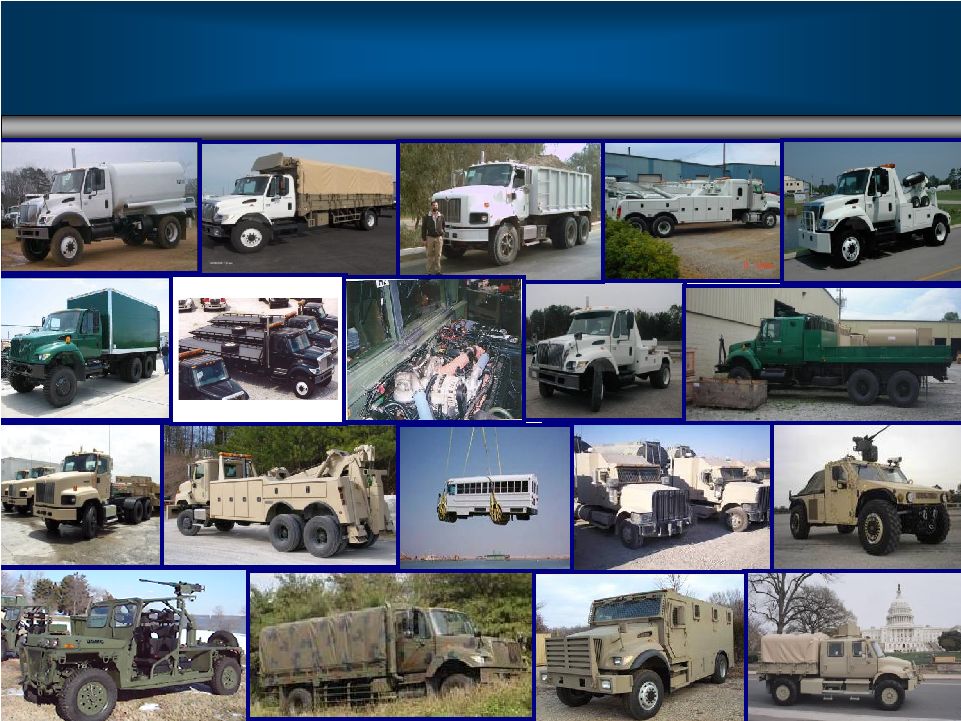
 70 Sustainment/Reset/Remanufacturing Tactical • 7000 MV • AFMTV • MTV • Taiwan • FMS-UK (TSV) • JLTV – down selected • OUVS – down selected • FMS – other Militarized/ supporting vehicles •5000 MV •Armored Line •Haul Tractor •TACOM – other urgent requirements •MXT MRAP U.S. & foreign MRAP variants (6+) •CAT I & II base •Larger vehicle – increased protection (PLUS) •Smaller vehicle (DASH) •Ambulance Future opportunities •M-ATV •FMTV •MMPV •MILCOTS - Canada •SMP - Canada •M915 •JLTV •OUVS •HET •STS We believe the military business (including parts) is sustainable at ~$2 Billion In FY2008 we delivered ~ $4 Billion in revenues Navistar Defense Group |
 Looking Forward • Fleet is aging faster than planned • Recognition of new capabilities and technologies • Operation Iraqi Freedom/Operation Enduring Freedom is approaching a major decision point • Equipping Iraqi Army if U.S. withdraws is large opportunity • Resetting U.S. Fleet if U.S. withdraws is large opportunity • Lessons learned from MRAP form basis for new vehicles • Rest of World opportunities • Navistar Defense has developed unrivaled reputation in U.S. Armed Forces – should lead to major new opportunities 71 Military vehicles as an industry is undergoing rapid change; Represents huge opportunity for Navistar Defense |
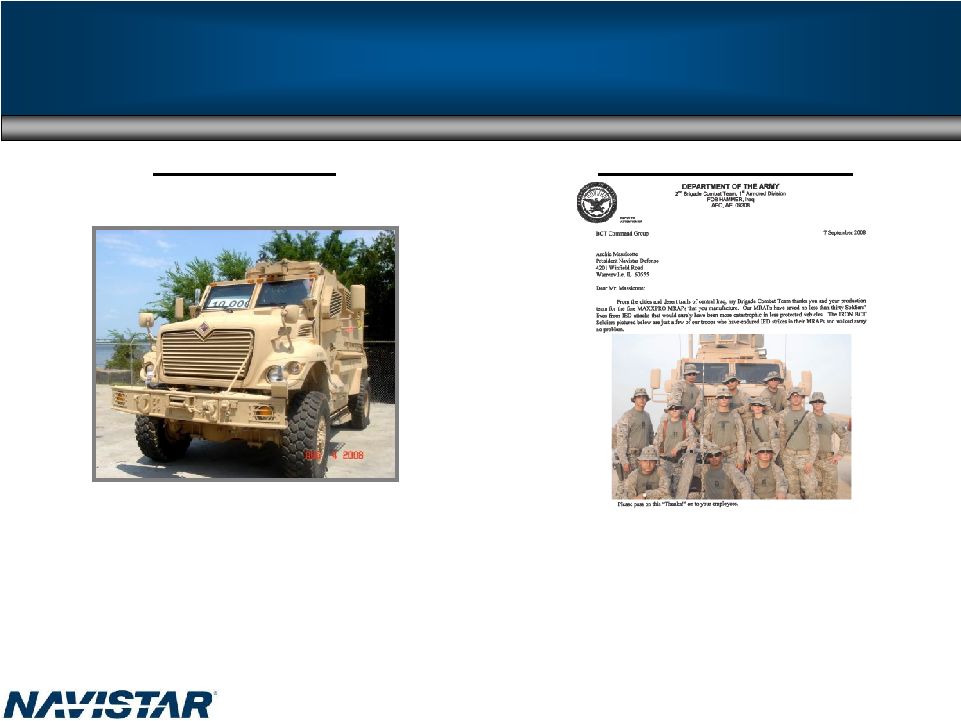 Purchaser “This is a significant achievement. This program has gone from zero to ten thousand in just about a year and a half. These vehicles have proven themselves on the battlefield and are saving lives.” Secretary of Defense – Robert Gates Delivery of 10,000 MRAP End Customer “Our MRAPs have saved no less than thirty Soldiers’ lives from IED attacks that would surely have been more catastrophic in less protected vehicles. The IRON BCT Soliders pictured above are just a few of our troops who have endured IED strikes in their MRAPs and walked away no problem”. Please pass on this “Thanks!” to your employees. COL Robert P. White – Commanding Officer 2 Brigade Combat Team, 1 Armored Division Measurement of Success 72 th nd st |
 WE’RE IN. WE’RE IN. |
 Terry Endsley Executive Vice President and Chief Financial Officer |
 Ford Settlement • Lawsuits have been withdrawn – Agreement on intellectual property – Warranty dispute resolved • Supply agreement – December 2009 • Received cash settlement • Blue Diamond ventures restructured 75 |
 76 10/31/2009 Cash Goal $ (Millions) Revised Goal Manufacturing Cash¹ Balance: 10/31/2007 10/31/2008 10/31/2009 October 31, 2006 $1,078 October 31, 2007 $716 Approximate Cash¹ Flows:* From Operations ($231) $414 Dividends from NFC $400 $15 From Investing / (Cap Ex) ($70) ($216) From Financing / (Debt Paydown) ($480) ($133) Exchange Rate Effect $19 ($21) Manufacturing Cash¹ Balance: October 31, 2007 $716 October 31, 2008 $775 October 31, 2009 $500 to $600 ¹Cash = Cash & Cash Equivalents *The above unaudited non-GAAP manufacturing cash and cash flow information has been revised to reflect the correction of certain errors. The corrections within the unaudited non-GAAP manufacturing cash flow information, which are not considered material, had no effect on previously reported unaudited non- GAAP manufacturing cash balances. |
 77 NFC Liquidity Remains Strong • NFC has total available undrawn committed funding of approximately $900 million at 10/31/2008 • We expect NFC profitability to rebound in 2009 – Volumes and margins will remain depressed for first half – Impact of derivative accounting depends on interest rate movement after October 2008 – Margins improving – finance competitors on sidelines/not aggressive • NFC retail activity primarily funded by facilities that do not require refinancing until 2010 • NFC has continued to obtain access to bank conduit markets to fund retail note acquisitions • Over $1.2B in retail notes have been sold and securitized since the subprime issues began to impact the asset securitization market • Serviced receivables balances tracking to truck market trough • Truck financing is available for quality credits, especially conquest accounts Retail Notes Bank Revolver • $500 million revolving warehouse (TRIP) – Acquired notes sold into TRIP – TRIP warehouses, then securitizes via bank conduits • TRIP terms – Matures June 2010 On-balance sheet • $1.4B facility – Initial funding of retail note acquisitions – Also funds dealer/customer open accounts • Revolver terms – Matures July 2010 On-balance sheet Dealer Floor Plan (DFP) • Current situation – ~$1.0B funding facility (NFSC) – Available $345 million • NFSC terms – Bank conduit portion (VFC) renewed October 2008 – Public portion matures February 2010 Off-balance sheet |
 78 Capital Structure – Next Steps • Intend to execute at least 1 million share repurchase • Anticipated cash flow in excess of CapEx/Investments allows consideration of debt buyback – Currently 68 cents to $1 par – Debt reduction, gain on extinguishment • Recent key financing renewals ensure NFC liquidity for 2009 – Must have NFC-U.S. revolver refinanced by Q2 2010 - $1.4B, relationship banks • Parent company has no need to refinance in near-term – not until late 2011 – Using combo of parent company and NFC-U.S. availability to meet Mexican truck market inventory financing demands on NFC-Mexico – $340M unutilized committed credit facilities – Benefiting from low Libor interest rate (next reset less than 5%) – Debt buyback now could greatly facilitate ease of refinancing later • We have sufficient liquidity/borrowing capacity to execute our strategies |
 79 Original FY2009 Goal • Original Goal was $15+ Billion Revenue-$1.6 Billion Manufacturing Segment Profit at 415,000 Industry • Now-2009 Volumes are unknown • Focus is on reducing impact of cyclicality – Non-Traditional/Expansion Markets – Grow Parts • Improve cost structure while developing synergistic niche businesses with richer margins • Improve conversion rate of operating income into net income • Controlling our Destiny Leveraging What We Have and What Others Have Built |
 Q&A |
 Appendix |
 82 2009 Guidance ($ Millions (excluding EPS)) Truck Industry Units 244K to 256K Revenue $15,000 to $16,000 Mfg. Segment Profit* $1,000 to $1,050 Below the line items ~$(590) Profit Before Tax $410 to $460 Net Income $370 to $410 EPS $5.10 to $5.60 # of shares ~73M Guidance *For additional information please see Reg G slide in appendix |
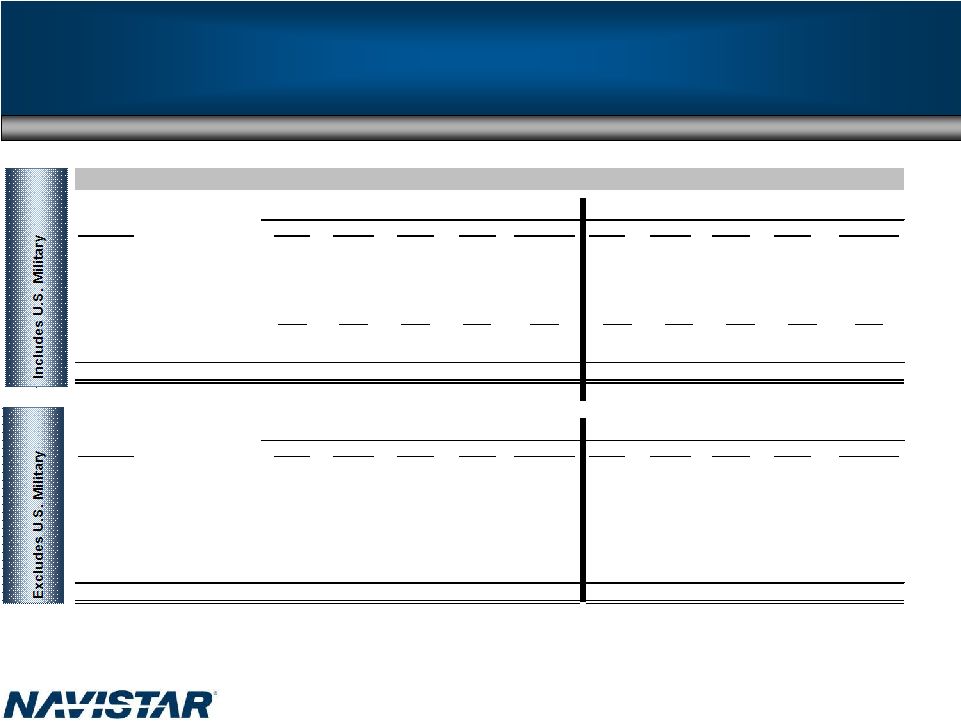 Navistar 1st Q 2nd Q 3rd Q 4th Q Full Year 1st Q 2nd Q 3rd Q 4th Q Full Year Bus (School) 60% 60% 59% 59% 60% 57% 57% 48% 58% 55% Medium (Class 6-7) 37% 34% 34% 37% 36% 34% 35% 39% 36% 36% Heavy (LH & RH) 16% 12% 15% 17% 15% 16% 15% 19% 25% 19% Severe Service 24% 28% 26% 32% 27% 35% 36% 34% 41% 37% Combined Class 8 18% 17% 19% 22% 19% 23% 23% 25% 30% 25% Combined Market Share 25% 25% 27% 31% 27% 29% 29% 30% 35% 31% Navistar 1st Q 2nd Q 3rd Q 4th Q Full Year 1st Q 2nd Q 3rd Q 4th Q Full Year Bus (School) 60% 60% 59% 59% 60% 57% 57% 48% 58% 55% Medium (Class 6-7) 37% 34% 34% 37% 36% 34% 35% 39% 36% 36% Heavy (LH & RH) 16% 12% 15% 17% 15% 16% 15% 19% 25% 19% Severe Service 23% 26% 24% 28% 25% 28% 26% 26% 29% 27% Combined Class 8 18% 16% 19% 21% 18% 20% 19% 21% 26% 22% Combined Market Share 25% 25% 27% 31% 26% 27% 27% 28% 33% 29% 2007 2008 Market Share - US & Canada School Bus and Class 6-8 2007 2008 Market Share – U.S. & Canada School Bus and Class 6-8 83 |
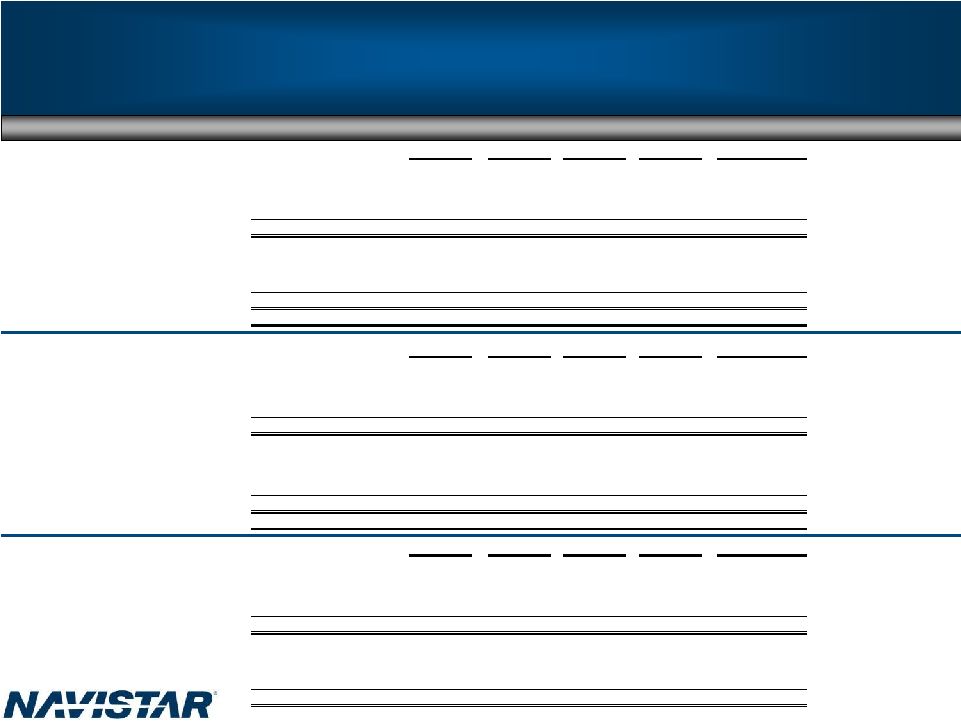 84 Truck Shipments Note: Information shown below is based on Navistar’s fiscal year-end Fiscal Year 2006 1Q06 2Q06 3Q06 4Q06 Full Year 2006 BUS 4,100 4,500 4,300 5,100 18,000 MEDIUM 7,300 11,500 12,100 14,300 45,200 HEAVY 7,900 9,900 10,200 15,400 43,400 SEVERE 3,900 4,500 4,300 6,300 19,000 TOTAL 23,200 30,400 30,900 41,100 125,600 MILITARY (U.S. & Foreign) 400 500 1,200 800 2,900 EXPANSIONARY 5,800 6,600 7,500 7,000 26,900 WORLD WIDE TRUCK 29,400 37,500 39,600 48,900 155,400 Fiscal Year 2007 1Q07 2Q07 3Q07 4Q07 Full Year 2007 BUS 3,400 4,100 3,200 3,900 14,600 MEDIUM 9,700 6,800 5,600 6,600 28,700 HEAVY 7,000 4,500 2,600 3,300 17,400 SEVERE 3,900 3,300 3,500 3,700 14,400 TOTAL 24,000 18,700 14,900 17,500 75,100 MILITARY (U.S. & Foreign) 600 900 700 1,000 3,200 EXPANSIONARY 9,100 8,700 9,000 8,500 35,300 WORLD WIDE TRUCK 33,700 28,300 24,600 27,000 113,600 Fiscal year 2008 1Q08 2Q08 3Q08 4Q08 Full Year 2008 BUS 3,100 3,300 2,700 4,400 13,500 MEDIUM 3,700 6,300 5,800 4,500 20,300 HEAVY 2,600 3,900 4,500 7,800 18,800 SEVERE 2,400 3,400 3,400 3,600 12,800 TOTAL 11,800 16,900 16,400 20,300 65,400 MILITARY (U.S. & Foreign) 1,600 2,200 2,300 2,600 8,700 EXPANSIONARY 6,000 8,100 8,400 5,600 28,100 WORLD WIDE TRUCK 19,400 27,200 27,100 28,500 102,200 |
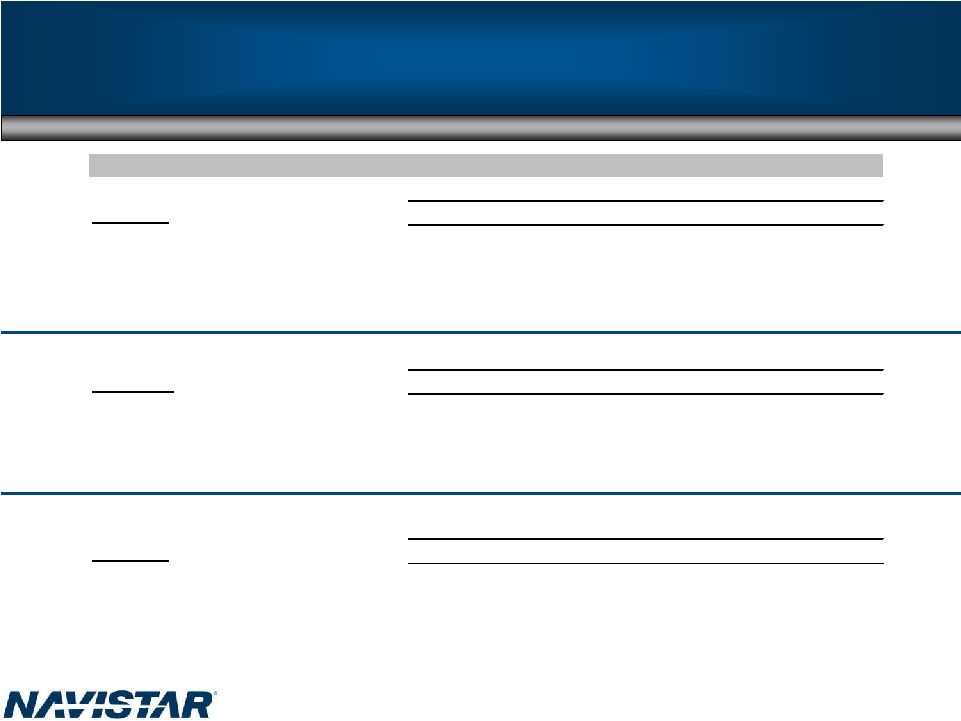 85 World Wide Engine Shipments Navistar 1st Q 2nd Q 3rd Q 4th Q Full Year Ford 80,200 92,200 75,200 68,100 315,700 Other OEM's (All Models) 25,300 29,000 26,500 24,100 104,900 Engine Shipments to Truck Group 17,600 24,300 25,100 32,100 99,100 Total Shipments 123,100 145,500 126,800 124,300 519,700 Navistar 1st Q 2nd Q 3rd Q 4th Q Full Year Ford 60,000 56,200 65,400 53,500 235,100 Other OEM's (All Models) 21,000 26,400 29,100 27,700 104,200 Engine Shipments to Truck Group 23,100 12,100 13,700 16,500 65,400 Total Shipments 104,100 94,700 108,200 97,700 404,700 Navistar 1st Q 2nd Q 3rd Q 4th Q Full Year Ford 47,000 55,300 25,200 24,500 152,000 Other OEM's (All Models) 25,900 31,500 35,100 37,400 129,900 Engine Shipments to Truck Group 12,900 15,700 19,000 16,000 63,600 Total Shipments 85,800 102,500 79,300 77,900 345,500 2008 World Wide Engine Shipments 2007 2006 |
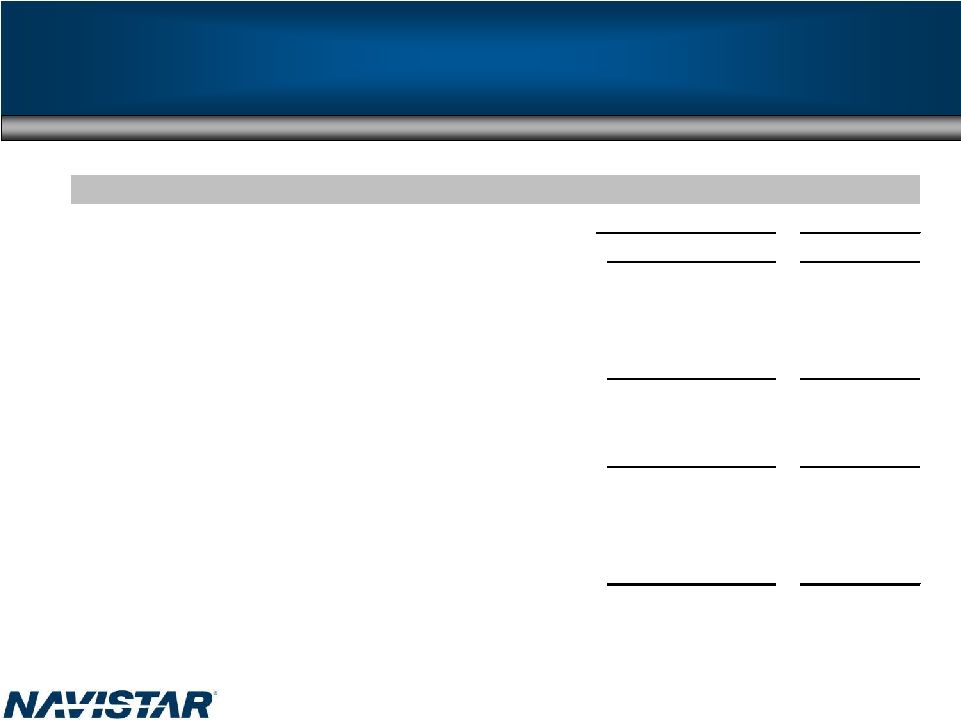 86 Order Receipts – U.S. & Canada Navistar (Order receipt data) FY 2007 FY 2008 Bus (School) 9,600 11,900 Medium (Class 6-7) 21,400 19,400 Combined Class 8 (Heavy & Severe Service) 26,200 45,700 Total Navistar 57,200 77,000 Industry (Order receipt data) FY 2007 FY 2008 Bus (School) 19,400 20,900 Medium (Class 6-7) 50,500 54,600 Combined Class 8 (Heavy & Severe Service) 107,500 157,200 Total Industry 177,400 232,700 Order receipts: U.S. & Canada (Units) |
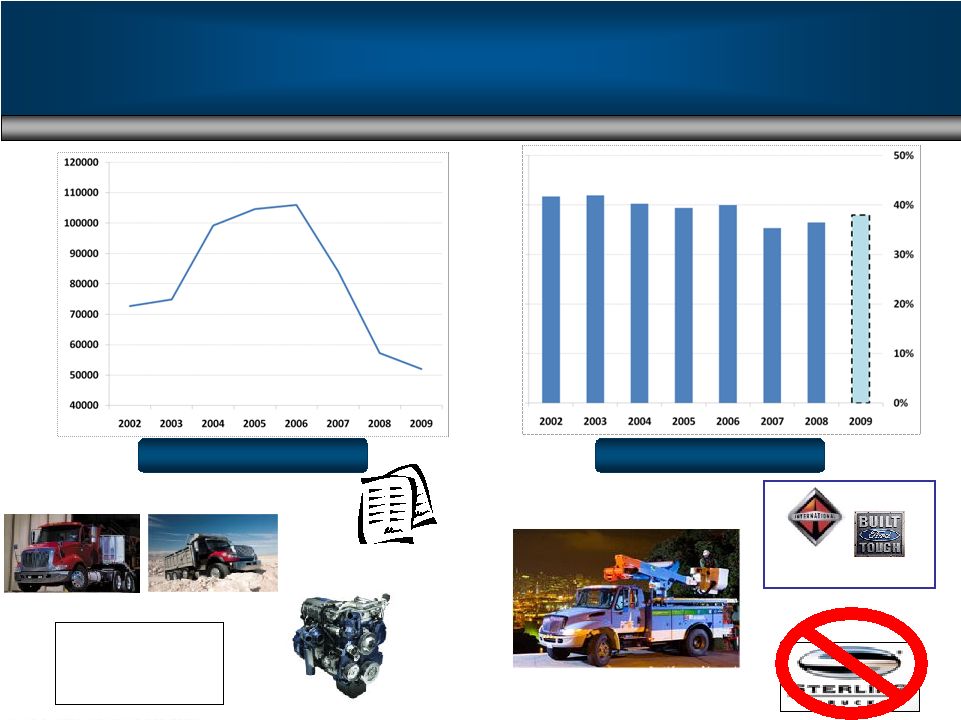
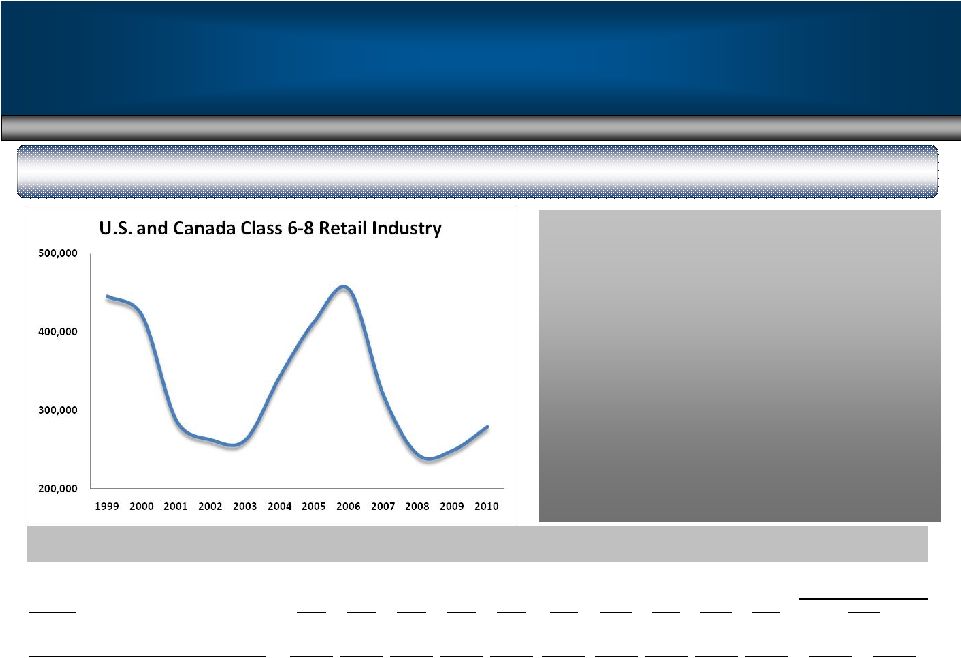 87 Traditional U.S. and Canada Retail Sales Class 6 – 8 Industry Landscape Economic uncertainty about 2009 and 2010: • 2009 no longer the peak • 2010 no longer the trough Reality: • Age of fleet increasing • Fuel prices coming down 2nd half of 2009 will determine total industry size Industry FY99 FY00 FY01 FY02 FY03 FY04 FY 05 FY06 FY 07 FY08 School Bus 33,800 33,900 27,900 27,400 29,200 26,200 26,800 28,200 24,500 24,400 22,000 24,000 Class 6-7 - Medium 126,000 129,600 96,000 72,700 74,900 99,200 104,600 110,400 88,500 59,600 56,000 64,000 Combined Class 8 (Heavy & Severe Service) 286,000 258,300 163,700 163,300 159,300 219,300 282,900 316,100 206,000 160,100 166,000 168,000 Total Industry Demand 445,800 421,800 287,600 263,400 263,400 344,700 414,300 454,700 319,000 244,100 244,000 256,000 Navistar Order Receipt Share* NA NA NA NA NA 23.7% 26.8% 29.8% 30.7% 33.1% *U.S. and Canada Class 6-8 (includes U.S. military) Historical Information FY 09 Guidance Current Actual United States and Canadian Class 6-8 Truck Industry - Retail Sales Volume |
 88 SEC Regulation G The above non-GAAP financial measures are unaudited and reflect a 2007 change in segment reporting methodology. This presentation is not in accordance with, or an alternative for, U.S. generally accepted accounting principles (GAAP). The non-GAAP financial information presented herein should be considered supplemental to, and not as a substitute for, or superior to, financial measures calculated in accordance with GAAP. However, we believe that non-GAAP reporting, giving effect to the adjustments shown in the reconciliation above, provides meaningful information and therefore we use it to supplement our GAAP reporting by identifying items that may not be related to the core manufacturing business. Management often uses this information to assess and measure the performance of our operating segments. We have chosen to provide this supplemental information to investors, analysts and other interested parties to enable them to perform additional analyses of operating results, to illustrate the results of operations giving effect to the non-GAAP adjustments shown in the above reconciliations and to provide an additional measure of performance. DEBT YE 2005 YE 2006 YE 2007 YE 2008 (in millions) Manufacturing operations January 2007 Loan Facility (Libor + 325 matures January 2012) - $ - $ 1,330 $ 1,330 $ Bridge Loan Facility (Libor + 500) - 1,500 - - Financing arrangements and capital lease obligations 408 401 369 306 6.25% Senior Notes 400 - - - 9.375% Senior Notes 393 - - - 7.5% Senior Notes 249 15 15 15 Majority owned dealership debt 245 484 267 157 4.75% Subordinated Exchangeable Notes, due 2009 202 1 1 1 2.5% Senior Convertible Notes 190 - - - 9.95% Senior Notes 13 11 8 6 Other 24 60 39 19 Total manufacturing operations debt 2,124 2,472 2,029 1,834 Financial services operations Borrowing secured by asset-backed securities, at variable rates, due serially through 2011 2,779 $ 3,104 $ 2,748 $ 2,076 $ Bank revolvers, variable rates, due 2010 838 1,426 1,354 1,370 Revolving retail warehouse facility, variable rates, due 2010 500 500 500 500 Commercial Paper (Mexican Finance Subsidary) - 28 117 162 Borrowing secured by operating and finance leases 148 116 133 132 Total financial services operations debt 4,265 $ 5,174 $ 4,852 $ 4,240 $ Cash & Cash Equivalents YE 2005 YE 2006 YE 2007 YE 2008 Manufacturing non-GAAP (Unaudited) 776 $ 1,078 $ 716 $ 775 $ Financial Services non-GAAP (Unaudited) 53 79 61 86 Consolidated US GAAP (Audited) 829 $ 1,157 $ 777 $ 861 $ (Audited) |
 89 SEC Regulation G The above non-GAAP financial measures are unaudited and reflect a 2007 change in segment reporting methodology. This presentation is not in accordance with, or an alternative for, U.S. generally accepted accounting principles (GAAP). The non-GAAP financial information presented herein should be considered supplemental to, and not as a substitute for, or superior to, financial measures calculated in accordance with GAAP. However, we believe that non-GAAP reporting, giving effect to the adjustments shown in the reconciliation above, provides meaningful information and therefore we use it to supplement our GAAP reporting by identifying items that may not be related to the core manufacturing business. Management often uses this information to assess and measure the performance of our operating segments. We have chosen to provide this supplemental information to investors, analysts and other interested parties to enable them to perform additional analyses of operating results, to illustrate the results of operations giving effect to the non-GAAP adjustments shown in the above reconciliations and to provide an additional measure of performance. FY 2006 ($Billions) FY 2007 ($Billions) FY 2008 ($Billions) As Reported As Reported As Reported Revenues $14 $12 $15 $15 $16 ($Millions) ($Millions) ($Millions) Manufacturing Segment Profit $838 $426 $1,114 $1,000 $1,050 $750 $800 Asset Impairment Charges & Related Costs* NA NA ($395) Manufacturing Segment Profit $838 $426 $719 $1,000 $1,050 $750 $800 Sub total - Below the line range: ($443) ($499) ($528) ($500) ($330) Consolidated Income Before Income Tax $395 ($73) $191 $410 $460 $1,100 $1,270 $160 $210 Taxes Benefit (Expense) ($94) ($47) ($57) ($40) ($50) ($40) ($50) Net Income (Loss) $301 ($120) $134 $370 $410 $120 $160 Diluted EPS $4.12 ($1.70) $1.82 $5.10 $5.60 $1.65 $2.20 Memo - Professional fees included above in corporate items: ($70) ($224) ($154) ($40) ($30) ($30) ($20) ($40) ($30) *Related to reductions in Ford engine volumes $1,600 FY 2009 ($Billions) FY 2009 ($Billions) Goal @ 244K to 256K unit industry - Current Guidance Original Goal @ 414.5K unit industry $15+ ($590) Full Year FY 2009 ($Billions) Goal @ 244K to 256K unit industry - Implied Guidance $15+ ($Millions) NA ($Millions) NA ($590) ($Millions) NA $1,600 |