Free signup for more
- Track your favorite companies
- Receive email alerts for new filings
- Personalized dashboard of news and more
- Access all data and search results
Filing tables
Filing exhibits
NAV similar filings
- 30 Sep 09 Departure of Directors or Certain Officers
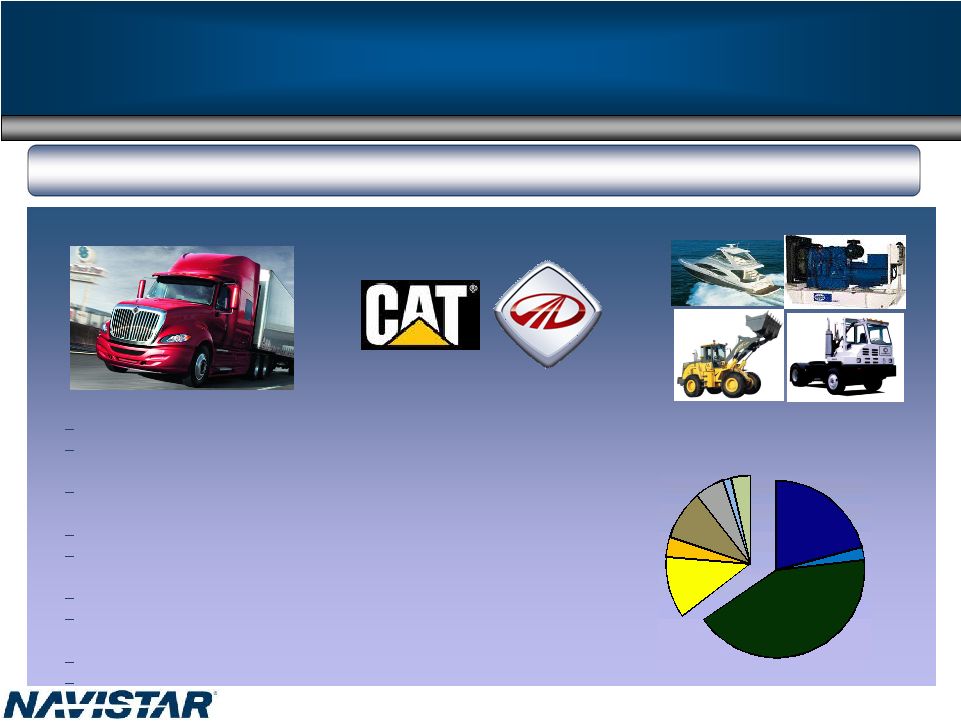
- 15 Sep 09 Navistar and Caterpillar Announce
- 15 Sep 09 Information provided and statements contained in this presentation that are not purely historical are
- 10 Sep 09 Information provided and statements contained in this presentation that are not purely historical are
- 9 Sep 09 Results of Operations and Financial Condition
- 8 Sep 09 Entry into a Material Definitive Agreement
- 3 Sep 09 Regulation FD Disclosure
Filing view
External links