NYSE: NAV JPMorgan Diversified Industries Conference September 15, 2009 Exhibit 99.1 |
NYSE: NAV 2 Safe Harbor Statement Information provided and statements contained in this presentation that are not purely historical are forward-looking statements within the meaning of Section 27A of the Securities Act of 1933, as amended, Section 21E of the Securities Exchange Act of 1934, as amended, and the Private Securities Litigation Reform Act of 1995. Such forward-looking statements only speak as of the date of this presentation and the Company assumes no obligation to update the information included in this presentation. Such forward-looking statements include information concerning our possible or assumed future results of operations, including descriptions of our business strategy. These statements often include words such as “believe,” “expect,” “anticipate,” “intend,” “plan,” “estimate,” or similar expressions. These statements are not guarantees of performance or results and they involve risks, uncertainties, and assumptions. For a further description of these factors, see Item 1A, Risk Factors, included within our Form 10-K for the year ended October 31, 2008, which was filed on December 30, 2008, and Item 1A, Risk Factors, included within our Form 10-Q for the period ended July 31, 2009, which was filed on September 9, 2009. Although we believe that these forward-looking statements are based on reasonable assumptions, there are many factors that could affect our actual financial results or results of operations and could cause actual results to differ materially from those in the forward- looking statements. All future written and oral forward-looking statements by us or persons acting on our behalf are expressly qualified in their entirety by the cautionary statements contained or referred to above. Except for our ongoing obligations to disclose material information as required by the federal securities laws, we do not have any obligations or intention to release publicly any revisions to any forward-looking statements to reflect events or circumstances in the future or to reflect the occurrence of unanticipated events. |
NYSE: NAV 3 Other Cautionary Notes • The financial information herein contains audited and unaudited information and has been prepared by management in good faith and based on data currently available to the company. • Certain Non-GAAP measures are used in this presentation to assist the reader in understanding our core manufacturing business. We believe this information is useful and relevant to assess and measure the performance of our core manufacturing business as it illustrates manufacturing performance without regard to selected historical legacy costs (i.e. pension and other postretirement costs). It also excludes financial services and other expenses that may not be related to the core manufacturing business. Management often uses this information to assess and measure the performance of our operating segments. A reconciliation to the most appropriate GAAP number is included in the appendix of this presentation. |
NYSE: NAV Guidance - Industry Landscape Guidance • Class 6-8 Truck Industry 2009: 165K to 185K 2010: 175K to 215K • Engine shipments – 245K to 265K • Parts – segment revenues expected to be ~$2.2B to $2.3B • Financial Services - profitable Note: Industry guidance includes military orders sold to the U.S. 4 Industry FY99 FY00 FY01 FY02 FY03 FY04 FY 05 FY06 FY 07 FY08 School Bus 33,800 33,900 27,900 27,400 29,200 26,200 26,800 28,200 24,500 24,400 21,000 23,000 Class 6-7 - Medium 126,000 129,600 96,000 72,700 74,900 99,200 104,600 110,400 88,500 59,600 34,000 42,000 Combined Class 8 (Heavy & Severe Service) 286,000 258,300 163,700 163,300 159,300 219,300 282,900 316,100 206,000 160,100 110,000 120,000 Total Industry Demand 445,800 421,800 287,600 263,400 263,400 344,700 414,300 454,700 319,000 244,100 165,000 185,000 FY 09 Historical Information United States and Canadian Class 6-8 Truck Industry - Retail Sales Volume Current 2009 Actual Guidance |
NYSE: NAV 5 We expect our strategy will enable us to deliver our 2009 goals and BEYOND Original FY 2009 Goals Original FY 2009 Goals • $15+ Billion Revenue • $1.6 Billion Manufacturing Segment Profit • Improve cost structure while developing synergistic niche businesses with richer margins • Improve conversion rate of operating income into net income • Reduce impact of cyclicality – Grow Parts – Non-Traditional/Expansion Markets Leveraging what we have and what others have built NYSE: NAV |
NYSE: NAV Great Products *Excludes U.S. Military shipments 6 |
NYSE: NAV Competitive Cost Structure-Overall goal is to continuously seek the needed quality at the best price Below the Line Key Component of COGS 7 Strategic initiatives ProStar ® MaxxForce™ Big Bore 11L/13L/15L Scale Strategic partnerships Mahindra International South America CAT Global sourcing Design cost reduction Commodities cost reduction and containment Manufacturing cost structure NYSE: NAV |
NYSE: NAV Medium Truck 3Q09 School Bus, Class 6-8 Market Share was 36% 61% Market Share 3Q09 35% Market Share 3Q09 33% Market Share 3Q09 Severe Service Truck* Heavy Truck 29% Market share 3Q09 • #2 in YTD July Market Share • Executing on strategy - New Products (ProStar ® , LoneStar ® ) • MaxxForce ® EGR engines • #1 In Market Share despite industry consolidation • MaxxForce ® EGR engines • #1 in Market Share • A leader in Medium Hybrid • MaxxForce ® EGR engines • #1 in Market Share • 3rd straight year of increasing market share • MaxxForce ® EGR engines FY07 60% FY08 55% 3Q09 61% YTD JUL 59% *Note: Excludes U.S. Military shipments. School Bus & Combined Class 6-8 Market Share – FY07: 26%; FY08: 29%; 3Q09: 36%; YTD JUL: 33% FY07 36% FY08 36% 3Q09 35% YTD JUL 35% FY07 25% FY08 27% 3Q09 33% YTD JUL 34% FY07 15% FY08 19% 3Q09 29% YTD JUL 25% Class 8* 30% Market Share 3Q09 School Bus 8 NYSE: NAV |
NYSE: NAV Our Strategy is Paying Off Leveraging What We Have and What Others Have Built 9 NYSE: NAV *Note: This slide contains non-GAAP information, please see the Reg G in appendix for detailed reconciliation |
NYSE: NAV Actions in 2009 for 2010 and Beyond 2010 Emission Strategy How EGR Technology Works Competitor “A” – announced its Environmental Protection Agency (EPA) 2010 emissions reduction technology using selective catalytic reduction (SCR) will carry a surcharge of $9,600. Competitor “B” – “anywhere from $8,000 to $10,000 is a range that everybody is aware of. There's certainly no secret about that.” Navistar’s strategy is to price competitively. 10 |
NYSE: NAV 2010 Emission Strategy Status 2010 emission strategy on/ahead of schedule • All engines will be between .4 and .5 NOx • Engine durability testing is on track and plan to over-test and stress many parts of the system • In most cases, vehicles will have equal to better fuel economy than 2009 vehicles • Base engine will have less heat than 2009 engines • ProStar ® vehicle weight will be reduced by 600 lbs. • MaxxForce ® 13L will have over 1,000 lbs. of weight advantage vs. a competitive 15L SCR engine 11 |
12 NFC – Primary Purpose is to Help Us Sell Trucks Dealers Retail 12 • Liquidity – Overall $1B - Wholesale - $311M - Retail - $348M - Revolver - $362M • Strategy: - Maintain the value of NFC - Reduce leverage • Refinancing Plan: - Wholesale Renew wholesale VFC – Done Expand capacity for market recovery - Retail Work with banks to improve product offering for customers – In Progress Concentration of customers - Bank Facility/Term Loan Refinance bank facility/term loan to meet strategy – End of Year NYSE: NAV |
NYSE: NAV 13 Capital Structure $0 $200 $400 $600 $800 $1,000 $1,200 $1,400 $1,600 2009 2010 2011 2012 Capital Structure NFC $1.4B Due July 2010 Mfg $1.5B Due Jan 2012 • Initial focus on NFC • Balance the alternatives - Cost - Execution/market conditions - Shareholder value |
NYSE: NAV 14 Summary Advanced EGR In-Cylinder NOx Reduction Military sustainable at $2B Combined 33% Market Share July YTD |
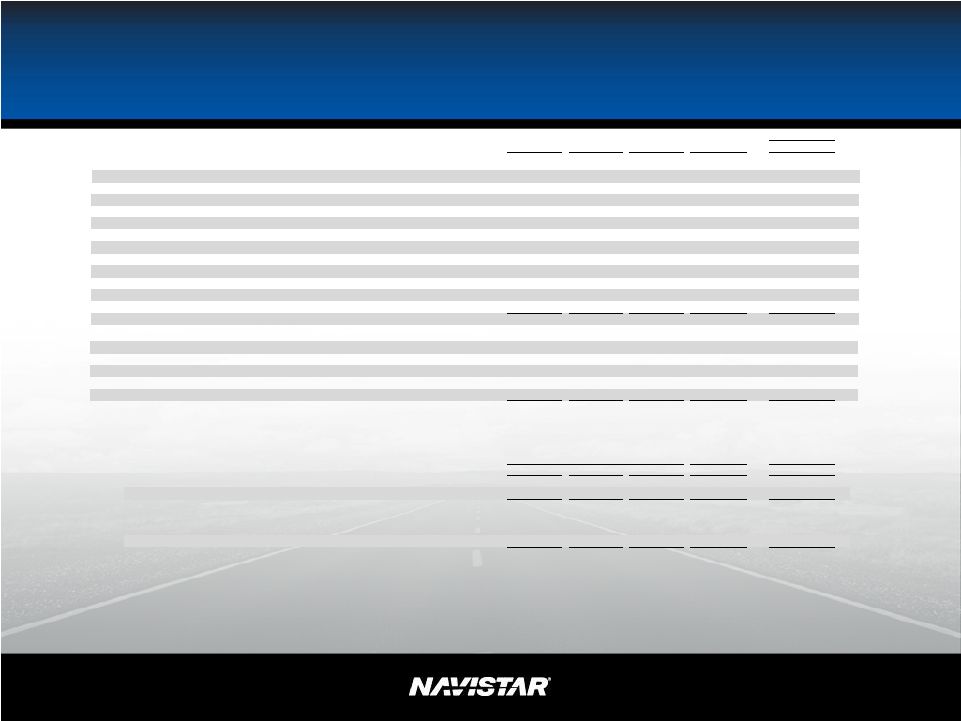
NYSE: NAV SEC Regulation G 15 This presentation is not in accordance with, or an alternative for, U.S. generally accepted accounting principles (GAAP). The non-GAAP financial information presented herein should be considered supplemental to, and not as a substitute for, or superior to, financial measures calculated in accordance with GAAP. However, we believe that non-GAAP reporting, giving effect to the adjustments shown in the reconciliation above, provides meaningful information and therefore we use it to supplement our GAAP reporting by identifying items that may not be related to the core manufacturing business. Management often uses this information to assess and measure the performance of our operating segments. We have chosen to provide this supplemental information to investors, analysts and other interested parties to enable them to perform additional analyses of operating results, to illustrate the results of operations giving effect to the non-GAAP adjustments shown in the above reconciliations and to provide an additional measure of performance. (Unaudited) YE 2005 YE 2006 YE 2007 YE 2008 2009 - 3Q - $ - $ 1,330 $ 1,330 $ 1,330 $ - 1,500 - - - 408 401 369 306 278 400 - - - - 393 - - - - 249 15 15 15 15 245 484 267 157 162 202 1 1 1 - 190 - - - - 13 11 8 6 4 24 60 39 19 17 2,124 2,472 2,029 1,834 1,806 2,779 $ 3,104 $ 2,748 $ 2,076 $ 1,439 $ 838 1,426 1,354 1,370 1,259 500 500 500 500 500 - 28 117 162 75 148 116 133 132 128 4,265 $ 5,174 $ 4,852 $ 4,240 $ 3,401 $ (Unaudited) YE 2005 YE 2006 YE 2007 YE 2008 2009 - 3Q 776 $ 1,078 $ 716 $ 775 $ 751 $ * 53 79 61 86 70 829 $ 1,157 $ 777 $ 861 $ 821 $ 776 $ 1,078 $ 716 $ 775 $ 751 $ * 91 136 6 2 - DEBT (in millions) Manufacturing operations January 2007 Loan Facility (Libor + 325 matures January 2012) Bridge Loan Facility (Libor + 500) Financing arrangements and capital lease obligations 6.25% Senior Notes 9.375% Senior Notes 7.5% Senior Notes, due 2011 Majority owned dealership debt 4.75% Subordinated Exchangeable Notes, due 2009 2.5% Senior Convertible Notes 9.95% Senior Notes, due 2011 Other Total manufacturing operations debt Financial services operations Borrowing secured by asset-backed securities, at variable rates, due serially through 2016 Bank revolvers, at fixed and variable rates, due dates from 2010 through 2013 Revolving retail warehouse facility, at variable rates, due 2010 Commercial Paper, at variable rates, due serially through 2010 Borrowing secured by operating and finance leases, at various rate, due serially through 2016 Total financial services operations debt Cash & Cash Equivalents Manufacturing non-GAAP (Unaudited) Financial Services non-GAAP (Unaudited) Consolidated US GAAP (Audited) Manufacturing Cash & Cash Equivalents non-GAAP (Unaudited) Manufacturing Marketable Securities non-GAAP (Unaudited) Manufacturing Cash, Cash Equivalents & Marketable Securities non-GAAP (Unaudited) 867 $ 1,214 $ 722 $ 777 $ 751 $ *Includes increase in cash and cash equivalents from consolidating Blue Diamond Truck and Blue Diamond Parts (Audited) |
NYSE: NAV SEC Regulation G U.S. and Canada industry 165K 185K Sales and revenues, net $11.5 $12.0 Manufacturing segment profit (excludes asset impairment, Ford settlement, & related charges) $350 $450 Asset impairment, Ford settlement, & related charges Manufacturing segment profit $350 $450 Below the line items ($500) ($330) Income (Loss) before income tax $1,100 $1,270 ($170) ($70) NA $15+ ($Millions) ($Millions) $1,600 Target @ Current Industry 414.5K ($Billions) ~($520) $1,600 NA ($Billions) FY 2009 Guidance on $1.6B Mfg Segment Profit Line Original Target @ 414.5K Industry This regulation G slide corresponds with the data found in the chart on slide 5 and 9 NYSE: NAV |
NYSE: NAV SEC Regulation G – Fiscal Year Comparison FY 2008 FY 2007 FY 2006 Estimated As Reported As Reported As Reported Ford Settlement Impacts U.S. and Canada industry 165K 185K 165K 185K ($Billions) ($Billions) ($Billions) Sales and revenues, net $11.0 $11.5 $11.0 $11.5 $14.7 $12.3 $14.2 ($Millions) ($Millions) ($Millions) ($Millions) Manufacturing segment profit * (excludes asset impairment, Ford settlement, & related charges) $710 $735 NA $710 $735 $1,114 $426 $838 Asset impairment, Ford settlement, & related charges ~ $175 ($395) NA NA Manufacturing segment profit * $710 $735 $175 $885 $910 $719 $426 $838 Below the line items $0 ($528) ($499) ($443) Income (Loss) excluding income tax $225 $250 $175 $400 $425 $191 ($73) $395 Income tax benefit (expense) ~ ($3) ($57) ($47) ($94) Net income (loss) $182 $207 $172 $354 $379 $134 ($120) $301 Diluted earnings (loss) per share ($'s) $2.55 $2.85 $2.40 $4.95 $5.25 $1.82 ($1.70) $4.12 Weighted average shares outstanding: diluted ~72M 73.2M 70.3M 74.5M Memo - professional fees included in below the line items ($40) ($30) ($40) ($30) ($154) ($224) ($70) * Includes: minority interest in net income of subsidiaries of ($7)M, net of tax; extraordinary gain of $23M, net of tax ~72M ~72M ~($485) ~($43) ~($46) ($Millions) ($Millions) ($Billions) ($Billions) FY 2009 Non GAAP Goal Goal Without Ford Settlement With Ford Settlement ~($485) NA ~$175 17 This presentation is not in accordance with, or an alternative for, U.S. generally accepted accounting principles (GAAP). The non-GAAP financial information presented herein should be considered supplemental to, and not as a substitute for, or superior to, financial measures calculated in accordance with GAAP. However, we believe that non-GAAP reporting, giving effect to the adjustments shown in the reconciliation above, provides meaningful information and therefore we use it to supplement our GAAP reporting by identifying items that may not be related to the core manufacturing business. Management often uses this information to assess and measure the performance of our operating segments. We have chosen to provide this supplemental information to investors, analysts and other interested parties to enable them to perform additional analyses of operating results, to illustrate the results of operations giving effect to the non-GAAP adjustments shown in the above reconciliations and to provide an additional measure of performance. |